UNITED STATES
SECURITIES AND EXCHANGE COMMISSION
Washington, D.C. 20549
FORM N-CSR
CERTIFIED SHAREHOLDER REPORT OF REGISTERED
MANAGEMENT INVESTMENT COMPANIES
Investment Company Act file number 811-4118
Fidelity Securities Fund
(Exact name of registrant as specified in charter)
82 Devonshire St., Boston, Massachusetts 02109
(Address of principal executive offices) (Zip code)
Eric D. Roiter, Secretary
82 Devonshire St.
Boston, Massachusetts 02109
(Name and address of agent for service)
Registrant's telephone number, including area code: 617-563-7000
Date of fiscal year end: | July 31 |
| |
Date of reporting period: | July 31, 2005 |
Item 1. Reports to Stockholders
Fidelity®
Blue Chip Growth
Fund
Annual Report
July 31, 2005
(2_fidelity_logos) (Registered_Trademark)
Contents
Chairman's Message | <Click Here> | Ned Johnson's message to shareholders. |
Performance | <Click Here> | How the fund has done over time. |
Management's Discussion | <Click Here> | The managers' review of fund performance, strategy and outlook. |
Shareholder Expense Example | <Click Here> | An example of shareholder expenses. |
Investment Changes | <Click Here> | A summary of major shifts in the fund's investments over the past six months. |
Investments | <Click Here> | A complete list of the fund's investments with their market values. |
Financial Statements | <Click Here> | Statements of assets and liabilities, operations, and changes in net assets,
as well as financial highlights. |
Notes | <Click Here> | Notes to the financial statements. |
Report of Independent Registered Public Accounting Firm | <Click Here> | |
Trustees and Officers | <Click Here> | |
Distributions | <Click Here> | |
Board Approval of Investment Advisory Contracts and Management Fees | <Click Here> | |
To view a fund's proxy voting guidelines and proxy voting record for the 12-month period ended June 30, visit www.fidelity.com/proxyvotingresults or visit the Securities and Exchange Commission's (SEC) web site at www.sec.gov. You may also call 1-800-544-8544 to request a free copy of the proxy voting guidelines.
Standard & Poor's, S&P and S&P 500 are registered service marks of The McGraw-Hill Companies, Inc. and have been licensed for use by Fidelity Distributors Corporation.
Other third party marks appearing herein are the property of their respective owners.
All other marks appearing herein are registered or unregistered trademarks or service marks of FMR Corp. or an affiliated company.
Annual Report
This report and the financial statements contained herein are submitted for the general information of the shareholders of the fund. This report is not authorized for distribution to prospective investors in the fund unless preceded or accompanied by an effective prospectus.
A fund files its complete schedule of portfolio holdings with the SEC for the first and third quarters of each fiscal year on Form N-Q. Forms N-Q are available on the SEC's web site at http://www.sec.gov. A fund's Forms N-Q may be reviewed and copied at the SEC's Public Reference Room in Washington, DC. Information regarding the operation of the SEC's Public Reference Room may be obtained by calling 1-800-SEC-0330. For a complete list of a fund's portfolio holdings, view the most recent quarterly holdings report, semiannual report, or annual report on Fidelity's web site at http://www.fidelity.com/holdings.
NOT FDIC INSURED · MAY LOSE VALUE · NO BANK GUARANTEE
Neither the fund nor Fidelity Distributors Corporation is a bank.
Annual Report
Chairman's Message
(photo_of_Edward_C_Johnson_3d)
Dear Shareholder:
During the past year or so, much has been reported about the mutual fund industry, and much of it has been more critical than I believe is warranted. Allegations that some companies have been less than forthright with their shareholders have cast a shadow on the entire industry. I continue to find these reports disturbing, and assert that they do not create an accurate picture of the industry overall. Therefore, I would like to remind everyone where Fidelity stands on these issues. I will say two things specifically regarding allegations that some mutual fund companies were in violation of the Securities and Exchange Commission's forward pricing rules or were involved in so-called "market timing" activities.
First, Fidelity has no agreements that permit customers who buy fund shares after 4 p.m. to obtain the 4 p.m. price. This is not a new policy. This is not to say that someone could not deceive the company through fraudulent acts. However, we are extremely diligent in preventing fraud from occurring in this manner - and in every other. But I underscore again that Fidelity has no so-called "agreements" that sanction illegal practices.
Second, Fidelity continues to stand on record, as we have for years, in opposition to predatory short-term trading that adversely affects shareholders in a mutual fund. Back in the 1980s, we initiated a fee - which is returned to the fund and, therefore, to investors - to discourage this activity. Further, we took the lead several years ago in developing a Fair Value Pricing Policy to prevent market timing on foreign securities in our funds. I am confident we will find other ways to make it more difficult for predatory traders to operate. However, this will only be achieved through close cooperation among regulators, legislators and the industry.
Yes, there have been unfortunate instances of unethical and illegal activity within the mutual fund industry from time to time. That is true of any industry. When this occurs, confessed or convicted offenders should be dealt with appropriately. But we are still concerned about the risk of over-regulation and the quick application of simplistic solutions to intricate problems. Every system can be improved, and we support and applaud well thought out improvements by regulators, legislators and industry representatives that achieve the common goal of building and protecting the value of investors' holdings.
For nearly 60 years, Fidelity has worked very hard to improve its products and service to justify your trust. When our family founded this company in 1946, we had only a few hundred customers. Today, we serve more than 18 million customers including individual investors and participants in retirement plans across America.
Let me close by saying that we do not take your trust in us for granted, and we realize that we must always work to improve all aspects of our service to you. In turn, we urge you to continue your active participation with your financial matters, so that your interests can be well served.
Best regards,
/s/Edward C. Johnson 3d
Edward C. Johnson 3d
Annual Report
Performance: The Bottom Line
Average annual total return reflects the change in the value of an investment, assuming reinvestment of the fund's dividend income and capital gains (the profits earned upon the sale of securities that have grown in value) and assuming a constant rate of performance each year. The $10,000 table and the fund's returns do not reflect the deduction of taxes that a shareholder would pay on fund distributions or the redemption of fund shares. During periods of reimbursement by Fidelity, a fund's total return will be greater than it would be had the reimbursement not occurred. How a fund did yesterday is no guarantee of how it will do tomorrow.
Average Annual Total Returns
Periods ended July 31, 2005 | Past 1
year | Past 5
years | Past 10
years |
Fidelity® Blue Chip Growth | 11.08% | -5.51% | 6.60% |
$10,000 Over 10 Years
Let's say hypothetically that $10,000 was invested in Fidelity® Blue Chip Growth Fund on July 31, 1995. The chart shows how the value of your investment would have changed, and also shows how the Standard & Poor's 500 IndexSM (S&P 500®) performed over the same period.
Annual Report
Management's Discussion of Fund Performance
The following comments are from John McDowell and Brian Hanson, Portfolio Managers of Fidelity® Blue Chip Growth Fund. Brian Hanson was added as Portfolio Manager on April 4, 2005.
A late-inning rally on Wall Street helped push some key U.S. equity indexes to four-year highs by the conclusion of the 12-month period ending July 31, 2005. Spurred on by bullish economic data and strong corporate earnings, investors enjoyed a stellar month of July, capping off a turbulent 12-month period for U.S. equity markets. Stock prices bounced up and down during most of the year, moving in cadence with gyrations in the price of crude oil and investors' gathering and ebbing concerns about inflation. The Federal Reserve Board raised short-term interest rates eight times during the period, also affecting overall market sentiment. Despite their fluctuations, the major equity indexes finished on a high note, with the Standard & Poor's 500SM Index and the NASDAQ Composite® Index posting gains of 14.05% and 16.51%, respectively, for the period. The small-cap Russell 2000® Index rose 24.78% and the Russell Midcap® Index jumped 28.93%, while the blue-chips' Dow Jones Industrial AverageSM advanced only 7.29%.
Fidelity Blue Chip Growth Fund gained 11.08% for the year ending July 31, 2005, while the Russell 1000® Growth Index rose 13.04% and the LipperSM Growth Funds Average returned 15.92%. The fund also lagged the S&P 500® during the period. The relative shortfall was mainly due to the fund's larger-cap bias versus the indexes, meaning that its holdings did not participate as fully in market rallies - especially early on in the period - that were led by smaller, more-volatile growth companies. While an overweighting in the high-flying energy sector helped performance versus the Russell index, an overall underweighting and inopportune stock picking within consumer discretionary, as well as unfavorable sector positioning in health care and financials, held back the fund's relative return. Among the biggest detractors were ill-timed investments in consumer electronics firm Motorola and drug maker Pfizer, plus an underweighting in strong-performing Apple Computer and an overweighted position in Fannie Mae, the beleaguered government-sponsored mortgage underwriter. Industrial conglomerate Tyco International also disappointed. On the upside, energy services stocks such as Halliburton, Transocean and Schlumberger, helped performance, as did Internet search engine Google and biotech pioneer Genentech.
The views expressed in this statement reflect those of the portfolio manager only through the end of the period of the report as stated on the cover and do not necessarily represent the views of Fidelity or any other person in the Fidelity organization. Any such views are subject to change at any time based upon market or other conditions and Fidelity disclaims any responsibility to update such views. These views may not be relied on as investment advice and, because investment decisions for a Fidelity fund are based on numerous factors, may not be relied on as an indication of trading intent on behalf of any Fidelity fund.
Annual Report
Shareholder Expense Example
As a shareholder of the Fund, you incur two types of costs: (1) transaction costs, and (2) ongoing costs, including management fees and other Fund expenses. This Example is intended to help you understand your ongoing costs (in dollars) of investing in the Fund and to compare these costs with the ongoing costs of investing in other mutual funds.
The Example is based on an investment of $1,000 invested at the beginning of the period and held for the entire period (February 1, 2005 to July 31, 2005).
Actual Expenses
The first line of the table below provides information about actual account values and actual expenses. You may use the information in this line, together with the amount you invested, to estimate the expenses that you paid over the period. Simply divide your account value by $1,000.00 (for example, an $8,600 account value divided by $1,000.00 = 8.6), then multiply the result by the number in the first line under the heading entitled "Expenses Paid During Period" to estimate the expenses you paid on your account during this period. A small balance maintenance fee of $12.00 that is charged once a year may apply for certain accounts with a value of less than $2,000. This fee is not included in the table below. If it was, the estimate of expenses you paid during the period would be higher, and your ending account value lower, by this amount.
Hypothetical Example for Comparison Purposes
The second line of the table below provides information about hypothetical account values and hypothetical expenses based on the Fund's actual expense ratio and an assumed rate of return of 5% per year before expenses, which is not the Fund's actual return. The hypothetical account values and expenses may not be used to estimate the actual ending account balance or expenses you paid for the period. You may use this information to compare the ongoing costs of investing in the Fund and other funds. To do so, compare this 5% hypothetical example with the 5% hypothetical examples that appear in the shareholder reports of the other funds. A small balance maintenance fee of $12.00 that is charged once a year may apply for certain accounts with a value of less than $2,000. This fee is not included in the table below. If it was, the estimate of expenses you paid during the period would be higher, and your ending account value lower, by this amount.
Please note that the expenses shown in the table are meant to highlight your ongoing costs only and do not reflect any transaction costs. Therefore, the second line of the table is useful in comparing ongoing costs only, and will not help you determine the relative total costs of owning different funds. In addition, if these transactional costs were included, your costs would have been higher.
| Beginning
Account Value
February 1, 2005 | Ending
Account Value
July 31, 2005 | Expenses Paid
During Period*
February 1, 2005
to July 31, 2005 |
Actual | $ 1,000.00 | $ 1,049.00 | $ 3.30 |
Hypothetical (5% return per year before expenses) | $ 1,000.00 | $ 1,021.57 | $ 3.26 |
* Expenses are equal to the Fund's annualized expense ratio of .65%; multiplied by the average account value over the period, multiplied by 181/365 (to reflect the one-half year period).
Annual Report
Investment Changes
Top Ten Stocks as of July 31, 2005 |
| % of fund's
net assets | % of fund's net assets
6 months ago |
Microsoft Corp. | 4.3 | 4.3 |
General Electric Co. | 3.8 | 4.0 |
Johnson & Johnson | 2.7 | 2.7 |
American International Group, Inc. | 2.4 | 2.2 |
Intel Corp. | 2.4 | 2.3 |
Dell, Inc. | 2.4 | 2.0 |
Wal-Mart Stores, Inc. | 2.0 | 2.0 |
Procter & Gamble Co. | 2.0 | 1.9 |
UnitedHealth Group, Inc. | 1.7 | 1.4 |
PepsiCo, Inc. | 1.6 | 1.5 |
| 25.3 | |
Top Five Market Sectors as of July 31, 2005 |
| % of fund's
net assets | % of fund's net assets
6 months ago |
Information Technology | 25.8 | 23.5 |
Health Care | 21.3 | 19.7 |
Consumer Discretionary | 12.1 | 10.8 |
Financials | 10.5 | 13.9 |
Consumer Staples | 10.5 | 11.0 |
Asset Allocation (% of fund's net assets) |
As of July 31, 2005 * | As of January 31, 2005 ** |
 | Stocks 99.2% | | | Stocks 99.4% | |
 | Short-Term
Investments and
Net Other Assets 0.8% | | | Short-Term
Investments and
Net Other Assets 0.6% | |
* Foreign investments | 5.0% | | ** Foreign investments | 4.6% | |

Annual Report
Investments July 31, 2005
Showing Percentage of Net Assets
Common Stocks - 99.2% |
| Shares | | Value (Note 1)
(000s) |
CONSUMER DISCRETIONARY - 12.1% |
Diversified Consumer Services - 0.3% |
Apollo Group, Inc. Class A (a) | 662,700 | | $ 49,802 |
Career Education Corp. (a) | 816,200 | | 31,660 |
| | 81,462 |
Hotels, Restaurants & Leisure - 1.6% |
Brinker International, Inc. (a) | 1,960,700 | | 80,193 |
Carnival Corp. unit (d) | 2,410,600 | | 126,315 |
McDonald's Corp. | 2,935,800 | | 91,509 |
Royal Caribbean Cruises Ltd. | 1,495,900 | | 67,989 |
| | 366,006 |
Internet & Catalog Retail - 0.8% |
eBay, Inc. (a) | 4,152,600 | | 173,496 |
Media - 3.3% |
EchoStar Communications Corp. Class A | 1,326,534 | | 38,098 |
Getty Images, Inc. (a) | 461,960 | | 37,303 |
Lamar Advertising Co. Class A (a) | 190,200 | | 8,371 |
News Corp.: | | | |
Class A | 3,184,436 | | 52,161 |
Class B (d) | 4,327,900 | | 75,046 |
Omnicom Group, Inc. | 1,635,600 | | 138,813 |
Time Warner, Inc. (a) | 2,727,132 | | 46,416 |
Univision Communications, Inc. Class A (a) | 4,817,000 | | 136,225 |
Walt Disney Co. | 5,597,100 | | 143,510 |
XM Satellite Radio Holdings, Inc. Class A (a) | 2,036,400 | | 72,557 |
| | 748,500 |
Multiline Retail - 1.8% |
Kohl's Corp. (a) | 1,920,900 | | 108,243 |
Target Corp. | 5,180,400 | | 304,349 |
| | 412,592 |
Specialty Retail - 3.9% |
Best Buy Co., Inc. | 1,238,300 | | 94,854 |
Foot Locker, Inc. | 2,128,500 | | 53,213 |
Home Depot, Inc. | 7,551,900 | | 328,583 |
Lowe's Companies, Inc. | 2,903,000 | | 192,237 |
Ross Stores, Inc. | 1,820,000 | | 48,230 |
Staples, Inc. | 8,082,300 | | 184,034 |
| | 901,151 |
Common Stocks - continued |
| Shares | | Value (Note 1)
(000s) |
CONSUMER DISCRETIONARY - continued |
Textiles, Apparel & Luxury Goods - 0.4% |
NIKE, Inc. Class B | 1,087,800 | | $ 91,158 |
TOTAL CONSUMER DISCRETIONARY | | 2,774,365 |
CONSUMER STAPLES - 10.5% |
Beverages - 1.6% |
PepsiCo, Inc. | 6,789,762 | | 370,246 |
Food & Staples Retailing - 3.6% |
Costco Wholesale Corp. | 405,500 | | 18,641 |
CVS Corp. | 3,483,600 | | 108,096 |
Sysco Corp. | 1,716,800 | | 61,908 |
Wal-Mart Stores, Inc. | 9,330,255 | | 460,448 |
Walgreen Co. | 3,813,900 | | 182,533 |
| | 831,626 |
Food Products - 0.5% |
Bunge Ltd. | 1,069,700 | | 65,669 |
Global Bio-Chem Technology Group Co. Ltd. | 35,330,000 | | 17,725 |
The J.M. Smucker Co. | 442,900 | | 21,069 |
| | 104,463 |
Household Products - 2.6% |
Colgate-Palmolive Co. | 2,644,100 | | 139,979 |
Procter & Gamble Co. | 8,265,080 | | 459,786 |
| | 599,765 |
Personal Products - 1.2% |
Avon Products, Inc. | 500,000 | | 16,355 |
Gillette Co. | 4,772,600 | | 256,145 |
| | 272,500 |
Tobacco - 1.0% |
Altria Group, Inc. | 3,319,500 | | 222,274 |
TOTAL CONSUMER STAPLES | | 2,400,874 |
ENERGY - 6.5% |
Energy Equipment & Services - 4.7% |
Baker Hughes, Inc. | 3,148,500 | | 178,016 |
BJ Services Co. | 1,667,200 | | 101,683 |
Halliburton Co. | 5,141,700 | | 288,192 |
Nabors Industries Ltd. (a) | 1,919,600 | | 125,638 |
National Oilwell Varco, Inc. (a) | 194,973 | | 10,207 |
Common Stocks - continued |
| Shares | | Value (Note 1)
(000s) |
ENERGY - continued |
Energy Equipment & Services - continued |
Schlumberger Ltd. (NY Shares) | 2,609,300 | | $ 218,503 |
Transocean, Inc. (a) | 1,443,300 | | 81,445 |
Weatherford International Ltd. (a) | 1,063,500 | | 67,298 |
| | 1,070,982 |
Oil, Gas & Consumable Fuels - 1.8% |
BG Group PLC sponsored ADR | 394,900 | | 16,455 |
BP PLC sponsored ADR | 142,100 | | 9,362 |
Chevron Corp. | 1,574,400 | | 91,331 |
Exxon Mobil Corp. | 2,922,600 | | 171,703 |
Total SA Series B | 504,400 | | 126,100 |
| | 414,951 |
TOTAL ENERGY | | 1,485,933 |
FINANCIALS - 10.5% |
Capital Markets - 1.3% |
Goldman Sachs Group, Inc. | 537,600 | | 57,781 |
Lehman Brothers Holdings, Inc. | 1,009,000 | | 106,076 |
Merrill Lynch & Co., Inc. | 1,676,200 | | 98,527 |
State Street Corp. | 803,000 | | 39,941 |
| | 302,325 |
Commercial Banks - 1.5% |
Bank of America Corp. | 3,314,700 | | 144,521 |
Wachovia Corp. | 2,016,500 | | 101,591 |
Wells Fargo & Co. | 1,663,100 | | 102,015 |
| | 348,127 |
Consumer Finance - 2.0% |
American Express Co. | 5,027,829 | | 276,531 |
Capital One Financial Corp. | 864,100 | | 71,288 |
SLM Corp. | 2,149,700 | | 110,688 |
| | 458,507 |
Diversified Financial Services - 0.4% |
Citigroup, Inc. | 1,963,554 | | 85,415 |
Insurance - 3.7% |
AFLAC, Inc. | 1,390,900 | | 62,730 |
AMBAC Financial Group, Inc. | 1,269,900 | | 91,230 |
American International Group, Inc. | 9,349,355 | | 562,831 |
Common Stocks - continued |
| Shares | | Value (Note 1)
(000s) |
FINANCIALS - continued |
Insurance - continued |
MBIA, Inc. | 992,750 | | $ 60,300 |
Prudential Financial, Inc. | 1,206,300 | | 80,701 |
| | 857,792 |
Thrifts & Mortgage Finance - 1.6% |
Fannie Mae | 3,930,100 | | 219,535 |
Freddie Mac | 217,300 | | 13,751 |
Golden West Financial Corp., Delaware | 1,944,900 | | 126,652 |
| | 359,938 |
TOTAL FINANCIALS | | 2,412,104 |
HEALTH CARE - 21.3% |
Biotechnology - 3.4% |
Alkermes, Inc. (a) | 545,200 | | 8,451 |
Amgen, Inc. (a) | 3,060,400 | | 244,067 |
Biogen Idec, Inc. (a) | 1,744,550 | | 68,543 |
Cephalon, Inc. (a) | 726,700 | | 30,449 |
Genentech, Inc. (a) | 3,729,900 | | 333,192 |
Gilead Sciences, Inc. (a) | 1,730,400 | | 77,539 |
Protein Design Labs, Inc. (a) | 717,300 | | 16,347 |
| | 778,588 |
Health Care Equipment & Supplies - 4.8% |
Baxter International, Inc. | 2,848,800 | | 111,872 |
Becton, Dickinson & Co. | 1,390,200 | | 76,975 |
Cytyc Corp. (a) | 2,849,000 | | 71,111 |
Fisher Scientific International, Inc. (a) | 1,167,100 | | 78,254 |
Guidant Corp. | 1,160,200 | | 79,822 |
Medtronic, Inc. | 6,275,800 | | 338,517 |
Millipore Corp. (a) | 1,332,800 | | 81,661 |
St. Jude Medical, Inc. (a) | 2,792,800 | | 132,407 |
Waters Corp. (a) | 2,520,200 | | 114,115 |
| | 1,084,734 |
Health Care Providers & Services - 3.6% |
Aetna, Inc. | 555,200 | | 42,972 |
AmerisourceBergen Corp. | 204,400 | | 14,674 |
Cardinal Health, Inc. | 1,209,975 | | 72,090 |
Health Management Associates, Inc. Class A | 1,056,900 | | 25,154 |
Laboratory Corp. of America Holdings (a) | 1,162,600 | | 58,909 |
McKesson Corp. | 682,600 | | 30,717 |
Common Stocks - continued |
| Shares | | Value (Note 1)
(000s) |
HEALTH CARE - continued |
Health Care Providers & Services - continued |
Quest Diagnostics, Inc. | 1,178,600 | | $ 60,509 |
UnitedHealth Group, Inc. | 7,428,600 | | 388,516 |
WellPoint, Inc. (a) | 1,919,100 | | 135,757 |
| | 829,298 |
Pharmaceuticals - 9.5% |
Abbott Laboratories | 3,776,400 | | 176,094 |
Allergan, Inc. | 1,332,400 | | 119,077 |
Barr Pharmaceuticals, Inc. (a) | 1,382,000 | | 65,534 |
Eli Lilly & Co. | 2,872,200 | | 161,762 |
Johnson & Johnson | 9,770,804 | | 624,941 |
Merck & Co., Inc. | 1,040,400 | | 32,315 |
Nastech Pharmaceutical Co., Inc. (a)(d)(e) | 1,430,400 | | 20,455 |
Novartis AG sponsored ADR | 425,000 | | 20,702 |
Pfizer, Inc. | 12,403,500 | | 328,693 |
Schering-Plough Corp. | 12,726,000 | | 264,955 |
Wyeth | 7,907,400 | | 361,764 |
| | 2,176,292 |
TOTAL HEALTH CARE | | 4,868,912 |
INDUSTRIALS - 9.9% |
Aerospace & Defense - 2.4% |
Honeywell International, Inc. | 5,614,200 | | 220,526 |
Northrop Grumman Corp. | 1,009,100 | | 55,955 |
The Boeing Co. | 2,816,800 | | 185,937 |
United Technologies Corp. | 1,425,500 | | 72,273 |
| | 534,691 |
Air Freight & Logistics - 0.1% |
FedEx Corp. | 368,300 | | 30,970 |
Airlines - 0.1% |
Southwest Airlines Co. | 1,880,400 | | 26,683 |
Commercial Services & Supplies - 0.6% |
Cintas Corp. | 1,113,200 | | 49,348 |
Robert Half International, Inc. | 2,204,900 | | 74,724 |
| | 124,072 |
Construction & Engineering - 0.7% |
Chicago Bridge & Iron Co. NV (NY Shares) | 1,431,800 | | 40,019 |
Common Stocks - continued |
| Shares | | Value (Note 1)
(000s) |
INDUSTRIALS - continued |
Construction & Engineering - continued |
Fluor Corp. | 1,555,500 | | $ 99,241 |
Jacobs Engineering Group, Inc. (a) | 312,000 | | 18,371 |
| | 157,631 |
Electrical Equipment - 0.4% |
American Power Conversion Corp. | 1,072,000 | | 30,134 |
Roper Industries, Inc. | 824,700 | | 63,296 |
| | 93,430 |
Industrial Conglomerates - 5.3% |
3M Co. | 2,475,400 | | 185,655 |
General Electric Co. | 25,315,700 | | 873,392 |
Tyco International Ltd. | 5,247,000 | | 159,876 |
| | 1,218,923 |
Machinery - 0.3% |
Danaher Corp. | 1,180,800 | | 65,475 |
Road & Rail - 0.0% |
Burlington Northern Santa Fe Corp. | 135,800 | | 7,367 |
TOTAL INDUSTRIALS | | 2,259,242 |
INFORMATION TECHNOLOGY - 25.8% |
Communications Equipment - 3.5% |
AudioCodes Ltd. (a) | 1,858,500 | | 16,894 |
Cisco Systems, Inc. (a) | 18,344,300 | | 351,293 |
Harris Corp. | 1,562,800 | | 57,933 |
Juniper Networks, Inc. (a) | 4,017,200 | | 96,373 |
QUALCOMM, Inc. | 6,230,300 | | 246,035 |
Sonus Networks, Inc. (a) | 2,000,000 | | 9,680 |
Tekelec (a) | 500,000 | | 8,305 |
| | 786,513 |
Computers & Peripherals - 5.2% |
Apple Computer, Inc. (a) | 968,900 | | 41,324 |
Dell, Inc. (a) | 13,605,100 | | 550,598 |
EMC Corp. (a) | 22,600,300 | | 309,398 |
International Business Machines Corp. | 3,480,300 | | 290,466 |
| | 1,191,786 |
Electronic Equipment & Instruments - 1.5% |
CDW Corp. | 956,000 | | 59,272 |
Flextronics International Ltd. (a) | 9,303,500 | | 125,969 |
Common Stocks - continued |
| Shares | | Value (Note 1)
(000s) |
INFORMATION TECHNOLOGY - continued |
Electronic Equipment & Instruments - continued |
Jabil Circuit, Inc. (a) | 4,496,200 | | $ 140,236 |
National Instruments Corp. | 609,900 | | 16,742 |
| | 342,219 |
Internet Software & Services - 1.8% |
aQuantive, Inc. (a) | 1,112,000 | | 20,972 |
Google, Inc. Class A (sub. vtg.) | 459,800 | | 132,312 |
Yahoo! Japan Corp. | 8,000 | | 17,217 |
Yahoo!, Inc. (a) | 7,231,964 | | 241,114 |
| | 411,615 |
IT Services - 1.0% |
Affiliated Computer Services, Inc. Class A (a) | 1,340,600 | | 66,990 |
DST Systems, Inc. (a) | 1,315,900 | | 66,795 |
First Data Corp. | 976,200 | | 40,161 |
Paychex, Inc. | 1,775,620 | | 61,987 |
| | 235,933 |
Office Electronics - 0.1% |
Zebra Technologies Corp. Class A (a) | 600,000 | | 23,400 |
Semiconductors & Semiconductor Equipment - 6.6% |
Advanced Semiconductor Engineering, Inc. sponsored ADR | 7,227,500 | | 27,826 |
Altera Corp. (a) | 2,926,400 | | 64,000 |
Analog Devices, Inc. | 3,678,400 | | 144,193 |
Applied Materials, Inc. | 4,097,500 | | 75,640 |
ASE Test Ltd. (a) | 1,052,100 | | 7,312 |
Cree, Inc. (a) | 704,700 | | 20,894 |
Intel Corp. | 20,520,040 | | 556,914 |
Intersil Corp. Class A | 2,381,300 | | 46,126 |
KLA-Tencor Corp. | 1,850,500 | | 95,671 |
Lam Research Corp. (a) | 1,108,900 | | 31,548 |
Linear Technology Corp. | 1,298,260 | | 50,450 |
Marvell Technology Group Ltd. (a) | 1,551,600 | | 67,789 |
Microchip Technology, Inc. | 701,400 | | 21,792 |
PMC-Sierra, Inc. (a) | 2,732,100 | | 26,857 |
Siliconware Precision Industries Co. Ltd. sponsored ADR (d) | 6,065,656 | | 31,602 |
Teradyne, Inc. (a) | 1,448,900 | | 22,501 |
Texas Instruments, Inc. | 5,238,500 | | 166,375 |
Xilinx, Inc. | 1,985,700 | | 56,295 |
| | 1,513,785 |
Common Stocks - continued |
| Shares | | Value (Note 1)
(000s) |
INFORMATION TECHNOLOGY - continued |
Software - 6.1% |
Adobe Systems, Inc. | 1,302,736 | | $ 38,613 |
BEA Systems, Inc. (a) | 3,083,800 | | 27,939 |
Citrix Systems, Inc. (a) | 1,523,000 | | 36,293 |
McAfee, Inc. (a) | 1,875,100 | | 58,878 |
Microsoft Corp. | 38,133,100 | | 976,584 |
Oracle Corp. (a) | 8,837,300 | | 120,011 |
Quest Software, Inc. (a) | 1,195,800 | | 17,040 |
Siebel Systems, Inc. | 1,650,600 | | 13,865 |
Symantec Corp. (a) | 3,835,689 | | 84,270 |
Synopsys, Inc. (a) | 1,151,354 | | 21,312 |
| | 1,394,805 |
TOTAL INFORMATION TECHNOLOGY | | 5,900,056 |
MATERIALS - 1.6% |
Chemicals - 1.5% |
Monsanto Co. | 1,523,800 | | 102,658 |
Potash Corp. of Saskatchewan | 859,600 | | 91,475 |
Praxair, Inc. | 2,869,900 | | 141,744 |
| | 335,877 |
Containers & Packaging - 0.1% |
Smurfit-Stone Container Corp. (a) | 2,435,816 | | 29,546 |
TOTAL MATERIALS | | 365,423 |
TELECOMMUNICATION SERVICES - 1.0% |
Diversified Telecommunication Services - 0.3% |
Verizon Communications, Inc. | 1,763,100 | | 60,351 |
Wireless Telecommunication Services - 0.7% |
American Tower Corp. Class A (a) | 1,564,180 | | 35,945 |
Nextel Communications, Inc. Class A (a) | 3,879,200 | | 134,996 |
| | 170,941 |
TOTAL TELECOMMUNICATION SERVICES | | 231,292 |
TOTAL COMMON STOCKS (Cost $18,812,814) | 22,698,201 |
Convertible Preferred Stocks - 0.0% |
| Shares | | Value (Note 1)
(000s) |
INFORMATION TECHNOLOGY - 0.0% |
Communications Equipment - 0.0% |
Chorum Technologies, Inc. Series E (a)(f) | 132,000 | | $ 0 |
TOTAL CONVERTIBLE PREFERRED STOCKS (Cost $1,980) | 0 |
Money Market Funds - 1.1% |
| | | |
Fidelity Cash Central Fund, 3.31% (b) | 208,479,925 | | 208,480 |
Fidelity Securities Lending Cash Central Fund, 3.32% (b)(c) | 36,670,425 | | 36,670 |
TOTAL MONEY MARKET FUNDS (Cost $245,150) | 245,150 |
TOTAL INVESTMENT PORTFOLIO - 100.3% (Cost $19,059,944) | | 22,943,351 |
NET OTHER ASSETS - (0.3)% | | (62,584) |
NET ASSETS - 100% | $ 22,880,767 |
Legend |
(a) Non-income producing |
(b) Affiliated fund that is available only to investment companies and other accounts managed by Fidelity Investments. The rate quoted is the annualized seven-day yield of the fund at period end. A complete listing of the fund's holdings as of its most recent quarter end is available upon request. |
(c) Investment made with cash collateral received from securities on loan. |
(d) Security or a portion of the security is on loan at period end. |
(e) Affiliated company |
(f) Restricted securities - Investment in securities not registered under the Securities Act of 1933 (excluding 144A issues). At the end of the period, the value of restricted securities (excluding 144A issues) amounted to $0 or 0.0% of net assets. |
Additional information on each holding is as follows: |
Security | Acquisition Date | Acquisition Cost (000s) |
Chorum Technologies, Inc. Series E | 9/19/00 | $ 2,276 |
Other Information |
An affiliated company is a company in which the fund has ownership of at least 5% of the voting securities. Companies which are affiliates of the fund at period-end are noted in the fund's Schedule of Investments. Transactions during the period with companies which are or were affiliates are as follows: |
Affiliate
(amounts in thousands) | Value,
beginning
of period | Purchases | Sales Proceeds | Dividend Income | Value, end
of period |
Nastech Pharmaceutical Co., Inc. | $ - | $ 19,814 | $ - | $ - | $ 20,455 |
TOTALS | $ - | $ 19,814 | $ - | $ - | $ 20,455 |
Income Tax Information |
At July 31, 2005, the fund had a capital loss carryforward of approximately $1,279,950,000 all of which will expire on July 31, 2011. |
See accompanying notes which are an integral part of the financial statements.
Annual Report
Financial Statements
Statement of Assets and Liabilities
Amounts in thousands (except per-share amount) | July 31, 2005 |
Assets | | |
Investment in securities, at value (including securities loaned of $35,740) (cost $19,059,944) - See accompanying schedule | | $ 22,943,351 |
Receivable for investments sold | | 156,727 |
Receivable for fund shares sold | | 18,125 |
Dividends receivable | | 10,380 |
Interest receivable | | 774 |
Prepaid expenses | | 37 |
Other affiliated receivables | | 97 |
Other receivables | | 1,811 |
Total assets | | 23,131,302 |
| | |
Liabilities | | |
Payable for investments purchased | $ 154,289 | |
Payable for fund shares redeemed | 46,886 | |
Accrued management fee | 7,384 | |
Other affiliated payables | 5,157 | |
Other payables and accrued expenses | 149 | |
Collateral on securities loaned, at value | 36,670 | |
Total liabilities | | 250,535 |
| | |
Net Assets | | $ 22,880,767 |
Net Assets consist of: | | |
Paid in capital | | $ 20,223,542 |
Undistributed net investment income | | 63,702 |
Accumulated undistributed net realized gain (loss) on investments and foreign currency transactions | | (1,289,886) |
Net unrealized appreciation (depreciation) on investments and assets and liabilities in foreign currencies | | 3,883,409 |
Net Assets, for 537,157 shares outstanding | | $ 22,880,767 |
Net Asset Value, offering price and redemption price per share ($22,880,767 ÷ 537,157 shares) | | $ 42.60 |
See accompanying notes which are an integral part of the financial statements.
Annual Report
Financial Statements - continued
Statement of Operations
Amounts in thousands | Year ended July 31, 2005 |
Investment Income | | |
Dividends | | $ 260,699 |
Special Dividends | | 111,473 |
Interest | | 6,957 |
Security lending | | 818 |
Total income | | 379,947 |
| | |
Expenses | | |
Management fee
Basic fee | $ 128,607 | |
Performance adjustment | (39,985) | |
Transfer agent fees | 55,839 | |
Accounting and security lending fees | 1,750 | |
Independent trustees' compensation | 140 | |
Appreciation in deferred trustee compensation account | 5 | |
Custodian fees and expenses | 359 | |
Registration fees | 113 | |
Audit | 165 | |
Legal | 61 | |
Miscellaneous | 161 | |
Total expenses before reductions | 147,215 | |
Expense reductions | (3,380) | 143,835 |
Net investment income (loss) | | 236,112 |
Realized and Unrealized Gain (Loss) Net realized gain (loss) on: | | |
Investment securities | 1,609,026 | |
Foreign currency transactions | 8 | |
Total net realized gain (loss) | | 1,609,034 |
Change in net unrealized appreciation (depreciation) on: Investment securities | 529,345 | |
Assets and liabilities in foreign currencies | (13) | |
Total change in net unrealized appreciation (depreciation) | | 529,332 |
Net gain (loss) | | 2,138,366 |
Net increase (decrease) in net assets resulting from operations | | $ 2,374,478 |
See accompanying notes which are an integral part of the financial statements.
Annual Report
Statement of Changes in Net Assets
Amounts in thousands | Year ended
July 31,
2005 | Year ended
July 31,
2004 |
Increase (Decrease) in Net Assets | | |
Operations | | |
Net investment income (loss) | $ 236,112 | $ 106,237 |
Net realized gain (loss) | 1,609,034 | 750,921 |
Change in net unrealized appreciation (depreciation) | 529,332 | 695,358 |
Net increase (decrease) in net assets resulting
from operations | 2,374,478 | 1,552,516 |
Distributions to shareholders from net investment income | (220,167) | (122,754) |
Share transactions
Proceeds from sales of shares | 3,792,068 | 4,701,393 |
Reinvestment of distributions | 214,432 | 119,640 |
Cost of shares redeemed | (5,382,182) | (4,084,178) |
Net increase (decrease) in net assets resulting from share transactions | (1,375,682) | 736,855 |
Total increase (decrease) in net assets | 778,629 | 2,166,617 |
| | |
Net Assets | | |
Beginning of period | 22,102,138 | 19,935,521 |
End of period (including undistributed net investment income of $63,702 and undistributed net investment income of $48,439, respectively) | $ 22,880,767 | $ 22,102,138 |
Other Information Shares | | |
Sold | 94,109 | 120,270 |
Issued in reinvestment of distributions | 5,283 | 3,151 |
Redeemed | (133,003) | (104,362) |
Net increase (decrease) | (33,611) | 19,059 |
See accompanying notes which are an integral part of the financial statements.
Annual Report
Financial Highlights
Years ended July 31, | 2005 | 2004 | 2003 | 2002 | 2001 |
Selected Per-Share Data | | | | | |
Net asset value, beginning of period | $ 38.72 | $ 36.13 | $ 33.24 | $ 45.08 | $ 60.25 |
Income from Investment Operations | | | | | |
Net investment income (loss) B | .42 C | .19 | .21 | .10 | .01 |
Net realized and unrealized gain (loss) | 3.85 | 2.62 | 2.81 | (11.88) | (12.66) |
Total from investment operations | 4.27 | 2.81 | 3.02 | (11.78) | (12.65) |
Distributions from net investment income | (.39) | (.22) | (.13) | (.06) | - |
Distributions from net realized gain | - | - | - | - | (2.52) |
Total distributions | (.39) | (.22) | (.13) | (.06) | (2.52) |
Net asset value, end of period | $ 42.60 | $ 38.72 | $ 36.13 | $ 33.24 | $ 45.08 |
Total Return A | 11.08% | 7.79% | 9.13% | (26.16)% | (21.92)% |
Ratios to Average Net Assets D | | | | |
Expenses before expense reductions | .66% | .68% | .71% | .76% | .89% |
Expenses net of voluntary waivers, if any | .66% | .68% | .71% | .76% | .89% |
Expenses net of all reductions | .64% | .67% | .69% | .74% | .87% |
Net investment income (loss) | 1.05% C | .48% | .64% | .25% | .01% |
Supplemental Data | | | | |
Net assets, end of period (in millions) | $ 22,881 | $ 22,102 | $ 19,936 | $ 17,021 | $ 23,032 |
Portfolio turnover rate | 29% | 23% | 24% | 33% | 46% |
A Total returns would have been lower had certain expenses not been reduced during the periods shown.
B Calculated based on average shares outstanding during the period.
C Investment income per share reflects a special dividend which amounted to $.20 per share. Excluding the special dividend, the ratio of net investment income to average net assets would have been .56%.
D Expense ratios reflect operating expenses of the fund. Expenses before reductions do not reflect amounts reimbursed by the investment adviser or reductions from brokerage service arrangements or other expense offset arrangements and do not represent the amount paid by the fund during periods when reimbursements or reductions occur. Expenses net of any voluntary waivers reflect expenses after reimbursement by the investment adviser but prior to reductions from brokerage service arrangements or other expense offset arrangements. Expenses net of all reductions represent the net expenses paid by the fund.
See accompanying notes which are an integral part of the financial statements.
Annual Report
Notes to Financial Statements
For the period ended July 31, 2005
(Amounts in thousands except ratios)
1. Significant Accounting Policies.
Fidelity Blue Chip Growth Fund (the fund) is a fund of Fidelity Securities Fund (the trust) and is authorized to issue an unlimited number of shares. The trust is registered under the Investment Company Act of 1940, as amended (the 1940 Act), as an open-end management investment company organized as a Massachusetts business trust. The financial statements have been prepared in conformity with accounting principles generally accepted in the United States of America, which require management to make certain estimates and assumptions at the date of the financial statements. The following summarizes the significant accounting policies of the fund:
Security Valuation. Net asset value per share (NAV calculation) is calculated as of the close of business of the New York Stock Exchange, normally 4:00 p.m. Eastern time. Equity securities, including restricted securities, for which market quotations are available are valued at the last sale price or official closing price (closing bid price or last evaluated quote if no sale has occurred) on the primary market or exchange on which they trade. If prices are not readily available or do not accurately reflect fair value for a security, or if a security's value has been materially affected by events occurring after the close of the exchange or market on which the security is principally traded, that security may be valued by another method that the Board of Trustees believes accurately reflects fair value. A security's valuation may differ depending on the method used for determining value. Price movements in futures contracts and ADRs, market and trading trends, the bid/ask quotes of brokers and off-exchange institutional trading may be reviewed in the course of making a good faith determination of a security's fair value. Short-term securities with remaining maturities of sixty days or less for which quotations are not readily available are valued on the basis of amortized cost. Investments in open-end investment companies are valued at their net asset value each business day.
Foreign Currency. The fund uses foreign currency contracts to facilitate transactions in foreign-denominated securities. Losses from these transactions may arise from changes in the value of the foreign currency or if the counterparties do not perform under the contracts' terms.
Foreign-denominated assets, including investment securities, and liabilities are translated into U.S. dollars at the exchange rate at period end. Purchases and sales of investment securities, income and dividends received and expenses denominated in foreign currencies are translated into U.S. dollars at the exchange rate in effect on the transaction date.
The effects of exchange rate fluctuations on investments are included with the net realized and unrealized gain (loss) on investment securities. Other foreign currency transactions resulting in realized and unrealized gain (loss) are disclosed separately.
Annual Report
Notes to Financial Statements - continued
(Amounts in thousands except ratios)
1. Significant Accounting Policies - continued
Investment Transactions and Income. Security transactions are accounted for as of trade date. Gains and losses on securities sold are determined on the basis of identified cost and may include proceeds received from litigation. Dividend income is recorded on the ex-dividend date, except for certain dividends from foreign securities where the ex-dividend date may have passed, which are recorded as soon as the fund is informed of the ex-dividend date. Non-cash dividends included in dividend income, if any, are recorded at the fair market value of the securities received. Distributions received on securities that represent a return of capital or capital gain are recorded as a reduction of cost of investments and/or as a realized gain. The fund estimates the components of distributions received that may be considered return of capital distributions or capital gain distributions. Large, non-recurring dividends recognized by the fund are presented separately on the Statement of Operations as "Special Dividends" and the impact of these dividends is presented in the Financial Highlights. Interest income is accrued as earned. Interest income includes coupon interest and amortization of premium and accretion of discount on debt securities. Investment income is recorded net of foreign taxes withheld where recovery of such taxes is uncertain.
Expenses. Most expenses of the trust can be directly attributed to a fund. Expenses which cannot be directly attributed are apportioned among each fund in the trust.
Deferred Trustee Compensation. Under a Deferred Compensation Plan (the Plan), independent Trustees must defer receipt of a portion of, and may elect to defer receipt of an additional portion of, their annual compensation. Deferred amounts are treated as though equivalent dollar amounts had been invested in shares of the fund or are invested in a cross-section of other Fidelity funds, and are marked-to-market. Deferred amounts remain in the fund until distributed in accordance with the Plan.
Income Tax Information and Distributions to Shareholders. Each year, the fund intends to qualify as a regulated investment company by distributing all of its taxable income and realized gains under Subchapter M of the Internal Revenue Code. As a result, no provision for income taxes is required in the accompanying financial statements. Foreign taxes are provided for based on the fund's understanding of the tax rules and rates that exist in the foreign markets in which it invests.
Distributions are recorded on the ex-dividend date. Income and capital gain distributions are determined in accordance with income tax regulations, which may differ from generally accepted accounting principles.
Capital accounts within the financial statements are adjusted for permanent book-tax differences. These adjustments have no impact on net assets or the results of operations. Temporary book-tax differences will reverse in a subsequent period.
Annual Report
1. Significant Accounting Policies - continued
Income Tax Information and Distributions to Shareholders - continued
Book-tax differences are primarily due to foreign currency transactions, deferred trus-tees compensation, capital loss carryforwards and losses deferred due to wash sales.
The tax-basis components of distributable earnings and the federal tax cost as of period end were as follows:
Unrealized appreciation | $ 4,818,314 | |
Unrealized depreciation | (944,840) | |
Net unrealized appreciation (depreciation) | 3,873,474 | |
Undistributed ordinary income | 64,123 | |
Capital loss carryforward | (1,279,950) | |
| | |
Cost for federal income tax purposes | $ 19,069,877 | |
The tax character of distributions paid was as follows:
| July 31, 2005 | July 31, 2004 |
Ordinary Income | $ 220,167 | $ 122,754 |
2. Operating Policies.
Repurchase Agreements. Fidelity Management & Research Company (FMR) has received an Exemptive Order from the Securities and Exchange Commission (the SEC) which permits the fund and other affiliated entities of FMR to transfer uninvested cash balances into joint trading accounts which are then invested in repurchase agreements. The fund may also invest directly with institutions in repurchase agreements. Repurchase agreements are collateralized by government or non-government securities. Collateral is held in segregated accounts with custodian banks and may be obtained in the event of a default of the counterparty. The fund monitors, on a daily basis, the value of the collateral to ensure it is at least equal to the principal amount of the repurchase agreement (including accrued interest). In the event of a default by the counterparty, realization of the collateral proceeds could be delayed, during which time the value of the collateral may decline.
Restricted Securities. The fund may invest in securities that are subject to legal or contractual restrictions on resale. These securities generally may be resold in transactions exempt from registration or to the public if the securities are registered. Disposal of these securities may involve time-consuming negotiations and expense, and prompt sale at an acceptable price may be difficult. Information regarding restricted securities is included at the end of the fund's Schedule of Investments.
Annual Report
Notes to Financial Statements - continued
(Amounts in thousands except ratios)
3. Purchases and Sales of Investments.
Purchases and sales of securities, other than short-term securities and U.S. government securities, aggregated $6,414,001 and $7,498,625, respectively.
4. Fees and Other Transactions with Affiliates.
Management Fee. FMR and its affiliates provide the fund with investment management related services for which the fund pays a monthly management fee. The management fee is the sum of an individual fund fee rate that is based on an annual rate of .30% of the fund's average net assets and a group fee rate that averaged .27% during the period. The group fee rate is based upon the average net assets of all the mutual funds advised by FMR. The group fee rate decreases as assets under management increase and increases as assets under management decrease. In addition, the management fee is subject to a performance adjustment (up to a maximum of ±.20% of the fund's average net assets over a 36 month performance period). The upward or downward adjustment to the management fee is based on the fund's relative investment performance as compared to an appropriate benchmark index. For the period, the total annual management fee rate, including the performance adjustment, was .40% of the fund's average net assets.
Sales Load. Fidelity Distributors Corporation (FDC), an affiliate of FMR, is the general distributor of the fund. Shares purchased prior to October 12, 1990, were subject to a 1% deferred sales charge upon redemption. For the period, FDC received sales charges of $23 on redemption of shares of the fund. Effective July 1, 2005, the deferred sales charge was eliminated.
Transfer Agent Fees. Fidelity Service Company, Inc. (FSC), an affiliate of FMR, is the fund's transfer, dividend disbursing and shareholder servicing agent. FSC receives account fees and asset-based fees that vary according to account size and type of account. FSC pays for typesetting, printing and mailing of shareholder reports, except proxy statements. For the period, the transfer agent fees were equivalent to an annual rate of .25% of average net assets.
Accounting and Security Lending Fees. FSC maintains the fund's accounting records. The accounting fee is based on the level of average net assets for the month. Under a separate contract, FSC administers the security lending program. The security lending fee is based on the number and duration of lending transactions.
Central Funds. The fund may invest in affiliated Central Funds managed by Fidelity Investments Money Management, Inc. (FIMM), an affiliate of FMR. The Central Funds are open-end investment companies available only to investment companies and other accounts managed by FMR and its affiliates. The Money Market Central Funds seek preservation of capital and current income. The Central Funds do not pay a management fee. Income distributions earned by the fund are recorded as income in the accompanying financial statements and totaled $9,222 for the period.
Annual Report
4. Fees and Other Transactions with Affiliates - continued
Brokerage Commissions. The fund placed a portion of its portfolio transactions with brokerage firms which are affiliates of the investment adviser. The commissions paid to these affiliated firms were $238 for the period.
5. Committed Line of Credit.
The fund participates with other funds managed by FMR in a $4.2 billion credit facility (the "line of credit") to be utilized for temporary or emergency purposes to fund shareholder redemptions or for other short-term liquidity purposes. The fund has agreed to pay commitment fees on its pro rata portion of the line of credit. During the period, there were no borrowings on this line of credit.
6. Security Lending.
The fund lends portfolio securities from time to time in order to earn additional income. The fund receives collateral (in the form of U.S. Treasury obligations, letters of credit and/or cash) against the loaned securities and maintains collateral in an amount not less than 100% of the market value of the loaned securities during the period of the loan. The market value of the loaned securities is determined at the close of business of the fund and any additional required collateral is delivered to the fund on the next business day. If the borrower defaults on its obligation to return the securities loaned because of insolvency or other reasons, a fund could experience delays and costs in recovering the securities loaned or in gaining access to the collateral. Cash collateral is invested in the Fidelity Securities Lending Cash Central Fund. The value of loaned securities and cash collateral at period end are disclosed on the fund's Statement of Assets and Liabilities.
7. Expense Reductions.
Many of the brokers with whom FMR places trades on behalf of the fund provided services to the fund in addition to trade execution. These services included payments of certain expenses on behalf of the fund totaling $2,719 for the period. In addition, through arrangements with the fund's custodian and transfer agent, credits realized as a result of uninvested cash balances were used to reduce the fund's expenses. During the period, these credits reduced the fund's custody and transfer agent expenses by $1 and $660, respectively.
8. Other.
The fund's organizational documents provide former and current trustees and officers with a limited indemnification against liabilities arising in connection with the performance of their duties to the fund. In the normal course of business, the fund may also enter into contracts that provide general indemnifications. The fund's maximum exposure under these arrangements is unknown as this would be dependent on future claims that may be made against the fund. The risk of material loss from such claims is considered remote.
Annual Report
Report of Independent Registered Public Accounting Firm
To the Trustees of Fidelity Securities Fund and Shareholders of Fidelity Blue Chip Growth Fund:
We have audited the accompanying statement of assets and liabilities of Fidelity Blue Chip Growth Fund (the Fund), a fund of Fidelity Securities Fund, including the portfolio of investments, as of July 31, 2005, and the related statement of operations for the year then ended, the statement of changes in net assets for each of the two years in the period then ended, and the financial highlights for each of the five years in the period then ended. These financial statements and financial highlights are the responsibility of the Fund's management. Our responsibility is to express an opinion on these financial statements and financial highlights based on our audits.
We conducted our audits in accordance with standards of the Public Company Accounting Oversight Board (United States). Those standards require that we plan and perform the audit to obtain reasonable assurance about whether the financial statements and financial highlights are free of material misstatement. The Fund is not required to have, nor were we engaged to perform, an audit of its internal control over financial reporting. Our audits included consideration of internal control over financial reporting as a basis for designing audit procedures that are appropriate in the circumstances, but not for the purpose of expressing an opinion on the effectiveness of the Fund's internal control over financial reporting. Accordingly, we express no such opinion. An audit also includes examining, on a test basis, evidence supporting the amounts and disclosures in the financial statements, assessing the accounting principles used and significant estimates made by management, as well as evaluating the overall financial statement presentation. Our procedures included confirmation of securities owned as of July 31, 2005, by correspondence with the custodians and brokers; where replies were not received from brokers, we performed other auditing procedures. We believe that our audits provide a reasonable basis for our opinion.
In our opinion, the financial statements and financial highlights referred to above present fairly, in all material respects, the financial position of Fidelity Blue Chip Growth Fund as of July 31, 2005, the results of its operations for the year then ended, the changes in its net assets for each of the two years in the period then ended, and its financial highlights for each of the five years in the period then ended, in conformity with accounting principles generally accepted in the United States of America.
/s/ Deloitte & Touche LLP
DELOITTE & TOUCHE LLP
Boston, Massachusetts
September 9, 2005
Annual Report
Trustees and Officers
The Trustees, Members of the Advisory Board, and executive officers of the trust and fund, as applicable, are listed below. The Board of Trustees governs the fund and is responsible for protecting the interests of shareholders. The Trustees are experienced executives who meet periodically throughout the year to oversee the fund's activities, review contractual arrangements with companies that provide services to the fund, and review the fund's performance. Except for William O. McCoy, Stephen P. Jonas, and Kenneth L. Wolfe, each of the Trustees oversees 319 funds advised by FMR or an affiliate. Mr. McCoy oversees 321 funds advised by FMR or an affiliate. Mr. Jonas and Mr. Wolfe oversee 310 funds advised by FMR or an affiliate.
The Trustees hold office without limit in time except that (a) any Trustee may resign; (b) any Trustee may be removed by written instrument, signed by at least two-thirds of the number of Trustees prior to such removal; (c) any Trustee who requests to be retired or who has become incapacitated by illness or injury may be retired by written instrument signed by a majority of the other Trustees; and (d) any Trustee may be removed at any special meeting of shareholders by a two-thirds vote of the outstanding voting securities of the trust. Each Trustee who is not an interested person (as defined in the 1940 Act) (Independent Trustee), shall retire not later than the last day of the calendar year in which his or her 72nd birthday occurs. The Independent Trustees may waive this mandatory retirement age policy with respect to individual Trustees. The executive officers and Advisory Board Members hold office without limit in time, except that any officer and Advisory Board Member may resign or may be removed by a vote of a majority of the Trustees at any regular meeting or any special meeting of the Trustees. Except as indicated, each individual has held the office shown or other offices in the same company for the past five years.
Interested Trustees*:
Correspondence intended for each Trustee who is an interested person may be sent to Fidelity Investments, 82 Devonshire Street, Boston, Massachusetts 02109.
Name, Age; Principal Occupation |
Edward C. Johnson 3d (75)** |
| Year of Election or Appointment: 1984 Mr. Johnson is Chairman of the Board of Trustees. Mr. Johnson serves as Chief Executive Officer, Chairman, and a Director of FMR Corp.; a Director and Chairman of the Board and of the Executive Committee of FMR; Chairman and a Director of Fidelity Management & Research (Far East) Inc.; Chairman and a Director of Fidelity Investments Money Management, Inc.; and Chairman (2001-present) and a Director (2000-present) of FMR Co., Inc. |
Abigail P. Johnson (43)** |
| Year of Election or Appointment: 2001 Ms. Johnson serves as President of Fidelity Employer Services Company (FESCO) (2005-present). She is President and a Director of Fidelity Investments Money Management, Inc. (2001-present), FMR Co., Inc. (2001-present), and a Director of FMR Corp. Previously, Ms. Johnson served as President and a Director of FMR (2001-2005), Senior Vice President of the Fidelity funds (2001-2005), and managed a number of Fidelity funds. |
Stephen P. Jonas (52) |
| Year of Election or Appointment: 2005 Mr. Jonas is Senior Vice President of Blue Chip Growth (2005-present). He also serves as Senior Vice President of other Fidelity funds (2005-present). Mr. Jonas is Executive Director of FMR (2005-present). Previously, Mr. Jonas served as President of Fidelity Enterprise Operations and Risk Services (2004-2005), Chief Administrative Officer (2002-2004), and Chief Financial Officer of FMR Co. (1998-2000). Mr. Jonas has been with Fidelity Investments since 1987 and has held various financial and management positions, including Chief Financial Officer of FMR. In addition, he serves on the Boards of Boston Ballet (2003-present) and Simmons College (2003-present). |
Robert L. Reynolds (53) |
| Year of Election or Appointment: 2003 Mr. Reynolds is a Director (2003-present) and Chief Operating Officer (2002-present) of FMR Corp. He also serves on the Board at Fidelity Investments Canada, Ltd. (2000-present). Previously, Mr. Reynolds served as President of Fidelity Investments Institutional Retirement Group (1996-2000). |
* Trustees have been determined to be "Interested Trustees" by virtue of, among other things, their affiliation with the trust or various entities under common control with FMR.
** Edward C. Johnson 3d, Trustee, is Abigail P. Johnson's father.
Annual Report
Independent Trustees:
Correspondence intended for each Independent Trustee (that is, the Trustees other than the Interested Trustees) may be sent to Fidelity Investments, P.O. Box 55235, Boston, Massachusetts 02205-5235.
Name, Age; Principal Occupation |
Dennis J. Dirks (57) |
| Year of Election or Appointment: 2005 Prior to his retirement in May 2003, Mr. Dirks was Chief Operating Officer and a member of the Board of The Depository Trust & Clearing Corporation (DTCC) (1999-2003). He also served as President, Chief Operating Officer, and Board member of The Depository Trust Company (DTC) (1999-2003) and President and Board member of the National Securities Clearing Corporation (NSCC) (1999-2003). In addition, Mr. Dirks served as Chief Executive Officer and Board member of the Government Securities Clearing Corporation (2001-2003) and Chief Executive Officer and Board member of the Mortgage-Backed Securities Clearing Corporation (2001-2003). Mr. Dirks also serves as a Trustee of Manhattan College (2005-present). |
Robert M. Gates (61) |
| Year of Election or Appointment: 1997 Dr. Gates is Vice Chairman of the Independent Trustees (2005-present). Dr. Gates is President of Texas A&M University (2002-present). He was Director of the Central Intelligence Agency (CIA) from 1991 to 1993. From 1989 to 1991, Dr. Gates served as Assistant to the President of the United States and Deputy National Security Advisor. Dr. Gates is a Director of NACCO Industries, Inc. (mining and manufacturing), Parker Drilling Co., Inc. (drilling and rental tools for the energy industry, 2001-present), and Brinker International (restaurant management, 2003-present). Previously, Dr. Gates served as a Director of LucasVarity PLC (automotive components and diesel engines), a Director of TRW Inc. (automotive, space, defense, and information technology), and Dean of the George Bush School of Government and Public Service at Texas A&M University (1999-2001). Dr. Gates also is a Trustee of the Forum for International Policy. |
George H. Heilmeier (69) |
| Year of Election or Appointment: 2004 Dr. Heilmeier is Chairman Emeritus of Telcordia Technologies (communication software and systems), where prior to his retirement, he served as company Chairman and Chief Executive Officer. He currently serves on the Boards of Directors of The Mitre Corporation (systems engineering and information technology support for the government), and HRL Laboratories (private research and development, 2004-present). He is Chairman of the General Motors Science & Technology Advisory Board and a Life Fellow of the Institute of Electrical and Electronics Engineers (IEEE) (2000-present). Dr. Heilmeier is a member of the Defense Science Board and the National Security Agency Advisory Board. He is also a member of the National Academy of Engineering, the American Academy of Arts and Sciences, and the Board of Overseers of the School of Engineering and Applied Science of the University of Pennsylvania. Previously, Dr. Heilmeier served as a Director of TRW Inc. (automotive, space, defense, and information technology, 1992-2002), Compaq (1994-2002), Automatic Data Processing, Inc. (ADP) (technology-based business outsourcing, 1995-2002), INET Technologies Inc. (telecommunications network surveillance, 2001-2004), and Teletech Holdings (customer management services). He is the recipient of the 2005 Kyoto Prize in Advanced Technology for his invention of the liquid display. |
Marie L. Knowles (58) |
| Year of Election or Appointment: 2001 Prior to Ms. Knowles' retirement in June 2000, she served as Executive Vice President and Chief Financial Officer of Atlantic Richfield Company (ARCO) (diversified energy, 1996-2000). From 1993 to 1996, she was a Senior Vice President of ARCO and President of ARCO Transportation Company. She served as a Director of ARCO from 1996 to 1998. She currently serves as a Director of Phelps Dodge Corporation (copper mining and manufacturing) and McKesson Corporation (healthcare service, 2002-present). Ms. Knowles is a Trustee of the Brookings Institution and the Catalina Island Conservancy and also serves as a member of the Advisory Board for the School of Engineering of the University of Southern California. |
Ned C. Lautenbach (61) |
| Year of Election or Appointment: 2000 Mr. Lautenbach has been a partner of Clayton, Dubilier & Rice, Inc. (private equity investment firm) since September 1998. Previously, Mr. Lautenbach was with the International Business Machines Corporation (IBM) from 1968 until his retirement in 1998. Mr. Lautenbach serves as a Director of Italtel Holding S.p.A. (telecommunications (Milan, Italy), 2004-present) and Eaton Corporation (diversified industrial) as well as the Philharmonic Center for the Arts in Naples, Florida. He also is a member of the Board of Trustees of Fairfield University (2005-present), as well as a member of the Council on Foreign Relations. |
Marvin L. Mann (72) |
| Year of Election or Appointment: 1993 Mr. Mann is Chairman of the Independent Trustees (2001-present). He is Chairman Emeritus of Lexmark International, Inc. (computer peripherals), where he served as CEO until April 1998, retired as Chairman May 1999, and remains a member of the Board. Prior to 1991, he held the positions of Vice President of International Business Machines Corporation (IBM) and President and General Manager of various IBM divisions and subsidiaries. He is a member of the Executive Committee of the Independent Director's Council of the Investment Company Institute. In addition, Mr. Mann is a member of the President's Cabinet at the University of Alabama and the Board of Visitors of the Culverhouse College of Commerce and Business Administration at the University of Alabama. |
William O. McCoy (71) |
| Year of Election or Appointment: 1997 Prior to his retirement in December 1994, Mr. McCoy was Vice Chairman of the Board of BellSouth Corporation (telecommunications) and President of BellSouth Enterprises. He is currently a Director of Liberty Corporation (holding company), Duke Realty Corporation (real estate), and Progress Energy, Inc. (electric utility). He is also a partner of Franklin Street Partners (private investment management firm) and a member of the Research Triangle Foundation Board. In addition, Mr. McCoy served as the Interim Chancellor (1999-2000) and a member of the Board of Visitors for the University of North Carolina at Chapel Hill and currently serves on the Board of Directors of the University of North Carolina Health Care System and the Board of Visitors of the Kenan-Flagler Business School (University of North Carolina at Chapel Hill). He also served as Vice President of Finance for the University of North Carolina (16-school system). |
Cornelia M. Small (61) |
| Year of Election or Appointment: 2005 Ms. Small is a member (2000-present) and Chairperson (2002-present) of the Investment Committee, and a member (2002-present) of the Board of Trustees of Smith College. Previously, she served as Chief Investment Officer (1999-2000), Director of Global Equity Investments (1996-1999), and a member of the Board of Directors of Scudder, Stevens & Clark (1990-1997) and Scudder Kemper Investments (1997-1998). In addition, Ms. Small served as Co-Chair (2000-2003) of the Annual Fund for the Fletcher School of Law and Diplomacy. |
William S. Stavropoulos (66) |
| Year of Election or Appointment: 2002 Mr. Stavropoulos is Chairman of the Board (2000-present) and a Member of the Board of Directors of The Dow Chemical Company. Since joining The Dow Chemical Company in 1967, Mr. Stavropoulos served in numerous senior management positions, including President (1993-2000; 2002-2003), CEO (1995-2000; 2002-2004), and Chairman of the Executive Committee (2000-2004). Currently, he is a Director of NCR Corporation (data warehousing and technology solutions), BellSouth Corporation (telecommunications), Chemical Financial Corporation, Maersk Inc. (industrial conglomerate, 2002-present), and Metalmark Capital (private equity investment firm, 2005-present). He also serves as a member of the Board of Trustees of the American Enterprise Institute for Public Policy Research. In addition, Mr. Stavropoulos is a member of The Business Council, J.P. Morgan International Council and the University of Notre Dame Advisory Council for the College of Science. |
Kenneth L. Wolfe (66) |
| Year of Election or Appointment: 2005 Mr. Wolfe also serves as a Trustee (2005-present) or Member of the Advisory Board (2004-present) of other investment companies advised by FMR. Prior to his retirement in 2001, Mr. Wolfe was Chairman and Chief Executive Officer of Hershey Foods Corporation (1993-2001). He currently serves as a member of the boards of Adelphia Communications Corporation (2003-present), Bausch & Lomb, Inc., and Revlon Inc. (2004-present). |
Annual Report
Advisory Board Members and Executive Officers:
Correspondence intended for Mr. Gamper may be sent to Fidelity Investments, P.O. Box 55235, Boston, Massachusetts 02205-5235. Correspondence intended for each executive officer and Mr. Lynch may be sent to Fidelity Investments, 82 Devonshire Street, Boston, Massachusetts 02109.
Name, Age; Principal Occupation |
Albert R. Gamper, Jr. (63) |
| Year of Election or Appointment: 2005 Member of the Advisory Board of Fidelity Securities Fund. Prior to his retirement in December 2004, Mr. Gamper served as Chairman of the Board of CIT Group Inc. (commercial finance). During his tenure with CIT Group Inc. Mr. Gamper served in numerous senior management positions, including Chairman (1987-1989; 1999-2001; 2002-2004), Chief Executive Officer (1987-2004), and President (1989-2002). He currently serves as a member of the Board of Directors of Public Service Enterprise Group (utilities, 2001-present), Chairman of the Board of Governors, Rutgers University (2004-present), and Chairman of the Board of Saint Barnabas Health Care System. |
Peter S. Lynch (61) |
| Year of Election or Appointment: 2003 Member of the Advisory Board of Fidelity Securities Fund. Vice Chairman and a Director of FMR, and Vice Chairman (2001-present) and a Director (2000-present) of FMR Co., Inc. Previously, Mr. Lynch served as a Trustee of the Fidelity funds (1990-2003). In addition, he serves as a Trustee of Boston College, Massachusetts Eye & Ear Infirmary, Historic Deerfield, John F. Kennedy Library, and the Museum of Fine Arts of Boston. |
Dwight D. Churchill (51) |
| Year of Election or Appointment: 2005 Vice President of Blue Chip Growth. Mr. Churchill also serves as Vice President of certain Equity funds (2005-present) and certain High Income Funds (2005-present). Previously, he served as Head of Fidelity's Fixed-Income Division (2000-2005), Vice President of Fidelity's Money Market Funds (2000-2005), Vice President of Fidelity's Bond Funds, and Senior Vice President of FIMM (2000) and FMR. Mr. Churchill joined Fidelity in 1993 as Vice President and Group Leader of Taxable Fixed-Income Investments. |
John B. McDowell (46) |
| Year of Election or Appointment: 1996 Vice President of Blue Chip Growth. Since joining Fidelity Investments in 1985, Mr. McDowell has worked as a research analyst and manager. |
Brian J. Hanson (31) |
| Year of Election or Appointment: 2005 Vice President of Blue Chip Growth. Mr. Hanson also serves as Vice President of other funds advised by FMR. Prior to assuming his current responsibilities, Mr. Hanson has worked as a research analyst and portfolio manager. |
Eric D. Roiter (56) |
| Year of Election or Appointment: 1998 Secretary of Blue Chip Growth. He also serves as Secretary of other Fidelity funds; Vice President, General Counsel, and Secretary of FMR Co., Inc. (2001-present) and FMR; Assistant Secretary of Fidelity Management & Research (U.K.) Inc. (2001-present), Fidelity Management & Research (Far East) Inc. (2001-present), and Fidelity Investments Money Management, Inc. (2001-present). Mr. Roiter is an Adjunct Member, Faculty of Law, at Boston College Law School (2003-present). Previously, Mr. Roiter served as Vice President and Secretary of FDC (1998-2005). |
Stuart Fross (45) |
| Year of Election or Appointment: 2003 Assistant Secretary of Blue Chip Growth. Mr. Fross also serves as Assistant Secretary of other Fidelity funds (2003-present), Vice President and Secretary of FDC (2005-present), and is an employee of FMR. |
Christine Reynolds (46) |
| Year of Election or Appointment: 2004 President, Treasurer, and Anti-Money Laundering (AML) officer of Blue Chip Growth. Ms. Reynolds also serves as President, Treasurer, and AML officer of other Fidelity funds (2004) and is a Vice President (2003) and an employee (2002) of FMR. Before joining Fidelity Investments, Ms. Reynolds worked at PricewaterhouseCoopers LLP (PwC) (1980-2002), where she was most recently an audit partner with PwC's investment management practice. |
Timothy F. Hayes (54) |
| Year of Election or Appointment: 2002 Chief Financial Officer of Blue Chip Growth. Mr. Hayes also serves as Chief Financial Officer of other Fidelity funds (2002-present) and President of Fidelity Investment Operations (2005-present) which includes Fidelity Pricing and Cash Management Services Group (FPCMS), where he served as President (1998-2005). Mr. Hayes serves as President of Fidelity Service Company (2003-present) where he also serves as a Director. Mr. Hayes also served as President of Fidelity Investments Operations Group (FIOG, 2002-2005). |
Kenneth A. Rathgeber (58) |
| Year of Election or Appointment: 2004 Chief Compliance Officer of Blue Chip Growth. Mr. Rathgeber also serves as Chief Compliance Officer of other Fidelity funds (2004) and Executive Vice President of Risk Oversight for Fidelity Investments (2002). Previously, he served as Executive Vice President and Chief Operating Officer for Fidelity Investments Institutional Services Company, Inc. (1998-2002). |
John R. Hebble (47) |
| Year of Election or Appointment: 2003 Deputy Treasurer of Blue Chip Growth. Mr. Hebble also serves as Deputy Treasurer of other Fidelity funds (2003), and is an employee of FMR. Before joining Fidelity Investments, Mr. Hebble worked at Deutsche Asset Management where he served as Director of Fund Accounting (2002-2003) and Assistant Treasurer of the Scudder Funds (1998-2003). |
Bryan A. Mehrmann (44) |
| Year of Election or Appointment: 2005 Deputy Treasurer of Blue Chip Growth. Mr. Mehrmann also serves as Deputy Treasurer of other Fidelity funds (2005-present) and is an employee of FMR. Previously, Mr. Mehrmann served as Vice President of Fidelity Investments Institutional Services Group (FIIS)/Fidelity Investments Institutional Operations Corporation, Inc. (FIIOC) Client Services (1998-2004). |
Kimberley H. Monasterio (41) |
| Year of Election or Appointment: 2004 Deputy Treasurer of Blue Chip Growth. Ms. Monasterio also serves as Deputy Treasurer of other Fidelity funds (2004) and is an employee of FMR (2004). Before joining Fidelity Investments, Ms. Monasterio served as Treasurer (2000-2004) and Chief Financial Officer (2002-2004) of the Franklin Templeton Funds and Senior Vice President of Franklin Templeton Services, LLC (2000-2004). |
Kenneth B. Robins (35) |
| Year of Election or Appointment:2005 Deputy Treasurer of Blue Chip Growth. Mr. Robins also serves as Deputy Treasurer of other Fidelity funds (2005-present) and is an employee of FMR (2004-present). Before joining Fidelity Investments, Mr. Robins worked at KPMG LLP, where he was a partner in KPMG's department of professional practice (2002-2004) and a Senior Manager (1999-2000). In addition, Mr. Robins served as Assistant Chief Accountant, United States Securities and Exchange Commission (2000-2002). |
Robert G. Byrnes (38) |
| Year of Election or Appointment: 2005 Assistant Treasurer of Blue Chip Growth. Mr. Byrnes also serves as Assistant Treasurer of other Fidelity funds (2005-present) and is an employee of FMR (2005-present). Previously, Mr. Byrnes served as Vice President of FPCMS (2003-2005). Before joining Fidelity Investments, Mr. Byrnes worked at Deutsche Asset Management where he served as Vice President of the Investment Operations Group (2000-2003). |
John H. Costello (58) |
| Year of Election or Appointment: 1987 Assistant Treasurer of Blue Chip Growth. Mr. Costello also serves as Assistant Treasurer of other Fidelity funds and is an employee of FMR. |
Peter L. Lydecker (51) |
| Year of Election or Appointment: 2004 Assistant Treasurer of Blue Chip Growth. Mr. Lydecker also serves as Assistant Treasurer of other Fidelity funds (2004) and is an employee of FMR. |
Mark Osterheld (50) |
| Year of Election or Appointment: 2002 Assistant Treasurer of Blue Chip Growth. Mr. Osterheld also serves as Assistant Treasurer of other Fidelity funds (2002) and is an employee of FMR. |
Gary W. Ryan (46) |
| Year of Election or Appointment: 2005 Assistant Treasurer of Blue Chip Growth. Mr. Ryan also serves as Assistant Treasurer of other Fidelity funds (2005-present) and is an employee of FMR (2005-present). Previously, Mr. Ryan served as Vice President of Fund Reporting in FPCMS (1999-2005). |
Salvatore Schiavone (39) |
| Year of Election or Appointment: 2005 Assistant Treasurer of Blue Chip Growth. Mr. Schiavone also serves as Assistant Treasurer of other Fidelity funds (2005-present) and is an employee of FMR (2005-present). Before joining Fidelity Investments, Mr. Schiavone worked at Deutsche Asset Management, where he most recently served as Assistant Treasurer (2003-2005) of the Scudder Funds and Vice President and Head of Fund Reporting (1996-2003). |
Annual Report
Distributions
The fund designates 100% of the dividends distributed during the fiscal year as qualifying for the dividends-received deduction for corporate shareholders.
The fund designates 100% of the dividends distributed during the fiscal year as amounts which may be taken into account as a dividend for the purposes of the maximum rate under section 1(h)(11) of the Internal Revenue Code.
The fund will notify shareholders in January 2006 of amounts for use in preparing 2005 income tax returns.
Annual Report
Board Approval of Investment Advisory Contracts and Management Fees
Fidelity Blue Chip Growth Fund
Each year, typically in July, the Board of Trustees, including the independent Trustees (together, the Board), votes on the renewal of the management contract and sub-advisory agreements (together, the Advisory Contracts) for the fund. The Board, assisted by the advice of fund counsel and independent Trustees' counsel, requests and considers a broad range of information throughout the year.
The Board meets regularly each month except August and takes into account throughout the year matters bearing on Advisory Contracts. The Board, acting directly and through its separate committees, considers at each of its meetings factors that are relevant to the annual renewal of the fund's Advisory Contracts, including the services and support provided to the fund and its shareholders by Fidelity. At the time of the renewal, the Board had 11 standing committees, each composed of independent Trustees with varying backgrounds, to which the Board has assigned specific subject matter responsibilities in order to enhance effective decision-making by the Board. Each committee has adopted a written charter outlining the structure and purposes of the committee. One such committee, the Equity Contract Committee, meets periodically during the first six months of each year and as necessary to consider matters specifically related to the annual renewal of Advisory Contracts. The committee requests and receives information on, and makes recommendations to the independent Trustees concerning, the approval and annual review of the Advisory Contracts.
At its July 2005 meeting, the Board of Trustees, including the independent Trustees, unanimously determined to renew the Advisory Contracts for the fund. In reaching its determination, the Board considered all factors it believed relevant, including (1) the nature, extent, and quality of the services to be provided to the fund and its shareholders by Fidelity (including the investment performance of the fund); (2) the competitiveness of the management fee and total expenses of the fund; (3) the total costs of the services to be provided by and the profits to be realized by the investment adviser and its affiliates from the relationship with the fund; (4) the extent to which economies of scale would be realized as the fund grows; and (5) whether fee levels reflect these economies of scale, if any, for the benefit of fund shareholders.
In determining whether to renew the Advisory Contracts for the fund, the Board ultimately reached a determination, with the assistance of fund counsel and independent Trustees' counsel, that the renewal of the Advisory Contracts and the compensation to be received by Fidelity under the management contract is consistent with Fidelity's fiduciary duty under applicable law. In addition to evaluating the specific factors noted above, the Board, in reaching its determination, is aware that shareholders in the fund have a broad range of investment choices available to them, including a wide choice among mutual funds offered by competitors to Fidelity, and that the fund's shareholders, with the opportunity to review and weigh the disclosure provided by the fund in its prospectus and other public disclosures, have chosen to invest in this fund, managed by Fidelity.
Annual Report
Nature, Extent, and Quality of Services Provided by Fidelity. The Board considered staffing within the investment adviser, FMR, and the sub-advisers (together, the Investment Advisers), including the background of the fund's portfolio manager and the fund's investment objective and discipline. The independent Trustees also had discussions with senior management of Fidelity's investment operations and investment groups. The Board considered the structure of the portfolio manager compensation program and whether this structure provides appropriate incentives.
Fidelity Resources Dedicated to Investment Management and Support Services. The Board reviewed the size, education, and experience of the Investment Advisers' investment staff, their use of technology, and the Investment Advisers' approach to recruiting, training, and retaining portfolio managers and other research, advisory, and management personnel. The Board considered Fidelity's extensive global research capabilities that enable the Investment Advisers to aggregate data from various sources in an effort to produce positive investment results. The Board noted that Fidelity's analysts have access to a variety of technological tools that enable them to perform both fundamental and quantitative analysis and to specialize in various disciplines. The Board also considered that Fidelity's portfolio managers and analysts have access to daily portfolio attribution that allows for monitoring of a fund's portfolio, as well as an electronic communication system that provides immediate real-time access to research concerning issuers and credit enhancers.
Shareholder and Administrative Services. The Board considered the nature, extent, quality, and cost of administrative, distribution, and shareholder services performed by the Investment Advisers and their affiliates under the Advisory Contracts and under separate agreements covering transfer agency, pricing and bookkeeping, and securities lending services for the fund. The Board also considered the nature and extent of the Investment Advisers' supervision of third party service providers, principally custodians and subcustodians. The Board reviewed the allocation of fund brokerage, including allocations to brokers affiliated with the Investment Advisers, the use of brokerage commissions to pay fund expenses, and the use of "soft" commission dollars to pay for research services. The Board also considered that Fidelity voluntarily decided in 2004 to stop using "soft" commission dollars to pay for market data and, instead, to pay for that data out of its own resources. The Board also considered the resources devoted to, and the record of compliance with, the fund's compliance policies and procedures.
The Board noted that the growth of fund assets across the complex allows Fidelity to reinvest in the development of services designed to enhance the value or convenience of the Fidelity funds as investment vehicles. These services include 24-hour access to account information and market information through phone representatives and over the Internet, and investor education materials and asset allocation tools.
Annual Report
Board Approval of Investment Advisory Contracts and
Management Fees - continued
Investment in a Large Fund Family. The Board considered the benefits to shareholders of investing in a Fidelity fund, including the benefits of investing in a fund that is part of a large family of funds offering a variety of investment disciplines and providing for a large variety of mutual fund investor services. For example, fund shareholders are offered the privilege of exchanging shares of the fund for shares of other Fidelity funds, as set forth in the fund's prospectus, without paying a sales charge. The Board noted that, since the last Advisory Contract renewals in July 2004, Fidelity has taken a number of actions that benefited particular funds, including (i) voluntarily deciding in 2004 to stop using "soft" commission dollars to pay for market data and, instead, to pay for that data out of its own resources, (ii) contractually agreeing to impose management fee reductions and expense limitations on its five Spartan stock index funds and its stock index fund available through variable insurance products, (iii) contractually agreeing to eliminate the management fees on the Fidelity Freedom Funds and the Fidelity Advisor Freedom Funds, (iv) contractually agreeing to reduce the management fees on most of its investment-grade taxable bond funds, and (v) contractually agreeing to impose expense limitations on its retail and Spartan investment-grade taxable bond funds.
Investment Performance and Compliance. The Board considered whether the fund has operated within its investment objective, as well as its record of compliance with its investment restrictions. It also reviewed the fund's absolute investment performance, as well as the fund's relative investment performance measured against (i) a broad-based securities market index, and (ii) a peer group of mutual funds deemed appropriate by the Board over multiple periods. The following charts considered by the Board show, over the one-, three-, and five-year periods ended December 31, 2004, the fund's returns, the returns of a broad-based securities market index ("benchmark"), and a range of returns of a peer group of mutual funds identified by Lipper Inc. as having an investment objective similar to that of the fund. The box within each chart shows the 25th percentile return (bottom of box) and the 75th percentile return (top of box) of the Lipper peer group. Returns shown above the box are in the first quartile and returns shown below the box are in the fourth quartile. The percentage beaten number noted below each chart corresponds to the percentile box and represents the percentage of funds in the Lipper peer group whose performance was equal to or lower than that of the fund.
Annual Report
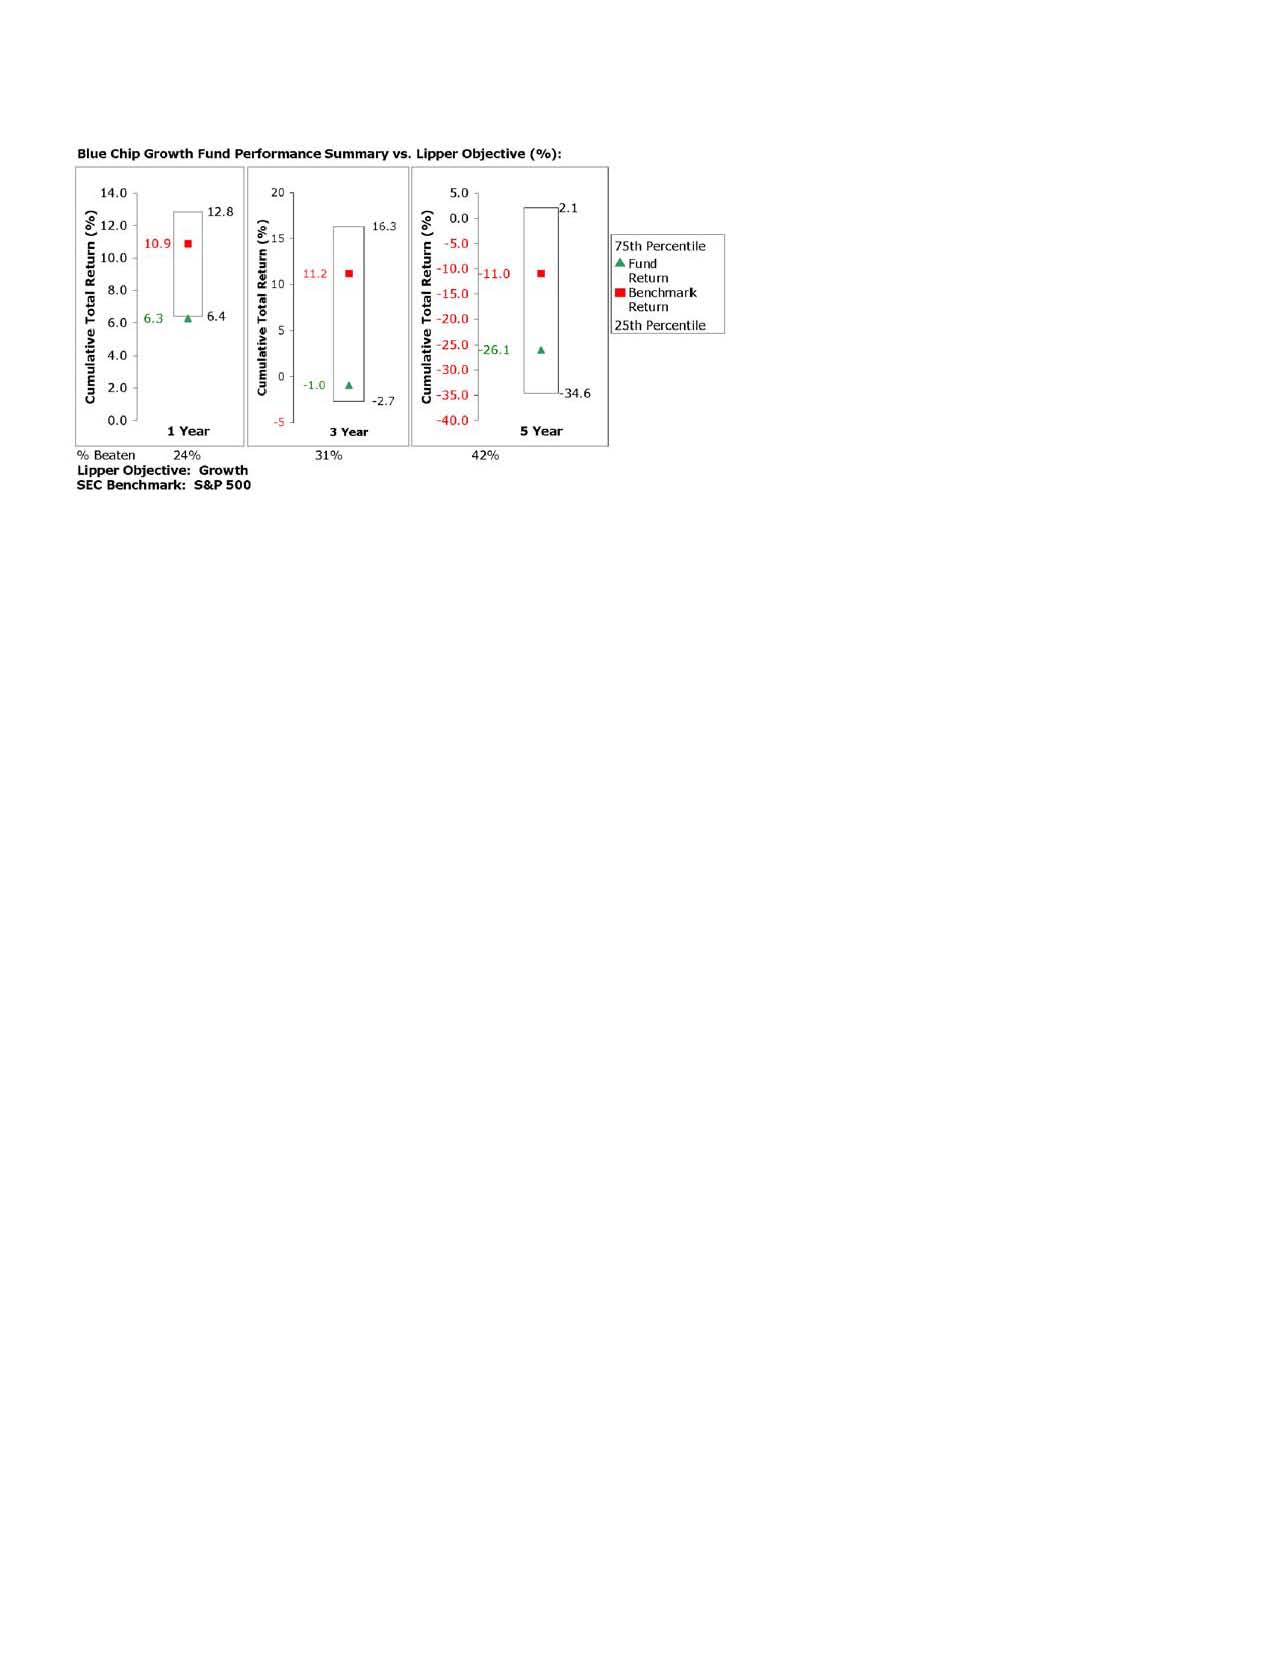
The Board reviewed the fund's relative investment performance against its Lipper peer group and stated that the performance of the fund was in the fourth quartile for the one-year period and the third quartile for the three- and five-year periods. The Board also stated that the relative investment performance of the fund was lower than its benchmark over time. The Board discussed with FMR actions to be taken by FMR to improve the fund's disappointing performance.
The Board also considered that the fund's management fee is subject to upward or downward adjustment depending upon whether, and to what extent, the fund's investment performance for the performance period exceeds, or is exceeded by, the record (over the same period) of a Board-approved performance adjustment index. The Board realizes that the performance adjustment provides FMR with a strong economic incentive to seek to achieve superior performance for the fund's shareholders and helps to more closely align the interests of FMR and the fund's shareholders.
The Board has had thorough discussions with FMR throughout the year about the Board's and FMR's concerns about equity research, equity fund performance, and compliance with internal policies governing gifts and entertainment. FMR has taken steps that it believes will refocus and strengthen equity research and equity portfolio management and compliance. The Board noted with favor FMR's recent reorganization of its senior management team and FMR's plans to dedicate additional resources to investment research, and participated in the process that led to those changes.
Based on its review, and giving particular weight to the nature and quality of the resources dedicated by the Investment Advisers to maintain and improve relative performance, the Board concluded that the nature, extent, and quality of the services provided by Fidelity will benefit the fund's shareholders, particularly in light of the Board's view that the fund's shareholders benefit from investing in a fund that is part of a large family of funds offering a variety of investment disciplines and services.
Annual Report
Board Approval of Investment Advisory Contracts and
Management Fees - continued
Competitiveness of Management Fee and Total Fund Expenses. The Board considered the fund's management fee and total expenses compared to "mapped groups" of competitive funds and classes. Fidelity creates "mapped groups" by combining similar Lipper investment objective categories that have comparable management fee characteristics. Combining Lipper investment objective categories aids the Board's management fee and total expense comparisons by broadening the competitive group used for comparison and by reducing the number of universes to which various Fidelity funds are compared.
The Board considered two proprietary management fee comparisons for the 12-month periods shown in the chart below. The group of Lipper funds used by the Board for management fee comparisons is referred to below as the "Total Mapped Group" and, for the reasons explained above, is broader than the Lipper peer group used by the Board for performance comparisons. The Total Mapped Group comparison focuses on a fund's standing relative to the total universe of comparable funds available to investors, in terms of gross management fees before expense reimbursements or caps. "TMG %" represents the percentage of funds in the Total Mapped Group that had management fees that were lower than the fund's. For example, a TMG % of 17% means that 83% of the funds in the Total Mapped Group had higher management fees than the fund. The "Asset-Size Peer Group" (ASPG) comparison focuses on a fund's standing relative to non-Fidelity funds similar in size to the fund within the Total Mapped Group. The ASPG represents at least 15% of the funds in the Total Mapped Group with comparable asset size and management fee characteristics, subject to a minimum of 50 funds (or all funds in the Total Mapped Group if fewer than 50). Additional information, such as the ASPG quartile ("quadrant") in which the fund's management fee ranked and the impact of the fund's performance adjustment, is also included in the chart and considered by the Board.
Annual Report
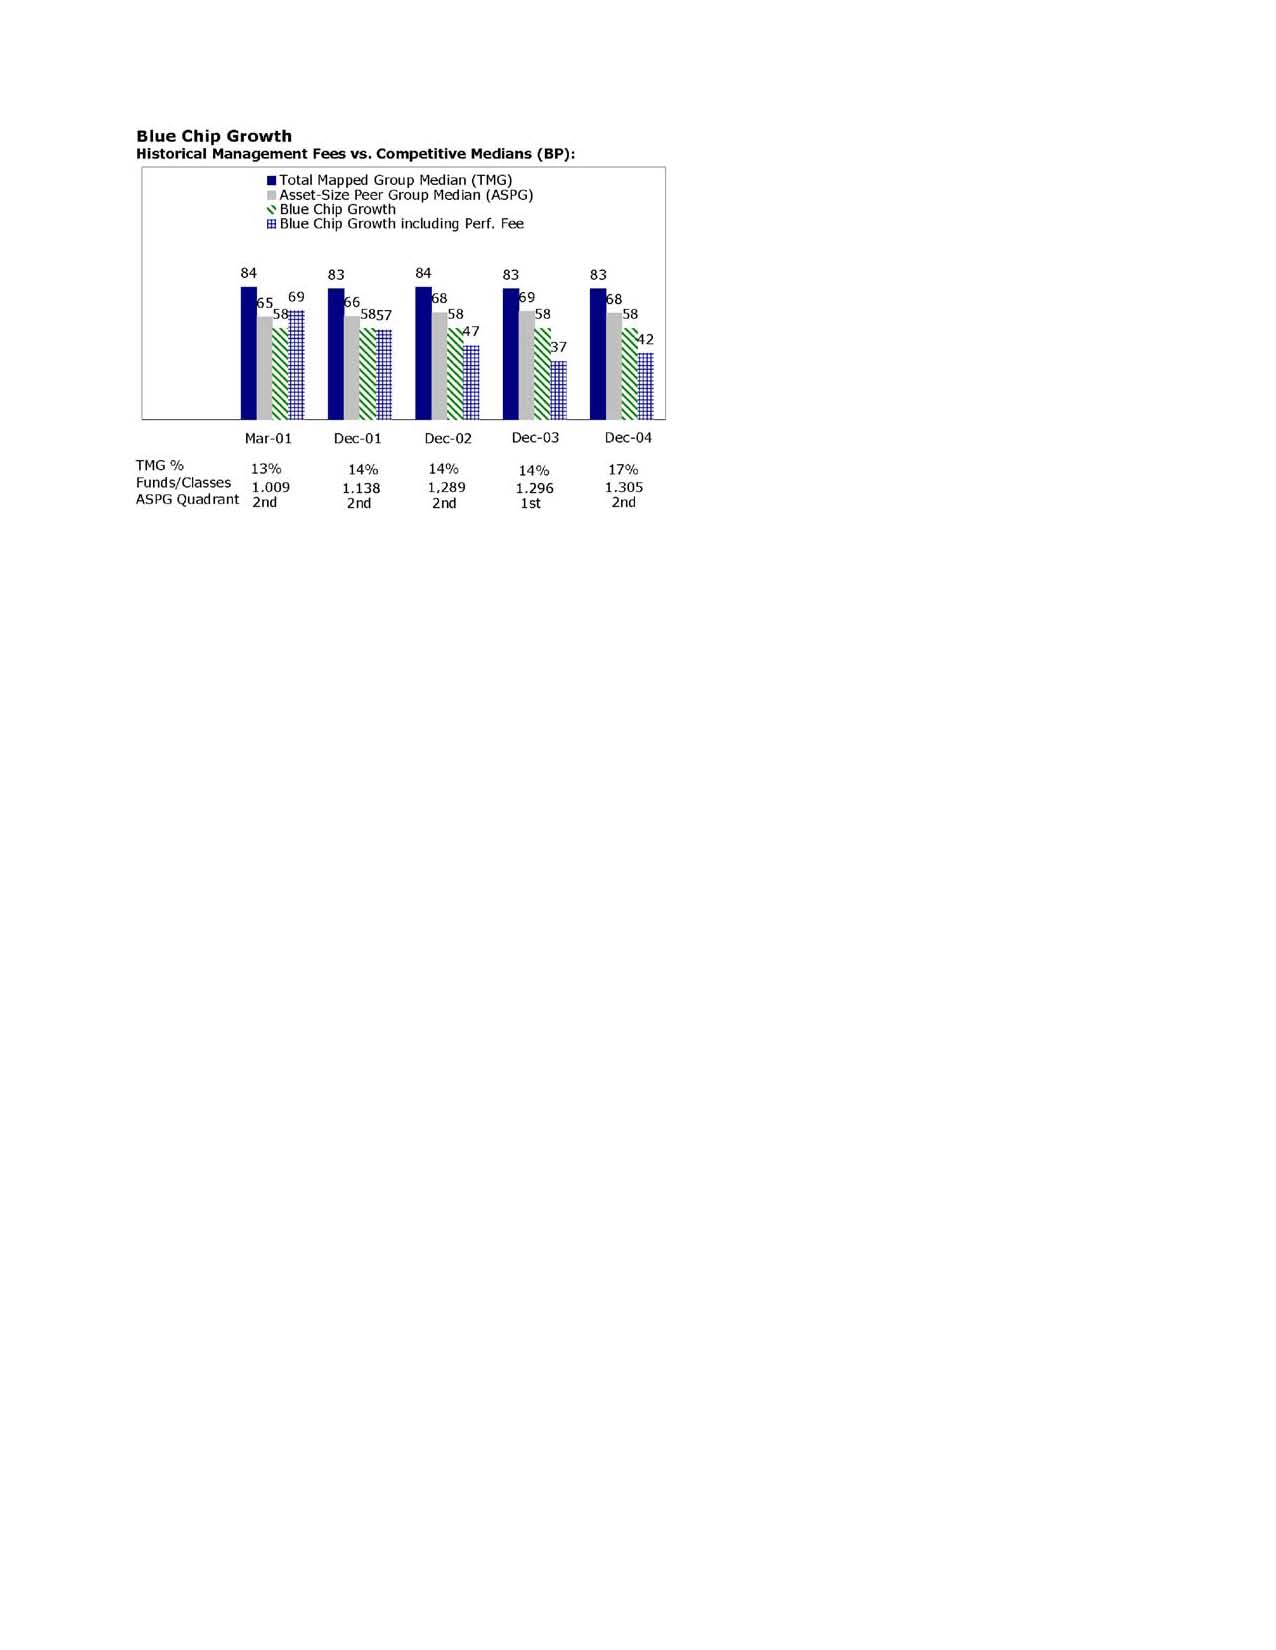
The Board noted that the fund's management fee ranked below the median of its Total Mapped Group and below the median of its ASPG for 2004. The Board also noted the effect of the fund's negative performance adjustment on the fund's management fee ranking.
Based on its review, the Board concluded that the fund's management fee was fair and reasonable in light of the services that the fund receives and the other factors considered.
In its review of the fund's total expenses, the Board considered the fund's management fee as well as other fund expenses, such as transfer agent fees, pricing and bookkeeping fees, and custodial, legal, and audit fees. The Board also noted the effects of any waivers and reimbursements on fees and expenses, as well as the fund's negative performance adjustment. As part of its review, the Board also considered current and historical total expenses of the fund compared to competitive fund median expenses. The fund is compared to those funds and classes in the Total Mapped Group (used by the Board for management fee comparisons) that have a similar sales load structure.
The Board noted that the fund's total expenses ranked below its competitive median for 2004.
In its review of total expenses, the Board also considered Fidelity fee structures and other information on clients that FMR and its affiliates service in other competitive markets, such as other mutual funds advised or subadvised by FMR or its affiliates, pension plan clients, and other institutional clients.
Annual Report
Board Approval of Investment Advisory Contracts and
Management Fees - continued
Based on its review, the Board concluded that the fund's total expenses were reasonable in light of the services that the fund and its shareholders receive and the other factors considered.
Costs of the Services and Profitability. The Board considered the revenues earned and the expenses incurred by Fidelity in conducting the business of developing, marketing, distributing, managing, administering and servicing the fund and its shareholders. The Board also considered the level of Fidelity's profits in respect of all the Fidelity funds.
On an annual basis, FMR presents to the Board Fidelity's profitability for the fund. Fidelity calculates the profitability for each fund, as well as aggregate profitability for groups of Fidelity funds and all Fidelity funds, using a series of detailed revenue and cost allocation methodologies which originate with the audited books and records of Fidelity. The Audit Committee of the Board reviews any significant changes from the prior year's methodologies.
PricewaterhouseCoopers LLP (PwC), independent registered accounting firm and auditor to Fidelity and certain Fidelity funds, has been engaged annually by the Board as part of the Board's assessment of the results of Fidelity's profitability analysis. PwC's engagement includes the review and assessment of Fidelity's methodologies used in determining the revenues and expenses attributable to Fidelity's mutual fund business, and completion of agreed-upon procedures surrounding the mathematical accuracy of fund profitability and its conformity to allocation methodologies. After considering PwC's reports issued under the engagement and information provided by Fidelity, the Board believes that while other allocation methods may also be reasonable, Fidelity's profitability methodologies are reasonable in all material respects.
The Board has also reviewed Fidelity's non-fund businesses and any fall-out benefits related to the mutual fund business as well as cases where Fidelity's affiliates may benefit from or be related to the fund's business. In addition, a special committee of the Board reviewed services provided to Fidelity by its affiliates and determined that the fees that Fidelity paid for such services were reasonable.
The Board considered the costs of the services provided by and the profits realized by Fidelity in connection with the operation of the fund and determined that the amount of profit is a fair entrepreneurial profit for the management of the fund.
Economies of Scale. The Board considered whether there have been economies of scale in respect of the management of the Fidelity funds, whether the Fidelity funds (including the fund) have appropriately benefited from any such economies of scale, and whether there is potential for realization of any further economies of scale. The Board considered the extent to which the fund will benefit from economies of scale through increased services to the fund, through waivers or reimbursements, or through fee or expense reductions, including reductions that occur through operation of the transfer agent agreement. The transfer agent fee varies in part based on the number of accounts in the fund. If the number of accounts decreases or the average account size increases, the overall transfer agent fee rate decreases.
Annual Report
The Board recognized that the fund's management contract incorporates a "group fee" structure, which provides for lower fee rates as total fund assets under FMR's management increase, and for higher fee rates as total fund assets under FMR's management decrease. The Board considered that the group fee is designed to deliver the benefits of economies of scale to fund shareholders when total fund assets increase, even if assets of any particular fund are unchanged or have declined, because some portion of Fidelity's costs are attributable to services provided to all Fidelity funds, and all funds benefit if those costs can be allocated among more assets. The Board concluded that, given the group fee structure, fund shareholders will achieve a certain level of economies of scale as assets under FMR's management increase at the fund complex level, regardless of whether Fidelity achieves any such economies of scale.
The Board further concluded that any potential economies of scale are being shared between fund shareholders and Fidelity in an appropriate manner.
Additional Information Requested by the Board. In order to develop fully the factual basis for consideration of the Advisory Contracts, the Board requested additional information regarding (i) equity fund transfer agency fees; (ii) Fidelity's fund profitability methodology and the impact of various changes in the methodology over time; (iii) benefits to shareholders from economies of scale; (iv) composition and characteristics of various fund and industry data used in comparisons; and (v) compensation of portfolio managers and research analysts.
Based on its evaluation of all of the conclusions noted above, and after considering all material factors, the Board ultimately concluded that the existing advisory fee structures are fair and reasonable, and that the fund's existing Advisory Contracts should be renewed.
Annual Report
Investment Adviser
Fidelity Management & Research Company
Boston, MA
Investment Sub-Advisers
FMR Co., Inc.
Fidelity Management & Research
(Far East) Inc.
Fidelity Management & Research
(U.K.) Inc.
Fidelity Investments Japan Limited
Fidelity International Investment
Advisors
Fidelity International Investment
Advisors (U.K.) Limited
General Distributor
Fidelity Distributors Corporation
Boston, MA
Transfer and Service Agent
Fidelity Service Company, Inc.
Boston, MA
Custodian
Citibank, N.A.
New York, NY
The Fidelity Telephone Connection
Mutual Fund 24-Hour Service
Exchanges/Redemptions
and Account Assistance 1-800-544-6666
Product Information 1-800-544-6666
Retirement Accounts 1-800-544-4774
(8 a.m. - 9 p.m.)
TDD Service 1-800-544-0118
for the deaf and hearing impaired
(9 a.m. - 9 p.m. Eastern time)
Fidelity Automated Service
Telephone (FAST®) (automated graphic) 1-800-544-5555
(automated graphic) Automated line for quickest service
BCF-UANN-0905
1.789244.102
(Fidelity Investment logo)(registered trademark)
Corporate Headquarters
82 Devonshire St., Boston, MA 02109
www.fidelity.com
Fidelity®
Blue Chip Value
Fund
Annual Report
July 31, 2005
(2_fidelity_logos) (Registered_Trademark)
Contents
Chairman's Message | <Click Here> | Ned Johnson's message to shareholders. |
Performance | <Click Here> | How the fund has done over time. |
Management's Discussion | <Click Here> | The manager's review of fund performance, strategy and outlook |
Shareholder Expense Example | <Click Here> | An example of shareholder expenses. |
Investment Changes | <Click Here> | A summary of major shifts in the fund's investments over the past six months. |
Investments | <Click Here> | A complete list of the fund's investments with their market values. |
Financial Statements | <Click Here> | Statements of assets and liabilities, operations, and changes in net assets,
as well as financial highlights. |
Notes | <Click Here> | Notes to the financial statements. |
Report of Independent Registered Public Accounting Firm | <Click Here> | |
Trustees and Officers | <Click Here> | |
Distributions | <Click Here> | |
Board Approval of Investment Advisory Contracts and Management Fees | <Click Here> | |
To view a fund's proxy voting guidelines and proxy voting record for the 12-month period ended June 30, visit www.fidelity.com/proxyvotingresults or visit the Securities and Exchange Commission's (SEC) web site at www.sec.gov. You may also call 1-800-544-8544 to request a free copy of the proxy voting guidelines.
Standard & Poor's, S&P and S&P 500 are registered service marks of The McGraw-Hill Companies, Inc. and have been licensed for use by Fidelity Distributors Corporation.
Other third party marks appearing herein are the property of their respective owners.
All other marks appearing herein are registered or unregistered trademarks or service marks of FMR Corp. or an affiliated company.
Annual Report
This report and the financial statements contained herein are submitted for the general information of the shareholders of the fund. This report is not authorized for distribution to prospective investors in the fund unless preceded or accompanied by an effective prospectus.
A fund files its complete schedule of portfolio holdings with the SEC for the first and third quarters of each fiscal year on Form N-Q. Forms N-Q are available on the SEC's web site at http://www.sec.gov. A fund's Forms N-Q may be reviewed and copied at the SEC's Public Reference Room in Washington, DC. Information regarding the operation of the SEC's Public Reference Room may be obtained by calling 1-800-SEC-0330. For a complete list of a fund's portfolio holdings, view the most recent quarterly holdings report, semiannual report, or annual report on Fidelity's web site at http://www.fidelity.com/holdings.
NOT FDIC INSURED · MAY LOSE VALUE · NO BANK GUARANTEE
Neither the fund nor Fidelity Distributors Corporation is a bank.
Annual Report
Chairman's Message
(photo_of_Edward_C_Johnson_3d)
Dear Shareholder:
During the past year or so, much has been reported about the mutual fund industry, and much of it has been more critical than I believe is warranted. Allegations that some companies have been less than forthright with their shareholders have cast a shadow on the entire industry. I continue to find these reports disturbing, and assert that they do not create an accurate picture of the industry overall. Therefore, I would like to remind everyone where Fidelity stands on these issues. I will say two things specifically regarding allegations that some mutual fund companies were in violation of the Securities and Exchange Commission's forward pricing rules or were involved in so-called "market timing" activities.
First, Fidelity has no agreements that permit customers who buy fund shares after 4 p.m. to obtain the 4 p.m. price. This is not a new policy. This is not to say that someone could not deceive the company through fraudulent acts. However, we are extremely diligent in preventing fraud from occurring in this manner - and in every other. But I underscore again that Fidelity has no so-called "agreements" that sanction illegal practices.
Second, Fidelity continues to stand on record, as we have for years, in opposition to predatory short-term trading that adversely affects shareholders in a mutual fund. Back in the 1980s, we initiated a fee - which is returned to the fund and, therefore, to investors - to discourage this activity. Further, we took the lead several years ago in developing a Fair Value Pricing Policy to prevent market timing on foreign securities in our funds. I am confident we will find other ways to make it more difficult for predatory traders to operate. However, this will only be achieved through close cooperation among regulators, legislators and the industry.
Yes, there have been unfortunate instances of unethical and illegal activity within the mutual fund industry from time to time. That is true of any industry. When this occurs, confessed or convicted offenders should be dealt with appropriately. But we are still concerned about the risk of over-regulation and the quick application of simplistic solutions to intricate problems. Every system can be improved, and we support and applaud well thought out improvements by regulators, legislators and industry representatives that achieve the common goal of building and protecting the value of investors' holdings.
For nearly 60 years, Fidelity has worked very hard to improve its products and service to justify your trust. When our family founded this company in 1946, we had only a few hundred customers. Today, we serve more than 18 million customers including individual investors and participants in retirement plans across America.
Let me close by saying that we do not take your trust in us for granted, and we realize that we must always work to improve all aspects of our service to you. In turn, we urge you to continue your active participation with your financial matters, so that your interests can be well served.
Best regards,
/s/Edward C. Johnson 3d
Edward C. Johnson 3d
Annual Report
Performance: The Bottom Line
Average annual total return reflects the change in the value of an investment, assuming reinvestment of the fund's dividend income and capital gains (the profits earned upon the sale of securities that have grown in value) and assuming a constant rate of performance each year. The $10,000 table and the fund's returns do not reflect the deduction of taxes that a shareholder would pay on fund distributions or the redemption of fund shares. During periods of reimbursement by Fidelity, a fund's total return will be greater than it would be had the reimbursement not occurred. How a fund did yesterday is no guarantee of how it will do tomorrow.
Average Annual Total Returns
Periods ended July 31, 2005 | Past 1
year | Life of
FundA |
Fidelity® Blue Chip Value Fund | 19.20% | 15.07% |
A From June 17, 2003.
$10,000 Over Life of Fund
Let's say hypothetically that $10,000 was invested in Fidelity® Blue Chip Value on June 17, 2003, when the fund started. The chart shows how the value of your investment would have changed, and also shows how the Russell 1000® Value Index performed over the same period.
Annual Report
Management's Discussion of Fund Performance
Comments from Brian Hogan, Portfolio Manager of Fidelity® Blue Chip Value Fund
A late-inning rally on Wall Street helped push some key U.S. equity indexes to four-year highs by the conclusion of the 12-month period ending July 31, 2005. Spurred on by bullish economic data and strong corporate earnings, investors enjoyed a stellar month of July, capping off a turbulent 12-month period for U.S. equity markets. Stock prices bounced up and down during most of the year, moving in cadence with gyrations in the price of crude oil and investors' gathering and ebbing concerns about inflation. The Federal Reserve Board raised short-term interest rates eight times during the period, also affecting overall market sentiment. Despite their fluctuations, the major equity indexes finished on a high note, with the Standard & Poor's 500SM Index and the NASDAQ Composite® Index posting gains of 14.05% and 16.51%, respectively, for the period. The small-cap Russell 2000® Index rose 24.78% and the Russell Midcap® Index jumped 28.93%, while the blue-chips' Dow Jones Industrial AverageSM advanced only 7.29%.
For the 12-month period ending July 31, 2005, the fund gained 19.20%, topping the Russell 1000® Value Index, which returned 19.04%, and the LipperSM Growth Funds Average, which returned 15.92%. The fund's outperformance versus its index was driven primarily by companies that benefited from record-high oil and natural gas prices. This group included energy equipment and services firms such as Halliburton and Transocean. Natural gas and oil exploration and production company Quicksilver Resources was another key contributor. The company, which focuses on unconventional gas reserves, benefited from the strong price environment as well as better-than-expected results from its wells in the Barnett Shale production area in North Texas. On the negative side, performance was dampened somewhat by an investment in American International Group (AIG), a global property, casualty and life insurance company, which did not play out as expected and was the largest detractor versus the index during the period. Tyco International also was a disappointment. After having been rewarded for its remarkable turnaround, the company ran into some obstacles during the second half of the period and its stock price suffered.
The views expressed in this statement reflect those of the portfolio manager only through the end of the period of the report as stated on the cover and do not necessarily represent the views of Fidelity or any other person in the Fidelity organization. Any such views are subject to change at any time based upon market or other conditions and Fidelity disclaims any responsibility to update such views. These views may not be relied on as investment advice and, because investment decisions for a Fidelity fund are based on numerous factors, may not be relied on as an indication of trading intent on behalf of any Fidelity fund.
Annual Report
Shareholder Expense Example
As a shareholder of the Fund, you incur two types of costs: (1) transaction costs, and (2) ongoing costs, including management fees and other Fund expenses. This Example is intended to help you understand your ongoing costs (in dollars) of investing in the Fund and to compare these costs with the ongoing costs of investing in other mutual funds.
The Example is based on an investment of $1,000 invested at the beginning of the period and held for the entire period (February 1, 2005 to July 31, 2005).
Actual Expenses
The first line of the table below provides information about actual account values and actual expenses. You may use the information in this line, together with the amount you invested, to estimate the expenses that you paid over the period. Simply divide your account value by $1,000.00 (for example, an $8,600 account value divided by $1,000.00 = 8.6), then multiply the result by the number in the first line under the heading entitled "Expenses Paid During Period" to estimate the expenses you paid on your account during this period. A small balance maintenance fee of $12.00 that is charged once a year may apply for certain accounts with a value of less than $2,000. This fee is not included in the table below. If it was, the estimate of expenses you paid during the period would be higher, and your ending account value lower, by this amount.
Hypothetical Example for Comparison Purposes
The second line of the table below provides information about hypothetical account values and hypothetical expenses based on the Fund's actual expense ratio and an assumed rate of return of 5% per year before expenses, which is not the Fund's actual return. The hypothetical account values and expenses may not be used to estimate the actual ending account balance or expenses you paid for the period. You may use this information to compare the ongoing costs of investing in the Fund and other funds. To do so, compare this 5% hypothetical example with the 5% hypothetical examples that appear in the share-holder reports of the other funds. A small balance maintenance fee of $12.00 that is charged once a year may apply for certain accounts with a value of less than $2,000. This fee is not included in the table below. If it was, the estimate of expenses you paid during the period would be higher, and your ending account value lower, by this amount.
Please note that the expenses shown in the table are meant to highlight your ongoing costs only and do not reflect any transaction costs. Therefore, the second line of the table is useful in comparing ongoing costs only, and will not help you determine the relative total costs of owning different funds.
| Beginning
Account Value
February 1, 2005 | Ending
Account Value
July 31, 2005 | Expenses Paid
During Period*
February 1, 2005
to July 31, 2005 |
Actual | $ 1,000.00 | $ 1,063.60 | $ 4.86 |
Hypothetical (5% return per year before expenses) | $ 1,000.00 | $ 1,020.08 | $ 4.76 |
* Expenses are equal to the Fund's annualized expense ratio of .95%; multiplied by the average account value over the period, multiplied by 181/365 (to reflect the one-half year period).
Annual Report
Investment Changes
Top Ten Stocks as of July 31, 2005 |
| % of fund's
net assets | % of fund's net assets
6 months ago |
General Electric Co. | 4.2 | 6.0 |
American International Group, Inc. | 3.9 | 2.5 |
Honeywell International, Inc. | 3.8 | 2.7 |
Exxon Mobil Corp. | 3.5 | 3.6 |
Bank of America Corp. | 2.2 | 3.2 |
Baxter International, Inc. | 1.8 | 1.5 |
Tyco International Ltd. | 1.7 | 1.8 |
SBC Communications, Inc. | 1.7 | 1.3 |
JPMorgan Chase & Co. | 1.6 | 0.5 |
E.I. du Pont de Nemours & Co. | 1.5 | 1.6 |
| 25.9 | |
Top Five Market Sectors as of July 31, 2005 |
| % of fund's
net assets | % of fund's net assets
6 months ago |
Financials | 20.7 | 18.6 |
Industrials | 16.1 | 19.3 |
Energy | 15.0 | 12.5 |
Information Technology | 10.5 | 7.8 |
Consumer Discretionary | 9.7 | 9.3 |
Asset Allocation (% of fund's net assets) |
As of July 31, 2005 * | As of January 31, 2005 ** |
| Stocks 100.1% | | | Stocks 95.9% | |
 | Short-Term
Investments and
Net Other
Assets (0.1)%*** | | | Short-Term
Investments and
Net Other Assets 4.1% | |
* Foreign
investments | 6.1% | | ** Foreign
investments | 4.0% | |
*** Short-term Investments and Net Other Assets are not included in the pie chart. |

Annual Report
Investments July 31, 2005
Showing Percentage of Net Assets
Common Stocks - 100.1% |
| Shares | | Value (Note 1) |
CONSUMER DISCRETIONARY - 9.7% |
Auto Components - 0.6% |
Delphi Corp. | 37,200 | | $ 197,160 |
Lear Corp. | 20,900 | | 893,893 |
| | 1,091,053 |
Diversified Consumer Services - 0.3% |
Apollo Group, Inc. Class A (a) | 2,200 | | 165,330 |
Service Corp. International (SCI) | 46,200 | | 400,554 |
| | 565,884 |
Hotels, Restaurants & Leisure - 0.3% |
Domino's Pizza, Inc. | 10,000 | | 250,200 |
McDonald's Corp. | 11,300 | | 352,221 |
| | 602,421 |
Household Durables - 1.2% |
Centex Corp. | 5,400 | | 399,492 |
KB Home | 6,600 | | 540,606 |
LG Electronics, Inc. | 1,510 | | 98,276 |
Sony Corp. sponsored ADR | 13,700 | | 445,387 |
Techtronic Industries Co. Ltd. | 72,000 | | 178,759 |
Toll Brothers, Inc. (a) | 9,100 | | 504,322 |
| | 2,166,842 |
Internet & Catalog Retail - 0.9% |
eBay, Inc. (a) | 30,100 | | 1,257,578 |
IAC/InterActiveCorp (a) | 13,100 | | 349,770 |
| | 1,607,348 |
Leisure Equipment & Products - 1.0% |
Eastman Kodak Co. | 67,400 | | 1,802,276 |
Media - 3.9% |
Clear Channel Communications, Inc. | 15,900 | | 518,976 |
EchoStar Communications Corp. Class A | 7,400 | | 212,528 |
Grupo Televisa SA de CV sponsored ADR | 4,900 | | 323,253 |
Lamar Advertising Co. Class A (a) | 26,096 | | 1,148,485 |
News Corp. Class A | 5,232 | | 85,700 |
NTL, Inc. (a) | 4,953 | | 330,018 |
Omnicom Group, Inc. | 3,300 | | 280,071 |
The Reader's Digest Association, Inc. (non-vtg.) | 7,900 | | 128,296 |
Time Warner, Inc. (a) | 48,800 | | 830,576 |
Univision Communications, Inc. Class A (a) | 54,400 | | 1,538,432 |
Valassis Communications, Inc. (a) | 2,400 | | 94,920 |
Viacom, Inc. Class B (non-vtg.) | 12,041 | | 403,253 |
Common Stocks - continued |
| Shares | | Value (Note 1) |
CONSUMER DISCRETIONARY - continued |
Media - continued |
Walt Disney Co. | 42,200 | | $ 1,082,008 |
XM Satellite Radio Holdings, Inc. Class A (a) | 2,500 | | 89,075 |
| | 7,065,591 |
Multiline Retail - 0.9% |
99 Cents Only Stores (a) | 19,400 | | 238,038 |
Federated Department Stores, Inc. | 4,700 | | 356,589 |
JCPenney Co., Inc. | 6,200 | | 348,068 |
Kohl's Corp. (a) | 8,100 | | 456,435 |
Nordstrom, Inc. | 7,600 | | 281,276 |
| | 1,680,406 |
Specialty Retail - 0.6% |
bebe Stores, Inc. | 12,000 | | 341,520 |
Home Depot, Inc. | 17,500 | | 761,425 |
Maidenform Brands, Inc. | 600 | | 10,950 |
| | 1,113,895 |
TOTAL CONSUMER DISCRETIONARY | | 17,695,716 |
CONSUMER STAPLES - 5.2% |
Beverages - 1.0% |
Coca-Cola Enterprises, Inc. | 34,300 | | 806,050 |
PepsiCo, Inc. | 5,100 | | 278,103 |
The Coca-Cola Co. | 17,300 | | 757,048 |
| | 1,841,201 |
Food & Staples Retailing - 1.0% |
Kroger Co. (a) | 14,900 | | 295,765 |
Rite Aid Corp. (a) | 17,700 | | 79,473 |
Safeway, Inc. | 26,800 | | 651,240 |
Wal-Mart Stores, Inc. | 9,000 | | 444,150 |
Walgreen Co. | 7,100 | | 339,806 |
| | 1,810,434 |
Food Products - 0.7% |
Corn Products International, Inc. | 14,900 | | 358,643 |
Nestle SA (Reg.) | 1,505 | | 412,913 |
Tyson Foods, Inc. Class A | 23,800 | | 443,632 |
| | 1,215,188 |
Household Products - 0.9% |
Colgate-Palmolive Co. | 29,600 | | 1,567,024 |
Common Stocks - continued |
| Shares | | Value (Note 1) |
CONSUMER STAPLES - continued |
Personal Products - 0.2% |
Gillette Co. | 7,620 | | $ 408,965 |
Tobacco - 1.4% |
Altria Group, Inc. | 38,300 | | 2,564,568 |
TOTAL CONSUMER STAPLES | | 9,407,380 |
ENERGY - 15.0% |
Energy Equipment & Services - 6.5% |
Baker Hughes, Inc. | 4,200 | | 237,468 |
BJ Services Co. | 15,200 | | 927,048 |
ENSCO International, Inc. | 7,900 | | 319,002 |
FMC Technologies, Inc. (a) | 18,300 | | 663,375 |
GlobalSantaFe Corp. | 18,000 | | 809,820 |
Halliburton Co. | 44,800 | | 2,511,040 |
Hornbeck Offshore Services, Inc. (a) | 12,400 | | 370,760 |
National Oilwell Varco, Inc. (a) | 31,657 | | 1,657,244 |
Pride International, Inc. (a) | 29,200 | | 759,784 |
Schlumberger Ltd. (NY Shares) | 15,900 | | 1,331,466 |
Smith International, Inc. | 9,900 | | 672,606 |
Transocean, Inc. (a) | 9,500 | | 536,085 |
Weatherford International Ltd. (a) | 15,650 | | 990,332 |
| | 11,786,030 |
Oil, Gas & Consumable Fuels - 8.5% |
Amerada Hess Corp. | 3,800 | | 447,868 |
Apache Corp. | 5,520 | | 377,568 |
Burlington Resources, Inc. | 14,200 | | 910,362 |
Chevron Corp. | 36,100 | | 2,094,161 |
ConocoPhillips | 11,000 | | 688,490 |
El Paso Corp. | 29,900 | | 358,800 |
Encore Acquisition Co. (a) | 11,100 | | 350,094 |
Exxon Mobil Corp. | 109,000 | | 6,403,750 |
Marathon Oil Corp. | 614 | | 35,833 |
Occidental Petroleum Corp. | 10,100 | | 831,028 |
OMI Corp. | 11,800 | | 212,754 |
Quicksilver Resources, Inc. (a) | 31,050 | | 1,315,278 |
Royal Dutch Shell PLC ADR Class B (a) | 2,585 | | 164,587 |
Valero Energy Corp. | 16,700 | | 1,382,426 |
| | 15,572,999 |
TOTAL ENERGY | | 27,359,029 |
Common Stocks - continued |
| Shares | | Value (Note 1) |
FINANCIALS - 20.7% |
Capital Markets - 3.0% |
Bear Stearns Companies, Inc. | 3,400 | | $ 347,174 |
Investors Financial Services Corp. | 6,300 | | 216,846 |
KKR Financial Corp. | 600 | | 14,688 |
Lehman Brothers Holdings, Inc. | 5,300 | | 557,189 |
Merrill Lynch & Co., Inc. | 23,300 | | 1,369,574 |
Morgan Stanley | 32,400 | | 1,718,820 |
Nuveen Investments, Inc. Class A | 7,200 | | 273,600 |
State Street Corp. | 4,600 | | 228,804 |
TradeStation Group, Inc. (a) | 23,600 | | 226,324 |
UBS AG (NY Shares) | 5,500 | | 450,780 |
| | 5,403,799 |
Commercial Banks - 4.5% |
Banco Bradesco SA (PN) sponsored ADR (non-vtg.) | 18,400 | | 640,688 |
Bank of America Corp. | 91,016 | | 3,968,298 |
Korea Exchange Bank (a) | 48,790 | | 476,791 |
UCBH Holdings, Inc. | 25,200 | | 460,404 |
Wachovia Corp. | 37,956 | | 1,912,223 |
Wells Fargo & Co. | 12,200 | | 748,348 |
| | 8,206,752 |
Consumer Finance - 0.3% |
Capital One Financial Corp. | 6,100 | | 503,250 |
Diversified Financial Services - 2.8% |
Citigroup, Inc. | 48,900 | | 2,127,150 |
JPMorgan Chase & Co. | 85,752 | | 3,013,325 |
| | 5,140,475 |
Insurance - 7.0% |
ACE Ltd. | 21,980 | | 1,015,696 |
AMBAC Financial Group, Inc. | 2,500 | | 179,600 |
American International Group, Inc. | 117,700 | | 7,085,540 |
Hartford Financial Services Group, Inc. | 14,700 | | 1,184,379 |
Hilb Rogal & Hobbs Co. | 13,000 | | 440,570 |
MetLife, Inc. | 9,800 | | 481,572 |
PartnerRe Ltd. | 16,400 | | 1,063,048 |
Platinum Underwriters Holdings Ltd. | 800 | | 27,736 |
Scottish Re Group Ltd. | 10,700 | | 257,335 |
The Chubb Corp. | 2,200 | | 195,404 |
Unitrin, Inc. | 2,000 | | 106,500 |
W.R. Berkley Corp. | 21,800 | | 815,974 |
| | 12,853,354 |
Common Stocks - continued |
| Shares | | Value (Note 1) |
FINANCIALS - continued |
Real Estate - 0.9% |
Apartment Investment & Management Co. Class A | 13,310 | | $ 585,640 |
Digital Realty Trust, Inc. | 1,600 | | 30,304 |
Equity Lifestyle Properties, Inc. | 1,400 | | 61,698 |
General Growth Properties, Inc. | 13,800 | | 634,524 |
iStar Financial, Inc. | 6,200 | | 265,298 |
Spirit Finance Corp. (e) | 2,000 | | 23,520 |
| | 1,600,984 |
Thrifts & Mortgage Finance - 2.2% |
Doral Financial Corp. | 20,500 | | 316,315 |
Fannie Mae | 28,840 | | 1,611,002 |
Freddie Mac | 11,200 | | 708,736 |
Golden West Financial Corp., Delaware | 4,720 | | 307,366 |
Hudson City Bancorp, Inc. | 16,000 | | 189,280 |
New York Community Bancorp, Inc. | 6,100 | | 111,996 |
Sovereign Bancorp, Inc. | 25,700 | | 616,543 |
W Holding Co., Inc. | 6,732 | | 71,965 |
| | 3,933,203 |
TOTAL FINANCIALS | | 37,641,817 |
HEALTH CARE - 9.5% |
Biotechnology - 1.9% |
Alkermes, Inc. (a) | 5,400 | | 83,700 |
Amgen, Inc. (a) | 6,200 | | 494,450 |
Biogen Idec, Inc. (a) | 6,900 | | 271,101 |
BioMarin Pharmaceutical, Inc. (a) | 40,500 | | 344,250 |
Cephalon, Inc. (a) | 28,700 | | 1,202,530 |
Genentech, Inc. (a) | 3,600 | | 321,588 |
MedImmune, Inc. (a) | 21,600 | | 613,656 |
ONYX Pharmaceuticals, Inc. (a) | 4,600 | | 107,870 |
| | 3,439,145 |
Health Care Equipment & Supplies - 3.9% |
Aspect Medical Systems, Inc. (a) | 4,000 | | 132,000 |
Baxter International, Inc. | 82,840 | | 3,253,127 |
CONMED Corp. (a) | 5,300 | | 159,583 |
Cooper Companies, Inc. | 5,700 | | 391,590 |
Dade Behring Holdings, Inc. | 4,200 | | 318,360 |
Medtronic, Inc. | 11,800 | | 636,492 |
PerkinElmer, Inc. | 14,100 | | 295,818 |
Syneron Medical Ltd. | 3,200 | | 123,360 |
Common Stocks - continued |
| Shares | | Value (Note 1) |
HEALTH CARE - continued |
Health Care Equipment & Supplies - continued |
Thermo Electron Corp. (a) | 9,500 | | $ 283,670 |
Varian, Inc. (a) | 4,400 | | 164,868 |
Waters Corp. (a) | 28,100 | | 1,272,368 |
| | 7,031,236 |
Health Care Providers & Services - 0.6% |
McKesson Corp. | 6,200 | | 279,000 |
Sierra Health Services, Inc. (a) | 3,700 | | 249,528 |
UnitedHealth Group, Inc. | 11,200 | | 585,760 |
| | 1,114,288 |
Pharmaceuticals - 3.1% |
Allergan, Inc. | 5,300 | | 473,661 |
Connetics Corp. (a) | 6,000 | | 112,260 |
Pfizer, Inc. | 66,100 | | 1,751,650 |
Schering-Plough Corp. | 95,410 | | 1,986,436 |
Wyeth | 28,500 | | 1,303,875 |
| | 5,627,882 |
TOTAL HEALTH CARE | | 17,212,551 |
INDUSTRIALS - 16.1% |
Aerospace & Defense - 4.8% |
Hexcel Corp. (a) | 13,100 | | 226,368 |
Honeywell International, Inc. | 177,360 | | 6,966,701 |
Precision Castparts Corp. | 2,700 | | 242,946 |
Raytheon Co. | 17,800 | | 700,074 |
The Boeing Co. | 9,900 | | 653,499 |
| | 8,789,588 |
Air Freight & Logistics - 0.2% |
EGL, Inc. (a) | 14,800 | | 297,924 |
Airlines - 0.7% |
ACE Aviation Holdings, Inc. Class A (a) | 9,200 | | 286,742 |
AirTran Holdings, Inc. (a) | 16,800 | | 192,192 |
JetBlue Airways Corp. (a) | 13,400 | | 281,400 |
Northwest Airlines Corp. (a) | 45,700 | | 212,505 |
Southwest Airlines Co. | 15,100 | | 214,269 |
| | 1,187,108 |
Common Stocks - continued |
| Shares | | Value (Note 1) |
INDUSTRIALS - continued |
Building Products - 0.4% |
Masco Corp. | 13,900 | | $ 471,349 |
York International Corp. | 6,900 | | 294,837 |
| | 766,186 |
Commercial Services & Supplies - 0.5% |
Robert Half International, Inc. | 26,030 | | 882,157 |
Construction & Engineering - 1.7% |
Chicago Bridge & Iron Co. NV (NY Shares) | 23,200 | | 648,440 |
Dycom Industries, Inc. (a) | 9,900 | | 241,560 |
Fluor Corp. | 18,700 | | 1,193,060 |
Foster Wheeler Ltd. (a) | 8,800 | | 203,280 |
Jacobs Engineering Group, Inc. (a) | 9,600 | | 565,248 |
MasTec, Inc. (a) | 27,900 | | 273,420 |
| | 3,125,008 |
Electrical Equipment - 0.2% |
ABB Ltd. sponsored ADR (a) | 33,800 | | 230,178 |
Cooper Industries Ltd. Class A | 2,900 | | 187,282 |
| | 417,460 |
Industrial Conglomerates - 6.1% |
3M Co. | 4,500 | | 337,500 |
General Electric Co. | 220,850 | | 7,619,325 |
Tyco International Ltd. | 102,840 | | 3,133,535 |
| | 11,090,360 |
Machinery - 0.4% |
ITT Industries, Inc. | 7,400 | | 787,360 |
Road & Rail - 0.6% |
Norfolk Southern Corp. | 28,600 | | 1,064,206 |
Trading Companies & Distributors - 0.5% |
Watsco, Inc. | 9,300 | | 440,448 |
WESCO International, Inc. (a) | 15,300 | | 521,118 |
| | 961,566 |
TOTAL INDUSTRIALS | | 29,368,923 |
INFORMATION TECHNOLOGY - 10.5% |
Communications Equipment - 1.2% |
Avaya, Inc. (a) | 22,000 | | 227,260 |
Comverse Technology, Inc. (a) | 16,200 | | 409,698 |
Juniper Networks, Inc. (a) | 20,200 | | 484,598 |
Common Stocks - continued |
| Shares | | Value (Note 1) |
INFORMATION TECHNOLOGY - continued |
Communications Equipment - continued |
Motorola, Inc. | 12,400 | | $ 262,632 |
Nokia Corp. sponsored ADR | 57,600 | | 918,720 |
| | 2,302,908 |
Computers & Peripherals - 1.7% |
Dell, Inc. (a) | 3,700 | | 149,739 |
EMC Corp. (a) | 27,400 | | 375,106 |
Hewlett-Packard Co. | 71,600 | | 1,762,792 |
International Business Machines Corp. | 2,820 | | 235,357 |
Maxtor Corp. (a) | 42,100 | | 248,390 |
Western Digital Corp. (a) | 18,730 | | 280,763 |
| | 3,052,147 |
Electronic Equipment & Instruments - 1.4% |
Agilent Technologies, Inc. (a) | 46,000 | | 1,207,040 |
Amphenol Corp. Class A | 5,600 | | 249,424 |
Symbol Technologies, Inc. | 43,400 | | 505,176 |
Trimble Navigation Ltd. (a) | 3,000 | | 116,880 |
TTM Technologies, Inc. (a) | 20,000 | | 141,800 |
Vishay Intertechnology, Inc. (a) | 25,800 | | 361,716 |
| | 2,582,036 |
Internet Software & Services - 1.0% |
Akamai Technologies, Inc. (a) | 14,300 | | 218,361 |
Google, Inc. Class A (sub. vtg.) | 3,200 | | 920,832 |
Yahoo!, Inc. (a) | 18,700 | | 623,458 |
| | 1,762,651 |
IT Services - 0.7% |
Affiliated Computer Services, Inc. Class A (a) | 10,500 | | 524,685 |
Anteon International Corp. (a) | 10,600 | | 497,670 |
Ceridian Corp. (a) | 14,200 | | 297,206 |
| | 1,319,561 |
Office Electronics - 0.1% |
Xerox Corp. (a) | 12,800 | | 169,088 |
Semiconductors & Semiconductor Equipment - 2.1% |
Analog Devices, Inc. | 8,100 | | 317,520 |
Cabot Microelectronics Corp. (a)(d) | 10,600 | | 318,742 |
Freescale Semiconductor, Inc. Class A | 29,000 | | 740,080 |
Intel Corp. | 44,500 | | 1,207,730 |
Maxim Integrated Products, Inc. | 15,600 | | 653,172 |
Micron Technology, Inc. (a) | 16,100 | | 191,268 |
Common Stocks - continued |
| Shares | | Value (Note 1) |
INFORMATION TECHNOLOGY - continued |
Semiconductors & Semiconductor Equipment - continued |
PMC-Sierra, Inc. (a) | 9,000 | | $ 88,470 |
Samsung Electronics Co. Ltd. | 440 | | 242,940 |
| | 3,759,922 |
Software - 2.3% |
BEA Systems, Inc. (a) | 26,159 | | 237,001 |
Electronic Arts, Inc. (a) | 7,500 | | 432,000 |
Macrovision Corp. (a) | 1,800 | | 39,294 |
Microsoft Corp. | 69,660 | | 1,783,993 |
NAVTEQ Corp. | 8,000 | | 351,760 |
Oracle Corp. (a) | 13,600 | | 184,688 |
Siebel Systems, Inc. | 25,200 | | 211,680 |
Symantec Corp. (a) | 27,700 | | 608,569 |
TIBCO Software, Inc. (a) | 18,700 | | 143,803 |
Ulticom, Inc. (a) | 17,800 | | 218,050 |
| | 4,210,838 |
TOTAL INFORMATION TECHNOLOGY | | 19,159,151 |
MATERIALS - 6.8% |
Chemicals - 4.5% |
Ashland, Inc. | 2,600 | | 159,770 |
Cytec Industries, Inc. | 2,900 | | 131,602 |
Dow Chemical Co. | 10,700 | | 513,065 |
E.I. du Pont de Nemours & Co. | 61,600 | | 2,629,088 |
Ecolab, Inc. | 5,900 | | 198,122 |
Ferro Corp. | 19,100 | | 429,750 |
Georgia Gulf Corp. | 5,700 | | 180,861 |
Lyondell Chemical Co. | 59,918 | | 1,674,109 |
Monsanto Co. | 13,000 | | 875,810 |
Mosaic Co. (a) | 22,000 | | 382,800 |
Praxair, Inc. | 11,200 | | 553,168 |
Rohm & Haas Co. | 8,900 | | 409,934 |
| | 8,138,079 |
Construction Materials - 0.1% |
Martin Marietta Materials, Inc. | 3,000 | | 218,070 |
Containers & Packaging - 1.2% |
Crown Holdings, Inc. (a) | 10,000 | | 157,900 |
Owens-Illinois, Inc. (a) | 30,300 | | 777,195 |
Common Stocks - continued |
| Shares | | Value (Note 1) |
MATERIALS - continued |
Containers & Packaging - continued |
Packaging Corp. of America | 19,400 | | $ 412,250 |
Smurfit-Stone Container Corp. (a) | 70,100 | | 850,313 |
| | 2,197,658 |
Metals & Mining - 1.0% |
Alcoa, Inc. | 24,800 | | 695,640 |
Freeport-McMoRan Copper & Gold, Inc. Class B | 9,100 | | 366,548 |
Industrias Penoles SA de CV | 20,000 | | 93,469 |
Newmont Mining Corp. | 19,500 | | 732,225 |
| | 1,887,882 |
TOTAL MATERIALS | | 12,441,689 |
TELECOMMUNICATION SERVICES - 5.1% |
Diversified Telecommunication Services - 3.1% |
ALLTEL Corp. | 3,900 | | 259,350 |
Covad Communications Group, Inc. (a) | 314,000 | | 423,900 |
NeuStar, Inc. Class A | 1,200 | | 33,600 |
New Skies Satellites Holdings Ltd. | 11,000 | | 227,700 |
SBC Communications, Inc. | 124,800 | | 3,051,360 |
Telewest Global, Inc. (a) | 32,700 | | 730,518 |
Verizon Communications, Inc. | 27,600 | | 944,748 |
| | 5,671,176 |
Wireless Telecommunication Services - 2.0% |
American Tower Corp. Class A (a) | 23,000 | | 528,540 |
Leap Wireless International, Inc. (a) | 6,000 | | 186,300 |
Nextel Communications, Inc. Class A (a) | 55,100 | | 1,917,480 |
Nextel Partners, Inc. Class A (a) | 36,800 | | 916,320 |
| | 3,548,640 |
TOTAL TELECOMMUNICATION SERVICES | | 9,219,816 |
UTILITIES - 1.5% |
Electric Utilities - 0.9% |
Entergy Corp. | 9,200 | | 717,048 |
ITC Holdings Corp. | 300 | | 8,400 |
PG&E Corp. | 14,600 | | 549,398 |
PPL Corp. | 5,700 | | 351,006 |
Southern Co. | 2,660 | | 93,073 |
| | 1,718,925 |
Common Stocks - continued |
| Shares | | Value (Note 1) |
UTILITIES - continued |
Independent Power Producers & Energy Traders - 0.2% |
AES Corp. (a) | 10,700 | | $ 171,735 |
TXU Corp. | 1,400 | | 121,296 |
| | 293,031 |
Multi-Utilities - 0.4% |
CMS Energy Corp. (a) | 33,900 | | 536,976 |
Public Service Enterprise Group, Inc. | 1,500 | | 96,450 |
| | 633,426 |
TOTAL UTILITIES | | 2,645,382 |
TOTAL COMMON STOCKS (Cost $159,843,818) | 182,151,454 |
Money Market Funds - 0.5% |
| | | |
Fidelity Cash Central Fund, 3.31% (b) | 811,718 | | 811,718 |
Fidelity Securities Lending Cash Central Fund, 3.32% (b)(c) | 124,000 | | 124,000 |
TOTAL MONEY MARKET FUNDS (Cost $935,718) | 935,718 |
TOTAL INVESTMENT PORTFOLIO - 100.6% (Cost $160,779,536) | | 183,087,172 |
NET OTHER ASSETS - (0.6)% | | (1,016,563) |
NET ASSETS - 100% | $ 182,070,609 |
Legend |
(a) Non-income producing |
(b) Affiliated fund that is available only to investment companies and other accounts managed by Fidelity Investments. The rate quoted is the annualized seven-day yield of the fund at period end. A complete listing of the fund's holdings as of its most recent quarter end is available upon request. |
(c) Investment made with cash collateral received from securities on loan. |
(d) Security or a portion of the security is on loan at period end. |
(e) Security exempt from registration under Rule 144A of the Securities Act of 1933. These securities may be resold in transactions exempt from registration, normally to qualified institutional buyers. At the period end, the value of these securities amounted to $23,520 or 0.0% of net assets. |
See accompanying notes which are an integral part of the financial statements.
Annual Report
Financial Statements
Statement of Assets and Liabilities
| July 31, 2005 |
| | |
Assets | | |
Investment in securities, at value (including securities loaned of $120,280) (cost $160,779,536) - See accompanying schedule | | $ 183,087,172 |
Receivable for investments sold | | 725,580 |
Receivable for fund shares sold | | 623,999 |
Dividends receivable | | 149,766 |
Interest receivable | | 5,734 |
Prepaid expenses | | 125 |
Other receivables | | 35,204 |
Total assets | | 184,627,580 |
| | |
Liabilities | | |
Payable to custodian bank | $ 825 | |
Payable for investments purchased | 2,113,117 | |
Payable for fund shares redeemed | 158,904 | |
Accrued management fee | 81,302 | |
Other affiliated payables | 50,012 | |
Other payables and accrued expenses | 28,811 | |
Collateral on securities loaned, at value | 124,000 | |
Total liabilities | | 2,556,971 |
| | |
Net Assets | | $ 182,070,609 |
Net Assets consist of: | | |
Paid in capital | | $ 158,987,382 |
Undistributed net investment income | | 540,880 |
Accumulated undistributed net realized gain (loss) on investments and foreign currency transactions | | 234,710 |
Net unrealized appreciation (depreciation) on investments and assets and liabilities in foreign currencies | | 22,307,637 |
Net Assets, for 13,779,253 shares outstanding | | $ 182,070,609 |
Net Asset Value, offering price and redemption price per share ($182,070,609 ÷ 13,779,253 shares) | | $ 13.21 |
See accompanying notes which are an integral part of the financial statements.
Annual Report
Statement of Operations
| Year ended July 31, 2005 |
| | |
Investment Income | | |
Dividends | | $ 2,077,433 |
Interest | | 85,929 |
Security lending | | 4,896 |
Total income | | 2,168,258 |
| | |
Expenses | | |
Management fee
Basic fee | $ 698,308 | |
Performance adjustment | (46,418) | |
Transfer agent fees | 386,640 | |
Accounting and security lending fees | 46,264 | |
Independent trustees' compensation | 560 | |
Custodian fees and expenses | 29,074 | |
Registration fees | 30,438 | |
Audit | 33,553 | |
Legal | 498 | |
Miscellaneous | 2,252 | |
Total expenses before reductions | 1,181,169 | |
Expense reductions | (52,818) | 1,128,351 |
Net investment income (loss) | | 1,039,907 |
Realized and Unrealized Gain (Loss) Net realized gain (loss) on: | | |
Investment securities | 606,323 | |
Foreign currency transactions | (2,912) | |
Total net realized gain (loss) | | 603,411 |
Change in net unrealized appreciation (depreciation) on: Investment securities | 17,741,372 | |
Assets and liabilities in foreign currencies | 12 | |
Total change in net unrealized appreciation (depreciation) | | 17,741,384 |
Net gain (loss) | | 18,344,795 |
Net increase (decrease) in net assets resulting from operations | | $ 19,384,702 |
See accompanying notes which are an integral part of the financial statements.
Annual Report
Financial Statements - continued
Statement of Changes in Net Assets
| Year ended
July 31,
2005 | Year ended
July 31,
2004 |
Increase (Decrease) in Net Assets | | |
Operations | | |
Net investment income (loss) | $ 1,039,907 | $ 253,479 |
Net realized gain (loss) | 603,411 | 342,318 |
Change in net unrealized appreciation (depreciation) | 17,741,384 | 4,732,030 |
Net increase (decrease) in net assets resulting
from operations | 19,384,702 | 5,327,827 |
Distributions to shareholders from net investment income | (665,959) | (70,717) |
Distributions to shareholders from net realized gain | (480,889) | (168,054) |
Total distributions | (1,146,848) | (238,771) |
Share transactions
Proceeds from sales of shares | 147,890,874 | 73,889,048 |
Reinvestment of distributions | 1,111,333 | 232,131 |
Cost of shares redeemed | (53,710,260) | (29,251,784) |
Net increase (decrease) in net assets resulting from share transactions | 95,291,947 | 44,869,395 |
Total increase (decrease) in net assets | 113,529,801 | 49,958,451 |
| | |
Net Assets | | |
Beginning of period | 68,540,808 | 18,582,357 |
End of period (including undistributed net investment income of $540,880 and undistributed net investment income of $189,382, respectively) | $ 182,070,609 | $ 68,540,808 |
Other Information Shares | | |
Sold | 12,009,001 | 6,816,269 |
Issued in reinvestment of distributions | 95,055 | 21,396 |
Redeemed | (4,420,951) | (2,650,499) |
Net increase (decrease) | 7,683,105 | 4,187,166 |
See accompanying notes which are an integral part of the financial statements.
Annual Report
Financial Highlights
Years ended July 31, | 2005 | 2004 | 2003 E |
Selected Per-Share Data | | | |
Net asset value, beginning of period | $ 11.24 | $ 9.73 | $ 10.00 |
Income from Investment Operations | | | |
Net investment income (loss) D | .11 | .05 | - G |
Net realized and unrealized gain (loss) | 2.03 | 1.52 | (.27) |
Total from investment operations | 2.14 | 1.57 | (.27) |
Distributions from net investment income | (.09) | (.02) | - |
Distributions from net realized gain | (.08) | (.04) | - |
Total distributions | (.17) | (.06) | - |
Net asset value, end of period | $ 13.21 | $ 11.24 | $ 9.73 |
Total Return B, C | 19.20% | 16.16% | (2.70)% |
Ratios to Average Net Assets F | | | |
Expenses before expense reductions | .97% | 1.17% | 3.37% A |
Expenses net of voluntary waivers, if any | .97% | 1.17% | 1.50% A |
Expenses net of all reductions | .93% | 1.13% | 1.50% A |
Net investment income (loss) | .85% | .50% | .41% A |
Supplemental Data | | | |
Net assets, end of period (000 omitted) | $ 182,071 | $ 68,541 | $ 18,582 |
Portfolio turnover rate | 81% | 111% | 84% A |
A Annualized
B Total returns for periods of less than one year are not annualized.
C Total returns would have been lower had certain expenses not been reduced during the periods shown.
D Calculated based on average shares outstanding during the period.
E For the period June 17, 2003 (commencement of operations) to July 31, 2003.
F Expense ratios reflect operating expenses of the fund. Expenses before reductions do not reflect amounts reimbursed by the investment adviser or reductions from brokerage service arrangements or other expense offset arrangements and do not represent the amount paid by the fund during periods when reimbursements or reductions occur. Expense ratios before reductions for start-up periods may not be representative of longer-term operating periods. Expenses net of any voluntary waivers reflect expenses after reimbursement by the investment adviser but prior to reductions from brokerage service arrangements or other expense offset arrangements. Expenses net of all reductions represent the net expenses paid by the fund.
G Amount represents less than $.01 per share.
See accompanying notes which are an integral part of the financial statements.
Annual Report
Notes to Financial Statements
For the period ended July 31, 2005
1. Significant Accounting Policies.
Fidelity Blue Chip Value Fund (the fund) is a non-diversified fund of Fidelity Securities Fund (the trust) and is authorized to issue an unlimited number of shares. The trust is registered under the Investment Company Act of 1940, as amended (the 1940 Act), as an open-end management investment company organized as a Massachusetts business trust. The financial statements have been prepared in conformity with accounting principles generally accepted in the United States of America, which require management to make certain estimates and assumptions at the date of the financial statements. The following summarizes the significant accounting policies of the fund:
Security Valuation. Net asset value per share (NAV calculation) is calculated as of the close of business of the New York Stock Exchange, normally 4:00 p.m. Eastern time. Equity securities, including restricted securities, for which market quotations are available are valued at the last sale price or official closing price (closing bid price or last evaluated quote if no sale has occurred) on the primary market or exchange on which they trade. If prices are not readily available or do not accurately reflect fair value for a security, or if a security's value has been materially affected by events occurring after the close of the exchange or market on which the security is principally traded, that security may be valued by another method that the Board of Trustees believes accurately reflects fair value. A security's valuation may differ depending on the method used for determining value. Price movements in futures contracts and ADRs, market and trading trends, the bid/ask quotes of brokers and off-exchange institutional trading may be reviewed in the course of making a good faith determination of a security's fair value. Short-term securities with remaining maturities of sixty days or less for which quotations are not readily available are valued on the basis of amortized cost. Investments in open-end investment companies are valued at their net asset value each business day.
Foreign Currency. The fund uses foreign currency contracts to facilitate transactions in foreign-denominated securities. Losses from these transactions may arise from changes in the value of the foreign currency or if the counterparties do not perform under the contracts' terms.
Foreign-denominated assets, including investment securities, and liabilities are translated into U.S. dollars at the exchange rate at period end. Purchases and sales of investment securities, income and dividends received and expenses denominated in foreign currencies are translated into U.S. dollars at the exchange rate in effect on the transaction date.
The effects of exchange rate fluctuations on investments are included with the net realized and unrealized gain (loss) on investment securities. Other foreign currency transactions resulting in realized and unrealized gain (loss) are disclosed separately.
Annual Report
1. Significant Accounting Policies - continued
Investment Transactions and Income. Security transactions are accounted for as of trade date. Gains and losses on securities sold are determined on the basis of identified cost. Dividend income is recorded on the ex-dividend date, except for certain dividends from foreign securities where the ex-dividend date may have passed, which are recorded as soon as the fund is informed of the ex-dividend date. Non-cash dividends included in dividend income, if any, are recorded at the fair market value of the securities received. Distributions received on securities that represent a return of capital or capital gain are recorded as a reduction of cost of investments and/or as a realized gain. The fund estimates the components of distributions received that may be considered return of capital distributions or capital gain distributions. Interest income is accrued as earned. Interest income includes coupon interest and amortization of premium and accretion of discount on debt securities. Investment income is recorded net of foreign taxes withheld where recovery of such taxes is uncertain.
Expenses. Most expenses of the trust can be directly attributed to a fund. Expenses which cannot be directly attributed are apportioned among each fund in the trust.
Income Tax Information and Distributions to Shareholders. Each year, the fund intends to qualify as a regulated investment company by distributing all of its taxable income and realized gains under Subchapter M of the Internal Revenue Code. As a result, no provision for income taxes is required in the accompanying financial statements. Foreign taxes are provided for based on the fund's understanding of the tax rules and rates that exist in the foreign markets in which it invests.
Distributions are recorded on the ex-dividend date. Income and capital gain distributions are determined in accordance with income tax regulations, which may differ from generally accepted accounting principles. In addition, the fund will claim a portion of the payment made to redeeming shareholders as a distribution for income tax purposes.
Capital accounts within the financial statements are adjusted for permanent book-tax differences. These adjustments have no impact on net assets or the results of operations. Temporary book-tax differences will reverse in a subsequent period.
Book-tax differences are primarily due to foreign currency transactions and losses deferred due to wash sales.
Annual Report
Notes to Financial Statements - continued
1. Significant Accounting Policies - continued
Income Tax Information and Distributions to Shareholders - continued
The tax-basis components of distributable earnings and the federal tax cost as of period end were as follows:
Unrealized appreciation | $ 24,568,081 | |
Unrealized depreciation | (2,978,018) | |
Net unrealized appreciation (depreciation) | 21,590,063 | |
Undistributed ordinary income | 528,214 | |
Undistributed long-term capital gain | 929,984 | |
| | |
Cost for federal income tax purposes | $ 161,497,109 | |
The tax character of distributions paid was as follows:
| July 31, 2005 | July 31, 2004 |
Ordinary Income | $ 922,433 | $ 238,771 |
Long-term Capital Gains | 224,415 | - |
Total | $ 1,146,848 | $ 238,771 |
2. Operating Policies.
Repurchase Agreements. Fidelity Management & Research Company (FMR) has received an Exemptive Order from the Securities and Exchange Commission (the SEC) which permits the fund and other affiliated entities of FMR to transfer uninvested cash balances into joint trading accounts which are then invested in repurchase agreements. The fund may also invest directly with institutions in repurchase agreements. Repurchase agreements are collateralized by government or non-government securities. Collateral is held in segregated accounts with custodian banks and may be obtained in the event of a default of the counterparty. The fund monitors, on a daily basis, the value of the collateral to ensure it is at least equal to the principal amount of the repurchase agreement (including accrued interest). In the event of a default by the counterparty, realization of the collateral proceeds could be delayed, during which time the value of the collateral may decline.
Restricted Securities. The fund may invest in securities that are subject to legal or contractual restrictions on resale. These securities generally may be resold in transactions exempt from registration or to the public if the securities are registered. Disposal of these securities may involve time-consuming negotiations and expense, and prompt sale at an acceptable price may be difficult. Information regarding restricted securities is included at the end of the fund's Schedule of Investments.
Annual Report
3. Purchases and Sales of Investments.
Purchases and sales of securities, other than short-term securities and U.S. government securities, aggregated $192,344,633 and $97,010,176, respectively.
4. Fees and Other Transactions with Affiliates.
Management Fee. FMR and its affiliates provide the fund with investment management related services for which the fund pays a monthly management fee. The management fee is the sum of an individual fund fee rate that is based on an annual rate of .30% of the fund's average net assets and a group fee rate that averaged .27% during the period. The group fee rate is based upon the average net assets of all the mutual funds advised by FMR. The group fee rate decreases as assets under management increase and increases as assets under management decrease. In addition, the management fee is subject to a performance adjustment (up to a maximum of ± .20% of the fund's average net assets over a 36 month performance period). The upward or downward adjustment to the management fee is based on the fund's relative investment performance as compared to an appropriate benchmark index. For the period, the total annual management fee rate, including the performance adjustment, was .54% of the fund's average net assets.
Transfer Agent Fees. Fidelity Service Company, Inc. (FSC), an affiliate of FMR, is the fund's transfer, dividend disbursing and shareholder servicing agent. FSC receives account fees and asset-based fees that vary according to account size and type of account. FSC pays for typesetting, printing and mailing of shareholder reports, except proxy statements. For the period, the transfer agent fees were equivalent to an annual rate of .32% of average net assets.
Accounting and Security Lending Fees. FSC maintains the fund's accounting rec-ords. The accounting fee is based on the level of average net assets for the month. Under a separate contract, FSC administers the security lending program. The security lending fee is based on the number and duration of lending transactions.
Central Funds. The fund may invest in affiliated Central Funds managed by Fidelity Investments Money Management, Inc. (FIMM), an affiliate of FMR. The Central Funds are open-end investment companies available only to investment companies and other accounts managed by FMR and its affiliates. The Money Market Central Funds seek preservation of capital and current income. The Central Funds do not pay a management fee. Income distributions earned by the fund are recorded as income in the accompanying financial statements and totaled $99,577 for the period.
Brokerage Commissions. The fund placed a portion of its portfolio transactions with brokerage firms which are affiliates of the investment adviser. The commissions paid to these affiliated firms were $11,318 for the period.
Annual Report
Notes to Financial Statements - continued
5. Committed Line of Credit.
The fund participates with other funds managed by FMR in a $4.2 billion credit facility (the "line of credit") to be utilized for temporary or emergency purposes to fund shareholder redemptions or for other short-term liquidity purposes. The fund has agreed to pay commitment fees on its pro rata portion of the line of credit. During the period, there were no borrowings on this line of credit.
6. Security Lending.
The fund lends portfolio securities from time to time in order to earn additional income. The fund receives collateral (in the form of U.S. Treasury obligations, letters of credit and/or cash) against the loaned securities and maintains collateral in an amount not less than 100% of the market value of the loaned securities during the period of the loan. The market value of the loaned securities is determined at the close of business of the fund and any additional required collateral is delivered to the fund on the next business day. If the borrower defaults on its obligation to return the securities loaned because of insolvency or other reasons, a fund could experience delays and costs in recovering the securities loaned or in gaining access to the collateral. Cash collateral is invested in the Fidelity Securities Lending Cash Central Fund. The value of loaned securities and cash collateral at period end are disclosed on the fund's Statement of Assets and Liabilities.
7. Expense Reductions.
Many of the brokers with whom FMR places trades on behalf of the fund provided services to the fund in addition to trade execution. These services included payments of certain expenses on behalf of the fund totaling $52,818 for the period.
8. Other.
The fund's organizational documents provide former and current trustees and officers with a limited indemnification against liabilities arising in connection with the performance of their duties to the fund. In the normal course of business, the fund may also enter into contracts that provide general indemnifications. The fund's maximum exposure under these arrangements is unknown as this would be dependent on future claims that may be made against the fund. The risk of material loss from such claims is considered remote.
Annual Report
Report of Independent Registered Public Accounting Firm
To the Trustees of Fidelity Securities Fund and the Shareholders of Fidelity Blue Chip Value Fund:
In our opinion, the accompanying statement of assets and liabilities, including the schedule of investments, and the related statements of operations and of changes in net assets and the financial highlights present fairly, in all material respects, the financial position of Fidelity Blue Chip Value Fund (a fund of Fidelity Securities Fund) at July 31, 2005 and the results of its operations, the changes in its net assets and the financial highlights for the periods indicated, in conformity with accounting principles generally accepted in the United States of America. These financial statements and financial highlights (hereafter referred to as "financial statements") are the responsibility of the Fidelity Blue Chip Value Fund's management; our responsibility is to express an opinion on these financial statements based on our audits. We conducted our audits of these financial statements in accordance with the standards of the Public Company Accounting Oversight Board (United States). Those standards require that we plan and perform the audit to obtain reasonable assurance about whether the financial statements are free of material misstatement. An audit includes examining, on a test basis, evidence supporting the amounts and disclosures in the financial statements, assessing the accounting principles used and significant estimates made by management, and evaluating the overall financial statement presentation. We believe that our audits, which included confirmation of securities at July 31, 2005 by correspondence with the custodian and brokers, provide a reasonable basis for our opinion.
/s/ PricewaterhouseCoopers LLP
PricewaterhouseCoopers LLP
Boston, Massachusetts
September 9, 2005
Annual Report
Trustees and Officers
The Trustees, Members of the Advisory Board, and executive officers of the trust and fund, as applicable, are listed below. The Board of Trustees governs the fund and is responsible for protecting the interests of shareholders. The Trustees are experienced executives who meet periodically throughout the year to oversee the fund's activities, review contractual arrangements with companies that provide services to the fund, and review the fund's performance. Except for William O. McCoy, Stephen P. Jonas, and Kenneth L. Wolfe, each of the Trustees oversees 319 funds advised by FMR or an affiliate. Mr. McCoy oversees 321 funds advised by FMR or an affiliate. Mr. Jonas and Mr. Wolfe oversee 310 funds advised by FMR or an affiliate.
The Trustees hold office without limit in time except that (a) any Trustee may resign; (b) any Trustee may be removed by written instrument, signed by at least two-thirds of the number of Trustees prior to such removal; (c) any Trustee who requests to be retired or who has become incapacitated by illness or injury may be retired by written instrument signed by a majority of the other Trustees; and (d) any Trustee may be removed at any special meeting of shareholders by a two-thirds vote of the outstanding voting securities of the trust. Each Trustee who is not an interested person (as defined in the 1940 Act) (Independent Trustee), shall retire not later than the last day of the calendar year in which his or her 72nd birthday occurs. The Independent Trustees may waive this mandatory retirement age policy with respect to individual Trustees. The executive officers and Advisory Board Members hold office without limit in time, except that any officer and Advisory Board Member may resign or may be removed by a vote of a majority of the Trustees at any regular meeting or any special meeting of the Trustees. Except as indicated, each individual has held the office shown or other offices in the same company for the past five years.
Interested Trustees*:
Correspondence intended for each Trustee who is an interested person may be sent to Fidelity Investments, 82 Devonshire Street, Boston, Massachusetts 02109.
Name, Age; Principal Occupation |
Edward C. Johnson 3d (75)** |
| Year of Election or Appointment: 1984 Mr. Johnson is Chairman of the Board of Trustees. Mr. Johnson serves as Chief Executive Officer, Chairman, and a Director of FMR Corp.; a Director and Chairman of the Board and of the Executive Committee of FMR; Chairman and a Director of Fidelity Management & Research (Far East) Inc.; Chairman and a Director of Fidelity Investments Money Management, Inc.; and Chairman (2001-present) and a Director (2000-present) of FMR Co., Inc. |
Abigail P. Johnson (43)** |
| Year of Election or Appointment: 2001 Ms. Johnson serves as President of Fidelity Employer Services Company (FESCO) (2005-present). She is President and a Director of Fidelity Investments Money Management, Inc. (2001-present), FMR Co., Inc. (2001-present), and a Director of FMR Corp. Previously, Ms. Johnson served as President and a Director of FMR (2001-2005), Senior Vice President of the Fidelity Funds (2001-2005), and managed a number of Fidelity funds. |
Stephen P. Jonas (52) |
| Year of Election or Appointment: 2005 Mr. Jonas is Senior Vice President of Blue Chip Value (2005-present). He also serves as Senior Vice President of other Fidelity funds (2005- present). Mr. Jonas is Executive Director of FMR (2005-present). Previously, Mr. Jonas served as President of Fidelity Enterprise Operations and Risk Services (2004-2005), Chief Administrative Officer (2002- 2004), and Chief Financial Officer of FMR Co. (1998-2000). Mr. Jonas has been with Fidelity Investments since 1987 and has held various financial and management positions, including Chief Financial Officer of FMR. In addition, he serves on the Boards of Boston Ballet (2003- present) and Simmons College (2003-present). |
Robert L. Reynolds (53) |
| Year of Election or Appointment: 2003 Mr. Reynolds is a Director (2003-present) and Chief Operating Officer (2002-present) of FMR Corp. He also serves on the Board at Fidelity Investments Canada, Ltd. (2000-present). Previously, Mr. Reynolds served as President of Fidelity Investments Institutional Retirement Group (1996-2000). |
* Trustees have been determined to be "Interested Trustees" by virtue of, among other things, their affiliation with the trust or various entities under common control with FMR.
** Edward C. Johnson 3d, Trustee, is Abigail P. Johnson's father.
Annual Report
Independent Trustees:
Correspondence intended for each Independent Trustee (that is, the Trustees other than the Interested Trustees) may be sent to Fidelity Investments, P.O. Box 55235, Boston, Massachusetts 02205-5235.
Name, Age; Principal Occupation |
Dennis J. Dirks (57) |
| Year of Election or Appointment: 2005 Prior to his retirement in May 2003, Mr. Dirks was Chief Operating Officer and a member of the Board of The Depository Trust & Clearing Corporation (DTCC) (1999-2003). He also served as President, Chief Operating Officer, and Board member of The Depository Trust Company (DTC) (1999-2003) and President and Board member of the National Securities Clearing Corporation (NSCC) (1999-2003). In addition, Mr. Dirks served as Chief Executive Officer and Board member of the Government Securities Clearing Corporation (2001-2003) and Chief Executive Officer and Board member of the Mortgage-Backed Securities Clearing Corporation (2001-2003). Mr. Dirks also serves as a Trustee of Manhattan College (2005-present). |
Robert M. Gates (61) |
| Year of Election or Appointment: 1997 Dr. Gates is Vice Chairman of the Independent Trustees (2005-present). Dr. Gates is President of Texas A&M University (2002-present). He was Director of the Central Intelligence Agency (CIA) from 1991 to 1993. From 1989 to 1991, Dr. Gates served as Assistant to the President of the United States and Deputy National Security Advisor. Dr. Gates is a Director of NACCO Industries, Inc. (mining and manufacturing), Parker Drilling Co., Inc. (drilling and rental tools for the energy industry, 2001-present), and Brinker International (restaurant management, 2003-present). Previously, Dr. Gates served as a Director of LucasVarity PLC (automotive components and diesel engines), a Director of TRW Inc. (automotive, space, defense, and information technology), and Dean of the George Bush School of Government and Public Service at Texas A&M University (1999-2001). Dr. Gates also is a Trustee of the Forum for International Policy. |
George H. Heilmeier (69) |
| Year of Election or Appointment: 2004 Dr. Heilmeier is Chairman Emeritus of Telcordia Technologies (communication software and systems), where prior to his retirement, he served as company Chairman and Chief Executive Officer. He currently serves on the Boards of Directors of The Mitre Corporation (systems engineering and information technology support for the government), and HRL Laboratories (private research and development, 2004-present). He is Chairman of the General Motors Science & Technology Advisory Board and a Life Fellow of the Institute of Electrical and Electronics Engineers (IEEE) (2000-present). Dr. Heilmeier is a member of the Defense Science Board and the National Security Agency Advisory Board. He is also a member of the National Academy of Engineering, the American Acad-emy of Arts and Sciences, and the Board of Overseers of the School of Engineering and Applied Science of the University of Pennsylvania. Previously, Dr. Heilmeier served as a Director of TRW Inc. (automotive, space, defense, and information technology, 1992-2002), Compaq (1994-2002), Automatic Data Processing, Inc. (ADP) (technology-based business outsourcing, 1995-2002), INET Technologies Inc. (telecommunications network surveillance, 2001-2004), and Teletech Holdings (customer management services). He is the recipient of the 2005 Kyoto Prize in Advanced Technology for his invention of the liquid display. |
Marie L. Knowles (58) |
| Year of Election or Appointment: 2001 Prior to Ms. Knowles' retirement in June 2000, she served as Executive Vice President and Chief Financial Officer of Atlantic Richfield Company (ARCO) (diversified energy, 1996-2000). From 1993 to 1996, she was a Senior Vice President of ARCO and President of ARCO Transportation Company. She served as a Director of ARCO from 1996 to 1998. She currently serves as a Director of Phelps Dodge Corporation (copper mining and manufacturing) and McKesson Corporation (healthcare service, 2002-present). Ms. Knowles is a Trustee of the Brookings Institution and the Catalina Island Conservancy and also serves as a member of the Advisory Board for the School of Engineering of the University of Southern California. |
Ned C. Lautenbach (61) |
| Year of Election or Appointment: 2000 Mr. Lautenbach has been a partner of Clayton, Dubilier & Rice, Inc. (private equity investment firm) since September 1998. Previously, Mr. Lautenbach was with the International Business Machines Corporation (IBM) from 1968 until his retirement in 1998. Mr. Lautenbach serves as a Director of Italtel Holding S.p.A. (telecommunications (Milan, Italy), 2004-present) and Eaton Corporation (diversified industrial) as well as the Philharmonic Center for the Arts in Naples, Florida. He also is a member of the Board of Trustees of Fairfield University (2005-present), as well as a member of the Council on Foreign Relations. |
Marvin L. Mann (72) |
| Year of Election or Appointment: 1993 Mr. Mann is Chairman of the Independent Trustees (2001-present). He is Chairman Emeritus of Lexmark International, Inc. (computer peripherals), where he served as CEO until April 1998, retired as Chairman May 1999, and remains a member of the Board. Prior to 1991, he held the positions of Vice President of International Business Machines Corporation (IBM) and President and General Manager of various IBM divisions and subsidiaries. He is a member of the Executive Committee of the Independent Director's Council of the Investment Company Institute. In addition, Mr. Mann is a member of the President's Cabinet at the University of Alabama and the Board of Visitors of the Culverhouse College of Commerce and Business Administration at the University of Alabama. |
William O. McCoy (71) |
| Year of Election or Appointment: 1997 Prior to his retirement in December 1994, Mr. McCoy was Vice Chairman of the Board of BellSouth Corporation (telecommunications) and President of BellSouth Enterprises. He is currently a Director of Liberty Corporation (holding company), Duke Realty Corporation (real estate), and Progress Energy, Inc. (electric utility). He is also a partner of Franklin Street Partners (private investment management firm) and a member of the Research Triangle Foundation Board. In addition, Mr. McCoy served as the Interim Chancellor (1999-2000) and a member of the Board of Visitors for the University of North Carolina at Chapel Hill and currently serves on the Board of Directors of the University of North Carolina Health Care System and the Board of Visitors of the Kenan-Flagler Business School (University of North Carolina at Chapel Hill). He also served as Vice President of Finance for the University of North Carolina (16-school system). |
Cornelia M. Small (61) |
| Year of Election or Appointment: 2005 Ms. Small is a member (2000-present) and Chairperson (2002-present) of the Investment Committee, and a member (2002-present) of the Board of Trustees of Smith College. Previously, she served as Chief Investment Officer (1999-2000), Director of Global Equity Investments (1996-1999), and a member of the Board of Directors of Scudder, Stevens & Clark (1990-1997) and Scudder Kemper Investments (1997-1998). In addition, Ms. Small served as Co-Chair (2000-2003) of the Annual Fund for the Fletcher School of Law and Diplomacy. |
William S. Stavropoulos (66) |
| Year of Election or Appointment: 2002 Mr. Stavropoulos is Chairman of the Board (2000-present) and a Member of the Board of Directors of The Dow Chemical Company. Since joining The Dow Chemical Company in 1967, Mr. Stavropoulos served in numerous senior management positions, including President (1993-2000; 2002-2003), CEO (1995-2000; 2002-2004), and Chairman of the Executive Committee (2000-2004). Currently, he is a Director of NCR Corporation (data warehousing and technology solutions), BellSouth Corporation (telecommunications), Chemical Financial Corporation, Maersk Inc. (industrial conglomerate, 2002-present), and Metalmark Capital (private equity investment firm, 2005-present). He also serves as a member of the Board of Trustees of the American Enterprise Institute for Public Policy Research. In addition, Mr. Stavropoulos is a member of The Business Council, J.P. Morgan International Council and the University of Notre Dame Advisory Council for the College of Science. |
Kenneth L. Wolfe (66) |
| Year of Election or Appointment: 2005 Mr. Wolfe also serves as a Trustee (2005-present) or Member of the Advisory Board (2004-present) of other investment companies advised by FMR. Prior to his retirement in 2001, Mr. Wolfe was Chairman and Chief Executive Officer of Hershey Foods Corporation (1993-2001). He currently serves as a member of the boards of Adelphia Communications Corporation (2003-present), Bausch & Lomb, Inc., and Revlon Inc. (2004-present). |
Annual Report
Advisory Board Members and Executive Officers:
Correspondence intended for Mr. Gamper may be sent to Fidelity Investments, P.O. Box 55235, Boston, Massachusetts 02205-5235. Correspondence intended for each executive officer and Mr. Lynch may be sent to Fidelity Investments, 82 Devonshire Street, Boston, Massachusetts 02109.
Name, Age; Principal Occupation |
Albert R. Gamper, Jr. (63) |
| Year of Election or Appointment: 2005 Member of the Advisory Board of Fidelity Securities Fund. Prior to his retirement in December 2004, Mr. Gamper served as Chairman of the Board of CIT Group Inc. (commercial finance). During his tenure with CIT Group Inc. Mr. Gamper served in numerous senior management positions, including Chairman (1987-1989; 1999-2001; 2002-2004), Chief Executive Officer (1987-2004), and President (1989-2002). He currently serves as a member of the Board of Directors of Public Service Enterprise Group (utilities, 2001-present), Chairman of the Board of Governors, Rutgers University (2004-present), and Chairman of the Board of Saint Barnabas Health Care System. |
Peter S. Lynch (61) |
| Year of Election or Appointment: 2003 Member of the Advisory Board of Fidelity Securities Fund. Vice Chairman and a Director of FMR, and Vice Chairman (2001-present) and a Director (2000-present) of FMR Co., Inc. Previously, Mr. Lynch served as a Trustee of the Fidelity funds (1990-2003). In addition, he serves as a Trustee of Boston College, Massachusetts Eye & Ear Infirmary, Historic Deerfield, John F. Kennedy Library, and the Museum of Fine Arts of Boston. |
Dwight D. Churchill (51) |
| Year of Election or Appointment: 2005 Vice President of Blue Chip Value. Mr. Churchill also serves as Vice President of certain Equity Funds (2005-present) and certain High Income Funds (2005-present). Previously, he served as Head of Fidelity's Fixed-Income Division (2000-2005), Vice President of Fidelity's Money Market Funds (2000-2005), Vice President of Fidelity's Bond Funds, and Senior Vice President of FIMM (2000) and FMR. Mr. Churchill joined Fidelity in 1993 as Vice President and Group Leader of Taxable Fixed-Income Investments. |
Eric D. Roiter (56) |
| Year of Election or Appointment: 2003 Secretary of Blue Chip Value. He also serves as Secretary of other Fidelity funds; Vice President, General Counsel, and Secretary of FMR Co., Inc. (2001-present) and FMR; Assistant Secretary of Fidelity Management & Research (U.K.) Inc. (2001-present), Fidelity Management & Research (Far East) Inc. (2001-present), and Fidelity Investments Money Management, Inc. (2001-present). Mr. Roiter is an Adjunct Member, Faculty of Law, at Boston College Law School (2003-present). Previously, Mr. Roiter served as Vice President and Secretary of FDC (1998-2005). |
Stuart Fross (45) |
| Year of Election or Appointment: 2003 Assistant Secretary of Blue Chip Value. Mr. Fross also serves as Assistant Secretary of other Fidelity funds (2003-present), Vice President and Secretary of FDC (2005-present), and is an employee of FMR. |
Christine Reynolds (46) |
| Year of Election or Appointment: 2004 President, Treasurer, and Anti-Money Laundering (AML) officer of Blue Chip Value. Ms. Reynolds also serves as President, Treasurer, and AML officer of other Fidelity funds (2004) and is a Vice President (2003) and an employee (2002) of FMR. Before joining Fidelity Investments, Ms. Reynolds worked at PricewaterhouseCoopers LLP (PwC) (1980-2002), where she was most recently an audit partner with PwC's investment management practice. |
Timothy F. Hayes (54) |
| Year of Election or Appointment: 2003 Chief Financial Officer of Blue Chip Value. Mr. Hayes also serves as Chief Financial Officer of other Fidelity funds (2002-present) and President of Fidelity Investment Operations (2005-present) which includes Fidelity Pricing and Cash Management Services Group (FPCMS), where he served as President (1998-2005). Mr. Hayes serves as President of Fidelity Service Company (2003-present) where he also serves as a Director. Mr. Hayes also served as President of Fidelity Investments Operations Group (FIOG, 2002-2005). |
Kenneth A. Rathgeber (58) |
| Year of Election or Appointment: 2004 Chief Compliance Officer of Blue Chip Value. Mr. Rathgeber also serves as Chief Compliance Officer of other Fidelity funds (2004) and Executive Vice President of Risk Oversight for Fidelity Investments (2002). Previously, he served as Executive Vice President and Chief Operating Officer for Fidelity Investments Institutional Services Company, Inc. (1998-2002). |
John R. Hebble (47) |
| Year of Election or Appointment: 2003 Deputy Treasurer of Blue Chip Value. Mr. Hebble also serves as Deputy Treasurer of other Fidelity funds (2003), and is an employee of FMR. Before joining Fidelity Investments, Mr. Hebble worked at Deutsche Asset Management where he served as Director of Fund Accounting (2002-2003) and Assistant Treasurer of the Scudder Funds (1998-2003). |
Bryan A. Mehrmann (44) |
| Year of Election or Appointment: 2005 Deputy Treasurer of Blue Chip Value. Mr. Mehrmann also serves as Deputy Treasurer of other Fidelity funds (2005-present) and is an employee of FMR. Previously, Mr. Mehrmann served as Vice President of Fidelity Investments Institutional Services Group (FIIS)/Fidelity Investments Institutional Operations Corporation, Inc. (FIIOC) Client Services (1998-2004). |
Kimberley H. Monasterio (41) |
| Year of Election or Appointment: 2004 Deputy Treasurer of Blue Chip Value. Ms. Monasterio also serves as Deputy Treasurer of other Fidelity funds (2004) and is an employee of FMR (2004). Before joining Fidelity Investments, Ms. Monasterio served as Treasurer (2000-2004) and Chief Financial Officer (2002-2004) of the Franklin Templeton Funds and Senior Vice President of Franklin Templeton Services, LLC (2000-2004). |
Kenneth B. Robins (35) |
| Year of Election or Appointment:2005 Deputy Treasurer of Blue Chip Value. Mr. Robins also serves as Deputy Treasurer of other Fidelity funds (2005-present) and is an employee of FMR (2004-present). Before joining Fidelity Investments, Mr. Robins worked at KPMG LLP, where he was a partner in KPMG's department of professional practice (2002-2004) and a Senior Manager (1999-2000). In addition, Mr. Robins served as Assistant Chief Accountant, United States Securities and Exchange Commission (2000-2002). |
Robert G. Byrnes (38) |
| Year of Election or Appointment: 2005 Assistant Treasurer of Blue Chip Value. Mr. Byrnes also serves as Assistant Treasurer of other Fidelity funds (2005-present) and is an employee of FMR (2005-present). Previously, Mr. Byrnes served as Vice President of FPCMS (2003-2005). Before joining Fidelity Investments, Mr. Byrnes worked at Deutsche Asset Management where he served as Vice President of the Investment Operations Group (2000-2003). |
John H. Costello (58) |
| Year of Election or Appointment: 2003 Assistant Treasurer of Blue Chip Value. Mr. Costello also serves as Assistant Treasurer of other Fidelity funds and is an employee of FMR. |
Peter L. Lydecker (51) |
| Year of Election or Appointment: 2004 Assistant Treasurer of Blue Chip Value. Mr. Lydecker also serves as Assistant Treasurer of other Fidelity funds (2004) and is an employee of FMR. |
Mark Osterheld (50) |
| Year of Election or Appointment: 2003 Assistant Treasurer of Blue Chip Value. Mr. Osterheld also serves as Assistant Treasurer of other Fidelity funds (2002) and is an employee of FMR. |
Gary W. Ryan (46) |
| Year of Election or Appointment: 2005 Assistant Treasurer of Blue Chip Value. Mr. Ryan also serves as Assistant Treasurer of other Fidelity funds (2005-present) and is an employee of FMR (2005-present). Previously, Mr. Ryan served as Vice President of Fund Reporting in FPCMS (1999-2005). |
Salvatore Schiavone (39) |
| Year of Election or Appointment: 2005 Assistant Treasurer of Blue Chip Value. Mr. Schiavone also serves as Assistant Treasurer of other Fidelity funds (2005-present) and is an employee of FMR (2005-present). Before joining Fidelity Investments, Mr. Schiavone worked at Deutsche Asset Management, where he most recently served as Assistant Treasurer (2003-2005) of the Scudder Funds and Vice President and Head of Fund Reporting (1996-2003). |
Annual Report
Distributions
The Board of Trustees of Fidelity Blue Chip Value voted to pay on September 12, 2005, to shareholders of record at the opening of business on September 9, 2005, a distribution of $0.07 per share derived from capital gains realized from sales of portfolio securities and a dividend of $0.04 per share from net investment income.
The fund hereby designates as capital gain dividends: For dividends with respect to the taxable year ended July 31, 2005, $884,000, or, if subsequently determined to be different, the net capital gain of such year, and for dividends with respect to the taxable year ended July 31, 2004, $234,000, or, if subsequently determined to be different, the excess of: (a) the net capital gain of such year, over (b) amounts previously designated as capital gain dividends with respect to such year.
The fund designates 100% of the dividends distributed during the fiscal year as qualifying for the dividends-received deduction for corporate shareholders.
The fund designates 100% of the dividends distributed in September and December during the fiscal year as amounts which may be taken into account as a dividend for purposes of the maximum rate under section 1(h)(11) of the Internal Revenue Code.
The fund will notify shareholders in January 2006 of amounts for use in preparing 2005 income tax returns.
Annual Report
Board Approval of Investment Advisory Contracts and Management Fees
Fidelity Blue Chip Value Fund
Each year, typically in July, the Board of Trustees, including the independent Trustees (together, the Board), votes on the renewal of the management contract and sub-advisory agreements (together, the Advisory Contracts) for the fund. The Board, assisted by the advice of fund counsel and independent Trustees' counsel, requests and considers a broad range of information throughout the year.
The Board meets regularly each month except August and takes into account throughout the year matters bearing on Advisory Contracts. The Board, acting directly and through its separate committees, considers at each of its meetings factors that are relevant to the annual renewal of the fund's Advisory Contracts, including the services and support provided to the fund and its shareholders by Fidelity. At the time of the renewal, the Board had 11 standing committees, each composed of independent Trustees with varying backgrounds, to which the Board has assigned specific subject matter responsibilities in order to enhance effective decision-making by the Board. Each committee has adopted a written charter outlining the structure and purposes of the committee. One such committee, the Equity Contract Committee, meets periodically during the first six months of each year and as necessary to consider matters specifically related to the annual renewal of Advisory Contracts. The committee requests and receives information on, and makes recommendations to the independent Trustees concerning, the approval and annual review of the Advisory Contracts.
At its July 2005 meeting, the Board of Trustees, including the independent Trustees, unanimously determined to renew the Advisory Contracts for the fund. In reaching its determination, the Board considered all factors it believed relevant, including (1) the nature, extent, and quality of the services to be provided to the fund and its shareholders by Fidelity (including the investment performance of the fund); (2) the competitiveness of the management fee and total expenses of the fund; (3) the total costs of the services to be provided by and the profits to be realized by the investment adviser and its affiliates from the relationship with the fund; (4) the extent to which economies of scale would be realized as the fund grows; and (5) whether fee levels reflect these economies of scale, if any, for the benefit of fund shareholders.
In determining whether to renew the Advisory Contracts for the fund, the Board ultimately reached a determination, with the assistance of fund counsel and independent Trustees' counsel, that the renewal of the Advisory Contracts and the compensation to be received by Fidelity under the management contract is consistent with Fidelity's fiduciary duty under applicable law. In addition to evaluating the specific factors noted above, the Board, in reaching its determination, is aware that shareholders in the fund have a broad range of investment choices available to them, including a wide choice among mutual funds offered by competitors to Fidelity, and that the fund's shareholders, with the opportunity to review and weigh the disclosure provided by the fund in its prospectus and other public disclosures, have chosen to invest in this fund, managed by Fidelity.
Annual Report
Board Approval of Investment Advisory Contracts and
Management Fees - continued
Nature, Extent, and Quality of Services Provided by Fidelity. The Board considered staffing within the investment adviser, FMR, and the sub-advisers (together, the Investment Advisers), including the background of the fund's portfolio manager and the fund's investment objective and discipline. The independent Trustees also had discussions with senior management of Fidelity's investment operations and investment groups. The Board considered the structure of the portfolio manager compensation program and whether this structure provides appropriate incentives.
Fidelity Resources Dedicated to Investment Management and Support Services. The Board reviewed the size, education, and experience of the Investment Advisers' investment staff, their use of technology, and the Investment Advisers' approach to recruiting, training, and retaining portfolio managers and other research, advisory, and management personnel. The Board considered Fidelity's extensive global research capabilities that enable the Investment Advisers to aggregate data from various sources in an effort to produce positive investment results. The Board noted that Fidelity's analysts have access to a variety of technological tools that enable them to perform both fundamental and quantitative analysis and to specialize in various disciplines. The Board also considered that Fidelity's portfolio managers and analysts have access to daily portfolio attribution that allows for monitoring of a fund's portfolio, as well as an electronic communication system that provides immediate real-time access to research concerning issuers and credit enhancers.
Shareholder and Administrative Services. The Board considered the nature, extent, quality, and cost of administrative, distribution, and shareholder services performed by the Investment Advisers and their affiliates under the Advisory Contracts and under separate agreements covering transfer agency, pricing and bookkeeping, and securities lending services for the fund. The Board also considered the nature and extent of the Investment Advisers' supervision of third party service providers, principally custodians and subcustodians. The Board reviewed the allocation of fund brokerage, including allocations to brokers affiliated with the Investment Advisers, the use of brokerage commissions to pay fund expenses, and the use of "soft" commission dollars to pay for research services. The Board also considered that Fidelity voluntarily decided in 2004 to stop using "soft" commission dollars to pay for market data and, instead, to pay for that data out of its own resources. The Board also considered the resources devoted to, and the record of compliance with, the fund's compliance policies and procedures.
The Board noted that the growth of fund assets across the complex allows Fidelity to reinvest in the development of services designed to enhance the value or convenience of the Fidelity funds as investment vehicles. These services include 24-hour access to account information and market information through phone representatives and over the Internet, and investor education materials and asset allocation tools.
Annual Report
Investment in a Large Fund Family. The Board considered the benefits to shareholders of investing in a Fidelity fund, including the benefits of investing in a fund that is part of a large family of funds offering a variety of investment disciplines and providing for a large variety of mutual fund investor services. For example, fund shareholders are offered the privilege of exchanging shares of the fund for shares of other Fidelity funds, as set forth in the fund's prospectus, without paying a sales charge. The Board noted that, since the last Advisory Contract renewals in July 2004, Fidelity has taken a number of actions that benefited particular funds, including (i) voluntarily deciding in 2004 to stop using "soft" commission dollars to pay for market data and, instead, to pay for that data out of its own resources, (ii) contractually agreeing to impose management fee reductions and expense limitations on its five Spartan stock index funds and its stock index fund available through variable insurance products, (iii) contractually agreeing to eliminate the management fees on the Fidelity Freedom Funds and the Fidelity Advisor Freedom Funds, (iv) contractually agreeing to reduce the management fees on most of its investment-grade taxable bond funds, and (v) contractually agreeing to impose expense limitations on its retail and Spartan investment-grade taxable bond funds.
Investment Performance and Compliance. The Board considered whether the fund has operated within its investment objective, as well as its record of compliance with its investment restrictions. It also reviewed the fund's absolute investment performance, as well as the fund's relative investment performance measured against (i) a broad-based securities market index, and (ii) a peer group of mutual funds. Because the fund had been in existence less than three calendar years, the following chart considered by the Board shows, for the one-year period ended December 31, 2004, the fund's return, the return of a broad-based securities market index ("benchmark"), and a range of returns of a peer group of mutual funds identified by Lipper Inc. as having an investment objective similar to that of the fund. The box within the chart shows the 25th percentile return (bottom of box) and the 75th percentile return (top of box) of the Lipper peer group. Returns shown above the box are in the first quartile and returns shown below the box are in the fourth quartile. The percentage beaten number noted below the chart corresponds to the percentile box and represents the percentage of funds in the Lipper peer group whose performance was equal to or lower than that of the fund.
Annual Report
Board Approval of Investment Advisory Contracts and
Management Fees - continued
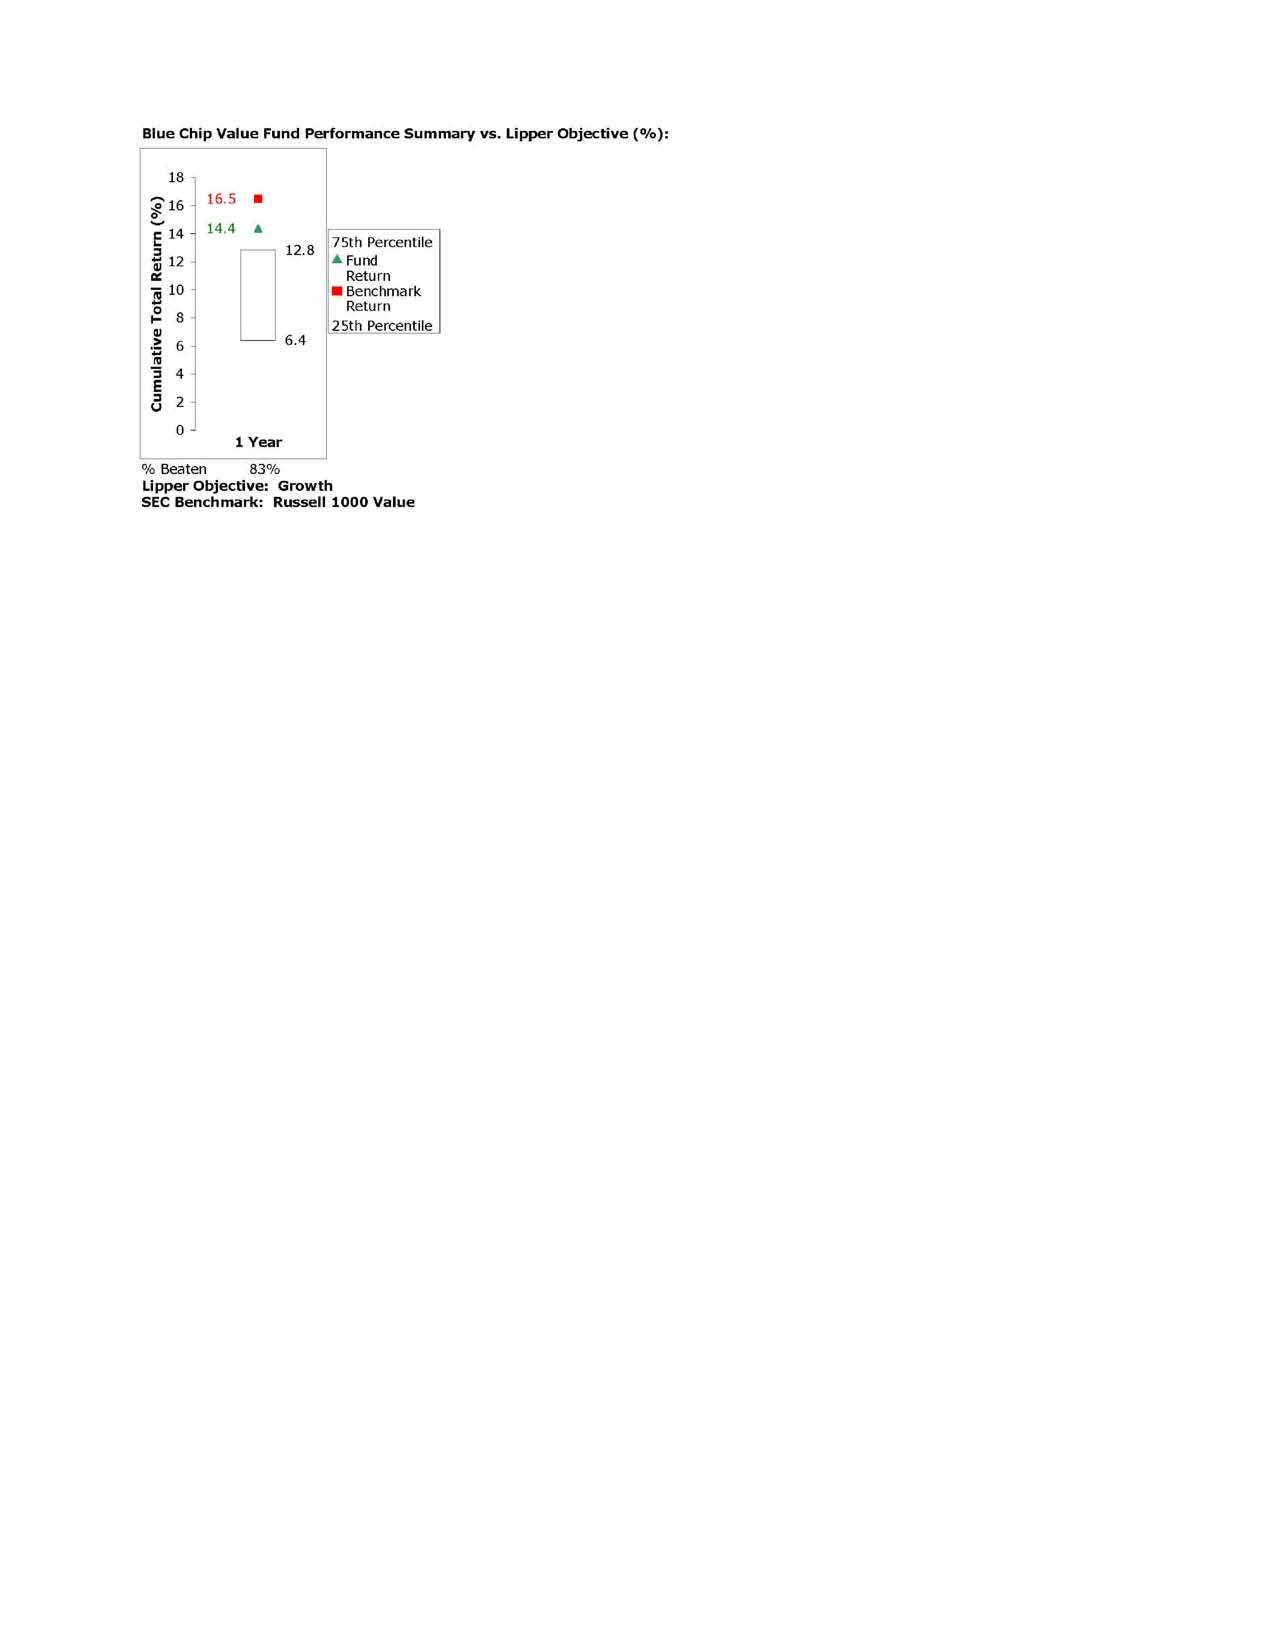
The Board reviewed the fund's relative investment performance against its Lipper peer group and stated that the performance of the fund was in the first quartile for the one-year period. The Board noted that FMR does not consider that Lipper peer group to be a meaningful comparison for the fund, however, because the peer group includes funds with different investment mandates (some broader, some narrower) than the fund. For example, the peer group includes funds that are not limited to a particular investment style, funds that focus on growth-oriented stocks, and funds that (like the fund) focus their investments on value-oriented securities. The Board also stated that the relative investment performance of the fund was lower than its benchmark for the one-year period. The Board stated that it is difficult to evaluate in any comprehensive fashion the performance of the fund, in light of its relatively recent launch.
The Board also considered that the fund's management fee is subject to upward or downward adjustment depending upon whether, and to what extent, the fund's investment performance for the performance period exceeds, or is exceeded by, the record (over the same period) of a Board-approved performance adjustment index. The Board realizes that the performance adjustment provides FMR with a strong economic incentive to seek to achieve superior performance for the fund's shareholders and helps to more closely align the interests of FMR and the fund's shareholders.
The Board has had thorough discussions with FMR throughout the year about the Board's and FMR's concerns about equity research, equity fund performance, and compliance with internal policies governing gifts and entertainment. FMR has taken steps that it believes will refocus and strengthen equity research and equity portfolio management and compliance. The Board noted with favor FMR's recent reorganization of its senior management team and FMR's plans to dedicate additional resources to investment research, and participated in the process that led to those changes.
Annual Report
Based on its review, and giving particular weight to the nature and quality of the resources dedicated by the Investment Advisers to maintain and improve relative performance, the Board concluded that the nature, extent, and quality of the services provided by Fidelity will benefit the fund's shareholders, particularly in light of the Board's view that the fund's shareholders benefit from investing in a fund that is part of a large family of funds offering a variety of investment disciplines and services.
Competitiveness of Management Fee and Total Fund Expenses. The Board considered the fund's management fee and total expenses compared to "mapped groups" of competitive funds and classes. Fidelity creates "mapped groups" by combining similar Lipper investment objective categories that have comparable management fee characteristics. Combining Lipper investment objective categories aids the Board's management fee and total expense comparisons by broadening the competitive group used for comparison and by reducing the number of universes to which various Fidelity funds are compared.
The Board considered two proprietary management fee comparisons for the 12-month (or shorter) periods shown in the chart below. The group of Lipper funds used by the Board for management fee comparisons is referred to below as the "Total Mapped Group" and, for the reasons explained above, is broader than the Lipper peer group used by the Board for performance comparisons. The Total Mapped Group comparison focuses on a fund's standing relative to the total universe of comparable funds available to investors, in terms of gross management fees before expense reimbursements or caps. "TMG %" represents the percentage of funds in the Total Mapped Group that had management fees that were lower than the fund's. For example, a TMG % of 15% means that 85% of the funds in the Total Mapped Group had higher management fees than the fund. The "Asset-Size Peer Group" (ASPG) comparison focuses on a fund's standing relative to non-Fidelity funds similar in size to the fund within the Total Mapped Group. The ASPG represents at least 15% of the funds in the Total Mapped Group with comparable asset size and management fee characteristics, subject to a minimum of 50 funds (or all funds in the Total Mapped Group if fewer than 50). Additional information, such as the ASPG quartile ("quadrant") in which the fund's management fee ranked and the impact of the fund's performance adjustment, is also included in the chart and considered by the Board.
Annual Report
Board Approval of Investment Advisory Contracts and
Management Fees - continued
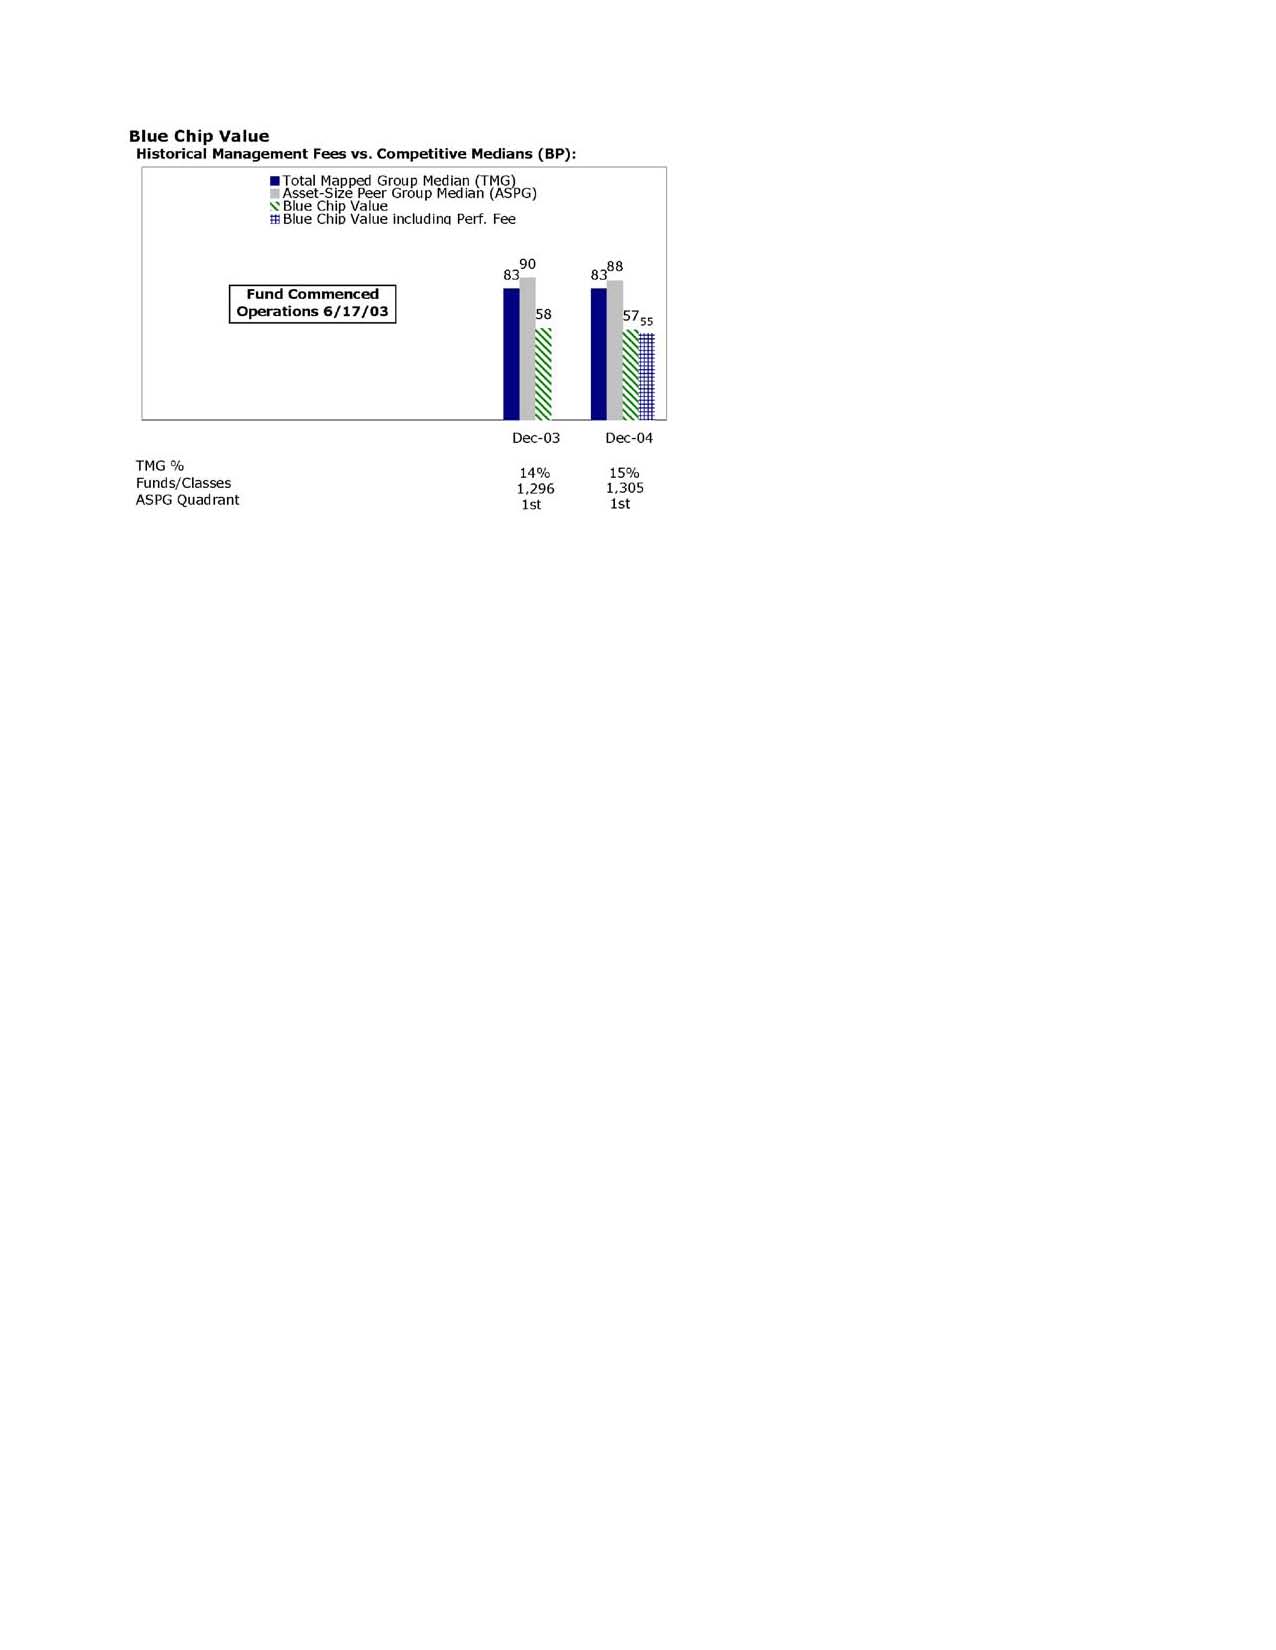
The Board noted that the fund's management fee ranked below the median of its Total Mapped Group and below the median of its ASPG for 2004. The Board also noted the effect of the fund's negative performance adjustment on the fund's management fee ranking.
Based on its review, the Board concluded that the fund's management fee was fair and reasonable in light of the services that the fund receives and the other factors considered.
In its review of the fund's total expenses, the Board considered the fund's management fee as well as other fund expenses, such as transfer agent fees, pricing and bookkeeping fees, and custodial, legal, and audit fees. The Board also noted the effects of any waivers and reimbursements on fees and expenses, as well as the fund's negative performance adjustment. As part of its review, the Board also considered current and historical total expenses of the fund compared to competitive fund median expenses. The fund is compared to those funds and classes in the Total Mapped Group (used by the Board for management fee comparisons) that have a similar sales load structure.
The Board noted that the fund's total expenses ranked below its competitive median for 2004.
In its review of total expenses, the Board also considered Fidelity fee structures and other information on clients that FMR and its affiliates service in other competitive markets, such as other mutual funds advised or subadvised by FMR or its affiliates, pension plan clients, and other institutional clients.
Annual Report
Based on its review, the Board concluded that the fund's total expenses were reasonable in light of the services that the fund and its shareholders receive and the other factors considered.
Costs of the Services and Profitability. The Board considered the revenues earned and the expenses incurred by Fidelity in conducting the business of developing, marketing, distributing, managing, administering and servicing the fund and its shareholders. The Board also considered the level of Fidelity's profits in respect of all the Fidelity funds.
On an annual basis, FMR presents to the Board Fidelity's profitability for the fund. Fidelity calculates the profitability for each fund, as well as aggregate profitability for groups of Fidelity funds and all Fidelity funds, using a series of detailed revenue and cost allocation methodologies which originate with the audited books and records of Fidelity. The Audit Committee of the Board reviews any significant changes from the prior year's methodologies.
PricewaterhouseCoopers LLP (PwC), independent registered accounting firm and auditor to Fidelity and certain Fidelity funds, has been engaged annually by the Board as part of the Board's assessment of the results of Fidelity's profitability analysis. PwC's engagement includes the review and assessment of Fidelity's methodologies used in determining the revenues and expenses attributable to Fidelity's mutual fund business, and completion of agreed-upon procedures surrounding the mathematical accuracy of fund profitability and its conformity to allocation methodologies. After considering PwC's reports issued under the engagement and information provided by Fidelity, the Board believes that while other allocation methods may also be reasonable, Fidelity's profitability methodologies are reasonable in all material respects.
The Board has also reviewed Fidelity's non-fund businesses and any fall-out benefits related to the mutual fund business as well as cases where Fidelity's affiliates may benefit from or be related to the fund's business. In addition, a special committee of the Board reviewed services provided to Fidelity by its affiliates and determined that the fees that Fidelity paid for such services were reasonable.
The Board considered the costs of the services provided by and the profits realized by Fidelity in connection with the operation of the fund and determined that the amount of profit is a fair entrepreneurial profit for the management of the fund.
Economies of Scale. The Board considered whether there have been economies of scale in respect of the management of the Fidelity funds, whether the Fidelity funds (including the fund) have appropriately benefited from any such economies of scale, and whether there is potential for realization of any further economies of scale. The Board considered the extent to which the fund will benefit from economies of scale through increased services to the fund, through waivers or reimbursements, or through fee or expense reductions, including reductions that occur through operation of the transfer agent agreement. The transfer agent fee varies in part based on the number of accounts in the fund. If the number of accounts decreases or the average account size increases, the overall transfer agent fee rate decreases.
Annual Report
Board Approval of Investment Advisory Contracts and
Management Fees - continued
The Board recognized that the fund's management contract incorporates a "group fee" structure, which provides for lower fee rates as total fund assets under FMR's management increase, and for higher fee rates as total fund assets under FMR's management decrease. The Board considered that the group fee is designed to deliver the benefits of economies of scale to fund shareholders when total fund assets increase, even if assets of any particular fund are unchanged or have declined, because some portion of Fidelity's costs are attributable to services provided to all Fidelity funds, and all funds benefit if those costs can be allocated among more assets. The Board concluded that, given the group fee structure, fund shareholders will achieve a certain level of economies of scale as assets under FMR's management increase at the fund complex level, regardless of whether Fidelity achieves any such economies of scale.
The Board further concluded that any potential economies of scale are being shared between fund shareholders and Fidelity in an appropriate manner.
Additional Information Requested by the Board. In order to develop fully the factual basis for consideration of the Advisory Contracts, the Board requested additional information regarding (i) equity fund transfer agency fees; (ii) Fidelity's fund profitability methodology and the impact of various changes in the methodology over time; (iii) benefits to shareholders from economies of scale; (iv) composition and characteristics of various fund and industry data used in comparisons; and (v) compensation of portfolio managers and research analysts.
Based on its evaluation of all of the conclusions noted above, and after considering all material factors, the Board ultimately concluded that the existing advisory fee structures are fair and reasonable, and that the fund's existing Advisory Contracts should be renewed.
Annual Report
Managing Your Investments
Fidelity offers several ways to conveniently manage your personal investments via your telephone or PC. You can access your account information, conduct trades and research your investments 24 hours a day.
By Phone
Fidelity Automated Service Telephone provides a single toll-free number to access account balances, positions, quotes and trading. It's easy to navigate the service, and on your first call, the system will help you create a personal identification number (PIN) for security.
(phone_graphic)
Fidelity Automated
Service Telephone (FAST®)
1-800-544-5555
Press
1 For mutual fund and brokerage trading.
2 For quotes.*
3 For account balances and holdings.
4 To review orders and mutual
fund activity.
5 To change your PIN.
*0 To speak to a Fidelity representative.
By PC
Fidelity's web site on the Internet provides a wide range of information, including daily financial news, fund performance, interactive planning tools and news about Fidelity products and services.
(computer_graphic)
Fidelity's Web Site
www.fidelity.com
* When you call the quotes line, please remember that a fund's yield and return will vary and, except for money market funds, share price will also vary. This means that you may have a gain or loss when you sell your shares. There is no assurance that money market funds will be able to maintain a stable $1 share price; an investment in a money market fund is not insured or guaranteed by the U.S. government. Total returns are historical and include changes in share price, reinvestment of dividends and capital gains, and the effects of any sales charges.
Annual Report
To Visit Fidelity
For directions and hours,
please call 1-800-544-9797.
Arizona
7001 West Ray Road
Chandler, AZ
7373 N. Scottsdale Road
Scottsdale, AZ
California
815 East Birch Street
Brea, CA
1411 Chapin Avenue
Burlingame, CA
851 East Hamilton Avenue
Campbell, CA
19200 Von Karman Avenue
Irvine, CA
601 Larkspur Landing Circle
Larkspur, CA
10100 Santa Monica Blvd.
Los Angeles, CA
27101 Puerta Real
Mission Viejo, CA
73-575 El Paseo
Palm Desert, CA
251 University Avenue
Palo Alto, CA
123 South Lake Avenue
Pasadena, CA
16995 Bernardo Ctr. Drive
Rancho Bernardo, CA
1740 Arden Way
Sacramento, CA
7676 Hazard Center Drive
San Diego, CA
8 Montgomery Street
San Francisco, CA
3793 State Street
Santa Barbara, CA
21701 Hawthorne Boulevard
Torrance, CA
2001 North Main Street
Walnut Creek, CA
6300 Canoga Avenue
Woodland Hills, CA
Colorado
1625 Broadway
Denver, CO
9185 East Westview Road
Littleton, CO
Connecticut
48 West Putnam Avenue
Greenwich, CT
265 Church Street
New Haven, CT
300 Atlantic Street
Stamford, CT
29 South Main Street
West Hartford, CT
Delaware
222 Delaware Avenue
Wilmington, DE
Florida
4400 N. Federal Highway
Boca Raton, FL
121 Alhambra Plaza
Coral Gables, FL
2948 N. Federal Highway
Ft. Lauderdale, FL
1907 West State Road 434
Longwood, FL
8880 Tamiami Trail, North
Naples, FL
3550 Tamiami Trail, South
Sarasota, FL
1502 N. Westshore Blvd.
Tampa, FL
2465 State Road 7
Wellington, FL
3501 PGA Boulevard
West Palm Beach, FL
Georgia
3445 Peachtree Road, N.E.
Atlanta, GA
1000 Abernathy Road
Atlanta, GA
Illinois
One North LaSalle Street
Chicago, IL
875 North Michigan Ave.
Chicago, IL
1415 West 22nd Street
Oak Brook, IL
1700 East Golf Road
Schaumburg, IL
3232 Lake Avenue
Wilmette, IL
Indiana
4729 East 82nd Street
Indianapolis, IN
Kansas
5400 College Boulevard
Overland Park, KS
Maine
Three Canal Plaza
Portland, ME
Maryland
7315 Wisconsin Avenue
Bethesda, MD
One W. Pennsylvania Ave.
Towson, MD
Massachusetts
801 Boylston Street
Boston, MA
155 Congress Street
Boston, MA
300 Granite Street
Braintree, MA
44 Mall Road
Burlington, MA
405 Cochituate Road
Framingham, MA
416 Belmont Street
Worcester, MA
Michigan
500 E. Eisenhower Pkwy.
Ann Arbor, MI
280 Old N. Woodward Ave.
Birmingham, MI
43420 Grand River Avenue
Novi, MI
29155 Northwestern Hwy.
Southfield, MI
Minnesota
7600 France Avenue South
Edina, MN
Missouri
8885 Ladue Road
Ladue, MO
Annual Report
Nevada
2225 Village Walk Drive
Henderson, NV
New Jersey
150 Essex Street
Millburn, NJ
56 South Street
Morristown, NJ
396 Route 17, North
Paramus, NJ
3518 Route 1 North
Princeton, NJ
530 Highway 35
Shrewsbury, NJ
New York
1055 Franklin Avenue
Garden City, NY
37 West Jericho Turnpike
Huntington Station, NY
1271 Avenue of the Americas
New York, NY
61 Broadway
New York, NY
350 Park Avenue
New York, NY
200 Fifth Avenue
New York, NY
733 Third Avenue
New York, NY
11 Penn Plaza
New York, NY
2070 Broadway
New York, NY
1075 Northern Blvd.
Roslyn, NY
North Carolina
4611 Sharon Road
Charlotte, NC
Ohio
3805 Edwards Road
Cincinnati, OH
1324 Polaris Parkway
Columbus, OH
28699 Chagrin Boulevard
Woodmere Village, OH
Oregon
16850 SW 72nd Avenue
Tigard, OR
Pennsylvania
600 West DeKalb Pike
King of Prussia, PA
1735 Market Street
Philadelphia, PA
12001 Perry Highway
Wexford, PA
Rhode Island
47 Providence Place
Providence, RI
Tennessee
6150 Poplar Avenue
Memphis, TN
Texas
10000 Research Boulevard
Austin, TX
4001 Northwest Parkway
Dallas, TX
12532 Memorial Drive
Houston, TX
2701 Drexel Drive
Houston, TX
6500 N. MacArthur Blvd.
Irving, TX
6005 West Park Boulevard
Plano, TX
14100 San Pedro
San Antonio, TX
1576 East Southlake Blvd.
Southlake, TX
19740 IH 45 North
Spring, TX
Utah
215 South State Street
Salt Lake City, UT
Virginia
1861 International Drive
McLean, VA
Washington
411 108th Avenue, N.E.
Bellevue, WA
1518 6th Avenue
Seattle, WA
Washington, DC
1900 K Street, N.W.
Washington, DC
Wisconsin
595 North Barker Road
Brookfield, WI
Fidelity Brokerage Services, Inc., 100 Summer St., Boston, MA 02110 Member NYSE/SIPC
Annual Report
To Write Fidelity
We'll give your correspondence immediate attention and send you written confirmation upon completion of your request.
(letter_graphic)
Making Changes
To Your Account
(such as changing name, address, bank, etc.)
Fidelity Investments
P.O. Box 770001
Cincinnati, OH 45277-0002
(letter_graphic)
For Non-Retirement
Accounts
Buying shares
Fidelity Investments
P.O. Box 770001
Cincinnati, OH 45277-0003
Overnight Express
Fidelity Investments
Attn: Distribution Services
100 Crosby Parkway - KC1H
Covington, KY 41015
Selling shares
Fidelity Investments
P.O. Box 770001
Cincinnati, OH 45277-0035
Overnight Express
Fidelity Investments
Attn: Distribution Services
100 Crosby Parkway - KC1H
Covington, KY 41015
General Correspondence
Fidelity Investments
P.O. Box 500
Merrimack, NH 03054-0500
(letter_graphic)
For Retirement
Accounts
Buying shares
Fidelity Investments
P.O. Box 770001
Cincinnati, OH 45277-0003
Selling shares
Fidelity Investments
P.O. Box 770001
Cincinnati, OH 45277-0035
Overnight Express
Fidelity Investments
Attn: Distribution Services
100 Crosby Parkway - KC1H
Covington, KY 41015
General Correspondence
Fidelity Investments
P.O. Box 500
Merrimack, NH 03054-0500
Annual Report
Annual Report
Annual Report
Annual Report
Investment Adviser
Fidelity Management & Research Company
Boston, MA
Investment Sub-Advisers
FMR Co., Inc.
Fidelity Management & Research
(Far East) Inc.
Fidelity Management & Research
(U.K.) Inc.
Fidelity Investments Japan Limited
Fidelity International Investment
Advisors
Fidelity International Investment
Advisors (U.K.) Inc. Limited
General Distributor
Fidelity Distributors Corporation
Boston, MA
Transfer and Service Agent
Fidelity Service Company, Inc.
Boston, MA
Custodian
Brown Brothers Harriman & Co.
Boston, MA
The Fidelity Telephone Connection
Mutual Fund 24-Hour Service
Exchanges/Redemptions
and Account Assistance 1-800-544-6666
Product Information 1-800-544-6666
Retirement Accounts 1-800-544-4774
(8 a.m. - 9 p.m.)
TDD Service 1-800-544-0118
for the deaf and hearing impaired
(9 a.m. - 9 p.m. Eastern time)
Fidelity Automated Service
Telephone (FAST®) (automated graphic) 1-800-544-5555
(automated graphic) Automated line for quickest service
BCV-UANN-0905
1.789709.102
(Fidelity Investment logo)(registered trademark)
Corporate Headquarters
82 Devonshire St., Boston, MA 02109
www.fidelity.com
Fidelity®
Dividend Growth
Fund
Annual Report
July 31, 2005
(2_fidelity_logos) (Registered_Trademark)
Contents
Chairman's Message | <Click Here> | Ned Johnson's message to shareholders. |
Performance | <Click Here> | How the fund has done over time. |
Management's Discussion | <Click Here> | The manager's review of fund performance, strategy and outlook. |
Shareholder Expense Example | <Click Here> | An example of shareholder expenses. |
Investment Changes | <Click Here> | A summary of major shifts in the fund's investments over the past six months. |
Investments | <Click Here> | A complete list of the fund's investments with their market values. |
Financial Statements | <Click Here> | Statements of assets and liabilities, operations, and changes in net assets,
as well as financial highlights. |
Notes | <Click Here> | Notes to the financial statements. |
Report of Independent Registered Public Accounting Firm | <Click Here> | |
Trustees and Officers | <Click Here> | |
Distributions | <Click Here> | |
Board Approval of Investment Advisory Contracts and Management Fees | <Click Here> | |
To view a fund's proxy voting guidelines and proxy voting record for the 12-month period ended June 30, visit www.fidelity.com/proxyvotingresults or visit the Securities and Exchange Commission's (SEC) web site at www.sec.gov. You may also call 1-800-544-8544 to request a free copy of the proxy voting guidelines.
Standard & Poor's, S&P and S&P 500 are registered service marks of The McGraw-Hill Companies, Inc. and have been licensed for use by Fidelity Distributors Corporation.
Other third party marks appearing herein are the property of their respective owners.
All other marks appearing herein are registered or unregistered trademarks or service marks of FMR Corp. or an affiliated company.
Annual Report
This report and the financial statements contained herein are submitted for the general information of the shareholders of the fund. This report is not authorized for distribution to prospective investors in the fund unless preceded or accompanied by an effective prospectus.
A fund files its complete schedule of portfolio holdings with the SEC for the first and third quarters of each fiscal year on Form N-Q. Forms N-Q are available on the SEC's web site at http://www.sec.gov. A fund's Forms N-Q may be reviewed and copied at the SEC's Public Reference Room in Washington, DC. Information regarding the operation of the SEC's Public Reference Room may be obtained by calling 1-800-SEC-0330. For a complete list of a fund's portfolio holdings, view the most recent quarterly holdings report, semiannual report, or annual report on Fidelity's web site at http://www.fidelity.com/holdings.
NOT FDIC INSURED · MAY LOSE VALUE · NO BANK GUARANTEE
Neither the fund nor Fidelity Distributors Corporation is a bank.
Annual Report
Chairman's Message
(photo_of_Edward_C_Johnson_3d)
Dear Shareholder:
During the past year or so, much has been reported about the mutual fund industry, and much of it has been more critical than I believe is warranted. Allegations that some companies have been less than forthright with their shareholders have cast a shadow on the entire industry. I continue to find these reports disturbing, and assert that they do not create an accurate picture of the industry overall. Therefore, I would like to remind everyone where Fidelity stands on these issues. I will say two things specifically regarding allegations that some mutual fund companies were in violation of the Securities and Exchange Commission's forward pricing rules or were involved in so-called "market timing" activities.
First, Fidelity has no agreements that permit customers who buy fund shares after 4 p.m. to obtain the 4 p.m. price. This is not a new policy. This is not to say that someone could not deceive the company through fraudulent acts. However, we are extremely diligent in preventing fraud from occurring in this manner - and in every other. But I underscore again that Fidelity has no so-called "agreements" that sanction illegal practices.
Second, Fidelity continues to stand on record, as we have for years, in opposition to predatory short-term trading that adversely affects shareholders in a mutual fund. Back in the 1980s, we initiated a fee - which is returned to the fund and, therefore, to investors - to discourage this activity. Further, we took the lead several years ago in developing a Fair Value Pricing Policy to prevent market timing on foreign securities in our funds. I am confident we will find other ways to make it more difficult for predatory traders to operate. However, this will only be achieved through close cooperation among regulators, legislators and the industry.
Yes, there have been unfortunate instances of unethical and illegal activity within the mutual fund industry from time to time. That is true of any industry. When this occurs, confessed or convicted offenders should be dealt with appropriately. But we are still concerned about the risk of over-regulation and the quick application of simplistic solutions to intricate problems. Every system can be improved, and we support and applaud well thought out improvements by regulators, legislators and industry representatives that achieve the common goal of building and protecting the value of investors' holdings.
For nearly 60 years, Fidelity has worked very hard to improve its products and service to justify your trust. When our family founded this company in 1946, we had only a few hundred customers. Today, we serve more than 18 million customers including individual investors and participants in retirement plans across America.
Let me close by saying that we do not take your trust in us for granted, and we realize that we must always work to improve all aspects of our service to you. In turn, we urge you to continue your active participation with your financial matters, so that your interests can be well served.
Best regards,
/s/Edward C. Johnson 3d
Edward C. Johnson 3d
Annual Report
Performance: The Bottom Line
Average annual total return reflects the change in the value of an investment, assuming reinvestment of the fund's dividend income and capital gains (the profits earned upon the sale of securities that have grown in value) and assuming a constant rate of performance each year. The $10,000 table and the fund's returns do not reflect the deduction of taxes that a shareholder would pay on fund distributions or the redemption of fund shares. During periods of reimbursement by Fidelity, a fund's total return will be greater than it would be had the reimbursement not occurred. How a fund did yesterday is no guarantee of how it will do tomorrow.
Average Annual Total Returns
Periods ended July 31, 2005 | Past 1
year | Past 5
years | Past 10
years |
Fidelity® Dividend Growth Fund | 10.08% | 1.29% | 11.48% |
$10,000 Over 10 Years
Let's say hypothetically that $10,000 was invested in Fidelity® Dividend Growth Fund on July 31, 1994. The chart shows how the value of your investment would have changed, and also shows how the Standard & Poor's 500SM Index performed over the same period.

Annual Report
Management's Discussion of Fund Performance
Comments from Charles Mangum, Portfolio Manager of Fidelity® Dividend Growth Fund
A late-inning rally on Wall Street helped push some key U.S. equity indexes to four-year highs by the conclusion of the 12-month period ending July 31, 2005. Spurred on by bullish economic data and strong corporate earnings, investors enjoyed a stellar month of July, capping off a turbulent 12-month period for U.S. equity markets. Stock prices bounced up and down during most of the year, moving in cadence with gyrations in the price of crude oil and investors' gathering and ebbing concerns about inflation. The Federal Reserve Board raised short-term interest rates eight times during the period, also affecting overall market sentiment. Despite their fluctuations, the major equity indexes finished on a high note, with the Standard & Poor's 500SM Index and the NASDAQ Composite® Index posting gains of 14.05% and 16.51%, respectively, for the period. The small-cap Russell 2000® Index rose 24.78% and the Russell Midcap® Index jumped 28.93%, while the blue-chips' Dow Jones Industrial AverageSM advanced only 7.29%.
For the 12-month period ending July 31, 2005, Fidelity Dividend Growth Fund gained 10.08%, but fell short of both the Standard & Poor's 500 Index and the LipperSM Growth Funds Average, which advanced 15.92%. Unfortunate stock picking was the primary reason for the fund's lagging performance relative to the index, with company-specific issues surrounding three individual stocks - mortgage underwriter Fannie Mae, financial services giant American International Group, and media and entertainment outlet Clear Channel Communications - accounting for most of the shortfall. The fund was significantly underweighted in the high-flying energy sector and thus not in a position to gain the full benefit of its strength. However, the fund's holdings in several high-volatility, growth-oriented energy equipment and services names - among them oil drillers such as Diamond Offshore Drilling - did quite well during the period, virtually offsetting the negative effect of the large underweighting in energy. Upside performance was led by pharmaceuticals and health care equipment distributor Cardinal Health and national drug store chain CVS.
The views expressed in this statement reflect those of the portfolio manager only through the end of the period of the report as stated on the cover and do not necessarily represent the views of Fidelity or any other person in the Fidelity organization. Any such views are subject to change at any time based upon market or other conditions and Fidelity disclaims any responsibility to update such views. These views may not be relied on as investment advice and, because investment decisions for a Fidelity fund are based on numerous factors, may not be relied on as an indication of trading intent on behalf of any Fidelity fund.
Annual Report
Shareholder Expense Example
As a shareholder of the Fund, you incur two types of costs: (1) transaction costs, and (2) ongoing costs, including management fees and other Fund expenses. This Example is intended to help you understand your ongoing costs (in dollars) of investing in the Fund and to compare these costs with the ongoing costs of investing in other mutual funds.
The Example is based on an investment of $1,000 invested at the beginning of the period and held for the entire period (February 1, 2005 to July 31, 2005).
Actual Expenses
The first line of the table below provides information about actual account values and actual expenses. You may use the information in this line, together with the amount you invested, to estimate the expenses that you paid over the period. Simply divide your account value by $1,000.00 (for example, an $8,600 account value divided by $1,000.00 = 8.6), then multiply the result by the number in the first line under the heading entitled "Expenses Paid During Period" to estimate the expenses you paid on your account during this period. A small balance maintenance fee of $12.00 that is charged once a year may apply for certain accounts with a value of less than $2,000. This fee is not included in the table below. If it was, the estimate of expenses you paid during the period would be higher, and your ending account value lower, by this amount.
Hypothetical Example for Comparison Purposes
The second line of the table below provides information about hypothetical account values and hypothetical expenses based on the Fund's actual expense ratio and an assumed rate of return of 5% per year before expenses, which is not the Fund's actual return. The hypothetical account values and expenses may not be used to estimate the actual ending account balance or expenses you paid for the period. You may use this information to compare the ongoing costs of investing in the Fund and other funds. To do so, compare this 5% hypothetical example with the 5% hypothetical examples that appear in the share-holder reports of the other funds. A small balance maintenance fee of $12.00 that is charged once a year may apply for certain accounts with a value of less than $2,000. This fee is not included in the table below. If it was, the estimate of expenses you paid during the period would be higher, and your ending account value lower, by this amount.
Please note that the expenses shown in the table are meant to highlight your ongoing costs only and do not reflect any transaction costs. Therefore, the second line of the table is useful in comparing ongoing costs only, and will not help you determine the relative total costs of owning different funds.
| Beginning
Account Value
February 1, 2005 | Ending
Account Value
July 31, 2005 | Expenses Paid
During Period*
February 1, 2005
to July 31, 2005 |
Actual | $ 1,000.00 | $ 1,040.00 | $ 3.24 |
Hypothetical (5% return per year before expenses) | $ 1,000.00 | $ 1,021.62 | $ 3.21 |
* Expenses are equal to the Fund's annualized expense ratio of .64%; multiplied by the average account value over the period, multiplied by 181/365 (to reflect the one-half year period).
Annual Report
Investment Changes
Top Ten Stocks as of July 31, 2005 |
| % of fund's
net assets | % of fund's net assets
6 months ago |
Cardinal Health, Inc. | 6.2 | 5.5 |
Home Depot, Inc. | 6.0 | 5.4 |
American International Group, Inc. | 5.6 | 5.7 |
Microsoft Corp. | 5.1 | 5.1 |
Wyeth | 4.4 | 3.7 |
SBC Communications, Inc. | 4.4 | 4.1 |
General Electric Co. | 4.1 | 3.8 |
Clear Channel Communications, Inc. | 4.0 | 3.8 |
Pfizer, Inc. | 3.7 | 3.9 |
CVS Corp. | 2.4 | 2.4 |
| 45.9 | |
Top Five Market Sectors as of July 31, 2005 |
| % of fund's
net assets | % of fund's net assets
6 months ago |
Financials | 21.8 | 25.8 |
Information Technology | 18.0 | 16.3 |
Health Care | 16.8 | 16.1 |
Consumer Discretionary | 12.6 | 10.6 |
Industrials | 9.4 | 8.5 |
Asset Allocation (% of fund's net assets) |
As of July 31, 2005* | As of January 31, 2005** |
| Stocks 97.9% | | | Stocks 97.3% | |
 | Convertible
Securities 0.1% | | | Convertible
Securities 0.6% | |
| Short-Term
Investments and
Net Other Assets 2.0% | | | Short-Term
Investments and
Net Other Assets 2.1% | |
* Foreign
investments | 2.6% | | ** Foreign
investments | 2.7% | |

Annual Report
Investments July 31, 2005
Showing Percentage of Net Assets
Common Stocks - 97.9% |
| Shares | | Value (Note 1) (000s) |
CONSUMER DISCRETIONARY - 12.6% |
Hotels, Restaurants & Leisure - 0.7% |
Carnival Corp. unit | 423,100 | | $ 22,170 |
McDonald's Corp. | 2,966,800 | | 92,475 |
Royal Caribbean Cruises Ltd. | 376,500 | | 17,112 |
| | 131,757 |
Media - 5.5% |
Cablevision Systems Corp. - NY Group Class A (a) | 882,000 | | 27,316 |
Clear Channel Communications, Inc. | 21,360,940 | | 697,221 |
E.W. Scripps Co. Class A | 198,600 | | 10,035 |
News Corp. Class A | 7,255,800 | | 118,850 |
Omnicom Group, Inc. | 703,400 | | 59,698 |
Tribune Co. | 1,197,900 | | 43,723 |
Univision Communications, Inc. Class A (a) | 100,300 | | 2,836 |
| | 959,679 |
Specialty Retail - 6.4% |
Home Depot, Inc. | 23,995,000 | | 1,044,022 |
Ross Stores, Inc. | 399,176 | | 10,578 |
TJX Companies, Inc. | 2,249,100 | | 52,876 |
| | 1,107,476 |
TOTAL CONSUMER DISCRETIONARY | | 2,198,912 |
CONSUMER STAPLES - 7.4% |
Beverages - 0.5% |
PepsiCo, Inc. | 1,757,790 | | 95,852 |
Food & Staples Retailing - 4.4% |
CVS Corp. | 13,221,100 | | 410,251 |
Safeway, Inc. | 7,476,300 | | 181,674 |
Wal-Mart Stores, Inc. | 3,437,400 | | 169,636 |
| | 761,561 |
Household Products - 0.3% |
Colgate-Palmolive Co. | 864,100 | | 45,745 |
Personal Products - 0.6% |
Alberto-Culver Co. | 2,490,745 | | 112,382 |
Tobacco - 1.6% |
Altria Group, Inc. | 4,060,900 | | 271,918 |
TOTAL CONSUMER STAPLES | | 1,287,458 |
Common Stocks - continued |
| Shares | | Value (Note 1) (000s) |
ENERGY - 4.3% |
Energy Equipment & Services - 2.8% |
Diamond Offshore Drilling, Inc. | 2,208,600 | | $ 126,023 |
ENSCO International, Inc. | 2,044,294 | | 82,549 |
GlobalSantaFe Corp. | 3,349,879 | | 150,711 |
Transocean, Inc. (a) | 2,389,500 | | 134,839 |
| | 494,122 |
Oil, Gas & Consumable Fuels - 1.5% |
ConocoPhillips | 3,420,400 | | 214,083 |
Exxon Mobil Corp. | 728,020 | | 42,771 |
| | 256,854 |
TOTAL ENERGY | | 750,976 |
FINANCIALS - 21.8% |
Capital Markets - 3.2% |
Goldman Sachs Group, Inc. | 2,002,900 | | 215,272 |
Merrill Lynch & Co., Inc. | 3,113,800 | | 183,029 |
Morgan Stanley | 2,240,500 | | 118,859 |
Nuveen Investments, Inc. Class A | 966,000 | | 36,708 |
| | 553,868 |
Commercial Banks - 3.6% |
Bank of America Corp. | 6,410,798 | | 279,511 |
Synovus Financial Corp. | 939,700 | | 27,787 |
Wachovia Corp. | 2,664,153 | | 134,220 |
Wells Fargo & Co. | 2,910,000 | | 178,499 |
| | 620,017 |
Consumer Finance - 0.3% |
Capital One Financial Corp. | 284,600 | | 23,480 |
MBNA Corp. | 950,100 | | 23,905 |
| | 47,385 |
Diversified Financial Services - 1.7% |
Citigroup, Inc. | 5,870,139 | | 255,351 |
JPMorgan Chase & Co. | 1,334,324 | | 46,888 |
| | 302,239 |
Insurance - 10.1% |
ACE Ltd. | 2,073,600 | | 95,821 |
AFLAC, Inc. | 392,400 | | 17,697 |
AMBAC Financial Group, Inc. | 1,401,200 | | 100,662 |
American International Group, Inc. | 16,294,200 | | 980,911 |
Common Stocks - continued |
| Shares | | Value (Note 1) (000s) |
FINANCIALS - continued |
Insurance - continued |
Hartford Financial Services Group, Inc. | 3,846,620 | | $ 309,922 |
MBIA, Inc. | 1,422,900 | | 86,427 |
MetLife, Inc. | 2,685,000 | | 131,941 |
MetLife, Inc. unit | 1,449,900 | | 40,119 |
| | 1,763,500 |
Thrifts & Mortgage Finance - 2.9% |
Fannie Mae | 5,533,234 | | 309,086 |
MGIC Investment Corp. | 1,743,400 | | 119,562 |
Washington Mutual, Inc. | 1,693,000 | | 71,919 |
| | 500,567 |
TOTAL FINANCIALS | | 3,787,576 |
HEALTH CARE - 16.8% |
Health Care Equipment & Supplies - 0.2% |
Medtronic, Inc. | 535,700 | | 28,896 |
Health Care Providers & Services - 6.2% |
Cardinal Health, Inc. | 18,176,470 | | 1,082,955 |
Pharmaceuticals - 10.4% |
Johnson & Johnson | 4,684,500 | | 299,621 |
Pfizer, Inc. | 23,808,100 | | 630,915 |
Schering-Plough Corp. | 5,151,300 | | 107,250 |
Wyeth | 16,791,060 | | 768,191 |
| | 1,805,977 |
TOTAL HEALTH CARE | | 2,917,828 |
INDUSTRIALS - 9.4% |
Aerospace & Defense - 1.5% |
Honeywell International, Inc. | 1,882,900 | | 73,960 |
Lockheed Martin Corp. | 1,031,200 | | 64,347 |
Northrop Grumman Corp. | 553,783 | | 30,707 |
United Technologies Corp. | 1,635,400 | | 82,915 |
| | 251,929 |
Commercial Services & Supplies - 0.3% |
ChoicePoint, Inc. (a) | 1,310,100 | | 57,120 |
Industrial Conglomerates - 6.6% |
3M Co. | 2,315,300 | | 173,648 |
Common Stocks - continued |
| Shares | | Value (Note 1) (000s) |
INDUSTRIALS - continued |
Industrial Conglomerates - continued |
General Electric Co. | 20,525,400 | | $ 708,126 |
Tyco International Ltd. | 8,850,800 | | 269,684 |
| | 1,151,458 |
Machinery - 0.7% |
Ingersoll-Rand Co. Ltd. Class A | 1,631,600 | | 127,542 |
Marine - 0.1% |
Alexander & Baldwin, Inc. | 275,616 | | 14,740 |
Road & Rail - 0.2% |
Burlington Northern Santa Fe Corp. | 190,600 | | 10,340 |
CSX Corp. | 460,800 | | 20,985 |
| | 31,325 |
TOTAL INDUSTRIALS | | 1,634,114 |
INFORMATION TECHNOLOGY - 17.9% |
Communications Equipment - 3.9% |
Cisco Systems, Inc. (a) | 20,463,400 | | 391,874 |
Comverse Technology, Inc. (a) | 1,921,500 | | 48,595 |
Lucent Technologies, Inc. warrants 12/10/07 (a) | 725,401 | | 530 |
Motorola, Inc. | 3,641,900 | | 77,135 |
Nokia Corp. sponsored ADR | 7,712,600 | | 123,016 |
QUALCOMM, Inc. | 1,102,200 | | 43,526 |
| | 684,676 |
Computers & Peripherals - 3.1% |
Dell, Inc. (a) | 5,861,800 | | 237,227 |
Hewlett-Packard Co. | 2,266,500 | | 55,801 |
International Business Machines Corp. | 2,931,300 | | 244,646 |
| | 537,674 |
Electronic Equipment & Instruments - 0.3% |
Flextronics International Ltd. (a) | 2,426,800 | | 32,859 |
Jabil Circuit, Inc. (a) | 329,300 | | 10,271 |
Solectron Corp. (a) | 675,600 | | 2,594 |
| | 45,724 |
IT Services - 0.1% |
Affiliated Computer Services, Inc. Class A (a) | 311,500 | | 15,566 |
Semiconductors & Semiconductor Equipment - 3.5% |
Analog Devices, Inc. | 317,200 | | 12,434 |
Applied Materials, Inc. | 6,546,000 | | 120,839 |
Common Stocks - continued |
| Shares | | Value (Note 1) (000s) |
INFORMATION TECHNOLOGY - continued |
Semiconductors & Semiconductor Equipment - continued |
Intel Corp. | 11,932,000 | | $ 323,834 |
KLA-Tencor Corp. | 757,500 | | 39,163 |
Lam Research Corp. (a) | 1,133,300 | | 32,242 |
Linear Technology Corp. | 215,400 | | 8,370 |
Novellus Systems, Inc. (a) | 722,700 | | 20,850 |
Taiwan Semiconductor Manufacturing Co. Ltd. sponsored ADR | 2,277,925 | | 19,567 |
United Microelectronics Corp. sponsored ADR | 6,080,176 | | 23,409 |
Xilinx, Inc. | 145,500 | | 4,125 |
| | 604,833 |
Software - 7.0% |
BEA Systems, Inc. (a) | 5,128,200 | | 46,461 |
Microsoft Corp. | 35,037,087 | | 897,300 |
Symantec Corp. (a) | 12,585,537 | | 276,504 |
| | 1,220,265 |
TOTAL INFORMATION TECHNOLOGY | | 3,108,738 |
MATERIALS - 0.3% |
Chemicals - 0.3% |
Praxair, Inc. | 1,033,500 | | 51,045 |
TELECOMMUNICATION SERVICES - 7.2% |
Diversified Telecommunication Services - 6.8% |
BellSouth Corp. | 5,787,100 | | 159,724 |
Qwest Communications International, Inc. (a) | 28,200,000 | | 107,724 |
SBC Communications, Inc. | 31,380,791 | | 767,260 |
Verizon Communications, Inc. | 4,481,650 | | 153,407 |
| | 1,188,115 |
Wireless Telecommunication Services - 0.4% |
Nextel Communications, Inc. Class A (a) | 1,970,400 | | 68,570 |
TOTAL TELECOMMUNICATION SERVICES | | 1,256,685 |
UTILITIES - 0.2% |
Electric Utilities - 0.2% |
PG&E Corp. | 1,174,400 | | 44,193 |
TOTAL COMMON STOCKS (Cost $15,330,508) | 17,037,525 |
Convertible Bonds - 0.1% |
| Principal Amount (000s) | | Value (Note 1) (000s) |
INFORMATION TECHNOLOGY - 0.1% |
Communications Equipment - 0.1% |
CIENA Corp. 3.75% 2/1/08 | $ 8,560 | | $ 7,587 |
TOTAL CONVERTIBLE BONDS (Cost $8,560) | 7,587 |
Money Market Funds - 2.3% |
| Shares | | |
Fidelity Cash Central Fund, 3.31% (b)
(Cost $399,316) | 399,315,559 | | 399,316 |
TOTAL INVESTMENT PORTFOLIO - 100.3% (Cost $15,738,384) | | 17,444,428 |
NET OTHER ASSETS - (0.3)% | | (45,836) |
NET ASSETS - 100% | $ 17,398,592 |
Legend |
(a) Non-income producing |
(b) Affiliated fund that is available only to investment companies and other accounts managed by Fidelity Investments. The rate quoted is the annualized seven-day yield of the fund at period end. A complete listing of the fund's holdings as of its most recent quarter end is available upon request. |
See accompanying notes which are an integral part of the financial statements.
Annual Report
Financial Statements
Statement of Assets and Liabilities
Amounts in thousands (except per-share amount) | July 31, 2005 |
| | |
Assets | | |
Investment in securities, at value (cost $15,738,384) - See accompanying schedule | | $ 17,444,428 |
Receivable for investments sold | | 52,470 |
Receivable for fund shares sold | | 13,852 |
Dividends receivable | | 22,665 |
Interest receivable | | 1,336 |
Prepaid expenses | | 30 |
Other affiliated receivables | | 26 |
Other receivables | | 1,096 |
Total assets | | 17,535,903 |
| | |
Liabilities | | |
Payable for investments purchased | $ 96,362 | |
Payable for fund shares redeemed | 31,441 | |
Accrued management fee | 5,853 | |
Other affiliated payables | 3,579 | |
Other payables and accrued expenses | 76 | |
Total liabilities | | 137,311 |
| | |
Net Assets | | $ 17,398,592 |
Net Assets consist of: | | |
Paid in capital | | $ 15,618,620 |
Undistributed net investment income | | 111,008 |
Accumulated undistributed net realized gain (loss) on investments and foreign currency transactions | | (37,080) |
Net unrealized appreciation (depreciation) on investments and assets and liabilities in foreign currencies | | 1,706,044 |
Net Assets, for 603,014 shares outstanding | | $ 17,398,592 |
Net Asset Value, offering price and redemption price per share ($17,398,592 ÷ 603,014 shares) | | $ 28.85 |
See accompanying notes which are an integral part of the financial statements.
Annual Report
Financial Statements - continued
Statement of Operations
Amounts in thousands | Year ended July 31, 2005 |
| | |
Investment Income | | |
Dividends | | $ 299,932 |
Special Dividends | | 106,976 |
Interest | | 12,855 |
Security lending | | 325 |
Total income | | 420,088 |
| | |
Expenses | | |
Management fee
Basic fee | $ 104,385 | |
Performance adjustment | (24,936) | |
Transfer agent fees | 41,053 | |
Accounting and security lending fees | 1,584 | |
Independent trustees' compensation | 96 | |
Appreciation in deferred trustee compensation account | 3 | |
Custodian fees and expenses | 280 | |
Registration fees | 102 | |
Audit | 145 | |
Legal | 42 | |
Miscellaneous | 161 | |
Total expenses before reductions | 122,915 | |
Expense reductions | (2,208) | 120,707 |
Net investment income (loss) | | 299,381 |
Realized and Unrealized Gain (Loss) Net realized gain (loss) on: | | |
Investment securities | 243,907 | |
Foreign currency transactions | 59 | |
Futures contracts | 11,990 | |
Total net realized gain (loss) | | 255,956 |
Change in net unrealized appreciation (depreciation) on: Investment securities | 1,190,068 | |
Assets and liabilities in foreign currencies | (16) | |
Futures contracts | 3,469 | |
Total change in net unrealized appreciation (depreciation) | | 1,193,521 |
Net gain (loss) | | 1,449,477 |
Net increase (decrease) in net assets resulting from operations | | $ 1,748,858 |
See accompanying notes which are an integral part of the financial statements.
Annual Report
Statement of Changes in Net Assets
Amounts in thousands | Year ended
July 31,
2005 | Year ended
July 31,
2004 |
Increase (Decrease) in Net Assets | | |
Operations | | |
Net investment income (loss) | $ 299,381 | $ 133,702 |
Net realized gain (loss) | 255,956 | 573,551 |
Change in net unrealized appreciation (depreciation) | 1,193,521 | 587,273 |
Net increase (decrease) in net assets resulting
from operations | 1,748,858 | 1,294,526 |
Distributions to shareholders from net investment income | (269,023) | (142,749) |
Share transactions
Proceeds from sales of shares | 3,009,735 | 5,305,733 |
Reinvestment of distributions | 260,163 | 137,933 |
Cost of shares redeemed | (5,738,004) | (3,945,945) |
Net increase (decrease) in net assets resulting from share transactions | (2,468,106) | 1,497,721 |
Total increase (decrease) in net assets | (988,271) | 2,649,498 |
| | |
Net Assets | | |
Beginning of period | 18,386,863 | 15,737,365 |
End of period (including undistributed net investment income of $111,008 and undistributed net investment income of $80,780, respectively) | $ 17,398,592 | $ 18,386,863 |
Other Information Shares | | |
Sold | 109,723 | 198,128 |
Issued in reinvestment of distributions | 9,419 | 5,341 |
Redeemed | (207,836) | (147,303) |
Net increase (decrease) | (88,694) | 56,166 |
See accompanying notes which are an integral part of the financial statements.
Annual Report
Financial Highlights
Years ended July 31, | 2005 | 2004 | 2003 | 2002 | 2001 |
Selected Per-Share Data | | | | | |
Net asset value, beginning of period | $ 26.58 | $ 24.76 | $ 22.20 | $ 29.75 | $ 30.90 |
Income from Investment Operations | | | | | |
Net investment income (loss) B | .45 C | .20 | .22 | .24 E | .16 |
Net realized and unrealized gain (loss) | 2.21 | 1.84 | 2.56 | (7.31) E | 1.27 |
Total from investment operations | 2.66 | 2.04 | 2.78 | (7.07) | 1.43 |
Distributions from net investment income | (.39) | (.22) | (.22) | (.15) | (.18) |
Distributions from net realized gain | - | - | - | (.33) | (2.40) |
Total distributions | (.39) | (.22) | (.22) | (.48) | (2.58) |
Net asset value, end of period | $ 28.85 | $ 26.58 | $ 24.76 | $ 22.20 | $ 29.75 |
Total Return A | 10.08% | 8.27% | 12.63% | (24.04)% | 4.58% |
Ratios to Average Net Assets D | | | | | |
Expenses before expense reductions | .68% | .90% | 1.05% | .98% | .97% |
Expenses net of voluntary waivers, if any | .68% | .90% | 1.05% | .98% | .97% |
Expenses net of all reductions | .66% | .89% | 1.02% | .95% | .94% |
Net investment income (loss) | 1.64% C | .75% | .94% | .90% E | .54% |
Supplemental Data | | | | | |
Net assets, end of period (in millions) | $ 17,399 | $ 18,387 | $ 15,737 | $ 12,648 | $ 14,463 |
Portfolio turnover rate | 26% | 37% | 51% | 81% | 88% |
A Total returns would have been lower had certain expenses not been reduced during the periods shown.
B Calculated based on average shares outstanding during the period.
C Investment income per share reflects a special dividend which amounted to $.16 per share. Excluding the special dividend, the ratio of net investment income to average net assets would have been 1.06%.
D Expense ratios reflect operating expenses of the fund. Expenses before reductions do not reflect amounts reimbursed by the investment adviser or reductions from brokerage service arrangements or other expense offset arrangements and do not represent the amount paid by the fund during periods when reimbursements or reductions occur. Expenses net of any voluntary waivers reflect expenses after reimbursement by the investment adviser but prior to reductions from brokerage service arrangements or other expense offset arrangements. Expenses net of all reductions represent the net expenses paid by the fund.
E Effective August 1, 2001, the fund adopted the provisions of the AICPA Audit and Accounting Guide for Investment Companies and began amortizing premium and discount on all debt securities. Per-share data and ratios for periods prior to adoption have not been restated to reflect this change.
See accompanying notes which are an integral part of the financial statements.
Annual Report
Notes to Financial Statements
For the period ended July 31, 2005
(Amounts in thousands except ratios)
1. Significant Accounting Policies.
Fidelity Dividend Growth Fund (the fund) is a fund of Fidelity Securities Fund (the trust) and is authorized to issue an unlimited number of shares. The trust is registered under the Investment Company Act of 1940, as amended (the 1940 Act), as an open-end management investment company organized as a Massachusetts business trust. The financial statements have been prepared in conformity with accounting principles generally accepted in the United States of America, which require management to make certain estimates and assumptions at the date of the financial statements. The following summarizes the significant accounting policies of the fund:
Security Valuation. Net asset value per share (NAV calculation) is calculated as of the close of business of the New York Stock Exchange, normally 4:00 p.m. Eastern time. Equity securities, including restricted securities, for which market quotations are available are valued at the last sale price or official closing price (closing bid price or last evaluated quote if no sale has occurred) on the primary market or exchange on which they trade. Debt securities, including restricted securities, for which quotations are readily available are valued at their most recent bid prices (sales prices if the principal market is an exchange) in the principal market in which such securities are normally traded, as determined by recognized dealers in such securities, or securities are valued on the basis of information provided by a pricing service. Pricing services use valuation matrices that incorporate both dealer-supplied valuations and valuation models. If prices are not readily available or do not accurately reflect fair value for a security, or if a security's value has been materially affected by events occurring after the close of the exchange or market on which the security is principally traded, that security may be valued by another method that the Board of Trustees believes accurately reflects fair value. A security's valuation may differ depending on the method used for determining value. Price movements in futures contracts and ADRs, market and trading trends, the bid/ask quotes of brokers and off-exchange institutional trading may be reviewed in the course of making a good faith determination of a security's fair value. Short-term securities with remaining maturities of sixty days or less for which quotations are not readily available are valued on the basis of amortized cost. Investments in open-end investment companies are valued at their net asset value each business day.
Foreign Currency. The fund uses foreign currency contracts to facilitate transactions in foreign-denominated securities. Losses from these transactions may arise from changes in the value of the foreign currency or if the counterparties do not perform under the contracts' terms.
Foreign-denominated assets, including investment securities, and liabilities are translated into U.S. dollars at the exchange rate at period end. Purchases and sales of investment securities, income and dividends received and expenses denominated in foreign currencies are translated into U.S. dollars at the exchange rate in effect on the transaction date.
Annual Report
Notes to Financial Statements - continued
(Amounts in thousands except ratios)
1. Significant Accounting Policies - continued
Foreign Currency - continued
The effects of exchange rate fluctuations on investments are included with the net realized and unrealized gain (loss) on investment securities. Other foreign currency transactions resulting in realized and unrealized gain (loss) are disclosed separately.
Investment Transactions and Income. Security transactions are accounted for as of trade date. Gains and losses on securities sold are determined on the basis of identified cost and may include proceeds received from litigation. Dividend income is recorded on the ex-dividend date, except for certain dividends from foreign securities where the ex-dividend date may have passed, which are recorded as soon as the fund is informed of the ex-dividend date. Non-cash dividends included in dividend income, if any, are recorded at the fair market value of the securities received. Distributions received on securities that represent a return of capital or capital gain are recorded as a reduction of cost of investments and/or as a realized gain. The fund estimates the components of distributions received that may be considered return of capital distributions or capital gain distributions. Large, non-recurring dividends recognized by the fund are presented separately on the Statement of Operations as "Special Dividends" and the impact of these dividends is presented in the Financial Highlights. Interest income is accrued as earned. Interest income includes coupon interest and amortization of premium and accretion of discount on debt securities. Investment income is recorded net of foreign taxes withheld where recovery of such taxes is uncertain.
Expenses. Most expenses of the trust can be directly attributed to a fund. Expenses which cannot be directly attributed are apportioned among each fund in the trust.
Deferred Trustee Compensation. Under a Deferred Compensation Plan (the Plan), independent Trustees must defer receipt of a portion of, and may elect to defer receipt of an additional portion of, their annual compensation. Deferred amounts are treated as though equivalent dollar amounts had been invested in shares of the fund or are invested in a cross-section of other Fidelity funds, and are marked-to-market. Deferred amounts remain in the fund until distributed in accordance with the Plan.
Income Tax Information and Distributions to Shareholders. Each year, the fund intends to qualify as a regulated investment company by distributing all of its taxable income and realized gains under Subchapter M of the Internal Revenue Code. As a result, no provision for income taxes is required in the accompanying financial statements. Foreign taxes are provided for based on the fund's understanding of the tax rules and rates that exist in the foreign markets in which it invests.
Annual Report
1. Significant Accounting Policies - continued
Income Tax Information and Distributions to Shareholders - continued
Distributions are recorded on the ex-dividend date. Income and capital gain distributions are determined in accordance with income tax regulations, which may differ from generally accepted accounting principles. In addition, the fund will claim a portion of the payment made to redeeming shareholders as a distribution for income tax purposes.
Capital accounts within the financial statements are adjusted for permanent book-tax differences. These adjustments have no impact on net assets or the results of operations. Temporary book-tax differences will reverse in a subsequent period.
Book-tax differences are primarily due to futures transactions, foreign currency transactions, market discount and losses deferred due to wash sales.
The tax-basis components of distributable earnings and the federal tax cost as of period end were as follows:
Unrealized appreciation | $ 2,648,714 | |
Unrealized depreciation | (1,044,862) | |
Net unrealized appreciation (depreciation) | 1,603,852 | |
Undistributed ordinary income | 95,971 | |
Undistributed long-term capital gain | 56,209 | |
| | |
Cost for federal income tax purposes | $ 15,840,576 | |
The tax character of distributions paid was as follows:
| July 31, 2005 | July 31, 2004 |
Ordinary Income | $ 269,023 | $ 142,749 |
2. Operating Policies.
Repurchase Agreements. Fidelity Management & Research Company (FMR) has received an Exemptive Order from the Securities and Exchange Commission (the SEC) which permits the fund and other affiliated entities of FMR to transfer uninvested cash balances into joint trading accounts which are then invested in repurchase agreements. The fund may also invest directly with institutions in repurchase agreements. Repurchase agreements are collateralized by government or non-government securities. Collateral is held in segregated accounts with custodian banks and may be obtained in the event of a default of the counterparty. The fund monitors, on a daily basis, the value of the collateral to ensure it is at least equal to the principal amount of the repurchase agreement (including accrued interest). In the event of a default by the counterparty, realization of the collateral proceeds could be delayed, during which time the value of the collateral may decline.
Annual Report
Notes to Financial Statements - continued
(Amounts in thousands except ratios)
2. Operating Policies - continued
Futures Contracts. The fund may use futures contracts to manage its exposure to the stock market. Buying futures tends to increase a fund's exposure to the underlying instrument, while selling futures tends to decrease a fund's exposure to the underlying instrument or hedge other fund investments. Losses may arise from changes in the value of the underlying instruments or if the counterparties do not perform under the contracts' terms. Gains (losses) are realized upon the expiration or closing of the futures contracts. Futures contracts are valued at the settlement price established each day by the board of trade or exchange on which they are traded.
3. Purchases and Sales of Investments.
Purchases and sales of securities, other than short-term securities and U.S. government securities, aggregated $4,590,302 and $6,478,605, respectively.
4. Fees and Other Transactions with Affiliates.
Management Fee. FMR and its affiliates provide the fund with investment management related services for which the fund pays a monthly management fee. The management fee is the sum of an individual fund fee rate that is based on an annual rate of .30% of the fund's average net assets and a group fee rate that averaged .27% during the period. The group fee rate is based upon the average net assets of all the mutual funds advised by FMR. The group fee rate decreases as assets under management increase and increases as assets under management decrease. In addition, the management fee is subject to a performance adjustment (up to a maximum of ±.20% of the fund's average net assets over a 36 month performance period). The upward or downward adjustment to the management fee is based on the fund's relative investment performance as compared to an appropriate benchmark index. For the period, the total annual management fee rate, including the performance adjustment, was .44% of the fund's average net assets.
Transfer Agent Fees. Fidelity Service Company, Inc. (FSC), an affiliate of FMR, is the fund's transfer, dividend disbursing and shareholder servicing agent. FSC receives account fees and asset-based fees that vary according to account size and type of account. FSC pays for typesetting, printing and mailing of shareholder reports, except proxy statements. For the period, the transfer agent fees were equivalent to an annual rate of .23% of average net assets.
Accounting and Security Lending Fees. FSC maintains the fund's accounting records. The accounting fee is based on the level of average net assets for the month. Under a separate contract, FSC administers the security lending program. The security lending fee is based on the number and duration of lending transactions.
Annual Report
4. Fees and Other Transactions with Affiliates - continued
Central Funds. The fund may invest in affiliated Central Funds managed by Fidelity Investments Money Management, Inc. (FIMM), an affiliate of FMR. The Central Funds are open-end investment companies available only to investment companies and other accounts managed by FMR and its affiliates. The Money Market Central Funds seek preservation of capital and current income. The Central Funds do not pay a management fee. Income distributions earned by the fund are recorded as income in the accompanying financial statements and totaled $12,011 for the period.
Brokerage Commissions. The fund placed a portion of its portfolio transactions with brokerage firms which are affiliates of the investment adviser. The commissions paid to these affiliated firms were $248 for the period.
5. Committed Line of Credit.
The fund participates with other funds managed by FMR in a $4.2 billion credit facility (the "line of credit") to be utilized for temporary or emergency purposes to fund shareholder redemptions or for other short-term liquidity purposes. The fund has agreed to pay commitment fees on its pro rata portion of the line of credit. During the period, there were no borrowings on this line of credit.
6. Security Lending.
The fund lends portfolio securities from time to time in order to earn additional income. The fund receives collateral (in the form of U.S. Treasury obligations, letters of credit and/or cash) against the loaned securities and maintains collateral in an amount not less than 100% of the market value of the loaned securities during the period of the loan. The market value of the loaned securities is determined at the close of business of the fund and any additional required collateral is delivered to the fund on the next business day. If the borrower defaults on its obligation to return the securities loaned because of insolvency or other reasons, a fund could experience delays and costs in recovering the securities loaned or in gaining access to the collateral. Cash collateral is invested in the Fidelity Securities Lending Cash Central Fund. At period end there were no security loans outstanding.
7. Expense Reductions.
Many of the brokers with whom FMR places trades on behalf of the fund provided services to the fund in addition to trade execution. These services included payments of certain expenses on behalf of the fund totaling $1,798 for the period. In addition, through arrangements with the fund's transfer agent, credits realized as a result of uninvested cash balances were used to reduce the fund's expenses. During the period, these credits reduced the fund's transfer agent expenses by $410.
Annual Report
Notes to Financial Statements - continued
(Amounts in thousands except ratios)
8. Other.
The fund's organizational documents provide former and current trustees and officers with a limited indemnification against liabilities arising in connection with the performance of their duties to the fund. In the normal course of business, the fund may also enter into contracts that provide general indemnifications. The fund's maximum exposure under these arrangements is unknown as this would be dependent on future claims that may be made against the fund. The risk of material loss from such claims is considered remote.
Annual Report
Report of Independent Registered Public Accounting Firm
To the Trustees of Fidelity Securities Fund and the Shareholders of Fidelity Dividend Growth Fund:
In our opinion, the accompanying statement of assets and liabilities, including the schedule of investments, and the related statements of operations and of changes in net assets and the financial highlights present fairly, in all material respects, the financial position of Fidelity Dividend Growth Fund (a fund of Fidelity Securities Fund) at July 31, 2005 and the results of its operations, the changes in its net assets and the financial highlights for the periods indicated, in conformity with accounting principles generally accepted in the United States of America. These financial statements and financial highlights (hereafter referred to as "financial statements") are the responsibility of the Fidelity Dividend Growth Fund's management; our responsibility is to express an opinion on these financial statements based on our audits. We conducted our audits of these financial statements in accordance with the standards of the Public Company Accounting Oversight Board (United States). Those standards require that we plan and perform the audit to obtain reasonable assurance about whether the financial statements are free of material misstatement. An audit includes examining, on a test basis, evidence supporting the amounts and disclosures in the financial statements, assessing the accounting principles used and significant estimates made by management, and evaluating the overall financial statement presentation. We believe that our audits, which included confirmation of securities at July 31, 2005 by correspondence with the custodian and brokers, provide a reasonable basis for our opinion.
/s/ PricewaterhouseCoopers LLP
PricewaterhouseCoopers LLP
Boston, Massachusetts
September 9, 2005
Annual Report
Trustees and Officers
The Trustees, Members of the Advisory Board, and executive officers of the trust and fund, as applicable, are listed below. The Board of Trustees governs the fund and is responsible for protecting the interests of shareholders. The Trustees are experienced executives who meet periodically throughout the year to oversee the fund's activities, review contractual arrangements with companies that provide services to the fund, and review the fund's performance. Except for William O. McCoy, Stephen P. Jonas, and Kenneth L. Wolfe, each of the Trustees oversees 319 funds advised by FMR or an affiliate. Mr. McCoy oversees 321 funds advised by FMR or an affiliate. Mr. Jonas and Mr. Wolfe oversee 310 funds advised by FMR or an affiliate.
The Trustees hold office without limit in time except that (a) any Trustee may resign; (b) any Trustee may be removed by written instrument, signed by at least two-thirds of the number of Trustees prior to such removal; (c) any Trustee who requests to be retired or who has become incapacitated by illness or injury may be retired by written instrument signed by a majority of the other Trustees; and (d) any Trustee may be removed at any special meeting of shareholders by a two-thirds vote of the outstanding voting securities of the trust. Each Trustee who is not an interested person (as defined in the 1940 Act) (Independent Trustee), shall retire not later than the last day of the calendar year in which his or her 72nd birthday occurs. The Independent Trustees may waive this mandatory retirement age policy with respect to individual Trustees. The executive officers and Advisory Board Members hold office without limit in time, except that any officer and Advisory Board Member may resign or may be removed by a vote of a majority of the Trustees at any regular meeting or any special meeting of the Trustees. Except as indicated, each individual has held the office shown or other offices in the same company for the past five years.
Interested Trustees*:
Correspondence intended for each Trustee who is an interested person may be sent to Fidelity Investments, 82 Devonshire Street, Boston, Massachusetts 02109.
Name, Age; Principal Occupation |
Edward C. Johnson 3d (75)** |
| Year of Election or Appointment: 1984 Mr. Johnson is Chairman of the Board of Trustees. Mr. Johnson serves as Chief Executive Officer, Chairman, and a Director of FMR Corp.; a Director and Chairman of the Board and of the Executive Committee of FMR; Chairman and a Director of Fidelity Management & Research (Far East) Inc.; Chairman and a Director of Fidelity Investments Money Management, Inc.; and Chairman (2001-present) and a Director (2000-present) of FMR Co., Inc. |
Abigail P. Johnson (43)** |
| Year of Election or Appointment: 2001 Ms. Johnson serves as President of Fidelity Employer Services Company (FESCO) (2005-present). She is President and a Director of Fidelity Investments Money Management, Inc. (2001-present), FMR Co., Inc. (2001-present), and a Director of FMR Corp. Previously, Ms. Johnson served as President and a Director of FMR (2001-2005), Senior Vice President of the Fidelity funds (2001-2005), and managed a number of Fidelity funds. |
Stephen P. Jonas (52) |
| Year of Election or Appointment: 2005 Mr. Jonas is Senior Vice President of Dividend Growth (2005-present). He also serves as Senior Vice President of other Fidelity funds (2005-present). Mr. Jonas is Executive Director of FMR (2005-present). Previously, Mr. Jonas served as President of Fidelity Enterprise Operations and Risk Services (2004-2005), Chief Administrative Officer (2002-2004), and Chief Financial Officer of FMR Co. (1998-2000). Mr. Jonas has been with Fidelity Investments since 1987 and has held various financial and management positions including Chief Financial Officer of FMR. In addition, he serves on the Boards of Boston Ballet (2003-present) and Simmons College (2003-present). |
Robert L. Reynolds (53) |
| Year of Election or Appointment: 2003 Mr. Reynolds is a Director (2003-present) and Chief Operating Officer (2002-present) of FMR Corp. He also serves on the Board at Fidelity Investments Canada, Ltd. (2000-present). Previously, Mr. Reynolds served as President of Fidelity Investments Institutional Retirement Group (1996-2000). |
* Trustees have been determined to be "Interested Trustees" by virtue of, among other things, their affiliation with the trust or various entities under common control with FMR.
** Edward C. Johnson 3d, Trustee, is Abigail P. Johnson's father.
Annual Report
Independent Trustees:
Correspondence intended for each Independent Trustee (that is, the Trustees other than the Interested Trustees) may be sent to Fidelity Investments, P.O. Box 55235, Boston, Massachusetts 02205-5235.
Name, Age; Principal Occupation |
Dennis J. Dirks (57) |
| Year of Election or Appointment: 2005 Prior to his retirement in May 2003, Mr. Dirks was Chief Operating Officer and a member of the Board of The Depository Trust & Clearing Corporation (DTCC) (1999-2003). He also served as President, Chief Operating Officer, and Board member of The Depository Trust Company (DTC) (1999-2003) and President and Board member of the National Securities Clearing Corporation (NSCC) (1999-2003). In addition, Mr. Dirks served as Chief Executive Officer and Board member of the Government Securities Clearing Corporation (2001-2003) and Chief Executive Officer and Board member of the Mortgage-Backed Securities Clearing Corporation (2001-2003). Mr. Dirks also serves as a Trustee of Manhattan College (2005-present). |
Robert M. Gates (61) |
| Year of Election or Appointment: 1997 Dr. Gates is Vice Chairman of the Independent Trustees (2005-present). Dr. Gates is President of Texas A&M University (2002-present). He was Director of the Central Intelligence Agency (CIA) from 1991 to 1993. From 1989 to 1991, Dr. Gates served as Assistant to the President of the United States and Deputy National Security Advisor. Dr. Gates is a Director of NACCO Industries, Inc. (mining and manufacturing), Parker Drilling Co., Inc. (drilling and rental tools for the energy industry, 2001-present), and Brinker International (restaurant management, 2003-present). Previously, Dr. Gates served as a Director of LucasVarity PLC (automotive components and diesel engines), a Director of TRW Inc. (automotive, space, defense, and information technology), and Dean of the George Bush School of Government and Public Service at Texas A&M University (1999-2001). Dr. Gates also is a Trustee of the Forum for International Policy. |
George H. Heilmeier (69) |
| Year of Election or Appointment: 2004 Dr. Heilmeier is Chairman Emeritus of Telcordia Technologies (communication software and systems), where prior to his retirement, he served as company Chairman and Chief Executive Officer. He currently serves on the Boards of Directors of The Mitre Corporation (systems engineering and information technology support for the government), and HRL Laboratories (private research and development, 2004-present). He is Chairman of the General Motors Science & Technology Advisory Board and a Life Fellow of the Institute of Electrical and Electronics Engineers (IEEE) (2000-present). Dr. Heilmeier is a member of the Defense Science Board and the National Security Agency Advisory Board. He is also a member of the National Academy of Engineering, the American Academy of Arts and Sciences, and the Board of Overseers of the School of Engineering and Applied Science of the University of Pennsylvania. Previously, Dr. Heilmeier served as a Director of TRW Inc. (automotive, space, defense, and information technology, 1992-2002), Compaq (1994-2002), Automatic Data Processing, Inc. (ADP) (technology-based business outsourcing, 1995-2002), INET Technologies Inc. (telecommunications network surveillance, 2001-2004), and Teletech Holdings (customer management services). He is the recipient of the 2005 Kyoto Prize in Advanced Technology for his invention of the liquid display. |
Marie L. Knowles (58) |
| Year of Election or Appointment: 2001 Prior to Ms. Knowles' retirement in June 2000, she served as Executive Vice President and Chief Financial Officer of Atlantic Richfield Company (ARCO) (diversified energy, 1996-2000). From 1993 to 1996, she was a Senior Vice President of ARCO and President of ARCO Transportation Company. She served as a Director of ARCO from 1996 to 1998. She currently serves as a Director of Phelps Dodge Corporation (copper mining and manufacturing) and McKesson Corporation (healthcare service, 2002-present). Ms. Knowles is a Trustee of the Brookings Institution and the Catalina Island Conservancy and also serves as a member of the Advisory Board for the School of Engineering of the University of Southern California. |
Ned C. Lautenbach (61) |
| Year of Election or Appointment: 2000 Mr. Lautenbach has been a partner of Clayton, Dubilier & Rice, Inc. (private equity investment firm) since September 1998. Previously, Mr. Lautenbach was with the International Business Machines Corporation (IBM) from 1968 until his retirement in 1998. Mr. Lautenbach serves as a Director of Italtel Holding S.p.A. (telecommunications (Milan, Italy), 2004-present) and Eaton Corporation (diversified industrial) as well as the Philharmonic Center for the Arts in Naples, Florida. He also is a member of the Board of Trustees of Fairfield University (2005-present), as well as a member of the Council on Foreign Relations. |
Marvin L. Mann (72) |
| Year of Election or Appointment: 1993 Mr. Mann is Chairman of the Independent Trustees (2001-present). He is Chairman Emeritus of Lexmark International, Inc. (computer peripherals), where he served as CEO until April 1998, retired as Chairman May 1999, and remains a member of the Board. Prior to 1991, he held the positions of Vice President of International Business Machines Corporation (IBM) and President and General Manager of various IBM divisions and subsidiaries. He is a member of the Executive Committee of the Independent Director's Council of the Investment Company Institute. In addition, Mr. Mann is a member of the President's Cabinet at the University of Alabama and the Board of Visitors of the Culverhouse College of Commerce and Business Administration at the University of Alabama. |
William O. McCoy (71) |
| Year of Election or Appointment: 1997 Prior to his retirement in December 1994, Mr. McCoy was Vice Chairman of the Board of BellSouth Corporation (telecommunications) and President of BellSouth Enterprises. He is currently a Director of Liberty Corporation (holding company), Duke Realty Corporation (real estate), and Progress Energy, Inc. (electric utility). He is also a partner of Franklin Street Partners (private investment management firm) and a member of the Research Triangle Foundation Board. In addition, Mr. McCoy served as the Interim Chancellor (1999-2000) and a member of the Board of Visitors for the University of North Carolina at Chapel Hill and currently serves on the Board of Directors of the University of North Carolina Health Care System and the Board of Visitors of the Kenan-Flagler Business School (University of North Carolina at Chapel Hill). He also served as Vice President of Finance for the University of North Carolina (16-school system). |
Cornelia M. Small (61) |
| Year of Election or Appointment: 2005 Ms. Small is a member (2000-present) and Chairperson (2002-present) of the Investment Committee, and a member (2002-present) of the Board of Trustees of Smith College. Previously, she served as Chief Investment Officer (1999-2000), Director of Global Equity Investments (1996-1999), and a member of the Board of Directors of Scudder, Stevens & Clark (1990-1997) and Scudder Kemper Investments (1997-1998). In addition, Ms. Small served as Co-Chair (2000-2003) of the Annual Fund for the Fletcher School of Law and Diplomacy. |
William S. Stavropoulos (66) |
| Year of Election or Appointment: 2002 Mr. Stavropoulos is Chairman of the Board (2000-present) and a Member of the Board of Directors of The Dow Chemical Company. Since joining The Dow Chemical Company in 1967, Mr. Stavropoulos served in numerous senior management positions, including President (1993-2000; 2002-2003), CEO (1995-2000; 2002-2004), and Chairman of the Executive Committee (2000-2004). Currently, he is a Director of NCR Corporation (data warehousing and technology solutions), BellSouth Corporation (telecommunications), Chemical Financial Corporation, Maersk Inc. (industrial conglomerate, 2002-present), and Metalmark Capital (private equity investment firm, 2005-present). He also serves as a member of the Board of Trustees of the American Enterprise Institute for Public Policy Research. In addition, Mr. Stavropoulos is a member of The Business Council, J.P. Morgan International Council and the University of Notre Dame Advisory Council for the College of Science. |
Kenneth L. Wolfe (66) |
| Year of Election or Appointment: 2005 Mr. Wolfe also serves as a Trustee (2005-present) or Member of the Advisory Board (2004-present) of other investment companies advised by FMR. Prior to his retirement in 2001, Mr. Wolfe was Chairman and Chief Executive Officer of Hershey Foods Corporation (1993-2001). He currently serves as a member of the boards of Adelphia Communications Corporation (2003-present), Bausch & Lomb, Inc., and Revlon Inc. (2004-present). |
Annual Report
Advisory Board Members and Executive Officers:
Correspondence intended for Mr. Gamper may be sent to Fidelity Investments, P.O. Box 55235, Boston, Massachusetts 02205-5235. Correspondence intended for each executive officer and Mr. Lynch may be sent to Fidelity Investments, 82 Devonshire Street, Boston, Massachusetts 02109.
Name, Age; Principal Occupation |
Albert R. Gamper, Jr. (63) |
| Year of Election or Appointment: 2005 Member of the Advisory Board of Fidelity Securities Fund. Prior to his retirement in December 2004, Mr. Gamper served as Chairman of the Board of CIT Group Inc. (commercial finance). During his tenure with CIT Group Inc. Mr. Gamper served in numerous senior management positions, including Chairman (1987-1989; 1999-2001; 2002-2004), Chief Executive Officer (1987-2004), and President (1989-2002). He currently serves as a member of the Board of Directors of Public Service Enterprise Group (utilities, 2001-present), Chairman of the Board of Governors, Rutgers University (2004-present), and Chairman of the Board of Saint Barnabas Health Care System. |
Peter S. Lynch (61) |
| Year of Election or Appointment: 2003 Member of the Advisory Board of Fidelity Securities Fund. Vice Chairman and a Director of FMR, and Vice Chairman (2001-present) and a Director (2000-present) of FMR Co., Inc. Previously, Mr. Lynch served as a Trustee of the Fidelity funds (1990-2003). In addition, he serves as a Trustee of Boston College, Massachusetts Eye & Ear Infirmary, Historic Deerfield, John F. Kennedy Library, and the Museum of Fine Arts of Boston. |
Dwight D. Churchill (51) |
| Year of Election or Appointment: 2005 Vice President of Dividend Growth. Mr. Churchill also serves as Vice President of certain Equity Funds (2005-present) and certain High Income Funds (2005-present). Previously, he served as Head of Fidelity's Fixed-Income Division (2000-2005), Vice President of Fidelity's Money Market Funds (2000-2005), Vice President of Fidelity's Bond Funds, and Senior Vice President of FIMM (2000) and FMR. Mr. Churchill joined Fidelity in 1993 as Vice President and Group Leader of Taxable Fixed-Income Investments. |
Charles Mangum (40) |
| Year of Election or Appointment: 1997 Vice President of Dividend Growth. Mr. Mangum also serves as Vice President of other funds advised by FMR. |
Eric D. Roiter (56) |
| Year of Election or Appointment: 2003 Secretary of Dividend Growth. He also serves as Secretary of other Fidelity funds; Vice President, General Counsel, and Secretary of FMR Co., Inc. (2001-present) and FMR; Assistant Secretary of Fidelity Management & Research (U.K.) Inc. (2001-present), Fidelity Management & Research (Far East) Inc. (2001-present), and Fidelity Investments Money Management, Inc. (2001-present). Mr. Roiter is an Adjunct Member, Faculty of Law, at Boston College Law School (2003-present). Previously, Mr. Roiter served as Vice President and Secretary of FDC (1998-2005). |
Stuart Fross (45) |
| Year of Election or Appointment: 2003 Assistant Secretary of Dividend Growth. Mr. Fross also serves as Assistant Secretary of other Fidelity funds (2003-present), Vice President and Secretary of FDC (2005-present), and is an employee of FMR. |
Christine Reynolds (46) |
| Year of Election or Appointment: 2004 President, Treasurer, and Anti-Money Laundering (AML) officer of Dividend Growth. Ms. Reynolds also serves as President, Treasurer, and AML officer of other Fidelity funds (2004) and is a Vice President (2003) and an employee (2002) of FMR. Before joining Fidelity Investments, Ms. Reynolds worked at PricewaterhouseCoopers LLP (PwC) (1980-2002), where she was most recently an audit partner with PwC's investment management practice. |
Timothy F. Hayes (54) |
| Year of Election or Appointment: 2003 Chief Financial Officer of Dividend Growth. Mr. Hayes also serves as Chief Financial Officer of other Fidelity funds (2002-present) and President of Fidelity Investment Operations (2005-present) which includes Fidelity Pricing and Cash Management Services Group (FPCMS), where he served as President (1998-2005). Mr. Hayes serves as President of Fidelity Service Company (2003-present) where he also serves as a Director. Mr. Hayes also served as President of Fidelity Investments Operations Group (FIOG, 2002-2005). |
Kenneth A. Rathgeber (58) |
| Year of Election or Appointment: 2004 Chief Compliance Officer of Dividend Growth. Mr. Rathgeber also serves as Chief Compliance Officer of other Fidelity funds (2004) and Executive Vice President of Risk Oversight for Fidelity Investments (2002). Previously, he served as Executive Vice President and Chief Operating Officer for Fidelity Investments Institutional Services Company, Inc. (1998-2002). |
John R. Hebble (47) |
| Year of Election or Appointment: 2003 Deputy Treasurer of Dividend Growth. Mr. Hebble also serves as Deputy Treasurer of other Fidelity funds (2003), and is an employee of FMR. Before joining Fidelity Investments, Mr. Hebble worked at Deutsche Asset Management where he served as Director of Fund Accounting (2002-2003) and Assistant Treasurer of the Scudder Funds (1998-2003). |
Bryan A. Mehrmann (44) |
| Year of Election or Appointment: 2005 Deputy Treasurer of Dividend Growth. Mr. Mehrmann also serves as Deputy Treasurer of other Fidelity funds (2005-present) and is an employee of FMR. Previously, Mr. Mehrmann served as Vice President of Fidelity Investments Institutional Services Group (FIIS)/Fidelity Investments Institutional Operations Corporation, Inc. (FIIOC) Client Services (1998-2004). |
Kimberley H. Monasterio (41) |
| Year of Election or Appointment: 2004 Deputy Treasurer of Dividend Growth. Ms. Monasterio also serves as Deputy Treasurer of other Fidelity funds (2004) and is an employee of FMR (2004). Before joining Fidelity Investments, Ms. Monasterio served as Treasurer (2000-2004) and Chief Financial Officer (2002-2004) of the Franklin Templeton Funds and Senior Vice President of Franklin Templeton Services, LLC (2000-2004). |
Kenneth B. Robins (35) |
| Year of Election or Appointment:2005 Deputy Treasurer of Dividend Growth. Mr. Robins also serves as Deputy Treasurer of other Fidelity funds (2005-present) and is an employee of FMR (2004-present). Before joining Fidelity Investments, Mr. Robins worked at KPMG LLP, where he was a partner in KPMG's department of professional practice (2002-2004) and a Senior Manager (1999-2000). In addition, Mr. Robins served as Assistant Chief Accountant, United States Securities and Exchange Commission (2000-2002). |
Robert G. Byrnes (38) |
| Year of Election or Appointment: 2005 Assistant Treasurer of Dividend Growth. Mr. Byrnes also serves as Assistant Treasurer of other Fidelity funds (2005-present) and is an employee of FMR (2005-present). Previously, Mr. Byrnes served as Vice President of FPCMS (2003-2005). Before joining Fidelity Investments, Mr. Byrnes worked at Deutsche Asset Management where he served as Vice President of the Investment Operations Group (2000-2003). |
John H. Costello (58) |
| Year of Election or Appointment: 2003 Assistant Treasurer of Dividend Growth. Mr. Costello also serves as Assistant Treasurer of other Fidelity funds and is an employee of FMR. |
Peter L. Lydecker (51) |
| Year of Election or Appointment: 2004 Assistant Treasurer of Dividend Growth. Mr. Lydecker also serves as Assistant Treasurer of other Fidelity funds (2004) and is an employee of FMR. |
Mark Osterheld (50) |
| Year of Election or Appointment: 2003 Assistant Treasurer of Dividend Growth. Mr. Osterheld also serves as Assistant Treasurer of other Fidelity funds (2002) and is an employee of FMR. |
Gary W. Ryan (46) |
| Year of Election or Appointment: 2005 Assistant Treasurer of Dividend Growth. Mr. Ryan also serves as Assistant Treasurer of other Fidelity funds (2005-present) and is an employee of FMR (2005-present). Previously, Mr. Ryan served as Vice President of Fund Reporting in FPCMS (1999-2005). |
Salvatore Schiavone (39) |
| Year of Election or Appointment: 2005 Assistant Treasurer of Dividend Growth. Mr. Schiavone also serves as Assistant Treasurer of other Fidelity funds (2005-present) and is an employee of FMR (2005-present). Before joining Fidelity Investments, Mr. Schiavone worked at Deutsche Asset Management, where he most recently served as Assistant Treasurer (2003-2005) of the Scudder Funds and Vice President and Head of Fund Reporting (1996-2003). |
Annual Report
Distributions
The Board of Trustees of Fidelity Dividend Growth Fund voted to pay on September 12, 2005, to shareholders of record at the opening of business on September 9, 2005, a distribution of $.10 per share derived from capital gains realized from sales of portfolio securities and a dividend of $.16 per share from net investment income.
The fund hereby designates as capital gain dividends: For dividends with respect to the taxable year ended July 31, 2005, $65,113,000, or, if subsequently determined to be different, the net capital gain of such year, and for dividends with respect to the taxable year ended July 31, 2004, $0, or, if subsequently determined to be different, the excess of: (a) the net capital gain of such year, over (b) amounts previously designated as capital gain dividends with respect to such year.
The fund designates 100% of the dividends distributed during the fiscal year as qualifying for the dividends-received deduction for corporate shareholders.
The fund designates 100% of the dividends distributed in September and December, respectively during the fiscal year as amounts which may be taken into account as a dividend for the purposes of the maximum rate under section 1(h)(11) of the Internal Revenue Code.
The fund will notify shareholders in January 2006 of amounts for use in preparing 2005 income tax returns.
Annual Report
Board Approval of Investment Advisory Contracts and Management Fees
Fidelity Dividend Growth Fund
Each year, typically in July, the Board of Trustees, including the independent Trustees (together, the Board), votes on the renewal of the management contract and sub-advisory agreements (together, the Advisory Contracts) for the fund. The Board, assisted by the advice of fund counsel and independent Trustees' counsel, requests and considers a broad range of information throughout the year.
The Board meets regularly each month except August and takes into account throughout the year matters bearing on Advisory Contracts. The Board, acting directly and through its separate committees, considers at each of its meetings factors that are relevant to the annual renewal of the fund's Advisory Contracts, including the services and support provided to the fund and its shareholders by Fidelity. At the time of the renewal, the Board had 11 standing committees, each composed of independent Trustees with varying backgrounds, to which the Board has assigned specific subject matter responsibilities in order to enhance effective decision-making by the Board. Each committee has adopted a written charter outlining the structure and purposes of the committee. One such committee, the Equity Contract Committee, meets periodically during the first six months of each year and as necessary to consider matters specifically related to the annual renewal of Advisory Contracts. The committee requests and receives information on, and makes recommendations to the independent Trustees concerning, the approval and annual review of the Advisory Contracts.
At its July 2005 meeting, the Board of Trustees, including the independent Trustees, unanimously determined to renew the Advisory Contracts for the fund. In reaching its determination, the Board considered all factors it believed relevant, including (1) the nature, extent, and quality of the services to be provided to the fund and its shareholders by Fidelity (including the investment performance of the fund); (2) the competitiveness of the management fee and total expenses of the fund; (3) the total costs of the services to be provided by and the profits to be realized by the investment adviser and its affiliates from the relationship with the fund; (4) the extent to which economies of scale would be realized as the fund grows; and (5) whether fee levels reflect these economies of scale, if any, for the benefit of fund shareholders.
In determining whether to renew the Advisory Contracts for the fund, the Board ultimately reached a determination, with the assistance of fund counsel and independent Trustees' counsel, that the renewal of the Advisory Contracts and the compensation to be received by Fidelity under the management contract is consistent with Fidelity's fiduciary duty under applicable law. In addition to evaluating the specific factors noted above, the Board, in reaching its determination, is aware that shareholders in the fund have a broad range of investment choices available to them, including a wide choice among mutual funds offered by competitors to Fidelity, and that the fund's shareholders, with the opportunity to review and weigh the disclosure provided by the fund in its prospectus and other public disclosures, have chosen to invest in this fund, managed by Fidelity.
Annual Report
Board Approval of Investment Advisory Contracts and
Management Fees - continued
Nature, Extent, and Quality of Services Provided by Fidelity. The Board considered staffing within the investment adviser, FMR, and the sub-advisers (together, the Investment Advisers), including the background of the fund's portfolio manager and the fund's investment objective and discipline. The independent Trustees also had discussions with senior management of Fidelity's investment operations and investment groups. The Board considered the structure of the portfolio manager compensation program and whether this structure provides appropriate incentives.
Fidelity Resources Dedicated to Investment Management and Support Services. The Board reviewed the size, education, and experience of the Investment Advisers' investment staff, their use of technology, and the Investment Advisers' approach to recruiting, training, and retaining portfolio managers and other research, advisory, and management personnel. The Board considered Fidelity's extensive global research capabilities that enable the Investment Advisers to aggregate data from various sources in an effort to produce positive investment results. The Board noted that Fidelity's analysts have access to a variety of technological tools that enable them to perform both fundamental and quantitative analysis and to specialize in various disciplines. The Board also considered that Fidelity's portfolio managers and analysts have access to daily portfolio attribution that allows for monitoring of a fund's portfolio, as well as an electronic communication system that provides immediate real-time access to research concerning issuers and credit enhancers.
Shareholder and Administrative Services. The Board considered the nature, extent, quality, and cost of administrative, distribution, and shareholder services performed by the Investment Advisers and their affiliates under the Advisory Contracts and under separate agreements covering transfer agency, pricing and bookkeeping, and securities lending services for the fund. The Board also considered the nature and extent of the Investment Advisers' supervision of third party service providers, principally custodians and subcustodians. The Board reviewed the allocation of fund brokerage, including allocations to brokers affiliated with the Investment Advisers, the use of brokerage commissions to pay fund expenses, and the use of "soft" commission dollars to pay for research services. The Board also considered that Fidelity voluntarily decided in 2004 to stop using "soft" commission dollars to pay for market data and, instead, to pay for that data out of its own resources. The Board also considered the resources devoted to, and the record of compliance with, the fund's compliance policies and procedures.
The Board noted that the growth of fund assets across the complex allows Fidelity to reinvest in the development of services designed to enhance the value or convenience of the Fidelity funds as investment vehicles. These services include 24-hour access to account information and market information through phone representatives and over the Internet, and investor education materials and asset allocation tools.
Annual Report
Investment in a Large Fund Family. The Board considered the benefits to shareholders of investing in a Fidelity fund, including the benefits of investing in a fund that is part of a large family of funds offering a variety of investment disciplines and providing for a large variety of mutual fund investor services. For example, fund shareholders are offered the privilege of exchanging shares of the fund for shares of other Fidelity funds, as set forth in the fund's prospectus, without paying a sales charge. The Board noted that, since the last Advisory Contract renewals in July 2004, Fidelity has taken a number of actions that benefited particular funds, including (i) voluntarily deciding in 2004 to stop using "soft" commission dollars to pay for market data and, instead, to pay for that data out of its own resources, (ii) contractually agreeing to impose management fee reductions and expense limitations on its five Spartan stock index funds and its stock index fund available through variable insurance products, (iii) contractually agreeing to eliminate the management fees on the Fidelity Freedom Funds and the Fidelity Advisor Freedom Funds, (iv) contractually agreeing to reduce the management fees on most of its investment-grade taxable bond funds, and (v) contractually agreeing to impose expense limitations on its retail and Spartan investment-grade taxable bond funds.
Investment Performance and Compliance. The Board considered whether the fund has operated within its investment objective, as well as its record of compliance with its investment restrictions. It also reviewed the fund's absolute investment performance, as well as the fund's relative investment performance measured against (i) a broad-based securities market index, and (ii) a peer group of mutual funds deemed appropriate by the Board over multiple periods. The following charts considered by the Board show, over the one-, three-, and five-year periods ended December 31, 2004, the fund's returns, the returns of a broad-based securities market index ("benchmark"), and a range of returns of a peer group of mutual funds identified by Lipper Inc. as having an investment objective similar to that of the fund. The box within each chart shows the 25th percentile return (bottom of box) and the 75th percentile return (top of box) of the Lipper peer group. Returns shown above the box are in the first quartile and returns shown below the box are in the fourth quartile. The percentage beaten number noted below each chart corresponds to the percentile box and represents the percentage of funds in the Lipper peer group whose performance was equal to or lower than that of the fund.
Annual Report
Board Approval of Investment Advisory Contracts and
Management Fees - continued
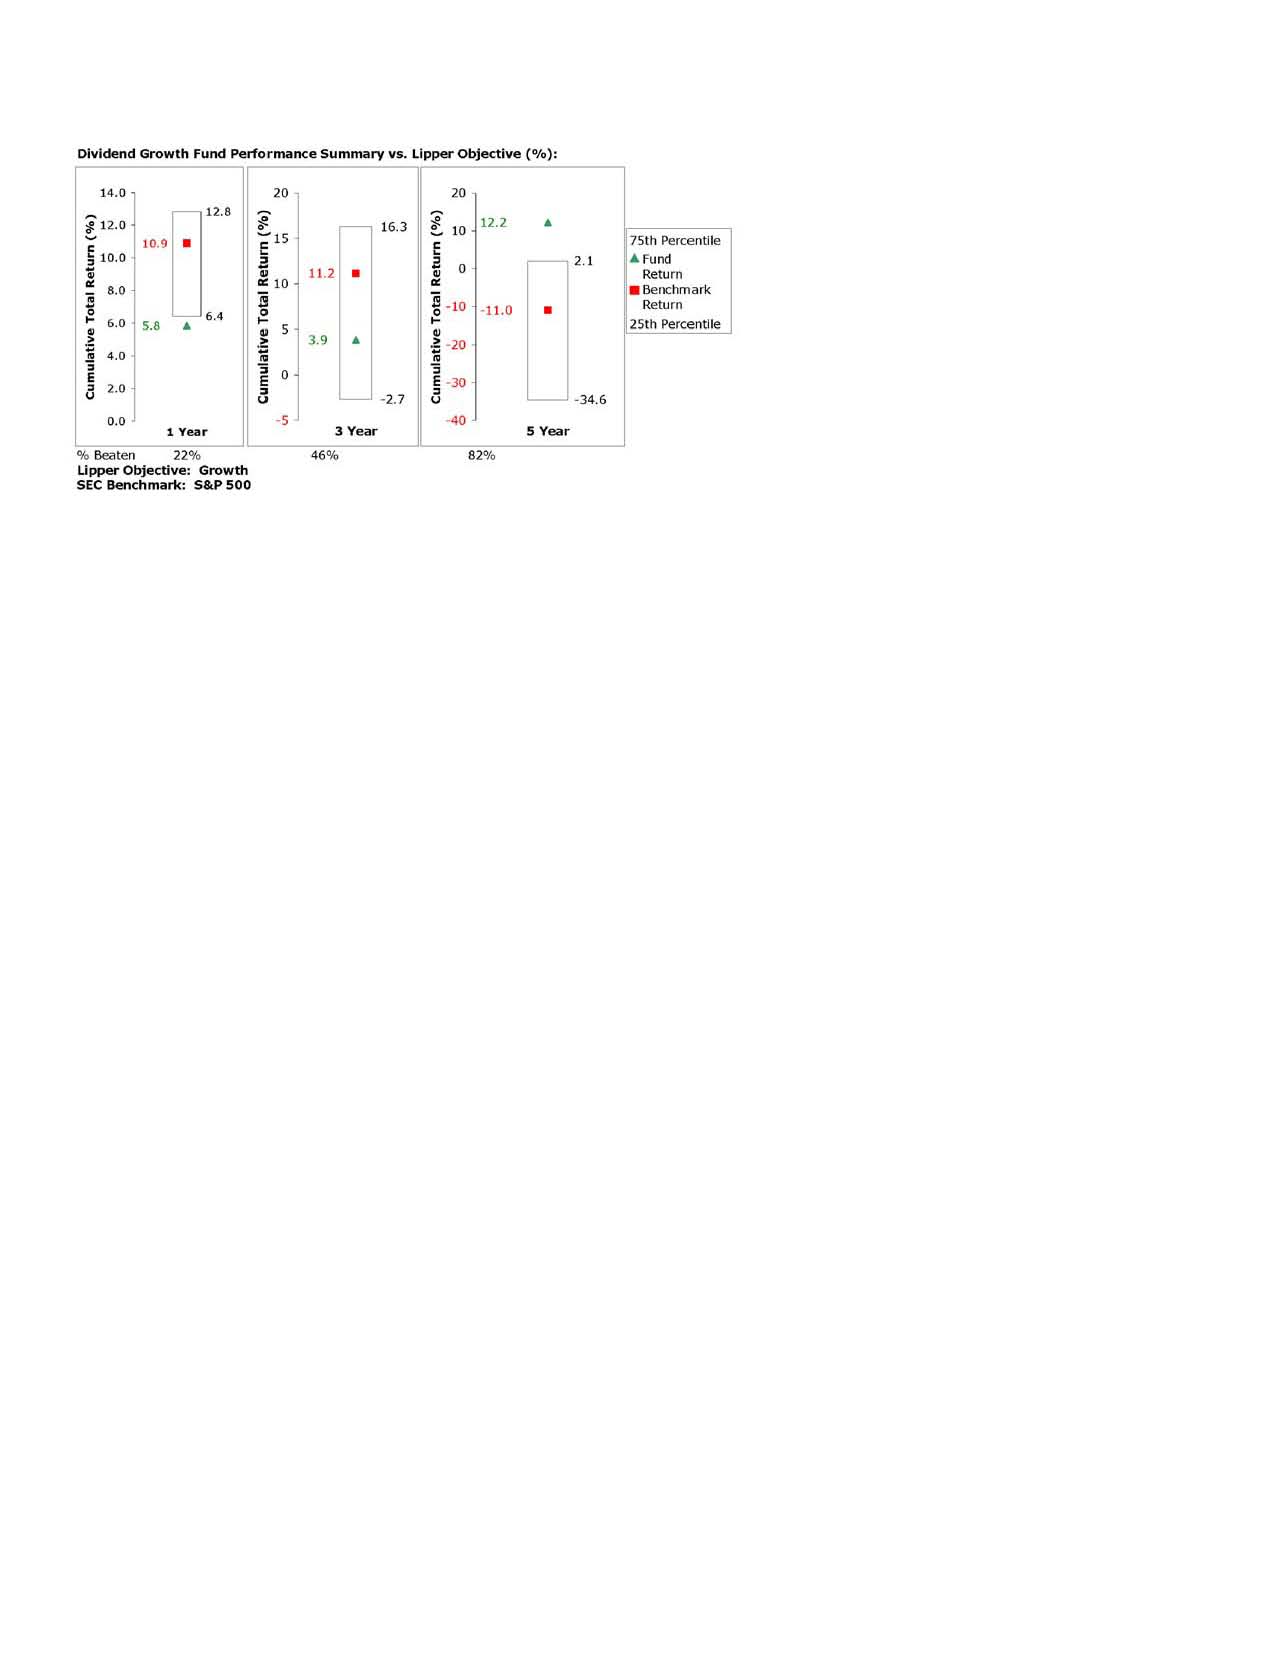
The Board reviewed the fund's relative investment performance against its Lipper peer group and stated that the performance of the fund was in the fourth quartile for the one-year period, the third quartile for the three-year period and the first quartile for the five-year period. The Board also stated that the relative investment performance of the fund was lower than its benchmark for certain periods, although the five-year cumulative total return of the fund was higher than its benchmark. The Board discussed with FMR actions to be taken by FMR to improve the fund's more recent disappointing performance.
The Board also considered that the fund's management fee is subject to upward or downward adjustment depending upon whether, and to what extent, the fund's investment performance for the performance period exceeds, or is exceeded by, the record (over the same period) of a Board-approved performance adjustment index. The Board realizes that the performance adjustment provides FMR with a strong economic incentive to seek to achieve superior performance for the fund's shareholders and helps to more closely align the interests of FMR and the fund's shareholders.
The Board has had thorough discussions with FMR throughout the year about the Board's and FMR's concerns about equity research, equity fund performance, and compliance with internal policies governing gifts and entertainment. FMR has taken steps that it believes will refocus and strengthen equity research and equity portfolio management and compliance. The Board noted with favor FMR's recent reorganization of its senior management team and FMR's plans to dedicate additional resources to investment research, and participated in the process that led to those changes.
Annual Report
Based on its review, and giving particular weight to the nature and quality of the resources dedicated by the Investment Advisers to maintain and improve relative performance, the Board concluded that the nature, extent, and quality of the services provided by Fidelity will benefit the fund's shareholders, particularly in light of the Board's view that the fund's shareholders benefit from investing in a fund that is part of a large family of funds offering a variety of investment disciplines and services.
Competitiveness of Management Fee and Total Fund Expenses. The Board considered the fund's management fee and total expenses compared to "mapped groups" of competitive funds and classes. Fidelity creates "mapped groups" by combining similar Lipper investment objective categories that have comparable management fee characteristics. Combining Lipper investment objective categories aids the Board's management fee and total expense comparisons by broadening the competitive group used for comparison and by reducing the number of universes to which various Fidelity funds are compared.
The Board considered two proprietary management fee comparisons for the 12-month periods shown in the chart below. The group of Lipper funds used by the Board for management fee comparisons is referred to below as the "Total Mapped Group" and, for the reasons explained above, is broader than the Lipper peer group used by the Board for performance comparisons. The Total Mapped Group comparison focuses on a fund's standing relative to the total universe of comparable funds available to investors, in terms of gross management fees before expense reimbursements or caps. "TMG %" represents the percentage of funds in the Total Mapped Group that had management fees that were lower than the fund's. For example, a TMG % of 15% means that 85% of the funds in the Total Mapped Group had higher management fees than the fund. The "Asset-Size Peer Group" (ASPG) comparison focuses on a fund's standing relative to non-Fidelity funds similar in size to the fund within the Total Mapped Group. The ASPG represents at least 15% of the funds in the Total Mapped Group with comparable asset size and management fee characteristics, subject to a minimum of 50 funds (or all funds in the Total Mapped Group if fewer than 50). Additional information, such as the ASPG quartile ("quadrant") in which the fund's management fee ranked and the impact of the fund's performance adjustment, is also included in the chart and considered by the Board.
Annual Report
Board Approval of Investment Advisory Contracts and
Management Fees - continued

The Board noted that the fund's management fee ranked below the median of its Total Mapped Group and below the median of its ASPG for 2004. The Board also noted the effect of the fund's negative performance adjustment on the fund's management fee ranking.
Based on its review, the Board concluded that the fund's management fee was fair and reasonable in light of the services that the fund receives and the other factors considered.
In its review of the fund's total expenses, the Board considered the fund's management fee as well as other fund expenses, such as transfer agent fees, pricing and bookkeeping fees, and custodial, legal, and audit fees. The Board also noted the effects of any waivers and reimbursements on fees and expenses, as well as the fund's negative performance adjustment. As part of its review, the Board also considered current and historical total expenses of the fund compared to competitive fund median expenses. The fund is compared to those funds and classes in the Total Mapped Group (used by the Board for management fee comparisons) that have a similar sales load structure.
The Board noted that the fund's total expenses ranked below its competitive median for 2004.
In its review of total expenses, the Board also considered Fidelity fee structures and other information on clients that FMR and its affiliates service in other competitive markets, such as other mutual funds advised or subadvised by FMR or its affiliates, pension plan clients, and other institutional clients.
Annual Report
Based on its review, the Board concluded that the fund's total expenses were reasonable in light of the services that the fund and its shareholders receive and the other factors considered.
Costs of the Services and Profitability. The Board considered the revenues earned and the expenses incurred by Fidelity in conducting the business of developing, marketing, distributing, managing, administering and servicing the fund and its shareholders. The Board also considered the level of Fidelity's profits in respect of all the Fidelity funds.
On an annual basis, FMR presents to the Board Fidelity's profitability for the fund. Fidelity calculates the profitability for each fund, as well as aggregate profitability for groups of Fidelity funds and all Fidelity funds, using a series of detailed revenue and cost allocation methodologies which originate with the audited books and records of Fidelity. The Audit Committee of the Board reviews any significant changes from the prior year's methodologies.
PricewaterhouseCoopers LLP (PwC), independent registered accounting firm and auditor to Fidelity and certain Fidelity funds, has been engaged annually by the Board as part of the Board's assessment of the results of Fidelity's profitability analysis. PwC's engagement includes the review and assessment of Fidelity's methodologies used in determining the revenues and expenses attributable to Fidelity's mutual fund business, and completion of agreed-upon procedures surrounding the mathematical accuracy of fund profitability and its conformity to allocation methodologies. After considering PwC's reports issued under the engagement and information provided by Fidelity, the Board believes that while other allocation methods may also be reasonable, Fidelity's profitability methodologies are reasonable in all material respects.
The Board has also reviewed Fidelity's non-fund businesses and any fall-out benefits related to the mutual fund business as well as cases where Fidelity's affiliates may benefit from or be related to the fund's business. In addition, a special committee of the Board reviewed services provided to Fidelity by its affiliates and determined that the fees that Fidelity paid for such services were reasonable.
The Board considered the costs of the services provided by and the profits realized by Fidelity in connection with the operation of the fund and determined that the amount of profit is a fair entrepreneurial profit for the management of the fund.
Economies of Scale. The Board considered whether there have been economies of scale in respect of the management of the Fidelity funds, whether the Fidelity funds (including the fund) have appropriately benefited from any such economies of scale, and whether there is potential for realization of any further economies of scale. The Board considered the extent to which the fund will benefit from economies of scale through increased services to the fund, through waivers or reimbursements, or through fee or expense reductions, including reductions that occur through operation of the transfer agent agreement. The transfer agent fee varies in part based on the number of accounts in the fund. If the number of accounts decreases or the average account size increases, the overall transfer agent fee rate decreases.
Annual Report
Board Approval of Investment Advisory Contracts and
Management Fees - continued
The Board recognized that the fund's management contract incorporates a "group fee" structure, which provides for lower fee rates as total fund assets under FMR's management increase, and for higher fee rates as total fund assets under FMR's management decrease. The Board considered that the group fee is designed to deliver the benefits of economies of scale to fund shareholders when total fund assets increase, even if assets of any particular fund are unchanged or have declined, because some portion of Fidelity's costs are attributable to services provided to all Fidelity funds, and all funds benefit if those costs can be allocated among more assets. The Board concluded that, given the group fee structure, fund shareholders will achieve a certain level of economies of scale as assets under FMR's management increase at the fund complex level, regardless of whether Fidelity achieves any such economies of scale.
The Board further concluded that any potential economies of scale are being shared between fund shareholders and Fidelity in an appropriate manner.
Additional Information Requested by the Board. In order to develop fully the factual basis for consideration of the Advisory Contracts, the Board requested additional information regarding (i) equity fund transfer agency fees; (ii) Fidelity's fund profitability methodology and the impact of various changes in the methodology over time; (iii) benefits to shareholders from economies of scale; (iv) composition and characteristics of various fund and industry data used in comparisons; and (v) compensation of portfolio managers and research analysts.
Based on its evaluation of all of the conclusions noted above, and after considering all material factors, the Board ultimately concluded that the existing advisory fee structures are fair and reasonable, and that the fund's existing Advisory Contracts should be renewed.
Annual Report
Managing Your Investments
Fidelity offers several ways to conveniently manage your personal investments via your telephone or PC. You can access your account information, conduct trades and research your investments 24 hours a day.
By Phone
Fidelity Automated Service Telephone provides a single toll-free number to access account balances, positions, quotes and trading. It's easy to navigate the service, and on your first call, the system will help you create a personal identification number (PIN) for security.
(phone_graphic)
Fidelity Automated
Service Telephone (FAST®)
1-800-544-5555
Press
1 For mutual fund and brokerage trading.
2 For quotes.*
3 For account balances and holdings.
4 To review orders and mutual
fund activity.
5 To change your PIN.
*0 To speak to a Fidelity representative.
By PC
Fidelity's web site on the Internet provides a wide range of information, including daily financial news, fund performance, interactive planning tools and news about Fidelity products and services.
(computer_graphic)
Fidelity's Web Site
www.fidelity.com
* When you call the quotes line, please remember that a fund's yield and return will vary and, except for money market funds, share price will also vary. This means that you may have a gain or loss when you sell your shares. There is no assurance that money market funds will be able to maintain a stable $1 share price; an investment in a money market fund is not insured or guaranteed by the U.S. government. Total returns are historical and include changes in share price, reinvestment of dividends and capital gains, and the effects of any sales charges.
Annual Report
To Visit Fidelity
For directions and hours,
please call 1-800-544-9797.
Arizona
7001 West Ray Road
Chandler, AZ
7373 N. Scottsdale Road
Scottsdale, AZ
California
815 East Birch Street
Brea, CA
1411 Chapin Avenue
Burlingame, CA
851 East Hamilton Avenue
Campbell, CA
19200 Von Karman Avenue
Irvine, CA
601 Larkspur Landing Circle
Larkspur, CA
10100 Santa Monica Blvd.
Los Angeles, CA
27101 Puerta Real
Mission Viejo, CA
73-575 El Paseo
Palm Desert, CA
251 University Avenue
Palo Alto, CA
123 South Lake Avenue
Pasadena, CA
16995 Bernardo Ctr. Drive
Rancho Bernardo, CA
1740 Arden Way
Sacramento, CA
7676 Hazard Center Drive
San Diego, CA
8 Montgomery Street
San Francisco, CA
3793 State Street
Santa Barbara, CA
21701 Hawthorne Boulevard
Torrance, CA
2001 North Main Street
Walnut Creek, CA
6300 Canoga Avenue
Woodland Hills, CA
Colorado
1625 Broadway
Denver, CO
9185 East Westview Road
Littleton, CO
Connecticut
48 West Putnam Avenue
Greenwich, CT
265 Church Street
New Haven, CT
300 Atlantic Street
Stamford, CT
29 South Main Street
West Hartford, CT
Delaware
222 Delaware Avenue
Wilmington, DE
Florida
4400 N. Federal Highway
Boca Raton, FL
121 Alhambra Plaza
Coral Gables, FL
2948 N. Federal Highway
Ft. Lauderdale, FL
1907 West State Road 434
Longwood, FL
8880 Tamiami Trail, North
Naples, FL
3550 Tamiami Trail, South
Sarasota, FL
1502 N. Westshore Blvd.
Tampa, FL
2465 State Road 7
Wellington, FL
3501 PGA Boulevard
West Palm Beach, FL
Georgia
3445 Peachtree Road, N.E.
Atlanta, GA
1000 Abernathy Road
Atlanta, GA
Illinois
One North LaSalle Street
Chicago, IL
875 North Michigan Ave.
Chicago, IL
1415 West 22nd Street
Oak Brook, IL
1700 East Golf Road
Schaumburg, IL
3232 Lake Avenue
Wilmette, IL
Indiana
4729 East 82nd Street
Indianapolis, IN
Kansas
5400 College Boulevard
Overland Park, KS
Maine
Three Canal Plaza
Portland, ME
Maryland
7315 Wisconsin Avenue
Bethesda, MD
One W. Pennsylvania Ave.
Towson, MD
Massachusetts
801 Boylston Street
Boston, MA
155 Congress Street
Boston, MA
300 Granite Street
Braintree, MA
44 Mall Road
Burlington, MA
405 Cochituate Road
Framingham, MA
416 Belmont Street
Worcester, MA
Michigan
500 E. Eisenhower Pkwy.
Ann Arbor, MI
280 Old N. Woodward Ave.
Birmingham, MI
43420 Grand River Avenue
Novi, MI
29155 Northwestern Hwy.
Southfield, MI
Minnesota
7600 France Avenue South
Edina, MN
Missouri
8885 Ladue Road
Ladue, MO
Annual Report
Nevada
2225 Village Walk Drive
Henderson, NV
New Jersey
150 Essex Street
Millburn, NJ
56 South Street
Morristown, NJ
396 Route 17, North
Paramus, NJ
3518 Route 1 North
Princeton, NJ
530 Highway 35
Shrewsbury, NJ
New York
1055 Franklin Avenue
Garden City, NY
37 West Jericho Turnpike
Huntington Station, NY
1271 Avenue of the Americas
New York, NY
61 Broadway
New York, NY
350 Park Avenue
New York, NY
200 Fifth Avenue
New York, NY
733 Third Avenue
New York, NY
11 Penn Plaza
New York, NY
2070 Broadway
New York, NY
1075 Northern Blvd.
Roslyn, NY
North Carolina
4611 Sharon Road
Charlotte, NC
Ohio
3805 Edwards Road
Cincinnati, OH
1324 Polaris Parkway
Columbus, OH
28699 Chagrin Boulevard
Woodmere Village, OH
Oregon
16850 SW 72nd Avenue
Tigard, OR
Pennsylvania
600 West DeKalb Pike
King of Prussia, PA
1735 Market Street
Philadelphia, PA
12001 Perry Highway
Wexford, PA
Rhode Island
47 Providence Place
Providence, RI
Tennessee
6150 Poplar Avenue
Memphis, TN
Texas
10000 Research Boulevard
Austin, TX
4001 Northwest Parkway
Dallas, TX
12532 Memorial Drive
Houston, TX
2701 Drexel Drive
Houston, TX
6500 N. MacArthur Blvd.
Irving, TX
6005 West Park Boulevard
Plano, TX
14100 San Pedro
San Antonio, TX
1576 East Southlake Blvd.
Southlake, TX
19740 IH 45 North
Spring, TX
Utah
215 South State Street
Salt Lake City, UT
Virginia
1861 International Drive
McLean, VA
Washington
411 108th Avenue, N.E.
Bellevue, WA
1518 6th Avenue
Seattle, WA
Washington, DC
1900 K Street, N.W.
Washington, DC
Wisconsin
595 North Barker Road
Brookfield, WI
Fidelity Brokerage Services, Inc., 100 Summer St., Boston, MA 02110 Member NYSE/SIPC
Annual Report
Investment Adviser
Fidelity Management & Research Company
Boston, MA
Investment Sub Advisers
FMR Co., Inc.
Fidelity Management & Research
(Far East) Inc.
Fidelity Management & Research
(U.K.) Inc.
Fidelity International Investment
Advisors
Fidelity Investments Japan Limited
Fidelity International Investment
Advisors (U.K.) Limited
General Distributor
Fidelity Distributors Corporation
Boston, MA
Transfer and Service Agent
Fidelity Service Company, Inc.
Boston, MA
Custodian
Citibank, N.A.,
New York, NY
The Fidelity Telephone Connection
Mutual Fund 24-Hour Service
Exchanges/Redemptions
and Account Assistance 1-800-544-6666
Product Information 1-800-544-6666
Retirement Accounts 1-800-544-4774
(8 a.m. - 9 p.m.)
TDD Service 1-800-544-0118
for the deaf and hearing impaired
(9 a.m. - 9 p.m. Eastern time)
Fidelity Automated Service
Telephone (FAST ®) (automated graphic) 1-800-544-5555
(automated graphic) Automated line for quickest service
DGF-UANN-0905
1.789245.102
(Fidelity Investment logo)(registered trademark)
Corporate Headquarters
82 Devonshire St., Boston, MA 02109
www.fidelity.com
Fidelity®
Growth & Income
Portfolio
Annual Report
July 31, 2005
(2_fidelity_logos) (Registered_Trademark)
Contents
Chairman's Message | <Click Here> | Ned Johnson's message to shareholders. |
Performance | <Click Here> | How the fund has done over time. |
Management's Discussion | <Click Here> | The manager's review of fund performance, strategy and outlook. |
Shareholder Expense Example | <Click Here> | An example of shareholder expenses. |
Investment Changes | <Click Here> | A summary of major shifts in the fund's investments over the past six months. |
Investments | <Click Here> | A complete list of the fund's investments with their market values. |
Financial Statements | <Click Here> | Statements of assets and liabilities, operations, and changes in net assets,
as well as financial highlights. |
Notes | <Click Here> | Notes to the financial statements. |
Report of Independent Registered Public Accounting Firm | <Click Here> | |
Trustees and Officers | <Click Here> | |
Distributions | <Click Here> | |
Board Approval of Investment Advisory Contracts and Management Fees | <Click Here> | |
To view a fund's proxy voting guidelines and proxy voting record for the 12-month period ended June 30, visit www.fidelity.com/proxyvotingresults or visit the Securities and Exchange Commission's (SEC) web site at www.sec.gov. You may also call 1-800-544-8544 to request a free copy of the proxy voting guidelines.
Standard & Poor's, S&P and S&P 500 are registered service marks of The McGraw-Hill Companies, Inc. and have been licensed for use by Fidelity Distributors Corporation.
Other third party marks appearing herein are the property of their respective owners.
All other marks appearing herein are registered or unregistered trademarks or service marks of FMR Corp. or an affiliated company.
Annual Report
This report and the financial statements contained herein are submitted for the general information of the shareholders of the fund. This report is not authorized for distribution to prospective investors in the fund unless preceded or accompanied by an effective prospectus.
A fund files its complete schedule of portfolio holdings with the SEC for the first and third quarters of each fiscal year on Form N-Q. Forms N-Q are available on the SEC's web site at http://www.sec.gov. A fund's Forms N-Q may be reviewed and copied at the SEC's Public Reference Room in Washington, DC. Information regarding the operation of the SEC's Public Reference Room may be obtained by calling 1-800-SEC-0330. For a complete list of a fund's portfolio holdings, view the most recent quarterly holdings report, semiannual report, or annual report on Fidelity's web site at http://www.fidelity.com/holdings.
NOT FDIC INSURED · MAY LOSE VALUE · NO BANK GUARANTEE
Neither the fund nor Fidelity Distributors Corporation is a bank.
Annual Report
Chairman's Message
(photo_of_Edward_C_Johnson_3d)
Dear Shareholder:
During the past year or so, much has been reported about the mutual fund industry, and much of it has been more critical than I believe is warranted. Allegations that some companies have been less than forthright with their shareholders have cast a shadow on the entire industry. I continue to find these reports disturbing, and assert that they do not create an accurate picture of the industry overall. Therefore, I would like to remind everyone where Fidelity stands on these issues. I will say two things specifically regarding allegations that some mutual fund companies were in violation of the Securities and Exchange Commission's forward pricing rules or were involved in so-called "market timing" activities.
First, Fidelity has no agreements that permit customers who buy fund shares after 4 p.m. to obtain the 4 p.m. price. This is not a new policy. This is not to say that someone could not deceive the company through fraudulent acts. However, we are extremely diligent in preventing fraud from occurring in this manner - and in every other. But I underscore again that Fidelity has no so-called "agreements" that sanction illegal practices.
Second, Fidelity continues to stand on record, as we have for years, in opposition to predatory short-term trading that adversely affects shareholders in a mutual fund. Back in the 1980s, we initiated a fee - which is returned to the fund and, therefore, to investors - to discourage this activity. Further, we took the lead several years ago in developing a Fair Value Pricing Policy to prevent market timing on foreign securities in our funds. I am confident we will find other ways to make it more difficult for predatory traders to operate. However, this will only be achieved through close cooperation among regulators, legislators and the industry.
Yes, there have been unfortunate instances of unethical and illegal activity within the mutual fund industry from time to time. That is true of any industry. When this occurs, confessed or convicted offenders should be dealt with appropriately. But we are still concerned about the risk of over-regulation and the quick application of simplistic solutions to intricate problems. Every system can be improved, and we support and applaud well thought out improvements by regulators, legislators and industry representatives that achieve the common goal of building and protecting the value of investors' holdings.
For nearly 60 years, Fidelity has worked very hard to improve its products and service to justify your trust. When our family founded this company in 1946, we had only a few hundred customers. Today, we serve more than 18 million customers including individual investors and participants in retirement plans across America.
Let me close by saying that we do not take your trust in us for granted, and we realize that we must always work to improve all aspects of our service to you. In turn, we urge you to continue your active participation with your financial matters, so that your interests can be well served.
Best regards,
/s/Edward C. Johnson 3d
Edward C. Johnson 3d
Annual Report
Performance: The Bottom Line
Average annual total return reflects the change in the value of an investment, assuming reinvestment of the fund's dividend income and capital gains (the profits earned upon the sale of securities that have grown in value) and assuming a constant rate of performance each year. The $10,000 table and the fund's returns do not reflect the deduction of taxes that a shareholder would pay on fund distributions or the redemption of fund shares. During periods of reimbursement by Fidelity, a fund's total return will be greater than it would be had the reimbursement not occurred. How a fund did yesterday is no guarantee of how it will do tomorrow.
Average Annual Total Returns
Periods ended July 31, 2005 | Past 1
year | Past 5
years | Past 10
years |
Fidelity® Growth & Income Portfolio | 11.15% | -0.70% | 9.17% |
$10,000 Over 10 Years
Let's say hypothetically that $10,000 was invested in Fidelity ® Growth & Income Portfolio on July 31, 1995. The chart shows how the value of your investment would have changed, and also shows how the Standard & Poor's 500SM Index performed over the same period.
Annual Report
Management's Discussion of Fund Performance
Comments from Steve Kaye, Portfolio Manager of Fidelity® Growth & Income Portfolio
A late-inning rally on Wall Street helped push some key U.S. equity indexes to four-year highs by the conclusion of the 12-month period ending July 31, 2005. Spurred on by bullish economic data and strong corporate earnings, investors enjoyed a stellar month of July, capping off a turbulent 12-month period for U.S. equity markets. Stock prices bounced up and down during most of the year, moving in cadence with gyrations in the price of crude oil and investors' gathering and ebbing concerns about inflation. The Federal Reserve Board raised short-term interest rates eight times during the period, also affecting overall market sentiment. Despite their fluctuations, the major equity indexes finished on a high note, with the Standard & Poor's 500SM Index and the NASDAQ Composite® Index posting gains of 14.05% and 16.51%, respectively, for the period. The small-cap Russell 2000® Index rose 24.78% and the Russell Midcap® Index jumped 28.93%, while the blue-chips' Dow Jones Industrial AverageSM advanced 7.29%.
The fund had a solid absolute return of 11.15% during the 12-month period ending July 31, 2005, but trailed the S&P 500® and the 14.84% return of the LipperSM Growth & Income Funds Average. Underweighting strong-performing energy stocks was the primary reason for the fund's shortfall relative to the index - a disparity caused mainly by a lack of exposure to such names as ConocoPhillips, Occidental Petroleum and Valero Energy. Overweighting telecommunication services and unfavorable security selection in the sector was the fund's second-largest relative detractor. Despite their low valuations, high dividend yields and impressive cash flows, fund holdings Verizon Communications and SBC Communications failed to capture investor enthusiasm during the past year. On the upside, good stock selection in financials was key. Student loan lender SLM Corp. - or Sallie Mae - was the fund's top absolute and relative performer, as it continued to post strong earnings growth. MGM MIRAGE and Harrah's Entertainment also were among the fund's top relative contributors. Both made well-timed acquisitions that expanded their growth and both have benefited from higher room rates, making them less dependent on gambling income.
The views expressed in this statement reflect those of the portfolio manager only through the end of the period of the report as stated on the cover and do not necessarily represent the views of Fidelity or any other person in the Fidelity organization. Any such views are subject to change at any time based upon market or other conditions and Fidelity disclaims any responsibility to update such views. These views may not be relied on as investment advice and, because investment decisions for a Fidelity fund are based on numerous factors, may not be relied on as an indication of trading intent on behalf of any Fidelity fund.
Annual Report
Shareholder Expense Example
As a shareholder of the Fund, you incur two types of costs: (1) transaction costs, and (2) ongoing costs, including management fees and other Fund expenses. This Example is intended to help you understand your ongoing costs (in dollars) of investing in the Fund and to compare these costs with the ongoing costs of investing in other mutual funds.
The Example is based on an investment of $1,000 invested at the beginning of the period and held for the entire period (February 1, 2005 to July 31, 2005).
Actual Expenses
The first line of the table below provides information about actual account values and actual expenses. You may use the information in this line, together with the amount you invested, to estimate the expenses that you paid over the period. Simply divide your account value by $1,000.00 (for example, an $8,600 account value divided by $1,000.00 = 8.6), then multiply the result by the number in the first line under the heading entitled "Expenses Paid During Period" to estimate the expenses you paid on your account during this period. A small balance maintenance fee of $12.00 that is charged once a year may apply for certain accounts with a value of less than $2,000. This fee is not included in the table below. If it was, the estimate of expenses you paid during the period would be higher, and your ending account value lower, by this amount.
Hypothetical Example for Comparison Purposes
The second line of the table below provides information about hypothetical account values and hypothetical expenses based on the Fund's actual expense ratio and an assumed rate of return of 5% per year before expenses, which is not the Fund's actual return. The hypothetical account values and expenses may not be used to estimate the actual ending account balance or expenses you paid for the period. You may use this information to compare the ongoing costs of investing in the Fund and other funds. To do so, compare this 5% hypothetical example with the 5% hypothetical examples that appear in the shareholder reports of the other funds. A small balance maintenance fee of $12.00 that is charged once a year may apply for certain accounts with a value of less than $2,000. This fee is not included in the table below. If it was, the estimate of expenses you paid during the period would be higher, and your ending account value lower, by this amount.
Please note that the expenses shown in the table are meant to highlight your ongoing costs only and do not reflect any transaction costs. Therefore, the second line of the table is useful in comparing ongoing costs only, and will not help you determine the relative total costs of owning different funds.
| Beginning
Account Value
February 1, 2005 | Ending
Account Value
July 31, 2005 | Expenses Paid
During Period*
February 1, 2005
to July 31, 2005 |
Actual | $ 1,000.00 | $ 1,035.00 | $ 3.48 |
Hypothetical (5% return per year before expenses) | $ 1,000.00 | $ 1,021.37 | $ 3.46 |
* Expenses are equal to the Fund's annualized expense ratio of .69%; multiplied by the average account value over the period, multiplied by 181/365 (to reflect the one-half year period).
Annual Report
Investment Changes
Top Ten Stocks as of July 31, 2005 |
| % of fund's
net assets | % of fund's net assets
6 months ago |
SLM Corp. | 4.3 | 4.0 |
Exxon Mobil Corp. | 4.2 | 3.6 |
General Electric Co. | 4.2 | 4.0 |
Microsoft Corp. | 3.2 | 3.2 |
UnitedHealth Group, Inc. | 2.7 | 2.4 |
Verizon Communications, Inc. | 2.4 | 2.6 |
SBC Communications, Inc. | 2.4 | 2.3 |
Altria Group, Inc. | 2.2 | 2.0 |
Wal-Mart Stores, Inc. | 1.8 | 2.1 |
American International Group, Inc. | 1.8 | 2.1 |
| 29.2 | |
Top Five Market Sectors as of July 31, 2005 |
| % of fund's
net assets | % of fund's net assets
6 months ago |
Financials | 19.1 | 20.0 |
Health Care | 16.2 | 13.6 |
Information Technology | 12.6 | 10.1 |
Consumer Staples | 11.6 | 12.4 |
Consumer Discretionary | 11.4 | 10.6 |
Asset Allocation (% of fund's net assets) |
As of July 31, 2005 * | As of January 31, 2005 ** |
| Stocks 99.0% | | | Stocks 94.9% | |
| Convertible
Securities 0.0% | | | Convertible
Securities 0.6% | |
| Short-Term
Investments and
Net Other Assets 1.0% | | | Short-Term
Investments and
Net Other Assets 4.5% | |
* Foreign investments | 4.9% | | ** Foreign investments | 4.6% | |

Annual Report
Investments July 31, 2005
Showing Percentage of Net Assets
Common Stocks - 98.9% |
| Shares | | Value (Note 1)
(000s) |
CONSUMER DISCRETIONARY - 11.4% |
Diversified Consumer Services - 0.4% |
Apollo Group, Inc. Class A (a) | 1,871,300 | | $ 140,628 |
Hotels, Restaurants & Leisure - 2.3% |
Carnival Corp. unit | 2,606,900 | | 136,602 |
Harrah's Entertainment, Inc. | 1,986,700 | | 156,433 |
Marriott International, Inc. Class A | 1,941,100 | | 132,907 |
McDonald's Corp. | 3,262,650 | | 101,697 |
MGM MIRAGE (a) | 3,453,456 | | 156,960 |
Starbucks Corp. (a) | 649,906 | | 34,153 |
Starwood Hotels & Resorts Worldwide, Inc. unit | 75,300 | | 4,768 |
| | 723,520 |
Internet & Catalog Retail - 0.3% |
eBay, Inc. (a) | 2,670,900 | | 111,590 |
Media - 4.6% |
Arbitron, Inc. | 492,700 | | 20,447 |
Clear Channel Communications, Inc. | 351,000 | | 11,457 |
Comcast Corp. Class A (special) (a) | 2,076,998 | | 62,310 |
E.W. Scripps Co. Class A | 744,600 | | 37,625 |
EchoStar Communications Corp. Class A | 6,661,845 | | 191,328 |
Gannett Co., Inc. | 1,898,700 | | 138,529 |
News Corp. Class B (d) | 10,496,300 | | 182,006 |
Omnicom Group, Inc. | 5,006,900 | | 424,936 |
Time Warner, Inc. (a) | 4,081,046 | | 69,459 |
Univision Communications, Inc. Class A (a) | 3,844,900 | | 108,734 |
Viacom, Inc. Class B (non-vtg.) | 2,470,147 | | 82,725 |
Walt Disney Co. | 4,822,700 | | 123,654 |
| | 1,453,210 |
Multiline Retail - 1.6% |
Family Dollar Stores, Inc. | 2,072,000 | | 53,458 |
Federated Department Stores, Inc. | 1,037,400 | | 78,708 |
Kohl's Corp. (a) | 1,838,700 | | 103,611 |
Target Corp. | 4,195,100 | | 246,462 |
The May Department Stores Co. | 494,600 | | 20,303 |
| | 502,542 |
Specialty Retail - 1.9% |
Best Buy Co., Inc. | 494,600 | | 37,886 |
Home Depot, Inc. | 7,428,350 | | 323,208 |
Common Stocks - continued |
| Shares | | Value (Note 1)
(000s) |
CONSUMER DISCRETIONARY - continued |
Specialty Retail - continued |
Lowe's Companies, Inc. | 1,335,500 | | $ 88,437 |
Staples, Inc. | 6,792,750 | | 154,671 |
| | 604,202 |
Textiles, Apparel & Luxury Goods - 0.3% |
NIKE, Inc. Class B | 885,900 | | 74,238 |
Polo Ralph Lauren Corp. Class A | 269,600 | | 13,275 |
| | 87,513 |
TOTAL CONSUMER DISCRETIONARY | | 3,623,205 |
CONSUMER STAPLES - 11.6% |
Beverages - 2.3% |
Anheuser-Busch Companies, Inc. | 1,102,700 | | 48,905 |
Diageo PLC sponsored ADR | 1,879,500 | | 104,632 |
PepsiCo, Inc. | 5,630,507 | | 307,032 |
The Coca-Cola Co. | 6,190,500 | | 270,896 |
| | 731,465 |
Food & Staples Retailing - 4.1% |
Costco Wholesale Corp. | 286,800 | | 13,184 |
Safeway, Inc. | 3,345,030 | | 81,284 |
Sysco Corp. | 5,913,600 | | 213,244 |
Wal-Mart Stores, Inc. | 11,564,300 | | 570,698 |
Walgreen Co. | 8,038,500 | | 384,723 |
Whole Foods Market, Inc. | 221,120 | | 30,185 |
| | 1,293,318 |
Food Products - 0.2% |
Kellogg Co. | 1,211,800 | | 54,907 |
Household Products - 1.6% |
Colgate-Palmolive Co. | 3,652,000 | | 193,337 |
Kimberly-Clark Corp. | 1,968,300 | | 125,499 |
Procter & Gamble Co. | 3,745,982 | | 208,389 |
| | 527,225 |
Personal Products - 1.2% |
Avon Products, Inc. | 442,400 | | 14,471 |
Gillette Co. | 6,831,200 | | 366,631 |
| | 381,102 |
Common Stocks - continued |
| Shares | | Value (Note 1)
(000s) |
CONSUMER STAPLES - continued |
Tobacco - 2.2% |
Altria Group, Inc. | 10,497,100 | | $ 702,886 |
TOTAL CONSUMER STAPLES | | 3,690,903 |
ENERGY - 7.0% |
Energy Equipment & Services - 0.6% |
Halliburton Co. | 2,302,900 | | 129,078 |
Schlumberger Ltd. (NY Shares) | 711,300 | | 59,564 |
Transocean, Inc. (a) | 173,100 | | 9,768 |
| | 198,410 |
Oil, Gas & Consumable Fuels - 6.4% |
Apache Corp. | 1,585,420 | | 108,443 |
BP PLC sponsored ADR | 5,358,000 | | 352,985 |
Chevron Corp. | 4,005,720 | | 232,372 |
Exxon Mobil Corp. | 22,779,094 | | 1,338,272 |
| | 2,032,072 |
TOTAL ENERGY | | 2,230,482 |
FINANCIALS - 19.0% |
Capital Markets - 2.8% |
Bank of New York Co., Inc. | 1,427,100 | | 43,926 |
Goldman Sachs Group, Inc. | 1,455,780 | | 156,467 |
Merrill Lynch & Co., Inc. | 4,506,200 | | 264,874 |
Morgan Stanley | 2,595,800 | | 137,707 |
Northern Trust Corp. | 3,497,023 | | 177,649 |
UBS AG (NY Shares) | 1,215,000 | | 99,581 |
| | 880,204 |
Commercial Banks - 3.2% |
Bank of America Corp. | 10,218,868 | | 445,543 |
Wachovia Corp. | 3,319,113 | | 167,217 |
Wells Fargo & Co. | 6,349,800 | | 389,497 |
| | 1,002,257 |
Consumer Finance - 5.5% |
American Express Co. | 6,042,190 | | 332,320 |
Capital One Financial Corp. (d) | 640,840 | | 52,869 |
SLM Corp. (e) | 26,676,530 | | 1,373,570 |
| | 1,758,759 |
Common Stocks - continued |
| Shares | | Value (Note 1)
(000s) |
FINANCIALS - continued |
Diversified Financial Services - 2.0% |
Citigroup, Inc. | 9,943,338 | | $ 432,535 |
JPMorgan Chase & Co. | 5,826,992 | | 204,760 |
| | 637,295 |
Insurance - 3.0% |
AFLAC, Inc. | 3,988,200 | | 179,868 |
Allstate Corp. | 308,700 | | 18,911 |
American International Group, Inc. | 9,432,770 | | 567,853 |
MBIA, Inc. | 3,033,700 | | 184,267 |
| | 950,899 |
Real Estate - 1.6% |
Equity Lifestyle Properties, Inc. (e) | 1,466,000 | | 64,607 |
Equity Office Properties Trust | 3,538,290 | | 125,432 |
Equity Residential (SBI) | 5,221,070 | | 210,931 |
Simon Property Group, Inc. | 871,000 | | 69,454 |
Vornado Realty Trust | 575,700 | | 51,030 |
| | 521,454 |
Thrifts & Mortgage Finance - 0.9% |
Fannie Mae | 1,627,520 | | 90,913 |
Freddie Mac | 1,368,000 | | 86,567 |
Golden West Financial Corp., Delaware | 1,592,500 | | 103,704 |
| | 281,184 |
TOTAL FINANCIALS | | 6,032,052 |
HEALTH CARE - 16.2% |
Biotechnology - 1.2% |
Amgen, Inc. (a) | 3,082,600 | | 245,837 |
Biogen Idec, Inc. (a) | 1,286,000 | | 50,527 |
Gilead Sciences, Inc. (a) | 750,000 | | 33,608 |
MedImmune, Inc. (a) | 578,300 | | 16,430 |
Protein Design Labs, Inc. (a) | 1,458,100 | | 33,230 |
| | 379,632 |
Health Care Equipment & Supplies - 3.1% |
Alcon, Inc. | 1,298,350 | | 148,726 |
Baxter International, Inc. | 4,802,130 | | 188,580 |
Becton, Dickinson & Co. | 1,709,320 | | 94,645 |
C.R. Bard, Inc. | 1,605,320 | | 107,219 |
Kinetic Concepts, Inc. (a) | 1,286,000 | | 77,121 |
Common Stocks - continued |
| Shares | | Value (Note 1)
(000s) |
HEALTH CARE - continued |
Health Care Equipment & Supplies - continued |
Medtronic, Inc. | 3,742,290 | | $ 201,859 |
St. Jude Medical, Inc. (a) | 1,686,140 | | 79,940 |
Stryker Corp. | 1,580,100 | | 85,468 |
| | 983,558 |
Health Care Providers & Services - 3.7% |
Aetna, Inc. | 836,320 | | 64,731 |
Cardinal Health, Inc. | 1,597,100 | | 95,155 |
IMS Health, Inc. | 706,619 | | 19,241 |
McKesson Corp. | 1,713,400 | | 77,103 |
UnitedHealth Group, Inc. | 16,670,700 | | 871,878 |
WebMD Corp. (a) | 5,439,046 | | 57,708 |
| | 1,185,816 |
Pharmaceuticals - 8.2% |
Abbott Laboratories | 6,843,300 | | 319,103 |
Allergan, Inc. | 1,399,600 | | 125,082 |
Eli Lilly & Co. | 1,263,402 | | 71,155 |
GlaxoSmithKline PLC sponsored ADR | 1,376,230 | | 65,288 |
Johnson & Johnson | 7,903,200 | | 505,489 |
Merck & Co., Inc. | 1,629,500 | | 50,612 |
Novartis AG sponsored ADR | 3,418,150 | | 166,498 |
Pfizer, Inc. | 18,940,469 | | 501,922 |
Roche Holding AG (participation certificate) | 1,705,800 | | 231,950 |
Sanofi-Aventis sponsored ADR | 1,483,800 | | 64,249 |
Schering-Plough Corp. | 9,867,960 | | 205,451 |
Sepracor, Inc. (a) | 500,000 | | 26,175 |
Wyeth | 5,955,800 | | 272,478 |
| | 2,605,452 |
TOTAL HEALTH CARE | | 5,154,458 |
INDUSTRIALS - 10.2% |
Aerospace & Defense - 2.7% |
Honeywell International, Inc. | 4,851,100 | | 190,551 |
Lockheed Martin Corp. | 2,375,340 | | 148,221 |
Northrop Grumman Corp. | 810,645 | | 44,950 |
Raytheon Co. | 2,182,800 | | 85,850 |
The Boeing Co. | 2,938,000 | | 193,937 |
United Technologies Corp. | 3,782,200 | | 191,758 |
| | 855,267 |
Common Stocks - continued |
| Shares | | Value (Note 1)
(000s) |
INDUSTRIALS - continued |
Air Freight & Logistics - 0.3% |
United Parcel Service, Inc. Class B | 1,220,283 | | $ 89,044 |
Airlines - 0.1% |
Southwest Airlines Co. | 3,761,961 | | 53,382 |
Commercial Services & Supplies - 0.9% |
Aramark Corp. Class B | 1,730,800 | | 48,185 |
Cintas Corp. | 990,827 | | 43,923 |
Equifax, Inc. | 1,545,900 | | 56,271 |
Robert Half International, Inc. | 1,236,300 | | 41,898 |
Waste Management, Inc. | 3,287,800 | | 92,453 |
| | 282,730 |
Electrical Equipment - 0.3% |
Emerson Electric Co. | 1,381,300 | | 90,890 |
Industrial Conglomerates - 5.3% |
3M Co. | 2,560,280 | | 192,021 |
General Electric Co. | 38,752,200 | | 1,336,951 |
Tyco International Ltd. | 5,218,950 | | 159,021 |
| | 1,687,993 |
Machinery - 0.3% |
Caterpillar, Inc. | 495,240 | | 26,698 |
Deere & Co. | 915,000 | | 67,280 |
| | 93,978 |
Road & Rail - 0.3% |
Burlington Northern Santa Fe Corp. | 1,313,200 | | 71,241 |
Norfolk Southern Corp. | 494,500 | | 18,400 |
| | 89,641 |
TOTAL INDUSTRIALS | | 3,242,925 |
INFORMATION TECHNOLOGY - 12.6% |
Communications Equipment - 1.5% |
Cisco Systems, Inc. (a) | 17,360,400 | | 332,452 |
QUALCOMM, Inc. | 4,006,300 | | 158,209 |
| | 490,661 |
Computers & Peripherals - 3.0% |
Dell, Inc. (a) | 8,559,250 | | 346,393 |
EMC Corp. (a) | 13,222,480 | | 181,016 |
Hewlett-Packard Co. | 4,847,100 | | 119,336 |
Common Stocks - continued |
| Shares | | Value (Note 1)
(000s) |
INFORMATION TECHNOLOGY - continued |
Computers & Peripherals - continued |
International Business Machines Corp. | 3,587,500 | | $ 299,413 |
Lexmark International, Inc. Class A (a) | 26,400 | | 1,655 |
| | 947,813 |
Electronic Equipment & Instruments - 0.2% |
Flextronics International Ltd. (a) | 4,430,500 | | 59,989 |
Internet Software & Services - 0.4% |
Google, Inc. Class A (sub. vtg.) | 98,910 | | 28,462 |
Yahoo!, Inc. (a) | 3,074,870 | | 102,516 |
| | 130,978 |
IT Services - 1.3% |
Accenture Ltd. Class A (a) | 1,704,500 | | 42,681 |
Automatic Data Processing, Inc. | 4,133,200 | | 183,555 |
DST Systems, Inc. (a) | 973,600 | | 49,420 |
First Data Corp. | 1,169,765 | | 48,124 |
Fiserv, Inc. (a) | 1,087,900 | | 48,270 |
Paychex, Inc. | 1,457,000 | | 50,864 |
| | 422,914 |
Semiconductors & Semiconductor Equipment - 2.5% |
Analog Devices, Inc. | 1,605,800 | | 62,947 |
Intel Corp. | 19,657,140 | | 533,495 |
KLA-Tencor Corp. | 1,088,200 | | 56,260 |
Maxim Integrated Products, Inc. | 2,231,600 | | 93,437 |
Microchip Technology, Inc. | 1,236,100 | | 38,406 |
| | 784,545 |
Software - 3.7% |
Microsoft Corp. | 39,948,639 | | 1,023,085 |
Oracle Corp. (a) | 7,000,872 | | 95,072 |
Symantec Corp. (a) | 2,529,081 | | 55,564 |
| | 1,173,721 |
TOTAL INFORMATION TECHNOLOGY | | 4,010,621 |
MATERIALS - 2.0% |
Chemicals - 1.8% |
Ashland, Inc. | 1,038,300 | | 63,804 |
BASF AG sponsored ADR | 565,600 | | 40,044 |
Dow Chemical Co. | 1,379,170 | | 66,131 |
E.I. du Pont de Nemours & Co. | 493,900 | | 21,080 |
Common Stocks - continued |
| Shares | | Value (Note 1)
(000s) |
MATERIALS - continued |
Chemicals - continued |
Monsanto Co. | 2,074,175 | | $ 139,737 |
Praxair, Inc. | 5,115,100 | | 252,635 |
| | 583,431 |
Metals & Mining - 0.1% |
Alcoa, Inc. | 684,300 | | 19,195 |
Paper & Forest Products - 0.1% |
International Paper Co. | 684,000 | | 21,614 |
TOTAL MATERIALS | | 624,240 |
TELECOMMUNICATION SERVICES - 7.2% |
Diversified Telecommunication Services - 6.8% |
ALLTEL Corp. | 2,153,450 | | 143,204 |
BellSouth Corp. | 17,513,700 | | 483,378 |
SBC Communications, Inc. | 30,749,200 | | 751,818 |
Verizon Communications, Inc. | 22,536,240 | | 771,415 |
| | 2,149,815 |
Wireless Telecommunication Services - 0.4% |
Crown Castle International Corp. (a) | 1,475,700 | | 32,111 |
Nextel Communications, Inc. Class A (a) | 2,769,700 | | 96,386 |
| | 128,497 |
TOTAL TELECOMMUNICATION SERVICES | | 2,278,312 |
UTILITIES - 1.7% |
Electric Utilities - 1.4% |
Entergy Corp. | 1,827,400 | | 142,428 |
Exelon Corp. | 1,783,250 | | 95,440 |
FPL Group, Inc. | 3,533,668 | | 152,372 |
Southern Co. | 1,269,300 | | 44,413 |
| | 434,653 |
Gas Utilities - 0.1% |
KeySpan Corp. | 811,419 | | 33,017 |
Independent Power Producers & Energy Traders - 0.1% |
Duke Energy Corp. | 1,644,000 | | 48,564 |
Common Stocks - continued |
| Shares | | Value (Note 1)
(000s) |
UTILITIES - continued |
Multi-Utilities - 0.1% |
Public Service Enterprise Group, Inc. | 551,100 | | $ 35,436 |
TOTAL UTILITIES | | 551,670 |
TOTAL COMMON STOCKS (Cost $20,470,124) | 31,438,868 |
Nonconvertible Preferred Stocks - 0.1% |
| | | |
FINANCIALS - 0.1% |
Thrifts & Mortgage Finance - 0.1% |
Fannie Mae 7.00% | 656,400 | | 36,496 |
TOTAL NONCONVERTIBLE PREFERRED STOCKS (Cost $32,820) | 36,496 |
Money Market Funds - 1.2% |
| | | |
Fidelity Cash Central Fund, 3.31% (b) | 331,309,673 | | 331,310 |
Fidelity Securities Lending Cash Central Fund, 3.32% (b)(c) | 34,095,150 | | 34,095 |
TOTAL MONEY MARKET FUNDS (Cost $365,405) | 365,405 |
TOTAL INVESTMENT PORTFOLIO - 100.2% (Cost $20,868,349) | | 31,840,769 |
NET OTHER ASSETS - (0.2)% | | (51,745) |
NET ASSETS - 100% | $ 31,789,024 |
Legend |
(a) Non-income producing |
(b) Affiliated fund that is available only to investment companies and other accounts managed by Fidelity Investments. The rate quoted is the annualized seven-day yield of the fund at period end. A complete listing of the fund's holdings as of its most recent quarter end is available upon request. |
(c) Investment made with cash collateral received from securities on loan. |
(d) Security or a portion of the security is on loan at period end. |
(e) Affiliated company |
Other Information |
An affiliated company is a company in which the fund has ownership of at least 5% of the voting securities. Companies which are affiliates of the fund at period-end are noted in the fund's Schedule of Investments. Transactions during the period with companies which are or were affiliates are as follows: |
Affiliates
(Amounts in thousands) | Value, beginning of period | Purchases | Sales Proceeds | Dividend Income | Value,
end of
period |
Equity Lifestyle Properties, Inc. (formerly Manufactured Home Communities, Inc.) | $ 46,458 | $ - | $ - | $ 14 | $ 64,607 |
SLM Corp. | 1,024,258 | 105,891 | 122,708 | 20,747 | 1,373,570 |
Total | $ 1,070,716 | $ 105,891 | $ 122,708 | $ 20,761 | $ 1,438,177 |
See accompanying notes which are an integral part of the financial statements.
Annual Report
Financial Statements
Statement of Assets and Liabilities
Amounts in thousands (except per-share amount) | July 31, 2005 |
| | |
Assets | | |
Investment in securities, at value (including securities loaned of $32,891) (cost $20,868,349) - See accompanying schedule | | $ 31,840,769 |
Receivable for investments sold | | 232,854 |
Receivable for fund shares sold | | 74,095 |
Dividends receivable | | 41,639 |
Interest receivable | | 1,679 |
Prepaid expenses | | 49 |
Other affiliated receivables | | 183 |
Other receivables | | 1,842 |
Total assets | | 32,193,110 |
| | |
Liabilities | | |
Payable for investments purchased | $ 314,220 | |
Payable for fund shares redeemed | 36,907 | |
Accrued management fee | 12,429 | |
Other affiliated payables | 6,225 | |
Other payables and accrued expenses | 210 | |
Collateral on securities loaned, at value | 34,095 | |
Total liabilities | | 404,086 |
| | |
Net Assets | | $ 31,789,024 |
Net Assets consist of: | | |
Paid in capital | | $ 19,818,094 |
Undistributed net investment income | | 33,293 |
Accumulated undistributed net realized gain (loss) on investments and foreign currency transactions | | 965,217 |
Net unrealized appreciation (depreciation) on investments | | 10,972,420 |
Net Assets, for 827,389 shares outstanding | | $ 31,789,024 |
Net Asset Value, offering price and redemption price per share ($31,789,024 ÷ 827,389 shares) | | $ 38.42 |
See accompanying notes which are an integral part of the financial statements.
Annual Report
Financial Statements - continued
Statement of Operations
Amounts in thousands | Year ended July 31, 2005 |
| | |
Investment Income | | |
Dividends (including $20,761 received from affiliated issuers) | | $ 574,079 |
Special Dividends | | 110,357 |
Interest | | 29,770 |
Security lending | | 740 |
Total income | | 714,946 |
| | |
Expenses | | |
Management fee | $ 146,708 | |
Transfer agent fees | 63,840 | |
Accounting and security lending fees | 1,955 | |
Independent trustees' compensation | 161 | |
Appreciation in deferred trustee compensation account | 30 | |
Custodian fees and expenses | 344 | |
Registration fees | 88 | |
Audit | 232 | |
Legal | 79 | |
Interest | 3 | |
Miscellaneous | 337 | |
Total expenses before reductions | 213,777 | |
Expense reductions | (3,149) | 210,628 |
Net investment income (loss) | | 504,318 |
Realized and Unrealized Gain (Loss) Net realized gain (loss) on: | | |
Investment securities (Including realized gain (loss) of $62,109 from affiliated issuers) | 1,191,897 | |
Foreign currency transactions | 108 | |
Total net realized gain (loss) | | 1,192,005 |
Change in net unrealized appreciation (depreciation) on investment securities | | 1,570,053 |
Net gain (loss) | | 2,762,058 |
Net increase (decrease) in net assets resulting from operations | | $ 3,266,376 |
See accompanying notes which are an integral part of the financial statements.
Annual Report
Statement of Changes in Net Assets
Amounts in thousands | Year ended
July 31,
2005 | Year ended
July 31,
2004 |
Increase (Decrease) in Net Assets | | |
Operations | | |
Net investment income (loss) | $ 504,318 | $ 338,806 |
Net realized gain (loss) | 1,192,005 | 1,042,653 |
Change in net unrealized appreciation (depreciation) | 1,570,053 | 1,223,009 |
Net increase (decrease) in net assets resulting
from operations | 3,266,376 | 2,604,468 |
Distributions to shareholders from net investment income | (507,409) | (349,784) |
Distributions to shareholders from net realized gain | (283,191) | - |
Total distributions | (790,600) | (349,784) |
Share transactions
Proceeds from sales of shares | 3,564,106 | 3,793,282 |
Reinvestment of distributions | 768,803 | 338,999 |
Cost of shares redeemed | (4,795,421) | (4,874,618) |
Net increase (decrease) in net assets resulting from share transactions | (462,512) | (742,337) |
Total increase (decrease) in net assets | 2,013,264 | 1,512,347 |
| | |
Net Assets | | |
Beginning of period | 29,775,760 | 28,263,413 |
End of period (including undistributed net investment income of $33,293 and undistributed net investment income of $36,084, respectively) | $ 31,789,024 | $ 29,775,760 |
Other Information Shares | | |
Sold | 95,778 | 108,237 |
Issued in reinvestment of distributions | 20,723 | 9,611 |
Redeemed | (128,848) | (138,812) |
Net increase (decrease) | (12,347) | (20,964) |
See accompanying notes which are an integral part of the financial statements.
Annual Report
Financial Highlights
Years ended July 31, | 2005 | 2004 | 2003 | 2002 | 2001 |
Selected Per-Share Data | | | | | |
Net asset value, beginning of period | $ 35.46 | $ 32.84 | $ 31.61 | $ 39.10 | $ 46.83 |
Income from Investment Operations | | | | | |
Net investment income (loss) B | .60 C | .40 | .40 | .34 | .39 |
Net realized and unrealized gain (loss) | 3.31 | 2.63 | 1.20 | (7.12) | (3.83) |
Total from investment operations | 3.91 | 3.03 | 1.60 | (6.78) | (3.44) |
Distributions from net investment income | (.61) | (.41) | (.37) | (.33) | (.38) |
Distributions from net realized gain | (.34) | - | - | (.38) | (3.91) |
Total distributions | (.95) | (.41) | (.37) | (.71) | (4.29) |
Net asset value, end of period | $ 38.42 | $ 35.46 | $ 32.84 | $ 31.61 | $ 39.10 |
Total Return A | 11.15% | 9.24% | 5.15% | (17.56)% | (8.25)% |
Ratios to Average Net Assets D | | | | | |
Expenses before expense reductions | .69% | .70% | .73% | .69% | .68% |
Expenses net of voluntary waivers, if any | .69% | .70% | .73% | .69% | .68% |
Expenses net of all reductions | .68% | .69% | .71% | .68% | .66% |
Net investment income (loss) | 1.63% C | 1.13% | 1.29% | .94% | .94% |
Supplemental Data | | | | | |
Net assets, end of period (in millions) | $ 31,789 | $ 29,776 | $ 28,263 | $ 27,849 | $ 36,099 |
Portfolio turnover rate | 31% | 30% | 33% | 36% | 46% |
A Total returns would have been lower had certain expenses not been reduced during the periods shown.
B Calculated based on average shares outstanding during the period.
C Investment income per share reflects a special dividend which amounted to $.13 per share. Excluding the special dividend, the ratio of net investment income to average net assets would have been 1.27%.
D Expense ratios reflect operating expenses of the fund. Expenses before reductions do not reflect amounts reimbursed by the investment adviser or reductions from brokerage service arrangements or other expense offset arrangements and do not represent the amount paid by the fund during periods when reimbursements or reductions occur. Expenses net of any voluntary waivers reflect expenses after reimbursement by the investment adviser but prior to reductions from brokerage service arrangements or other expense offset arrangements. Expenses net of all reductions represent the net expenses paid by the fund.
See accompanying notes which are an integral part of the financial statements.
Annual Report
Notes to Financial Statements
For the period ended July 31, 2005
(Amounts in thousands except ratios)
1. Significant Accounting Policies.
Fidelity Growth & Income Portfolio (the fund) is a fund of Fidelity Securities Fund (the trust) and is authorized to issue an unlimited number of shares. The trust is registered under the Investment Company Act of 1940, as amended (the 1940 Act), as an open-end management investment company organized as a Massachusetts business trust. The financial statements have been prepared in conformity with accounting principles generally accepted in the United States of America, which require management to make certain estimates and assumptions at the date of the financial statements. The following summarizes the significant accounting policies of the fund:
Security Valuation. Net asset value per share (NAV calculation) is calculated as of the close of business of the New York Stock Exchange, normally 4:00 p.m. Eastern time. Equity securities, including restricted securities, for which market quotations are available are valued at the last sale price or official closing price (closing bid price or last evaluated quote if no sale has occurred) on the primary market or exchange on which they trade. If prices are not readily available or do not accurately reflect fair value for a security, or if a security's value has been materially affected by events occurring after the close of the exchange or market on which the security is principally traded, that security may be valued by another method that the Board of Trustees believes accurately reflects fair value. A security's valuation may differ depending on the method used for determining value. Price movements in futures contracts and ADRs, market and trading trends, the bid/ask quotes of brokers and off-exchange institutional trading may be reviewed in the course of making a good faith determination of a security's fair value. Short-term securities with remaining maturities of sixty days or less for which quotations are not readily available are valued on the basis of amortized cost. Investments in open-end investment companies are valued at their net asset value each business day.
Foreign Currency. The fund uses foreign currency contracts to facilitate transactions in foreign-denominated securities. Losses from these transactions may arise from changes in the value of the foreign currency or if the counterparties do not perform under the contracts' terms.
Foreign-denominated assets, including investment securities, and liabilities are translated into U.S. dollars at the exchange rate at period end. Purchases and sales of investment securities, income and dividends received and expenses denominated in foreign currencies are translated into U.S. dollars at the exchange rate in effect on the transaction date.
The effects of exchange rate fluctuations on investments are included with the net realized and unrealized gain (loss) on investment securities. Other foreign currency transactions resulting in realized and unrealized gain (loss) are disclosed separately.
Annual Report
Notes to Financial Statements - continued
(Amounts in thousands except ratios)
1. Significant Accounting Policies - continued
Investment Transactions and Income. Security transactions are accounted for as of trade date. Gains and losses on securities sold are determined on the basis of identified cost and may include proceeds received from litigation. Dividend income is recorded on the ex-dividend date, except for certain dividends from foreign securities where the ex-dividend date may have passed, which are recorded as soon as the fund is informed of the ex-dividend date. Non-cash dividends included in dividend income, if any, are recorded at the fair market value of the securities received. Distributions received on securities that represent a return of capital or capital gain are recorded as a reduction of cost of investments and/or as a realized gain. The fund estimates the components of distributions received that may be considered return of capital distributions or capital gain distributions. Large, non-recurring dividends recognized by the fund are presented separately on the Statement of Operations as "Special Dividends" and the impact of these dividends is presented in the Financial Highlights. Interest income is accrued as earned. Interest income includes coupon interest and amortization of premium and accretion of discount on debt securities. Investment income is recorded net of foreign taxes withheld where recovery of such taxes is uncertain.
Expenses. Most expenses of the trust can be directly attributed to a fund. Expenses which cannot be directly attributed are apportioned among each fund in the trust.
Deferred Trustee Compensation. Under a Deferred Compensation Plan (the Plan), independent Trustees must defer receipt of a portion of, and may elect to defer receipt of an additional portion of, their annual compensation. Deferred amounts are treated as though equivalent dollar amounts had been invested in shares of the fund or are invested in a cross-section of other Fidelity funds, and are marked-to-market. Deferred amounts remain in the fund until distributed in accordance with the Plan.
Income Tax Information and Distributions to Shareholders. Each year, the fund intends to qualify as a regulated investment company by distributing all of its taxable income and realized gains under Subchapter M of the Internal Revenue Code. As a result, no provision for income taxes is required in the accompanying financial statements. Foreign taxes are provided for based on the fund's understanding of the tax rules and rates that exist in the foreign markets in which it invests.
Distributions are recorded on the ex-dividend date. Income and capital gain distributions are determined in accordance with income tax regulations, which may differ from generally accepted accounting principles. In addition, the fund will claim a portion of the payment made to redeeming shareholders as a distribution for income tax purposes.
Annual Report
1. Significant Accounting Policies - continued
Income Tax Information and Distributions to Shareholders - continued
Capital accounts within the financial statements are adjusted for permanent book-tax differences. These adjustments have no impact on net assets or the results of operations. Temporary book-tax differences will reverse in a subsequent period.
Book-tax differences are primarily due to foreign currency transactions and losses deferred due to wash sales.
The tax-basis components of distributable earnings and the federal tax cost as of period end were as follows:
Unrealized appreciation | $ 11,325,158 | |
Unrealized depreciation | (375,481) | |
Net unrealized appreciation (depreciation) | 10,949,677 | |
Undistributed ordinary income | 34,030 | |
Undistributed long-term capital gain | 936,645 | |
Cost for federal income tax purposes | $ 20,891,092 | |
The tax character of distributions paid was as follows:
| July 31, 2005 | July 31, 2004 |
Ordinary Income | $ 507,409 | $ 349,784 |
Long-term Capital Gains | 283,191 | - |
Total | $ 790,600 | $ 349,784 |
2. Operating Policies.
Repurchase Agreements. Fidelity Management & Research Company (FMR) has received an Exemptive Order from the Securities and Exchange Commission (the SEC) which permits the fund and other affiliated entities of FMR to transfer uninvested cash balances into joint trading accounts which are then invested in repurchase agreements. The fund may also invest directly with institutions in repurchase agreements. Repurchase agreements are collateralized by government or non-government securities. Collateral is held in segregated accounts with custodian banks and may be obtained in the event of a default of the counterparty. The fund monitors, on a daily basis, the value of the collateral to ensure it is at least equal to the principal amount of the repurchase agreement (including accrued interest). In the event of a default by the counterparty, realization of the collateral proceeds could be delayed, during which time the value of the collateral may decline.
Annual Report
Notes to Financial Statements - continued
(Amounts in thousands except ratios)
3. Purchases and Sales of Investments.
Purchases and sales of securities, other than short-term securities and U.S. government securities, aggregated $9,087,112 and $9,191,989, respectively.
4. Fees and Other Transactions with Affiliates.
Management Fee. FMR and its affiliates provide the fund with investment management related services for which the fund pays a monthly management fee. The management fee is the sum of an individual fund fee rate that is based on an annual rate of .20% of the fund's average net assets and a group fee rate that averaged .27% during the period. The group fee rate is based upon the average net assets of all the mutual funds advised by FMR. The group fee rate decreases as assets under management increase and increases as assets under management decrease. For the period, the total annual management fee rate was .47% of the fund's average net assets.
Transfer Agent Fees. Fidelity Service Company, Inc. (FSC), an affiliate of FMR, is the fund's transfer, dividend disbursing and shareholder servicing agent. FSC receives account fees and asset-based fees that vary according to account size and type of account. FSC pays for typesetting, printing and mailing of shareholder reports, except proxy statements. For the period, the transfer agent fees were equivalent to an annual rate of .21% of average net assets.
Accounting and Security Lending Fees. FSC maintains the fund's accounting records. The accounting fee is based on the level of average net assets for the month. Under a separate contract, FSC administers the security lending program. The security lending fee is based on the number and duration of lending transactions.
Central Funds. The fund may invest in affiliated Central Funds managed by Fidelity Investments Money Management, Inc. (FIMM), an affiliate of FMR. The Central Funds are open-end investment companies available only to investment companies and other accounts managed by FMR and its affiliates. The Money Market Central Funds seek preservation of capital and current income. The Central Funds do not pay a management fee. Income distributions earned by the fund are recorded as income in the accompanying financial statements and totaled $30,305 for the period.
Brokerage Commissions. The fund placed a portion of its portfolio transactions with brokerage firms which are affiliates of the investment adviser. The commissions paid to these affiliated firms were $201 for the period.
Annual Report
5. Committed Line of Credit.
The fund participates with other funds managed by FMR in a $4.2 billion credit facility (the "line of credit") to be utilized for temporary or emergency purposes to fund shareholder redemptions or for other short-term liquidity purposes. The fund has agreed to pay commitment fees on its pro rata portion of the line of credit. During the period, there were no borrowings on this line of credit.
6. Security Lending.
The fund lends portfolio securities from time to time in order to earn additional income. The fund receives collateral (in the form of U.S. Treasury obligations, letters of credit and/or cash) against the loaned securities and maintains collateral in an amount not less than 100% of the market value of the loaned securities during the period of the loan. The market value of the loaned securities is determined at the close of business of the fund and any additional required collateral is delivered to the fund on the next business day. If the borrower defaults on its obligation to return the securities loaned because of insolvency or other reasons, a fund could experience delays and costs in recovering the securities loaned or in gaining access to the collateral. Cash collateral is invested in the Fidelity Securities Lending Cash Central Fund. The value of loaned securities and cash collateral at period end are disclosed on the fund's Statement of Assets and Liabilities.
7. Bank Borrowings.
The fund is permitted to have bank borrowings for temporary or emergency purposes to fund shareholder redemptions. The fund has established borrowing arrangements with certain banks. The interest rate on the borrowings is the bank's base rate, as revised from time to time. The average daily loan balance during the period for which loans were outstanding amounted to $9,959. The weighted average interest rate was 3.25%. At period end, there were no bank borrowings outstanding.
8. Expense Reductions.
Many of the brokers with whom FMR places trades on behalf of the fund provided services to the fund in addition to trade execution. These services included payments of certain expenses on behalf of the fund totaling $3,051 for the period. In addition, through arrangements with the fund's transfer agent, credits realized as a result of uninvested cash balances were used to reduce the fund's expenses. During the period, these credits reduced the fund's transfer agent expenses by $98.
Annual Report
Notes to Financial Statements - continued
(Amounts in thousands except ratios)
9. Other.
The fund's organizational documents provide former and current trustees and officers with a limited indemnification against liabilities arising in connection with the performance of their duties to the fund. In the normal course of business, the fund may also enter into contracts that provide general indemnifications. The fund's maximum exposure under these arrangements is unknown as this would be dependent on future claims that may be made against the fund. The risk of material loss from such claims is considered remote.
Annual Report
Report of Independent Registered Public Accounting Firm
To the Trustees of Fidelity Securities Fund and the Shareholders of Fidelity Growth & Income Portfolio:
In our opinion, the accompanying statement of assets and liabilities, including the schedule of investments, and the related statements of operations and of changes in net assets and the financial highlights present fairly, in all material respects, the financial position of Fidelity Growth & Income Portfolio (a fund of Fidelity Securities Fund) at July 31, 2005 and the results of its operations, the changes in its net assets and the financial highlights for the periods indicated, in conformity with accounting principles generally accepted in the United States of America. These financial statements and financial highlights (hereafter referred to as "financial statements") are the responsibility of the Fidelity Growth & Income Portfolio's management; our responsibility is to express an opinion on these financial statements based on our audits. We conducted our audits of these financial statements in accordance with the standards of the Public Company Accounting Oversight Board (United States). Those standards require that we plan and perform the audit to obtain reasonable assurance about whether the financial statements are free of material misstatement. An audit includes examining, on a test basis, evidence supporting the amounts and disclosures in the financial statements, assessing the accounting principles used and significant estimates made by management, and evaluating the overall financial statement presentation. We believe that our audits, which included confirmation of securities at July 31, 2005 by correspondence with the custodian and brokers, provide a reasonable basis for our opinion.
/s/ PricewaterhouseCoopers LLP
PricewaterhouseCoopers LLP
Boston, Massachusetts
September 13, 2005
Annual Report
Trustees and Officers
The Trustees, Members of the Advisory Board, and executive officers of the trust and fund, as applicable, are listed below. The Board of Trustees governs the fund and is responsible for protecting the interests of shareholders. The Trustees are experienced executives who meet periodically throughout the year to oversee the fund's activities, review contractual arrangements with companies that provide services to the fund, and review the fund's performance. Except for William O. McCoy, Stephen P. Jonas, and Kenneth L. Wolfe, each of the Trustees oversees 320 funds advised by FMR or an affiliate. Mr. McCoy oversees 322 funds advised by FMR or an affiliate. Mr. Jonas and Mr. Wolfe oversee 311 funds advised by FMR or an affiliate.
The Trustees hold office without limit in time except that (a) any Trustee may resign; (b) any Trustee may be removed by written instrument, signed by at least two-thirds of the number of Trustees prior to such removal; (c) any Trustee who requests to be retired or who has become incapacitated by illness or injury may be retired by written instrument signed by a majority of the other Trustees; and (d) any Trustee may be removed at any special meeting of shareholders by a two-thirds vote of the outstanding voting securities of the trust. Each Trustee who is not an interested person (as defined in the 1940 Act) (Independent Trustee), shall retire not later than the last day of the calendar year in which his or her 72nd birthday occurs. The Independent Trustees may waive this mandatory retirement age policy with respect to individual Trustees. The executive officers and Advisory Board Members hold office without limit in time, except that any officer and Advisory Board member may resign or may be removed by a vote of a majority of the Trustees at any regular meeting or any special meeting of the Trustees. Except as indicated, each individual has held the office shown or other offices in the same company for the past five years.
The fund's Statement of Additional Information (SAI) includes more information about Trustees. To request a free copy, call Fidelity at 1-800-544-8544.
Interested Trustees*:
Correspondence intended for each Trustee who is an interested person may be sent to Fidelity Investments, 82 Devonshire Street, Boston, Massachusetts 02109.
Name, Age; Principal Occupation |
Edward C. Johnson 3d (75)** |
| Year of Election or Appointment: 1984 Mr. Johnson is Chairman of the Board of Trustees. Mr. Johnson serves as Chief Executive Officer, Chairman, and a Director of FMR Corp.; a Director and Chairman of the Board and of the Executive Committee of FMR; Chairman and a Director of Fidelity Management & Research (Far East) Inc.; Chairman and a Director of Fidelity Investments Money Management, Inc.; and Chairman (2001-present) and a Director (2000-present) of FMR Co., Inc. |
Abigail P. Johnson (43)** |
| Year of Election or Appointment: 2001 Ms. Johnson serves as President of Fidelity Employee Service Company (FESCO) (2005-present). She is President and a Director of Fidelity Investments Money Management, Inc. (2001-present), FMR Co., Inc. (2001-present), and a Director of FMR Corp. Previously, Ms. Johnson served as President and a Director of FMR (2001-2005), Senior Vice President of the Fidelity funds (2001-2005), and managed a number of Fidelity funds. |
Stephen P. Jonas (52) |
| Year of Election or Appointment: 2005 Mr. Jonas is Senior Vice President of Growth & Income (2005-present). He also serves as Senior Vice President of other Fidelity funds (2005-present). Mr. Jonas is Executive Director of FMR (2005-present). Previously, Mr. Jonas served as President of Fidelity Enterprise Operations and Risk Services (2004-2005), Chief Administrative Officer (2002-2004), and Chief Financial Officer of FMR Co. (1998-2000). Mr. Jonas has been with Fidelity Investments since 1987 and held various financial and management positions including Chief Financial Officer of FMR. In addition, he serves on the Boards of Boston Ballet (2003-present) and Simmons College (2003-present). |
Robert L. Reynolds (53) |
| Year of Election or Appointment: 2003 Mr. Reynolds is a Director (2003-present) and Chief Operating Officer (2002-present) of FMR Corp. He also serves on the Board at Fidelity Investments Canada, Ltd. (2000-present). Previously, Mr. Reynolds served as President of Fidelity Investments Institutional Retirement Group (1996-2000). |
* Trustees have been determined to be "Interested Trustees" by virtue of, among other things, their affiliation with the trust or various entities under common control with FMR.
** Edward C. Johnson 3d, Trustee, is Abigail P. Johnson's father.
Annual Report
Independent Trustees:
Correspondence intended for each Independent Trustee (that is, the Trustees other than the Interested Trustees) may be sent to Fidelity Investments, P.O. Box 55235, Boston, Massachusetts 02205-5235.
Name, Age; Principal Occupation |
Dennis J. Dirks (57) |
| Year of Election or Appointment: 2005 Prior to his retirement in May 2003, Mr. Dirks was Chief Operating Officer and a member of the Board of The Depository Trust & Clearing Corporation (DTCC) (1999-2003). He also served as President, Chief Operating Officer, and Board member of The Depository Trust Company (DTC) (1999-2003) and President and Board member of the National Securities Clearing Corporation (NSCC) (1999-2003). In addition, Mr. Dirks served as Chief Executive Officer and Board member of the Government Securities Clearing Corporation (2001-2003) and Chief Executive Officer and Board member of the Mortgage-Backed Securities Clearing Corporation (2001-2003). Mr. Dirks also serves as a Trustee of Manhattan College (2005-present). |
Robert M. Gates (61) |
| Year of Election or Appointment: 1997 Dr. Gates is Vice Chairman of the Independent Trustees (2005-present). Dr. Gates is President of Texas A&M University (2002-present). He was Director of the Central Intelligence Agency (CIA) from 1991 to 1993. From 1989 to 1991, Dr. Gates served as Assistant to the President of the United States and Deputy National Security Advisor. Dr. Gates is a Director of NACCO Industries, Inc. (mining and manufacturing), Parker Drilling Co., Inc. (drilling and rental tools for the energy industry, 2001-present), and Brinker International (restaurant management, 2003-present). Previously, Dr. Gates served as a Director of LucasVarity PLC (automotive components and diesel engines), a Director of TRW Inc. (automotive, space, defense, and information technology), and Dean of the George Bush School of Government and Public Service at Texas A&M University (1999-2001). Dr. Gates also is a Trustee of the Forum for International Policy. |
George H. Heilmeier (69) |
| Year of Election or Appointment: 2004 Dr. Heilmeier is Chairman Emeritus of Telcordia Technologies (communication software and systems), where prior to his retirement, he served as company Chairman and Chief Executive Officer. He currently serves on the Boards of Directors of The Mitre Corporation (systems engineering and information technology support for the government), and HRL Laboratories (private research and development, 2004-present). He is Chairman of the General Motors Science & Technology Advisory Board and a Life Fellow of the Institute of Electrical and Electronics Engineers (IEEE) (2000-present). Dr. Heilmeier is a member of the Defense Science Board and the National Security Agency Advisory Board. He is also a member of the National Academy of Engineering, the American Academy of Arts and Sciences, and the Board of Overseers of the School of Engineering and Applied Science of the University of Pennsylvania. Previously, Dr. Heilmeier served as a Director of TRW Inc. (automotive, space, defense, and information technology, 1992-2002), Compaq (1994-2002), Automatic Data Processing, Inc. (ADP) (technology-based business outsourcing, 1995-2002), INET Technologies Inc. (telecommunications network surveillance, 2001-2004), and Teletech Holdings (customer management services). He is the recipient of the 2005 Kyoto Prize in Advanced Technology for his invention of the liquid display. |
Marie L. Knowles (58) |
| Year of Election or Appointment: 2001 Prior to Ms. Knowles' retirement in June 2000, she served as Executive Vice President and Chief Financial Officer of Atlantic Richfield Company (ARCO) (diversified energy, 1996-2000). From 1993 to 1996, she was a Senior Vice President of ARCO and President of ARCO Transportation Company. She served as a Director of ARCO from 1996 to 1998. She currently serves as a Director of Phelps Dodge Corporation (copper mining and manufacturing) and McKesson Corporation (healthcare service, 2002-present). Ms. Knowles is a Trustee of the Brookings Institution and the Catalina Island Conservancy and also serves as a member of the Advisory Board for the School of Engineering of the University of Southern California. |
Ned C. Lautenbach (61) |
| Year of Election or Appointment: 2000 Mr. Lautenbach has been a partner of Clayton, Dubilier & Rice, Inc. (private equity investment firm) since September 1998. Previously, Mr. Lautenbach was with the International Business Machines Corporation (IBM) from 1968 until his retirement in 1998. Mr. Lautenbach serves as a Director of Italtel Holding S.p.A. (telecommunications (Milan, Italy), 2004-present) and Eaton Corporation (diversified industrial) as well as the Philharmonic Center for the Arts in Naples, Florida. He also is a member of the Board of Trustees of Fairfield University (2005-present), as well as a member of the Council on Foreign Relations. |
Marvin L. Mann (72) |
| Year of Election or Appointment: 1993 Mr. Mann is Chairman of the Independent Trustees (2001-present). He is Chairman Emeritus of Lexmark International, Inc. (computer peripherals), where he served as CEO until April 1998, retired as Chairman May 1999, and remains a member of the Board. Prior to 1991, he held the positions of Vice President of International Business Machines Corporation (IBM) and President and General Manager of various IBM divisions and subsidiaries. He is a member of the Executive Committee of the Independent Director's Council of the Investment Company Institute. In addition, Mr. Mann is a member of the President's Cabinet at the University of Alabama and the Board of Visitors of the Culverhouse College of Commerce and Business Administration at the University of Alabama. |
William O. McCoy (71) |
| Year of Election or Appointment: 1997 Prior to his retirement in December 1994, Mr. McCoy was Vice Chairman of the Board of BellSouth Corporation (telecommunications) and President of BellSouth Enterprises. He is currently a Director of Liberty Corporation (holding company), Duke Realty Corporation (real estate), and Progress Energy, Inc. (electric utility). He is also a partner of Franklin Street Partners (private investment management firm) and a member of the Research Triangle Foundation Board. In addition, Mr. McCoy served as the Interim Chancellor (1999-2000) and a member of the Board of Visitors for the University of North Carolina at Chapel Hill and currently serves on the Board of Directors of the University of North Carolina Health Care System and the Board of Visitors of the Kenan-Flagler Business School (University of North Carolina at Chapel Hill). He also served as Vice President of Finance for the University of North Carolina (16-school system). |
Cornelia M. Small (61) |
| Year of Election or Appointment: 2005 Ms. Small is a member (2000-present) and Chairperson (2002-present) of the Investment Committee, and a member (2002-present) of the Board of Trustees of Smith College. Previously, she served as Chief Investment Officer (1999-2000), Director of Global Equity Investments (1996-1999), and a member of the Board of Directors of Scudder, Stevens & Clark (1990-1997) and Scudder Kemper Investments (1997-1998). In addition, Ms. Small served as Co-Chair (2000-2003) of the Annual Fund for the Fletcher School of Law and Diplomacy. |
William S. Stavropoulos (66) |
| Year of Election or Appointment: 2002 Mr. Stavropoulos is Chairman of the Board (2000-present) and a Member of the Board of Directors of The Dow Chemical Company. Since joining The Dow Chemical Company in 1967, Mr. Stavropoulos served in numerous senior management positions, including President (1993-2000; 2002-2003), CEO (1995-2000; 2002-2004), and Chairman of the Executive Committee (2000-2004). Currently, he is a Director of NCR Corporation (data warehousing and technology solutions), BellSouth Corporation (telecommunications), Chemical Financial Corporation, Maersk Inc. (industrial conglomerate, 2002-present), and Metalmark Capital (private equity investment firm, 2005-present). He also serves as a member of the Board of Trustees of the American Enterprise Institute for Public Policy Research. In addition, Mr. Stavropoulos is a member of The Business Council, J.P. Morgan International Council and the University of Notre Dame Advisory Council for the College of Science. |
Kenneth L. Wolfe (66) |
| Year of Election or Appointment: 2005 Mr. Wolfe also serves as a Trustee (2005-present) or Member of the Advisory Board (2004-present) of other investment companies advised by FMR. Prior to his retirement in 2001, Mr. Wolfe was Chairman and Chief Executive Officer of Hershey Foods Corporation (1993-2001). He currently serves as a member of the boards of Adelphia Communications Corporation (2003-present), Bausch & Lomb, Inc., and Revlon Inc. (2004-present). |
Annual Report
Advisory Board Members and Executive Officers:
Correspondence intended for Mr. Gamper may be sent to Fidelity Investments, P.O. Box 55235, Boston, Massachusetts 02205-5235. Correspondence intended for each executive officer and Mr. Lynch may be sent to Fidelity Investments, 82 Devonshire Street, Boston, Massachusetts 02109.
Name, Age; Principal Occupation |
Albert R. Gamper, Jr. (63) |
| Year of Election or Appointment: 2005 Member of the Advisory Board of Fidelity Securities Fund. Prior to his retirement in December 2004, Mr. Gamper served as Chairman of the Board of CIT Group Inc. (commercial finance). During his tenure with CIT Group Inc. Mr. Gamper served in numerous senior management positions, including Chairman (1987-1989; 1999-2001; 2002-2004), Chief Executive Officer (1987-2004), and President (1989-2002). He currently serves as a member of the Board of Directors of Public Service Enterprise Group (utilities, 2001-present), Chairman of the Board of Governors, Rutgers University (2004-present), and Chairman of the Board of Saint Barnabas Health Care System. |
Peter S. Lynch (62) |
| Year of Election or Appointment: 2003 Member of the Advisory Board of Fidelity Securities Fund. Vice Chairman and a Director of FMR, and Vice Chairman (2001-present) and a Director (2000-present) of FMR Co., Inc. Previously, Mr. Lynch served as a Trustee of the Fidelity funds (1990-2003). In addition, he serves as a Trustee of Boston College, Massachusetts Eye & Ear Infirmary, Historic Deerfield, John F. Kennedy Library, and the Museum of Fine Arts of Boston. |
Dwight D. Churchill (51) |
| Year of Election or Appointment: 2005 Vice President of Growth & Income (2005-present). Mr. Churchill also serves as Vice President of certain Equity Funds (2005-present) and certain High Income Funds (2005-present). Previously, he served as Head of Fidelity's Fixed-Income Division (2000-2005), Vice President of Fidelity's Money Market Funds (2000-2005), Vice President of Fidelity's Bond Funds, and Senior Vice President of FIMM (2000) and FMR. Mr. Churchill joined Fidelity in 1993 as Vice President and Group Leader of Taxable Fixed-Income Investments. |
Steven Kaye (46) |
| Year of Election or Appointment: 1993 Vice president and manager of Growth & Income. Mr. Kaye also serves as Senior Vice President of FMR and FMR Co., Inc (2001). |
Eric D. Roiter (56) |
| Year of Election or Appointment: 1998 Secretary of Growth & Income. He also serves as Secretary of other Fidelity funds; Vice President, General Counsel, and Secretary of FMR Co., Inc. (2001-present) and FMR; Assistant Secretary of Fidelity Management & Research (U.K.) Inc. (2001-present), Fidelity Management & Research (Far East) Inc. (2001-present), and Fidelity Investments Money Management, Inc. (2001-present). Mr. Roiter is an Adjunct Member, Faculty of Law, at Boston College Law School (2003-present). Previously, Mr. Roiter served as Vice President and Secretary of Fidelity Distributors Corporation (FDC) (1998-2005). |
Stuart Fross (45) |
| Year of Election or Appointment: 2003 Assistant Secretary of Growth & Income. Mr. Fross also serves as Assistant Secretary of other Fidelity funds (2003-present), Vice President and Secretary of FDC (2005-present), and is an employee of FMR. |
Christine Reynolds (46) |
| Year of Election or Appointment: 2004 President, Treasurer, and Anti-Money Laundering (AML) officer of Growth & Income. Ms. Reynolds also serves as President, Treasurer, and AML officer of other Fidelity funds (2004) and is a Vice President (2003) and an employee (2002) of FMR. Before joining Fidelity Investments, Ms. Reynolds worked at PricewaterhouseCoopers LLP (PwC) (1980-2002), where she was most recently an audit partner with PwC's investment management practice. |
Timothy F. Hayes (54) |
| Year of Election or Appointment: 2002 Chief Financial Officer of Growth & Income. Mr. Hayes also serves as Chief Financial Officer of other Fidelity funds (2002-present) and President of Fidelity Investment Operations (2005-present) which includes Fidelity Pricing and Cash Management Services Group (FPCMS), where he served as President (1998-2005). Mr. Hayes serves as President of Fidelity Service Company (2003-present) where he also serves as a Director. Mr. Hayes also served as President of Fidelity Investments Operations Group (FIOG, 2002-2005). |
Kenneth A. Rathgeber (58) |
| Year of Election or Appointment: 2004 Chief Compliance Officer of Growth & Income. Mr. Rathgeber also serves as Chief Compliance Officer of other Fidelity funds (2004) and Executive Vice President of Risk Oversight for Fidelity Investments (2002). Previously, he served as Executive Vice President and Chief Operating Officer for Fidelity Investments Institutional Services Company, Inc. (1998-2002). |
John R. Hebble (47) |
| Year of Election or Appointment: 2003 Deputy Treasurer of Growth & Income. Mr. Hebble also serves as Deputy Treasurer of other Fidelity funds (2003), and is an employee of FMR. Before joining Fidelity Investments, Mr. Hebble worked at Deutsche Asset Management where he served as Director of Fund Accounting (2002-2003) and Assistant Treasurer of the Scudder Funds (1998-2003). |
Bryan A. Mehrmann (44) |
| Year of Election or Appointment: 2005 Deputy Treasurer of Growth & Income. Mr. Mehrmann also serves as Deputy Treasurer of other Fidelity funds (2005-present) and is an employee of FMR. Previously, Mr. Mehrmann served as Vice President of Fidelity Investments Institutional Services Group (FIIS)/Fidelity Investments Institutional Operations Corporation, Inc. (FIIOC) Client Services (1998-2004). |
Kimberley H. Monasterio (41) |
| Year of Election or Appointment: 2004 Deputy Treasurer of Growth & Income. Ms. Monasterio also serves as Deputy Treasurer of other Fidelity funds (2004) and is an employee of FMR (2004). Before joining Fidelity Investments, Ms. Monasterio served as Treasurer (2000-2004) and Chief Financial Officer (2002-2004) of the Franklin Templeton Funds and Senior Vice President of Franklin Templeton Services, LLC (2000-2004). |
Kenneth B. Robins (35) |
| Year of Election or Appointment: 2005 Deputy Treasurer of Growth & Income. Mr. Robins also serves as Deputy Treasurer of other Fidelity funds (2005-present) and is an employee of FMR (2004-present). Before joining Fidelity Investments, Mr. Robins worked at KPMG LLP, where he was a partner in KPMG's department of professional practice (2002-2004) and a Senior Manager (1999-2000). In addition, Mr. Robins served as Assistant Chief Accountant, United States Securities and Exchange Commission (2000-2002). |
Robert G. Byrnes (38) |
| Year of Election or Appointment: 2005 Assistant Treasurer of Growth & Income. Mr. Byrnes also serves as Assistant Treasurer of other Fidelity funds (2005-present) and is an employee of FMR (2005-present). Previously, Mr. Byrnes served as Vice President of FPCMS (2003-2005). Before joining Fidelity Investments, Mr. Byrnes worked at Deutsche Asset Management where he served as Vice President of the Investment Operations Group (2000-2003). |
John H. Costello (58) |
| Year of Election or Appointment: 1986 Assistant Treasurer of Growth & Income. Mr. Costello also serves as Assistant Treasurer of other Fidelity funds and is an employee of FMR. |
Peter L. Lydecker (51) |
| Year of Election or Appointment:2004 Assistant Treasurer of Growth & Income. Mr. Lydecker also serves as Assistant Treasurer of other Fidelity funds (2004) and is an employee of FMR. |
Mark Osterheld (50) |
| Year of Election or Appointment: 2002 Assistant Treasurer of Growth & Income. Mr. Osterheld also serves as Assistant Treasurer of other Fidelity funds (2002) and is an employee of FMR. |
Gary W. Ryan (46) |
| Year of Election or Appointment: 2005 Assistant Treasurer of Growth & Income. Mr. Ryan also serves as Assistant Treasurer of other Fidelity funds (2005-present) and is an employee of FMR (2005-present). Previously, Mr. Ryan served as Vice President of Fund Reporting in FPCMS (1999-2005). |
Salvatore Schiavone (39) |
| Year of Election or Appointment: 2005 Assistant Treasurer of Growth & Income. Mr. Schiavone also serves as Assistant Treasurer of other Fidelity funds (2005-present) and is an employee of FMR (2005-present). Before joining Fidelity Investments, Mr. Schiavone worked at Deutsche Asset Management, where he most recently served as Assistant Treasurer (2003-2005) of the Scudder Funds and Vice President and Head of Fund Reporting (1996-2003). |
Annual Report
Distributions
The Board of Trustees of Fidelity Growth & Income Portfolio voted to pay on September 12, 2005, to shareholders of record at the opening of business on September 9, 2005, a distribution of $1.14 per share derived from capital gains realized from sales of portfolio securities.
The fund hereby designates as capital gain dividends: For dividends with respect to the taxable year ended July 31, 2005, $1,177,336,000, or, if subsequently determined to be different, the net capital gain of such year.
A total of .23% of the dividends distributed during the fiscal year was derived from interest on U.S. Government securities which is generally exempt from state income tax.
The fund designates 100% of the dividends distributed during the fiscal year as qualifying for the dividends-received deduction for corporate shareholders.
The fund designates 100% of the dividends distributed during the fiscal year as amounts which may be taken into account as a dividend for the purposes of the maximum rate under section 1(h)(11) of the Internal Revenue Code.
The fund will notify shareholders in January 2006 of amounts for use in preparing 2005 income tax returns.
Annual Report
Board Approval of Investment Advisory Contracts and Management Fees
Fidelity Growth & Income Portfolio
Each year, typically in July, the Board of Trustees, including the independent Trustees (together, the Board), votes on the renewal of the management contract and sub-advisory agreements (together, the Advisory Contracts) for the fund. The Board, assisted by the advice of fund counsel and independent Trustees' counsel, requests and considers a broad range of information throughout the year.
The Board meets regularly each month except August and takes into account throughout the year matters bearing on Advisory Contracts. The Board, acting directly and through its separate committees, considers at each of its meetings factors that are relevant to the annual renewal of the fund's Advisory Contracts, including the services and support provided to the fund and its shareholders by Fidelity. At the time of the renewal, the Board had 11 standing committees, each composed of independent Trustees with varying backgrounds, to which the Board has assigned specific subject matter responsibilities in order to enhance effective decision-making by the Board. Each committee has adopted a written charter outlining the structure and purposes of the committee. One such committee, the Equity Contract Committee, meets periodically during the first six months of each year and as necessary to consider matters specifically related to the annual renewal of Advisory Contracts. The committee requests and receives information on, and makes recommendations to the independent Trustees concerning, the approval and annual review of the Advisory Contracts.
At its July 2005 meeting, the Board of Trustees, including the independent Trustees, unanimously determined to renew the Advisory Contracts for the fund. In reaching its determination, the Board considered all factors it believed relevant, including (1) the nature, extent, and quality of the services to be provided to the fund and its shareholders by Fidelity (including the investment performance of the fund); (2) the competitiveness of the management fee and total expenses of the fund; (3) the total costs of the services to be provided by and the profits to be realized by the investment adviser and its affiliates from the relationship with the fund; (4) the extent to which economies of scale would be realized as the fund grows; and (5) whether fee levels reflect these economies of scale, if any, for the benefit of fund shareholders.
In determining whether to renew the Advisory Contracts for the fund, the Board ultimately reached a determination, with the assistance of fund counsel and independent Trustees' counsel, that the renewal of the Advisory Contracts and the compensation to be received by Fidelity under the management contract is consistent with Fidelity's fiduciary duty under applicable law. In addition to evaluating the specific factors noted above, the Board, in reaching its determination, is aware that shareholders in the fund have a broad range of investment choices available to them, including a wide choice among mutual funds offered by competitors to Fidelity, and that the fund's shareholders, with the opportunity to review and weigh the disclosure provided by the fund in its prospectus and other public disclosures, have chosen to invest in this fund, managed by Fidelity.
Annual Report
Board Approval of Investment Advisory Contracts and
Management Fees - continued
Nature, Extent, and Quality of Services Provided by Fidelity. The Board considered staffing within the investment adviser, FMR, and the sub-advisers (together, the Investment Advisers), including the background of the fund's portfolio manager and the fund's investment objective and discipline. The independent Trustees also had discussions with senior management of Fidelity's investment operations and investment groups. The Board considered the structure of the portfolio manager compensation program and whether this structure provides appropriate incentives.
Fidelity Resources Dedicated to Investment Management and Support Services. The Board reviewed the size, education, and experience of the Investment Advisers' investment staff, their use of technology, and the Investment Advisers' approach to recruiting, training, and retaining portfolio managers and other research, advisory, and management personnel. The Board considered Fidelity's extensive global research capabilities that enable the Investment Advisers to aggregate data from various sources in an effort to produce positive investment results. The Board noted that Fidelity's analysts have access to a variety of technological tools that enable them to perform both fundamental and quantitative analysis and to specialize in various disciplines. The Board also considered that Fidelity's portfolio managers and analysts have access to daily portfolio attribution that allows for monitoring of a fund's portfolio, as well as an electronic communication system that provides immediate real-time access to research concerning issuers and credit enhancers.
Shareholder and Administrative Services. The Board considered the nature, extent, quality, and cost of administrative, distribution, and shareholder services performed by the Investment Advisers and their affiliates under the Advisory Contracts and under separate agreements covering transfer agency, pricing and bookkeeping, and securities lending services for the fund. The Board also considered the nature and extent of the Investment Advisers' supervision of third party service providers, principally custodians and subcustodians. The Board reviewed the allocation of fund brokerage, including allocations to brokers affiliated with the Investment Advisers, the use of brokerage commissions to pay fund expenses, and the use of "soft" commission dollars to pay for research services. The Board also considered that Fidelity voluntarily decided in 2004 to stop using "soft" commission dollars to pay for market data and, instead, to pay for that data out of its own resources. The Board also considered the resources devoted to, and the record of compliance with, the fund's compliance policies and procedures.
The Board noted that the growth of fund assets across the complex allows Fidelity to reinvest in the development of services designed to enhance the value or convenience of the Fidelity funds as investment vehicles. These services include 24-hour access to account information and market information through phone representatives and over the Internet, and investor education materials and asset allocation tools.
Annual Report
Investment in a Large Fund Family. The Board considered the benefits to shareholders of investing in a Fidelity fund, including the benefits of investing in a fund that is part of a large family of funds offering a variety of investment disciplines and providing for a large variety of mutual fund investor services. For example, fund shareholders are offered the privilege of exchanging shares of the fund for shares of other Fidelity funds, as set forth in the fund's prospectus, without paying a sales charge. The Board noted that, since the last Advisory Contract renewals in July 2004, Fidelity has taken a number of actions that benefited particular funds, including (i) voluntarily deciding in 2004 to stop using "soft" commission dollars to pay for market data and, instead, to pay for that data out of its own resources, (ii) contractually agreeing to impose management fee reductions and expense limitations on its five Spartan stock index funds and its stock index fund available through variable insurance products, (iii) contractually agreeing to eliminate the management fees on the Fidelity Freedom Funds and the Fidelity Advisor Freedom Funds, (iv) contractually agreeing to reduce the management fees on most of its investment-grade taxable bond funds, and (v) contractually agreeing to impose expense limitations on its retail and Spartan investment-grade taxable bond funds.
Investment Performance and Compliance. The Board considered whether the fund has operated within its investment objective, as well as its record of compliance with its investment restrictions. It also reviewed the fund's absolute investment performance, as well as the fund's relative investment performance measured against (i) a broad-based securities market index, and (ii) a peer group of mutual funds deemed appropriate by the Board over multiple periods. The following charts considered by the Board show, over the one-, three-, and five-year periods ended December 31, 2004, the fund's returns, the returns of a broad-based securities market index ("benchmark"), and a range of returns of a peer group of mutual funds identified by Lipper Inc. as having an investment objective similar to that of the fund. The box within each chart shows the 25th percentile return (bottom of box) and the 75th percentile return (top of box) of the Lipper peer group. Returns shown above the box are in the first quartile and returns shown below the box are in the fourth quartile. The percentage beaten number noted below each chart corresponds to the percentile box and represents the percentage of funds in the Lipper peer group whose performance was equal to or lower than that of the fund.
Annual Report
Board Approval of Investment Advisory Contracts and
Management Fees - continued
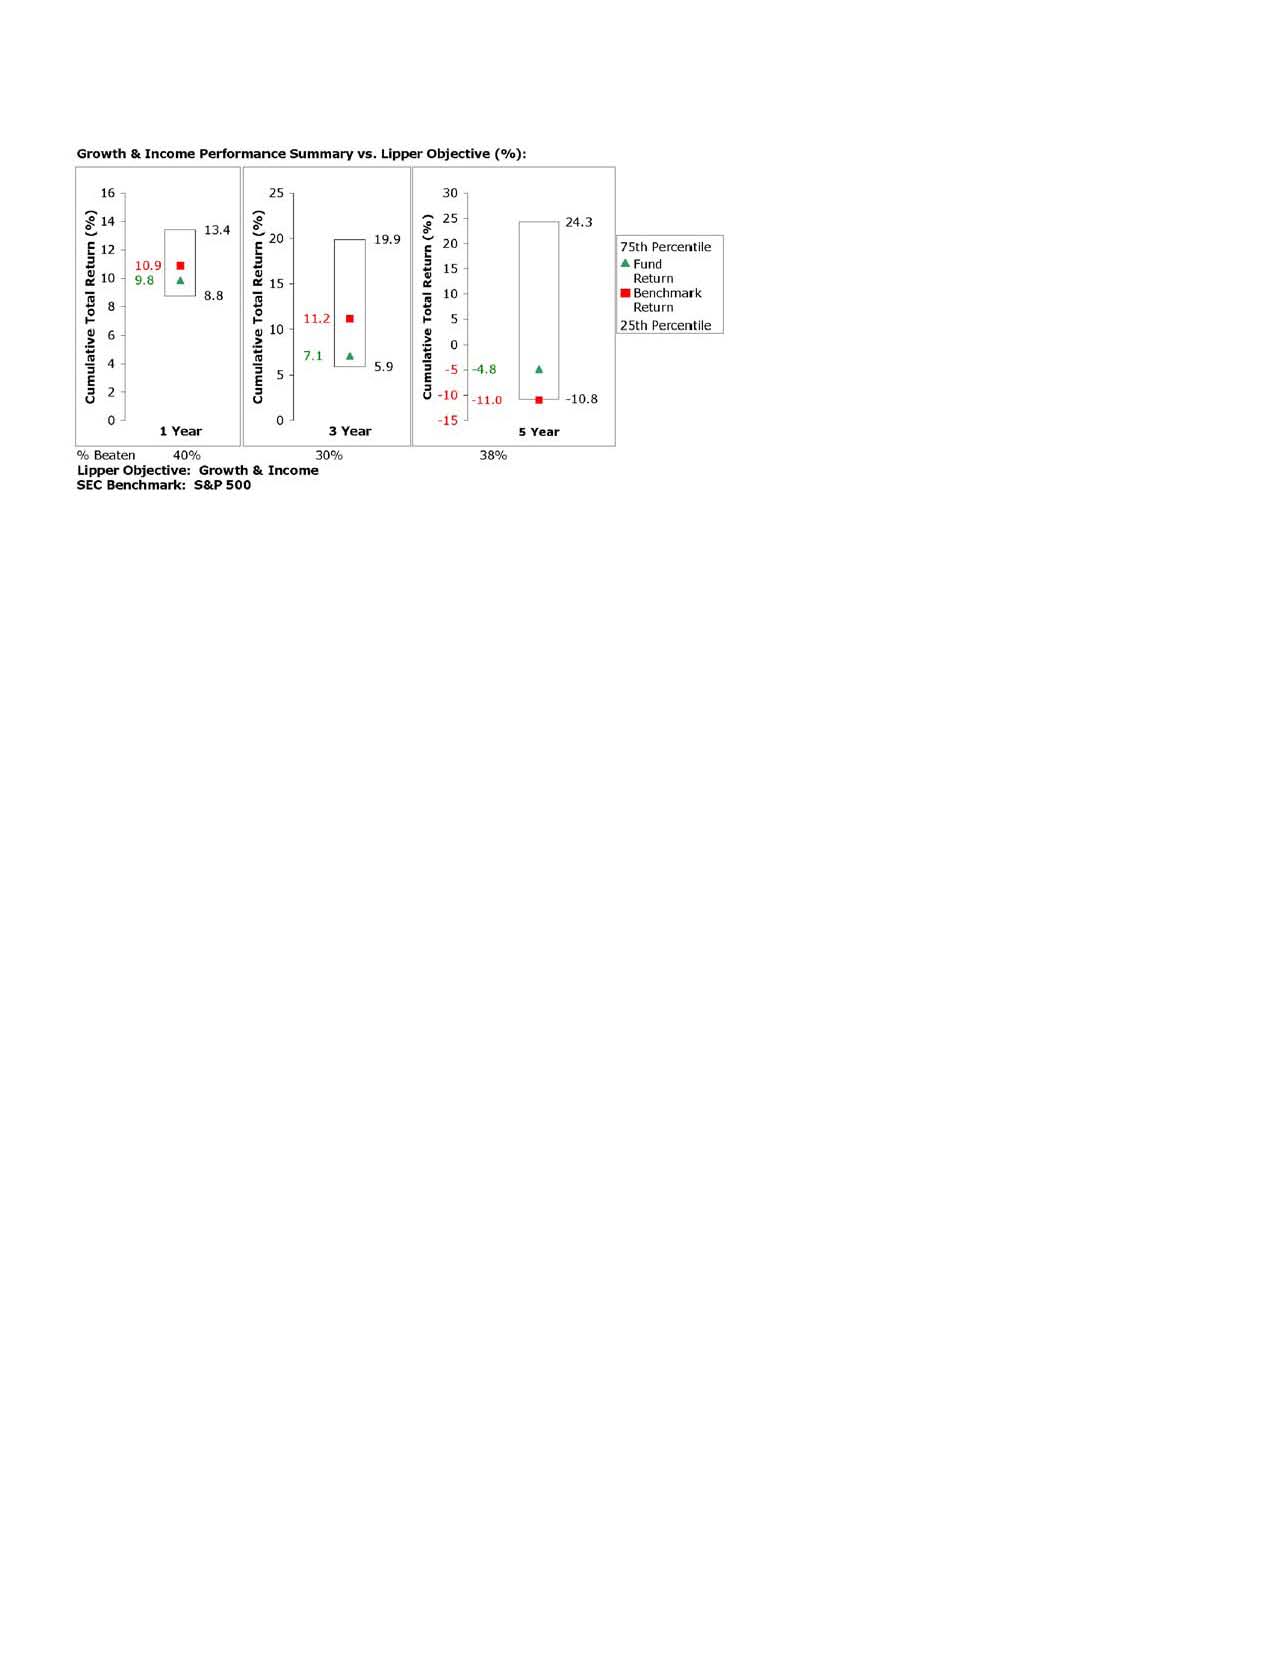
The Board reviewed the fund's relative investment performance against its Lipper peer group and stated that the performance of the fund was in the third quartile for the one-, three-, and five-year periods. The Board also stated that the relative investment performance of the fund was lower than its benchmark for certain periods, although the five-year cumulative total return of the fund was higher than its benchmark. The Board discussed with FMR actions to be taken by FMR to improve the fund's disappointing performance.
The Board has had thorough discussions with FMR throughout the year about the Board's and FMR's concerns about equity research, equity fund performance, and compliance with internal policies governing gifts and entertainment. FMR has taken steps that it believes will refocus and strengthen equity research and equity portfolio management and compliance. The Board noted with favor FMR's recent reorganization of its senior management team and FMR's plans to dedicate additional resources to investment research, and participated in the process that led to those changes.
Based on its review, and giving particular weight to the nature and quality of the resources dedicated by the Investment Advisers to maintain and improve relative performance, the Board concluded that the nature, extent, and quality of the services provided by Fidelity will benefit the fund's shareholders, particularly in light of the Board's view that the fund's shareholders benefit from investing in a fund that is part of a large family of funds offering a variety of investment disciplines and services.
Competitiveness of Management Fee and Total Fund Expenses. The Board considered the fund's management fee and total expenses compared to "mapped groups" of competitive funds and classes. Fidelity creates "mapped groups" by combining similar Lipper investment objective categories that have comparable management fee characteristics. Combining Lipper investment objective categories aids the Board's management fee and total expense comparisons by broadening the competitive group used for comparison and by reducing the number of universes to which various Fidelity funds are compared.
Annual Report
The Board considered two proprietary management fee comparisons for the 12-month periods shown in the chart below. The group of Lipper funds used by the Board for management fee comparisons is referred to below as the "Total Mapped Group" and, for the reasons explained above, is broader than the Lipper peer group used by the Board for performance comparisons. The Total Mapped Group comparison focuses on a fund's standing relative to the total universe of comparable funds available to investors, in terms of gross management fees before expense reimbursements or caps. "TMG %" represents the percentage of funds in the Total Mapped Group that had management fees that were lower than the fund's. For example, a TMG % of 21% means that 79% of the funds in the Total Mapped Group had higher management fees than the fund. The "Asset-Size Peer Group" (ASPG) comparison focuses on a fund's standing relative to non-Fidelity funds similar in size to the fund within the Total Mapped Group. The ASPG represents at least 15% of the funds in the Total Mapped Group with comparable asset size and management fee characteristics, subject to a minimum of 50 funds (or all funds in the Total Mapped Group if fewer than 50). Additional information, such as the ASPG quartile ("quadrant") in which the fund's management fee ranked, is also included in the chart and considered by the Board.
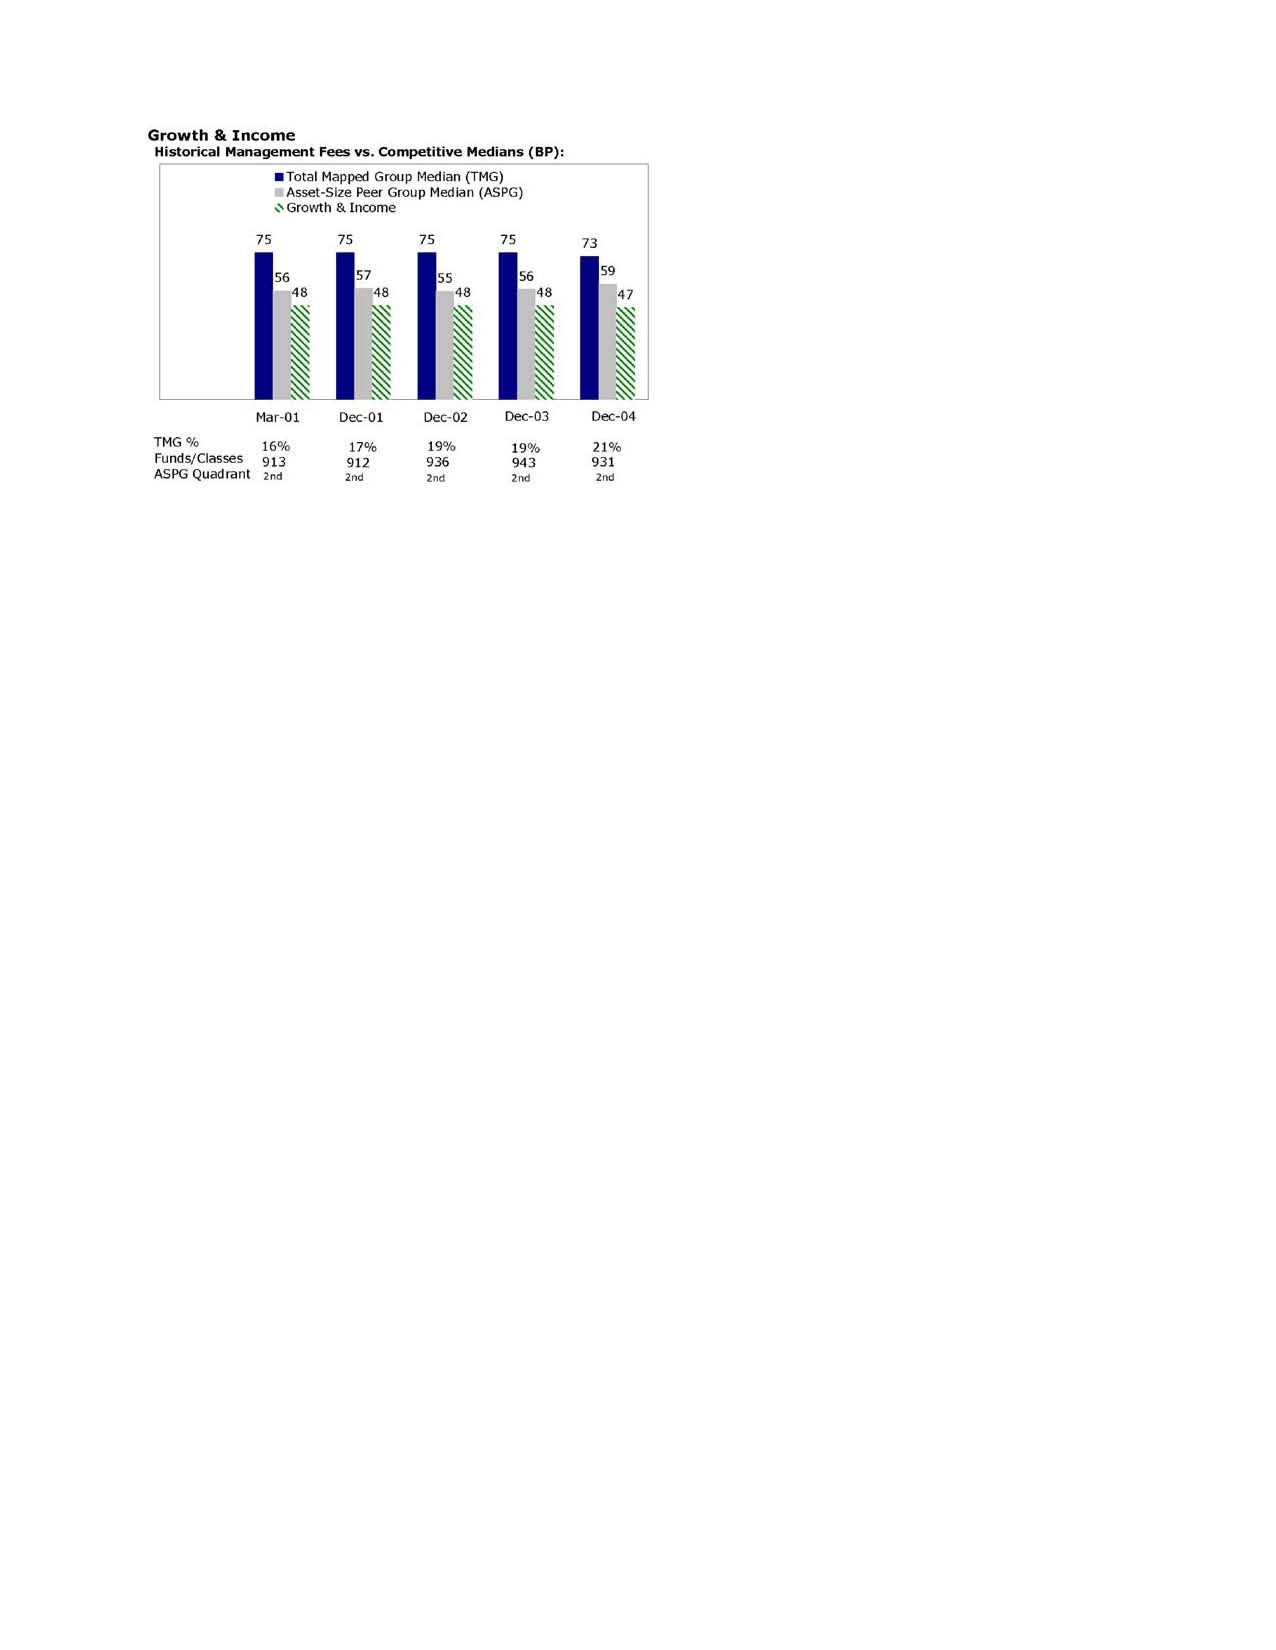
The Board noted that the fund's management fee ranked below the median of its Total Mapped Group and below the median of its ASPG for 2004.
Annual Report
Board Approval of Investment Advisory Contracts and
Management Fees - continued
Based on its review, the Board concluded that the fund's management fee was fair and reasonable in light of the services that the fund receives and the other factors considered.
In its review of the fund's total expenses, the Board considered the fund's management fee as well as other fund expenses, such as transfer agent fees, pricing and bookkeeping fees, and custodial, legal, and audit fees. The Board also noted the effects of any waivers and reimbursements on fees and expenses. As part of its review, the Board also considered current and historical total expenses of the fund compared to competitive fund median expenses. The fund is compared to those funds and classes in the Total Mapped Group (used by the Board for management fee comparisons) that have a similar sales load structure.
The Board noted that the fund's total expenses ranked below its competitive median for 2004.
In its review of total expenses, the Board also considered Fidelity fee structures and other information on clients that FMR and its affiliates service in other competitive markets, such as other mutual funds advised or subadvised by FMR or its affiliates, pension plan clients, and other institutional clients.
Based on its review, the Board concluded that the fund's total expenses were reasonable in light of the services that the fund and its shareholders receive and the other factors considered.
Costs of the Services and Profitability. The Board considered the revenues earned and the expenses incurred by Fidelity in conducting the business of developing, marketing, distributing, managing, administering and servicing the fund and its shareholders. The Board also considered the level of Fidelity's profits in respect of all the Fidelity funds.
On an annual basis, FMR presents to the Board Fidelity's profitability for the fund. Fidelity calculates the profitability for each fund, as well as aggregate profitability for groups of Fidelity funds and all Fidelity funds, using a series of detailed revenue and cost allocation methodologies which originate with the audited books and records of Fidelity. The Audit Committee of the Board reviews any significant changes from the prior year's methodologies.
PricewaterhouseCoopers LLP (PwC), independent registered accounting firm and auditor to Fidelity and certain Fidelity funds, has been engaged annually by the Board as part of the Board's assessment of the results of Fidelity's profitability analysis. PwC's engagement includes the review and assessment of Fidelity's methodologies used in determining the revenues and expenses attributable to Fidelity's mutual fund business, and completion of agreed-upon procedures surrounding the mathematical accuracy of fund profitability and its conformity to allocation methodologies. After considering PwC's reports issued under the engagement and information provided by Fidelity, the Board believes that while other allocation methods may also be reasonable, Fidelity's profitability methodologies are reasonable in all material respects.
Annual Report
The Board has also reviewed Fidelity's non-fund businesses and any fall-out benefits related to the mutual fund business as well as cases where Fidelity's affiliates may benefit from or be related to the fund's business. In addition, a special committee of the Board reviewed services provided to Fidelity by its affiliates and determined that the fees that Fidelity paid for such services were reasonable.
The Board considered the costs of the services provided by and the profits realized by Fidelity in connection with the operation of the fund and determined that the amount of profit is a fair entrepreneurial profit for the management of the fund.
Economies of Scale. The Board considered whether there have been economies of scale in respect of the management of the Fidelity funds, whether the Fidelity funds (including the fund) have appropriately benefited from any such economies of scale, and whether there is potential for realization of any further economies of scale. The Board considered the extent to which the fund will benefit from economies of scale through increased services to the fund, through waivers or reimbursements, or through fee or expense reductions, including reductions that occur through operation of the transfer agent agreement. The transfer agent fee varies in part based on the number of accounts in the fund. If the number of accounts decreases or the average account size increases, the overall transfer agent fee rate decreases.
The Board recognized that the fund's management contract incorporates a "group fee" structure, which provides for lower fee rates as total fund assets under FMR's management increase, and for higher fee rates as total fund assets under FMR's management decrease. The Board considered that the group fee is designed to deliver the benefits of economies of scale to fund shareholders when total fund assets increase, even if assets of any particular fund are unchanged or have declined, because some portion of Fidelity's costs are attributable to services provided to all Fidelity funds, and all funds benefit if those costs can be allocated among more assets. The Board concluded that, given the group fee structure, fund shareholders will achieve a certain level of economies of scale as assets under FMR's management increase at the fund complex level, regardless of whether Fidelity achieves any such economies of scale.
The Board further concluded that any potential economies of scale are being shared between fund shareholders and Fidelity in an appropriate manner.
Additional Information Requested by the Board. In order to develop fully the factual basis for consideration of the Advisory Contracts, the Board requested additional information regarding (i) equity fund transfer agency fees; (ii) Fidelity's fund profitability methodology and the impact of various changes in the methodology over time; (iii) benefits to shareholders from economies of scale; (iv) composition and characteristics of various fund and industry data used in comparisons; and (v) compensation of portfolio managers and research analysts.
Annual Report
Board Approval of Investment Advisory Contracts and
Management Fees - continued
Based on its evaluation of all of the conclusions noted above, and after considering all material factors, the Board ultimately concluded that the existing advisory fee structures are fair and reasonable, and that the fund's existing Advisory Contracts should be renewed.
Annual Report
Investment Adviser
Fidelity Management & Research Company
Boston, MA
Investment Sub-Advisers
FMR Co., Inc.
Fidelity Management & Research
(Far East) Inc.
Fidelity Management & Research
(U.K.) Inc.
Fidelity Investments Japan Limited
Fidelity International Investment
Advisors
Fidelity International Investment
Advisors (U.K.) Limited
General Distributor
Fidelity Distributors Corporation
Boston, MA
Transfer and Service Agent
Fidelity Service Company, Inc.
Boston, MA
Custodian
JPMorgan Chase Bank
New York, NY
The Fidelity Telephone Connection
Mutual Fund 24-Hour Service
Exchanges/Redemptions
and Account Assistance 1-800-544-6666
Product Information 1-800-544-6666
Retirement Accounts 1-800-544-4774
(8 a.m. - 9 p.m.)
TDD Service 1-800-544-0118
for the deaf and hearing impaired
(9 a.m. - 9 p.m. Eastern time)
Fidelity Automated Service
Telephone (FAST®) (automated graphic) 1-800-544-5555
(automated graphic) Automated line for quickest service
GAI-UANNPRO-0905
1.789247.102
(Fidelity Investment logo)(registered trademark)
Corporate Headquarters
82 Devonshire St., Boston, MA 02109
www.fidelity.com
Fidelity®
International Real Estate
Fund
Annual Report
July 31, 2005
(2_fidelity_logos) (Registered_Trademark)
Contents
Chairman's Message | <Click Here> | Ned Johnson's message to shareholders. |
Performance | <Click Here> | How the fund has done over time. |
Management's Discussion | <Click Here> | The manager's review of fund performance, strategy and outlook. |
Shareholder Expense Example | <Click Here> | An example of shareholder expenses. |
Investment Changes | <Click Here> | A summary of major shifts in the fund's investments over the past six months. |
Investments | <Click Here> | A complete list of the fund's investments with their market values. |
Financial Statements | <Click Here> | Statements of assets and liabilities, operations, and changes in net assets,
as well as financial highlights. |
Notes | <Click Here> | Notes to the financial statements. |
Report of Independent Registered Public Accounting Firm | <Click Here> | |
Trustees and Officers | <Click Here> | |
Distributions | <Click Here> | |
Board Approval of Investment Advisory Contracts and Management Fees | <Click Here> | |
To view a fund's proxy voting guidelines and proxy voting record for the 12-month period ended June 30, visit www.fidelity.com/proxyvotingresults or visit the Securities and Exchange Commission's (SEC) web site at www.sec.gov. You may also call 1-800-544-8544 to request a free copy of the proxy voting guidelines.
Standard & Poor's, S&P and S&P 500 are registered service marks of The McGraw-Hill Companies, Inc. and have been licensed for use by Fidelity Distributors Corporation.
Other third party marks appearing herein are the property of their respective owners.
All other marks appearing herein are registered or unregistered trademarks or service marks of FMR Corp. or an affiliated company.
Annual Report
This report and the financial statements contained herein are submitted for the general information of the shareholders of the fund. This report is not authorized for distribution to prospective investors in the fund unless preceded or accompanied by an effective prospectus.
A fund files its complete schedule of portfolio holdings with the SEC for the first and third quarters of each fiscal year on Form N-Q. Forms N-Q are available on the SEC's web site at http://www.sec.gov. A fund's Forms N-Q may be reviewed and copied at the SEC's Public Reference Room in Washington, DC. Information regarding the operation of the SEC's Public Reference Room may be obtained by calling 1-800-SEC-0330. For a complete list of a fund's portfolio holdings, view the most recent quarterly holdings report, semiannual report, or annual report on Fidelity's web site at http://www.fidelity.com/holdings.
NOT FDIC INSURED · MAY LOSE VALUE · NO BANK GUARANTEE
Neither the fund nor Fidelity Distributors Corporation is a bank.
Annual Report
Chairman's Message
(photo_of_Edward_C_Johnson_3d)
Dear Shareholder:
During the past year or so, much has been reported about the mutual fund industry, and much of it has been more critical than I believe is warranted. Allegations that some companies have been less than forthright with their shareholders have cast a shadow on the entire industry. I continue to find these reports disturbing, and assert that they do not create an accurate picture of the industry overall. Therefore, I would like to remind everyone where Fidelity stands on these issues. I will say two things specifically regarding allegations that some mutual fund companies were in violation of the Securities and Exchange Commission's forward pricing rules or were involved in so-called "market timing" activities.
First, Fidelity has no agreements that permit customers who buy fund shares after 4 p.m. to obtain the 4 p.m. price. This is not a new policy. This is not to say that someone could not deceive the company through fraudulent acts. However, we are extremely diligent in preventing fraud from occurring in this manner - and in every other. But I underscore again that Fidelity has no so-called "agreements" that sanction illegal practices.
Second, Fidelity continues to stand on record, as we have for years, in opposition to predatory short-term trading that adversely affects shareholders in a mutual fund. Back in the 1980s, we initiated a fee - which is returned to the fund and, therefore, to investors - to discourage this activity. Further, we took the lead several years ago in developing a Fair Value Pricing Policy to prevent market timing on foreign securities in our funds. I am confident we will find other ways to make it more difficult for predatory traders to operate. However, this will only be achieved through close cooperation among regulators, legislators and the industry.
Yes, there have been unfortunate instances of unethical and illegal activity within the mutual fund industry from time to time. That is true of any industry. When this occurs, confessed or convicted offenders should be dealt with appropriately. But we are still concerned about the risk of over-regulation and the quick application of simplistic solutions to intricate problems. Every system can be improved, and we support and applaud well thought out improvements by regulators, legislators and industry representatives that achieve the common goal of building and protecting the value of investors' holdings.
For nearly 60 years, Fidelity has worked very hard to improve its products and service to justify your trust. When our family founded this company in 1946, we had only a few hundred customers. Today, we serve more than 18 million customers including individual investors and participants in retirement plans across America.
Let me close by saying that we do not take your trust in us for granted, and we realize that we must always work to improve all aspects of our service to you. In turn, we urge you to continue your active participation with your financial matters, so that your interests can be well served.
Best regards,
/s/Edward C. Johnson 3d
Edward C. Johnson 3d
Annual Report
Performance: The Bottom Line
Average annual total return reflects the change in the value of an investment, assuming reinvestment of the fund's dividend income and capital gains (the profits earned upon the sale of securities that have grown in value) and assuming a constant rate of performance each year. The $10,000 table and the fund's returns do not reflect the deduction of taxes that a shareholder would pay on fund distributions or the redemption of fund shares. During periods of reimbursement by Fidelity, a fund's total return will be greater than it would be had the reimbursement not occurred. How a fund did yesterday is no guarantee of how it will do tomorrow.
Average annual total returns take International Real Estate's cumulative total return and show you what would have happened if International Real Estate shares had performed at a constant rate each year. These numbers will be reported once the fund is a year old.
$10,000 Over Life of Fund
Let's say hypothetically that $10,000 was invested in Fidelity® International Real Estate Fund on September 8, 2004. The chart shows how the value of your investment would have changed, and also shows how the Morgan Stanley Capital International Europe, Australasia and Far East (MSCI® EAFE®)Index performed over the same period.
Annual Report
Management's Discussion of Fund Performance
Comments from Steve Buller, Portfolio Manager of Fidelity® International Real Estate Fund
Most major foreign equity markets outpaced Wall Street during the 12-month period ending July 31, 2005. The Morgan Stanley Capital InternationalSM Europe, Australasia, Far East (MSCI® EAFE®) Index - a benchmark for the performance of developed stock markets outside the United States and Canada - advanced 21.25% during the period versus a 14.05% gain for the Standard & Poor's 500SM Index. The relative weakness of the U.S. dollar through much of the year contributed to this disparity. In Latin America, the high prices of oil and raw material exports drove many stocks higher, as reflected in the MSCI Emerging Markets-Latin America index's 62.59% gain. European markets had mixed results, with sluggish growth in such core economies as Germany, while more vibrant activity in the Nordic Countries helped the MSCI Europe index to rise 25.12%. Japanese markets continued to show overall weakness, with the Tokyo Stock Exchange Stock Price Index only able to manage a 7.04% return. Elsewhere, foreign real estate markets did quite well, with the EPRA/NAREIT Global Real Estate ex North America Index climbing 31.48%.
From its inception on September 8, 2004, through July 31, 2005, Fidelity International Real Estate Fund gained 21.53%. By comparison, the EPRA/NAREIT Global Real Estate ex North America Index returned 24.71%, while the broad international equity market, as measured by the MSCI EAFE index, returned 18.66%. Relative to the EPRA/NAREIT index, the fund was hurt by negative stock and sector selection as well as by unfavorable currency movements. Detracting from performance was an underweighted position in Madrid-based home and office builder Metrovacesa, which did very well, primarily on the strength of the Spanish homebuilding market. By contrast, I was overweighted in Japanese development REIT Mitsui Fudosan, which was a moderately positive performer that simply failed to keep up with the index. Another notable underperformer was Greek office developer and owner Babis Vovos. Conversely, the portfolio benefited from owning only a modest amount of Mirvac Group, a diversified Australian real estate company and relatively sizable component of the index. The sluggishness of the Australian homebuilding market pressured the stock. Also adding to performance was Citycon, a Finland-based retail mall owner, which investors favored for its particularly high dividend yield. The fund's top absolute contributor during the period was Australia-based Westfield Group, a shopping center owner and manager that benefited from broad trends helping the entire mall sector.
The views expressed in this statement reflect those of the portfolio manager only through the end of the period of the report as stated on the cover and do not necessarily represent the views of Fidelity or any other person in the Fidelity organization. Any such views are subject to change at any time based upon market or other conditions and Fidelity disclaims any responsibility to update such views. These views may not be relied on as investment advice and, because investment decisions for a Fidelity fund are based on numerous factors, may not be relied on as an indication of trading intent on behalf of any Fidelity fund.
Annual Report
Shareholder Expense Example
As a shareholder of the Fund, you incur two types of costs: (1) transaction costs, including redemption fees, and (2) ongoing costs, including management fees and other Fund expenses. This Example is intended to help you understand your ongoing costs (in dollars) of investing in the Fund and to compare these costs with the ongoing costs of investing in other mutual funds.
The Example is based on an investment of $1,000 invested at the beginning of the period and held for the entire period (February 1, 2005 to July 31, 2005).
Actual Expenses
The first line of the table below provides information about actual account values and actual expenses. You may use the information in this line, together with the amount you invested, to estimate the expenses that you paid over the period. Simply divide your account value by $1,000.00 (for example, an $8,600 account value divided by $1,000.00 = 8.6), then multiply the result by the number in the first line under the heading entitled "Expenses Paid During Period" to estimate the expenses you paid on your account during this period. A small balance maintenance fee of $12.00 that is charged once a year may apply for certain accounts with a value of less than $2,000. This fee is not included in the table below. If it was, the estimate of expenses you paid during the period would be higher, and your ending account value lower, by this amount.
Hypothetical Example for Comparison Purposes
The second line of the table below provides information about hypothetical account values and hypothetical expenses based on the Fund's actual expense ratio and an assumed rate of return of 5% per year before expenses, which is not the Fund's actual return. The hypothetical account values and expenses may not be used to estimate the actual ending account balance or expenses you paid for the period. You may use this information to compare the ongoing costs of investing in the Fund and other funds. To do so, compare this 5% hypothetical example with the 5% hypothetical examples that appear in the shareholder reports of the other funds. A small balance maintenance fee of $12.00 that is charged once a year may apply for certain accounts with a value of less than $2,000. This fee is not included in the table below. If it was, the estimate of expenses you paid during the period would be higher, and your ending account value lower, by this amount.
Please note that the expenses shown in the table are meant to highlight your ongoing costs only and do not reflect any transaction costs. Therefore, the second line of the table is useful in comparing ongoing costs only, and will not help you determine the relative total costs of owning different funds. In addition, if these transactional costs were included, your costs would have been higher.
| Beginning
Account Value
February 1, 2005 | Ending
Account Value
July 31, 2005 | Expenses Paid
During Period*
February 1, 2005
to July 31, 2005 |
Actual | $ 1,000.00 | $ 1,040.40 | $ 6.22 |
Hypothetical (5% return per year before expenses) | $ 1,000.00 | $ 1,018.70 | $ 6.16 |
* Expenses are equal to the Fund's annualized expense ratio of 1.23%; multiplied by the average account value over the period, multiplied by 181/365 (to reflect the one-half year period).
Annual Report
Investment Changes
Top Ten Stocks as of July 31, 2005 |
| % of fund's
net assets | % of fund's net assets
6 months ago |
Westfield Group unit | 8.1 | 9.0 |
Sun Hung Kai Properties Ltd. | 5.4 | 4.8 |
Mitsui Fudosan Co. Ltd. | 4.6 | 4.7 |
British Land Co. PLC | 4.3 | 4.5 |
Land Securities Group PLC | 3.6 | 3.0 |
Mitsubishi Estate Co. Ltd. | 3.5 | 3.9 |
Macquarie Goodman Group unit | 3.1 | 2.2 |
Rodamco Europe NV | 2.9 | 2.4 |
Stockland unit | 2.9 | 2.9 |
Unibail (Reg.) | 2.6 | 2.2 |
| 41.0 | |
Top Five Countries as of July 31, 2005 |
(excluding cash equivalents) | % of fund's
net assets | % of fund's net assets
6 months ago |
United Kingdom | 21.8 | 22.6 |
Australia | 21.0 | 20.5 |
Japan | 15.9 | 16.0 |
Hong Kong | 15.2 | 13.8 |
Netherlands | 7.2 | 7.0 |
Percentages are adjusted for the effect of open futures contracts, if applicable. |
Top Five REIT Sectors as of July 31, 2005 |
| % of fund's
net assets | % of fund's net assets
6 months ago |
REITs - Management/Investment | 33.9 | 33.3 |
REITs - Office Buildings | 4.1 | 3.9 |
REITs - Shopping Centers | 1.4 | 1.0 |
REITs - Industrial Buildings | 1.3 | 1.5 |
Asset Allocation (% of fund's net assets) |
As of July 31, 2005 * | As of January 31, 2005 ** |
| Stocks 98.1% | | | Stocks 96.6% | |
| Short-Term
Investments and
Net Other Assets 1.9% | | | Short-Term
Investments and
Net Other Assets 3.4% | |
* Foreign investments | 98.1% | | ** Foreign investments | 96.6% | |

Annual Report
Investments July 31, 2005
Showing Percentage of Net Assets
Common Stocks - 98.1% |
| Shares | | Value (Note 1) |
Australia - 21.0% |
Centro Properties Group unit | 671,282 | | $ 2,850,969 |
Centro Retail Group unit | 223,760 | | 254,096 |
CFS Gandel Retail Trust | 2,150,500 | | 2,800,222 |
Commonwealth Property Office Fund | 1,422,700 | | 1,405,557 |
DB RREEF Trust unit | 1,227,338 | | 1,286,881 |
Macquarie Goodman Group unit | 1,615,719 | | 4,966,111 |
Stockland unit | 1,066,800 | | 4,627,668 |
The GPT Group unit | 891,600 | | 2,578,446 |
Westfield Group unit | 957,200 | | 13,043,670 |
TOTAL AUSTRALIA | | 33,813,620 |
Austria - 0.6% |
IMMOFINANZ Immobilien Anlagen AG (a) | 105,800 | | 972,381 |
China - 0.2% |
Guangzhou R&F Properties Co. Ltd. (H Shares) | 217,000 | | 319,627 |
Finland - 1.0% |
Citycon Oyj | 404,000 | | 1,562,621 |
France - 5.4% |
Gecina SA | 14,000 | | 1,582,070 |
Klepierre SA | 30,800 | | 2,961,459 |
Unibail (Reg.) | 29,900 | | 4,132,928 |
TOTAL FRANCE | | 8,676,457 |
Germany - 0.1% |
Vivacon AG | 5,384 | | 114,242 |
Greece - 1.3% |
Babis Vovos International Technical SA | 135,580 | | 2,068,036 |
Hong Kong - 15.2% |
Cheung Kong Holdings Ltd. ADR | 129,300 | | 1,396,440 |
Far East Consortium International Ltd. | 2,600,000 | | 1,120,459 |
Hang Lung Properties Ltd. | 536,000 | | 851,549 |
Henderson Land Development Co. Ltd. | 673,700 | | 3,405,939 |
Hong Kong Land Holdings Ltd. | 799,000 | | 2,604,740 |
Hysan Development Co. Ltd. | 633,000 | | 1,490,159 |
Kerry Properties Ltd. | 423,000 | | 1,093,740 |
New World Development Co. Ltd. | 1,671,000 | | 2,235,567 |
Sino Land Co. | 961,000 | | 1,137,337 |
Sun Hung Kai Properties Ltd. | 835,000 | | 8,609,299 |
Wharf Holdings Ltd. | 143,000 | | 537,151 |
TOTAL HONG KONG | | 24,482,380 |
Common Stocks - continued |
| Shares | | Value (Note 1) |
Italy - 2.0% |
Beni Stabili Spa | 1,375,400 | | $ 1,527,088 |
Pirelli & C. Real Estate Spa | 27,700 | | 1,665,542 |
TOTAL ITALY | | 3,192,630 |
Japan - 15.9% |
Aeon Mall Co. Ltd. | 15,000 | | 493,575 |
Japan Logistics Fund, Inc. | 150 | | 960,470 |
Japan Prime Realty Investment Corp. | 576 | | 1,618,711 |
Japan Real Estate Investment Corp. | 233 | | 1,991,311 |
Japan Retail Fund Investment Corp. | 269 | | 2,296,590 |
Mitsubishi Estate Co. Ltd. | 500,000 | | 5,558,273 |
Mitsui Fudosan Co. Ltd. | 652,000 | | 7,427,738 |
Nippon Building Fund, Inc. (d) | 353 | | 3,051,412 |
NTT Urban Development Co. | 285 | | 1,196,318 |
Sumitomo Realty & Development Co. Ltd. | 98,000 | | 1,082,449 |
TOTAL JAPAN | | 25,676,847 |
Netherlands - 7.2% |
Corio NV | 25,626 | | 1,432,397 |
Eurocommercial Properties NV unit | 53,717 | | 1,986,522 |
Nieuwe Steen Investments NV | 62,363 | | 1,439,712 |
Rodamco Europe NV | 55,200 | | 4,678,407 |
Wereldhave NV | 19,700 | | 2,098,407 |
TOTAL NETHERLANDS | | 11,635,445 |
Singapore - 4.2% |
Ascendas Real Estate Investment Trust (A-REIT) | 788,900 | | 1,118,704 |
CapitaLand Ltd. | 1,464,000 | | 2,489,482 |
Keppel Land Ltd. | 576,000 | | 1,114,448 |
Mapletree Logistics Trust (REIT) | 1,000,000 | | 537,780 |
Singapore Land Ltd. | 415,000 | | 1,446,297 |
TOTAL SINGAPORE | | 6,706,711 |
Spain - 0.9% |
Inmobiliaria Colonial | 27,700 | | 1,494,588 |
Sweden - 0.6% |
Castellum AB | 21,900 | | 920,956 |
Switzerland - 0.6% |
PSP Swiss Property AG | 23,140 | | 1,023,695 |
Thailand - 0.1% |
Ticon Industrial Connection PCL (For. Reg.) | 600,000 | | 142,600 |
Common Stocks - continued |
| Shares | | Value (Note 1) |
United Kingdom - 21.8% |
British Land Co. PLC | 472,400 | | $ 6,970,088 |
Brixton PLC | 288,400 | | 1,794,346 |
Caliber Global Investment Ltd. | 27,700 | | 283,371 |
Capital & Regional PLC | 190,200 | | 2,590,717 |
CLS Holdings PLC (a) | 156,597 | | 1,258,476 |
Daejan Holdings PLC | 6,000 | | 322,423 |
Derwent Valley Holdings PLC | 61,600 | | 1,320,834 |
Development Securities PLC | 157,900 | | 1,332,082 |
Eurocastle Investment Ltd. | 17,000 | | 387,515 |
Great Portland Estates PLC | 132,400 | | 831,319 |
Hammerson PLC | 147,700 | | 2,224,687 |
Helical Bar PLC | 35,000 | | 891,957 |
Land Securities Group PLC | 237,000 | | 5,802,393 |
Liberty International PLC | 139,700 | | 2,369,362 |
Slough Estates PLC | 428,500 | | 4,029,139 |
Unite Group PLC | 341,700 | | 1,831,692 |
Workspace Group PLC | 179,000 | | 802,234 |
TOTAL UNITED KINGDOM | | 35,042,635 |
TOTAL COMMON STOCKS (Cost $147,351,703) | 157,845,471 |
Money Market Funds - 4.1% |
| | | |
Fidelity Cash Central Fund, 3.31% (b) | 4,258,835 | | 4,258,835 |
Fidelity Securities Lending Cash Central Fund, 3.32% (b)(c) | 2,405,471 | | 2,405,471 |
TOTAL MONEY MARKET FUNDS (Cost $6,664,306) | 6,664,306 |
TOTAL INVESTMENT PORTFOLIO - 102.2% (Cost $154,016,009) | | 164,509,777 |
NET OTHER ASSETS - (2.2)% | | (3,530,024) |
NET ASSETS - 100% | $ 160,979,753 |
Legend |
(a) Non-income producing |
(b) Affiliated fund that is available only to investment companies and other accounts managed by Fidelity Investments. The rate quoted is the annualized seven-day yield of the fund at period end. A complete listing of the fund's holdings as of its most recent quarter end is available upon request. |
(c) Investment made with cash collateral received from securities on loan. |
(d) Security or a portion of the security is on loan at period end. |
See accompanying notes which are an integral part of the financial statements.
Annual Report
Financial Statements
Statement of Assets and Liabilities
| July 31, 2005 |
Assets | | |
Investment in securities, at value (including securities loaned of $2,290,924) (cost $154,016,009) - See accompanying schedule | | $ 164,509,777 |
Foreign currency held at value (cost $741,350) | | 738,866 |
Receivable for fund shares sold | | 276,447 |
Dividends receivable | | 696,665 |
Interest receivable | | 9,323 |
Prepaid expenses | | 2,232 |
Other affiliated receivables | | 297 |
Other receivables | | 22,843 |
Total assets | | 166,256,450 |
| | |
Liabilities | | |
Payable for investments purchased | $ 2,200,438 | |
Payable for fund shares redeemed | 494,534 | |
Accrued management fee | 95,798 | |
Other affiliated payables | 36,610 | |
Other payables and accrued expenses | 43,846 | |
Collateral on securities loaned, at value | 2,405,471 | |
Total liabilities | | 5,276,697 |
| | |
Net Assets | | $ 160,979,753 |
Net Assets consist of: | | |
Paid in capital | | $ 147,170,232 |
Undistributed net investment income | | 2,726,894 |
Accumulated undistributed net realized gain (loss) on investments and foreign currency transactions | | 604,029 |
Net unrealized appreciation (depreciation) on investments and assets and liabilities in foreign currencies | | 10,478,598 |
Net Assets, for 13,319,577 shares outstanding | | $ 160,979,753 |
Net Asset Value, offering price and redemption price per share ($160,979,753 ÷ 13,319,577 shares) | | $ 12.09 |
See accompanying notes which are an integral part of the financial statements.
Annual Report
Financial Statements - continued
Statement of Operations
| For the period September 8, 2004 (commencement of operations) to July 31, 2005 |
Investment Income | | |
Dividends | | $ 3,932,957 |
Interest | | 86,081 |
Security lending | | 35,057 |
| | 4,054,095 |
Less foreign taxes withheld | | (431,266) |
Total income | | 3,622,829 |
| | |
Expenses | | |
Management fee | $ 754,330 | |
Transfer agent fees | 245,613 | |
Accounting and security lending fees | 56,787 | |
Independent trustees' compensation | 419 | |
Custodian fees and expenses | 206,128 | |
Registration fees | 42,031 | |
Audit | 40,155 | |
Legal | 141 | |
Miscellaneous | 151 | |
Total expenses before reductions | 1,345,755 | |
Expense reductions | (24,519) | 1,321,236 |
Net investment income (loss) | | 2,301,593 |
Realized and Unrealized Gain (Loss) Net realized gain (loss) on: | | |
Investment securities | 1,253,283 | |
Foreign currency transactions | (44,900) | |
Total net realized gain (loss) | | 1,208,383 |
Change in net unrealized appreciation (depreciation) on: Investment securities | 10,493,768 | |
Assets and liabilities in foreign currencies | (15,170) | |
Total change in net unrealized appreciation (depreciation) | | 10,478,598 |
Net gain (loss) | | 11,686,981 |
Net increase (decrease) in net assets resulting from operations | | $ 13,988,574 |
See accompanying notes which are an integral part of the financial statements.
Annual Report
Statement of Changes in Net Assets
| For the period
September 8, 2004
(commencement
of operations) to
July 31, 2005 |
Increase (Decrease) in Net Assets | |
Operations | |
Net investment income (loss) | $ 2,301,593 |
Net realized gain (loss) | 1,208,383 |
Change in net unrealized appreciation (depreciation) | 10,478,598 |
Net increase (decrease) in net assets resulting from operations | 13,988,574 |
Distributions to shareholders from net investment income | (284,922) |
Distributions to shareholders from net realized gain | (284,922) |
Total distributions | (569,844) |
Share transactions
Proceeds from sales of shares | 198,883,069 |
Reinvestment of distributions | 534,380 |
Cost of shares redeemed | (51,974,181) |
Net increase (decrease) in net assets resulting from share transactions | 147,443,268 |
Redemption fees | 117,755 |
Total increase (decrease) in net assets | 160,979,753 |
| |
Net Assets | |
Beginning of period | - |
End of period (including undistributed net investment income of $2,726,894) | $ 160,979,753 |
Other Information Shares | |
Sold | 17,760,569 |
Issued in reinvestment of distributions | 46,067 |
Redeemed | (4,487,059) |
Net increase (decrease) | 13,319,577 |
See accompanying notes which are an integral part of the financial statements.
Annual Report
Financial Highlights
Period ended July 31, | 2005 E |
Selected Per-Share Data | |
Net asset value, beginning of period | $ 10.00 |
Income from Investment Operations | |
Net investment income (loss) D | .23 |
Net realized and unrealized gain (loss) | 1.91 |
Total from investment operations | 2.14 |
Distributions from net investment income | (.03) |
Distributions from net realized gain | (.03) |
Total distributions | (.06) |
Redemption fees added to paid in capital D | .01 |
Net asset value, end of period | $ 12.09 |
Total Return B, C | 21.53% |
Ratios to Average Net Assets F | |
Expenses before expense reductions | 1.29% A |
Expenses net of voluntary waivers, if any | 1.29% A |
Expenses net of all reductions | 1.27% A |
Net investment income (loss) | 2.21% A |
Supplemental Data | |
Net assets, end of period (000 omitted) | $ 160,980 |
Portfolio turnover rate | 36% A |
A Annualized
B Total returns for periods of less than one year are not annualized.
C Total returns would have been lower had certain expenses not been reduced during the periods shown.
D Calculated based on average shares outstanding during the period.
E For the period September 8, 2004 (commencement of operations) to July 31, 2005.
F Expense ratios reflect operating expenses of the fund. Expenses before reductions do not reflect amounts reimbursed by the investment adviser or reductions from brokerage service arrangements or other expense offset arrangements and do not represent the amount paid by the fund during periods when reimbursements or reductions occur. Expense ratios before reductions for start-up periods may not be representative of longer-term operating periods. Expenses net of any voluntary waivers reflect expenses after reimbursement by the investment adviser but prior to reductions from brokerage service arrangements or other expense offset arrangements. Expenses net of all reductions represent the net expenses paid by the fund.
See accompanying notes which are an integral part of the financial statements.
Annual Report
Notes to Financial Statements
For the period ended July 31, 2005
1. Significant Accounting Policies.
Fidelity International Real Estate Fund (the fund) is a non-diversified fund of Fidelity Securities Fund (the trust) and is authorized to issue an unlimited number of shares. The trust is registered under the Investment Company Act of 1940, as amended (the 1940 Act), as an open-end management investment company organized as a Massachusetts business trust. The financial statements have been prepared in conformity with accounting principles generally accepted in the United States of America, which require management to make certain estimates and assumptions at the date of the financial statements. The following summarizes the significant accounting policies of the fund:
Security Valuation. Net asset value per share (NAV calculation) is calculated as of the close of business of the New York Stock Exchange, normally 4:00 p.m. Eastern time. Equity securities, including restricted securities, for which market quotations are available are valued at the last sale price or official closing price (closing bid price or last evaluated quote if no sale has occurred) on the primary market or exchange on which they trade. If prices are not readily available or do not accurately reflect fair value for a security, or if a security's value has been materially affected by events occurring after the close of the exchange or market on which the security is principally traded, that security may be valued by another method that the Board of Trustees believes accurately reflects fair value. A security's valuation may differ depending on the method used for determining value. Price movements in futures contracts and ADRs, market and trading trends, the bid/ask quotes of brokers and off-exchange institutional trading may be reviewed in the course of making a good faith determination of a security's fair value. Short-term securities with remaining maturities of sixty days or less for which quotations are not readily available are valued on the basis of amortized cost. Investments in open-end investment companies are valued at their net asset value each business day.
Foreign Currency. The fund uses foreign currency contracts to facilitate transactions in foreign-denominated securities. Losses from these transactions may arise from changes in the value of the foreign currency or if the counterparties do not perform under the contracts' terms.
Foreign-denominated assets, including investment securities, and liabilities are translated into U.S. dollars at the exchange rate at period end. Purchases and sales of investment securities, income and dividends received and expenses denominated in foreign currencies are translated into U.S. dollars at the exchange rate in effect on the transaction date.
The effects of exchange rate fluctuations on investments are included with the net realized and unrealized gain (loss) on investment securities. Other foreign currency transactions resulting in realized and unrealized gain (loss) are disclosed separately.
Annual Report
Notes to Financial Statements - continued
1. Significant Accounting Policies - continued
Investment Transactions and Income. Security transactions are accounted for as of trade date. Gains and losses on securities sold are determined on the basis of identified cost. Dividend income is recorded on the ex-dividend date, except for certain dividends from foreign securities where the ex-dividend date may have passed, which are recorded as soon as the fund is informed of the ex-dividend date. Non-cash dividends included in dividend income, if any, are recorded at the fair market value of the securities received. Distributions received on securities that represent a return of capital or capital gain are recorded as a reduction of cost of investments and/or as a realized gain. The fund estimates the components of distributions received that may be considered return of capital distributions or capital gain distributions. Interest income is accrued as earned. Interest income includes coupon interest and amortization of premium and accretion of discount on debt securities. Investment income is recorded net of foreign taxes withheld where recovery of such taxes is uncertain.
Expenses. Most expenses of the trust can be directly attributed to a fund. Expenses which cannot be directly attributed are apportioned among each fund in the trust.
Income Tax Information and Distributions to Shareholders. Each year, the fund intends to qualify as a regulated investment company by distributing all of its taxable income and realized gains under Subchapter M of the Internal Revenue Code. As a result, no provision for income taxes is required in the accompanying financial statements. Foreign taxes are provided for based on the fund's understanding of the tax rules and rates that exist in the foreign markets in which it invests.
Distributions are recorded on the ex-dividend date. Income and capital gain distributions are determined in accordance with income tax regulations, which may differ from generally accepted accounting principles. In addition, the fund will claim a portion of the payment made to redeeming shareholders as a distribution for income tax purposes.
Capital accounts within the financial statements are adjusted for permanent book-tax differences. These adjustments have no impact on net assets or the results of operations. Temporary book-tax differences will reverse in a subsequent period. Book-tax differences are primarily due to foreign currency transactions, passive foreign investment companies (PFIC), non-taxable dividends, and losses deferred due to wash sales.
The tax-basis components of distributable earnings and the federal tax cost as of period end were as follows:
Unrealized appreciation | $ 9,457,088 | |
Unrealized depreciation | (3,029,768) | |
Net unrealized appreciation (depreciation) | 6,427,320 | |
Undistributed ordinary income | 6,892,835 | |
Cost for federal income tax purposes | $ 158,082,457 | |
Annual Report
1. Significant Accounting Policies - continued
Income Tax Information and Distributions to Shareholders - continued
The tax character of distributions paid was as follows:
| July 31, 2005 | |
Ordinary Income | $ 569,844 | |
Short-Term Trading (Redemption) Fees. Shares held in the fund less than 90 days are subject to a redemption fee equal to 1.50% of the proceeds of the redeemed shares. All redemption fees, including any estimated redemption fees paid by Fidelity Management & Research Company (FMR), are retained by the fund and accounted for as an addition to paid in capital.
2. Operating Policies.
Repurchase Agreements. FMR has received an Exemptive Order from the Securities and Exchange Commission (the SEC) which permits the fund and other affiliated entities of FMR to transfer uninvested cash balances into joint trading accounts which are then invested in repurchase agreements. The fund may also invest directly with institutions in repurchase agreements. Repurchase agreements are collateralized by government or non-government securities. Collateral is held in segregated accounts with custodian banks and may be obtained in the event of a default of the counterparty. The fund monitors, on a daily basis, the value of the collateral to ensure it is at least equal to the principal amount of the repurchase agreement (including accrued interest). In the event of a default by the counterparty, realization of the collateral proceeds could be delayed, during which time the value of the collateral may decline.
3. Purchases and Sales of Investments.
Purchases and sales of securities, other than short-term securities and U.S. government securities, aggregated $184,598,924 and $37,790,278, respectively.
4. Fees and Other Transactions with Affiliates.
Management Fee. FMR and its affiliates provide the fund with investment management related services for which the fund pays a monthly management fee. The management fee is the sum of an individual fund fee rate that is based on an annual rate of .45% of the fund's average net assets and a group fee rate that averaged .27% during the period. The group fee rate is based upon the average net assets of all the mutual funds advised by FMR. The group fee rate decreases as assets under management increase and increases as assets under management decrease. For the period, the total annualized management fee rate was .72% of the fund's average net assets.
Annual Report
Notes to Financial Statements - continued
4. Fees and Other Transactions with Affiliates - continued
Transfer Agent Fees. Fidelity Service Company, Inc. (FSC), an affiliate of FMR, is the fund's transfer, dividend disbursing and shareholder servicing agent. FSC receives account fees and asset-based fees that vary according to account size and type of account. FSC pays for typesetting, printing and mailing of shareholder reports, except proxy statements. For the period, the transfer agent fees were equivalent to an annualized rate of .24% of average net assets.
Accounting and Security Lending Fees. FSC maintains the fund's accounting records. The accounting fee is based on the level of average net assets for the month. Under a separate contract, FSC administers the security lending program. The security lending fee is based on the number and duration of lending transactions.
Central Funds. The fund may invest in affiliated Central Funds managed by Fidelity Investments Money Management, Inc. (FIMM), an affiliate of FMR. The Central Funds are open-end investment companies available only to investment companies and other accounts managed by FMR and its affiliates. The Money Market Central Funds seek preservation of capital and current income. The Central Funds do not pay a management fee. Income distributions earned by the fund are recorded as income in the accompanying financial statements and totaled $61,617 for the period.
5. Committed Line of Credit.
The fund participates with other funds managed by FMR in a $4.2 billion credit facility (the "line of credit") to be utilized for temporary or emergency purposes to fund shareholder redemptions or for other short-term liquidity purposes. The fund has agreed to pay commitment fees on its pro rata portion of the line of credit. During the period, there were no borrowings on this line of credit.
6. Security Lending.
The fund lends portfolio securities from time to time in order to earn additional income. The fund receives collateral (in the form of U.S. Treasury obligations, letters of credit and/or cash) against the loaned securities and maintains collateral in an amount not less than 100% of the market value of the loaned securities during the period of the loan. The market value of the loaned securities is determined at the close of business of the fund and any additional required collateral is delivered to the fund on the next business day. If the borrower defaults on its obligation to return the securities loaned because of insolvency or other reasons, a fund could experience delays and costs in recovering the securities loaned or in gaining access to the collateral. Cash collateral is invested in the Fidelity Securities Lending Cash Central Fund. The value of loaned securities and cash collateral at period end are disclosed on the fund's Statement of Assets and Liabilities.
Annual Report
7. Expense Reductions.
Many of the brokers with whom FMR places trades on behalf of the fund provided services to the fund in addition to trade execution. These services included payments of certain expenses on behalf of the fund totaling $24,495 for the period. In addition, through arrangements with the fund's custodian, credits realized as a result of uninvested cash balances were used to reduce the fund's expenses. During the period, these credits reduced the fund's custody expenses by $24.
8. Other.
The fund's organizational documents provide former and current trustees and officers with a limited indemnification against liabilities arising in connection with the performance of their duties to the fund. In the normal course of business, the fund may also enter into contracts that provide general indemnifications. The fund's maximum exposure under these arrangements is unknown as this would be dependent on future claims that may be made against the fund. The risk of material loss from such claims is considered remote.
Annual Report
Report of Independent Registered Public Accounting Firm
To the Trustees of Fidelity Securities Fund and the Shareholders of Fidelity International Real Estate Fund:
In our opinion, the accompanying statement of assets and liabilities, including the schedule of investments, and the related statements of operations and of changes in net assets and the financial highlights present fairly, in all material respects, the financial position of Fidelity International Real Estate Fund (a fund of Fidelity Securities Fund) at July 31, 2005 and the results of its operations, the changes in its net assets and the financial highlights for the period indicated, in conformity with accounting principles generally accepted in the United States of America. These financial statements and financial highlights (hereafter referred to as "financial statements") are the responsibility of the Fidelity International Real Estate Fund's management; our responsibility is to express an opinion on these financial statements based on our audit. We conducted our audit of these financial statements in accordance with the standards of the Public Company Accounting Oversight Board (United States). Those standards require that we plan and perform the audit to obtain reasonable assurance about whether the financial statements are free of material misstatement. An audit includes examining, on a test basis, evidence supporting the amounts and disclosures in the financial statements, assessing the accounting principles used and significant estimates made by management, and evaluating the overall financial statement presentation. We believe that our audit, which included confirmation of securities at July 31, 2005 by correspondence with the custodian and brokers, provides a reasonable basis for our opinion.
/s/ PricewaterhouseCoopers LLP
PricewaterhouseCoopers LLP
Boston, Massachusetts
September 9, 2005
Annual Report
Trustees and Officers
The Trustees, Members of the Advisory Board, and executive officers of the trust and fund, as applicable, are listed below. The Board of Trustees governs the fund and is responsible for protecting the interests of shareholders. The Trustees are experienced executives who meet periodically throughout the year to oversee the fund's activities, review contractual arrangements with companies that provide services to the fund, and review the fund's performance. Except for William O. McCoy, Stephen P. Jonas, and Kenneth L. Wolfe, each of the Trustees oversees 320 funds advised by FMR or an affiliate. Mr. McCoy oversees 322 funds advised by FMR or an affiliate. Mr. Jonas and Mr. Wolfe oversee 311 funds advised by FMR or an affiliate.
The Trustees hold office without limit in time except that (a) any Trustee may resign; (b) any Trustee may be removed by written instrument, signed by at least two-thirds of the number of Trustees prior to such removal; (c) any Trustee who requests to be retired or who has become incapacitated by illness or injury may be retired by written instrument signed by a majority of the other Trustees; and (d) any Trustee may be removed at any special meeting of shareholders by a two-thirds vote of the outstanding voting securities of the trust. Each Trustee who is not an interested person (as defined in the 1940 Act) (Independent Trustee), shall retire not later than the last day of the calendar year in which his or her 72nd birthday occurs. The Independent Trustees may waive this mandatory retirement age policy with respect to individual Trustees. The executive officers and Advisory Board Members hold office without limit in time, except that any officer and Advisory Board Member may resign or may be removed by a vote of a majority of the Trustees at any regular meeting or any special meeting of the Trustees. Except as indicated, each individual has held the office shown or other offices in the same company for the past five years.
The fund's Statement of Additional Information (SAI) includes more information about the Trustees. To request a free copy, call Fidelity at 1-800-544-8544.
Interested Trustees*:
Correspondence intended for each Trustee who is an interested person may be sent to Fidelity Investments, 82 Devonshire Street, Boston, Massachusetts 02109.
Name, Age; Principal Occupation |
Edward C. Johnson 3d (75)** |
| Year of Election or Appointment: 1984 Mr. Johnson is Chairman of the Board of Trustees. Mr. Johnson serves as Chief Executive Officer, Chairman, and a Director of FMR Corp.; a Director and Chairman of the Board and of the Executive Committee of FMR; Chairman and a Director of Fidelity Management & Research (Far East) Inc.; Chairman and a Director of Fidelity Investments Money Management, Inc.; and Chairman (2001-present) and a Director (2000-present) of FMR Co., Inc. |
Abigail P. Johnson (43)** |
| Year of Election or Appointment: 2001 Ms. Johnson serves as President of Fidelity Employer Services Company (FESCO) (2005-present). She is President and a Director of Fidelity Investments Money Management, Inc. (2001-present), FMR Co., Inc. (2001-present), and a Director of FMR Corp. Previously, Ms. Johnson served as President and a Director of FMR (2001-2005), Senior Vice President of the Fidelity funds (2001-2005), and managed a number of Fidelity funds. |
Stephen P. Jonas (52) |
| Year of Election or Appointment: 2005 Mr. Jonas is Senior Vice President of International Real Estate (2005-present). He also serves as Senior Vice President of other Fidelity funds (2005-present). Mr. Jonas is Executive Director of FMR (2005-present). Previously, Mr. Jonas served as President of Fidelity Enterprise Operations and Risk Services (2004-2005), Chief Administrative Officer (2002-2004), and Chief Financial Officer of FMR Co. (1998-2000). Mr. Jonas has been with Fidelity Investments since 1987 and has held various financial and management positions including Chief Financial Officer of FMR. In addition, he serves on the Boards of Boston Ballet (2003-present) and Simmons College (2003-present). |
Robert L. Reynolds (53) |
| Year of Election or Appointment: 2003 Mr. Reynolds is a Director (2003-present) and Chief Operating Officer (2002-present) of FMR Corp. He also serves on the Board at Fidelity Investments Canada, Ltd. (2000-present). Previously, Mr. Reynolds served as President of Fidelity Investments Institutional Retirement Group (1996-2000). |
* Trustees have been determined to be "Interested Trustees" by virtue of, among other things, their affiliation with the trust or various entities under common control with FMR.
** Edward C. Johnson 3d, Trustee, is Abigail P. Johnson's father.
Annual Report
Independent Trustees:
Correspondence intended for each Independent Trustee (that is, the Trustees other than the Interested Trustees) may be sent to Fidelity Investments, P.O. Box 55235, Boston, Massachusetts 02205-5235.
Name, Age; Principal Occupation |
Dennis J. Dirks (57) |
| Year of Election or Appointment: 2005 Prior to his retirement in May 2003, Mr. Dirks was Chief Operating Officer and a member of the Board of The Depository Trust & Clearing Corporation (DTCC) (1999-2003). He also served as President, Chief Operating Officer, and Board member of The Depository Trust Company (DTC) (1999-2003) and President and Board member of the National Securities Clearing Corporation (NSCC) (1999-2003). In addition, Mr. Dirks served as Chief Executive Officer and Board member of the Government Securities Clearing Corporation (2001-2003) and Chief Executive Officer and Board member of the Mortgage-Backed Securities Clearing Corporation (2001-2003). Mr. Dirks also serves as a Trustee of Manhattan College (2005-present). |
Robert M. Gates (61) |
| Year of Election or Appointment: 1997 Dr. Gates is Vice Chairman of the Independent Trustees (2005-present). Dr. Gates is President of Texas A&M University (2002-present). He was Director of the Central Intelligence Agency (CIA) from 1991 to 1993. From 1989 to 1991, Dr. Gates served as Assistant to the President of the United States and Deputy National Security Advisor. Dr. Gates is a Director of NACCO Industries, Inc. (mining and manufacturing), Parker Drilling Co., Inc. (drilling and rental tools for the energy industry, 2001-present), and Brinker International (restaurant management, 2003-present). Previously, Dr. Gates served as a Director of LucasVarity PLC (automotive components and diesel engines), a Director of TRW Inc. (automotive, space, defense, and information technology), and Dean of the George Bush School of Government and Public Service at Texas A&M University (1999-2001). Dr. Gates also is a Trustee of the Forum for International Policy. |
George H. Heilmeier (69) |
| Year of Election or Appointment: 2004 Dr. Heilmeier is Chairman Emeritus of Telcordia Technologies (communication software and systems), where prior to his retirement, he served as company Chairman and Chief Executive Officer. He currently serves on the Boards of Directors of The Mitre Corporation (systems engineering and information technology support for the government), and HRL Laboratories (private research and development, 2004-present). He is Chairman of the General Motors Science & Technology Advisory Board and a Life Fellow of the Institute of Electrical and Electronics Engineers (IEEE) (2000-present). Dr. Heilmeier is a member of the Defense Science Board and the National Security Agency Advisory Board. He is also a member of the National Academy of Engineering, the American Academy of Arts and Sciences, and the Board of Overseers of the School of Engineering and Applied Science of the University of Pennsylvania. Previously, Dr. Heilmeier served as a Director of TRW Inc. (automotive, space, defense, and information technology, 1992-2002), Compaq (1994-2002), Automatic Data Processing, Inc. (ADP) (technology-based business outsourcing, 1995-2002), INET Technologies Inc. (telecommunications network surveillance, 2001-2004), and Teletech Holdings (customer management services). He is the recipient of the 2005 Kyoto Prize in Advanced Technology for his invention of the liquid display. |
Marie L. Knowles (58) |
| Year of Election or Appointment: 2001 Prior to Ms. Knowles' retirement in June 2000, she served as Executive Vice President and Chief Financial Officer of Atlantic Richfield Company (ARCO) (diversified energy, 1996-2000). From 1993 to 1996, she was a Senior Vice President of ARCO and President of ARCO Transportation Company. She served as a Director of ARCO from 1996 to 1998. She currently serves as a Director of Phelps Dodge Corporation (copper mining and manufacturing) and McKesson Corporation (healthcare service, 2002-present). Ms. Knowles is a Trustee of the Brookings Institution and the Catalina Island Conservancy and also serves as a member of the Advisory Board for the School of Engineering of the University of Southern California. |
Ned C. Lautenbach (61) |
| Year of Election or Appointment: 2000 Mr. Lautenbach has been a partner of Clayton, Dubilier & Rice, Inc. (private equity investment firm) since September 1998. Previously, Mr. Lautenbach was with the International Business Machines Corporation (IBM) from 1968 until his retirement in 1998. Mr. Lautenbach serves as a Director of Italtel Holding S.p.A. (telecommunications (Milan, Italy), 2004-present) and Eaton Corporation (diversified industrial) as well as the Philharmonic Center for the Arts in Naples, Florida. He also is a member of the Board of Trustees of Fairfield University (2005-present), as well as a member of the Council on Foreign Relations. |
Marvin L. Mann (72) |
| Year of Election or Appointment: 1993 Mr. Mann is Chairman of the Independent Trustees (2001-present). He is Chairman Emeritus of Lexmark International, Inc. (computer peripherals), where he served as CEO until April 1998, retired as Chairman May 1999, and remains a member of the Board. Prior to 1991, he held the positions of Vice President of International Business Machines Corporation (IBM) and President and General Manager of various IBM divisions and subsidiaries. He is a member of the Executive Committee of the Independent Director's Council of the Investment Company Institute. In addition, Mr. Mann is a member of the President's Cabinet at the University of Alabama and the Board of Visitors of the Culverhouse College of Commerce and Business Administration at the University of Alabama. |
William O. McCoy (71) |
| Year of Election or Appointment: 1997 Prior to his retirement in December 1994, Mr. McCoy was Vice Chairman of the Board of BellSouth Corporation (telecommunications) and President of BellSouth Enterprises. He is currently a Director of Liberty Corporation (holding company), Duke Realty Corporation (real estate), and Progress Energy, Inc. (electric utility). He is also a partner of Franklin Street Partners (private investment management firm) and a member of the Research Triangle Foundation Board. In addition, Mr. McCoy served as the Interim Chancellor (1999-2000) and a member of the Board of Visitors for the University of North Carolina at Chapel Hill and currently serves on the Board of Directors of the University of North Carolina Health Care System and the Board of Visitors of the Kenan-Flagler Business School (University of North Carolina at Chapel Hill). He also served as Vice President of Finance for the University of North Carolina (16-school system). |
Cornelia M. Small (61) |
| Year of Election or Appointment: 2005 Ms. Small is a member (2000-present) and Chairperson (2002-present) of the Investment Committee, and a member (2002-present) of the Board of Trustees of Smith College. Previously, she served as Chief Investment Officer (1999-2000), Director of Global Equity Investments (1996-1999), and a member of the Board of Directors of Scudder, Stevens & Clark (1990-1997) and Scudder Kemper Investments (1997-1998). In addition, Ms. Small served as Co-Chair (2000-2003) of the Annual Fund for the Fletcher School of Law and Diplomacy. |
William S. Stavropoulos (66) |
| Year of Election or Appointment: 2002 Mr. Stavropoulos is Chairman of the Board (2000-present) and a Member of the Board of Directors of The Dow Chemical Company. Since joining The Dow Chemical Company in 1967, Mr. Stavropoulos served in numerous senior management positions, including President (1993-2000; 2002-2003), CEO (1995-2000; 2002-2004), and Chairman of the Executive Committee (2000-2004). Currently, he is a Director of NCR Corporation (data warehousing and technology solutions), BellSouth Corporation (telecommunications), Chemical Financial Corporation, Maersk Inc. (industrial conglomerate, 2002-present), and Metalmark Capital (private equity investment firm, 2005-present). He also serves as a member of the Board of Trustees of the American Enterprise Institute for Public Policy Research. In addition, Mr. Stavropoulos is a member of The Business Council, J.P. Morgan International Council and the University of Notre Dame Advisory Council for the College of Science. |
Kenneth L. Wolfe (66) |
| Year of Election or Appointment: 2005 Mr. Wolfe also serves as a Trustee (2005-present) or Member of the Advisory Board (2004-present) of other investment companies advised by FMR. Prior to his retirement in 2001, Mr. Wolfe was Chairman and Chief Executive Officer of Hershey Foods Corporation (1993-2001). He currently serves as a member of the boards of Adelphia Communications Corporation (2003-present), Bausch & Lomb, Inc., and Revlon Inc. (2004-present). |
Annual Report
Advisory Board Members and Executive Officers:
Correspondence intended for Mr. Gamper may be sent to Fidelity Investments, P.O. Box 55235, Boston, Massachusetts 02205-5235. Correspondence intended for each executive officer and Mr. Lynch may be sent to Fidelity Investments, 82 Devonshire Street, Boston, Massachusetts 02109.
Name, Age; Principal Occupation |
Albert R. Gamper, Jr. (63) |
| Year of Election or Appointment: 2005 Member of the Advisory Board of Fidelity Securities Fund. Prior to his retirement in December 2004, Mr. Gamper served as Chairman of the Board of CIT Group Inc. (commercial finance). During his tenure with CIT Group Inc. Mr. Gamper served in numerous senior management positions, including Chairman (1987-1989; 1999-2001; 2002-2004), Chief Executive Officer (1987-2004), and President (1989-2002). He currently serves as a member of the Board of Directors of Public Service Enterprise Group (utilities, 2001-present), Chairman of the Board of Governors, Rutgers University (2004-present), and Chairman of the Board of Saint Barnabas Health Care System. |
Peter S. Lynch (61) |
| Year of Election or Appointment: 2003 Member of the Advisory Board of Fidelity Securities Fund. Vice Chairman and a Director of FMR, and Vice Chairman (2001-present) and a Director (2000-present) of FMR Co., Inc. Previously, Mr. Lynch served as a Trustee of the Fidelity funds (1990-2003). In addition, he serves as a Trustee of Boston College, Massachusetts Eye & Ear Infirmary, Historic Deerfield, John F. Kennedy Library, and the Museum of Fine Arts of Boston. |
Dwight D. Churchill (51) |
| Year of Election or Appointment: 2005 Vice President of International Real Estate (2005-present). Mr. Churchill also serves as Vice President of certain Equity funds (2005-present) and certain High Income Funds (2005-present). Previously, he served as Head of Fidelity's Fixed-Income Division (2000-2005), Vice President of Fidelity's Money Market Funds (2000-2005), Vice President of Fidelity's Bond Funds, and Senior Vice President of FIMM (2000) and FMR. Mr. Churchill joined Fidelity in 1993 as Vice President and Group Leader of Taxable Fixed-Income Investments. |
Eric D. Roiter (56) |
| Year of Election or Appointment: 2004 Secretary of International Real Estate. He also serves as Secretary of other Fidelity funds; Vice President, General Counsel, and Secretary of FMR Co., Inc. (2001-present) and FMR; Assistant Secretary of Fidelity Management & Research (U.K.) Inc. (2001-present), Fidelity Management & Research (Far East) Inc. (2001-present), and Fidelity Investments Money Management, Inc. (2001-present). Mr. Roiter is an Adjunct Member, Faculty of Law, at Boston College Law School (2003-present). Previously, Mr. Roiter served as Vice President and Secretary of Fidelity Distributors Corporation (FDC) (1998-2005). |
Stuart Fross (45) |
| Year of Election or Appointment: 2004 Assistant Secretary of International Real Estate. Mr. Fross also serves as Assistant Secretary of other Fidelity funds (2003-present), Vice President and Secretary of FDC (2005-present), and is an employee of FMR. |
Christine Reynolds (46) |
| Year of Election or Appointment: 2004 President, Treasurer, and Anti-Money Laundering (AML) officer of International Real Estate. Ms. Reynolds also serves as President, Treasurer, and AML officer of other Fidelity funds (2004) and is a Vice President (2003) and an employee (2002) of FMR. Before joining Fidelity Investments, Ms. Reynolds worked at PricewaterhouseCoopers LLP (PwC) (1980-2002), where she was most recently an audit partner with PwC's investment management practice. |
Timothy F. Hayes (54) |
| Year of Election or Appointment: 2004 Chief Financial Officer of International Real Estate. Mr. Hayes also serves as Chief Financial Officer of other Fidelity funds (2002-present) and President of Fidelity Investment Operations (2005-present) which includes Fidelity Pricing and Cash Management Services Group (FPCMS), where he served as President (1998-2005). Mr. Hayes serves as President of Fidelity Service Company (2003-present) where he also serves as a Director. Mr. Hayes also served as President of Fidelity Investments Operations Group (FIOG, 2002-2005). |
Kenneth A. Rathgeber (58) |
| Year of Election or Appointment: 2004 Chief Compliance Officer of International Real Estate. Mr. Rathgeber also serves as Chief Compliance Officer of other Fidelity funds (2004) and Executive Vice President of Risk Oversight for Fidelity Investments (2002). Previously, he served as Executive Vice President and Chief Operating Officer for Fidelity Investments Institutional Services Company, Inc. (1998-2002). |
John R. Hebble (47) |
| Year of Election or Appointment: 2004 Deputy Treasurer of International Real Estate. Mr. Hebble also serves as Deputy Treasurer of other Fidelity funds (2003), and is an employee of FMR. Before joining Fidelity Investments, Mr. Hebble worked at Deutsche Asset Management where he served as Director of Fund Accounting (2002-2003) and Assistant Treasurer of the Scudder Funds (1998-2003). |
Bryan A. Mehrmann (44) |
| Year of Election or Appointment: 2005 Deputy Treasurer of International Real Estate. Mr. Mehrmann also serves as Deputy Treasurer of other Fidelity funds (2005-present) and is an employee of FMR. Previously, Mr. Mehrmann served as Vice President of Fidelity Investments Institutional Services Group (FIIS)/Fidelity Investments Institutional Operations Corporation, Inc. (FIIOC) Client Services (1998-2004). |
Kimberley H. Monasterio (41) |
| Year of Election or Appointment: 2004 Deputy Treasurer of International Real Estate. Ms. Monasterio also serves as Deputy Treasurer of other Fidelity funds (2004) and is an employee of FMR (2004). Before joining Fidelity Investments, Ms. Monasterio served as Treasurer (2000-2004) and Chief Financial Officer (2002-2004) of the Franklin Templeton Funds and Senior Vice President of Franklin Templeton Services, LLC (2000-2004). |
Kenneth B. Robins (35) |
| Year of Election or Appointment: 2005 Deputy Treasurer of International Real Estate. Mr. Robins also serves as Deputy Treasurer of other Fidelity funds (2005-present) and is an employee of FMR (2004-present). Before joining Fidelity Investments, Mr. Robins worked at KPMG LLP, where he was a partner in KPMG's department of professional practice (2002-2004) and a Senior Manager (1999-2000). In addition, Mr. Robins served as Assistant Chief Accountant, United States Securities and Exchange Commission (2000-2002). |
Robert G. Byrnes (38) |
| Year of Election or Appointment: 2005 Assistant Treasurer of International Real Estate. Mr. Byrnes also serves as Assistant Treasurer of other Fidelity funds (2005-present) and is an employee of FMR (2005-present). Previously, Mr. Byrnes served as Vice President of FPCMS (2003-2005). Before joining Fidelity Investments, Mr. Byrnes worked at Deutsche Asset Management where he served as Vice President of the Investment Operations Group (2000-2003). |
John H. Costello (58) |
| Year of Election or Appointment: 2004 Assistant Treasurer of International Real Estate. Mr. Costello also serves as Assistant Treasurer of other Fidelity funds and is an employee of FMR. |
Peter L. Lydecker (51) |
| Year of Election or Appointment: 2004 Assistant Treasurer of International Real Estate. Mr. Lydecker also serves as Assistant Treasurer of other Fidelity funds (2004) and is an employee of FMR. |
Mark Osterheld (50) |
| Year of Election or Appointment: 2004 Assistant Treasurer of International Real Estate. Mr. Osterheld also serves as Assistant Treasurer of other Fidelity funds (2002) and is an employee of FMR. |
Gary W. Ryan (46) |
| Year of Election or Appointment: 2005 Assistant Treasurer of International Real Estate. Mr. Ryan also serves as Assistant Treasurer of other Fidelity funds (2005-present) and is an employee of FMR (2005-present). Previously, Mr. Ryan served as Vice President of Fund Reporting in FPCMS (1999-2005). |
Salvatore Schiavone (39) |
| Year of Election or Appointment: 2005 Assistant Treasurer of International Real Estate. Mr. Schiavone also serves as Assistant Treasurer of other Fidelity funds (2005-present) and is an employee of FMR (2005-present). Before joining Fidelity Investments, Mr. Schiavone worked at Deutsche Asset Management, where he most recently served as Assistant Treasurer (2003-2005) of the Scudder Funds and Vice President and Head of Fund Reporting (1996-2003). |
Annual Report
Distributions
The Board of Trustees of Fidelity International Real Estate Fund voted to pay on September 12, 2005, to shareholders of record at the opening of business on September 9, 2005, a distribution of $.33 per share derived from capital gains realized from sales of portfolio securities and a dividend of $.19 per share from net investment income.
The fund designates 12% of the dividends distributed during the fiscal year as amounts which may be taken into account as a dividend for the purposes of the maximum rate under section 1(h)(11) of the Internal Revenue Code.
The amounts per share which represent income derived from sources within, and taxes paid to, foreign countries or possessions of the United States are .042 and .006 for the dividend paid December 27, 2004.
The fund will notify shareholders in January 2006 of amounts for use in preparing 2005 income tax returns.
Annual Report
Board Approval of Investment Advisory Contracts and Management Fees
Fidelity International Real Estate Fund
Each year, typically in July, the Board of Trustees, including the independent Trustees (together, the Board), votes on the renewal of the management contract and sub-advisory agreements (together, the Advisory Contracts) for the fund. The Board, assisted by the advice of fund counsel and independent Trustees' counsel, requests and considers a broad range of information throughout the year.
The Board meets regularly each month except August and takes into account throughout the year matters bearing on Advisory Contracts. The Board, acting directly and through its separate committees, considers at each of its meetings factors that are relevant to the annual renewal of the fund's Advisory Contracts, including the services and support provided to the fund and its shareholders by Fidelity. At the time of the renewal, the Board had 11 standing committees, each composed of independent Trustees with varying backgrounds, to which the Board has assigned specific subject matter responsibilities in order to enhance effective decision-making by the Board. Each committee has adopted a written charter outlining the structure and purposes of the committee. One such committee, the Equity Contract Committee, meets periodically during the first six months of each year and as necessary to consider matters specifically related to the annual renewal of Advisory Contracts. The committee requests and receives information on, and makes recommendations to the independent Trustees concerning, the approval and annual review of the Advisory Contracts.
At its July 2005 meeting, the Board of Trustees, including the independent Trustees, unanimously determined to renew the Advisory Contracts for the fund. In reaching its determination, the Board considered all factors it believed relevant, including (1) the nature, extent, and quality of the services to be provided to the fund and its shareholders by Fidelity (including the investment performance of the fund); (2) the competitiveness of the management fee and total expenses of the fund; (3) the total costs of the services to be provided by and the profits to be realized by the investment adviser and its affiliates from the relationship with the fund; (4) the extent to which economies of scale would be realized as the fund grows; and (5) whether fee levels reflect these economies of scale, if any, for the benefit of fund shareholders.
In determining whether to renew the Advisory Contracts for the fund, the Board ultimately reached a determination, with the assistance of fund counsel and independent Trustees' counsel, that the renewal of the Advisory Contracts and the compensation to be received by Fidelity under the management contract is consistent with Fidelity's fiduciary duty under applicable law. In addition to evaluating the specific factors noted above, the Board, in reaching its determination, is aware that shareholders in the fund have a broad range of investment choices available to them, including a wide choice among mutual funds offered by competitors to Fidelity, and that the fund's shareholders, with the opportunity to review and weigh the disclosure provided by the fund in its prospectus and other public disclosures, have chosen to invest in this fund, managed by Fidelity.
Annual Report
Nature, Extent, and Quality of Services Provided by Fidelity. The Board considered staffing within the investment adviser, FMR, and the sub-advisers (together, the Investment Advisers), including the background of the fund's portfolio manager and the fund's investment objective and discipline. The independent Trustees also had discussions with senior management of Fidelity's investment operations and investment groups. The Board considered the structure of the portfolio manager compensation program and whether this structure provides appropriate incentives.
Fidelity Resources Dedicated to Investment Management and Support Services. The Board reviewed the size, education, and experience of the Investment Advisers' investment staff, their use of technology, and the Investment Advisers' approach to recruiting, training, and retaining portfolio managers and other research, advisory, and management personnel. The Board considered Fidelity's extensive global research capabilities that enable the Investment Advisers to aggregate data from various sources in an effort to produce positive investment results. The Board noted that Fidelity's analysts have access to a variety of technological tools that enable them to perform both fundamental and quantitative analysis and to specialize in various disciplines. The Board also considered that Fidelity's portfolio managers and analysts have access to daily portfolio attribution that allows for monitoring of a fund's portfolio, as well as an electronic communication system that provides immediate real-time access to research concerning issuers and credit enhancers.
Shareholder and Administrative Services. The Board considered the nature, extent, quality, and cost of administrative, distribution, and shareholder services performed by the Investment Advisers and their affiliates under the Advisory Contracts and under separate agreements covering transfer agency, pricing and bookkeeping, and securities lending services for the fund. The Board also considered the nature and extent of the Investment Advisers' supervision of third party service providers, principally custodians and subcustodians. The Board reviewed the allocation of fund brokerage, including allocations to brokers affiliated with the Investment Advisers, the use of brokerage commissions to pay fund expenses, and the use of "soft" commission dollars to pay for research services. The Board also considered that Fidelity voluntarily decided in 2004 to stop using "soft" commission dollars to pay for market data and, instead, to pay for that data out of its own resources. The Board also considered the resources devoted to, and the record of compliance with, the fund's compliance policies and procedures.
The Board noted that the growth of fund assets across the complex allows Fidelity to reinvest in the development of services designed to enhance the value or convenience of the Fidelity funds as investment vehicles. These services include 24-hour access to account information and market information through phone representatives and over the Internet, and investor education materials and asset allocation tools.
Annual Report
Board Approval of Investment Advisory Contracts and
Management Fees - continued
Investment in a Large Fund Family. The Board considered the benefits to shareholders of investing in a Fidelity fund, including the benefits of investing in a fund that is part of a large family of funds offering a variety of investment disciplines and providing for a large variety of mutual fund investor services. For example, fund shareholders are offered the privilege of exchanging shares of the fund for shares of other Fidelity funds, as set forth in the fund's prospectus, without paying an additional sales charge. The Board noted that, since July 2004, Fidelity has taken a number of actions that benefited particular funds, including (i) voluntarily deciding in 2004 to stop using "soft" commission dollars to pay for market data and, instead, to pay for that data out of its own resources, (ii) contractually agreeing to impose management fee reductions and expense limitations on its five Spartan stock index funds and its stock index fund available through variable insurance products, (iii) contractually agreeing to eliminate the management fees on the Fidelity Freedom Funds and the Fidelity Advisor Freedom Funds, (iv) contractually agreeing to reduce the management fees on most of its investment-grade taxable bond funds, and (v) contractually agreeing to impose expense limitations on its retail and Spartan investment-grade taxable bond funds.
Investment Performance and Compliance. The Board considered whether the fund has operated within its investment objective, as well as its record of compliance with its investment restrictions. The Board noted that it is not possible to evaluate performance in any comprehensive fashion because the fund had been in operation for less than one calendar year. Once the fund has been in operation for at least one calendar year, the Board will review the fund's absolute investment performance, as well as the fund's relative investment performance measured against (i) a broad-based securities market index and (ii) a peer group of mutual funds deemed appropriate by the Board.
The Board has had thorough discussions with FMR throughout the year about the Board's and FMR's concerns about equity research, equity fund performance, and compliance with internal policies governing gifts and entertainment. FMR has taken steps that it believes will refocus and strengthen equity research and equity portfolio management and compliance. The Board noted with favor FMR's recent reorganization of its senior management team and FMR's plans to dedicate additional resources to investment research, and participated in the process that led to those changes.
Based on its review, and giving particular weight to the nature and quality of the resources dedicated by the Investment Advisers to maintain and improve relative performance, the Board concluded that the nature, extent, and quality of the services provided by Fidelity will benefit the fund's shareholders, particularly in light of the Board's view that the fund's shareholders benefit from investing in a fund that is part of a large family of funds offering a variety of investment disciplines and services.
Annual Report
Competitiveness of Management Fee and Total Fund Expenses. The Board considered the fund's management fee and total expenses compared to "mapped groups" of competitive funds and classes. Fidelity creates "mapped groups" by combining similar Lipper investment objective categories that have comparable management fee characteristics. Combining Lipper investment objective categories aids the Board's management fee and total expense comparisons by broadening the competitive group used for comparison and by reducing the number of universes to which various Fidelity funds are compared.
The Board considered two proprietary management fee comparisons for the period of the fund's operations shown in the chart below. The group of Lipper funds used by the Board for management fee comparisons is referred to below as the "Total Mapped Group" and, for the reasons explained above, is broader than the Lipper peer group used by the Board for performance comparisons. The Total Mapped Group comparison focuses on a fund's standing relative to the total universe of comparable funds available to investors, in terms of gross management fees before expense reimbursements or caps. "TMG %" represents the percentage of funds in the Total Mapped Group that had management fees that were lower than the fund's. For example, a TMG % of 48% means that 52% of the funds in the Total Mapped Group had higher management fees than the fund. The "Asset-Size Peer Group" (ASPG) comparison focuses on a fund's standing relative to non-Fidelity funds similar in size to the fund within the Total Mapped Group. The ASPG represents at least 15% of the funds in the Total Mapped Group with comparable asset size and management fee characteristics, subject to a minimum of 50 funds (or all funds in the Total Mapped Group if fewer than 50). Additional information, such as the ASPG quartile ("quadrant") in which the fund's management fee ranked, is also included in the chart and considered by the Board.
Annual Report
Board Approval of Investment Advisory Contracts and
Management Fees - continued
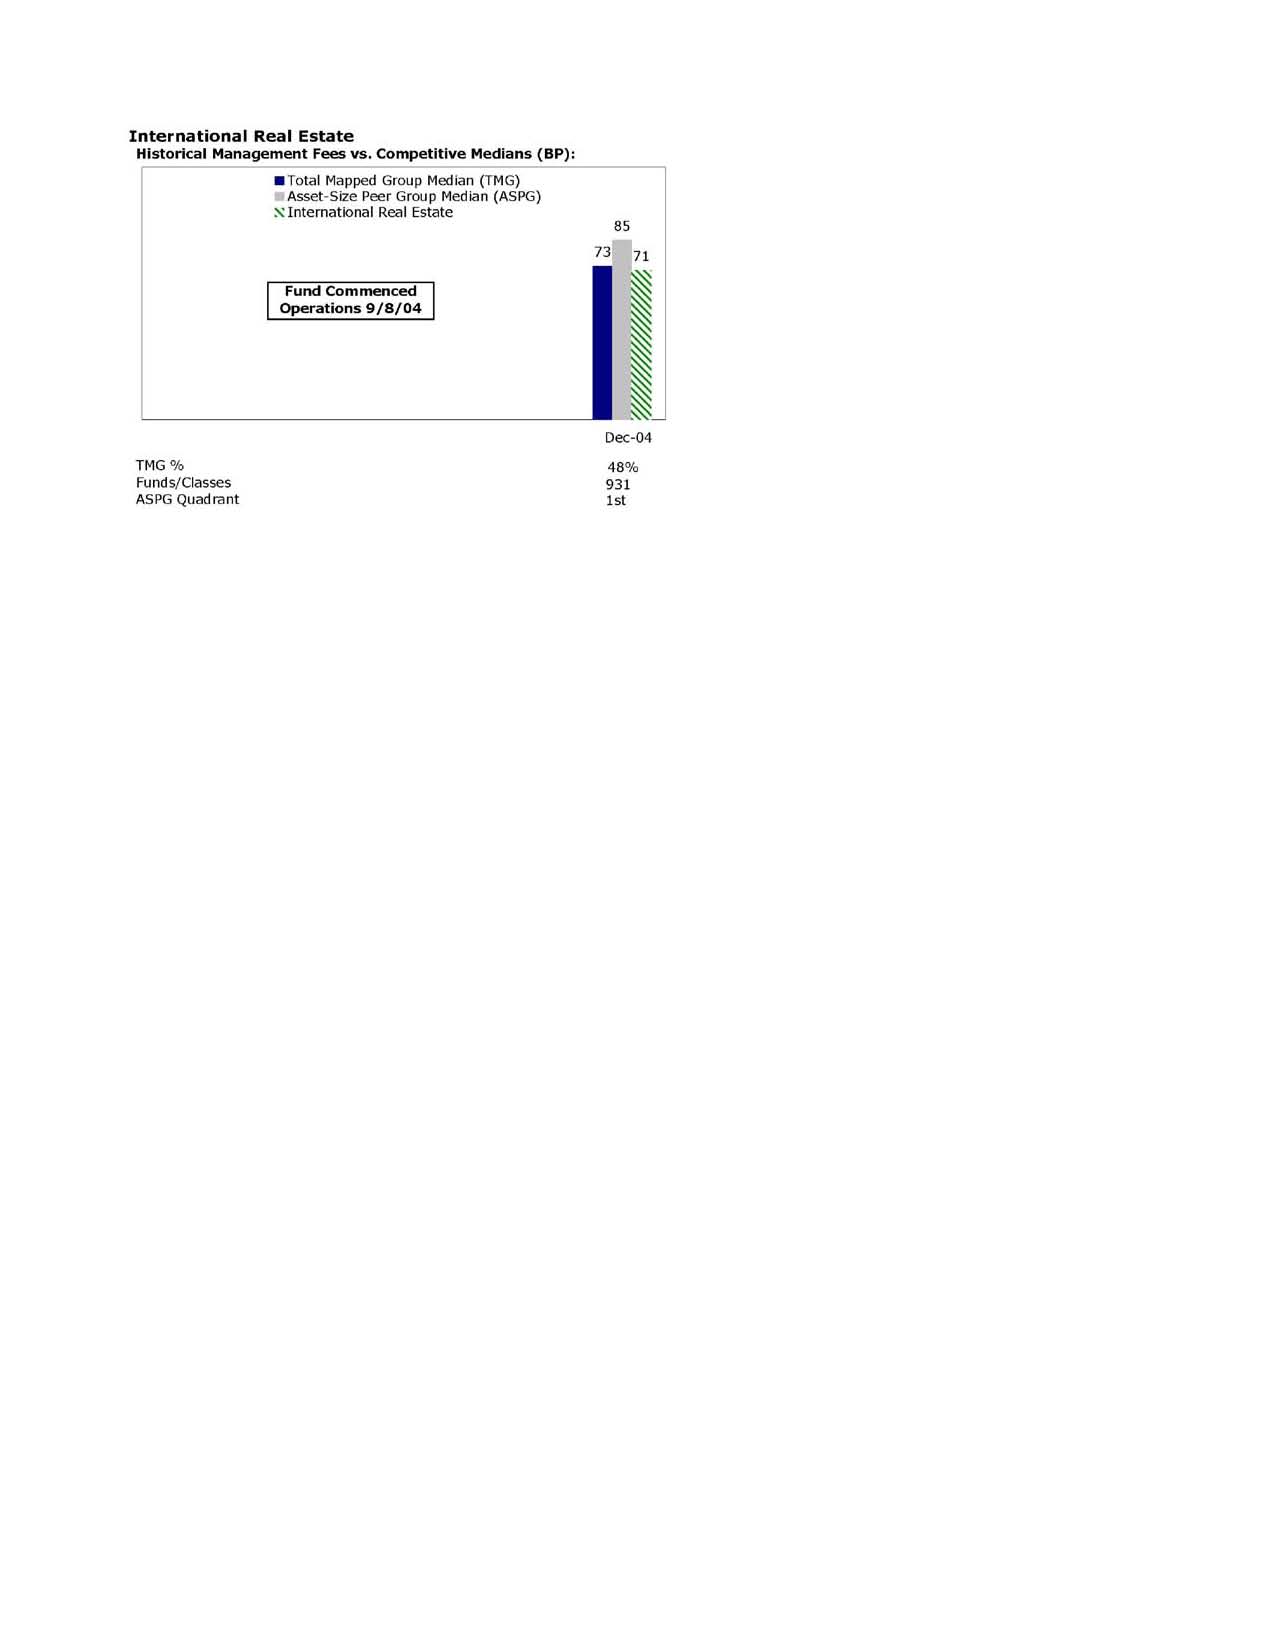
The Board noted that the fund's management fee ranked below the median of its Total Mapped Group and below the median of its ASPG for the period.
Based on its review, the Board concluded that the fund's management fee was fair and reasonable in light of the services that the fund receives and the other factors considered.
In its review of the fund's total expenses, the Board considered the fund's management fee as well as other fund expenses, such as transfer agent fees, pricing and bookkeeping fees, and custodial, legal, and audit fees. The Board also noted the effects of any waivers and reimbursements on fees and expenses. As part of its review, the Board also considered current and historical total expenses of the fund compared to competitive fund median expenses. The fund is compared to those funds and classes in the Total Mapped Group (used by the Board for management fee comparisons) that have a similar sales load structure.
The Board noted that the fund's total expenses ranked above its competitive median for the period.
Furthermore, the Board considered that, effective June 1, 2005, FMR voluntarily agreed to reimburse the fund to the extent that total operating expenses (excluding certain expenses) exceed 125 basis points. The Board considered that, if the 125 basis point voluntary expense reimbursement had been in effect in 2004, the fund's total expenses would have ranked below the median.
In its review of total expenses, the Board also considered Fidelity fee structures and other information on clients that FMR and its affiliates service in other competitive markets, such as other mutual funds advised or subadvised by FMR or its affiliates, pension plan clients, and other institutional clients.
Annual Report
Based on its review, the Board concluded that the fund's total expenses were reasonable, although above the median of the universe presented for comparison, in light of the services that the fund and its shareholders receive and the other factors considered.
Costs of the Services and Profitability. The Board considered the revenues earned and the expenses incurred by Fidelity in conducting the business of developing, marketing, distributing, managing, administering and servicing the fund and its shareholders. The Board also considered the level of Fidelity's profits in respect of all the Fidelity funds.
On an annual basis, FMR presents to the Board Fidelity's profitability for the fund. Fidelity calculates the profitability for each fund, as well as aggregate profitability for groups of Fidelity funds and all Fidelity funds, using a series of detailed revenue and cost allocation methodologies which originate with the audited books and records of Fidelity. The Audit Committee of the Board reviews any significant changes from the prior year's methodologies.
PricewaterhouseCoopers LLP (PwC), independent registered accounting firm and auditor to Fidelity and certain Fidelity funds, has been engaged annually by the Board as part of the Board's assessment of the results of Fidelity's profitability analysis. PwC's engagement includes the review and assessment of Fidelity's methodologies used in determining the revenues and expenses attributable to Fidelity's mutual fund business, and completion of agreed-upon procedures surrounding the mathematical accuracy of fund profitability and its conformity to allocation methodologies. After considering PwC's reports issued under the engagement and information provided by Fidelity, the Board believes that while other allocation methods may also be reasonable, Fidelity's profitability methodologies are reasonable in all material respects.
The Board has also reviewed Fidelity's non-fund businesses and any fall-out benefits related to the mutual fund business as well as cases where Fidelity's affiliates may benefit from or be related to the fund's business. In addition, a special committee of the Board reviewed services provided to Fidelity by its affiliates and determined that the fees that Fidelity paid for such services were reasonable.
The Board considered the costs of the services provided by and the profits realized by Fidelity in connection with the operation of the fund and determined that the amount of profit is a fair entrepreneurial profit for the management of the fund.
Economies of Scale. The Board considered whether there have been economies of scale in respect of the management of the Fidelity funds, whether the Fidelity funds (including the fund) have appropriately benefited from any such economies of scale, and whether there is potential for realization of any further economies of scale. The Board considered the extent to which the fund will benefit from economies of scale through increased services to the fund, through waivers or reimbursements, or through fee or expense reductions, including reductions that occur through operation of the transfer agent agreement. The transfer agent fee varies in part based on the number of accounts in the fund. If the number of accounts decreases or the average account size increases, the overall transfer agent fee rate decreases.
Annual Report
Board Approval of Investment Advisory Contracts and
Management Fees - continued
The Board recognized that the fund's management contract incorporates a "group fee" structure, which provides for lower fee rates as total fund assets under FMR's management increase, and for higher fee rates as total fund assets under FMR's management decrease. The Board considered that the group fee is designed to deliver the benefits of economies of scale to fund shareholders when total fund assets increase, even if assets of any particular fund are unchanged or have declined, because some portion of Fidelity's costs are attributable to services provided to all Fidelity funds, and all funds benefit if those costs can be allocated among more assets. The Board concluded that, given the group fee structure, fund shareholders will achieve a certain level of economies of scale as assets under FMR's management increase at the fund complex level, regardless of whether Fidelity achieves any such economies of scale.
The Board further concluded that any potential economies of scale are being shared between fund shareholders and Fidelity in an appropriate manner.
Additional Information Requested by the Board. In order to develop fully the factual basis for consideration of the Advisory Contracts, the Board requested additional information regarding (i) equity fund transfer agency fees; (ii) Fidelity's fund profitability methodology and the impact of various changes in the methodology over time; (iii) benefits to shareholders from economies of scale; (iv) composition and characteristics of various fund and industry data used in comparisons; and (v) compensation of portfolio managers and research analysts.
Based on its evaluation of all of the conclusions noted above, and after considering all material factors, the Board ultimately concluded that the existing advisory fee structures are fair and reasonable, and that the fund's existing Advisory Contracts should be renewed.
Annual Report
Managing Your Investments
Fidelity offers several ways to conveniently manage your personal investments via your telephone or PC. You can access your account information, conduct trades and research your investments 24 hours a day.
By Phone
Fidelity Automated Service Telephone provides a single toll-free number to access account balances, positions, quotes and trading. It's easy to navigate the service, and on your first call, the system will help you create a personal identification number (PIN) for security.
(phone_graphic)
Fidelity Automated
Service Telephone (FAST®)
1-800-544-5555
Press
1 For mutual fund and brokerage trading.
2 For quotes.*
3 For account balances and holdings.
4 To review orders and mutual
fund activity.
5 To change your PIN.
*0 To speak to a Fidelity representative.
By PC
Fidelity's web site on the Internet provides a wide range of information, including daily financial news, fund performance, interactive planning tools and news about Fidelity products and services.
(computer_graphic)
Fidelity's Web Site
www.fidelity.com
* When you call the quotes line, please remember that a fund's yield and return will vary and, except for money market funds, share price will also vary. This means that you may have a gain or loss when you sell your shares. There is no assurance that money market funds will be able to maintain a stable $1 share price; an investment in a money market fund is not insured or guaranteed by the U.S. government. Total returns are historical and include changes in share price, reinvestment of dividends and capital gains, and the effects of any sales charges.
Annual Report
To Visit Fidelity
For directions and hours,
please call 1-800-544-9797.
Arizona
7001 West Ray Road
Chandler, AZ
7373 N. Scottsdale Road
Scottsdale, AZ
California
815 East Birch Street
Brea, CA
1411 Chapin Avenue
Burlingame, CA
851 East Hamilton Avenue
Campbell, CA
19200 Von Karman Avenue
Irvine, CA
601 Larkspur Landing Circle
Larkspur, CA
10100 Santa Monica Blvd.
Los Angeles, CA
27101 Puerta Real
Mission Viejo, CA
73-575 El Paseo
Palm Desert, CA
251 University Avenue
Palo Alto, CA
123 South Lake Avenue
Pasadena, CA
16995 Bernardo Ctr. Drive
Rancho Bernardo, CA
1740 Arden Way
Sacramento, CA
7676 Hazard Center Drive
San Diego, CA
8 Montgomery Street
San Francisco, CA
3793 State Street
Santa Barbara, CA
21701 Hawthorne Boulevard
Torrance, CA
2001 North Main Street
Walnut Creek, CA
6300 Canoga Avenue
Woodland Hills, CA
Colorado
1625 Broadway
Denver, CO
9185 East Westview Road
Littleton, CO
Connecticut
48 West Putnam Avenue
Greenwich, CT
265 Church Street
New Haven, CT
300 Atlantic Street
Stamford, CT
29 South Main Street
West Hartford, CT
Delaware
222 Delaware Avenue
Wilmington, DE
Florida
4400 N. Federal Highway
Boca Raton, FL
121 Alhambra Plaza
Coral Gables, FL
2948 N. Federal Highway
Ft. Lauderdale, FL
1907 West State Road 434
Longwood, FL
8880 Tamiami Trail, North
Naples, FL
3550 Tamiami Trail, South
Sarasota, FL
1502 N. Westshore Blvd.
Tampa, FL
2465 State Road 7
Wellington, FL
3501 PGA Boulevard
West Palm Beach, FL
Georgia
3445 Peachtree Road, N.E.
Atlanta, GA
1000 Abernathy Road
Atlanta, GA
Illinois
One North LaSalle Street
Chicago, IL
875 North Michigan Ave.
Chicago, IL
1415 West 22nd Street
Oak Brook, IL
1700 East Golf Road
Schaumburg, IL
3232 Lake Avenue
Wilmette, IL
Indiana
4729 East 82nd Street
Indianapolis, IN
Kansas
5400 College Boulevard
Overland Park, KS
Maine
Three Canal Plaza
Portland, ME
Maryland
7315 Wisconsin Avenue
Bethesda, MD
One W. Pennsylvania Ave.
Towson, MD
Massachusetts
801 Boylston Street
Boston, MA
155 Congress Street
Boston, MA
300 Granite Street
Braintree, MA
44 Mall Road
Burlington, MA
405 Cochituate Road
Framingham, MA
416 Belmont Street
Worcester, MA
Michigan
500 E. Eisenhower Pkwy.
Ann Arbor, MI
280 Old N. Woodward Ave.
Birmingham, MI
43420 Grand River Avenue
Novi, MI
29155 Northwestern Hwy.
Southfield, MI
Minnesota
7600 France Avenue South
Edina, MN
Missouri
8885 Ladue Road
Ladue, MO
Annual Report
Nevada
2225 Village Walk Drive
Henderson, NV
New Jersey
150 Essex Street
Millburn, NJ
56 South Street
Morristown, NJ
396 Route 17, North
Paramus, NJ
3518 Route 1 North
Princeton, NJ
530 Highway 35
Shrewsbury, NJ
New York
1055 Franklin Avenue
Garden City, NY
37 West Jericho Turnpike
Huntington Station, NY
1271 Avenue of the Americas
New York, NY
61 Broadway
New York, NY
350 Park Avenue
New York, NY
200 Fifth Avenue
New York, NY
733 Third Avenue
New York, NY
11 Penn Plaza
New York, NY
2070 Broadway
New York, NY
1075 Northern Blvd.
Roslyn, NY
North Carolina
4611 Sharon Road
Charlotte, NC
Ohio
3805 Edwards Road
Cincinnati, OH
1324 Polaris Parkway
Columbus, OH
28699 Chagrin Boulevard
Woodmere Village, OH
Oregon
16850 SW 72nd Avenue
Tigard, OR
Pennsylvania
600 West DeKalb Pike
King of Prussia, PA
1735 Market Street
Philadelphia, PA
12001 Perry Highway
Wexford, PA
Rhode Island
47 Providence Place
Providence, RI
Tennessee
6150 Poplar Avenue
Memphis, TN
Texas
10000 Research Boulevard
Austin, TX
4001 Northwest Parkway
Dallas, TX
12532 Memorial Drive
Houston, TX
2701 Drexel Drive
Houston, TX
6500 N. MacArthur Blvd.
Irving, TX
6005 West Park Boulevard
Plano, TX
14100 San Pedro
San Antonio, TX
1576 East Southlake Blvd.
Southlake, TX
19740 IH 45 North
Spring, TX
Utah
215 South State Street
Salt Lake City, UT
Virginia
1861 International Drive
McLean, VA
Washington
411 108th Avenue, N.E.
Bellevue, WA
1518 6th Avenue
Seattle, WA
Washington, DC
1900 K Street, N.W.
Washington, DC
Wisconsin
595 North Barker Road
Brookfield, WI
Fidelity Brokerage Services, Inc., 100 Summer St., Boston, MA 02110 Member NYSE/SIPC
Annual Report
To Write Fidelity
We'll give your correspondence immediate attention and send you written confirmation upon completion of your request.
(letter_graphic)
Making Changes
To Your Account
(such as changing name, address, bank, etc.)
Fidelity Investments
P.O. Box 770001
Cincinnati, OH 45277-0002
(letter_graphic)
For Non-Retirement
Accounts
Buying shares
Fidelity Investments
P.O. Box 770001
Cincinnati, OH 45277-0003
Overnight Express
Fidelity Investments
Attn: Distribution Services
100 Crosby Parkway - KC1H
Covington, KY 41015
Selling shares
Fidelity Investments
P.O. Box 770001
Cincinnati, OH 45277-0035
Overnight Express
Fidelity Investments
Attn: Distribution Services
100 Crosby Parkway - KC1H
Covington, KY 41015
General Correspondence
Fidelity Investments
P.O. Box 500
Merrimack, NH 03054-0500
(letter_graphic)
For Retirement
Accounts
Buying shares
Fidelity Investments
P.O. Box 770001
Cincinnati, OH 45277-0003
Selling shares
Fidelity Investments
P.O. Box 770001
Cincinnati, OH 45277-0035
Overnight Express
Fidelity Investments
Attn: Distribution Services
100 Crosby Parkway - KC1H
Covington, KY 41015
General Correspondence
Fidelity Investments
P.O. Box 500
Merrimack, NH 03054-0500
Annual Report
Annual Report
Annual Report
Annual Report
Investment Adviser
Fidelity Management & Research Company
Boston, MA
Investment Sub-Advisers
FMR Co., Inc.
Fidelity Management & Research
(Far East) Inc.
Fidelity Management & Research
(U.K.) Inc.
Fidelity Investments Japan Limited
Fidelity International Investment
Advisers
Fidelity International Investment
Advisers (U.K.) Limited
General Distributor
Fidelity Distributors Corporation
Boston, MA
Transfer and Service Agent
Fidelity Service Company, Inc.
Boston, MA
Custodian
Mellon Bank, N.A.
Pittsburgh, PA
The Fidelity Telephone Connection
Mutual Fund 24-Hour Service
Exchanges/Redemptions
and Account Assistance 1-800-544-6666
Product Information 1-800-544-6666
Retirement Accounts 1-800-544-4774
(8 a.m. - 9 p.m.)
TDD Service 1-800-544-0118
for the deaf and hearing impaired
(9 a.m. - 9 p.m. Eastern time)
Fidelity Automated Service
Telephone (FAST®) (automated graphic) 1-800-544-5555
(automated graphic) Automated line for quickest service
IRE-UANN-0905
1.801327.100
(Fidelity Investment logo)(registered trademark)
Corporate Headquarters
82 Devonshire St., Boston, MA 02109
www.fidelity.com
Fidelity®
Leveraged Company Stock
Fund
Annual Report
July 31, 2005
(2_fidelity_logos) (Registered_Trademark)
Contents
Chairman's Message | <Click Here> | Ned Johnson's message to shareholders. |
Performance | <Click Here> | How the fund has done over time. |
Management's Discussion | <Click Here> | The manager's review of fund performance, strategy and outlook. |
Shareholder Expense Example | <Click Here> | An example of shareholder expenses. |
Investment Changes | <Click Here> | A summary of major shifts in the fund's investments over the last six months. |
Investments | <Click Here> | A complete list of the fund's investments with their market values. |
Financial Statements | <Click Here> | Statements of assets and liabilities, operations, and changes in net assets,
as well as financial highlights. |
Notes | <Click Here> | Notes to the financial statements. |
Report of Independent Registered Public Accounting Firm | <Click Here> | |
Trustees and Officers | <Click Here> | |
Distributions | <Click Here> | |
Board Approval of Investment Advisory Contracts and Management Fees | <Click Here> | |
To view a fund's proxy voting guidelines and proxy voting record for the 12-month period ended June 30, visit www.fidelity.com/proxyvotingresults or visit the Securities and Exchange Commission's (SEC) web site at www.sec.gov. You may also call 1-800-544-8544 to request a free copy of the proxy voting guidelines.
Standard & Poor's, S&P and S&P 500 are registered service marks of The McGraw-Hill Companies, Inc. and have been licensed for use by Fidelity Distributors Corporation.
Other third party marks appearing herein are the property of their respective owners.
All other marks appearing herein are registered or unregistered trademarks or service marks of FMR Corp. or an affiliated company.
Annual Report
This report and the financial statements contained herein are submitted for the general information of the shareholders of the fund. This report is not authorized for distribution to prospective investors in the fund unless preceded or accompanied by an effective prospectus.
A fund files its complete schedule of portfolio holdings with the SEC for the first and third quarters of each fiscal year on Form N-Q. Forms N-Q are available on the SEC's web site at http://www.sec.gov. A fund's Forms N-Q may be reviewed and copied at the SEC's Public Reference Room in Washington, DC. Information regarding the operation of the SEC's Public Reference Room may be obtained by calling 1-800-SEC-0330. For a complete list of a fund's portfolio holdings, view the most recent quarterly holdings report, semiannual report, or annual report on Fidelity's web site at http://www.fidelity.com/holdings.
NOT FDIC INSURED · MAY LOSE VALUE · NO BANK GUARANTEE
Neither the fund nor Fidelity Distributors Corporation is a bank.
Annual Report
Chairman's Message
(photo_of_Edward_C_Johnson_3d)
Dear Shareholder:
During the past year or so, much has been reported about the mutual fund industry, and much of it has been more critical than I believe is warranted. Allegations that some companies have been less than forthright with their shareholders have cast a shadow on the entire industry. I continue to find these reports disturbing, and assert that they do not create an accurate picture of the industry overall. Therefore, I would like to remind everyone where Fidelity stands on these issues. I will say two things specifically regarding allegations that some mutual fund companies were in violation of the Securities and Exchange Commission's forward pricing rules or were involved in so-called "market timing" activities.
First, Fidelity has no agreements that permit customers who buy fund shares after 4 p.m. to obtain the 4 p.m. price. This is not a new policy. This is not to say that someone could not deceive the company through fraudulent acts. However, we are extremely diligent in preventing fraud from occurring in this manner - and in every other. But I underscore again that Fidelity has no so-called "agreements" that sanction illegal practices.
Second, Fidelity continues to stand on record, as we have for years, in opposition to predatory short-term trading that adversely affects shareholders in a mutual fund. Back in the 1980s, we initiated a fee - which is returned to the fund and, therefore, to investors - to discourage this activity. Further, we took the lead several years ago in developing a Fair Value Pricing Policy to prevent market timing on foreign securities in our funds. I am confident we will find other ways to make it more difficult for predatory traders to operate. However, this will only be achieved through close cooperation among regulators, legislators and the industry.
Yes, there have been unfortunate instances of unethical and illegal activity within the mutual fund industry from time to time. That is true of any industry. When this occurs, confessed or convicted offenders should be dealt with appropriately. But we are still concerned about the risk of over-regulation and the quick application of simplistic solutions to intricate problems. Every system can be improved, and we support and applaud well thought out improvements by regulators, legislators and industry representatives that achieve the common goal of building and protecting the value of investors' holdings.
For nearly 60 years, Fidelity has worked very hard to improve its products and service to justify your trust. When our family founded this company in 1946, we had only a few hundred customers. Today, we serve more than 18 million customers including individual investors and participants in retirement plans across America.
Let me close by saying that we do not take your trust in us for granted, and we realize that we must always work to improve all aspects of our service to you. In turn, we urge you to continue your active participation with your financial matters, so that your interests can be well served.
Best regards,
/s/Edward C. Johnson 3d
Edward C. Johnson 3d
Annual Report
Performance: The Bottom Line
Average annual total return reflects the change in the value of an investment, assuming reinvestment of the fund's dividend income and capital gains (the profits earned upon the sale of securities that have grown in value) and assuming a constant rate of performance each year. The $10,000 table and the fund's returns do not reflect the deduction of taxes that a shareholder would pay on fund distributions or the redemption of fund shares. During periods of reimbursement by Fidelity, a fund's total return will be greater than it would be had the reimbursement not occurred. How a fund did yesterday is no guarantee of how it will do tomorrow.
Average Annual Total Returns
Periods ended July 31, 2005 | | Past 1
year | Life of
fundA |
Fidelity® Leveraged Company Stock Fund | | 33.93% | 25.02% |
A From December 19, 2000
$10,000 Over Life of Fund
Let's say hypothetically that $10,000 was invested in Fidelity ® Leveraged Company Stock Fund on December 19, 2000, when the fund started. The chart shows how the value of your investment would have changed, and also shows how the Standard & Poor'sSM 500 Index performed over the same period.
Annual Report
Management's Discussion of Fund Performance
Comments from Thomas Soviero, Portfolio Manager of Fidelity® Leveraged Company Stock Fund
A late-inning rally on Wall Street helped push some key U.S. equity indexes to four-year highs by the conclusion of the 12-month period ending July 31, 2005. Spurred on by bullish economic data and strong corporate earnings, investors enjoyed a stellar month of July, capping off a turbulent 12-month period for U.S. equity markets. Stock prices bounced up and down during most of the year, moving in cadence with gyrations in the price of crude oil and investors' gathering and ebbing concerns about inflation. The Federal Reserve Board raised short-term interest rates eight times during the period, also affecting overall market sentiment. Despite their fluctuations, the major equity indexes finished on a high note, with the Standard & Poor's 500SM Index and the NASDAQ Composite® Index posting gains of 14.05% and 16.51%, respectively, for the period. The small-cap Russell 2000® Index rose 24.78% and the Russell Midcap® Index jumped 28.93%, while the blue-chips' Dow Jones Industrial AverageSM advanced only 7.29%.
For the 12 months that ended July 31, 2005, the fund returned 33.93%, outperforming the Credit Suisse First Boston Leveraged Equity Index and the LipperSM Capital Appreciation Funds Average, which returned 30.76% and 13.69%, respectively. It also beat the S&P 500®. The fund's absolute performance was driven by concentrated positions in several stocks that offered strong returns. Relative to the S&P 500®, the fund's performance was helped by security selection and an overweighting in the energy and utilities sectors. Stock selection in telecommunication services also boosted the fund's relative performance, as did some good picks and underweightings in financials and health care. Top performers for the fund, both in absolute terms and relative to the S&P 500, included global power company AES, energy exploration and production firm Forest Oil, oil refiner Valero Energy, and independent oil and natural gas producer Chesapeake Energy. Among the detractors from the fund's performance during the period were electronic component manufacturer DDi, International Paper and packaging firm Smurfit-Stone Container.
The views expressed in this statement reflect those of the portfolio manager only through the end of the period of the report as stated on the cover and do not necessarily represent the views of Fidelity or any other person in the Fidelity organization. Any such views are subject to change at any time based upon market or other conditions and Fidelity disclaims any responsibility to update such views. These views may not be relied on as investment advice and, because investment decisions for a Fidelity fund are based on numerous factors, may not be relied on as an indication of trading intent on behalf of any Fidelity fund.
Annual Report
Shareholder Expense Example
As a shareholder of the Fund, you incur two types of costs: (1) transaction costs, including redemption fees, and (2) ongoing costs, including management fees and other Fund expenses. This Example is intended to help you understand your ongoing costs (in dollars) of investing in the Fund and to compare these costs with the ongoing costs of investing in other mutual funds.
The Example is based on an investment of $1,000 invested at the beginning of the period and held for the entire period (February 1, 2005 to July 31, 2005).
Actual Expenses
The first line of the table below provides information about actual account values and actual expenses. You may use the information in this line, together with the amount you invested, to estimate the expenses that you paid over the period. Simply divide your account value by $1,000.00 (for example, an $8,600 account value divided by $1,000.00 = 8.6), then multiply the result by the number in the first line under the heading entitled "Expenses Paid During Period" to estimate the expenses you paid on your account during this period. A small balance maintenance fee of $12.00 that is charged once a year may apply for certain accounts with a value of less than $2,000. This fee is not included in the table below. If it was, the estimate of expenses you paid during the period would be higher, and your ending account value lower, by this amount.
Hypothetical Example for Comparison Purposes
The second line of the table below provides information about hypothetical account values and hypothetical expenses based on the Fund's actual expense ratio and an assumed rate of return of 5% per year before expenses, which is not the Fund's actual return. The hypothetical account values and expenses may not be used to estimate the actual ending account balance or expenses you paid for the period. You may use this information to compare the ongoing costs of investing in the Fund and other funds. To do so, compare this 5% hypothetical example with the 5% hypothetical examples that appear in the shareholder reports of the other funds. A small balance maintenance fee of $12.00 that is charged once a year may apply for certain accounts with a value of less than $2,000. This fee is not included in the table below. If it was, the estimate of expenses you paid during the period would be higher, and your ending account value lower, by this amount.
Please note that the expenses shown in the table are meant to highlight your ongoing costs only and do not reflect any transaction costs. Therefore, the second line of the table is useful in comparing ongoing costs only, and will not help you determine the relative total costs of owning different funds. In addition, if these transactional costs were included, your costs would have been higher.
| Beginning
Account Value
February 1, 2005 | Ending
Account Value
July 31, 2005 | Expenses Paid
During Period*
February 1, 2005
to July 31, 2005 |
Actual | $ 1,000.00 | $ 1,127.90 | $ 4.54 |
Hypothetical (5% return per year before expenses) | $ 1,000.00 | $ 1,020.53 | $ 4.31 |
* Expenses are equal to the Fund's annualized expense ratio of .86%; multiplied by the average account value over the period, multiplied by 181/365 (to reflect the one-half year period).
Annual Report
Investment Changes
Top Ten Stocks as of July 31, 2005 |
| % of fund's
net assets | % of fund's net assets
6 months ago |
Forest Oil Corp. | 4.9 | 4.7 |
Teekay Shipping Corp. | 4.5 | 6.2 |
AES Corp. | 4.5 | 6.0 |
Service Corp. International (SCI) | 3.8 | 0.0 |
General Maritime Corp. | 3.4 | 5.6 |
Nextel Communications, Inc. Class A | 2.8 | 3.4 |
OMI Corp. | 2.8 | 2.1 |
Valero Energy Corp. | 2.6 | 1.1 |
Celanese Corp. Class A | 2.4 | 0.1 |
CMS Energy Corp. | 2.2 | 2.5 |
| 33.9 | |
Top Five Market Sectors as of July 31, 2005 |
| % of fund's
net assets | % of fund's net assets
6 months ago |
Energy | 34.3 | 34.1 |
Materials | 14.6 | 10.8 |
Consumer Discretionary | 9.6 | 8.1 |
Information Technology | 9.1 | 3.2 |
Industrials | 8.9 | 11.1 |
Asset Allocation (% of fund's net assets) |
As of July 31, 2005 * | As of January 31, 2005 ** |
| Stocks 99.3% | | | Stocks 93.6% | |
 | Bonds 0.2% | | | Bonds 0.0% | |
 | Other Investments 0.3% | | | Other Investments 0.9% | |
| Short-Term
Investments and
Net Other Assets 0.2% | | | Short-Term
Investments and
Net Other Assets 5.5% | |
* Foreign investments | 17.4% | | ** Foreign investments | 20.8% | |

Annual Report
Investments July 31, 2005
Showing Percentage of Net Assets
Common Stocks - 99.0% |
| Shares | | Value (Note 1)
(000s) |
CONSUMER DISCRETIONARY - 9.5% |
Auto Components - 0.6% |
Tenneco Automotive, Inc. (a) | 258,500 | | $ 4,875 |
TRW Automotive Holdings Corp. (a) | 618,100 | | 16,460 |
| | 21,335 |
Diversified Consumer Services - 3.8% |
Carriage Services, Inc. Class A (a) | 266,200 | | 1,680 |
Service Corp. International (SCI) | 14,576,200 | | 126,376 |
| | 128,056 |
Hotels, Restaurants & Leisure - 1.4% |
Alliance Gaming Corp. (a)(d) | 896,000 | | 13,718 |
Centerplate, Inc. unit | 363,005 | | 4,719 |
Friendly Ice Cream Corp. (a)(e) | 423,400 | | 5,102 |
Six Flags, Inc. (a) | 3,395,400 | | 17,826 |
Sunterra Corp. (a) | 342,900 | | 4,828 |
| | 46,193 |
Household Durables - 0.4% |
Juno Lighting, Inc. | 72,319 | | 3,182 |
Tempur-Pedic International, Inc. (a)(d) | 525,100 | | 9,037 |
| | 12,219 |
Media - 2.5% |
Cablevision Systems Corp. - NY Group Class A (a) | 242,900 | | 7,523 |
Charter Communications, Inc. Class A (a)(d) | 13,115,971 | | 17,707 |
Gray Television, Inc. | 622,300 | | 7,997 |
Liberty Global, Inc. Class A (a) | 33,815 | | 1,604 |
Nexstar Broadcasting Group, Inc. (a) | 222,000 | | 1,243 |
NTL, Inc. (a) | 344,669 | | 22,965 |
Spanish Broadcasting System, Inc. Class A (a) | 248,100 | | 2,134 |
The DIRECTV Group, Inc. (a) | 619,645 | | 9,543 |
The Reader's Digest Association, Inc. (non-vtg.) | 752,900 | | 12,227 |
| | 82,943 |
Specialty Retail - 0.8% |
AutoNation, Inc. (a) | 247,600 | | 5,346 |
Blockbuster, Inc. Class A (d) | 1,136,500 | | 9,853 |
Gap, Inc. | 558,200 | | 11,784 |
| | 26,983 |
TOTAL CONSUMER DISCRETIONARY | | 317,729 |
Common Stocks - continued |
| Shares | | Value (Note 1)
(000s) |
CONSUMER STAPLES - 4.3% |
Food & Staples Retailing - 2.8% |
Albertsons, Inc. (d) | 1,579,300 | | $ 33,655 |
Koninklijke Ahold NV sponsored ADR (a) | 2,756,800 | | 24,232 |
Kroger Co. (a) | 439,300 | | 8,720 |
Pathmark Stores, Inc. (a) | 1,297,047 | | 14,449 |
Safeway, Inc. | 445,700 | | 10,831 |
| | 91,887 |
Food Products - 1.2% |
Corn Products International, Inc. | 475,600 | | 11,448 |
Kellogg Co. | 184,900 | | 8,378 |
Smithfield Foods, Inc. (a) | 811,700 | | 21,202 |
| | 41,028 |
Personal Products - 0.3% |
Revlon, Inc. Class A (sub. vtg.) (a) | 2,987,299 | | 11,172 |
TOTAL CONSUMER STAPLES | | 144,087 |
ENERGY - 34.3% |
Energy Equipment & Services - 5.2% |
Grant Prideco, Inc. (a) | 606,300 | | 19,462 |
Grey Wolf, Inc. (a) | 8,326,600 | | 63,865 |
Hanover Compressor Co. (a) | 451,500 | | 6,565 |
Nabors Industries Ltd. (a) | 454,400 | | 29,740 |
Petroleum Geo-Services ASA sponsored ADR (a)(d) | 838,459 | | 20,131 |
Pride International, Inc. (a) | 484,300 | | 12,601 |
Rowan Companies, Inc. | 321,100 | | 10,969 |
Universal Compression Holdings, Inc. (a) | 184,700 | | 7,490 |
| | 170,823 |
Oil, Gas & Consumable Fuels - 29.1% |
Burlington Resources, Inc. | 709,500 | | 45,486 |
Chesapeake Energy Corp. | 2,434,100 | | 63,554 |
Comstock Resources, Inc. (a) | 311,800 | | 8,634 |
El Paso Corp. | 2,647,700 | | 31,772 |
Forest Oil Corp. (a)(e) | 3,610,100 | | 161,587 |
Frontier Oil Corp. | 966,800 | | 27,090 |
Frontline Ltd. (d) | 185,300 | | 7,937 |
Frontline Ltd. (NY Shares) | 1,036,800 | | 43,525 |
General Maritime Corp. (e) | 2,926,000 | | 114,085 |
Houston Exploration Co. (a) | 89,200 | | 5,155 |
KCS Energy, Inc. (a) | 259,300 | | 5,093 |
Common Stocks - continued |
| Shares | | Value (Note 1)
(000s) |
ENERGY - continued |
Oil, Gas & Consumable Fuels - continued |
Nexen, Inc. | 831,600 | | $ 30,823 |
OMI Corp. (e) | 5,100,900 | | 91,969 |
Overseas Shipholding Group, Inc. | 123,200 | | 7,645 |
Petrohawk Energy Corp. (a) | 548,737 | | 6,047 |
Range Resources Corp. | 2,426,200 | | 74,096 |
Ship Finance International Ltd.: | | | |
(Norway) | 18,530 | | 348 |
(NY Shares) | 449,662 | | 8,454 |
Teekay Shipping Corp. (d) | 3,258,300 | | 149,914 |
Valero Energy Corp. | 1,037,700 | | 85,901 |
| | 969,115 |
TOTAL ENERGY | | 1,139,938 |
FINANCIALS - 1.7% |
Consumer Finance - 0.3% |
Metris Companies, Inc. (a) | 637,300 | | 9,464 |
Insurance - 1.1% |
American Financial Group, Inc., Ohio | 1,002,800 | | 33,935 |
UnumProvident Corp. | 134,400 | | 2,574 |
| | 36,509 |
Thrifts & Mortgage Finance - 0.3% |
Capital Crossing Bank (a) | 258,800 | | 9,475 |
TOTAL FINANCIALS | | 55,448 |
HEALTH CARE - 2.9% |
Health Care Equipment & Supplies - 0.5% |
Baxter International, Inc. | 430,100 | | 16,890 |
Health Care Providers & Services - 2.4% |
DaVita, Inc. (a) | 1,567,900 | | 74,068 |
Rural/Metro Corp. (a) | 834,200 | | 6,599 |
| | 80,667 |
TOTAL HEALTH CARE | | 97,557 |
INDUSTRIALS - 8.8% |
Air Freight & Logistics - 0.1% |
Park-Ohio Holdings Corp. (a) | 179,465 | | 3,647 |
Common Stocks - continued |
| Shares | | Value (Note 1)
(000s) |
INDUSTRIALS - continued |
Airlines - 2.0% |
AirTran Holdings, Inc. (a) | 861,500 | | $ 9,856 |
America West Holding Corp. Class B (a)(d) | 800,600 | | 6,805 |
AMR Corp. (a)(d) | 2,514,530 | | 35,329 |
Delta Air Lines, Inc. (a)(d) | 4,192,909 | | 12,411 |
Northwest Airlines Corp. (a)(d) | 455,100 | | 2,116 |
| | 66,517 |
Building Products - 2.5% |
American Standard Companies, Inc. | 613,200 | | 27,152 |
Lennox International, Inc. | 230,700 | | 5,634 |
Masco Corp. | 605,200 | | 20,522 |
Royal Group Technologies Ltd. (sub. vtg.) (a) | 564,700 | | 5,595 |
York International Corp. | 536,700 | | 22,933 |
| | 81,836 |
Commercial Services & Supplies - 2.1% |
Allied Waste Industries, Inc. (a) | 2,403,900 | | 20,625 |
Cenveo, Inc. (a)(d) | 1,812,300 | | 14,879 |
Clean Harbors, Inc. (a)(d) | 140,200 | | 3,415 |
Corrections Corp. of America (a) | 193,100 | | 7,259 |
Waste Management, Inc. | 904,900 | | 25,446 |
| | 71,624 |
Construction & Engineering - 0.2% |
Integrated Electrical Services, Inc. (a)(d)(e) | 2,607,500 | | 7,223 |
Industrial Conglomerates - 1.1% |
Tyco International Ltd. | 1,196,200 | | 36,448 |
Machinery - 0.5% |
Navistar International Corp. (a) | 234,000 | | 7,991 |
Terex Corp. (a) | 82,700 | | 4,004 |
Thermadyne Holdings Corp. (a) | 64,900 | | 957 |
Timken Co. | 92,800 | | 2,456 |
| | 15,408 |
Marine - 0.0% |
Golden Ocean Group Ltd. (a)(d) | 2,067,600 | | 1,262 |
Road & Rail - 0.3% |
Central Freight Lines, Inc. (a) | 679,940 | | 2,047 |
Kansas City Southern (a) | 326,700 | | 7,370 |
| | 9,417 |
TOTAL INDUSTRIALS | | 293,382 |
Common Stocks - continued |
| Shares | | Value (Note 1)
(000s) |
INFORMATION TECHNOLOGY - 9.1% |
Communications Equipment - 1.2% |
Motorola, Inc. | 1,815,100 | | $ 38,444 |
Computers & Peripherals - 0.9% |
McDATA Corp. Class A (a) | 2,591,100 | | 12,541 |
Seagate Technology | 835,600 | | 16,186 |
| | 28,727 |
Electronic Equipment & Instruments - 1.7% |
Celestica, Inc. (sub. vtg.) (a) | 1,716,000 | | 19,958 |
DDi Corp. (a) | 2,071,300 | | 3,521 |
Merix Corp. (a)(d) | 385,000 | | 2,422 |
Solectron Corp. (a) | 3,673,600 | | 14,107 |
Viasystems Group, Inc. (a) | 95,400 | | 763 |
Viasystems Group, Inc. (a)(h) | 625,780 | | 5,006 |
Vishay Intertechnology, Inc. (a) | 815,000 | | 11,426 |
| | 57,203 |
Semiconductors & Semiconductor Equipment - 5.3% |
AMIS Holdings, Inc. (a) | 1,195,324 | | 15,252 |
Amkor Technology, Inc. (a)(d)(e) | 9,439,636 | | 43,989 |
Atmel Corp. (a) | 13,152,700 | | 30,777 |
Conexant Systems, Inc. (a) | 927,700 | | 1,772 |
Fairchild Semiconductor International, Inc. (a) | 200,000 | | 3,372 |
Freescale Semiconductor, Inc.: | | | |
Class A | 287,500 | | 7,337 |
Class B | 27,040 | | 696 |
ON Semiconductor Corp. (a)(e) | 12,896,800 | | 74,157 |
| | 177,352 |
TOTAL INFORMATION TECHNOLOGY | | 301,726 |
MATERIALS - 14.6% |
Chemicals - 6.8% |
Albemarle Corp. | 362,000 | | 13,792 |
Arch Chemicals, Inc. | 482,842 | | 12,433 |
Celanese Corp. Class A | 4,143,100 | | 77,973 |
Chemtura Corp. | 4,781,661 | | 75,263 |
Methanex Corp. | 701,700 | | 11,405 |
NOVA Chemicals Corp. (d) | 537,000 | | 18,833 |
Common Stocks - continued |
| Shares | | Value (Note 1)
(000s) |
MATERIALS - continued |
Chemicals - continued |
Rhodia SA sponsored ADR (a)(d) | 7,102,200 | | $ 14,631 |
Texas Petrochemicals, Inc. (a) | 11,700 | | 176 |
| | 224,506 |
Construction Materials - 0.1% |
Texas Industries, Inc. | 53,800 | | 3,961 |
Containers & Packaging - 3.7% |
Owens-Illinois, Inc. (a) | 1,132,890 | | 29,059 |
Packaging Corp. of America | 179,700 | | 3,819 |
Pactiv Corp. (a) | 2,006,300 | | 44,179 |
Sealed Air Corp. (a) | 156,900 | | 8,325 |
Smurfit-Stone Container Corp. (a) | 3,226,482 | | 39,137 |
| | 124,519 |
Metals & Mining - 0.4% |
Freeport-McMoRan Copper & Gold, Inc. Class B | 282,500 | | 11,379 |
Haynes International, Inc. (a)(f) | 16,834 | | 345 |
| | 11,724 |
Paper & Forest Products - 3.6% |
Aracruz Celulose SA (PN-B) sponsored ADR | 184,500 | | 6,865 |
Georgia-Pacific Corp. | 301,300 | | 10,289 |
International Paper Co. | 1,527,900 | | 48,282 |
Weyerhaeuser Co. | 791,100 | | 54,570 |
| | 120,006 |
TOTAL MATERIALS | | 484,716 |
TELECOMMUNICATION SERVICES - 7.0% |
Diversified Telecommunication Services - 2.9% |
Covad Communications Group, Inc. (a) | 931,615 | | 1,258 |
General Communications, Inc. Class A (a) | 907,800 | | 9,332 |
Qwest Communications International, Inc. (a) | 18,442,400 | | 70,450 |
Telewest Global, Inc. (a) | 590,291 | | 13,187 |
XO Communications, Inc. (a) | 926,500 | | 2,502 |
| | 96,729 |
Wireless Telecommunication Services - 4.1% |
American Tower Corp. Class A (a) | 300,300 | | 6,901 |
Crown Castle International Corp. (a) | 536,100 | | 11,666 |
Dobson Communications Corp. Class A (a)(d) | 1,733,300 | | 12,220 |
Common Stocks - continued |
| Shares | | Value (Note 1)
(000s) |
TELECOMMUNICATION SERVICES - continued |
Wireless Telecommunication Services - continued |
Nextel Communications, Inc. Class A (a) | 2,660,585 | | $ 92,588 |
NII Holdings, Inc. (a) | 160,800 | | 11,970 |
| | 135,345 |
TOTAL TELECOMMUNICATION SERVICES | | 232,074 |
UTILITIES - 6.8% |
Independent Power Producers & Energy Traders - 4.5% |
AES Corp. (a) | 9,259,458 | | 148,614 |
Multi-Utilities - 2.3% |
Aquila, Inc. (a) | 911,800 | | 3,392 |
CMS Energy Corp. (a) | 4,752,600 | | 75,281 |
| | 78,673 |
TOTAL UTILITIES | | 227,287 |
TOTAL COMMON STOCKS (Cost $2,493,381) | 3,293,944 |
Preferred Stocks - 0.3% |
| | | |
Convertible Preferred Stocks - 0.0% |
CONSUMER DISCRETIONARY - 0.0% |
Media - 0.0% |
Emmis Communications Corp. Series A, 6.25% | 32,200 | | 1,345 |
| | | |
Nonconvertible Preferred Stocks - 0.3% |
CONSUMER STAPLES - 0.3% |
Food Products - 0.3% |
Doane Pet Care Co. 14.25% pay-in-kind (a) | 122,505 | | 9,800 |
TELECOMMUNICATION SERVICES - 0.0% |
Diversified Telecommunication Services - 0.0% |
PTV, Inc. Series A, 10.00% | 84 | | 0 |
TOTAL NONCONVERTIBLE PREFERRED STOCKS | | 9,800 |
TOTAL PREFERRED STOCKS (Cost $6,956) | 11,145 |
Nonconvertible Bonds - 0.2% |
| Principal Amount (000s) | | Value (Note 1)
(000s) |
CONSUMER DISCRETIONARY - 0.1% |
Media - 0.1% |
Vertis, Inc. 13.5% 12/7/09 (f) | $ 3,430 | | $ 2,641 |
INDUSTRIALS - 0.1% |
Airlines - 0.1% |
Delta Air Lines, Inc. 8% 12/15/07 (f) | 11,835 | | 4,556 |
TOTAL NONCONVERTIBLE BONDS (Cost $9,308) | 7,197 |
Floating Rate Loans - 0.3% |
|
TELECOMMUNICATION SERVICES - 0.3% |
Diversified Telecommunication Services - 0.3% |
McLeodUSA, Inc.: | | | | |
revolver loan 8.8867% 5/31/07 (a)(g) | 5,792 | | 1,332 |
Tranche A, term loan 8.8864% 5/31/07 (a)(g) | 17,122 | | 3,938 |
Tranche B, term loan 9.59% 5/30/08 (a)(g) | 15,507 | | 3,567 |
| 8,837 |
TOTAL FLOATING RATE LOANS (Cost $26,905) | 8,837 |
Money Market Funds - 5.4% |
| Shares | | |
Fidelity Cash Central Fund, 3.31% (b) | 24,195,073 | | 24,195 |
Fidelity Securities Lending Cash Central Fund, 3.32% (b)(c) | 156,034,971 | | 156,035 |
TOTAL MONEY MARKET FUNDS (Cost $180,230) | 180,230 |
TOTAL INVESTMENT PORTFOLIO - 105.2% (Cost $2,716,780) | | 3,501,353 |
NET OTHER ASSETS - (5.2)% | | (173,584) |
NET ASSETS - 100% | $ 3,327,769 |
Legend |
(a) Non-income producing |
(b) Affiliated fund that is available only to investment companies and other accounts managed by Fidelity Investments. The rate quoted is the annualized seven-day yield of the fund at period end. A complete listing of the fund's holdings as of its most recent quarter end is available upon request. |
(c) Investment made with cash collateral received from securities on loan. |
(d) Security or a portion of the security is on loan at period end. |
(e) Affiliated company |
(f) Security exempt from registration under Rule 144A of the Securities Act of 1933. These securities may be resold in transactions exempt from registration, normally to qualified institutional buyers. At the period end, the value of these securities amounted to $7,542,000 or 0.2% of net assets. |
(g) The coupon rate shown on floating or adjustable rate securities represents the rate at period end. |
(h) Restricted securities - Investment in securities not registered under the Securities Act of 1933 (excluding 144A issues). At the end of the period, the value of restricted securities (excluding 144A issues) amounted to $5,006,000 or 0.2% of net assets. |
Additional information on each holding is as follows: |
Security | Acquisition Date | Acquisition Cost (000s) |
Viasystems Group, Inc. | 2/13/04 | $ 12,594 |
Other Information |
Distribution of investments by country of issue, as a percentage of total net assets, is as follows: |
United States of America | 82.6% |
Marshall Islands | 10.7% |
Canada | 2.6% |
Bermuda | 1.7% |
Others (individually less than 1%) | 2.4% |
| 100.0% |
An affiliated company is a company in which the fund has ownership of at least 5% of the voting securities. Companies which are affiliates of the fund at period-end are noted in the fund's Schedule of Investments. Transactions during the period with companies which are or were affiliates are as follows: |
Affiliates
(amounts in thousands) | Value,
beginning
of period | Purchases | Sales Proceeds | Dividend Income | Value,
end of
period |
Amkor Technology, Inc. | $ 2,116 | $ 43,815 | $ 2,022 | $ - | $ 43,989 |
Central Freight Lines, Inc. | - | 6,048 | 1,500 | - | - |
Forest Oil Corp. | 61,599 | 46,578 | - | - | 161,587 |
Friendly Ice Cream Corp. | 3,362 | 792 | - | - | 5,102 |
General Maritime Corp. | 84,190 | 13,010 | 6,432 | 5,179 | 114,085 |
Integrated Electrical Services, Inc. | - | 12,064 | 1,294 | - | 7,223 |
OMI Corp. | 29,564 | 59,101 | 2,249 | 896 | 91,969 |
ON Semiconductor Corp. | 35,159 | 17,058 | - | - | 74,157 |
Pathmark Stores, Inc. | 11,606 | - | 1,585 | - | - |
Triton PCS Holdings, Inc. Class A | 11,894 | - | 10,296 | - | - |
Total | $ 239,490 | $ 198,466 | $ 25,378 | $ 6,075 | $ 498,112 |
See accompanying notes which are an integral part of the financial statements.
Annual Report
Financial Statements
Statement of Assets and Liabilities
Amounts in thousands (except per-share amount) | July 31, 2005 |
Assets | | |
Investment in securities, at value (including securities loaned of $147,225) (cost $2,716,780) - See accompanying schedule | | $ 3,501,353 |
Cash | | 448 |
Receivable for investments sold | | 5,442 |
Receivable for fund shares sold | | 11,492 |
Dividends receivable | | 690 |
Interest receivable | | 323 |
Prepaid expenses | | 3 |
Other affiliated receivables | | 6 |
Other receivables | | 1,254 |
Total assets | | 3,521,011 |
| | |
Liabilities | | |
Payable for investments purchased | $ 27,459 | |
Payable for fund shares redeemed | 7,459 | |
Accrued management fee | 1,670 | |
Other affiliated payables | 574 | |
Other payables and accrued expenses | 45 | |
Collateral on securities loaned, at value | 156,035 | |
Total liabilities | | 193,242 |
| | |
Net Assets | | $ 3,327,769 |
Net Assets consist of: | | |
Paid in capital | | $ 2,478,787 |
Undistributed net investment income | | 23,521 |
Accumulated undistributed net realized gain (loss) on investments and foreign currency transactions | | 40,888 |
Net unrealized appreciation (depreciation) on investments and assets and liabilities in foreign currencies | | 784,573 |
Net Assets, for 130,613 shares outstanding | | $ 3,327,769 |
Net Asset Value, offering price and redemption price per share ($3,327,769 ÷ 130,613 shares) | | $ 25.48 |
See accompanying notes which are an integral part of the financial statements.
Annual Report
Financial Statements - continued
Statement of Operations
Amounts in thousands | Year ended July 31, 2005 |
Investment Income | | |
Dividends (including $6,075 received from affiliated issuers) | | $ 25,519 |
Special Dividends | | 9,743 |
Interest | | 5,175 |
Security lending | | 2,364 |
Total income | | 42,801 |
| | |
Expenses | | |
Management fee | $ 14,209 | |
Transfer agent fees | 4,600 | |
Accounting and security lending fees | 674 | |
Independent trustees' compensation | 11 | |
Custodian fees and expenses | 37 | |
Registration fees | 159 | |
Audit | 56 | |
Legal | 7 | |
Miscellaneous | 18 | |
Total expenses before reductions | 19,771 | |
Expense reductions | (661) | 19,110 |
Net investment income (loss) | | 23,691 |
Realized and Unrealized Gain (Loss) Net realized gain (loss) on: | | |
Investment securities (Including realized gain (loss) of $(11,154) from affiliated issuers) | 54,605 | |
Foreign currency transactions | (84) | |
Total net realized gain (loss) | | 54,521 |
Change in net unrealized appreciation (depreciation) on: Investment securities | 531,827 | |
Total change in net unrealized appreciation (depreciation) | | 531,827 |
Net gain (loss) | | 586,348 |
Net increase (decrease) in net assets resulting from operations | | $ 610,039 |
See accompanying notes which are an integral part of the financial statements.
Annual Report
Statement of Changes in Net Assets
Amounts in thousands | Year ended
July 31,
2005 | Year ended
July 31,
2004 |
Increase (Decrease) in Net Assets | | |
Operations | | |
Net investment income (loss) | $ 23,691 | $ 2,937 |
Net realized gain (loss) | 54,521 | 106,434 |
Change in net unrealized appreciation (depreciation) | 531,827 | 162,681 |
Net increase (decrease) in net assets resulting
from operations | 610,039 | 272,052 |
Distributions to shareholders from net investment income | (3,319) | - |
Distributions to shareholders from net realized gain | (83,082) | (14,471) |
Total distributions | (86,401) | (14,471) |
Share transactions
Proceeds from sales of shares | 1,965,483 | 1,359,933 |
Reinvestment of distributions | 82,683 | 13,770 |
Cost of shares redeemed | (749,454) | (847,399) |
Net increase (decrease) in net assets resulting from share transactions | 1,298,712 | 526,304 |
Redemption fees | 1,224 | 2,119 |
Total increase (decrease) in net assets | 1,823,574 | 786,004 |
| | |
Net Assets | | |
Beginning of period | 1,504,195 | 718,191 |
End of period (including undistributed net investment income of $23,521 and undistributed net investment income of $3,427, respectively) | $ 3,327,769 | $ 1,504,195 |
Other Information Shares | | |
Sold | 85,928 | 70,707 |
Issued in reinvestment of distributions | 4,283 | 788 |
Redeemed | (34,148) | (45,040) |
Net increase (decrease) | 56,063 | 26,455 |
See accompanying notes which are an integral part of the financial statements.
Annual Report
Financial Highlights
| Years ended July 31, |
| 2005 | 2004 | 2003 | 2002 | 2001 E |
Selected Per-Share Data | | | | |
Net asset value, beginning of period | $ 20.18 | $ 14.93 | $ 7.37 | $ 10.66 | $ 10.00 |
Income from Investment Operations | | | | | |
Net investment income (loss) D | .24 H | .04 | .01 | .11 G | .07 |
Net realized and unrealized gain (loss) | 6.21 | 5.45 | 7.49 | (3.22) G | .58 |
Total from investment operations | 6.45 | 5.49 | 7.50 | (3.11) | .65 |
Distributions from net investment income | (.04) | - | - | (.20) | - |
Distributions from net realized gain | (1.12) | (.27) | - | - | - |
Total distributions | (1.16) | (.27) | - | (.20) | - |
Redemption fees added to paid in capital D | .01 | .03 | .06 | .02 | .01 |
Net asset value, end of period | $ 25.48 | $ 20.18 | $ 14.93 | $ 7.37 | $ 10.66 |
Total Return B, C | 33.93% | 37.27% | 102.58% | (29.40)% | 6.60% |
Ratios to Average Net Assets F | | | | |
Expenses before expense reductions | .87% | .88% | .93% | 1.14% | .94% A |
Expenses net of voluntary waivers, if any | .87% | .88% | .93% | 1.14% | .94% A |
Expenses net of all reductions | .84% | .85% | .83% | .93% | .83% A |
Net investment income (loss) | 1.04%H | .23% | .07% | 1.16% G | 1.12% A |
Supplemental Data | | | | |
Net assets, end of period (in millions) | $ 3,328 | $ 1,504 | $ 718 | $ 36 | $ 195 |
Portfolio turnover rate | 16% | 35% | 79% | 203% | 230% A |
A Annualized
B Total returns for periods of less than one year are not annualized.
C Total returns would have been lower had certain expenses not been reduced during the periods shown.
D Calculated based on average shares outstanding during the period.
E For the period December 19, 2000 (commencement of operations) to July 31, 2001.
F Expense ratios reflect operating expenses of the fund. Expenses before reductions do not reflect amounts reimbursed by the investment adviser or reductions from brokerage service arrangements or other expense offset arrangements and do not represent the amount paid by the fund during periods when reimbursements or reductions occur. Expense ratios before reductions for start-up periods may not be representative of longer-term operating periods. Expenses net of any voluntary waivers reflect expenses after reimbursement by the investment adviser but prior to reductions from brokerage service arrangements or other expense offset arrangements. Expenses net of all reductions represent the net expenses paid by the fund.
G Effective August 1, 2001, the fund adopted the provisions of the AICPA Audit and Accounting Guide for Investment Companies and began amortizing premium and discount on all debt securities. Per-share data and ratios for periods prior to adoption have not been restated to reflect this change.
H Investment Income per share reflects an in-kind dividend received in a corporate reorganization which amounted to $0.10 per share. Excluding this dividend, the ratio of net investment income to average net assets would have been .61%.
See accompanying notes which are an integral part of the financial statements.
Annual Report
Notes to Financial Statements
For the period ended July 31, 2005
(Amounts in thousands except ratios)
1. Significant Accounting Policies.
Fidelity Leveraged Company Stock Fund (the fund) is a non-diversified fund of Fidelity Securities Fund (the trust) and is authorized to issue an unlimited number of shares. The trust is registered under the Investment Company Act of 1940, as amended (the 1940 Act), as an open-end management investment company organized as a Massachusetts business trust. The financial statements have been prepared in conformity with accounting principles generally accepted in the United States of America, which require management to make certain estimates and assumptions at the date of the financial statements. The following summarizes the significant accounting policies of the fund:
Security Valuation. Net asset value per share (NAV calculation) is calculated as of the close of business of the New York Stock Exchange, normally 4:00 p.m. Eastern time. Equity securities, including restricted securities, for which market quotations are available are valued at the last sale price or official closing price (closing bid price or last evaluated quote if no sale has occurred) on the primary market or exchange on which they trade. Debt securities, including restricted securities, for which quotations are readily available are valued at their most recent bid prices (sales prices if the principal market is an exchange) in the principal market in which such securities are normally traded, as determined by recognized dealers in such securities, or securities are valued on the basis of information provided by a pricing service. Pricing services use valuation matrices that incorporate both dealer-supplied valuations and valuation models. If prices are not readily available or do not accurately reflect fair value for a security, or if a security's value has been materially affected by events occurring after the close of the exchange or market on which the security is principally traded, that security may be valued by another method that the Board of Trustees believes accurately reflects fair value. A security's valuation may differ depending on the method used for determining value. Price movements in futures contracts and ADRs, market and trading trends, the bid/ask quotes of brokers and off-exchange institutional trading may be reviewed in the course of making a good faith determination of a security's fair value. Short-term securities with remaining maturities of sixty days or less for which quotations are not readily available are valued on the basis of amortized cost. Investments in open-end investment companies are valued at their net asset value each business day.
Foreign Currency. The fund uses foreign currency contracts to facilitate transactions in foreign-denominated securities. Losses from these transactions may arise from changes in the value of the foreign currency or if the counterparties do not perform under the contracts' terms.
Foreign-denominated assets, including investment securities, and liabilities are translated into U.S. dollars at the exchange rate at period end. Purchases and sales of investment securities, income and dividends received and expenses denominated in foreign currencies are translated into U.S. dollars at the exchange rate in effect on the transaction date.
Annual Report
Notes to Financial Statements - continued
(Amounts in thousands except ratios)
1. Significant Accounting Policies - continued
Foreign Currency - continued
The effects of exchange rate fluctuations on investments are included with the net realized and unrealized gain (loss) on investment securities. Other foreign currency transactions resulting in realized and unrealized gain (loss) are disclosed separately.
Investment Transactions and Income. Security transactions are accounted for as of trade date. Gains and losses on securities sold are determined on the basis of identified cost and may include proceeds received from litigation. Dividend income is recorded on the ex-dividend date, except for certain dividends from foreign securities where the ex-dividend date may have passed, which are recorded as soon as the fund is informed of the ex-dividend date. Non-cash dividends included in dividend income, if any, are recorded at the fair market value of the securities received. Distributions received on securities that represent a return of capital or capital gain are recorded as a reduction of cost of investments and/or as a realized gain. The fund estimates the components of distributions received that may be considered return of capital distributions or capital gain distributions. Large, non-recurring dividends recognized by the fund are presented separately on the Statement of Operations as "Special Dividends" and the impact of these dividends is presented in the Financial Highlights. Interest income is accrued as earned. Interest income includes coupon interest and amortization of premium and accretion of discount on debt securities. Investment income is recorded net of foreign taxes withheld where recovery of such taxes is uncertain.
Expenses. Most expenses of the trust can be directly attributed to a fund. Expenses which cannot be directly attributed are apportioned among each fund in the trust.
Income Tax Information and Distributions to Shareholders. Each year, the fund intends to qualify as a regulated investment company by distributing all of its taxable income and realized gains under Subchapter M of the Internal Revenue Code. As a result, no provision for income taxes is required in the accompanying financial statements. Foreign taxes are provided for based on the fund's understanding of the tax rules and rates that exist in the foreign markets in which it invests.
Distributions are recorded on the ex-dividend date. Income and capital gain distributions are determined in accordance with income tax regulations, which may differ from generally accepted accounting principles. In addition, the fund claimed a portion of the payment made to redeeming shareholders as a distribution for income tax purposes. Capital accounts within the financial statements are adjusted for permanent book-tax differences. These adjustments have no impact on net assets or the results of operations. Temporary book-tax differences will reverse in a subsequent period.
Book-tax differences are primarily due to foreign currency transactions, market discount and losses deferred due to wash sales.
Annual Report
1. Significant Accounting Policies - continued
Income Tax Information and Distributions to Shareholders - continued
The tax-basis components of distributable earnings and the federal tax cost as of period end were as follows:
Unrealized appreciation | $ 950,200 | |
Unrealized depreciation | (163,185) | |
Net unrealized appreciation (depreciation) | 787,015 | |
Undistributed ordinary income | 18,781 | |
Undistributed long-term capital gain | 38,606 | |
Cost for federal income tax purposes | $ 2,714,338 | |
The tax character of distributions paid was as follows:
| July 31, 2005 | July 31, 2004 |
Ordinary Income | $ 43,399 | $ 14,471 |
Long-term Capital Gains | 43,002 | - |
Total | $ 86,401 | $ 14,471 |
Short-Term Trading (Redemption) Fees. Shares held in the fund less than 90 days are subject to a redemption fee equal to 1.50% of the proceeds of the redeemed shares. All redemption fees, including any estimated redemption fees paid by Fidelity Management & Research Company (FMR), are retained by the fund and accounted for as an addition to paid in capital.
2. Operating Policies.
Repurchase Agreements. FMR has received an Exemptive Order from the Securities and Exchange Commission (the SEC) which permits the fund and other affiliated entities of FMR to transfer uninvested cash balances into joint trading accounts which are then invested in repurchase agreements. The fund may also invest directly with institutions in repurchase agreements. Repurchase agreements are collateralized by government or non-government securities. Collateral is held in segregated accounts with custodian banks and may be obtained in the event of a default of the counterparty. The fund monitors, on a daily basis, the value of the collateral to ensure it is at least equal to the principal amount of the repurchase agreement (including accrued interest). In the event of a default by the counterparty, realization of the collateral proceeds could be delayed, during which time the value of the collateral may decline.
Restricted Securities. The fund may invest in securities that are subject to legal or contractual restrictions on resale. These securities generally may be resold in transactions exempt from registration or to the public if the securities are registered. Disposal of these securities may involve time-consuming negotiations and expense, and prompt sale at an acceptable price may be difficult. Information regarding restricted securities is included at the end of the fund's Schedule of Investments.
Annual Report
Notes to Financial Statements - continued
(Amounts in thousands except ratios)
2. Operating Policies - continued
Loans and Other Direct Debt Instruments. The fund may invest in loans and loan participations, trade claims or other receivables. These investments may include standby financing commitments, including revolving credit facilities, that obligate the fund to supply additional cash to the borrower on demand. Loan participations involve a risk of insolvency of the lending bank or other financial intermediary. The fund may be contractually obligated to receive approval from the agent bank and/or borrower prior to the sale of these investments.
3. Purchases and Sales of Investments.
Purchases and sales of securities, other than short-term securities and U.S. government securities, aggregated $1,606,477 and $345,827, respectively.
4. Fees and Other Transactions with Affiliates.
Management Fee. FMR and its affiliates provide the fund with investment management related services for which the fund pays a monthly management fee. The management fee is the sum of an individual fund fee rate that is based on an annual rate of .35% of the fund's average net assets and a group fee rate that averaged .27% during the period. The group fee rate is based upon the average net assets of all the mutual funds advised by FMR. The group fee rate decreases as assets under management increase and increases as assets under management decrease. For the period, the total annual management fee rate was .62% of the fund's average net assets.
Transfer Agent Fees. Fidelity Service Company, Inc. (FSC), an affiliate of FMR, is the fund's transfer, dividend disbursing and shareholder servicing agent. FSC receives account fees and asset-based fees that vary according to account size and type of account. FSC pays for typesetting, printing and mailing of shareholder reports, except proxy statements. For the period, the transfer agent fees were equivalent to an annual rate of .20% of average net assets.
Accounting and Security Lending Fees. FSC maintains the fund's accounting records. The accounting fee is based on the level of average net assets for the month. Under a separate contract, FSC administers the security lending program. The security lending fee is based on the number and duration of lending transactions.
Central Funds. The fund may invest in affiliated Central Funds managed by Fidelity Investments Money Management, Inc. (FIMM), an affiliate of FMR. The Central Funds are open-end investment companies available only to investment companies and other accounts managed by FMR and its affiliates. The Money Market Central Funds seek preservation of capital and current income. The Central Funds do not pay a management fee. Income distributions earned by the fund are recorded as income in the accompanying financial statements and totaled $3,827 for the period.
Annual Report
4. Fees and Other Transactions with Affiliates - continued
Brokerage Commissions. The fund placed a portion of its portfolio transactions with brokerage firms which are affiliates of the investment adviser. The commissions paid to these affiliated firms were $174 for the period.
5. Committed Line of Credit.
The fund participates with other funds managed by FMR in a $4.2 billion credit facility (the "line of credit") to be utilized for temporary or emergency purposes to fund shareholder redemptions or for other short-term liquidity purposes. The fund has agreed to pay commitment fees on its pro rata portion of the line of credit. During the period, there were no borrowings on this line of credit.
6. Security Lending.
The fund lends portfolio securities from time to time in order to earn additional income. The fund receives collateral (in the form of U.S. Treasury obligations, letters of credit and/or cash) against the loaned securities and maintains collateral in an amount not less than 100% of the market value of the loaned securities during the period of the loan. The market value of the loaned securities is determined at the close of business of the fund and any additional required collateral is delivered to the fund on the next business day. If the borrower defaults on its obligation to return the securities loaned because of insolvency or other reasons, a fund could experience delays and costs in recovering the securities loaned or in gaining access to the collateral. Cash collateral is invested in cash equivalents. The value of loaned securities and cash collateral at period end are disclosed on the fund's Statement of Assets and Liabilities.
7. Expense Reductions.
Many of the brokers with whom FMR places trades on behalf of the fund provided services to the fund in addition to trade execution. These services included payments of certain expenses on behalf of the fund totaling $646 for the period. In addition, through arrangements with the fund's custodian and transfer agent, credits realized as a result of uninvested cash balances were used to reduce the fund's expenses. During the period, these credits reduced the fund's custody and transfer agent expenses by $4 and $11, respectively.
8. Other.
The fund's organizational documents provide former and current trustees and officers with a limited indemnification against liabilities arising in connection with the performance of their duties to the fund. In the normal course of business, the fund may also enter into contracts that provide general indemnifications. The fund's maximum exposure under these arrangements is unknown as this would be dependent on future claims that may be made against the fund. The risk of material loss from such claims is considered remote.
Annual Report
Report of Independent Registered Public Accounting Firm
To the Trustees of Fidelity Securities Fund and the Shareholders of Fidelity Leveraged Company Stock Fund:
In our opinion, the accompanying statement of assets and liabilities, including the schedule of investments, and the related statements of operations and of changes in net assets and the financial highlights present fairly, in all material respects, the financial position of Fidelity Leveraged Company Stock Fund (a fund of Fidelity Securities Fund) at July 31, 2005 and the results of its operations, the changes in its net assets and the financial highlights for the periods indicated, in conformity with accounting principles generally accepted in the United States of America. These financial statements and financial highlights (hereafter referred to as "financial statements") are the responsibility of the Fidelity Leveraged Company Stock Fund's management; our responsibility is to express an opinion on these financial statements based on our audits. We conducted our audits of these financial statements in accordance with the standards of the Public Company Accounting Oversight Board (United States). Those standards require that we plan and perform the audit to obtain reasonable assurance about whether the financial statements are free of material misstatement. An audit includes examining, on a test basis, evidence supporting the amounts and disclosures in the financial statements, assessing the accounting principles used and significant estimates made by management, and evaluating the overall financial statement presentation. We believe that our audits, which included confirmation of securities at July 31, 2005 by correspondence with the custodian and brokers, provide a reasonable basis for our opinion.
/s/ PricewaterhouseCoopers LLP
PricewaterhouseCoopers LLP
Boston, Massachusetts
September 9, 2005
Annual Report
Trustees and Officers
The Trustees, Members of the Advisory Board, and executive officers of the trust and fund, as applicable, are listed below. The Board of Trustees governs the fund and is responsible for protecting the interests of shareholders. The Trustees are experienced executives who meet periodically throughout the year to oversee the fund's activities, review contractual arrangements with companies that provide services to the fund, and review the fund's performance. Except for William O. McCoy, Stephen P. Jonas, and Kenneth L. Wolfe, each of the Trustees oversees 319 funds advised by FMR or an affiliate. Mr. McCoy oversees 321 funds advised by FMR or an affiliate. Mr. Jonas and Mr. Wolfe oversee 310 funds advised by FMR or an affiliate.
The Trustees hold office without limit in time except that (a) any Trustee may resign; (b) any Trustee may be removed by written instrument, signed by at least two-thirds of the number of Trustees prior to such removal; (c) any Trustee who requests to be retired or who has become incapacitated by illness or injury may be retired by written instrument signed by a majority of the other Trustees; and (d) any Trustee may be removed at any special meeting of shareholders by a two-thirds vote of the outstanding voting securities of the trust. Each Trustee who is not an interested person (as defined in the 1940 Act) (Independent Trustee), shall retire not later than the last day of the calendar year in which his or her 72nd birthday occurs. The Independent Trustees may waive this mandatory retirement age policy with respect to individual Trustees. The executive officers and Advisory Board Members hold office without limit in time, except that any officer and Advisory Board Member may resign or may be removed by a vote of a majority of the Trustees at any regular meeting or any special meeting of the Trustees. Except as indicated, each individual has held the office shown or other offices in the same company for the past five years.
The fund's Statement of Additional Information (SAI) includes more information about the Trustees. To request a free copy, call Fidelity at 1-800-544-8544.
Interested Trustees*:
Correspondence intended for each Trustee who is an interested person may be sent to Fidelity Investments, 82 Devonshire Street, Boston, Massachusetts 02109.
Name, Age; Principal Occupation |
Edward C. Johnson 3d (75)** |
| Year of Election or Appointment: 1984 Mr. Johnson is Chairman of the Board of Trustees. Mr. Johnson serves as Chief Executive Officer, Chairman, and a Director of FMR Corp.; a Director and Chairman of the Board and of the Executive Committee of FMR; Chairman and a Director of Fidelity Management & Research (Far East) Inc.; Chairman and a Director of Fidelity Investments Money Management, Inc.; and Chairman (2001-present) and a Director (2000-present) of FMR Co., Inc. |
Abigail P. Johnson (43)** |
| Year of Election or Appointment: 2001 Ms. Johnson serves as President of Fidelity Employer Services Company (FESCO) (2005-present). She is President and a Director of Fidelity Investments Money Management, Inc. (2001-present), FMR Co., Inc. (2001-present), and a Director of FMR Corp. Previously, Ms. Johnson served as President and a Director of FMR (2001-2005), Senior Vice President of the Fidelity funds (2001-2005), and managed a number of Fidelity funds. |
Stephen P. Jonas (52) |
| Year of Election or Appointment: 2005 Mr. Jonas is Senior Vice President of Leveraged Company Stock (2005-present). He also serves as Senior Vice President of other Fidelity funds (2005-present). Mr. Jonas is Executive Director of FMR (2005-
present). Previously, Mr. Jonas served as President of Fidelity Enterprise Operations and Risk Services (2004-2005), Chief Administrative Officer (2002-2004), and Chief Financial Officer of FMR Co. (1998-2000). Mr. Jonas has been with Fidelity Investments since 1987 and has held various financial and management positions including Chief Financial Officer of FMR. In addition, he serves on the Boards of Boston Ballet (2003-present) and Simmons College (2003-present). |
Robert L. Reynolds (53) |
| Year of Election or Appointment: 2003 Mr. Reynolds is a Director (2003-present) and Chief Operating Officer (2002-present) of FMR Corp. He also serves on the Board at Fidelity Investments Canada, Ltd. (2000-present). Previously, Mr. Reynolds served as President of Fidelity Investments Institutional Retirement Group (1996-2000). |
* Trustees have been determined to be "Interested Trustees" by virtue of, among other things, their affiliation with the trust or various entities under common control with FMR.
** Edward C. Johnson 3d, Trustee, is Abigail P. Johnson's father.
Annual Report
Independent Trustees:
Correspondence intended for each Independent Trustee (that is, the Trustees other than the Interested Trustees) may be sent to Fidelity Investments, P.O. Box 55235, Boston, Massachusetts 02205-5235.
Name, Age; Principal Occupation |
Dennis J. Dirks (57) |
| Year of Election or Appointment: 2005 Prior to his retirement in May 2003, Mr. Dirks was Chief Operating Officer and a member of the Board of The Depository Trust & Clearing Corporation (DTCC) (1999-2003). He also served as President, Chief Operating Officer, and Board member of The Depository Trust Company (DTC) (1999-2003) and President and Board member of the National Securities Clearing Corporation (NSCC) (1999-2003). In addition, Mr. Dirks served as Chief Executive Officer and Board member of the Government Securities Clearing Corporation (2001-2003) and Chief Executive Officer and Board member of the Mortgage-Backed Securities Clearing Corporation (2001-2003). Mr. Dirks also serves as a Trustee of Manhattan College (2005-present). |
Robert M. Gates (61) |
| Year of Election or Appointment: 1997 Dr. Gates is Vice Chairman of the Independent Trustees (2005-present). Dr. Gates is President of Texas A&M University (2002-present). He was Director of the Central Intelligence Agency (CIA) from 1991 to 1993. From 1989 to 1991, Dr. Gates served as Assistant to the President of the United States and Deputy National Security Advisor. Dr. Gates is a Director of NACCO Industries, Inc. (mining and manufacturing), Parker Drilling Co., Inc. (drilling and rental tools for the energy industry, 2001-present), and Brinker International (restaurant management, 2003-present). Previously, Dr. Gates served as a Director of LucasVarity PLC (automotive components and diesel engines), a Director of TRW Inc. (automotive, space, defense, and information technology), and Dean of the George Bush School of Government and Public Service at Texas A&M University (1999-2001). Dr. Gates also is a Trustee of the Forum for International Policy. |
George H. Heilmeier (69) |
| Year of Election or Appointment: 2004 Dr. Heilmeier is Chairman Emeritus of Telcordia Technologies (communication software and systems), where prior to his retirement, he served as company Chairman and Chief Executive Officer. He currently serves on the Boards of Directors of The Mitre Corporation (systems engineering and information technology support for the government), and HRL Laboratories (private research and development, 2004-present). He is Chairman of the General Motors Science & Technology Advisory Board and a Life Fellow of the Institute of Electrical and Electronics Engineers (IEEE) (2000-present). Dr. Heilmeier is a member of the Defense Science Board and the National Security Agency Advisory Board. He is also a member of the National Academy of Engineering, the American Academy of Arts and Sciences, and the Board of Overseers of the School of Engineering and Applied Science of the University of Pennsylvania. Previously, Dr. Heilmeier served as a Director of TRW Inc. (automotive, space, defense, and information technology, 1992-2002), Compaq (1994-2002), Automatic Data Processing, Inc. (ADP) (technology-based business outsourcing, 1995-2002), INET Technologies Inc. (telecommunications network surveillance, 2001-2004), and Teletech Holdings (customer management services). He is the recipient of the 2005 Kyoto Prize in Advanced Technology for his invention of the liquid display. |
Marie L. Knowles (58) |
| Year of Election or Appointment: 2001 Prior to Ms. Knowles' retirement in June 2000, she served as Executive Vice President and Chief Financial Officer of Atlantic Richfield Company (ARCO) (diversified energy, 1996-2000). From 1993 to 1996, she was a Senior Vice President of ARCO and President of ARCO Transportation Company. She served as a Director of ARCO from 1996 to 1998. She currently serves as a Director of Phelps Dodge Corporation (copper mining and manufacturing) and McKesson Corporation (healthcare service, 2002-present). Ms. Knowles is a Trustee of the Brookings Institution and the Catalina Island Conservancy and also serves as a member of the Advisory Board for the School of Engineering of the University of Southern California. |
Ned C. Lautenbach (61) |
| Year of Election or Appointment: 2000 Mr. Lautenbach has been a partner of Clayton, Dubilier & Rice, Inc. (private equity investment firm) since September 1998. Previously, Mr. Lautenbach was with the International Business Machines Corporation (IBM) from 1968 until his retirement in 1998. Mr. Lautenbach serves as a Director of Italtel Holding S.p.A. (telecommunications (Milan, Italy), 2004-present) and Eaton Corporation (diversified industrial) as well as the Philharmonic Center for the Arts in Naples, Florida. He also is a member of the Board of Trustees of Fairfield University (2005-present), as well as a member of the Council on Foreign Relations. |
Marvin L. Mann (72) |
| Year of Election or Appointment: 1993 Mr. Mann is Chairman of the Independent Trustees (2001-present). He is Chairman Emeritus of Lexmark International, Inc. (computer peripherals), where he served as CEO until April 1998, retired as Chairman May 1999, and remains a member of the Board. Prior to 1991, he held the positions of Vice President of International Business Machines Corporation (IBM) and President and General Manager of various IBM divisions and subsidiaries. He is a member of the Executive Committee of the Independent Director's Council of the Investment Company Institute. In addition, Mr. Mann is a member of the President's Cabinet at the University of Alabama and the Board of Visitors of the Culverhouse College of Commerce and Business Administration at the University of Alabama. |
William O. McCoy (71) |
| Year of Election or Appointment: 1997 Prior to his retirement in December 1994, Mr. McCoy was Vice Chairman of the Board of BellSouth Corporation (telecommunications) and President of BellSouth Enterprises. He is currently a Director of Liberty Corporation (holding company), Duke Realty Corporation (real estate), and Progress Energy, Inc. (electric utility). He is also a partner of Franklin Street Partners (private investment management firm) and a member of the Research Triangle Foundation Board. In addition, Mr. McCoy served as the Interim Chancellor (1999-2000) and a member of the Board of Visitors for the University of North Carolina at Chapel Hill and currently serves on the Board of Directors of the University of North Carolina Health Care System and the Board of Visitors of the Kenan-Flagler Business School (University of North Carolina at Chapel Hill). He also served as Vice President of Finance for the University of North Carolina (16-school system). |
Cornelia M. Small (61) |
| Year of Election or Appointment: 2005 Ms. Small is a member (2000-present) and Chairperson (2002-present) of the Investment Committee, and a member (2002-present) of the Board of Trustees of Smith College. Previously, she served as Chief Investment Officer (1999-2000), Director of Global Equity Investments (1996-1999), and a member of the Board of Directors of Scudder, Stevens & Clark (1990-1997) and Scudder Kemper Investments (1997-1998). In addition, Ms. Small served as Co-Chair (2000-2003) of the Annual Fund for the Fletcher School of Law and Diplomacy. |
William S. Stavropoulos (66) |
| Year of Election or Appointment: 2002 Mr. Stavropoulos is Chairman of the Board (2000-present) and a Member of the Board of Directors of The Dow Chemical Company. Since joining The Dow Chemical Company in 1967, Mr. Stavropoulos served in numerous senior management positions, including President (1993-2000; 2002-2003), CEO (1995-2000; 2002-2004), and Chairman of the Executive Committee (2000-2004). Currently, he is a Director of NCR Corporation (data warehousing and technology solutions), BellSouth Corporation (telecommunications), Chemical Financial Corporation, Maersk Inc. (industrial conglomerate, 2002-present), and Metalmark Capital (private equity investment firm, 2005-present). He also serves as a member of the Board of Trustees of the American Enterprise Institute for Public Policy Research. In addition, Mr. Stavropoulos is a member of The Business Council, J.P. Morgan International Council and the University of Notre Dame Advisory Council for the College of Science. |
Kenneth L. Wolfe (66) |
| Year of Election or Appointment: 2005 Mr. Wolfe also serves as a Trustee (2005-present) or Member of the Advisory Board (2004-present) of other investment companies advised by FMR. Prior to his retirement in 2001, Mr. Wolfe was Chairman and Chief Executive Officer of Hershey Foods Corporation (1993-2001). He currently serves as a member of the boards of Adelphia Communications Corporation (2003-present), Bausch & Lomb, Inc., and Revlon Inc. (2004-present). |
Annual Report
Advisory Board Members and Executive Officers:
Correspondence intended for Mr. Gamper may be sent to Fidelity Investments, P.O. Box 55235, Boston, Massachusetts 02205-5235. Correspondence intended for each executive officer and Mr. Lynch may be sent to Fidelity Investments, 82 Devonshire Street, Boston, Massachusetts 02109.
Name, Age; Principal Occupation |
Albert R. Gamper, Jr. (63) |
| Year of Election or Appointment: 2005 Member of the Advisory Board of Fidelity Securities Fund. Prior to his retirement in December 2004, Mr. Gamper served as Chairman of the Board of CIT Group Inc. (commercial finance). During his tenure with CIT Group Inc. Mr. Gamper served in numerous senior management positions, including Chairman (1987-1989; 1999-2001; 2002-2004), Chief Executive Officer (1987-2004), and President (1989-2002). He currently serves as a member of the Board of Directors of Public Service Enterprise Group (utilities, 2001-present), Chairman of the Board of Governors, Rutgers University (2004-present), and Chairman of the Board of Saint Barnabas Health Care System. |
Peter S. Lynch (61) |
| Year of Election or Appointment: 2003 Member of the Advisory Board of Fidelity Securities Fund. Vice Chairman and a Director of FMR, and Vice Chairman (2001-present) and a Director (2000-present) of FMR Co., Inc. Previously, Mr. Lynch served as a Trustee of the Fidelity funds (1990-2003). In addition, he serves as a Trustee of Boston College, Massachusetts Eye & Ear Infirmary, Historic Deerfield, John F. Kennedy Library, and the Museum of Fine Arts of Boston. |
Walter C. Donovan (43) |
| Year of Election or Appointment: 2005 Vice President of Leveraged Company Stock. Mr. Donovan also serves as Vice President of Fidelity's High Income Funds (2005-present), Fidelity's Fixed-Income Funds (2005-present), certain Asset Allocation Funds (2005-present), and certain Balanced Funds (2005-present). Mr. Donovan also serves as Executive Vice President of FMR (2005-present) and FMRC (2005-present). Previously, Mr. Donovan served as Vice President and Director of Fidelity's International Equity Trading group (1998-2005). |
Thomas Soviero (41) |
| Year of Election or Appointment: 2003 Vice President of Leveraged Company Stock. Mr. Soviero also serves as Vice President of other funds advised by FMR. Prior to assuming his current responsibilities, Mr. Soviero managed a variety of Fidelity funds. Mr. Soviero also serves as Vice President of FMR and FMR Co., Inc. (2001). |
Eric D. Roiter (56) |
| Year of Election or Appointment: 2000 Secretary of Leveraged Company Stock. He also serves as Secretary of other Fidelity funds; Vice President, General Counsel, and Secretary of FMR Co., Inc. (2001-present) and FMR; Assistant Secretary of Fidelity Management & Research (U.K.) Inc. (2001-present), Fidelity Management & Research (Far East) Inc. (2001-present), and Fidelity Investments Money Management, Inc. (2001-present). Mr. Roiter is an Adjunct Member, Faculty of Law, at Boston College Law School (2003-present). Previously, Mr. Roiter served as Vice President and Secretary of Fidelity Distributors Corporation (FDC) (1998-2005). |
Stuart Fross (45) |
| Year of Election or Appointment: 2003 Assistant Secretary of Leveraged Company Stock. Mr. Fross also serves as Assistant Secretary of other Fidelity funds (2003-present), Vice President and Secretary of FDC (2005-present), and is an employee of FMR. |
Christine Reynolds (46) |
| Year of Election or Appointment: 2004 President, Treasurer, and Anti-Money Laundering (AML) officer of Leveraged Company Stock. Ms. Reynolds also serves as President, Treasurer, and AML officer of other Fidelity funds (2004) and is a Vice President (2003) and an employee (2002) of FMR. Before joining Fidelity Investments, Ms. Reynolds worked at PricewaterhouseCoopers LLP (PwC) (1980-2002), where she was most recently an audit partner with PwC's investment management practice. |
Timothy F. Hayes (54) |
| Year of Election or Appointment: 2002 Chief Financial Officer of Leveraged Company Stock. Mr. Hayes also serves as Chief Financial Officer of other Fidelity funds (2002-present) and President of Fidelity Investment Operations (2005-present) which includes Fidelity Pricing and Cash Management Services Group (FPCMS), where he served as President (1998-2005). Mr. Hayes serves as President of Fidelity Service Company (2003-present) where he also serves as a Director. Mr. Hayes also served as President of Fidelity Investments Operations Group (FIOG, 2002-2005). |
Kenneth A. Rathgeber (58) |
| Year of Election or Appointment: 2004 Chief Compliance Officer of Leveraged Company Stock. Mr. Rathgeber also serves as Chief Compliance Officer of other Fidelity funds (2004) and Executive Vice President of Risk Oversight for Fidelity Investments (2002). Previously, he served as Executive Vice President and Chief Operating Officer for Fidelity Investments Institutional Services Company, Inc. (1998-2002). |
John R. Hebble (47) |
| Year of Election or Appointment: 2003 Deputy Treasurer of Leveraged Company Stock. Mr. Hebble also serves as Deputy Treasurer of other Fidelity funds (2003), and is an employee of FMR. Before joining Fidelity Investments, Mr. Hebble worked at Deutsche Asset Management where he served as Director of Fund Accounting (2002-2003) and Assistant Treasurer of the Scudder Funds (1998-2003). |
Bryan A. Mehrmann (44) |
| Year of Election or Appointment: 2005 Deputy Treasurer of Leveraged Company Stock. Mr. Mehrmann also serves as Deputy Treasurer of other Fidelity funds (2005-present) and is an employee of FMR. Previously, Mr. Mehrmann served as Vice President of Fidelity Investments Institutional Services Group (FIIS)/Fidelity Investments Institutional Operations Corporation, Inc. (FIIOC) Client Services (1998-2004). |
Kimberley H. Monasterio (41) |
| Year of Election or Appointment: 2004 Deputy Treasurer of Leveraged Company Stock. Ms. Monasterio also serves as Deputy Treasurer of other Fidelity funds (2004) and is an employee of FMR (2004). Before joining Fidelity Investments, Ms. Monasterio served as Treasurer (2000-2004) and Chief Financial Officer (2002-2004) of the Franklin Templeton Funds and Senior Vice President of Franklin Templeton Services, LLC (2000-2004). |
Kenneth B. Robins (35) |
| Year of Election or Appointment: 2005 Deputy Treasurer of Leveraged Company Stock. Mr. Robins also serves as Deputy Treasurer of other Fidelity funds (2005-present) and is an employee of FMR (2004-present). Before joining Fidelity Investments, Mr. Robins worked at KPMG LLP, where he was a partner in KPMG's department of professional practice (2002-2004) and a Senior Manager (1999-2000). In addition, Mr. Robins served as Assistant Chief Accountant, United States Securities and Exchange Commission (2000-2002). |
Robert G. Byrnes (38) |
| Year of Election or Appointment: 2005 Assistant Treasurer of Leveraged Company Stock. Mr. Byrnes also serves as Assistant Treasurer of other Fidelity funds (2005-present) and is an employee of FMR (2005-present). Previously, Mr. Byrnes served as Vice President of FPCMS (2003-2005). Before joining Fidelity Investments, Mr. Byrnes worked at Deutsche Asset Management where he served as Vice President of the Investment Operations Group (2000-2003). |
John H. Costello (58) |
| Year of Election or Appointment: 2000 Assistant Treasurer of Leveraged Company Stock. Mr. Costello also serves as Assistant Treasurer of other Fidelity funds and is an employee of FMR. |
Peter L. Lydecker (51) |
| Year of Election or Appointment: 2004 Assistant Treasurer of Leveraged Company Stock. Mr. Lydecker also serves as Assistant Treasurer of other Fidelity funds (2004) and is an employee of FMR. |
Mark Osterheld (50) |
| Year of Election or Appointment: 2002 Assistant Treasurer of Leveraged Company Stock. Mr. Osterheld also serves as Assistant Treasurer of other Fidelity funds (2002) and is an employee of FMR. |
Gary W. Ryan (46) |
| Year of Election or Appointment: 2005 Assistant Treasurer of Leveraged Company Stock. Mr. Ryan also serves as Assistant Treasurer of other Fidelity funds (2005-present) and is an employee of FMR (2005-present). Previously, Mr. Ryan served as Vice President of Fund Reporting in FPCMS (1999-2005). |
Salvatore Schiavone (39) |
| Year of Election or Appointment: 2005 Assistant Treasurer of Leveraged Company Stock. Mr. Schiavone also serves as Assistant Treasurer of other Fidelity funds (2005-present) and is an employee of FMR (2005-present). Before joining Fidelity Investments, Mr. Schiavone worked at Deutsche Asset Management, where he most recently served as Assistant Treasurer (2003-2005) of the Scudder Funds and Vice President and Head of Fund Reporting (1996-2003). |
Annual Report
Distributions
The Board of Trustees of Fidelity Leveraged Company Stock Fund voted to pay on September 12, 2005, to shareholders of record at the opening of business on September 9, 2005, a distribution of $0.30 per share derived from capital gains realized from sales of portfolio securities and a dividend of $0.14 per share from net investment income.
The fund hereby designates as capital gain dividends: For dividends with respect to the taxable year ended July 31, 2005, $50,488,000, or, if subsequently determined to be different, the net capital gain of such year, and for dividends with respect to the taxable year ended July 31, 2004, $32,555,000, or, if subsequently determined to be different, the excess of: (a) the net capital gain of such year, over (b) amounts previously designated as capital gain dividends with respect to such year.
The fund designates 7%, 62% and 62% of the dividends distributed in September, December and December, respectively during the fiscal year as qualifying for the dividends-received deduction for corporate shareholders.
The fund designates 18%, 100% and 100% of the dividends distributed in September, December and December, respectively during the fiscal year as amounts which may be taken into account as a dividend for purposes of the maximum rate under section 1(h)(11) of the Internal Revenue Code.
The fund will notify shareholders in January 2006 of amounts for use in preparing 2005 income tax returns.
Annual Report
Board Approval of Investment Advisory Contracts and Management Fees
Fidelity Leveraged Company Stock Fund
Each year, typically in July, the Board of Trustees, including the independent Trustees (together, the Board), votes on the renewal of the management contract and sub-advisory agreements (together, the Advisory Contracts) for the fund. The Board, assisted by the advice of fund counsel and independent Trustees' counsel, requests and considers a broad range of information throughout the year.
The Board meets regularly each month except August and takes into account throughout the year matters bearing on Advisory Contracts. The Board, acting directly and through its separate committees, considers at each of its meetings factors that are relevant to the annual renewal of the fund's Advisory Contracts, including the services and support provided to the fund and its shareholders by Fidelity. At the time of the renewal, the Board had 11 standing committees, each composed of independent Trustees with varying backgrounds, to which the Board has assigned specific subject matter responsibilities in order to enhance effective decision-making by the Board. Each committee has adopted a written charter outlining the structure and purposes of the committee. One such committee, the Equity Contract Committee, meets periodically during the first six months of each year and as necessary to consider matters specifically related to the annual renewal of Advisory Contracts. The committee requests and receives information on, and makes recommendations to the independent Trustees concerning, the approval and annual review of the Advisory Contracts.
At its July 2005 meeting, the Board of Trustees, including the independent Trustees, unanimously determined to renew the Advisory Contracts for the fund. In reaching its determination, the Board considered all factors it believed relevant, including (1) the nature, extent, and quality of the services to be provided to the fund and its shareholders by Fidelity (including the investment performance of the fund); (2) the competitiveness of the management fee and total expenses of the fund; (3) the total costs of the services to be provided by and the profits to be realized by the investment adviser and its affiliates from the relationship with the fund; (4) the extent to which economies of scale would be realized as the fund grows; and (5) whether fee levels reflect these economies of scale, if any, for the benefit of fund shareholders.
In determining whether to renew the Advisory Contracts for the fund, the Board ultimately reached a determination, with the assistance of fund counsel and independent Trustees' counsel, that the renewal of the Advisory Contracts and the compensation to be received by Fidelity under the management contract is consistent with Fidelity's fiduciary duty under applicable law. In addition to evaluating the specific factors noted above, the Board, in reaching its determination, is aware that shareholders in the fund have a broad range of investment choices available to them, including a wide choice among mutual funds offered by competitors to Fidelity, and that the fund's shareholders, with the opportunity to review and weigh the disclosure provided by the fund in its prospectus and other public disclosures, have chosen to invest in this fund, managed by Fidelity.
Annual Report
Nature, Extent, and Quality of Services Provided by Fidelity. The Board considered staffing within the investment adviser, FMR, and the sub-advisers (together, the Investment Advisers), including the background of the fund's portfolio manager and the fund's investment objective and discipline. The independent Trustees also had discussions with senior management of Fidelity's investment operations and investment groups. The Board considered the structure of the portfolio manager compensation program and whether this structure provides appropriate incentives.
Fidelity Resources Dedicated to Investment Management and Support Services. The Board reviewed the size, education, and experience of the Investment Advisers' investment staff, their use of technology, and the Investment Advisers' approach to recruiting, training, and retaining portfolio managers and other research, advisory, and management personnel. The Board considered Fidelity's extensive global research capabilities that enable the Investment Advisers to aggregate data from various sources in an effort to produce positive investment results. The Board noted that Fidelity's analysts have access to a variety of technological tools that enable them to perform both fundamental and quantitative analysis and to specialize in various disciplines. The Board also considered that Fidelity's portfolio managers and analysts have access to daily portfolio attribution that allows for monitoring of a fund's portfolio, as well as an electronic communication system that provides immediate real-time access to research concerning issuers and credit enhancers.
Shareholder and Administrative Services. The Board considered the nature, extent, quality, and cost of administrative, distribution, and shareholder services performed by the Investment Advisers and their affiliates under the Advisory Contracts and under separate agreements covering transfer agency, pricing and bookkeeping, and securities lending services for the fund. The Board also considered the nature and extent of the Investment Advisers' supervision of third party service providers, principally custodians and subcustodians. The Board reviewed the allocation of fund brokerage, including allocations to brokers affiliated with the Investment Advisers, the use of brokerage commissions to pay fund expenses, and the use of "soft" commission dollars to pay for research services. The Board also considered that Fidelity voluntarily decided in 2004 to stop using "soft" commission dollars to pay for market data and, instead, to pay for that data out of its own resources. The Board also considered the resources devoted to, and the record of compliance with, the fund's compliance policies and procedures.
The Board noted that the growth of fund assets across the complex allows Fidelity to reinvest in the development of services designed to enhance the value or convenience of the Fidelity funds as investment vehicles. These services include 24-hour access to account information and market information through phone representatives and over the Internet, and investor education materials and asset allocation tools.
Annual Report
Board Approval of Investment Advisory Contracts and
Management Fees - continued
Investment in a Large Fund Family. The Board considered the benefits to shareholders of investing in a Fidelity fund, including the benefits of investing in a fund that is part of a large family of funds offering a variety of investment disciplines and providing for a large variety of mutual fund investor services. For example, fund shareholders are offered the privilege of exchanging shares of the fund for shares of other Fidelity funds, as set forth in the fund's prospectus, without paying a sales charge. The Board noted that, since the last Advisory Contract renewals in July 2004, Fidelity has taken a number of actions that benefited particular funds, including (i) voluntarily deciding in 2004 to stop using "soft" commission dollars to pay for market data and, instead, to pay for that data out of its own resources, (ii) contractually agreeing to impose management fee reductions and expense limitations on its five Spartan stock index funds and its stock index fund available through variable insurance products, (iii) contractually agreeing to eliminate the management fees on the Fidelity Freedom Funds and the Fidelity Advisor Freedom Funds, (iv) contractually agreeing to reduce the management fees on most of its investment-grade taxable bond funds, and (v) contractually agreeing to impose expense limitations on its retail and Spartan investment-grade taxable bond funds.
Investment Performance and Compliance. The Board considered whether the fund has operated within its investment objective, as well as its record of compliance with its investment restrictions. It also reviewed the fund's absolute investment performance, as well as the fund's relative investment performance measured against (i) a broad-based securities market index, and (ii) a peer group of mutual funds deemed appropriate by the Board over multiple periods. Because the fund had been in existence less than five calendar years, the following charts considered by the Board show, over the one- and three-year periods ended December 31, 2004, the fund's returns, the returns of a broad-based securities market index ("benchmark"), and a range of returns of a peer group of mutual funds identified by Lipper Inc. as having an investment objective similar to that of the fund. The box within each chart shows the 25th percentile return (bottom of box) and the 75th percentile return (top of box) of the Lipper peer group. Returns shown above the box are in the first quartile and returns shown below the box are in the fourth quartile. The percentage beaten number noted below each chart corresponds to the percentile box and represents the percentage of funds in the Lipper peer group whose performance was equal to or lower than that of the fund.
Annual Report
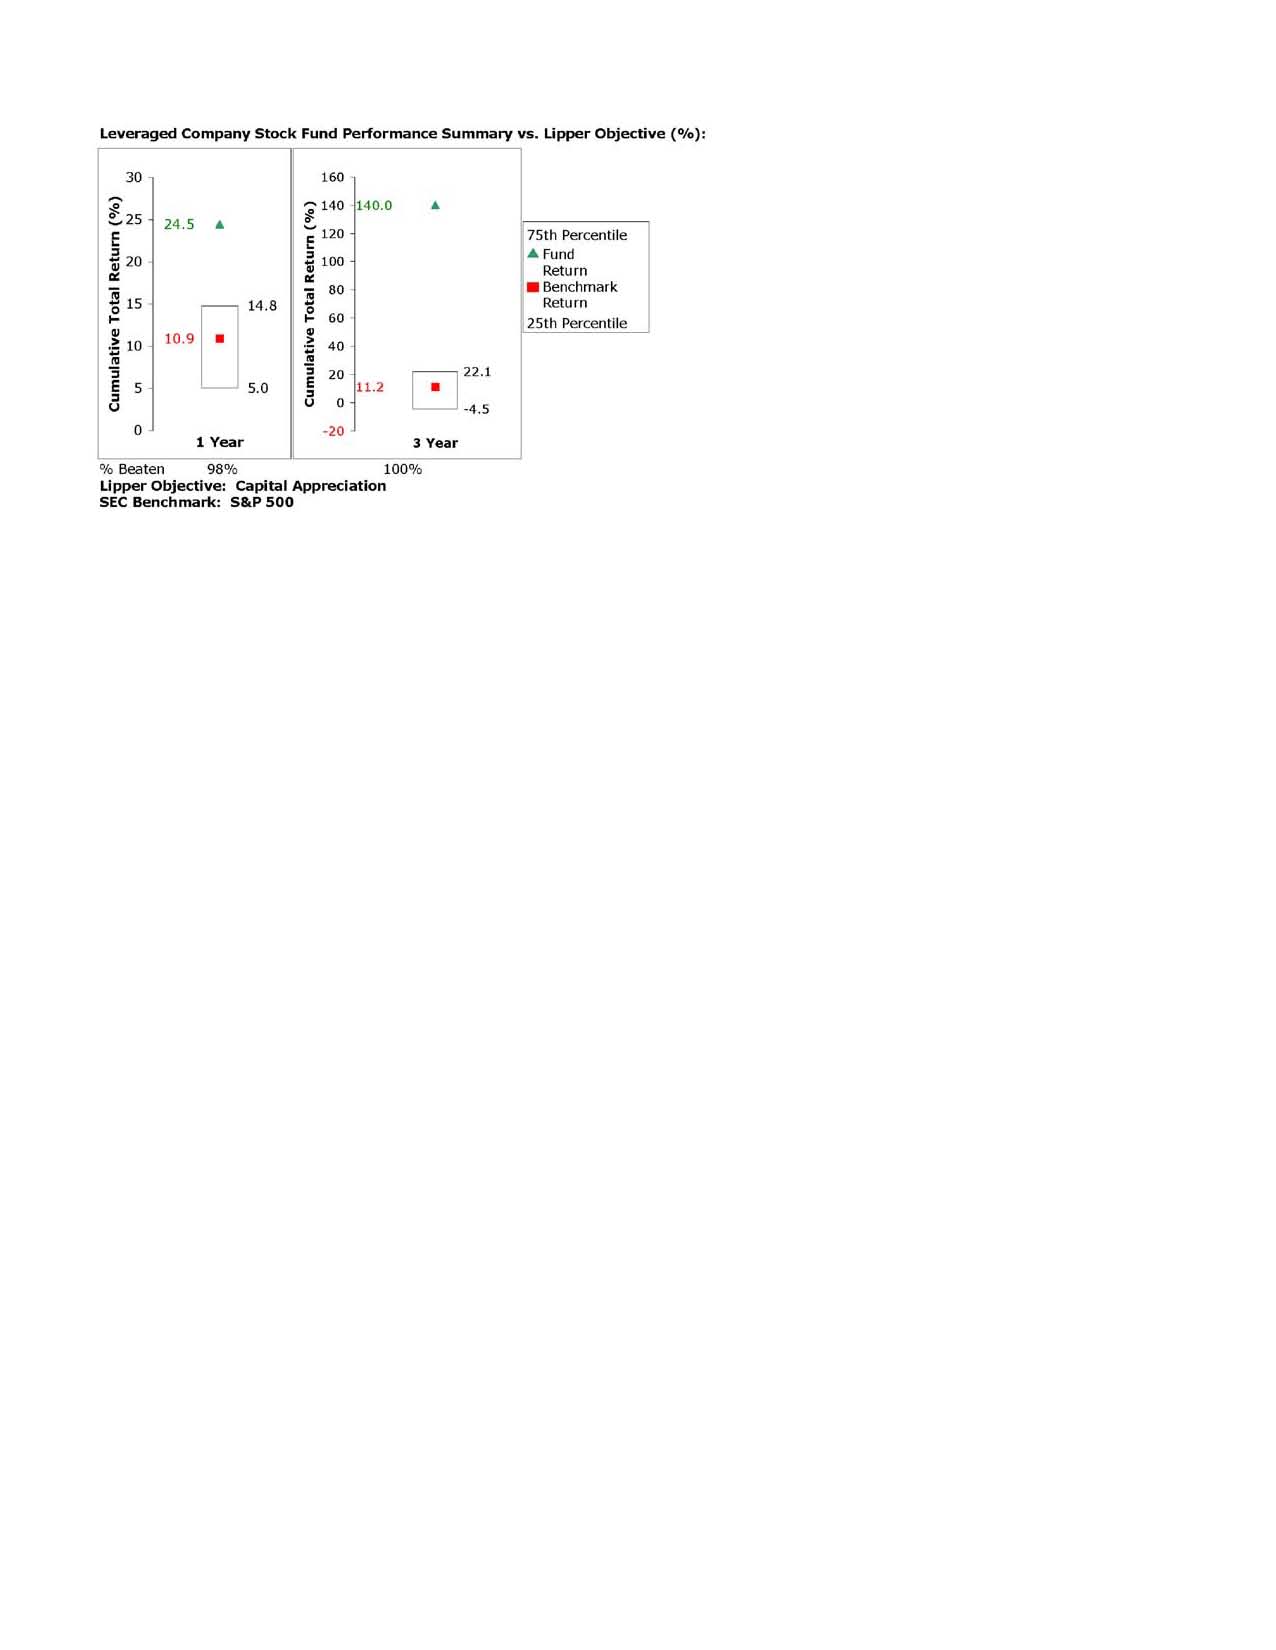
The Board reviewed the fund's relative investment performance against its Lipper peer group and stated that the performance of the fund was in the first quartile for the one- and three-year periods. The Board also stated that the relative investment performance of the fund has compared favorably to its benchmark over time.
The Board has had thorough discussions with FMR throughout the year about the Board's and FMR's concerns about equity research, equity fund performance, and compliance with internal policies governing gifts and entertainment. FMR has taken steps that it believes will refocus and strengthen equity research and equity portfolio management and compliance. The Board noted with favor FMR's recent reorganization of its senior management team and FMR's plans to dedicate additional resources to investment research, and participated in the process that led to those changes.
Based on its review, and giving particular weight to the nature and quality of the resources dedicated by the Investment Advisers to maintain and improve relative performance, the Board concluded that the nature, extent, and quality of the services provided by Fidelity will benefit the fund's shareholders, particularly in light of the Board's view that the fund's shareholders benefit from investing in a fund that is part of a large family of funds offering a variety of investment disciplines and services.
Competitiveness of Management Fee and Total Fund Expenses. The Board considered the fund's management fee and total expenses compared to "mapped groups" of competitive funds and classes. Fidelity creates "mapped groups" by combining similar Lipper investment objective categories that have comparable management fee characteristics. Combining Lipper investment objective categories aids the Board's management fee and total expense comparisons by broadening the competitive group used for comparison and by reducing the number of universes to which various Fidelity funds are compared.
Annual Report
Board Approval of Investment Advisory Contracts and
Management Fees - continued
The Board considered two proprietary management fee comparisons for the 12-month periods shown in the chart below. The group of Lipper funds used by the Board for management fee comparisons is referred to below as the "Total Mapped Group" and, for the reasons explained above, is broader than the Lipper peer group used by the Board for performance comparisons. The Total Mapped Group comparison focuses on a fund's standing relative to the total universe of comparable funds available to investors, in terms of gross management fees before expense reimbursements or caps. "TMG %" represents the percentage of funds in the Total Mapped Group that had management fees that were lower than the fund's. For example, a TMG % of 21% means that 79% of the funds in the Total Mapped Group had higher management fees than the fund. The "Asset-Size Peer Group" (ASPG) comparison focuses on a fund's standing relative to non-Fidelity funds similar in size to the fund within the Total Mapped Group. The ASPG represents at least 15% of the funds in the Total Mapped Group with comparable asset size and management fee characteristics, subject to a minimum of 50 funds (or all funds in the Total Mapped Group if fewer than 50). Additional information, such as the ASPG quartile ("quadrant") in which the fund's management fee ranked, is also included in the chart and considered by the Board.

The Board noted that the fund's management fee ranked below the median of its Total Mapped Group and below the median of its ASPG for 2004.
Annual Report
Based on its review, the Board concluded that the fund's management fee was fair and reasonable in light of the services that the fund receives and the other factors considered.
In its review of the fund's total expenses, the Board considered the fund's management fee as well as other fund expenses, such as transfer agent fees, pricing and bookkeeping fees, and custodial, legal, and audit fees. The Board also noted the effects of any waivers and reimbursements on fees and expenses. As part of its review, the Board also considered current and historical total expenses of the fund compared to competitive fund median expenses. The fund is compared to those funds and classes in the Total Mapped Group (used by the Board for management fee comparisons) that have a similar sales load structure.
The Board noted that the fund's total expenses ranked below its competitive median for 2004.
In its review of total expenses, the Board also considered Fidelity fee structures and other information on clients that FMR and its affiliates service in other competitive markets, such as other mutual funds advised or subadvised by FMR or its affiliates, pension plan clients, and other institutional clients.
Based on its review, the Board concluded that the fund's total expenses were reasonable in light of the services that the fund and its shareholders receive and the other factors considered.
Costs of the Services and Profitability. The Board considered the revenues earned and the expenses incurred by Fidelity in conducting the business of developing, marketing, distributing, managing, administering and servicing the fund and its shareholders. The Board also considered the level of Fidelity's profits in respect of all the Fidelity funds.
On an annual basis, FMR presents to the Board Fidelity's profitability for the fund. Fidelity calculates the profitability for each fund, as well as aggregate profitability for groups of Fidelity funds and all Fidelity funds, using a series of detailed revenue and cost allocation methodologies which originate with the audited books and records of Fidelity. The Audit Committee of the Board reviews any significant changes from the prior year's methodologies.
PricewaterhouseCoopers LLP (PwC), independent registered accounting firm and auditor to Fidelity and certain Fidelity funds, has been engaged annually by the Board as part of the Board's assessment of the results of Fidelity's profitability analysis. PwC's engagement includes the review and assessment of Fidelity's methodologies used in determining the revenues and expenses attributable to Fidelity's mutual fund business, and completion of agreed-upon procedures surrounding the mathematical accuracy of fund profitability and its conformity to allocation methodologies. After considering PwC's reports issued under the engagement and information provided by Fidelity, the Board believes that while other allocation methods may also be reasonable, Fidelity's profitability methodologies are reasonable in all material respects.
Annual Report
Board Approval of Investment Advisory Contracts and
Management Fees - continued
The Board has also reviewed Fidelity's non-fund businesses and any fall-out benefits related to the mutual fund business as well as cases where Fidelity's affiliates may benefit from or be related to the fund's business. In addition, a special committee of the Board reviewed services provided to Fidelity by its affiliates and determined that the fees that Fidelity paid for such services were reasonable.
The Board considered the costs of the services provided by and the profits realized by Fidelity in connection with the operation of the fund and determined that the amount of profit is a fair entrepreneurial profit for the management of the fund.
Economies of Scale. The Board considered whether there have been economies of scale in respect of the management of the Fidelity funds, whether the Fidelity funds (including the fund) have appropriately benefited from any such economies of scale, and whether there is potential for realization of any further economies of scale. The Board considered the extent to which the fund will benefit from economies of scale through increased services to the fund, through waivers or reimbursements, or through fee or expense reductions, including reductions that occur through operation of the transfer agent agreement. The transfer agent fee varies in part based on the number of accounts in the fund. If the number of accounts decreases or the average account size increases, the overall transfer agent fee rate decreases.
The Board recognized that the fund's management contract incorporates a "group fee" structure, which provides for lower fee rates as total fund assets under FMR's management increase, and for higher fee rates as total fund assets under FMR's management decrease. The Board considered that the group fee is designed to deliver the benefits of economies of scale to fund shareholders when total fund assets increase, even if assets of any particular fund are unchanged or have declined, because some portion of Fidelity's costs are attributable to services provided to all Fidelity funds, and all funds benefit if those costs can be allocated among more assets. The Board concluded that, given the group fee structure, fund shareholders will achieve a certain level of economies of scale as assets under FMR's management increase at the fund complex level, regardless of whether Fidelity achieves any such economies of scale.
The Board further concluded that any potential economies of scale are being shared between fund shareholders and Fidelity in an appropriate manner.
Additional Information Requested by the Board. In order to develop fully the factual basis for consideration of the Advisory Contracts, the Board requested additional information regarding (i) equity fund transfer agency fees; (ii) Fidelity's fund profitability methodology and the impact of various changes in the methodology over time; (iii) benefits to shareholders from economies of scale; (iv) composition and characteristics of various fund and industry data used in comparisons; and (v) compensation of portfolio managers and research analysts.
Annual Report
Based on its evaluation of all of the conclusions noted above, and after considering all material factors, the Board ultimately concluded that the existing advisory fee structures are fair and reasonable, and that the fund's existing Advisory Contracts should be renewed.
Annual Report
Investment Adviser
Fidelity Management & Research Company
Boston, MA
Investment Sub-Adviser
FMR Co., Inc.
Fidelity Management & Research
(Far East) Inc.
Fidelity Management & Research
(U.K.) Inc.
Fidelity Investments Japan Limited
Fidelity International Investment
Advisors
Fidelity International Investment
Advisors (U.K.) Limited
General Distributor
Fidelity Distributors Corporation
Boston, MA
Transfer and Service Agent
Fidelity Service Company, Inc.
Boston, MA
Custodian
JPMorgan Chase Bank
New York, NY
The Fidelity Telephone Connection
Mutual Fund 24-Hour Service
Exchanges/Redemptions
and Account Assistance 1-800-544-6666
Product Information 1-800-544-6666
Retirement Accounts 1-800-544-4774
(8 a.m. - 9 p.m.)
TDD Service 1-800-544-0118
for the deaf and hearing impaired
(9 a.m. - 9 p.m. Eastern time)
Fidelity Automated Service
Telephone (FAST ®) (automated graphic) 1-800-544-5555
(automated graphic) Automated line for quickest service
LSF-UANN-0905
1.789248.102
(Fidelity Investment logo)(registered trademark)
Corporate Headquarters
82 Devonshire St., Boston, MA 02109
www.fidelity.com
Fidelity®
OTC
Portfolio
Annual Report
July 31, 2005
(2_fidelity_logos) (Registered_Trademark)
Contents
Chairman's Message | <Click Here> | Ned Johnson's message to shareholders. |
Performance | <Click Here> | How the fund has done over time. |
Management's Discussion | <Click Here> | The manager's review of fund performance, strategy and outlook. |
Shareholder Expense Example | <Click Here> | An example of shareholder expenses. |
Investment Changes | <Click Here> | A summary of major shifts in the fund's investments over the past six months. |
Investments | <Click Here> | A complete list of the fund's investments with their market values. |
Financial Statements | <Click Here> | Statements of assets and liabilities, operations, and changes in net assets, as well as financial highlights. |
Notes | <Click Here> | Notes to the financial statements. |
Report of Independent Registered Public Accounting Firm | <Click Here> | |
Trustees and Officers | <Click Here> | |
Distributions | <Click Here> | |
Board Approval of Investment Advisory Contracts and Management Fees | <Click Here> | |
To view a fund's proxy voting guidelines and proxy voting record for the 12-month period ended June 30, visit www.fidelity.com/proxyvotingresults or visit the Securities and Exchange Commission's (SEC) web site at www.sec.gov. You may also call 1-800-544-8544 to request a free copy of the proxy voting guidelines.
Standard & Poor's, S&P and S&P 500 are registered service marks of The McGraw-Hill Companies, Inc. and have been licensed for use by Fidelity Distributors Corporation.
Other third party marks appearing herein are the property of their respective owners.
All other marks appearing herein are registered or unregistered trademarks or service marks of FMR Corp. or an affiliated company.
Annual Report
This report and the financial statements contained herein are submitted for the general information of the shareholders of the fund. This report is not authorized for distribution to prospective investors in the fund unless preceded or accompanied by an effective prospectus.
A fund files its complete schedule of portfolio holdings with the SEC for the first and third quarters of each fiscal year on Form N-Q. Forms N-Q are available on the SEC's web site at http://www.sec.gov. A fund's Forms N-Q may be reviewed and copied at the SEC's Public Reference Room in Washington, DC. Information regarding the operation of the SEC's Public Reference Room may be obtained by calling 1-800-SEC-0330. For a complete list of a fund's portfolio holdings, view the most recent quarterly holdings report, semiannual report, or annual report on Fidelity's web site at http://www.fidelity.com/holdings.
NOT FDIC INSURED · MAY LOSE VALUE · NO BANK GUARANTEE
Neither the fund nor Fidelity Distributors Corporation is a bank.
Annual Report
Chairman's Message
(photo_of_Edward_C_Johnson_3d)
Dear Shareholder:
During the past year or so, much has been reported about the mutual fund industry, and much of it has been more critical than I believe is warranted. Allegations that some companies have been less than forthright with their shareholders have cast a shadow on the entire industry. I continue to find these reports disturbing, and assert that they do not create an accurate picture of the industry overall. Therefore, I would like to remind everyone where Fidelity stands on these issues. I will say two things specifically regarding allegations that some mutual fund companies were in violation of the Securities and Exchange Commission's forward pricing rules or were involved in so-called "market timing" activities.
First, Fidelity has no agreements that permit customers who buy fund shares after 4 p.m. to obtain the 4 p.m. price. This is not a new policy. This is not to say that someone could not deceive the company through fraudulent acts. However, we are extremely diligent in preventing fraud from occurring in this manner - and in every other. But I underscore again that Fidelity has no so-called "agreements" that sanction illegal practices.
Second, Fidelity continues to stand on record, as we have for years, in opposition to predatory short-term trading that adversely affects shareholders in a mutual fund. Back in the 1980s, we initiated a fee - which is returned to the fund and, therefore, to investors - to discourage this activity. Further, we took the lead several years ago in developing a Fair Value Pricing Policy to prevent market timing on foreign securities in our funds. I am confident we will find other ways to make it more difficult for predatory traders to operate. However, this will only be achieved through close cooperation among regulators, legislators and the industry.
Yes, there have been unfortunate instances of unethical and illegal activity within the mutual fund industry from time to time. That is true of any industry. When this occurs, confessed or convicted offenders should be dealt with appropriately. But we are still concerned about the risk of over-regulation and the quick application of simplistic solutions to intricate problems. Every system can be improved, and we support and applaud well thought out improvements by regulators, legislators and industry representatives that achieve the common goal of building and protecting the value of investors' holdings.
For nearly 60 years, Fidelity has worked very hard to improve its products and service to justify your trust. When our family founded this company in 1946, we had only a few hundred customers. Today, we serve more than 18 million customers including individual investors and participants in retirement plans across America.
Let me close by saying that we do not take your trust in us for granted, and we realize that we must always work to improve all aspects of our service to you. In turn, we urge you to continue your active participation with your financial matters, so that your interests can be well served.
Best regards,
/s/Edward C. Johnson 3d
Edward C. Johnson 3d
Annual Report
Performance: The Bottom Line
Average annual total return reflects the change in the value of an investment, assuming reinvestment of the fund's dividend income and capital gains (the profits earned upon the sale of securities that have grown in value) and assuming a constant rate of performance each year. The $10,000 table and the fund's returns do not reflect the deduction of taxes that a shareholder would pay on fund distributions or the redemption of fund shares. During periods of reimbursement by Fidelity, a fund's total return will be greater than it would be had the reimbursement not occurred. How a fund did yesterday is no guarantee of how it will do tomorrow.
Average Annual Total Returns
Periods ended July 31, 2005 | Past 1
year | Past 5
years | Past 10
years |
Fidelity® OTC Portfolio | 19.70% | -8.76% | 8.27% |
$10,000 Over 10 Years
Let's say hypothetically that $10,000 was invested in Fidelity ® OTC Portfolio on July 31, 1995. The chart shows how the value of your investment would have changed, and also shows how the NASDAQ Composite® Index performed over the same period.
Annual Report
Management's Discussion of Fund Performance
Comments from Sonu Kalra, Portfolio Manager of Fidelity® OTC Portfolio
A late-inning rally on Wall Street helped push some key U.S. equity indexes to four-year highs by the conclusion of the 12-month period ending July 31, 2005. Spurred on by bullish economic data and strong corporate earnings, investors enjoyed a stellar month of July, capping off a turbulent 12-month period for U.S. equity markets. Stock prices bounced up and down during most of the year, moving in cadence with gyrations in the price of crude oil and investors' gathering and ebbing concerns about inflation. The Federal Reserve Board raised short-term interest rates eight times during the period, also affecting overall market sentiment. Despite their fluctuations, the major equity indexes finished on a high note, with the Standard & Poor's 500SM Index and the NASDAQ Composite® Index posting gains of 14.05% and 16.51%, respectively, for the period. The small-cap Russell 2000® Index rose 24.78% and the Russell Midcap® Index jumped 28.93%, while the blue-chips' Dow Jones Industrial AverageSM advanced only 7.29%.
For the 12 months ending July 31, 2005, the fund returned 19.70%, handily beating the NASDAQ Composite Index but trailing the 22.82% return of the LipperSM Mid-Cap Funds Average. Compared with the index, the fund was aided by strong stock picking in information technology and health care. Among individual holdings, Google was the biggest contributor in absolute terms and second-largest versus the index. The company's Internet search engine remained the tool of choice for finding information online, enabling the company to post strong gains in paid-search revenues and earnings. Another tech stock aiding both absolute and relative performance was chip maker Intel, which was bolstered by strong demand in the more profitable laptop and notebook end of the personal computer market. On the other hand, business software maker Siebel Systems detracted from performance both in absolute terms and relative to the index. Investors were disappointed with Siebel's financial performance amid intense competition and a seeming lack of urgency in management's willingness to step up restructuring efforts. The fund's largest holding at period end, Microsoft, was a detractor relative to the index, albeit a modest contributor in absolute terms. Unexciting earnings growth and competition from upstarts such as the Linux operating system hampered the stock.
The views expressed in this statement reflect those of the portfolio manager only through the end of the period of the report as stated on the cover and do not necessarily represent the views of Fidelity or any other person in the Fidelity organization. Any such views are subject to change at any time based upon market or other conditions and Fidelity disclaims any responsibility to update such views. These views may not be relied on as investment advice and, because investment decisions for a Fidelity fund are based on numerous factors, may not be relied on as an indication of trading intent on behalf of any Fidelity fund.
Annual Report
Shareholder Expense Example
As a shareholder of the Fund, you incur two types of costs: (1) transaction costs, and (2) ongoing costs, including management fees and other Fund expenses. This Example is intended to help you understand your ongoing costs (in dollars) of investing in the Fund and to compare these costs with the ongoing costs of investing in other mutual funds.
The Example is based on an investment of $1,000 invested at the beginning of the period and held for the entire period (February 1, 2005 to July 31, 2005).
Actual Expenses
The first line of the table below provides information about actual account values and actual expenses. You may use the information in this line, together with the amount you invested, to estimate the expenses that you paid over the period. Simply divide your account value by $1,000.00 (for example, an $8,600 account value divided by $1,000.00 = 8.6), then multiply the result by the number in the first line under the heading entitled "Expenses Paid During Period" to estimate the expenses you paid on your account during this period. A small balance maintenance fee of $12.00 that is charged once a year may apply for certain accounts with a value of less than $2,000. This fee is not included in the table below. If it was, the estimate of expenses you paid during the period would be higher, and your ending account value lower, by this amount.
Hypothetical Example for Comparison Purposes
The second line of the table below provides information about hypothetical account values and hypothetical expenses based on the Fund's actual expense ratio and an assumed rate of return of 5% per year before expenses, which is not the Fund's actual return. The hypothetical account values and expenses may not be used to estimate the actual ending account balance or expenses you paid for the period. You may use this information to compare the ongoing costs of investing in the Fund and other funds. To do so, compare this 5% hypothetical example with the 5% hypothetical examples that appear in the share-holder reports of the other funds. A small balance maintenance fee of $12.00 that is charged once a year may apply for certain accounts with a value of less than $2,000. This fee is not included in the table below. If it was, the estimate of expenses you paid during the period would be higher, and your ending account value lower, by this amount.
Please note that the expenses shown in the table are meant to highlight your ongoing costs only and do not reflect any transaction costs. Therefore, the second line of the table is useful in comparing ongoing costs only, and will not help you determine the relative total costs of owning different funds.
| Beginning
Account Value
February 1, 2005 | Ending
Account Value
July 31, 2005 | Expenses Paid
During Period*
February 1, 2005
to July 31, 2005 |
Actual | $ 1,000.00 | $ 1,090.90 | $ 3.94 |
Hypothetical (5% return per year before expenses) | $ 1,000.00 | $ 1,021.03 | $ 3.81 |
* Expenses are equal to the Fund's annualized expense ratio of .76%; multiplied by the average account value over the period, multiplied by 181/365 (to reflect the one-half year period).
Annual Report
Investment Changes
Top Ten Stocks as of July 31, 2005 |
| % of fund's
net assets | % of fund's net assets
6 months ago |
Microsoft Corp. | 7.7 | 11.4 |
Intel Corp. | 6.2 | 5.5 |
Dell, Inc. | 4.4 | 5.7 |
Cisco Systems, Inc. | 3.7 | 4.7 |
Yahoo!, Inc. | 2.4 | 2.5 |
Amgen, Inc. | 2.4 | 1.2 |
Google, Inc. Class A (sub. vtg.) | 2.3 | 0.5 |
eBay, Inc. | 2.2 | 0.8 |
Apple Computer, Inc. | 2.0 | 1.1 |
Symantec Corp. | 1.5 | 1.1 |
| 34.8 | |
Top Five Market Sectors as of July 31, 2005 |
| % of fund's
net assets | % of fund's net assets
6 months ago |
Information Technology | 56.8 | 64.5 |
Health Care | 15.3 | 10.8 |
Consumer Discretionary | 13.8 | 9.7 |
Industrials | 3.5 | 3.7 |
Telecommunication Services | 2.8 | 3.6 |
Asset Allocation (% of fund's net assets) |
As of July 31, 2005* | As of January 31, 2005** |
| Stocks 98.6% | | | Stocks 97.7% | |
| Short-Term
Investments and
Net Other Assets 1.4% | | | Short-Term
Investments and
Net Other Assets 2.3% | |
* Foreign
investments | 8.1% | | ** Foreign investments | 6.9% | |

Annual Report
Investments July 31, 2005
Showing Percentage of Net Assets
Common Stocks - 98.6% |
| Shares | | Value (Note 1) (000s) |
CONSUMER DISCRETIONARY - 13.8% |
Diversified Consumer Services - 0.4% |
Career Education Corp. (a) | 387,600 | | $ 15,035 |
Corinthian Colleges, Inc. (a) | 817,600 | | 11,226 |
Steiner Leisure Ltd. (a) | 145,300 | | 5,022 |
| | 31,283 |
Hotels, Restaurants & Leisure - 2.5% |
Buffalo Wild Wings, Inc. (a) | 359,300 | | 11,774 |
Carnival Corp. unit | 254,800 | | 13,352 |
Cosi, Inc. (a) | 529,850 | | 4,488 |
P.F. Chang's China Bistro, Inc. (a) | 200,000 | | 11,398 |
Panera Bread Co. Class A (a) | 129,094 | | 7,520 |
Penn National Gaming, Inc. (a) | 716,200 | | 25,604 |
Red Robin Gourmet Burgers, Inc. (a) | 365,250 | | 21,930 |
Shuffle Master, Inc. (a)(d) | 700,000 | | 18,781 |
Sportingbet PLC (a) | 1,519,000 | | 9,891 |
Starbucks Corp. (a) | 393,400 | | 20,673 |
Sunterra Corp. (a) | 934,800 | | 13,162 |
Texas Roadhouse, Inc. Class A | 310,155 | | 11,668 |
Wynn Resorts Ltd. (a)(d) | 553,600 | | 31,168 |
| | 201,409 |
Household Durables - 0.4% |
Beazer Homes USA, Inc. | 138,700 | | 9,077 |
D.R. Horton, Inc. | 198,700 | | 8,163 |
Ryland Group, Inc. | 106,000 | | 8,565 |
Toll Brothers, Inc. (a) | 143,600 | | 7,958 |
| | 33,763 |
Internet & Catalog Retail - 3.1% |
Amazon.com, Inc. (a) | 451,200 | | 20,381 |
Coldwater Creek, Inc. (a) | 1,008,100 | | 27,914 |
eBay, Inc. (a) | 4,296,900 | | 179,524 |
J. Jill Group, Inc. (a) | 803,500 | | 13,105 |
Overstock.com, Inc. (a)(d) | 275,600 | | 11,931 |
| | 252,855 |
Media - 2.3% |
Comcast Corp. Class A (special) (a) | 652,200 | | 19,566 |
EchoStar Communications Corp. Class A | 1,030,822 | | 29,605 |
Focus Media Holding Ltd. ADR (d) | 399,800 | | 7,708 |
Harris Interactive, Inc. (a) | 76,164 | | 307 |
Lamar Advertising Co. Class A (a) | 1,056,900 | | 46,514 |
NTL, Inc. (a) | 592,543 | | 39,481 |
Common Stocks - continued |
| Shares | | Value (Note 1) (000s) |
CONSUMER DISCRETIONARY - continued |
Media - continued |
Sirius Satellite Radio, Inc. (a)(d) | 1,392,600 | | $ 9,498 |
TiVo, Inc. (a) | 962,900 | | 6,018 |
XM Satellite Radio Holdings, Inc. Class A (a) | 711,400 | | 25,347 |
| | 184,044 |
Multiline Retail - 0.7% |
Federated Department Stores, Inc. | 107,900 | | 8,186 |
Sears Holdings Corp. (a) | 321,300 | | 49,554 |
| | 57,740 |
Specialty Retail - 4.4% |
Aeropostale, Inc. (a) | 271,700 | | 8,110 |
American Eagle Outfitters, Inc. | 422,800 | | 13,931 |
bebe Stores, Inc. | 644,100 | | 18,331 |
Bed Bath & Beyond, Inc. (a) | 543,100 | | 24,928 |
Best Buy Co., Inc. | 494,100 | | 37,848 |
Electronics Boutique Holding Corp. (a) | 488,700 | | 31,599 |
GameStop Corp.: | | | |
Class A (a) | 52,900 | | 1,817 |
Class B (a) | 741,200 | | 23,718 |
Guitar Center, Inc. (a) | 344,300 | | 22,240 |
Hot Topic, Inc. (a) | 1,782,400 | | 30,372 |
Pacific Sunwear of California, Inc. (a) | 637,000 | | 15,536 |
Ross Stores, Inc. | 914,900 | | 24,245 |
Staples, Inc. | 2,855,300 | | 65,015 |
Urban Outfitters, Inc. (a) | 631,100 | | 38,314 |
| | 356,004 |
TOTAL CONSUMER DISCRETIONARY | | 1,117,098 |
CONSUMER STAPLES - 1.3% |
Food & Staples Retailing - 1.3% |
Costco Wholesale Corp. | 997,200 | | 45,841 |
United Natural Foods, Inc. (a) | 241,000 | | 8,127 |
Wal-Mart Stores, Inc. | 405,400 | | 20,006 |
Whole Foods Market, Inc. | 167,900 | | 22,920 |
Wild Oats Markets, Inc. (a)(d) | 680,300 | | 9,136 |
| | 106,030 |
Common Stocks - continued |
| Shares | | Value (Note 1) (000s) |
ENERGY - 1.7% |
Energy Equipment & Services - 1.1% |
GlobalSantaFe Corp. | 205,400 | | $ 9,241 |
Halliburton Co. | 151,500 | | 8,492 |
Noble Corp. | 138,500 | | 9,304 |
Patterson-UTI Energy, Inc. | 1,548,600 | | 50,841 |
Schlumberger Ltd. (NY Shares) | 98,100 | | 8,215 |
| | 86,093 |
Oil, Gas & Consumable Fuels - 0.6% |
Top Tankers, Inc. | 1,274,200 | | 19,546 |
Toreador Resources Corp. | 25,000 | | 726 |
Valero Energy Corp. | 384,100 | | 31,796 |
| | 52,068 |
TOTAL ENERGY | | 138,161 |
FINANCIALS - 2.4% |
Capital Markets - 0.9% |
Ameritrade Holding Corp. (a) | 749,500 | | 14,638 |
Calamos Asset Management, Inc. Class A | 831,300 | | 23,975 |
E*TRADE Financial Corp. (a) | 1,174,200 | | 18,212 |
Investors Financial Services Corp. (d) | 479,700 | | 16,511 |
| | 73,336 |
Commercial Banks - 1.1% |
Fifth Third Bancorp | 379,000 | | 16,335 |
HDFC Bank Ltd. sponsored ADR | 186,800 | | 9,489 |
Nara Bancorp, Inc. | 434,000 | | 6,744 |
SVB Financial Group (a) | 540,300 | | 27,739 |
Texas Capital Bancshares, Inc. (a) | 400,000 | | 9,448 |
UCBH Holdings, Inc. | 706,800 | | 12,913 |
| | 82,668 |
Consumer Finance - 0.1% |
Asta Funding, Inc. | 301,500 | | 8,065 |
Diversified Financial Services - 0.2% |
Encore Capital Group, Inc. (a) | 294,818 | | 5,189 |
NETeller PLC (a) | 874,500 | | 12,926 |
| | 18,115 |
Common Stocks - continued |
| Shares | | Value (Note 1) (000s) |
FINANCIALS - continued |
Thrifts & Mortgage Finance - 0.1% |
Hudson City Bancorp, Inc. | 775,000 | | $ 9,168 |
TOTAL FINANCIALS | | 191,352 |
HEALTH CARE - 15.3% |
Biotechnology - 8.5% |
Affymetrix, Inc. (a) | 372,500 | | 17,392 |
Alkermes, Inc. (a) | 704,800 | | 10,924 |
Amgen, Inc. (a) | 2,443,000 | | 194,829 |
Biogen Idec, Inc. (a) | 2,343,200 | | 92,064 |
BioMarin Pharmaceutical, Inc. (a) | 1,377,600 | | 11,710 |
Celgene Corp. (a) | 704,400 | | 33,706 |
Cephalon, Inc. (a) | 824,510 | | 34,547 |
Genentech, Inc. (a) | 665,400 | | 59,440 |
Gilead Sciences, Inc. (a) | 1,163,500 | | 52,136 |
ImClone Systems, Inc. (a) | 869,700 | | 30,179 |
Invitrogen Corp. (a) | 672,500 | | 57,680 |
MedImmune, Inc. (a) | 825,300 | | 23,447 |
Millennium Pharmaceuticals, Inc. (a) | 1,240,200 | | 12,811 |
Neurocrine Biosciences, Inc. (a) | 137,300 | | 6,807 |
ONYX Pharmaceuticals, Inc. (a)(d) | 377,600 | | 8,855 |
OSI Pharmaceuticals, Inc. (a) | 181,000 | | 7,475 |
Protein Design Labs, Inc. (a) | 1,192,000 | | 27,166 |
Seattle Genetics, Inc. (a) | 551,300 | | 3,319 |
Vertex Pharmaceuticals, Inc. (a) | 266,500 | | 4,251 |
| | 688,738 |
Health Care Equipment & Supplies - 2.0% |
American Medical Systems Holdings, Inc. (a) | 1,110,400 | | 25,817 |
Arthrocare Corp. (a) | 233,400 | | 8,535 |
Cytyc Corp. (a) | 484,000 | | 12,081 |
Dade Behring Holdings, Inc. | 419,500 | | 31,798 |
Gen-Probe, Inc. (a) | 285,800 | | 12,601 |
Respironics, Inc. (a) | 1,290,200 | | 48,899 |
SonoSight, Inc. (a) | 251,100 | | 8,412 |
Syneron Medical Ltd. | 210,000 | | 8,096 |
Varian, Inc. (a) | 209,100 | | 7,835 |
| | 164,074 |
Health Care Providers & Services - 3.0% |
Caremark Rx, Inc. (a) | 263,460 | | 11,745 |
Common Stocks - continued |
| Shares | | Value (Note 1) (000s) |
HEALTH CARE - continued |
Health Care Providers & Services - continued |
Cerner Corp. (a) | 98,500 | | $ 7,429 |
Express Scripts, Inc. (a) | 637,100 | | 33,320 |
Henry Schein, Inc. (a) | 924,200 | | 39,898 |
Humana, Inc. (a) | 902,200 | | 35,953 |
UnitedHealth Group, Inc. | 856,800 | | 44,811 |
WebMD Corp. (a) | 6,138,200 | | 65,126 |
| | 238,282 |
Pharmaceuticals - 1.8% |
Elan Corp. PLC sponsored ADR (a) | 540,800 | | 4,045 |
Endo Pharmaceuticals Holdings, Inc. (a) | 1,488,900 | | 42,374 |
Medicis Pharmaceutical Corp. Class A (d) | 474,200 | | 16,085 |
Roche Holding AG (participation certificate) | 91,300 | | 12,415 |
Sepracor, Inc. (a) | 647,700 | | 33,907 |
Teva Pharmaceutical Industries Ltd. sponsored ADR | 1,153,100 | | 36,207 |
| | 145,033 |
TOTAL HEALTH CARE | | 1,236,127 |
INDUSTRIALS - 3.5% |
Aerospace & Defense - 0.1% |
BE Aerospace, Inc. (a) | 675,303 | | 11,838 |
Air Freight & Logistics - 0.4% |
EGL, Inc. (a) | 863,451 | | 17,381 |
Forward Air Corp. | 412,500 | | 14,376 |
| | 31,757 |
Airlines - 1.1% |
JetBlue Airways Corp. (a) | 1,819,756 | | 38,215 |
Northwest Airlines Corp. (a)(d) | 2,207,400 | | 10,264 |
Ryanair Holdings PLC sponsored ADR (a) | 265,400 | | 12,423 |
Southwest Airlines Co. | 1,743,900 | | 24,746 |
| | 85,648 |
Commercial Services & Supplies - 1.2% |
Cintas Corp. | 737,100 | | 32,676 |
Herman Miller, Inc. | 1,134,400 | | 36,221 |
Monster Worldwide, Inc. (a) | 533,000 | | 16,187 |
PeopleSupport, Inc. (e) | 1,432,700 | | 13,740 |
| | 98,824 |
Common Stocks - continued |
| Shares | | Value (Note 1) (000s) |
INDUSTRIALS - continued |
Machinery - 0.3% |
A.S.V., Inc. (a) | 220,200 | | $ 10,559 |
Joy Global, Inc. | 259,100 | | 10,641 |
| | 21,200 |
Marine - 0.1% |
DryShips, Inc. | 513,800 | | 7,347 |
Road & Rail - 0.3% |
Landstar System, Inc. (a) | 860,692 | | 28,678 |
TOTAL INDUSTRIALS | | 285,292 |
INFORMATION TECHNOLOGY - 56.8% |
Communications Equipment - 8.6% |
Cisco Systems, Inc. (a) | 15,483,300 | | 296,505 |
Comverse Technology, Inc. (a) | 849,200 | | 21,476 |
F5 Networks, Inc. (a) | 167,700 | | 7,074 |
Finisar Corp. (a) | 1,950,000 | | 2,126 |
JDS Uniphase Corp. (a) | 5,856,300 | | 8,843 |
Juniper Networks, Inc. (a) | 2,218,500 | | 53,222 |
Motorola, Inc. | 1,985,700 | | 42,057 |
Nokia Corp. sponsored ADR | 2,911,700 | | 46,442 |
QUALCOMM, Inc. | 2,460,200 | | 97,153 |
Research In Motion Ltd. (a) | 1,709,700 | | 120,902 |
| | 695,800 |
Computers & Peripherals - 10.8% |
Advanced Digital Information Corp. (a) | 1,080,400 | | 8,622 |
Apple Computer, Inc. (a) | 3,853,100 | | 164,335 |
Avid Technology, Inc. (a) | 777,900 | | 32,011 |
Dell, Inc. (a) | 8,769,200 | | 354,890 |
EMC Corp. (a) | 1,829,600 | | 25,047 |
Emulex Corp. (a) | 1,861,700 | | 35,354 |
Hutchinson Technology, Inc. (a) | 300,000 | | 9,987 |
M-Systems Flash Disk Pioneers Ltd. (a)(e) | 1,773,200 | | 45,837 |
NCR Corp. (a) | 845,700 | | 29,354 |
Network Appliance, Inc. (a) | 657,000 | | 16,760 |
Palm, Inc. (a) | 1,252,600 | | 35,749 |
Rackable Systems, Inc. | 250,000 | | 3,243 |
SanDisk Corp. (a) | 2,059,000 | | 69,635 |
Seagate Technology | 1,853,900 | | 35,910 |
| | 866,734 |
Common Stocks - continued |
| Shares | | Value (Note 1) (000s) |
INFORMATION TECHNOLOGY - continued |
Electronic Equipment & Instruments - 0.7% |
Agilent Technologies, Inc. (a) | 306,800 | | $ 8,050 |
FARO Technologies, Inc. (a) | 142,500 | | 3,374 |
Hon Hai Precision Industries Co. Ltd. | 4,613,794 | | 25,914 |
Optimal Group, Inc. Class A (a) | 200,000 | | 4,302 |
Photon Dynamics, Inc. (a) | 428,300 | | 8,110 |
Samsung SDI Co. Ltd. | 78,900 | | 7,865 |
| | 57,615 |
Internet Software & Services - 5.6% |
Akamai Technologies, Inc. (a) | 2,213,600 | | 33,802 |
Cryptologic, Inc. | 255,500 | | 7,200 |
Digitas, Inc. (a) | 1,423,200 | | 16,054 |
Equinix, Inc. (a) | 127,500 | | 5,657 |
Google, Inc. Class A (sub. vtg.) | 645,100 | | 185,634 |
Marchex, Inc. Class B (a) | 182,100 | | 2,992 |
Supportsoft, Inc. (a) | 1,695,119 | | 9,323 |
Yahoo!, Inc. (a) | 5,844,316 | | 194,849 |
| | 455,511 |
IT Services - 1.5% |
Cognizant Technology Solutions Corp. Class A (a) | 733,500 | | 36,000 |
Infosys Technologies Ltd. sponsored ADR | 538,800 | | 38,352 |
Paychex, Inc. | 899,500 | | 31,402 |
Sapient Corp. (a) | 159,000 | | 1,237 |
Satyam Computer Services Ltd. sponsored ADR | 325,800 | | 9,311 |
Syntel, Inc. | 264,947 | | 5,087 |
| | 121,389 |
Office Electronics - 0.4% |
Zebra Technologies Corp. Class A (a) | 761,200 | | 29,687 |
Semiconductors & Semiconductor Equipment - 14.3% |
Analog Devices, Inc. | 1,314,400 | | 51,524 |
Applied Materials, Inc. | 3,303,700 | | 60,986 |
Applied Micro Circuits Corp. (a) | 2,277,700 | | 6,856 |
ASML Holding NV (NY Shares) (a) | 1,434,700 | | 25,251 |
ATMI, Inc. (a) | 854,211 | | 27,190 |
Cypress Semiconductor Corp. (a) | 589,300 | | 8,462 |
Freescale Semiconductor, Inc.: | | | |
Class A | 1,934,100 | | 49,358 |
Class B | 1,215,334 | | 31,295 |
Integrated Circuit Systems, Inc. (a) | 1,094,800 | | 23,954 |
Intel Corp. | 18,500,200 | | 502,095 |
Common Stocks - continued |
| Shares | | Value (Note 1) (000s) |
INFORMATION TECHNOLOGY - continued |
Semiconductors & Semiconductor Equipment - continued |
Linear Technology Corp. | 775,400 | | $ 30,132 |
Marvell Technology Group Ltd. (a) | 548,500 | | 23,964 |
Maxim Integrated Products, Inc. | 1,363,400 | | 57,086 |
National Semiconductor Corp. | 1,851,200 | | 45,743 |
Novellus Systems, Inc. (a) | 240,000 | | 6,924 |
NVIDIA Corp. (a) | 1,042,900 | | 28,221 |
Omnivision Technologies, Inc. (a)(d) | 1,491,600 | | 21,076 |
PMC-Sierra, Inc. (a) | 1,911,600 | | 18,791 |
PortalPlayer, Inc. (d)(e) | 1,375,800 | | 33,019 |
Rambus, Inc. (a)(d) | 992,800 | | 13,045 |
Samsung Electronics Co. Ltd. | 74,550 | | 41,162 |
Silicon Laboratories, Inc. (a) | 444,600 | | 13,013 |
Vitesse Semiconductor Corp. (a) | 5,820,300 | | 12,921 |
Xilinx, Inc. | 699,600 | | 19,834 |
| | 1,151,902 |
Software - 14.9% |
Activision, Inc. (a) | 1,692,211 | | 34,420 |
Cognos, Inc. (a) | 359,300 | | 13,998 |
Electronic Arts, Inc. (a) | 1,144,501 | | 65,923 |
Hyperion Solutions Corp. (a) | 375,531 | | 17,672 |
Macrovision Corp. (a) | 520,400 | | 11,360 |
Microsoft Corp. | 24,230,100 | | 620,535 |
Oracle Corp. (a) | 7,948,200 | | 107,937 |
Quest Software, Inc. (a) | 881,800 | | 12,566 |
Red Hat, Inc. (a) | 3,565,700 | | 54,341 |
Siebel Systems, Inc. | 10,059,745 | | 84,502 |
Symantec Corp. (a) | 5,554,674 | | 122,036 |
Take-Two Interactive Software, Inc. (a) | 1,187,650 | | 29,228 |
THQ, Inc. (a) | 84,383 | | 2,952 |
TIBCO Software, Inc. (a) | 1,396,102 | | 10,736 |
UBI Soft Entertainment SA (a)(d) | 200,000 | | 11,097 |
| | 1,199,303 |
TOTAL INFORMATION TECHNOLOGY | | 4,577,941 |
Common Stocks - continued |
| Shares | | Value (Note 1) (000s) |
MATERIALS - 0.6% |
Chemicals - 0.6% |
Ashland, Inc. | 490,800 | | $ 30,160 |
Monsanto Co. | 236,000 | | 15,899 |
| | 46,059 |
TELECOMMUNICATION SERVICES - 2.8% |
Diversified Telecommunication Services - 0.1% |
NeuStar, Inc. Class A | 352,000 | | 9,856 |
Wireless Telecommunication Services - 2.7% |
Nextel Communications, Inc. Class A (a) | 3,502,100 | | 121,873 |
Nextel Partners, Inc. Class A (a) | 487,200 | | 12,131 |
NII Holdings, Inc. (a) | 1,072,600 | | 79,844 |
| | 213,848 |
TOTAL TELECOMMUNICATION SERVICES | | 223,704 |
UTILITIES - 0.4% |
Electric Utilities - 0.1% |
Exelon Corp. | 150,600 | | 8,060 |
Gas Utilities - 0.1% |
Questar Corp. | 128,700 | | 9,032 |
Multi-Utilities - 0.2% |
Public Service Enterprise Group, Inc. | 200,100 | | 12,866 |
TOTAL UTILITIES | | 29,958 |
TOTAL COMMON STOCKS (Cost $7,215,623) | 7,951,722 |
Money Market Funds - 2.9% |
| Shares | | Value (Note 1) (000s) |
Fidelity Cash Central Fund, 3.31% (b) | 117,637,305 | | $ 117,637 |
Fidelity Securities Lending Cash Central Fund, 3.32% (b)(c) | 111,749,787 | | 111,750 |
TOTAL MONEY MARKET FUNDS (Cost $229,387) | 229,387 |
TOTAL INVESTMENT PORTFOLIO - 101.5% (Cost $7,445,010) | | 8,181,109 |
NET OTHER ASSETS - (1.5)% | | (118,262) |
NET ASSETS - 100% | $ 8,062,847 |
Legend |
(a) Non-income producing |
(b) Affiliated fund that is available only to investment companies and other accounts managed by Fidelity Investments. The rate quoted is the annualized seven-day yield of the fund at period end. A complete listing of the fund's holdings as of its most recent quarter end is available upon request. |
(c) Investment made with cash collateral received from securities on loan. |
(d) Security or a portion of the security is on loan at period end. |
(e) Affiliated company |
Other Information |
An affiliated company is a company in which the fund has ownership of at least 5% of the voting securities. Companies which are affiliates of the fund at period-end are noted in the fund's Schedule of Investments. Transactions during the period with companies which are or were affiliates are as follows: |
Affiliates
(Amounts in thousands) | Value,
beginning
of period | Purchases | Sales Proceeds | Dividend Income | Value,
end of
period |
24/7 Real Media, Inc. | $ 6,713 | $ 7,257 | $ 10,999 | $ - | $ - |
Carrier Access Corp. | - | 19,282 | 9,907 | - | - |
eDiets.com, Inc. | 3,208 | - | 4,628 | - | - |
Homestore, Inc. | 27,581 | 16,819 | 35,800 | - | - |
M-Systems Flash Disk Pioneers Ltd. | - | 41,329 | - | - | 45,837 |
PeopleSupport, Inc. | - | 14,484 | - | - | 13,740 |
PortalPlayer, Inc. | - | 37,346 | 9,128 | - | 33,019 |
Redback Networks, Inc. | 15,289 | - | 13,429 | - | - |
Rush Enterprises, Inc. Class A | - | 18,460 | 21,816 | - | - |
Time Warner Telecom, Inc. Class A | 32,301 | 166 | 28,716 | - | - |
Top Tankers, Inc. | 1,987 | 22,221 | 7,782 | 1,404 | - |
WatchGuard Technologies, Inc. | 6,848 | 4,362 | 8,688 | - | - |
Wet Seal, Inc. Class A | 7,768 | - | 2,746 | - | - |
Total | $ 101,695 | $ 181,726 | $ 153,639 | $ 1,404 | $ 92,596 |
Income Tax Information |
At July 31, 2005, the fund had a capital loss carryforward of approximately $4,443,084,000 of which $3,193,189,000 and $1,249,895,000 will expire on July 31, 2010 and 2011, respectively. |
See accompanying notes which are an integral part of the financial statements.
Annual Report
Financial Statements
Statement of Assets and Liabilities
Amounts in thousands (except per-share amount) | July 31, 2005 |
| | |
Assets | | |
Investment in securities, at value (including securities loaned of $107,642) (cost $7,445,010) - See accompanying schedule | | $ 8,181,109 |
Cash | | 8 |
Foreign currency held at value (cost $157) | | 166 |
Receivable for investments sold | | 226,554 |
Receivable for fund shares sold | | 7,587 |
Dividends receivable | | 219 |
Interest receivable | | 304 |
Prepaid expenses | | 12 |
Other affiliated receivables | | 33 |
Other receivables | | 3,503 |
Total assets | | 8,419,495 |
| | |
Liabilities | | |
Payable for investments purchased | $ 227,568 | |
Payable for fund shares redeemed | 12,526 | |
Accrued management fee | 2,954 | |
Other affiliated payables | 1,760 | |
Other payables and accrued expenses | 90 | |
Collateral on securities loaned, at value | 111,750 | |
Total liabilities | | 356,648 |
| | |
Net Assets | | $ 8,062,847 |
Net Assets consist of: | | |
Paid in capital | | $ 11,799,505 |
Accumulated net investment loss | | (209) |
Accumulated undistributed net realized gain (loss) on investments and foreign currency transactions | | (4,472,566) |
Net unrealized appreciation (depreciation) on investments and assets and liabilities in foreign currencies | | 736,117 |
Net Assets, for 224,046 shares outstanding | | $ 8,062,847 |
Net Asset Value, offering price and redemption price per share ($8,062,847 ÷ 224,046 shares) | | $ 35.99 |
See accompanying notes which are an integral part of the financial statements.
Annual Report
Statement of Operations
Amounts in thousands | Year ended July 31, 2005 |
| | |
Investment Income | | |
Dividends (including $1,404 received from affiliated issuers) | | $ 31,999 |
Special Dividends | | 106,285 |
Interest | | 3,168 |
Security lending | | 1,030 |
Total income | | 142,482 |
| | |
Expenses | | |
Management fee
Basic fee | $ 47,129 | |
Performance adjustment | (5,664) | |
Transfer agent fees | 17,955 | |
Accounting and security lending fees | 1,160 | |
Independent trustees' compensation | 39 | |
Appreciation in deferred trustee compensation account | 4 | |
Custodian fees and expenses | 317 | |
Registration fees | 92 | |
Audit | 93 | |
Legal | 55 | |
Interest | 2 | |
Miscellaneous | 64 | |
Total expenses before reductions | 61,246 | |
Expense reductions | (4,301) | 56,945 |
Net investment income (loss) | | 85,537 |
Realized and Unrealized Gain (Loss) Net realized gain (loss) on: | | |
Investment securities (Including realized gain (loss) of $(86,137) from affiliated issuers) | 966,014 | |
Foreign currency transactions | (77) | |
Total net realized gain (loss) | | 965,937 |
Change in net unrealized appreciation (depreciation) on: Investment securities | 323,742 | |
Assets and liabilities in foreign currencies | 32 | |
Total change in net unrealized appreciation (depreciation) | | 323,774 |
Net gain (loss) | | 1,289,711 |
Net increase (decrease) in net assets resulting from operations | | $ 1,375,248 |
See accompanying notes which are an integral part of the financial statements.
Annual Report
Financial Statements - continued
Statement of Changes in Net Assets
Amounts in thousands | Year ended
July 31,
2005 | Year ended
July 31,
2004 |
Increase (Decrease) in Net Assets | | |
Operations | | |
Net investment income (loss) | $ 85,537 | $ (41,667) |
Net realized gain (loss) | 965,937 | 1,268,916 |
Change in net unrealized appreciation (depreciation) | 323,774 | (703,476) |
Net increase (decrease) in net assets resulting from operations | 1,375,248 | 523,773 |
Distributions to shareholders from net investment income | (95,497) | - |
Share transactions
Proceeds from sales of shares | 1,495,132 | 2,620,488 |
Reinvestment of distributions | 94,058 | - |
Cost of shares redeemed | (2,128,096) | (2,863,293) |
Net increase (decrease) in net assets resulting from share transactions | (538,906) | (242,805) |
Total increase (decrease) in net assets | 740,845 | 280,968 |
| | |
Net Assets | | |
Beginning of period | 7,322,002 | 7,041,034 |
End of period (including accumulated net investment loss of $209 and accumulated net investment loss of $133, respectively) | $ 8,062,847 | $ 7,322,002 |
Other Information Shares | | |
Sold | 45,709 | 82,028 |
Issued in reinvestment of distributions | 2,762 | - |
Redeemed | (65,059) | (89,916) |
Net increase (decrease) | (16,588) | (7,888) |
See accompanying notes which are an integral part of the financial statements.
Annual Report
Financial Highlights
Years ended July 31, | 2005 | 2004 | 2003 | 2002 | 2001 |
Selected Per-Share Data | | | | | |
Net asset value, beginning of period | $ 30.43 | $ 28.33 | $ 23.46 | $ 32.96 | $ 69.82 |
Income from Investment Operations | | | | | |
Net investment income (loss) B | .37 C | (.17) | (.17) | (.24) | (.18) |
Net realized and unrealized gain (loss) | 5.60 | 2.27 | 5.04 | (9.26) | (24.02) |
Total from investment operations | 5.97 | 2.10 | 4.87 | (9.50) | (24.20) |
Distributions from net investment income | (.41) | - | - | - | - |
Distributions from net realized gain | - | - | - | - | (12.66) |
Total distributions | (.41) | - | - | - | (12.66) |
Net asset value, end of period | $ 35.99 | $ 30.43 | $ 28.33 | $ 23.46 | $ 32.96 |
Total Return A | 19.70% | 7.41% | 20.76% | (28.82)% | (42.79)% |
Ratios to Average Net Assets D | | | | | |
Expenses before expense reductions | .81% | .91% | 1.18% | 1.14% | .97% |
Expenses net of voluntary waivers, if any | .81% | .91% | 1.18% | 1.14% | .97% |
Expenses net of all reductions | .75% | .89% | 1.12% | 1.09% | .94% |
Net investment income (loss) | 1.13% C | (.53)% | (.71)% | (.81)% | (.40)% |
Supplemental Data | | | | | |
Net assets, end of period (in millions) | $ 8,063 | $ 7,322 | $ 7,041 | $ 5,911 | $ 8,802 |
Portfolio turnover rate | 117% | 61% | 116% | 120% | 219% |
A Total returns would have been lower had certain expenses not been reduced during the periods shown.
B Calculated based on average shares outstanding during the period.
C Investment income per share reflects a special dividend which amounted to $.46 per share. Excluding the special dividend, the ratio of net investment income to average net assets would have been (.27)%.
D Expense ratios reflect operating expenses of the fund. Expenses before reductions do not reflect amounts reimbursed by the investment adviser or reductions from brokerage service arrangements or other expense offset arrangements and do not represent the amount paid by the fund during periods when reimbursements or reductions occur. Expenses net of any voluntary waivers reflect expenses after reimbursement by the investment adviser but prior to reductions from brokerage service arrangements or other expense offset arrangements. Expenses net of all reductions represent the net expenses paid by the fund.
See accompanying notes which are an integral part of the financial statements.
Annual Report
Notes to Financial Statements
For the period ended July 31, 2005
(Amounts in thousands except ratios)
1. Significant Accounting Policies.
Fidelity OTC Portfolio (the fund) is a non-diversified fund of Fidelity Securities Fund (the trust) and is authorized to issue an unlimited number of shares. The trust is registered under the Investment Company Act of 1940, as amended (the 1940 Act), as an open-end management investment company organized as a Massachusetts business trust. The financial statements have been prepared in conformity with accounting principles generally accepted in the United States of America, which require management to make certain estimates and assumptions at the date of the financial statements. The following summarizes the significant accounting policies of the fund:
Security Valuation. Net asset value per share (NAV calculation) is calculated as of the close of business of the New York Stock Exchange, normally 4:00 p.m. Eastern time. Equity securities, including restricted securities, for which market quotations are available are valued at the last sale price or official closing price (closing bid price or last evaluated quote if no sale has occurred) on the primary market or exchange on which they trade. If prices are not readily available or do not accurately reflect fair value for a security, or if a security's value has been materially affected by events occurring after the close of the exchange or market on which the security is principally traded, that security may be valued by another method that the Board of Trustees believes accurately reflects fair value. A security's valuation may differ depending on the method used for determining value. Price movements in futures contracts and ADRs, market and trading trends, the bid/ask quotes of brokers and off-exchange institutional trading may be reviewed in the course of making a good faith determination of a security's fair value. Short-term securities with remaining maturities of sixty days or less for which quotations are not readily available are valued on the basis of amortized cost. Investments in open-end investment companies are valued at their net asset value each business day.
Foreign Currency. The fund uses foreign currency contracts to facilitate transactions in foreign-denominated securities. Losses from these transactions may arise from changes in the value of the foreign currency or if the counterparties do not perform under the contracts' terms.
Foreign-denominated assets, including investment securities, and liabilities are translated into U.S. dollars at the exchange rate at period end. Purchases and sales of investment securities, income and dividends received and expenses denominated in foreign currencies are translated into U.S. dollars at the exchange rate in effect on the transaction date.
The effects of exchange rate fluctuations on investments are included with the net realized and unrealized gain (loss) on investment securities. Other foreign currency transactions resulting in realized and unrealized gain (loss) are disclosed separately.
Annual Report
1. Significant Accounting Policies - continued
Investment Transactions and Income. Security transactions are accounted for as of trade date. Gains and losses on securities sold are determined on the basis of identified cost and may include proceeds received from litigation. Dividend income is recorded on the ex-dividend date, except for certain dividends from foreign securities where the ex-dividend date may have passed, which are recorded as soon as the fund is informed of the ex-dividend date. Non-cash dividends included in dividend income, if any, are recorded at the fair market value of the securities received. Distributions received on securities that represent a return of capital or capital gain are recorded as a reduction of cost of investments and/or as a realized gain. The fund estimates the components of distributions received that may be considered return of capital distributions or capital gain distributions. Large, non-recurring dividends recognized by the fund are presented separately on the Statement of Operations as "Special Dividends" and the impact of these dividends is presented in the Financial Highlights. Interest income is accrued as earned. Interest income includes coupon interest and amortization of premium and accretion of discount on debt securities. Investment income is recorded net of foreign taxes withheld where recovery of such taxes is uncertain.
Expenses. Most expenses of the trust can be directly attributed to a fund. Expenses which cannot be directly attributed are apportioned among each fund in the trust.
Deferred Trustee Compensation. Under a Deferred Compensation Plan (the Plan), independent Trustees must defer receipt of a portion of, and may elect to defer receipt of an additional portion of, their annual compensation. Deferred amounts are treated as though equivalent dollar amounts had been invested in shares of the fund or are invested in a cross-section of other Fidelity funds, and are marked-to-market. Deferred amounts remain in the fund until distributed in accordance with the Plan.
Income Tax Information and Distributions to Shareholders. Each year, the fund intends to qualify as a regulated investment company by distributing all of its taxable income and realized gains under Subchapter M of the Internal Revenue Code. As a result, no provision for income taxes is required in the accompanying financial statements. Foreign taxes are provided for based on the fund's understanding of the tax rules and rates that exist in the foreign markets in which it invests.
Annual Report
Notes to Financial Statements - continued
(Amounts in thousands except ratios)
1. Significant Accounting Policies - continued
Income Tax Information and Distributions to Shareholders - continued
Distributions are recorded on the ex-dividend date. Income and capital gain distributions are determined in accordance with income tax regulations, which may differ from generally accepted accounting principles. In addition, the fund will claim a portion of the payment made to redeeming shareholders as a distribution for income tax purposes. Capital accounts within the financial statements are adjusted for permanent book-tax differences. These adjustments have no impact on net assets or the results of operations. Temporary book-tax differences will reverse in a subsequent period.
Book-tax differences are primarily due to foreign currency transactions, non-taxable dividends, deferred trustees compensation, net operating losses, capital loss carryforwards and losses deferred due to wash sales.
The tax-basis components of distributable earnings and the federal tax cost as of period end were as follows:
Unrealized appreciation | $ 1,029,725 | |
Unrealized depreciation | (323,149) | |
Net unrealized appreciation (depreciation) | 706,576 | |
Capital loss carryforward | (4,448,826) | |
| | |
Cost for federal income tax purposes | $ 7,474,533 | |
The tax character of distributions paid was as follows:
| July 31, 2005 |
Ordinary Income | $ 95,497 |
2. Operating Policies.
Repurchase Agreements. Fidelity Management & Research Company (FMR) has received an Exemptive Order from the Securities and Exchange Commission (the SEC) which permits the fund and other affiliated entities of FMR to transfer uninvested cash balances into joint trading accounts which are then invested in repurchase agreements. The fund may also invest directly with institutions in repurchase agreements. Repurchase agreements are collateralized by government or non-government securities. Collateral is held in segregated accounts with custodian banks and may be obtained in the event of a default of the counterparty. The fund monitors, on a daily basis, the value of the collateral to ensure it is at least equal to the principal amount of the repurchase agreement (including accrued interest). In the event of a default by the counterparty, realization of the collateral proceeds could be delayed, during which time the value of the collateral may decline.
Annual Report
3. Purchases and Sales of Investments.
Purchases and sales of securities, other than short-term securities and U.S. government securities, aggregated $8,700,268 and $9,262,602, respectively.
4. Fees and Other Transactions with Affiliates.
Management Fee. FMR and its affiliates provide the fund with investment management related services for which the fund pays a monthly management fee. The management fee is the sum of an individual fund fee rate that is based on an annual rate of .35% of the fund's average net assets and a group fee rate that averaged .27% during the period. The group fee rate is based upon the average net assets of all the mutual funds advised by FMR. The group fee rate decreases as assets under management increase and increases as assets under management decrease. In addition, the management fee is subject to a performance adjustment (up to a maximum of ± .20% of the fund's average net assets over a 36 month performance period). The upward or downward adjustment to the management fee is based on the fund's relative investment performance as compared to an appropriate benchmark index. For the period, the total annual management fee rate, including the performance adjustment, was .55% of the fund's average net assets.
Transfer Agent Fees. Fidelity Service Company, Inc. (FSC), an affiliate of FMR, is the fund's transfer, dividend disbursing and shareholder servicing agent. FSC receives account fees and asset-based fees that vary according to account size and type of account. FSC pays for typesetting, printing and mailing of shareholder reports, except proxy statements. For the period, the transfer agent fees were equivalent to an annual rate of .24% of average net assets.
Accounting and Security Lending Fees. FSC maintains the fund's accounting records. The accounting fee is based on the level of average net assets for the month. Under a separate contract, FSC administers the security lending program. The security lending fee is based on the number and duration of lending transactions.
Central Funds. The fund may invest in affiliated Central Funds managed by Fidelity Investments Money Management, Inc. (FIMM), an affiliate of FMR. The Central Funds are open-end investment companies available only to investment companies and other accounts managed by FMR and its affiliates. The Money Market Central Funds seek preservation of capital and current income. The Central Funds do not pay a management fee. Income distributions earned by the fund are recorded as income in the accompanying financial statements and totaled $4,792 for the period.
Brokerage Commissions. The fund placed a portion of its portfolio transactions with brokerage firms which are affiliates of the investment adviser. The commissions paid to these affiliated firms were $1,063 for the period.
Annual Report
Notes to Financial Statements - continued
(Amounts in thousands except ratios)
4. Fees and Other Transactions with Affiliates - continued
Interfund Lending Program. Pursuant to an Exemptive Order issued by the SEC, the fund, along with other registered investment companies having management contracts with FMR, may participate in an interfund lending program. This program provides an alternative credit facility allowing the funds to borrow from, or lend money to, other participating affiliated funds. At period end, there were no interfund loans outstanding. The fund's activity in this program during the period for which loans were outstanding was as follows:
Borrower or Lender | Average Daily
Loan Balance | Weighted Average Interest Rate | Interest
Expense |
Borrower | $ 27,227 | 2.14% | $ 2 |
5. Committed Line of Credit.
The fund participates with other funds managed by FMR in a $4.2 billion credit facility (the "line of credit") to be utilized for temporary or emergency purposes to fund shareholder redemptions or for other short-term liquidity purposes. The fund has agreed to pay commitment fees on its pro rata portion of the line of credit. During the period, there were no borrowings on this line of credit.
6. Security Lending.
The fund lends portfolio securities from time to time in order to earn additional income. The fund receives collateral (in the form of U.S. Treasury obligations, letters of credit and/or cash) against the loaned securities and maintains collateral in an amount not less than 100% of the market value of the loaned securities during the period of the loan. The market value of the loaned securities is determined at the close of business of the fund and any additional required collateral is delivered to the fund on the next business day. If the borrower defaults on its obligation to return the securities loaned because of insolvency or other reasons, a fund could experience delays and costs in recovering the securities loaned or in gaining access to the collateral. Cash collateral is invested in the Fidelity Securities Lending Cash Central Fund. The value of loaned securities and cash collateral at period end are disclosed on the fund's Statement of Assets and Liabilities.
7. Bank Borrowings.
The fund is permitted to have bank borrowings for temporary or emergency purposes to fund shareholder redemptions. The fund has established borrowing arrangements with certain banks. The interest rate on the borrowings is the bank's base rate, as revised from time to time. The average daily loan balance during the period for which loans were outstanding amounted to $5,484. The weighted average interest rate was 2.06%. At period end, there were no bank borrowings outstanding.
Annual Report
8. Expense Reductions.
Many of the brokers with whom FMR places trades on behalf of the fund provided services to the fund in addition to trade execution. These services included payments of certain expenses on behalf of the fund totaling $4,094 for the period. In addition, through arrangements with the fund's custodian and transfer agent, credits realized as a result of uninvested cash balances were used to reduce the fund's expenses. During the period, these credits reduced the fund's custody and transfer agent expenses by $3 and $204, respectively.
9. Other.
The fund's organizational documents provide former and current trustees and officers with a limited indemnification against liabilities arising in connection with the performance of their duties to the fund. In the normal course of business, the fund may also enter into contracts that provide general indemnifications. The fund's maximum exposure under these arrangements is unknown as this would be dependent on future claims that may be made against the fund. The risk of material loss from such claims is considered remote.
Annual Report
Report of Independent Registered Public Accounting Firm
To the Trustees of Fidelity Securities Fund and Shareholders of Fidelity OTC Portfolio:
We have audited the accompanying statement of assets and liabilities of Fidelity OTC Portfolio (the Fund), a fund of Fidelity Securities Fund, including the portfolio of investments, as of July 31, 2005, and the related statement of operations for the year then ended, the statement of changes in net assets for each of the two years in the period then ended, and the financial highlights for each of the five years in the period then ended. These financial statements and financial highlights are the responsibility of the Fund's management. Our responsibility is to express an opinion on these financial statements and financial highlights based on our audits.
We conducted our audits in accordance with standards of the Public Company Accounting Oversight Board (United States). Those standards require that we plan and perform the audit to obtain reasonable assurance about whether the financial statements and financial highlights are free of material misstatement. The Fund is not required to have, nor were we engaged to perform, an audit of its internal control over financial reporting. Our audits included consideration of internal control over financial reporting as a basis for designing audit procedures that are appropriate in the circumstances, but not for the purpose of expressing an opinion on the effectiveness of the Fund's internal control over financial reporting. Accordingly, we express no such opinion. An audit also includes examining, on a test basis, evidence supporting the amounts and disclosures in the financial statements, assessing the accounting principles used and significant estimates made by management, as well as evaluating the overall financial statement presentation. Our procedures included confirmation of securities owned as of July 31, 2005, by correspondence with the custodians and brokers; where replies were not received from brokers, we performed other auditing procedures. We believe that our audits provide a reasonable basis for our opinion.
In our opinion, the financial statements and financial highlights referred to above present fairly, in all material respects, the financial position of Fidelity OTC Portfolio as of July 31, 2005, the results of its operations for the year then ended, the changes in its net assets for each of the two years in the period then ended, and its financial highlights for each of the five years in the period then ended, in conformity with accounting principles generally accepted in the United States of America.
/s/ Deloitte & Touche LLP
DELOITTE & TOUCHE LLP
Boston, Massachusetts
September 9, 2005
Annual Report
Trustees and Officers
The Trustees, Members of the Advisory Board, and executive officers of the trust and fund, as applicable, are listed below. The Board of Trustees governs the fund and is responsible for protecting the interests of shareholders. The Trustees are experienced executives who meet periodically throughout the year to oversee the fund's activities, review contractual arrangements with companies that provide services to the fund, and review the fund's performance. Except for William O. McCoy, Stephen P. Jonas, and Kenneth L. Wolfe, each of the Trustees oversees 320 funds advised by FMR or an affiliate. Mr. McCoy oversees 322 funds advised by FMR or an affiliate. Mr. Jonas and Mr. Wolfe oversee 311 funds advised by FMR or an affiliate.
The Trustees hold office without limit in time except that (a) any Trustee may resign; (b) any Trustee may be removed by written instrument, signed by at least two-thirds of the number of Trustees prior to such removal; (c) any Trustee who requests to be retired or who has become incapacitated by illness or injury may be retired by written instrument signed by a majority of the other Trustees; and (d) any Trustee may be removed at any special meeting of shareholders by a two-thirds vote of the outstanding voting securities of the trust. Each Trustee who is not an interested person (as defined in the 1940 Act) (Independent Trustee), shall retire not later than the last day of the calendar year in which his or her 72nd birthday occurs. The Independent Trustees may waive this mandatory retirement age policy with respect to individual Trustees. The executive officers and Advisory Board Members hold office without limit in time, except that any officer and Advisory Board Member may resign or may be removed by a vote of a majority of the Trustees at any regular meeting or any special meeting of the Trustees. Except as indicated, each individual has held the office shown or other offices in the same company for the past five years.
The fund's Statement of Additional Information (SAI) includes more information about the Trustees. To request a free copy, call Fidelity at 1-800-544-8544.
Interested Trustees*:
Correspondence intended for each Trustee who is an interested person may be sent to Fidelity Investments, 82 Devonshire Street, Boston, Massachusetts 02109.
Name, Age; Principal Occupation |
Edward C. Johnson 3d (75)** |
| Year of Election or Appointment: 1984 Mr. Johnson is Chairman of the Board of Trustees. Mr. Johnson serves as Chief Executive Officer, Chairman, and a Director of FMR Corp.; a Director and Chairman of the Board and of the Executive Committee of FMR; Chairman and a Director of Fidelity Management & Research (Far East) Inc.; Chairman and a Director of Fidelity Investments Money Management, Inc.; and Chairman (2001-present) and a Director (2000-present) of FMR Co., Inc. |
Abigail P. Johnson (43)** |
| Year of Election or Appointment: 2001 Ms. Johnson serves as President of Fidelity Employer Services Company (FESCO) (2005-present). She is President and a Director of Fidelity Investments Money Management, Inc. (2001-present), FMR Co., Inc. (2001-present), and a Director of FMR Corp. Previously, Ms. Johnson served as President and a Director of FMR (2001-2005), Senior Vice President of other Fidelity funds (2001-2005), and managed a number of Fidelity funds. |
Stephen P. Jonas (52) |
| Year of Election or Appointment: 2005 Mr. Jonas is Senior Vice President of OTC (2005-present). He also serves as Senior Vice President of other Fidelity funds (2005-present). Mr. Jonas is Executive Director of FMR (2005-present). Previously, Mr. Jonas served as President of Fidelity Enterprise Operations and Risk Services (2004-2005), Chief Administrative Officer (2002-2004), and Chief Financial Officer of FMR Co. (1998-2000). In addition, he serves on the Boards of Boston Ballet (2003-present) and Simmons College (2003-present). Mr. Jonas has been with Fidelity Investments since 1987 and has held various financial and management positions including Chief Financial Officer of FMR. |
Robert L. Reynolds (53) |
| Year of Election or Appointment: 2003 Mr. Reynolds is a Director (2003-present) and Chief Operating Officer (2002-present) of FMR Corp. He also serves on the Board at Fidelity Investments Canada, Ltd. (2000-present). Previously, Mr. Reynolds served as President of Fidelity Investments Institutional Retirement Group (1996-2000). |
* Trustees have been determined to be "Interested Trustees" by virtue of, among other things, their affiliation with the trust or various entities under common control with FMR.
** Edward C. Johnson 3d, Trustee, is Abigail P. Johnson's father.
Annual Report
Independent Trustees:
Correspondence intended for each Independent Trustee (that is, the Trustees other than the Interested Trustees) may be sent to Fidelity Investments, P.O. Box 55235, Boston, Massachusetts 02205-5235.
Name, Age; Principal Occupation |
Dennis J. Dirks (57) |
| Year of Election or Appointment: 2005 Prior to his retirement in May 2003, Mr. Dirks was Chief Operating Officer and a member of the Board of The Depository Trust & Clearing Corporation (DTCC) (1999-2003). He also served as President, Chief Operating Officer, and Board member of The Depository Trust Company (DTC) (1999-2003) and President and Board member of the National Securities Clearing Corporation (NSCC) (1999-2003). In addition, Mr. Dirks served as Chief Executive Officer and Board member of the Government Securities Clearing Corporation (2001-2003) and Chief Executive Officer and Board member of the Mortgage-Backed Securities Clearing Corporation (2001-2003). Mr. Dirks also serves as a Trustee of Manhattan College (2005-present). |
Robert M. Gates (61) |
| Year of Election or Appointment: 1997 Dr. Gates is Vice Chairman of the Independent Trustees (2005-present). Dr. Gates is President of Texas A&M University (2002-present). He was Director of the Central Intelligence Agency (CIA) from 1991 to 1993. From 1989 to 1991, Dr. Gates served as Assistant to the President of the United States and Deputy National Security Advisor. Dr. Gates is a Director of NACCO Industries, Inc. (mining and manufacturing), Parker Drilling Co., Inc. (drilling and rental tools for the energy industry, 2001-present), and Brinker International (restaurant management, 2003-present). Previously, Dr. Gates served as a Director of LucasVarity PLC (automotive components and diesel engines), a Director of TRW Inc. (automotive, space, defense, and information technology), and Dean of the George Bush School of Government and Public Service at Texas A&M University (1999-2001). Dr. Gates also is a Trustee of the Forum for International Policy. |
George H. Heilmeier (69) |
| Year of Election or Appointment: 2004 Dr. Heilmeier is Chairman Emeritus of Telcordia Technologies (communication software and systems), where prior to his retirement, he served as company Chairman and Chief Executive Officer. He currently serves on the Boards of Directors of The Mitre Corporation (systems engineering and information technology support for the government), and HRL Laboratories (private research and development, 2004-present). He is Chairman of the General Motors Science & Technology Advisory Board and a Life Fellow of the Institute of Electrical and Electronics Engineers (IEEE) (2000-present). Dr. Heilmeier is a member of the Defense Science Board and the National Security Agency Advisory Board. He is also a member of the National Academy of Engineering, the American Academy of Arts and Sciences, and the Board of Overseers of the School of Engineering and Applied Science of the University of Pennsylvania. Previously, Dr. Heilmeier served as a Director of TRW Inc. (automotive, space, defense, and information technology, 1992-2002), Compaq (1994-2002), Automatic Data Processing, Inc. (ADP) (technology-based business outsourcing, 1995-2002), INET Technologies Inc. (telecommunications network surveillance, 2001-2004), and Teletech Holdings (customer management services). He is the recipient of the 2005 Kyoto Prize in Advanced Technology for his invention of the liquid display. |
Marie L. Knowles (58) |
| Year of Election or Appointment: 2001 Prior to Ms. Knowles' retirement in June 2000, she served as Executive Vice President and Chief Financial Officer of Atlantic Richfield Company (ARCO) (diversified energy, 1996-2000). From 1993 to 1996, she was a Senior Vice President of ARCO and President of ARCO Transportation Company. She served as a Director of ARCO from 1996 to 1998. She currently serves as a Director of Phelps Dodge Corporation (copper mining and manufacturing) and McKesson Corporation (healthcare service, 2002-present). Ms. Knowles is a Trustee of the Brookings Institution and the Catalina Island Conservancy and also serves as a member of the Advisory Board for the School of Engineering of the University of Southern California. |
Ned C. Lautenbach (61) |
| Year of Election or Appointment: 2000 Mr. Lautenbach has been a partner of Clayton, Dubilier & Rice, Inc. (private equity investment firm) since September 1998. Previously, Mr. Lautenbach was with the International Business Machines Corporation (IBM) from 1968 until his retirement in 1998. Mr. Lautenbach serves as a Director of Italtel Holding S.p.A. (telecommunications (Milan, Italy), 2004-present) and Eaton Corporation (diversified industrial) as well as the Philharmonic Center for the Arts in Naples, Florida. He also is a member of the Board of Trustees of Fairfield University (2005-present), as well as a member of the Council on Foreign Relations. |
Marvin L. Mann (72) |
| Year of Election or Appointment: 1993 Mr. Mann is Chairman of the Independent Trustees (2001-present). He is Chairman Emeritus of Lexmark International, Inc. (computer peripherals), where he served as CEO until April 1998, retired as Chairman May 1999, and remains a member of the Board. Prior to 1991, he held the positions of Vice President of International Business Machines Corporation (IBM) and President and General Manager of various IBM divisions and subsidiaries. He is a member of the Executive Committee of the Independent Director's Council of the Investment Company Institute. In addition, Mr. Mann is a member of the President's Cabinet at the University of Alabama and the Board of Visitors of the Culverhouse College of Commerce and Business Administration at the University of Alabama. |
William O. McCoy (71) |
| Year of Election or Appointment: 1997 Prior to his retirement in December 1994, Mr. McCoy was Vice Chairman of the Board of BellSouth Corporation (telecommunications) and President of BellSouth Enterprises. He is currently a Director of Liberty Corporation (holding company), Duke Realty Corporation (real estate), and Progress Energy, Inc. (electric utility). He is also a partner of Franklin Street Partners (private investment management firm) and a member of the Research Triangle Foundation Board. In addition, Mr. McCoy served as the Interim Chancellor (1999-2000) and a member of the Board of Visitors for the University of North Carolina at Chapel Hill and currently serves on the Board of Directors of the University of North Carolina Health Care System and the Board of Visitors of the Kenan-Flagler Business School (University of North Carolina at Chapel Hill). He also served as Vice President of Finance for the University of North Carolina (16-school system). |
Cornelia M. Small (61) |
| Year of Election or Appointment: 2005 Ms. Small is a member (2000-present) and Chairperson (2002-present) of the Investment Committee, and a member (2002-present) of the Board of Trustees of Smith College. Previously, she served as Chief Investment Officer (1999-2000), Director of Global Equity Investments (1996-1999), and a member of the Board of Directors of Scudder, Stevens & Clark (1990-1997) and Scudder Kemper Investments (1997-1998). In addition, Ms. Small served as Co-Chair (2000-2003) of the Annual Fund for the Fletcher School of Law and Diplomacy. |
William S. Stavropoulos (66) |
| Year of Election or Appointment: 2002 Mr. Stavropoulos is Chairman of the Board (2000-present) and a Member of the Board of Directors of The Dow Chemical Company. Since joining The Dow Chemical Company in 1967, Mr. Stavropoulos served in numerous senior management positions, including President (1993-2000; 2002-2003), CEO (1995-2000; 2002-2004), and Chairman of the Executive Committee (2000-2004). Currently, he is a Director of NCR Corporation (data warehousing and technology solutions), BellSouth Corporation (telecommunications), Chemical Financial Corporation, Maersk Inc. (industrial conglomerate, 2002-present), and Metalmark Capital (private equity investment firm, 2005-present). He also serves as a member of the Board of Trustees of the American Enterprise Institute for Public Policy Research. In addition, Mr. Stavropoulos is a member of The Business Council, J.P. Morgan International Council and the University of Notre Dame Advisory Council for the College of Science. |
Kenneth L. Wolfe (66) |
| Year of Election or Appointment: 2005 Mr. Wolfe also serves as a Trustee (2005-present) or Member of the Advisory Board (2004-present) of other investment companies advised by FMR. Prior to his retirement in 2001, Mr. Wolfe was Chairman and Chief Executive Officer of Hershey Foods Corporation (1993-2001). He currently serves as a member of the boards of Adelphia Communications Corporation (2003-present), Bausch & Lomb, Inc., and Revlon Inc. (2004-present). |
Annual Report
Advisory Board Members and Executive Officers:
Correspondence intended for Mr. Gamper may be sent to Fidelity Investments, P.O. Box 55235, Boston, Massachusetts 02205-5235. Correspondence intended for each executive officer and Mr. Lynch may be sent to Fidelity Investments, 82 Devonshire Street, Boston, Massachusetts 02109.
Name, Age; Principal Occupation |
Albert R. Gamper, Jr. (63) |
| Year of Election or Appointment: 2005 Member of the Advisory Board of Fidelity Securities Fund. Prior to his retirement in December 2004, Mr. Gamper served as Chairman of the Board of CIT Group Inc. (commercial finance). During his tenure with CIT Group Inc. Mr. Gamper served in numerous senior management positions, including Chairman (1987-1989; 1999-2001; 2002-2004), Chief Executive Officer (1987-2004), and President (1989-2002). He currently serves as a member of the Board of Directors of Public Service Enterprise Group (utilities, 2001-present), Chairman of the Board of Governors, Rutgers University (2004-present), and Chairman of the Board of Saint Barnabas Health Care System. |
Peter S. Lynch (61) |
| Year of Election or Appointment: 2003 Member of the Advisory Board of Fidelity Securities Fund. Vice Chairman and a Director of FMR, and Vice Chairman (2001-present) and a Director (2000-present) of FMR Co., Inc. Previously, Mr. Lynch served as a Trustee of the Fidelity funds (1990-2003). In addition, he serves as a Trustee of Boston College, Massachusetts Eye & Ear Infirmary, Historic Deerfield, John F. Kennedy Library, and the Museum of Fine Arts of Boston. |
Dwight D. Churchill (51) |
| Year of Election or Appointment: 2005 Vice President of OTC. Mr. Churchill also serves as Vice President of certain Equity Funds (2005-present) and certain High Income Funds (2005-present). Previously, he served as Head of Fidelity's Fixed-Income Division (2000-2005), Vice President of Fidelity's Money Market Funds (2000-2005), Vice President of Fidelity's Bond Funds, and Senior Vice President of FIMM (2000) and FMR. Mr. Churchill joined Fidelity in 1993 as Vice President and Group Leader of Taxable Fixed-Income Investments. |
Eric D. Roiter (56) |
| Year of Election or Appointment: 1998 Secretary of OTC. He also serves as Secretary of other Fidelity funds; Vice President, General Counsel, and Secretary of FMR Co., Inc. (2001-present) and FMR; Assistant Secretary of Fidelity Management & Research (U.K.) Inc. (2001-present), Fidelity Management & Research (Far East) Inc. (2001-present), and Fidelity Investments Money Management, Inc. (2001-present). Mr. Roiter is an Adjunct Member, Faculty of Law, at Boston College Law School (2003-present). Previously, Mr. Roiter served as Vice President and Secretary of FDC (1998-2005). |
Stuart Fross (45) |
| Year of Election or Appointment: 2003 Assistant Secretary of OTC. Mr. Fross also serves as Assistant Secretary of other Fidelity funds (2003-present), Vice President and Secretary of FDC (2005-present), and is an employee of FMR. |
Christine Reynolds (46) |
| Year of Election or Appointment: 2004 President, Treasurer, and Anti-Money Laundering (AML) officer of OTC. Ms. Reynolds also serves as President, Treasurer, and AML officer of other Fidelity funds (2004) and is a Vice President (2003) and an employee (2002) of FMR. Before joining Fidelity Investments, Ms. Reynolds worked at PricewaterhouseCoopers LLP (PwC) (1980-2002), where she was most recently an audit partner with PwC's investment management practice. |
Timothy F. Hayes (54) |
| Year of Election or Appointment: 2002 Chief Financial Officer of OTC. Mr. Hayes also serves as Chief Financial Officer of other Fidelity funds (2002-present) and President of Fidelity Investment Operations (2005-present) which includes Fidelity Pricing and Cash Management Services Group (FPCMS), where he served as President (1998-2005). Mr. Hayes serves as President of Fidelity Service Company (2003-present) where he also serves as a Director. Mr. Hayes also served as President of Fidelity Investments Operations Group (FIOG, 2002-2005). |
Kenneth A. Rathgeber (58) |
| Year of Election or Appointment: 2004 Chief Compliance Officer of OTC. Mr. Rathgeber also serves as Chief Compliance Officer of other Fidelity funds (2004) and Executive Vice President of Risk Oversight for Fidelity Investments (2002). Previously, he served as Executive Vice President and Chief Operating Officer for Fidelity Investments Institutional Services Company, Inc. (1998-2002). |
John R. Hebble (47) |
| Year of Election or Appointment: 2003 Deputy Treasurer of OTC. Mr. Hebble also serves as Deputy Treasurer of other Fidelity funds (2003), and is an employee of FMR. Before joining Fidelity Investments, Mr. Hebble worked at Deutsche Asset Management where he served as Director of Fund Accounting (2002-2003) and Assistant Treasurer of the Scudder Funds (1998-2003). |
Bryan A. Mehrmann (44) |
| Year of Election or Appointment: 2005 Deputy Treasurer of OTC. Mr. Mehrmann also serves as Deputy Treasurer of other Fidelity funds (2005-present) and is an employee of FMR. Previously, Mr. Mehrmann served as Vice President of Fidelity Investments Institutional Services Group (FIIS)/Fidelity Investments Institutional Operations Corporation, Inc. (FIIOC) Client Services (1998-2004). |
Kimberley H. Monasterio (41) |
| Year of Election or Appointment: 2004 Deputy Treasurer of OTC. Ms. Monasterio also serves as Deputy Treasurer of other Fidelity funds (2004) and is an employee of FMR (2004). Before joining Fidelity Investments, Ms. Monasterio served as Treasurer (2000-2004) and Chief Financial Officer (2002-2004) of the Franklin Templeton Funds and Senior Vice President of Franklin Templeton Services, LLC (2000-2004). |
Kenneth B. Robins (35) |
| Year of Election or Appointment: 2005 Deputy Treasurer of OTC. Mr. Robins also serves as Deputy Treasurer of other Fidelity funds (2005-present) and is an employee of FMR (2004-present). Before joining Fidelity Investments, Mr. Robins worked at KPMG LLP, where he was a partner in KPMG's department of professional practice (2002-2004) and a Senior Manager (1999-2000). In addition, Mr. Robins served as Assistant Chief Accountant, United States Securities and Exchange Commission (2000-2002). |
Robert G. Byrnes (38) |
| Year of Election or Appointment: 2005 Assistant Treasurer of OTC. Mr. Byrnes also serves as Assistant Treasurer of other Fidelity funds (2005-present) and is an employee of FMR (2005-present). Previously, Mr. Byrnes served as Vice President of FPCMS (2003-2005). Before joining Fidelity Investments, Mr. Byrnes worked at Deutsche Asset Management where he served as Vice President of the Investment Operations Group (2000-2003). |
John H. Costello (58) |
| Year of Election or Appointment: 1986 Assistant Treasurer of OTC. Mr. Costello also serves as Assistant Treasurer of other Fidelity funds and is an employee of FMR. |
Peter L. Lydecker (51) |
| Year of Election or Appointment: 2004 Assistant Treasurer of OTC. Mr. Lydecker also serves as Assistant Treasurer of other Fidelity funds (2004) and is an employee of FMR. |
Mark Osterheld (50) |
| Year of Election or Appointment: 2002 Assistant Treasurer of OTC. Mr. Osterheld also serves as Assistant Treasurer of other Fidelity funds (2002) and is an employee of FMR. |
Gary W. Ryan (46) |
| Year of Election or Appointment: 2005 Assistant Treasurer of OTC. Mr. Ryan also serves as Assistant Treasurer of other Fidelity funds (2005-present) and is an employee of FMR (2005-present). Previously, Mr. Ryan served as Vice President of Fund Reporting in FPCMS (1999-2005). |
Salvatore Schiavone (39) |
| Year of Election or Appointment: 2005 Assistant Treasurer of OTC. Mr. Schiavone also serves as Assistant Treasurer of other Fidelity funds (2005-present) and is an employee of FMR (2005-present). Before joining Fidelity Investments, Mr. Schiavone worked at Deutsche Asset Management, where he most recently served as Assistant Treasurer (2003-2005) of the Scudder Funds and Vice President and Head of Fund Reporting (1996-2003). |
Annual Report
Distributions
The fund designates 100% of the dividends distributed in December during the fiscal year as qualifying for the dividends-received deduction for corporate shareholders.
The fund designates 100% of the dividends distributed in December during the fiscal year as amounts which may be taken into account as a dividend for the purposes of the maximum rate under section 1(h)(11) of the Internal Revenue Code.
The fund will notify shareholders in January 2006 of amounts for use in preparing 2005 income tax returns.
Annual Report
Board Approval of Investment Advisory Contracts and Management Fees
Fidelity OTC Portfolio
Each year, typically in July, the Board of Trustees, including the independent Trustees (together, the Board), votes on the renewal of the management contract and sub-advisory agreements (together, the Advisory Contracts) for the fund. The Board, assisted by the advice of fund counsel and independent Trustees' counsel, requests and considers a broad range of information throughout the year.
The Board meets regularly each month except August and takes into account throughout the year matters bearing on Advisory Contracts. The Board, acting directly and through its separate committees, considers at each of its meetings factors that are relevant to the annual renewal of the fund's Advisory Contracts, including the services and support provided to the fund and its shareholders by Fidelity. At the time of the renewal, the Board had 11 standing committees, each composed of independent Trustees with varying backgrounds, to which the Board has assigned specific subject matter responsibilities in order to enhance effective decision-making by the Board. Each committee has adopted a written charter outlining the structure and purposes of the committee. One such committee, the Equity Contract Committee, meets periodically during the first six months of each year and as necessary to consider matters specifically related to the annual renewal of Advisory Contracts. The committee requests and receives information on, and makes recommendations to the independent Trustees concerning, the approval and annual review of the Advisory Contracts.
At its July 2005 meeting, the Board of Trustees, including the independent Trustees, unanimously determined to renew the Advisory Contracts for the fund. In reaching its determination, the Board considered all factors it believed relevant, including (1) the nature, extent, and quality of the services to be provided to the fund and its shareholders by Fidelity (including the investment performance of the fund); (2) the competitiveness of the management fee and total expenses of the fund; (3) the total costs of the services to be provided by and the profits to be realized by the investment adviser and its affiliates from the relationship with the fund; (4) the extent to which economies of scale would be realized as the fund grows; and (5) whether fee levels reflect these economies of scale, if any, for the benefit of fund shareholders.
In determining whether to renew the Advisory Contracts for the fund, the Board ultimately reached a determination, with the assistance of fund counsel and independent Trustees' counsel, that the renewal of the Advisory Contracts and the compensation to be received by Fidelity under the management contract is consistent with Fidelity's fiduciary duty under applicable law. In addition to evaluating the specific factors noted above, the Board, in reaching its determination, is aware that shareholders in the fund have a broad range of investment choices available to them, including a wide choice among mutual funds offered by competitors to Fidelity, and that the fund's shareholders, with the opportunity to review and weigh the disclosure provided by the fund in its prospectus and other public disclosures, have chosen to invest in this fund, managed by Fidelity.
Annual Report
Nature, Extent, and Quality of Services Provided by Fidelity. The Board considered staffing within the investment adviser, FMR, and the sub-advisers (together, the Investment Advisers), including the background of the fund's portfolio manager and the fund's investment objective and discipline. The independent Trustees also had discussions with senior management of Fidelity's investment operations and investment groups. The Board considered the structure of the portfolio manager compensation program and whether this structure provides appropriate incentives.
Fidelity Resources Dedicated to Investment Management and Support Services. The Board reviewed the size, education, and experience of the Investment Advisers' investment staff, their use of technology, and the Investment Advisers' approach to recruiting, training, and retaining portfolio managers and other research, advisory, and management personnel. The Board considered Fidelity's extensive global research capabilities that enable the Investment Advisers to aggregate data from various sources in an effort to produce positive investment results. The Board noted that Fidelity's analysts have access to a variety of technological tools that enable them to perform both fundamental and quantitative analysis and to specialize in various disciplines. The Board also considered that Fidelity's portfolio managers and analysts have access to daily portfolio attribution that allows for monitoring of a fund's portfolio, as well as an electronic communication system that provides immediate real-time access to research concerning issuers and credit enhancers.
Shareholder and Administrative Services. The Board considered the nature, extent, quality, and cost of administrative, distribution, and shareholder services performed by the Investment Advisers and their affiliates under the Advisory Contracts and under separate agreements covering transfer agency, pricing and bookkeeping, and securities lending services for the fund. The Board also considered the nature and extent of the Investment Advisers' supervision of third party service providers, principally custodians and subcustodians. The Board reviewed the allocation of fund brokerage, including allocations to brokers affiliated with the Investment Advisers, the use of brokerage commissions to pay fund expenses, and the use of "soft" commission dollars to pay for research services. The Board also considered that Fidelity voluntarily decided in 2004 to stop using "soft" commission dollars to pay for market data and, instead, to pay for that data out of its own resources. The Board also considered the resources devoted to, and the record of compliance with, the fund's compliance policies and procedures.
The Board noted that the growth of fund assets across the complex allows Fidelity to reinvest in the development of services designed to enhance the value or convenience of the Fidelity funds as investment vehicles. These services include 24-hour access to account information and market information through phone representatives and over the Internet, and investor education materials and asset allocation tools.
Annual Report
Board Approval of Investment Advisory Contracts and
Management Fees - continued
Investment in a Large Fund Family. The Board considered the benefits to shareholders of investing in a Fidelity fund, including the benefits of investing in a fund that is part of a large family of funds offering a variety of investment disciplines and providing for a large variety of mutual fund investor services. For example, fund shareholders are offered the privilege of exchanging shares of the fund for shares of other Fidelity funds, as set forth in the fund's prospectus, without paying a sales charge. The Board noted that, since the last Advisory Contract renewals in July 2004, Fidelity has taken a number of actions that benefited particular funds, including (i) voluntarily deciding in 2004 to stop using "soft" commission dollars to pay for market data and, instead, to pay for that data out of its own resources, (ii) contractually agreeing to impose management fee reductions and expense limitations on its five Spartan stock index funds and its stock index fund available through variable insurance products, (iii) contractually agreeing to eliminate the management fees on the Fidelity Freedom Funds and the Fidelity Advisor Freedom Funds, (iv) contractually agreeing to reduce the management fees on most of its investment-grade taxable bond funds, and (v) contractually agreeing to impose expense limitations on its retail and Spartan investment-grade taxable bond funds.
Investment Performance and Compliance. The Board considered whether the fund has operated within its investment objective, as well as its record of compliance with its investment restrictions. It also reviewed the fund's absolute investment performance, as well as the fund's relative investment performance measured against (i) a broad-based securities market index, and (ii) a peer group of mutual funds deemed appropriate by the Board over multiple periods. The following charts considered by the Board show, over the one-, three-, and five-year periods ended December 31, 2004, the fund's returns, the returns of a broad-based securities market index ("benchmark"), and a range of returns of a peer group of mutual funds identified by Lipper Inc. as having an investment objective similar to that of the fund. The box within each chart shows the 25th percentile return (bottom of box) and the 75th percentile return (top of box) of the Lipper peer group. Returns shown above the box are in the first quartile and returns shown below the box are in the fourth quartile. The percentage beaten number noted below each chart corresponds to the percentile box and represents the percentage of funds in the Lipper peer group whose performance was equal to or lower than that of the fund.
Annual Report
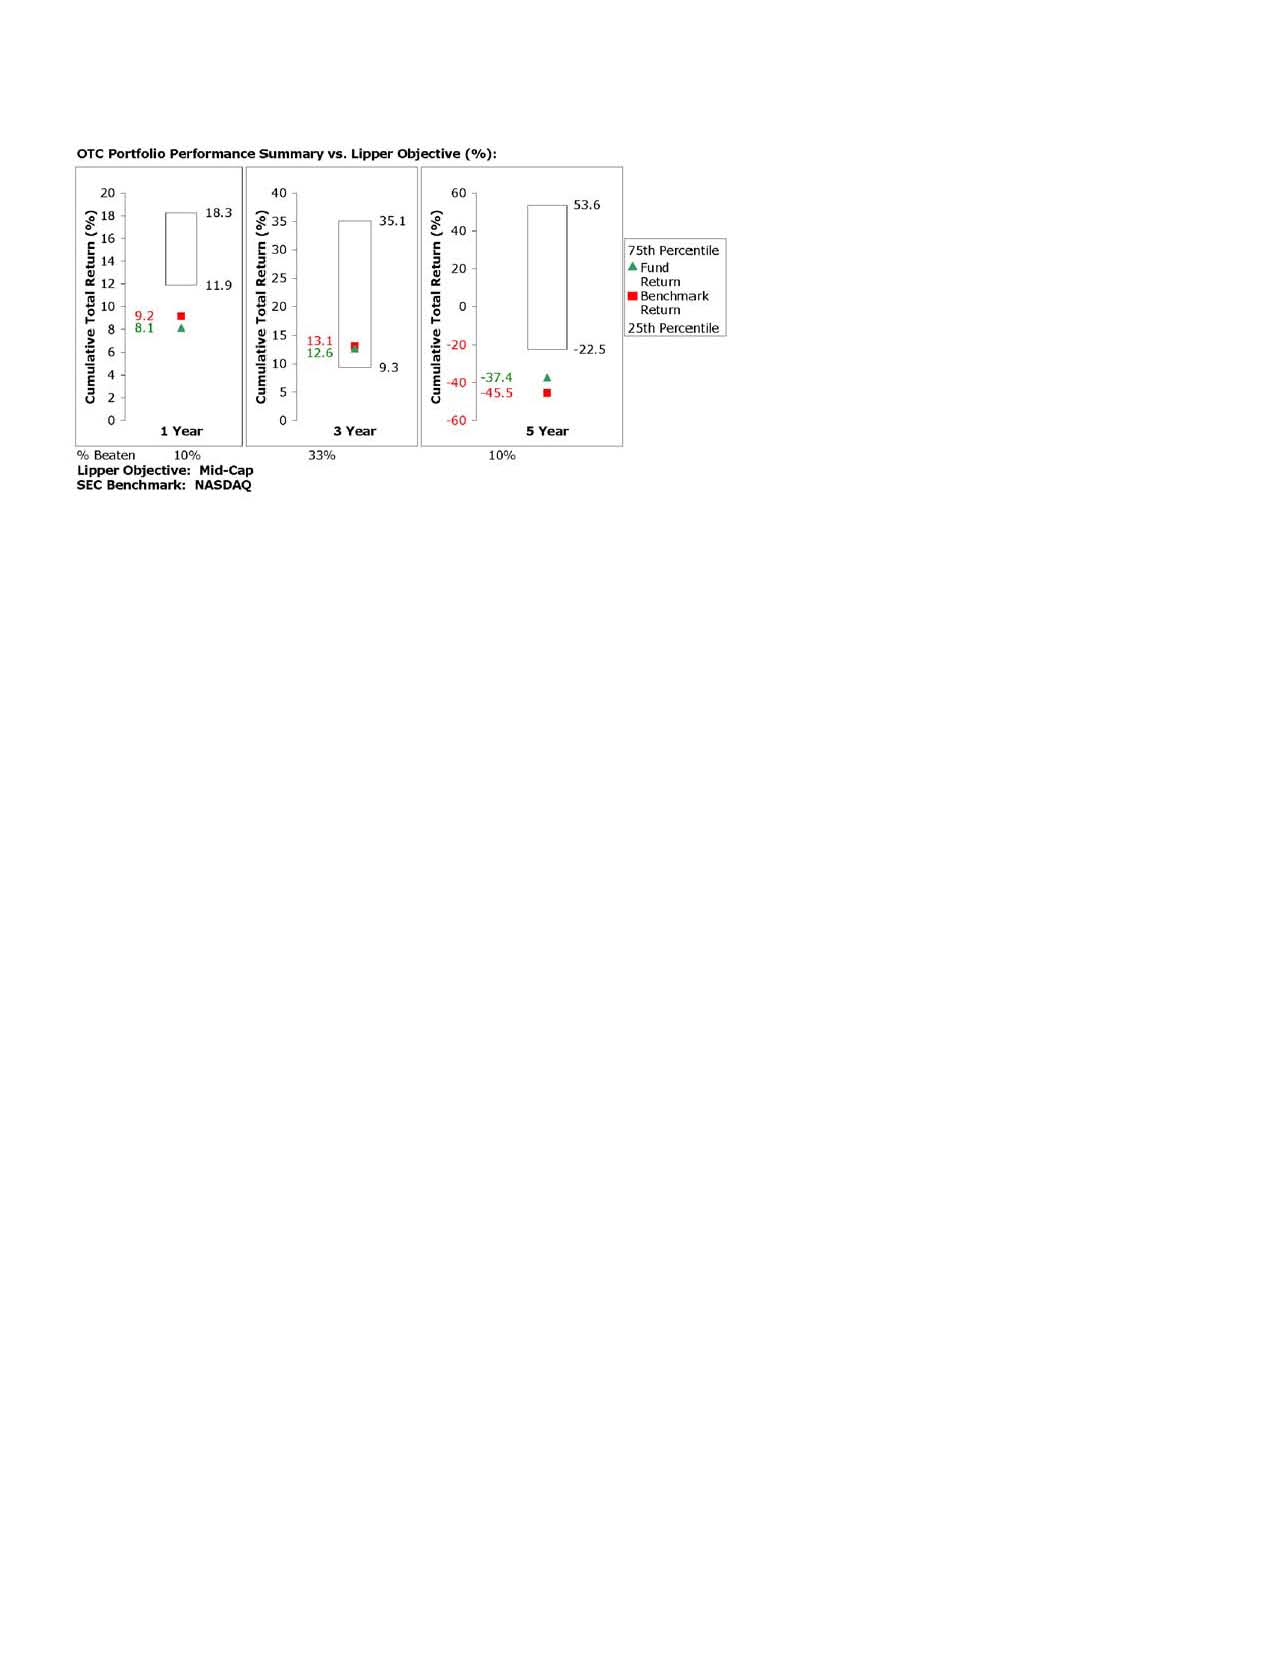
The Board reviewed the fund's relative investment performance against its Lipper peer group and stated that the performance of the fund was in the fourth quartile for the one- and five-year periods and the third quartile for the three-year period. The Board also stated that the relative investment performance of the fund was lower than its benchmark for certain periods, although the five-year cumulative total return of the fund was higher than its benchmark. The Board discussed with FMR actions to be taken by FMR to improve the fund's disappointing performance.
The Board also considered that the fund's management fee is subject to upward or downward adjustment depending upon whether, and to what extent, the fund's investment performance for the performance period exceeds, or is exceeded by, the record (over the same period) of a Board-approved performance adjustment index. The Board realizes that the performance adjustment provides FMR with a strong economic incentive to seek to achieve superior performance for the fund's shareholders and helps to more closely align the interests of FMR and the fund's shareholders.
The Board has had thorough discussions with FMR throughout the year about the Board's and FMR's concerns about equity research, equity fund performance, and compliance with internal policies governing gifts and entertainment. FMR has taken steps that it believes will refocus and strengthen equity research and equity portfolio management and compliance. The Board noted with favor FMR's recent reorganization of its senior management team and FMR's plans to dedicate additional resources to investment research, and participated in the process that led to those changes.
Based on its review, and giving particular weight to the nature and quality of the resources dedicated by the Investment Advisers to maintain and improve relative performance, the Board concluded that the nature, extent, and quality of the services provided by Fidelity will benefit the fund's shareholders, particularly in light of the Board's view that the fund's shareholders benefit from investing in a fund that is part of a large family of funds offering a variety of investment disciplines and services.
Annual Report
Board Approval of Investment Advisory Contracts and
Management Fees - continued
Competitiveness of Management Fee and Total Fund Expenses. The Board considered the fund's management fee and total expenses compared to "mapped groups" of competitive funds and classes. Fidelity creates "mapped groups" by combining similar Lipper investment objective categories that have comparable management fee characteristics. Combining Lipper investment objective categories aids the Board's management fee and total expense comparisons by broadening the competitive group used for comparison and by reducing the number of universes to which various Fidelity funds are compared.
The Board considered two proprietary management fee comparisons for the 12-month periods shown in the chart below. The group of Lipper funds used by the Board for management fee comparisons is referred to below as the "Total Mapped Group" and, for the reasons explained above, is broader than the Lipper peer group used by the Board for performance comparisons. The Total Mapped Group comparison focuses on a fund's standing relative to the total universe of comparable funds available to investors, in terms of gross management fees before expense reimbursements or caps. "TMG %" represents the percentage of funds in the Total Mapped Group that had management fees that were lower than the fund's. For example, a TMG % of 22% means that 78% of the funds in the Total Mapped Group had higher management fees than the fund. The "Asset-Size Peer Group" (ASPG) comparison focuses on a fund's standing relative to non-Fidelity funds similar in size to the fund within the Total Mapped Group. The ASPG represents at least 15% of the funds in the Total Mapped Group with comparable asset size and management fee characteristics, subject to a minimum of 50 funds (or all funds in the Total Mapped Group if fewer than 50). Additional information, such as the ASPG quartile ("quadrant") in which the fund's management fee ranked and the impact of the fund's performance adjustment, is also included in the chart and considered by the Board.
Annual Report
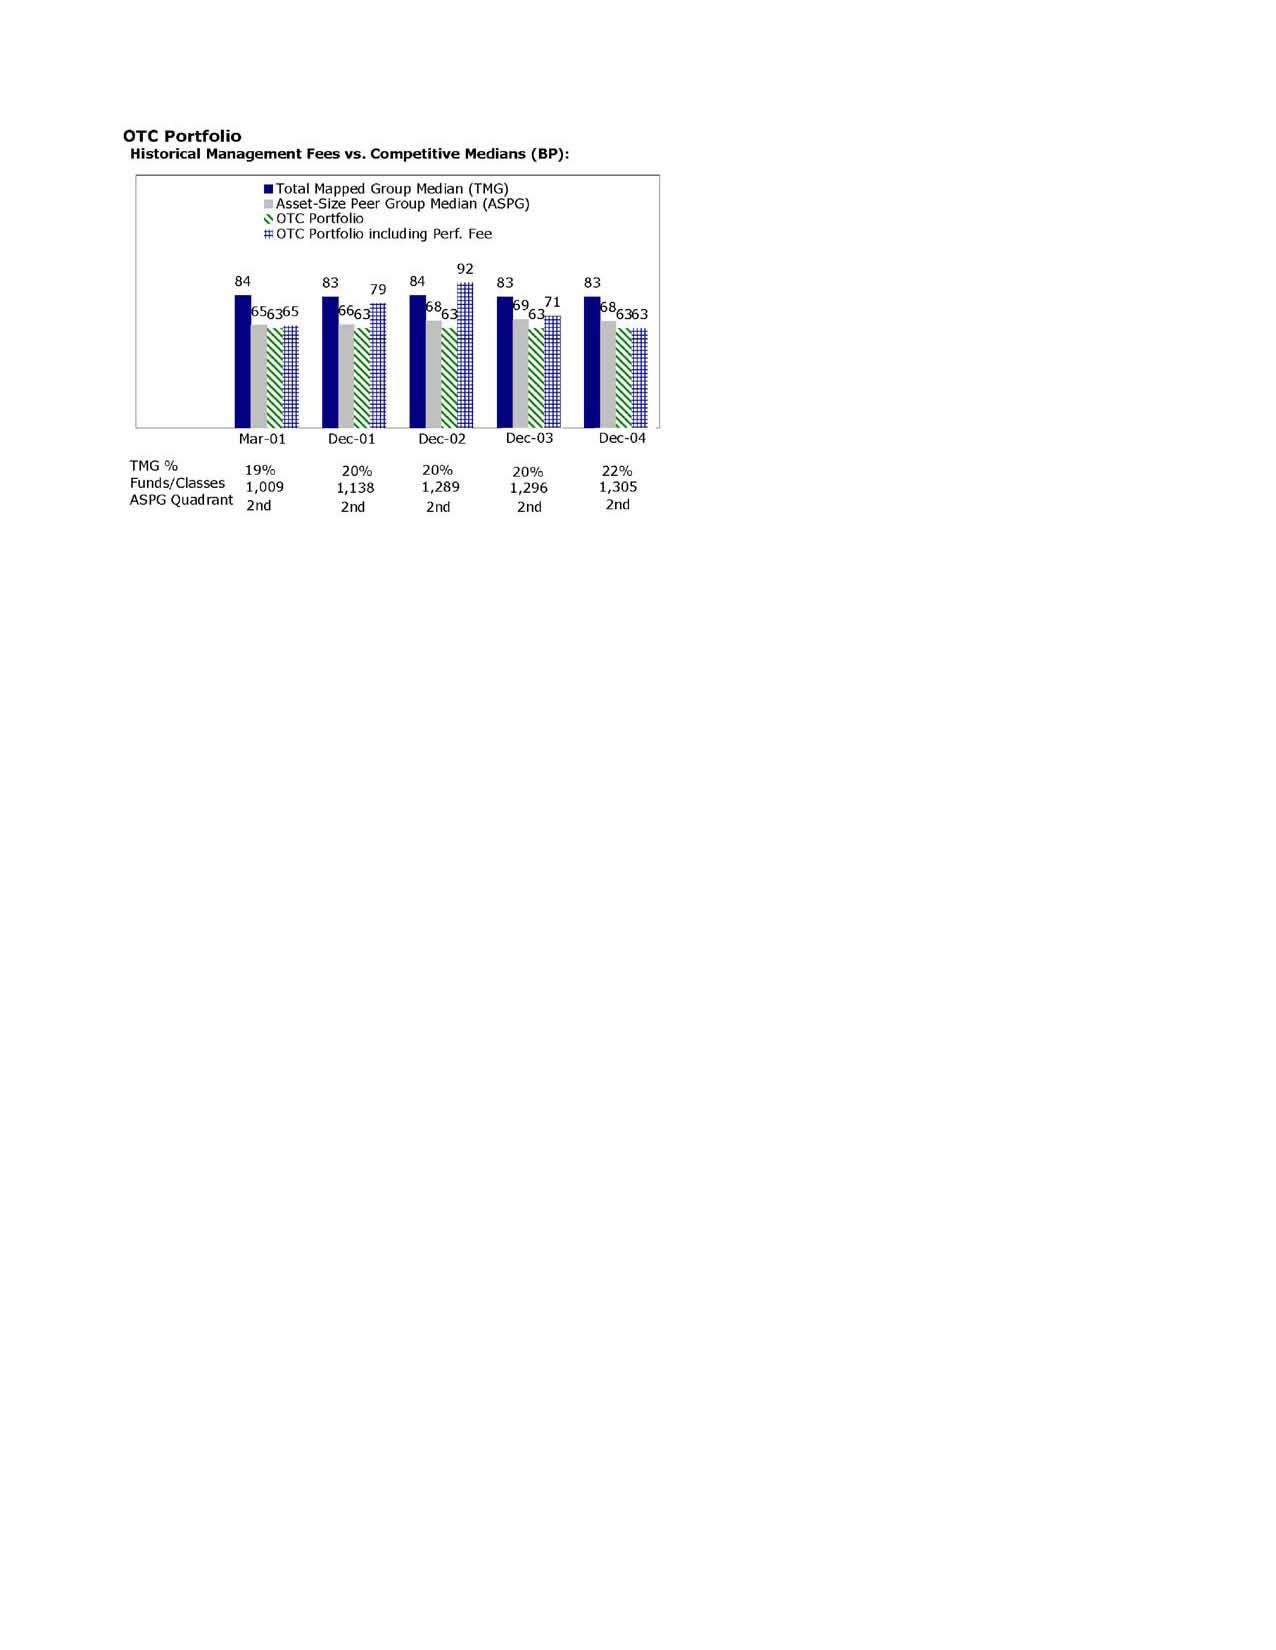
The Board noted that the fund's management fee ranked below the median of its Total Mapped Group and below the median of its ASPG for 2004. The Board also noted the effect of the fund's positive performance adjustment on the fund's management fee ranking.
Based on its review, the Board concluded that the fund's management fee was fair and reasonable in light of the services that the fund receives and the other factors considered.
In its review of the fund's total expenses, the Board considered the fund's management fee as well as other fund expenses, such as transfer agent fees, pricing and bookkeeping fees, and custodial, legal, and audit fees. The Board also noted the effects of any waivers and reimbursements on fees and expenses, as well as the fund's positive performance adjustment. As part of its review, the Board also considered current and historical total expenses of the fund compared to competitive fund median expenses. The fund is compared to those funds and classes in the Total Mapped Group (used by the Board for management fee comparisons) that have a similar sales load structure.
The Board noted that the fund's total expenses ranked below its competitive median for 2004.
In its review of total expenses, the Board also considered Fidelity fee structures and other information on clients that FMR and its affiliates service in other competitive markets, such as other mutual funds advised or subadvised by FMR or its affiliates, pension plan clients, and other institutional clients.
Annual Report
Board Approval of Investment Advisory Contracts and
Management Fees - continued
Based on its review, the Board concluded that the fund's total expenses were reasonable in light of the services that the fund and its shareholders receive and the other factors considered.
Costs of the Services and Profitability. The Board considered the revenues earned and the expenses incurred by Fidelity in conducting the business of developing, marketing, distributing, managing, administering and servicing the fund and its shareholders. The Board also considered the level of Fidelity's profits in respect of all the Fidelity funds.
On an annual basis, FMR presents to the Board Fidelity's profitability for the fund. Fidelity calculates the profitability for each fund, as well as aggregate profitability for groups of Fidelity funds and all Fidelity funds, using a series of detailed revenue and cost allocation methodologies which originate with the audited books and records of Fidelity. The Audit Committee of the Board reviews any significant changes from the prior year's methodologies.
PricewaterhouseCoopers LLP (PwC), independent registered accounting firm and auditor to Fidelity and certain Fidelity funds, has been engaged annually by the Board as part of the Board's assessment of the results of Fidelity's profitability analysis. PwC's engagement includes the review and assessment of Fidelity's methodologies used in determining the revenues and expenses attributable to Fidelity's mutual fund business, and completion of agreed-upon procedures surrounding the mathematical accuracy of fund profitability and its conformity to allocation methodologies. After considering PwC's reports issued under the engagement and information provided by Fidelity, the Board believes that while other allocation methods may also be reasonable, Fidelity's profitability methodologies are reasonable in all material respects.
The Board has also reviewed Fidelity's non-fund businesses and any fall-out benefits related to the mutual fund business as well as cases where Fidelity's affiliates may benefit from or be related to the fund's business. In addition, a special committee of the Board reviewed services provided to Fidelity by its affiliates and determined that the fees that Fidelity paid for such services were reasonable.
The Board considered the costs of the services provided by and the profits realized by Fidelity in connection with the operation of the fund and determined that the amount of profit is a fair entrepreneurial profit for the management of the fund.
Economies of Scale. The Board considered whether there have been economies of scale in respect of the management of the Fidelity funds, whether the Fidelity funds (including the fund) have appropriately benefited from any such economies of scale, and whether there is potential for realization of any further economies of scale. The Board considered the extent to which the fund will benefit from economies of scale through increased services to the fund, through waivers or reimbursements, or through fee or expense reductions, including reductions that occur through operation of the transfer agent agreement. The transfer agent fee varies in part based on the number of accounts in the fund. If the number of accounts decreases or the average account size increases, the overall transfer agent fee rate decreases.
Annual Report
The Board recognized that the fund's management contract incorporates a "group fee" structure, which provides for lower fee rates as total fund assets under FMR's management increase, and for higher fee rates as total fund assets under FMR's management decrease. The Board considered that the group fee is designed to deliver the benefits of economies of scale to fund shareholders when total fund assets increase, even if assets of any particular fund are unchanged or have declined, because some portion of Fidelity's costs are attributable to services provided to all Fidelity funds, and all funds benefit if those costs can be allocated among more assets. The Board concluded that, given the group fee structure, fund shareholders will achieve a certain level of economies of scale as assets under FMR's management increase at the fund complex level, regardless of whether Fidelity achieves any such economies of scale.
The Board further concluded that any potential economies of scale are being shared between fund shareholders and Fidelity in an appropriate manner.
Additional Information Requested by the Board. In order to develop fully the factual basis for consideration of the Advisory Contracts, the Board requested additional information regarding (i) equity fund transfer agency fees; (ii) Fidelity's fund profitability methodology and the impact of various changes in the methodology over time; (iii) benefits to shareholders from economies of scale; (iv) composition and characteristics of various fund and industry data used in comparisons; and (v) compensation of portfolio managers and research analysts.
Based on its evaluation of all of the conclusions noted above, and after considering all material factors, the Board ultimately concluded that the existing advisory fee structures are fair and reasonable, and that the fund's existing Advisory Contracts should be renewed.
Annual Report
Managing Your Investments
Fidelity offers several ways to conveniently manage your personal investments via your telephone or PC. You can access your account information, conduct trades and research your investments 24 hours a day.
By Phone
Fidelity Automated Service Telephone provides a single toll-free number to access account balances, positions, quotes and trading. It's easy to navigate the service, and on your first call, the system will help you create a personal identification number (PIN) for security.
(phone_graphic)
Fidelity Automated
Service Telephone (FAST®)
1-800-544-5555
Press
1 For mutual fund and brokerage trading.
2 For quotes.*
3 For account balances and holdings.
4 To review orders and mutual
fund activity.
5 To change your PIN.
*0 To speak to a Fidelity representative.
By PC
Fidelity's web site on the Internet provides a wide range of information, including daily financial news, fund performance, interactive planning tools and news about Fidelity products and services.
(computer_graphic)
Fidelity's Web Site
www.fidelity.com
* When you call the quotes line, please remember that a fund's yield and return will vary and, except for money market funds, share price will also vary. This means that you may have a gain or loss when you sell your shares. There is no assurance that money market funds will be able to maintain a stable $1 share price; an investment in a money market fund is not insured or guaranteed by the U.S. government. Total returns are historical and include changes in share price, reinvestment of dividends and capital gains, and the effects of any sales charges.
Annual Report
To Write Fidelity
We'll give your correspondence immediate attention and send you written confirmation upon completion of your request.
(letter_graphic)
Making Changes
To Your Account
(such as changing name, address, bank, etc.)
Fidelity Investments
P.O. Box 770001
Cincinnati, OH 45277-0002
(letter_graphic)
For Non-Retirement
Accounts
Buying shares
Fidelity Investments
P.O. Box 770001
Cincinnati, OH 45277-0003
Overnight Express
Fidelity Investments
Attn: Distribution Services
100 Crosby Parkway - KC1H
Covington, KY 41015
Selling shares
Fidelity Investments
P.O. Box 770001
Cincinnati, OH 45277-0035
Overnight Express
Fidelity Investments
Attn: Distribution Services
100 Crosby Parkway - KC1H
Covington, KY 41015
General Correspondence
Fidelity Investments
P.O. Box 500
Merrimack, NH 03054-0500
(letter_graphic)
For Retirement
Accounts
Buying shares
Fidelity Investments
P.O. Box 770001
Cincinnati, OH 45277-0003
Selling shares
Fidelity Investments
P.O. Box 770001
Cincinnati, OH 45277-0035
Overnight Express
Fidelity Investments
Attn: Distribution Services
100 Crosby Parkway - KC1H
Covington, KY 41015
General Correspondence
Fidelity Investments
P.O. Box 500
Merrimack, NH 03054-0500
Annual Report
To Visit Fidelity
For directions and hours,
please call 1-800-544-9797.
Arizona
7001 West Ray Road
Chandler, AZ
7373 N. Scottsdale Road
Scottsdale, AZ
California
815 East Birch Street
Brea, CA
1411 Chapin Avenue
Burlingame, CA
851 East Hamilton Avenue
Campbell, CA
19200 Von Karman Avenue
Irvine, CA
601 Larkspur Landing Circle
Larkspur, CA
10100 Santa Monica Blvd.
Los Angeles, CA
27101 Puerta Real
Mission Viejo, CA
73-575 El Paseo
Palm Desert, CA
251 University Avenue
Palo Alto, CA
123 South Lake Avenue
Pasadena, CA
16995 Bernardo Ctr. Drive
Rancho Bernardo, CA
1740 Arden Way
Sacramento, CA
7676 Hazard Center Drive
San Diego, CA
8 Montgomery Street
San Francisco, CA
3793 State Street
Santa Barbara, CA
21701 Hawthorne Boulevard
Torrance, CA
2001 North Main Street
Walnut Creek, CA
6300 Canoga Avenue
Woodland Hills, CA
Colorado
1625 Broadway
Denver, CO
9185 East Westview Road
Littleton, CO
Connecticut
48 West Putnam Avenue
Greenwich, CT
265 Church Street
New Haven, CT
300 Atlantic Street
Stamford, CT
29 South Main Street
West Hartford, CT
Delaware
222 Delaware Avenue
Wilmington, DE
Florida
4400 N. Federal Highway
Boca Raton, FL
121 Alhambra Plaza
Coral Gables, FL
2948 N. Federal Highway
Ft. Lauderdale, FL
1907 West State Road 434
Longwood, FL
8880 Tamiami Trail, North
Naples, FL
3550 Tamiami Trail, South
Sarasota, FL
1502 N. Westshore Blvd.
Tampa, FL
2465 State Road 7
Wellington, FL
3501 PGA Boulevard
West Palm Beach, FL
Georgia
3445 Peachtree Road, N.E.
Atlanta, GA
1000 Abernathy Road
Atlanta, GA
Illinois
One North LaSalle Street
Chicago, IL
875 North Michigan Ave.
Chicago, IL
1415 West 22nd Street
Oak Brook, IL
1700 East Golf Road
Schaumburg, IL
3232 Lake Avenue
Wilmette, IL
Indiana
4729 East 82nd Street
Indianapolis, IN
Kansas
5400 College Boulevard
Overland Park, KS
Maine
Three Canal Plaza
Portland, ME
Maryland
7315 Wisconsin Avenue
Bethesda, MD
One W. Pennsylvania Ave.
Towson, MD
Massachusetts
801 Boylston Street
Boston, MA
155 Congress Street
Boston, MA
300 Granite Street
Braintree, MA
44 Mall Road
Burlington, MA
405 Cochituate Road
Framingham, MA
416 Belmont Street
Worcester, MA
Michigan
500 E. Eisenhower Pkwy.
Ann Arbor, MI
280 Old N. Woodward Ave.
Birmingham, MI
43420 Grand River Avenue
Novi, MI
29155 Northwestern Hwy.
Southfield, MI
Minnesota
7600 France Avenue South
Edina, MN
Missouri
8885 Ladue Road
Ladue, MO
Annual Report
Nevada
2225 Village Walk Drive
Henderson, NV
New Jersey
150 Essex Street
Millburn, NJ
56 South Street
Morristown, NJ
396 Route 17, North
Paramus, NJ
3518 Route 1 North
Princeton, NJ
530 Highway 35
Shrewsbury, NJ
New York
1055 Franklin Avenue
Garden City, NY
37 West Jericho Turnpike
Huntington Station, NY
1271 Avenue of the Americas
New York, NY
61 Broadway
New York, NY
350 Park Avenue
New York, NY
200 Fifth Avenue
New York, NY
733 Third Avenue
New York, NY
11 Penn Plaza
New York, NY
2070 Broadway
New York, NY
1075 Northern Blvd.
Roslyn, NY
North Carolina
4611 Sharon Road
Charlotte, NC
Ohio
3805 Edwards Road
Cincinnati, OH
1324 Polaris Parkway
Columbus, OH
28699 Chagrin Boulevard
Woodmere Village, OH
Oregon
16850 SW 72nd Avenue
Tigard, OR
Pennsylvania
600 West DeKalb Pike
King of Prussia, PA
1735 Market Street
Philadelphia, PA
12001 Perry Highway
Wexford, PA
Rhode Island
47 Providence Place
Providence, RI
Tennessee
6150 Poplar Avenue
Memphis, TN
Texas
10000 Research Boulevard
Austin, TX
4001 Northwest Parkway
Dallas, TX
12532 Memorial Drive
Houston, TX
2701 Drexel Drive
Houston, TX
6500 N. MacArthur Blvd.
Irving, TX
6005 West Park Boulevard
Plano, TX
14100 San Pedro
San Antonio, TX
1576 East Southlake Blvd.
Southlake, TX
19740 IH 45 North
Spring, TX
Utah
215 South State Street
Salt Lake City, UT
Virginia
1861 International Drive
McLean, VA
Washington
411 108th Avenue, N.E.
Bellevue, WA
1518 6th Avenue
Seattle, WA
Washington, DC
1900 K Street, N.W.
Washington, DC
Wisconsin
595 North Barker Road
Brookfield, WI
Fidelity Brokerage Services, Inc., 100 Summer St., Boston, MA 02110 Member NYSE/SIPC
Annual Report
Annual Report
Annual Report
Investment Adviser
Fidelity Management & Research Company
Boston, MA
Investment Sub-Advisers
FMR Co., Inc.
Fidelity Management & Research
(Far East) Inc.
Fidelity Management & Research
(U.K.) Inc.
Fidelity Investments Japan Limited
Fidelity International Investments
Advisors
Fidelity International Investments
Advisors (U.K.) Limited
General Distributor
Fidelity Distributors Corporation
Boston, MA
Transfer and Service Agent
Fidelity Service Company, Inc.
Boston, MA
Custodian
Brown Brothers Harriman & Co.
Boston, MA
The Fidelity Telephone Connection
Mutual Fund 24-Hour Service
Exchanges/Redemptions
and Account Assistance 1-800-544-6666
Product Information 1-800-544-6666
Retirement Accounts 1-800-544-4774
(8 a.m. - 9 p.m.)
TDD Service 1-800-544-0118
for the deaf and hearing impaired
(9 a.m. - 9 p.m. Eastern time)
Fidelity Automated Service
Telephone (FAST®) (automated graphic) 1-800-544-5555
(automated graphic) Automated line for quickest service
OTC-UANN-0905
1.789250.102
Fidelity®
Real Estate Income
Fund
Annual Report
July 31, 2005
(2_fidelity_logos) (Registered_Trademark)
Contents
Chairman's Message | <Click Here> | Ned Johnson's message to shareholders. |
Performance | <Click Here> | How the fund has done over time. |
Management's Discussion | <Click Here> | The manager's review of fund performance, strategy and outlook. |
Shareholder Expense Example | <Click Here> | An example of shareholder expenses. |
Investment Changes | <Click Here> | A summary of major shifts in the fund's investments over the past six months. |
Investments | <Click Here> | A complete list of the fund's investments with their market values. |
Financial Statements | <Click Here> | Statements of assets and liabilities, operations, and changes in net assets,
as well as financial highlights. |
Notes | <Click Here> | Notes to the financial statements. |
Report of Independent Registered Public Accounting Firm | <Click Here> | |
Trustees and Officers | <Click Here> | |
Distributions | <Click Here> | |
Board Approval of Investment Advisory Contracts and Management Fees | <Click Here> | |
Central Fund Investments | <Click Here> | Complete list of investments for Fidelity's fixed-income central funds. |
To view a fund's proxy voting guidelines and proxy voting record for the 12-month period ended June 30, visit www.fidelity.com/proxyvotingresults or visit the Securities and Exchange Commission's (SEC) web site at www.sec.gov. You may also call 1-800-544-8544 to request a free copy of the proxy voting guidelines.
Standard & Poor's, S&P and S&P 500 are registered service marks of The McGraw-Hill Companies, Inc. and have been licensed for use by Fidelity Distributors Corporation.
Other third party marks appearing herein are the property of their respective owners.
All other marks appearing herein are registered or unregistered trademarks or service marks of FMR Corp. or an affiliated company.
This report and the financial statements contained herein are submitted for the general information of the shareholders of the fund. This report is not authorized for distribution to prospective investors in the fund unless preceded or accompanied by an effective prospectus.
A fund files its complete schedule of portfolio holdings with the SEC for the first and third quarters of each fiscal year on Form N-Q. Forms N-Q are available on the SEC's web site at http://www.sec.gov. A fund's Forms N-Q may be reviewed and copied at the SEC's Public Reference Room in Washington, DC. Information regarding the operation of the SEC's Public Reference Room may be obtained by calling 1-800-SEC-0330. For a complete list of a fund's portfolio holdings, view the most recent quarterly holdings report, semiannual report, or annual report on Fidelity's web site at http://www.fidelity.com/holdings.
NOT FDIC INSURED · MAY LOSE VALUE · NO BANK GUARANTEE
Neither the fund nor Fidelity Distributors Corporation is a bank.
Annual Report
Chairman's Message
(photo_of_Edward_C_Johnson_3d)
Dear Shareholder:
During the past year or so, much has been reported about the mutual fund industry, and much of it has been more critical than I believe is warranted. Allegations that some companies have been less than forthright with their shareholders have cast a shadow on the entire industry. I continue to find these reports disturbing, and assert that they do not create an accurate picture of the industry overall. Therefore, I would like to remind everyone where Fidelity stands on these issues. I will say two things specifically regarding allegations that some mutual fund companies were in violation of the Securities and Exchange Commission's forward pricing rules or were involved in so-called "market timing" activities.
First, Fidelity has no agreements that permit customers who buy fund shares after 4 p.m. to obtain the 4 p.m. price. This is not a new policy. This is not to say that someone could not deceive the company through fraudulent acts. However, we are extremely diligent in preventing fraud from occurring in this manner - and in every other. But I underscore again that Fidelity has no so-called "agreements" that sanction illegal practices.
Second, Fidelity continues to stand on record, as we have for years, in opposition to predatory short-term trading that adversely affects shareholders in a mutual fund. Back in the 1980s, we initiated a fee - which is returned to the fund and, therefore, to investors - to discourage this activity. Further, we took the lead several years ago in developing a Fair Value Pricing Policy to prevent market timing on foreign securities in our funds. I am confident we will find other ways to make it more difficult for predatory traders to operate. However, this will only be achieved through close cooperation among regulators, legislators and the industry.
Yes, there have been unfortunate instances of unethical and illegal activity within the mutual fund industry from time to time. That is true of any industry. When this occurs, confessed or convicted offenders should be dealt with appropriately. But we are still concerned about the risk of over-regulation and the quick application of simplistic solutions to intricate problems. Every system can be improved, and we support and applaud well thought out improvements by regulators, legislators and industry representatives that achieve the common goal of building and protecting the value of investors' holdings.
For nearly 60 years, Fidelity has worked very hard to improve its products and service to justify your trust. When our family founded this company in 1946, we had only a few hundred customers. Today, we serve more than 18 million customers including individual investors and participants in retirement plans across America.
Let me close by saying that we do not take your trust in us for granted, and we realize that we must always work to improve all aspects of our service to you. In turn, we urge you to continue your active participation with your financial matters, so that your interests can be well served.
Best regards,
/s/Edward C. Johnson 3d
Edward C. Johnson 3d
Annual Report
Performance: The Bottom Line
Average annual total return reflects the change in the value of an investment, assuming reinvestment of the fund's dividend income and capital gains (the profits earned upon the sale of securities that have grown in value) and assuming a constant rate of performance each year. The $10,000 table and the fund's returns do not reflect the deduction of taxes that a shareholder would pay on fund distributions or the redemption of fund shares. During periods of reimbursement by Fidelity, a fund's total return will be greater than it would be had the reimbursement not occurred. How a fund did yesterday is no guarantee of how it will do tomorrow.
Average Annual Total Returns
Periods ended July 31, 2005 | Past 1
year | Life of
Fund A |
Fidelity Real Estate Income Fund | 12.90% | 13.82% |
A From February 4, 2003.
$10,000 Over Life of Fund
Let's say hypothetically that $10,000 was invested in Fidelity® Real Estate Income Fund on February 4, 2003, when the fund started. The chart shows how the value of your investment would have changed, and also shows how the Standard and Poor's 500SM Index performed over the same period.
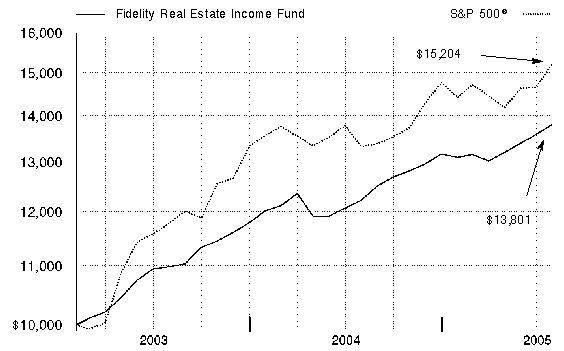
Annual Report
Management's Discussion of Fund Performance
Comments from Mark Snyderman, Portfolio Manager of Fidelity® Real Estate Income Fund
A late rally helped push some key U.S. equity indexes to four-year highs by the conclusion of the 12-month period ending July 31, 2005. Spurred on by bullish economic data and strong corporate earnings, investors enjoyed a good month of July. Also helping was the fact that the yield on the 10-year Treasury note declined from 4.50% to 4.28% in the 12-month period, much to the surprise of many observers. The Federal Reserve Board raised short-term interest rates eight times during the period, also affecting overall market sentiment. Despite their fluctuations, the major equity indexes finished on a high note, with the Standard & Poor's 500SM Index and the NASDAQ Composite® Index posting gains of 14.05% and 16.51%, respectively, for the period. The small-cap Russell 2000® Index rose 24.78% and the Russell Midcap® Index jumped 28.93%, while the blue-chips' Dow Jones Industrial AverageSM advanced only 7.29%.
The fund gained 12.90% during the past 12 months, solidly outpacing the Fidelity Real Estate Income Composite Index - a 50/50 blend of the Morgan Stanley® REIT Preferred Index and the Merrill Lynch® Real Estate Corporate Bond Index - which returned 7.61%. The fund trailed its peer group average, the LipperSM Real Estate Funds Average, which gained 39.86%, and the broader stock market, as measured by the S&P 500®. The portfolio generally benefited from positive real estate and capital market fundamentals. Real estate common stock appreciation and credit upgrades in some of our bond holdings were significant contributors to performance both on an absolute basis and relative to the composite index. The fund was helped by its common stock holdings in General Growth Properties, which benefited from the company's growth prospects and progress in reducing its debt leverage. Another fund holding, a CBMS created by J.P. Morgan - JPMC 97-C5 F - performed well as the security's credit quality improved. There were few significantly negative holdings during the period, but one laggard was an interest-only CMBS - CSFB 04-TFLA AX - that lost ground as the underlying commercial mortgages paid off too quickly to make this bond a good investment. Also detracting was my position in real estate investment trust (REIT) common stock Bimini Mortgage. This mortgage REIT underperformed as it faced greater competition.
The views expressed in this statement reflect those of the portfolio manager only through the end of the period of the report as stated on the cover and do not necessarily represent the views of Fidelity or any other person in the Fidelity organization. Any such views are subject to change at any time based upon market or other conditions and Fidelity disclaims any responsibility to update such views. These views may not be relied on as investment advice and, because investment decisions for a Fidelity fund are based on numerous factors, may not be relied on as an indication of trading intent on behalf of any Fidelity fund.
Annual Report
Shareholder Expense Example
As a shareholder of the Fund, you incur two types of costs: (1) transaction costs, including redemption fees, and (2) ongoing costs, including management fees and other Fund expenses. This Example is intended to help you understand your ongoing costs (in dollars) of investing in the Fund and to compare these costs with the ongoing costs of investing in other mutual funds.
The Example is based on an investment of $1,000 invested at the beginning of the period and held for the entire period (February 1, 2005 to July 31, 2005).
Actual Expenses
The first line of the table below provides information about actual account values and actual expenses. You may use the information in this line, together with the amount you invested, to estimate the expenses that you paid over the period. Simply divide your account value by $1,000.00 (for example, an $8,600 account value divided by $1,000.00 = 8.6), then multiply the result by the number in the first line under the heading entitled "Expenses Paid During Period" to estimate the expenses you paid on your account during this period. A small balance maintenance fee of $12.00 that is charged once a year may apply for certain accounts with a value of less than $2,000. This fee is not included in the table below. If it was, the estimate of expenses you paid during the period would be higher, and your ending account value lower, by this amount.
Hypothetical Example for Comparison Purposes
The second line of the table below provides information about hypothetical account values and hypothetical expenses based on the Fund's actual expense ratio and an assumed rate of return of 5% per year before expenses, which is not the Fund's actual return. The hypothetical account values and expenses may not be used to estimate the actual ending account balance or expenses you paid for the period. You may use this information to compare the ongoing costs of investing in the Fund and other funds. To do so, compare this 5% hypothetical example with the 5% hypothetical examples that appear in the shareholder reports of the other funds. A small balance maintenance fee of $12.00 that is charged once a year may apply for certain accounts with a value of less than $2,000. This fee is not included in the table below. If it was, the estimate of expenses you paid during the period would be higher, and your ending account value lower, by this amount.
Please note that the expenses shown in the table are meant to highlight your ongoing costs only and do not reflect any transaction costs. Therefore, the second line of the table is useful in comparing ongoing costs only, and will not help you determine the relative total costs of owning different funds. In addition, if these transactional costs were included, your costs would have been higher.
| Beginning
Account Value
February 1, 2005 | Ending
Account Value
July 31, 2005 | Expenses Paid
During Period*
February 1, 2005
to July 31, 2005 |
Actual | $ 1,000.00 | $ 1,053.30 | $ 4.33 |
Hypothetical (5% return per year before expenses) | $ 1,000.00 | $ 1,020.58 | $ 4.26 |
* Expenses are equal to the Fund's annualized expense ratio of .85%; multiplied by the average account value over the period, multiplied by 181/365 (to reflect the one-half year period).
Annual Report
Investment Changes
Top Five Stocks as of July 31, 2005 |
| % of fund's
net assets | % of fund's net assets
6 months ago |
General Growth Properties, Inc. | 0.9 | 0.6 |
MFA Mortgage Investments, Inc. Series A, 8.50% | 0.8 | 0.9 |
Annaly Mortgage Management, Inc. Series A, 7.875% | 0.8 | 0.9 |
Windrose Medical Properties Trust 7.50% | 0.8 | 0.0 |
Apartment Investment & Management Co. Series T, 8.00% | 0.8 | 0.9 |
| 4.1 | |
Top Five Bonds as of July 31, 2005 |
(with maturities greater than one year) | % of fund's
net assets | % of fund's net assets
6 months ago |
J.P. Morgan Commercial Mortgage Finance Corp. Series 1997-C5 Class F, 7.5605% 9/15/2029 | 1.0 | 1.1 |
Taberna Preferred Funding II Ltd./Taberna Preferred Funding II, Inc. Series 2005-2A Class E1, 6.449% 11/5/35 | 0.6 | 0.0 |
MeriStar Hospitality Corp. 9% 1/15/08 | 0.6 | 0.7 |
Banc of America Large Loan, Inc. floater Series 2003-BBA2 Class A3, 3.7081% 11/15/2015 | 0.6 | 0.7 |
Wrightwood Capital LLC 9% 6/1/14 | 0.6 | 0.0 |
| 3.4 | |
Top Five REIT Sectors as of July 31, 2005 |
| % of fund's
net assets | % of fund's net assets
6 months ago |
REITs - Management/Investment | 9.1 | 6.8 |
REITs - Mortgage | 8.7 | 10.2 |
REITs - Office Buildings | 6.7 | 7.5 |
REITs - Health Care Facilities | 6.9 | 6.3 |
REITs - Apartments | 6.9 | 6.6 |
Asset Allocation (% of fund's net assets) |
As of July 31, 2005 * | As of January 31, 2005 ** |
 | Stocks 45.9% | | | Stocks 45.0% | |
 | Bonds 43.4% | | | Bonds 45.1% | |
 | Convertible Securities 1.6% | | | Convertible Securities 0.8% | |
 | Other Investments 3.1% | | | Other Investments 3.3% | |
 | Short-Term
Investments and
Net Other Assets 6.0% | | | Short-Term
Investments and
Net Other Assets 5.8% | |
* Foreign investments | 3.1% | | ** Foreign investments | 1.4% | |

The information in the above tables is based on the combined investments of the fund and its pro-ratashare of the investments of Fidelity's fixed-income central fund. |
Annual Report
Investments July 31, 2005
Showing Percentage of Net Assets
Common Stocks - 16.6% |
| Shares | | Value (Note 1) |
CONSUMER DISCRETIONARY - 0.6% |
Hotels, Restaurants & Leisure - 0.1% |
Starwood Hotels & Resorts Worldwide, Inc. unit | 10,000 | | $ 633,200 |
Household Durables - 0.5% |
KB Home | 20,300 | | 1,662,773 |
Ryland Group, Inc. | 20,400 | | 1,648,320 |
| | 3,311,093 |
TOTAL CONSUMER DISCRETIONARY | | 3,944,293 |
FINANCIALS - 16.0% |
Capital Markets - 0.0% |
KKR Financial Corp. | 11,500 | | 281,520 |
Real Estate - 16.0% |
Acadia Realty Trust (SBI) | 145,600 | | 2,766,400 |
AMB Property Corp. (SBI) | 20,900 | | 961,191 |
American Campus Communities, Inc. | 39,900 | | 999,495 |
American Financial Realty Trust (SBI) | 153,400 | | 2,208,960 |
Anworth Mortgage Asset Corp. | 210,400 | | 1,977,760 |
Apartment Investment & Management Co. Class A | 16,200 | | 712,800 |
AvalonBay Communities, Inc. | 17,900 | | 1,567,324 |
Bimini Mortgage Management, Inc. | 80,700 | | 1,066,854 |
Boston Properties, Inc. | 27,700 | | 2,109,355 |
Capital Lease Funding, Inc. | 104,500 | | 1,149,500 |
CarrAmerica Realty Corp. | 51,300 | | 1,992,492 |
Catellus Development Corp. | 57,300 | | 2,066,238 |
CenterPoint Properties Trust (SBI) | 41,200 | | 1,807,032 |
DiamondRock Hospitality Co. | 142,400 | | 1,710,224 |
Digital Realty Trust, Inc. | 56,500 | | 1,070,110 |
Duke Realty Corp. | 78,800 | | 2,676,048 |
Eagle Hospitality Properties Trust, Inc. | 198,100 | | 2,028,544 |
Education Realty Trust, Inc. | 78,300 | | 1,552,689 |
Equity Lifestyle Properties, Inc. | 69,630 | | 3,068,594 |
Equity Residential (SBI) | 95,300 | | 3,850,120 |
Federal Realty Investment Trust (SBI) | 57,200 | | 3,735,732 |
Fieldstone Investment Corp. | 115,634 | | 1,692,882 |
General Growth Properties, Inc. | 134,640 | | 6,190,747 |
Glenborough Realty Trust, Inc. | 66,300 | | 1,389,648 |
GMH Communities Trust | 98,300 | | 1,473,517 |
Healthcare Realty Trust, Inc. | 35,900 | | 1,466,874 |
HomeBanc Mortgage Corp., Georgia | 251,900 | | 2,282,214 |
Host Marriott Corp. | 43,000 | | 801,950 |
Common Stocks - continued |
| Shares | | Value (Note 1) |
FINANCIALS - continued |
Real Estate - continued |
Inland Real Estate Corp. | 213,800 | | $ 3,546,942 |
Innkeepers USA Trust (SBI) | 108,200 | | 1,663,034 |
Kimco Realty Corp. | 61,500 | | 4,038,090 |
Lexington Corporate Properties Trust | 95,300 | | 2,285,294 |
MeriStar Hospitality Corp. (a) | 80,700 | | 719,844 |
MortgageIT Holdings, Inc. | 167,700 | | 3,291,951 |
Nationwide Health Properties, Inc. | 35,800 | | 897,864 |
New Century Financial Corp. | 17,100 | | 895,698 |
Newcastle Investment Corp. | 68,800 | | 2,125,920 |
Origen Financial, Inc. (d) | 100,000 | | 777,000 |
Plum Creek Timber Co., Inc. | 29,400 | | 1,112,790 |
ProLogis | 34,000 | | 1,549,040 |
Saxon Capital, Inc. | 32,700 | | 526,143 |
Simon Property Group, Inc. | 52,304 | | 4,170,721 |
Spirit Finance Corp. (d) | 200,000 | | 2,352,000 |
Spirit Finance Corp. | 311,000 | | 3,657,360 |
Sunstone Hotel Investors, Inc. | 60,500 | | 1,564,530 |
The Macerich Co. | 13,300 | | 933,926 |
Trizec Properties, Inc. | 113,900 | | 2,502,383 |
Trustreet Properties, Inc. | 121,700 | | 2,134,618 |
United Dominion Realty Trust, Inc. (SBI) | 103,400 | | 2,631,530 |
Ventas, Inc. | 102,900 | | 3,322,641 |
Vornado Realty Trust | 39,400 | | 3,492,416 |
| | 106,567,029 |
TOTAL FINANCIALS | | 106,848,549 |
TOTAL COMMON STOCKS (Cost $86,473,339) | 110,792,842 |
Preferred Stocks - 30.9% |
| | | |
Convertible Preferred Stocks - 1.6% |
FINANCIALS - 1.6% |
Real Estate - 1.6% |
Crescent Real Estate Equities Co. Series A, 6.75% | 17,700 | | 380,196 |
Equity Office Properties Trust Series B, 5.25% | 74,000 | | 3,855,400 |
Glenborough Realty Trust, Inc. Series A, 7.75% | 38,330 | | 985,081 |
Windrose Medical Properties Trust 7.50% | 200,000 | | 5,270,000 |
| | 10,490,677 |
Preferred Stocks - continued |
| Shares | | Value (Note 1) |
Nonconvertible Preferred Stocks - 29.3% |
CONSUMER DISCRETIONARY - 0.0% |
Hotels, Restaurants & Leisure - 0.0% |
Hilton Hotels Corp. 8.00% | 4,800 | | $ 126,096 |
FINANCIALS - 29.3% |
Diversified Financial Services - 0.5% |
Westcoast Hospitality Capital Trust 9.50% | 135,000 | | 3,597,750 |
Real Estate - 28.6% |
Accredited Mortgage Loan Trust Series A, 9.75% | 165,695 | | 4,419,086 |
Affordable Residential Communties, Inc. Series A, 8.25% | 184,000 | | 4,664,400 |
Alexandria Real Estate Equities, Inc.: | | | |
Series B, 9.10% | 101,200 | | 2,699,004 |
Series C, 8.375% | 65,000 | | 1,714,050 |
American Home Mortgage Investment Corp.: | | | |
Series A, 9.375% | 120,000 | | 3,246,000 |
Series B, 9.25% | 82,000 | | 2,171,360 |
Annaly Mortgage Management, Inc. Series A, 7.875% | 207,000 | | 5,297,130 |
Anthracite Capital, Inc. Series C, 9.375% | 46,000 | | 1,209,800 |
Anworth Mortgage Asset Corp. Series A, 8.625% | 187,827 | | 4,827,154 |
Apartment Investment & Management Co.: | | | |
Series G, 9.375% | 66,600 | | 1,773,558 |
Series Q, 10.10% | 82,490 | | 2,154,639 |
Series R, 10.00% | 96,800 | | 2,565,200 |
Series T, 8.00% | 204,400 | | 5,263,300 |
Series U, 7.75% | 48,812 | | 1,235,432 |
Series V, 8.00% | 40,000 | | 1,025,600 |
Series Y, 7.875% | 40,000 | | 1,018,000 |
Ashford Hospitality Trust, Inc. Series A, 8.55% | 100,000 | | 2,630,000 |
Bedford Property Investors, Inc.: | | | |
Series A, 8.75% (d) | 69,000 | | 3,652,170 |
Series B, 7.625% | 64,800 | | 1,636,200 |
Brandywine Realty Trust Series C, 7.50% | 10,000 | | 253,000 |
Capital Automotive (REIT) 6.75% | 163,000 | | 4,115,750 |
CBL & Associates Properties, Inc.: | | | |
(depositary shares) Series C, 7.75% | 28,600 | | 743,600 |
Series B, 8.75% | 60,000 | | 3,240,000 |
Cedar Shopping Centers, Inc. 8.875% | 110,000 | | 2,970,000 |
CenterPoint Properties Trust Series D, 5.377% | 4,100 | | 4,089,750 |
Colonial Properties Trust: | | | |
(depositary shares) Series D, 8.125% | 3,500 | | 90,825 |
Series C, 9.25% | 30,000 | | 783,000 |
Series E, 7.62% | 78,679 | | 1,937,077 |
Preferred Stocks - continued |
| Shares | | Value (Note 1) |
Nonconvertible Preferred Stocks - continued |
FINANCIALS - continued |
Real Estate - continued |
Commercial Net Lease Realty, Inc. Series A, 9.00% | 19,200 | | $ 513,792 |
Cousins Properties, Inc.: | | | |
Series A, 7.75% | 131,700 | | 3,350,448 |
Series B, 7.50% | 40,000 | | 1,018,000 |
Crescent Real Estate Equities Co. Series B, 9.50% | 3,900 | | 104,130 |
CRT Properties, Inc. Series A, 8.50% | 25,000 | | 631,250 |
Developers Diversified Realty Corp. (depositary shares): | | | |
Class F, 8.60% | 7,200 | | 189,936 |
Class G, 8.00% | 42,800 | | 1,115,796 |
Digital Realty Trust, Inc.: | | | |
Series A, 8.50% | 160,000 | | 4,220,800 |
Series B, 7.875% | 76,100 | | 2,007,518 |
Duke Realty Corp. (depositary shares) Series B, 7.99% | 74,700 | | 3,828,375 |
Eagle Hospitality Properties Trust, Inc. Series A, 8.25% | 184,000 | | 4,728,800 |
Eastgroup Properties, Inc. Series D, 7.95% | 103,900 | | 2,742,960 |
Entertainment Properties Trust Series A 9.50% | 40,000 | | 1,080,000 |
Equity Inns, Inc. Series B, 8.75% | 60,000 | | 1,591,800 |
Equity Residential Series B, 9.125% | 19,600 | | 498,036 |
Federal Realty Investment Trust Series B, 8.50% | 11,600 | | 302,876 |
FelCor Lodging Trust, Inc. 8.00% | 40,000 | | 972,000 |
Glimcher Realty Trust: | | | |
Series F, 8.75% | 62,000 | | 1,616,340 |
Series G, 8.125% | 127,000 | | 3,265,170 |
Health Care REIT, Inc.: | | | |
Series D, 7.875% | 30,000 | | 774,900 |
Series F, 7.625% | 36,700 | | 932,547 |
Hersha Hospitality Trust Series A 8.00% | 110,000 | | 2,750,000 |
Highwoods Properties, Inc.: | | | |
(depositary shares) Series D, 8.00% | 36,300 | | 908,226 |
Series A, 8.625% | 214 | | 214,000 |
Series B, 8.00% | 37,500 | | 953,250 |
Host Marriott Corp.: | | | |
Class C, 10.00% | 8,500 | | 221,425 |
Series E, 8.875% | 50,000 | | 1,377,500 |
HRPT Properties Trust: | | | |
Series A, 9.875% | 11,500 | | 294,975 |
Series B, 8.75% | 29,700 | | 802,791 |
Impac Mortgage Holdings, Inc. Series C, 9.125% | 150,000 | | 3,847,500 |
Innkeepers USA Trust Series C, 8.00% | 67,400 | | 1,735,550 |
Preferred Stocks - continued |
| Shares | | Value (Note 1) |
Nonconvertible Preferred Stocks - continued |
FINANCIALS - continued |
Real Estate - continued |
iStar Financial, Inc.: | | | |
Series D, 8.00% | 4,000 | | $ 101,920 |
Series E, 7.875% | 27,000 | | 702,000 |
Series F, 7.80% | 13,800 | | 353,418 |
Kilroy Realty Corp. Series E, 7.80% | 44,000 | | 1,122,440 |
La Quinta Properties, Inc. (depositary shares) Series A, 9.00% | 10,000 | | 257,000 |
LaSalle Hotel Properties: | | | |
Series A, 10.25% | 178,200 | | 4,811,400 |
Series B, 8.375% | 19,400 | | 510,220 |
Lexington Corporate Properties Trust Series B, 8.05% | 124,500 | | 3,224,550 |
LTC Properties, Inc. Series F, 8.00% | 79,300 | | 2,034,045 |
MFA Mortgage Investments, Inc. Series A, 8.50% | 209,400 | | 5,381,580 |
Mid-America Apartment Communities, Inc. Series H, 8.30% | 127,800 | | 3,379,032 |
Nationwide Health Properties, Inc. 7.677% | 36,939 | | 3,850,891 |
New Plan Excel Realty Trust (depositary shares) Series D, 7.80% | 25,106 | | 1,308,023 |
Newcastle Investment Corp. Series B, 9.75% | 163,700 | | 4,441,181 |
Omega Healthcare Investors, Inc. Series D, 8.375% | 159,800 | | 4,186,760 |
Parkway Properties, Inc. Series D, 8.00% | 165,000 | | 4,356,000 |
Prime Group Realty Trust(OLD) Series B, 9.00% | 60,000 | | 1,414,200 |
ProLogis Series C, 8.54% | 6,478 | | 403,660 |
PS Business Parks, Inc.: | | | |
(depositary shares) Series F, 8.75% | 21,500 | | 564,375 |
(depositary shares) Series L, 7.60% | 22,500 | | 574,200 |
Series D, 9.50% | 28,100 | | 731,162 |
RAIT Investment Trust: | | | |
Series A, 7.75% | 125,900 | | 3,175,198 |
Series B, 8.375% | 111,300 | | 2,893,800 |
Realty Income Corp. 8.25% | 76,800 | | 2,108,160 |
Saul Centers, Inc. 8.00% | 156,800 | | 4,126,976 |
Simon Property Group, Inc.: | | | |
Series G, 7.89% | 28,900 | | 1,560,600 |
Series J, 8.375% | 17,100 | | 1,171,350 |
SNH Capital Trust I Series Z, 10.125% | 43,300 | | 1,143,986 |
Strategic Hotel Capital, Inc. 8.50% (d) | 119,500 | | 3,151,813 |
Taubman Centers, Inc. Series A, 8.30% | 48,727 | | 1,242,539 |
The Mills Corp.: | | | |
Series B, 9.00% | 25,000 | | 657,500 |
Series C, 9.00% | 63,100 | | 1,664,578 |
Preferred Stocks - continued |
| Shares | | Value (Note 1) |
Nonconvertible Preferred Stocks - continued |
FINANCIALS - continued |
Real Estate - continued |
The Mills Corp.: - continued | | | |
Series E, 8.75% | 44,100 | | $ 1,180,998 |
Series G, 7.875% | 60,000 | | 1,539,000 |
United Dominion Realty Trust, Inc. Series B, 8.60% | 12,500 | | 333,750 |
Winston Hotels, Inc. Series B, 8.00% | 35,600 | | 906,020 |
| | 190,580,101 |
Thrifts & Mortgage Finance - 0.2% |
Fannie Mae 7.00% | 20,000 | | 1,112,000 |
TOTAL FINANCIALS | | 195,289,851 |
TOTAL NONCONVERTIBLE PREFERRED STOCKS | | 195,415,947 |
TOTAL PREFERRED STOCKS (Cost $199,383,477) | 205,906,624 |
Nonconvertible Bonds - 24.0% |
| Principal
Amount | | |
CONSUMER DISCRETIONARY - 3.8% |
Hotels, Restaurants & Leisure - 1.6% |
Felcor Lodging LP 9% 6/1/11 (e) | $ 1,500,000 | | 1,650,000 |
Hilton Hotels Corp. 7.625% 5/15/08 | 1,680,000 | | 1,810,200 |
HMH Properties, Inc. 7.875% 8/1/08 | 90,000 | | 91,125 |
Host Marriott LP: | | | |
7% 8/15/12 | 1,500,000 | | 1,563,750 |
7.125% 11/1/13 | 1,503,000 | | 1,572,589 |
John Q. Hammons Hotels LP/John Q. Hammons Hotels Corp. III 8.875% 5/15/12 | 2,080,000 | | 2,280,200 |
Landry's Seafood Restaurants, Inc. 7.5% 12/15/14 | 1,500,000 | | 1,483,125 |
| 10,450,989 |
Household Durables - 2.2% |
Beazer Homes USA, Inc. 8.375% 4/15/12 | 1,000,000 | | 1,080,000 |
D.R. Horton, Inc.: | | | |
4.875% 1/15/10 | 1,000,000 | | 980,000 |
9.375% 3/15/11 | 1,300,000 | | 1,391,000 |
K. Hovnanian Enterprises, Inc.: | | | |
6% 1/15/10 | 420,000 | | 416,850 |
Nonconvertible Bonds - continued |
| Principal
Amount | | Value (Note 1) |
CONSUMER DISCRETIONARY - continued |
Household Durables - continued |
K. Hovnanian Enterprises, Inc.: - continued | | | | |
7.75% 5/15/13 | | $ 2,000,000 | | $ 2,120,000 |
KB Home: | | | | |
5.875% 1/15/15 | | 1,000,000 | | 992,500 |
7.75% 2/1/10 | | 1,500,000 | | 1,588,125 |
Ryland Group, Inc. 9.125% 6/15/11 | | 1,000,000 | | 1,080,000 |
Standard Pacific Corp. 9.25% 4/15/12 | | 1,500,000 | | 1,672,500 |
WCI Communities, Inc.: | | | | |
7.875% 10/1/13 | | 370,000 | | 375,088 |
9.125% 5/1/12 | | 2,000,000 | | 2,110,000 |
William Lyon Homes, Inc. 7.5% 2/15/14 | | 1,000,000 | | 960,000 |
| | 14,766,063 |
TOTAL CONSUMER DISCRETIONARY | | 25,217,052 |
FINANCIALS - 19.0% |
Real Estate - 18.4% |
Ahold Lease Series 2001 A1 pass thru trust certificates 7.82% 1/2/20 | | 1,490,889 | | 1,587,796 |
AMB Property LP 7.2% 12/15/05 | | 1,080,000 | | 1,091,857 |
American Health Properties, Inc. 7.5% 1/15/07 | | 1,000,000 | | 1,036,640 |
American Real Estate Partners/American Real Estate Finance Corp.: | | | | |
7.125% 2/15/13 (d) | | 1,000,000 | | 1,000,000 |
8.125% 6/1/12 | | 3,190,000 | | 3,349,500 |
Archstone-Smith Trust 5% 8/15/07 | | 200,000 | | 202,145 |
Arden Realty LP: | | | | |
5.2% 9/1/11 | | 500,000 | | 496,359 |
7% 11/15/07 | | 1,000,000 | | 1,051,688 |
8.5% 11/15/10 | | 1,000,000 | | 1,155,891 |
Bay Apartment Communities, Inc. 6.625% 1/15/08 | | 840,000 | | 873,858 |
Brandywine Operating Partnership LP 4.5% 11/1/09 | | 1,000,000 | | 971,787 |
Camden Property Trust 4.375% 1/15/10 | | 2,370,000 | | 2,304,643 |
CarrAmerica Realty Corp.: | | | | |
3.625% 4/1/09 | | 1,000,000 | | 952,031 |
5.25% 11/30/07 | | 1,525,000 | | 1,532,788 |
CB Richard Ellis Services, Inc. 9.75% 5/15/10 | | 1,932,000 | | 2,144,520 |
Colonial Properties Trust: | | | | |
6.25% 6/15/14 | | 1,000,000 | | 1,035,118 |
7% 7/14/07 | | 1,000,000 | | 1,034,726 |
Nonconvertible Bonds - continued |
| Principal
Amount | | Value (Note 1) |
FINANCIALS - continued |
Real Estate - continued |
Commercial Net Lease Realty, Inc. 6.25% 6/15/14 | | $ 500,000 | | $ 516,337 |
Crescent Real Estate Equities LP 7.5% 9/15/07 (e) | | 1,500,000 | | 1,522,500 |
Crescent Real Estate Equities LP/Crescent Finance Co. 9.25% 4/15/09 | | 2,500,000 | | 2,612,500 |
Developers Diversified Realty Corp.: | | | | |
4.625% 8/1/10 | | 1,505,000 | | 1,469,211 |
5% 5/3/10 | | 1,000,000 | | 995,785 |
6.625% 1/15/08 | | 550,000 | | 570,735 |
7.5% 7/15/18 | | 200,000 | | 233,515 |
Duke Realty LP: | | | | |
5.25% 1/15/10 | | 200,000 | | 202,414 |
6.8% 2/12/09 | | 1,500,000 | | 1,591,428 |
EOP Operating LP: | | | | |
4.1044% 10/1/10 (e) | | 3,000,000 | | 3,022,650 |
8.375% 3/15/06 | | 1,000,000 | | 1,024,851 |
Evans Withycombe Residential LP 7.625% 4/15/07 | | 1,675,000 | | 1,744,638 |
Federal Realty Investment Trust 6.125% 11/15/07 | | 1,200,000 | | 1,231,708 |
First Industrial LP: | | | | |
5.25% 6/15/09 | | 1,000,000 | | 1,001,423 |
7.375% 3/15/11 | | 2,100,000 | | 2,288,536 |
7.6% 5/15/07 | | 1,000,000 | | 1,046,074 |
Gables Realty LP: | | | | |
5.75% 7/15/07 | | 2,000,000 | | 2,032,452 |
7.25% 2/15/06 | | 1,500,000 | | 1,522,874 |
Health Care REIT, Inc.: | | | | |
6% 11/15/13 | | 1,000,000 | | 1,008,199 |
7.5% 8/15/07 | | 450,000 | | 471,129 |
8% 9/12/12 | | 2,450,000 | | 2,804,231 |
Healthcare Realty Trust, Inc. 8.125% 5/1/11 | | 2,790,000 | | 3,133,692 |
Heritage Property Investment Trust, Inc. 4.5% 10/15/09 | | 1,500,000 | | 1,469,705 |
Highwoods/Forsyth LP: | | | | |
7% 12/1/06 | | 500,000 | | 513,122 |
7.125% 2/1/08 | | 950,000 | | 994,896 |
7.5% 4/15/18 | | 1,250,000 | | 1,368,311 |
Hospitality Properties Trust 6.75% 2/15/13 | | 1,610,000 | | 1,732,344 |
HRPT Properties Trust 6.5% 1/15/13 | | 200,000 | | 214,701 |
iStar Financial, Inc.: | | | | |
5.125% 4/1/11 | | 1,000,000 | | 988,410 |
6.5% 12/15/13 | | 1,000,000 | | 1,032,500 |
7% 3/15/08 | | 1,800,000 | | 1,887,750 |
Nonconvertible Bonds - continued |
| Principal
Amount | | Value (Note 1) |
FINANCIALS - continued |
Real Estate - continued |
Liberty Property LP 7.25% 8/15/07 | | $ 1,500,000 | | $ 1,567,991 |
Mack-Cali Realty LP 7.25% 3/15/09 | | 100,000 | | 107,045 |
MeriStar Hospitality Corp. 9% 1/15/08 | | 4,000,000 | | 4,180,000 |
MeriStar Hospitality Operating Partnership LP/MeriStar Hospitality Finance Corp. III 9.125% 1/15/11 | | 1,250,000 | | 1,325,000 |
Nationwide Health Properties, Inc.: | | | | |
6% 5/20/15 | | 2,000,000 | | 1,971,000 |
8.25% 7/1/12 | | 1,300,000 | | 1,442,581 |
Omega Healthcare Investors, Inc. 7% 4/1/14 | | 2,970,000 | | 3,021,975 |
Post Apartment Homes LP: | | | | |
5.125% 10/12/11 | | 1,500,000 | | 1,508,733 |
5.45% 6/1/12 | | 1,000,000 | | 994,570 |
7.7% 12/20/10 | | 2,500,000 | | 2,789,755 |
Price Development Co. LP 7.29% 3/11/08 | | 1,650,000 | | 1,744,875 |
ProLogis 7.1% 4/15/08 | | 775,000 | | 821,750 |
Reckson Operating Partnership LP 7.75% 3/15/09 | | 2,600,000 | | 2,825,831 |
Security Capital Industrial Trust 7.95% 5/15/08 | | 97,000 | | 101,804 |
Senior Housing Properties Trust: | | | | |
7.875% 4/15/15 | | 585,000 | | 630,338 |
8.625% 1/15/12 | | 2,500,000 | | 2,818,750 |
Shurgard Storage Centers, Inc. 5.875% 3/15/13 | | 1,000,000 | | 1,002,168 |
Simon Property Group LP 5.375% 8/28/08 | | 550,000 | | 560,657 |
Tanger Properties LP 9.125% 2/15/08 | | 300,000 | | 324,000 |
The Rouse Co.: | | | | |
3.625% 3/15/09 | | 1,000,000 | | 934,531 |
5.375% 11/26/13 | | 2,000,000 | | 1,895,110 |
7.2% 9/15/12 | | 3,220,000 | | 3,401,611 |
Thornburg Mortgage, Inc. 8% 5/15/13 | | 3,750,000 | | 3,843,750 |
Trustreet Properties, Inc. 7.5% 4/1/15 (d) | | 3,000,000 | | 3,082,500 |
United Dominion Realty Trust: | | | | |
5% 1/15/12 | | 1,000,000 | | 981,986 |
7.95% 7/12/06 | | 2,200,000 | | 2,263,078 |
United Dominion Realty Trust, Inc. 6.5% 6/15/09 | | 325,000 | | 343,180 |
Ventas Realty LP/Ventas Capital Corp.: | | | | |
6.625% 10/15/14 | | 1,670,000 | | 1,711,750 |
6.625% 10/15/14 (d) | | 500,000 | | 512,500 |
6.75% 6/1/10 (d) | | 2,000,000 | | 2,085,000 |
8.75% 5/1/09 | | 800,000 | | 884,000 |
9% 5/1/12 | | 2,961,000 | | 3,434,760 |
Nonconvertible Bonds - continued |
| Principal
Amount | | Value (Note 1) |
FINANCIALS - continued |
Real Estate - continued |
Vornado Realty LP 4.5% 8/15/09 | | $ 1,000,000 | | $ 979,781 |
Vornado Realty Trust 5.625% 6/15/07 | | 2,700,000 | | 2,732,767 |
| | 122,895,095 |
Thrifts & Mortgage Finance - 0.6% |
Wrightwood Capital LLC 9% 6/1/14 (h) | | 4,000,000 | | 4,000,000 |
TOTAL FINANCIALS | | 126,895,095 |
HEALTH CARE - 0.7% |
Health Care Providers & Services - 0.7% |
Beverly Enterprises, Inc. 7.875% 6/15/14 | | 1,030,000 | | 1,122,700 |
Extendicare Health Services, Inc. 6.875% 5/1/14 | | 1,500,000 | | 1,492,500 |
Genesis HealthCare Corp. 8% 10/15/13 | | 1,820,000 | | 1,974,700 |
| | 4,589,900 |
TELECOMMUNICATION SERVICES - 0.5% |
Wireless Telecommunication Services - 0.5% |
American Tower Corp. 7.125% 10/15/12 | | 2,000,000 | | 2,115,000 |
American Tower Escrow Corp. 0% 8/1/08 (c) | | 2,000,000 | | 1,542,600 |
| | 3,657,600 |
TOTAL NONCONVERTIBLE BONDS (Cost $158,299,060) | 160,359,647 |
Asset-Backed Securities - 2.9% |
|
ABSC NIMS Trust: | | | | |
Series 2003-HE4 Class A, 7% 8/17/33 (d) | | 92,807 | | 92,807 |
Series 2003-HE5 Class A, 7% 8/17/33 (d) | | 82,968 | | 83,071 |
Series 2003-HE7 Class A, 7% 12/15/33 (d) | | 103,888 | | 104,018 |
Ameriquest Mortgage Securities, Inc. Series 2004-R9 Class M9, 5.96% 10/25/34 (d)(e) | | 2,000,000 | | 1,844,688 |
Conseco Finance Securitizations Corp. Series 2000-4 Class A4, 7.73% 4/1/31 | | 867,980 | | 808,382 |
Countrywide Home Loans, Inc. Series 2004-11N
Class N, 5.25% 4/25/36 (d) | | 399,765 | | 397,601 |
Crest Dartmouth Street Ltd./Crest Dartmouth Street Corp. Series 2003-1A Class D, 9% 6/28/38 (d) | | 850,000 | | 930,713 |
Crown Castle Towers LLC/Crown Atlantic Holdings Sub LLC/Crown Communication, Inc. Series 2005-1
Class D, 5.612% 6/15/35 (d) | | 2,000,000 | | 2,006,054 |
Asset-Backed Securities - continued |
| Principal
Amount | | Value (Note 1) |
Diversified REIT Trust Series 2003-SMU Class D, 6.78% 3/18/11 (d)(e) | | $ 1,785,000 | | $ 1,722,804 |
Gramercy Real Estate CDO Ltd. Series 2005-1A Class H, 5.58% 7/25/35 (d)(e) | | 2,000,000 | | 2,000,000 |
Green Tree Financial Corp. Series 1996-4 Class M1, 7.75% 6/15/27 | | 1,788,179 | | 1,515,983 |
GSAMP Trust Series 2005-HE3 Class B3, 5.96% 6/25/35 (e) | | 1,259,000 | | 1,111,068 |
Home Equity Asset Trust Series 2003-6N Class A, 6.5% 3/27/34 (d) | | 142,965 | | 142,250 |
Morgan Stanley Dean Witter Capital I Trust Series 2001-NC2 Class B1, 5.41% 1/25/32 (e) | | 84,355 | | 84,394 |
Park Place NIMS Trust Series 2004-WCW1 Class NOTE, 5.65% 9/25/34 (d) | | 484,517 | | 485,122 |
Park Place Securities NIM Trust Series 2004-WHQN2 Class A, 4% 2/25/35 (d) | | 621,275 | | 616,615 |
Park Place Securities, Inc. Series 2004-WHQ2
Class M10, 5.96% 2/25/35 (d)(e) | | 1,500,000 | | 1,305,900 |
Taberna Preferred Funding II Ltd./Taberna Preferred Funding II, Inc. Series 2005-2A Class E1, 6.449% 11/5/35 (d)(e) | | 4,210,000 | | 4,210,000 |
TOTAL ASSET-BACKED SECURITIES (Cost $19,587,956) | 19,461,470 |
Collateralized Mortgage Obligations - 1.8% |
|
Private Sponsor - 1.7% |
Countrywide Home Loans, Inc.: | | | | |
Series 2002-38 Class B3, 5% 2/25/18 (d) | | 217,535 | | 202,121 |
Series 2002-R2 Class 2B3, 4.6039% 7/25/33 (d)(e) | | 276,042 | | 175,200 |
Series 2003-40 Class B3, 4.5% 10/25/18 | | 273,448 | | 242,119 |
Series 2003-R2 Class B3, 5.5% 5/25/43 (d) | | 594,161 | | 474,400 |
Series 2003-R3: | | | | |
Class B2, 5.5% 11/25/33 | | 1,879,968 | | 1,636,160 |
Class B3, 5.5% 11/25/33 | | 562,923 | | 447,875 |
Series 2004-R1 Class 1B3, 5.5% 11/25/34 (e) | | 660,875 | | 514,036 |
Residential Finance LP/Residential Finance Development Corp. floater: | | | | |
Series 2002-A Class B10, 19.55% 10/10/34 (e) | | 552,565 | | 580,193 |
Series 2003-B Class B9, 15.3% 7/10/35 (d)(e) | | 965,485 | | 1,023,414 |
Series 2004-C Class B5, 4.7% 9/10/36 (e) | | 395,549 | | 399,999 |
Series 2005-A Class B6, 5.35% 3/10/37 (d)(e) | | 1,990,828 | | 1,990,828 |
Series 2005-B Class B6, 4.95% 6/10/37 (d)(e) | | 998,108 | | 998,108 |
Collateralized Mortgage Obligations - continued |
| Principal
Amount | | Value (Note 1) |
Private Sponsor - continued |
Residential Funding Mortgage Securities I, Inc.
Series 2002-S20 Class M3, 5.25% 12/25/17 | | $ 88,279 | | $ 82,930 |
Residential Funding Securities Corp. Series 2002-RM1 Class BI1, 5.5% 12/25/17 (d) | | 184,283 | | 161,018 |
Resix Finance Ltd. floater: | | | | |
Series 2003-D Class B8, 9.85% 12/10/35 (d)(e) | | 729,957 | | 753,681 |
Series 2004-A Class B7, 7.6% 2/10/36 (d)(e) | | 686,961 | | 702,418 |
Series 2004-B Class B7, 7.35% 2/10/36 (d)(e) | | 825,680 | | 848,386 |
TOTAL PRIVATE SPONSOR | | 11,232,886 |
U.S. Government Agency - 0.1% |
Fannie Mae REMIC Trust Series 2003-W1 Subordinate REMIC Pass-Through Certificate, Class B3, 5.75% 12/25/42 | | 336,337 | | 275,901 |
Fannie Mae REMIC Trust Series 2003-W4 Subordinate REMIC Pass-Through Certificate, Class 2B3, 4.6587% 10/25/42 (d)(e) | | 84,595 | | 54,564 |
Fannie Mae REMIC Trust Series 2003-W10 Subordinate REMIC Pass-Through Certificate, Class 2B3, 4.4463% 6/25/43 (e) | | 197,209 | | 122,578 |
Fannie Mae REMIC Trust Series 2001-W3 Subordinate REMIC Pass-Through Certificate, Class B3, 7% 9/25/41 | | 295,426 | | 261,545 |
Fannie Mae REMIC Trust Series 2002-W1 Subordinate REMIC Pass-Through Certificate, Class 3B3, 4.3947% 2/25/42 (d)(e) | | 172,100 | | 116,437 |
TOTAL U.S. GOVERNMENT AGENCY | | 831,025 |
TOTAL COLLATERALIZED MORTGAGE OBLIGATIONS (Cost $11,926,260) | 12,063,911 |
Commercial Mortgage Securities - 12.4% |
|
Asset Securitization Corp. Series 1997-D4: | | | | |
Class B1, 7.525% 4/14/29 | | 2,500,000 | | 2,791,162 |
Class B2, 7.525% 4/14/29 | | 515,000 | | 553,605 |
Banc of America Commercial Mortgage, Inc. Series 2003-2: | | | | |
Class BWD, 6.947% 10/11/37 (d) | | 430,400 | | 438,302 |
Class BWE, 7.226% 10/11/37 (d) | | 583,123 | | 593,365 |
Class BWF, 7.55% 10/11/37 (d) | | 514,695 | | 524,712 |
Class BWG, 8.155% 10/11/37 (d) | | 498,828 | | 503,584 |
Class BWH, 9.073% 10/11/37 (d) | | 261,810 | | 268,594 |
Class BWJ, 9.99% 10/11/37 (d) | | 430,400 | | 440,288 |
Class BWK, 10.676% 10/11/37 (d) | | 338,172 | | 347,848 |
Class BWL, 10.1596% 10/11/37 (d) | | 570,231 | | 542,973 |
Commercial Mortgage Securities - continued |
| Principal
Amount | | Value (Note 1) |
Banc of America Large Loan, Inc. floater: | | | | |
Series 2003-BBA2 Class A3, 3.7081% 11/15/15 (d)(e) | | $ 4,000,000 | | $ 4,002,520 |
Series 2005-BOCA Class M, 5.4881% 12/15/16 (d)(e) | | 1,790,000 | | 1,799,299 |
Capital Trust RE CDO Ltd. floater Series 2005-1A
Class D, 4.93% 3/20/50 (d)(e) | | 2,250,000 | | 2,250,000 |
Commercial Mortgage pass thru certificates floater Series 2004-CNL: | | | | |
Class G, 4.3681% 9/15/14 (d)(e) | | 125,000 | | 125,050 |
Class H, 4.4681% 9/15/14 (d)(e) | | 135,000 | | 135,054 |
CS First Boston Mortgage Securities Corp.: | | | | |
floater Series 2004-HC1 Class E, 7.1381% 12/15/21 (d)(e) | | 2,000,000 | | 1,999,984 |
Series 1998-C1 Class F, 6% 5/17/40 (d) | | 4,250,000 | | 3,459,534 |
Series 1998-C2 Class F, 6.75% 11/11/30 (d) | | 2,000,000 | | 2,133,421 |
Series 2004-TF2A Class AX, 1.517% 11/15/19 (d)(e)(g) | | 51,529,543 | | 870,849 |
Series 2004-TFLA Class AX, 1.5079% 2/15/14 (d)(e)(g) | | 50,356,121 | | 322,279 |
DLJ Commercial Mortgage Corp. Series 1998-CF2
Class B3, 6.04% 11/12/31 | | 2,000,000 | | 2,001,589 |
EQI Financing Partnership I LP Series 1997-1 Class C, 7.58% 2/20/17 (d) | | 2,500,000 | | 2,515,083 |
First Chicago/Lennar Trust I: | | | | |
Series 1997-CHL1 Class E, 7.7015% 4/29/39 (d)(e) | | 3,500,000 | | 3,625,235 |
weighted average coupon Series 1997-CHL1 Class D, 7.7015% 4/29/39 (d)(e) | | 1,750,000 | | 1,768,594 |
Global Signal Trust Series 2004-1: | | | | |
Class F, 8.08% 1/15/34 (d)(e) | | 2,860,000 | | 2,862,039 |
Class G, 10% 1/15/34 (d)(e) | | 2,640,000 | | 2,665,112 |
GMAC Commercial Mortgage Securities, Inc.
Series 1997-C2 Class F, 6.75% 4/15/29 (e) | | 2,767,000 | | 2,408,155 |
Greenwich Capital Commercial Funding Corp. floater Series 2004-FL2A Class NMV, 5.09% 11/5/19 (d)(e) | | 1,991,020 | | 1,992,887 |
J.P. Morgan Chase Commercial Mortgage Securities Corp. Series 2001-A: | | | | |
Class G, 6% 10/15/32 (d)(e) | | 2,895,000 | | 2,218,120 |
Class X, 1.905% 10/15/32 (d)(e)(g) | | 20,842,972 | | 827,205 |
J.P. Morgan Commercial Mortgage Finance Corp.: | | | | |
Series 1997-C5 Class F, 7.5605% 9/15/29 | | 5,885,000 | | 6,384,268 |
Series 1999-C7 Class F, 6% 10/15/35 (d) | | 350,000 | | 357,896 |
Series 1999-C8: | | | | |
Class G, 6% 7/15/31 (d) | | 1,385,000 | | 1,228,218 |
Commercial Mortgage Securities - continued |
| Principal
Amount | | Value (Note 1) |
J.P. Morgan Commercial Mortgage Finance Corp.: - continued | | | | |
Series 1999-C8: | | | | |
Class H, 6% 7/15/31 (d) | | $ 2,638,000 | | $ 1,978,500 |
Series 2000-C9 Class G, 6.25% 10/15/32 (d) | | 2,425,000 | | 2,393,960 |
Lehman Brothers Floating Rate Commercial Mortgage Trust floater Series 2003-C4A Class F, 5.6% 7/11/15 (d)(e) | | 89,879 | | 89,927 |
LTC Commercial Mortgage pass thru certificates Series 1998-1 Class E, 7.792% 5/28/30 (d) | | 1,588,381 | | 1,589,775 |
Meristar Commercial Mortgage Trust Series 1999-C1: | | | | |
Class C, 8.29% 3/3/16 (d) | | 1,500,000 | | 1,645,136 |
Class X, 0.2154% 3/3/16 (d)(g) | | 36,650,000 | | 284,785 |
Merrill Lynch Financial Asset, Inc. Series 2005-CA16: | | | | |
Class F, 4.384% 7/12/15 | CAD | 710,000 | | 503,128 |
Class G, 4.384% 7/12/15 | CAD | 355,000 | | 242,131 |
Class H, 4.384% 7/12/15 | CAD | 236,000 | | 139,099 |
Class J, 4.384% 7/12/15 | CAD | 355,000 | | 191,069 |
Class K, 4.384% 7/12/15 | CAD | 355,000 | | 177,941 |
Class L, 4.384% 7/12/15 | CAD | 236,000 | | 110,310 |
Class M, 4.384% 7/12/15 | CAD | 995,000 | | 295,450 |
Merrill Lynch Mortgage Investors, Inc.: | | | | |
Series 1999-C1 Class G, 6.71% 11/15/31 (d) | | 3,359,000 | | 3,114,431 |
Series 2001-HRPA Class G, 6.778% 2/3/16 (d) | | 820,000 | | 862,952 |
Mezz Capital Commercial Mortgage Trust Series 2004-C1: | | | | |
Class D, 6.988% 9/15/13 | | 750,000 | | 733,950 |
Class E, 7.983% 10/15/13 | | 1,453,000 | | 1,423,674 |
Class X, 8.054% 1/15/18 (e)(g) | | 7,184,298 | | 3,029,473 |
Morgan Stanley Capital I, Inc.: | | | | |
Series 1997-C1 Class F, 6.85% 2/15/20 (d) | | 500,000 | | 518,498 |
Series 1997-HF1 Class G, 6.86% 7/15/29 (d) | | 555,000 | | 570,749 |
Series 1998-HF1 Class F, 7.18% 3/15/30 (d) | | 1,500,000 | | 1,572,206 |
Nationslink Funding Corp. Series 1998-2 Class F, 7.105% 8/20/30 (d) | | 2,075,000 | | 2,236,691 |
Nomura Asset Securities Corp. Series 1998-D6 Class B1, 6% 3/15/30 (d) | | 2,800,000 | | 2,931,822 |
Trizechahn Office Properties Trust Series 2001-TZHA Class E4, 7.604% 5/15/16 (d) | | 790,000 | | 850,161 |
TOTAL COMMERCIAL MORTGAGE SECURITIES (Cost $79,328,240) | 82,442,642 |
Floating Rate Loans - 3.0% |
| Principal
Amount | | Value (Note 1) |
CONSUMER DISCRETIONARY - 0.4% |
Hotels, Restaurants & Leisure - 0.4% |
Wyndham International, Inc. Tranche 1: | | | | |
Credit-Linked Deposit 6.435% 5/6/11 (e) | | $ 232,754 | | $ 233,336 |
term loan 6.625% 5/6/11 (e) | | 2,461,073 | | 2,467,226 |
| | 2,700,562 |
FINANCIALS - 2.3% |
Diversified Financial Services - 0.3% |
Landsource Communication Development LLC Tranche B, term loan 5.9375% 3/31/10 (e) | | 2,200,000 | | 2,216,500 |
Real Estate - 2.0% |
Apartment Investment & Management Co. term loan: | | | | |
5.16% 11/2/09 (e) | | 200,000 | | 201,500 |
5.21% 11/2/09 (e) | | 2,000,000 | | 2,022,500 |
Crescent Real Estate Funding XII LP term loan 5.59% 1/12/06 (e) | | 1,826,216 | | 1,835,347 |
General Growth Properties, Inc.: | | | | |
Tranche A, term loan 5.59% 11/12/07 (e) | | 2,846,148 | | 2,871,052 |
Tranche B, term loan 5.49% 11/12/08 (e) | | 1,492,894 | | 1,513,421 |
LNR Property Corp. Tranche B, term loan 6.3396% 2/3/08 (e) | | 3,919,880 | | 3,963,979 |
Newkirk Master LP: | | | | |
term loan 7.9475% 11/24/06 (e) | | 206,725 | | 206,725 |
Tranche B term loan 5.5706% 7/31/08 (e) | | 110,000 | | 111,238 |
Shea Mountain House LLC Tranche B, term loan 5.27% 5/11/11 (e) | | 350,000 | | 351,750 |
| | 13,077,512 |
TOTAL FINANCIALS | | 15,294,012 |
HEALTH CARE - 0.0% |
Health Care Providers & Services - 0.0% |
Beverly Enterprises, Inc. term loan 6.1086% 10/22/08 (e) | | 196,500 | | 197,483 |
MATERIALS - 0.2% |
Paper & Forest Products - 0.2% |
Escanaba Timber LLC term loan 6% 5/2/08 (e) | | 1,200,000 | | 1,219,500 |
Floating Rate Loans - continued |
| Principal
Amount | | Value (Note 1) |
TELECOMMUNICATION SERVICES - 0.1% |
Wireless Telecommunication Services - 0.1% |
American Tower LP Tranche C, term loan 5.2099% 8/31/11 (e) | | $ 379,050 | | $ 383,314 |
SpectraSite Communications, Inc. Tranche B, term loan 4.91% 5/19/12 (e) | | 447,750 | | 452,228 |
| | 835,542 |
TOTAL FLOATING RATE LOANS (Cost $20,085,393) | 20,247,099 |
Preferred Securities - 0.1% |
| | | |
FINANCIALS - 0.1% |
Diversified Financial Services - 0.1% |
Crest Dartmouth Street 2003 1 Ltd. Series 2003-1A Class PS, 26.6887% 6/28/38 (d)(e) (Cost $590,000) | 590,000 | 626,418 |
Fixed-Income Funds - 3.7% |
| | Shares | | |
Fidelity Ultra-Short Central Fund (f)
(Cost $24,999,977) | | 251,145 | | 24,983,905 |
Money Market Funds - 4.4% |
| | | |
Fidelity Cash Central Fund, 3.31% (b)
(Cost $29,078,819) | | 29,078,819 | | 29,078,819 |
TOTAL INVESTMENT PORTFOLIO - 99.8% (Cost $629,752,521) | | | 665,963,377 |
NET OTHER ASSETS - 0.2% | | | 1,439,231 |
NET ASSETS - 100% | | $ 667,402,608 |
Currency Abbreviation |
CAD | - | Canadian dollar |
Legend |
(a) Non-income producing |
(b) Affiliated fund that is available only to investment companies and other accounts managed by Fidelity Investments. The rate quoted is the annualized seven-day yield of the fund at period end. A complete listing of the fund's holdings as of its most recent quarter end is available upon request. |
(c) Debt obligation initially issued in zero coupon form which converts to coupon form at a specified rate and date. The rate shown is the rate at period end. |
(d) Security exempt from registration under Rule 144A of the Securities Act of 1933. These securities may be resold in transactions exempt from registration, normally to qualified institutional buyers. At the period end, the value of these securities amounted to $102,139,257 or 15.3% of net assets. |
(e) The coupon rate shown on floating or adjustable rate securities represents the rate at period end. |
(f) Affiliated fund that is available only to investment companies and other accounts managed by Fidelity Investments. A complete listing of the fixed-income central fund's holdings is provided at the end of the report. |
(g) Security represents right to receive monthly interest payments on an underlying pool of mortgages. Principal shown is the par amount of the mortgage pool. |
(h) Restricted securities - Investment in securities not registered under the Securities Act of 1933 (excluding 144A issues). At the end of the period, the value of restricted securities (excluding 144A issues) amounted to $4,000,000 or 0.6% of net assets. |
Additional information on each holding is as follows: |
Security | Acquisition
Date | Acquisition
Cost |
Wrightwood Capital LLC 9% 6/1/14 | 1/1/05 | $ 4,000,000 |
Other Information |
The composition of credit quality ratings as a percentage of net assets is as follows (ratings are unaudited): |
U.S.Government and U.S.Government Agency Obligations | 0.2% |
AAA,AA,A | 3.3% |
BBB | 15.9% |
BB | 14.6% |
B | 8.4% |
CCC,CC,C | 0.1% |
Not Rated | 4.0% |
Equities | 47.5% |
Short-Term Investments and Net Other Assets | 6.0% |
| 100.0% |
We have used ratings from Moody's Investors Services, Inc. Where Moody's ratings are not available, we have used S&P ratings. |
See accompanying notes which are an integral part of the financial statements.
Annual Report
Financial Statements
Statement of Assets and Liabilities
| July 31, 2005 |
| | |
Assets | | |
Investment in securities, at value (cost $629,752,521) - See accompanying schedule | | $ 665,963,377 |
Cash | | 1,778,790 |
Receivable for investments sold | | 848 |
Receivable for fund shares sold | | 1,034,365 |
Dividends receivable | | 1,002,697 |
Interest receivable | | 3,549,797 |
Prepaid expenses | | 754 |
Other affiliated receivables | | 322 |
Other receivables | | 15,622 |
Total assets | | 673,346,572 |
| | |
Liabilities | | |
Payable for investments purchased | $ 4,709,386 | |
Payable for fund shares redeemed | 741,514 | |
Accrued management fee | 314,057 | |
Other affiliated payables | 136,108 | |
Other payables and accrued expenses | 42,899 | |
Total liabilities | | 5,943,964 |
| | |
Net Assets | | $ 667,402,608 |
Net Assets consist of: | | |
Paid in capital | | $ 614,269,798 |
Undistributed net investment income | | 6,241,480 |
Accumulated undistributed net realized gain (loss) on investments | | 10,680,491 |
Net unrealized appreciation (depreciation) on investments and assets and liabilities in foreign currencies | | 36,210,839 |
Net Assets, for 54,845,415 shares outstanding | | $ 667,402,608 |
Net Asset Value, offering price and redemption price per share ($667,402,608 ÷ 54,845,415 shares) | | $ 12.17 |
See accompanying notes which are an integral part of the financial statements.
Annual Report
Financial Statements - continued
Statement of Operations
| Year ended July 31, 2005 |
| | |
Investment Income | | |
Dividends | | $ 15,093,625 |
Interest | | 19,353,079 |
Total income | | 34,446,704 |
| | |
Expenses | | |
Management fee | $ 3,307,917 | |
Transfer agent fees | 1,204,662 | |
Accounting fees and expenses | 241,526 | |
Independent trustees' compensation | 2,854 | |
Custodian fees and expenses | 17,180 | |
Registration fees | 61,390 | |
Audit | 81,012 | |
Legal | 2,464 | |
Miscellaneous | 8,340 | |
Total expenses before reductions | 4,927,345 | |
Expense reductions | (27,395) | 4,899,950 |
Net investment income (loss) | | 29,546,754 |
Realized and Unrealized Gain (Loss) Net realized gain (loss) on investment securities | | 10,712,768 |
Change in net unrealized appreciation (depreciation) on: Investment securities | 27,324,083 | |
Assets and liabilities in foreign currencies | (17) | |
Total change in net unrealized appreciation (depreciation) | | 27,324,066 |
Net gain (loss) | | 38,036,834 |
Net increase (decrease) in net assets resulting from operations | | $ 67,583,588 |
See accompanying notes which are an integral part of the financial statements.
Annual Report
Statement of Changes in Net Assets
| Year ended
July 31,
2005 | Year ended
July 31,
2004 |
Increase (Decrease) in Net Assets | | |
Operations | | |
Net investment income (loss) | $ 29,546,754 | $ 19,812,277 |
Net realized gain (loss) | 10,712,768 | 10,307,573 |
Change in net unrealized appreciation (depreciation) | 27,324,066 | 3,123,862 |
Net increase (decrease) in net assets resulting
from operations | 67,583,588 | 33,243,712 |
Distributions to shareholders from net investment income | (26,821,897) | (17,564,086) |
Distributions to shareholders from net realized gain | (7,090,927) | (1,945,418) |
Total distributions | (33,912,824) | (19,509,504) |
Share transactions
Proceeds from sales of shares | 342,677,417 | 411,886,173 |
Reinvestment of distributions | 29,547,608 | 16,882,212 |
Cost of shares redeemed | (161,193,200) | (248,916,115) |
Net increase (decrease) in net assets resulting from share transactions | 211,031,825 | 179,852,270 |
Redemption fees | 148,704 | 420,153 |
Total increase (decrease) in net assets | 244,851,293 | 194,006,631 |
| | |
Net Assets | | |
Beginning of period | 422,551,315 | 228,544,684 |
End of period (including undistributed net investment income of $6,241,480 and undistributed net investment income of $4,720,379, respectively) | $ 667,402,608 | $ 422,551,315 |
Other Information Shares | | |
Sold | 29,225,235 | 36,337,200 |
Issued in reinvestment of distributions | 2,535,568 | 1,514,555 |
Redeemed | (13,702,129) | (22,005,866) |
Net increase (decrease) | 18,058,674 | 15,845,889 |
See accompanying notes which are an integral part of the financial statements.
Annual Report
Financial Highlights
Years ended July 31, | 2005 | 2004 | 2003E |
Selected Per-Share Data | | | |
Net asset value, beginning of period | $ 11.49 | $ 10.91 | $ 10.00 |
Income from Investment Operations | | | |
Net investment income (loss)D | .60 | .59 | .27 |
Net realized and unrealized gain (loss) | .83 | .60 | .71 |
Total from investment operations | 1.43 | 1.19 | .98 |
Distributions from net investment income | (.57) | (.55) | (.07) |
Distributions from net realized gain | (.18) | (.07) | - |
Total distributions | (.75) | (.62) | (.07) |
Redemption fees added to paid in capitalD | -G | .01 | -G |
Net asset value, end of period | $ 12.17 | $ 11.49 | $ 10.91 |
Total ReturnB,C | 12.90% | 11.31% | 9.83% |
Ratios to Average Net AssetsF | | | |
Expenses before expense reductions | .85% | .85% | .97%A |
Expenses net of voluntary waivers, if any | .85% | .85% | .97%A |
Expenses net of all reductions | .85% | .85% | .94%A |
Net investment income (loss) | 5.13% | 5.25% | 5.10%A |
Supplemental Data | | | |
Net assets, end of period (000 omitted) | $ 667,403 | $ 422,551 | $ 228,545 |
Portfolio turnover rate | 30% | 61% | 41%A |
A Annualized
B Total returns for periods of less than one year are not annualized.
C Total returns would have been lower had certain expenses not been reduced during the periods shown.
D Calculated based on average shares outstanding during the period.
E For the period February 4, 2003 (commencement of operations) to July 31, 2003.
F Expense ratios reflect operating expenses of the fund. Expenses before reductions do not reflect amounts reimbursed by the investment adviser or reductions from brokerage service arrangements or other expense offset arrangements and do not represent the amount paid by the fund during periods when reimbursements or reductions occur. Expense ratios before reductions for start-up periods may not be representative of longer-term operating periods. Expenses net of any voluntary waivers reflect expenses after reimbursement by the investment adviser but prior to reductions from brokerage service arrangements or other expense offset arrangements. Expenses net of all reductions represent the net expenses paid by the fund.
G Amount represents less than $.01 per share.
See accompanying notes which are an integral part of the financial statements.
Semiannual Report
Notes to Financial Statements
For the period ended July 31, 2005
1. Significant Accounting Policies.
Fidelity Real Estate Income Fund (the fund) is a non-diversified fund of Fidelity Securities Fund (the trust) and is authorized to issue an unlimited number of shares. The trust is registered under the Investment Company Act of 1940, as amended (the 1940 Act), as an open-end management investment company organized as a Massachusetts business trust. The fund may invest in affiliated money market central funds (Money Market Central Funds) and fixed-income Central Investment Portfolios(CIPs), collectively referred to as Central Funds, which are open-end investment companies available to investment companies and other accounts managed by Fidelity Management & Research Company (FMR) and its affiliates.
The financial statements have been prepared in conformity with accounting principles generally accepted in the United States of America, which require management to make certain estimates and assumptions at the date of the financial statements. The following summarizes the significant accounting policies of the fund, which are also consistently followed by the Central Funds:
Security Valuation. Net asset value per share (NAV calculation) is calculated as of the close of business of the New York Stock Exchange, normally 4:00 p.m. Eastern time. Equity securities, including restricted securities, for which market quotations are available are valued at the last sale price or official closing price (closing bid price or last evaluated quote if no sale has occurred) on the primary market or exchange on which they trade. Debt securities, including restricted securities, for which quotations are readily available are valued at their most recent bid prices (sales prices if the principal market is an exchange) in the principal market in which such securities are normally traded, as determined by recognized dealers in such securities, or securities are valued on the basis of information provided by a pricing service. Pricing services use valuation matrices that incorporate both dealer-supplied valuations and valuation models. If prices are not readily available or do not accurately reflect fair value for a security, or if a security's value has been materially affected by events occurring after the close of the exchange or market on which the security is principally traded, that security may be valued by another method that the Board of Trustees believes accurately reflects fair value. A security's valuation may differ depending on the method used for determining value. Price movements in futures contracts and ADRs, market and trading trends, the bid/ask quotes of brokers and off-exchange institutional trading may be reviewed in the course of making a good faith determination of a security's fair value. Short-term securities with remaining maturities of sixty days or less for which quotations are not readily available are valued on the basis of amortized cost. Investments in open-end investment companies, including Central Funds, are valued at their net asset value each business day.
Annual Report
Notes to Financial Statements - continued
1. Significant Accounting Policies - continued
Foreign Currency. The fund uses foreign currency contracts to facilitate transactions in foreign-denominated securities. Losses from these transactions may arise from changes in the value of the foreign currency or if the counterparties do not perform under the contracts' terms.
Foreign-denominated assets, including investment securities, and liabilities are translated into U.S. dollars at the exchange rate at period end. Purchases and sales of investment securities, income and dividends received and expenses denominated in foreign currencies are translated into U.S. dollars at the exchange rate in effect on the transaction date.
The effects of exchange rate fluctuations on investments are included with the net realized and unrealized gain (loss) on investment securities. Other foreign currency transactions resulting in realized and unrealized gain (loss) are disclosed separately.
Investment Transactions and Income. Security transactions, including the fund's investment activity in the Central Funds, are accounted for as of trade date. Gains and losses on securities sold are determined on the basis of identified cost. Dividend income is recorded on the ex-dividend date, except for certain dividends from foreign securities where the ex-dividend date may have passed, which are recorded as soon as the fund is informed of the ex-dividend date. Non-cash dividends included in dividend income, if any, are recorded at the fair market value of the securities received. Distributions received on securities that represent a return of capital or capital gain are recorded as a reduction of cost of investments and/or as a realized gain. The fund estimates the components of distributions received that may be considered return of capital distributions or capital gain distributions. Interest income, including distributions from the Central Funds, is accrued as earned. Interest income includes coupon interest and amortization of premium and accretion of discount on debt securities. The fund follows the provisions of Emerging Issues Task Force Issue No. 99-20 (EITF 99-20), "Recognition of Interest Income and Impairment on Purchased and Retained Beneficial Interests in Securitized Financial Assets" for certain lower credit quality securitized assets that have contractual cash flows (for example, asset backed securities, collateralized mortgage obligations and commercial mortgage-backed securities). Under EITF 99-20, if there is a change in the estimated cash flows for any of these securities, based on an evaluation of current information, then the estimated yield is adjusted on a prospective basis over the remaining life of the security. Investment income is recorded net of foreign taxes withheld where recovery of such taxes is uncertain.
Expenses. Most expenses of the trust can be directly attributed to a fund. Expenses which cannot be directly attributed are apportioned among each fund in the trust.
Annual Report
1. Significant Accounting Policies - continued
Income Tax Information and Distributions to Shareholders. Each year, the fund intends to qualify as a regulated investment company by distributing all of its taxable income and realized gains under Subchapter M of the Internal Revenue Code. As a result, no provision for income taxes is required in the accompanying financial statements. Foreign taxes are provided for based on the fund's understanding of the tax rules and rates that exist in the foreign markets in which it invests.
Distributions are recorded on the ex-dividend date. Income and capital gain distributions are determined in accordance with income tax regulations, which may differ from generally accepted accounting principles. In addition, the fund will claim a portion of the payment made to redeeming shareholders as a distribution for income tax purposes. Capital accounts within the financial statements are adjusted for permanent book-tax differences. These adjustments have no impact on net assets or the results of operations. Temporary book-tax differences will reverse in a subsequent period.
Book-tax differences are primarily due to passive foreign investment companies (PFIC), partnerships, and losses deferred due to wash sales.
The tax-basis components of distributable earnings and the federal tax cost as of period end were as follows:
Unrealized appreciation | $ 40,120,328 | |
Unrealized depreciation | (4,170,721) | |
Net unrealized appreciation (depreciation) | 35,949,607 | |
Undistributed ordinary income | 8,657,062 | |
Undistributed long-term capital gain | 7,076,881 | |
| | |
Cost for federal income tax purposes | $ 630,013,770 | |
The tax character of distributions paid was as follows:
| July 31,
2005 | July 31,
2004 |
Ordinary Income | $ 28,735,912 | $ 19,200,804 |
Long-term Capital Gains | 5,176,912 | 308,700 |
Total | $ 33,912,824 | $ 19,509,504 |
Short-Term Trading (Redemption) Fees. Shares held in the fund less than 90 days are subject to a redemption fee equal to .75% of the proceeds of the redeemed shares. All redemption fees, including any estimated redemption fees paid by FMR, are retained by the fund and accounted for as an addition to paid in capital.
Annual Report
Notes to Financial Statements - continued
2. Operating Policies.
Repurchase Agreements. FMR has received an Exemptive Order from the Securities and Exchange Commission (the SEC) which permits the fund and other affiliated entities of FMR to transfer uninvested cash balances into joint trading accounts which are then invested in repurchase agreements. The fund may also invest directly with institutions in repurchase agreements. Repurchase agreements are collateralized by government or non-government securities. Collateral is held in segregated accounts with custodian banks and may be obtained in the event of a default of the counterparty. The fund monitors, on a daily basis, the value of the collateral to ensure it is at least equal to the principal amount of the repurchase agreement (including accrued interest). In the event of a default by the counterparty, realization of the collateral proceeds could be delayed, during which time the value of the collateral may decline.
Delayed Delivery Transactions and When-Issued Securities. The fund may purchase or sell securities on a delayed delivery or when-issued basis. Payment and delivery may take place after the customary settlement period for that security. The price of the underlying securities and the date when the securities will be delivered and paid for are fixed at the time the transaction is negotiated. During the time a delayed delivery sell is outstanding, the contract is marked-to-market daily and equivalent deliverable securities are held for the transaction. The value of the securities purchased on a delayed delivery or when-issued basis are identified as such in the fund's Schedule of Investments. The fund may receive compensation for interest forgone in the purchase of a delayed delivery or when-issued security. With respect to purchase commitments, the fund identifies securities as segregated in its records with a value at least equal to the amount of the commitment. Losses may arise due to changes in the value of the underlying securities or if the counterparty does not perform under the contract's terms, or if the issuer does not issue the securities due to political, economic, or other factors.
Restricted Securities. The fund may invest in securities that are subject to legal or contractual restrictions on resale. These securities generally may be resold in transactions exempt from registration or to the public if the securities are registered. Disposal of these securities may involve time-consuming negotiations and expense, and prompt sale at an acceptable price may be difficult. Information regarding restricted securities is included at the end of the fund's Schedule of Investments.
Loans and Other Direct Debt Instruments. The fund may invest in loans and loan participations, trade claims or other receivables. These investments may include standby financing commitments, including revolving credit facilities, that obligate the fund to supply additional cash to the borrower on demand. Loan participations involve a risk of insolvency of the lending bank or other financial intermediary. The fund may be contractually obligated to receive approval from the agent bank and/or borrower prior to the sale of these investments.
Annual Report
3. Purchases and Sales of Investments.
Purchases and sales of securities, other than short-term securities and U.S. government securities, aggregated $373,415,548 and $162,746,114, respectively.
4. Fees and Other Transactions with Affiliates.
Management Fee. FMR and its affiliates provide the fund with investment management related services for which the fund pays a monthly management fee. The management fee is the sum of an individual fund fee rate that is based on an annual rate of .30% of the fund's average net assets and a group fee rate that averaged .27% during the period. The group fee rate is based upon the average net assets of all the mutual funds advised by FMR. The group fee rate decreases as assets under management increase and increases as assets under management decrease. For the period, the total annual management fee rate was .57% of the fund's average net assets.
Transfer Agent Fees. Fidelity Service Company, Inc. (FSC), an affiliate of FMR, is the fund's transfer, dividend disbursing and shareholder servicing agent. FSC receives account fees and asset-based fees that vary according to account size and type of account. FSC pays for typesetting, printing and mailing of shareholder reports, except proxy statements. For the period, the transfer agent fees were equivalent to an annual rate of .21% of average net assets.
Accounting Fees. FSC maintains the fund's accounting records. The fee is based on the level of average net assets for the month.
Affiliated Central Funds. The fund may invest in Money Market Central Funds which seek preservation of capital and current income and are managed by Fidelity Investments Money Management, Inc. (FIMM) an affiliate of FMR.
The fund may also invest in CIPs managed by FIMM. The Ultra-Short Central Fund seeks to obtain a high level of current income consistent with preservation of capital by investing in U.S. dollar-denominated money market and investment-grade debt securities and repurchase agreements.
The fund's Schedule of Investments lists the CIP as an investment of the fund but does not include the underlying holdings of the CIP. Based on its investment objectives, the CIP may invest or participate in various investment vehicles or strategies such as delayed delivery and when-issued securities, derivatives, financing transactions and restricted securities. These strategies are consistent with the investment objectives of the fund, and may involve certain economic risks, including the risk that a counterparty to one or more of these transactions may be unable or unwilling to comply with the terms of the governing agreement. This may result in a decline in value of the CIP and the fund.
Annual Report
Notes to Financial Statements - continued
4. Fees and Other Transactions with Affiliates - continued
Affiliated Central Funds - continued
A complete list of holdings for the CIP is available at the end of this report. In addition, a copy of the CIP's financial statements is available on the EDGAR Database on the SEC's website www.sec.gov, or at the Commission's public reference room in Washington, DC.
The Central Funds do not pay a management fee. Income distributions earned by the fund are recorded as income in the accompanying financial statements and totaled $1,267,126 for the period.
Brokerage Commissions. The fund placed a portion of its portfolio transactions with brokerage firms which are affiliates of the investment adviser. The commissions paid to these affiliated firms were $22,395 for the period.
5. Committed Line of Credit.
The fund participates with other funds managed by FMR in a $4.2 billion credit facility (the "line of credit") to be utilized for temporary or emergency purposes to fund shareholder redemptions or for other short-term liquidity purposes. The fund has agreed to pay commitment fees on its pro rata portion of the line of credit. During the period, there were no borrowings on this line of credit.
6. Expense Reductions.
Many of the brokers with whom FMR places trades on behalf of the fund provided services to the fund in addition to trade execution. These services included payments of certain expenses on behalf of the fund totaling $24,145 for the period. In addition, through arrangements with the fund's custodian and transfer agent, credits realized as a result of uninvested cash balances were used to reduce the fund's expenses. During the period, these credits reduced the fund's custody and transfer agent expenses by $3,165 and $85, respectively.
7. Other.
The fund's organizational documents provide former and current trustees and officers with a limited indemnification against liabilities arising in connection with the performance of their duties to the fund. In the normal course of business, the fund may also enter into contracts that provide general indemnifications. The fund's maximum exposure under these arrangements is unknown as this would be dependent on future claims that may be made against the fund. The risk of material loss from such claims is considered remote.
Annual Report
Report of Independent Registered Public Accounting Firm
To the Trustees of Fidelity Securities Fund and Shareholders of Fidelity Real Estate Income Fund:
We have audited the accompanying statement of assets and liabilities of Fidelity Real Estate Income Fund (the Fund), a fund of Fidelity Securities Fund, including the portfolio of investments, as of July 31, 2005, and the related statement of operations for the year then ended, the statement of changes in net assets for each of the two years in the period then ended, and the financial highlights for each of the two years ended July 31, 2005 and for the period February 4, 2003, commencement of operations, to July 31, 2003. These financial statements and financial highlights are the responsibility of the Fund's management. Our responsibility is to express an opinion on these financial statements and financial highlights based on our audits.
We conducted our audits in accordance with standards of the Public Company Accounting Oversight Board (United States). Those standards require that we plan and perform the audit to obtain reasonable assurance about whether the financial statements and financial highlights are free of material misstatement. The Fund is not required to have, nor were we engaged to perform, an audit of its internal control over financial reporting. Our audits included consideration of internal control over financial reporting as a basis for designing audit procedures that are appropriate in the circumstances, but not for the purpose of expressing an opinion on the effectiveness of the Fund's internal control over financial reporting. Accordingly, we express no such opinion. An audit also includes examining, on a test basis, evidence supporting the amounts and disclosures in the financial statements, assessing the accounting principles used and significant estimates made by management, as well as evaluating the overall financial statement presentation. Our procedures included confirmation of securities owned as of July 31, 2005, by correspondence with the custodians and brokers; where replies were not received from brokers, we performed other auditing procedures. We believe that our audits provide a reasonable basis for our opinion.
In our opinion, the financial statements and financial highlights referred to above present fairly, in all material respects, the financial position of Fidelity Real Estate Income Fund as of July 31, 2005, the results of its operations for the year then ended, the changes in its net assets for each of the two years in the period then ended, and the financial highlights for the two years ended July 31, 2005 and for the period February 4, 2003, commencement of operations, to July 31, 2003, in conformity with accounting principles generally accepted in the United States of America.
/s/ Deloitte & Touche LLP
DELOITTE & TOUCHE LLP
Boston, Massachusetts
September 13, 2005
Annual Report
Trustees and Officers
The Trustees, Members of the Advisory Board, and executive officers of the trust and fund, as applicable, are listed below. The Board of Trustees governs the fund and is responsible for protecting the interests of shareholders. The Trustees are experienced executives who meet periodically throughout the year to oversee the fund's activities, review contractual arrangements with companies that provide services to the fund, and review the fund's performance. Except for William O. McCoy, Stephen P. Jonas, and Kenneth L. Wolfe, each of the Trustees oversees 320 funds advised by FMR or an affiliate. Mr. McCoy oversees 322 funds advised by FMR or an affiliate. Mr. Jonas and Mr. Wolfe oversee 311 funds advised by FMR or an affiliate.
The Trustees hold office without limit in time except that (a) any Trustee may resign; (b) any Trustee may be removed by written instrument, signed by at least two-thirds of the number of Trustees prior to such removal; (c) any Trustee who requests to be retired or who has become incapacitated by illness or injury may be retired by written instrument signed by a majority of the other Trustees; and (d) any Trustee may be removed at any special meeting of shareholders by a two-thirds vote of the outstanding voting securities of the trust. Each Trustee who is not an interested person (as defined in the 1940 Act) (Independent Trustee), shall retire not later than the last day of the calendar year in which his or her 72nd birthday occurs. The Independent Trustees may waive this mandatory retirement age policy with respect to individual Trustees. The executive officers and Advisory Board Members hold office without limit in time, except that any officer and Advisory Board Member may resign or may be removed by a vote of a majority of the Trustees at any regular meeting or any special meeting of the Trustees. Except as indicated, each individual has held the office shown or other offices in the same company for the past five years.
The fund's Statement of Additional Information (SAI) includes more information about the Trustees. To request a free copy, call Fidelity at 1-800-544-8544.
Interested Trustees*:
Correspondence intended for each Trustee who is an interested person may be sent to Fidelity Investments, 82 Devonshire Street, Boston, Massachusetts 02109.
Name, Age; Principal Occupation |
Edward C. Johnson 3d (75)** |
| Year of Election or Appointment: 1984 Mr. Johnson is Chairman of the Board of Trustees. Mr. Johnson serves as Chief Executive Officer, Chairman, and a Director of FMR Corp.; a Director and Chairman of the Board and of the Executive Committee of FMR; Chairman and a Director of Fidelity Management & Research (Far East) Inc.; Chairman and a Director of Fidelity Investments Money Management, Inc.; and Chairman (2001-present) and a Director (2000-present) of FMR Co., Inc. |
Abigail P. Johnson (43)** |
| Year of Election or Appointment: 2001 Ms. Johnson serves as President of Fidelity Employer Services Company (FESCO) (2005-present). She is President and a Director of Fidelity Investments Money Management, Inc. (2001-present), FMR Co., Inc. (2001-present), and a Director of FMR Corp. Previously, Ms. Johnson served as President and a Director of FMR (2001-2005), Senior Vice President of the Fidelity funds (2001-2005), and managed a number of Fidelity funds. |
Stephen P. Jonas (52) |
| Year of Election or Appointment: 2005 Mr. Jonas is Senior Vice President of Real Estate Income (2005-present). He also serves as Senior Vice President of other Fidelity funds (2005-present). Mr. Jonas is Executive Director of FMR (2005-present). Previously, Mr. Jonas served as President of Fidelity Enterprise Operations and Risk Services (2004-2005), Chief Administrative Officer (2002-2004), and Chief Financial Officer of FMR Co. (1998-2000). Mr. Jonas has been with Fidelity Investments since 1987 and has held various financial and management positions including Chief Financial Officer of FMR. In addition, he serves on the Boards of Boston Ballet (2003-present) and Simmons College (2003-present). |
Robert L. Reynolds (53) |
| Year of Election or Appointment: 2003 Mr. Reynolds is a Director (2003-present) and Chief Operating Officer (2002-present) of FMR Corp. He also serves on the Board at Fidelity Investments Canada, Ltd. (2000-present). Previously, Mr. Reynolds served as President of Fidelity Investments Institutional Retirement Group (1996-2000). |
* Trustees have been determined to be "Interested Trustees" by virtue of, among other things, their affiliation with the trust or various entities under common control with FMR.
** Edward C. Johnson 3d, Trustee, is Abigail P. Johnson's father.
Annual Report
Independent Trustees:
Correspondence intended for each Independent Trustee (that is, the Trustees other than the Interested Trustees) may be sent to Fidelity Investments, P.O. Box 55235, Boston, Massachusetts 02205-5235.
Name, Age; Principal Occupation |
Dennis J. Dirks (57) |
| Year of Election or Appointment: 2005 Prior to his retirement in May 2003, Mr. Dirks was Chief Operating Officer and a member of the Board of The Depository Trust & Clearing Corporation (DTCC) (1999-2003). He also served as President, Chief Operating Officer, and Board member of The Depository Trust Company (DTC) (1999-2003) and President and Board member of the National Securities Clearing Corporation (NSCC) (1999-2003). In addition, Mr. Dirks served as Chief Executive Officer and Board member of the Government Securities Clearing Corporation (2001-2003) and Chief Executive Officer and Board member of the Mortgage-Backed Securities Clearing Corporation (2001-2003). Mr. Dirks also serves as a Trustee of Manhattan College (2005-present). |
Robert M. Gates (61) |
| Year of Election or Appointment: 1997 Dr. Gates is Vice Chairman of the Independent Trustees (2005-present). Dr. Gates is President of Texas A&M University (2002-present). He was Director of the Central Intelligence Agency (CIA) from 1991 to 1993. From 1989 to 1991, Dr. Gates served as Assistant to the President of the United States and Deputy National Security Advisor. Dr. Gates is a Director of NACCO Industries, Inc. (mining and manufacturing), Parker Drilling Co., Inc. (drilling and rental tools for the energy industry, 2001-present), and Brinker International (restaurant management, 2003-present). Previously, Dr. Gates served as a Director of LucasVarity PLC (automotive components and diesel engines), a Director of TRW Inc. (automotive, space, defense, and information technology), and Dean of the George Bush School of Government and Public Service at Texas A&M University (1999-2001). Dr. Gates also is a Trustee of the Forum for International Policy. |
George H. Heilmeier (69) |
| Year of Election or Appointment: 2004 Dr. Heilmeier is Chairman Emeritus of Telcordia Technologies (communication software and systems), where prior to his retirement, he served as company Chairman and Chief Executive Officer. He currently serves on the Boards of Directors of The Mitre Corporation (systems engineering and information technology support for the government), and HRL Laboratories (private research and development, 2004-present). He is Chairman of the General Motors Science & Technology Advisory Board and a Life Fellow of the Institute of Electrical and Electronics Engineers (IEEE) (2000-present). Dr. Heilmeier is a member of the Defense Science Board and the National Security Agency Advisory Board. He is also a member of the National Academy of Engineering, the American Academy of Arts and Sciences, and the Board of Overseers of the School of Engineering and Applied Science of the University of Pennsylvania. Previously, Dr. Heilmeier served as a Director of TRW Inc. (automotive, space, defense, and information technology, 1992-2002), Compaq (1994-2002), Automatic Data Processing, Inc. (ADP) (technology-based business outsourcing, 1995-2002), INET Technologies Inc. (telecommunications network surveillance, 2001-2004), and Teletech Holdings (customer management services). He is the recipient of the 2005 Kyoto Prize in Advanced Technology for his invention of the liquid display. |
Marie L. Knowles (58) |
| Year of Election or Appointment: 2001 Prior to Ms. Knowles' retirement in June 2000, she served as Executive Vice President and Chief Financial Officer of Atlantic Richfield Company (ARCO) (diversified energy, 1996-2000). From 1993 to 1996, she was a Senior Vice President of ARCO and President of ARCO Transportation Company. She served as a Director of ARCO from 1996 to 1998. She currently serves as a Director of Phelps Dodge Corporation (copper mining and manufacturing) and McKesson Corporation (healthcare service, 2002-present). Ms. Knowles is a Trustee of the Brookings Institution and the Catalina Island Conservancy and also serves as a member of the Advisory Board for the School of Engineering of the University of Southern California. |
Ned C. Lautenbach (61) |
| Year of Election or Appointment: 2000 Mr. Lautenbach has been a partner of Clayton, Dubilier & Rice, Inc. (private equity investment firm) since September 1998. Previously, Mr. Lautenbach was with the International Business Machines Corporation (IBM) from 1968 until his retirement in 1998. Mr. Lautenbach serves as a Director of Italtel Holding S.p.A. (telecommunications (Milan, Italy), 2004-present) and Eaton Corporation (diversified industrial) as well as the Philharmonic Center for the Arts in Naples, Florida. He also is a member of the Board of Trustees of Fairfield University (2005-present), as well as a member of the Council on Foreign Relations. |
Marvin L. Mann (72) |
| Year of Election or Appointment: 1993 Mr. Mann is Chairman of the Independent Trustees (2001-present). He is Chairman Emeritus of Lexmark International, Inc. (computer peripherals), where he served as CEO until April 1998, retired as Chairman May 1999, and remains a member of the Board. Prior to 1991, he held the positions of Vice President of International Business Machines Corporation (IBM) and President and General Manager of various IBM divisions and subsidiaries. He is a member of the Executive Committee of the Independent Director's Council of the Investment Company Institute. In addition, Mr. Mann is a member of the President's Cabinet at the University of Alabama and the Board of Visitors of the Culverhouse College of Commerce and Business Administration at the University of Alabama. |
William O. McCoy (71) |
| Year of Election or Appointment: 1997 Prior to his retirement in December 1994, Mr. McCoy was Vice Chairman of the Board of BellSouth Corporation (telecommunications) and President of BellSouth Enterprises. He is currently a Director of Liberty Corporation (holding company), Duke Realty Corporation (real estate), and Progress Energy, Inc. (electric utility). He is also a partner of Franklin Street Partners (private investment management firm) and a member of the Research Triangle Foundation Board. In addition, Mr. McCoy served as the Interim Chancellor (1999-2000) and a member of the Board of Visitors for the University of North Carolina at Chapel Hill and currently serves on the Board of Directors of the University of North Carolina Health Care System and the Board of Visitors of the Kenan-Flagler Business School (University of North Carolina at Chapel Hill). He also served as Vice President of Finance for the University of North Carolina (16-school system). |
Cornelia M. Small (61) |
| Year of Election or Appointment: 2005 Ms. Small is a member (2000-present) and Chairperson (2002-present) of the Investment Committee, and a member (2002-present) of the Board of Trustees of Smith College. Previously, she served as Chief Investment Officer (1999-2000), Director of Global Equity Investments (1996-1999), and a member of the Board of Directors of Scudder, Stevens & Clark (1990-1997) and Scudder Kemper Investments (1997-1998). In addition, Ms. Small served as Co-Chair (2000-2003) of the Annual Fund for the Fletcher School of Law and Diplomacy. |
William S. Stavropoulos (66) |
| Year of Election or Appointment: 2002 Mr. Stavropoulos is Chairman of the Board (2000-present) and a Member of the Board of Directors of The Dow Chemical Company. Since joining The Dow Chemical Company in 1967, Mr. Stavropoulos served in numerous senior management positions, including President (1993-2000; 2002-2003), CEO (1995-2000; 2002-2004), and Chairman of the Executive Committee (2000-2004). Currently, he is a Director of NCR Corporation (data warehousing and technology solutions), BellSouth Corporation (telecommunications), Chemical Financial Corporation, Maersk Inc. (industrial conglomerate, 2002-present), and Metalmark Capital (private equity investment firm, 2005-present). He also serves as a member of the Board of Trustees of the American Enterprise Institute for Public Policy Research. In addition, Mr. Stavropoulos is a member of The Business Council, J.P. Morgan International Council and the University of Notre Dame Advisory Council for the College of Science. |
Kenneth L. Wolfe (66) |
| Year of Election or Appointment: 2005 Mr. Wolfe also serves as a Trustee (2005-present) or Member of the Advisory Board (2004-present) of other investment companies advised by FMR. Prior to his retirement in 2001, Mr. Wolfe was Chairman and Chief Executive Officer of Hershey Foods Corporation (1993-2001). He currently serves as a member of the boards of Adelphia Communications Corporation (2003-present), Bausch & Lomb, Inc., and Revlon Inc. (2004-present). |
Annual Report
Advisory Board Members and Executive Officers:
Correspondence intended for Mr. Gamper may be sent to Fidelity Investments, P.O. Box 55235, Boston, Massachusetts 02205-5235. Correspondence intended for each executive officer and Mr. Lynch may be sent to Fidelity Investments, 82 Devonshire Street, Boston, Massachusetts 02109.
Name, Age; Principal Occupation |
Albert R. Gamper, Jr. (63) |
| Year of Election or Appointment: 2005 Member of the Advisory Board of Fidelity Securities Fund. Prior to his retirement in December 2004, Mr. Gamper served as Chairman of the Board of CIT Group Inc. (commercial finance). During his tenure with CIT Group Inc. Mr. Gamper served in numerous senior management positions, including Chairman (1987-1989; 1999-2001; 2002-2004), Chief Executive Officer (1987-2004), and President (1989-2002). He currently serves as a member of the Board of Directors of Public Service Enterprise Group (utilities, 2001-present), Chairman of the Board of Governors, Rutgers University (2004-present), and Chairman of the Board of Saint Barnabas Health Care System. |
Peter S. Lynch (61) |
| Year of Election or Appointment: 2003 Member of the Advisory Board of Fidelity Securities Fund. Vice Chairman and a Director of FMR, and Vice Chairman (2001-present) and a Director (2000-present) of FMR Co., Inc. Previously, Mr. Lynch served as a Trustee of the Fidelity funds (1990-2003). In addition, he serves as a Trustee of Boston College, Massachusetts Eye & Ear Infirmary, Historic Deerfield, John F. Kennedy Library, and the Museum of Fine Arts of Boston. |
Dwight D. Churchill (51) |
| Year of Election or Appointment: 2005 Vice President of Real Estate Income (2005-present). Mr. Churchill also serves as Vice President of certain Equity funds (2005-present) and certain High Income Funds (2005-present). Previously, he served as Head of Fidelity's Fixed-Income Division (2000-2005), Vice President of Fidelity's Money Market Funds (2000-2005), Vice President of Fidelity's Bond Funds, and Senior Vice President of FIMM (2000) and FMR. Mr. Churchill joined Fidelity in 1993 as Vice President and Group Leader of Taxable Fixed-Income Investments. |
Mark Snyderman (48) |
| Year of Election or Appointment: 2003 Vice President of Real Estate Income. Prior to assuming his current responsibilities, Mr. Snyderman served as an investment officer for commercial mortgage-backed securities in Fidelity's real estate group and as a portfolio manager of real estate stock and real estate bond mutual funds and institutional accounts. |
Eric D. Roiter (56) |
| Year of Election or Appointment: 2003 Secretary of Real Estate Income. He also serves as Secretary of other Fidelity funds; Vice President, General Counsel, and Secretary of FMR Co., Inc. (2001-present) and FMR; Assistant Secretary of Fidelity Management & Research (U.K.) Inc. (2001-present), Fidelity Management & Research (Far East) Inc. (2001-present), and Fidelity Investments Money Management, Inc. (2001-present). Mr. Roiter is an Adjunct Member, Faculty of Law, at Boston College Law School (2003-present). Previously, Mr. Roiter served as Vice President and Secretary of Fidelity Distributors Corporation (FDC) (1998-2005). |
Stuart Fross (45) |
| Year of Election or Appointment: 2003 Assistant Secretary of Real Estate Income. Mr. Fross also serves as Assistant Secretary of other Fidelity funds (2003-present), Vice President and Secretary of FDC (2005-present), and is an employee of FMR. |
Christine Reynolds (46) |
| Year of Election or Appointment: 2004 President, Treasurer, and Anti-Money Laundering (AML) officer of Real Estate Income. Ms. Reynolds also serves as President, Treasurer, and AML officer of other Fidelity funds (2004) and is a Vice President (2003) and an employee (2002) of FMR. Before joining Fidelity Investments, Ms. Reynolds worked at PricewaterhouseCoopers LLP (PwC) (1980-2002), where she was most recently an audit partner with PwC's investment management practice. |
Timothy F. Hayes (54) |
| Year of Election or Appointment: 2003 Chief Financial Officer of Real Estate Income. Mr. Hayes also serves as Chief Financial Officer of other Fidelity funds (2002-present) and President of Fidelity Investment Operations (2005-present) which includes Fidelity Pricing and Cash Management Services Group (FPCMS), where he served as President (1998-2005). Mr. Hayes serves as President of Fidelity Service Company (2003-present) where he also serves as a Director. Mr. Hayes also served as President of Fidelity Investments Operations Group (FIOG, 2002-2005). |
Kenneth A. Rathgeber (58) |
| Year of Election or Appointment: 2004 Chief Compliance Officer of Real Estate Income. Mr. Rathgeber also serves as Chief Compliance Officer of other Fidelity funds (2004) and Executive Vice President of Risk Oversight for Fidelity Investments (2002). Previously, he served as Executive Vice President and Chief Operating Officer for Fidelity Investments Institutional Services Company, Inc. (1998-2002). |
John R. Hebble (47) |
| Year of Election or Appointment: 2003 Deputy Treasurer of Real Estate Income. Mr. Hebble also serves as Deputy Treasurer of other Fidelity funds (2003), and is an employee of FMR. Before joining Fidelity Investments, Mr. Hebble worked at Deutsche Asset Management where he served as Director of Fund Accounting (2002-2003) and Assistant Treasurer of the Scudder Funds (1998-2003). |
Bryan A. Mehrmann (44) |
| Year of Election or Appointment: 2005 Deputy Treasurer of Real Estate Income. Mr. Mehrmann also serves as Deputy Treasurer of other Fidelity funds (2005-present) and is an employee of FMR. Previously, Mr. Mehrmann served as Vice President of Fidelity Investments Institutional Services Group (FIIS)/Fidelity Investments Institutional Operations Corporation, Inc. (FIIOC) Client Services (1998-2004). |
Kimberley H. Monasterio (41) |
| Year of Election or Appointment: 2004 Deputy Treasurer of Real Estate Income. Ms. Monasterio also serves as Deputy Treasurer of other Fidelity funds (2004) and is an employee of FMR (2004). Before joining Fidelity Investments, Ms. Monasterio served as Treasurer (2000-2004) and Chief Financial Officer (2002-2004) of the Franklin Templeton Funds and Senior Vice President of Franklin Templeton Services, LLC (2000-2004). |
Kenneth B. Robins (35) |
| Year of Election or Appointment: 2005 Deputy Treasurer of Real Estate Income. Mr. Robins also serves as Deputy Treasurer of other Fidelity funds (2005-present) and is an employee of FMR (2004-present). Before joining Fidelity Investments, Mr. Robins worked at KPMG LLP, where he was a partner in KPMG's department of professional practice (2002-2004) and a Senior Manager (1999-2000). In addition, Mr. Robins served as Assistant Chief Accountant, United States Securities and Exchange Commission (2000-2002). |
Robert G. Byrnes (38) |
| Year of Election or Appointment: 2005 Assistant Treasurer of Real Estate Income. Mr. Byrnes also serves as Assistant Treasurer of other Fidelity funds (2005-present) and is an employee of FMR (2005-present). Previously, Mr. Byrnes served as Vice President of FPCMS (2003-2005). Before joining Fidelity Investments, Mr. Byrnes worked at Deutsche Asset Management where he served as Vice President of the Investment Operations Group (2000-2003). |
John H. Costello (58) |
| Year of Election or Appointment: 2003 Assistant Treasurer of Real Estate Income. Mr. Costello also serves as Assistant Treasurer of other Fidelity funds and is an employee of FMR. |
Peter L. Lydecker (51) |
| Year of Election or Appointment: 2004 Assistant Treasurer of Real Estate Income. Mr. Lydecker also serves as Assistant Treasurer of other Fidelity funds (2004) and is an employee of FMR. |
Mark Osterheld (50) |
| Year of Election or Appointment: 2003 Assistant Treasurer of Real Estate Income. Mr. Osterheld also serves as Assistant Treasurer of other Fidelity funds (2002) and is an employee of FMR. |
Gary W. Ryan (46) |
| Year of Election or Appointment: 2005 Assistant Treasurer of Real Estate Income. Mr. Ryan also serves as Assistant Treasurer of other Fidelity funds (2005-present) and is an employee of FMR (2005-present). Previously, Mr. Ryan served as Vice President of Fund Reporting in FPCMS (1999-2005). |
Salvatore Schiavone (39) |
| Year of Election or Appointment: 2005 Assistant Treasurer of Real Estate Income. Mr. Schiavone also serves as Assistant Treasurer of other Fidelity funds (2005-present) and is an employee of FMR (2005-present). Before joining Fidelity Investments, Mr. Schiavone worked at Deutsche Asset Management, where he most recently served as Assistant Treasurer (2003-2005) of the Scudder Funds and Vice President and Head of Fund Reporting (1996-2003). |
Annual Report
Distributions
The Board of Trustees of Fidelity Real Estate Income voted to pay on September 12, 2005, to shareholders of record at the opening of business on September 9, 2005, a distribution of $.16 per share derived from capital gains realized from sales of portfolio securities and a dividend of $.17 per share from net investment income.
The fund hereby designates as capital gain dividends: For dividends with respect to the taxable year ended (July 31, 2005,) $7,076,881, or, if subsequently determined to be different, the net capital gain of such year, and for dividends with respect to the taxable year ended (July 31, 2004,) $5,195,727, or, if subsequently determined to be different, the excess of: (a) the net capital gain of such year, over (b) amounts previously designated as capital gain dividends with respect to such year.
A total of .11% of the dividends distributed during the fiscal year was derived from interest on U.S. Government securities which is generally exempt from state income tax.
The fund will notify shareholders in January 2006 of amounts for use in preparing 2005 income tax returns.
Annual Report
Board Approval of Investment Advisory Contracts and Management Fees
Fidelity Real Estate Income Fund
Each year, typically in July, the Board of Trustees, including the independent Trustees (together, the Board), votes on the renewal of the management contract and sub-advisory agreements (together, the Advisory Contracts) for the fund. The Board, assisted by the advice of fund counsel and independent Trustees' counsel, requests and considers a broad range of information throughout the year.
The Board meets regularly each month except August and takes into account throughout the year matters bearing on Advisory Contracts. The Board, acting directly and through its separate committees, considers at each of its meetings factors that are relevant to the annual renewal of the fund's Advisory Contracts, including the services and support provided to the fund and its shareholders by Fidelity. At the time of the renewal, the Board had 11 standing committees, each composed of independent Trustees with varying backgrounds, to which the Board has assigned specific subject matter responsibilities in order to enhance effective decision-making by the Board. Each committee has adopted a written charter outlining the structure and purposes of the committee. One such committee, the Equity Contract Committee, meets periodically during the first six months of each year and as necessary to consider matters specifically related to the annual renewal of Advisory Contracts. The committee requests and receives information on, and makes recommendations to the independent Trustees concerning, the approval and annual review of the Advisory Contracts.
At its July 2005 meeting, the Board of Trustees, including the independent Trustees, unanimously determined to renew the Advisory Contracts for the fund. In reaching its determination, the Board considered all factors it believed relevant, including (1) the nature, extent, and quality of the services to be provided to the fund and its shareholders by Fidelity (including the investment performance of the fund); (2) the competitiveness of the management fee and total expenses of the fund; (3) the total costs of the services to be provided by and the profits to be realized by the investment adviser and its affiliates from the relationship with the fund; (4) the extent to which economies of scale would be realized as the fund grows; and (5) whether fee levels reflect these economies of scale, if any, for the benefit of fund shareholders.
In determining whether to renew the Advisory Contracts for the fund, the Board ultimately reached a determination, with the assistance of fund counsel and independent Trustees' counsel, that the renewal of the Advisory Contracts and the compensation to be received by Fidelity under the management contract is consistent with Fidelity's fiduciary duty under applicable law. In addition to evaluating the specific factors noted above, the Board, in reaching its determination, is aware that shareholders in the fund have a broad range of investment choices available to them, including a wide choice among mutual funds offered by competitors to Fidelity, and that the fund's shareholders, with the opportunity to review and weigh the disclosure provided by the fund in its prospectus and other public disclosures, have chosen to invest in this fund, managed by Fidelity.
Annual Report
Nature, Extent, and Quality of Services Provided by Fidelity. The Board considered staffing within the investment adviser, FMR, and the sub-advisers (together, the Investment Advisers), including the background of the fund's portfolio manager and the fund's investment objective and discipline. The independent Trustees also had discussions with senior management of Fidelity's investment operations and investment groups. The Board considered the structure of the portfolio manager compensation program and whether this structure provides appropriate incentives.
Fidelity Resources Dedicated to Investment Management and Support Services. The Board reviewed the size, education, and experience of the Investment Advisers' investment staff, their use of technology, and the Investment Advisers' approach to recruiting, training, and retaining portfolio managers and other research, advisory, and management personnel. The Board considered Fidelity's extensive global research capabilities that enable the Investment Advisers to aggregate data from various sources in an effort to produce positive investment results. The Board noted that Fidelity's analysts have access to a variety of technological tools that enable them to perform both fundamental and quantitative analysis and to specialize in various disciplines. The Board also considered that Fidelity's portfolio managers and analysts have access to daily portfolio attribution that allows for monitoring of a fund's portfolio, as well as an electronic communication system that provides immediate real-time access to research concerning issuers and credit enhancers.
Shareholder and Administrative Services. The Board considered the nature, extent, quality, and cost of administrative, distribution, and shareholder services performed by the Investment Advisers and their affiliates under the Advisory Contracts and under separate agreements covering transfer agency, pricing and bookkeeping, and securities lending services for the fund. The Board also considered the nature and extent of the Investment Advisers' supervision of third party service providers, principally custodians and subcustodians. The Board reviewed the allocation of fund brokerage, including allocations to brokers affiliated with the Investment Advisers, the use of brokerage commissions to pay fund expenses, and the use of "soft" commission dollars to pay for research services. The Board also considered that Fidelity voluntarily decided in 2004 to stop using "soft" commission dollars to pay for market data and, instead, to pay for that data out of its own resources. The Board also considered the resources devoted to, and the record of compliance with, the fund's compliance policies and procedures.
The Board noted that the growth of fund assets across the complex allows Fidelity to reinvest in the development of services designed to enhance the value or convenience of the Fidelity funds as investment vehicles. These services include 24-hour access to account information and market information through phone representatives and over the Internet, and investor education materials and asset allocation tools.
Annual Report
Board Approval of Investment Advisory Contracts and
Management Fees - continued
Investment in a Large Fund Family. The Board considered the benefits to shareholders of investing in a Fidelity fund, including the benefits of investing in a fund that is part of a large family of funds offering a variety of investment disciplines and providing for a large variety of mutual fund investor services. For example, fund shareholders are offered the privilege of exchanging shares of the fund for shares of other Fidelity funds, as set forth in the fund's prospectus, without paying a sales charge. The Board noted that, since the last Advisory Contract renewals in July 2004, Fidelity has taken a number of actions that benefited particular funds, including (i) voluntarily deciding in 2004 to stop using "soft" commission dollars to pay for market data and, instead, to pay for that data out of its own resources, (ii) contractually agreeing to impose management fee reductions and expense limitations on its five Spartan stock index funds and its stock index fund available through variable insurance products, (iii) contractually agreeing to eliminate the management fees on the Fidelity Freedom Funds and the Fidelity Advisor Freedom Funds, (iv) contractually agreeing to reduce the management fees on most of its investment-grade taxable bond funds, and (v) contractually agreeing to impose expense limitations on its retail and Spartan investment-grade taxable bond funds.
Investment Performance and Compliance. The Board considered whether the fund has operated within its investment objective, as well as its record of compliance with its investment restrictions. It also reviewed the fund's absolute investment performance, as well as the fund's relative investment performance measured against (i) a broad-based securities market index, and (ii) a peer group of mutual funds. Because the fund had been in existence less than three calendar years, the following chart considered by the Board shows, for the one-year period ended December 31, 2004, the fund's return, the return of a broad-based securities market index ("benchmark"), and a range of returns of a peer group of mutual funds identified by Lipper Inc. as having an investment objective similar to that of the fund. The box within the chart shows the 25th percentile return (bottom of box) and the 75th percentile return (top of box) of the Lipper peer group. Returns shown above the box are in the first quartile and returns shown below the box are in the fourth quartile. The percentage beaten number noted below the chart corresponds to the percentile box and represents the percentage of funds in the Lipper peer group whose performance was equal to or lower than that of the fund.
Annual Report
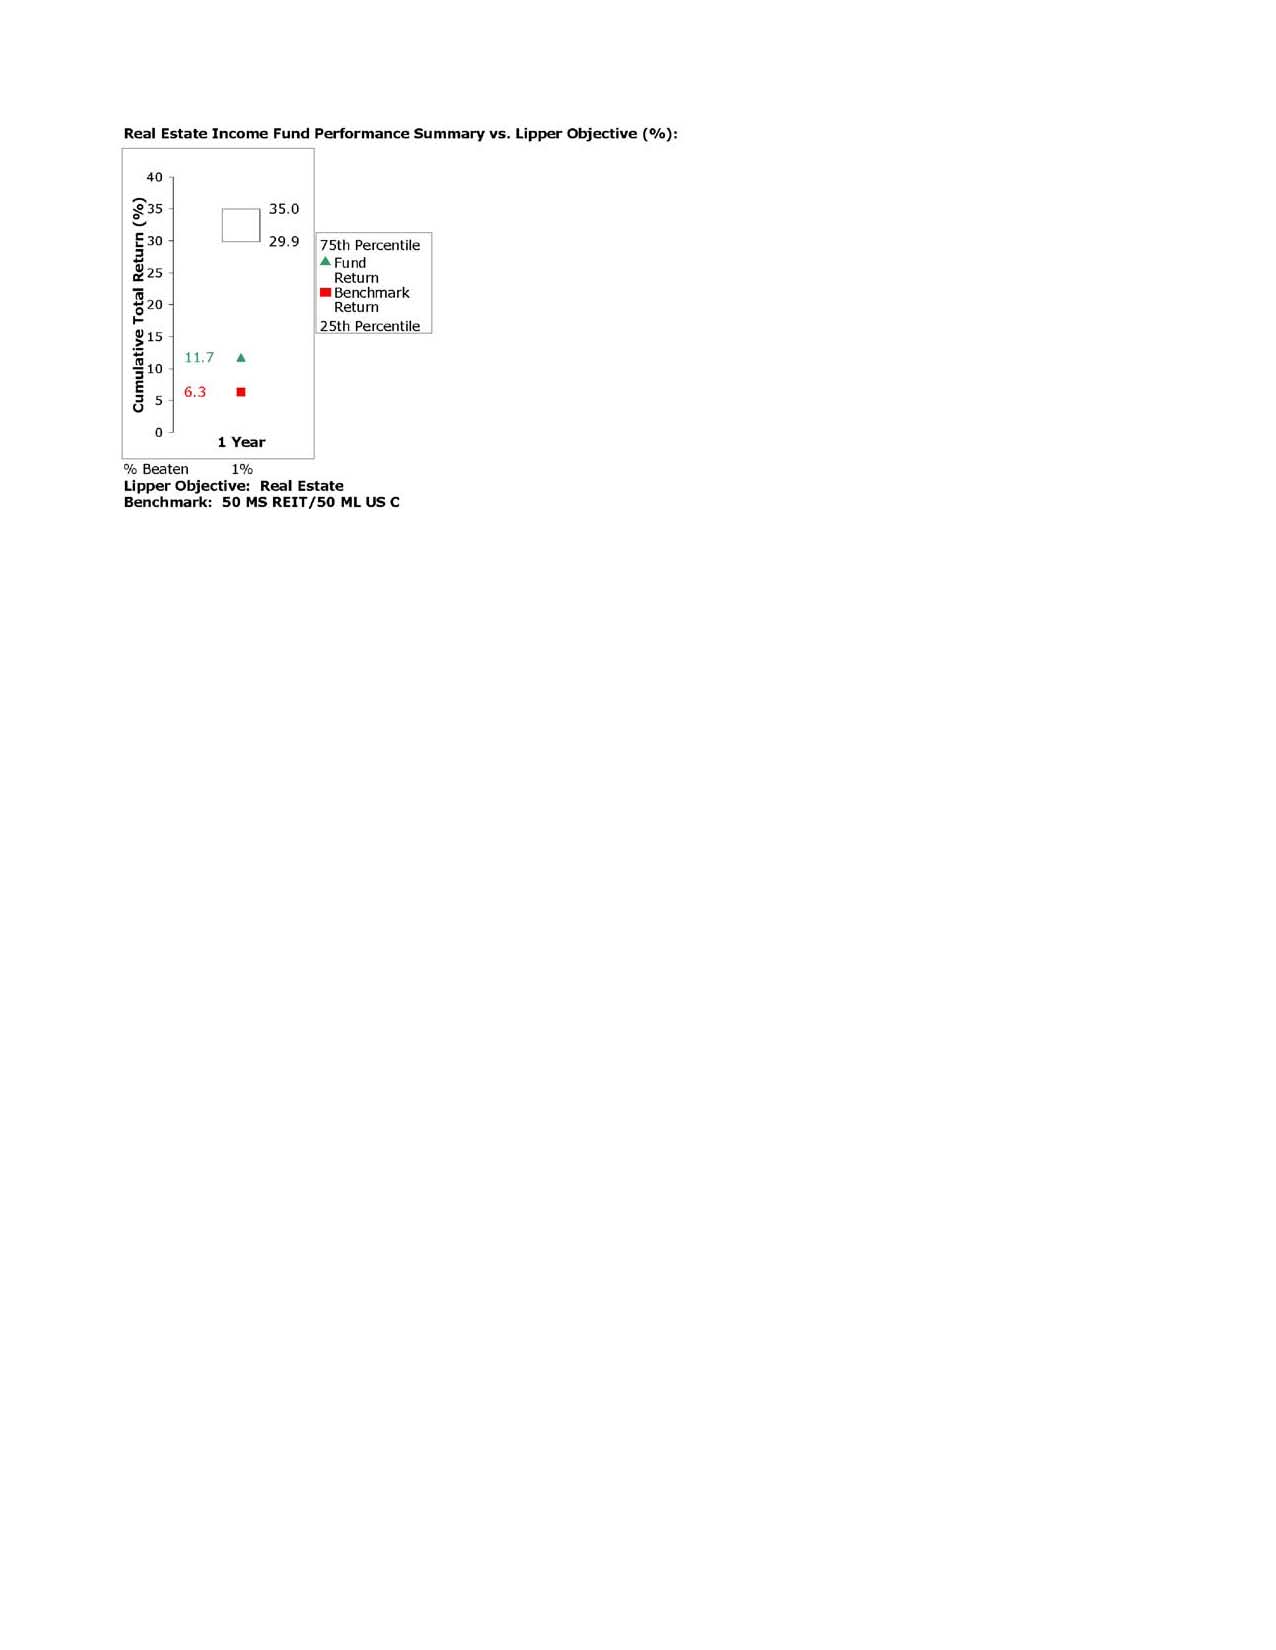
The Board reviewed the fund's relative investment performance against its Lipper peer group and stated that the performance of the fund was in the fourth quartile for the one-year period. The Board noted that FMR does not consider that Lipper peer group to be a meaningful comparison for the fund, however, because unlike many of its peers, the fund has a principal investment strategy of normally investing in preferred and common stocks of REITs and debt securities of real estate entities. The Board also stated that the relative investment performance of the fund compared favorably to its benchmark for the one-year period. The Board stated that it is difficult to evaluate in any comprehensive fashion the performance of the fund, in light of its relatively recent launch.
The Board has had thorough discussions with FMR throughout the year about the Board's and FMR's concerns about equity research, equity fund performance, and compliance with internal policies governing gifts and entertainment. FMR has taken steps that it believes will refocus and strengthen equity research and equity portfolio management and compliance. The Board noted with favor FMR's recent reorganization of its senior management team and FMR's plans to dedicate additional resources to investment research, and participated in the process that led to those changes.
Based on its review, and giving particular weight to the nature and quality of the resources dedicated by the Investment Advisers to maintain and improve relative performance, the Board concluded that the nature, extent, and quality of the services provided by Fidelity will benefit the fund's shareholders, particularly in light of the Board's view that the fund's shareholders benefit from investing in a fund that is part of a large family of funds offering a variety of investment disciplines and services.
Annual Report
Board Approval of Investment Advisory Contracts and
Management Fees - continued
Competitiveness of Management Fee and Total Fund Expenses. The Board considered the fund's management fee and total expenses compared to "mapped groups" of competitive funds and classes. Fidelity creates "mapped groups" by combining similar Lipper investment objective categories that have comparable management fee characteristics. Combining Lipper investment objective categories aids the Board's management fee and total expense comparisons by broadening the competitive group used for comparison and by reducing the number of universes to which various Fidelity funds are compared.
The Board considered two proprietary management fee comparisons for the 12-month (or shorter) periods shown in the chart below. The group of Lipper funds used by the Board for management fee comparisons is referred to below as the "Total Mapped Group" and, for the reasons explained above, is broader than the Lipper peer group used by the Board for performance comparisons. The Total Mapped Group comparison focuses on a fund's standing relative to the total universe of comparable funds available to investors, in terms of gross management fees before expense reimbursements or caps. "TMG %" represents the percentage of funds in the Total Mapped Group that had management fees that were lower than the fund's. For example, a TMG % of 30% means that 70% of the funds in the Total Mapped Group had higher management fees than the fund. The "Asset-Size Peer Group" (ASPG) comparison focuses on a fund's standing relative to non-Fidelity funds similar in size to the fund within the Total Mapped Group. The ASPG represents at least 15% of the funds in the Total Mapped Group with comparable asset size and management fee characteristics, subject to a minimum of 50 funds (or all funds in the Total Mapped Group if fewer than 50). Additional information, such as the ASPG quartile ("quadrant") in which the fund's management fee ranked, is also included in the chart and considered by the Board.
Annual Report
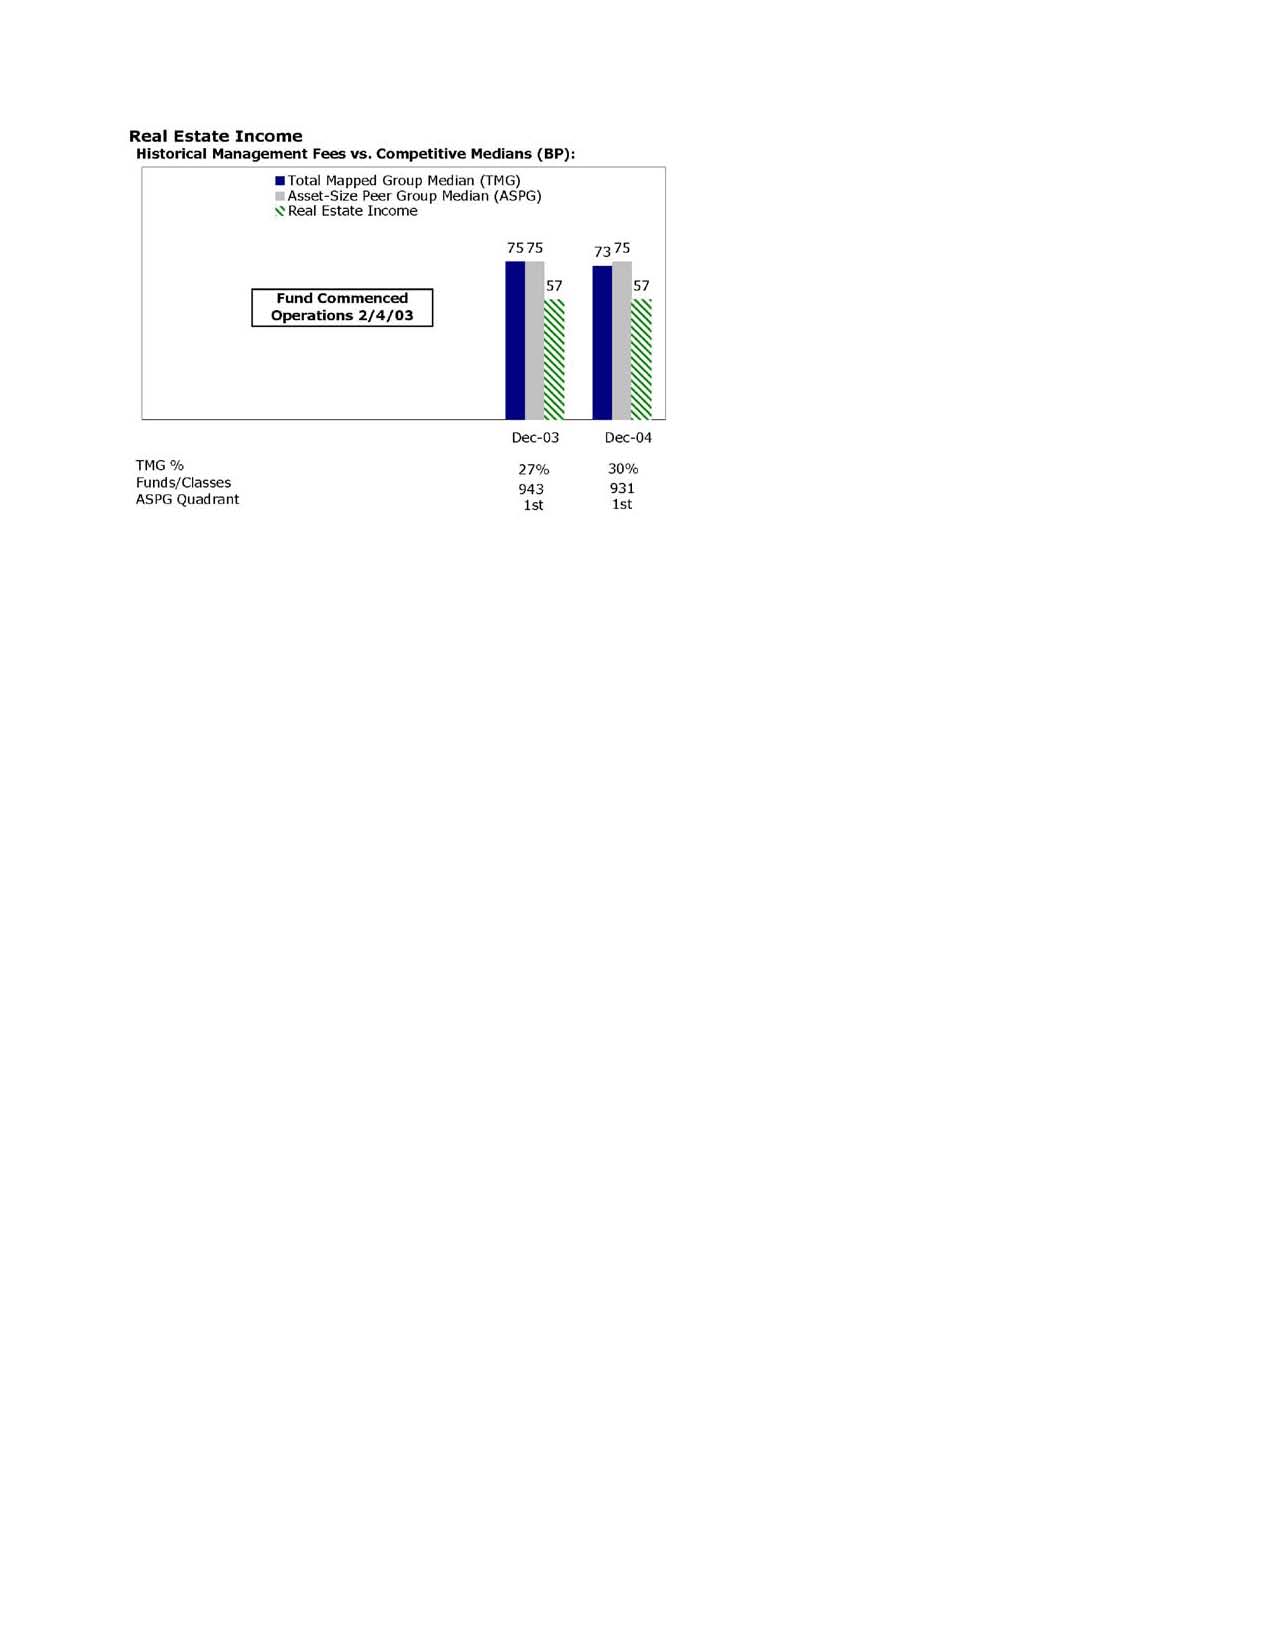
The Board noted that the fund's management fee ranked below the median of its Total Mapped Group and below the median of its ASPG for 2004.
Based on its review, the Board concluded that the fund's management fee was fair and reasonable in light of the services that the fund receives and the other factors considered.
In its review of the fund's total expenses, the Board considered the fund's management fee as well as other fund expenses, such as transfer agent fees, pricing and bookkeeping fees, and custodial, legal, and audit fees. The Board also noted the effects of any waivers and reimbursements on fees and expenses. As part of its review, the Board also considered current and historical total expenses of the fund compared to competitive fund median expenses. The fund is compared to those funds and classes in the Total Mapped Group (used by the Board for management fee comparisons) that have a similar sales load structure.
The Board noted that the fund's total expenses ranked below its competitive median for 2004.
In its review of total expenses, the Board also considered Fidelity fee structures and other information on clients that FMR and its affiliates service in other competitive markets, such as other mutual funds advised or subadvised by FMR or its affiliates, pension plan clients, and other institutional clients.
Based on its review, the Board concluded that the fund's total expenses were reasonable in light of the services that the fund and its shareholders receive and the other factors considered.
Annual Report
Board Approval of Investment Advisory Contracts and
Management Fees - continued
Costs of the Services and Profitability. The Board considered the revenues earned and the expenses incurred by Fidelity in conducting the business of developing, marketing, distributing, managing, administering and servicing the fund and its shareholders. The Board also considered the level of Fidelity's profits in respect of all the Fidelity funds.
On an annual basis, FMR presents to the Board Fidelity's profitability for the fund. Fidelity calculates the profitability for each fund, as well as aggregate profitability for groups of Fidelity funds and all Fidelity funds, using a series of detailed revenue and cost allocation methodologies which originate with the audited books and records of Fidelity. The Audit Committee of the Board reviews any significant changes from the prior year's methodologies.
PricewaterhouseCoopers LLP (PwC), independent registered accounting firm and auditor to Fidelity and certain Fidelity funds, has been engaged annually by the Board as part of the Board's assessment of the results of Fidelity's profitability analysis. PwC's engagement includes the review and assessment of Fidelity's methodologies used in determining the revenues and expenses attributable to Fidelity's mutual fund business, and completion of agreed-upon procedures surrounding the mathematical accuracy of fund profitability and its conformity to allocation methodologies. After considering PwC's reports issued under the engagement and information provided by Fidelity, the Board believes that while other allocation methods may also be reasonable, Fidelity's profitability methodologies are reasonable in all material respects.
The Board has also reviewed Fidelity's non-fund businesses and any fall-out benefits related to the mutual fund business as well as cases where Fidelity's affiliates may benefit from or be related to the fund's business. In addition, a special committee of the Board reviewed services provided to Fidelity by its affiliates and determined that the fees that Fidelity paid for such services were reasonable.
The Board considered the costs of the services provided by and the profits realized by Fidelity in connection with the operation of the fund and determined that the amount of profit is a fair entrepreneurial profit for the management of the fund.
Economies of Scale. The Board considered whether there have been economies of scale in respect of the management of the Fidelity funds, whether the Fidelity funds (including the fund) have appropriately benefited from any such economies of scale, and whether there is potential for realization of any further economies of scale. The Board considered the extent to which the fund will benefit from economies of scale through increased services to the fund, through waivers or reimbursements, or through fee or expense reductions, including reductions that occur through operation of the transfer agent agreement. The transfer agent fee varies in part based on the number of accounts in the fund. If the number of accounts decreases or the average account size increases, the overall transfer agent fee rate decreases.
Annual Report
The Board recognized that the fund's management contract incorporates a "group fee" structure, which provides for lower fee rates as total fund assets under FMR's management increase, and for higher fee rates as total fund assets under FMR's management decrease. The Board considered that the group fee is designed to deliver the benefits of economies of scale to fund shareholders when total fund assets increase, even if assets of any particular fund are unchanged or have declined, because some portion of Fidelity's costs are attributable to services provided to all Fidelity funds, and all funds benefit if those costs can be allocated among more assets. The Board concluded that, given the group fee structure, fund shareholders will achieve a certain level of economies of scale as assets under FMR's management increase at the fund complex level, regardless of whether Fidelity achieves any such economies of scale.
The Board further concluded that any potential economies of scale are being shared between fund shareholders and Fidelity in an appropriate manner.
Additional Information Requested by the Board. In order to develop fully the factual basis for consideration of the Advisory Contracts, the Board requested additional information regarding (i) equity fund transfer agency fees; (ii) Fidelity's fund profitability methodology and the impact of various changes in the methodology over time; (iii) benefits to shareholders from economies of scale; (iv) composition and characteristics of various fund and industry data used in comparisons; and (v) compensation of portfolio managers and research analysts.
Based on its evaluation of all of the conclusions noted above, and after considering all material factors, the Board ultimately concluded that the existing advisory fee structures are fair and reasonable, and that the fund's existing Advisory Contracts should be renewed.
Annual Report
The following is a complete listing of investments for Fidelity's
fixed-income central fund as of July 31, 2005 which is a
direct or indirect investment of Real Estate Income Fund.
These underlying holdings of the Fidelity fixed-income central fund
are not included in the Schedule of Investments as
part of the Financial Statements.
Annual Report
Fidelity Ultra-Short Central Fund
Investments July 31, 2005 (Unaudited)
Showing Percentage of Net Assets
Nonconvertible Bonds - 3.8% |
| Principal Amount | | Value |
CONSUMER DISCRETIONARY - 1.0% |
Auto Components - 0.3% |
DaimlerChrysler NA Holding Corp.: | | | | |
3.8594% 9/10/07 (f) | | $ 16,665,000 | | $ 16,698,830 |
3.8938% 5/24/06 (f) | | 4,700,000 | | 4,713,691 |
| | 21,412,521 |
Media - 0.7% |
Continental Cablevision, Inc. 8.3% 5/15/06 | | 8,000,000 | | 8,248,640 |
Cox Communications, Inc. (Reg. S) 3.95% 12/14/07 (f) | | 12,140,000 | | 12,202,691 |
Liberty Media Corp. 4.91% 9/17/06 (f) | | 16,694,000 | | 16,786,986 |
Univision Communications, Inc. 2.875% 10/15/06 | | 8,505,000 | | 8,315,339 |
| | 45,553,656 |
TOTAL CONSUMER DISCRETIONARY | | 66,966,177 |
ENERGY - 0.2% |
Oil, Gas & Consumable Fuels - 0.2% |
Valero Energy Corp. 7.375% 3/15/06 | | 11,550,000 | | 11,735,435 |
FINANCIALS - 1.0% |
Capital Markets - 0.1% |
State Street Capital Trust II 3.7681% 2/15/08 (f) | | 10,000,000 | | 10,002,260 |
Commercial Banks - 0.3% |
Wells Fargo & Co. 3.4194% 3/10/08 (f) | | 16,600,000 | | 16,599,452 |
Consumer Finance - 0.2% |
General Motors Acceptance Corp. 4.87% 10/20/05 (f) | | 14,765,000 | | 14,786,188 |
Thrifts & Mortgage Finance - 0.4% |
Countrywide Financial Corp. 3.71% 4/11/07 (f) | | 11,025,000 | | 11,032,034 |
Residential Capital Corp. 4.835% 6/29/07 (c)(f) | | 14,150,000 | | 14,164,716 |
| | 25,196,750 |
TOTAL FINANCIALS | | 66,584,650 |
TELECOMMUNICATION SERVICES - 1.3% |
Diversified Telecommunication Services - 1.2% |
British Telecommunications PLC 7.875% 12/15/05 | | 18,145,000 | | 18,397,070 |
France Telecom SA 7.45% 3/1/06 (a) | | 5,600,000 | | 5,699,484 |
GTE Corp. 6.36% 4/15/06 | | 9,000,000 | | 9,126,405 |
SBC Communications, Inc. 4.389% 6/5/06 (c) | | 15,315,000 | | 15,319,595 |
Sprint Capital Corp. 4.78% 8/17/06 | | 6,000,000 | | 6,020,550 |
Telefonica Europe BV 7.35% 9/15/05 | | 4,500,000 | | 4,517,537 |
Nonconvertible Bonds - continued |
| Principal Amount | | Value |
TELECOMMUNICATION SERVICES - continued |
Diversified Telecommunication Services - continued |
Telefonos de Mexico SA de CV 4.5% 11/19/08 | | $ 10,240,000 | | $ 10,092,268 |
TELUS Corp. yankee 7.5% 6/1/07 | | 6,500,000 | | 6,835,569 |
| | 76,008,478 |
Wireless Telecommunication Services - 0.1% |
AT&T Wireless Services, Inc. 7.35% 3/1/06 | | 5,500,000 | | 5,596,976 |
TOTAL TELECOMMUNICATION SERVICES | | 81,605,454 |
UTILITIES - 0.3% |
Electric Utilities - 0.2% |
Pinnacle West Energy Corp. 4.0044% 4/1/07 (c)(f) | | 12,800,000 | | 12,800,794 |
Gas Utilities - 0.1% |
NiSource Finance Corp. 7.625% 11/15/05 | | 9,250,000 | | 9,342,213 |
TOTAL UTILITIES | | 22,143,007 |
TOTAL NONCONVERTIBLE BONDS (Cost $249,397,779) | 249,034,723 |
U.S. Government Agency Obligations - 0.0% |
|
Fannie Mae 0% 9/28/05 (e)
(Cost $994,579) | | 1,000,000 | | 994,635 |
Asset-Backed Securities - 35.2% |
|
Accredited Mortgage Loan Trust: | | | | |
Series 2004-2 Class A2, 3.76% 7/25/34 (f) | | 7,964,683 | | 7,978,722 |
Series 2004-3 Class 2A4, 3.81% 10/25/34 (f) | | 10,915,000 | | 10,946,584 |
Series 2004-4 Class A2D, 3.81% 1/25/35 (f) | | 3,579,364 | | 3,588,366 |
Series 2005-1: | | | | |
Class M1, 3.93% 4/25/35 (f) | | 11,280,000 | | 11,251,882 |
Class M2, 4.15% 4/25/35 (f) | | 5,275,000 | | 5,276,901 |
ACE Securities Corp.: | | | | |
Series 2002-HE1 Class M1, 4.11% 6/25/32 (f) | | 1,308,761 | | 1,318,432 |
Series 2002-HE2 Class M1, 4.31% 8/25/32 (f) | | 18,631,213 | | 18,704,611 |
Series 2003-FM1 Class M2, 5.31% 11/25/32 (f) | | 3,015,000 | | 3,050,466 |
Series 2003-HS1: | | | | |
Class M1, 4.21% 6/25/33 (f) | | 800,000 | | 803,485 |
Class M2, 5.21% 6/25/33 (f) | | 856,000 | | 871,093 |
Asset-Backed Securities - continued |
| Principal Amount | | Value |
ACE Securities Corp.: - continued | | | | |
Series 2003-NC1 Class M1, 4.24% 7/25/33 (f) | | $ 1,600,000 | | $ 1,611,660 |
Series 2004-HE1: | | | | |
Class M1, 3.96% 2/25/34 (f) | | 2,193,000 | | 2,193,772 |
Class M2, 4.56% 2/25/34 (f) | | 2,475,000 | | 2,476,241 |
Series 2004-OP1: | | | | |
Class M1, 3.98% 4/25/34 (f) | | 4,420,000 | | 4,424,344 |
Class M2, 4.51% 4/25/34 (f) | | 6,240,000 | | 6,251,080 |
Series 2005-HE2: | | | | |
Class M1, 3.9% 4/25/35 (f) | | 1,530,000 | | 1,527,965 |
Class M2, 3.91% 4/25/35 (f) | | 1,803,000 | | 1,796,836 |
Class M3, 3.94% 4/25/35 (f) | | 1,040,000 | | 1,038,647 |
Class M4, 4.1% 4/25/35 (f) | | 1,340,000 | | 1,338,268 |
Series 2005-HE3: | | | | |
Class A2A, 3.56% 5/25/35 (f) | | 8,063,511 | | 8,063,822 |
Class A2B, 3.67% 5/25/35 (f) | | 4,370,000 | | 4,366,352 |
Series 2005-SD1 Class A1, 3.86% 11/25/50 (f) | | 2,563,309 | | 2,566,464 |
Aesop Funding II LLC Series 2005-1A Class A2, 3.49% 4/20/09 (c)(f) | | 8,800,000 | | 8,765,680 |
American Express Credit Account Master Trust: | | | | |
Series 2002-6 Class B, 3.8381% 3/15/10 (f) | | 5,000,000 | | 5,030,751 |
Series 2004-1 Class B, 3.6381% 9/15/11 (f) | | 5,775,000 | | 5,797,723 |
Series 2004-C Class C, 3.8881% 2/15/12 (c)(f) | | 17,323,520 | | 17,374,643 |
Series 2005-1 Class A, 3.4181% 10/15/12 (f) | | 15,455,000 | | 15,481,600 |
AmeriCredit Automobile Receivables Trust: | | | | |
Series 2002-EM Class A4A, 3.67% 6/8/09 | | 25,000,000 | | 24,899,223 |
Series 2003-AM: | | | | |
Class A3B, 3.71% 6/6/07 (f) | | 685,806 | | 685,879 |
Class A4B, 3.81% 11/6/09 (f) | | 12,400,000 | | 12,441,657 |
Series 2003-BX Class A4B, 3.72% 1/6/10 (f) | | 3,265,000 | | 3,275,694 |
Series 2003-CF Class A3, 2.75% 10/9/07 | | 12,249,371 | | 12,210,791 |
Series 2005-1 Class C, 4.73% 7/6/10 | | 15,500,000 | | 15,451,950 |
Ameriquest Mortgage Securities, Inc.: | | | | |
Series 2002-3 Class M1, 4.16% 8/25/32 (f) | | 5,000,000 | | 5,028,248 |
Series 2003-1: | | | | |
Class A2, 3.87% 2/25/33 (f) | | 465,695 | | 465,917 |
Class M1, 4.36% 2/25/33 (f) | | 6,150,000 | | 6,197,846 |
Series 2003-3: | | | | |
Class M1, 4.26% 3/25/33 (f) | | 1,590,000 | | 1,603,481 |
Class S, 5% 9/25/05 (g) | | 4,457,447 | | 17,215 |
Series 2003-6: | | | | |
Class M1, 4.22% 8/25/33 (f) | | 7,560,000 | | 7,611,224 |
Asset-Backed Securities - continued |
| Principal Amount | | Value |
Ameriquest Mortgage Securities, Inc.: - continued | | | | |
Series 2003-6: | | | | |
Class M2, 5.31% 5/25/33 (f) | | $ 2,750,000 | | $ 2,808,476 |
Series 2003-AR1 Class M1, 4.61% 1/25/33 (f) | | 7,000,000 | | 7,072,631 |
Series 2004-R2: | | | | |
Class M1, 3.89% 4/25/34 (f) | | 1,230,000 | | 1,229,949 |
Class M2, 3.94% 4/25/34 (f) | | 950,000 | | 949,960 |
Class M3, 4.01% 4/25/34 (f) | | 3,500,000 | | 3,499,854 |
Class M4, 4.51% 4/25/34 (f) | | 4,500,000 | | 4,499,807 |
Series 2004-R9 Class A3, 3.78% 10/25/34 (f) | | 9,340,000 | | 9,359,871 |
Series 2005-R1: | | | | |
Class M1, 3.91% 3/25/35 (f) | | 5,710,000 | | 5,691,308 |
Class M2, 3.94% 3/25/35 (f) | | 1,925,000 | | 1,918,868 |
Series 2005-R2 Class M1, 3.91% 4/25/35 (f) | | 12,500,000 | | 12,482,516 |
Amortizing Residential Collateral Trust: | | | | |
Series 2002-BC3 Class A, 3.79% 6/25/32 (f) | | 2,411,175 | | 2,418,495 |
Series 2002-BC6 Class M1, 4.21% 8/25/32 (f) | | 24,900,000 | | 25,116,817 |
Series 2002-BC7: | | | | |
Class M1, 4.1144% 10/25/32 (f) | | 10,000,000 | | 10,075,000 |
Class M2, 4.36% 10/25/32 (f) | | 5,575,000 | | 5,612,067 |
Series 2003-BC1 Class M2, 4.56% 1/25/32 (f) | | 758,836 | | 762,333 |
ARG Funding Corp.: | | | | |
Series 2005-1A Class A2, 3.53% 4/20/09 (c)(f) | | 11,000,000 | | 10,975,938 |
Series 2005-2A Class A2, 3.54% 5/20/09 (c)(f) | | 5,200,000 | | 5,190,453 |
Argent Securities, Inc.: | | | | |
Series 2003-W3 Class M2, 5.26% 9/25/33 (f) | | 20,000,000 | | 20,599,990 |
Series 2003-W7 Class A2, 3.85% 3/1/34 (f) | | 4,505,856 | | 4,515,756 |
Series 2004-W5 Class M1, 4.06% 4/25/34 (f) | | 3,960,000 | | 3,964,768 |
Series 2004-W7: | | | | |
Class M1, 4.01% 5/25/34 (f) | | 4,085,000 | | 4,084,827 |
Class M2, 4.06% 5/25/34 (f) | | 3,320,000 | | 3,319,860 |
Asset Backed Securities Corp. Home Equity Loan Trust: | | | | |
Series 2003-HE2: | | | | |
Class A2, 3.7681% 4/15/33 (f) | | 1,158,706 | | 1,159,186 |
Class M1, 4.2881% 4/15/33 (f) | | 11,365,000 | | 11,429,103 |
Series 2003-HE3: | | | | |
Class M1, 4.2181% 6/15/33 (f) | | 2,185,000 | | 2,198,827 |
Class M2, 5.3881% 6/15/33 (f) | | 10,000,000 | | 10,182,465 |
Series 2003-HE4 Class M2, 5.3881% 8/15/33 (f) | | 5,695,000 | | 5,798,650 |
Series 2003-HE5 Class A2A, 3.7481% 8/15/33 (f) | | 1,380,797 | | 1,381,390 |
Series 2003-HE6 Class M1, 4.11% 11/25/33 (f) | | 3,475,000 | | 3,490,373 |
Series 2004-HE2 Class M1, 4.01% 4/25/34 (f) | | 6,060,000 | | 6,070,769 |
Series 2004-HE3: | | | | |
Class M1, 4% 6/25/34 (f) | | 1,450,000 | | 1,454,353 |
Asset-Backed Securities - continued |
| Principal Amount | | Value |
Asset Backed Securities Corp. Home Equity Loan Trust: - continued | | | | |
Series 2004-HE3: | | | | |
Class M2, 4.58% 6/25/34 (f) | | $ 3,350,000 | | $ 3,386,297 |
Series 2004-HE6 Class A2, 3.82% 6/25/34 (f) | | 17,398,791 | | 17,435,568 |
Series 2005-HE2: | | | | |
Class M1, 3.91% 3/25/35 (f) | | 8,250,000 | | 8,235,989 |
Class M2, 3.96% 3/25/35 (f) | | 2,065,000 | | 2,065,671 |
Series 2005-HE6 Class A2B, 3.76% 8/25/35 (d)(f) | | 10,000,000 | | 10,000,000 |
Bank One Issuance Trust: | | | | |
Series 2002-B1 Class B1, 3.7681% 12/15/09 (f) | | 20,655,000 | | 20,741,067 |
Series 2002-B2 Class B2, 3.7281% 5/15/08 (f) | | 15,000,000 | | 15,001,929 |
Series 2002-B3 Class B, 3.7481% 8/15/08 (f) | | 14,500,000 | | 14,505,871 |
Series 2002-C1 Class C1, 4.3481% 12/15/09 (f) | | 7,980,000 | | 8,065,464 |
Series 2002-C2 Class C2, 4.3781% 5/15/08 (f) | | 35,785,000 | | 35,817,626 |
Bayview Financial Acquisition Trust Series 2004-C Class A1, 3.9013% 5/28/44 (f) | | 8,416,440 | | 8,415,509 |
Bayview Financial Asset Trust Series 2000-F Class A, 3.9813% 9/28/43 (f) | | 9,618,786 | | 9,632,318 |
Bayview Financial Mortgage Loan Trust Series 2004-A Class A, 3.9313% 2/28/44 (f) | | 5,760,012 | | 5,771,599 |
Bear Stearns Asset Backed Securities I: | | | | |
Series 2005-HE2: | | | | |
Class M1, 3.96% 2/25/35 (f) | | 6,655,000 | | 6,639,262 |
Class M2, 4.21% 2/25/35 (f) | | 2,430,000 | | 2,432,538 |
Series 2005-HE5 Class 1A1, 3.4244% 6/25/35 (f) | | 10,884,395 | | 10,884,395 |
Capital Auto Receivables Asset Trust: | | | | |
Series 2002-5 Class B, 2.8% 4/15/08 | | 2,894,887 | | 2,868,235 |
Series 2003-1 Class B, 3.8581% 6/15/10 (c)(f) | | 5,781,229 | | 5,797,579 |
Series 2003-2 Class B, 3.6681% 1/15/09 (f) | | 2,741,542 | | 2,746,505 |
Series 2005-1 Class B, 3.7631% 6/15/10 (f) | | 5,725,000 | | 5,730,367 |
Capital One Auto Finance Trust: | | | | |
Series 2003-A Class A4B, 3.6681% 1/15/10 (f) | | 9,630,000 | | 9,654,568 |
Series 2004-B Class A4, 3.4981% 8/15/11 (f) | | 16,300,000 | | 16,303,123 |
Capital One Master Trust: | | | | |
Series 1999-3 Class B, 3.8681% 9/15/09 (f) | | 5,000,000 | | 5,004,082 |
Series 2001-1 Class B, 3.8981% 12/15/10 (f) | | 19,500,000 | | 19,638,608 |
Series 2001-8A Class B, 3.9381% 8/17/09 (f) | | 9,585,000 | | 9,634,206 |
Series 2002-4A Class B, 3.8881% 3/15/10 (f) | | 6,000,000 | | 6,028,221 |
Capital One Multi-Asset Execution Trust: | | | | |
Series 2002-B1 Class B1, 4.0681% 7/15/08 (f) | | 17,705,000 | | 17,711,976 |
Series 2003-B1 Class B1, 4.5581% 2/17/09 (f) | | 15,470,000 | | 15,566,773 |
Capital Trust Ltd. Series 2004-1: | | | | |
Class A2, 3.88% 7/20/39 (c)(f) | | 2,968,000 | | 2,968,000 |
Asset-Backed Securities - continued |
| Principal Amount | | Value |
Capital Trust Ltd. Series 2004-1: - continued | | | | |
Class B, 4.18% 7/20/39 (c)(f) | | $ 1,550,000 | | $ 1,550,000 |
Class C, 4.53% 7/20/39 (c)(f) | | 1,994,000 | | 1,994,000 |
CDC Mortgage Capital Trust: | | | | |
Series 2001-HE1 Class M1, 4.49% 1/25/32 (f) | | 4,244,221 | | 4,254,278 |
Series 2002-HE2 Class M1, 4.16% 1/25/33 (f) | | 9,278,431 | | 9,309,123 |
Series 2002-HE3: | | | | |
Class M1, 4.56% 3/25/33 (f) | | 21,339,884 | | 21,627,815 |
Class M2, 5.71% 3/25/33 (f) | | 9,968,976 | | 10,143,974 |
Series 2003-HE1: | | | | |
Class M1, 4.36% 8/25/33 (f) | | 1,989,998 | | 1,997,574 |
Class M2, 5.41% 8/25/33 (f) | | 4,369,996 | | 4,422,084 |
Series 2003-HE2 Class A, 3.81% 10/25/33 (f) | | 1,634,377 | | 1,635,405 |
Series 2003-HE3: | | | | |
Class M1, 4.16% 11/25/33 (f) | | 2,254,989 | | 2,271,960 |
Class M2, 5.21% 11/25/33 (f) | | 1,719,992 | | 1,753,552 |
Series 2004-HE2 Class M2, 4.66% 7/26/34 (f) | | 2,345,000 | | 2,365,939 |
Chase Credit Card Owner Trust: | | | | |
Series 2001-6 Class B, 3.8681% 3/16/09 (f) | | 1,305,000 | | 1,311,169 |
Series 2002-6 Class B, 3.7381% 1/15/08 (f) | | 11,850,000 | | 11,852,472 |
Series 2004-1 Class B, 3.5881% 5/15/09 (f) | | 4,105,000 | | 4,104,204 |
Citibank Credit Card Issuance Trust: | | | | |
Series 2000-C2 Class C2, 4.2488% 10/15/07 (f) | | 17,500,000 | | 17,511,349 |
Series 2001-B2 Class B2, 3.8494% 12/10/08 (f) | | 11,945,000 | | 11,995,341 |
Series 2002-B1 Class B1, 3.8% 6/25/09 (f) | | 9,010,000 | | 9,038,878 |
Series 2002-C1 Class C1, 4.2185% 2/9/09 (f) | | 17,500,000 | | 17,686,918 |
Series 2003-B1 Class B1, 3.66% 3/7/08 (f) | | 25,000,000 | | 25,022,693 |
Series 2003-C1 Class C1, 4.65% 4/7/10 (f) | | 17,785,000 | | 18,152,159 |
Citigroup Mortgage Loan Trust Series 2003-HE4 Class A, 3.87% 12/25/33 (c)(f) | | 7,985,107 | | 7,985,935 |
CNH Wholesale Master Note Trust Series 2005-1: | | | | |
Class A, 3.43% 6/15/11 (f) | | 18,000,000 | | 18,000,000 |
Class B, 3.72% 6/15/11 (f) | | 2,280,000 | | 2,280,000 |
Countrywide Home Loans, Inc.: | | | | |
Series 2002-6 Class AV1, 3.89% 5/25/33 (f) | | 1,499,863 | | 1,503,470 |
Series 2003-BC1 Class M2, 5.46% 9/25/32 (f) | | 11,065,000 | | 11,199,451 |
Series 2003-SD3 Class A1, 3.88% 12/25/32 (c)(f) | | 927,188 | | 931,926 |
Series 2004-2 Class M1, 3.96% 5/25/34 (f) | | 5,200,000 | | 5,206,719 |
Series 2004-3: | | | | |
Class 3A4, 3.71% 8/25/34 (f) | | 530,752 | | 528,596 |
Class M1, 3.96% 6/25/34 (f) | | 1,475,000 | | 1,476,356 |
Series 2004-4: | | | | |
Class A, 3.83% 8/25/34 (f) | | 2,524,088 | | 2,526,278 |
Asset-Backed Securities - continued |
| Principal Amount | | Value |
Countrywide Home Loans, Inc.: - continued | | | | |
Series 2004-4: | | | | |
Class M1, 3.94% 7/25/34 (f) | | $ 3,650,000 | | $ 3,653,189 |
Class M2, 3.99% 6/25/34 (f) | | 4,395,000 | | 4,398,536 |
Series 2005-1: | | | | |
Class 1AV2, 3.66% 7/25/35 (f) | | 8,780,000 | | 8,775,114 |
Class M1, 3.88% 8/25/35 (f) | | 19,600,000 | | 19,563,654 |
Class MV1, 3.86% 7/25/35 (f) | | 3,135,000 | | 3,130,219 |
Class MV2, 3.9% 7/25/35 (f) | | 3,765,000 | | 3,754,147 |
Class MV3, 3.94% 7/25/35 (f) | | 1,560,000 | | 1,557,748 |
Series 2005-3 Class MV1, 3.88% 8/25/35 (f) | | 11,125,000 | | 11,103,934 |
Series 2005-AB1 Class A2, 3.67% 8/25/35 (f) | | 17,520,000 | | 17,514,797 |
Series 2005-IM1 Class A1, 3.56% 8/25/34 (d)(f) | | 17,915,000 | | 17,915,000 |
CS First Boston Mortgage Securities Corp.: | | | | |
Series 2003-8 Class A2, 3.85% 4/25/34 (f) | | 2,663,075 | | 2,674,762 |
Series 2004-FRE1: | | | | |
Class A2, 3.81% 4/25/34 (f) | | 2,689,397 | | 2,689,291 |
Class M3, 4.11% 4/25/34 (f) | | 5,885,000 | | 5,884,751 |
Discover Card Master Trust I Series 2003-4 Class B1, 3.7181% 5/16/11 (f) | | 8,155,000 | | 8,196,815 |
Fannie Mae guaranteed REMIC pass thru certificates Series 2004-T5 Class AB3, 3.8305% 5/28/35 (f) | | 6,957,460 | | 6,959,877 |
Fieldstone Mortgage Investment Corp.: | | | | |
Series 2003-1: | | | | |
Class M1, 4.14% 11/25/33 (f) | | 1,300,000 | | 1,308,748 |
Class M2, 5.21% 11/25/33 (f) | | 700,000 | | 718,600 |
Series 2004-1 Class M2, 4.56% 1/25/35 (f) | | 3,700,000 | | 3,741,581 |
Series 2004-2 Class M2, 4.61% 7/25/34 (f) | | 9,890,000 | | 9,889,579 |
Series 2004-3 Class M5, 4.91% 8/25/34 (f) | | 2,000,000 | | 2,033,830 |
Series 2005-2 Class 2A1, 3.5% 7/25/36 (d)(f) | | 16,935,000 | | 16,935,000 |
First Franklin Mortgage Loan Asset Backed Certificates: | | | | |
Series 2005-FF2 Class A2A, 3.55% 3/25/35 (f) | | 7,354,604 | | 7,354,604 |
Series 2005-FF2 Class M6, 4.16% 3/25/35 (f) | | 6,950,000 | | 6,950,000 |
First Franklin Mortgage Loan Trust Series 2004-FF2: | | | | |
Class M3, 4.01% 3/25/34 (f) | | 400,000 | | 400,711 |
Class M4, 4.36% 3/25/34 (f) | | 300,000 | | 302,647 |
First USA Credit Card Master Trust Series 2001-4 Class B, 3.75% 1/12/09 (f) | | 15,000,000 | | 15,026,199 |
First USA Secured Note Trust Series 2001-3 Class C, 4.4669% 11/19/08 (c)(f) | | 11,580,000 | | 11,661,421 |
Ford Credit Auto Owner Trust Series 2003-B Class B2, 3.8181% 10/15/07 (f) | | 19,600,000 | | 19,671,950 |
Asset-Backed Securities - continued |
| Principal Amount | | Value |
Ford Credit Floorplan Master Owner Trust Series 2005-1: | | | | |
Class A, 3.5381% 5/17/10 (f) | | $ 9,590,000 | | $ 9,589,981 |
Class B, 3.6563% 5/17/10 (f) | | 2,625,000 | | 2,624,992 |
Fremont Home Loan Trust: | | | | |
Series 2004-1: | | | | |
Class 1A1, 3.68% 2/25/34 (f) | | 2,669,337 | | 2,669,232 |
Class M1, 3.91% 2/25/34 (f) | | 750,000 | | 749,968 |
Class M2, 3.96% 2/25/34 (f) | | 800,000 | | 799,966 |
Series 2004-C Class 2A2, 4.01% 8/25/34 (f) | | 10,000,000 | | 10,101,993 |
Series 2005-2 Class 2A1, 3.5913% 6/25/35 (f) | | 15,380,000 | | 15,375,194 |
Series 2005-A: | | | | |
Class 2A2, 3.7% 2/25/35 (f) | | 11,850,000 | | 11,865,657 |
Class M1, 3.89% 1/25/35 (f) | | 1,603,000 | | 1,599,854 |
Class M2, 3.92% 1/25/35 (f) | | 2,325,000 | | 2,321,531 |
Class M3, 3.95% 1/25/35 (f) | | 1,250,000 | | 1,249,947 |
Class M4, 4.14% 1/25/35 (f) | | 925,000 | | 927,535 |
GE Business Loan Trust Series 2003-1 Class A, 3.8181% 4/15/31 (c)(f) | | 5,499,865 | | 5,531,421 |
GE Capital Credit Card Master Note Trust Series 2005-2 Class B, 3.5736% 6/15/11 (f) | | 6,475,000 | | 6,473,058 |
Gracechurch Card Funding PLC: | | | | |
Series 5: | | | | |
Class B, 3.6181% 8/15/08 (f) | | 1,520,000 | | 1,521,351 |
Class C, 4.3181% 8/15/08 (f) | | 5,580,000 | | 5,601,142 |
Series 6 Class B, 3.5781% 2/17/09 (f) | | 1,030,000 | | 1,030,901 |
Series 8 Class C, 3.6721% 6/15/10 (f) | | 18,450,000 | | 18,450,000 |
GSAMP Trust: | | | | |
Series 2002-HE Class M1, 4.68% 11/20/32 (f) | | 2,882,888 | | 2,928,737 |
Series 2002-NC1: | | | | |
Class A2, 3.78% 7/25/32 (f) | | 54,777 | | 55,099 |
Class M1, 4.1% 7/25/32 (f) | | 8,861,000 | | 8,920,491 |
Series 2003-FM1 Class M1, 4.25% 3/20/33 (f) | | 15,000,000 | | 15,136,310 |
Series 2004-FM1: | | | | |
Class M1, 4.11% 11/25/33 (f) | | 2,865,000 | | 2,864,879 |
Class M2, 4.86% 11/25/33 (f) | | 1,975,000 | | 2,005,597 |
Series 2004-FM2: | | | | |
Class M1, 3.96% 1/25/34 (f) | | 3,500,000 | | 3,499,853 |
Class M2, 4.56% 1/25/34 (f) | | 1,500,000 | | 1,499,936 |
Class M3, 4.76% 1/25/34 (f) | | 1,500,000 | | 1,499,935 |
Series 2004-HE1: | | | | |
Class M1, 4.01% 5/25/34 (f) | | 4,045,000 | | 4,044,829 |
Class M2, 4.61% 5/25/34 (f) | | 1,750,000 | | 1,766,258 |
Asset-Backed Securities - continued |
| Principal Amount | | Value |
GSAMP Trust: - continued | | | | |
Series 2005-9 Class 2A1, 3.5287% 8/25/35 (f) | | $ 17,530,000 | | $ 17,530,000 |
Series 2005-FF2 Class M5, 4.09% 3/25/35 (f) | | 3,500,000 | | 3,500,000 |
Series 2005-HE2 Class M, 3.89% 3/25/35 (f) | | 8,780,000 | | 8,749,867 |
Series 2005-NC1 Class M1, 3.91% 2/25/35 (f) | | 9,010,000 | | 8,987,296 |
Guggenheim Structured Real Estate Funding Ltd. Series 2005-1 Class C, 4.3944% 5/25/30 (c)(f) | | 14,000,000 | | 13,986,652 |
HFC Home Equity Loan Asset Backed Certificates Series 2005-2: | | | | |
Class M1, 3.97% 1/20/34 (f) | | 3,225,000 | | 3,225,000 |
Class M2, 4% 1/20/34 (f) | | 2,415,000 | | 2,415,000 |
Home Equity Asset Trust: | | | | |
Series 2002-2 Class M1, 4.26% 6/25/32 (f) | | 10,000,000 | | 10,017,090 |
Series 2002-3 Class A5, 3.9% 2/25/33 (f) | | 854,528 | | 855,194 |
Series 2002-4 Class A3, 3.94% 3/25/33 (f) | | 1,237,388 | | 1,238,074 |
Series 2002-5: | | | | |
Class A3, 3.98% 5/25/33 (f) | | 2,866,793 | | 2,872,821 |
Class M1, 4.66% 5/25/33 (f) | | 13,800,000 | | 13,966,276 |
Series 2003-1: | | | | |
Class A2, 3.93% 6/25/33 (f) | | 4,229,596 | | 4,233,111 |
Class M1, 4.46% 6/25/33 (f) | | 8,335,000 | | 8,375,317 |
Series 2003-2: | | | | |
Class A2, 3.84% 8/25/33 (f) | | 228,269 | | 229,139 |
Class M1, 4.34% 8/25/33 (f) | | 2,245,000 | | 2,269,298 |
Series 2003-3: | | | | |
Class A2, 3.82% 8/25/33 (f) | | 1,624,262 | | 1,630,339 |
Class M1, 4.32% 8/25/33 (f) | | 8,185,000 | | 8,266,814 |
Series 2003-4: | | | | |
Class M1, 4.26% 10/25/33 (f) | | 3,415,000 | | 3,440,384 |
Class M2, 5.36% 10/25/33 (f) | | 4,040,000 | | 4,093,038 |
Series 2003-5: | | | | |
Class A2, 3.81% 12/25/33 (f) | | 5,822,876 | | 5,843,440 |
Class M1, 4.16% 12/25/33 (f) | | 3,175,000 | | 3,192,660 |
Class M2, 5.19% 12/25/33 (f) | | 1,345,000 | | 1,377,487 |
Series 2003-7 Class A2, 3.84% 3/25/34 (f) | | 3,430,379 | | 3,438,503 |
Series 2004-2 Class A2, 3.75% 7/25/34 (f) | | 6,172,348 | | 6,172,139 |
Series 2004-3: | | | | |
Class M1, 4.03% 8/25/34 (f) | | 2,015,000 | | 2,019,636 |
Class M2, 4.66% 8/25/34 (f) | | 2,200,000 | | 2,237,373 |
Series 2004-4 Class A2, 3.78% 10/25/34 (f) | | 8,318,527 | | 8,347,783 |
Series 2004-6 Class A2, 3.81% 12/25/34 (f) | | 9,249,309 | | 9,278,715 |
Series 2004-7 Class A3, 3.85% 1/25/35 (f) | | 2,916,946 | | 2,929,856 |
Asset-Backed Securities - continued |
| Principal Amount | | Value |
Home Equity Asset Trust: - continued | | | | |
Series 2005-1: | | | | |
Class M1, 3.89% 5/25/35 (f) | | $ 9,705,000 | | $ 9,697,565 |
Class M2, 3.91% 5/25/35 (f) | | 5,780,000 | | 5,763,067 |
Class M3, 3.96% 5/25/35 (f) | | 5,825,000 | | 5,808,344 |
Series 2005-2: | | | | |
Class 2A2, 3.66% 7/25/35 (f) | | 13,170,000 | | 13,163,182 |
Class M1, 3.91% 7/25/35 (f) | | 10,085,000 | | 10,075,362 |
Series 2005-3 Class M1, 3.87% 8/25/35 (f) | | 9,450,000 | | 9,434,700 |
Series 2005-5 Class 2A2, 3.65% 11/25/35 (d)(f) | | 15,000,000 | | 14,968,605 |
Household Affinity Credit Card Master Note Trust I Series 2003-3 Class B, 3.6781% 8/15/08 (f) | | 10,000,000 | | 10,018,071 |
Household Credit Card Master Trust I Series 2002-1 Class B, 4.0381% 7/15/08 (f) | | 22,589,000 | | 22,608,682 |
Household Home Equity Loan Trust: | | | | |
Series 2002-2 Class A, 3.73% 4/20/32 (f) | | 3,295,048 | | 3,298,089 |
Series 2002-3 Class A, 3.88% 7/20/32 (f) | | 2,678,218 | | 2,681,775 |
Series 2003-1 Class M, 4.06% 10/20/32 (f) | | 770,987 | | 771,866 |
Series 2003-2: | | | | |
Class A, 3.76% 9/20/33 (f) | | 2,892,082 | | 2,897,777 |
Class M, 4.01% 9/20/33 (f) | | 1,360,000 | | 1,362,941 |
Series 2004-1 Class M, 3.95% 9/20/33 (f) | | 2,708,464 | | 2,713,597 |
Household Mortgage Loan Trust: | | | | |
Series 2003-HC1 Class M, 4.08% 2/20/33 (f) | | 1,742,776 | | 1,748,262 |
Series 2004-HC1: | | | | |
Class A, 3.78% 2/20/34 (f) | | 5,083,992 | | 5,096,702 |
Class M, 3.93% 2/20/34 (f) | | 3,073,800 | | 3,073,443 |
Household Private Label Credit Card Master Note Trust I: | | | | |
Series 2002-1 Class B, 3.9381% 1/18/11 (f) | | 8,850,000 | | 8,867,619 |
Series 2002-2: | | | | |
Class A, 3.5581% 1/18/11 (f) | | 9,000,000 | | 9,012,218 |
Class B, 3.9381% 1/18/11 (f) | | 14,275,000 | | 14,355,952 |
Series 2002-3 Class B, 4.6381% 9/15/09 (f) | | 4,150,000 | | 4,159,262 |
Ikon Receivables Funding LLC Series 2003-1 Class A3A, 3.6213% 12/17/07 (f) | | 2,781,207 | | 2,781,863 |
IXIS Real Estate Capital Trust Series 2005-HE1: | | | | |
Class A1, 3.71% 6/25/35 (f) | | 11,646,350 | | 11,645,706 |
Class M1, 3.93% 6/25/35 (f) | | 4,100,000 | | 4,094,813 |
Class M2, 3.95% 6/25/35 (f) | | 2,775,000 | | 2,766,003 |
Class M3, 3.98% 6/25/35 (f) | | 1,975,000 | | 1,972,566 |
Keycorp Student Loan Trust Series 1999-A Class A2, 3.8% 12/27/09 (f) | | 16,169,548 | | 16,224,493 |
Asset-Backed Securities - continued |
| Principal Amount | | Value |
Long Beach Mortgage Loan Trust: | | | | |
Series 2003-2: | | | | |
Class AV, 3.78% 6/25/33 (f) | | $ 253,078 | | $ 253,185 |
Class M1, 4.28% 6/25/33 (f) | | 19,500,000 | | 19,626,153 |
Series 2003-3 Class M1, 4.21% 7/25/33 (f) | | 7,770,000 | | 7,824,625 |
Series 2004-2: | | | | |
Class M1, 3.99% 6/25/34 (f) | | 4,275,000 | | 4,285,404 |
Class M2, 4.54% 6/25/34 (f) | | 1,400,000 | | 1,416,723 |
Series 2005-2 Class 2A2, 3.64% 4/25/35 (f) | | 12,000,000 | | 11,996,998 |
MASTR Asset Backed Securities Trust: | | | | |
Series 2003-NC1: | | | | |
Class M1, 4.19% 4/25/33 (f) | | 3,500,000 | | 3,519,270 |
Class M2, 5.31% 4/25/33 (f) | | 1,500,000 | | 1,534,429 |
Series 2004-FRE1 Class M1, 4.01% 7/25/34 (f) | | 5,223,000 | | 5,238,948 |
MBNA Asset Backed Note Trust Series 2000-K Class C, 4.1881% 3/17/08 (c)(f) | | 7,250,000 | | 7,258,700 |
MBNA Credit Card Master Note Trust: | | | | |
Series 2001-B1 Class B1, 3.7631% 10/15/08 (f) | | 30,000,000 | | 30,042,072 |
Series 2001-B2 Class B2, 3.7481% 1/15/09 (f) | | 30,353,000 | | 30,429,933 |
Series 2002-B2 Class B2, 3.7681% 10/15/09 (f) | | 20,000,000 | | 20,086,600 |
Series 2002-B3 Class B3, 3.7881% 1/15/08 (f) | | 15,000,000 | | 15,000,470 |
Series 2002-B4 Class B4, 3.8881% 3/15/10 (f) | | 14,800,000 | | 14,916,873 |
Series 2003-B2 Class B2, 3.7781% 10/15/10 (f) | | 1,530,000 | | 1,545,569 |
Series 2003-B3 Class B3, 3.7631% 1/18/11 (f) | | 1,130,000 | | 1,135,362 |
Series 2003-B5 Class B5, 3.7581% 2/15/11 (f) | | 705,000 | | 710,447 |
MBNA Master Credit Card Trust II: | | | | |
Series 1998-E Class B, 3.9288% 9/15/10 (f) | | 7,800,000 | | 7,846,570 |
Series 1998-G Class B, 3.7881% 2/17/09 (f) | | 20,000,000 | | 20,043,574 |
Meritage Mortgage Loan Trust Series 2004-1: | | | | |
Class M1, 3.96% 7/25/34 (f) | | 2,125,000 | | 2,124,911 |
Class M2, 4.01% 7/25/34 (f) | | 375,000 | | 374,985 |
Class M3, 4.41% 7/25/34 (f) | | 775,000 | | 774,967 |
Class M4, 4.56% 7/25/34 (f) | | 525,000 | | 524,978 |
Merrill Lynch Mortgage Investors, Inc. Series 2003-HE1 Class M1, 4.16% 7/25/34 (f) | | 2,321,000 | | 2,330,928 |
Morgan Stanley ABS Capital I, Inc.: | | | | |
Series 2002-NC6 Class M2, 5.56% 11/25/32 (f) | | 2,370,000 | | 2,441,680 |
Series 2003-NC5 Class M2, 5.46% 4/25/33 (f) | | 2,800,000 | | 2,834,138 |
Series 2003-NC6 Class M2, 5.41% 6/27/33 (f) | | 12,835,000 | | 13,180,825 |
Series 2003-NC7 Class M1, 4.16% 6/25/33 (f) | | 1,785,000 | | 1,791,357 |
Series 2003-NC8 Class M1, 4.16% 9/25/33 (f) | | 2,350,000 | | 2,363,472 |
Series 2004-HE6 Class A2, 3.8% 8/25/34 (f) | | 7,193,690 | | 7,217,222 |
Series 2004-NC2 Class M1, 4.01% 12/25/33 (f) | | 2,595,000 | | 2,599,359 |
Asset-Backed Securities - continued |
| Principal Amount | | Value |
Morgan Stanley ABS Capital I, Inc.: - continued | | | | |
Series 2004-NC6 Class A2, 3.8% 7/25/34 (f) | | $ 3,163,358 | | $ 3,170,145 |
Series 2005-1: | | | | |
Class M2, 3.93% 12/25/34 (f) | | 4,425,000 | | 4,417,835 |
Class M3, 3.98% 12/25/34 (f) | | 4,000,000 | | 3,998,266 |
Series 2005-HE1: | | | | |
Class A3B, 3.68% 12/25/34 (f) | | 3,885,000 | | 3,889,266 |
Class M1, 3.91% 12/25/34 (f) | | 1,100,000 | | 1,102,253 |
Class M2, 3.93% 12/25/34 (f) | | 2,970,000 | | 2,966,369 |
Series 2005-HE2: | | | | |
Class M1, 3.86% 1/25/35 (f) | | 2,665,000 | | 2,670,502 |
Class M2, 3.9% 1/25/35 (f) | | 1,900,000 | | 1,893,810 |
Series 2005-NC1: | | | | |
Class M1, 3.9% 1/25/35 (f) | | 2,425,000 | | 2,432,731 |
Class M2, 3.93% 1/25/35 (f) | | 2,425,000 | | 2,421,056 |
Class M3, 3.97% 1/25/35 (f) | | 2,425,000 | | 2,425,850 |
Morgan Stanley Dean Witter Capital I Trust: | | | | |
Series 2001-AM1: | | | | |
Class M1, 4.31% 2/25/32 (f) | | 1,510,288 | | 1,513,954 |
Class M2, 4.86% 2/25/32 (f) | | 7,146,795 | | 7,171,201 |
Series 2001-NC4: | | | | |
Class M1, 4.46% 1/25/32 (f) | | 3,827,881 | | 3,841,816 |
Series 2002-AM3 Class A3, 3.95% 2/25/33 (f) | | 1,426,624 | | 1,430,581 |
Series 2002-HE1 Class M1, 4.06% 7/25/32 (f) | | 5,860,000 | | 5,893,149 |
Series 2002-HE2 Class M1, 4.16% 8/25/32 (f) | | 9,925,000 | | 9,970,606 |
Series 2002-NC3 Class A3, 3.8% 8/25/32 (f) | | 396,299 | | 397,573 |
Series 2002-OP1 Class M1, 4.21% 9/25/32 (f) | | 3,894,745 | | 3,917,849 |
Series 2003-NC1: | | | | |
Class M1, 4.51% 11/25/32 (f) | | 2,555,000 | | 2,572,380 |
Class M2, 5.51% 11/25/32 (f) | | 1,880,000 | | 1,899,041 |
New Century Home Equity Loan Trust: | | | | |
Series 2003-2: | | | | |
Class A2, 3.89% 1/25/33 (f) | | 341,254 | | 341,436 |
Class M2, 5.46% 1/25/33 (f) | | 4,600,000 | | 4,667,174 |
Series 2003-6 Class M1, 4.18% 1/25/34 (f) | | 5,180,000 | | 5,202,952 |
Series 2005-1: | | | | |
Class M1, 3.91% 3/25/35 (f) | | 4,395,000 | | 4,392,950 |
Class M2, 3.94% 3/25/35 (f) | | 4,395,000 | | 4,384,834 |
Class M3, 3.98% 3/25/35 (f) | | 2,120,000 | | 2,120,796 |
Nissan Auto Lease Trust: | | | | |
Series 2003-A Class A3A, 3.5281% 6/15/09 (f) | | 13,621,752 | | 13,633,434 |
Series 2004-A Class A4A, 3.4581% 6/15/10 (f) | | 10,570,000 | | 10,582,978 |
Asset-Backed Securities - continued |
| Principal Amount | | Value |
NovaStar Home Equity Loan Series 2004-1: | | | | |
Class M1, 3.91% 6/25/34 (f) | | $ 1,450,000 | | $ 1,451,222 |
Class M4, 4.435% 6/25/34 (f) | | 2,435,000 | | 2,439,150 |
Ocala Funding LLC Series 2005-1A Class A, 4.93% 3/20/10 (c)(f) | | 3,675,000 | | 3,675,000 |
Ownit Mortgage Loan Asste-Backed Certificates Series 2005-3 Class A2A, 3.5% 6/25/36 (f) | | 15,500,000 | | 15,500,000 |
Park Place Securities, Inc.: | | | | |
Series 2004-WCW1: | | | | |
Class M1, 4.09% 9/25/34 (f) | | 3,745,000 | | 3,756,721 |
Class M2, 4.14% 9/25/34 (f) | | 1,755,000 | | 1,764,326 |
Class M3, 4.71% 9/25/34 (f) | | 3,355,000 | | 3,396,745 |
Class M4, 4.91% 9/25/34 (f) | | 4,700,000 | | 4,767,614 |
Series 2004-WCW2 Class A2, 3.84% 10/25/34 (f) | | 7,952,623 | | 7,976,111 |
Series 2005-WCH1: | | | | |
Class A3B, 3.68% 1/25/35 (f) | | 2,775,000 | | 2,779,908 |
Class M2, 3.98% 1/25/35 (f) | | 4,175,000 | | 4,166,539 |
Class M3, 4.02% 1/25/35 (f) | | 3,290,000 | | 3,292,599 |
Class M5, 4.34% 1/25/35 (f) | | 3,095,000 | | 3,104,620 |
Series 2005-WHQ2 Class M7, 4.71% 5/25/35 (f) | | 5,950,000 | | 5,930,787 |
People's Choice Home Loan Securities Trust Series 2005-2: | | | | |
Class A1, 3.57% 9/25/24 (f) | | 7,475,790 | | 7,475,790 |
Class M4, 4.09% 5/25/35 (f) | | 6,000,000 | | 6,000,000 |
Providian Gateway Master Trust Series 2002-B Class A, 4.0881% 6/15/09 (c)(f) | | 15,000,000 | | 15,039,393 |
Residental Asset Securities Corp.: | | | | |
Series 2005-KS4 Class M2, 4.04% 4/25/35 (f) | | 1,040,000 | | 1,037,610 |
Series 2005-KS7 Class A1, 3.4781% 8/25/35 (f) | | 10,515,000 | | 10,512,897 |
Residential Asset Mortgage Products, Inc. Series 2004-RS10 Class MII2, 4.71% 10/25/34 (f) | | 5,500,000 | | 5,566,857 |
Salomon Brothers Mortgage Securities VII, Inc. Series 2003-HE1 Class A, 3.86% 4/25/33 (f) | | 818,316 | | 822,076 |
Saxon Asset Securities Trust: | | | | |
Series 2004-1 Class M1, 3.99% 3/25/35 (f) | | 4,415,000 | | 4,413,887 |
Series 2004-2 Class MV1, 4.04% 8/25/35 (f) | | 4,495,000 | | 4,501,043 |
Sears Credit Account Master Trust II: | | | | |
Series 2001-1 Class B, 3.8131% 2/15/10 (f) | | 10,000,000 | | 9,987,143 |
Series 2002-4: | | | | |
Class A, 3.5181% 8/18/09 (f) | | 27,000,000 | | 26,999,603 |
Class B, 3.8131% 8/18/09 (f) | | 33,300,000 | | 33,301,149 |
Series 2002-5 Class B, 4.6381% 11/17/09 (f) | | 30,000,000 | | 30,062,976 |
Asset-Backed Securities - continued |
| Principal Amount | | Value |
Securitized Asset Backed Receivables LLC Trust Series 2004-NC1 Class M1, 3.98% 2/25/34 (f) | | $ 2,910,000 | | $ 2,909,256 |
Specialty Underwriting & Residential Finance Series 2003-BC4 Class M1, 4.06% 11/25/34 (f) | | 1,810,000 | | 1,818,452 |
Structured Asset Securities Corp. Series 2004-GEL1 Class A, 3.82% 2/25/34 (f) | | 1,043,424 | | 1,043,422 |
Superior Wholesale Inventory Financing Trust VII Series 2003-A8 Class CTFS, 3.8381% 3/15/11 (c)(f) | | 10,835,000 | | 10,828,228 |
Superior Wholesale Inventory Financing Trust XII Series 2005-A12 Class C, 4.46% 6/15/10 (f) | | 6,840,000 | | 6,839,945 |
Terwin Mortgage Trust: | | | | |
Series 2003-4HE Class A1, 3.89% 9/25/34 (f) | | 2,878,990 | | 2,894,593 |
Series 2003-6HE Class A1, 3.93% 11/25/33 (f) | | 1,784,384 | | 1,788,543 |
Series 2005-14HE Class AF1, 3.9753% 7/25/36 (d)(f) | | 8,635,000 | | 8,633,296 |
TOTAL ASSET-BACKED SECURITIES (Cost $2,293,954,229) | 2,300,747,332 |
Collateralized Mortgage Obligations - 16.9% |
|
Private Sponsor - 13.7% |
Adjustable Rate Mortgage Trust floater: | | | | |
Series 2004-2 Class 7A3, 3.86% 2/25/35 (f) | | 9,374,471 | | 9,396,037 |
Series 2004-4 Class 5A2, 3.86% 3/25/35 (f) | | 3,780,419 | | 3,787,953 |
Series 2005-1 Class 5A2, 3.79% 5/25/35 (f) | | 6,187,250 | | 6,191,166 |
Series 2005-2: | | | | |
Class 6A2, 3.74% 6/25/35 (f) | | 2,930,592 | | 2,932,491 |
Class 6M2, 3.94% 6/25/35 (f) | | 10,145,000 | | 10,145,010 |
Series 2005-3 Class 8A2, 3.7% 7/25/35 (f) | | 19,199,197 | | 19,211,695 |
Series 2005-4 Class 7A2, 3.69% 8/25/35 (f) | | 9,011,457 | | 9,003,527 |
Series 2005-8 Class 7A2, 3.77% 11/25/35 (f) | | 7,660,000 | | 7,660,000 |
Bear Stearns Alt-A Trust floater: | | | | |
Series 2005-1 Class A1, 3.74% 1/25/35 (f) | | 20,354,186 | | 20,354,186 |
Series 2005-2 Class 1A1, 3.71% 3/25/35 (f) | | 14,961,065 | | 14,961,065 |
Series 2005-5 Class 1A1, 3.68% 7/25/35 (f) | | 18,707,862 | | 18,696,170 |
Countrywide Alternative Loan Trust planned amortization class Series 2003-5T2 Class A2, 3.86% 5/25/33 (f) | | 5,545,033 | | 5,548,017 |
Countrywide Home Loans, Inc. floater: | | | | |
Series 2004-16 Class A1, 3.86% 9/25/34 (f) | | 10,335,456 | | 10,325,843 |
Series 2005-1 Class 2A1, 3.75% 3/25/35 (f) | | 14,617,171 | | 14,617,171 |
CS First Boston Mortgage Securities Corp. floater: | | | | |
Series 2004-AR2 Class 6A1, 3.86% 3/25/34 (f) | | 5,338,263 | | 5,334,945 |
Collateralized Mortgage Obligations - continued |
| Principal Amount | | Value |
Private Sponsor - continued |
CS First Boston Mortgage Securities Corp. floater: - continued | | | | |
Series 2004-AR3 Class 6A2, 3.83% 4/25/34 (f) | | $ 2,226,193 | | $ 2,228,162 |
Series 2004-AR4 Class 5A2, 3.83% 5/25/34 (f) | | 2,066,310 | | 2,065,052 |
Series 2004-AR5 Class 11A2, 3.83% 6/25/34 (f) | | 2,987,552 | | 2,981,472 |
Series 2004-AR6 Class 9A2, 3.83% 10/25/34 (f) | | 3,981,028 | | 3,983,412 |
Series 2004-AR7 Class 6A2, 3.84% 8/25/34 (f) | | 5,801,660 | | 5,806,785 |
Series 2004-AR8 Class 8A2, 3.84% 9/25/34 (f) | | 4,630,225 | | 4,638,807 |
First Horizon Mortgage Passthru Trust floater Series 2004-FL1 Class 2A1, 3.95% 12/25/34 (f) | | 4,384,853 | | 4,379,779 |
Granite Master Issuer PLC floater: | | | | |
Series 2005-1: | | | | |
Class A3, 3.51% 12/21/24 (f) | | 5,300,000 | | 5,299,006 |
Class B1, 3.56% 12/20/54 (f) | | 7,050,000 | | 7,047,577 |
Class M1, 3.66% 12/20/54 (f) | | 5,300,000 | | 5,298,178 |
Series 2005-2 Class C1, 3.7857% 12/20/54 (f) | | 7,975,000 | | 7,972,508 |
Granite Mortgages PLC floater: | | | | |
Series 2004-1: | | | | |
Class 1B, 3.64% 3/20/44 (f) | | 1,415,000 | | 1,414,844 |
Class 1C, 4.33% 3/20/44 (f) | | 4,075,000 | | 4,091,219 |
Class 1M, 3.84% 3/20/44 (f) | | 4,935,000 | | 4,938,751 |
Series 2004-2: | | | | |
Class 1A2, 3.5% 6/20/28 (f) | | 5,384,259 | | 5,384,932 |
Class 1B, 3.6% 6/20/44 (f) | | 1,018,055 | | 1,018,309 |
Class 1C, 4.13% 6/20/44 (f) | | 3,706,295 | | 3,713,918 |
Class 1M, 3.71% 6/20/44 (f) | | 2,722,846 | | 2,724,205 |
Series 2004-3: | | | | |
Class 1B, 3.59% 9/20/44 (f) | | 2,100,000 | | 2,100,210 |
Class 1C, 4.02% 9/20/44 (f) | | 5,415,000 | | 5,426,913 |
Class 1M, 3.7% 9/20/44 (f) | | 1,200,000 | | 1,200,360 |
Harborview Mortgage Loan Trust floater Series 2005-2 Class 2A1A, 3.6369% 5/19/35 (f) | | 11,690,145 | | 11,648,134 |
Holmes Financing No. 7 PLC floater Series 2 Class M, 4.3988% 7/15/40 (f) | | 2,560,000 | | 2,564,912 |
Holmes Financing No. 8 PLC floater Series 2: | | | | |
Class A, 3.6788% 4/15/11 (f) | | 25,000,000 | | 25,000,000 |
Class B, 3.7688% 7/15/40 (f) | | 2,695,000 | | 2,696,684 |
Class C, 4.3188% 7/15/40 (f) | | 10,280,000 | | 10,328,193 |
Home Equity Asset Trust floater Series 2005-3 Class 2A1, 3.55% 8/25/35 (f) | | 7,268,025 | | 7,266,230 |
Homestar Mortgage Acceptance Corp. floater Series 2004-5 Class A1, 3.91% 10/25/34 (f) | | 4,495,430 | | 4,509,337 |
Collateralized Mortgage Obligations - continued |
| Principal Amount | | Value |
Private Sponsor - continued |
Impac CMB Trust floater: | | | | |
Series 2004-11 Class 2A2, 3.83% 3/25/35 (f) | | $ 8,638,669 | | $ 8,636,982 |
Series 2004-6 Class 1A2, 3.85% 10/25/34 (f) | | 3,481,529 | | 3,487,748 |
Series 2005-1: | | | | |
Class M1, 3.92% 4/25/35 (f) | | 3,223,929 | | 3,220,529 |
Class M2, 3.96% 4/25/35 (f) | | 5,644,146 | | 5,639,516 |
Class M3, 3.99% 4/25/35 (f) | | 1,384,927 | | 1,383,466 |
Class M4, 4.21% 4/25/35 (f) | | 817,334 | | 818,164 |
Class M5, 4.23% 4/25/35 (f) | | 817,334 | | 817,174 |
Class M6, 4.28% 4/25/35 (f) | | 1,307,734 | | 1,307,479 |
Series 2005-2 Class 1A2, 3.77% 4/25/35 (f) | | 13,211,515 | | 13,201,194 |
Series 2005-3 Class A1, 3.7% 8/25/35 (f) | | 15,176,045 | | 15,149,962 |
Series 2005-4 Class 1B1, 4.76% 6/25/35 (f) | | 5,306,886 | | 5,282,839 |
Lehman Structured Securities Corp. floater Series 2005-1 Class A2, 3.67% 9/26/45 (c)(f) | | 16,153,164 | | 16,153,164 |
MASTR Adjustable Rate Mortgages Trust: | | | | |
floater Series 2005-1 Class 1A1, 3.73% 3/25/35 (f) | | 13,405,372 | | 13,396,993 |
Series 2004-6 Class 4A2, 4.1729% 7/25/34 (f) | | 5,969,000 | | 5,946,582 |
Merrill Lynch Mortgage Investors, Inc. floater: | | | | |
Series 2003-A Class 2A1, 3.85% 3/25/28 (f) | | 8,079,308 | | 8,122,924 |
Series 2003-B Class A1, 3.8% 4/25/28 (f) | | 7,852,610 | | 7,898,403 |
Series 2003-D Class A, 3.77% 8/25/28 (f) | | 7,479,616 | | 7,494,804 |
Series 2003-E Class A2, 3.4425% 10/25/28 (f) | | 10,687,128 | | 10,687,143 |
Series 2003-F Class A2, 3.7075% 10/25/28 (f) | | 12,892,959 | | 12,891,486 |
Series 2004-A Class A2, 3.6175% 4/25/29 (f) | | 11,584,437 | | 11,556,917 |
Series 2004-B Class A2, 3.79% 6/25/29 (f) | | 8,952,030 | | 8,930,464 |
Series 2004-C Class A2, 3.95% 7/25/29 (f) | | 12,856,157 | | 12,825,407 |
Series 2004-D Class A2, 3.4725% 9/25/29 (f) | | 9,971,432 | | 9,974,033 |
Series 2004-E: | | | | |
Class A2B, 3.7275% 11/25/29 (f) | | 8,523,921 | | 8,502,874 |
Class A2D, 3.9175% 11/25/29 (f) | | 1,982,307 | | 1,991,830 |
Series 2004-G Class A2, 3.95% 11/25/29 (f) | | 3,854,828 | | 3,854,422 |
Series 2005-A Class A2, 3.38% 2/25/30 (f) | | 10,800,867 | | 10,785,319 |
Mortgage Asset Backed Securities Trust floater Series 2002-NC1 Class M1, 4.31% 10/25/32 (f) | | 4,538,551 | | 4,555,535 |
MortgageIT Trust floater: | | | | |
Series 2004-2: | | | | |
Class A1, 3.83% 12/25/34 (f) | | 4,920,628 | | 4,927,758 |
Class A2, 3.91% 12/25/34 (f) | | 6,656,800 | | 6,696,298 |
Series 2005-2 Class 1A1, 3.72% 5/25/35 (f) | | 5,093,718 | | 5,097,498 |
Opteum Mortgage Acceptance Corp. floater Series 2005-3 Class APT, 3.75% 6/25/35 (f) | | 19,112,336 | | 19,123,533 |
Collateralized Mortgage Obligations - continued |
| Principal Amount | | Value |
Private Sponsor - continued |
Permanent Financing No. 1 PLC floater Series 1 Class 2C, 4.5594% 6/10/42 (f) | | $ 1,745,000 | | $ 1,749,384 |
Permanent Financing No. 3 PLC floater Series 2 Class C, 4.4294% 6/10/42 (f) | | 4,845,000 | | 4,893,450 |
Permanent Financing No. 4 PLC floater Series 2 Class C, 4.0994% 6/10/42 (f) | | 15,400,000 | | 15,475,306 |
Permanent Financing No. 5 PLC floater: | | | | |
Series 2 Class C, 4.0294% 6/10/42 (f) | | 4,215,000 | | 4,234,760 |
Series 3 Class C, 4.1994% 6/10/42 (f) | | 8,890,000 | | 8,967,788 |
Permanent Financing No. 6 PLC floater Series 6: | | | | |
Class 1C, 3.7294% 6/10/42 (f) | | 4,000,000 | | 4,000,572 |
Class 2C, 3.8294% 6/10/42 (f) | | 5,350,000 | | 5,352,343 |
Permanent Financing No. 7 PLC floater Series 7: | | | | |
Class 1B, 3.4694% 6/10/42 (f) | | 2,000,000 | | 1,999,375 |
Class 1C, 3.6594% 6/10/42 (f) | | 3,840,000 | | 3,838,800 |
Class 2C, 3.7094% 6/10/42 (f) | | 8,065,000 | | 8,054,919 |
Permanent Financing No. 8 PLC floater Series 8: | | | | |
Class 1C, 3.7475% 6/10/42 (f) | | 7,165,000 | | 7,162,621 |
Class 2C, 3.8175% 6/10/42 (f) | | 9,945,000 | | 9,941,688 |
Residential Asset Mortgage Products, Inc. sequential pay Series 2003-SL1 Class A31, 7.125% 4/25/31 | | 4,643,507 | | 4,727,342 |
Residential Finance LP/Residential Finance Development Corp. floater Series 2003-A: | | | | |
Class B4, 5.15% 3/10/35 (c)(f) | | 5,492,986 | | 5,575,381 |
Class B5, 5.7% 3/10/35 (c)(f) | | 5,684,725 | | 5,811,417 |
Residential Funding Securities Corp.: | | | | |
Series 2003-RP1 Class A1, 3.96% 11/25/34 (f) | | 2,829,110 | | 2,840,739 |
Series 2003-RP2 Class A1, 3.93% 6/25/33 (c)(f) | | 3,866,185 | | 3,881,108 |
Sequoia Mortgage Trust floater: | | | | |
Series 2003-5 Class A2, 3.41% 9/20/33 (f) | | 10,999,101 | | 10,996,236 |
Series 2003-7 Class A2, 2.885% 1/20/34 (f) | | 9,577,708 | | 9,569,385 |
Series 2004-1 Class A, 4.15% 2/20/34 (f) | | 6,379,791 | | 6,373,993 |
Series 2004-10 Class A4, 3.6681% 11/20/34 (f) | | 10,424,803 | | 10,408,138 |
Series 2004-3 Class A, 3.5463% 5/20/34 (f) | | 10,662,486 | | 10,588,333 |
Series 2004-4 Class A, 3.5881% 5/20/34 (f) | | 13,430,919 | | 13,399,990 |
Series 2004-5 Class A3, 3.77% 6/20/34 (f) | | 8,904,038 | | 8,897,082 |
Series 2004-6: | | | | |
Class A3A, 4.1475% 6/20/35 (f) | | 8,182,127 | | 8,176,739 |
Class A3B, 3.16% 7/20/34 (f) | | 1,022,766 | | 1,021,950 |
Series 2004-7: | | | | |
Class A3A, 3.2275% 8/20/34 (f) | | 7,642,675 | | 7,636,475 |
Class A3B, 3.4525% 7/20/34 (f) | | 1,375,260 | | 1,380,167 |
Collateralized Mortgage Obligations - continued |
| Principal Amount | | Value |
Private Sponsor - continued |
Sequoia Mortgage Trust floater: - continued | | | | |
Series 2004-8 Class A2, 3.45% 9/20/34 (f) | | $ 14,155,710 | | $ 14,148,404 |
Series 2005-1 Class A2, 3.68% 2/20/35 (f) | | 7,355,282 | | 7,354,362 |
Series 2005-2 Class A2, 3.36% 3/20/35 (f) | | 13,876,523 | | 13,876,523 |
Series 2005-3 Class A1, 3.46% 5/20/35 (f) | | 9,217,677 | | 9,217,677 |
Structured Adjustable Rate Mortgage Loan Trust floater Series 2001-14 Class A1, 3.77% 7/25/35 (f) | | 11,201,095 | | 11,201,095 |
Structured Asset Securities Corp. floater Series 2004-NP1 Class A, 3.86% 9/25/33 (c)(f) | | 2,553,470 | | 2,555,084 |
Thornburg Mortgage Securities Trust floater Series 2004-3 Class A, 3.83% 9/25/34 (f) | | 22,068,069 | | 22,129,394 |
WAMU Mortgage pass thru certificates: | | | | |
floater Series 2005-AR6 Class 2A-1A, 3.5448% 4/25/45 (f) | | 6,133,307 | | 6,133,607 |
Series 2005 AR11 Class A1C1, 3.6675% 8/25/40 (d)(f) | | 14,400,000 | | 14,400,000 |
Wells Fargo Mortgage Backed Securities Trust: | | | | |
Series 2004-M Class A3, 4.7024% 8/25/34 (f) | | 19,880,000 | | 19,789,156 |
Series 2005-AR12 Class 2A1, 4.322% 7/25/35 (f) | | 31,674,772 | | 31,407,532 |
TOTAL PRIVATE SPONSOR | | 895,419,920 |
U.S. Government Agency - 3.2% |
Fannie Mae: | | | | |
floater: | | | | |
Series 2000-38 Class F, 3.76% 11/18/30 (f) | | 1,103,802 | | 1,112,055 |
Series 2000-40 Class FA, 3.8144% 7/25/30 (f) | | 2,487,156 | | 2,498,099 |
Series 2002-89 Class F, 3.6144% 1/25/33 (f) | | 3,630,895 | | 3,636,484 |
target amortization class Series G94-2 Class D, 6.45% 1/25/24 | | 4,732,822 | | 4,849,182 |
Fannie Mae guaranteed REMIC pass thru certificates: | | | | |
floater: | | | | |
Series 2001-34 Class FR, 3.66% 8/18/31 (f) | | 2,500,934 | | 2,508,899 |
Series 2001-44 Class FB, 3.6144% 9/25/31 (f) | | 2,262,040 | | 2,268,738 |
Series 2001-46 Class F, 3.66% 9/18/31 (f) | | 6,514,676 | | 6,552,090 |
Series 2002-11 Class QF, 3.8144% 3/25/32 (f) | | 4,517,951 | | 4,551,812 |
Series 2002-36 Class FT, 3.8144% 6/25/32 (f) | | 1,503,724 | | 1,516,521 |
Series 2002-64 Class FE, 3.61% 10/18/32 (f) | | 2,256,514 | | 2,266,981 |
Series 2002-65 Class FA, 3.6144% 10/25/17 (f) | | 2,585,370 | | 2,590,545 |
Series 2002-74 Class FV, 3.7644% 11/25/32 (f) | | 8,360,131 | | 8,420,920 |
Series 2003-11: | | | | |
Class DF, 3.7644% 2/25/33 (f) | | 3,173,455 | | 3,195,574 |
Class EF, 3.7644% 2/25/33 (f) | | 2,602,157 | | 2,612,658 |
Collateralized Mortgage Obligations - continued |
| Principal Amount | | Value |
U.S. Government Agency - continued |
Fannie Mae guaranteed REMIC pass thru certificates: - continued | | | | |
floater: | | | | |
Series 2003-63 Class F1, 3.6144% 11/25/27 (f) | | $ 6,387,368 | | $ 6,390,916 |
planned amortization class: | | | | |
Series 1998-63 Class PG, 6% 3/25/27 | | 1,212,661 | | 1,212,198 |
Series 2001-62 Class PG, 6.5% 10/25/30 | | 4,183,652 | | 4,194,964 |
Series 2001-76 Class UB, 5.5% 10/25/13 | | 1,378,221 | | 1,379,002 |
Series 2002-16 Class QD, 5.5% 6/25/14 | | 345,479 | | 346,552 |
Series 2002-28 Class PJ, 6.5% 3/25/31 | | 4,950,777 | | 4,957,813 |
Series 2002-8 Class PD, 6.5% 7/25/30 | | 3,569,878 | | 3,584,870 |
Freddie Mac: | | | | |
floater Series 2510 Class FE, 3.7881% 10/15/32 (f) | | 5,998,150 | | 6,032,418 |
planned amortization class: | | | | |
Series 2091 Class PP, 6% 2/15/27 | | 1,286,641 | | 1,286,029 |
Series 2353 Class PC, 6.5% 9/15/15 | | 1,363,169 | | 1,366,992 |
Freddie Mac Manufactured Housing participation certificates guaranteed floater Series 2338 Class FJ, 3.5881% 7/15/31 (f) | | 5,197,631 | | 5,199,968 |
Freddie Mac Multi-class participation certificates guaranteed: | | | | |
floater: | | | | |
Series 2474 Class FJ, 3.7381% 7/15/17 (f) | | 4,556,922 | | 4,564,198 |
Series 2526 Class FC, 3.7881% 11/15/32 (f) | | 3,597,778 | | 3,616,182 |
Series 2538 Class FB, 3.7881% 12/15/32 (f) | | 6,607,741 | | 6,651,155 |
Series 2551 Class FH, 3.8381% 1/15/33 (f) | | 3,358,821 | | 3,373,027 |
planned amortization class: | | | | |
Series 2136 Class PE, 6% 1/15/28 | | 12,190,349 | | 12,248,248 |
Series 2394 Class ND, 6% 6/15/27 | | 1,550,172 | | 1,553,415 |
Series 2395 Class PE, 6% 2/15/30 | | 5,961,413 | | 6,000,327 |
Series 2398 Class DK, 6.5% 1/15/31 | | 372,760 | | 373,347 |
Series 2410 Class ML, 6.5% 12/15/30 | | 2,168,673 | | 2,179,211 |
Series 2420 Class BE, 6.5% 12/15/30 | | 2,595,889 | | 2,604,122 |
Series 2443 Class TD, 6.5% 10/15/30 | | 2,962,497 | | 2,977,827 |
Series 2461 Class PG, 6.5% 1/15/31 | | 2,737,118 | | 2,773,721 |
Series 2466 Class EC, 6% 10/15/27 | | 257,483 | | 257,163 |
Series 2483 Class DC, 5.5% 7/15/14 | | 1,861,588 | | 1,861,466 |
Series 2556 Class PM, 5.5% 2/15/16 | | 1,160,963 | | 1,159,984 |
Series 2776 Class UJ, 4.5% 5/15/20 (g) | | 7,104,375 | | 367,384 |
Series 2828 Class JA, 4.5% 1/15/10 | | 11,880,000 | | 11,903,044 |
sequential pay: | | | | |
Series 2430 Class ZE, 6.5% 8/15/27 | | 648,803 | | 649,120 |
Series 2480 Class QW, 5.75% 2/15/30 | | 871,905 | | 871,370 |
Collateralized Mortgage Obligations - continued |
| Principal Amount | | Value |
U.S. Government Agency - continued |
Freddie Mac Multi-class participation certificates guaranteed: - continued | | | | |
Series 2406: | | | | |
Class FP, 4.3681% 1/15/32 (f) | | $ 10,270,000 | | $ 10,502,819 |
Class PF, 4.3681% 12/15/31 (f) | | 8,125,000 | | 8,337,955 |
Series 2410 Class PF, 4.3681% 2/15/32 (f) | | 18,644,444 | | 19,070,154 |
Ginnie Mae guaranteed REMIC pass thru securities floater: | | | | |
Series 2001-46 Class FB, 3.7381% 5/16/23 (f) | | 2,988,811 | | 3,001,292 |
Series 2001-50 Class FV, 3.5881% 9/16/27 (f) | | 9,114,548 | | 9,113,939 |
Series 2002-24 Class FX, 3.9381% 4/16/32 (f) | | 2,630,687 | | 2,652,779 |
Series 2002-31 Class FW, 3.7881% 6/16/31 (f) | | 3,614,097 | | 3,633,687 |
Series 2002-5 Class KF, 3.7881% 8/16/26 (f) | | 617,815 | | 618,278 |
TOTAL U.S. GOVERNMENT AGENCY | | 207,447,494 |
TOTAL COLLATERALIZED MORTGAGE OBLIGATIONS (Cost $1,104,119,465) | 1,102,867,414 |
Commercial Mortgage Securities - 5.8% |
|
1301 Avenue of The Americas Trust Series 2000-1301: | | | | |
Class C, 7.44% 8/3/10 (c)(f) | | 5,025,000 | | 5,024,881 |
Class D, 7.54% 8/3/10 (c)(f) | | 6,695,000 | | 6,694,844 |
Banc of America Large Loan, Inc. floater: | | | | |
Series 2003-BBA2 Class A3, 3.7081% 11/15/15 (c)(f) | | 5,038,226 | | 5,041,400 |
Series 2005-BOCA: | | | | |
Class H, 4.3381% 12/15/16 (c)(f) | | 2,065,000 | | 2,061,834 |
Class J, 4.4881% 12/15/16 (c)(f) | | 1,020,000 | | 1,018,438 |
Class K, 4.7381% 12/15/16 (c)(f) | | 6,659,000 | | 6,650,611 |
Bayview Commercial Asset Trust floater: | | | | |
Series 2003-1 Class A, 4.04% 8/25/33 (c)(f) | | 6,644,316 | | 6,723,250 |
Series 2003-2: | | | | |
Class A, 4.04% 12/25/33 (c)(f) | | 13,522,369 | | 13,687,661 |
Class M1, 4.31% 12/25/33 (c)(f) | | 2,200,548 | | 2,236,841 |
Series 2004-1: | | | | |
Class A, 3.82% 4/25/34 (c)(f) | | 6,403,472 | | 6,414,728 |
Class B, 5.36% 4/25/34 (c)(f) | | 665,296 | | 672,910 |
Class M1, 4.02% 4/25/34 (c)(f) | | 582,134 | | 584,681 |
Class M2, 4.66% 4/25/34 (c)(f) | | 498,972 | | 504,819 |
Commercial Mortgage Securities - continued |
| Principal Amount | | Value |
Bayview Commercial Asset Trust floater: - continued | | | | |
Series 2004-2: | | | | |
Class A, 3.89% 8/25/34 (c)(f) | | $ 6,299,807 | | $ 6,330,814 |
Class M1, 4.04% 8/25/34 (c)(f) | | 2,031,330 | | 2,039,265 |
Series 2004-3: | | | | |
Class A1, 3.83% 1/25/35 (c)(f) | | 6,582,479 | | 6,605,519 |
Class A2, 3.88% 1/25/35 (c)(f) | | 914,869 | | 918,092 |
Class M1, 3.96% 1/25/35 (c)(f) | | 1,097,080 | | 1,098,564 |
Class M2, 4.46% 1/25/35 (c)(f) | | 715,487 | | 719,742 |
Series 2005-2A: | | | | |
Class M1, 3.73% 8/25/35 (c)(f) | | 1,297,812 | | 1,297,812 |
Class M2, 3.78% 8/25/35 (c)(f) | | 2,136,399 | | 2,136,399 |
Class M3, 3.8% 8/25/35 (c)(f) | | 1,183,006 | | 1,183,006 |
Class M4, 3.91% 8/25/35 (c)(f) | | 1,088,166 | | 1,088,166 |
Bear Stearns Commercial Mortgage Securities, Inc. floater: | | | | |
Series 2003-BA1A: | | | | |
Class JFCM, 4.98% 4/14/15 (c)(f) | | 1,344,296 | | 1,350,087 |
Class JMM, 4.88% 4/14/15 (c)(f) | | 1,384,053 | | 1,385,065 |
Class KFCM, 5.23% 4/14/15 (c)(f) | | 1,436,661 | | 1,443,179 |
Class KMM, 5.13% 4/14/15 (c)(f) | | 1,253,767 | | 1,254,776 |
Class LFCM, 5.63% 4/14/15 (c)(f) | | 1,601,905 | | 1,602,545 |
Class MFCM, 5.93% 4/14/15 (c)(f) | | 2,218,251 | | 2,219,234 |
Series 2004-BBA3 Class E, 4.0881% 6/15/17 (c)(f) | | 10,415,000 | | 10,415,949 |
Chase Commercial Mortgage Securities Corp. floater Series 2000-FL1A: | | | | |
Class B, 3.81% 12/12/13 (c)(f) | | 896,672 | | 897,536 |
Class C, 4.16% 12/12/13 (c)(f) | | 1,793,345 | | 1,801,374 |
COMM floater: | | | | |
Series 2001-FL5A Class E, 4.8881% 11/15/13 (c)(f) | | 3,049,546 | | 3,048,573 |
Series 2002-FL6: | | | | |
Class F, 4.8381% 6/14/14 (c)(f) | | 11,163,000 | | 11,190,451 |
Class G, 5.2881% 6/14/14 (c)(f) | | 5,000,000 | | 5,000,444 |
Series 2003-FL9 Class B, 3.8881% 11/15/15 (c)(f) | | 10,354,700 | | 10,383,149 |
Commercial Mortgage pass thru certificates floater: | | | | |
Series 2004-CNL: | | | | |
Class A2, 3.6881% 9/15/14 (c)(f) | | 3,570,000 | | 3,573,440 |
Class G, 4.3681% 9/15/14 (c)(f) | | 1,345,000 | | 1,345,538 |
Class H, 4.4681% 9/15/14 (c)(f) | | 1,430,000 | | 1,430,571 |
Class J, 4.9881% 9/15/14 (c)(f) | | 490,000 | | 491,560 |
Class K, 5.3881% 9/15/14 (c)(f) | | 770,000 | | 771,587 |
Class L, 5.5881% 9/15/14 (c)(f) | | 625,000 | | 624,693 |
Commercial Mortgage Securities - continued |
| Principal Amount | | Value |
Commercial Mortgage pass thru certificates floater: - continued | | | | |
Series 2004-HTL1: | | | | |
Class B, 3.8381% 7/15/16 (c)(f) | | $ 495,379 | | $ 495,732 |
Class D, 3.9381% 7/15/16 (c)(f) | | 1,125,628 | | 1,125,788 |
Class E, 4.1381% 7/15/16 (c)(f) | | 805,726 | | 806,031 |
Class F, 4.1881% 7/15/16 (c)(f) | | 852,671 | | 853,207 |
Class H, 4.6881% 7/15/16 (c)(f) | | 2,472,312 | | 2,473,143 |
Class J, 4.8381% 7/15/16 (c)(f) | | 950,314 | | 950,633 |
Class K, 5.7381% 7/15/16 (c)(f) | | 1,069,720 | | 1,069,257 |
Commercial Mortgage Pass-Through Certificates floater Series 2005-F10A: | | | | |
Class B, 3.6181% 4/15/17 (c)(f) | | 7,080,000 | | 7,080,000 |
Class C, 3.6581% 4/15/17 (c)(f) | | 3,006,000 | | 3,006,000 |
Class D, 3.6981% 4/15/17 (c)(f) | | 2,440,000 | | 2,440,000 |
Class E, 3.7581% 4/15/17 (c)(f) | | 1,821,000 | | 1,821,000 |
Class F, 3.7981% 4/15/17 (c)(f) | | 1,035,000 | | 1,035,000 |
Class G, 3.9381% 4/15/17 (c)(f) | | 1,035,000 | | 1,035,000 |
Class H, 4.0081% 4/15/17 (c)(f) | | 1,035,000 | | 1,035,000 |
Class I, 4.2381% 4/15/17 (c)(f) | | 335,000 | | 335,000 |
Class MOA3, 3.6881% 3/15/20 (c)(f) | | 4,590,000 | | 4,590,000 |
CS First Boston Mortgage Securities Corp.: | | | | |
floater: | | | | |
Series 2001-TFLA Class G, 5.1381% 12/15/11 (c)(f) | | 3,720,000 | | 3,702,795 |
Series 2002-TFLA Class C, 3.9688% 11/18/12 (c)(f) | | 3,675,000 | | 3,674,923 |
Series 2003-TF2A Class A2, 3.7081% 11/15/14 (c)(f) | | 9,500,000 | | 9,507,100 |
Series 2004-FL1 Class B, 3.8381% 5/15/14 (c)(f) | | 11,230,000 | | 11,235,571 |
Series 2004-HC1: | | | | |
Class A2, 3.8881% 12/15/21 (c)(f) | | 1,475,000 | | 1,474,997 |
Class B, 4.1381% 12/15/21 (c)(f) | | 3,835,000 | | 3,834,992 |
Series 2004-TF2A Class E, 3.8081% 11/15/19 (c)(f) | | 4,450,000 | | 4,456,884 |
Series 2004-TFL1: | | | | |
Class A2, 3.5781% 2/15/14 (c)(f) | | 7,005,000 | | 7,007,087 |
Class E, 3.9381% 2/15/14 (c)(f) | | 2,800,000 | | 2,806,033 |
Class F, 3.9881% 2/15/14 (c)(f) | | 2,325,000 | | 2,330,394 |
Class G, 4.2381% 2/15/14 (c)(f) | | 1,875,000 | | 1,880,617 |
Class H, 4.4881% 2/15/14 (c)(f) | | 1,400,000 | | 1,403,733 |
Class J, 4.7881% 2/15/14 (c)(f) | | 750,000 | | 753,724 |
Commercial Mortgage Securities - continued |
| Principal Amount | | Value |
CS First Boston Mortgage Securities Corp.: - continued | | | | |
Series 2005-TF2A Class F, 3.8881% 11/15/19 (c)(f) | | $ 1,540,000 | | $ 1,542,381 |
Series 2005-TFLA: | | | | |
Class C, 3.6281% 2/15/20 (c)(f) | | 5,650,000 | | 5,649,989 |
Class E, 3.7181% 2/15/20 (c)(f) | | 3,955,000 | | 3,954,992 |
Class F, 3.7681% 2/15/20 (c)(f) | | 1,745,000 | | 1,744,997 |
Class G, 3.9081% 2/15/20 (c)(f) | | 505,000 | | 504,998 |
Class H, 4.1381% 2/15/20 (c)(f) | | 715,000 | | 714,998 |
sequential pay Series 1997-C2 Class A2, 6.52% 1/17/35 | | 518,675 | | 522,823 |
Series 2003-TFLA Class G, 3.7357% 4/15/13 (c)(f) | | 446,933 | | 445,553 |
GMAC Commercial Mortgage Securities, Inc. floater Series 2001-FL1A Class E, 4.2% 2/11/11 (c)(f) | | 264,524 | | 264,175 |
GS Mortgage Securities Corp. II floater Series 2005-FL7A Class A1, 3.5% 11/6/19 (c)(f) | | 10,526,054 | | 10,527,180 |
ISTAR Asset Receivables Trust floater Series 2002-1A Class A2, 3.8613% 5/28/20 (c)(f) | | 2,727,545 | | 2,728,117 |
John Hancock Tower Mortgage Trust floater Series 2003-C5A Class B, 5.6585% 4/10/15 (c)(f) | | 8,245,000 | | 8,150,339 |
JP Morgan Chase Commercial Mortgage Security Corp.: | | | | |
floater Series 2005-FL1A: | | | | |
Class WH, 3.97% 6/15/19 (c)(f) | | 3,325,000 | | 3,325,100 |
Class WJ, 4.17% 6/15/19 (c)(f) | | 2,045,000 | | 2,045,061 |
Class WK, 4.57% 6/15/19 (c)(f) | | 3,065,000 | | 3,065,092 |
Series 2005-FL1A Class WX1, 1.2068% 6/15/19 (c)(f)(g) | | 240,000,000 | | 2,596,800 |
Lehman Brothers Floating Rate Commercial Mortgage Trust: | | | | |
floater: | | | | |
Series 2003-C4A: | | | | |
Class F, 5.6% 7/11/15 (c)(f) | | 813,387 | | 813,822 |
Class H, 6.35% 7/11/15 (c)(f) | | 8,267,264 | | 8,287,932 |
Series 2003-LLFA: | | | | |
Class A2, 3.77% 12/16/14 (c)(f) | | 11,700,000 | | 11,707,744 |
Class B, 3.98% 12/16/14 (c)(f) | | 4,615,000 | | 4,626,299 |
Class C, 4.08% 12/16/14 (c)(f) | | 4,982,000 | | 4,997,311 |
Series 2005-LLFA Class FAIR, 5.1138% 7/15/19 (c)(d)(f) | | 4,360,000 | | 4,360,000 |
Morgan Stanley Dean Witter Capital I Trust floater Series 2002-XLF Class F, 5.49% 8/5/14 (c)(f) | | 7,603,983 | | 7,603,972 |
Commercial Mortgage Securities - continued |
| Principal Amount | | Value |
Salomon Brothers Mortgage Securities VII, Inc.: | | | | |
floater: | | | | |
Series 2001-CDCA: | | | | |
Class C, 4.1881% 2/15/13 (c)(f) | | $ 10,495,000 | | $ 10,291,568 |
Class D, 4.1881% 2/15/13 (c)(f) | | 4,000,000 | | 3,891,288 |
Series 2003-CDCA: | | | | |
Class HEXB, 5.2881% 2/15/15 (c)(f) | | 770,000 | | 771,001 |
Class JEXB, 5.4881% 2/15/15 (c)(f) | | 1,300,000 | | 1,301,690 |
Class KEXB, 5.8881% 2/15/15 (c)(f) | | 960,000 | | 961,248 |
Series 2000-NL1 Class E, 7.0607% 10/15/30 (c)(f) | | 3,657,956 | | 3,672,236 |
SDG Macerich Properties LP floater Series 2000-1 Class A3, 3.7281% 5/15/09 (c)(f) | | 18,000,000 | | 18,008,086 |
STRIPS III Ltd./STRIPS III Corp. floater Series 2004-1A Class A, 3.78% 3/24/18 (c)(f) | | 7,263,029 | | 7,263,029 |
Wachovia Bank Commercial Mortgage Trust floater: | | | | |
Series 2004-WHL3: | | | | |
Class A2, 3.5681% 3/15/14 (c)(f) | | 3,510,000 | | 3,511,290 |
Class E, 3.8881% 3/15/14 (c)(f) | | 2,190,000 | | 2,192,749 |
Class F, 3.9381% 3/15/14 (c)(f) | | 1,755,000 | | 1,757,120 |
Class G, 4% 3/15/14 (c)(f) | | 875,000 | | 876,363 |
Series 2005-WL5A: | | | | |
Class KHP1, 3.7381% 1/15/18 (c)(f) | | 1,745,000 | | 1,745,000 |
Class KHP2, 3.9381% 1/15/18 (c)(f) | | 1,745,000 | | 1,745,000 |
Class KHP3, 4.2381% 1/15/18 (c)(f) | | 2,060,000 | | 2,060,000 |
Class KHP4, 4.3381% 1/15/18 (c)(f) | | 1,600,000 | | 1,600,000 |
Class KHP5, 4.5381% 1/15/18 (c)(f) | | 1,855,000 | | 1,855,000 |
TOTAL COMMERCIAL MORTGAGE SECURITIES (Cost $378,363,353) | 378,866,012 |
Interfund Loans - 0.1% |
| | | |
With Fidelity Equity-Income Fund, at 3.43442% due 8/1/05 (b) (Cost $8,443,000) | | 8,443,000 | | 8,443,000 |
Cash Equivalents - 40.4% |
| | Maturity
Amount | | Value |
Investments in repurchase agreements (Collateralized by U.S. Government Obligations, in a joint trading account at 3.32%, dated 7/29/05 due 8/1/05) (i) | | $ 2,354,814,398 | | $ 2,354,164,000 |
With Goldman Sachs & Co. at 3.41%, dated 7/1/05 due 8/23/05 (Collateralized by Mortgage Loan Obligations valued at $295,800,001, 0.9%- 10.36%, 4/18/17 - 6/25/44) (f)(h) | | 291,455,881 | | 289,998,492 |
TOTAL CASH EQUIVALENTS (Cost $2,644,164,000) | | 2,644,162,492 |
TOTAL INVESTMENT PORTFOLIO - 102.2% (Cost $6,679,436,405) | | | 6,685,115,608 |
NET OTHER ASSETS - (2.2)% | | | (140,968,200) |
NET ASSETS - 100% | | $ 6,544,147,408 |
Futures Contracts |
| Expiration Date | | Underlying Face Amount at Value | | Unrealized Appreciation/
(Depreciation) |
Sold |
Eurodollar Contracts |
73 Eurodollar 90 Day Index Contracts | Dec. 2005 | | $ 72,221,638 | | $ 34,806 |
49 Eurodollar 90 Day Index Contracts | March 2006 | | 48,464,675 | | 28,036 |
32 Eurodollar 90 Day Index Contracts | June 2006 | | 31,645,600 | | 16,247 |
27 Eurodollar 90 Day Index Contracts | Sept. 2006 | | 26,698,612 | | 16,355 |
26 Eurodollar 90 Day Index Contracts | Dec. 2006 | | 25,707,500 | | 14,421 |
24 Eurodollar 90 Day Index Contracts | March 2007 | | 23,729,700 | | 12,329 |
17 Eurodollar 90 Day Index Contracts | June 2007 | | 16,807,688 | | 5,970 |
16 Eurodollar 90 Day Index Contracts | Sept. 2007 | | 15,818,200 | | 5,711 |
15 Eurodollar 90 Day Index Contracts | Dec. 2007 | | 14,828,250 | | 5,590 |
15 Eurodollar 90 Day Index Contracts | March 2008 | | 14,827,875 | | 5,015 |
8 Eurodollar 90 Day Index Contracts | June 2008 | | 7,907,800 | | 7,518 |
7 Eurodollar 90 Day Index Contracts | Sept. 2008 | | 6,918,888 | | 6,885 |
TOTAL EURODOLLAR CONTRACTS | | 158,883 |
Swap Agreements |
| | | Notional Amount | | Value |
Credit Default Swap |
Receive from Citibank, upon default event of DaimlerChrysler NA Holding Corp., par value of the notional amount of DaimlerChrysler NA Holding Corp. 6.5% 11/15/13, and pay quarterly notional amount multiplied by .8% | June 2007 | | $ 14,000,000 | | $ (135,972) |
Receive quarterly notional amount multiplied by 1.12% and pay Morgan Stanley, Inc. upon default of Comcast Cable Communications, Inc., par value of the notional amount of Comcast Cable Communications, Inc. 6.75% 1/30/11 | June 2006 | | 10,000,000 | | 102,057 |
TOTAL CREDIT DEFAULT SWAP | 24,000,000 | | (33,915) |
Swap Agreements - continued |
| Expiration Date | | Notional Amount | | Value |
Total Return Swap |
Receive monthly notional amount multiplied by the nominal spread appreciation of the Lehman Brothers CMBS U.S. Aggregate Index adjusted by a modified duration factor plus 10 basis points and pay monthly notional amount multiplied by the nominal spread depreciation of the Lehman Brothers CMBS U.S. Aggregate Index adjusted by a modified duration factor with Lehman Brothers, Inc. | Oct. 2005 | | $ 48,200,000 | | $ 46,335 |
Receive monthly notional amount multiplied by the nominal spread appreciation of the Lehman Brothers CMBS U.S. Aggregate Index adjusted by a modified duration factor plus 25 basis points and pay monthly notional amount multiplied by the nominal spread depreciation of the Lehman Brothers CMBS U.S. Aggregate Index adjusted by a modified duration factor with Lehman Brothers, Inc. | Dec. 2005 | | 30,000,000 | | 32,511 |
Receive monthly notional amount multiplied by the nominal spread appreciation of the Lehman Brothers CMBS U.S. Aggregate Index adjusted by a modified duration factor plus 30 basis points and pay monthly notional amount multiplied by the nominal spread depreciation of the Lehman Brothers CMBS U.S. Aggregate Index adjusted by a modified duration factor with Lehman Brothers, Inc. | August 2005 | | 35,100,000 | | 33,945 |
Swap Agreements - continued |
| Expiration Date | | Notional Amount | | Value |
Receive monthly notional amount multiplied by the nominal spread appreciation of the Lehman Brothers CMBS U.S. Aggregate Index adjusted by a modified duration factor plus 22 basis points and pay monthly notional amount multiplied by the nominal spread depreciation of the Lehman Brothers CMBS U.S. Aggregate Index adjusted by a modified duration factor with Lehman Brothers, Inc. | Jan. 2006 | | $ 35,100,000 | | $ 32,229 |
Receive monthly a return equal to Lehman Brothers ABS Floating Rate Index and pay monthly a floating rate based on the 1- month LIBOR minus 11.1 basis points with Lehman Brothers, Inc. | Nov. 2005 | | 30,000,000 | | 0 |
TOTAL TOTAL RETURN SWAP | 178,400,000 | | 145,020 |
| | $ 202,400,000 | | $ 111,105 |
Legend |
(a) Debt obligation initially issued at one coupon which converts to a higher coupon at a specified date. The rate shown is the rate at period end. |
(b) Affiliated entity |
(c) Security exempt from registration under Rule 144A of the Securities Act of 1933. These securities may be resold in transactions exempt from registration, normally to qualified institutional buyers. At the period end, the value of these securities amounted to $586,119,417 or 9.0% of net assets. |
(d) Security or a portion of the security purchased on a delayed delivery or when-issued basis. |
(e) Security or a portion of the security was pledged to cover margin requirements for futures contracts. At the period end, the value of securities pledged amounted to $994,635. |
(f) The coupon rate shown on floating or adjustable rate securities represents the rate at period end. |
(g) Security represents right to receive monthly interest payments on an underlying pool of mortgages. Principal shown is the par amount of the mortgage pool. |
(h) The maturity amount is based on the rate at period end. |
(i) Additional information on each counterparty to the repurchase agreement is as follows: |
Repurchase Agreement/
Counterparty | Value |
$2,354,164,000 due 8/1/05 at 3.32% | |
Banc of America Securities LLC. | $ 471,596,247 |
Bank of America, National Association | 244,985,063 |
Barclays Capital Inc. | 979,940,254 |
Countrywide Securities Corporation | 244,985,063 |
Morgan Stanley & Co. Incorporated. | 351,411,107 |
UBS Securities LLC | 61,246,266 |
| $ 2,354,164,000 |
Income Tax Information |
At July 31, 2005, the aggregate cost of investment securities for income tax purposes was $6,679,021,266. Net unrealized appreciation aggregated $6,094,342, of which $11,067,257 related to appreciated investment securities and $4,972,915 related to depreciated investment securities. |
Annual Report
Managing Your Investments
Fidelity offers several ways to conveniently manage your personal investments via your telephone or PC. You can access your account information, conduct trades and research your investments 24 hours a day.
By Phone
Fidelity Automated Service Telephone provides a single toll-free number to access account balances, positions, quotes and trading. It's easy to navigate the service, and on your first call, the system will help you create a personal identification number (PIN) for security.
(phone_graphic)
Fidelity Automated
Service Telephone (FAST®)
1-800-544-5555
Press
1 For mutual fund and brokerage trading.
2 For quotes.*
3 For account balances and holdings.
4 To review orders and mutual
fund activity.
5 To change your PIN.
*0 To speak to a Fidelity representative.
By PC
Fidelity's web site on the Internet provides a wide range of information, including daily financial news, fund performance, interactive planning tools and news about Fidelity products and services.
(computer_graphic)
Fidelity's Web Site
www.fidelity.com
* When you call the quotes line, please remember that a fund's yield and return will vary and, except for money market funds, share price will also vary. This means that you may have a gain or loss when you sell your shares. There is no assurance that money market funds will be able to maintain a stable $1 share price; an investment in a money market fund is not insured or guaranteed by the U.S. government. Total returns are historical and include changes in share price, reinvestment of dividends and capital gains, and the effects of any sales charges.
Annual Report
To Visit Fidelity
For directions and hours,
please call 1-800-544-9797.
Arizona
7001 West Ray Road
Chandler, AZ
7373 N. Scottsdale Road
Scottsdale, AZ
California
815 East Birch Street
Brea, CA
1411 Chapin Avenue
Burlingame, CA
851 East Hamilton Avenue
Campbell, CA
19200 Von Karman Avenue
Irvine, CA
601 Larkspur Landing Circle
Larkspur, CA
10100 Santa Monica Blvd.
Los Angeles, CA
27101 Puerta Real
Mission Viejo, CA
73-575 El Paseo
Palm Desert, CA
251 University Avenue
Palo Alto, CA
123 South Lake Avenue
Pasadena, CA
16995 Bernardo Ctr. Drive
Rancho Bernardo, CA
1740 Arden Way
Sacramento, CA
7676 Hazard Center Drive
San Diego, CA
8 Montgomery Street
San Francisco, CA
3793 State Street
Santa Barbara, CA
21701 Hawthorne Boulevard
Torrance, CA
2001 North Main Street
Walnut Creek, CA
6300 Canoga Avenue
Woodland Hills, CA
Colorado
1625 Broadway
Denver, CO
9185 East Westview Road
Littleton, CO
Connecticut
48 West Putnam Avenue
Greenwich, CT
265 Church Street
New Haven, CT
300 Atlantic Street
Stamford, CT
29 South Main Street
West Hartford, CT
Delaware
222 Delaware Avenue
Wilmington, DE
Florida
4400 N. Federal Highway
Boca Raton, FL
121 Alhambra Plaza
Coral Gables, FL
2948 N. Federal Highway
Ft. Lauderdale, FL
1907 West State Road 434
Longwood, FL
8880 Tamiami Trail, North
Naples, FL
3550 Tamiami Trail, South
Sarasota, FL
1502 N. Westshore Blvd.
Tampa, FL
2465 State Road 7
Wellington, FL
3501 PGA Boulevard
West Palm Beach, FL
Georgia
3445 Peachtree Road, N.E.
Atlanta, GA
1000 Abernathy Road
Atlanta, GA
Illinois
One North LaSalle Street
Chicago, IL
875 North Michigan Ave.
Chicago, IL
1415 West 22nd Street
Oak Brook, IL
1700 East Golf Road
Schaumburg, IL
3232 Lake Avenue
Wilmette, IL
Indiana
4729 East 82nd Street
Indianapolis, IN
Kansas
5400 College Boulevard
Overland Park, KS
Maine
Three Canal Plaza
Portland, ME
Maryland
7315 Wisconsin Avenue
Bethesda, MD
One W. Pennsylvania Ave.
Towson, MD
Massachusetts
801 Boylston Street
Boston, MA
155 Congress Street
Boston, MA
300 Granite Street
Braintree, MA
44 Mall Road
Burlington, MA
405 Cochituate Road
Framingham, MA
416 Belmont Street
Worcester, MA
Michigan
500 E. Eisenhower Pkwy.
Ann Arbor, MI
280 Old N. Woodward Ave.
Birmingham, MI
43420 Grand River Avenue
Novi, MI
29155 Northwestern Hwy.
Southfield, MI
Minnesota
7600 France Avenue South
Edina, MN
Missouri
8885 Ladue Road
Ladue, MO
Fidelity Brokerage Services, Inc., 100 Summer St., Boston, MA 02110 Member NYSE/SIPC
Annual Report
Nevada
2225 Village Walk Drive
Henderson, NV
New Jersey
150 Essex Street
Millburn, NJ
56 South Street
Morristown, NJ
396 Route 17, North
Paramus, NJ
3518 Route 1 North
Princeton, NJ
530 Highway 35
Shrewsbury, NJ
New York
1055 Franklin Avenue
Garden City, NY
37 West Jericho Turnpike
Huntington Station, NY
1271 Avenue of the Americas
New York, NY
61 Broadway
New York, NY
350 Park Avenue
New York, NY
200 Fifth Avenue
New York, NY
733 Third Avenue
New York, NY
11 Penn Plaza
New York, NY
2070 Broadway
New York, NY
1075 Northern Blvd.
Roslyn, NY
North Carolina
4611 Sharon Road
Charlotte, NC
Ohio
3805 Edwards Road
Cincinnati, OH
1324 Polaris Parkway
Columbus, OH
28699 Chagrin Boulevard
Woodmere Village, OH
Oregon
16850 SW 72nd Avenue
Tigard, OR
Pennsylvania
600 West DeKalb Pike
King of Prussia, PA
1735 Market Street
Philadelphia, PA
12001 Perry Highway
Wexford, PA
Rhode Island
47 Providence Place
Providence, RI
Tennessee
6150 Poplar Avenue
Memphis, TN
Texas
10000 Research Boulevard
Austin, TX
4001 Northwest Parkway
Dallas, TX
12532 Memorial Drive
Houston, TX
2701 Drexel Drive
Houston, TX
6500 N. MacArthur Blvd.
Irving, TX
6005 West Park Boulevard
Plano, TX
14100 San Pedro
San Antonio, TX
1576 East Southlake Blvd.
Southlake, TX
19740 IH 45 North
Spring, TX
Utah
215 South State Street
Salt Lake City, UT
Virginia
1861 International Drive
McLean, VA
Washington
411 108th Avenue, N.E.
Bellevue, WA
1518 6th Avenue
Seattle, WA
Washington, DC
1900 K Street, N.W.
Washington, DC
Wisconsin
595 North Barker Road
Brookfield, WI
Annual Report
Investment Adviser
Fidelity Management & Research Company
Boston, MA
Investment Sub-Advisers
FMR Co., Inc.
Fidelity Management & Research
(Far East) Inc.
Fidelity Management & Research
(U.K.) Inc.
Fidelity Investments Japan Limited
Fidelity International Investment
Advisers
Fidelity International Investment
Advisers (U.K.) Limited
General Distributor
Fidelity Distributors Corporation
Boston, MA
Transfer and Service Agent
Fidelity Service Company, Inc.
Boston, MA
Custodian
Citibank, N.A.
New York, NY
The Fidelity Telephone Connection
Mutual Fund 24-Hour Service
Exchanges/Redemptions
and Account Assistance 1-800-544-6666
Product Information 1-800-544-6666
Retirement Accounts 1-800-544-4774
(8 a.m. - 9 p.m.)
TDD Service 1-800-544-0118
for the deaf and hearing impaired
(9 a.m. - 9 p.m. Eastern time)
Fidelity Automated Service
Telephone (FAST®) (automated graphic) 1-800-544-5555
(automated graphic) Automated line for quickest service
REI-UANN-0905
1.789710.102
(Fidelity Investment logo)(registered trademark)
Corporate Headquarters
82 Devonshire St., Boston, MA 02109
www.fidelity.com
(Fidelity Investment logo)(registered trademark)
Corporate Headquarters
82 Devonshire St., Boston, MA 02109
www.fidelity.com
Fidelity®
Small Cap Growth
Fund
Annual Report
July 31, 2005
(2_fidelity_logos) (Registered_Trademark)
Contents
Chairman's Message | <Click Here> | Ned Johnson's message to shareholders. |
Performance | <Click Here> | How the fund has done over time. |
Management's Discussion | <Click Here> | The managers' review of fund performance, strategy and outlook |
Shareholder Expense Example | <Click Here> | An example of shareholder expenses. |
Investment Changes | <Click Here> | A summary of major shifts in the fund's investments over the past six months. |
Investments | <Click Here> | A complete list of the fund's investments with their market values. |
Financial Statements | <Click Here> | Statements of assets and liabilities, operations, and changes in net assets,
as well as financial highlights. |
Notes | <Click Here> | Notes to the financial statements. |
Report of Independent Registered Public Accounting Firm | <Click Here> | |
Trustees and Officers | <Click Here> | |
Distributions | <Click Here> | |
Board Approval of Investment Advisory Contracts and Management Fees | <Click Here> | |
To view a fund's proxy voting guidelines and proxy voting record for the 12-month period ended June 30, visit www.fidelity.com/proxyvotingresults or visit the Securities and Exchange Commission's (SEC) web site at www.sec.gov. You may also call 1-800-544-8544 to request a free copy of the proxy voting guidelines.
Standard & Poor's, S&P and S&P 500 are registered service marks of The McGraw-Hill Companies, Inc. and have been licensed for use by Fidelity Distributors Corporation.
Other third party marks appearing herein are the property of their respective owners.
All other marks appearing herein are registered or unregistered trademarks or service marks of FMR Corp. or an affiliated company.
Annual Report
This report and the financial statements contained herein are submitted for the general information of the shareholders of the fund. This report is not authorized for distribution to prospective investors in the fund unless preceded or accompanied by an effective prospectus.
A fund files its complete schedule of portfolio holdings with the SEC for the first and third quarters of each fiscal year on Form N-Q. Forms N-Q are available on the SEC's web site at http://www.sec.gov. A fund's Forms N-Q may be reviewed and copied at the SEC's Public Reference Room in Washington, DC. Information regarding the operation of the SEC's Public Reference Room may be obtained by calling 1-800-SEC-0330. For a complete list of a fund's portfolio holdings, view the fund's most recent quarterly holdings report, semiannual report, or annual report on Fidelity's web site at http://www.fidelity.com/holdings.
NOT FDIC INSURED · MAY LOSE VALUE · NO BANK GUARANTEE
Neither the fund nor Fidelity Distributors Corporation is a bank.
Annual Report
Chairman's Message
(photo_of_Edward_C_Johnson_3d)
Dear Shareholder:
During the past year or so, much has been reported about the mutual fund industry, and much of it has been more critical than I believe is warranted. Allegations that some companies have been less than forthright with their shareholders have cast a shadow on the entire industry. I continue to find these reports disturbing, and assert that they do not create an accurate picture of the industry overall. Therefore, I would like to remind everyone where Fidelity stands on these issues. I will say two things specifically regarding allegations that some mutual fund companies were in violation of the Securities and Exchange Commission's forward pricing rules or were involved in so-called "market timing" activities.
First, Fidelity has no agreements that permit customers who buy fund shares after 4 p.m. to obtain the 4 p.m. price. This is not a new policy. This is not to say that someone could not deceive the company through fraudulent acts. However, we are extremely diligent in preventing fraud from occurring in this manner - and in every other. But I underscore again that Fidelity has no so-called "agreements" that sanction illegal practices.
Second, Fidelity continues to stand on record, as we have for years, in opposition to predatory short-term trading that adversely affects shareholders in a mutual fund. Back in the 1980s, we initiated a fee - which is returned to the fund and, therefore, to investors - to discourage this activity. Further, we took the lead several years ago in developing a Fair Value Pricing Policy to prevent market timing on foreign securities in our funds. I am confident we will find other ways to make it more difficult for predatory traders to operate. However, this will only be achieved through close cooperation among regulators, legislators and the industry.
Yes, there have been unfortunate instances of unethical and illegal activity within the mutual fund industry from time to time. That is true of any industry. When this occurs, confessed or convicted offenders should be dealt with appropriately. But we are still concerned about the risk of over-regulation and the quick application of simplistic solutions to intricate problems. Every system can be improved, and we support and applaud well thought out improvements by regulators, legislators and industry representatives that achieve the common goal of building and protecting the value of investors' holdings.
For nearly 60 years, Fidelity has worked very hard to improve its products and service to justify your trust. When our family founded this company in 1946, we had only a few hundred customers. Today, we serve more than 18 million customers including individual investors and participants in retirement plans across America.
Let me close by saying that we do not take your trust in us for granted, and we realize that we must always work to improve all aspects of our service to you. In turn, we urge you to continue your active participation with your financial matters, so that your interests can be well served.
Best regards,
/s/Edward C. Johnson 3d
Edward C. Johnson 3d
Annual Report
Performance: The Bottom Line
Average annual total return reflects the change in the value of an investment, assuming reinvestment of the fund's dividend income and capital gains (the profits earned upon the sale of securities that have grown in value) and assuming a constant rate of performance each year. The $10,000 table and the fund's returns do not reflect the deduction of taxes that a shareholder would pay on fund distributions or the redemption of fund shares. During periods of reimbursement by Fidelity, a fund's total return will be greater than it would be had the reimbursement not occurred. How a fund did yesterday is no guarantee of how it will do tomorrow.
Average annual total returns take Fidelity Small Cap Growth Fund's cumulative total return and show you what would have happened if Small Cap Growth Fund shares had performed at a constant rate each year. These numbers will be reported once the fund is a year old.
$10,000 Life of Fund
Let's say hypothetically that $10,000 was invested in Fidelity® Small Cap Growth Fund on November 3, 2004, when the fund started. The chart shows how the value of your investment would have changed, and also shows how the Russell 2000® Growth Index performed over the same period.
Annual Report
Management's Discussion of Fund Performance
Comments from Jamie Harmon, Lead Portfolio Manager, and Lionel Harris and Chuck Myers, Portfolio Managers of Fidelity® Small Cap Growth Fund. The team assumed management of the fund on April 7, 2005.
A late-inning rally on Wall Street helped push some key U.S. equity indexes to four-year highs by the conclusion of the 12-month period ending July 31, 2005. Spurred on by bullish economic data and strong corporate earnings, investors enjoyed a stellar month of July, capping off a turbulent 12-month period for U.S. equity markets. Stock prices bounced up and down during most of the year, moving in cadence with gyrations in the price of crude oil and investors' gathering and ebbing concerns about inflation. The Federal Reserve Board raised short-term interest rates eight times during the period, also affecting overall market sentiment. Despite their fluctuations, the major equity indexes finished on a high note, with the Standard & Poor's 500SM Index and the NASDAQ Composite® Index posting gains of 14.05% and 16.51%, respectively, for the period. The small-cap Russell 2000® Index rose 24.78% and the Russell Midcap® Index jumped 28.93%, while the blue-chips' Dow Jones Industrial AverageSM advanced only 7.29%.
Small Cap Growth performed very well, gaining 29.80% since its inception date of November 3, 2004, through July 31, 2005. By comparison, the fund's benchmark, the Russell 2000 Growth Index, rose 13.53%. The fund's strong results were driven mainly by positive stock selection in energy, health care and information technology, with sector selection in all three areas playing a lesser but still significant role. Energy names such as Quicksilver Resources and Holly Corp. benefited from continued high oil prices. Also helping was Omnicare, a provider of institutional pharmacy services to nursing homes. Omnicare gained as investors became more confident that the company's profit margins were sustainable and that an acquisition of rival NeighborCare might occur. By contrast, EVCI Career Colleges performed poorly after an earnings shortfall and disclosure of controversial management pay packages. Tempur-Pedic International, a maker of foam mattresses, fell after its widely anticipated new product offering was introduced at a lower price point than expected. Investors discounted the stock because they interpreted this move as an indication of growing competition.
The views expressed in this statement reflect those of the portfolio managers only through the end of the period of the report as stated on the cover and do not necessarily represent the views of Fidelity or any other person in the Fidelity organization. Any such views are subject to change at any time based upon market or other conditions and Fidelity disclaims any responsibility to update such views. These views may not be relied on as investment advice and, because investment decisions for a Fidelity fund are based on numerous factors, may not be relied on as an indication of trading intent on behalf of any Fidelity fund.
Annual Report
Shareholder Expense Example
As a shareholder of the Fund, you incur two types of costs: (1) transaction costs, including sales charges (loads) on purchase payments or redemption proceeds, redemption fees, and (2) ongoing costs, including management fees, distribution and/or service (12b-1) fees and other Fund expenses. This Example is intended to help you understand your ongoing costs (in dollars) of investing in the Fund and to compare these costs with the ongoing costs of investing in other mutual funds.
The Example is based on an investment of $1,000 invested at the beginning of the period and held for the entire period (February 1, 2005 to July 31, 2005).
Actual Expenses
The first line of the table below for each class of the Fund provides information about actual account values and actual expenses. You may use the information in this line, together with the amount you invested, to estimate the expenses that you paid over the period. Simply divide your account value by $1,000.00 (for example, an $8,600 account value divided by $1,000.00 = 8.6), then multiply the result by the number in the first line for a class of the Fund under the heading entitled "Expenses Paid During Period" to estimate the expenses you paid on your account during this period. A small balance maintenance fee of $12.00 that is charged once a year may apply for certain accounts with a value of less than $2,000. This fee is not included in the table below. If it was, the estimate of expenses you paid during the period would be higher, and your ending account value lower, by this amount.
Hypothetical Example for Comparison Purposes
The second line of the table below for each class of the Fund provides information about hypothetical account values and hypothetical expenses based on a Class' actual expense ratio and an assumed rate of return of 5% per year before expenses, which is not the Class' actual return. The hypothetical account values and expenses may not be used to estimate the actual ending account balance or expenses you paid for the period. You may use this information to compare the ongoing costs of investing in the Fund and other funds. To do so, compare this 5% hypothetical example with the 5% hypothetical examples that appear in the shareholder reports of the other funds. A small balance maintenance fee of $12.00 that is charged once a year may apply for certain accounts with a value of less than $2,000. This fee is not included in the table below. If it was, the estimate of expenses you paid during the period would be higher, and your ending account value lower, by this amount.
Annual Report
Shareholder Expense Example - continued
Please note that the expenses shown in the table are meant to highlight your ongoing costs only and do not reflect any transaction costs. Therefore, the second line of the table is useful in comparing ongoing costs only, and will not help you determine the relative total costs of owning different funds. In addition, if these transactional costs were included, your costs would have been higher.
| Beginning
Account Value
February 1, 2005 | Ending
Account Value
July 31, 2005 | Expenses Paid
During Period*
February 1, 2005
to July 31, 2005 |
Class A | | | |
Actual | $ 1,000.00 | $ 1,125.10 | $ 7.59 |
HypotheticalA | $ 1,000.00 | $ 1,017.65 | $ 7.20 |
Class T | | | |
Actual | $ 1,000.00 | $ 1,124.30 | $ 8.90 |
HypotheticalA | $ 1,000.00 | $ 1,016.41 | $ 8.45 |
Class B | | | |
Actual | $ 1,000.00 | $ 1,121.10 | $ 11.52 |
HypotheticalA | $ 1,000.00 | $ 1,013.93 | $ 10.94 |
Class C | | | |
Actual | $ 1,000.00 | $ 1,121.00 | $ 11.36 |
HypotheticalA | $ 1,000.00 | $ 1,014.08 | $ 10.79 |
Small Cap Growth | | | |
Actual | $ 1,000.00 | $ 1,126.70 | $ 6.06 |
HypotheticalA | $ 1,000.00 | $ 1,019.09 | $ 5.76 |
Institutional Class | | | |
Actual | $ 1,000.00 | $ 1,126.80 | $ 6.12 |
HypotheticalA | $ 1,000.00 | $ 1,019.04 | $ 5.81 |
A 5% return per year before expenses
* Expenses are equal to each Class' annualized expense ratio (shown in the table below); multiplied by the average account value over the period, multiplied by 181/365 (to reflect the one-half year period).
| Annualized
Expense Ratio |
Class A | 1.44% |
Class T | 1.69% |
Class B | 2.19% |
Class C | 2.16% |
Small Cap Growth | 1.15% |
Institutional Class | 1.16% |
Annual Report
Investment Changes
Top Ten Stocks as of July 31, 2005 |
| % of fund's
net assets | % of fund's net assets
6 months ago |
Big 5 Sporting Goods Corp. | 3.1 | 1.6 |
Pacific Sunwear of California, Inc. | 2.2 | 1.8 |
Lionbridge Technologies, Inc. | 2.2 | 3.0 |
Abaxis, Inc. | 2.0 | 0.0 |
America Service Group, Inc. | 2.0 | 0.8 |
Monaco Coach Corp. | 2.0 | 0.0 |
Tempur-Pedic International, Inc. | 2.0 | 0.0 |
Aspen Insurance Holdings Ltd. | 2.0 | 0.0 |
Career Education Corp. | 1.9 | 2.3 |
Fossil, Inc. | 1.9 | 0.0 |
| 21.3 | |
Top Five Market Sectors as of July 31, 2005 |
| % of fund's
net assets | % of fund's net assets
6 months ago |
Consumer Discretionary | 27.0 | 20.5 |
Information Technology | 24.1 | 17.6 |
Health Care | 13.3 | 14.5 |
Industrials | 10.0 | 11.9 |
Energy | 9.1 | 16.8 |
Asset Allocation (% of fund's net assets) |
As of July 31, 2005* | As of January 31, 2005** |
| Stocks 96.1% | | | Stocks 90.5% | |
| Short-Term
Investments and
Net Other Assets 3.9% | | | Short-Term
Investments and
Net Other Assets 9.5% | |
* Foreign
investments | 9.9% | | ** Foreign investments | 14.8% | |

Annual Report
Investments July 31, 2005
Showing Percentage of Net Assets
Common Stocks - 96.1% |
| Shares | | Value (Note 1) |
CONSUMER DISCRETIONARY - 27.0% |
Automobiles - 2.0% |
Monaco Coach Corp. | 259,400 | | $ 4,539,500 |
Diversified Consumer Services - 3.5% |
Career Education Corp. (a) | 112,700 | | 4,371,633 |
EVCI Career Colleges, Inc. (a) | 549,491 | | 3,516,742 |
| | 7,888,375 |
Hotels, Restaurants & Leisure - 4.2% |
CEC Entertainment, Inc. (a) | 107,800 | | 4,129,818 |
Ctrip.com International Ltd. sponsored ADR | 30,100 | | 1,667,691 |
Domino's Pizza, Inc. | 68,800 | | 1,721,376 |
Papa John's International, Inc. (a) | 46,800 | | 2,017,080 |
| | 9,535,965 |
Household Durables - 3.2% |
Interface, Inc. Class A (a) | 74,200 | | 757,582 |
Lifetime Brands, Inc. | 88,000 | | 1,980,880 |
Tempur-Pedic International, Inc. (a)(d) | 260,700 | | 4,486,647 |
| | 7,225,109 |
Internet & Catalog Retail - 2.1% |
Blue Nile, Inc. (a)(d) | 56,000 | | 1,862,560 |
Collegiate Pacific, Inc. (d) | 251,300 | | 2,970,366 |
| | 4,832,926 |
Multiline Retail - 0.8% |
Tuesday Morning Corp. | 51,300 | | 1,811,403 |
Specialty Retail - 7.4% |
Big 5 Sporting Goods Corp. | 254,500 | | 7,036,922 |
Finish Line, Inc. Class A | 140,000 | | 2,532,600 |
Genesco, Inc. (a) | 63,000 | | 2,348,010 |
Pacific Sunwear of California, Inc. (a) | 206,000 | | 5,024,340 |
| | 16,941,872 |
Textiles, Apparel & Luxury Goods - 3.8% |
Fossil, Inc. (a) | 180,268 | | 4,288,576 |
Lakeland Industries, Inc. | 23,034 | | 371,769 |
Steven Madden Ltd. (a) | 181,863 | | 4,064,638 |
| | 8,724,983 |
TOTAL CONSUMER DISCRETIONARY | | 61,500,133 |
CONSUMER STAPLES - 1.8% |
Personal Products - 1.8% |
NBTY, Inc. (a) | 169,500 | | 4,101,900 |
Common Stocks - continued |
| Shares | | Value (Note 1) |
ENERGY - 9.1% |
Energy Equipment & Services - 3.4% |
AKITA Drilling Ltd. Class A (non-vtg.) | 59,000 | | $ 804,754 |
Hornbeck Offshore Services, Inc. (a) | 30,000 | | 897,000 |
Maverick Tube Corp. (a) | 88,000 | | 2,918,960 |
Oil States International, Inc. (a) | 55,200 | | 1,632,816 |
Pason Systems, Inc. | 79,600 | | 1,566,840 |
| | 7,820,370 |
Oil, Gas & Consumable Fuels - 5.7% |
Alberta Clipper Energy, Inc. (a) | 46,363 | | 177,977 |
Forest Oil Corp. (a) | 34,000 | | 1,521,840 |
Frontier Oil Corp. | 55,000 | | 1,541,100 |
Holly Corp. | 59,700 | | 2,795,154 |
OMI Corp. | 140,000 | | 2,524,200 |
Quicksilver Resources, Inc. (a) | 46,250 | | 1,959,150 |
Range Resources Corp. | 81,000 | | 2,473,740 |
| | 12,993,161 |
TOTAL ENERGY | | 20,813,531 |
FINANCIALS - 8.1% |
Capital Markets - 1.0% |
optionsXpress Holdings, Inc. | 144,000 | | 2,335,680 |
Commercial Banks - 0.6% |
Cascade Bancorp | 62,100 | | 1,427,058 |
Insurance - 6.5% |
Aspen Insurance Holdings Ltd. | 157,000 | | 4,460,370 |
Hilb Rogal & Hobbs Co. | 90,800 | | 3,077,212 |
IPC Holdings Ltd. | 52,400 | | 2,119,580 |
PXRE Group Ltd. | 75,615 | | 1,928,183 |
USI Holdings Corp. (a) | 238,800 | | 3,062,610 |
| | 14,647,955 |
TOTAL FINANCIALS | | 18,410,693 |
HEALTH CARE - 13.3% |
Health Care Equipment & Supplies - 3.9% |
Abaxis, Inc. (a) | 373,300 | | 4,658,784 |
Nutraceutical International Corp. (a) | 84,388 | | 1,197,466 |
Regeneration Technologies, Inc. (a) | 417,000 | | 3,177,540 |
| | 9,033,790 |
Common Stocks - continued |
| Shares | | Value (Note 1) |
HEALTH CARE - continued |
Health Care Providers & Services - 9.4% |
America Service Group, Inc. (a) | 212,500 | | $ 4,585,750 |
American Dental Partners, Inc. (a) | 46,900 | | 1,292,564 |
AmSurg Corp. (a) | 55,700 | | 1,560,157 |
ICON PLC sponsored ADR (a) | 51,500 | | 2,016,225 |
Molina Healthcare, Inc. (a) | 50,000 | | 1,197,000 |
Omnicare, Inc. | 85,500 | | 3,941,550 |
Pediatrix Medical Group, Inc. (a) | 39,500 | | 3,097,590 |
Per-Se Technologies, Inc. (a) | 46,400 | | 1,070,448 |
VCA Antech, Inc. (a) | 110,800 | | 2,630,392 |
| | 21,391,676 |
TOTAL HEALTH CARE | | 30,425,466 |
INDUSTRIALS - 10.0% |
Aerospace & Defense - 0.7% |
BE Aerospace, Inc. (a) | 96,000 | | 1,682,880 |
Building Products - 0.3% |
Quixote Corp. | 30,100 | | 611,933 |
Commercial Services & Supplies - 1.9% |
Navigant Consulting, Inc. (a) | 100,700 | | 2,014,000 |
PeopleSupport, Inc. | 135,000 | | 1,294,650 |
The Geo Group, Inc. (a) | 33,000 | | 902,550 |
| | 4,211,200 |
Construction & Engineering - 0.9% |
Comfort Systems USA, Inc. (a) | 266,500 | | 2,065,375 |
Electrical Equipment - 1.9% |
C&D Technologies, Inc. | 219,300 | | 2,208,351 |
Genlyte Group, Inc. (a) | 43,000 | | 2,209,340 |
| | 4,417,691 |
Machinery - 2.3% |
Freightcar America, Inc. | 76,600 | | 2,455,796 |
Watts Water Technologies, Inc. Class A | 75,500 | | 2,755,750 |
| | 5,211,546 |
Marine - 0.3% |
Alexander & Baldwin, Inc. | 12,700 | | 679,196 |
Road & Rail - 0.7% |
P.A.M. Transportation Services, Inc. (a) | 91,000 | | 1,497,860 |
Common Stocks - continued |
| Shares | | Value (Note 1) |
INDUSTRIALS - continued |
Trading Companies & Distributors - 1.0% |
WESCO International, Inc. (a) | 70,000 | | $ 2,384,200 |
TOTAL INDUSTRIALS | | 22,761,881 |
INFORMATION TECHNOLOGY - 24.1% |
Communications Equipment - 2.4% |
Avocent Corp. (a) | 51,500 | | 1,795,290 |
Harris Corp. | 97,000 | | 3,595,790 |
| | 5,391,080 |
Computers & Peripherals - 1.8% |
Avid Technology, Inc. (a) | 52,500 | | 2,160,375 |
iCAD, Inc. (a) | 105,300 | | 375,921 |
Mobility Electronics, Inc. (a) | 138,000 | | 1,600,800 |
| | 4,137,096 |
Electronic Equipment & Instruments - 3.4% |
Arrow Electronics, Inc. (a) | 26,200 | | 786,524 |
Cogent, Inc. | 69,000 | | 2,074,830 |
Measurement Specialties, Inc. (a) | 64,200 | | 1,624,260 |
ScanSource, Inc. (a) | 34,500 | | 1,646,685 |
Xyratex Ltd. (a) | 95,000 | | 1,591,250 |
| | 7,723,549 |
Internet Software & Services - 2.6% |
Akamai Technologies, Inc. (a) | 95,800 | | 1,462,866 |
Homestore, Inc. (a) | 340,000 | | 897,600 |
iMergent, Inc. (a) | 100,400 | | 1,139,540 |
j2 Global Communications, Inc. (a) | 59,900 | | 2,402,589 |
| | 5,902,595 |
IT Services - 5.0% |
Lionbridge Technologies, Inc. (a) | 767,146 | | 4,971,106 |
SI International, Inc. (a) | 118,700 | | 3,740,237 |
TALX Corp. | 55,550 | | 2,049,795 |
Tyler Technologies, Inc. (a) | 79,300 | | 629,642 |
| | 11,390,780 |
Office Electronics - 1.0% |
Zebra Technologies Corp. Class A (a) | 60,000 | | 2,340,000 |
Semiconductors & Semiconductor Equipment - 3.7% |
California Micro Devices Corp. (a) | 89,000 | | 582,060 |
Cascade Microtech, Inc. | 121,861 | | 1,630,500 |
Intersil Corp. Class A | 104,000 | | 2,014,480 |
Common Stocks - continued |
| Shares | | Value (Note 1) |
INFORMATION TECHNOLOGY - continued |
Semiconductors & Semiconductor Equipment - continued |
O2Micro International Ltd. (a) | 67,200 | | $ 1,153,152 |
Silicon Laboratories, Inc. (a) | 55,000 | | 1,609,850 |
Tessera Technologies, Inc. (a) | 44,000 | | 1,545,280 |
| | 8,535,322 |
Software - 4.2% |
Blackbaud, Inc. | 156,859 | | 2,243,084 |
Bottomline Technologies, Inc. (a) | 129,000 | | 2,030,460 |
DATATRAK International, Inc. (a)(e) | 10,000 | | 219,500 |
DATATRAK International, Inc. warrants 12/23/07 (a)(e) | 1,500 | | 11,055 |
Moldflow Corp. (a) | 57,000 | | 892,620 |
Phase Forward, Inc. | 386,052 | | 3,092,277 |
SERENA Software, Inc. (a) | 49,000 | | 1,005,480 |
| | 9,494,476 |
TOTAL INFORMATION TECHNOLOGY | | 54,914,898 |
MATERIALS - 1.6% |
Containers & Packaging - 0.5% |
Myers Industries, Inc. | 95,000 | | 1,254,000 |
Metals & Mining - 1.1% |
Apex Silver Mines Ltd. (a) | 31,000 | | 430,280 |
Goldcorp, Inc. | 122,000 | | 1,982,930 |
| | 2,413,210 |
TOTAL MATERIALS | | 3,667,210 |
TELECOMMUNICATION SERVICES - 0.8% |
Diversified Telecommunication Services - 0.8% |
FairPoint Communications, Inc. | 109,000 | | 1,787,600 |
UTILITIES - 0.3% |
Multi-Utilities - 0.3% |
CMS Energy Corp. (a) | 45,000 | | 712,800 |
TOTAL COMMON STOCKS (Cost $199,508,126) | 219,096,112 |
Money Market Funds - 7.1% |
| Shares | | Value (Note 1) |
Fidelity Cash Central Fund, 3.31% (b) | 13,111,943 | | $ 13,111,943 |
Fidelity Securities Lending Cash Central Fund, 3.32% (b)(c) | 3,015,200 | | 3,015,200 |
TOTAL MONEY MARKET FUNDS (Cost $16,127,143) | 16,127,143 |
TOTAL INVESTMENT PORTFOLIO - 103.2% (Cost $215,635,269) | | 235,223,255 |
NET OTHER ASSETS - (3.2)% | | (7,278,885) |
NET ASSETS - 100% | $ 227,944,370 |
Legend |
(a) Non-income producing |
(b) Affiliated fund that is available only to investment companies and other accounts managed by Fidelity Investments. The rate quoted is the annualized seven-day yield of the fund at period end. A complete listing of the fund's holdings as of its most recent quarter end is available upon request. |
(c) Investment made with cash collateral received from securities on loan. |
(d) Security or a portion of the security is on loan at period end. |
(e) Restricted securities - Investment in securities not registered under the Securities Act of 1933 (excluding 144A issues). At the end of the period, the value of restricted securities (excluding 144A issues) amounted to $230,555 or 0.1% of net assets. |
Additional information on each holding is as follows: |
Security | Acquisition Date | Acquisition Cost |
DATATRAK International, Inc. | 12/27/04 | $ 95,000 |
DATATRAK International, Inc. warrants 12/23/07 | 12/27/04 | 0 |
An affiliated company is a company in which the fund has ownership of at least 5% of the voting securities. Companies which are affiliates of the fund at period-end are noted in the fund's Schedule of Investments. Transactions during the period with companies which are or were affiliates are as follows: |
Affiliate | Value,
beginning
of period | Purchases | Sales Proceeds | Dividend Income | Value,
end of
period |
Collegiate Pacific, Inc. | $ - | $ 7,098,636 | $ 3,699,650 | $ 29,840 | $ - |
TOTALS | $ - | $ 7,098,636 | $ 3,699,650 | $ 29,840 | $ - |
See accompanying notes which are an integral part of the financial statements.
Annual Report
Financial Statements
Statement of Assets and Liabilities
| July 31, 2005 |
| | |
Assets | | |
Investment in securities, at value (including securities loaned of $2,995,562) (cost $215,635,269) - See accompanying schedule | | $ 235,223,255 |
Foreign currency held at value (cost $34,077) | | 34,045 |
Receivable for investments sold | | 3,676,503 |
Receivable for fund shares sold | | 6,892,475 |
Dividends receivable | | 4,968 |
Interest receivable | | 40,377 |
Prepaid expenses | | 23,822 |
Receivable from investment adviser for expense reductions | | 1,660 |
Other affiliated receivables | | 76 |
Other receivables | | 57,762 |
Total assets | | 245,954,943 |
| | |
Liabilities | | |
Payable to custodian bank | $ 1,846 | |
Payable for investments purchased | 14,722,078 | |
Payable for fund shares redeemed | 91,405 | |
Accrued management fee | 111,204 | |
Distribution fees payable | 10,809 | |
Other affiliated payables | 33,311 | |
Other payables and accrued expenses | 24,720 | |
Collateral on securities loaned, at value | 3,015,200 | |
Total liabilities | | 18,010,573 |
| | |
Net Assets | | $ 227,944,370 |
Net Assets consist of: | | |
Paid in capital | | $ 205,410,038 |
Accumulated net investment loss | | (14,971) |
Accumulated undistributed net realized gain (loss) on investments and foreign currency transactions | | 2,961,349 |
Net unrealized appreciation (depreciation) on investments and assets and liabilities in foreign currencies | | 19,587,954 |
Net Assets | | $ 227,944,370 |
See accompanying notes which are an integral part of the financial statements.
Annual Report
Statement of Assets and Liabilities - continued
| July 31, 2005 |
| | |
Calculation of Maximum Offering Price
Class A:
Net Asset Value and redemption price per share
($4,719,086 ÷ 364,450 shares) | | $ 12.95 |
| | |
Maximum offering price per share (100/94.25 of $12.95) | | $ 13.74 |
Class T:
Net Asset Value and redemption price per share ($5,239,546 ÷ 405,372 shares) | | $ 12.93 |
| | |
Maximum offering price per share (100/96.50 of $12.93) | | $ 13.40 |
Class B:
Net Asset Value and offering price per share ($2,054,739 ÷ 159,623 shares)A | | $ 12.87 |
| | |
Class C:
Net Asset Value and offering price per share ($8,372,444 ÷ 650,058 shares)A | | $ 12.88 |
| | |
Small Cap Growth:
Net Asset Value, offering price and redemption price per share ($205,652,093 ÷ 15,842,436 shares) | | $ 12.98 |
| | |
Institutional Class:
Net Asset Value, offering price and redemption price per share ($1,906,462 ÷ 146,954 shares) | | $ 12.97 |
A Redemption price per share is equal to net asset value less any applicable contingent deferred sales charge.
See accompanying notes which are an integral part of the financial statements.
Annual Report
Financial Statements - continued
Statement of Operations
| For the period November 3, 2004 (commencement of operations) to July 31, 2005 |
| | |
Investment Income | | |
Dividends (including $29,840 received from affiliated issuers) | | $ 270,319 |
Interest | | 183,813 |
Security lending | | 1,526 |
Total income | | 455,658 |
| | |
Expenses | | |
Management fee | $ 563,759 | |
Transfer agent fees | 179,370 | |
Distribution fees | 48,838 | |
Accounting and security lending fees | 35,102 | |
Independent trustees' compensation | 284 | |
Custodian fees and expenses | 16,621 | |
Registration fees | 88,279 | |
Audit | 31,530 | |
Legal | 91 | |
Miscellaneous | 185 | |
Total expenses before reductions | 964,059 | |
Expense reductions | (73,677) | 890,382 |
Net investment income (loss) | | (434,724) |
Realized and Unrealized Gain (Loss) Net realized gain (loss) on: | | |
Investment securities (Including realized gain (loss) of $(557,638) from affiliated issuers) | 3,383,303 | |
Foreign currency transactions | (2,201) | |
Total net realized gain (loss) | | 3,381,102 |
Change in net unrealized appreciation (depreciation) on: Investment securities | 19,587,986 | |
Assets and liabilities in foreign currencies | (32) | |
Total change in net unrealized appreciation (depreciation) | | 19,587,954 |
Net gain (loss) | | 22,969,056 |
Net increase (decrease) in net assets resulting from operations | | $ 22,534,332 |
See accompanying notes which are an integral part of the financial statements.
Annual Report
Statement of Changes in Net Assets
| For the period November 3, 2004 (commencement
of operations) to
July 31, 2005 |
Increase (Decrease) in Net Assets | |
Operations | |
Net investment income (loss) | $ (434,724) |
Net realized gain (loss) | 3,381,102 |
Change in net unrealized appreciation (depreciation) | 19,587,954 |
Net increase (decrease) in net assets resulting from operations | 22,534,332 |
Share transactions - net increase (decrease) | 205,303,288 |
Redemption fees | 106,750 |
Total increase (decrease) in net assets | 227,944,370 |
| |
Net Assets | |
Beginning of period | - |
End of period (including accumulated net investment loss of $14,971) | $ 227,944,370 |
See accompanying notes which are an integral part of the financial statements.
Annual Report
Financial Highlights - Class A
Year ended July 31, | 2005 F |
Selected Per-Share Data | |
Net asset value, beginning of period | $ 10.00 |
Income from Investment Operations | |
Net investment income (loss) E | (.07) |
Net realized and unrealized gain (loss) | 3.01 |
Total from investment operations | 2.94 |
Redemption fees added to paid in capital E | .01 |
Net asset value, end of period | $ 12.95 |
Total Return B, C, D | 29.50% |
Ratios to Average Net Assets G | |
Expenses before expense reductions | 1.55% A |
Expenses net of voluntary waivers, if any | 1.45% A |
Expenses net of all reductions | 1.36% A |
Net investment income (loss) | (.78)% A |
Supplemental Data | |
Net assets, end of period (000 omitted) | $ 4,719 |
Portfolio turnover rate | 93% A |
A Annualized
B Total returns for periods of less than one year are not annualized.
C Total returns would have been lower had certain expenses not been reduced during the periods shown.
D Total returns do not include the effect of the sales charges.
E Calculated based on average shares outstanding during the period.
F For the period November 3, 2004 (commencement of operations) to July 31, 2005.
G Expense ratios reflect operating expenses of the class. Expenses before reductions do not reflect amounts reimbursed by the investment adviser or reductions from brokerage service arrangements or other expense offset arrangements and do not represent the amount paid by the class during periods when reimbursements or reductions occur. Expense ratios before reductions for start-up periods may not be representative of longer-term operating periods. Expenses net of any voluntary waivers reflect expenses after reimbursement by the investment adviser but prior to reductions from brokerage service arrangements or other expense offset arrangements. Expenses net of all reductions represent the net expenses paid by the class.
See accompanying notes which are an integral part of the financial statements.
Annual Report
Financial Highlights - Class T
Year ended July 31, | 2005 F |
Selected Per-Share Data | |
Net asset value, beginning of period | $ 10.00 |
Income from Investment Operations | |
Net investment income (loss) E | (.09) |
Net realized and unrealized gain (loss) | 3.01 |
Total from investment operations | 2.92 |
Redemption fees added to paid in capital E | .01 |
Net asset value, end of period | $ 12.93 |
Total Return B, C, D | 29.30% |
Ratios to Average Net Assets G | |
Expenses before expense reductions | 1.79% A |
Expenses net of voluntary waivers, if any | 1.70% A |
Expenses net of all reductions | 1.61% A |
Net investment income (loss) | (1.03)% A |
Supplemental Data | |
Net assets, end of period (000 omitted) | $ 5,240 |
Portfolio turnover rate | 93% A |
A Annualized
B Total returns for periods of less than one year are not annualized.
C Total returns would have been lower had certain expenses not been reduced during the periods shown.
D Total returns do not include the effect of the sales charges.
E Calculated based on average shares outstanding during the period.
F For the period November 3, 2004 (commencement of operations) to July 31, 2005.
G Expense ratios reflect operating expenses of the class. Expenses before reductions do not reflect amounts reimbursed by the investment adviser or reductions from brokerage service arrangements or other expense offset arrangements and do not represent the amount paid by the class during periods when reimbursements or reductions occur. Expense ratios before reductions for start-up periods may not be representative of longer-term operating periods. Expenses net of any voluntary waivers reflect expenses after reimbursement by the investment adviser but prior to reductions from brokerage service arrangements or other expense offset arrangements. Expenses net of all reductions represent the net expenses paid by the class.
See accompanying notes which are an integral part of the financial statements.
Annual Report
Financial Highlights - Class B
Year ended July 31, | 2005 F |
Selected Per-Share Data | |
Net asset value, beginning of period | $ 10.00 |
Income from Investment Operations | |
Net investment income (loss) E | (.13) |
Net realized and unrealized gain (loss) | 2.99 |
Total from investment operations | 2.86 |
Redemption fees added to paid in capital E | .01 |
Net asset value, end of period | $ 12.87 |
Total Return B, C, D | 28.70% |
Ratios to Average Net Assets G | |
Expenses before expense reductions | 2.33% A |
Expenses net of voluntary waivers, if any | 2.20% A |
Expenses net of all reductions | 2.11% A |
Net investment income (loss) | (1.53)% A |
Supplemental Data | |
Net assets, end of period (000 omitted) | $ 2,055 |
Portfolio turnover rate | 93% A |
A Annualized
B Total returns for periods of less than one year are not annualized.
C Total returns would have been lower had certain expenses not been reduced during the periods shown.
D Total returns do not include the effect of the contingent deferred sales charge.
E Calculated based on average shares outstanding during the period.
F For the period November 3, 2004 (commencement of operations) to July 31, 2005.
G Expense ratios reflect operating expenses of the class. Expenses before reductions do not reflect amounts reimbursed by the investment adviser or reductions from brokerage service arrangements or other expense offset arrangements and do not represent the amount paid by the class during periods when reimbursements or reductions occur. Expense ratios before reductions for start-up periods may not be representative of longer-term operating periods. Expenses net of any voluntary waivers reflect expenses after reimbursement by the investment adviser but prior to reductions from brokerage service arrangements or other expense offset arrangements. Expenses net of all reductions represent the net expenses paid by the class.
See accompanying notes which are an integral part of the financial statements.
Annual Report
Financial Highlights - Class C
Year ended July 31, | 2005 F |
Selected Per-Share Data | |
Net asset value, beginning of period | $ 10.00 |
Income from Investment Operations | |
Net investment income (loss) E | (.13) |
Net realized and unrealized gain (loss) | 3.00 |
Total from investment operations | 2.87 |
Redemption fees added to paid in capital E | .01 |
Net asset value, end of period | $ 12.88 |
Total Return B, C, D | 28.80% |
Ratios to Average Net Assets G | |
Expenses before expense reductions | 2.24% A |
Expenses net of voluntary waivers, if any | 2.17% A |
Expenses net of all reductions | 2.09% A |
Net investment income (loss) | (1.50)% A |
Supplemental Data | |
Net assets, end of period (000 omitted) | $ 8,372 |
Portfolio turnover rate | 93% A |
A Annualized
B Total returns for periods of less than one year are not annualized.
C Total returns would have been lower had certain expenses not been reduced during the periods shown.
D Total returns do not include the effect of the contingent deferred sales charge.
E Calculated based on average shares outstanding during the period.
F For the period November 3, 2004 (commencement of operations) to July 31, 2005.
G Expense ratios reflect operating expenses of the class. Expenses before reductions do not reflect amounts reimbursed by the investment adviser or reductions from brokerage service arrangements or other expense offset arrangements and do not represent the amount paid by the class during periods when reimbursements or reductions occur. Expense ratios before reductions for start-up periods may not be representative of longer--term operating periods. Expenses net of any voluntary waivers reflect expenses after reimbursement by the investment adviser but prior to reductions from brokerage service arrangements or other expense offset arrangements. Expenses net of all reductions represent the net expenses paid by the class.
See accompanying notes which are an integral part of the financial statements.
Annual Report
Financial Highlights - Small Cap Growth
Year ended July 31, | 2005 E |
Selected Per-Share Data | |
Net asset value, beginning of period | $ 10.00 |
Income from Investment Operations | |
Net investment income (loss) D | (.04) |
Net realized and unrealized gain (loss) | 3.01 |
Total from investment operations | 2.97 |
Redemption fees added to paid in capital D | .01 |
Net asset value, end of period | $ 12.98 |
Total Return B, C | 29.80% |
Ratios to Average Net Assets F | |
Expenses before expense reductions | 1.16% A |
Expenses net of voluntary waivers, if any | 1.16% A |
Expenses net of all reductions | 1.08% A |
Net investment income (loss) | (.49)% A |
Supplemental Data | |
Net assets, end of period (000 omitted) | $ 205,652 |
Portfolio turnover rate | 93% A |
A Annualized
B Total returns for periods of less than one year are not annualized.
C Total returns would have been lower had certain expenses not been reduced during the periods shown.
D Calculated based on average shares outstanding during the period.
E For the period November 3, 2004 (commencement of operations) to July 31, 2005.
F Expense ratios reflect operating expenses of the class. Expenses before reductions do not reflect amounts reimbursed by the investment adviser or reductions from brokerage service arrangements or other expense offset arrangements and do not represent the amount paid by the class during periods when reimbursements or reductions occur. Expense ratios before reductions for start-up periods may not be representative of longer-term operating periods. Expenses net of any voluntary waivers reflect expenses after reimbursement by the investment adviser but prior to reductions from brokerage service arrangements or other expense offset arrangements. Expenses net of all reductions represent the net expenses paid by the class.
See accompanying notes which are an integral part of the financial statements.
Annual Report
Financial Highlights - Institutional Class
Year ended July 31, | 2005 E |
Selected Per-Share Data | |
Net asset value, beginning of period | $ 10.00 |
Income from Investment Operations | |
Net investment income (loss) D | (.04) |
Net realized and unrealized gain (loss) | 3.00 |
Total from investment operations | 2.96 |
Redemption fees added to paid in capital D | .01 |
Net asset value, end of period | $ 12.97 |
Total Return B, C | 29.70% |
Ratios to Average Net Assets F | |
Expenses before expense reductions | 1.20% A |
Expenses net of voluntary waivers, if any | 1.18% A |
Expenses net of all reductions | 1.10% A |
Net investment income (loss) | (.51)% A |
Supplemental Data | |
Net assets, end of period (000 omitted) | $ 1,906 |
Portfolio turnover rate | 93% A |
A Annualized
B Total returns for periods of less than one year are not annualized.
C Total returns would have been lower had certain expenses not been reduced during the periods shown.
D Calculated based on average shares outstanding during the period.
E For the period November 3, 2004 (commencement of operations) to July 31, 2005.
F Expense ratios reflect operating expenses of the class. Expenses before reductions do not reflect amounts reimbursed by the investment adviser or reductions from brokerage service arrangements or other expense offset arrangements and do not represent the amount paid by the class during periods when reimbursements or reductions occur. Expense ratios before reductions for start-up periods may not be representative of longer-term operating periods. Expenses net of any voluntary waivers reflect expenses after reimbursement by the investment adviser but prior to reductions from brokerage service arrangements or other expense offset arrangements. Expenses net of all reductions represent the net expenses paid by the class.
See accompanying notes which are an integral part of the financial statements.
Annual Report
Notes to Financial Statements
For the period ended July 31, 2005
1. Significant Accounting Policies.
Fidelity Small Cap Growth Fund (the fund) is a non-diversified fund of Fidelity Securities Fund (the trust) and is authorized to issue an unlimited number of shares. The trust is registered under the Investment Company Act of 1940, as amended (the 1940 Act), as an open-end management investment company organized as a Massachusetts business trust.
The fund offers Class A, Class T, Class B, Class C, Small Cap Growth, and Institutional Class shares, each of which has equal rights as to assets and voting privileges. Each class has exclusive voting rights with respect to matters that affect that class. Class B shares will automatically convert to Class A shares after a holding period of seven years from the initial date of purchase. Investment income, realized and unrealized capital gains and losses, the common expenses of the fund, and certain fund-level expense reductions, if any, are allocated on a pro rata basis to each class based on the relative net assets of each class to the total net assets of the fund. Each class differs with respect to transfer agent and distribution and service plan fees incurred. Certain expense reductions also differ by class.
The financial statements have been prepared in conformity with accounting principles generally accepted in the United States of America, which require management to make certain estimates and assumptions at the date of the financial statements. The following summarizes the significant accounting policies of the fund:
Security Valuation. Net asset value per share (NAV calculation) is calculated as of the close of business of the New York Stock Exchange, normally 4:00 p.m. Eastern time. Equity securities, including restricted securities, for which market quotations are available are valued at the last sale price or official closing price (closing bid price or last evaluated quote if no sale has occurred) on the primary market or exchange on which they trade. If prices are not readily available or do not accurately reflect fair value for a security, or if a security's value has been materially affected by events occurring after the close of the exchange or market on which the security is principally traded, that security may be valued by another method that the Board of Trustees believes accurately reflects fair value. A security's valuation may differ depending on the method used for determining value. Price movements in futures contracts and ADRs, market and trading trends, the bid/ask quotes of brokers and off-exchange institutional trading may be reviewed in the course of making a good faith determination of a security's fair value. Short-term securities with remaining maturities of sixty days or less for which quotations are not readily available are valued on the basis of amortized cost. Investments in open-end investment companies are valued at their net asset value each business day.
Foreign Currency. The fund uses foreign currency contracts to facilitate transactions in foreign-denominated securities. Losses from these transactions may arise from changes in the value of the foreign currency or if the counterparties do not perform under the contracts' terms.
Annual Report
1. Significant Accounting Policies - continued
Foreign Currency - continued
Foreign-denominated assets, including investment securities, and liabilities are translated into U.S. dollars at the exchange rate at period end. Purchases and sales of investment securities, income and dividends received and expenses denominated in foreign currencies are translated into U.S. dollars at the exchange rate in effect on the transaction date.
The effects of exchange rate fluctuations on investments are included with the net realized and unrealized gain (loss) on investment securities. Other foreign currency transactions resulting in realized and unrealized gain (loss) are disclosed separately.
Investment Transactions and Income. Security transactions are accounted for as of trade date. Gains and losses on securities sold are determined on the basis of identified cost. Dividend income is recorded on the ex-dividend date, except for certain dividends from foreign securities where the ex-dividend date may have passed, which are recorded as soon as the fund is informed of the ex-dividend date. Non-cash dividends included in dividend income, if any, are recorded at the fair market value of the securities received. Interest income is accrued as earned. Interest income includes coupon interest and amortization of premium and accretion of discount on debt securities. Investment income is recorded net of foreign taxes withheld where recovery of such taxes is uncertain.
Expenses. Most expenses of the trust can be directly attributed to a fund. Expenses which cannot be directly attributed are apportioned among each fund in the trust.
Income Tax Information and Distributions to Shareholders. Each year, the fund intends to qualify as a regulated investment company by distributing all of its taxable income and realized gains under Subchapter M of the Internal Revenue Code. As a result, no provision for income taxes is required in the accompanying financial statements. Foreign taxes are provided for based on the fund's understanding of the tax rules and rates that exist in the foreign markets in which it invests.
Distributions are recorded on the ex-dividend date. Income dividends and capital gain distributions are declared separately for each class. Income and capital gain distributions are determined in accordance with income tax regulations, which may differ from generally accepted accounting principles. In addition, the fund will claim a portion of the payment made to redeeming shareholders as a distribution for income tax purposes.
Capital accounts within the financial statements are adjusted for permanent book-tax differences. These adjustments have no impact on net assets or the results of operations. Temporary book-tax differences will reverse in a subsequent period.
Annual Report
Notes to Financial Statements - continued
1. Significant Accounting Policies - continued
Income Tax Information and Distributions to Shareholders - continued
Book-tax differences are primarily due to foreign currency transactions, passive foreign investment companies (PFIC) and losses deferred due to wash sales.
The tax-basis components of distributable earnings and the federal tax cost as of period end were as follows:
Unrealized appreciation | $ 23,649,374 | |
Unrealized depreciation | (4,111,134) | |
Net unrealized appreciation (depreciation) | 19,538,240 | |
Undistributed ordinary income | 2,686,931 | |
| | |
Cost for federal income tax purposes | $ 215,685,015 | |
Short-Term Trading (Redemption) Fees. Shares held in the fund less than 90 days are subject to a redemption fee equal to 1.50% of the proceeds of the redeemed shares. All redemption fees, including any estimated redemption fees paid by Fidelity Management & Research Company (FMR), are retained by the fund and accounted for as an addition to paid in capital.
2. Operating Policies.
Repurchase Agreements. FMR has received an Exemptive Order from the Securities and Exchange Commission (the SEC) which permits the fund and other affiliated entities of FMR to transfer uninvested cash balances into joint trading accounts which are then invested in repurchase agreements. The fund may also invest directly with institutions in repurchase agreements. Repurchase agreements are collateralized by government or non-government securities. Collateral is held in segregated accounts with custodian banks and may be obtained in the event of a default of the counterparty. The fund monitors, on a daily basis, the value of the collateral to ensure it is at least equal to the principal amount of the repurchase agreement (including accrued interest). In the event of a default by the counterparty, realization of the collateral proceeds could be delayed, during which time the value of the collateral may decline.
Restricted Securities. The fund may invest in securities that are subject to legal or contractual restrictions on resale. These securities generally may be resold in transactions exempt from registration or to the public if the securities are registered. Disposal of these securities may involve time-consuming negotiations and expense, and prompt sale at an acceptable price may be difficult. Information regarding restricted securities is included at the end of the fund's Schedule of Investments.
Annual Report
3. Purchases and Sales of Investments.
Purchases and sales of securities, other than short-term securities and U.S. government securities, aggregated $271,874,395 and $75,735,653, respectively.
4. Fees and Other Transactions with Affiliates.
Management Fee. FMR and its affiliates provide the fund with investment management related services for which the fund pays a monthly management fee. The management fee is the sum of an individual fund fee rate that is based on an annual rate of .45% of the fund's average net assets and a group fee rate that averaged .27% during the period. The group fee rate is based upon the average net assets of all the mutual funds advised by FMR. The group fee rate decreases as assets under management increase and increases as assets under management decrease. In addition, the management fee is subject to a performance adjustment (up to a maximum of ±.20% of the fund's average net assets over a 36 month performance period). The upward or downward adjustment to the management fee is based on the fund's relative investment performance as compared to an appropriate benchmark index. The fund's performance adjustment will not take effect until November, 2005. Subsequent months will be added until the performance period includes 36 months. For the period, the total annualized management fee rate was .72% of the fund's average net assets.
Distribution and Service Plan. In accordance with Rule 12b-1 of the 1940 Act, the fund has adopted separate Distribution and Service Plans for each class of shares. Certain classes pay Fidelity Distributors Corporation (FDC), an affiliate of FMR, separate Distribution and Service Fees, each of which is based on an annual percentage of each class' average net assets. In addition, FDC may pay financial intermediaries for selling shares of the fund and providing shareholder support services. For the period, the Distribution and Service Fee rates and the total amounts paid to and retained by FDC were as follows:
| Distribution
Fee | Service
Fee | Paid to
FDC | Retained
by FDC |
Class A | 0% | .25% | $ 4,000 | $ 1,244 |
Class T | .25% | .25% | 10,064 | 2,454 |
Class B | .75% | .25% | 9,067 | 8,060 |
Class C | .75% | .25% | 25,707 | 11,363 |
| | | $ 48,838 | $ 23,121 |
Sales Load. FDC receives a front-end sales charge of up to 5.75% for selling Class A shares, and 3.50% for selling Class T shares, some of which is paid to financial intermediaries for selling shares of the fund. FDC receives the proceeds of contingent deferred sales charges levied on Class A, Class T, Class B, and Class C redemptions. These charges
Annual Report
Notes to Financial Statements - continued
4. Fees and Other Transactions with Affiliates - continued
Sales Load - continued
depend on the holding period. The deferred sales charges range from 5% to 1% for Class B, 1% for Class C, and .25% for certain purchases of Class A and Class T shares.
For the period, sales charge amounts retained by FDC were as follows:
| Retained
by FDC | |
Class A | $ 10,726 | |
Class T | 2,528 | |
Class B* | 1,092 | |
Class C* | 205 | |
| $ 14,551 | |
* When Class B and Class C shares are initially sold, FDC pays commissions from its own resources to financial intermediaries through which the sales are made.
Transfer Agent Fees. Fidelity Investments Institutional Operations Company, Inc. (FIIOC), an affiliate of FMR, is the transfer, dividend disbursing and shareholder servicing agent for each class of the fund, except for Small Cap Growth. Fidelity Service Company, Inc. (FSC), an affiliate of FMR, is the transfer agent for Small Cap Growth shares. FIIOC and FSC receive account fees and asset-based fees that vary according to the account size and type of account of the shareholders of the respective classes of the fund. FIIOC and FSC pay for typesetting, printing and mailing of shareholder reports, except proxy statements. For the period the total transfer agent fees paid by each class to FIIOC or FSC, were as follows:
| Amount | % of
Average
Net Assets |
Class A | $ 5,363 | .33 * |
Class T | 6,337 | .31 * |
Class B | 3,035 | .33 * |
Class C | 8,123 | .32 * |
Small Cap Growth | 154,713 | .22 * |
Institutional Class | 1,799 | .19 * |
| $ 179,370 | |
* Annualized
Accounting and Security Lending Fees. FSC maintains the fund's accounting records. The accounting fee is based on the level of average net assets for the month. Under a separate contract, FSC administers the security lending program. The security lending fee is based on the number and duration of lending transactions.
Annual Report
4. Fees and Other Transactions with Affiliates - continued
Central Funds. The fund may invest in affiliated Central Funds managed by Fidelity Investments Money Management, Inc. (FIMM), an affiliate of FMR. The Central Funds are open-end investment companies available only to investment companies and other accounts managed by FMR and its affiliates. The Money Market Central Funds seek preservation of capital and current income. The Central Funds do not pay a management fee. Income distributions earned by the fund are recorded as income in the accompanying financial statements and totaled $51,594 for the period.
Brokerage Commissions. The fund placed a portion of its portfolio transactions with brokerage firms which are affiliates of the investment adviser. The commissions paid to these affiliated firms were $22,836 for the period.
5. Committed Line of Credit.
The fund participates with other funds managed by FMR in a $4.2 billion credit facility (the "line of credit") to be utilized for temporary or emergency purposes to fund shareholder redemptions or for other short-term liquidity purposes. The fund has agreed to pay commitment fees on its pro rata portion of the line of credit. During the period, there were no borrowings on this line of credit.
6. Security Lending.
The fund lends portfolio securities from time to time in order to earn additional income. The fund receives collateral (in the form of U.S. Treasury obligations, letters of credit and/or cash) against the loaned securities and maintains collateral in an amount not less than 100% of the market value of the loaned securities during the period of the loan. The market value of the loaned securities is determined at the close of business of the fund and any additional required collateral is delivered to the fund on the next business day. If the borrower defaults on its obligation to return the securities loaned because of insolvency or other reasons, a fund could experience delays and costs in recovering the securities loaned or in gaining access to the collateral. Cash collateral is invested in the Fidelity Securities Lending Cash Central Fund. The value of loaned securities and cash collateral at period end are disclosed on the fund's Statement of Assets and Liabilities.
7. Expense Reductions.
FMR voluntarily agreed to reimburse each class to the extent annual operating expenses exceeded certain levels of average net assets as noted in the table below. Some expenses, for example interest expense, are excluded from this reimbursement.
Annual Report
Notes to Financial Statements - continued
7. Expense Reductions - continued
The following classes were in reimbursement during the period:
| Expense
Limitations | Reimbursement
from adviser |
Class A | 1.50% - 1.40% * | $ 1,731 |
Class T | 1.75% - 1.65% * | 1,875 |
Class B | 2.25% - 2.15% * | 1,244 |
Class C | 2.25% - 2.15% * | 1,848 |
Institutional Class | 1.25% - 1.15% * | 134 |
| | $ 6,832 |
* Expense limitation in effect at period end.
Many of the brokers with whom FMR places trades on behalf of the fund provided services to the fund in addition to trade execution. These services included payments of certain expenses on behalf of the fund totaling $66,694 for the period. In addition, through arrangements with the fund's custodian, credits realized as a result of uninvested cash balances were used to reduce the fund's expenses. During the period, these credits reduced the fund's custody expenses by $151.
8. Other.
The fund's organizational documents provide former and current trustees and officers with a limited indemnification against liabilities arising in connection with the performance of their duties to the fund. In the normal course of business, the fund may also enter into contracts that provide general indemnifications. The fund's maximum exposure under these arrangements is unknown as this would be dependent on future claims that may be made against the fund. The risk of material loss from such claims is considered remote.
Annual Report
9. Share Transactions.
Transactions for each class of shares were as follows:
| Shares | Dollars |
| For the period
November 3, 2004 (commencement
of sale of shares) to July 31, 2005 | For the period
November 3, 2004 (commencement
of sale of shares) to
July 31, 2005 |
Class A | | |
Shares sold | 377,650 | $ 4,304,515 |
Shares redeemed | (13,200) | (157,404) |
Net increase (decrease) | 364,450 | $ 4,147,111 |
Class T | | |
Shares sold | 432,704 | $ 4,904,069 |
Shares redeemed | (27,332) | (327,972) |
Net increase (decrease) | 405,372 | $ 4,576,097 |
Class B | | |
Shares sold | 169,626 | $ 1,864,130 |
Shares redeemed | (10,003) | (113,030) |
Net increase (decrease) | 159,623 | $ 1,751,100 |
Class C | | |
Shares sold | 664,094 | $ 7,429,424 |
Shares redeemed | (14,036) | (166,606) |
Net increase (decrease) | 650,058 | $ 7,262,818 |
Small Cap Growth | | |
Shares sold | 18,162,749 | $ 212,509,370 |
Shares redeemed | (2,320,313) | (26,565,039) |
Net increase (decrease) | 15,842,436 | $ 185,944,331 |
Institutional Class | | |
Shares sold | 170,585 | $ 1,883,777 |
Shares redeemed | (23,631) | (261,946) |
Net increase (decrease) | 146,954 | $ 1,621,831 |
Annual Report
Report of Independent Registered Public Accounting Firm
To the Trustees of Fidelity Securities Fund and the Shareholders of Fidelity Small Cap Growth Fund:
In our opinion, the accompanying statement of assets and liabilities, including the schedule of investments, and the related statements of operations and of changes in net assets and the financial highlights present fairly, in all material respects, the financial position of Fidelity Small Cap Growth Fund (a fund of Fidelity Securities Fund) at July 31, 2005 and the results of its operations, the changes in its net assets and the financial highlights for the periods indicated, in conformity with accounting principles generally accepted in the United States of America. These financial statements and financial highlights (hereafter referred to as "financial statements") are the responsibility of the Fidelity Small Cap Growth Fund's management; our responsibility is to express an opinion on these financial statements based on our audit. We conducted our audit of these financial statements in accordance with the standards of the Public Company Accounting Oversight Board (United States). Those standards require that we plan and perform the audit to obtain reasonable assurance about whether the financial statements are free of material misstatement. An audit includes examining, on a test basis, evidence supporting the amounts and disclosures in the financial statements, assessing the accounting principles used and significant estimates made by management, and evaluating the overall financial statement presentation. We believe that our audit, which included confirmation of securities at July 31, 2005 by correspondence with the custodian and brokers, provides a reasonable basis for our opinion.
/s/ PricewaterhouseCoopers LLP
PricewaterhouseCoopers LLP
Boston, Massachusetts
September 9, 2005
Annual Report
Trustees and Officers
The Trustees, Members of the Advisory Board, and executive officers of the trust and fund, as applicable, are listed below. The Board of Trustees governs the fund and is responsible for protecting the interests of shareholders. The Trustees are experienced executives who meet periodically throughout the year to oversee the fund's activities, review contractual arrangements with companies that provide services to the fund, and review the fund's performance. Except for William O. McCoy, Stephen P. Jonas, and Kenneth L. Wolfe, each of the Trustees oversees 320 funds advised by FMR or an affiliate. Mr. McCoy oversees 322 funds advised by FMR or an affiliate. Mr. Jonas and Mr. Wolfe oversee 311 funds advised by FMR or an affiliate.
The Trustees hold office without limit in time except that (a) any Trustee may resign; (b) any Trustee may be removed by written instrument, signed by at least two-thirds of the number of Trustees prior to such removal; (c) any Trustee who requests to be retired or who has become incapacitated by illness or injury may be retired by written instrument signed by a majority of the other Trustees; and (d) any Trustee may be removed at any special meeting of shareholders by a two-thirds vote of the outstanding voting securities of the trust. Each Trustee who is not an interested person (as defined in the 1940 Act) (Independent Trustee), shall retire not later than the last day of the calendar year in which his or her 72nd birthday occurs. The Independent Trustees may waive this mandatory retirement age policy with respect to individual Trustees. The executive officers and Advisory Board Members hold office without limit in time, except that any officer and Advisory Board Member may resign or may be removed by a vote of a majority of the Trustees at any regular meeting or any special meeting of the Trustees. Except as indicated, each individual has held the office shown or other offices in the same company for the past five years.
The fund's Statement of Additional Information (SAI) includes more information about the Trustees. To request a free copy, call Fidelity at 1-800-544-8544.
Interested Trustees*:
Correspondence intended for each Trustee who is an interested person may be sent to Fidelity Investments, 82 Devonshire Street, Boston, Massachusetts 02109.
Name, Age; Principal Occupation |
Edward C. Johnson 3d (75)** |
| Year of Election or Appointment: 1984 Mr. Johnson is Chairman of the Board of Trustees. Mr. Johnson serves as Chief Executive Officer, Chairman, and a Director of FMR Corp.; a Director and Chairman of the Board and of the Executive Committee of FMR; Chairman and a Director of Fidelity Management & Research (Far East) Inc.; Chairman and a Director of Fidelity Investments Money Management, Inc.; and Chairman (2001-present) and a Director (2000-present) of FMR Co., Inc. |
Abigail P. Johnson (43)** |
| Year of Election or Appointment: 2001 Ms. Johnson serves as President of Fidelity Employer Services Company (FESCO) (2005-present). She is President and a Director of Fidelity Investments Money Management, Inc. (2001-present), FMR Co., Inc. (2001-present), and a Director of FMR Corp. Previously, Ms. Johnson served as President and a Director of FMR (2001-2005), Senior Vice President of the Fidelity funds (2001-2005), and managed a number of Fidelity funds. |
Stephen P. Jonas (52) |
| Year of Election or Appointment: 2005 Mr. Jonas is Senior Vice President of Small Cap Growth (2005-present). He also serves as a Senior Vice President of other Fidelity funds (2005-present). Mr. Jonas is Executive Director of FMR (2005-present). Previously, Mr. Jonas served as President of Fidelity Enterprise Operations and Risk Services (2004-2005), Chief Administrative Officer (2002-2004), and Chief Financial Officer of FMR Co. (1998-2000). Mr. Jonas has been with Fidelity Investments since 1987 and has held various financial and management positions including Chief Financial Officer of FMR. In addition, he serves on the Boards of Boston Ballet (2003-present) and Simmons College (2003-present). |
Robert L. Reynolds (53) |
| Year of Election or Appointment: 2003 Mr. Reynolds is a Director (2003-present) and Chief Operating Officer (2002-present) of FMR Corp. He also serves on the Board at Fidelity Investments Canada, Ltd. (2000-present). Previously, Mr. Reynolds served as President of Fidelity Investments Institutional Retirement Group (1996-2000). |
* Trustees have been determined to be "Interested Trustees" by virtue of, among other things, their affiliation with the trust or various entities under common control with FMR.
** Edward C. Johnson 3d, Trustee, is Abigail P. Johnson's father.
Annual Report
Independent Trustees:
Correspondence intended for each Independent Trustee (that is, the Trustees other than the Interested Trustees) may be sent to Fidelity Investments, P.O. Box 55235, Boston, Massachusetts 02205-5235.
Name, Age; Principal Occupation |
Dennis J. Dirks (57) |
| Year of Election or Appointment: 2005 Prior to his retirement in May 2003, Mr. Dirks was Chief Operating Officer and a member of the Board of The Depository Trust & Clearing Corporation (DTCC) (1999-2003). He also served as President, Chief Operating Officer, and Board member of The Depository Trust Com-pany (DTC) (1999-2003) and President and Board member of the National Securities Clearing Corporation (NSCC) (1999-2003). In addition, Mr. Dirks served as Chief Executive Officer and Board member of the Government Securities Clearing Corporation (2001-2003) and Chief Executive Officer and Board member of the Mortgage-Backed Securities Clearing Corporation (2001-2003). Mr. Dirks also serves as a Tustee of Manhattan College (2005-present). |
Robert M. Gates (61) |
| Year of Election or Appointment: 1997 Dr. Gates is Vice Chairman of the Independent Trustees (2005-present). Dr. Gates is President of Texas A&M University (2002-present). He was Director of the Central Intelligence Agency (CIA) from 1991 to 1993. From 1989 to 1991, Dr. Gates served as Assistant to the President of the United States and Deputy National Security Advisor. Dr. Gates is a Director of NACCO Industries, Inc. (mining and manufacturing), Parker Drilling Co., Inc. (drilling and rental tools for the energy industry, 2001-present), and Brinker International (restaurant management, 2003-present). Previously, Dr. Gates served as a Director of LucasVarity PLC (automotive components and diesel engines), a Director of TRW Inc. (automotive, space, defense, and information technology), and Dean of the George Bush School of Government and Public Service at Texas A&M University (1999-2001). Dr. Gates also is a Trustee of the Forum for International Policy. |
George H. Heilmeier (69) |
| Year of Election or Appointment: 2004 Dr. Heilmeier is Chairman Emeritus of Telcordia Technologies (communication software and systems), where prior to his retirement, he served as company Chairman and Chief Executive Officer. He currently serves on the Boards of Directors of The Mitre Corporation (systems engineering and information technology support for the government), and HRL Laboratories (private research and development, 2004-present). He is Chairman of the General Motors Science & Technology Advisory Board and a Life Fellow of the Institute of Electrical and Electronics Engineers (IEEE) (2000-present). Dr. Heilmeier is a member of the Defense Science Board and the National Security Agency Advisory Board. He is also a member of the National Academy of Engineering, the American Academy of Arts and Sciences, and the Board of Overseers of the School of Engineering and Applied Science of the University of Pennsylvania. Previously, Dr. Heilmeier served as a Director of TRW Inc. (automotive, space, defense, and information technology, 1992-2002), Compaq (1994-2002), Automatic Data Processing, Inc. (ADP) (technology-based business outsourcing, 1995-2002), INET Technologies Inc. (telecommunications network surveillance, 2001-2004), and Teletech Holdings (customer management services). He is the recipient of the 2005 Kyoto Prize in Advanced Technology for his invention of the liquid display. |
Marie L. Knowles (58) |
| Year of Election or Appointment: 2001 Prior to Ms. Knowles' retirement in June 2000, she served as Executive Vice President and Chief Financial Officer of Atlantic Richfield Company (ARCO) (diversified energy, 1996-2000). From 1993 to 1996, she was a Senior Vice President of ARCO and President of ARCO Transportation Company. She served as a Director of ARCO from 1996 to 1998. She currently serves as a Director of Phelps Dodge Corporation (copper mining and manufacturing) and McKesson Corporation (healthcare service, 2002-present). Ms. Knowles is a Trustee of the Brookings Institution and the Catalina Island Conservancy and also serves as a member of the Advisory Board for the School of Engineering of the University of Southern California. |
Ned C. Lautenbach (61) |
| Year of Election or Appointment: 2000 Mr. Lautenbach has been a partner of Clayton, Dubilier & Rice, Inc. (private equity investment firm) since September 1998. Previously, Mr. Lautenbach was with the International Business Machines Corporation (IBM) from 1968 until his retirement in 1998. Mr. Lautenbach serves as a Director of Italtel Holding S.p.A. (telecommunications (Milan, Italy), 2004-present) and Eaton Corporation (diversified industrial) as well as the Philharmonic Center for the Arts in Naples, Florida. He also is a member of the Board of Trustees of Fairfield University (2005-present), as well as a member of the Council on Foreign Relations. |
Marvin L. Mann (72) |
| Year of Election or Appointment: 1993 Mr. Mann is Chairman of the Independent Trustees (2001-present). He is Chairman Emeritus of Lexmark International, Inc. (computer peripherals), where he served as CEO until April 1998, retired as Chairman May 1999, and remains a member of the Board. Prior to 1991, he held the positions of Vice President of International Business Machines Corporation (IBM) and President and General Manager of various IBM divisions and subsidiaries. He is a member of the Executive Committee of the Independent Director's Council of the Investment Company Institute. In addition, Mr. Mann is a member of the President's Cabinet at the University of Alabama and the Board of Visitors of the Culverhouse College of Commerce and Business Administration at the University of Alabama. |
William O. McCoy (71) |
| Year of Election or Appointment: 1997 Prior to his retirement in December 1994, Mr. McCoy was Vice Chairman of the Board of BellSouth Corporation (telecommunications) and President of BellSouth Enterprises. He is currently a Director of Liberty Corporation (holding company), Duke Realty Corporation (real estate), and Progress Energy, Inc. (electric utility). He is also a partner of Franklin Street Partners (private investment management firm) and a member of the Research Triangle Foundation Board. In addition, Mr. McCoy served as the Interim Chancellor (1999-2000) and a member of the Board of Visitors for the University of North Carolina at Chapel Hill and currently serves on the Board of Directors of the University of North Carolina Health Care System and the Board of Visitors of the Kenan-Flagler Business School (University of North Carolina at Chapel Hill). He also served as Vice President of Finance for the University of North Carolina (16-school system). |
Cornelia M. Small (61) |
| Year of Election or Appointment: 2005 Ms. Small is a member (2000-present) and Chairperson (2002-present) of the Investment Committee, and a member (2002-present) of the Board of Trustees of Smith College. Previously, she served as Chief Investment Officer (1999-2000), Director of Global Equity Investments (1996-1999), and a member of the Board of Directors of Scudder, Stevens & Clark (1990-1997) and Scudder Kemper Investments (1997-1998). In addition, Ms. Small served as Co-Chair (2000-2003) of the Annual Fund for the Fletcher School of Law and Diplomacy. |
William S. Stavropoulos (66) |
| Year of Election or Appointment: 2002 Mr. Stavropoulos is Chairman of the Board (2000-present) and a Member of the Board of Directors of The Dow Chemical Company. Since joining The Dow Chemical Company in 1967, Mr. Stavropoulos served in numerous senior management positions, including President (1993-2000; 2002-2003), CEO (1995-2000; 2002-2004), and Chairman of the Executive Committee (2000-2004). Currently, he is a Director of NCR Corporation (data warehousing and technology solutions), BellSouth Corporation (telecommunications), Chemical Financial Corporation, and Maersk Inc. (industrial conglomerate, 2002-present), and Metalmark Capital (private equity investment firm, 2005-present). He also serves as a member of the Board of Trustees of the American Enterprise Institute for Public Policy Research. In addition, Mr. Stavropoulos is a member of The Business Council, J.P. Morgan International Council and the University of Notre Dame Advisory Council for the College of Science. |
Kenneth L. Wolfe (66) |
| Year of Election or Appointment: 2005 Mr. Wolfe also serves as a Trustee (2005-present) or Member of the Advisory Board (2004-present) of other investment companies advised by FMR. Prior to his retirement in 2001, Mr. Wolfe was Chairman and Chief Executive Officer of Hershey Foods Corporation (1993-2001). He currently serves as a member of the boards of Adelphia Communications Corporation (2003-present), Bausch & Lomb, Inc., and Revlon Inc. (2004-present). |
Annual Report
Advisory Board Members and Executive Officers:
Correspondence intended for Mr. Gamper may be sent to Fidelity Investments, P.O. Box 55235, Boston, Massachusetts 02205-5235. Correspondence intended for each executive officer and Mr. Lynch may be sent to Fidelity Investments, 82 Devonshire Street, Boston, Massachusetts 02109.
Name, Age; Principal Occupation |
Albert R. Gamper, Jr. (63) |
| Year of Election or Appointment: 2005 Member of the Advisory Board of Fidelity Securities Fund. Prior to his retirement in December 2004, Mr. Gamper served as Chairman of the Board of CIT Group Inc. (commercial finance). During his tenure with CIT Group Inc. Mr. Gamper served in numerous senior management positions, including Chairman (1987-1989; 1999-2001; 2002-2004), Chief Executive Officer (1987-2004), and President (1989-2002). He currently serves as a member of the Board of Directors of Public Service Enterprise Group (utilities, 2001-present), Chairman of the Board of Governors, Rutgers University (2004-present), and Chairman of the Board of Saint Barnabas Health Care System. |
Peter S. Lynch (62) |
| Year of Election or Appointment: 2003 Member of the Advisory Board of Fidelity Securities Fund. Vice Chairman and a Director of FMR, and Vice Chairman (2001-present) and a Director (2000-present) of FMR Co., Inc. Previously, Mr. Lynch served as a Trustee of the Fidelity funds (1990-2003). In addition, he serves as a Trustee of Boston College, Massachusetts Eye & Ear Infirmary, Historic Deerfield, John F. Kennedy Library, and the Museum of Fine Arts of Boston. |
Dwight D. Churchill (51) |
| Year of Election or Appointment: 2005 Vice President of Small Cap Growth. Mr. Churchill also serves as Vice President of certain Equity Funds (2005-present) and certain High Income Funds (2005-present). Previously, he served as Head of Fidelity's Fixed-Income Division (2000-2005), Vice President of Fidelity's Money Market Funds (2000-2005), Vice President of Fidelity's Bond Funds, and Senior Vice President of FIMM (2000) and FMR. Mr. Churchill joined Fidelity in 1993 as Vice President and Group Leader of Taxable Fixed-Income Investments. |
John B. McDowell (46) |
| Year of Election or Appointment: 2004 Vice President of Small Cap Growth. Mr. McDowell also serves as Vice President of certain Equity Funds (2002). He is Senior Vice President of FMR (1999), FMR Co., Inc. (2001), and Fidelity Management Trust Company (FMTC). Since joining Fidelity Investments in 1985, Mr. McDowell has worked as a research analyst and manager. |
James M. Harmon (34) |
| Year of Election or Appointment: 2005 Vice President of Small Cap Growth. He also manages other Fidelity funds, and has worked as a research analyst, portfolio assistant and portfolio manager. |
Eric D. Roiter (56) |
| Year of Election or Appointment: 2004 Secretary of Small Cap Growth. He also serves as Secretary of other Fidelity funds; Vice President, General Counsel, and Secretary of FMR Co., Inc. (2001-present) and FMR; Assistant Secretary of Fidelity Management & Research (U.K.) Inc. (2001-present), Fidelity Management & Research (Far East) Inc. (2001-present), and Fidelity Investments Money Management, Inc. (2001-present). Mr. Roiter is an Adjunct Member, Faculty of Law, at Boston College Law School (2003-present). Previously, Mr. Roiter served as Vice President and Secretary of FDC (1998-2005). |
Stuart Fross (45) |
| Year of Election or Appointment: 2004 Assistant Secretary of Small Cap Growth. Mr. Fross also serves as Assistant Secretary of other Fidelity funds (2003-present), Vice President and Secretary of FDC (2005-present), and is an employee of FMR. |
Christine Reynolds (46) |
| Year of Election or Appointment: 2004 President, Treasurer, and Anti-Money Laundering (AML) officer of Small Cap Growth. Ms. Reynolds also serves as President, Treasurer, and AML officer of other Fidelity funds (2004) and is a Vice President (2003) and an employee (2002) of FMR. Before joining Fidelity Investments, Ms. Reynolds worked at PricewaterhouseCoopers LLP (PwC) (1980-2002), where she was most recently an audit partner with PwC's investment management practice. |
Timothy F. Hayes (54) |
| Year of Election or Appointment: 2004 Chief Financial Officer of Small Cap Growth. Mr. Hayes also serves as Chief Financial Officer of other Fidelity funds (2002). Mr. Hayes also serves as Chief Financial Officer of other Fidelity funds (2002-present) and President of Fidelity Investment Operations (2005-present) which includes Fidelity Pricing and Cash Management Services Group (FPCMS), where he served as President (1998-2005). Mr. Hayes serves as President of Fidelity Service Company (2003-present) where he also serves as a Director. Mr. Hayes also served as President of Fidelity Investments Operations Group (FIOG, 2002-2005). |
Kenneth A. Rathgeber (58) |
| Year of Election or Appointment: 2004 Chief Compliance Officer of Small Cap Growth. Mr. Rathgeber also serves as Chief Compliance Officer of other Fidelity funds (2004) and Executive Vice President of Risk Oversight for Fidelity Investments (2002). Previously, he served as Executive Vice President and Chief Operating Officer for Fidelity Investments Institutional Services Company, Inc. (1998-2002). |
John R. Hebble (47) |
| Year of Election or Appointment: 2004 Deputy Treasurer of Small Cap Growth. Mr. Hebble also serves as Deputy Treasurer of other Fidelity funds (2003), and is an employee of FMR. Before joining Fidelity Investments, Mr. Hebble worked at Deutsche Asset Management where he served as Director of Fund Accounting (2002-2003) and Assistant Treasurer of the Scudder Funds (1998-2003). |
Bryan A. Mehrmann (44) |
| Year of Election or Appointment: 2005 Deputy Treasurer of Small Cap Growth. Mr. Mehrmann also serves as Deputy Treasurer of other Fidelity funds (2005-present) and is an employee of FMR. Previously, Mr. Mehrmann served as Vice President of Fidelity Investments Institutional Services Group (FIIS)/Fidelity Investments Institutional Operations Corporation, Inc. (FIIOC) Client Services (1998-2004). |
Kimberley H. Monasterio (41) |
| Year of Election or Appointment: 2004 Deputy Treasurer of Small Cap Growth. Ms. Monasterio also serves as Deputy Treasurer of other Fidelity funds (2004) and is an employee of FMR (2004). Before joining Fidelity Investments, Ms. Monasterio served as Treasurer (2000-2004) and Chief Financial Officer (2002-2004) of the Franklin Templeton Funds and Senior Vice President of Franklin Templeton Services, LLC (2000-2004). |
Kenneth B. Robins (35) |
| Year of Election or Appointment: 2005 Deputy Treasurer of Small Cap Growth. Mr. Robins also serves as Deputy Treasurer of other Fidelity funds (2005-present) and is an employee of FMR (2004-present). Before joining Fidelity Investments, Mr. Robins worked at KPMG LLP, where he was a partner in KPMG's department of professional practice (2002-2004) and a Senior Manager (1999-2000). In addition, Mr. Robins served as Assistant Chief Accountant, United States Securities and Exchange Commission (2000-2002). |
Robert G. Byrnes (38) |
| Year of Election or Appointment: 2005 Assistant Treasurer of Small Cap Growth. Mr. Byrnes also serves as Assistant Treasurer of other Fidelity funds (2005-present) and is an employee of FMR (2005-present). Previously, Mr. Byrnes served as Vice President of FPCMS (2003-2005). Before joining Fidelity Investments, Mr. Byrnes worked at Deutsche Asset Management where he served as Vice President of the Investment Operations Group (2000-2003). |
John H. Costello (58) |
| Year of Election or Appointment: 2004 Assistant Treasurer of Small Cap Growth. Mr. Costello also serves as Assistant Treasurer of other Fidelity funds and is an employee of FMR. |
Peter L. Lydecker (51) |
| Year of Election or Appointment: 2004 Assistant Treasurer of Small Cap Growth. Mr. Lydecker also serves as Assistant Treasurer of other Fidelity funds (2004) and is an employee of FMR. |
Mark Osterheld (50) |
| Year of Election or Appointment: 2004 Assistant Treasurer of Small Cap Growth. Mr. Osterheld also serves as Assistant Treasurer of other Fidelity funds (2002) and is an employee of FMR. |
Gary W. Ryan (46) |
| Year of Election or Appointment: 2005 Assistant Treasurer of Small Cap Growth. Mr. Ryan also serves as Assistant Treasurer of other Fidelity funds (2005-present) and is an employee of FMR (2005-present). Previously, Mr. Ryan served as Vice President of Fund Reporting in FPCMS (1999-2005). |
Salvatore Schiavone (39) |
| Year of Election or Appointment: 2005 Assistant Treasurer of Small Cap Growth. Mr. Schiavone also serves as Assistant Treasurer of other Fidelity funds (2005-present) and is an employee of FMR (2005-present). Before joining Fidelity Investments, Mr. Schiavone worked at Deutsche Asset Management, where he most recently served as Assistant Treasurer (2003-2005) of the Scudder Funds and Vice President and Head of Fund Reporting (1996-2003). |
Annual Report
Distributions
The Board of Trustees of Small Cap Growth Fund voted to pay to shareholders of record at the opening of business on record date, the following distributions per share derived from capital gains realized from sales of portfolio securities:
| Pay Date | Record Date | Capital Gains |
Small Cap Growth | 9/12/05 | 9/09/05 | $0.138 |
Annual Report
Board Approval of Investment Advisory Contracts and Management Fees
Small Cap Growth Fund
Each year, typically in July, the Board of Trustees, including the independent Trustees (together, the Board), votes on the renewal of the management contract and sub-advisory agreements (together, the Advisory Contracts) for the fund. The Board, assisted by the advice of fund counsel and independent Trustees' counsel, requests and considers a broad range of information throughout the year.
The Board meets regularly each month except August and takes into account throughout the year matters bearing on Advisory Contracts. The Board, acting directly and through its separate committees, considers at each of its meetings factors that are relevant to the annual renewal of the fund's Advisory Contracts, including the services and support provided to the fund and its shareholders by Fidelity. At the time of the renewal, the Board had 11 standing committees, each composed of independent Trustees with varying backgrounds, to which the Board has assigned specific subject matter responsibilities in order to enhance effective decision-making by the Board. Each committee has adopted a written charter outlining the structure and purposes of the committee. One such committee, the Equity Contract Committee, meets periodically during the first six months of each year and as necessary to consider matters specifically related to the annual renewal of Advisory Contracts. The committee requests and receives information on, and makes recommendations to the independent Trustees concerning, the approval and annual review of the Advisory Contracts.
At its July 2005 meeting, the Board of Trustees, including the independent Trustees, unanimously determined to renew the Advisory Contracts for the fund. In reaching its determination, the Board considered all factors it believed relevant, including (1) the nature, extent, and quality of the services to be provided to the fund and its shareholders by Fidelity (including the investment performance of the fund); (2) the competitiveness of the management fee and total expenses of the fund; (3) the total costs of the services to be provided by and the profits to be realized by the investment adviser and its affiliates from the relationship with the fund; (4) the extent to which economies of scale would be realized as the fund grows; and (5) whether fee levels reflect these economies of scale, if any, for the benefit of fund shareholders.
In determining whether to renew the Advisory Contracts for the fund, the Board ultimately reached a determination, with the assistance of fund counsel and independent Trustees' counsel, that the renewal of the Advisory Contracts and the compensation to be received by Fidelity under the management contract is consistent with Fidelity's fiduciary duty under applicable law. In addition to evaluating the specific factors noted above, the Board, in reaching its determination, is aware that shareholders in the fund have a broad range of investment choices available to them, including a wide choice among mutual funds offered by competitors to Fidelity, and that the fund's shareholders, with the opportunity to review and weigh the disclosure provided by the fund in its prospectus and other public disclosures, have chosen to invest in this fund, managed by Fidelity.
Annual Report
Board Approval of Investment Advisory Contracts and
Management Fees - continued
Nature, Extent, and Quality of Services Provided by Fidelity. The Board considered staffing within the investment adviser, FMR, and the sub-advisers (together, the Investment Advisers), including the background of the fund's portfolio manager and the fund's investment objective and discipline. The independent Trustees also had discussions with senior management of Fidelity's investment operations and investment groups. The Board considered the structure of the portfolio manager compensation program and whether this structure provides appropriate incentives.
Fidelity Resources Dedicated to Investment Management and Support Services. The Board reviewed the size, education, and experience of the Investment Advisers' investment staff, their use of technology, and the Investment Advisers' approach to recruiting, training, and retaining portfolio managers and other research, advisory, and management personnel. The Board considered Fidelity's extensive global research capabilities that enable the Investment Advisers to aggregate data from various sources in an effort to produce positive investment results. The Board noted that Fidelity's analysts have access to a variety of technological tools that enable them to perform both fundamental and quantitative analysis and to specialize in various disciplines. The Board also considered that Fidelity's portfolio managers and analysts have access to daily portfolio attribution that allows for monitoring of a fund's portfolio, as well as an electronic communication system that provides immediate real-time access to research concerning issuers and credit enhancers.
Shareholder and Administrative Services. The Board considered the nature, extent, quality, and cost of administrative, distribution, and shareholder services performed by the Investment Advisers and their affiliates under the Advisory Contracts and under separate agreements covering transfer agency, pricing and bookkeeping, and securities lending services for the fund. The Board also considered the nature and extent of the Investment Advisers' supervision of third party service providers, principally custodians and subcustodians. The Board reviewed the allocation of fund brokerage, including allocations to brokers affiliated with the Investment Advisers, the use of brokerage commissions to pay fund expenses, and the use of "soft" commission dollars to pay for research services. The Board also considered that Fidelity voluntarily decided in 2004 to stop using "soft" commission dollars to pay for market data and, instead, to pay for that data out of its own resources. The Board also considered the resources devoted to, and the record of compliance with, the fund's compliance policies and procedures.
The Board noted that the growth of fund assets across the complex allows Fidelity to reinvest in the development of services designed to enhance the value or convenience of the Fidelity funds as investment vehicles. These services include 24-hour access to account information and market information through phone representatives and over the Internet, and investor education materials and asset allocation tools.
Annual Report
Investment in a Large Fund Family. The Board considered the benefits to shareholders of investing in a Fidelity fund, including the benefits of investing in a fund that is part of a large family of funds offering a variety of investment disciplines and providing for a large variety of mutual fund investor services. For example, fund shareholders are offered the privilege of exchanging shares of the fund for shares of other Fidelity funds, as set forth in the fund's prospectus, without paying an additional sales charge. The Board noted that, since July 2004, Fidelity has taken a number of actions that benefited particular funds, including (i) voluntarily deciding in 2004 to stop using "soft" commission dollars to pay for market data and, instead, to pay for that data out of its own resources, (ii) contractually agreeing to impose management fee reductions and expense limitations on its five Spartan stock index funds and its stock index fund available through variable insurance products, (iii) contractually agreeing to eliminate the management fees on the Fidelity Freedom Funds and the Fidelity Advisor Freedom Funds, (iv) contractually agreeing to reduce the management fees on most of its investment-grade taxable bond funds, and (v) contractually agreeing to impose expense limitations on its retail and Spartan investment-grade taxable bond funds.
Investment Performance and Compliance. The Board considered whether the fund has operated within its investment objective, as well as its record of compliance with its investment restrictions. The Board noted that it is not possible to evaluate performance in any comprehensive fashion because the fund had been in operation for less than one calendar year. Once the fund has been in operation for at least one calendar year, the Board will review the fund's absolute investment performance for each class, as well as the fund's relative investment performance for each class measured against (i) a broad-based securities market index and (ii) a peer group of mutual funds deemed appropriate by the Board.
The Board also considered that, beginning November 1, 2005, the fund's management fee will be subject to upward or downward adjustment depending upon whether, and to what extent, the fund's investment performance for the performance period exceeds, or is exceeded by, the record (over the same period) of a Board-approved performance adjustment index. The Board realizes that the performance adjustment provides FMR with a strong economic incentive to seek to achieve superior performance for the fund's shareholders and helps to more closely align the interests of FMR and the fund's shareholders.
The Board has had thorough discussions with FMR throughout the year about the Board's and FMR's concerns about equity research, equity fund performance, and compliance with internal policies governing gifts and entertainment. FMR has taken steps that it believes will refocus and strengthen equity research and equity portfolio management and trading. The Board noted with favor FMR's recent reorganization of its senior management team and FMR's plans to dedicate additional resources to investment research, and participated in the process that led to those changes.
Annual Report
Board Approval of Investment Advisory Contracts and
Management Fees - continued
Based on its review, and giving particular weight to the nature and quality of the resources dedicated by the Investment Advisers to maintain and improve relative performance, the Board concluded that the nature, extent, and quality of the services provided by Fidelity will benefit the fund's shareholders, particularly in light of the Board's view that the fund's shareholders benefit from investing in a fund that is part of a large family of funds offering a variety of investment disciplines and services.
Competitiveness of Management Fee and Total Fund Expenses. The Board considered the fund's management fee and total expenses compared to "mapped groups" of competitive funds and classes. Fidelity creates "mapped groups" by combining similar Lipper investment objective categories that have comparable management fee characteristics. Combining Lipper investment objective categories aids the Board's management fee and total expense comparisons by broadening the competitive group used for comparison and by reducing the number of universes to which various Fidelity funds are compared.
The Board considered two proprietary management fee comparisons for the period of the fund's operations shown in the chart below. The group of Lipper funds used by the Board for management fee comparisons is referred to below as the "Total Mapped Group" and, for the reasons explained above, is broader than the Lipper peer group used by the Board for performance comparisons. The Total Mapped Group comparison focuses on a fund's standing relative to the total universe of comparable funds available to investors, in terms of gross management fees before expense reimbursements or caps. "TMG %" represents the percentage of funds in the Total Mapped Group that had management fees that were lower than the fund's. For example, a TMG % of 18% means that 82% of the funds in the Total Mapped Group had higher management fees than the fund. The "Asset-Size Peer Group" (ASPG) comparison focuses on a fund's standing relative to non-Fidelity funds similar in size to the fund within the Total Mapped Group. The ASPG represents at least 15% of the funds in the Total Mapped Group with comparable asset size and management fee characteristics, subject to a minimum of 50 funds (or all funds in the Total Mapped Group if fewer than 50). Additional information, such as the ASPG quartile ("quadrant") in which the fund's management fee ranked, is also included in the chart and considered by the Board.
Annual Report
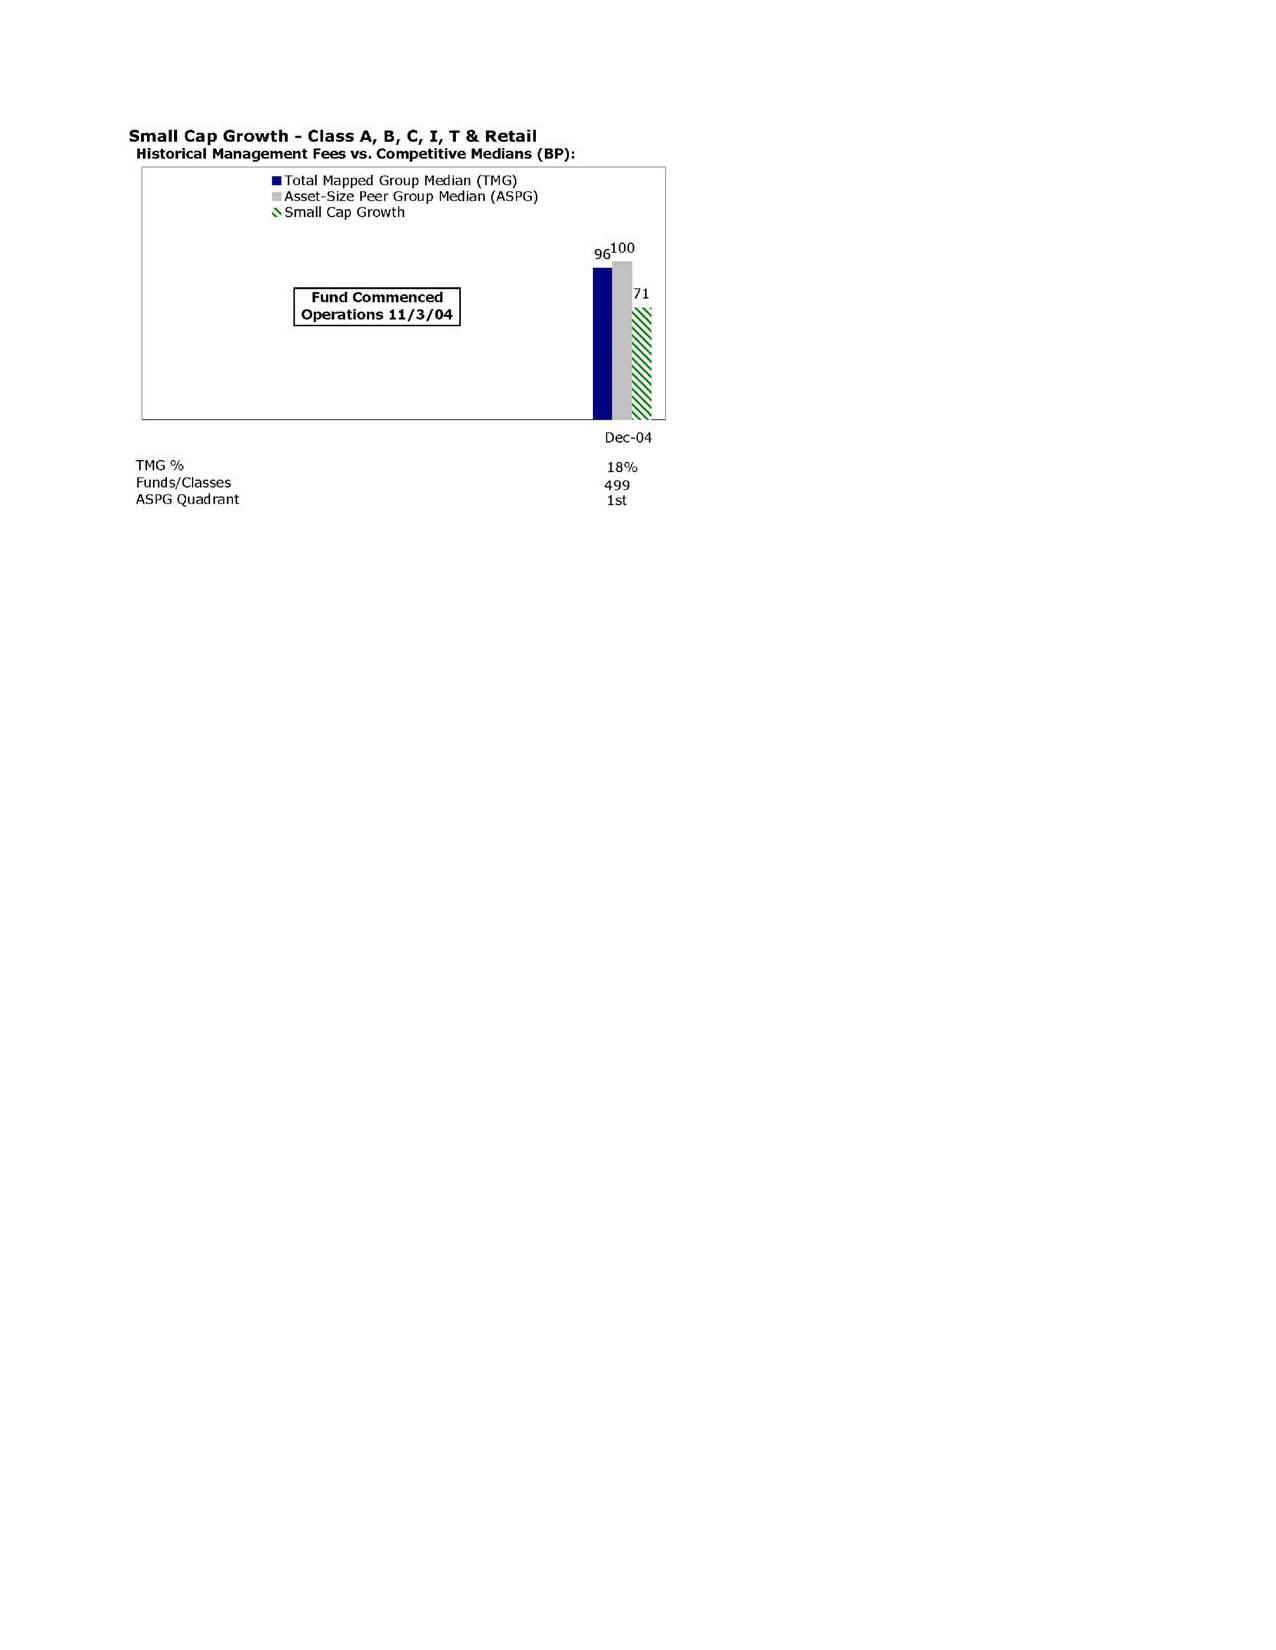
The Board noted that the fund's management fee ranked below the median of its Total Mapped Group and below the median of its ASPG for the period.
Based on its review, the Board concluded that the fund's management fee was fair and reasonable in light of the services that the fund receives and the other factors considered.
In its review of each class's total expenses, the Board considered the fund's management fee as well as other fund or class expenses, as applicable, such as transfer agent fees, pricing and bookkeeping fees, fund-paid 12b-1 fees, and custodial, legal, and audit fees. The Board also noted the effects of any waivers and reimbursements on fees and expenses. As part of its review, the Board also considered current and historical total expenses of each class of the fund compared to competitive fund median expenses. Each class of the fund is compared to those funds and classes in the Total Mapped Group (used by the Board for management fee comparisons) that have a similar sales load structure.
The Board noted that the total expenses of Fidelity Small Cap Growth Fund (retail class) ranked below its competitive median for the period, the total expenses of Class A ranked equal to its competitive median for the period, and the total expenses of each of Class B, Class C, Class T and Institutional Class ranked above its competitive median for the period. The Board considered that the fund launched in November 2004 and that the classes were above median because of high expenses in basis points due to their small size. The Board noted that the fund offers multiple classes, each of which has a different sales load and 12b-1 fee structure, and that the multiple structures are intended to offer a range of pricing options for the intermediary market. The Board also noted that the total expenses of the classes vary primarily by the level of their 12b-1 fees, although differences in transfer agent fees may also cause expenses to vary from class to class.
Annual Report
Board Approval of Investment Advisory Contracts and
Management Fees - continued
Furthermore, the Board considered that, effective June 1, 2005, FMR voluntarily agreed to reimburse each class of the fund to the extent that total operating expenses (excluding 12b-1 fees and certain other expenses) exceed 115 basis points. The Board considered that, if the voluntary expense reimbursements had been in effect in 2004, the total expenses of each of Class A, Class B and Class C would have ranked below the median and the total expenses of Institutional Class would have ranked equal to the median.
In its review of total expenses, the Board also considered Fidelity fee structures and other information on clients that FMR and its affiliates service in other competitive markets, such as other mutual funds advised or subadvised by FMR or its affiliates, pension plan clients, and other institutional clients.
Based on its review, the Board concluded that the total expenses for each class of the fund were reasonable, although in some cases above the median of the universe presented for comparison, in light of the services that the fund and its shareholders receive and the other factors considered.
Costs of the Services and Profitability. The Board considered the revenues earned and the expenses incurred by Fidelity in conducting the business of developing, marketing, distributing, managing, administering and servicing the fund and its shareholders. The Board also considered the level of Fidelity's profits in respect of all the Fidelity funds.
On an annual basis, FMR presents to the Board Fidelity's profitability for the fund. Fidelity calculates the profitability for each fund, as well as aggregate profitability for groups of Fidelity funds and all Fidelity funds, using a series of detailed revenue and cost allocation methodologies which originate with the audited books and records of Fidelity. The Audit Committee of the Board reviews any significant changes from the prior year's methodologies.
PricewaterhouseCoopers LLP (PwC), independent registered accounting firm and auditor to Fidelity and certain Fidelity funds, has been engaged annually by the Board as part of the Board's assessment of the results of Fidelity's profitability analysis. PwC's engagement includes the review and assessment of Fidelity's methodologies used in determining the revenues and expenses attributable to Fidelity's mutual fund business, and completion of agreed-upon procedures surrounding the mathematical accuracy of fund profitability and its conformity to allocation methodologies. After considering PwC's reports issued under the engagement and information provided by Fidelity, the Board believes that while other allocation methods may also be reasonable, Fidelity's profitability methodologies are reasonable in all material respects.
Annual Report
The Board has also reviewed Fidelity's non-fund businesses and any fall-out benefits related to the mutual fund business as well as cases where Fidelity's affiliates may benefit from or be related to the fund's business. In addition, a special committee of the Board reviewed services provided to Fidelity by its affiliates and determined that the fees that Fidelity paid for such services were reasonable.
The Board considered the costs of the services provided by and the profits realized by Fidelity in connection with the operation of the fund and determined that the amount of profit is a fair entrepreneurial profit for the management of the fund.
Economies of Scale. The Board considered whether there have been economies of scale in respect of the management of the Fidelity funds, whether the Fidelity funds (including the fund) have appropriately benefited from any such economies of scale, and whether there is potential for realization of any further economies of scale. The Board considered the extent to which the fund will benefit from economies of scale through increased services to the fund, through waivers or reimbursements, or through fee or expense reductions, including reductions that occur through operation of the transfer agent agreement. The transfer agent fee varies in part based on the number of accounts in the fund. If the number of accounts decreases or the average account size increases, the overall transfer agent fee rate decreases.
The Board recognized that the fund's management contract incorporates a "group fee" structure, which provides for lower fee rates as total fund assets under FMR's management increase, and for higher fee rates as total fund assets under FMR's management decrease. The Board considered that the group fee is designed to deliver the benefits of economies of scale to fund shareholders when total fund assets increase, even if assets of any particular fund are unchanged or have declined, because some portion of Fidelity's costs are attributable to services provided to all Fidelity funds, and all funds benefit if those costs can be allocated among more assets. The Board concluded that, given the group fee structure, fund shareholders will achieve a certain level of economies of scale as assets under FMR's management increase at the fund complex level, regardless of whether Fidelity achieves any such economies of scale.
The Board further concluded that any potential economies of scale are being shared between fund shareholders and Fidelity in an appropriate manner.
Additional Information Requested by the Board. In order to develop fully the factual basis for consideration of the Advisory Contracts, the Board requested additional information regarding (i) equity fund transfer agency fees; (ii) Fidelity's fund profitability methodology and the impact of various changes in the methodology over time; (iii) benefits to shareholders from economies of scale; (iv) composition and characteristics of various fund and industry data used in comparisons; and (v) compensation of portfolio managers and research analysts.
Annual Report
Board Approval of Investment Advisory Contracts and
Management Fees - continued
Based on its evaluation of all of the conclusions noted above, and after considering all material factors, the Board ultimately concluded that the existing advisory fee structures are fair and reasonable, and that the fund's existing Advisory Contracts should be renewed.
Annual Report
Managing Your Investments
Fidelity offers several ways to conveniently manage your personal investments via your telephone or PC. You can access your account information, conduct trades and research your investments 24 hours a day.
By Phone
Fidelity Automated Service Telephone provides a single toll-free number to access account balances, positions, quotes and trading. It's easy to navigate the service, and on your first call, the system will help you create a personal identification number (PIN) for security.
(phone_graphic)
Fidelity Automated
Service Telephone (FAST®)
1-800-544-5555
Press
1 For mutual fund and brokerage trading.
2 For quotes.*
3 For account balances and holdings.
4 To review orders and mutual
fund activity.
5 To change your PIN.
*0 To speak to a Fidelity representative.
By PC
Fidelity's web site on the Internet provides a wide range of information, including daily financial news, fund performance, interactive planning tools and news about Fidelity products and services.
(computer_graphic)
Fidelity's Web Site
www.fidelity.com
* When you call the quotes line, please remember that a fund's yield and return will vary and, except for money market funds, share price will also vary. This means that you may have a gain or loss when you sell your shares. There is no assurance that money market funds will be able to maintain a stable $1 share price; an investment in a money market fund is not insured or guaranteed by the U.S. government. Total returns are historical and include changes in share price, reinvestment of dividends and capital gains, and the effects of any sales charges.
Annual Report
Investment Adviser
Fidelity Management & Research Company
Boston, MA
Investment Sub-Advisers
FMR Co., Inc.
Fidelity Management & Research
(Far East) Inc.
Fidelity Management & Research
(U.K.) Inc.
Fidelity Investments Japan Limited
Fidelity International Investment
Advisors
Fidelity International Investment
Advisors (U.K.) Limited
General Distributor
Fidelity Distributors Corporation
Boston, MA
Transfer and Service Agent
Fidelity Service Company, Inc.
Boston, MA
Custodian
Citibank, N.A.
New York, NY
The Fidelity Telephone Connection
Mutual Fund 24-Hour Service
Exchanges/Redemptions
and Account Assistance 1-800-544-6666
Product Information 1-800-544-6666
Retirement Accounts 1-800-544-4774
(8 a.m. - 9 p.m.)
TDD Service 1-800-544-0118
for the deaf and hearing impaired
(9 a.m. - 9 p.m. Eastern time)
Fidelity Automated Service
Telephone (FAST®) (automated graphic) 1-800-544-5555
(automated graphic) Automated line for quickest service
SCP-UANN-0905
1.803694.100
(Fidelity Investment logo)(registered trademark)
Corporate Headquarters
82 Devonshire St., Boston, MA 02109
www.fidelity.com
(Fidelity Investment logo)(registered trademark)
Fidelity Advisor
Small Cap Growth
Fund - Class A, Class T,
Class B and Class C
Annual Report
July 31, 2005
Class A, Class T, Class B,
and Class C are classes
of Fidelity® Small Cap
Growth Fund
(2_fidelity_logos) (Registered_Trademark)
Contents
Chairman's Message | <Click Here> | Ned Johnson's message to shareholders. |
Performance | <Click Here> | How the fund has done over time. |
Management's Discussion | <Click Here> | The managers' review of fund performance, strategy and outlook. |
Shareholder Expense Example | <Click Here> | An example of shareholder expenses. |
Investment Changes | <Click Here> | A summary of the fund's investments. |
Investments | <Click Here> | A complete list of the fund's investments with their market values. |
Financial Statements | <Click Here> | Statements of assets and liabilities, operations, and changes in net assets,
as well as financial highlights. |
Notes | <Click Here> | Notes to the financial statements. |
Report of Independent Registered Public Accounting Firm | <Click Here> | |
Trustees and Officers | <Click Here> | |
Distributions | <Click Here> | |
Board Approval of Investment Advisory Contracts and Management Fees | <Click Here> | |
To view a fund's proxy voting guidelines and proxy voting record for the 12-month period ended June 30, visit www.fidelity.com/proxyvotingresults or visit the Securities and Exchange Commission's (SEC) web site at www.sec.gov. You may also call 1-877-208-0098 to request a free copy of the proxy voting guidelines.
Standard & Poor's, S&P and S&P 500 are registered service marks of The McGraw-Hill Companies, Inc. and have been licensed for use by Fidelity Distributors Corporation.
Other third party marks appearing herein are the property of their respective owners.
All other marks appearing herein are registered or unregistered trademarks or service marks of FMR Corp. or an affiliated company.
Annual Report
This report and the financial statements contained herein are submitted for the general information of the shareholders of the fund. This report is not authorized for distribution to prospective investors in the fund unless preceded or accompanied by an effective prospectus.
A fund files its complete schedule of portfolio holdings with the SEC for the first and third quarters of each fiscal year on Form N-Q. Forms N-Q are available on the SEC's web site at http://www.sec.gov. A fund's Forms N-Q may be reviewed and copied at the SEC's Public Reference Room in Washington, DC. Information regarding the operation of the SEC's Public Reference Room may be obtained by calling 1-800-SEC-0330. For a complete list of a fund's portfolio holdings, view the most recent quarterly holdings report, semiannual report, or annual report on Fidelity's web site at http://www.advisor.fidelity.com.
NOT FDIC INSURED · MAY LOSE VALUE · NO BANK GUARANTEE
Neither the fund nor Fidelity Distributors Corporation is a bank.
Annual Report
Chairman's Message
(photo_of_Edward_C_Johnson_3d)
Dear Shareholder:
During the past year or so, much has been reported about the mutual fund industry, and much of it has been more critical than I believe is warranted. Allegations that some companies have been less than forthright with their shareholders have cast a shadow on the entire industry. I continue to find these reports disturbing, and assert that they do not create an accurate picture of the industry overall. Therefore, I would like to remind everyone where Fidelity stands on these issues. I will say two things specifically regarding allegations that some mutual fund companies were in violation of the Securities and Exchange Commission's forward pricing rules or were involved in so-called "market timing" activities.
First, Fidelity has no agreements that permit customers who buy fund shares after 4 p.m. to obtain the 4 p.m. price. This is not a new policy. This is not to say that someone could not deceive the company through fraudulent acts. However, we are extremely diligent in preventing fraud from occurring in this manner - and in every other. But I underscore again that Fidelity has no so-called "agreements" that sanction illegal practices.
Second, Fidelity continues to stand on record, as we have for years, in opposition to predatory short-term trading that adversely affects shareholders in a mutual fund. Back in the 1980s, we initiated a fee - which is returned to the fund and, therefore, to investors - to discourage this activity. Further, we took the lead several years ago in developing a Fair Value Pricing Policy to prevent market timing on foreign securities in our funds. I am confident we will find other ways to make it more difficult for predatory traders to operate. However, this will only be achieved through close cooperation among regulators, legislators and the industry.
Yes, there have been unfortunate instances of unethical and illegal activity within the mutual fund industry from time to time. That is true of any industry. When this occurs, confessed or convicted offenders should be dealt with appropriately. But we are still concerned about the risk of over-regulation and the quick application of simplistic solutions to intricate problems. Every system can be improved, and we support and applaud well thought out improvements by regulators, legislators and industry representatives that achieve the common goal of building and protecting the value of investors' holdings.
For nearly 60 years, Fidelity has worked very hard to improve its products and service to justify your trust. When our family founded this company in 1946, we had only a few hundred customers. Today, we serve more than 18 million customers including individual investors and participants in retirement plans across America.
Let me close by saying that we do not take your trust in us for granted, and we realize that we must always work to improve all aspects of our service to you. In turn, we urge you to continue your active participation with your financial matters, so that your interests can be well served.
Best regards,
/s/Edward C. Johnson 3d
Edward C. Johnson 3d
Annual Report
Fidelity Advisor Small Cap Growth Fund - Class A, T, B, and C
Performance: The Bottom Line
Average annual total return reflects the change in the value of an investment, assuming reinvestment of the class' dividend income and capital gains (the profits earned upon the sale of securities that have grown in value) and assuming a constant rate of performance each year. The $10,000 table and the fund's returns do not reflect the deduction of taxes that a shareholder would pay on fund distributions or the redemption of fund shares. During periods of reimbursement by Fidelity, a fund's total return will be greater than it would be had the reimbursement not occurred. How a fund did yesterday is no guarantee of how it will do tomorrow.
Average annual total returns take Fidelity Advisor Small Cap Growth Fund's cumulative total return and show you what would have happened if Fidelity Advisor Small Cap Growth Fund shares had performed at a constant rate each year. These numbers will be reported once the fund is a year old.
$10,000 Over Life of Fund
Let's say hypothetically that $10,000 was invested in Fidelity Advisor Small Cap Growth Fund - Class T on November 3, 2004, when the fund started, and the current 3.50% sales charge was paid. The chart shows how the value of your investment would have changed, and also shows how the Russell 2000® Growth Index performed over the same period.
Annual Report
Management's Discussion of Fund Performance
Comments from Jamie Harmon, Lead Portfolio Manager and Lionel Harris and Chuck Myers, Portfolio Managers of Fidelity Advisor Small Cap Growth Fund. The team assumed management of the fund on April 7, 2005.
A late-inning rally on Wall Street helped push some key U.S. equity indexes to four-year highs by the conclusion of the 12-month period ending July 31, 2005. Spurred on by bullish economic data and strong corporate earnings, investors enjoyed a stellar month of July, capping off a turbulent 12-month period for U.S. equity markets. Stock prices bounced up and down during most of the year, moving in cadence with gyrations in the price of crude oil and investors' gathering and ebbing concerns about inflation. The Federal Reserve Board raised short-term interest rates eight times during the period, also affecting overall market sentiment. Despite their fluctuations, the major equity indexes finished on a high note, with the Standard & Poor's 500SM Index and the NASDAQ Composite® Index posting gains of 14.05% and 16.51%, respectively, for the period. The small-cap Russell 2000® Index rose 24.78% and the Russell Midcap® Index jumped 28.93%, while the blue-chips' Dow Jones Industrial AverageSM advanced only 7.29%.
From its inception on November 3, 2004, through July 31, 2005, the fund's Class A, Class T, Class B and Class C shares returned 29.50%, 29.30%, 28.70% and 28.80%, respectively. By comparison, the fund's benchmark, the Russell 2000 Growth Index, rose 13.53%. The fund's strong results were driven mainly by positive stock selection in energy, health care and information technology, with sector selection in all three areas playing a lesser but still significant role. Energy names such as Quicksilver Resources and Holly Corp. benefited from continued high oil prices. Also helping was Omnicare, a provider of institutional pharmacy services to nursing homes. Omnicare gained as investors became more confident that the company's profit margins were sustainable and that an acquisition of rival NeighborCare might occur. By contrast, EVCI Career Colleges performed poorly after an earnings shortfall and disclosure of controversial management pay packages. Tempur-Pedic International, a maker of foam mattresses, fell after its widely anticipated new product offering was introduced at a lower price point than expected. Investors discounted the stock because they interpreted this move as an indication of growing competition.
The views expressed in this statement reflect those of the portfolio managers only through the end of the period of the report as stated on the cover and do not necessarily represent the views of Fidelity or any other person in the Fidelity organization. Any such views are subject to change at any time based upon market or other conditions and Fidelity disclaims any responsibility to update such views. These views may not be relied on as investment advice and, because investment decisions for a Fidelity fund are based on numerous factors, may not be relied on as an indication of trading intent on behalf of any Fidelity fund.
Annual Report
Shareholder Expense Example
As a shareholder of the Fund, you incur two types of costs: (1) transaction costs, including sales charges (loads) on purchase payments or redemption proceeds, redemption fees, and (2) ongoing costs, including management fees, distribution and/or service (12b-1) fees and other Fund expenses. This Example is intended to help you understand your ongoing costs (in dollars) of investing in the Fund and to compare these costs with the ongoing costs of investing in other mutual funds.
The Example is based on an investment of $1,000 invested at the beginning of the period and held for the entire period (February 1, 2005 to July 31, 2005).
Actual Expenses
The first line of the table below for each class of the Fund provides information about actual account values and actual expenses. You may use the information in this line, together with the amount you invested, to estimate the expenses that you paid over the period. Simply divide your account value by $1,000.00 (for example, an $8,600 account value divided by $1,000.00 = 8.6), then multiply the result by the number in the first line for a class of the Fund under the heading entitled "Expenses Paid During Period" to estimate the expenses you paid on your account during this period. A small balance maintenance fee of $12.00 that is charged once a year may apply for certain accounts with a value of less than $2,000. This fee is not included in the table below. If it was, the estimate of expenses you paid during the period would be higher, and your ending account value lower, by this amount.
Hypothetical Example for Comparison Purposes
The second line of the table below for each class of the Fund provides information about hypothetical account values and hypothetical expenses based on a Class' actual expense ratio and an assumed rate of return of 5% per year before expenses, which is not the Class' actual return. The hypothetical account values and expenses may not be used to estimate the actual ending account balance or expenses you paid for the period. You may use this information to compare the ongoing costs of investing in the Fund and other funds. To do so, compare this 5% hypothetical example with the 5% hypothetical examples that appear in the shareholder reports of the other funds. A small balance maintenance fee of $12.00 that is charged once a year may apply for certain accounts with a value of less than $2,000. This fee is not included in the table below. If it was, the estimate of expenses you paid during the period would be higher, and your ending account value lower, by this amount.
Annual Report
Shareholder Expense Example - continued
Please note that the expenses shown in the table are meant to highlight your ongoing costs only and do not reflect any transaction costs. Therefore, the second line of the table is useful in comparing ongoing costs only, and will not help you determine the relative total costs of owning different funds. In addition, if these transactional costs were included, your costs would have been higher.
| Beginning
Account Value
February 1, 2005 | Ending
Account Value
July 31, 2005 | Expenses Paid
During Period*
February 1, 2005
to July 31, 2005 |
Class A | | | |
Actual | $ 1,000.00 | $ 1,125.10 | $ 7.59 |
HypotheticalA | $ 1,000.00 | $ 1,017.65 | $ 7.20 |
Class T | | | |
Actual | $ 1,000.00 | $ 1,124.30 | $ 8.90 |
HypotheticalA | $ 1,000.00 | $ 1,016.41 | $ 8.45 |
Class B | | | |
Actual | $ 1,000.00 | $ 1,121.10 | $ 11.52 |
HypotheticalA | $ 1,000.00 | $ 1,013.93 | $ 10.94 |
Class C | | | |
Actual | $ 1,000.00 | $ 1,121.00 | $ 11.36 |
HypotheticalA | $ 1,000.00 | $ 1,014.08 | $ 10.79 |
Small Cap Growth | | | |
Actual | $ 1,000.00 | $ 1,126.70 | $ 6.06 |
HypotheticalA | $ 1,000.00 | $ 1,019.09 | $ 5.76 |
Institutional Class | | | |
Actual | $ 1,000.00 | $ 1,126.80 | $ 6.12 |
HypotheticalA | $ 1,000.00 | $ 1,019.04 | $ 5.81 |
A 5% return per year before expenses
* Expenses are equal to each Class' annualized expense ratio (shown in the table below); multiplied by the average account value over the period, multiplied by 181/365 (to reflect the one-half year period).
| Annualized
Expense Ratio |
Class A | 1.44% |
Class T | 1.69% |
Class B | 2.19% |
Class C | 2.16% |
Small Cap Growth | 1.15% |
Institutional Class | 1.16% |
Annual Report
Investment Changes
Top Ten Stocks as of July 31, 2005 |
| % of fund's
net assets | % of fund's net assets
6 months ago |
Big 5 Sporting Goods Corp. | 3.1 | 1.6 |
Pacific Sunwear of California, Inc. | 2.2 | 1.8 |
Lionbridge Technologies, Inc. | 2.2 | 3.0 |
Abaxis, Inc. | 2.0 | 0.0 |
America Service Group, Inc. | 2.0 | 0.8 |
Monaco Coach Corp. | 2.0 | 0.0 |
Tempur-Pedic International, Inc. | 2.0 | 0.0 |
Aspen Insurance Holdings Ltd. | 2.0 | 0.0 |
Career Education Corp. | 1.9 | 2.3 |
Fossil, Inc. | 1.9 | 0.0 |
| 21.3 | |
Top Five Market Sectors as of July 31, 2005 |
| % of fund's
net assets | % of fund's net assets
6 months ago |
Consumer Discretionary | 27.0 | 20.5 |
Information Technology | 24.1 | 17.6 |
Health Care | 13.3 | 14.5 |
Industrials | 10.0 | 11.9 |
Energy | 9.1 | 16.8 |
Asset Allocation (% of fund's net assets) |
As of July 31, 2005* | As of January 31, 2005** |
| Stocks 96.1% | | | Stocks 90.5% | |
| Short-Term
Investments and
Net Other Assets 3.9% | | | Short-Term
Investments and
Net Other Assets 9.5% | |
* Foreign
investments | 9.9% | | ** Foreign investments | 14.8% | |

Annual Report
Investments July 31, 2005
Showing Percentage of Net Assets
Common Stocks - 96.1% |
| Shares | | Value (Note 1) |
CONSUMER DISCRETIONARY - 27.0% |
Automobiles - 2.0% |
Monaco Coach Corp. | 259,400 | | $ 4,539,500 |
Diversified Consumer Services - 3.5% |
Career Education Corp. (a) | 112,700 | | 4,371,633 |
EVCI Career Colleges, Inc. (a) | 549,491 | | 3,516,742 |
| | 7,888,375 |
Hotels, Restaurants & Leisure - 4.2% |
CEC Entertainment, Inc. (a) | 107,800 | | 4,129,818 |
Ctrip.com International Ltd. sponsored ADR | 30,100 | | 1,667,691 |
Domino's Pizza, Inc. | 68,800 | | 1,721,376 |
Papa John's International, Inc. (a) | 46,800 | | 2,017,080 |
| | 9,535,965 |
Household Durables - 3.2% |
Interface, Inc. Class A (a) | 74,200 | | 757,582 |
Lifetime Brands, Inc. | 88,000 | | 1,980,880 |
Tempur-Pedic International, Inc. (a)(d) | 260,700 | | 4,486,647 |
| | 7,225,109 |
Internet & Catalog Retail - 2.1% |
Blue Nile, Inc. (a)(d) | 56,000 | | 1,862,560 |
Collegiate Pacific, Inc. (d) | 251,300 | | 2,970,366 |
| | 4,832,926 |
Multiline Retail - 0.8% |
Tuesday Morning Corp. | 51,300 | | 1,811,403 |
Specialty Retail - 7.4% |
Big 5 Sporting Goods Corp. | 254,500 | | 7,036,922 |
Finish Line, Inc. Class A | 140,000 | | 2,532,600 |
Genesco, Inc. (a) | 63,000 | | 2,348,010 |
Pacific Sunwear of California, Inc. (a) | 206,000 | | 5,024,340 |
| | 16,941,872 |
Textiles, Apparel & Luxury Goods - 3.8% |
Fossil, Inc. (a) | 180,268 | | 4,288,576 |
Lakeland Industries, Inc. | 23,034 | | 371,769 |
Steven Madden Ltd. (a) | 181,863 | | 4,064,638 |
| | 8,724,983 |
TOTAL CONSUMER DISCRETIONARY | | 61,500,133 |
CONSUMER STAPLES - 1.8% |
Personal Products - 1.8% |
NBTY, Inc. (a) | 169,500 | | 4,101,900 |
Common Stocks - continued |
| Shares | | Value (Note 1) |
ENERGY - 9.1% |
Energy Equipment & Services - 3.4% |
AKITA Drilling Ltd. Class A (non-vtg.) | 59,000 | | $ 804,754 |
Hornbeck Offshore Services, Inc. (a) | 30,000 | | 897,000 |
Maverick Tube Corp. (a) | 88,000 | | 2,918,960 |
Oil States International, Inc. (a) | 55,200 | | 1,632,816 |
Pason Systems, Inc. | 79,600 | | 1,566,840 |
| | 7,820,370 |
Oil, Gas & Consumable Fuels - 5.7% |
Alberta Clipper Energy, Inc. (a) | 46,363 | | 177,977 |
Forest Oil Corp. (a) | 34,000 | | 1,521,840 |
Frontier Oil Corp. | 55,000 | | 1,541,100 |
Holly Corp. | 59,700 | | 2,795,154 |
OMI Corp. | 140,000 | | 2,524,200 |
Quicksilver Resources, Inc. (a) | 46,250 | | 1,959,150 |
Range Resources Corp. | 81,000 | | 2,473,740 |
| | 12,993,161 |
TOTAL ENERGY | | 20,813,531 |
FINANCIALS - 8.1% |
Capital Markets - 1.0% |
optionsXpress Holdings, Inc. | 144,000 | | 2,335,680 |
Commercial Banks - 0.6% |
Cascade Bancorp | 62,100 | | 1,427,058 |
Insurance - 6.5% |
Aspen Insurance Holdings Ltd. | 157,000 | | 4,460,370 |
Hilb Rogal & Hobbs Co. | 90,800 | | 3,077,212 |
IPC Holdings Ltd. | 52,400 | | 2,119,580 |
PXRE Group Ltd. | 75,615 | | 1,928,183 |
USI Holdings Corp. (a) | 238,800 | | 3,062,610 |
| | 14,647,955 |
TOTAL FINANCIALS | | 18,410,693 |
HEALTH CARE - 13.3% |
Health Care Equipment & Supplies - 3.9% |
Abaxis, Inc. (a) | 373,300 | | 4,658,784 |
Nutraceutical International Corp. (a) | 84,388 | | 1,197,466 |
Regeneration Technologies, Inc. (a) | 417,000 | | 3,177,540 |
| | 9,033,790 |
Common Stocks - continued |
| Shares | | Value (Note 1) |
HEALTH CARE - continued |
Health Care Providers & Services - 9.4% |
America Service Group, Inc. (a) | 212,500 | | $ 4,585,750 |
American Dental Partners, Inc. (a) | 46,900 | | 1,292,564 |
AmSurg Corp. (a) | 55,700 | | 1,560,157 |
ICON PLC sponsored ADR (a) | 51,500 | | 2,016,225 |
Molina Healthcare, Inc. (a) | 50,000 | | 1,197,000 |
Omnicare, Inc. | 85,500 | | 3,941,550 |
Pediatrix Medical Group, Inc. (a) | 39,500 | | 3,097,590 |
Per-Se Technologies, Inc. (a) | 46,400 | | 1,070,448 |
VCA Antech, Inc. (a) | 110,800 | | 2,630,392 |
| | 21,391,676 |
TOTAL HEALTH CARE | | 30,425,466 |
INDUSTRIALS - 10.0% |
Aerospace & Defense - 0.7% |
BE Aerospace, Inc. (a) | 96,000 | | 1,682,880 |
Building Products - 0.3% |
Quixote Corp. | 30,100 | | 611,933 |
Commercial Services & Supplies - 1.9% |
Navigant Consulting, Inc. (a) | 100,700 | | 2,014,000 |
PeopleSupport, Inc. | 135,000 | | 1,294,650 |
The Geo Group, Inc. (a) | 33,000 | | 902,550 |
| | 4,211,200 |
Construction & Engineering - 0.9% |
Comfort Systems USA, Inc. (a) | 266,500 | | 2,065,375 |
Electrical Equipment - 1.9% |
C&D Technologies, Inc. | 219,300 | | 2,208,351 |
Genlyte Group, Inc. (a) | 43,000 | | 2,209,340 |
| | 4,417,691 |
Machinery - 2.3% |
Freightcar America, Inc. | 76,600 | | 2,455,796 |
Watts Water Technologies, Inc. Class A | 75,500 | | 2,755,750 |
| | 5,211,546 |
Marine - 0.3% |
Alexander & Baldwin, Inc. | 12,700 | | 679,196 |
Road & Rail - 0.7% |
P.A.M. Transportation Services, Inc. (a) | 91,000 | | 1,497,860 |
Common Stocks - continued |
| Shares | | Value (Note 1) |
INDUSTRIALS - continued |
Trading Companies & Distributors - 1.0% |
WESCO International, Inc. (a) | 70,000 | | $ 2,384,200 |
TOTAL INDUSTRIALS | | 22,761,881 |
INFORMATION TECHNOLOGY - 24.1% |
Communications Equipment - 2.4% |
Avocent Corp. (a) | 51,500 | | 1,795,290 |
Harris Corp. | 97,000 | | 3,595,790 |
| | 5,391,080 |
Computers & Peripherals - 1.8% |
Avid Technology, Inc. (a) | 52,500 | | 2,160,375 |
iCAD, Inc. (a) | 105,300 | | 375,921 |
Mobility Electronics, Inc. (a) | 138,000 | | 1,600,800 |
| | 4,137,096 |
Electronic Equipment & Instruments - 3.4% |
Arrow Electronics, Inc. (a) | 26,200 | | 786,524 |
Cogent, Inc. | 69,000 | | 2,074,830 |
Measurement Specialties, Inc. (a) | 64,200 | | 1,624,260 |
ScanSource, Inc. (a) | 34,500 | | 1,646,685 |
Xyratex Ltd. (a) | 95,000 | | 1,591,250 |
| | 7,723,549 |
Internet Software & Services - 2.6% |
Akamai Technologies, Inc. (a) | 95,800 | | 1,462,866 |
Homestore, Inc. (a) | 340,000 | | 897,600 |
iMergent, Inc. (a) | 100,400 | | 1,139,540 |
j2 Global Communications, Inc. (a) | 59,900 | | 2,402,589 |
| | 5,902,595 |
IT Services - 5.0% |
Lionbridge Technologies, Inc. (a) | 767,146 | | 4,971,106 |
SI International, Inc. (a) | 118,700 | | 3,740,237 |
TALX Corp. | 55,550 | | 2,049,795 |
Tyler Technologies, Inc. (a) | 79,300 | | 629,642 |
| | 11,390,780 |
Office Electronics - 1.0% |
Zebra Technologies Corp. Class A (a) | 60,000 | | 2,340,000 |
Semiconductors & Semiconductor Equipment - 3.7% |
California Micro Devices Corp. (a) | 89,000 | | 582,060 |
Cascade Microtech, Inc. | 121,861 | | 1,630,500 |
Intersil Corp. Class A | 104,000 | | 2,014,480 |
Common Stocks - continued |
| Shares | | Value (Note 1) |
INFORMATION TECHNOLOGY - continued |
Semiconductors & Semiconductor Equipment - continued |
O2Micro International Ltd. (a) | 67,200 | | $ 1,153,152 |
Silicon Laboratories, Inc. (a) | 55,000 | | 1,609,850 |
Tessera Technologies, Inc. (a) | 44,000 | | 1,545,280 |
| | 8,535,322 |
Software - 4.2% |
Blackbaud, Inc. | 156,859 | | 2,243,084 |
Bottomline Technologies, Inc. (a) | 129,000 | | 2,030,460 |
DATATRAK International, Inc. (a)(e) | 10,000 | | 219,500 |
DATATRAK International, Inc. warrants 12/23/07 (a)(e) | 1,500 | | 11,055 |
Moldflow Corp. (a) | 57,000 | | 892,620 |
Phase Forward, Inc. | 386,052 | | 3,092,277 |
SERENA Software, Inc. (a) | 49,000 | | 1,005,480 |
| | 9,494,476 |
TOTAL INFORMATION TECHNOLOGY | | 54,914,898 |
MATERIALS - 1.6% |
Containers & Packaging - 0.5% |
Myers Industries, Inc. | 95,000 | | 1,254,000 |
Metals & Mining - 1.1% |
Apex Silver Mines Ltd. (a) | 31,000 | | 430,280 |
Goldcorp, Inc. | 122,000 | | 1,982,930 |
| | 2,413,210 |
TOTAL MATERIALS | | 3,667,210 |
TELECOMMUNICATION SERVICES - 0.8% |
Diversified Telecommunication Services - 0.8% |
FairPoint Communications, Inc. | 109,000 | | 1,787,600 |
UTILITIES - 0.3% |
Multi-Utilities - 0.3% |
CMS Energy Corp. (a) | 45,000 | | 712,800 |
TOTAL COMMON STOCKS (Cost $199,508,126) | 219,096,112 |
Money Market Funds - 7.1% |
| Shares | | Value (Note 1) |
Fidelity Cash Central Fund, 3.31% (b) | 13,111,943 | | $ 13,111,943 |
Fidelity Securities Lending Cash Central Fund, 3.32% (b)(c) | 3,015,200 | | 3,015,200 |
TOTAL MONEY MARKET FUNDS (Cost $16,127,143) | 16,127,143 |
TOTAL INVESTMENT PORTFOLIO - 103.2% (Cost $215,635,269) | | 235,223,255 |
NET OTHER ASSETS - (3.2)% | | (7,278,885) |
NET ASSETS - 100% | $ 227,944,370 |
Legend |
(a) Non-income producing |
(b) Affiliated fund that is available only to investment companies and other accounts managed by Fidelity Investments. The rate quoted is the annualized seven-day yield of the fund at period end. A complete listing of the fund's holdings as of its most recent quarter end is available upon request. |
(c) Investment made with cash collateral received from securities on loan. |
(d) Security or a portion of the security is on loan at period end. |
(e) Restricted securities - Investment in securities not registered under the Securities Act of 1933 (excluding 144A issues). At the end of the period, the value of restricted securities (excluding 144A issues) amounted to $230,555 or 0.1% of net assets. |
Additional information on each holding is as follows: |
Security | Acquisition Date | Acquisition Cost |
DATATRAK International, Inc. | 12/27/04 | $ 95,000 |
DATATRAK International, Inc. warrants 12/23/07 | 12/27/04 | 0 |
An affiliated company is a company in which the fund has ownership of at least 5% of the voting securities. Companies which are affiliates of the fund at period-end are noted in the fund's Schedule of Investments. Transactions during the period with companies which are or were affiliates are as follows: |
Affiliate | Value,
beginning
of period | Purchases | Sales Proceeds | Dividend Income | Value,
end of
period |
Collegiate Pacific, Inc. | $ - | $ 7,098,636 | $ 3,699,650 | $ 29,840 | $ - |
TOTALS | $ - | $ 7,098,636 | $ 3,699,650 | $ 29,840 | $ - |
See accompanying notes which are an integral part of the financial statements.
Annual Report
Financial Statements
Statement of Assets and Liabilities
| July 31, 2005 |
| | |
Assets | | |
Investment in securities, at value (including securities loaned of $2,995,562) (cost $215,635,269) - See accompanying schedule | | $ 235,223,255 |
Foreign currency held at value (cost $34,077) | | 34,045 |
Receivable for investments sold | | 3,676,503 |
Receivable for fund shares sold | | 6,892,475 |
Dividends receivable | | 4,968 |
Interest receivable | | 40,377 |
Prepaid expenses | | 23,822 |
Receivable from investment adviser for expense reductions | | 1,660 |
Other affiliated receivables | | 76 |
Other receivables | | 57,762 |
Total assets | | 245,954,943 |
| | |
Liabilities | | |
Payable to custodian bank | $ 1,846 | |
Payable for investments purchased | 14,722,078 | |
Payable for fund shares redeemed | 91,405 | |
Accrued management fee | 111,204 | |
Distribution fees payable | 10,809 | |
Other affiliated payables | 33,311 | |
Other payables and accrued expenses | 24,720 | |
Collateral on securities loaned, at value | 3,015,200 | |
Total liabilities | | 18,010,573 |
| | |
Net Assets | | $ 227,944,370 |
Net Assets consist of: | | |
Paid in capital | | $ 205,410,038 |
Accumulated net investment loss | | (14,971) |
Accumulated undistributed net realized gain (loss) on investments and foreign currency transactions | | 2,961,349 |
Net unrealized appreciation (depreciation) on investments and assets and liabilities in foreign currencies | | 19,587,954 |
Net Assets | | $ 227,944,370 |
See accompanying notes which are an integral part of the financial statements.
Annual Report
Statement of Assets and Liabilities - continued
| July 31, 2005 |
| | |
Calculation of Maximum Offering Price
Class A:
Net Asset Value and redemption price per share
($4,719,086 ÷ 364,450 shares) | | $ 12.95 |
| | |
Maximum offering price per share (100/94.25 of $12.95) | | $ 13.74 |
Class T:
Net Asset Value and redemption price per share ($5,239,546 ÷ 405,372 shares) | | $ 12.93 |
| | |
Maximum offering price per share (100/96.50 of $12.93) | | $ 13.40 |
Class B:
Net Asset Value and offering price per share ($2,054,739 ÷ 159,623 shares)A | | $ 12.87 |
| | |
Class C:
Net Asset Value and offering price per share ($8,372,444 ÷ 650,058 shares)A | | $ 12.88 |
| | |
Small Cap Growth:
Net Asset Value, offering price and redemption price per share ($205,652,093 ÷ 15,842,436 shares) | | $ 12.98 |
| | |
Institutional Class:
Net Asset Value, offering price and redemption price per share ($1,906,462 ÷ 146,954 shares) | | $ 12.97 |
A Redemption price per share is equal to net asset value less any applicable contingent deferred sales charge.
See accompanying notes which are an integral part of the financial statements.
Annual Report
Financial Statements - continued
Statement of Operations
| For the period November 3, 2004 (commencement of operations) to July 31, 2005 |
| | |
Investment Income | | |
Dividends (including $29,840 received from affiliated issuers) | | $ 270,319 |
Interest | | 183,813 |
Security lending | | 1,526 |
Total income | | 455,658 |
| | |
Expenses | | |
Management fee | $ 563,759 | |
Transfer agent fees | 179,370 | |
Distribution fees | 48,838 | |
Accounting and security lending fees | 35,102 | |
Independent trustees' compensation | 284 | |
Custodian fees and expenses | 16,621 | |
Registration fees | 88,279 | |
Audit | 31,530 | |
Legal | 91 | |
Miscellaneous | 185 | |
Total expenses before reductions | 964,059 | |
Expense reductions | (73,677) | 890,382 |
Net investment income (loss) | | (434,724) |
Realized and Unrealized Gain (Loss) Net realized gain (loss) on: | | |
Investment securities (Including realized gain (loss) of $(557,638) from affiliated issuers) | 3,383,303 | |
Foreign currency transactions | (2,201) | |
Total net realized gain (loss) | | 3,381,102 |
Change in net unrealized appreciation (depreciation) on: Investment securities | 19,587,986 | |
Assets and liabilities in foreign currencies | (32) | |
Total change in net unrealized appreciation (depreciation) | | 19,587,954 |
Net gain (loss) | | 22,969,056 |
Net increase (decrease) in net assets resulting from operations | | $ 22,534,332 |
See accompanying notes which are an integral part of the financial statements.
Annual Report
Statement of Changes in Net Assets
| For the period November 3, 2004 (commencement
of operations) to
July 31, 2005 |
Increase (Decrease) in Net Assets | |
Operations | |
Net investment income (loss) | $ (434,724) |
Net realized gain (loss) | 3,381,102 |
Change in net unrealized appreciation (depreciation) | 19,587,954 |
Net increase (decrease) in net assets resulting from operations | 22,534,332 |
Share transactions - net increase (decrease) | 205,303,288 |
Redemption fees | 106,750 |
Total increase (decrease) in net assets | 227,944,370 |
| |
Net Assets | |
Beginning of period | - |
End of period (including accumulated net investment loss of $14,971) | $ 227,944,370 |
See accompanying notes which are an integral part of the financial statements.
Annual Report
Financial Highlights - Class A
Year ended July 31, | 2005 F |
Selected Per-Share Data | |
Net asset value, beginning of period | $ 10.00 |
Income from Investment Operations | |
Net investment income (loss) E | (.07) |
Net realized and unrealized gain (loss) | 3.01 |
Total from investment operations | 2.94 |
Redemption fees added to paid in capital E | .01 |
Net asset value, end of period | $ 12.95 |
Total Return B, C, D | 29.50% |
Ratios to Average Net Assets G | |
Expenses before expense reductions | 1.55% A |
Expenses net of voluntary waivers, if any | 1.45% A |
Expenses net of all reductions | 1.36% A |
Net investment income (loss) | (.78)% A |
Supplemental Data | |
Net assets, end of period (000 omitted) | $ 4,719 |
Portfolio turnover rate | 93% A |
A Annualized
B Total returns for periods of less than one year are not annualized.
C Total returns would have been lower had certain expenses not been reduced during the periods shown.
D Total returns do not include the effect of the sales charges.
E Calculated based on average shares outstanding during the period.
F For the period November 3, 2004 (commencement of operations) to July 31, 2005.
G Expense ratios reflect operating expenses of the class. Expenses before reductions do not reflect amounts reimbursed by the investment adviser or reductions from brokerage service arrangements or other expense offset arrangements and do not represent the amount paid by the class during periods when reimbursements or reductions occur. Expense ratios before reductions for start-up periods may not be representative of longer-term operating periods. Expenses net of any voluntary waivers reflect expenses after reimbursement by the investment adviser but prior to reductions from brokerage service arrangements or other expense offset arrangements. Expenses net of all reductions represent the net expenses paid by the class.
See accompanying notes which are an integral part of the financial statements.
Annual Report
Financial Highlights - Class T
Year ended July 31, | 2005 F |
Selected Per-Share Data | |
Net asset value, beginning of period | $ 10.00 |
Income from Investment Operations | |
Net investment income (loss) E | (.09) |
Net realized and unrealized gain (loss) | 3.01 |
Total from investment operations | 2.92 |
Redemption fees added to paid in capital E | .01 |
Net asset value, end of period | $ 12.93 |
Total Return B, C, D | 29.30% |
Ratios to Average Net Assets G | |
Expenses before expense reductions | 1.79% A |
Expenses net of voluntary waivers, if any | 1.70% A |
Expenses net of all reductions | 1.61% A |
Net investment income (loss) | (1.03)% A |
Supplemental Data | |
Net assets, end of period (000 omitted) | $ 5,240 |
Portfolio turnover rate | 93% A |
A Annualized
B Total returns for periods of less than one year are not annualized.
C Total returns would have been lower had certain expenses not been reduced during the periods shown.
D Total returns do not include the effect of the sales charges.
E Calculated based on average shares outstanding during the period.
F For the period November 3, 2004 (commencement of operations) to July 31, 2005.
G Expense ratios reflect operating expenses of the class. Expenses before reductions do not reflect amounts reimbursed by the investment adviser or reductions from brokerage service arrangements or other expense offset arrangements and do not represent the amount paid by the class during periods when reimbursements or reductions occur. Expense ratios before reductions for start-up periods may not be representative of longer-term operating periods. Expenses net of any voluntary waivers reflect expenses after reimbursement by the investment adviser but prior to reductions from brokerage service arrangements or other expense offset arrangements. Expenses net of all reductions represent the net expenses paid by the class.
See accompanying notes which are an integral part of the financial statements.
Annual Report
Financial Highlights - Class B
Year ended July 31, | 2005 F |
Selected Per-Share Data | |
Net asset value, beginning of period | $ 10.00 |
Income from Investment Operations | |
Net investment income (loss) E | (.13) |
Net realized and unrealized gain (loss) | 2.99 |
Total from investment operations | 2.86 |
Redemption fees added to paid in capital E | .01 |
Net asset value, end of period | $ 12.87 |
Total Return B, C, D | 28.70% |
Ratios to Average Net Assets G | |
Expenses before expense reductions | 2.33% A |
Expenses net of voluntary waivers, if any | 2.20% A |
Expenses net of all reductions | 2.11% A |
Net investment income (loss) | (1.53)% A |
Supplemental Data | |
Net assets, end of period (000 omitted) | $ 2,055 |
Portfolio turnover rate | 93% A |
A Annualized
B Total returns for periods of less than one year are not annualized.
C Total returns would have been lower had certain expenses not been reduced during the periods shown.
D Total returns do not include the effect of the contingent deferred sales charge.
E Calculated based on average shares outstanding during the period.
F For the period November 3, 2004 (commencement of operations) to July 31, 2005.
G Expense ratios reflect operating expenses of the class. Expenses before reductions do not reflect amounts reimbursed by the investment adviser or reductions from brokerage service arrangements or other expense offset arrangements and do not represent the amount paid by the class during periods when reimbursements or reductions occur. Expense ratios before reductions for start-up periods may not be representative of longer-term operating periods. Expenses net of any voluntary waivers reflect expenses after reimbursement by the investment adviser but prior to reductions from brokerage service arrangements or other expense offset arrangements. Expenses net of all reductions represent the net expenses paid by the class.
See accompanying notes which are an integral part of the financial statements.
Annual Report
Financial Highlights - Class C
Year ended July 31, | 2005 F |
Selected Per-Share Data | |
Net asset value, beginning of period | $ 10.00 |
Income from Investment Operations | |
Net investment income (loss) E | (.13) |
Net realized and unrealized gain (loss) | 3.00 |
Total from investment operations | 2.87 |
Redemption fees added to paid in capital E | .01 |
Net asset value, end of period | $ 12.88 |
Total Return B, C, D | 28.80% |
Ratios to Average Net Assets G | |
Expenses before expense reductions | 2.24% A |
Expenses net of voluntary waivers, if any | 2.17% A |
Expenses net of all reductions | 2.09% A |
Net investment income (loss) | (1.50)% A |
Supplemental Data | |
Net assets, end of period (000 omitted) | $ 8,372 |
Portfolio turnover rate | 93% A |
A Annualized
B Total returns for periods of less than one year are not annualized.
C Total returns would have been lower had certain expenses not been reduced during the periods shown.
D Total returns do not include the effect of the contingent deferred sales charge.
E Calculated based on average shares outstanding during the period.
F For the period November 3, 2004 (commencement of operations) to July 31, 2005.
G Expense ratios reflect operating expenses of the class. Expenses before reductions do not reflect amounts reimbursed by the investment adviser or reductions from brokerage service arrangements or other expense offset arrangements and do not represent the amount paid by the class during periods when reimbursements or reductions occur. Expense ratios before reductions for start-up periods may not be representative of longer--term operating periods. Expenses net of any voluntary waivers reflect expenses after reimbursement by the investment adviser but prior to reductions from brokerage service arrangements or other expense offset arrangements. Expenses net of all reductions represent the net expenses paid by the class.
See accompanying notes which are an integral part of the financial statements.
Annual Report
Financial Highlights - Small Cap Growth
Year ended July 31, | 2005 E |
Selected Per-Share Data | |
Net asset value, beginning of period | $ 10.00 |
Income from Investment Operations | |
Net investment income (loss) D | (.04) |
Net realized and unrealized gain (loss) | 3.01 |
Total from investment operations | 2.97 |
Redemption fees added to paid in capital D | .01 |
Net asset value, end of period | $ 12.98 |
Total Return B, C | 29.80% |
Ratios to Average Net Assets F | |
Expenses before expense reductions | 1.16% A |
Expenses net of voluntary waivers, if any | 1.16% A |
Expenses net of all reductions | 1.08% A |
Net investment income (loss) | (.49)% A |
Supplemental Data | |
Net assets, end of period (000 omitted) | $ 205,652 |
Portfolio turnover rate | 93% A |
A Annualized
B Total returns for periods of less than one year are not annualized.
C Total returns would have been lower had certain expenses not been reduced during the periods shown.
D Calculated based on average shares outstanding during the period.
E For the period November 3, 2004 (commencement of operations) to July 31, 2005.
F Expense ratios reflect operating expenses of the class. Expenses before reductions do not reflect amounts reimbursed by the investment adviser or reductions from brokerage service arrangements or other expense offset arrangements and do not represent the amount paid by the class during periods when reimbursements or reductions occur. Expense ratios before reductions for start-up periods may not be representative of longer-term operating periods. Expenses net of any voluntary waivers reflect expenses after reimbursement by the investment adviser but prior to reductions from brokerage service arrangements or other expense offset arrangements. Expenses net of all reductions represent the net expenses paid by the class.
See accompanying notes which are an integral part of the financial statements.
Annual Report
Financial Highlights - Institutional Class
Year ended July 31, | 2005 E |
Selected Per-Share Data | |
Net asset value, beginning of period | $ 10.00 |
Income from Investment Operations | |
Net investment income (loss) D | (.04) |
Net realized and unrealized gain (loss) | 3.00 |
Total from investment operations | 2.96 |
Redemption fees added to paid in capital D | .01 |
Net asset value, end of period | $ 12.97 |
Total Return B, C | 29.70% |
Ratios to Average Net Assets F | |
Expenses before expense reductions | 1.20% A |
Expenses net of voluntary waivers, if any | 1.18% A |
Expenses net of all reductions | 1.10% A |
Net investment income (loss) | (.51)% A |
Supplemental Data | |
Net assets, end of period (000 omitted) | $ 1,906 |
Portfolio turnover rate | 93% A |
A Annualized
B Total returns for periods of less than one year are not annualized.
C Total returns would have been lower had certain expenses not been reduced during the periods shown.
D Calculated based on average shares outstanding during the period.
E For the period November 3, 2004 (commencement of operations) to July 31, 2005.
F Expense ratios reflect operating expenses of the class. Expenses before reductions do not reflect amounts reimbursed by the investment adviser or reductions from brokerage service arrangements or other expense offset arrangements and do not represent the amount paid by the class during periods when reimbursements or reductions occur. Expense ratios before reductions for start-up periods may not be representative of longer-term operating periods. Expenses net of any voluntary waivers reflect expenses after reimbursement by the investment adviser but prior to reductions from brokerage service arrangements or other expense offset arrangements. Expenses net of all reductions represent the net expenses paid by the class.
See accompanying notes which are an integral part of the financial statements.
Annual Report
Notes to Financial Statements
For the period ended July 31, 2005
1. Significant Accounting Policies.
Fidelity Small Cap Growth Fund (the fund) is a non-diversified fund of Fidelity Securities Fund (the trust) and is authorized to issue an unlimited number of shares. The trust is registered under the Investment Company Act of 1940, as amended (the 1940 Act), as an open-end management investment company organized as a Massachusetts business trust.
The fund offers Class A, Class T, Class B, Class C, Small Cap Growth, and Institutional Class shares, each of which has equal rights as to assets and voting privileges. Each class has exclusive voting rights with respect to matters that affect that class. Class B shares will automatically convert to Class A shares after a holding period of seven years from the initial date of purchase. Investment income, realized and unrealized capital gains and losses, the common expenses of the fund, and certain fund-level expense reductions, if any, are allocated on a pro rata basis to each class based on the relative net assets of each class to the total net assets of the fund. Each class differs with respect to transfer agent and distribution and service plan fees incurred. Certain expense reductions also differ by class.
The financial statements have been prepared in conformity with accounting principles generally accepted in the United States of America, which require management to make certain estimates and assumptions at the date of the financial statements. The following summarizes the significant accounting policies of the fund:
Security Valuation. Net asset value per share (NAV calculation) is calculated as of the close of business of the New York Stock Exchange, normally 4:00 p.m. Eastern time. Equity securities, including restricted securities, for which market quotations are available are valued at the last sale price or official closing price (closing bid price or last evaluated quote if no sale has occurred) on the primary market or exchange on which they trade. If prices are not readily available or do not accurately reflect fair value for a security, or if a security's value has been materially affected by events occurring after the close of the exchange or market on which the security is principally traded, that security may be valued by another method that the Board of Trustees believes accurately reflects fair value. A security's valuation may differ depending on the method used for determining value. Price movements in futures contracts and ADRs, market and trading trends, the bid/ask quotes of brokers and off-exchange institutional trading may be reviewed in the course of making a good faith determination of a security's fair value. Short-term securities with remaining maturities of sixty days or less for which quotations are not readily available are valued on the basis of amortized cost. Investments in open-end investment companies are valued at their net asset value each business day.
Foreign Currency. The fund uses foreign currency contracts to facilitate transactions in foreign-denominated securities. Losses from these transactions may arise from changes in the value of the foreign currency or if the counterparties do not perform under the contracts' terms.
Annual Report
1. Significant Accounting Policies - continued
Foreign Currency - continued
Foreign-denominated assets, including investment securities, and liabilities are translated into U.S. dollars at the exchange rate at period end. Purchases and sales of investment securities, income and dividends received and expenses denominated in foreign currencies are translated into U.S. dollars at the exchange rate in effect on the transaction date.
The effects of exchange rate fluctuations on investments are included with the net realized and unrealized gain (loss) on investment securities. Other foreign currency transactions resulting in realized and unrealized gain (loss) are disclosed separately.
Investment Transactions and Income. Security transactions are accounted for as of trade date. Gains and losses on securities sold are determined on the basis of identified cost. Dividend income is recorded on the ex-dividend date, except for certain dividends from foreign securities where the ex-dividend date may have passed, which are recorded as soon as the fund is informed of the ex-dividend date. Non-cash dividends included in dividend income, if any, are recorded at the fair market value of the securities received. Interest income is accrued as earned. Interest income includes coupon interest and amortization of premium and accretion of discount on debt securities. Investment income is recorded net of foreign taxes withheld where recovery of such taxes is uncertain.
Expenses. Most expenses of the trust can be directly attributed to a fund. Expenses which cannot be directly attributed are apportioned among each fund in the trust.
Income Tax Information and Distributions to Shareholders. Each year, the fund intends to qualify as a regulated investment company by distributing all of its taxable income and realized gains under Subchapter M of the Internal Revenue Code. As a result, no provision for income taxes is required in the accompanying financial statements. Foreign taxes are provided for based on the fund's understanding of the tax rules and rates that exist in the foreign markets in which it invests.
Distributions are recorded on the ex-dividend date. Income dividends and capital gain distributions are declared separately for each class. Income and capital gain distributions are determined in accordance with income tax regulations, which may differ from generally accepted accounting principles. In addition, the fund will claim a portion of the payment made to redeeming shareholders as a distribution for income tax purposes.
Capital accounts within the financial statements are adjusted for permanent book-tax differences. These adjustments have no impact on net assets or the results of operations. Temporary book-tax differences will reverse in a subsequent period.
Annual Report
Notes to Financial Statements - continued
1. Significant Accounting Policies - continued
Income Tax Information and Distributions to Shareholders - continued
Book-tax differences are primarily due to foreign currency transactions, passive foreign investment companies (PFIC) and losses deferred due to wash sales.
The tax-basis components of distributable earnings and the federal tax cost as of period end were as follows:
Unrealized appreciation | $ 23,649,374 | |
Unrealized depreciation | (4,111,134) | |
Net unrealized appreciation (depreciation) | 19,538,240 | |
Undistributed ordinary income | 2,686,931 | |
| | |
Cost for federal income tax purposes | $ 215,685,015 | |
Short-Term Trading (Redemption) Fees. Shares held in the fund less than 90 days are subject to a redemption fee equal to 1.50% of the proceeds of the redeemed shares. All redemption fees, including any estimated redemption fees paid by Fidelity Management & Research Company (FMR), are retained by the fund and accounted for as an addition to paid in capital.
2. Operating Policies.
Repurchase Agreements. FMR has received an Exemptive Order from the Securities and Exchange Commission (the SEC) which permits the fund and other affiliated entities of FMR to transfer uninvested cash balances into joint trading accounts which are then invested in repurchase agreements. The fund may also invest directly with institutions in repurchase agreements. Repurchase agreements are collateralized by government or non-government securities. Collateral is held in segregated accounts with custodian banks and may be obtained in the event of a default of the counterparty. The fund monitors, on a daily basis, the value of the collateral to ensure it is at least equal to the principal amount of the repurchase agreement (including accrued interest). In the event of a default by the counterparty, realization of the collateral proceeds could be delayed, during which time the value of the collateral may decline.
Restricted Securities. The fund may invest in securities that are subject to legal or contractual restrictions on resale. These securities generally may be resold in transactions exempt from registration or to the public if the securities are registered. Disposal of these securities may involve time-consuming negotiations and expense, and prompt sale at an acceptable price may be difficult. Information regarding restricted securities is included at the end of the fund's Schedule of Investments.
Annual Report
3. Purchases and Sales of Investments.
Purchases and sales of securities, other than short-term securities and U.S. government securities, aggregated $271,874,395 and $75,735,653, respectively.
4. Fees and Other Transactions with Affiliates.
Management Fee. FMR and its affiliates provide the fund with investment management related services for which the fund pays a monthly management fee. The management fee is the sum of an individual fund fee rate that is based on an annual rate of .45% of the fund's average net assets and a group fee rate that averaged .27% during the period. The group fee rate is based upon the average net assets of all the mutual funds advised by FMR. The group fee rate decreases as assets under management increase and increases as assets under management decrease. In addition, the management fee is subject to a performance adjustment (up to a maximum of ±.20% of the fund's average net assets over a 36 month performance period). The upward or downward adjustment to the management fee is based on the fund's relative investment performance as compared to an appropriate benchmark index. The fund's performance adjustment will not take effect until November, 2005. Subsequent months will be added until the performance period includes 36 months. For the period, the total annualized management fee rate was .72% of the fund's average net assets.
Distribution and Service Plan. In accordance with Rule 12b-1 of the 1940 Act, the fund has adopted separate Distribution and Service Plans for each class of shares. Certain classes pay Fidelity Distributors Corporation (FDC), an affiliate of FMR, separate Distribution and Service Fees, each of which is based on an annual percentage of each class' average net assets. In addition, FDC may pay financial intermediaries for selling shares of the fund and providing shareholder support services. For the period, the Distribution and Service Fee rates and the total amounts paid to and retained by FDC were as follows:
| Distribution
Fee | Service
Fee | Paid to
FDC | Retained
by FDC |
Class A | 0% | .25% | $ 4,000 | $ 1,244 |
Class T | .25% | .25% | 10,064 | 2,454 |
Class B | .75% | .25% | 9,067 | 8,060 |
Class C | .75% | .25% | 25,707 | 11,363 |
| | | $ 48,838 | $ 23,121 |
Sales Load. FDC receives a front-end sales charge of up to 5.75% for selling Class A shares, and 3.50% for selling Class T shares, some of which is paid to financial intermediaries for selling shares of the fund. FDC receives the proceeds of contingent deferred sales charges levied on Class A, Class T, Class B, and Class C redemptions. These charges
Annual Report
Notes to Financial Statements - continued
4. Fees and Other Transactions with Affiliates - continued
Sales Load - continued
depend on the holding period. The deferred sales charges range from 5% to 1% for Class B, 1% for Class C, and .25% for certain purchases of Class A and Class T shares.
For the period, sales charge amounts retained by FDC were as follows:
| Retained
by FDC | |
Class A | $ 10,726 | |
Class T | 2,528 | |
Class B* | 1,092 | |
Class C* | 205 | |
| $ 14,551 | |
* When Class B and Class C shares are initially sold, FDC pays commissions from its own resources to financial intermediaries through which the sales are made.
Transfer Agent Fees. Fidelity Investments Institutional Operations Company, Inc. (FIIOC), an affiliate of FMR, is the transfer, dividend disbursing and shareholder servicing agent for each class of the fund, except for Small Cap Growth. Fidelity Service Company, Inc. (FSC), an affiliate of FMR, is the transfer agent for Small Cap Growth shares. FIIOC and FSC receive account fees and asset-based fees that vary according to the account size and type of account of the shareholders of the respective classes of the fund. FIIOC and FSC pay for typesetting, printing and mailing of shareholder reports, except proxy statements. For the period the total transfer agent fees paid by each class to FIIOC or FSC, were as follows:
| Amount | % of
Average
Net Assets |
Class A | $ 5,363 | .33 * |
Class T | 6,337 | .31 * |
Class B | 3,035 | .33 * |
Class C | 8,123 | .32 * |
Small Cap Growth | 154,713 | .22 * |
Institutional Class | 1,799 | .19 * |
| $ 179,370 | |
* Annualized
Accounting and Security Lending Fees. FSC maintains the fund's accounting records. The accounting fee is based on the level of average net assets for the month. Under a separate contract, FSC administers the security lending program. The security lending fee is based on the number and duration of lending transactions.
Annual Report
4. Fees and Other Transactions with Affiliates - continued
Central Funds. The fund may invest in affiliated Central Funds managed by Fidelity Investments Money Management, Inc. (FIMM), an affiliate of FMR. The Central Funds are open-end investment companies available only to investment companies and other accounts managed by FMR and its affiliates. The Money Market Central Funds seek preservation of capital and current income. The Central Funds do not pay a management fee. Income distributions earned by the fund are recorded as income in the accompanying financial statements and totaled $51,594 for the period.
Brokerage Commissions. The fund placed a portion of its portfolio transactions with brokerage firms which are affiliates of the investment adviser. The commissions paid to these affiliated firms were $22,836 for the period.
5. Committed Line of Credit.
The fund participates with other funds managed by FMR in a $4.2 billion credit facility (the "line of credit") to be utilized for temporary or emergency purposes to fund shareholder redemptions or for other short-term liquidity purposes. The fund has agreed to pay commitment fees on its pro rata portion of the line of credit. During the period, there were no borrowings on this line of credit.
6. Security Lending.
The fund lends portfolio securities from time to time in order to earn additional income. The fund receives collateral (in the form of U.S. Treasury obligations, letters of credit and/or cash) against the loaned securities and maintains collateral in an amount not less than 100% of the market value of the loaned securities during the period of the loan. The market value of the loaned securities is determined at the close of business of the fund and any additional required collateral is delivered to the fund on the next business day. If the borrower defaults on its obligation to return the securities loaned because of insolvency or other reasons, a fund could experience delays and costs in recovering the securities loaned or in gaining access to the collateral. Cash collateral is invested in the Fidelity Securities Lending Cash Central Fund. The value of loaned securities and cash collateral at period end are disclosed on the fund's Statement of Assets and Liabilities.
7. Expense Reductions.
FMR voluntarily agreed to reimburse each class to the extent annual operating expenses exceeded certain levels of average net assets as noted in the table below. Some expenses, for example interest expense, are excluded from this reimbursement.
Annual Report
Notes to Financial Statements - continued
7. Expense Reductions - continued
The following classes were in reimbursement during the period:
| Expense
Limitations | Reimbursement
from adviser |
Class A | 1.50% - 1.40% * | $ 1,731 |
Class T | 1.75% - 1.65% * | 1,875 |
Class B | 2.25% - 2.15% * | 1,244 |
Class C | 2.25% - 2.15% * | 1,848 |
Institutional Class | 1.25% - 1.15% * | 134 |
| | $ 6,832 |
* Expense limitation in effect at period end.
Many of the brokers with whom FMR places trades on behalf of the fund provided services to the fund in addition to trade execution. These services included payments of certain expenses on behalf of the fund totaling $66,694 for the period. In addition, through arrangements with the fund's custodian, credits realized as a result of uninvested cash balances were used to reduce the fund's expenses. During the period, these credits reduced the fund's custody expenses by $151.
8. Other.
The fund's organizational documents provide former and current trustees and officers with a limited indemnification against liabilities arising in connection with the performance of their duties to the fund. In the normal course of business, the fund may also enter into contracts that provide general indemnifications. The fund's maximum exposure under these arrangements is unknown as this would be dependent on future claims that may be made against the fund. The risk of material loss from such claims is considered remote.
Annual Report
9. Share Transactions.
Transactions for each class of shares were as follows:
| Shares | Dollars |
| For the period
November 3, 2004 (commencement
of sale of shares) to July 31, 2005 | For the period
November 3, 2004 (commencement
of sale of shares) to
July 31, 2005 |
Class A | | |
Shares sold | 377,650 | $ 4,304,515 |
Shares redeemed | (13,200) | (157,404) |
Net increase (decrease) | 364,450 | $ 4,147,111 |
Class T | | |
Shares sold | 432,704 | $ 4,904,069 |
Shares redeemed | (27,332) | (327,972) |
Net increase (decrease) | 405,372 | $ 4,576,097 |
Class B | | |
Shares sold | 169,626 | $ 1,864,130 |
Shares redeemed | (10,003) | (113,030) |
Net increase (decrease) | 159,623 | $ 1,751,100 |
Class C | | |
Shares sold | 664,094 | $ 7,429,424 |
Shares redeemed | (14,036) | (166,606) |
Net increase (decrease) | 650,058 | $ 7,262,818 |
Small Cap Growth | | |
Shares sold | 18,162,749 | $ 212,509,370 |
Shares redeemed | (2,320,313) | (26,565,039) |
Net increase (decrease) | 15,842,436 | $ 185,944,331 |
Institutional Class | | |
Shares sold | 170,585 | $ 1,883,777 |
Shares redeemed | (23,631) | (261,946) |
Net increase (decrease) | 146,954 | $ 1,621,831 |
Annual Report
Report of Independent Registered Public Accounting Firm
To the Trustees of Fidelity Securities Fund and the Shareholders of Fidelity Small Cap Growth Fund:
In our opinion, the accompanying statement of assets and liabilities, including the schedule of investments, and the related statements of operations and of changes in net assets and the financial highlights present fairly, in all material respects, the financial position of Fidelity Small Cap Growth Fund (a fund of Fidelity Securities Fund) at July 31, 2005 and the results of its operations, the changes in its net assets and the financial highlights for the periods indicated, in conformity with accounting principles generally accepted in the United States of America. These financial statements and financial highlights (hereafter referred to as "financial statements") are the responsibility of the Fidelity Small Cap Growth Fund's management; our responsibility is to express an opinion on these financial statements based on our audit. We conducted our audit of these financial statements in accordance with the standards of the Public Company Accounting Oversight Board (United States). Those standards require that we plan and perform the audit to obtain reasonable assurance about whether the financial statements are free of material misstatement. An audit includes examining, on a test basis, evidence supporting the amounts and disclosures in the financial statements, assessing the accounting principles used and significant estimates made by management, and evaluating the overall financial statement presentation. We believe that our audit, which included confirmation of securities at July 31, 2005 by correspondence with the custodian and brokers, provides a reasonable basis for our opinion.
/s/ PricewaterhouseCoopers LLP
PricewaterhouseCoopers LLP
Boston, Massachusetts
September 9, 2005
Annual Report
Trustees and Officers
The Trustees, Members of the Advisory Board, and executive officers of the trust and funds, as applicable, are listed below. The Board of Trustees governs each fund and is responsible for protecting the interests of shareholders. The Trustees are experienced executives who meet periodically throughout the year to oversee each fund's activities, review contractual arrangements with companies that provide services to each fund, and review each fund's performance. Except for William O. McCoy, Stephen P. Jonas, and Kenneth L. Wolfe, each of the Trustees oversees 320 funds advised by FMR or an affiliate. Mr. McCoy oversees 322 funds advised by FMR or an affiliate. Mr. Jonas and Mr. Wolfe oversee 311 funds advised by FMR or an affiliate.
The Trustees hold office without limit in time except that (a) any Trustee may resign; (b) any Trustee may be removed by written instrument, signed by at least two-thirds of the number of Trustees prior to such removal; (c) any Trustee who requests to be retired or who has become incapacitated by illness or injury may be retired by written instrument signed by a majority of the other Trustees; and (d) any Trustee may be removed at any special meeting of shareholders by a two-thirds vote of the outstanding voting securities of the trust. Each Trustee who is not an interested person (as defined in the 1940 Act) (Independent Trustee), shall retire not later than the last day of the calendar year in which his or her 72nd birthday occurs. The Independent Trustees may waive this mandatory retirement age policy with respect to individual Trustees. The executive officers and Advisory Board Members hold office without limit in time, except that any officer and Advisory Board Member may resign or may be removed by a vote of a majority of the Trustees at any regular meeting or any special meeting of the Trustees. Except as indicated, each individual has held the office shown or other offices in the same company for the past five years.
The funds' Statement of Additional Information (SAI) includes more information about the Trustees. To request a free copy, call Fidelity at 1-800-544-8544.
Interested Trustees*:
Correspondence intended for each Trustee who is an interested person may be sent to Fidelity Investments, 82 Devonshire Street, Boston, Massachusetts 02109.
Name, Age; Principal Occupation |
Edward C. Johnson 3d (75)** |
| Year of Election or Appointment: 1984 Mr. Johnson is Chairman of the Board of Trustees. Mr. Johnson serves as Chief Executive Officer, Chairman, and a Director of FMR Corp.; a Director and Chairman of the Board and of the Executive Committee of FMR; Chairman and a Director of Fidelity Management & Research (Far East) Inc.; Chairman and a Director of Fidelity Investments Money Management, Inc.; and Chairman (2001-present) and a Director (2000-present) of FMR Co., Inc. |
Abigail P. Johnson (43)** |
| Year of Election or Appointment: 2001 Ms. Johnson serves as President of Fidelity Employer Services Company (FESCO) (2005-present). She is President and a Director of Fidelity Investments Money Management, Inc. (2001-present), FMR Co., Inc. (2001-present), and a Director of FMR Corp. Previously, Ms. Johnson served as President and a Director of FMR (2001-2005), Senior Vice President of the Fidelity funds (2001-2005), and managed a number of Fidelity funds. |
Stephen P. Jonas (52) |
| Year of Election or Appointment: 2005 Mr. Jonas is Senior Vice President of the fund (2005-present). He also serves as a Senior Vice President of other Fidelity funds (2005-present). Mr. Jonas is Executive Director of FMR (2005-present). Previously, Mr. Jonas served as President of Fidelity Enterprise Operations and Risk Services (2004-2005), Chief Administrative Officer (2002-2004), and Chief Financial Officer of FMR Co. (1998-2000). Mr. Jonas has been with Fidelity Investments since 1987 and has held various financial and management positions including Chief Financial Officer of FMR. In addition, he serves on the Boards of Boston Ballet (2003-present) and Simmons College (2003-present). |
Robert L. Reynolds (53) |
| Year of Election or Appointment: 2003 Mr. Reynolds is a Director (2003-present) and Chief Operating Officer (2002-present) of FMR Corp. He also serves on the Board at Fidelity Investments Canada, Ltd. (2000-present). Previously, Mr. Reynolds served as President of Fidelity Investments Institutional Retirement Group (1996-2000). |
* Trustees have been determined to be "Interested Trustees" by virtue of, among other things, their affiliation with the trust or various entities under common control with FMR.
** Edward C. Johnson 3d, Trustee, is Abigail P. Johnson's father.
Annual Report
Independent Trustees:
Correspondence intended for each Independent Trustee (that is, the Trustees other than the Interested Trustees) may be sent to Fidelity Investments, P.O. Box 55235, Boston, Massachusetts 02205-5235.
Name, Age; Principal Occupation |
Dennis J. Dirks (57) |
| Year of Election or Appointment: 2005 Prior to his retirement in May 2003, Mr. Dirks was Chief Operating Officer and a member of the Board of The Depository Trust & Clearing Corporation (DTCC) (1999-2003). He also served as President, Chief Operating Officer, and Board member of The Depository Trust Com-pany (DTC) (1999-2003) and President and Board member of the National Securities Clearing Corporation (NSCC) (1999-2003). In addition, Mr. Dirks served as Chief Executive Officer and Board member of the Government Securities Clearing Corporation (2001-2003) and Chief Executive Officer and Board member of the Mortgage-Backed Securities Clearing Corporation (2001-2003). Mr. Dirks also serves as a Tustee of Manhattan College (2005-present). |
Robert M. Gates (61) |
| Year of Election or Appointment: 1997 Dr. Gates is Vice Chairman of the Independent Trustees (2005-present). Dr. Gates is President of Texas A&M University (2002-present). He was Director of the Central Intelligence Agency (CIA) from 1991 to 1993. From 1989 to 1991, Dr. Gates served as Assistant to the President of the United States and Deputy National Security Advisor. Dr. Gates is a Director of NACCO Industries, Inc. (mining and manufacturing), Parker Drilling Co., Inc. (drilling and rental tools for the energy industry, 2001-present), and Brinker International (restaurant management, 2003-present). Previously, Dr. Gates served as a Director of LucasVarity PLC (automotive components and diesel engines), a Director of TRW Inc. (automotive, space, defense, and information technology), and Dean of the George Bush School of Government and Public Service at Texas A&M University (1999-2001). Dr. Gates also is a Trustee of the Forum for International Policy. |
George H. Heilmeier (69) |
| Year of Election or Appointment: 2004 Dr. Heilmeier is Chairman Emeritus of Telcordia Technologies (communication software and systems), where prior to his retirement, he served as company Chairman and Chief Executive Officer. He currently serves on the Boards of Directors of The Mitre Corporation (systems engineering and information technology support for the government), and HRL Laboratories (private research and development, 2004-present). He is Chairman of the General Motors Science & Technology Advisory Board and a Life Fellow of the Institute of Electrical and Electronics Engineers (IEEE) (2000-present). Dr. Heilmeier is a member of the Defense Science Board and the National Security Agency Advisory Board. He is also a member of the National Academy of Engineering, the American Academy of Arts and Sciences, and the Board of Overseers of the School of Engineering and Applied Science of the University of Pennsylvania. Previously, Dr. Heilmeier served as a Director of TRW Inc. (automotive, space, defense, and information technology, 1992-2002), Compaq (1994-2002), Automatic Data Processing, Inc. (ADP) (technology-based business outsourcing, 1995-2002), INET Tech-nologies Inc. (telecommunications network surveillance, 2001-2004), and Teletech Holdings (customer management services). He is the recipient of the 2005 Kyoto Prize in Advanced Technology for his invention of the liquid display. |
Marie L. Knowles (58) |
| Year of Election or Appointment: 2001 Prior to Ms. Knowles' retirement in June 2000, she served as Executive Vice President and Chief Financial Officer of Atlantic Richfield Company (ARCO) (diversified energy, 1996-2000). From 1993 to 1996, she was a Senior Vice President of ARCO and President of ARCO Transportation Company. She served as a Director of ARCO from 1996 to 1998. She currently serves as a Director of Phelps Dodge Corporation (copper mining and manufacturing) and McKesson Corporation (healthcare service, 2002-present). Ms. Knowles is a Trustee of the Brookings Institution and the Catalina Island Conservancy and also serves as a member of the Advisory Board for the School of Engineering of the University of Southern California. |
Ned C. Lautenbach (61) |
| Year of Election or Appointment: 2000 Mr. Lautenbach has been a partner of Clayton, Dubilier & Rice, Inc. (private equity investment firm) since September 1998. Previously, Mr. Lautenbach was with the International Business Machines Corporation (IBM) from 1968 until his retirement in 1998. Mr. Lautenbach serves as a Director of Italtel Holding S.p.A. (telecommunications (Milan, Italy), 2004-present) and Eaton Corporation (diversified industrial) as well as the Philharmonic Center for the Arts in Naples, Florida. He also is a member of the Board of Trustees of Fairfield University (2005-present), as well as a member of the Council on Foreign Relations. |
Marvin L. Mann (72) |
| Year of Election or Appointment: 1993 Mr. Mann is Chairman of the Independent Trustees (2001-present). He is Chairman Emeritus of Lexmark International, Inc. (computer peripherals), where he served as CEO until April 1998, retired as Chairman May 1999, and remains a member of the Board. Prior to 1991, he held the positions of Vice President of International Business Machines Corporation (IBM) and President and General Manager of various IBM divisions and subsidiaries. He is a member of the Executive Committee of the Independent Director's Council of the Investment Company Institute. In addition, Mr. Mann is a member of the President's Cabinet at the University of Alabama and the Board of Visitors of the Culverhouse College of Commerce and Business Administration at the University of Alabama. |
William O. McCoy (71) |
| Year of Election or Appointment: 1997 Prior to his retirement in December 1994, Mr. McCoy was Vice Chairman of the Board of BellSouth Corporation (telecommunications) and President of BellSouth Enterprises. He is currently a Director of Liberty Corporation (holding company), Duke Realty Corporation (real estate), and Progress Energy, Inc. (electric utility). He is also a partner of Franklin Street Partners (private investment management firm) and a member of the Research Triangle Foundation Board. In addition, Mr. McCoy served as the Interim Chancellor (1999-2000) and a member of the Board of Visitors for the University of North Carolina at Chapel Hill and currently serves on the Board of Directors of the University of North Carolina Health Care System and the Board of Visitors of the Kenan-Flagler Business School (University of North Carolina at Chapel Hill). He also served as Vice President of Finance for the University of North Carolina (16-school system). |
Cornelia M. Small (61) |
| Year of Election or Appointment: 2005 Ms. Small is a member (2000-present) and Chairperson (2002-present) of the Investment Committee, and a member (2002-present) of the Board of Trustees of Smith College. Previously, she served as Chief Investment Officer (1999-2000), Director of Global Equity Investments (1996-1999), and a member of the Board of Directors of Scudder, Stevens & Clark (1990-1997) and Scudder Kemper Investments (1997-1998). In addition, Ms. Small served as Co-Chair (2000-2003) of the Annual Fund for the Fletcher School of Law and Diplomacy. |
William S. Stavropoulos (66) |
| Year of Election or Appointment: 2002 Mr. Stavropoulos is Chairman of the Board (2000-present) and a Member of the Board of Directors of The Dow Chemical Company. Since joining The Dow Chemical Company in 1967, Mr. Stavropoulos served in numerous senior management positions, including President (1993-2000; 2002-2003), CEO (1995-2000; 2002-2004), and Chairman of the Executive Committee (2000-2004). Currently, he is a Director of NCR Corporation (data warehousing and technology solutions), BellSouth Corporation (telecommunications), Chemical Financial Corporation, and Maersk Inc. (industrial conglomerate, 2002-present), and Metalmark Capital (private equity investment firm, 2005-present). He also serves as a member of the Board of Trustees of the American Enterprise Institute for Public Policy Research. In addition, Mr. Stavropoulos is a member of The Business Council, J.P. Morgan International Council and the University of Notre Dame Advisory Council for the College of Science. |
Kenneth L. Wolfe (66) |
| Year of Election or Appointment: 2005 Mr. Wolfe also serves as a Trustee (2005-present) or Member of the Advisory Board (2004-present) of other investment companies advised by FMR. Prior to his retirement in 2001, Mr. Wolfe was Chairman and Chief Executive Officer of Hershey Foods Corporation (1993-2001). He currently serves as a member of the boards of Adelphia Communications Corporation (2003-present), Bausch & Lomb, Inc., and Revlon Inc. (2004-present). |
Annual Report
Advisory Board Members and Executive Officers:
Correspondence intended for Mr. Gamper may be sent to Fidelity Investments, P.O. Box 55235, Boston, Massachusetts 02205-5235. Correspondence intended for each executive officer and Mr. Lynch may be sent to Fidelity Investments, 82 Devonshire Street, Boston, Massachusetts 02109.
Name, Age; Principal Occupation |
Albert R. Gamper, Jr. (63) |
| Year of Election or Appointment: 2005 Member of the Advisory Board of Fidelity Securities Fund. Prior to his retirement in December 2004, Mr. Gamper served as Chairman of the Board of CIT Group Inc. (commercial finance). During his tenure with CIT Group Inc. Mr. Gamper served in numerous senior management positions, including Chairman (1987-1989; 1999-2001; 2002-2004), Chief Executive Officer (1987-2004), and President (1989-2002). He currently serves as a member of the Board of Directors of Public Service Enterprise Group (utilities, 2001-present), Chairman of the Board of Governors, Rutgers University (2004-present), and Chairman of the Board of Saint Barnabas Health Care System. |
Peter S. Lynch (62) |
| Year of Election or Appointment: 2003 Member of the Advisory Board of Fidelity Securities Fund. Vice Chairman and a Director of FMR, and Vice Chairman (2001-present) and a Director (2000-present) of FMR Co., Inc. Previously, Mr. Lynch served as a Trustee of the Fidelity funds (1990-2003). In addition, he serves as a Trustee of Boston College, Massachusetts Eye & Ear Infirmary, Historic Deerfield, John F. Kennedy Library, and the Museum of Fine Arts of Boston. |
Dwight D. Churchill (51) |
| Year of Election or Appointment: 2005 Vice President of the fund. Mr. Churchill also serves as Vice President of certain Equity Funds (2005-present) and certain High Income Funds (2005-present). Previously, he served as Head of Fidelity's Fixed-Income Division (2000-2005), Vice President of Fidelity's Bond Funds, and Senior Vice President of FIMM (2000) and FMR. Mr. Churchill joined Fidelity in 1993 as Vice President and Group Leader of Taxable Fixed-Income Investments. |
James M. Harmon (34) |
| Year of Election or Appointment: 2005 Vice President of the fund. He also manages other Fidelity funds, and has worked as a research analyst, portfolio assistant and portfolio manager. |
Eric D. Roiter (56) |
| Year of Election or Appointment: 2004 Secretary of the fund. He also serves as Secretary of other Fidelity funds; Vice President, General Counsel, and Secretary of FMR Co., Inc. (2001-present) and FMR; Assistant Secretary of Fidelity Management & Research (U.K.) Inc. (2001-present), Fidelity Management & Research (Far East) Inc. (2001-present), and Fidelity Investments Money Management, Inc. (2001-present). Mr. Roiter is an Adjunct Member, Faculty of Law, at Boston College Law School (2003-present). Previously, Mr. Roiter served as Vice President and Secretary of FDC (1998-2005). |
Stuart Fross (45) |
| Year of Election or Appointment: 2004 Assistant Secretary of the fund. Mr. Fross also serves as Assistant Secretary of other Fidelity funds (2003-present), Vice President and Secretary of FDC (2005-present), and is an employee of FMR. |
Christine Reynolds (46) |
| Year of Election or Appointment: 2004 President, Treasurer, and Anti-Money Laundering (AML) officer of the fund. Ms. Reynolds also serves as President, Treasurer, and AML officer of other Fidelity funds (2004) and is a Vice President (2003) and an employee (2002) of FMR. Before joining Fidelity Investments, Ms. Reynolds worked at PricewaterhouseCoopers LLP (PwC) (1980-2002), where she was most recently an audit partner with PwC's investment management practice. |
Timothy F. Hayes (54) |
| Year of Election or Appointment: 2004 Chief Financial Officer of the fund. Mr. Hayes also serves as Chief Financial Officer of other Fidelity funds (2002). Mr. Hayes also serves as Chief Financial Officer of other Fidelity funds (2002-present) and President of Fidelity Investment Operations (2005-present) which includes Fidelity Pricing and Cash Management Services Group (FPCMS), where he served as President (1998-2005). Mr. Hayes serves as President of Fidelity Service Company (2003-present) where he also serves as a Director. Mr. Hayes also served as President of Fidelity Investments Operations Group (FIOG, 2002-2005). |
Kenneth A. Rathgeber (58) |
| Year of Election or Appointment: 2004 Chief Compliance Officer of the fund. Mr. Rathgeber also serves as Chief Compliance Officer of other Fidelity funds (2004) and Executive Vice President of Risk Oversight for Fidelity Investments (2002). Previously, he served as Executive Vice President and Chief Operating Officer for Fidelity Investments Institutional Services Company, Inc. (1998-2002). |
John R. Hebble (47) |
| Year of Election or Appointment: 2004 Deputy Treasurer of the fund. Mr. Hebble also serves as Deputy Treasurer of other Fidelity funds (2003), and is an employee of FMR. Before joining Fidelity Investments, Mr. Hebble worked at Deutsche Asset Management where he served as Director of Fund Accounting (2002-2003) and Assistant Treasurer of the Scudder Funds (1998-2003). |
Bryan A. Mehrmann (44) |
| Year of Election or Appointment: 2005 Deputy Treasurer of the fund. Mr. Mehrmann also serves as Deputy Treasurer of other Fidelity funds (2005-present) and is an employee of FMR. Previously, Mr. Mehrmann served as Vice President of Fidelity Investments Institutional Services Group (FIIS)/Fidelity Investments Institutional Operations Corporation, Inc. (FIIOC) Client Services (1998-2004). |
Kimberley H. Monasterio (41) |
| Year of Election or Appointment: 2004 Deputy Treasurer of the fund. Ms. Monasterio also serves as Deputy Treasurer of other Fidelity funds (2004) and is an employee of FMR (2004). Before joining Fidelity Investments, Ms. Monasterio served as Treasurer (2000-2004) and Chief Financial Officer (2002-2004) of the Franklin Templeton Funds and Senior Vice President of Franklin Templeton Services, LLC (2000-2004). |
Kenneth B. Robins (35) |
| Year of Election or Appointment: 2005 Deputy Treasurer of the fund. Mr. Robins also serves as Deputy Treasurer of other Fidelity funds (2005-present) and is an employee of FMR (2004-present). Before joining Fidelity Investments, Mr. Robins worked at KPMG LLP, where he was a partner in KPMG's department of professional practice (2002-2004) and a Senior Manager (1999-2000). In addition, Mr. Robins served as Assistant Chief Accountant, United States Securities and Exchange Commission (2000-2002). |
Robert G. Byrnes (38) |
| Year of Election or Appointment: 2005 Assistant Treasurer of the fund. Mr. Byrnes also serves as Assistant Treasurer of other Fidelity funds (2005-present) and is an employee of FMR (2005-present). Previously, Mr. Byrnes served as Vice President of FPCMS (2003-2005). Before joining Fidelity Investments, Mr. Byrnes worked at Deutsche Asset Management where he served as Vice President of the Investment Operations Group (2000-2003). |
John H. Costello (58) |
| Year of Election or Appointment: 2004 Assistant Treasurer of the fund. Mr. Costello also serves as Assistant Treasurer of other Fidelity funds and is an employee of FMR. |
Peter L. Lydecker (51) |
| Year of Election or Appointment: 2004 Assistant Treasurer of the fund. Mr. Lydecker also serves as Assistant Treasurer of other Fidelity funds (2004) and is an employee of FMR. |
Mark Osterheld (50) |
| Year of Election or Appointment: 2004 Assistant Treasurer of the fund. Mr. Osterheld also serves as Assistant Treasurer of other Fidelity funds (2002) and is an employee of FMR. |
Gary W. Ryan (46) |
| Year of Election or Appointment: 2005 Assistant Treasurer of the fund. Mr. Ryan also serves as Assistant Treasurer of other Fidelity funds (2005-present) and is an employee of FMR (2005-present). Previously, Mr. Ryan served as Vice President of Fund Reporting in FPCMS (1999-2005). |
Salvatore Schiavone (39) |
| Year of Election or Appointment: 2005 Assistant Treasurer of the fund. Mr. Schiavone also serves as Assistant Treasurer of other Fidelity funds (2005-present) and is an employee of FMR (2005-present). Before joining Fidelity Investments, Mr. Schiavone worked at Deutsche Asset Management, where he most recently served as Assistant Treasurer (2003-2005) of the Scudder Funds and Vice President and Head of Fund Reporting (1996-2003). |
Annual Report
Distributions
The Board of Trustees of Advisor Small Cap Growth Fund voted to pay to shareholders of record at the opening of business on record date, the following distributions per share derived from capital gains realized from sales of portfolio securities:
| Pay Date | Record Date | Capital Gains |
Class A | 9/12/05 | 09/09/05 | $0.128 |
| | | |
Class T | 9/12/05 | 09/09/05 | $0.115 |
| | | |
Class B | 9/12/05 | 09/09/05 | $0.088 |
| | | |
Class C | 9/12/05 | 09/09/05 | $0.101 |
Annual Report
Board Approval of Investment Advisory Contracts and Management Fees
Fidelity Small Cap Growth Fund
Each year, typically in July, the Board of Trustees, including the independent Trustees (together, the Board), votes on the renewal of the management contract and sub-advisory agreements (together, the Advisory Contracts) for the fund. The Board, assisted by the advice of fund counsel and independent Trustees' counsel, requests and considers a broad range of information throughout the year.
The Board meets regularly each month except August and takes into account throughout the year matters bearing on Advisory Contracts. The Board, acting directly and through its separate committees, considers at each of its meetings factors that are relevant to the annual renewal of the fund's Advisory Contracts, including the services and support provided to the fund and its shareholders by Fidelity. At the time of the renewal, the Board had 11 standing committees, each composed of independent Trustees with varying backgrounds, to which the Board has assigned specific subject matter responsibilities in order to enhance effective decision-making by the Board. Each committee has adopted a written charter outlining the structure and purposes of the committee. One such committee, the Equity Contract Committee, meets periodically during the first six months of each year and as necessary to consider matters specifically related to the annual renewal of Advisory Contracts. The committee requests and receives information on, and makes recommendations to the independent Trustees concerning, the approval and annual review of the Advisory Contracts.
At its July 2005 meeting, the Board of Trustees, including the independent Trustees, unanimously determined to renew the Advisory Contracts for the fund. In reaching its determination, the Board considered all factors it believed relevant, including (1) the nature, extent, and quality of the services to be provided to the fund and its shareholders by Fidelity (including the investment performance of the fund); (2) the competitiveness of the management fee and total expenses of the fund; (3) the total costs of the services to be provided by and the profits to be realized by the investment adviser and its affiliates from the relationship with the fund; (4) the extent to which economies of scale would be realized as the fund grows; and (5) whether fee levels reflect these economies of scale, if any, for the benefit of fund shareholders.
In determining whether to renew the Advisory Contracts for the fund, the Board ultimately reached a determination, with the assistance of fund counsel and independent Trustees' counsel, that the renewal of the Advisory Contracts and the compensation to be received by Fidelity under the management contract is consistent with Fidelity's fiduciary duty under applicable law. In addition to evaluating the specific factors noted above, the Board, in reaching its determination, is aware that shareholders in the fund have a broad range of investment choices available to them, including a wide choice among mutual funds offered by competitors to Fidelity, and that the fund's shareholders, with the opportunity to review and weigh the disclosure provided by the fund in its prospectus and other public disclosures, have chosen to invest in this fund, managed by Fidelity.
Annual Report
Nature, Extent, and Quality of Services Provided by Fidelity. The Board considered staffing within the investment adviser, FMR, and the sub-advisers (together, the Investment Advisers), including the background of the fund's portfolio manager and the fund's investment objective and discipline. The independent Trustees also had discussions with senior management of Fidelity's investment operations and investment groups. The Board considered the structure of the portfolio manager compensation program and whether this structure provides appropriate incentives.
Fidelity Resources Dedicated to Investment Management and Support Services. The Board reviewed the size, education, and experience of the Investment Advisers' investment staff, their use of technology, and the Investment Advisers' approach to recruiting, training, and retaining portfolio managers and other research, advisory, and management personnel. The Board considered Fidelity's extensive global research capabilities that enable the Investment Advisers to aggregate data from various sources in an effort to produce positive investment results. The Board noted that Fidelity's analysts have access to a variety of technological tools that enable them to perform both fundamental and quantitative analysis and to specialize in various disciplines. The Board also considered that Fidelity's portfolio managers and analysts have access to daily portfolio attribution that allows for monitoring of a fund's portfolio, as well as an electronic communication system that provides immediate real-time access to research concerning issuers and credit enhancers.
Shareholder and Administrative Services. The Board considered the nature, extent, quality, and cost of administrative, distribution, and shareholder services performed by the Investment Advisers and their affiliates under the Advisory Contracts and under separate agreements covering transfer agency, pricing and bookkeeping, and securities lending services for the fund. The Board also considered the nature and extent of the Investment Advisers' supervision of third party service providers, principally custodians and subcustodians. The Board reviewed the allocation of fund brokerage, including allocations to brokers affiliated with the Investment Advisers, the use of brokerage commissions to pay fund expenses, and the use of "soft" commission dollars to pay for research services. The Board also considered that Fidelity voluntarily decided in 2004 to stop using "soft" commission dollars to pay for market data and, instead, to pay for that data out of its own resources. The Board also considered the resources devoted to, and the record of compliance with, the fund's compliance policies and procedures.
The Board noted that the growth of fund assets across the complex allows Fidelity to reinvest in the development of services designed to enhance the value or convenience of the Fidelity funds as investment vehicles. These services include 24-hour access to account information and market information through phone representatives and over the Internet, and investor education materials and asset allocation tools.
Annual Report
Board Approval of Investment Advisory Contracts and
Management Fees - continued
Investment in a Large Fund Family. The Board considered the benefits to shareholders of investing in a Fidelity fund, including the benefits of investing in a fund that is part of a large family of funds offering a variety of investment disciplines and providing for a large variety of mutual fund investor services. For example, fund shareholders are offered the privilege of exchanging shares of the fund for shares of other Fidelity funds, as set forth in the fund's prospectus, without paying an additional sales charge. The Board noted that, since July 2004, Fidelity has taken a number of actions that benefited particular funds, including (i) voluntarily deciding in 2004 to stop using "soft" commission dollars to pay for market data and, instead, to pay for that data out of its own resources, (ii) contractually agreeing to impose management fee reductions and expense limitations on its five Spartan stock index funds and its stock index fund available through variable insurance products, (iii) contractually agreeing to eliminate the management fees on the Fidelity Freedom Funds and the Fidelity Advisor Freedom Funds, (iv) contractually agreeing to reduce the management fees on most of its investment-grade taxable bond funds, and (v) contractually agreeing to impose expense limitations on its retail and Spartan investment-grade taxable bond funds.
Investment Performance and Compliance. The Board considered whether the fund has operated within its investment objective, as well as its record of compliance with its investment restrictions. The Board noted that it is not possible to evaluate performance in any comprehensive fashion because the fund had been in operation for less than one calendar year. Once the fund has been in operation for at least one calendar year, the Board will review the fund's absolute investment performance for each class, as well as the fund's relative investment performance for each class measured against (i) a broad-based securities market index and (ii) a peer group of mutual funds deemed appropriate by the Board.
The Board also considered that, beginning November 1, 2005, the fund's management fee will be subject to upward or downward adjustment depending upon whether, and to what extent, the fund's investment performance for the performance period exceeds, or is exceeded by, the record (over the same period) of a Board-approved performance adjustment index. The Board realizes that the performance adjustment provides FMR with a strong economic incentive to seek to achieve superior performance for the fund's shareholders and helps to more closely align the interests of FMR and the fund's shareholders.
The Board has had thorough discussions with FMR throughout the year about the Board's and FMR's concerns about equity research, equity fund performance, and compliance with internal policies governing gifts and entertainment. FMR has taken steps that it believes will refocus and strengthen equity research and equity portfolio management and compliance. The Board noted with favor FMR's recent reorganization of its senior management team and FMR's plans to dedicate additional resources to investment research, and participated in the process that led to those changes.
Annual Report
Based on its review, and giving particular weight to the nature and quality of the resources dedicated by the Investment Advisers to maintain and improve relative performance, the Board concluded that the nature, extent, and quality of the services provided by Fidelity will benefit the fund's shareholders, particularly in light of the Board's view that the fund's shareholders benefit from investing in a fund that is part of a large family of funds offering a variety of investment disciplines and services.
Competitiveness of Management Fee and Total Fund Expenses. The Board considered the fund's management fee and total expenses compared to "mapped groups" of competitive funds and classes. Fidelity creates "mapped groups" by combining similar Lipper investment objective categories that have comparable management fee characteristics. Combining Lipper investment objective categories aids the Board's management fee and total expense comparisons by broadening the competitive group used for comparison and by reducing the number of universes to which various Fidelity funds are compared.
The Board considered two proprietary management fee comparisons for the period of the fund's operations shown in the chart below. The group of Lipper funds used by the Board for management fee comparisons is referred to below as the "Total Mapped Group" and, for the reasons explained above, is broader than the Lipper peer group used by the Board for performance comparisons. The Total Mapped Group comparison focuses on a fund's standing relative to the total universe of comparable funds available to investors, in terms of gross management fees before expense reimbursements or caps. "TMG %" represents the percentage of funds in the Total Mapped Group that had management fees that were lower than the fund's. For example, a TMG % of 18% means that 82% of the funds in the Total Mapped Group had higher management fees than the fund. The "Asset-Size Peer Group" (ASPG) comparison focuses on a fund's standing relative to non-Fidelity funds similar in size to the fund within the Total Mapped Group. The ASPG represents at least 15% of the funds in the Total Mapped Group with comparable asset size and management fee characteristics, subject to a minimum of 50 funds (or all funds in the Total Mapped Group if fewer than 50). Additional information, such as the ASPG quartile ("quadrant") in which the fund's management fee ranked, is also included in the chart and considered by the Board.
Annual Report
Board Approval of Investment Advisory Contracts and
Management Fees - continued
The Board noted that the fund's management fee ranked below the median of its Total Mapped Group and below the median of its ASPG for the period.
Based on its review, the Board concluded that the fund's management fee was fair and reasonable in light of the services that the fund receives and the other factors considered.
In its review of each class's total expenses, the Board considered the fund's management fee as well as other fund or class expenses, as applicable, such as transfer agent fees, pricing and bookkeeping fees, fund-paid 12b-1 fees, and custodial, legal, and audit fees. The Board also noted the effects of any waivers and reimbursements on fees and expenses. As part of its review, the Board also considered current and historical total expenses of each class of the fund compared to competitive fund median expenses. Each class of the fund is compared to those funds and classes in the Total Mapped Group (used by the Board for management fee comparisons) that have a similar sales load structure.
The Board noted that the total expenses of Fidelity Small Cap Growth Fund (retail class) ranked below its competitive median for the period, the total expenses of Class A ranked equal to its competitive median for the period, and the total expenses of each of Class B, Class C, Class T and Institutional Class ranked above its competitive median for the period. The Board considered that the fund launched in November 2004 and that the classes were above median because of high expenses in basis points due to their small size. The Board noted that the fund offers multiple classes, each of which has a different sales load and 12b-1 fee structure, and that the multiple structures are intended to offer a range of pricing options for the intermediary market. The Board also noted that the total expenses of the classes vary primarily by the level of their 12b-1 fees, although differences in transfer agent fees may also cause expenses to vary from class to class.
Annual Report
Furthermore, the Board considered that, effective June 1, 2005, FMR voluntarily agreed to reimburse each class of the fund to the extent that total operating expenses (excluding 12b-1 fees and certain other expenses) exceed 115 basis points. The Board considered that, if the voluntary expense reimbursements had been in effect in 2004, the total expenses of each of Class A, Class B and Class C would have ranked below the median and the total expenses of Institutional Class would have ranked equal to the median.
In its review of total expenses, the Board also considered Fidelity fee structures and other information on clients that FMR and its affiliates service in other competitive markets, such as other mutual funds advised or subadvised by FMR or its affiliates, pension plan clients, and other institutional clients.
Based on its review, the Board concluded that the total expenses for each class of the fund were reasonable, although in some cases above the median of the universe presented for comparison, in light of the services that the fund and its shareholders receive and the other factors considered.
Costs of the Services and Profitability. The Board considered the revenues earned and the expenses incurred by Fidelity in conducting the business of developing, marketing, distributing, managing, administering and servicing the fund and its shareholders. The Board also considered the level of Fidelity's profits in respect of all the Fidelity funds.
On an annual basis, FMR presents to the Board Fidelity's profitability for the fund. Fidelity calculates the profitability for each fund, as well as aggregate profitability for groups of Fidelity funds and all Fidelity funds, using a series of detailed revenue and cost allocation methodologies which originate with the audited books and records of Fidelity. The Audit Committee of the Board reviews any significant changes from the prior year's methodologies.
PricewaterhouseCoopers LLP (PwC), independent registered accounting firm and auditor to Fidelity and certain Fidelity funds, has been engaged annually by the Board as part of the Board's assessment of the results of Fidelity's profitability analysis. PwC's engagement includes the review and assessment of Fidelity's methodologies used in determining the revenues and expenses attributable to Fidelity's mutual fund business, and completion of agreed-upon procedures surrounding the mathematical accuracy of fund profitability and its conformity to allocation methodologies. After considering PwC's reports issued under the engagement and information provided by Fidelity, the Board believes that while other allocation methods may also be reasonable, Fidelity's profitability methodologies are reasonable in all material respects.
Annual Report
Board Approval of Investment Advisory Contracts and
Management Fees - continued
The Board has also reviewed Fidelity's non-fund businesses and any fall-out benefits related to the mutual fund business as well as cases where Fidelity's affiliates may benefit from or be related to the fund's business. In addition, a special committee of the Board reviewed services provided to Fidelity by its affiliates and determined that the fees that Fidelity paid for such services were reasonable.
The Board considered the costs of the services provided by and the profits realized by Fidelity in connection with the operation of the fund and determined that the amount of profit is a fair entrepreneurial profit for the management of the fund.
Economies of Scale. The Board considered whether there have been economies of scale in respect of the management of the Fidelity funds, whether the Fidelity funds (including the fund) have appropriately benefited from any such economies of scale, and whether there is potential for realization of any further economies of scale. The Board considered the extent to which the fund will benefit from economies of scale through increased services to the fund, through waivers or reimbursements, or through fee or expense reductions, including reductions that occur through operation of the transfer agent agreement. The transfer agent fee varies in part based on the number of accounts in the fund. If the number of accounts decreases or the average account size increases, the overall transfer agent fee rate decreases.
The Board recognized that the fund's management contract incorporates a "group fee" structure, which provides for lower fee rates as total fund assets under FMR's management increase, and for higher fee rates as total fund assets under FMR's management decrease. The Board considered that the group fee is designed to deliver the benefits of economies of scale to fund shareholders when total fund assets increase, even if assets of any particular fund are unchanged or have declined, because some portion of Fidelity's costs are attributable to services provided to all Fidelity funds, and all funds benefit if those costs can be allocated among more assets. The Board concluded that, given the group fee structure, fund shareholders will achieve a certain level of economies of scale as assets under FMR's management increase at the fund complex level, regardless of whether Fidelity achieves any such economies of scale.
The Board further concluded that any potential economies of scale are being shared between fund shareholders and Fidelity in an appropriate manner.
Additional Information Requested by the Board. In order to develop fully the factual basis for consideration of the Advisory Contracts, the Board requested additional information regarding (i) equity fund transfer agency fees; (ii) Fidelity's fund profitability methodology and the impact of various changes in the methodology over time; (iii) benefits to shareholders from economies of scale; (iv) composition and characteristics of various fund and industry data used in comparisons; and (v) compensation of portfolio managers and research analysts.
Annual Report
Based on its evaluation of all of the conclusions noted above, and after considering all material factors, the Board ultimately concluded that the existing advisory fee structures are fair and reasonable, and that the fund's existing Advisory Contracts should be renewed.
Annual Report
Annual Report
Annual Report
Investment Adviser
Fidelity Management & Research Company
Boston, MA
Investment Sub-Advisers
FMR Co., Inc.
Fidelity Management & Research
(U.K.) Inc.
Fidelity Management & Research
(Far East) Inc.
Fidelity International Investment Advisors
Fidelity Investments Japan Limited
Fidelity International Investment Advisors (U.K.) Limited
General Distributor
Fidelity Distributors Corporation
Boston, MA
Transfer and Service Agents
Fidelity Investments Institutional
Operations Company, Inc.
Boston, MA
Fidelity Service Company, Inc.
Boston, MA
Custodian
Citibank, N.A.
New York, NY
ASCP-UANN-0905
1.803713.100
(Fidelity Investment logo)(registered trademark)
Corporate Headquarters
82 Devonshire St., Boston, MA 02109
www.fidelity.com
(Fidelity Investment logo)(registered trademark)
Fidelity Advisor
Small Cap Growth
Fund - Institutional Class
Annual Report
July 31, 2005
Institutional Class
is a class of Fidelity®
Small Cap Growth
Fund
(2_fidelity_logos) (Registered_Trademark)
Contents
Chairman's Message | <Click Here> | Ned Johnson's message to shareholders. |
Performance | <Click Here> | How the fund has done over time. |
Management's Discussion | <Click Here> | The managers' review of fund performance, strategy and outlook |
Shareholder Expense Example | <Click Here> | An example of shareholder expenses. |
Investment Changes | <Click Here> | A summary of the fund's investments. |
Investments | <Click Here> | A complete list of the fund's investments with their market values. |
Financial Statements | <Click Here> | Statements of assets and liabilities, operations, and changes in net assets,
as well as financial highlights. |
Notes | <Click Here> | Notes to the financial statements. |
Report of Independent Registered Public Accounting Firm | <Click Here> | |
Trustees and Officers | <Click Here> | |
Distributions | <Click Here> | |
Board Approval of Investment Advisory Contracts and Management Fees | <Click Here> | |
To view a fund's proxy voting guidelines and proxy voting record for the 12-month period ended June 30, visit www.fidelity.com/proxyvotingresults or visit the Securities and Exchange Commission's (SEC) web site at www.sec.gov. You may also call 1-877-208-0098 to request a free copy of the proxy voting guidelines.
Standard & Poor's, S&P and S&P 500 are registered service marks of The McGraw-Hill Companies, Inc. and have been licensed for use by Fidelity Distributors Corporation.
Other third party marks appearing herein are the property of their respective owners.
All other marks appearing herein are registered or unregistered trademarks or service marks of FMR Corp. or an affiliated company.
Annual Report
This report and the financial statements contained herein are submitted for the general information of the shareholders of the fund. This report is not authorized for distribution to prospective investors in the fund unless preceded or accompanied by an effective prospectus.
A fund files its complete schedule of portfolio holdings with the SEC for the first and third quarters of each fiscal year on Form N-Q. Forms N-Q are available on the SEC's web site at http://www.sec.gov. A fund's Forms N-Q may be reviewed and copied at the SEC's Public Reference Room in Washington, DC. Information regarding the operation of the SEC's Public Reference Room may be obtained by calling 1-800-SEC-0330. For a complete list of a fund's portfolio holdings, view the most recent quarterly holdings report, semiannual report, or annual report on Fidelity's web site at http://www.advisor.fidelity.com.
NOT FDIC INSURED · MAY LOSE VALUE · NO BANK GUARANTEE
Neither the fund nor Fidelity Distributors Corporation is a bank.
Annual Report
Chairman's Message
(photo_of_Edward_C_Johnson_3d)
Dear Shareholder:
During the past year or so, much has been reported about the mutual fund industry, and much of it has been more critical than I believe is warranted. Allegations that some companies have been less than forthright with their shareholders have cast a shadow on the entire industry. I continue to find these reports disturbing, and assert that they do not create an accurate picture of the industry overall. Therefore, I would like to remind everyone where Fidelity stands on these issues. I will say two things specifically regarding allegations that some mutual fund companies were in violation of the Securities and Exchange Commission's forward pricing rules or were involved in so-called "market timing" activities.
First, Fidelity has no agreements that permit customers who buy fund shares after 4 p.m. to obtain the 4 p.m. price. This is not a new policy. This is not to say that someone could not deceive the company through fraudulent acts. However, we are extremely diligent in preventing fraud from occurring in this manner - and in every other. But I underscore again that Fidelity has no so-called "agreements" that sanction illegal practices.
Second, Fidelity continues to stand on record, as we have for years, in opposition to predatory short-term trading that adversely affects shareholders in a mutual fund. Back in the 1980s, we initiated a fee - which is returned to the fund and, therefore, to investors - to discourage this activity. Further, we took the lead several years ago in developing a Fair Value Pricing Policy to prevent market timing on foreign securities in our funds. I am confident we will find other ways to make it more difficult for predatory traders to operate. However, this will only be achieved through close cooperation among regulators, legislators and the industry.
Yes, there have been unfortunate instances of unethical and illegal activity within the mutual fund industry from time to time. That is true of any industry. When this occurs, confessed or convicted offenders should be dealt with appropriately. But we are still concerned about the risk of over-regulation and the quick application of simplistic solutions to intricate problems. Every system can be improved, and we support and applaud well thought out improvements by regulators, legislators and industry representatives that achieve the common goal of building and protecting the value of investors' holdings.
For nearly 60 years, Fidelity has worked very hard to improve its products and service to justify your trust. When our family founded this company in 1946, we had only a few hundred customers. Today, we serve more than 18 million customers including individual investors and participants in retirement plans across America.
Let me close by saying that we do not take your trust in us for granted, and we realize that we must always work to improve all aspects of our service to you. In turn, we urge you to continue your active participation with your financial matters, so that your interests can be well served.
Best regards,
/s/Edward C. Johnson 3d
Edward C. Johnson 3d
Annual Report
Fidelity Advisor Small Cap Growth Fund - Institutional Class
Performance: The Bottom Line
Average annual total return reflects the change in the value of an investment, assuming reinvestment of the class' dividend income and capital gains (the profits earned upon the sale of securities that have grown in value) and assuming a constant rate of performance each year. The $10,000 table and the fund's returns do not reflect the deduction of taxes that a shareholder would pay on fund distributions or the redemption of fund shares. During periods of reimbursement by Fidelity, a fund's total return will be greater than it would be had the reimbursement not occurred. How a fund did yesterday is no guarantee of how it will do tomorrow.
Average annual total returns take Fidelity Advisor Small Cap Growth Fund's cumulative total return and show you what would have happened if Fidelity Advisor Small Cap Growth Fund shares had performed at a constant rate each year. These numbers will be reported once the fund is a year old.
$10,000 Over Life of Fund
Let's say hypothetically that $10,000 was invested in Fidelity Advisor Small Cap Growth Fund - Institutional Class on November 3, 2004, when the fund started. The chart shows how the value of your investment would have changed, and also shows how the Russell 2000® Growth Index performed over the same period.
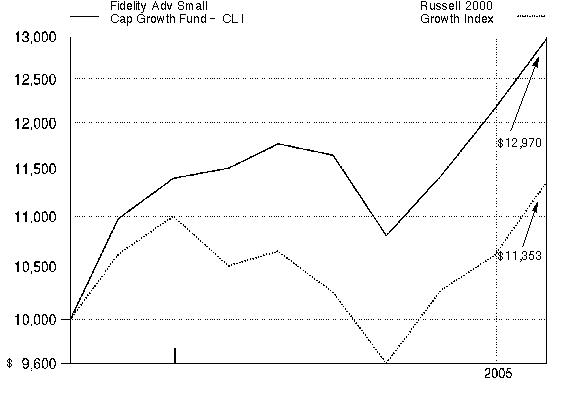
Annual Report
Management's Discussion of Fund Performance
Comments from Jamie Harmon, Lead Portfolio Manager and Lionel Harris and Chuck Myers, Portfolio Managers of Fidelity Advisor Small Cap Growth Fund. The team assumed management of the fund on April 7, 2005.
A late-inning rally on Wall Street helped push some key U.S. equity indexes to four-year highs by the conclusion of the 12-month period ending July 31, 2005. Spurred on by bullish economic data and strong corporate earnings, investors enjoyed a stellar month of July, capping off a turbulent 12-month period for U.S. equity markets. Stock prices bounced up and down during most of the year, moving in cadence with gyrations in the price of crude oil and investors' gathering and ebbing concerns about inflation. The Federal Reserve Board raised short-term interest rates eight times during the period, also affecting overall market sentiment. Despite their fluctuations, the major equity indexes finished on a high note, with the Standard & Poor's 500SM Index and the NASDAQ Composite® Index posting gains of 14.05% and 16.51%, respectively, for the period. The small-cap Russell 2000® Index rose 24.78% and the Russell Midcap® Index jumped 28.93%, while the blue-chips' Dow Jones Industrial AverageSM advanced only 7.29%.
From its inception on November 3, 2004, through July 31, 2005, the fund's Institutional Class shares returned 29.70%. By comparison, the fund's benchmark, the Russell 2000 Growth Index, rose 13.53%. The fund's strong results were driven mainly by positive stock selection in energy, health care and information technology, with sector selection in all three areas playing a lesser but still significant role. Energy names such as Quicksilver Resources and Holly Corp. benefited from continued high oil prices. Also helping was Omnicare, a provider of institutional pharmacy services to nursing homes. Omnicare gained as investors became more confident that the company's profit margins were sustainable and that an acquisition of rival NeighborCare might occur. By contrast, EVCI Career Colleges performed poorly after an earnings shortfall and disclosure of controversial management pay packages. Tempur-Pedic International, a maker of foam mattresses, fell after its widely anticipated new product offering was introduced at a lower price point than expected. Investors discounted the stock because they interpreted this move as an indication of growing competition.
The views expressed in this statement reflect those of the portfolio managers only through the end of the period of the report as stated on the cover and do not necessarily represent the views of Fidelity or any other person in the Fidelity organization. Any such views are subject to change at any time based upon market or other conditions and Fidelity disclaims any responsibility to update such views. These views may not be relied on as investment advice and, because investment decisions for a Fidelity fund are based on numerous factors, may not be relied on as an indication of trading intent on behalf of any Fidelity fund.
Annual Report
Shareholder Expense Example
As a shareholder of the Fund, you incur two types of costs: (1) transaction costs, including sales charges (loads) on purchase payments or redemption proceeds, redemption fees, and (2) ongoing costs, including management fees, distribution and/or service (12b-1) fees and other Fund expenses. This Example is intended to help you understand your ongoing costs (in dollars) of investing in the Fund and to compare these costs with the ongoing costs of investing in other mutual funds.
The Example is based on an investment of $1,000 invested at the beginning of the period and held for the entire period (February 1, 2005 to July 31, 2005).
Actual Expenses
The first line of the table below for each class of the Fund provides information about actual account values and actual expenses. You may use the information in this line, together with the amount you invested, to estimate the expenses that you paid over the period. Simply divide your account value by $1,000.00 (for example, an $8,600 account value divided by $1,000.00 = 8.6), then multiply the result by the number in the first line for a class of the Fund under the heading entitled "Expenses Paid During Period" to estimate the expenses you paid on your account during this period. A small balance maintenance fee of $12.00 that is charged once a year may apply for certain accounts with a value of less than $2,000. This fee is not included in the table below. If it was, the estimate of expenses you paid during the period would be higher, and your ending account value lower, by this amount.
Hypothetical Example for Comparison Purposes
The second line of the table below for each class of the Fund provides information about hypothetical account values and hypothetical expenses based on a Class' actual expense ratio and an assumed rate of return of 5% per year before expenses, which is not the Class' actual return. The hypothetical account values and expenses may not be used to estimate the actual ending account balance or expenses you paid for the period. You may use this information to compare the ongoing costs of investing in the Fund and other funds. To do so, compare this 5% hypothetical example with the 5% hypothetical examples that appear in the shareholder reports of the other funds. A small balance maintenance fee of $12.00 that is charged once a year may apply for certain accounts with a value of less than $2,000. This fee is not included in the table below. If it was, the estimate of expenses you paid during the period would be higher, and your ending account value lower, by this amount.
Annual Report
Shareholder Expense Example - continued
Please note that the expenses shown in the table are meant to highlight your ongoing costs only and do not reflect any transaction costs. Therefore, the second line of the table is useful in comparing ongoing costs only, and will not help you determine the relative total costs of owning different funds. In addition, if these transactional costs were included, your costs would have been higher.
| Beginning
Account Value
February 1, 2005 | Ending
Account Value
July 31, 2005 | Expenses Paid
During Period*
February 1, 2005
to July 31, 2005 |
Class A | | | |
Actual | $ 1,000.00 | $ 1,125.10 | $ 7.59 |
HypotheticalA | $ 1,000.00 | $ 1,017.65 | $ 7.20 |
Class T | | | |
Actual | $ 1,000.00 | $ 1,124.30 | $ 8.90 |
HypotheticalA | $ 1,000.00 | $ 1,016.41 | $ 8.45 |
Class B | | | |
Actual | $ 1,000.00 | $ 1,121.10 | $ 11.52 |
HypotheticalA | $ 1,000.00 | $ 1,013.93 | $ 10.94 |
Class C | | | |
Actual | $ 1,000.00 | $ 1,121.00 | $ 11.36 |
HypotheticalA | $ 1,000.00 | $ 1,014.08 | $ 10.79 |
Small Cap Growth | | | |
Actual | $ 1,000.00 | $ 1,126.70 | $ 6.06 |
HypotheticalA | $ 1,000.00 | $ 1,019.09 | $ 5.76 |
Institutional Class | | | |
Actual | $ 1,000.00 | $ 1,126.80 | $ 6.12 |
HypotheticalA | $ 1,000.00 | $ 1,019.04 | $ 5.81 |
A 5% return per year before expenses
* Expenses are equal to each Class' annualized expense ratio (shown in the table below); multiplied by the average account value over the period, multiplied by 181/365 (to reflect the one-half year period).
| Annualized
Expense Ratio |
Class A | 1.44% |
Class T | 1.69% |
Class B | 2.19% |
Class C | 2.16% |
Small Cap Growth | 1.15% |
Institutional Class | 1.16% |
Annual Report
Investment Changes
Top Ten Stocks as of July 31, 2005 |
| % of fund's
net assets | % of fund's net assets
6 months ago |
Big 5 Sporting Goods Corp. | 3.1 | 1.6 |
Pacific Sunwear of California, Inc. | 2.2 | 1.8 |
Lionbridge Technologies, Inc. | 2.2 | 3.0 |
Abaxis, Inc. | 2.0 | 0.0 |
America Service Group, Inc. | 2.0 | 0.8 |
Monaco Coach Corp. | 2.0 | 0.0 |
Tempur-Pedic International, Inc. | 2.0 | 0.0 |
Aspen Insurance Holdings Ltd. | 2.0 | 0.0 |
Career Education Corp. | 1.9 | 2.3 |
Fossil, Inc. | 1.9 | 0.0 |
| 21.3 | |
Top Five Market Sectors as of July 31, 2005 |
| % of fund's
net assets | % of fund's net assets
6 months ago |
Consumer Discretionary | 27.0 | 20.5 |
Information Technology | 24.1 | 17.6 |
Health Care | 13.3 | 14.5 |
Industrials | 10.0 | 11.9 |
Energy | 9.1 | 16.8 |
Asset Allocation (% of fund's net assets) |
As of July 31, 2005* | As of January 31, 2005** |
| Stocks 96.1% | | | Stocks 90.5% | |
| Short-Term
Investments and
Net Other Assets 3.9% | | | Short-Term
Investments and
Net Other Assets 9.5% | |
* Foreign
investments | 9.9% | | ** Foreign investments | 14.8% | |

Annual Report
Investments July 31, 2005
Showing Percentage of Net Assets
Common Stocks - 96.1% |
| Shares | | Value (Note 1) |
CONSUMER DISCRETIONARY - 27.0% |
Automobiles - 2.0% |
Monaco Coach Corp. | 259,400 | | $ 4,539,500 |
Diversified Consumer Services - 3.5% |
Career Education Corp. (a) | 112,700 | | 4,371,633 |
EVCI Career Colleges, Inc. (a) | 549,491 | | 3,516,742 |
| | 7,888,375 |
Hotels, Restaurants & Leisure - 4.2% |
CEC Entertainment, Inc. (a) | 107,800 | | 4,129,818 |
Ctrip.com International Ltd. sponsored ADR | 30,100 | | 1,667,691 |
Domino's Pizza, Inc. | 68,800 | | 1,721,376 |
Papa John's International, Inc. (a) | 46,800 | | 2,017,080 |
| | 9,535,965 |
Household Durables - 3.2% |
Interface, Inc. Class A (a) | 74,200 | | 757,582 |
Lifetime Brands, Inc. | 88,000 | | 1,980,880 |
Tempur-Pedic International, Inc. (a)(d) | 260,700 | | 4,486,647 |
| | 7,225,109 |
Internet & Catalog Retail - 2.1% |
Blue Nile, Inc. (a)(d) | 56,000 | | 1,862,560 |
Collegiate Pacific, Inc. (d) | 251,300 | | 2,970,366 |
| | 4,832,926 |
Multiline Retail - 0.8% |
Tuesday Morning Corp. | 51,300 | | 1,811,403 |
Specialty Retail - 7.4% |
Big 5 Sporting Goods Corp. | 254,500 | | 7,036,922 |
Finish Line, Inc. Class A | 140,000 | | 2,532,600 |
Genesco, Inc. (a) | 63,000 | | 2,348,010 |
Pacific Sunwear of California, Inc. (a) | 206,000 | | 5,024,340 |
| | 16,941,872 |
Textiles, Apparel & Luxury Goods - 3.8% |
Fossil, Inc. (a) | 180,268 | | 4,288,576 |
Lakeland Industries, Inc. | 23,034 | | 371,769 |
Steven Madden Ltd. (a) | 181,863 | | 4,064,638 |
| | 8,724,983 |
TOTAL CONSUMER DISCRETIONARY | | 61,500,133 |
CONSUMER STAPLES - 1.8% |
Personal Products - 1.8% |
NBTY, Inc. (a) | 169,500 | | 4,101,900 |
Common Stocks - continued |
| Shares | | Value (Note 1) |
ENERGY - 9.1% |
Energy Equipment & Services - 3.4% |
AKITA Drilling Ltd. Class A (non-vtg.) | 59,000 | | $ 804,754 |
Hornbeck Offshore Services, Inc. (a) | 30,000 | | 897,000 |
Maverick Tube Corp. (a) | 88,000 | | 2,918,960 |
Oil States International, Inc. (a) | 55,200 | | 1,632,816 |
Pason Systems, Inc. | 79,600 | | 1,566,840 |
| | 7,820,370 |
Oil, Gas & Consumable Fuels - 5.7% |
Alberta Clipper Energy, Inc. (a) | 46,363 | | 177,977 |
Forest Oil Corp. (a) | 34,000 | | 1,521,840 |
Frontier Oil Corp. | 55,000 | | 1,541,100 |
Holly Corp. | 59,700 | | 2,795,154 |
OMI Corp. | 140,000 | | 2,524,200 |
Quicksilver Resources, Inc. (a) | 46,250 | | 1,959,150 |
Range Resources Corp. | 81,000 | | 2,473,740 |
| | 12,993,161 |
TOTAL ENERGY | | 20,813,531 |
FINANCIALS - 8.1% |
Capital Markets - 1.0% |
optionsXpress Holdings, Inc. | 144,000 | | 2,335,680 |
Commercial Banks - 0.6% |
Cascade Bancorp | 62,100 | | 1,427,058 |
Insurance - 6.5% |
Aspen Insurance Holdings Ltd. | 157,000 | | 4,460,370 |
Hilb Rogal & Hobbs Co. | 90,800 | | 3,077,212 |
IPC Holdings Ltd. | 52,400 | | 2,119,580 |
PXRE Group Ltd. | 75,615 | | 1,928,183 |
USI Holdings Corp. (a) | 238,800 | | 3,062,610 |
| | 14,647,955 |
TOTAL FINANCIALS | | 18,410,693 |
HEALTH CARE - 13.3% |
Health Care Equipment & Supplies - 3.9% |
Abaxis, Inc. (a) | 373,300 | | 4,658,784 |
Nutraceutical International Corp. (a) | 84,388 | | 1,197,466 |
Regeneration Technologies, Inc. (a) | 417,000 | | 3,177,540 |
| | 9,033,790 |
Common Stocks - continued |
| Shares | | Value (Note 1) |
HEALTH CARE - continued |
Health Care Providers & Services - 9.4% |
America Service Group, Inc. (a) | 212,500 | | $ 4,585,750 |
American Dental Partners, Inc. (a) | 46,900 | | 1,292,564 |
AmSurg Corp. (a) | 55,700 | | 1,560,157 |
ICON PLC sponsored ADR (a) | 51,500 | | 2,016,225 |
Molina Healthcare, Inc. (a) | 50,000 | | 1,197,000 |
Omnicare, Inc. | 85,500 | | 3,941,550 |
Pediatrix Medical Group, Inc. (a) | 39,500 | | 3,097,590 |
Per-Se Technologies, Inc. (a) | 46,400 | | 1,070,448 |
VCA Antech, Inc. (a) | 110,800 | | 2,630,392 |
| | 21,391,676 |
TOTAL HEALTH CARE | | 30,425,466 |
INDUSTRIALS - 10.0% |
Aerospace & Defense - 0.7% |
BE Aerospace, Inc. (a) | 96,000 | | 1,682,880 |
Building Products - 0.3% |
Quixote Corp. | 30,100 | | 611,933 |
Commercial Services & Supplies - 1.9% |
Navigant Consulting, Inc. (a) | 100,700 | | 2,014,000 |
PeopleSupport, Inc. | 135,000 | | 1,294,650 |
The Geo Group, Inc. (a) | 33,000 | | 902,550 |
| | 4,211,200 |
Construction & Engineering - 0.9% |
Comfort Systems USA, Inc. (a) | 266,500 | | 2,065,375 |
Electrical Equipment - 1.9% |
C&D Technologies, Inc. | 219,300 | | 2,208,351 |
Genlyte Group, Inc. (a) | 43,000 | | 2,209,340 |
| | 4,417,691 |
Machinery - 2.3% |
Freightcar America, Inc. | 76,600 | | 2,455,796 |
Watts Water Technologies, Inc. Class A | 75,500 | | 2,755,750 |
| | 5,211,546 |
Marine - 0.3% |
Alexander & Baldwin, Inc. | 12,700 | | 679,196 |
Road & Rail - 0.7% |
P.A.M. Transportation Services, Inc. (a) | 91,000 | | 1,497,860 |
Common Stocks - continued |
| Shares | | Value (Note 1) |
INDUSTRIALS - continued |
Trading Companies & Distributors - 1.0% |
WESCO International, Inc. (a) | 70,000 | | $ 2,384,200 |
TOTAL INDUSTRIALS | | 22,761,881 |
INFORMATION TECHNOLOGY - 24.1% |
Communications Equipment - 2.4% |
Avocent Corp. (a) | 51,500 | | 1,795,290 |
Harris Corp. | 97,000 | | 3,595,790 |
| | 5,391,080 |
Computers & Peripherals - 1.8% |
Avid Technology, Inc. (a) | 52,500 | | 2,160,375 |
iCAD, Inc. (a) | 105,300 | | 375,921 |
Mobility Electronics, Inc. (a) | 138,000 | | 1,600,800 |
| | 4,137,096 |
Electronic Equipment & Instruments - 3.4% |
Arrow Electronics, Inc. (a) | 26,200 | | 786,524 |
Cogent, Inc. | 69,000 | | 2,074,830 |
Measurement Specialties, Inc. (a) | 64,200 | | 1,624,260 |
ScanSource, Inc. (a) | 34,500 | | 1,646,685 |
Xyratex Ltd. (a) | 95,000 | | 1,591,250 |
| | 7,723,549 |
Internet Software & Services - 2.6% |
Akamai Technologies, Inc. (a) | 95,800 | | 1,462,866 |
Homestore, Inc. (a) | 340,000 | | 897,600 |
iMergent, Inc. (a) | 100,400 | | 1,139,540 |
j2 Global Communications, Inc. (a) | 59,900 | | 2,402,589 |
| | 5,902,595 |
IT Services - 5.0% |
Lionbridge Technologies, Inc. (a) | 767,146 | | 4,971,106 |
SI International, Inc. (a) | 118,700 | | 3,740,237 |
TALX Corp. | 55,550 | | 2,049,795 |
Tyler Technologies, Inc. (a) | 79,300 | | 629,642 |
| | 11,390,780 |
Office Electronics - 1.0% |
Zebra Technologies Corp. Class A (a) | 60,000 | | 2,340,000 |
Semiconductors & Semiconductor Equipment - 3.7% |
California Micro Devices Corp. (a) | 89,000 | | 582,060 |
Cascade Microtech, Inc. | 121,861 | | 1,630,500 |
Intersil Corp. Class A | 104,000 | | 2,014,480 |
Common Stocks - continued |
| Shares | | Value (Note 1) |
INFORMATION TECHNOLOGY - continued |
Semiconductors & Semiconductor Equipment - continued |
O2Micro International Ltd. (a) | 67,200 | | $ 1,153,152 |
Silicon Laboratories, Inc. (a) | 55,000 | | 1,609,850 |
Tessera Technologies, Inc. (a) | 44,000 | | 1,545,280 |
| | 8,535,322 |
Software - 4.2% |
Blackbaud, Inc. | 156,859 | | 2,243,084 |
Bottomline Technologies, Inc. (a) | 129,000 | | 2,030,460 |
DATATRAK International, Inc. (a)(e) | 10,000 | | 219,500 |
DATATRAK International, Inc. warrants 12/23/07 (a)(e) | 1,500 | | 11,055 |
Moldflow Corp. (a) | 57,000 | | 892,620 |
Phase Forward, Inc. | 386,052 | | 3,092,277 |
SERENA Software, Inc. (a) | 49,000 | | 1,005,480 |
| | 9,494,476 |
TOTAL INFORMATION TECHNOLOGY | | 54,914,898 |
MATERIALS - 1.6% |
Containers & Packaging - 0.5% |
Myers Industries, Inc. | 95,000 | | 1,254,000 |
Metals & Mining - 1.1% |
Apex Silver Mines Ltd. (a) | 31,000 | | 430,280 |
Goldcorp, Inc. | 122,000 | | 1,982,930 |
| | 2,413,210 |
TOTAL MATERIALS | | 3,667,210 |
TELECOMMUNICATION SERVICES - 0.8% |
Diversified Telecommunication Services - 0.8% |
FairPoint Communications, Inc. | 109,000 | | 1,787,600 |
UTILITIES - 0.3% |
Multi-Utilities - 0.3% |
CMS Energy Corp. (a) | 45,000 | | 712,800 |
TOTAL COMMON STOCKS (Cost $199,508,126) | 219,096,112 |
Money Market Funds - 7.1% |
| Shares | | Value (Note 1) |
Fidelity Cash Central Fund, 3.31% (b) | 13,111,943 | | $ 13,111,943 |
Fidelity Securities Lending Cash Central Fund, 3.32% (b)(c) | 3,015,200 | | 3,015,200 |
TOTAL MONEY MARKET FUNDS (Cost $16,127,143) | 16,127,143 |
TOTAL INVESTMENT PORTFOLIO - 103.2% (Cost $215,635,269) | | 235,223,255 |
NET OTHER ASSETS - (3.2)% | | (7,278,885) |
NET ASSETS - 100% | $ 227,944,370 |
Legend |
(a) Non-income producing |
(b) Affiliated fund that is available only to investment companies and other accounts managed by Fidelity Investments. The rate quoted is the annualized seven-day yield of the fund at period end. A complete listing of the fund's holdings as of its most recent quarter end is available upon request. |
(c) Investment made with cash collateral received from securities on loan. |
(d) Security or a portion of the security is on loan at period end. |
(e) Restricted securities - Investment in securities not registered under the Securities Act of 1933 (excluding 144A issues). At the end of the period, the value of restricted securities (excluding 144A issues) amounted to $230,555 or 0.1% of net assets. |
Additional information on each holding is as follows: |
Security | Acquisition Date | Acquisition Cost |
DATATRAK International, Inc. | 12/27/04 | $ 95,000 |
DATATRAK International, Inc. warrants 12/23/07 | 12/27/04 | 0 |
An affiliated company is a company in which the fund has ownership of at least 5% of the voting securities. Companies which are affiliates of the fund at period-end are noted in the fund's Schedule of Investments. Transactions during the period with companies which are or were affiliates are as follows: |
Affiliate | Value,
beginning
of period | Purchases | Sales Proceeds | Dividend Income | Value,
end of
period |
Collegiate Pacific, Inc. | $ - | $ 7,098,636 | $ 3,699,650 | $ 29,840 | $ - |
TOTALS | $ - | $ 7,098,636 | $ 3,699,650 | $ 29,840 | $ - |
See accompanying notes which are an integral part of the financial statements.
Annual Report
Financial Statements
Statement of Assets and Liabilities
| July 31, 2005 |
| | |
Assets | | |
Investment in securities, at value (including securities loaned of $2,995,562) (cost $215,635,269) - See accompanying schedule | | $ 235,223,255 |
Foreign currency held at value (cost $34,077) | | 34,045 |
Receivable for investments sold | | 3,676,503 |
Receivable for fund shares sold | | 6,892,475 |
Dividends receivable | | 4,968 |
Interest receivable | | 40,377 |
Prepaid expenses | | 23,822 |
Receivable from investment adviser for expense reductions | | 1,660 |
Other affiliated receivables | | 76 |
Other receivables | | 57,762 |
Total assets | | 245,954,943 |
| | |
Liabilities | | |
Payable to custodian bank | $ 1,846 | |
Payable for investments purchased | 14,722,078 | |
Payable for fund shares redeemed | 91,405 | |
Accrued management fee | 111,204 | |
Distribution fees payable | 10,809 | |
Other affiliated payables | 33,311 | |
Other payables and accrued expenses | 24,720 | |
Collateral on securities loaned, at value | 3,015,200 | |
Total liabilities | | 18,010,573 |
| | |
Net Assets | | $ 227,944,370 |
Net Assets consist of: | | |
Paid in capital | | $ 205,410,038 |
Accumulated net investment loss | | (14,971) |
Accumulated undistributed net realized gain (loss) on investments and foreign currency transactions | | 2,961,349 |
Net unrealized appreciation (depreciation) on investments and assets and liabilities in foreign currencies | | 19,587,954 |
Net Assets | | $ 227,944,370 |
See accompanying notes which are an integral part of the financial statements.
Annual Report
Statement of Assets and Liabilities - continued
| July 31, 2005 |
| | |
Calculation of Maximum Offering Price
Class A:
Net Asset Value and redemption price per share
($4,719,086 ÷ 364,450 shares) | | $ 12.95 |
| | |
Maximum offering price per share (100/94.25 of $12.95) | | $ 13.74 |
Class T:
Net Asset Value and redemption price per share ($5,239,546 ÷ 405,372 shares) | | $ 12.93 |
| | |
Maximum offering price per share (100/96.50 of $12.93) | | $ 13.40 |
Class B:
Net Asset Value and offering price per share ($2,054,739 ÷ 159,623 shares)A | | $ 12.87 |
| | |
Class C:
Net Asset Value and offering price per share ($8,372,444 ÷ 650,058 shares)A | | $ 12.88 |
| | |
Small Cap Growth:
Net Asset Value, offering price and redemption price per share ($205,652,093 ÷ 15,842,436 shares) | | $ 12.98 |
| | |
Institutional Class:
Net Asset Value, offering price and redemption price per share ($1,906,462 ÷ 146,954 shares) | | $ 12.97 |
A Redemption price per share is equal to net asset value less any applicable contingent deferred sales charge.
See accompanying notes which are an integral part of the financial statements.
Annual Report
Financial Statements - continued
Statement of Operations
| For the period November 3, 2004 (commencement of operations) to July 31, 2005 |
| | |
Investment Income | | |
Dividends (including $29,840 received from affiliated issuers) | | $ 270,319 |
Interest | | 183,813 |
Security lending | | 1,526 |
Total income | | 455,658 |
| | |
Expenses | | |
Management fee | $ 563,759 | |
Transfer agent fees | 179,370 | |
Distribution fees | 48,838 | |
Accounting and security lending fees | 35,102 | |
Independent trustees' compensation | 284 | |
Custodian fees and expenses | 16,621 | |
Registration fees | 88,279 | |
Audit | 31,530 | |
Legal | 91 | |
Miscellaneous | 185 | |
Total expenses before reductions | 964,059 | |
Expense reductions | (73,677) | 890,382 |
Net investment income (loss) | | (434,724) |
Realized and Unrealized Gain (Loss) Net realized gain (loss) on: | | |
Investment securities (Including realized gain (loss) of $(557,638) from affiliated issuers) | 3,383,303 | |
Foreign currency transactions | (2,201) | |
Total net realized gain (loss) | | 3,381,102 |
Change in net unrealized appreciation (depreciation) on: Investment securities | 19,587,986 | |
Assets and liabilities in foreign currencies | (32) | |
Total change in net unrealized appreciation (depreciation) | | 19,587,954 |
Net gain (loss) | | 22,969,056 |
Net increase (decrease) in net assets resulting from operations | | $ 22,534,332 |
See accompanying notes which are an integral part of the financial statements.
Annual Report
Statement of Changes in Net Assets
| For the period November 3, 2004 (commencement
of operations) to
July 31, 2005 |
Increase (Decrease) in Net Assets | |
Operations | |
Net investment income (loss) | $ (434,724) |
Net realized gain (loss) | 3,381,102 |
Change in net unrealized appreciation (depreciation) | 19,587,954 |
Net increase (decrease) in net assets resulting from operations | 22,534,332 |
Share transactions - net increase (decrease) | 205,303,288 |
Redemption fees | 106,750 |
Total increase (decrease) in net assets | 227,944,370 |
| |
Net Assets | |
Beginning of period | - |
End of period (including accumulated net investment loss of $14,971) | $ 227,944,370 |
See accompanying notes which are an integral part of the financial statements.
Annual Report
Financial Highlights - Class A
Year ended July 31, | 2005 F |
Selected Per-Share Data | |
Net asset value, beginning of period | $ 10.00 |
Income from Investment Operations | |
Net investment income (loss) E | (.07) |
Net realized and unrealized gain (loss) | 3.01 |
Total from investment operations | 2.94 |
Redemption fees added to paid in capital E | .01 |
Net asset value, end of period | $ 12.95 |
Total Return B, C, D | 29.50% |
Ratios to Average Net Assets G | |
Expenses before expense reductions | 1.55% A |
Expenses net of voluntary waivers, if any | 1.45% A |
Expenses net of all reductions | 1.36% A |
Net investment income (loss) | (.78)% A |
Supplemental Data | |
Net assets, end of period (000 omitted) | $ 4,719 |
Portfolio turnover rate | 93% A |
A Annualized
B Total returns for periods of less than one year are not annualized.
C Total returns would have been lower had certain expenses not been reduced during the periods shown.
D Total returns do not include the effect of the sales charges.
E Calculated based on average shares outstanding during the period.
F For the period November 3, 2004 (commencement of operations) to July 31, 2005.
G Expense ratios reflect operating expenses of the class. Expenses before reductions do not reflect amounts reimbursed by the investment adviser or reductions from brokerage service arrangements or other expense offset arrangements and do not represent the amount paid by the class during periods when reimbursements or reductions occur. Expense ratios before reductions for start-up periods may not be representative of longer-term operating periods. Expenses net of any voluntary waivers reflect expenses after reimbursement by the investment adviser but prior to reductions from brokerage service arrangements or other expense offset arrangements. Expenses net of all reductions represent the net expenses paid by the class.
See accompanying notes which are an integral part of the financial statements.
Annual Report
Financial Highlights - Class T
Year ended July 31, | 2005 F |
Selected Per-Share Data | |
Net asset value, beginning of period | $ 10.00 |
Income from Investment Operations | |
Net investment income (loss) E | (.09) |
Net realized and unrealized gain (loss) | 3.01 |
Total from investment operations | 2.92 |
Redemption fees added to paid in capital E | .01 |
Net asset value, end of period | $ 12.93 |
Total Return B, C, D | 29.30% |
Ratios to Average Net Assets G | |
Expenses before expense reductions | 1.79% A |
Expenses net of voluntary waivers, if any | 1.70% A |
Expenses net of all reductions | 1.61% A |
Net investment income (loss) | (1.03)% A |
Supplemental Data | |
Net assets, end of period (000 omitted) | $ 5,240 |
Portfolio turnover rate | 93% A |
A Annualized
B Total returns for periods of less than one year are not annualized.
C Total returns would have been lower had certain expenses not been reduced during the periods shown.
D Total returns do not include the effect of the sales charges.
E Calculated based on average shares outstanding during the period.
F For the period November 3, 2004 (commencement of operations) to July 31, 2005.
G Expense ratios reflect operating expenses of the class. Expenses before reductions do not reflect amounts reimbursed by the investment adviser or reductions from brokerage service arrangements or other expense offset arrangements and do not represent the amount paid by the class during periods when reimbursements or reductions occur. Expense ratios before reductions for start-up periods may not be representative of longer-term operating periods. Expenses net of any voluntary waivers reflect expenses after reimbursement by the investment adviser but prior to reductions from brokerage service arrangements or other expense offset arrangements. Expenses net of all reductions represent the net expenses paid by the class.
See accompanying notes which are an integral part of the financial statements.
Annual Report
Financial Highlights - Class B
Year ended July 31, | 2005 F |
Selected Per-Share Data | |
Net asset value, beginning of period | $ 10.00 |
Income from Investment Operations | |
Net investment income (loss) E | (.13) |
Net realized and unrealized gain (loss) | 2.99 |
Total from investment operations | 2.86 |
Redemption fees added to paid in capital E | .01 |
Net asset value, end of period | $ 12.87 |
Total Return B, C, D | 28.70% |
Ratios to Average Net Assets G | |
Expenses before expense reductions | 2.33% A |
Expenses net of voluntary waivers, if any | 2.20% A |
Expenses net of all reductions | 2.11% A |
Net investment income (loss) | (1.53)% A |
Supplemental Data | |
Net assets, end of period (000 omitted) | $ 2,055 |
Portfolio turnover rate | 93% A |
A Annualized
B Total returns for periods of less than one year are not annualized.
C Total returns would have been lower had certain expenses not been reduced during the periods shown.
D Total returns do not include the effect of the contingent deferred sales charge.
E Calculated based on average shares outstanding during the period.
F For the period November 3, 2004 (commencement of operations) to July 31, 2005.
G Expense ratios reflect operating expenses of the class. Expenses before reductions do not reflect amounts reimbursed by the investment adviser or reductions from brokerage service arrangements or other expense offset arrangements and do not represent the amount paid by the class during periods when reimbursements or reductions occur. Expense ratios before reductions for start-up periods may not be representative of longer-term operating periods. Expenses net of any voluntary waivers reflect expenses after reimbursement by the investment adviser but prior to reductions from brokerage service arrangements or other expense offset arrangements. Expenses net of all reductions represent the net expenses paid by the class.
See accompanying notes which are an integral part of the financial statements.
Annual Report
Financial Highlights - Class C
Year ended July 31, | 2005 F |
Selected Per-Share Data | |
Net asset value, beginning of period | $ 10.00 |
Income from Investment Operations | |
Net investment income (loss) E | (.13) |
Net realized and unrealized gain (loss) | 3.00 |
Total from investment operations | 2.87 |
Redemption fees added to paid in capital E | .01 |
Net asset value, end of period | $ 12.88 |
Total Return B, C, D | 28.80% |
Ratios to Average Net Assets G | |
Expenses before expense reductions | 2.24% A |
Expenses net of voluntary waivers, if any | 2.17% A |
Expenses net of all reductions | 2.09% A |
Net investment income (loss) | (1.50)% A |
Supplemental Data | |
Net assets, end of period (000 omitted) | $ 8,372 |
Portfolio turnover rate | 93% A |
A Annualized
B Total returns for periods of less than one year are not annualized.
C Total returns would have been lower had certain expenses not been reduced during the periods shown.
D Total returns do not include the effect of the contingent deferred sales charge.
E Calculated based on average shares outstanding during the period.
F For the period November 3, 2004 (commencement of operations) to July 31, 2005.
G Expense ratios reflect operating expenses of the class. Expenses before reductions do not reflect amounts reimbursed by the investment adviser or reductions from brokerage service arrangements or other expense offset arrangements and do not represent the amount paid by the class during periods when reimbursements or reductions occur. Expense ratios before reductions for start-up periods may not be representative of longer--term operating periods. Expenses net of any voluntary waivers reflect expenses after reimbursement by the investment adviser but prior to reductions from brokerage service arrangements or other expense offset arrangements. Expenses net of all reductions represent the net expenses paid by the class.
See accompanying notes which are an integral part of the financial statements.
Annual Report
Financial Highlights - Small Cap Growth
Year ended July 31, | 2005 E |
Selected Per-Share Data | |
Net asset value, beginning of period | $ 10.00 |
Income from Investment Operations | |
Net investment income (loss) D | (.04) |
Net realized and unrealized gain (loss) | 3.01 |
Total from investment operations | 2.97 |
Redemption fees added to paid in capital D | .01 |
Net asset value, end of period | $ 12.98 |
Total Return B, C | 29.80% |
Ratios to Average Net Assets F | |
Expenses before expense reductions | 1.16% A |
Expenses net of voluntary waivers, if any | 1.16% A |
Expenses net of all reductions | 1.08% A |
Net investment income (loss) | (.49)% A |
Supplemental Data | |
Net assets, end of period (000 omitted) | $ 205,652 |
Portfolio turnover rate | 93% A |
A Annualized
B Total returns for periods of less than one year are not annualized.
C Total returns would have been lower had certain expenses not been reduced during the periods shown.
D Calculated based on average shares outstanding during the period.
E For the period November 3, 2004 (commencement of operations) to July 31, 2005.
F Expense ratios reflect operating expenses of the class. Expenses before reductions do not reflect amounts reimbursed by the investment adviser or reductions from brokerage service arrangements or other expense offset arrangements and do not represent the amount paid by the class during periods when reimbursements or reductions occur. Expense ratios before reductions for start-up periods may not be representative of longer-term operating periods. Expenses net of any voluntary waivers reflect expenses after reimbursement by the investment adviser but prior to reductions from brokerage service arrangements or other expense offset arrangements. Expenses net of all reductions represent the net expenses paid by the class.
See accompanying notes which are an integral part of the financial statements.
Annual Report
Financial Highlights - Institutional Class
Year ended July 31, | 2005 E |
Selected Per-Share Data | |
Net asset value, beginning of period | $ 10.00 |
Income from Investment Operations | |
Net investment income (loss) D | (.04) |
Net realized and unrealized gain (loss) | 3.00 |
Total from investment operations | 2.96 |
Redemption fees added to paid in capital D | .01 |
Net asset value, end of period | $ 12.97 |
Total Return B, C | 29.70% |
Ratios to Average Net Assets F | |
Expenses before expense reductions | 1.20% A |
Expenses net of voluntary waivers, if any | 1.18% A |
Expenses net of all reductions | 1.10% A |
Net investment income (loss) | (.51)% A |
Supplemental Data | |
Net assets, end of period (000 omitted) | $ 1,906 |
Portfolio turnover rate | 93% A |
A Annualized
B Total returns for periods of less than one year are not annualized.
C Total returns would have been lower had certain expenses not been reduced during the periods shown.
D Calculated based on average shares outstanding during the period.
E For the period November 3, 2004 (commencement of operations) to July 31, 2005.
F Expense ratios reflect operating expenses of the class. Expenses before reductions do not reflect amounts reimbursed by the investment adviser or reductions from brokerage service arrangements or other expense offset arrangements and do not represent the amount paid by the class during periods when reimbursements or reductions occur. Expense ratios before reductions for start-up periods may not be representative of longer-term operating periods. Expenses net of any voluntary waivers reflect expenses after reimbursement by the investment adviser but prior to reductions from brokerage service arrangements or other expense offset arrangements. Expenses net of all reductions represent the net expenses paid by the class.
See accompanying notes which are an integral part of the financial statements.
Annual Report
Notes to Financial Statements
For the period ended July 31, 2005
1. Significant Accounting Policies.
Fidelity Small Cap Growth Fund (the fund) is a non-diversified fund of Fidelity Securities Fund (the trust) and is authorized to issue an unlimited number of shares. The trust is registered under the Investment Company Act of 1940, as amended (the 1940 Act), as an open-end management investment company organized as a Massachusetts business trust.
The fund offers Class A, Class T, Class B, Class C, Small Cap Growth, and Institutional Class shares, each of which has equal rights as to assets and voting privileges. Each class has exclusive voting rights with respect to matters that affect that class. Class B shares will automatically convert to Class A shares after a holding period of seven years from the initial date of purchase. Investment income, realized and unrealized capital gains and losses, the common expenses of the fund, and certain fund-level expense reductions, if any, are allocated on a pro rata basis to each class based on the relative net assets of each class to the total net assets of the fund. Each class differs with respect to transfer agent and distribution and service plan fees incurred. Certain expense reductions also differ by class.
The financial statements have been prepared in conformity with accounting principles generally accepted in the United States of America, which require management to make certain estimates and assumptions at the date of the financial statements. The following summarizes the significant accounting policies of the fund:
Security Valuation. Net asset value per share (NAV calculation) is calculated as of the close of business of the New York Stock Exchange, normally 4:00 p.m. Eastern time. Equity securities, including restricted securities, for which market quotations are available are valued at the last sale price or official closing price (closing bid price or last evaluated quote if no sale has occurred) on the primary market or exchange on which they trade. If prices are not readily available or do not accurately reflect fair value for a security, or if a security's value has been materially affected by events occurring after the close of the exchange or market on which the security is principally traded, that security may be valued by another method that the Board of Trustees believes accurately reflects fair value. A security's valuation may differ depending on the method used for determining value. Price movements in futures contracts and ADRs, market and trading trends, the bid/ask quotes of brokers and off-exchange institutional trading may be reviewed in the course of making a good faith determination of a security's fair value. Short-term securities with remaining maturities of sixty days or less for which quotations are not readily available are valued on the basis of amortized cost. Investments in open-end investment companies are valued at their net asset value each business day.
Foreign Currency. The fund uses foreign currency contracts to facilitate transactions in foreign-denominated securities. Losses from these transactions may arise from changes in the value of the foreign currency or if the counterparties do not perform under the contracts' terms.
Annual Report
1. Significant Accounting Policies - continued
Foreign Currency - continued
Foreign-denominated assets, including investment securities, and liabilities are translated into U.S. dollars at the exchange rate at period end. Purchases and sales of investment securities, income and dividends received and expenses denominated in foreign currencies are translated into U.S. dollars at the exchange rate in effect on the transaction date.
The effects of exchange rate fluctuations on investments are included with the net realized and unrealized gain (loss) on investment securities. Other foreign currency transactions resulting in realized and unrealized gain (loss) are disclosed separately.
Investment Transactions and Income. Security transactions are accounted for as of trade date. Gains and losses on securities sold are determined on the basis of identified cost. Dividend income is recorded on the ex-dividend date, except for certain dividends from foreign securities where the ex-dividend date may have passed, which are recorded as soon as the fund is informed of the ex-dividend date. Non-cash dividends included in dividend income, if any, are recorded at the fair market value of the securities received. Interest income is accrued as earned. Interest income includes coupon interest and amortization of premium and accretion of discount on debt securities. Investment income is recorded net of foreign taxes withheld where recovery of such taxes is uncertain.
Expenses. Most expenses of the trust can be directly attributed to a fund. Expenses which cannot be directly attributed are apportioned among each fund in the trust.
Income Tax Information and Distributions to Shareholders. Each year, the fund intends to qualify as a regulated investment company by distributing all of its taxable income and realized gains under Subchapter M of the Internal Revenue Code. As a result, no provision for income taxes is required in the accompanying financial statements. Foreign taxes are provided for based on the fund's understanding of the tax rules and rates that exist in the foreign markets in which it invests.
Distributions are recorded on the ex-dividend date. Income dividends and capital gain distributions are declared separately for each class. Income and capital gain distributions are determined in accordance with income tax regulations, which may differ from generally accepted accounting principles. In addition, the fund will claim a portion of the payment made to redeeming shareholders as a distribution for income tax purposes.
Capital accounts within the financial statements are adjusted for permanent book-tax differences. These adjustments have no impact on net assets or the results of operations. Temporary book-tax differences will reverse in a subsequent period.
Annual Report
Notes to Financial Statements - continued
1. Significant Accounting Policies - continued
Income Tax Information and Distributions to Shareholders - continued
Book-tax differences are primarily due to foreign currency transactions, passive foreign investment companies (PFIC) and losses deferred due to wash sales.
The tax-basis components of distributable earnings and the federal tax cost as of period end were as follows:
Unrealized appreciation | $ 23,649,374 | |
Unrealized depreciation | (4,111,134) | |
Net unrealized appreciation (depreciation) | 19,538,240 | |
Undistributed ordinary income | 2,686,931 | |
| | |
Cost for federal income tax purposes | $ 215,685,015 | |
Short-Term Trading (Redemption) Fees. Shares held in the fund less than 90 days are subject to a redemption fee equal to 1.50% of the proceeds of the redeemed shares. All redemption fees, including any estimated redemption fees paid by Fidelity Management & Research Company (FMR), are retained by the fund and accounted for as an addition to paid in capital.
2. Operating Policies.
Repurchase Agreements. FMR has received an Exemptive Order from the Securities and Exchange Commission (the SEC) which permits the fund and other affiliated entities of FMR to transfer uninvested cash balances into joint trading accounts which are then invested in repurchase agreements. The fund may also invest directly with institutions in repurchase agreements. Repurchase agreements are collateralized by government or non-government securities. Collateral is held in segregated accounts with custodian banks and may be obtained in the event of a default of the counterparty. The fund monitors, on a daily basis, the value of the collateral to ensure it is at least equal to the principal amount of the repurchase agreement (including accrued interest). In the event of a default by the counterparty, realization of the collateral proceeds could be delayed, during which time the value of the collateral may decline.
Restricted Securities. The fund may invest in securities that are subject to legal or contractual restrictions on resale. These securities generally may be resold in transactions exempt from registration or to the public if the securities are registered. Disposal of these securities may involve time-consuming negotiations and expense, and prompt sale at an acceptable price may be difficult. Information regarding restricted securities is included at the end of the fund's Schedule of Investments.
Annual Report
3. Purchases and Sales of Investments.
Purchases and sales of securities, other than short-term securities and U.S. government securities, aggregated $271,874,395 and $75,735,653, respectively.
4. Fees and Other Transactions with Affiliates.
Management Fee. FMR and its affiliates provide the fund with investment management related services for which the fund pays a monthly management fee. The management fee is the sum of an individual fund fee rate that is based on an annual rate of .45% of the fund's average net assets and a group fee rate that averaged .27% during the period. The group fee rate is based upon the average net assets of all the mutual funds advised by FMR. The group fee rate decreases as assets under management increase and increases as assets under management decrease. In addition, the management fee is subject to a performance adjustment (up to a maximum of ±.20% of the fund's average net assets over a 36 month performance period). The upward or downward adjustment to the management fee is based on the fund's relative investment performance as compared to an appropriate benchmark index. The fund's performance adjustment will not take effect until November, 2005. Subsequent months will be added until the performance period includes 36 months. For the period, the total annualized management fee rate was .72% of the fund's average net assets.
Distribution and Service Plan. In accordance with Rule 12b-1 of the 1940 Act, the fund has adopted separate Distribution and Service Plans for each class of shares. Certain classes pay Fidelity Distributors Corporation (FDC), an affiliate of FMR, separate Distribution and Service Fees, each of which is based on an annual percentage of each class' average net assets. In addition, FDC may pay financial intermediaries for selling shares of the fund and providing shareholder support services. For the period, the Distribution and Service Fee rates and the total amounts paid to and retained by FDC were as follows:
| Distribution
Fee | Service
Fee | Paid to
FDC | Retained
by FDC |
Class A | 0% | .25% | $ 4,000 | $ 1,244 |
Class T | .25% | .25% | 10,064 | 2,454 |
Class B | .75% | .25% | 9,067 | 8,060 |
Class C | .75% | .25% | 25,707 | 11,363 |
| | | $ 48,838 | $ 23,121 |
Sales Load. FDC receives a front-end sales charge of up to 5.75% for selling Class A shares, and 3.50% for selling Class T shares, some of which is paid to financial intermediaries for selling shares of the fund. FDC receives the proceeds of contingent deferred sales charges levied on Class A, Class T, Class B, and Class C redemptions. These charges
Annual Report
Notes to Financial Statements - continued
4. Fees and Other Transactions with Affiliates - continued
Sales Load - continued
depend on the holding period. The deferred sales charges range from 5% to 1% for Class B, 1% for Class C, and .25% for certain purchases of Class A and Class T shares.
For the period, sales charge amounts retained by FDC were as follows:
| Retained
by FDC | |
Class A | $ 10,726 | |
Class T | 2,528 | |
Class B* | 1,092 | |
Class C* | 205 | |
| $ 14,551 | |
* When Class B and Class C shares are initially sold, FDC pays commissions from its own resources to financial intermediaries through which the sales are made.
Transfer Agent Fees. Fidelity Investments Institutional Operations Company, Inc. (FIIOC), an affiliate of FMR, is the transfer, dividend disbursing and shareholder servicing agent for each class of the fund, except for Small Cap Growth. Fidelity Service Company, Inc. (FSC), an affiliate of FMR, is the transfer agent for Small Cap Growth shares. FIIOC and FSC receive account fees and asset-based fees that vary according to the account size and type of account of the shareholders of the respective classes of the fund. FIIOC and FSC pay for typesetting, printing and mailing of shareholder reports, except proxy statements. For the period the total transfer agent fees paid by each class to FIIOC or FSC, were as follows:
| Amount | % of
Average
Net Assets |
Class A | $ 5,363 | .33 * |
Class T | 6,337 | .31 * |
Class B | 3,035 | .33 * |
Class C | 8,123 | .32 * |
Small Cap Growth | 154,713 | .22 * |
Institutional Class | 1,799 | .19 * |
| $ 179,370 | |
* Annualized
Accounting and Security Lending Fees. FSC maintains the fund's accounting records. The accounting fee is based on the level of average net assets for the month. Under a separate contract, FSC administers the security lending program. The security lending fee is based on the number and duration of lending transactions.
Annual Report
4. Fees and Other Transactions with Affiliates - continued
Central Funds. The fund may invest in affiliated Central Funds managed by Fidelity Investments Money Management, Inc. (FIMM), an affiliate of FMR. The Central Funds are open-end investment companies available only to investment companies and other accounts managed by FMR and its affiliates. The Money Market Central Funds seek preservation of capital and current income. The Central Funds do not pay a management fee. Income distributions earned by the fund are recorded as income in the accompanying financial statements and totaled $51,594 for the period.
Brokerage Commissions. The fund placed a portion of its portfolio transactions with brokerage firms which are affiliates of the investment adviser. The commissions paid to these affiliated firms were $22,836 for the period.
5. Committed Line of Credit.
The fund participates with other funds managed by FMR in a $4.2 billion credit facility (the "line of credit") to be utilized for temporary or emergency purposes to fund shareholder redemptions or for other short-term liquidity purposes. The fund has agreed to pay commitment fees on its pro rata portion of the line of credit. During the period, there were no borrowings on this line of credit.
6. Security Lending.
The fund lends portfolio securities from time to time in order to earn additional income. The fund receives collateral (in the form of U.S. Treasury obligations, letters of credit and/or cash) against the loaned securities and maintains collateral in an amount not less than 100% of the market value of the loaned securities during the period of the loan. The market value of the loaned securities is determined at the close of business of the fund and any additional required collateral is delivered to the fund on the next business day. If the borrower defaults on its obligation to return the securities loaned because of insolvency or other reasons, a fund could experience delays and costs in recovering the securities loaned or in gaining access to the collateral. Cash collateral is invested in the Fidelity Securities Lending Cash Central Fund. The value of loaned securities and cash collateral at period end are disclosed on the fund's Statement of Assets and Liabilities.
7. Expense Reductions.
FMR voluntarily agreed to reimburse each class to the extent annual operating expenses exceeded certain levels of average net assets as noted in the table below. Some expenses, for example interest expense, are excluded from this reimbursement.
Annual Report
Notes to Financial Statements - continued
7. Expense Reductions - continued
The following classes were in reimbursement during the period:
| Expense
Limitations | Reimbursement
from adviser |
Class A | 1.50% - 1.40% * | $ 1,731 |
Class T | 1.75% - 1.65% * | 1,875 |
Class B | 2.25% - 2.15% * | 1,244 |
Class C | 2.25% - 2.15% * | 1,848 |
Institutional Class | 1.25% - 1.15% * | 134 |
| | $ 6,832 |
* Expense limitation in effect at period end.
Many of the brokers with whom FMR places trades on behalf of the fund provided services to the fund in addition to trade execution. These services included payments of certain expenses on behalf of the fund totaling $66,694 for the period. In addition, through arrangements with the fund's custodian, credits realized as a result of uninvested cash balances were used to reduce the fund's expenses. During the period, these credits reduced the fund's custody expenses by $151.
8. Other.
The fund's organizational documents provide former and current trustees and officers with a limited indemnification against liabilities arising in connection with the performance of their duties to the fund. In the normal course of business, the fund may also enter into contracts that provide general indemnifications. The fund's maximum exposure under these arrangements is unknown as this would be dependent on future claims that may be made against the fund. The risk of material loss from such claims is considered remote.
Annual Report
9. Share Transactions.
Transactions for each class of shares were as follows:
| Shares | Dollars |
| For the period
November 3, 2004 (commencement
of sale of shares) to July 31, 2005 | For the period
November 3, 2004 (commencement
of sale of shares) to
July 31, 2005 |
Class A | | |
Shares sold | 377,650 | $ 4,304,515 |
Shares redeemed | (13,200) | (157,404) |
Net increase (decrease) | 364,450 | $ 4,147,111 |
Class T | | |
Shares sold | 432,704 | $ 4,904,069 |
Shares redeemed | (27,332) | (327,972) |
Net increase (decrease) | 405,372 | $ 4,576,097 |
Class B | | |
Shares sold | 169,626 | $ 1,864,130 |
Shares redeemed | (10,003) | (113,030) |
Net increase (decrease) | 159,623 | $ 1,751,100 |
Class C | | |
Shares sold | 664,094 | $ 7,429,424 |
Shares redeemed | (14,036) | (166,606) |
Net increase (decrease) | 650,058 | $ 7,262,818 |
Small Cap Growth | | |
Shares sold | 18,162,749 | $ 212,509,370 |
Shares redeemed | (2,320,313) | (26,565,039) |
Net increase (decrease) | 15,842,436 | $ 185,944,331 |
Institutional Class | | |
Shares sold | 170,585 | $ 1,883,777 |
Shares redeemed | (23,631) | (261,946) |
Net increase (decrease) | 146,954 | $ 1,621,831 |
Annual Report
Report of Independent Registered Public Accounting Firm
To the Trustees of Fidelity Securities Fund and the Shareholders of Fidelity Small Cap Growth Fund:
In our opinion, the accompanying statement of assets and liabilities, including the schedule of investments, and the related statements of operations and of changes in net assets and the financial highlights present fairly, in all material respects, the financial position of Fidelity Small Cap Growth Fund (a fund of Fidelity Securities Fund) at July 31, 2005 and the results of its operations, the changes in its net assets and the financial highlights for the periods indicated, in conformity with accounting principles generally accepted in the United States of America. These financial statements and financial highlights (hereafter referred to as "financial statements") are the responsibility of the Fidelity Small Cap Growth Fund's management; our responsibility is to express an opinion on these financial statements based on our audit. We conducted our audit of these financial statements in accordance with the standards of the Public Company Accounting Oversight Board (United States). Those standards require that we plan and perform the audit to obtain reasonable assurance about whether the financial statements are free of material misstatement. An audit includes examining, on a test basis, evidence supporting the amounts and disclosures in the financial statements, assessing the accounting principles used and significant estimates made by management, and evaluating the overall financial statement presentation. We believe that our audit, which included confirmation of securities at July 31, 2005 by correspondence with the custodian and brokers, provides a reasonable basis for our opinion.
/s/ PricewaterhouseCoopers LLP
PricewaterhouseCoopers LLP
Boston, Massachusetts
September 9, 2005
Annual Report
Trustees and Officers
The Trustees, Members of the Advisory Board, and executive officers of the trust and funds, as applicable, are listed below. The Board of Trustees governs each fund and is responsible for protecting the interests of shareholders. The Trustees are experienced executives who meet periodically throughout the year to oversee each fund's activities, review contractual arrangements with companies that provide services to each fund, and review each fund's performance. Except for William O. McCoy, Stephen P. Jonas, and Kenneth L. Wolfe, each of the Trustees oversees 320 funds advised by FMR or an affiliate. Mr. McCoy oversees 322 funds advised by FMR or an affiliate. Mr. Jonas and Mr. Wolfe oversee 311 funds advised by FMR or an affiliate.
The Trustees hold office without limit in time except that (a) any Trustee may resign; (b) any Trustee may be removed by written instrument, signed by at least two-thirds of the number of Trustees prior to such removal; (c) any Trustee who requests to be retired or who has become incapacitated by illness or injury may be retired by written instrument signed by a majority of the other Trustees; and (d) any Trustee may be removed at any special meeting of shareholders by a two-thirds vote of the outstanding voting securities of the trust. Each Trustee who is not an interested person (as defined in the 1940 Act) (Independent Trustee), shall retire not later than the last day of the calendar year in which his or her 72nd birthday occurs. The Independent Trustees may waive this mandatory retirement age policy with respect to individual Trustees. The executive officers and Advisory Board Members hold office without limit in time, except that any officer and Advisory Board Member may resign or may be removed by a vote of a majority of the Trustees at any regular meeting or any special meeting of the Trustees. Except as indicated, each individual has held the office shown or other offices in the same company for the past five years.
The funds' Statement of Additional Information (SAI) includes more information about the Trustees. To request a free copy, call Fidelity at 1-800-544-8544.
Interested Trustees*:
Correspondence intended for each Trustee who is an interested person may be sent to Fidelity Investments, 82 Devonshire Street, Boston, Massachusetts 02109.
Name, Age; Principal Occupation |
Edward C. Johnson 3d (75)** |
| Year of Election or Appointment: 1984 Mr. Johnson is Chairman of the Board of Trustees. Mr. Johnson serves as Chief Executive Officer, Chairman, and a Director of FMR Corp.; a Director and Chairman of the Board and of the Executive Committee of FMR; Chairman and a Director of Fidelity Management & Research (Far East) Inc.; Chairman and a Director of Fidelity Investments Money Management, Inc.; and Chairman (2001-present) and a Director (2000-present) of FMR Co., Inc. |
Abigail P. Johnson (43)** |
| Year of Election or Appointment: 2001 Ms. Johnson serves as President of Fidelity Employer Services Company (FESCO) (2005-present). She is President and a Director of Fidelity Investments Money Management, Inc. (2001-present), FMR Co., Inc. (2001-present), and a Director of FMR Corp. Previously, Ms. Johnson served as President and a Director of FMR (2001-2005), Senior Vice President of the Fidelity funds (2001-2005), and managed a number of Fidelity funds. |
Stephen P. Jonas (52) |
| Year of Election or Appointment: 2005 Mr. Jonas is Senior Vice President of the fund (2005-present). He also serves as a Senior Vice President of other Fidelity funds (2005-present). Mr. Jonas is Executive Director of FMR (2005-present). Previously, Mr. Jonas served as President of Fidelity Enterprise Operations and Risk Services (2004-2005), Chief Administrative Officer (2002-2004), and Chief Financial Officer of FMR Co. (1998-2000). Mr. Jonas has been with Fidelity Investments since 1987 and has held various financial and management positions including Chief Financial Officer of FMR. In addition, he serves on the Boards of Boston Ballet (2003-present) and Simmons College (2003-present). |
Robert L. Reynolds (53) |
| Year of Election or Appointment: 2003 Mr. Reynolds is a Director (2003-present) and Chief Operating Officer (2002-present) of FMR Corp. He also serves on the Board at Fidelity Investments Canada, Ltd. (2000-present). Previously, Mr. Reynolds served as President of Fidelity Investments Institutional Retirement Group (1996-2000). |
* Trustees have been determined to be "Interested Trustees" by virtue of, among other things, their affiliation with the trust or various entities under common control with FMR.
** Edward C. Johnson 3d, Trustee, is Abigail P. Johnson's father.
Annual Report
Independent Trustees:
Correspondence intended for each Independent Trustee (that is, the Trustees other than the Interested Trustees) may be sent to Fidelity Investments, P.O. Box 55235, Boston, Massachusetts 02205-5235.
Name, Age; Principal Occupation |
Dennis J. Dirks (57) |
| Year of Election or Appointment: 2005 Prior to his retirement in May 2003, Mr. Dirks was Chief Operating Officer and a member of the Board of The Depository Trust & Clearing Corporation (DTCC) (1999-2003). He also served as President, Chief Operating Officer, and Board member of The Depository Trust Com-pany (DTC) (1999-2003) and President and Board member of the National Securities Clearing Corporation (NSCC) (1999-2003). In addition, Mr. Dirks served as Chief Executive Officer and Board member of the Government Securities Clearing Corporation (2001-2003) and Chief Executive Officer and Board member of the Mortgage-Backed Securities Clearing Corporation (2001-2003). Mr. Dirks also serves as a Tustee of Manhattan College (2005-present). |
Robert M. Gates (61) |
| Year of Election or Appointment: 1997 Dr. Gates is Vice Chairman of the Independent Trustees (2005-present). Dr. Gates is President of Texas A&M University (2002-present). He was Director of the Central Intelligence Agency (CIA) from 1991 to 1993. From 1989 to 1991, Dr. Gates served as Assistant to the President of the United States and Deputy National Security Advisor. Dr. Gates is a Director of NACCO Industries, Inc. (mining and manufacturing), Parker Drilling Co., Inc. (drilling and rental tools for the energy industry, 2001-present), and Brinker International (restaurant management, 2003-present). Previously, Dr. Gates served as a Director of LucasVarity PLC (automotive components and diesel engines), a Director of TRW Inc. (automotive, space, defense, and information technology), and Dean of the George Bush School of Government and Public Service at Texas A&M University (1999-2001). Dr. Gates also is a Trustee of the Forum for International Policy. |
George H. Heilmeier (69) |
| Year of Election or Appointment: 2004 Dr. Heilmeier is Chairman Emeritus of Telcordia Technologies (communication software and systems), where prior to his retirement, he served as company Chairman and Chief Executive Officer. He currently serves on the Boards of Directors of The Mitre Corporation (systems engineering and information technology support for the government), and HRL Laboratories (private research and development, 2004-present). He is Chairman of the General Motors Science & Technology Advisory Board and a Life Fellow of the Institute of Electrical and Electronics Engineers (IEEE) (2000-present). Dr. Heilmeier is a member of the Defense Science Board and the National Security Agency Advisory Board. He is also a member of the National Academy of Engineering, the American Academy of Arts and Sciences, and the Board of Overseers of the School of Engineering and Applied Science of the University of Pennsylvania. Previously, Dr. Heilmeier served as a Director of TRW Inc. (automotive, space, defense, and information technology, 1992-2002), Compaq (1994-2002), Automatic Data Processing, Inc. (ADP) (technology-based business outsourcing, 1995-2002), INET Tech-nologies Inc. (telecommunications network surveillance, 2001-2004), and Teletech Holdings (customer management services). He is the recipient of the 2005 Kyoto Prize in Advanced Technology for his invention of the liquid display. |
Marie L. Knowles (58) |
| Year of Election or Appointment: 2001 Prior to Ms. Knowles' retirement in June 2000, she served as Executive Vice President and Chief Financial Officer of Atlantic Richfield Company (ARCO) (diversified energy, 1996-2000). From 1993 to 1996, she was a Senior Vice President of ARCO and President of ARCO Transportation Company. She served as a Director of ARCO from 1996 to 1998. She currently serves as a Director of Phelps Dodge Corporation (copper mining and manufacturing) and McKesson Corporation (healthcare service, 2002-present). Ms. Knowles is a Trustee of the Brookings Institution and the Catalina Island Conservancy and also serves as a member of the Advisory Board for the School of Engineering of the University of Southern California. |
Ned C. Lautenbach (61) |
| Year of Election or Appointment: 2000 Mr. Lautenbach has been a partner of Clayton, Dubilier & Rice, Inc. (private equity investment firm) since September 1998. Previously, Mr. Lautenbach was with the International Business Machines Corporation (IBM) from 1968 until his retirement in 1998. Mr. Lautenbach serves as a Director of Italtel Holding S.p.A. (telecommunications (Milan, Italy), 2004-present) and Eaton Corporation (diversified industrial) as well as the Philharmonic Center for the Arts in Naples, Florida. He also is a member of the Board of Trustees of Fairfield University (2005-present), as well as a member of the Council on Foreign Relations. |
Marvin L. Mann (72) |
| Year of Election or Appointment: 1993 Mr. Mann is Chairman of the Independent Trustees (2001-present). He is Chairman Emeritus of Lexmark International, Inc. (computer peripherals), where he served as CEO until April 1998, retired as Chairman May 1999, and remains a member of the Board. Prior to 1991, he held the positions of Vice President of International Business Machines Corporation (IBM) and President and General Manager of various IBM divisions and subsidiaries. He is a member of the Executive Committee of the Independent Director's Council of the Investment Company Institute. In addition, Mr. Mann is a member of the President's Cabinet at the University of Alabama and the Board of Visitors of the Culverhouse College of Commerce and Business Administration at the University of Alabama. |
William O. McCoy (71) |
| Year of Election or Appointment: 1997 Prior to his retirement in December 1994, Mr. McCoy was Vice Chairman of the Board of BellSouth Corporation (telecommunications) and President of BellSouth Enterprises. He is currently a Director of Liberty Corporation (holding company), Duke Realty Corporation (real estate), and Progress Energy, Inc. (electric utility). He is also a partner of Franklin Street Partners (private investment management firm) and a member of the Research Triangle Foundation Board. In addition, Mr. McCoy served as the Interim Chancellor (1999-2000) and a member of the Board of Visitors for the University of North Carolina at Chapel Hill and currently serves on the Board of Directors of the University of North Carolina Health Care System and the Board of Visitors of the Kenan-Flagler Business School (University of North Carolina at Chapel Hill). He also served as Vice President of Finance for the University of North Carolina (16-school system). |
Cornelia M. Small (61) |
| Year of Election or Appointment: 2005 Ms. Small is a member (2000-present) and Chairperson (2002-present) of the Investment Committee, and a member (2002-present) of the Board of Trustees of Smith College. Previously, she served as Chief Investment Officer (1999-2000), Director of Global Equity Investments (1996-1999), and a member of the Board of Directors of Scudder, Stevens & Clark (1990-1997) and Scudder Kemper Investments (1997-1998). In addition, Ms. Small served as Co-Chair (2000-2003) of the Annual Fund for the Fletcher School of Law and Diplomacy. |
William S. Stavropoulos (66) |
| Year of Election or Appointment: 2002 Mr. Stavropoulos is Chairman of the Board (2000-present) and a Member of the Board of Directors of The Dow Chemical Company. Since joining The Dow Chemical Company in 1967, Mr. Stavropoulos served in numerous senior management positions, including President (1993-2000; 2002-2003), CEO (1995-2000; 2002-2004), and Chairman of the Executive Committee (2000-2004). Currently, he is a Director of NCR Corporation (data warehousing and technology solutions), BellSouth Corporation (telecommunications), Chemical Financial Corporation, and Maersk Inc. (industrial conglomerate, 2002-present), and Metalmark Capital (private equity investment firm, 2005-present). He also serves as a member of the Board of Trustees of the American Enterprise Institute for Public Policy Research. In addition, Mr. Stavropoulos is a member of The Business Council, J.P. Morgan International Council and the University of Notre Dame Advisory Council for the College of Science. |
Kenneth L. Wolfe (66) |
| Year of Election or Appointment: 2005 Mr. Wolfe also serves as a Trustee (2005-present) or Member of the Advisory Board (2004-present) of other investment companies advised by FMR. Prior to his retirement in 2001, Mr. Wolfe was Chairman and Chief Executive Officer of Hershey Foods Corporation (1993-2001). He currently serves as a member of the boards of Adelphia Communications Corporation (2003-present), Bausch & Lomb, Inc., and Revlon Inc. (2004-present). |
Annual Report
Advisory Board Members and Executive Officers:
Correspondence intended for Mr. Gamper may be sent to Fidelity Investments, P.O. Box 55235, Boston, Massachusetts 02205-5235. Correspondence intended for each executive officer and Mr. Lynch may be sent to Fidelity Investments, 82 Devonshire Street, Boston, Massachusetts 02109.
Name, Age; Principal Occupation |
Albert R. Gamper, Jr. (63) |
| Year of Election or Appointment: 2005 Member of the Advisory Board of Fidelity Securities Fund. Prior to his retirement in December 2004, Mr. Gamper served as Chairman of the Board of CIT Group Inc. (commercial finance). During his tenure with CIT Group Inc. Mr. Gamper served in numerous senior management positions, including Chairman (1987-1989; 1999-2001; 2002-2004), Chief Executive Officer (1987-2004), and President (1989-2002). He currently serves as a member of the Board of Directors of Public Service Enterprise Group (utilities, 2001-present), Chairman of the Board of Governors, Rutgers University (2004-present), and Chairman of the Board of Saint Barnabas Health Care System. |
Peter S. Lynch (62) |
| Year of Election or Appointment: 2003 Member of the Advisory Board of Fidelity Securities Fund. Vice Chairman and a Director of FMR, and Vice Chairman (2001-present) and a Director (2000-present) of FMR Co., Inc. Previously, Mr. Lynch served as a Trustee of the Fidelity funds (1990-2003). In addition, he serves as a Trustee of Boston College, Massachusetts Eye & Ear Infirmary, Historic Deerfield, John F. Kennedy Library, and the Museum of Fine Arts of Boston. |
Dwight D. Churchill (51) |
| Year of Election or Appointment: 2005 Vice President of the fund. Mr. Churchill also serves as Vice President of certain Equity Funds (2005-present) and certain High Income Funds (2005-present). Previously, he served as Head of Fidelity's Fixed-Income Division (2000-2005), Vice President of Fidelity's Bond Funds, and Senior Vice President of FIMM (2000) and FMR. Mr. Churchill joined Fidelity in 1993 as Vice President and Group Leader of Taxable Fixed-Income Investments. |
James M. Harmon (34) |
| Year of Election or Appointment: 2005 Vice President of the fund. He also manages other Fidelity funds, and has worked as a research analyst, portfolio assistant and portfolio manager. |
Eric D. Roiter (56) |
| Year of Election or Appointment: 2004 Secretary of the fund. He also serves as Secretary of other Fidelity funds; Vice President, General Counsel, and Secretary of FMR Co., Inc. (2001-present) and FMR; Assistant Secretary of Fidelity Management & Research (U.K.) Inc. (2001-present), Fidelity Management & Research (Far East) Inc. (2001-present), and Fidelity Investments Money Management, Inc. (2001-present). Mr. Roiter is an Adjunct Member, Faculty of Law, at Boston College Law School (2003-present). Previously, Mr. Roiter served as Vice President and Secretary of FDC (1998-2005). |
Stuart Fross (45) |
| Year of Election or Appointment: 2004 Assistant Secretary of the fund. Mr. Fross also serves as Assistant Secretary of other Fidelity funds (2003-present), Vice President and Secretary of FDC (2005-present), and is an employee of FMR. |
Christine Reynolds (46) |
| Year of Election or Appointment: 2004 President, Treasurer, and Anti-Money Laundering (AML) officer of the fund. Ms. Reynolds also serves as President, Treasurer, and AML officer of other Fidelity funds (2004) and is a Vice President (2003) and an employee (2002) of FMR. Before joining Fidelity Investments, Ms. Reynolds worked at PricewaterhouseCoopers LLP (PwC) (1980-2002), where she was most recently an audit partner with PwC's investment management practice. |
Timothy F. Hayes (54) |
| Year of Election or Appointment: 2004 Chief Financial Officer of the fund. Mr. Hayes also serves as Chief Financial Officer of other Fidelity funds (2002). Mr. Hayes also serves as Chief Financial Officer of other Fidelity funds (2002-present) and President of Fidelity Investment Operations (2005-present) which includes Fidelity Pricing and Cash Management Services Group (FPCMS), where he served as President (1998-2005). Mr. Hayes serves as President of Fidelity Service Company (2003-present) where he also serves as a Director. Mr. Hayes also served as President of Fidelity Investments Operations Group (FIOG, 2002-2005). |
Kenneth A. Rathgeber (58) |
| Year of Election or Appointment: 2004 Chief Compliance Officer of the fund. Mr. Rathgeber also serves as Chief Compliance Officer of other Fidelity funds (2004) and Executive Vice President of Risk Oversight for Fidelity Investments (2002). Previously, he served as Executive Vice President and Chief Operating Officer for Fidelity Investments Institutional Services Company, Inc. (1998-2002). |
John R. Hebble (47) |
| Year of Election or Appointment: 2004 Deputy Treasurer of the fund. Mr. Hebble also serves as Deputy Treasurer of other Fidelity funds (2003), and is an employee of FMR. Before joining Fidelity Investments, Mr. Hebble worked at Deutsche Asset Management where he served as Director of Fund Accounting (2002-2003) and Assistant Treasurer of the Scudder Funds (1998-2003). |
Bryan A. Mehrmann (44) |
| Year of Election or Appointment: 2005 Deputy Treasurer of the fund. Mr. Mehrmann also serves as Deputy Treasurer of other Fidelity funds (2005-present) and is an employee of FMR. Previously, Mr. Mehrmann served as Vice President of Fidelity Investments Institutional Services Group (FIIS)/Fidelity Investments Institutional Operations Corporation, Inc. (FIIOC) Client Services (1998-2004). |
Kimberley H. Monasterio (41) |
| Year of Election or Appointment: 2004 Deputy Treasurer of the fund. Ms. Monasterio also serves as Deputy Treasurer of other Fidelity funds (2004) and is an employee of FMR (2004). Before joining Fidelity Investments, Ms. Monasterio served as Treasurer (2000-2004) and Chief Financial Officer (2002-2004) of the Franklin Templeton Funds and Senior Vice President of Franklin Templeton Services, LLC (2000-2004). |
Kenneth B. Robins (35) |
| Year of Election or Appointment: 2005 Deputy Treasurer of the fund. Mr. Robins also serves as Deputy Treasurer of other Fidelity funds (2005-present) and is an employee of FMR (2004-present). Before joining Fidelity Investments, Mr. Robins worked at KPMG LLP, where he was a partner in KPMG's department of professional practice (2002-2004) and a Senior Manager (1999-2000). In addition, Mr. Robins served as Assistant Chief Accountant, United States Securities and Exchange Commission (2000-2002). |
Robert G. Byrnes (38) |
| Year of Election or Appointment: 2005 Assistant Treasurer of the fund. Mr. Byrnes also serves as Assistant Treasurer of other Fidelity funds (2005-present) and is an employee of FMR (2005-present). Previously, Mr. Byrnes served as Vice President of FPCMS (2003-2005). Before joining Fidelity Investments, Mr. Byrnes worked at Deutsche Asset Management where he served as Vice President of the Investment Operations Group (2000-2003). |
John H. Costello (58) |
| Year of Election or Appointment: 2004 Assistant Treasurer of the fund. Mr. Costello also serves as Assistant Treasurer of other Fidelity funds and is an employee of FMR. |
Peter L. Lydecker (51) |
| Year of Election or Appointment: 2004 Assistant Treasurer of the fund. Mr. Lydecker also serves as Assistant Treasurer of other Fidelity funds (2004) and is an employee of FMR. |
Mark Osterheld (50) |
| Year of Election or Appointment: 2004 Assistant Treasurer of the fund. Mr. Osterheld also serves as Assistant Treasurer of other Fidelity funds (2002) and is an employee of FMR. |
Gary W. Ryan (46) |
| Year of Election or Appointment: 2005 Assistant Treasurer of the fund. Mr. Ryan also serves as Assistant Treasurer of other Fidelity funds (2005-present) and is an employee of FMR (2005-present). Previously, Mr. Ryan served as Vice President of Fund Reporting in FPCMS (1999-2005). |
Salvatore Schiavone (39) |
| Year of Election or Appointment: 2005 Assistant Treasurer of the fund. Mr. Schiavone also serves as Assistant Treasurer of other Fidelity funds (2005-present) and is an employee of FMR (2005-present). Before joining Fidelity Investments, Mr. Schiavone worked at Deutsche Asset Management, where he most recently served as Assistant Treasurer (2003-2005) of the Scudder Funds and Vice President and Head of Fund Reporting (1996-2003). |
Annual Report
Distributions
The Board of Trustees of Advisor Small Cap Growth Fund voted to pay to shareholders of record at the opening of business on record date, the following distributions per share derived from capital gains realized from sales of portfolio securities:
| Pay Date | Record Date | Capital Gains |
Institutional Class | 09/12/2005 | 09/09/2005 | $0.135 |
Annual Report
Board Approval of Investment Advisory Contracts and Management Fees
Fidelity Small Cap Growth Fund
Each year, typically in July, the Board of Trustees, including the independent Trustees (together, the Board), votes on the renewal of the management contract and sub-advisory agreements (together, the Advisory Contracts) for the fund. The Board, assisted by the advice of fund counsel and independent Trustees' counsel, requests and considers a broad range of information throughout the year.
The Board meets regularly each month except August and takes into account throughout the year matters bearing on Advisory Contracts. The Board, acting directly and through its separate committees, considers at each of its meetings factors that are relevant to the annual renewal of the fund's Advisory Contracts, including the services and support provided to the fund and its shareholders by Fidelity. At the time of the renewal, the Board had 11 standing committees, each composed of independent Trustees with varying backgrounds, to which the Board has assigned specific subject matter responsibilities in order to enhance effective decision-making by the Board. Each committee has adopted a written charter outlining the structure and purposes of the committee. One such committee, the Equity Contract Committee, meets periodically during the first six months of each year and as necessary to consider matters specifically related to the annual renewal of Advisory Contracts. The committee requests and receives information on, and makes recommendations to the independent Trustees concerning, the approval and annual review of the Advisory Contracts.
At its July 2005 meeting, the Board of Trustees, including the independent Trustees, unanimously determined to renew the Advisory Contracts for the fund. In reaching its determination, the Board considered all factors it believed relevant, including (1) the nature, extent, and quality of the services to be provided to the fund and its shareholders by Fidelity (including the investment performance of the fund); (2) the competitiveness of the management fee and total expenses of the fund; (3) the total costs of the services to be provided by and the profits to be realized by the investment adviser and its affiliates from the relationship with the fund; (4) the extent to which economies of scale would be realized as the fund grows; and (5) whether fee levels reflect these economies of scale, if any, for the benefit of fund shareholders.
In determining whether to renew the Advisory Contracts for the fund, the Board ultimately reached a determination, with the assistance of fund counsel and independent Trustees' counsel, that the renewal of the Advisory Contracts and the compensation to be received by Fidelity under the management contract is consistent with Fidelity's fiduciary duty under applicable law. In addition to evaluating the specific factors noted above, the Board, in reaching its determination, is aware that shareholders in the fund have a broad range of investment choices available to them, including a wide choice among mutual funds offered by competitors to Fidelity, and that the fund's shareholders, with the opportunity to review and weigh the disclosure provided by the fund in its prospectus and other public disclosures, have chosen to invest in this fund, managed by Fidelity.
Annual Report
Nature, Extent, and Quality of Services Provided by Fidelity. The Board considered staffing within the investment adviser, FMR, and the sub-advisers (together, the Investment Advisers), including the background of the fund's portfolio manager and the fund's investment objective and discipline. The independent Trustees also had discussions with senior management of Fidelity's investment operations and investment groups. The Board considered the structure of the portfolio manager compensation program and whether this structure provides appropriate incentives.
Fidelity Resources Dedicated to Investment Management and Support Services. The Board reviewed the size, education, and experience of the Investment Advisers' investment staff, their use of technology, and the Investment Advisers' approach to recruiting, training, and retaining portfolio managers and other research, advisory, and management personnel. The Board considered Fidelity's extensive global research capabilities that enable the Investment Advisers to aggregate data from various sources in an effort to produce positive investment results. The Board noted that Fidelity's analysts have access to a variety of technological tools that enable them to perform both fundamental and quantitative analysis and to specialize in various disciplines. The Board also considered that Fidelity's portfolio managers and analysts have access to daily portfolio attribution that allows for monitoring of a fund's portfolio, as well as an electronic communication system that provides immediate real-time access to research concerning issuers and credit enhancers.
Shareholder and Administrative Services. The Board considered the nature, extent, quality, and cost of administrative, distribution, and shareholder services performed by the Investment Advisers and their affiliates under the Advisory Contracts and under separate agreements covering transfer agency, pricing and bookkeeping, and securities lending services for the fund. The Board also considered the nature and extent of the Investment Advisers' supervision of third party service providers, principally custodians and subcustodians. The Board reviewed the allocation of fund brokerage, including allocations to brokers affiliated with the Investment Advisers, the use of brokerage commissions to pay fund expenses, and the use of "soft" commission dollars to pay for research services. The Board also considered that Fidelity voluntarily decided in 2004 to stop using "soft" commission dollars to pay for market data and, instead, to pay for that data out of its own resources. The Board also considered the resources devoted to, and the record of compliance with, the fund's compliance policies and procedures.
The Board noted that the growth of fund assets across the complex allows Fidelity to reinvest in the development of services designed to enhance the value or convenience of the Fidelity funds as investment vehicles. These services include 24-hour access to account information and market information through phone representatives and over the Internet, and investor education materials and asset allocation tools.
Annual Report
Board Approval of Investment Advisory Contracts and
Management Fees - continued
Investment in a Large Fund Family. The Board considered the benefits to shareholders of investing in a Fidelity fund, including the benefits of investing in a fund that is part of a large family of funds offering a variety of investment disciplines and providing for a large variety of mutual fund investor services. For example, fund shareholders are offered the privilege of exchanging shares of the fund for shares of other Fidelity funds, as set forth in the fund's prospectus, without paying an additional sales charge. The Board noted that, since July 2004, Fidelity has taken a number of actions that benefited particular funds, including (i) voluntarily deciding in 2004 to stop using "soft" commission dollars to pay for market data and, instead, to pay for that data out of its own resources, (ii) contractually agreeing to impose management fee reductions and expense limitations on its five Spartan stock index funds and its stock index fund available through variable insurance products, (iii) contractually agreeing to eliminate the management fees on the Fidelity Freedom Funds and the Fidelity Advisor Freedom Funds, (iv) contractually agreeing to reduce the management fees on most of its investment-grade taxable bond funds, and (v) contractually agreeing to impose expense limitations on its retail and Spartan investment-grade taxable bond funds.
Investment Performance and Compliance. The Board considered whether the fund has operated within its investment objective, as well as its record of compliance with its investment restrictions. The Board noted that it is not possible to evaluate performance in any comprehensive fashion because the fund had been in operation for less than one calendar year. Once the fund has been in operation for at least one calendar year, the Board will review the fund's absolute investment performance for each class, as well as the fund's relative investment performance for each class measured against (i) a broad-based securities market index and (ii) a peer group of mutual funds deemed appropriate by the Board.
The Board also considered that, beginning November 1, 2005, the fund's management fee will be subject to upward or downward adjustment depending upon whether, and to what extent, the fund's investment performance for the performance period exceeds, or is exceeded by, the record (over the same period) of a Board-approved performance adjustment index. The Board realizes that the performance adjustment provides FMR with a strong economic incentive to seek to achieve superior performance for the fund's shareholders and helps to more closely align the interests of FMR and the fund's shareholders.
The Board has had thorough discussions with FMR throughout the year about the Board's and FMR's concerns about equity research, equity fund performance, and compliance with internal policies governing gifts and entertainment. FMR has taken steps that it believes will refocus and strengthen equity research and equity portfolio management and compliance. The Board noted with favor FMR's recent reorganization of its senior management team and FMR's plans to dedicate additional resources to investment research, and participated in the process that led to those changes.
Annual Report
Based on its review, and giving particular weight to the nature and quality of the resources dedicated by the Investment Advisers to maintain and improve relative performance, the Board concluded that the nature, extent, and quality of the services provided by Fidelity will benefit the fund's shareholders, particularly in light of the Board's view that the fund's shareholders benefit from investing in a fund that is part of a large family of funds offering a variety of investment disciplines and services.
Competitiveness of Management Fee and Total Fund Expenses. The Board considered the fund's management fee and total expenses compared to "mapped groups" of competitive funds and classes. Fidelity creates "mapped groups" by combining similar Lipper investment objective categories that have comparable management fee characteristics. Combining Lipper investment objective categories aids the Board's management fee and total expense comparisons by broadening the competitive group used for comparison and by reducing the number of universes to which various Fidelity funds are compared.
The Board considered two proprietary management fee comparisons for the period of the fund's operations shown in the chart below. The group of Lipper funds used by the Board for management fee comparisons is referred to below as the "Total Mapped Group" and, for the reasons explained above, is broader than the Lipper peer group used by the Board for performance comparisons. The Total Mapped Group comparison focuses on a fund's standing relative to the total universe of comparable funds available to investors, in terms of gross management fees before expense reimbursements or caps. "TMG %" represents the percentage of funds in the Total Mapped Group that had management fees that were lower than the fund's. For example, a TMG % of 18% means that 82% of the funds in the Total Mapped Group had higher management fees than the fund. The "Asset-Size Peer Group" (ASPG) comparison focuses on a fund's standing relative to non-Fidelity funds similar in size to the fund within the Total Mapped Group. The ASPG represents at least 15% of the funds in the Total Mapped Group with comparable asset size and management fee characteristics, subject to a minimum of 50 funds (or all funds in the Total Mapped Group if fewer than 50). Additional information, such as the ASPG quartile ("quadrant") in which the fund's management fee ranked, is also included in the chart and considered by the Board.
Annual Report
Board Approval of Investment Advisory Contracts and
Management Fees - continued
The Board noted that the fund's management fee ranked below the median of its Total Mapped Group and below the median of its ASPG for the period.
Based on its review, the Board concluded that the fund's management fee was fair and reasonable in light of the services that the fund receives and the other factors considered.
In its review of each class's total expenses, the Board considered the fund's management fee as well as other fund or class expenses, as applicable, such as transfer agent fees, pricing and bookkeeping fees, fund-paid 12b-1 fees, and custodial, legal, and audit fees. The Board also noted the effects of any waivers and reimbursements on fees and expenses. As part of its review, the Board also considered current and historical total expenses of each class of the fund compared to competitive fund median expenses. Each class of the fund is compared to those funds and classes in the Total Mapped Group (used by the Board for management fee comparisons) that have a similar sales load structure.
The Board noted that the total expenses of Fidelity Small Cap Growth Fund (retail class) ranked below its competitive median for the period, the total expenses of Class A ranked equal to its competitive median for the period, and the total expenses of each of Class B, Class C, Class T and Institutional Class ranked above its competitive median for the period. The Board considered that the fund launched in November 2004 and that the classes were above median because of high expenses in basis points due to their small size. The Board noted that the fund offers multiple classes, each of which has a different sales load and 12b-1 fee structure, and that the multiple structures are intended to offer a range of pricing options for the intermediary market. The Board also noted that the total expenses of the classes vary primarily by the level of their 12b-1 fees, although differences in transfer agent fees may also cause expenses to vary from class to class.
Annual Report
Furthermore, the Board considered that, effective June 1, 2005, FMR voluntarily agreed to reimburse each class of the fund to the extent that total operating expenses (excluding 12b-1 fees and certain other expenses) exceed 115 basis points. The Board considered that, if the voluntary expense reimbursements had been in effect in 2004, the total expenses of each of Class A, Class B and Class C would have ranked below the median and the total expenses of Institutional Class would have ranked equal to the median.
In its review of total expenses, the Board also considered Fidelity fee structures and other information on clients that FMR and its affiliates service in other competitive markets, such as other mutual funds advised or subadvised by FMR or its affiliates, pension plan clients, and other institutional clients.
Based on its review, the Board concluded that the total expenses for each class of the fund were reasonable, although in some cases above the median of the universe presented for comparison, in light of the services that the fund and its shareholders receive and the other factors considered.
Costs of the Services and Profitability. The Board considered the revenues earned and the expenses incurred by Fidelity in conducting the business of developing, marketing, distributing, managing, administering and servicing the fund and its shareholders. The Board also considered the level of Fidelity's profits in respect of all the Fidelity funds.
On an annual basis, FMR presents to the Board Fidelity's profitability for the fund. Fidelity calculates the profitability for each fund, as well as aggregate profitability for groups of Fidelity funds and all Fidelity funds, using a series of detailed revenue and cost allocation methodologies which originate with the audited books and records of Fidelity. The Audit Committee of the Board reviews any significant changes from the prior year's methodologies.
PricewaterhouseCoopers LLP (PwC), independent registered accounting firm and auditor to Fidelity and certain Fidelity funds, has been engaged annually by the Board as part of the Board's assessment of the results of Fidelity's profitability analysis. PwC's engagement includes the review and assessment of Fidelity's methodologies used in determining the revenues and expenses attributable to Fidelity's mutual fund business, and completion of agreed-upon procedures surrounding the mathematical accuracy of fund profitability and its conformity to allocation methodologies. After considering PwC's reports issued under the engagement and information provided by Fidelity, the Board believes that while other allocation methods may also be reasonable, Fidelity's profitability methodologies are reasonable in all material respects.
Annual Report
Board Approval of Investment Advisory Contracts and
Management Fees - continued
The Board has also reviewed Fidelity's non-fund businesses and any fall-out benefits related to the mutual fund business as well as cases where Fidelity's affiliates may benefit from or be related to the fund's business. In addition, a special committee of the Board reviewed services provided to Fidelity by its affiliates and determined that the fees that Fidelity paid for such services were reasonable.
The Board considered the costs of the services provided by and the profits realized by Fidelity in connection with the operation of the fund and determined that the amount of profit is a fair entrepreneurial profit for the management of the fund.
Economies of Scale. The Board considered whether there have been economies of scale in respect of the management of the Fidelity funds, whether the Fidelity funds (including the fund) have appropriately benefited from any such economies of scale, and whether there is potential for realization of any further economies of scale. The Board considered the extent to which the fund will benefit from economies of scale through increased services to the fund, through waivers or reimbursements, or through fee or expense reductions, including reductions that occur through operation of the transfer agent agreement. The transfer agent fee varies in part based on the number of accounts in the fund. If the number of accounts decreases or the average account size increases, the overall transfer agent fee rate decreases.
The Board recognized that the fund's management contract incorporates a "group fee" structure, which provides for lower fee rates as total fund assets under FMR's management increase, and for higher fee rates as total fund assets under FMR's management decrease. The Board considered that the group fee is designed to deliver the benefits of economies of scale to fund shareholders when total fund assets increase, even if assets of any particular fund are unchanged or have declined, because some portion of Fidelity's costs are attributable to services provided to all Fidelity funds, and all funds benefit if those costs can be allocated among more assets. The Board concluded that, given the group fee structure, fund shareholders will achieve a certain level of economies of scale as assets under FMR's management increase at the fund complex level, regardless of whether Fidelity achieves any such economies of scale.
The Board further concluded that any potential economies of scale are being shared between fund shareholders and Fidelity in an appropriate manner.
Additional Information Requested by the Board. In order to develop fully the factual basis for consideration of the Advisory Contracts, the Board requested additional information regarding (i) equity fund transfer agency fees; (ii) Fidelity's fund profitability methodology and the impact of various changes in the methodology over time; (iii) benefits to shareholders from economies of scale; (iv) composition and characteristics of various fund and industry data used in comparisons; and (v) compensation of portfolio managers and research analysts.
Annual Report
Based on its evaluation of all of the conclusions noted above, and after considering all material factors, the Board ultimately concluded that the existing advisory fee structures are fair and reasonable, and that the fund's existing Advisory Contracts should be renewed.
Annual Report
Annual Report
Annual Report
Investment Adviser
Fidelity Management & Research Company
Boston, MA
Investment Sub-Advisers
FMR Co., Inc.
Fidelity Management & Research
(U.K.) Inc.
Fidelity Management & Research
(Far East) Inc.
Fidelity International Investment Advisors
Fidelity Investments Japan Limited
Fidelity International Investment Advisors (U.K.) Limited
General Distributor
Fidelity Distributors Corporation
Boston, MA
Transfer and Service Agents
Fidelity Investments Institutional
Operations Company, Inc.
Boston, MA
Fidelity Service Company, Inc.
Boston, MA
Custodian
Citibank, N.A.
New York, NY
ASCPI-UANN-0905
1.803721.100
(Fidelity Investment logo)(registered trademark)
Corporate Headquarters
82 Devonshire St., Boston, MA 02109
www.fidelity.com
Fidelity®
Small Cap Value
Fund
Annual Report
July 31, 2005
(2_fidelity_logos) (Registered_Trademark)
Contents
Chairman's Message | <Click Here> | Ned Johnson's message to shareholders. |
Performance | <Click Here> | How the fund has done over time. |
Management's Discussion | <Click Here> | The manager's review of fund performance, strategy and outlook |
Shareholder Expense Example | <Click Here> | An example of shareholder expenses. |
Investment Summary | <Click Here> | A summary of the fund's investments. |
Investments | <Click Here> | A complete list of the fund's investments with their market values. |
Financial Statements | <Click Here> | Statements of assets and liabilities, operations, and changes in net assets,
as well as financial highlights. |
Notes | <Click Here> | Notes to the financial statements. |
Report of Independent Registered Public Accounting Firm | <Click Here> | |
Trustees and Officers | <Click Here> | |
Distributions | <Click Here> | |
Board Approval of Investment Advisory Contracts and Management Fees | <Click Here> | |
To view a fund's proxy voting guidelines and proxy voting record for the 12-month period ended June 30, visit www.fidelity.com/proxyvotingresults or visit the Securities and Exchange Commission's (SEC) web site at www.sec.gov. You may also call 1-800-544-8544 to request a free copy of the proxy voting guidelines.
Standard & Poor's, S&P and S&P 500 are registered service marks of The McGraw-Hill Companies, Inc. and have been licensed for use by Fidelity Distributors Corporation.
Other third party marks appearing herein are the property of their respective owners.
All other marks appearing herein are registered or unregistered trademarks or service marks of FMR Corp. or an affiliated company.
Annual Report
This report and the financial statements contained herein are submitted for the general information of the shareholders of the fund. This report is not authorized for distribution to prospective investors in the fund unless preceded or accompanied by an effective prospectus.
A fund files its complete schedule of portfolio holdings with the SEC for the first and third quarters of each fiscal year on Form N-Q. Forms N-Q are available on the SEC's web site at http://www.sec.gov. A fund's Forms N-Q may be reviewed and copied at the SEC's Public Reference Room in Washington, DC. Information regarding the operation of the SEC's Public Reference Room may be obtained by calling 1-800-SEC-0330. For a complete list of a fund's portfolio holdings, view the most recent quarterly holdings report, semiannual report, or annual report on Fidelity's web site at http://www.fidelity.com/holdings.
NOT FDIC INSURED · MAY LOSE VALUE · NO BANK GUARANTEE
Neither the fund nor Fidelity Distributors Corporation is a bank.
Annual Report
Chairman's Message
(photo_of_Edward_C_Johnson_3d)
Dear Shareholder:
During the past year or so, much has been reported about the mutual fund industry, and much of it has been more critical than I believe is warranted. Allegations that some companies have been less than forthright with their shareholders have cast a shadow on the entire industry. I continue to find these reports disturbing, and assert that they do not create an accurate picture of the industry overall. Therefore, I would like to remind everyone where Fidelity stands on these issues. I will say two things specifically regarding allegations that some mutual fund companies were in violation of the Securities and Exchange Commission's forward pricing rules or were involved in so-called "market timing" activities.
First, Fidelity has no agreements that permit customers who buy fund shares after 4 p.m. to obtain the 4 p.m. price. This is not a new policy. This is not to say that someone could not deceive the company through fraudulent acts. However, we are extremely diligent in preventing fraud from occurring in this manner - and in every other. But I underscore again that Fidelity has no so-called "agreements" that sanction illegal practices.
Second, Fidelity continues to stand on record, as we have for years, in opposition to predatory short-term trading that adversely affects shareholders in a mutual fund. Back in the 1980s, we initiated a fee - which is returned to the fund and, therefore, to investors - to discourage this activity. Further, we took the lead several years ago in developing a Fair Value Pricing Policy to prevent market timing on foreign securities in our funds. I am confident we will find other ways to make it more difficult for predatory traders to operate. However, this will only be achieved through close cooperation among regulators, legislators and the industry.
Yes, there have been unfortunate instances of unethical and illegal activity within the mutual fund industry from time to time. That is true of any industry. When this occurs, confessed or convicted offenders should be dealt with appropriately. But we are still concerned about the risk of over-regulation and the quick application of simplistic solutions to intricate problems. Every system can be improved, and we support and applaud well thought out improvements by regulators, legislators and industry representatives that achieve the common goal of building and protecting the value of investors' holdings.
For nearly 60 years, Fidelity has worked very hard to improve its products and service to justify your trust. When our family founded this company in 1946, we had only a few hundred customers. Today, we serve more than 18 million customers including individual investors and participants in retirement plans across America.
Let me close by saying that we do not take your trust in us for granted, and we realize that we must always work to improve all aspects of our service to you. In turn, we urge you to continue your active participation with your financial matters, so that your interests can be well served.
Best regards,
/s/Edward C. Johnson 3d
Edward C. Johnson 3d
Annual Report
Performance: The Bottom Line
Average annual total return reflects the change in the value of an investment, assuming reinvestment of Small Cap Value's dividend income and capital gains (the profits earned upon the sale of securities that have grown in value) and assuming a constant rate of performance each year. The $10,000 table and the fund's returns do not reflect the deduction of taxes that a shareholder would pay on fund distributions or the redemption of fund shares. During periods of reimbursement by Fidelity, a fund's total return will be greater than it would be had the reimbursement not occurred. How a fund did yesterday is no guarantee of how it will do tomorrow.
Average annual total returns take Small Cap Value's cumulative total return and show you what would have happened if Small Cap Value shares had performed at a constant rate each year. These numbers will be reported once the fund is a year old.
$10,000 Over Life of Fund
Let's say hypothetically that $10,000 was invested in Small Cap Value on November 3, 2004, when the fund started. The chart shows how the value of your investment would have changed, and also shows how the Russell 2000® Value Index performed over the same period.
Annual Report
Management's Discussion of Fund Performance
Comments from Katherine Lieberman, Portfolio Manager of Fidelity® Small Cap Value Fund
A late-inning rally on Wall Street helped push some key U.S. equity indexes to four-year highs by the conclusion of the 12-month period ending July 31, 2005. Spurred on by bullish economic data and strong corporate earnings, investors enjoyed a stellar month of July, capping off a turbulent 12-month period for U.S. equity markets. Stock prices bounced up and down during most of the year, moving in cadence with gyrations in the price of crude oil and investors' gathering and ebbing concerns about inflation. The Federal Reserve Board raised short-term interest rates eight times during the period, also affecting overall market sentiment. Despite their fluctuations, the major equity indexes finished on a high note, with the Standard & Poor's 500SM Index and the NASDAQ Composite® Index posting gains of 14.05% and 16.51%, respectively, for the period. The small-cap Russell 2000® Index rose 24.78% and the Russell Midcap® Index jumped 28.93%, while the blue-chips' Dow Jones Industrial AverageSM advanced only 7.29%.
Small Cap Value was up 28.36% from its inception on November 3, 2004, through July 31, 2005, solidly outperforming the 16.66% return for the Russell 2000 Value Index during the same period. Favorable individual stock selection within a number of sectors as well as an overweighting in the energy sector made the biggest contributions to the fund's performance relative to its index. The fund also was helped by its holdings in late-cycle, construction-related stocks. Energy stocks such as exploration and production (E&P) companies benefited from high oil prices and increased production volumes, while energy services companies benefited from increased demand. Among the fund's top performers were E&P company Quicksilver Resources and energy services company Oil States International, while late-cycle construction company WESCO International was a notable absolute contributor. RC2 Corp., which makes learning toys, and designer denim company True Religion Apparel also boosted the fund's performance in absolute terms and relative to the sector index. I sold True Religion to lock in profits. In terms of disappointments, fashion-related stocks Innovo Group and Deckers Outdoor Corporation held back the fund's overall returns. Another specialty retailer, Cost Plus, was a meaningful detractor as well. Elsewhere, scant exposure to strong-performing utilities stocks further dampened the fund's relative return.
The views expressed in this statement reflect those of the portfolio manager only through the end of the period of the report as stated on the cover and do not necessarily represent the views of Fidelity or any other person in the Fidelity organization. Any such views are subject to change at any time based upon market or other conditions and Fidelity disclaims any responsibility to update such views. These views may not be relied on as investment advice and, because investment decisions for a Fidelity fund are based on numerous factors, may not be relied on as an indication of trading intent on behalf of any Fidelity fund.
Annual Report
Shareholder Expense Example
As a shareholder of the Fund, you incur two types of costs: (1) transaction costs, including sales charges (loads) on purchase payments or redemption proceeds, redemption fees, and (2) ongoing costs, including management fees, distribution and/or service (12b-1) fees and other Fund expenses. This Example is intended to help you understand your ongoing costs (in dollars) of investing in the Fund and to compare these costs with the ongoing costs of investing in other mutual funds.
The Example is based on an investment of $1,000 invested at the beginning of the period and held for the entire period (February 1, 2005 to July 31, 2005).
Actual Expenses
The first line of the table below for each class of the Fund provides information about actual account values and actual expenses. You may use the information in this line, together with the amount you invested, to estimate the expenses that you paid over the period. Simply divide your account value by $1,000.00 (for example, an $8,600 account value divided by $1,000.00 = 8.6), then multiply the result by the number in the first line for a class of the Fund under the heading entitled "Expenses Paid During Period" to estimate the expenses you paid on your account during this period. A small balance maintenance fee of $12.00 that is charged once a year may apply for certain accounts with a value of less than $2,000. This fee is not included in the table below. If it was, the estimate of expenses you paid during the period would be higher, and your ending account value lower, by this amount.
Hypothetical Example for Comparison Purposes
The second line of the table below for each class of the Fund provides information about hypothetical account values and hypothetical expenses based on a Class' actual expense ratio and an assumed rate of return of 5% per year before expenses, which is not the Class' actual return. The hypothetical account values and expenses may not be used to estimate the actual ending account balance or expenses you paid for the period. You may use this information to compare the ongoing costs of investing in the Fund and other funds. To do so, compare this 5% hypothetical example with the 5% hypothetical examples that appear in the shareholder reports of the other funds. A small balance maintenance fee of $12.00 that is charged once a year may apply for certain accounts with a value of less than $2,000. This fee is not included in the table below. If it was, the estimate of expenses you paid during the period would be higher, and your ending account value lower, by this amount.
Please note that the expenses shown in the table are meant to highlight your ongoing costs only and do not reflect any transaction costs. Therefore, the second line of the table is useful in comparing ongoing costs only, and will not help you determine the relative total costs of owning different funds. In addition, if these transactional costs were included, your costs would have been higher.
Annual Report
Shareholder Expense Example - continued
| Beginning
Account Value
February 1, 2005 | Ending
Account Value
July 31, 2005 | Expenses Paid
During Period*
February 1, 2005
to July 31, 2005 |
Class A | | | |
Actual | $ 1,000.00 | $ 1,154.20 | $ 7.64 |
HypotheticalA | $ 1,000.00 | $ 1,017.70 | $ 7.15 |
Class T | | | |
Actual | $ 1,000.00 | $ 1,151.40 | $ 8.91 |
HypotheticalA | $ 1,000.00 | $ 1,016.51 | $ 8.35 |
Class B | | | |
Actual | $ 1,000.00 | $ 1,148.90 | $ 11.62 |
HypotheticalA | $ 1,000.00 | $ 1,013.98 | $ 10.89 |
Class C | | | |
Actual | $ 1,000.00 | $ 1,149.80 | $ 11.51 |
HypotheticalA | $ 1,000.00 | $ 1,014.08 | $ 10.79 |
Small Cap Value | | | |
Actual | $ 1,000.00 | $ 1,155.90 | $ 5.51 |
HypotheticalA | $ 1,000.00 | $ 1,019.69 | $ 5.16 |
Institutional Class | | | |
Actual | $ 1,000.00 | $ 1,155.90 | $ 5.56 |
HypotheticalA | $ 1,000.00 | $ 1,019.64 | $ 5.21 |
A 5% return per year before expenses
* Expenses are equal to each Class' annualized expense ratio (shown in the table below); multiplied by the average account value over the period, multiplied by 181/365 (to reflect the one-half year period).
| Annualized
Expense Ratio |
Class A | 1.43% |
Class T | 1.67% |
Class B | 2.18% |
Class C | 2.16% |
Small Cap Value | 1.03% |
Institutional Class | 1.04% |
Annual Report
Investment Changes
Top Ten Stocks as of July 31, 2005 |
| % of fund's
net assets | % of fund's net assets
6 months ago |
RC2 Corp. | 3.3 | 4.9 |
Maverick Tube Corp. | 2.8 | 1.0 |
WESCO International, Inc. | 2.2 | 0.4 |
Compass Minerals International, Inc. | 2.1 | 0.0 |
Comstock Resources, Inc. | 1.6 | 0.0 |
Pioneer Companies, Inc. | 1.6 | 1.3 |
Steven Madden Ltd. | 1.6 | 2.3 |
USI Holdings Corp. | 1.6 | 1.3 |
Park-Ohio Holdings Corp. | 1.6 | 1.2 |
Carlisle Companies, Inc. | 1.4 | 0.7 |
| 19.8 | |
Top Five Market Sectors as of July 31, 2005 |
| % of fund's
net assets | % of fund's net assets
6 months ago |
Consumer Discretionary | 20.6 | 28.4 |
Financials | 18.7 | 20.7 |
Industrials | 18.2 | 11.9 |
Energy | 15.0 | 17.6 |
Information Technology | 7.0 | 4.0 |
Asset Allocation (% of fund's net assets) |
As of July 31, 2005 * | As of January 31, 2005 ** |
| Stocks 91.5% | | | Stocks 92.1% | |
| Bonds 0.8% | | | Bonds 0.0% | |
| Short-Term
Investments and
Net Other Assets 7.7% | | | Short-Term
Investments and
Net Other Assets 7.9% | |
* Foreign investments | 10.8% | | ** Foreign investments | 12.0% | |

Annual Report
Investments July 31, 2005
Showing Percentage of Net Assets
Common Stocks - 91.5% |
| Shares | | Value (Note 1) |
CONSUMER DISCRETIONARY - 20.5% |
Auto Components - 0.5% |
Spartan Motors, Inc. | 293,410 | | $ 3,438,765 |
Automobiles - 0.8% |
Monaco Coach Corp. | 199,200 | | 3,486,000 |
National R.V. Holdings, Inc. (a) | 167,700 | | 1,282,905 |
| | 4,768,905 |
Diversified Consumer Services - 0.8% |
Steiner Leisure Ltd. (a) | 142,030 | | 4,908,557 |
Hotels, Restaurants & Leisure - 1.7% |
AFC Enterprises, Inc. | 130,000 | | 1,779,700 |
Applebee's International, Inc. | 110,000 | | 2,916,100 |
Kerzner International Ltd. (a) | 39,470 | | 2,358,333 |
La Quinta Corp. unit (a) | 211,300 | | 1,901,700 |
Steak n Shake Co. (a) | 70,000 | | 1,515,500 |
| | 10,471,333 |
Household Durables - 1.7% |
Department 56, Inc. (a) | 248,000 | | 3,119,840 |
Interface, Inc. Class A (a) | 293,190 | | 2,993,470 |
Jarden Corp. (a) | 112,500 | | 4,315,500 |
| | 10,428,810 |
Leisure Equipment & Products - 4.9% |
Marine Products Corp. | 138,530 | | 1,953,273 |
MarineMax, Inc. (a) | 178,200 | | 5,926,932 |
Mega Bloks, Inc. (a) | 129,200 | | 2,694,063 |
RC2 Corp. (a) | 500,000 | | 20,404,994 |
| | 30,979,262 |
Media - 1.1% |
Emmis Communications Corp. Class A (a)(d) | 129,100 | | 2,650,423 |
Harris Interactive, Inc. (a) | 345,900 | | 1,393,977 |
Thomas Nelson, Inc. | 115,000 | | 2,626,600 |
| | 6,671,000 |
Multiline Retail - 0.9% |
Tuesday Morning Corp. | 162,300 | | 5,730,813 |
Specialty Retail - 4.9% |
Cost Plus, Inc. (a) | 265,630 | | 5,984,644 |
Genesco, Inc. (a) | 87,990 | | 3,279,387 |
Kirkland's, Inc. (a) | 348,306 | | 2,873,525 |
La Senza Corp. (sub. vtg.) | 44,100 | | 662,752 |
Le Chateau, Inc. Class A (sub. vtg.) | 32,500 | | 1,267,509 |
Monro Muffler Brake, Inc. | 70,500 | | 2,037,450 |
Common Stocks - continued |
| Shares | | Value (Note 1) |
CONSUMER DISCRETIONARY - continued |
Specialty Retail - continued |
Pacific Sunwear of California, Inc. (a) | 321,000 | | $ 7,829,190 |
Peacock Group PLC | 300,000 | | 1,384,071 |
Sonic Automotive, Inc. Class A (sub. vtg.) | 219,800 | | 5,121,340 |
| | 30,439,868 |
Textiles, Apparel & Luxury Goods - 3.2% |
Innovo Group, Inc. (a)(e) | 1,696,580 | | 3,902,134 |
Oxford Industries, Inc. | 131,560 | | 6,184,636 |
Steven Madden Ltd. (a) | 450,110 | | 10,059,959 |
| | 20,146,729 |
TOTAL CONSUMER DISCRETIONARY | | 127,984,042 |
CONSUMER STAPLES - 1.3% |
Food Products - 1.3% |
Delta & Pine Land Co. | 55,000 | | 1,471,250 |
Diamond Foods, Inc. | 70,600 | | 1,563,790 |
Green Mountain Coffee Roasters, Inc. (a) | 40,580 | | 1,422,329 |
Poore Brothers, Inc. (a) | 776,790 | | 3,806,271 |
| | 8,263,640 |
ENERGY - 15.0% |
Energy Equipment & Services - 7.2% |
Hornbeck Offshore Services, Inc. (a) | 240,000 | | 7,176,000 |
Maverick Tube Corp. (a) | 520,620 | | 17,268,965 |
NS Group, Inc. (a) | 210,000 | | 8,914,500 |
Oil States International, Inc. (a) | 245,360 | | 7,257,749 |
Pason Systems, Inc. | 225,300 | | 4,434,786 |
| | 45,052,000 |
Oil, Gas & Consumable Fuels - 7.8% |
Alon USA Energy, Inc. | 3,300 | | 58,575 |
Comstock Resources, Inc. (a) | 368,700 | | 10,209,303 |
Denbury Resources, Inc. (a) | 30,590 | | 1,431,612 |
Encore Acquisition Co. (a) | 96,120 | | 3,031,625 |
Gastar Exploration Ltd. (a) | 850,000 | | 2,291,012 |
Gastar Exploration Ltd. (a)(g) | 1,509,607 | | 3,661,970 |
Holly Corp. | 140,000 | | 6,554,800 |
KCS Energy, Inc. (a) | 100,000 | | 1,964,000 |
Penn Virginia Corp. | 45,670 | | 2,463,897 |
Petroleum Development Corp. (a) | 81,700 | | 3,058,848 |
Plains Exploration & Production Co. (a) | 105,000 | | 4,047,750 |
Common Stocks - continued |
| Shares | | Value (Note 1) |
ENERGY - continued |
Oil, Gas & Consumable Fuels - continued |
Quicksilver Resources, Inc. (a) | 161,850 | | $ 6,855,966 |
Range Resources Corp. | 62,150 | | 1,898,061 |
Top Tankers, Inc. | 68,300 | | 1,047,729 |
| | 48,575,148 |
TOTAL ENERGY | | 93,627,148 |
FINANCIALS - 18.7% |
Capital Markets - 0.2% |
Affiliated Managers Group, Inc. (a) | 16,000 | | 1,140,800 |
Commercial Banks - 3.9% |
Cathay General Bancorp | 50,120 | | 1,781,265 |
Center Financial Corp., California | 186,160 | | 4,756,388 |
Hanmi Financial Corp. | 175,040 | | 3,325,760 |
Nara Bancorp, Inc. | 82,650 | | 1,284,381 |
Preferred Bank, Los Angeles California | 135,000 | | 5,667,300 |
Texas Capital Bancshares, Inc. (a) | 108,200 | | 2,555,684 |
Wintrust Financial Corp. | 90,260 | | 4,840,644 |
| | 24,211,422 |
Diversified Financial Services - 1.8% |
Marlin Business Services Corp. (a) | 354,509 | | 7,887,825 |
Nasdaq Stock Market, Inc. (a) | 160,000 | | 3,624,000 |
| | 11,511,825 |
Insurance - 7.7% |
Arch Capital Group Ltd. (a) | 51,090 | | 2,350,140 |
Aspen Insurance Holdings Ltd. | 154,000 | | 4,375,140 |
HCC Insurance Holdings, Inc. | 112,020 | | 3,105,194 |
IPC Holdings Ltd. | 153,340 | | 6,202,603 |
National Interstate Corp. | 65,300 | | 1,297,511 |
Ohio Casualty Corp. | 230,000 | | 5,876,500 |
Philadelphia Consolidated Holdings Corp. (a) | 76,080 | | 6,316,162 |
Platinum Underwriters Holdings Ltd. | 69,900 | | 2,423,433 |
Specialty Underwriters' Alliance, Inc. | 382,130 | | 3,827,338 |
United America Indemnity Ltd. Class A (a) | 127,412 | | 2,335,462 |
USI Holdings Corp. (a) | 780,448 | | 10,009,246 |
| | 48,118,729 |
Real Estate - 4.6% |
American Campus Communities, Inc. | 243,720 | | 6,105,186 |
Capital Automotive (REIT) (SBI) | 29,800 | | 1,170,246 |
Common Stocks - continued |
| Shares | | Value (Note 1) |
FINANCIALS - continued |
Real Estate - continued |
CB Richard Ellis Group, Inc. Class A (a) | 25,000 | | $ 1,151,000 |
CenterPoint Properties Trust (SBI) | 40,000 | | 1,754,400 |
Columbia Equity Trust, Inc. | 80,000 | | 1,246,400 |
Education Realty Trust, Inc. | 56,300 | | 1,116,429 |
Far East Consortium International Ltd. | 3,175,000 | | 1,368,253 |
Feldman Mall Properties, Inc. | 212,400 | | 2,973,600 |
GMH Communities Trust | 209,100 | | 3,134,409 |
Kilroy Realty Corp. | 87,080 | | 4,536,868 |
Macquarie Goodman Group unit | 595,067 | | 1,829,012 |
Reckson Associates Realty Corp. | 44,570 | | 1,565,298 |
Ticon Industrial Connection PCL (For. Reg.) | 3,000,000 | | 713,000 |
| | 28,664,101 |
Thrifts & Mortgage Finance - 0.5% |
NetBank, Inc. | 310,000 | | 2,892,300 |
TOTAL FINANCIALS | | 116,539,177 |
HEALTH CARE - 4.0% |
Health Care Equipment & Supplies - 0.2% |
Pihsiang Machinery Manufacturing Co. | 670,000 | | 1,345,466 |
Health Care Providers & Services - 3.8% |
Air Methods Corp. (a) | 140,187 | | 1,195,795 |
America Service Group, Inc. (a) | 320,960 | | 6,926,317 |
ICON PLC sponsored ADR (a) | 214,360 | | 8,392,194 |
Medtox Scientific, Inc. (a) | 369,090 | | 2,594,703 |
PSS World Medical, Inc. (a) | 309,730 | | 4,528,253 |
| | 23,637,262 |
TOTAL HEALTH CARE | | 24,982,728 |
INDUSTRIALS - 18.2% |
Aerospace & Defense - 0.9% |
Kaman Corp. Class A | 275,800 | | 5,378,100 |
Air Freight & Logistics - 1.6% |
Park-Ohio Holdings Corp. (a) | 491,420 | | 9,985,654 |
Building Products - 0.3% |
Quixote Corp. | 92,200 | | 1,874,426 |
Commercial Services & Supplies - 2.5% |
Banta Corp. | 136,900 | | 6,535,606 |
Hudson Highland Group, Inc. (a) | 130,000 | | 2,701,400 |
Common Stocks - continued |
| Shares | | Value (Note 1) |
INDUSTRIALS - continued |
Commercial Services & Supplies - continued |
PeopleSupport, Inc. | 132,300 | | $ 1,268,757 |
Speedy Hire PLC | 140,000 | | 1,796,216 |
Standard Parking Corp. (a) | 111,084 | | 1,941,748 |
Waste Services, Inc. (a) | 365,000 | | 1,423,500 |
| | 15,667,227 |
Construction & Engineering - 1.8% |
Comfort Systems USA, Inc. (a) | 771,600 | | 5,979,900 |
URS Corp. (a) | 136,500 | | 5,111,925 |
| | 11,091,825 |
Electrical Equipment - 1.6% |
Acuity Brands, Inc. | 217,250 | | 6,339,355 |
C&D Technologies, Inc. | 330,000 | | 3,323,100 |
| | 9,662,455 |
Industrial Conglomerates - 1.4% |
Carlisle Companies, Inc. | 135,800 | | 8,943,788 |
Machinery - 4.6% |
Albany International Corp. Class A | 45,700 | | 1,601,328 |
Freightcar America, Inc. | 115,000 | | 3,686,900 |
Kinik Co. | 582,000 | | 1,716,599 |
Manitowoc Co., Inc. | 107,360 | | 4,900,984 |
Tennant Co. | 140,000 | | 5,180,000 |
Wabtec Corp. | 125,900 | | 3,075,737 |
Watts Water Technologies, Inc. Class A | 236,110 | | 8,618,015 |
| | 28,779,563 |
Trading Companies & Distributors - 3.5% |
UAP Holding Corp. | 436,200 | | 8,462,280 |
WESCO International, Inc. (a) | 400,000 | | 13,624,000 |
| | 22,086,280 |
TOTAL INDUSTRIALS | | 113,469,318 |
INFORMATION TECHNOLOGY - 7.0% |
Computers & Peripherals - 0.1% |
iCAD, Inc. (a) | 215,000 | | 767,550 |
Electronic Equipment & Instruments - 4.0% |
KEMET Corp. (a) | 548,200 | | 4,593,916 |
Mettler-Toledo International, Inc. (a) | 150,000 | | 7,875,000 |
ScanSource, Inc. (a) | 80,000 | | 3,818,400 |
Common Stocks - continued |
| Shares | | Value (Note 1) |
INFORMATION TECHNOLOGY - continued |
Electronic Equipment & Instruments - continued |
Tektronix, Inc. | 325,000 | | $ 8,144,500 |
Winland Electronics, Inc. (a) | 120,360 | | 535,602 |
| | 24,967,418 |
Internet Software & Services - 1.2% |
j2 Global Communications, Inc. (a)(d) | 160,000 | | 6,417,600 |
SonicWALL, Inc. (a) | 200,000 | | 1,068,000 |
| | 7,485,600 |
IT Services - 0.5% |
Forrester Research, Inc. (a) | 26,968 | | 532,079 |
Telvent GIT SA | 253,900 | | 2,749,483 |
| | 3,281,562 |
Semiconductors & Semiconductor Equipment - 0.5% |
MKS Instruments, Inc. (a) | 166,100 | | 3,174,171 |
Software - 0.7% |
Blackbaud, Inc. | 115,749 | | 1,655,211 |
Hyperion Solutions Corp. (a) | 10,000 | | 470,600 |
Moldflow Corp. (a) | 124,498 | | 1,949,639 |
| | 4,075,450 |
TOTAL INFORMATION TECHNOLOGY | | 43,751,751 |
MATERIALS - 6.1% |
Chemicals - 4.0% |
Albemarle Corp. | 214,700 | | 8,180,070 |
Cytec Industries, Inc. | 115,070 | | 5,221,877 |
Pioneer Companies, Inc. (a) | 420,290 | | 10,200,438 |
Spartech Corp. | 60,000 | | 1,123,800 |
| | 24,726,185 |
Metals & Mining - 2.1% |
Compass Minerals International, Inc. | 530,000 | | 13,488,500 |
TOTAL MATERIALS | | 38,214,685 |
TELECOMMUNICATION SERVICES - 0.5% |
Diversified Telecommunication Services - 0.5% |
New Skies Satellites Holdings Ltd. | 150,000 | | 3,105,000 |
Common Stocks - continued |
| Shares | | Value (Note 1) |
UTILITIES - 0.2% |
Gas Utilities - 0.2% |
Xinao Gas Holdings Ltd. | 1,302,000 | | $ 1,030,063 |
TOTAL COMMON STOCKS (Cost $514,738,650) | 570,967,552 |
Nonconvertible Bonds - 0.8% |
| Principal Amount | | |
CONSUMER DISCRETIONARY - 0.1% |
Hotels, Restaurants & Leisure - 0.1% |
Uno Restaurant Corp. 10% 2/15/11 (f) | $ 1,000,000 | | 965,000 |
HEALTH CARE - 0.7% |
Health Care Providers & Services - 0.7% |
Hanger Orthopedic Group, Inc. 10.375% 2/15/09 | 4,301,000 | | 4,301,000 |
TOTAL NONCONVERTIBLE BONDS (Cost $4,992,804) | 5,266,000 |
Money Market Funds - 9.2% |
| Shares | | |
Fidelity Cash Central Fund, 3.31% (b) | 52,708,903 | | 52,708,903 |
Fidelity Securities Lending Cash Central Fund, 3.32% (b)(c) | 4,949,800 | | 4,949,800 |
TOTAL MONEY MARKET FUNDS (Cost $57,658,703) | 57,658,703 |
Cash Equivalents - 0.5% |
| Maturity
Amount | | |
Investments in repurchase agreements (Collateralized by U.S. Government Obligations, in a joint trading account at 3.27%, dated 7/29/05 due 8/1/05)
(Cost $2,892,000) | $ 2,892,788 | | $ 2,892,000 |
TOTAL INVESTMENT PORTFOLIO - 102.0% (Cost $580,282,157) | | 636,784,255 |
NET OTHER ASSETS - (2.0)% | | (12,557,638) |
NET ASSETS - 100% | $ 624,226,617 |
Legend |
(a) Non-income producing |
(b) Affiliated fund that is available only to investment companies and other accounts managed by Fidelity Investments. The rate quoted is the annualized seven-day yield of the fund at period end. A complete listing of the fund's holdings as of its most recent quarter end is available upon request. |
(c) Investment made with cash collateral received from securities on loan. |
(d) Security or a portion of the security is on loan at period end. |
(e) Affiliated company |
(f) Security exempt from registration under Rule 144A of the Securities Act of 1933. These securities may be resold in transactions exempt from registration, normally to qualified institutional buyers. At the period end, the value of these securities amounted to $965,000 or 0.2% of net assets. |
(g) Restricted securities - Investment in securities not registered under the Securities Act of 1933 (excluding 144A issues). At the end of the period, the value of restricted securities (excluding 144A issues) amounted to $3,661,970 or 0.6% of net assets. |
Additional information on each holding is as follows: |
Security | Acquisition Date | Acquisition Cost |
Gastar Exploration Ltd. | 6/13/05 | $ 3,999,855 |
Other Information |
Distribution of investments by country of issue, as a percentage of total net assets, is as follows: |
United States of America | 89.2% |
Bermuda | 3.0% |
Canada | 2.4% |
Ireland | 1.4% |
Bahamas (Nassau) | 1.2% |
Others (individually less than 1%) | 2.8% |
Total | 100.0% |
An affiliated company is a company in which the fund has ownership of at least 5% of the voting securities. Companies which are affiliates of the fund at period-end are noted in the fund's Schedule of Investments. Transactions during the period with companies which are or were affiliates are as follows: |
Affiliate | Value, beginning of period | Purchases | Sales Proceeds | Dividend Income | Value,
end of
period |
Innovo Group, Inc. | $ - | $ 7,565,418 | $ - | $ - | $ 3,902,134 |
Total | $ - | $ 7,565,418 | $ - | $ - | $ 3,902,134 |
See accompanying notes which are an integral part of the financial statements.
Annual Report
Financial Statements
Statement of Assets and Liabilities
| July 31, 2005 |
| | |
Assets | | |
Investment in securities, at value (including securities loaned of $4,823,803 and repurchase agreements of $2,892,000) (cost $580,282,157) - See accompanying schedule | | $ 636,784,255 |
Cash | | 467 |
Foreign currency held at value (cost $203,113) | | 201,893 |
Receivable for investments sold | | 8,213,753 |
Receivable for fund shares sold | | 10,686,933 |
Dividends receivable | | 154,554 |
Interest receivable | | 377,732 |
Prepaid expenses | | 23,797 |
Receivable from investment adviser for expense reductions | | 1,035 |
Other receivables | | 107,399 |
Total assets | | 656,551,818 |
| | |
Liabilities | | |
Payable for investments purchased | $ 26,628,826 | |
Payable for fund shares redeemed | 275,193 | |
Accrued management fee | 328,037 | |
Distribution fees payable | 16,537 | |
Other affiliated payables | 100,174 | |
Other payables and accrued expenses | 26,634 | |
Collateral on securities loaned, at value | 4,949,800 | |
Total liabilities | | 32,325,201 |
| | |
Net Assets | | $ 624,226,617 |
Net Assets consist of: | | |
Paid in capital | | $ 552,739,748 |
Undistributed net investment income | | 5,374 |
Accumulated undistributed net realized gain (loss) on investments and foreign currency transactions | | 14,982,417 |
Net unrealized appreciation (depreciation) on investments and assets and liabilities in foreign currencies | | 56,499,078 |
Net Assets | | $ 624,226,617 |
See accompanying notes which are an integral part of the financial statements.
Annual Report
Statement of Assets and Liabilities - continued
| July 31, 2005 |
| | |
Calculation of Maximum Offering Price
Class A:
Net Asset Value and redemption price per share
($9,390,087 ÷ 733,847 shares) | | $ 12.80 |
| | |
Maximum offering price per share (100/94.25 of $12.80) | | $ 13.58 |
Class T:
Net Asset Value and redemption price per share ($12,724,811 ÷ 995,632 shares) | | $ 12.78 |
| | |
Maximum offering price per share (100/96.50 of $12.78) | | $ 13.24 |
Class B:
Net Asset Value and offering price per share ($3,930,896 ÷ 308,759 shares) A | | $ 12.73 |
| | |
Class C:
Net Asset Value and offering price per share ($11,731,652 ÷ 921,136 shares) A | | $ 12.74 |
| | |
Small Cap Value:
Net Asset Value, offering price and redemption price per share ($582,688,643 ÷ 45,410,224 shares) | | $ 12.83 |
| | |
Institutional Class:
Net Asset Value, offering price and redemption price per share ($3,760,528 ÷ 293,101 shares) | | $ 12.83 |
A Redemption price per share is equal to net asset value less any applicable contingent deferred sales charge.
See accompanying notes which are an integral part of the financial statements.
Annual Report
Financial Statements - continued
Statement of Operations
| For the period November 3, 2004 (commencement of operations) to July 31, 2005 |
| | |
Investment Income | | |
Dividends | | $ 1,417,528 |
Interest | | 567,033 |
Security lending | | 319 |
Total income | | 1,984,880 |
| | |
Expenses | | |
Management fee | $ 1,558,541 | |
Transfer agent fees | 458,714 | |
Distribution fees | 72,234 | |
Accounting and security lending fees | 90,433 | |
Independent trustees' compensation | 767 | |
Custodian fees and expenses | 31,181 | |
Registration fees | 118,829 | |
Audit | 32,133 | |
Legal | 218 | |
Miscellaneous | 536 | |
Total expenses before reductions | 2,363,586 | |
Expense reductions | (129,800) | 2,233,786 |
Net investment income (loss) | | (248,906) |
Realized and Unrealized Gain (Loss) Net realized gain (loss) on: | | |
Investment securities | 15,314,106 | |
Foreign currency transactions | (7,814) | |
Total net realized gain (loss) | | 15,306,292 |
Change in net unrealized appreciation (depreciation) on: Investment securities | 56,502,098 | |
Assets and liabilities in foreign currencies | (3,020) | |
Total change in net unrealized appreciation (depreciation) | | 56,499,078 |
Net gain (loss) | | 71,805,370 |
Net increase (decrease) in net assets resulting from operations | | $ 71,556,464 |
See accompanying notes which are an integral part of the financial statements.
Annual Report
Statement of Changes in Net Assets
| For the period
November 3, 2004
(commencement
of operations) to
July 31, 2005 |
Increase (Decrease) in Net Assets | |
Operations | |
Net investment income (loss) | $ (248,906) |
Net realized gain (loss) | 15,306,292 |
Change in net unrealized appreciation (depreciation) | 56,499,078 |
Net increase (decrease) in net assets resulting
from operations | 71,556,464 |
Distributions to shareholders from net investment income | (69,595) |
Share transactions - net increase (decrease) | 552,608,856 |
Redemption fees | 130,892 |
Total increase (decrease) in net assets | 624,226,617 |
| |
Net Assets | |
Beginning of period | - |
End of period (including undistributed net investment income of $5,374) | $ 624,226,617 |
See accompanying notes which are an integral part of the financial statements.
Annual Report
Financial Highlights - Class A
Year ended July 31, | 2005 F |
Selected Per-Share Data | |
Net asset value, beginning of period | $ 10.00 |
Income from Investment Operations | |
Net investment income (loss) E | (.04) |
Net realized and unrealized gain (loss) | 2.84 |
Total from investment operations | 2.80 |
Distributions from net investment income | (.01) |
Redemption fees added to paid in capital E | .01 |
Net asset value, end of period | $ 12.80 |
Total Return B, C, D | 28.06% |
Ratios to Average Net Assets G | |
Expenses before expense reductions | 1.46% A |
Expenses net of voluntary waivers, if any | 1.44% A |
Expenses net of all reductions | 1.38% A |
Net investment income (loss) | (.46)% A |
Supplemental Data | |
Net assets, end of period (000 omitted) | $ 9,390 |
Portfolio turnover rate | 60% A |
A Annualized
B Total returns for periods of less than one year are not annualized.
C Total returns would have been lower had certain expenses not been reduced during the periods shown.
D Total returns do not include the effect of the sales charges.
E Calculated based on average shares outstanding during the period.
F For the period November 3, 2004 (commencement of operations) to July 31, 2005.
G Expense ratios reflect operating expenses of the class. Expenses before reductions do not reflect amounts reimbursed by the investment adviser or reductions from brokerage service arrangements or other expense offset arrangements and do not represent the amount paid by the class during periods when reimbursements or reductions occur. Expense ratios before reductions for start-up periods may not be representative of longer-term operating periods. Expenses net of any voluntary waivers reflect expenses after reimbursement by the investment adviser but prior to reductions from brokerage service arrangements or other expense offset arrangements. Expenses net of all reductions represent the net expenses paid by the class.
See accompanying notes which are an integral part of the financial statements.
Annual Report
Financial Highlights - Class T
Year ended July 31, | 2005 F |
Selected Per-Share Data | |
Net asset value, beginning of period | $ 10.00 |
Income from Investment Operations | |
Net investment income (loss) E | (.06) |
Net realized and unrealized gain (loss) | 2.83 |
Total from investment operations | 2.77 |
Redemption fees added to paid in capital E | .01 |
Net asset value, end of period | $ 12.78 |
Total Return B, C, D | 27.80% |
Ratios to Average Net Assets G | |
Expenses before expense reductions | 1.72% A |
Expenses net of voluntary waivers, if any | 1.68% A |
Expenses net of all reductions | 1.62% A |
Net investment income (loss) | (.70)% A |
Supplemental Data | |
Net assets, end of period (000 omitted) | $ 12,725 |
Portfolio turnover rate | 60% A |
A Annualized
B Total returns for periods of less than one year are not annualized.
C Total returns would have been lower had certain expenses not been reduced during the periods shown.
D Total returns do not include the effect of the sales charges.
E Calculated based on average shares outstanding during the period.
F For the period November 3, 2004 (commencement of operations) to July 31, 2005.
G Expense ratios reflect operating expenses of the class. Expenses before reductions do not reflect amounts reimbursed by the investment adviser or reductions from brokerage service arrangements or other expense offset arrangements and do not represent the amount paid by the class during periods when reimbursements or reductions occur. Expense ratios before reductions for start-up periods may not be representative of longer-term operating periods. Expenses net of any voluntary waivers reflect expenses after reimbursement by the investment adviser but prior to reductions from brokerage service arrangements or other expense offset arrangements. Expenses net of all reductions represent the net expenses paid by the class.
See accompanying notes which are an integral part of the financial statements.
Annual Report
Financial Highlights - Class B
Year ended July 31, | 2005 F |
Selected Per-Share Data | |
Net asset value, beginning of period | $ 10.00 |
Income from Investment Operations | |
Net investment income (loss) E | (.10) |
Net realized and unrealized gain (loss) | 2.82 |
Total from investment operations | 2.72 |
Redemption fees added to paid in capital E | .01 |
Net asset value, end of period | $ 12.73 |
Total Return B, C, D | 27.30% |
Ratios to Average Net Assets G | |
Expenses before expense reductions | 2.24% A |
Expenses net of voluntary waivers, if any | 2.19% A |
Expenses net of all reductions | 2.13% A |
Net investment income (loss) | (1.21)% A |
Supplemental Data | |
Net assets, end of period (000 omitted) | $ 3,931 |
Portfolio turnover rate | 60% A |
A Annualized
B Total returns for periods of less than one year are not annualized.
C Total returns would have been lower had certain expenses not been reduced during the periods shown.
D Total returns do not include the effect of the contingent deferred sales charge.
E Calculated based on average shares outstanding during the period.
F For the period November 3, 2004 (commencement of operations) to July 31, 2005.
G Expense ratios reflect operating expenses of the class. Expenses before reductions do not reflect amounts reimbursed by the investment adviser or reductions from brokerage service arrangements or other expense offset arrangements and do not represent the amount paid by the class during periods when reimbursements or reductions occur. Expense ratios before reductions for start-up periods may not be representative of longer-term operating periods. Expenses net of any voluntary waivers reflect expenses after reimbursement by the investment adviser but prior to reductions from brokerage service arrangements or other expense offset arrangements. Expenses net of all reductions represent the net expenses paid by the class.
See accompanying notes which are an integral part of the financial statements.
Annual Report
Financial Highlights - Class C
Year ended July 31, | 2005 F |
Selected Per-Share Data | |
Net asset value, beginning of period | $ 10.00 |
Income from Investment Operations | |
Net investment income (loss) E | (.10) |
Net realized and unrealized gain (loss) | 2.83 |
Total from investment operations | 2.73 |
Redemption fees added to paid in capital E | .01 |
Net asset value, end of period | $ 12.74 |
Total Return B, C, D | 27.40% |
Ratios to Average Net Assets G | |
Expenses before expense reductions | 2.17% A |
Expenses net of voluntary waivers, if any | 2.17% A |
Expenses net of all reductions | 2.11% A |
Net investment income (loss) | (1.19)% A |
Supplemental Data | |
Net assets, end of period (000 omitted) | $ 11,732 |
Portfolio turnover rate | 60% A |
A Annualized
B Total returns for periods of less than one year are not annualized.
C Total returns would have been lower had certain expenses not been reduced during the periods shown.
D Total returns do not include the effect of the contingent deferred sales charge.
E Calculated based on average shares outstanding during the period.
F For the period November 3, 2004 (commencement of operations) to July 31, 2005.
G Expense ratios reflect operating expenses of the class. Expenses before reductions do not reflect amounts reimbursed by the investment adviser or reductions from brokerage service arrangements or other expense offset arrangements and do not represent the amount paid by the class during periods when reimbursements or reductions occur. Expense ratios before reductions for start-up periods may not be representative of longer-term operating periods. Expenses net of any voluntary waivers reflect expenses after reimbursement by the investment adviser but prior to reductions from brokerage service arrangements or other expense offset arrangements. Expenses net of all reductions represent the net expenses paid by the class.
See accompanying notes which are an integral part of the financial statements.
Annual Report
Financial Highlights - Small Cap Value
Year ended July 31, | 2005 E |
Selected Per-Share Data | |
Net asset value, beginning of period | $ 10.00 |
Income from Investment Operations | |
Net investment income (loss) D | (.01) |
Net realized and unrealized gain (loss) | 2.84 |
Total from investment operations | 2.83 |
Distributions from net investment income | (.01) |
Redemption fees added to paid in capital D | .01 |
Net asset value, end of period | $ 12.83 |
Total Return B, C | 28.36% |
Ratios to Average Net Assets F | |
Expenses before expense reductions | 1.05% A |
Expenses net of voluntary waivers, if any | 1.05% A |
Expenses net of all reductions | .99% A |
Net investment income (loss) | (.08)% A |
Supplemental Data | |
Net assets, end of period (000 omitted) | $ 582,689 |
Portfolio turnover rate | 60% A |
A Annualized
B Total returns for periods of less than one year are not annualized.
C Total returns would have been lower had certain expenses not been reduced during the periods shown.
D Calculated based on average shares outstanding during the period.
E For the period November 3, 2004 (commencement of operations) to July 31, 2005.
F Expense ratios reflect operating expenses of the class. Expenses before reductions do not reflect amounts reimbursed by the investment adviser or reductions from brokerage service arrangements or other expense offset arrangements and do not represent the amount paid by the class during periods when reimbursements or reductions occur. Expense ratios before reductions for start-up periods may not be representative of longer-term operating periods. Expenses net of any voluntary waivers reflect expenses after reimbursement by the investment adviser but prior to reductions from brokerage service arrangements or other expense offset arrangements. Expenses net of all reductions represent the net expenses paid by the class.
See accompanying notes which are an integral part of the financial statements.
Annual Report
Financial Highlights - Institutional Class
Year ended July 31, | 2005 E |
Selected Per-Share Data | |
Net asset value, beginning of period | $ 10.00 |
Income from Investment Operations | |
Net investment income (loss) D | (.01) |
Net realized and unrealized gain (loss) | 2.84 |
Total from investment operations | 2.83 |
Distributions from net investment income | (.01) |
Redemption fees added to paid in capital D | .01 |
Net asset value, end of period | $ 12.83 |
Total Return B, C | 28.36% |
Ratios to Average Net Assets F | |
Expenses before expense reductions | 1.07% A |
Expenses net of voluntary waivers, if any | 1.07% A |
Expenses net of all reductions | 1.01% A |
Net investment income (loss) | (.10)% A |
Supplemental Data | |
Net assets, end of period (000 omitted) | $ 3,761 |
Portfolio turnover rate | 60% A |
A Annualized
B Total returns for periods of less than one year are not annualized.
C Total returns would have been lower had certain expenses not been reduced during the periods shown.
D Calculated based on average shares outstanding during the period.
E For the period November 3, 2004 (commencement of operations) to July 31, 2005.
F Expense ratios reflect operating expenses of the class. Expenses before reductions do not reflect amounts reimbursed by the investment adviser or reductions from brokerage service arrangements or other expense offset arrangements and do not represent the amount paid by the class during periods when reimbursements or reductions occur. Expense ratios before reductions for start-up periods may not be representative of longer-term operating periods. Expenses net of any voluntary waivers reflect expenses after reimbursement by the investment adviser but prior to reductions from brokerage service arrangements or other expense offset arrangements. Expenses net of all reductions represent the net expenses paid by the class.
See accompanying notes which are an integral part of the financial statements.
Annual Report
Notes to Financial Statements
For the period ended July 31, 2005
1. Significant Accounting Policies.
Fidelity Small Cap Value Fund (the fund) is a non-diversified fund of Fidelity Securities Fund (the trust) and is authorized to issue an unlimited number of shares. The trust is registered under the Investment Company Act of 1940, as amended (the 1940 Act), as an open-end management investment company organized as a Massachusetts business trust.
The fund offers Class A, Class T, Class B, Class C, Small Cap Value, and Institutional Class shares, each of which has equal rights as to assets and voting privileges. Each class has exclusive voting rights with respect to matters that affect that class. Class B shares will automatically convert to Class A shares after a holding period of seven years from the initial date of purchase. Investment income, realized and unrealized capital gains and losses, the common expenses of the fund, and certain fund-level expense reductions, if any, are allocated on a pro rata basis to each class based on the relative net assets of each class to the total net assets of the fund. Each class differs with respect to transfer agent and distribution and service plan fees incurred. Certain expense reductions also differ by class.
The financial statements have been prepared in conformity with accounting principles generally accepted in the United States of America, which require management to make certain estimates and assumptions at the date of the financial statements. The following summarizes the significant accounting policies of the fund:
Security Valuation. Net asset value per share (NAV calculation) is calculated as of the close of business of the New York Stock Exchange, normally 4:00 p.m. Eastern time. Equity securities, including restricted securities, for which market quotations are available are valued at the last sale price or official closing price (closing bid price or last evaluated quote if no sale has occurred) on the primary market or exchange on which they trade. Debt securities, including restricted securities, for which quotations are readily available are valued at their most recent bid prices (sales prices if the principal market is an exchange) in the principal market in which such securities are normally traded, as determined by recognized dealers in such securities, or securities are valued on the basis of information provided by a pricing service. Pricing services use valuation matrices that incorporate both dealer-supplied valuations and valuation models. If prices are not readily available or do not accurately reflect fair value for a security, or if a security's value has been materially affected by events occurring after the close of the exchange or market on which the security is principally traded, that security may be valued by another method that the Board of Trustees believes accurately reflects fair value. A security's valuation may differ depending on the method used for determining value. Price movements in futures contracts and ADRs, market and trading trends, the bid/ask quotes of brokers and off-exchange institutional trading may be reviewed in the
Annual Report
1. Significant Accounting Policies - continued
Security Valuation - continued
course of making a good faith determination of a security's fair value. Short-term securities with remaining maturities of sixty days or less for which quotations are not readily available are valued on the basis of amortized cost. Investments in open-end investment companies are valued at their net asset value each business day.
Foreign Currency. The fund uses foreign currency contracts to facilitate transactions in foreign-denominated securities. Losses from these transactions may arise from changes in the value of the foreign currency or if the counterparties do not perform under the contracts' terms.
Foreign-denominated assets, including investment securities, and liabilities are translated into U.S. dollars at the exchange rate at period end. Purchases and sales of investment securities, income and dividends received and expenses denominated in foreign currencies are translated into U.S. dollars at the exchange rate in effect on the transaction date.
The effects of exchange rate fluctuations on investments are included with the net realized and unrealized gain (loss) on investment securities. Other foreign currency transactions resulting in realized and unrealized gain (loss) are disclosed separately.
Investment Transactions and Income. Security transactions are accounted for as of trade date. Gains and losses on securities sold are determined on the basis of identified cost. Dividend income is recorded on the ex-dividend date, except for certain dividends from foreign securities where the ex-dividend date may have passed, which are recorded as soon as the fund is informed of the ex-dividend date. Non-cash dividends included in dividend income, if any, are recorded at the fair market value of the securities received. Distributions received on securities that represent a return of capital or capital gain are recorded as a reduction of cost of investments and/or as a realized gain. The fund estimates the components of distributions received that may be considered return of capital distributions or capital gain distributions. Interest income is accrued as earned. Interest income includes coupon interest and amortization of premium and accretion of discount on debt securities. Investment income is recorded net of foreign taxes withheld where recovery of such taxes is uncertain.
Expenses. Most expenses of the trust can be directly attributed to a fund. Expenses which cannot be directly attributed are apportioned among each fund in the trust.
Income Tax Information and Distributions to Shareholders. Each year, the fund intends to qualify as a regulated investment company by distributing all of its taxable income and realized gains under Subchapter M of the Internal Revenue Code. As a result, no provision for income taxes is required in the accompanying financial statements.
Annual Report
Notes to Financial Statements - continued
1. Significant Accounting Policies - continued
Income Tax Information and Distributions to Shareholders - continued
Foreign taxes are provided for based on the fund's understanding of the tax rules and rates that exist in the foreign markets in which it invests.
Distributions are recorded on the ex-dividend date. Income dividends and capital gain distributions are declared separately for each class. Income and capital gain distributions are determined in accordance with income tax regulations, which may differ from generally accepted accounting principles. In addition, the fund will claim a portion of the payment made to redeeming shareholders as a distribution for income tax purposes.
Capital accounts within the financial statements are adjusted for permanent book-tax differences. These adjustments have no impact on net assets or the results of operations. Temporary book-tax differences will reverse in a subsequent period.
Book-tax differences are primarily due to short-term capital gains, foreign currency transactions, passive foreign investment companies (PFIC) and losses deferred due to wash sales.
The tax-basis components of distributable earnings and the federal tax cost as of period end were as follows:
Unrealized appreciation | $ 67,705,489 | |
Unrealized depreciation | (11,339,549) | |
Net unrealized appreciation (depreciation) | 56,365,940 | |
Undistributed ordinary income | 14,695,235 | |
| | |
Cost for federal income tax purposes | $ 580,418,315 | |
The tax character of distributions paid was as follows:
| July 31, 2005 | |
Ordinary Income | $ 69,595 | |
Short-Term Trading (Redemption) Fees. Shares held in the fund less than 90 days are subject to a redemption fee equal to 1.50% of the proceeds of the redeemed shares. All redemption fees, including any estimated redemption fees paid by Fidelity Management and Research Company (FMR), are retained by the fund and accounted for as an addition to paid in capital.
Annual Report
2. Operating Policies.
Repurchase Agreements. FMR has received an Exemptive Order from the Securities and Exchange Commission (the SEC) which permits the fund and other affiliated entities of FMR to transfer uninvested cash balances into joint trading accounts which are then invested in repurchase agreements. The fund may also invest directly with institutions in repurchase agreements. Repurchase agreements are collateralized by government or non-government securities. Collateral is held in segregated accounts with custodian banks and may be obtained in the event of a default of the counterparty. The fund monitors, on a daily basis, the value of the collateral to ensure it is at least equal to the principal amount of the repurchase agreement (including accrued interest). In the event of a default by the counterparty, realization of the collateral proceeds could be delayed, during which time the value of the collateral may decline.
Restricted Securities. The fund may invest in securities that are subject to legal or contractual restrictions on resale. These securities generally may be resold in transactions exempt from registration or to the public if the securities are registered. Disposal of these securities may involve time-consuming negotiations and expense, and prompt sale at an acceptable price may be difficult. Information regarding restricted securities is included at the end of the fund's Schedule of Investments.
3. Purchases and Sales of Investments.
Purchases and sales of securities, other than short-term securities and U.S. government securities, aggregated $635,585,396 and $130,951,513, respectively.
4. Fees and Other Transactions with Affiliates.
Management Fee. FMR and its affiliates provide the fund with investment management related services for which the fund pays a monthly management fee. The management fee is the sum of an individual fund fee rate that is based on an annual rate of .45% of the fund's average net assets and a group fee rate that averaged .27% during the period. The group fee rate is based upon the average net assets of all the mutual funds advised by FMR. The group fee rate decreases as assets under management increase and increases as assets under management decrease. In addition, the management fee is subject to a performance adjustment (up to a maximum of ± .20% of the fund's average net assets over a 36 month performance period). The upward or downward adjustment to the management fee is based on the fund's relative investment performance as compared to an appropriate benchmark index. The fund's performance adjustment will not take effect until November 2005. Subsequent months will be added until the performance period includes 36 months. For the period, the total annualized management fee rate was .72% of the fund's average net assets.
Annual Report
Notes to Financial Statements - continued
4. Fees and Other Transactions with Affiliates - continued
Distribution and Service Plan. In accordance with Rule 12b-1 of the 1940 Act, the fund has adopted separate Distribution and Service Plans for each class of shares. Certain classes pay Fidelity Distributors Corporation (FDC), an affiliate of FMR, separate Distribution and Service Fees, each of which is based on an annual percentage of each class' average net assets. In addition, FDC may pay financial intermediaries for selling shares of the fund and providing shareholder support services. For the period, the Distribution and Service Fee rates and the total amounts paid to and retained by FDC were as follows:
| Distribution
Fee | Service
Fee | Paid to
FDC | Retained
by FDC |
Class A | 0% | .25% | $ 7,461 | $ 1,194 |
Class T | .25% | .25% | 12,596 | 2,172 |
Class B | .75% | .25% | 14,541 | 12,157 |
Class C | .75% | .25% | 37,636 | 16,080 |
| | | $ 72,234 | $ 31,603 |
Sales Load. FDC receives a front-end sales charge of up to 5.75% for selling Class A shares, and 3.50% for selling Class T shares, some of which is paid to financial intermediaries for selling shares of the fund. FDC receives the proceeds of contingent deferred sales charges levied on Class A, Class T, Class B, and Class C redemptions. These charges depend on the holding period. The deferred sales charges range from 5% to 1% for Class B, 1% for Class C, and .25% for certain purchases of Class A and Class T shares.
For the period, sales charge amounts retained by FDC were as follows:
| Retained
by FDC | |
Class A | $ 24,744 | |
Class T | 6,938 | |
Class B* | 1,116 | |
Class C* | 324 | |
| $ 33,122 | |
* When Class B and Class C shares are initially sold, FDC pays commissions from its own resources to financial intermediaries through which the sales are made.
Transfer Agent Fees. Fidelity Investments Institutional Operations Company, Inc. (FIIOC), an affiliate of FMR, is the transfer, dividend disbursing and shareholder servicing agent for each class of the fund, except for Small Cap Value. Fidelity Service Company, Inc. (FSC), an affiliate of FMR, is the transfer agent for Small Cap Value shares. FIIOC and FSC receive account fees and asset-based fees that vary according to the account size and type of account of the shareholders of the respective classes of the fund.
Annual Report
4. Fees and Other Transactions with Affiliates - continued
Transfer Agent Fees - continued
FIIOC and FSC pay for typesetting, printing and mailing of shareholder reports, except proxy statements. For the period the total transfer agent fees paid by each class to FIIOC or FSC, were as follows:
| Amount | % of
Average
Net Assets |
Class A | $ 10,531 | .35* |
Class T | 8,940 | .35* |
Class B | 5,110 | .35* |
Class C | 11,895 | .32* |
Small Cap Value | 419,553 | .21* |
Institutional Class | 2,685 | .19* |
| $ 458,714 | |
* Annualized
Accounting and Security Lending Fees. FSC maintains the fund's accounting records. The accounting fee is based on the level of average net assets for the month. Under a separate contract, FSC administers the security lending program. The security lending fee is based on the number and duration of lending transactions.
Central Funds. The fund may invest in affiliated Central Funds managed by Fidelity Investments Money Management, Inc. (FIMM), an affiliate of FMR. The Central Funds are open-end investment companies available only to investment companies and other accounts managed by FMR and its affiliates. The Money Market Central Funds seek preservation of capital and current income. The Central Funds do not pay a management fee. Income distributions earned by the fund are recorded as income in the accompanying financial statements and totaled $476,355 for the period.
Brokerage Commissions. The fund placed a portion of its portfolio transactions with brokerage firms which are affiliates of the investment adviser. The commissions paid to these affiliated firms were $50,063 for the period.
5. Committed Line of Credit.
The fund participates with other funds managed by FMR in a $4.2 billion credit facility (the "line of credit") to be utilized for temporary or emergency purposes to fund shareholder redemptions or for other short-term liquidity purposes. The fund has agreed to pay commitment fees on its pro rata portion of the line of credit. During the period, there were no borrowings on this line of credit.
Annual Report
Notes to Financial Statements - continued
6. Security Lending.
The fund lends portfolio securities from time to time in order to earn additional income. The fund receives collateral (in the form of U.S. Treasury obligations, letters of credit and/or cash) against the loaned securities and maintains collateral in an amount not less than 100% of the market value of the loaned securities during the period of the loan. The market value of the loaned securities is determined at the close of business of the fund and any additional required collateral is delivered to the fund on the next business day. If the borrower defaults on its obligation to return the securities loaned because of insolvency or other reasons, a fund could experience delays and costs in recovering the securities loaned or in gaining access to the collateral. Cash collateral is invested in the Fidelity Securities Lending Cash Central Fund. The value of loaned securities and cash collateral at period end are disclosed on the fund's Statement of Assets and Liabilities.
7. Expense Reductions.
FMR voluntarily agreed to reimburse each class to the extent annual operating expenses exceeded certain levels of average net assets as noted in the table below. Some expenses, for example interest expense, are excluded from this reimbursement.
The following classes were in reimbursement during the period:
| Expense
Limitations | Reimbursement
from adviser |
| | |
Class A | 1.50% - 1.40%* | $ 698 |
Class T | 1.75% - 1.65%* | 1,050 |
Class B | 2.25% - 2.15%* | 717 |
| | $ 2,465 |
* Expense limitation in effect at period end
Many of the brokers with whom FMR places trades on behalf of the fund provided services to the fund in addition to trade execution. These services included payments of certain expenses on behalf of the fund totaling $126,495 for the period. In addition, through arrangements with the fund's custodian, credits realized as a result of uninvested cash balances were used to reduce the fund's expenses. During the period, these credits reduced the fund's custody expenses by $840.
Annual Report
8. Other.
The fund's organizational documents provide former and current trustees and officers with a limited indemnification against liabilities arising in connection with the performance of their duties to the fund. In the normal course of business, the fund may also enter into contracts that provide general indemnifications. The fund's maximum exposure under these arrangements is unknown as this would be dependent on future claims that may be made against the fund. The risk of material loss from such claims is considered remote.
9. Distributions to Shareholders.
Distributions to shareholders of each class were as follows:
| Year ended
July 31, 2005 | |
From net investment income | | |
Class A | $ 724 | |
Small Cap Value | 68,438 | |
Institutional Class | 433 | |
Total | $ 69,595 | |
Annual Report
Notes to Financial Statements - continued
10. Share Transactions.
Transactions for each class of shares were as follows:
| Shares | Dollars |
| For the period
November 3, 2004
(commencement of
sale of shares) to
July 31, 2005 | For the period
November 3, 2004
(commencement of
sale of shares) to
July 31, 2005 |
Class A | | |
Shares sold | 750,692 | $ 8,523,912 |
Reinvestment of distributions | 54 | 590 |
Shares redeemed | (16,899) | (197,248) |
Net increase (decrease) | 733,847 | $ 8,327,254 |
Class T | | |
Shares sold | 1,010,520 | $ 11,960,654 |
Shares redeemed | (14,888) | (175,516) |
Net increase (decrease) | 995,632 | $ 11,785,138 |
Class B | | |
Shares sold | 314,195 | $ 3,487,462 |
Shares redeemed | (5,436) | (61,184) |
Net increase (decrease) | 308,759 | $ 3,426,278 |
Class C | | |
Shares sold | 952,687 | $ 10,586,807 |
Shares redeemed | (31,551) | (363,557) |
Net increase (decrease) | 921,136 | $ 10,223,250 |
Small Cap Value | | |
Shares sold | 49,836,348 | $ 566,509,509 |
Reinvestment of distributions | 6,024 | 66,450 |
Shares redeemed | (4,432,148) | (50,921,377) |
Net increase (decrease) | 45,410,224 | $ 515,654,582 |
Institutional Class | | |
Shares sold | 315,268 | $ 3,439,515 |
Reinvestment of distributions | 39 | 433 |
Shares redeemed | (22,206) | (247,594) |
Net increase (decrease) | 293,101 | $ 3,192,354 |
Annual Report
Report of Independent Registered Public Accounting Firm
To the Trustees of Fidelity Securities Fund and the Shareholders of Fidelity Small Cap Value Fund:
In our opinion, the accompanying statement of assets and liabilities, including the schedule of investments, and the related statements of operations and of changes in net assets and the financial highlights present fairly, in all material respects, the financial position of Fidelity Small Cap Value Fund (a fund of Fidelity Securities Fund) at July 31, 2005 and the results of its operations, the changes in its net assets and the financial highlights for the period indicated, in conformity with accounting principles generally accepted in the United States of America. These financial statements and financial highlights (hereafter referred to as "financial statements") are the responsibility of the Fidelity Small Cap Value Fund's management; our responsibility is to express an opinion on these financial statements based on our audit. We conducted our audit of these financial statements in accordance with the standards of the Public Company Accounting Oversight Board (United States). Those standards require that we plan and perform the audit to obtain reasonable assurance about whether the financial statements are free of material misstatement. An audit includes examining, on a test basis, evidence supporting the amounts and disclosures in the financial statements, assessing the accounting principles used and significant estimates made by management, and evaluating the overall financial statement presentation. We believe that our audit, which included confirmation of securities at July 31, 2005 by correspondence with the custodian and brokers, provides a reasonable basis for our opinion.
/s/ PricewaterhouseCoopers LLP
PricewaterhouseCoopers LLP
Boston, Massachusetts
September 13, 2005
Annual Report
Trustees and Officers
The Trustees, Members of the Advisory Board, and executive officers of the trust and fund, as applicable, are listed below. The Board of Trustees governs the fund and is responsible for protecting the interests of shareholders. The Trustees are experienced executives who meet periodically throughout the year to oversee the fund's activities, review contractual arrangements with companies that provide services to the fund, and review the fund's performance. Except for William O. McCoy, Stephen P. Jonas, and Kenneth L. Wolfe, each of the Trustees oversees 320 funds advised by FMR or an affiliate. Mr. McCoy oversees 322 funds advised by FMR or an affiliate. Mr. Jonas and Mr. Wolfe oversee 311 funds advised by FMR or an affiliate.
The Trustees hold office without limit in time except that (a) any Trustee may resign; (b) any Trustee may be removed by written instrument, signed by at least two-thirds of the number of Trustees prior to such removal; (c) any Trustee who requests to be retired or who has become incapacitated by illness or injury may be retired by written instrument signed by a majority of the other Trustees; and (d) any Trustee may be removed at any special meeting of shareholders by a two-thirds vote of the outstanding voting securities of the trust. Each Trustee who is not an interested person (as defined in the 1940 Act) (Independent Trustee), shall retire not later than the last day of the calendar year in which his or her 72nd birthday occurs. The Independent Trustees may waive this mandatory retirement age policy with respect to individual Trustees. The executive officers and Advisory Board Members hold office without limit in time, except that any officer and Advisory Board Member may resign or may be removed by a vote of a majority of the Trustees at any regular meeting or any special meeting of the Trustees. Except as indicated, each individual has held the office shown or other offices in the same company for the past five years.
The fund's Statement of Additional Information (SAI) includes more information about the Trustees. To request a free copy, call Fidelity at 1-800-544-8544.
Interested Trustees*:
Correspondence intended for each Trustee who is an interested person may be sent to Fidelity Investments, 82 Devonshire Street, Boston, Massachusetts 02109.
Name, Age; Principal Occupation |
Edward C. Johnson 3d (75)** |
| Year of Election or Appointment: 1984 Mr. Johnson is Chairman of the Board of Trustees. Mr. Johnson serves as Chief Executive Officer, Chairman, and a Director of FMR Corp.; a Director and Chairman of the Board and of the Executive Committee of FMR; Chairman and a Director of Fidelity Management & Research (Far East) Inc.; Chairman and a Director of Fidelity Investments Money Management, Inc.; and Chairman (2001-present) and a Director (2000-present) of FMR Co., Inc. |
Abigail P. Johnson (43)** |
| Year of Election or Appointment: 2001 Ms. Johnson serves as President of Fidelity Employer Services Company (FESCO) (2005-present). She is President and a Director of Fidelity Investments Money Management, Inc. (2001-present), FMR Co., Inc. (2001-present), and a Director of FMR Corp. Previously, Ms. Johnson served as President and a Director of FMR (2001-2005), Senior Vice President of the Fidelity funds (2001-2005), and managed a number of Fidelity funds. |
Stephen P. Jonas (52) |
| Year of Election or Appointment: 2005 Mr. Jonas is Senior Vice President of Small Cap Value (2005-present). He also serves as Senior Vice President of other Fidelity funds (2005-present). Mr. Jonas is Executive Director of FMR (2005-present). Previously, Mr. Jonas served as President of Fidelity Enterprise Operations and Risk Services (2004-2005), Chief Administrative Officer (2002-2004), and Chief Financial Officer of FMR Co. (1998-2000). Mr. Jonas has been with Fidelity Investments since 1987 and has held various financial and management positions including Chief Financial Officer with FMR. In addition, he serves on the Boards of Boston Ballet (2003-present) and Simmons College (2003-present). |
Robert L. Reynolds (53) |
| Year of Election or Appointment: 2003 Mr. Reynolds is a Director (2003-present) and Chief Operating Officer (2002-present) of FMR Corp. He also serves on the Board at Fidelity Investments Canada, Ltd. (2000-present). Previously, Mr. Reynolds served as President of Fidelity Investments Institutional Retirement Group (1996-2000). |
* Trustees have been determined to be "Interested Trustees" by virtue of, among other things, their affiliation with the trust or various entities under common control with FMR.
** Edward C. Johnson 3d, Trustee, is Abigail P. Johnson's father.
Annual Report
Independent Trustees:
Correspondence intended for each Independent Trustee (that is, the Trustees other than the Interested Trustees) may be sent to Fidelity Investments, P.O. Box 55235, Boston, Massachusetts 02205-5235.
Name, Age; Principal Occupation |
Dennis J. Dirks (57) |
| Year of Election or Appointment: 2005 Prior to his retirement in May 2003, Mr. Dirks was Chief Operating Officer and a member of the Board of The Depository Trust & Clearing Corporation (DTCC) (1999-2003). He also served as President, Chief Operating Officer, and Board member of The Depository Trust Company (DTC) (1999-2003) and President and Board member of the National Securities Clearing Corporation (NSCC) (1999-2003). In addition, Mr. Dirks served as Chief Executive Officer and Board member of the Government Securities Clearing Corporation (2001-2003) and Chief Executive Officer and Board member of the Mortgage-Backed Securities Clearing Corporation (2001-2003). Mr. Dirks also serves as a Trustee of Manhattan College (2005-present). |
Robert M. Gates (61) |
| Year of Election or Appointment: 1997 Dr. Gates is Vice Chairman of the Independent Trustees (2005-present). Dr. Gates is President of Texas A&M University (2002-present). He was Director of the Central Intelligence Agency (CIA) from 1991 to 1993. From 1989 to 1991, Dr. Gates served as Assistant to the President of the United States and Deputy National Security Advisor. Dr. Gates is a Director of NACCO Industries, Inc. (mining and manufacturing), Parker Drilling Co., Inc. (drilling and rental tools for the energy industry, 2001-present), and Brinker International (restaurant management, 2003-present). Previously, Dr. Gates served as a Director of LucasVarity PLC (automotive components and diesel engines), a Director of TRW Inc. (automotive, space, defense, and information technology), and Dean of the George Bush School of Government and Public Service at Texas A&M University (1999-2001). Dr. Gates also is a Trustee of the Forum for International Policy. |
George H. Heilmeier (69) |
| Year of Election or Appointment: 2004 Dr. Heilmeier is Chairman Emeritus of Telcordia Technologies (communication software and systems), where prior to his retirement, he served as company Chairman and Chief Executive Officer. He currently serves on the Boards of Directors of The Mitre Corporation (systems engineering and information technology support for the government), and HRL Laboratories (private research and development, 2004-present). He is Chairman of the General Motors Science & Technology Advisory Board and a Life Fellow of the Institute of Electrical and Electronics Engineers (IEEE) (2000-present). Dr. Heilmeier is a member of the Defense Science Board and the National Security Agency Advisory Board. He is also a member of the National Academy of Engineering, the American Academy of Arts and Sciences, and the Board of Overseers of the School of Engineering and Applied Science of the University of Pennsylvania. Previously, Dr. Heilmeier served as a Director of TRW Inc. (automotive, space, defense, and information technology, 1992-2002), Compaq (1994-2002), Automatic Data Processing, Inc. (ADP) (technology-based business outsourcing, 1995-2002), INET Technologies Inc. (telecommunications network surveillance, 2001-2004), and Teletech Holdings (customer management services). He is the recipient of the 2005 Kyoto Prize in Advanced Technology for his invention of the liquid display. |
Marie L. Knowles (58) |
| Year of Election or Appointment: 2001 Prior to Ms. Knowles' retirement in June 2000, she served as Executive Vice President and Chief Financial Officer of Atlantic Richfield Company (ARCO) (diversified energy, 1996-2000). From 1993 to 1996, she was a Senior Vice President of ARCO and President of ARCO Transportation Company. She served as a Director of ARCO from 1996 to 1998. She currently serves as a Director of Phelps Dodge Corporation (copper mining and manufacturing) and McKesson Corporation (healthcare service, 2002-present). Ms. Knowles is a Trustee of the Brookings Institution and the Catalina Island Conservancy and also serves as a member of the Advisory Board for the School of Engineering of the University of Southern California. |
Ned C. Lautenbach (61) |
| Year of Election or Appointment: 2000 Mr. Lautenbach has been a partner of Clayton, Dubilier & Rice, Inc. (private equity investment firm) since September 1998. Previously, Mr. Lautenbach was with the International Business Machines Corporation (IBM) from 1968 until his retirement in 1998. Mr. Lautenbach serves as a Director of Italtel Holding S.p.A. (telecommunications (Milan, Italy), 2004-present) and Eaton Corporation (diversified industrial) as well as the Philharmonic Center for the Arts in Naples, Florida. He also is a member of the Board of Trustees of Fairfield University (2005-present), as well as a member of the Council on Foreign Relations. |
Marvin L. Mann (72) |
| Year of Election or Appointment: 1993 Mr. Mann is Chairman of the Independent Trustees (2001-present). He is Chairman Emeritus of Lexmark International, Inc. (computer peripherals), where he served as CEO until April 1998, retired as Chairman May 1999, and remains a member of the Board. Prior to 1991, he held the positions of Vice President of International Business Machines Corporation (IBM) and President and General Manager of various IBM divisions and subsidiaries. He is a member of the Executive Committee of the Independent Director's Council of the Investment Company Institute. In addition, Mr. Mann is a member of the President's Cabinet at the University of Alabama and the Board of Visitors of the Culverhouse College of Commerce and Business Administration at the University of Alabama. |
William O. McCoy (71) |
| Year of Election or Appointment: 1997 Prior to his retirement in December 1994, Mr. McCoy was Vice Chairman of the Board of BellSouth Corporation (telecommunications) and President of BellSouth Enterprises. He is currently a Director of Liberty Corporation (holding company), Duke Realty Corporation (real estate), and Progress Energy, Inc. (electric utility). He is also a partner of Franklin Street Partners (private investment management firm) and a member of the Research Triangle Foundation Board. In addition, Mr. McCoy served as the Interim Chancellor (1999-2000) and a member of the Board of Visitors for the University of North Carolina at Chapel Hill and currently serves on the Board of Directors of the University of North Carolina Health Care System and the Board of Visitors of the Kenan-Flagler Business School (University of North Carolina at Chapel Hill). He also served as Vice President of Finance for the University of North Carolina (16-school system). |
Cornelia M. Small (61) |
| Year of Election or Appointment: 2005 Ms. Small is a member (2000-present) and Chairperson (2002-present) of the Investment Committee, and a member (2002-present) of the Board of Trustees of Smith College. Previously, she served as Chief Investment Officer (1999-2000), Director of Global Equity Investments (1996-1999), and a member of the Board of Directors of Scudder, Stevens & Clark (1990-1997) and Scudder Kemper Investments (1997-1998). In addition, Ms. Small served as Co-Chair (2000-2003) of the Annual Fund for the Fletcher School of Law and Diplomacy. |
William S. Stavropoulos (66) |
| Year of Election or Appointment: 2002 Mr. Stavropoulos is Chairman of the Board (2000-present) and a Member of the Board of Directors of The Dow Chemical Company. Since joining The Dow Chemical Company in 1967, Mr. Stavropoulos served in numerous senior management positions, including President (1993-2000; 2002-2003), CEO (1995-2000; 2002-2004), and Chairman of the Executive Committee (2000-2004). Currently, he is a Director of NCR Corporation (data warehousing and technology solutions), BellSouth Corporation (telecommunications), Chemical Financial Corporation, Maersk Inc. (industrial conglomerate, 2002-present), and Metalmark Capital (private equity investment firm, 2005-present). He also serves as a member of the Board of Trustees of the American Enterprise Institute for Public Policy Research. In addition, Mr. Stavropoulos is a member of The Business Council, J.P. Morgan International Council and the University of Notre Dame Advisory Council for the College of Science. |
Kenneth L. Wolfe (66) |
| Year of Election or Appointment: 2005 Mr. Wolfe also serves as a Trustee (2005-present) or Member of the Advisory Board (2004-present) of other investment companies advised by FMR. Prior to his retirement in 2001, Mr. Wolfe was Chairman and Chief Executive Officer of Hershey Foods Corporation (1993-2001). He currently serves as a member of the boards of Adelphia Communications Corporation (2003-present), Bausch & Lomb, Inc., and Revlon Inc. (2004-present). |
Annual Report
Advisory Board Members and Executive Officers:
Correspondence intended for Mr. Gamper may be sent to Fidelity Investments, P.O. Box 55235, Boston, Massachusetts 02205-5235. Correspondence intended for each executive officer and Mr. Lynch may be sent to Fidelity Investments, 82 Devonshire Street, Boston, Massachusetts 02109.
Name, Age; Principal Occupation |
Albert R. Gamper, Jr. (63) |
| Year of Election or Appointment: 2005 Member of the Advisory Board of Fidelity Securities Fund. Prior to his retirement in December 2004, Mr. Gamper served as Chairman of the Board of CIT Group Inc. (commercial finance). During his tenure with CIT Group Inc. Mr. Gamper served in numerous senior management positions, including Chairman (1987-1989; 1999-2001; 2002-2004), Chief Executive Officer (1987-2004), and President (1989-2002). He currently serves as a member of the Board of Directors of Public Service Enterprise Group (utilities, 2001-present), Chairman of the Board of Governors, Rutgers University (2004-present), and Chairman of the Board of Saint Barnabas Health Care System. |
Peter S. Lynch (61) |
| Year of Election or Appointment: 2003 Member of the Advisory Board of Fidelity Securities Fund. Vice Chairman and a Director of FMR, and Vice Chairman (2001-present) and a Director (2000-present) of FMR Co., Inc. Previously, Mr. Lynch served as a Trustee of the Fidelity funds (1990-2003). In addition, he serves as a Trustee of Boston College, Massachusetts Eye & Ear Infirmary, Historic Deerfield, John F. Kennedy Library, and the Museum of Fine Arts of Boston. |
Dwight D. Churchill (51) |
| Year of Election or Appointment: 2005 Vice President of Small Cap Value. Mr. Churchill also serves as Vice President of certain Equity Funds (2005-present) and certain High Income Funds (2005-present). Previously, he served as Head of Fidelity's Fixed-Income Division (2000-2005), Vice President of Fidelity's Money Market Funds (2000-2005), Vice President of Fidelity's Bond Funds, and Senior Vice President of FIMM (2000) and FMR. Mr. Churchill joined Fidelity in 1993 as Vice President and Group Leader of Taxable Fixed-Income Investments. |
Walter C. Donovan (43) |
| Year of Election or Appointment: 2005 Vice President of Small Cap Value. Mr. Donovan also serves as Vice President of Fidelity's High Income Funds (2005-present), Fidelity's Fixed-Income Funds (2005-present), certain Asset Allocation Funds (2005-present), and certain Balanced Funds (2005-present). Mr. Donovan also serves as Executive Vice President of FMR (2005-present) and FMRC (2005-present). Previously, Mr. Donovan served as Vice President and Director of Fidelity's International Equity Trading group (1998-2005). |
Eric D. Roiter (56) |
| Year of Election or Appointment: 2004 Secretary of Small Cap Value. He also serves as Secretary of other Fidelity funds; Vice President, General Counsel, and Secretary of FMR Co., Inc. (2001-present) and FMR; Assistant Secretary of Fidelity Management & Research (U.K.) Inc. (2001-present), Fidelity Management & Research (Far East) Inc. (2001-present), and Fidelity Investments Money Management, Inc. (2001-present). Mr. Roiter is an Adjunct Member, Faculty of Law, at Boston College Law School (2003-present). Previously, Mr. Roiter served as Vice President and Secretary of Fidelity Distributors Corporation (FDC) (1998-2005). |
Stuart Fross (45) |
| Year of Election or Appointment: 2004 Assistant Secretary of Small Cap Value. Mr. Fross also serves as Assistant Secretary of other Fidelity funds (2003-present), Vice President and Secretary of FDC (2005-present), and is an employee of FMR. |
Christine Reynolds (46) |
| Year of Election or Appointment: 2004 President, Treasurer, and Anti-Money Laundering (AML) officer of Small Cap Value. Ms. Reynolds also serves as President, Treasurer, and AML officer of other Fidelity funds (2004) and is a Vice President (2003) and an employee (2002) of FMR. Before joining Fidelity Investments, Ms. Reynolds worked at PricewaterhouseCoopers LLP (PwC) (1980-2002), where she was most recently an audit partner with PwC's investment management practice. |
Timothy F. Hayes (54) |
| Year of Election or Appointment: 2004 Chief Financial Officer of Small Cap Value. Mr. Hayes also serves as Chief Financial Officer of other Fidelity funds (2002-present) and President of Fidelity Investment Operations (2005-present) which includes Fidelity Pricing and Cash Management Services Group (FPCMS), where he served as President (1998-2005). Mr. Hayes serves as President of Fidelity Service Company (2003-present) where he also serves as a Director. Mr. Hayes also served as President of Fidelity Investments Operations Group (FIOG, 2002-2005). |
Kenneth A. Rathgeber (58) |
| Year of Election or Appointment: 2004 Chief Compliance Officer of Small Cap Value. Mr. Rathgeber also serves as Chief Compliance Officer of other Fidelity funds (2004) and Executive Vice President of Risk Oversight for Fidelity Investments (2002). Previously, he served as Executive Vice President and Chief Operating Officer for Fidelity Investments Institutional Services Company, Inc. (1998-2002). |
John R. Hebble (47) |
| Year of Election or Appointment: 2004 Deputy Treasurer of Small Cap Value. Mr. Hebble also serves as Deputy Treasurer of other Fidelity funds (2003), and is an employee of FMR. Before joining Fidelity Investments, Mr. Hebble worked at Deutsche Asset Management where he served as Director of Fund Accounting (2002-2003) and Assistant Treasurer of the Scudder Funds (1998-2003). |
Bryan A. Mehrmann (44) |
| Year of Election or Appointment: 2005 Deputy Treasurer of Small Cap Value. Mr. Mehrmann also serves as Deputy Treasurer of other Fidelity funds (2005-present) and is an employee of FMR. Previously, Mr. Mehrmann served as Vice President of Fidelity Investments Institutional Services Group (FIIS)/Fidelity Investments Institutional Operations Corporation, Inc. (FIIOC) Client Services (1998-2004). |
Kimberley H. Monasterio (41) |
| Year of Election or Appointment: 2004 Deputy Treasurer of Small Cap Value. Ms. Monasterio also serves as Deputy Treasurer of other Fidelity funds (2004) and is an employee of FMR (2004). Before joining Fidelity Investments, Ms. Monasterio served as Treasurer (2000-2004) and Chief Financial Officer (2002-2004) of the Franklin Templeton Funds and Senior Vice President of Franklin Templeton Services, LLC (2000-2004). |
Kenneth B. Robins (35) |
| Year of Election or Appointment:2005 Deputy Treasurer of Small Cap Value. Mr. Robins also serves as Deputy Treasurer of other Fidelity funds (2005-present) and is an employee of FMR (2004-present). Before joining Fidelity Investments, Mr. Robins worked at KPMG LLP, where he was a partner in KPMG's department of professional practice (2002-2004) and a Senior Manager (1999-2000). In addition, Mr. Robins served as Assistant Chief Accountant, United States Securities and Exchange Commission (2000-2002). |
Robert G. Byrnes (38) |
| Year of Election or Appointment: 2005 Assistant Treasurer of Small Cap Value. Mr. Byrnes also serves as Assistant Treasurer of other Fidelity funds (2005-present) and is an employee of FMR (2005-present). Previously, Mr. Byrnes served as Vice President of FPCMS (2003-2005). Before joining Fidelity Investments, Mr. Byrnes worked at Deutsche Asset Management where he served as Vice President of the Investment Operations Group (2000-2003). |
John H. Costello (58) |
| Year of Election or Appointment: 2004 Assistant Treasurer of Small Cap Value. Mr. Costello also serves as Assistant Treasurer of other Fidelity funds and is an employee of FMR. |
Peter L. Lydecker (51) |
| Year of Election or Appointment: 2004 Assistant Treasurer of Small Cap Value. Mr. Lydecker also serves as Assistant Treasurer of other Fidelity funds (2004) and is an employee of FMR. |
Mark Osterheld (50) |
| Year of Election or Appointment: 2004 Assistant Treasurer of Small Cap Value. Mr. Osterheld also serves as Assistant Treasurer of other Fidelity funds (2002) and is an employee of FMR. |
Gary W. Ryan (46) |
| Year of Election or Appointment: 2005 Assistant Treasurer of Small Cap Value. Mr. Ryan also serves as Assistant Treasurer of other Fidelity funds (2005-present) and is an employee of FMR (2005-present). Previously, Mr. Ryan served as Vice President of Fund Reporting in FPCMS (1999-2005). |
Salvatore Schiavone (39) |
| Year of Election or Appointment: 2005 Assistant Treasurer of Small Cap Value. Mr. Schiavone also serves as Assistant Treasurer of other Fidelity funds (2005-present) and is an employee of FMR (2005-present). Before joining Fidelity Investments, Mr. Schiavone worked at Deutsche Asset Management, where he most recently served as Assistant Treasurer (2003-2005) of the Scudder Funds and Vice President and Head of Fund Reporting (1996-2003). |
Annual Report
Distributions
The Board of Trustees of Small Cap Value voted to pay to shareholders of record at the opening of business on record date, the following distributions per share derived from capital gains realized from sales of portfolio securities:
| Pay Date | Record Date | Capital Gains |
Small Cap Value | 9/12/05 | 9/9/05 | $0.267 |
The fund hereby designates as capital gain dividends: for dividends with respect to the taxable year ended July 31, 2005, $16,591, or, if subsequently determined to be different, the net capital gain of such year.
Small Cap Value designates 56%, of the dividends distributed in December 2004 during the fiscal year as qualifying for the dividends-received deduction for corporate shareholders.
The fund will notify shareholders in January 2006 of amounts for use in preparing 2005 income tax returns.
Annual Report
Board Approval of Investment Advisory Contracts and Management Fees
Small Cap Value Fund
Each year, typically in July, the Board of Trustees, including the independent Trustees (together, the Board), votes on the renewal of the management contract and sub-advisory agreements (together, the Advisory Contracts) for the fund. The Board, assisted by the advice of fund counsel and independent Trustees' counsel, requests and considers a broad range of information throughout the year.
The Board meets regularly each month except August and takes into account throughout the year matters bearing on Advisory Contracts. The Board, acting directly and through its separate committees, considers at each of its meetings factors that are relevant to the annual renewal of the fund's Advisory Contracts, including the services and support provided to the fund and its shareholders by Fidelity. At the time of the renewal, the Board had 11 standing committees, each composed of independent Trustees with varying backgrounds, to which the Board has assigned specific subject matter responsibilities in order to enhance effective decision-making by the Board. Each committee has adopted a written charter outlining the structure and purposes of the committee. One such committee, the Equity Contract Committee, meets periodically during the first six months of each year and as necessary to consider matters specifically related to the annual renewal of Advisory Contracts. The committee requests and receives information on, and makes recommendations to the independent Trustees concerning, the approval and annual review of the Advisory Contracts.
At its July 2005 meeting, the Board of Trustees, including the independent Trustees, unanimously determined to renew the Advisory Contracts for the fund. In reaching its determination, the Board considered all factors it believed relevant, including (1) the nature, extent, and quality of the services to be provided to the fund and its shareholders by Fidelity (including the investment performance of the fund); (2) the competitiveness of the management fee and total expenses of the fund; (3) the total costs of the services to be provided by and the profits to be realized by the investment adviser and its affiliates from the relationship with the fund; (4) the extent to which economies of scale would be realized as the fund grows; and (5) whether fee levels reflect these economies of scale, if any, for the benefit of fund shareholders.
In determining whether to renew the Advisory Contracts for the fund, the Board ultimately reached a determination, with the assistance of fund counsel and independent Trustees' counsel, that the renewal of the Advisory Contracts and the compensation to be received by Fidelity under the management contract is consistent with Fidelity's fiduciary duty under applicable law. In addition to evaluating the specific factors noted above, the Board, in reaching its determination, is aware that shareholders in the fund have a broad range of investment choices available to them, including a wide choice among mutual funds offered by competitors to Fidelity, and that the fund's shareholders, with the opportunity to review and weigh the disclosure provided by the fund in its prospectus and other public disclosures, have chosen to invest in this fund, managed by Fidelity.
Annual Report
Nature, Extent, and Quality of Services Provided by Fidelity. The Board considered staffing within the investment adviser, FMR, and the sub-advisers (together, the Investment Advisers), including the background of the fund's portfolio manager and the fund's investment objective and discipline. The independent Trustees also had discussions with senior management of Fidelity's investment operations and investment groups. The Board considered the structure of the portfolio manager compensation program and whether this structure provides appropriate incentives.
Fidelity Resources Dedicated to Investment Management and Support Services. The Board reviewed the size, education, and experience of the Investment Advisers' investment staff, their use of technology, and the Investment Advisers' approach to recruiting, training, and retaining portfolio managers and other research, advisory, and management personnel. The Board considered Fidelity's extensive global research capabilities that enable the Investment Advisers to aggregate data from various sources in an effort to produce positive investment results. The Board noted that Fidelity's analysts have access to a variety of technological tools that enable them to perform both fundamental and quantitative analysis and to specialize in various disciplines. The Board also considered that Fidelity's portfolio managers and analysts have access to daily portfolio attribution that allows for monitoring of a fund's portfolio, as well as an electronic communication system that provides immediate real-time access to research concerning issuers and credit enhancers.
Shareholder and Administrative Services. The Board considered the nature, extent, quality, and cost of administrative, distribution, and shareholder services performed by the Investment Advisers and their affiliates under the Advisory Contracts and under separate agreements covering transfer agency, pricing and bookkeeping, and securities lending services for the fund. The Board also considered the nature and extent of the Investment Advisers' supervision of third party service providers, principally custodians and subcustodians. The Board reviewed the allocation of fund brokerage, including allocations to brokers affiliated with the Investment Advisers, the use of brokerage commissions to pay fund expenses, and the use of "soft" commission dollars to pay for research services. The Board also considered that Fidelity voluntarily decided in 2004 to stop using "soft" commission dollars to pay for market data and, instead, to pay for that data out of its own resources. The Board also considered the resources devoted to, and the record of compliance with, the fund's compliance policies and procedures.
The Board noted that the growth of fund assets across the complex allows Fidelity to reinvest in the development of services designed to enhance the value or convenience of the Fidelity funds as investment vehicles. These services include 24-hour access to account information and market information through phone representatives and over the Internet, and investor education materials and asset allocation tools.
Annual Report
Board Approval of Investment Advisory Contracts and
Management Fees - continued
Investment in a Large Fund Family. The Board considered the benefits to shareholders of investing in a Fidelity fund, including the benefits of investing in a fund that is part of a large family of funds offering a variety of investment disciplines and providing for a large variety of mutual fund investor services. For example, fund shareholders are offered the privilege of exchanging shares of the fund for shares of other Fidelity funds, as set forth in the fund's prospectus, without paying an additional sales charge. The Board noted that, since July 2004, Fidelity has taken a number of actions that benefited particular funds, including (i) voluntarily deciding in 2004 to stop using "soft" commission dollars to pay for market data and, instead, to pay for that data out of its own resources, (ii) contractually agreeing to impose management fee reductions and expense limitations on its five Spartan stock index funds and its stock index fund available through variable insurance products, (iii) contractually agreeing to eliminate the management fees on the Fidelity Freedom Funds and the Fidelity Advisor Freedom Funds, (iv) contractually agreeing to reduce the management fees on most of its investment-grade taxable bond funds, and (v) contractually agreeing to impose expense limitations on its retail and Spartan investment-grade taxable bond funds.
Investment Performance and Compliance. The Board considered whether the fund has operated within its investment objective, as well as its record of compliance with its investment restrictions. The Board noted that it is not possible to evaluate performance in any comprehensive fashion because the fund had been in operation for less than one calendar year. Once the fund has been in operation for at least one calendar year, the Board will review the fund's absolute investment performance for each class, as well as the fund's relative investment performance for each class measured against (i) a broad-based securities market index and (ii) a peer group of mutual funds deemed appropriate by the Board.
The Board also considered that, beginning November 1, 2005, the fund's management fee will be subject to upward or downward adjustment depending upon whether, and to what extent, the fund's investment performance for the performance period exceeds, or is exceeded by, the record (over the same period) of a Board-approved performance adjustment index. The Board realizes that the performance adjustment provides FMR with a strong economic incentive to seek to achieve superior performance for the fund's shareholders and helps to more closely align the interests of FMR and the fund's shareholders.
The Board has had thorough discussions with FMR throughout the year about the Board's and FMR's concerns about equity research, equity fund performance, and compliance with internal policies governing gifts and entertainment. FMR has taken steps that it believes will refocus and strengthen equity research and equity portfolio management and compliance. The Board noted with favor FMR's recent reorganization of its senior management team and FMR's plans to dedicate additional resources to investment research, and participated in the process that led to those changes.
Annual Report
Based on its review, and giving particular weight to the nature and quality of the resources dedicated by the Investment Advisers to maintain and improve relative performance, the Board concluded that the nature, extent, and quality of the services provided by Fidelity will benefit the fund's shareholders, particularly in light of the Board's view that the fund's shareholders benefit from investing in a fund that is part of a large family of funds offering a variety of investment disciplines and services.
Competitiveness of Management Fee and Total Fund Expenses. The Board considered the fund's management fee and total expenses compared to "mapped groups" of competitive funds and classes. Fidelity creates "mapped groups" by combining similar Lipper investment objective categories that have comparable management fee characteristics. Combining Lipper investment objective categories aids the Board's management fee and total expense comparisons by broadening the competitive group used for comparison and by reducing the number of universes to which various Fidelity funds are compared.
The Board considered two proprietary management fee comparisons for the period of the fund's operations shown in the chart below. The group of Lipper funds used by the Board for management fee comparisons is referred to below as the "Total Mapped Group" and, for the reasons explained above, is broader than the Lipper peer group used by the Board for performance comparisons. The Total Mapped Group comparison focuses on a fund's standing relative to the total universe of comparable funds available to investors, in terms of gross management fees before expense reimbursements or caps. "TMG %" represents the percentage of funds in the Total Mapped Group that had management fees that were lower than the fund's. For example, a TMG % of 16% means that 84% of the funds in the Total Mapped Group had higher management fees than the fund. The "Asset-Size Peer Group" (ASPG) comparison focuses on a fund's standing relative to non-Fidelity funds similar in size to the fund within the Total Mapped Group. The ASPG represents at least 15% of the funds in the Total Mapped Group with comparable asset size and management fee characteristics, subject to a minimum of 50 funds (or all funds in the Total Mapped Group if fewer than 50). Additional information, such as the ASPG quartile ("quadrant") in which the fund's management fee ranked, is also included in the chart and considered by the Board.
Annual Report
Board Approval of Investment Advisory Contracts and
Management Fees - continued
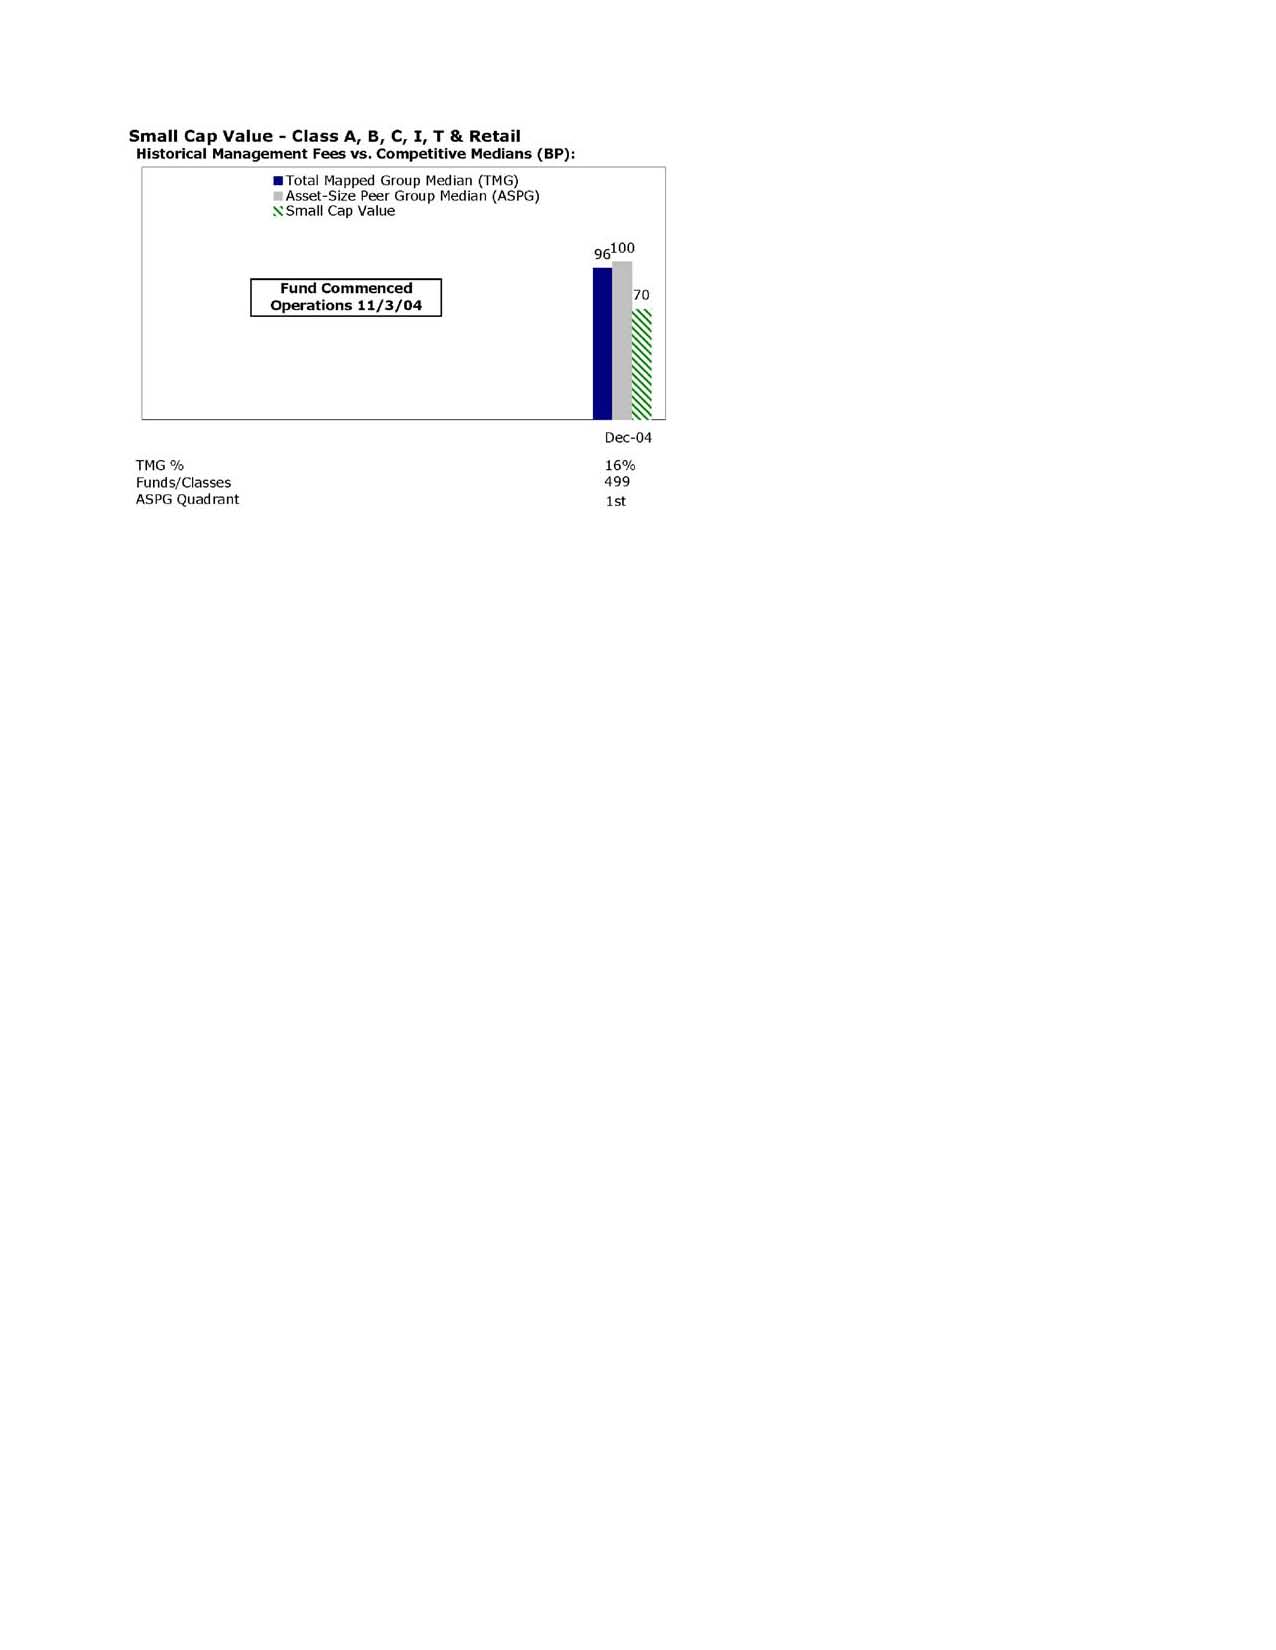
The Board noted that the fund's management fee ranked below the median of its Total Mapped Group and below the median of its ASPG for the period.
Based on its review, the Board concluded that the fund's management fee was fair and reasonable in light of the services that the fund receives and the other factors considered.
In its review of each class's total expenses, the Board considered the fund's management fee as well as other fund or class expenses, as applicable, such as transfer agent fees, pricing and bookkeeping fees, fund-paid 12b-1 fees, and custodial, legal, and audit fees. The Board also noted the effects of any waivers and reimbursements on fees and expenses. As part of its review, the Board also considered current and historical total expenses of each class of the fund compared to competitive fund median expenses. Each class of the fund is compared to those funds and classes in the Total Mapped Group (used by the Board for management fee comparisons) that have a similar sales load structure.
The Board noted that the total expenses of Fidelity Small Cap Value Fund (retail class) ranked below its competitive median for the period, the total expenses of Class A ranked equal to its competitive median for the period, and the total expenses of each of Class B, Class C, Class T and Institutional Class ranked above its competitive median for the period. The Board considered that the fund launched in November 2004 and that the classes were above median because of high expenses in basis points due to their small size. The Board noted that the fund offers multiple classes, each of which has a different sales load and 12b-1 fee structure, and that the multiple structures are intended to offer a range of pricing options for the intermediary market. The Board also noted that the total expenses of the classes vary primarily by the level of their 12b-1 fees, although differences in transfer agent fees may also cause expenses to vary from class to class.
Annual Report
Furthermore, the Board considered that, effective June 1, 2005, FMR voluntarily agreed to reimburse each class of the fund to the extent that total operating expenses (excluding 12b-1 fees and certain other expenses) exceed 115 basis points. The Board considered that, if the voluntary expense reimbursements had been in effect in 2004, the total expenses of each of Class A, Class B and Class C would have ranked below the median and the total expenses of Institutional Class would have ranked equal to the median.
In its review of total expenses, the Board also considered Fidelity fee structures and other information on clients that FMR and its affiliates service in other competitive markets, such as other mutual funds advised or subadvised by FMR or its affiliates, pension plan clients, and other institutional clients.
Based on its review, the Board concluded that the total expenses for each class of the fund were reasonable, although in some cases above the median of the universe presented for comparison, in light of the services that the fund and its shareholders receive and the other factors considered.
Costs of the Services and Profitability. The Board considered the revenues earned and the expenses incurred by Fidelity in conducting the business of developing, marketing, distributing, managing, administering and servicing the fund and its shareholders. The Board also considered the level of Fidelity's profits in respect of all the Fidelity funds.
On an annual basis, FMR presents to the Board Fidelity's profitability for the fund. Fidelity calculates the profitability for each fund, as well as aggregate profitability for groups of Fidelity funds and all Fidelity funds, using a series of detailed revenue and cost allocation methodologies which originate with the audited books and records of Fidelity. The Audit Committee of the Board reviews any significant changes from the prior year's methodologies.
PricewaterhouseCoopers LLP (PwC), independent registered accounting firm and auditor to Fidelity and certain Fidelity funds, has been engaged annually by the Board as part of the Board's assessment of the results of Fidelity's profitability analysis. PwC's engagement includes the review and assessment of Fidelity's methodologies used in determining the revenues and expenses attributable to Fidelity's mutual fund business, and completion of agreed-upon procedures surrounding the mathematical accuracy of fund profitability and its conformity to allocation methodologies. After considering PwC's reports issued under the engagement and information provided by Fidelity, the Board believes that while other allocation methods may also be reasonable, Fidelity's profitability methodologies are reasonable in all material respects.
Annual Report
Board Approval of Investment Advisory Contracts and
Management Fees - continued
The Board has also reviewed Fidelity's non-fund businesses and any fall-out benefits related to the mutual fund business as well as cases where Fidelity's affiliates may benefit from or be related to the fund's business. In addition, a special committee of the Board reviewed services provided to Fidelity by its affiliates and determined that the fees that Fidelity paid for such services were reasonable.
The Board considered the costs of the services provided by and the profits realized by Fidelity in connection with the operation of the fund and determined that the amount of profit is a fair entrepreneurial profit for the management of the fund.
Economies of Scale. The Board considered whether there have been economies of scale in respect of the management of the Fidelity funds, whether the Fidelity funds (including the fund) have appropriately benefited from any such economies of scale, and whether there is potential for realization of any further economies of scale. The Board considered the extent to which the fund will benefit from economies of scale through increased services to the fund, through waivers or reimbursements, or through fee or expense reductions, including reductions that occur through operation of the transfer agent agreement. The transfer agent fee varies in part based on the number of accounts in the fund. If the number of accounts decreases or the average account size increases, the overall transfer agent fee rate decreases.
The Board recognized that the fund's management contract incorporates a "group fee" structure, which provides for lower fee rates as total fund assets under FMR's management increase, and for higher fee rates as total fund assets under FMR's management decrease. The Board considered that the group fee is designed to deliver the benefits of economies of scale to fund shareholders when total fund assets increase, even if assets of any particular fund are unchanged or have declined, because some portion of Fidelity's costs are attributable to services provided to all Fidelity funds, and all funds benefit if those costs can be allocated among more assets. The Board concluded that, given the group fee structure, fund shareholders will achieve a certain level of economies of scale as assets under FMR's management increase at the fund complex level, regardless of whether Fidelity achieves any such economies of scale.
The Board further concluded that any potential economies of scale are being shared between fund shareholders and Fidelity in an appropriate manner.
Additional Information Requested by the Board. In order to develop fully the factual basis for consideration of the Advisory Contracts, the Board requested additional information regarding (i) equity fund transfer agency fees; (ii) Fidelity's fund profitability methodology and the impact of various changes in the methodology over time; (iii) benefits to shareholders from economies of scale; (iv) composition and characteristics of various fund and industry data used in comparisons; and (v) compensation of portfolio managers and research analysts.
Annual Report
Based on its evaluation of all of the conclusions noted above, and after considering all material factors, the Board ultimately concluded that the existing advisory fee structures are fair and reasonable, and that the fund's existing Advisory Contracts should be renewed.
Annual Report
Managing Your Investments
Fidelity offers several ways to conveniently manage your personal investments via your telephone or PC. You can access your account information, conduct trades and research your investments 24 hours a day.
By Phone
Fidelity Automated Service Telephone provides a single toll-free number to access account balances, positions, quotes and trading. It's easy to navigate the service, and on your first call, the system will help you create a personal identification number (PIN) for security.
(phone_graphic)
Fidelity Automated
Service Telephone (FAST®)
1-800-544-5555
Press
1 For mutual fund and brokerage trading.
2 For quotes.*
3 For account balances and holdings.
4 To review orders and mutual
fund activity.
5 To change your PIN.
*0 To speak to a Fidelity representative.
By PC
Fidelity's web site on the Internet provides a wide range of information, including daily financial news, fund performance, interactive planning tools and news about Fidelity products and services.
(computer_graphic)
Fidelity's Web Site
www.fidelity.com
* When you call the quotes line, please remember that a fund's yield and return will vary and, except for money market funds, share price will also vary. This means that you may have a gain or loss when you sell your shares. There is no assurance that money market funds will be able to maintain a stable $1 share price; an investment in a money market fund is not insured or guaranteed by the U.S. government. Total returns are historical and include changes in share price, reinvestment of dividends and capital gains, and the effects of any sales charges.
Annual Report
To Write Fidelity
We'll give your correspondence immediate attention and send you written confirmation upon completion of your request.
(letter_graphic)
Making Changes
To Your Account
(such as changing name, address, bank, etc.)
Fidelity Investments
P.O. Box 770001
Cincinnati, OH 45277-0002
(letter_graphic)
For Non-Retirement
Accounts
Buying shares
Fidelity Investments
P.O. Box 770001
Cincinnati, OH 45277-0003
Overnight Express
Fidelity Investments
Attn: Distribution Services
100 Crosby Parkway - KC1H
Covington, KY 41015
Selling shares
Fidelity Investments
P.O. Box 770001
Cincinnati, OH 45277-0035
Overnight Express
Fidelity Investments
Attn: Distribution Services
100 Crosby Parkway - KC1H
Covington, KY 41015
General Correspondence
Fidelity Investments
P.O. Box 500
Merrimack, NH 03054-0500
(letter_graphic)
For Retirement
Accounts
Buying shares
Fidelity Investments
P.O. Box 770001
Cincinnati, OH 45277-0003
Selling shares
Fidelity Investments
P.O. Box 770001
Cincinnati, OH 45277-0035
Overnight Express
Fidelity Investments
Attn: Distribution Services
100 Crosby Parkway - KC1H
Covington, KY 41015
General Correspondence
Fidelity Investments
P.O. Box 500
Merrimack, NH 03054-0500
Annual Report
To Visit Fidelity
For directions and hours,
please call 1-800-544-9797.
Arizona
7001 West Ray Road
Chandler, AZ
7373 N. Scottsdale Road
Scottsdale, AZ
California
815 East Birch Street
Brea, CA
1411 Chapin Avenue
Burlingame, CA
851 East Hamilton Avenue
Campbell, CA
19200 Von Karman Avenue
Irvine, CA
601 Larkspur Landing Circle
Larkspur, CA
10100 Santa Monica Blvd.
Los Angeles, CA
27101 Puerta Real
Mission Viejo, CA
73-575 El Paseo
Palm Desert, CA
251 University Avenue
Palo Alto, CA
123 South Lake Avenue
Pasadena, CA
16995 Bernardo Ctr. Drive
Rancho Bernardo, CA
1740 Arden Way
Sacramento, CA
7676 Hazard Center Drive
San Diego, CA
8 Montgomery Street
San Francisco, CA
3793 State Street
Santa Barbara, CA
21701 Hawthorne Boulevard
Torrance, CA
2001 North Main Street
Walnut Creek, CA
6300 Canoga Avenue
Woodland Hills, CA
Colorado
1625 Broadway
Denver, CO
9185 East Westview Road
Littleton, CO
Connecticut
48 West Putnam Avenue
Greenwich, CT
265 Church Street
New Haven, CT
300 Atlantic Street
Stamford, CT
29 South Main Street
West Hartford, CT
Delaware
222 Delaware Avenue
Wilmington, DE
Florida
4400 N. Federal Highway
Boca Raton, FL
121 Alhambra Plaza
Coral Gables, FL
2948 N. Federal Highway
Ft. Lauderdale, FL
1907 West State Road 434
Longwood, FL
8880 Tamiami Trail, North
Naples, FL
3550 Tamiami Trail, South
Sarasota, FL
1502 N. Westshore Blvd.
Tampa, FL
2465 State Road 7
Wellington, FL
3501 PGA Boulevard
West Palm Beach, FL
Georgia
3445 Peachtree Road, N.E.
Atlanta, GA
1000 Abernathy Road
Atlanta, GA
Illinois
One North LaSalle Street
Chicago, IL
875 North Michigan Ave.
Chicago, IL
1415 West 22nd Street
Oak Brook, IL
1700 East Golf Road
Schaumburg, IL
3232 Lake Avenue
Wilmette, IL
Indiana
4729 East 82nd Street
Indianapolis, IN
Kansas
5400 College Boulevard
Overland Park, KS
Maine
Three Canal Plaza
Portland, ME
Maryland
7315 Wisconsin Avenue
Bethesda, MD
One W. Pennsylvania Ave.
Towson, MD
Massachusetts
801 Boylston Street
Boston, MA
155 Congress Street
Boston, MA
300 Granite Street
Braintree, MA
44 Mall Road
Burlington, MA
405 Cochituate Road
Framingham, MA
416 Belmont Street
Worcester, MA
Michigan
500 E. Eisenhower Pkwy.
Ann Arbor, MI
280 Old N. Woodward Ave.
Birmingham, MI
43420 Grand River Avenue
Novi, MI
29155 Northwestern Hwy.
Southfield, MI
Minnesota
7600 France Avenue South
Edina, MN
Missouri
8885 Ladue Road
Ladue, MO
Annual Report
Nevada
2225 Village Walk Drive
Henderson, NV
New Jersey
150 Essex Street
Millburn, NJ
56 South Street
Morristown, NJ
396 Route 17, North
Paramus, NJ
3518 Route 1 North
Princeton, NJ
530 Highway 35
Shrewsbury, NJ
New York
1055 Franklin Avenue
Garden City, NY
37 West Jericho Turnpike
Huntington Station, NY
1271 Avenue of the Americas
New York, NY
61 Broadway
New York, NY
350 Park Avenue
New York, NY
200 Fifth Avenue
New York, NY
733 Third Avenue
New York, NY
11 Penn Plaza
New York, NY
2070 Broadway
New York, NY
1075 Northern Blvd.
Roslyn, NY
North Carolina
4611 Sharon Road
Charlotte, NC
Ohio
3805 Edwards Road
Cincinnati, OH
1324 Polaris Parkway
Columbus, OH
28699 Chagrin Boulevard
Woodmere Village, OH
Oregon
16850 SW 72nd Avenue
Tigard, OR
Pennsylvania
600 West DeKalb Pike
King of Prussia, PA
1735 Market Street
Philadelphia, PA
12001 Perry Highway
Wexford, PA
Rhode Island
47 Providence Place
Providence, RI
Tennessee
6150 Poplar Avenue
Memphis, TN
Texas
10000 Research Boulevard
Austin, TX
4001 Northwest Parkway
Dallas, TX
12532 Memorial Drive
Houston, TX
2701 Drexel Drive
Houston, TX
6500 N. MacArthur Blvd.
Irving, TX
6005 West Park Boulevard
Plano, TX
14100 San Pedro
San Antonio, TX
1576 East Southlake Blvd.
Southlake, TX
19740 IH 45 North
Spring, TX
Utah
215 South State Street
Salt Lake City, UT
Virginia
1861 International Drive
McLean, VA
Washington
411 108th Avenue, N.E.
Bellevue, WA
1518 6th Avenue
Seattle, WA
Washington, DC
1900 K Street, N.W.
Washington, DC
Wisconsin
595 North Barker Road
Brookfield, WI
Fidelity Brokerage Services, Inc., 100 Summer St., Boston, MA 02110 Member NYSE/SIPC
Annual Report
Annual Report
Annual Report
Investment Adviser
Fidelity Management & Research Company
Boston, MA
Investment Sub-Advisers
FMR Co., Inc.
Fidelity Management & Research
(Far East) Inc.
Fidelity Management & Research
(U.K.) Inc.
Fidelity Investments Japan Limited
Fidelity International Investment
Advisors
Fidelity International Investment
Advisors (U.K.) Limited
General Distributor
Fidelity Distributors Corporation
Boston, MA
Transfer and Service Agent
Fidelity Service Company, Inc.
Boston, MA
Custodian
Citibank, N.A.
New York, NY
The Fidelity Telephone Connection
Mutual Fund 24-Hour Service
Exchanges/Redemptions
and Account Assistance 1-800-544-6666
Product Information 1-800-544-6666
Retirement Accounts 1-800-544-4774
(8 a.m. - 9 p.m.)
TDD Service 1-800-544-0118
for the deaf and hearing impaired
(9 a.m. - 9 p.m. Eastern time)
Fidelity Automated Service
Telephone (FAST®) (automated graphic) 1-800-544-5555
(automated graphic) Automated line for quickest service
SCV-UANN-0905
1.803705.100
(Fidelity Investment logo)(registered trademark)
Corporate Headquarters
82 Devonshire St., Boston, MA 02109
www.fidelity.com
(Fidelity Investment logo)(registered trademark)
Fidelity Advisor
Small Cap Value
Fund - Class A, Class T,
Class B and Class C
Annual Report
July 31, 2005
Class A, Class T, Class B
and Class C are classes of
Fidelity® Small Cap Value Fund
(2_fidelity_logos) (Registered_Trademark)
Contents
Chairman's Message | <Click Here> | Ned Johnson's message to shareholders. |
Performance | <Click Here> | How the fund has done over time. |
Management's Discussion | <Click Here> | The manager's review of fund performance, strategy and outlook |
Shareholder Expense Example | <Click Here> | An example of shareholder expenses. |
Investment Changes | <Click Here> | A summary of the fund's investments. |
Investments | <Click Here> | A complete list of the fund's investments with their market values. |
Financial Statements | <Click Here> | Statements of assets and liabilities, operations, and changes in net assets,
as well as financial highlights. |
Notes | <Click Here> | Notes to the financial statements. |
Report of Independent Registered Public Accounting Firm | <Click Here> | |
Trustees and Officers | <Click Here> | |
Distributions | <Click Here> | |
Board Approval of Investment Advisory Contracts and Management Fees | <Click Here> | |
To view a fund's proxy voting guidelines and proxy voting record for the 12-month period ended June 30, visit www.fidelity.com/proxyvotingresults or visit the Securities and Exchange Commission's (SEC) web site at www.sec.gov. You may also call 1-877-208-0098 to request a free copy of the proxy voting guidelines.
Standard & Poor's, S&P and S&P 500 are registered service marks of The McGraw-Hill Companies, Inc. and have been licensed for use by Fidelity Distributors Corporation.
Other third party marks appearing herein are the property of their respective owners.
All other marks appearing herein are registered or unregistered trademarks or service marks of FMR Corp. or an affiliated company.
Annual Report
This report and the financial statements contained herein are submitted for the general information of the shareholders of the fund. This report is not authorized for distribution to prospective investors in the fund unless preceded or accompanied by an effective prospectus.
A fund files its complete schedule of portfolio holdings with the SEC for the first and third quarters of each fiscal year on Form N-Q. Forms N-Q are available on the SEC's web site at http://www.sec.gov. A fund's Forms N-Q may be reviewed and copied at the SEC's Public Reference Room in Washington, DC. Information regarding the operation of the SEC's Public Reference Room may be obtained by calling 1-800-SEC-0330. For a complete list of a fund's portfolio holdings, view the most recent quarterly holdings report, semiannual report, or annual report on Fidelity's web site at http://www.advisor.fidelity.com.
NOT FDIC INSURED · MAY LOSE VALUE · NO BANK GUARANTEE
Neither the fund nor Fidelity Distributors Corporation is a bank.
Annual Report
Chairman's Message
(photo_of_Edward_C_Johnson_3d)
Dear Shareholder:
During the past year or so, much has been reported about the mutual fund industry, and much of it has been more critical than I believe is warranted. Allegations that some companies have been less than forthright with their shareholders have cast a shadow on the entire industry. I continue to find these reports disturbing, and assert that they do not create an accurate picture of the industry overall. Therefore, I would like to remind everyone where Fidelity stands on these issues. I will say two things specifically regarding allegations that some mutual fund companies were in violation of the Securities and Exchange Commission's forward pricing rules or were involved in so-called "market timing" activities.
First, Fidelity has no agreements that permit customers who buy fund shares after 4 p.m. to obtain the 4 p.m. price. This is not a new policy. This is not to say that someone could not deceive the company through fraudulent acts. However, we are extremely diligent in preventing fraud from occurring in this manner - and in every other. But I underscore again that Fidelity has no so-called "agreements" that sanction illegal practices.
Second, Fidelity continues to stand on record, as we have for years, in opposition to predatory short-term trading that adversely affects shareholders in a mutual fund. Back in the 1980s, we initiated a fee - which is returned to the fund and, therefore, to investors - to discourage this activity. Further, we took the lead several years ago in developing a Fair Value Pricing Policy to prevent market timing on foreign securities in our funds. I am confident we will find other ways to make it more difficult for predatory traders to operate. However, this will only be achieved through close cooperation among regulators, legislators and the industry.
Yes, there have been unfortunate instances of unethical and illegal activity within the mutual fund industry from time to time. That is true of any industry. When this occurs, confessed or convicted offenders should be dealt with appropriately. But we are still concerned about the risk of over-regulation and the quick application of simplistic solutions to intricate problems. Every system can be improved, and we support and applaud well thought out improvements by regulators, legislators and industry representatives that achieve the common goal of building and protecting the value of investors' holdings.
For nearly 60 years, Fidelity has worked very hard to improve its products and service to justify your trust. When our family founded this company in 1946, we had only a few hundred customers. Today, we serve more than 18 million customers including individual investors and participants in retirement plans across America.
Let me close by saying that we do not take your trust in us for granted, and we realize that we must always work to improve all aspects of our service to you. In turn, we urge you to continue your active participation with your financial matters, so that your interests can be well served.
Best regards,
/s/Edward C. Johnson 3d
Edward C. Johnson 3d
Annual Report
Fidelity Advisor Small Cap Value Fund - Class A, T, B, and C
Performance: The Bottom Line
Average annual total return reflects the change in the value of an investment, assuming reinvestment of the class' dividend income and capital gains (the profits earned upon the sale of securities that have grown in value) and assuming a constant rate of performance each year. The $10,000 table and the fund's returns do not reflect the deduction of taxes that a shareholder would pay on fund distributions or the redemption of fund shares. During periods of reimbursement by Fidelity, a fund's total return will be greater than it would be had the reimbursement not occurred. How a fund did yesterday is no guarantee of how it will do tomorrow.
Average annual total returns take Fidelity Advisor Small Cap Value Fund's cumulative total return and show you what would have happened if Fidelity Advisor Small Cap Value Fund shares had performed at a constant rate each year. These numbers will be reported once the fund is a year old.
Annual Report
$10,000 Over Life of Fund
Let's say hypothetically that $10,000 was invested in Fidelity Advisor Small Cap Value Fund - Class T on November 3, 2004, when the fund started, and the current 3.50% sales charge was paid. The chart shows how the value of your investment would have changed, and also shows how the Russell 2000® Value Index performed over the same period.
Annual Report
Management's Discussion of Fund Performance
Comments from Katherine Lieberman, Portfolio Manager of Fidelity Advisor Small Cap Value Fund
A late-inning rally on Wall Street helped push some key U.S. equity indexes to four-year highs by the conclusion of the 12-month period ending July 31, 2005. Spurred on by bullish economic data and strong corporate earnings, investors enjoyed a stellar month of July, capping off a turbulent 12-month period for U.S. equity markets. Stock prices bounced up and down during most of the year, moving in cadence with gyrations in the price of crude oil and investors' gathering and ebbing concerns about inflation. The Federal Reserve Board raised short-term interest rates eight times during the period, also affecting overall market sentiment. Despite their fluctuations, the major equity indexes finished on a high note, with the Standard & Poor's 500SM Index and the NASDAQ Composite® Index posting gains of 14.05% and 16.51%, respectively, for the period. The small-cap Russell 2000® Index rose 24.78% and the Russell Midcap® Index jumped 28.93%, while the blue-chips' Dow Jones Industrial AverageSM advanced only 7.29%.
Since its inception on November 3, 2004, through July 31, 2005, the fund's Class A, Class T, Class B and Class C shares were up 28.06%, 27.80%, 27.30% and 27.40%, respectively, solidly outperforming the 16.66% return for the Russell 2000 Value Index during the same period. Favorable individual stock selection within a number of sectors as well as an overweighting in the energy sector made the biggest contributions to the fund's performance relative to its index. The fund also was helped by its holdings in late-cycle, construction-related stocks. Energy stocks such as exploration and production (E&P) companies benefited from high oil prices and increased production volumes, while energy services companies benefited from increased demand. Among the fund's top performers were E&P company Quicksilver Resources and energy services company Oil States International, while late-cycle construction company WESCO International was a notable absolute contributor. RC2 Corp., which makes learning toys, and designer denim company True Religion Apparel also boosted the fund's performance in absolute terms and relative to the sector index. I sold True Religion to lock in profits. In terms of disappointments, fashion-related stocks Innovo Group and Deckers Outdoor Corporation held back the fund's overall returns. Another specialty retailer, Cost Plus, was a detractor as well. Elsewhere, scant exposure to strong-performing utilities stocks further dampened the fund's relative return.
The views expressed in this statement reflect those of the portfolio manager only through the end of the period of the report as stated on the cover and do not necessarily represent the views of Fidelity or any other person in the Fidelity organization. Any such views are subject to change at any time based upon market or other conditions and Fidelity disclaims any responsibility to update such views. These views may not be relied on as investment advice and, because investment decisions for a Fidelity fund are based on numerous factors, may not be relied on as an indication of trading intent on behalf of any Fidelity fund.
Annual Report
Shareholder Expense Example
As a shareholder of the Fund, you incur two types of costs: (1) transaction costs, including sales charges (loads) on purchase payments or redemption proceeds, redemption fees, and (2) ongoing costs, including management fees, distribution and/or service (12b-1) fees and other Fund expenses. This Example is intended to help you understand your ongoing costs (in dollars) of investing in the Fund and to compare these costs with the ongoing costs of investing in other mutual funds.
The Example is based on an investment of $1,000 invested at the beginning of the period and held for the entire period (February 1, 2005 to July 31, 2005).
Actual Expenses
The first line of the table below for each class of the Fund provides information about actual account values and actual expenses. You may use the information in this line, together with the amount you invested, to estimate the expenses that you paid over the period. Simply divide your account value by $1,000.00 (for example, an $8,600 account value divided by $1,000.00 = 8.6), then multiply the result by the number in the first line for a class of the Fund under the heading entitled "Expenses Paid During Period" to estimate the expenses you paid on your account during this period. A small balance maintenance fee of $12.00 that is charged once a year may apply for certain accounts with a value of less than $2,000. This fee is not included in the table below. If it was, the estimate of expenses you paid during the period would be higher, and your ending account value lower, by this amount.
Hypothetical Example for Comparison Purposes
The second line of the table below for each class of the Fund provides information about hypothetical account values and hypothetical expenses based on a Class' actual expense ratio and an assumed rate of return of 5% per year before expenses, which is not the Class' actual return. The hypothetical account values and expenses may not be used to estimate the actual ending account balance or expenses you paid for the period. You may use this information to compare the ongoing costs of investing in the Fund and other funds. To do so, compare this 5% hypothetical example with the 5% hypothetical examples that appear in the shareholder reports of the other funds. A small balance maintenance fee of $12.00 that is charged once a year may apply for certain accounts with a value of less than $2,000. This fee is not included in the table below. If it was, the estimate of expenses you paid during the period would be higher, and your ending account value lower, by this amount.
Please note that the expenses shown in the table are meant to highlight your ongoing costs only and do not reflect any transaction costs. Therefore, the second line of the table is useful in comparing ongoing costs only, and will not help you determine the relative total costs of owning different funds. In addition, if these transactional costs were included, your costs would have been higher.
Annual Report
| Beginning
Account Value
February 1, 2005 | Ending
Account Value
July 31, 2005 | Expenses Paid
During Period*
February 1, 2005
to July 31, 2005 |
Class A | | | |
Actual | $ 1,000.00 | $ 1,154.20 | $ 7.64 |
HypotheticalA | $ 1,000.00 | $ 1,017.70 | $ 7.15 |
Class T | | | |
Actual | $ 1,000.00 | $ 1,151.40 | $ 8.91 |
HypotheticalA | $ 1,000.00 | $ 1,016.51 | $ 8.35 |
Class B | | | |
Actual | $ 1,000.00 | $ 1,148.90 | $ 11.62 |
HypotheticalA | $ 1,000.00 | $ 1,013.98 | $ 10.89 |
Class C | | | |
Actual | $ 1,000.00 | $ 1,149.80 | $ 11.51 |
HypotheticalA | $ 1,000.00 | $ 1,014.08 | $ 10.79 |
Small Cap Value | | | |
Actual | $ 1,000.00 | $ 1,155.90 | $ 5.51 |
HypotheticalA | $ 1,000.00 | $ 1,019.69 | $ 5.16 |
Institutional Class | | | |
Actual | $ 1,000.00 | $ 1,155.90 | $ 5.56 |
HypotheticalA | $ 1,000.00 | $ 1,019.64 | $ 5.21 |
A 5% return per year before expenses
* Expenses are equal to each Class' annualized expense ratio (shown in the table below); multiplied by the average account value over the period, multiplied by 181/365 (to reflect the one-half year period).
| Annualized
Expense Ratio |
Class A | 1.43% |
Class T | 1.67% |
Class B | 2.18% |
Class C | 2.16% |
Small Cap Value | 1.03% |
Institutional Class | 1.04% |
Annual Report
Investment Changes
Top Ten Stocks as of July 31, 2005 |
| % of fund's
net assets | % of fund's net assets
6 months ago |
RC2 Corp. | 3.3 | 4.9 |
Maverick Tube Corp. | 2.8 | 1.0 |
WESCO International, Inc. | 2.2 | 0.4 |
Compass Minerals International, Inc. | 2.1 | 0.0 |
Comstock Resources, Inc. | 1.6 | 0.0 |
Pioneer Companies, Inc. | 1.6 | 1.3 |
Steven Madden Ltd. | 1.6 | 2.3 |
USI Holdings Corp. | 1.6 | 1.3 |
Park-Ohio Holdings Corp. | 1.6 | 1.2 |
Carlisle Companies, Inc. | 1.4 | 0.7 |
| 19.8 | |
Top Five Market Sectors as of July 31, 2005 |
| % of fund's
net assets | % of fund's net assets
6 months ago |
Consumer Discretionary | 20.6 | 28.4 |
Financials | 18.7 | 20.7 |
Industrials | 18.2 | 11.9 |
Energy | 15.0 | 17.6 |
Information Technology | 7.0 | 4.0 |
Asset Allocation (% of fund's net assets) |
As of July 31, 2005 * | As of January 31, 2005 ** |
| Stocks 91.5% | | | Stocks 92.1% | |
| Bonds 0.8% | | | Bonds 0.0% | |
| Short-Term
Investments and
Net Other Assets 7.7% | | | Short-Term
Investments and
Net Other Assets 7.9% | |
* Foreign investments | 10.8% | | ** Foreign investments | 12.0% | |

Annual Report
Investments July 31, 2005
Showing Percentage of Net Assets
Common Stocks - 91.5% |
| Shares | | Value (Note 1) |
CONSUMER DISCRETIONARY - 20.5% |
Auto Components - 0.5% |
Spartan Motors, Inc. | 293,410 | | $ 3,438,765 |
Automobiles - 0.8% |
Monaco Coach Corp. | 199,200 | | 3,486,000 |
National R.V. Holdings, Inc. (a) | 167,700 | | 1,282,905 |
| | 4,768,905 |
Diversified Consumer Services - 0.8% |
Steiner Leisure Ltd. (a) | 142,030 | | 4,908,557 |
Hotels, Restaurants & Leisure - 1.7% |
AFC Enterprises, Inc. | 130,000 | | 1,779,700 |
Applebee's International, Inc. | 110,000 | | 2,916,100 |
Kerzner International Ltd. (a) | 39,470 | | 2,358,333 |
La Quinta Corp. unit (a) | 211,300 | | 1,901,700 |
Steak n Shake Co. (a) | 70,000 | | 1,515,500 |
| | 10,471,333 |
Household Durables - 1.7% |
Department 56, Inc. (a) | 248,000 | | 3,119,840 |
Interface, Inc. Class A (a) | 293,190 | | 2,993,470 |
Jarden Corp. (a) | 112,500 | | 4,315,500 |
| | 10,428,810 |
Leisure Equipment & Products - 4.9% |
Marine Products Corp. | 138,530 | | 1,953,273 |
MarineMax, Inc. (a) | 178,200 | | 5,926,932 |
Mega Bloks, Inc. (a) | 129,200 | | 2,694,063 |
RC2 Corp. (a) | 500,000 | | 20,404,994 |
| | 30,979,262 |
Media - 1.1% |
Emmis Communications Corp. Class A (a)(d) | 129,100 | | 2,650,423 |
Harris Interactive, Inc. (a) | 345,900 | | 1,393,977 |
Thomas Nelson, Inc. | 115,000 | | 2,626,600 |
| | 6,671,000 |
Multiline Retail - 0.9% |
Tuesday Morning Corp. | 162,300 | | 5,730,813 |
Specialty Retail - 4.9% |
Cost Plus, Inc. (a) | 265,630 | | 5,984,644 |
Genesco, Inc. (a) | 87,990 | | 3,279,387 |
Kirkland's, Inc. (a) | 348,306 | | 2,873,525 |
La Senza Corp. (sub. vtg.) | 44,100 | | 662,752 |
Le Chateau, Inc. Class A (sub. vtg.) | 32,500 | | 1,267,509 |
Monro Muffler Brake, Inc. | 70,500 | | 2,037,450 |
Common Stocks - continued |
| Shares | | Value (Note 1) |
CONSUMER DISCRETIONARY - continued |
Specialty Retail - continued |
Pacific Sunwear of California, Inc. (a) | 321,000 | | $ 7,829,190 |
Peacock Group PLC | 300,000 | | 1,384,071 |
Sonic Automotive, Inc. Class A (sub. vtg.) | 219,800 | | 5,121,340 |
| | 30,439,868 |
Textiles, Apparel & Luxury Goods - 3.2% |
Innovo Group, Inc. (a)(e) | 1,696,580 | | 3,902,134 |
Oxford Industries, Inc. | 131,560 | | 6,184,636 |
Steven Madden Ltd. (a) | 450,110 | | 10,059,959 |
| | 20,146,729 |
TOTAL CONSUMER DISCRETIONARY | | 127,984,042 |
CONSUMER STAPLES - 1.3% |
Food Products - 1.3% |
Delta & Pine Land Co. | 55,000 | | 1,471,250 |
Diamond Foods, Inc. | 70,600 | | 1,563,790 |
Green Mountain Coffee Roasters, Inc. (a) | 40,580 | | 1,422,329 |
Poore Brothers, Inc. (a) | 776,790 | | 3,806,271 |
| | 8,263,640 |
ENERGY - 15.0% |
Energy Equipment & Services - 7.2% |
Hornbeck Offshore Services, Inc. (a) | 240,000 | | 7,176,000 |
Maverick Tube Corp. (a) | 520,620 | | 17,268,965 |
NS Group, Inc. (a) | 210,000 | | 8,914,500 |
Oil States International, Inc. (a) | 245,360 | | 7,257,749 |
Pason Systems, Inc. | 225,300 | | 4,434,786 |
| | 45,052,000 |
Oil, Gas & Consumable Fuels - 7.8% |
Alon USA Energy, Inc. | 3,300 | | 58,575 |
Comstock Resources, Inc. (a) | 368,700 | | 10,209,303 |
Denbury Resources, Inc. (a) | 30,590 | | 1,431,612 |
Encore Acquisition Co. (a) | 96,120 | | 3,031,625 |
Gastar Exploration Ltd. (a) | 850,000 | | 2,291,012 |
Gastar Exploration Ltd. (a)(g) | 1,509,607 | | 3,661,970 |
Holly Corp. | 140,000 | | 6,554,800 |
KCS Energy, Inc. (a) | 100,000 | | 1,964,000 |
Penn Virginia Corp. | 45,670 | | 2,463,897 |
Petroleum Development Corp. (a) | 81,700 | | 3,058,848 |
Plains Exploration & Production Co. (a) | 105,000 | | 4,047,750 |
Common Stocks - continued |
| Shares | | Value (Note 1) |
ENERGY - continued |
Oil, Gas & Consumable Fuels - continued |
Quicksilver Resources, Inc. (a) | 161,850 | | $ 6,855,966 |
Range Resources Corp. | 62,150 | | 1,898,061 |
Top Tankers, Inc. | 68,300 | | 1,047,729 |
| | 48,575,148 |
TOTAL ENERGY | | 93,627,148 |
FINANCIALS - 18.7% |
Capital Markets - 0.2% |
Affiliated Managers Group, Inc. (a) | 16,000 | | 1,140,800 |
Commercial Banks - 3.9% |
Cathay General Bancorp | 50,120 | | 1,781,265 |
Center Financial Corp., California | 186,160 | | 4,756,388 |
Hanmi Financial Corp. | 175,040 | | 3,325,760 |
Nara Bancorp, Inc. | 82,650 | | 1,284,381 |
Preferred Bank, Los Angeles California | 135,000 | | 5,667,300 |
Texas Capital Bancshares, Inc. (a) | 108,200 | | 2,555,684 |
Wintrust Financial Corp. | 90,260 | | 4,840,644 |
| | 24,211,422 |
Diversified Financial Services - 1.8% |
Marlin Business Services Corp. (a) | 354,509 | | 7,887,825 |
Nasdaq Stock Market, Inc. (a) | 160,000 | | 3,624,000 |
| | 11,511,825 |
Insurance - 7.7% |
Arch Capital Group Ltd. (a) | 51,090 | | 2,350,140 |
Aspen Insurance Holdings Ltd. | 154,000 | | 4,375,140 |
HCC Insurance Holdings, Inc. | 112,020 | | 3,105,194 |
IPC Holdings Ltd. | 153,340 | | 6,202,603 |
National Interstate Corp. | 65,300 | | 1,297,511 |
Ohio Casualty Corp. | 230,000 | | 5,876,500 |
Philadelphia Consolidated Holdings Corp. (a) | 76,080 | | 6,316,162 |
Platinum Underwriters Holdings Ltd. | 69,900 | | 2,423,433 |
Specialty Underwriters' Alliance, Inc. | 382,130 | | 3,827,338 |
United America Indemnity Ltd. Class A (a) | 127,412 | | 2,335,462 |
USI Holdings Corp. (a) | 780,448 | | 10,009,246 |
| | 48,118,729 |
Real Estate - 4.6% |
American Campus Communities, Inc. | 243,720 | | 6,105,186 |
Capital Automotive (REIT) (SBI) | 29,800 | | 1,170,246 |
Common Stocks - continued |
| Shares | | Value (Note 1) |
FINANCIALS - continued |
Real Estate - continued |
CB Richard Ellis Group, Inc. Class A (a) | 25,000 | | $ 1,151,000 |
CenterPoint Properties Trust (SBI) | 40,000 | | 1,754,400 |
Columbia Equity Trust, Inc. | 80,000 | | 1,246,400 |
Education Realty Trust, Inc. | 56,300 | | 1,116,429 |
Far East Consortium International Ltd. | 3,175,000 | | 1,368,253 |
Feldman Mall Properties, Inc. | 212,400 | | 2,973,600 |
GMH Communities Trust | 209,100 | | 3,134,409 |
Kilroy Realty Corp. | 87,080 | | 4,536,868 |
Macquarie Goodman Group unit | 595,067 | | 1,829,012 |
Reckson Associates Realty Corp. | 44,570 | | 1,565,298 |
Ticon Industrial Connection PCL (For. Reg.) | 3,000,000 | | 713,000 |
| | 28,664,101 |
Thrifts & Mortgage Finance - 0.5% |
NetBank, Inc. | 310,000 | | 2,892,300 |
TOTAL FINANCIALS | | 116,539,177 |
HEALTH CARE - 4.0% |
Health Care Equipment & Supplies - 0.2% |
Pihsiang Machinery Manufacturing Co. | 670,000 | | 1,345,466 |
Health Care Providers & Services - 3.8% |
Air Methods Corp. (a) | 140,187 | | 1,195,795 |
America Service Group, Inc. (a) | 320,960 | | 6,926,317 |
ICON PLC sponsored ADR (a) | 214,360 | | 8,392,194 |
Medtox Scientific, Inc. (a) | 369,090 | | 2,594,703 |
PSS World Medical, Inc. (a) | 309,730 | | 4,528,253 |
| | 23,637,262 |
TOTAL HEALTH CARE | | 24,982,728 |
INDUSTRIALS - 18.2% |
Aerospace & Defense - 0.9% |
Kaman Corp. Class A | 275,800 | | 5,378,100 |
Air Freight & Logistics - 1.6% |
Park-Ohio Holdings Corp. (a) | 491,420 | | 9,985,654 |
Building Products - 0.3% |
Quixote Corp. | 92,200 | | 1,874,426 |
Commercial Services & Supplies - 2.5% |
Banta Corp. | 136,900 | | 6,535,606 |
Hudson Highland Group, Inc. (a) | 130,000 | | 2,701,400 |
Common Stocks - continued |
| Shares | | Value (Note 1) |
INDUSTRIALS - continued |
Commercial Services & Supplies - continued |
PeopleSupport, Inc. | 132,300 | | $ 1,268,757 |
Speedy Hire PLC | 140,000 | | 1,796,216 |
Standard Parking Corp. (a) | 111,084 | | 1,941,748 |
Waste Services, Inc. (a) | 365,000 | | 1,423,500 |
| | 15,667,227 |
Construction & Engineering - 1.8% |
Comfort Systems USA, Inc. (a) | 771,600 | | 5,979,900 |
URS Corp. (a) | 136,500 | | 5,111,925 |
| | 11,091,825 |
Electrical Equipment - 1.6% |
Acuity Brands, Inc. | 217,250 | | 6,339,355 |
C&D Technologies, Inc. | 330,000 | | 3,323,100 |
| | 9,662,455 |
Industrial Conglomerates - 1.4% |
Carlisle Companies, Inc. | 135,800 | | 8,943,788 |
Machinery - 4.6% |
Albany International Corp. Class A | 45,700 | | 1,601,328 |
Freightcar America, Inc. | 115,000 | | 3,686,900 |
Kinik Co. | 582,000 | | 1,716,599 |
Manitowoc Co., Inc. | 107,360 | | 4,900,984 |
Tennant Co. | 140,000 | | 5,180,000 |
Wabtec Corp. | 125,900 | | 3,075,737 |
Watts Water Technologies, Inc. Class A | 236,110 | | 8,618,015 |
| | 28,779,563 |
Trading Companies & Distributors - 3.5% |
UAP Holding Corp. | 436,200 | | 8,462,280 |
WESCO International, Inc. (a) | 400,000 | | 13,624,000 |
| | 22,086,280 |
TOTAL INDUSTRIALS | | 113,469,318 |
INFORMATION TECHNOLOGY - 7.0% |
Computers & Peripherals - 0.1% |
iCAD, Inc. (a) | 215,000 | | 767,550 |
Electronic Equipment & Instruments - 4.0% |
KEMET Corp. (a) | 548,200 | | 4,593,916 |
Mettler-Toledo International, Inc. (a) | 150,000 | | 7,875,000 |
ScanSource, Inc. (a) | 80,000 | | 3,818,400 |
Common Stocks - continued |
| Shares | | Value (Note 1) |
INFORMATION TECHNOLOGY - continued |
Electronic Equipment & Instruments - continued |
Tektronix, Inc. | 325,000 | | $ 8,144,500 |
Winland Electronics, Inc. (a) | 120,360 | | 535,602 |
| | 24,967,418 |
Internet Software & Services - 1.2% |
j2 Global Communications, Inc. (a)(d) | 160,000 | | 6,417,600 |
SonicWALL, Inc. (a) | 200,000 | | 1,068,000 |
| | 7,485,600 |
IT Services - 0.5% |
Forrester Research, Inc. (a) | 26,968 | | 532,079 |
Telvent GIT SA | 253,900 | | 2,749,483 |
| | 3,281,562 |
Semiconductors & Semiconductor Equipment - 0.5% |
MKS Instruments, Inc. (a) | 166,100 | | 3,174,171 |
Software - 0.7% |
Blackbaud, Inc. | 115,749 | | 1,655,211 |
Hyperion Solutions Corp. (a) | 10,000 | | 470,600 |
Moldflow Corp. (a) | 124,498 | | 1,949,639 |
| | 4,075,450 |
TOTAL INFORMATION TECHNOLOGY | | 43,751,751 |
MATERIALS - 6.1% |
Chemicals - 4.0% |
Albemarle Corp. | 214,700 | | 8,180,070 |
Cytec Industries, Inc. | 115,070 | | 5,221,877 |
Pioneer Companies, Inc. (a) | 420,290 | | 10,200,438 |
Spartech Corp. | 60,000 | | 1,123,800 |
| | 24,726,185 |
Metals & Mining - 2.1% |
Compass Minerals International, Inc. | 530,000 | | 13,488,500 |
TOTAL MATERIALS | | 38,214,685 |
TELECOMMUNICATION SERVICES - 0.5% |
Diversified Telecommunication Services - 0.5% |
New Skies Satellites Holdings Ltd. | 150,000 | | 3,105,000 |
Common Stocks - continued |
| Shares | | Value (Note 1) |
UTILITIES - 0.2% |
Gas Utilities - 0.2% |
Xinao Gas Holdings Ltd. | 1,302,000 | | $ 1,030,063 |
TOTAL COMMON STOCKS (Cost $514,738,650) | 570,967,552 |
Nonconvertible Bonds - 0.8% |
| Principal Amount | | |
CONSUMER DISCRETIONARY - 0.1% |
Hotels, Restaurants & Leisure - 0.1% |
Uno Restaurant Corp. 10% 2/15/11 (f) | $ 1,000,000 | | 965,000 |
HEALTH CARE - 0.7% |
Health Care Providers & Services - 0.7% |
Hanger Orthopedic Group, Inc. 10.375% 2/15/09 | 4,301,000 | | 4,301,000 |
TOTAL NONCONVERTIBLE BONDS (Cost $4,992,804) | 5,266,000 |
Money Market Funds - 9.2% |
| Shares | | |
Fidelity Cash Central Fund, 3.31% (b) | 52,708,903 | | 52,708,903 |
Fidelity Securities Lending Cash Central Fund, 3.32% (b)(c) | 4,949,800 | | 4,949,800 |
TOTAL MONEY MARKET FUNDS (Cost $57,658,703) | 57,658,703 |
Cash Equivalents - 0.5% |
| Maturity
Amount | | |
Investments in repurchase agreements (Collateralized by U.S. Government Obligations, in a joint trading account at 3.27%, dated 7/29/05 due 8/1/05)
(Cost $2,892,000) | $ 2,892,788 | | $ 2,892,000 |
TOTAL INVESTMENT PORTFOLIO - 102.0% (Cost $580,282,157) | | 636,784,255 |
NET OTHER ASSETS - (2.0)% | | (12,557,638) |
NET ASSETS - 100% | $ 624,226,617 |
Legend |
(a) Non-income producing |
(b) Affiliated fund that is available only to investment companies and other accounts managed by Fidelity Investments. The rate quoted is the annualized seven-day yield of the fund at period end. A complete listing of the fund's holdings as of its most recent quarter end is available upon request. |
(c) Investment made with cash collateral received from securities on loan. |
(d) Security or a portion of the security is on loan at period end. |
(e) Affiliated company |
(f) Security exempt from registration under Rule 144A of the Securities Act of 1933. These securities may be resold in transactions exempt from registration, normally to qualified institutional buyers. At the period end, the value of these securities amounted to $965,000 or 0.2% of net assets. |
(g) Restricted securities - Investment in securities not registered under the Securities Act of 1933 (excluding 144A issues). At the end of the period, the value of restricted securities (excluding 144A issues) amounted to $3,661,970 or 0.6% of net assets. |
Additional information on each holding is as follows: |
Security | Acquisition Date | Acquisition Cost |
Gastar Exploration Ltd. | 6/13/05 | $ 3,999,855 |
Other Information |
Distribution of investments by country of issue, as a percentage of total net assets, is as follows: |
United States of America | 89.2% |
Bermuda | 3.0% |
Canada | 2.4% |
Ireland | 1.4% |
Bahamas (Nassau) | 1.2% |
Others (individually less than 1%) | 2.8% |
Total | 100.0% |
An affiliated company is a company in which the fund has ownership of at least 5% of the voting securities. Companies which are affiliates of the fund at period-end are noted in the fund's Schedule of Investments. Transactions during the period with companies which are or were affiliates are as follows: |
Affiliate | Value, beginning of period | Purchases | Sales Proceeds | Dividend Income | Value,
end of
period |
Innovo Group, Inc. | $ - | $ 7,565,418 | $ - | $ - | $ 3,902,134 |
Total | $ - | $ 7,565,418 | $ - | $ - | $ 3,902,134 |
See accompanying notes which are an integral part of the financial statements.
Annual Report
Financial Statements
Statement of Assets and Liabilities
| July 31, 2005 |
| | |
Assets | | |
Investment in securities, at value (including securities loaned of $4,823,803 and repurchase agreements of $2,892,000) (cost $580,282,157) - See accompanying schedule | | $ 636,784,255 |
Cash | | 467 |
Foreign currency held at value (cost $203,113) | | 201,893 |
Receivable for investments sold | | 8,213,753 |
Receivable for fund shares sold | | 10,686,933 |
Dividends receivable | | 154,554 |
Interest receivable | | 377,732 |
Prepaid expenses | | 23,797 |
Receivable from investment adviser for expense reductions | | 1,035 |
Other receivables | | 107,399 |
Total assets | | 656,551,818 |
| | |
Liabilities | | |
Payable for investments purchased | $ 26,628,826 | |
Payable for fund shares redeemed | 275,193 | |
Accrued management fee | 328,037 | |
Distribution fees payable | 16,537 | |
Other affiliated payables | 100,174 | |
Other payables and accrued expenses | 26,634 | |
Collateral on securities loaned, at value | 4,949,800 | |
Total liabilities | | 32,325,201 |
| | |
Net Assets | | $ 624,226,617 |
Net Assets consist of: | | |
Paid in capital | | $ 552,739,748 |
Undistributed net investment income | | 5,374 |
Accumulated undistributed net realized gain (loss) on investments and foreign currency transactions | | 14,982,417 |
Net unrealized appreciation (depreciation) on investments and assets and liabilities in foreign currencies | | 56,499,078 |
Net Assets | | $ 624,226,617 |
See accompanying notes which are an integral part of the financial statements.
Annual Report
Financial Statements - continued
Statement of Assets and Liabilities - continued
| July 31, 2005 |
| | |
Calculation of Maximum Offering Price
Class A:
Net Asset Value and redemption price per share
($9,390,087 ÷ 733,847 shares) | | $ 12.80 |
| | |
Maximum offering price per share (100/94.25 of $12.80) | | $ 13.58 |
Class T:
Net Asset Value and redemption price per share ($12,724,811 ÷ 995,632 shares) | | $ 12.78 |
| | |
Maximum offering price per share (100/96.50 of $12.78) | | $ 13.24 |
Class B:
Net Asset Value and offering price per share ($3,930,896 ÷ 308,759 shares) A | | $ 12.73 |
| | |
Class C:
Net Asset Value and offering price per share ($11,731,652 ÷ 921,136 shares) A | | $ 12.74 |
| | |
Small Cap Value:
Net Asset Value, offering price and redemption price per share ($582,688,643 ÷ 45,410,224 shares) | | $ 12.83 |
| | |
Institutional Class:
Net Asset Value, offering price and redemption price per share ($3,760,528 ÷ 293,101 shares) | | $ 12.83 |
A Redemption price per share is equal to net asset value less any applicable contingent deferred sales charge.
See accompanying notes which are an integral part of the financial statements.
Annual Report
Statement of Operations
| For the period November 3, 2004 (commencement of operations) to July 31, 2005 |
| | |
Investment Income | | |
Dividends | | $ 1,417,528 |
Interest | | 567,033 |
Security lending | | 319 |
Total income | | 1,984,880 |
| | |
Expenses | | |
Management fee | $ 1,558,541 | |
Transfer agent fees | 458,714 | |
Distribution fees | 72,234 | |
Accounting and security lending fees | 90,433 | |
Independent trustees' compensation | 767 | |
Custodian fees and expenses | 31,181 | |
Registration fees | 118,829 | |
Audit | 32,133 | |
Legal | 218 | |
Miscellaneous | 536 | |
Total expenses before reductions | 2,363,586 | |
Expense reductions | (129,800) | 2,233,786 |
Net investment income (loss) | | (248,906) |
Realized and Unrealized Gain (Loss) Net realized gain (loss) on: | | |
Investment securities | 15,314,106 | |
Foreign currency transactions | (7,814) | |
Total net realized gain (loss) | | 15,306,292 |
Change in net unrealized appreciation (depreciation) on: Investment securities | 56,502,098 | |
Assets and liabilities in foreign currencies | (3,020) | |
Total change in net unrealized appreciation (depreciation) | | 56,499,078 |
Net gain (loss) | | 71,805,370 |
Net increase (decrease) in net assets resulting from operations | | $ 71,556,464 |
See accompanying notes which are an integral part of the financial statements.
Annual Report
Financial Statements - continued
Statement of Changes in Net Assets
| For the period
November 3, 2004
(commencement
of operations) to
July 31, 2005 |
Increase (Decrease) in Net Assets | |
Operations | |
Net investment income (loss) | $ (248,906) |
Net realized gain (loss) | 15,306,292 |
Change in net unrealized appreciation (depreciation) | 56,499,078 |
Net increase (decrease) in net assets resulting
from operations | 71,556,464 |
Distributions to shareholders from net investment income | (69,595) |
Share transactions - net increase (decrease) | 552,608,856 |
Redemption fees | 130,892 |
Total increase (decrease) in net assets | 624,226,617 |
| |
Net Assets | |
Beginning of period | - |
End of period (including undistributed net investment income of $5,374) | $ 624,226,617 |
See accompanying notes which are an integral part of the financial statements.
Annual Report
Financial Highlights - Class A
Year ended July 31, | 2005 F |
Selected Per-Share Data | |
Net asset value, beginning of period | $ 10.00 |
Income from Investment Operations | |
Net investment income (loss) E | (.04) |
Net realized and unrealized gain (loss) | 2.84 |
Total from investment operations | 2.80 |
Distributions from net investment income | (.01) |
Redemption fees added to paid in capital E | .01 |
Net asset value, end of period | $ 12.80 |
Total Return B, C, D | 28.06% |
Ratios to Average Net Assets G | |
Expenses before expense reductions | 1.46% A |
Expenses net of voluntary waivers, if any | 1.44% A |
Expenses net of all reductions | 1.38% A |
Net investment income (loss) | (.46)% A |
Supplemental Data | |
Net assets, end of period (000 omitted) | $ 9,390 |
Portfolio turnover rate | 60% A |
A Annualized
B Total returns for periods of less than one year are not annualized.
C Total returns would have been lower had certain expenses not been reduced during the periods shown.
D Total returns do not include the effect of the sales charges.
E Calculated based on average shares outstanding during the period.
F For the period November 3, 2004 (commencement of operations) to July 31, 2005.
G Expense ratios reflect operating expenses of the class. Expenses before reductions do not reflect amounts reimbursed by the investment adviser or reductions from brokerage service arrangements or other expense offset arrangements and do not represent the amount paid by the class during periods when reimbursements or reductions occur. Expense ratios before reductions for start-up periods may not be representative of longer-term operating periods. Expenses net of any voluntary waivers reflect expenses after reimbursement by the investment adviser but prior to reductions from brokerage service arrangements or other expense offset arrangements. Expenses net of all reductions represent the net expenses paid by the class.
See accompanying notes which are an integral part of the financial statements.
Annual Report
Financial Highlights - Class T
Year ended July 31, | 2005 F |
Selected Per-Share Data | |
Net asset value, beginning of period | $ 10.00 |
Income from Investment Operations | |
Net investment income (loss) E | (.06) |
Net realized and unrealized gain (loss) | 2.83 |
Total from investment operations | 2.77 |
Redemption fees added to paid in capital E | .01 |
Net asset value, end of period | $ 12.78 |
Total Return B, C, D | 27.80% |
Ratios to Average Net Assets G | |
Expenses before expense reductions | 1.72% A |
Expenses net of voluntary waivers, if any | 1.68% A |
Expenses net of all reductions | 1.62% A |
Net investment income (loss) | (.70)% A |
Supplemental Data | |
Net assets, end of period (000 omitted) | $ 12,725 |
Portfolio turnover rate | 60% A |
A Annualized
B Total returns for periods of less than one year are not annualized.
C Total returns would have been lower had certain expenses not been reduced during the periods shown.
D Total returns do not include the effect of the sales charges.
E Calculated based on average shares outstanding during the period.
F For the period November 3, 2004 (commencement of operations) to July 31, 2005.
G Expense ratios reflect operating expenses of the class. Expenses before reductions do not reflect amounts reimbursed by the investment adviser or reductions from brokerage service arrangements or other expense offset arrangements and do not represent the amount paid by the class during periods when reimbursements or reductions occur. Expense ratios before reductions for start-up periods may not be representative of longer-term operating periods. Expenses net of any voluntary waivers reflect expenses after reimbursement by the investment adviser but prior to reductions from brokerage service arrangements or other expense offset arrangements. Expenses net of all reductions represent the net expenses paid by the class.
See accompanying notes which are an integral part of the financial statements.
Annual Report
Financial Highlights - Class B
Year ended July 31, | 2005 F |
Selected Per-Share Data | |
Net asset value, beginning of period | $ 10.00 |
Income from Investment Operations | |
Net investment income (loss) E | (.10) |
Net realized and unrealized gain (loss) | 2.82 |
Total from investment operations | 2.72 |
Redemption fees added to paid in capital E | .01 |
Net asset value, end of period | $ 12.73 |
Total Return B, C, D | 27.30% |
Ratios to Average Net Assets G | |
Expenses before expense reductions | 2.24% A |
Expenses net of voluntary waivers, if any | 2.19% A |
Expenses net of all reductions | 2.13% A |
Net investment income (loss) | (1.21)% A |
Supplemental Data | |
Net assets, end of period (000 omitted) | $ 3,931 |
Portfolio turnover rate | 60% A |
A Annualized
B Total returns for periods of less than one year are not annualized.
C Total returns would have been lower had certain expenses not been reduced during the periods shown.
D Total returns do not include the effect of the contingent deferred sales charge.
E Calculated based on average shares outstanding during the period.
F For the period November 3, 2004 (commencement of operations) to July 31, 2005.
G Expense ratios reflect operating expenses of the class. Expenses before reductions do not reflect amounts reimbursed by the investment adviser or reductions from brokerage service arrangements or other expense offset arrangements and do not represent the amount paid by the class during periods when reimbursements or reductions occur. Expense ratios before reductions for start-up periods may not be representative of longer-term operating periods. Expenses net of any voluntary waivers reflect expenses after reimbursement by the investment adviser but prior to reductions from brokerage service arrangements or other expense offset arrangements. Expenses net of all reductions represent the net expenses paid by the class.
See accompanying notes which are an integral part of the financial statements.
Annual Report
Financial Highlights - Class C
Year ended July 31, | 2005 F |
Selected Per-Share Data | |
Net asset value, beginning of period | $ 10.00 |
Income from Investment Operations | |
Net investment income (loss) E | (.10) |
Net realized and unrealized gain (loss) | 2.83 |
Total from investment operations | 2.73 |
Redemption fees added to paid in capital E | .01 |
Net asset value, end of period | $ 12.74 |
Total Return B, C, D | 27.40% |
Ratios to Average Net Assets G | |
Expenses before expense reductions | 2.17% A |
Expenses net of voluntary waivers, if any | 2.17% A |
Expenses net of all reductions | 2.11% A |
Net investment income (loss) | (1.19)% A |
Supplemental Data | |
Net assets, end of period (000 omitted) | $ 11,732 |
Portfolio turnover rate | 60% A |
A Annualized
B Total returns for periods of less than one year are not annualized.
C Total returns would have been lower had certain expenses not been reduced during the periods shown.
D Total returns do not include the effect of the contingent deferred sales charge.
E Calculated based on average shares outstanding during the period.
F For the period November 3, 2004 (commencement of operations) to July 31, 2005.
G Expense ratios reflect operating expenses of the class. Expenses before reductions do not reflect amounts reimbursed by the investment adviser or reductions from brokerage service arrangements or other expense offset arrangements and do not represent the amount paid by the class during periods when reimbursements or reductions occur. Expense ratios before reductions for start-up periods may not be representative of longer-term operating periods. Expenses net of any voluntary waivers reflect expenses after reimbursement by the investment adviser but prior to reductions from brokerage service arrangements or other expense offset arrangements. Expenses net of all reductions represent the net expenses paid by the class.
See accompanying notes which are an integral part of the financial statements.
Annual Report
Financial Highlights - Small Cap Value
Year ended July 31, | 2005 E |
Selected Per-Share Data | |
Net asset value, beginning of period | $ 10.00 |
Income from Investment Operations | |
Net investment income (loss) D | (.01) |
Net realized and unrealized gain (loss) | 2.84 |
Total from investment operations | 2.83 |
Distributions from net investment income | (.01) |
Redemption fees added to paid in capital D | .01 |
Net asset value, end of period | $ 12.83 |
Total Return B, C | 28.36% |
Ratios to Average Net Assets F | |
Expenses before expense reductions | 1.05% A |
Expenses net of voluntary waivers, if any | 1.05% A |
Expenses net of all reductions | .99% A |
Net investment income (loss) | (.08)% A |
Supplemental Data | |
Net assets, end of period (000 omitted) | $ 582,689 |
Portfolio turnover rate | 60% A |
A Annualized
B Total returns for periods of less than one year are not annualized.
C Total returns would have been lower had certain expenses not been reduced during the periods shown.
D Calculated based on average shares outstanding during the period.
E For the period November 3, 2004 (commencement of operations) to July 31, 2005.
F Expense ratios reflect operating expenses of the class. Expenses before reductions do not reflect amounts reimbursed by the investment adviser or reductions from brokerage service arrangements or other expense offset arrangements and do not represent the amount paid by the class during periods when reimbursements or reductions occur. Expense ratios before reductions for start-up periods may not be representative of longer-term operating periods. Expenses net of any voluntary waivers reflect expenses after reimbursement by the investment adviser but prior to reductions from brokerage service arrangements or other expense offset arrangements. Expenses net of all reductions represent the net expenses paid by the class.
See accompanying notes which are an integral part of the financial statements.
Annual Report
Financial Highlights - Institutional Class
Year ended July 31, | 2005 E |
Selected Per-Share Data | |
Net asset value, beginning of period | $ 10.00 |
Income from Investment Operations | |
Net investment income (loss) D | (.01) |
Net realized and unrealized gain (loss) | 2.84 |
Total from investment operations | 2.83 |
Distributions from net investment income | (.01) |
Redemption fees added to paid in capital D | .01 |
Net asset value, end of period | $ 12.83 |
Total Return B, C | 28.36% |
Ratios to Average Net Assets F | |
Expenses before expense reductions | 1.07% A |
Expenses net of voluntary waivers, if any | 1.07% A |
Expenses net of all reductions | 1.01% A |
Net investment income (loss) | (.10)% A |
Supplemental Data | |
Net assets, end of period (000 omitted) | $ 3,761 |
Portfolio turnover rate | 60% A |
A Annualized
B Total returns for periods of less than one year are not annualized.
C Total returns would have been lower had certain expenses not been reduced during the periods shown.
D Calculated based on average shares outstanding during the period.
E For the period November 3, 2004 (commencement of operations) to July 31, 2005.
F Expense ratios reflect operating expenses of the class. Expenses before reductions do not reflect amounts reimbursed by the investment adviser or reductions from brokerage service arrangements or other expense offset arrangements and do not represent the amount paid by the class during periods when reimbursements or reductions occur. Expense ratios before reductions for start-up periods may not be representative of longer-term operating periods. Expenses net of any voluntary waivers reflect expenses after reimbursement by the investment adviser but prior to reductions from brokerage service arrangements or other expense offset arrangements. Expenses net of all reductions represent the net expenses paid by the class.
See accompanying notes which are an integral part of the financial statements.
Annual Report
Notes to Financial Statements
For the period ended July 31, 2005
1. Significant Accounting Policies.
Fidelity Small Cap Value Fund (the fund) is a non-diversified fund of Fidelity Securities Fund (the trust) and is authorized to issue an unlimited number of shares. The trust is registered under the Investment Company Act of 1940, as amended (the 1940 Act), as an open-end management investment company organized as a Massachusetts business trust.
The fund offers Class A, Class T, Class B, Class C, Small Cap Value, and Institutional Class shares, each of which has equal rights as to assets and voting privileges. Each class has exclusive voting rights with respect to matters that affect that class. Class B shares will automatically convert to Class A shares after a holding period of seven years from the initial date of purchase. Investment income, realized and unrealized capital gains and losses, the common expenses of the fund, and certain fund-level expense reductions, if any, are allocated on a pro rata basis to each class based on the relative net assets of each class to the total net assets of the fund. Each class differs with respect to transfer agent and distribution and service plan fees incurred. Certain expense reductions also differ by class.
The financial statements have been prepared in conformity with accounting principles generally accepted in the United States of America, which require management to make certain estimates and assumptions at the date of the financial statements. The following summarizes the significant accounting policies of the fund:
Security Valuation. Net asset value per share (NAV calculation) is calculated as of the close of business of the New York Stock Exchange, normally 4:00 p.m. Eastern time. Equity securities, including restricted securities, for which market quotations are available are valued at the last sale price or official closing price (closing bid price or last evaluated quote if no sale has occurred) on the primary market or exchange on which they trade. Debt securities, including restricted securities, for which quotations are readily available are valued at their most recent bid prices (sales prices if the principal market is an exchange) in the principal market in which such securities are normally traded, as determined by recognized dealers in such securities, or securities are valued on the basis of information provided by a pricing service. Pricing services use valuation matrices that incorporate both dealer-supplied valuations and valuation models. If prices are not readily available or do not accurately reflect fair value for a security, or if a security's value has been materially affected by events occurring after the close of the exchange or market on which the security is principally traded, that security may be valued by another method that the Board of Trustees believes accurately reflects fair value. A security's valuation may differ depending on the method used for determining value. Price movements in futures contracts and ADRs, market and trading trends, the bid/ask quotes of brokers and off-exchange institutional trading may be reviewed in the
Annual Report
Notes to Financial Statements - continued
1. Significant Accounting Policies - continued
Security Valuation - continued
course of making a good faith determination of a security's fair value. Short-term securities with remaining maturities of sixty days or less for which quotations are not readily available are valued on the basis of amortized cost. Investments in open-end investment companies are valued at their net asset value each business day.
Foreign Currency. The fund uses foreign currency contracts to facilitate transactions in foreign-denominated securities. Losses from these transactions may arise from changes in the value of the foreign currency or if the counterparties do not perform under the contracts' terms.
Foreign-denominated assets, including investment securities, and liabilities are translated into U.S. dollars at the exchange rate at period end. Purchases and sales of investment securities, income and dividends received and expenses denominated in foreign currencies are translated into U.S. dollars at the exchange rate in effect on the transaction date.
The effects of exchange rate fluctuations on investments are included with the net realized and unrealized gain (loss) on investment securities. Other foreign currency transactions resulting in realized and unrealized gain (loss) are disclosed separately.
Investment Transactions and Income. Security transactions are accounted for as of trade date. Gains and losses on securities sold are determined on the basis of identified cost. Dividend income is recorded on the ex-dividend date, except for certain dividends from foreign securities where the ex-dividend date may have passed, which are recorded as soon as the fund is informed of the ex-dividend date. Non-cash dividends included in dividend income, if any, are recorded at the fair market value of the securities received. Distributions received on securities that represent a return of capital or capital gain are recorded as a reduction of cost of investments and/or as a realized gain. The fund estimates the components of distributions received that may be considered return of capital distributions or capital gain distributions. Interest income is accrued as earned. Interest income includes coupon interest and amortization of premium and accretion of discount on debt securities. Investment income is recorded net of foreign taxes withheld where recovery of such taxes is uncertain.
Expenses. Most expenses of the trust can be directly attributed to a fund. Expenses which cannot be directly attributed are apportioned among each fund in the trust.
Income Tax Information and Distributions to Shareholders. Each year, the fund intends to qualify as a regulated investment company by distributing all of its taxable income and realized gains under Subchapter M of the Internal Revenue Code. As a result, no provision for income taxes is required in the accompanying financial statements.
Annual Report
1. Significant Accounting Policies - continued
Income Tax Information and Distributions to Shareholders - continued
Foreign taxes are provided for based on the fund's understanding of the tax rules and rates that exist in the foreign markets in which it invests.
Distributions are recorded on the ex-dividend date. Income dividends and capital gain distributions are declared separately for each class. Income and capital gain distributions are determined in accordance with income tax regulations, which may differ from generally accepted accounting principles. In addition, the fund will claim a portion of the payment made to redeeming shareholders as a distribution for income tax purposes.
Capital accounts within the financial statements are adjusted for permanent book-tax differences. These adjustments have no impact on net assets or the results of operations. Temporary book-tax differences will reverse in a subsequent period.
Book-tax differences are primarily due to short-term capital gains, foreign currency transactions, passive foreign investment companies (PFIC) and losses deferred due to wash sales.
The tax-basis components of distributable earnings and the federal tax cost as of period end were as follows:
Unrealized appreciation | $ 67,705,489 | |
Unrealized depreciation | (11,339,549) | |
Net unrealized appreciation (depreciation) | 56,365,940 | |
Undistributed ordinary income | 14,695,235 | |
| | |
Cost for federal income tax purposes | $ 580,418,315 | |
The tax character of distributions paid was as follows:
| July 31, 2005 | |
Ordinary Income | $ 69,595 | |
Short-Term Trading (Redemption) Fees. Shares held in the fund less than 90 days are subject to a redemption fee equal to 1.50% of the proceeds of the redeemed shares. All redemption fees, including any estimated redemption fees paid by Fidelity Management and Research Company (FMR), are retained by the fund and accounted for as an addition to paid in capital.
Annual Report
Notes to Financial Statements - continued
2. Operating Policies.
Repurchase Agreements. FMR has received an Exemptive Order from the Securities and Exchange Commission (the SEC) which permits the fund and other affiliated entities of FMR to transfer uninvested cash balances into joint trading accounts which are then invested in repurchase agreements. The fund may also invest directly with institutions in repurchase agreements. Repurchase agreements are collateralized by government or non-government securities. Collateral is held in segregated accounts with custodian banks and may be obtained in the event of a default of the counterparty. The fund monitors, on a daily basis, the value of the collateral to ensure it is at least equal to the principal amount of the repurchase agreement (including accrued interest). In the event of a default by the counterparty, realization of the collateral proceeds could be delayed, during which time the value of the collateral may decline.
Restricted Securities. The fund may invest in securities that are subject to legal or contractual restrictions on resale. These securities generally may be resold in transactions exempt from registration or to the public if the securities are registered. Disposal of these securities may involve time-consuming negotiations and expense, and prompt sale at an acceptable price may be difficult. Information regarding restricted securities is included at the end of the fund's Schedule of Investments.
3. Purchases and Sales of Investments.
Purchases and sales of securities, other than short-term securities and U.S. government securities, aggregated $635,585,396 and $130,951,513, respectively.
4. Fees and Other Transactions with Affiliates.
Management Fee. FMR and its affiliates provide the fund with investment management related services for which the fund pays a monthly management fee. The management fee is the sum of an individual fund fee rate that is based on an annual rate of .45% of the fund's average net assets and a group fee rate that averaged .27% during the period. The group fee rate is based upon the average net assets of all the mutual funds advised by FMR. The group fee rate decreases as assets under management increase and increases as assets under management decrease. In addition, the management fee is subject to a performance adjustment (up to a maximum of ± .20% of the fund's average net assets over a 36 month performance period). The upward or downward adjustment to the management fee is based on the fund's relative investment performance as compared to an appropriate benchmark index. The fund's performance adjustment will not take effect until November 2005. Subsequent months will be added until the performance period includes 36 months. For the period, the total annualized management fee rate was .72% of the fund's average net assets.
Annual Report
4. Fees and Other Transactions with Affiliates - continued
Distribution and Service Plan. In accordance with Rule 12b-1 of the 1940 Act, the fund has adopted separate Distribution and Service Plans for each class of shares. Certain classes pay Fidelity Distributors Corporation (FDC), an affiliate of FMR, separate Distribution and Service Fees, each of which is based on an annual percentage of each class' average net assets. In addition, FDC may pay financial intermediaries for selling shares of the fund and providing shareholder support services. For the period, the Distribution and Service Fee rates and the total amounts paid to and retained by FDC were as follows:
| Distribution
Fee | Service
Fee | Paid to
FDC | Retained
by FDC |
Class A | 0% | .25% | $ 7,461 | $ 1,194 |
Class T | .25% | .25% | 12,596 | 2,172 |
Class B | .75% | .25% | 14,541 | 12,157 |
Class C | .75% | .25% | 37,636 | 16,080 |
| | | $ 72,234 | $ 31,603 |
Sales Load. FDC receives a front-end sales charge of up to 5.75% for selling Class A shares, and 3.50% for selling Class T shares, some of which is paid to financial intermediaries for selling shares of the fund. FDC receives the proceeds of contingent deferred sales charges levied on Class A, Class T, Class B, and Class C redemptions. These charges depend on the holding period. The deferred sales charges range from 5% to 1% for Class B, 1% for Class C, and .25% for certain purchases of Class A and Class T shares.
For the period, sales charge amounts retained by FDC were as follows:
| Retained
by FDC | |
Class A | $ 24,744 | |
Class T | 6,938 | |
Class B* | 1,116 | |
Class C* | 324 | |
| $ 33,122 | |
* When Class B and Class C shares are initially sold, FDC pays commissions from its own resources to financial intermediaries through which the sales are made.
Transfer Agent Fees. Fidelity Investments Institutional Operations Company, Inc. (FIIOC), an affiliate of FMR, is the transfer, dividend disbursing and shareholder servicing agent for each class of the fund, except for Small Cap Value. Fidelity Service Company, Inc. (FSC), an affiliate of FMR, is the transfer agent for Small Cap Value shares. FIIOC and FSC receive account fees and asset-based fees that vary according to the account size and type of account of the shareholders of the respective classes of the fund.
Annual Report
Notes to Financial Statements - continued
4. Fees and Other Transactions with Affiliates - continued
Transfer Agent Fees - continued
FIIOC and FSC pay for typesetting, printing and mailing of shareholder reports, except proxy statements. For the period the total transfer agent fees paid by each class to FIIOC or FSC, were as follows:
| Amount | % of
Average
Net Assets |
Class A | $ 10,531 | .35* |
Class T | 8,940 | .35* |
Class B | 5,110 | .35* |
Class C | 11,895 | .32* |
Small Cap Value | 419,553 | .21* |
Institutional Class | 2,685 | .19* |
| $ 458,714 | |
* Annualized
Accounting and Security Lending Fees. FSC maintains the fund's accounting records. The accounting fee is based on the level of average net assets for the month. Under a separate contract, FSC administers the security lending program. The security lending fee is based on the number and duration of lending transactions.
Central Funds. The fund may invest in affiliated Central Funds managed by Fidelity Investments Money Management, Inc. (FIMM), an affiliate of FMR. The Central Funds are open-end investment companies available only to investment companies and other accounts managed by FMR and its affiliates. The Money Market Central Funds seek preservation of capital and current income. The Central Funds do not pay a management fee. Income distributions earned by the fund are recorded as income in the accompanying financial statements and totaled $476,355 for the period.
Brokerage Commissions. The fund placed a portion of its portfolio transactions with brokerage firms which are affiliates of the investment adviser. The commissions paid to these affiliated firms were $50,063 for the period.
5. Committed Line of Credit.
The fund participates with other funds managed by FMR in a $4.2 billion credit facility (the "line of credit") to be utilized for temporary or emergency purposes to fund shareholder redemptions or for other short-term liquidity purposes. The fund has agreed to pay commitment fees on its pro rata portion of the line of credit. During the period, there were no borrowings on this line of credit.
Annual Report
6. Security Lending.
The fund lends portfolio securities from time to time in order to earn additional income. The fund receives collateral (in the form of U.S. Treasury obligations, letters of credit and/or cash) against the loaned securities and maintains collateral in an amount not less than 100% of the market value of the loaned securities during the period of the loan. The market value of the loaned securities is determined at the close of business of the fund and any additional required collateral is delivered to the fund on the next business day. If the borrower defaults on its obligation to return the securities loaned because of insolvency or other reasons, a fund could experience delays and costs in recovering the securities loaned or in gaining access to the collateral. Cash collateral is invested in the Fidelity Securities Lending Cash Central Fund. The value of loaned securities and cash collateral at period end are disclosed on the fund's Statement of Assets and Liabilities.
7. Expense Reductions.
FMR voluntarily agreed to reimburse each class to the extent annual operating expenses exceeded certain levels of average net assets as noted in the table below. Some expenses, for example interest expense, are excluded from this reimbursement.
The following classes were in reimbursement during the period:
| Expense
Limitations | Reimbursement
from adviser |
| | |
Class A | 1.50% - 1.40%* | $ 698 |
Class T | 1.75% - 1.65%* | 1,050 |
Class B | 2.25% - 2.15%* | 717 |
| | $ 2,465 |
* Expense limitation in effect at period end
Many of the brokers with whom FMR places trades on behalf of the fund provided services to the fund in addition to trade execution. These services included payments of certain expenses on behalf of the fund totaling $126,495 for the period. In addition, through arrangements with the fund's custodian, credits realized as a result of uninvested cash balances were used to reduce the fund's expenses. During the period, these credits reduced the fund's custody expenses by $840.
Annual Report
Notes to Financial Statements - continued
8. Other.
The fund's organizational documents provide former and current trustees and officers with a limited indemnification against liabilities arising in connection with the performance of their duties to the fund. In the normal course of business, the fund may also enter into contracts that provide general indemnifications. The fund's maximum exposure under these arrangements is unknown as this would be dependent on future claims that may be made against the fund. The risk of material loss from such claims is considered remote.
9. Distributions to Shareholders.
Distributions to shareholders of each class were as follows:
| Year ended
July 31, 2005 | |
From net investment income | | |
Class A | $ 724 | |
Small Cap Value | 68,438 | |
Institutional Class | 433 | |
Total | $ 69,595 | |
Annual Report
10. Share Transactions.
Transactions for each class of shares were as follows:
| Shares | Dollars |
| For the period
November 3, 2004
(commencement of
sale of shares) to
July 31, 2005 | For the period
November 3, 2004
(commencement of
sale of shares) to
July 31, 2005 |
Class A | | |
Shares sold | 750,692 | $ 8,523,912 |
Reinvestment of distributions | 54 | 590 |
Shares redeemed | (16,899) | (197,248) |
Net increase (decrease) | 733,847 | $ 8,327,254 |
Class T | | |
Shares sold | 1,010,520 | $ 11,960,654 |
Shares redeemed | (14,888) | (175,516) |
Net increase (decrease) | 995,632 | $ 11,785,138 |
Class B | | |
Shares sold | 314,195 | $ 3,487,462 |
Shares redeemed | (5,436) | (61,184) |
Net increase (decrease) | 308,759 | $ 3,426,278 |
Class C | | |
Shares sold | 952,687 | $ 10,586,807 |
Shares redeemed | (31,551) | (363,557) |
Net increase (decrease) | 921,136 | $ 10,223,250 |
Small Cap Value | | |
Shares sold | 49,836,348 | $ 566,509,509 |
Reinvestment of distributions | 6,024 | 66,450 |
Shares redeemed | (4,432,148) | (50,921,377) |
Net increase (decrease) | 45,410,224 | $ 515,654,582 |
Institutional Class | | |
Shares sold | 315,268 | $ 3,439,515 |
Reinvestment of distributions | 39 | 433 |
Shares redeemed | (22,206) | (247,594) |
Net increase (decrease) | 293,101 | $ 3,192,354 |
Annual Report
Report of Independent Registered Public Accounting Firm
To the Trustees of Fidelity Securities Fund and the Shareholders of Fidelity Small Cap Value Fund:
In our opinion, the accompanying statement of assets and liabilities, including the schedule of investments, and the related statements of operations and of changes in net assets and the financial highlights present fairly, in all material respects, the financial position of Fidelity Small Cap Value Fund (a fund of Fidelity Securities Fund) at July 31, 2005 and the results of its operations, the changes in its net assets and the financial highlights for the period indicated, in conformity with accounting principles generally accepted in the United States of America. These financial statements and financial highlights (hereafter referred to as "financial statements") are the responsibility of the Fidelity Small Cap Value Fund's management; our responsibility is to express an opinion on these financial statements based on our audit. We conducted our audit of these financial statements in accordance with the standards of the Public Company Accounting Oversight Board (United States). Those standards require that we plan and perform the audit to obtain reasonable assurance about whether the financial statements are free of material misstatement. An audit includes examining, on a test basis, evidence supporting the amounts and disclosures in the financial statements, assessing the accounting principles used and significant estimates made by management, and evaluating the overall financial statement presentation. We believe that our audit, which included confirmation of securities at July 31, 2005 by correspondence with the custodian and brokers, provides a reasonable basis for our opinion.
/s/ PricewaterhouseCoopers LLP
PricewaterhouseCoopers LLP
Boston, Massachusetts
September 13, 2005
Annual Report
Trustees and Officers
The Trustees, Members of the Advisory Board, and executive officers of the trust and fund, as applicable, are listed below. The Board of Trustees governs the fund and is responsible for protecting the interests of shareholders. The Trustees are experienced executives who meet periodically throughout the year to oversee the fund's activities, review contractual arrangements with companies that provide services to the fund, and review the fund's performance. Except for William O. McCoy, Stephen P. Jonas, and Kenneth L. Wolfe, each of the Trustees oversees 320 funds advised by FMR or an affiliate. Mr. McCoy oversees 322 funds advised by FMR or an affiliate. Mr. Jonas and Mr. Wolfe oversee 311 funds advised by FMR or an affiliate.
The Trustees hold office without limit in time except that (a) any Trustee may resign; (b) any Trustee may be removed by written instrument, signed by at least two-thirds of the number of Trustees prior to such removal; (c) any Trustee who requests to be retired or who has become incapacitated by illness or injury may be retired by written instrument signed by a majority of the other Trustees; and (d) any Trustee may be removed at any special meeting of shareholders by a two-thirds vote of the outstanding voting securities of the trust. Each Trustee who is not an interested person (as defined in the 1940 Act) (Independent Trustee), shall retire not later than the last day of the calendar year in which his or her 72nd birthday occurs. The Independent Trustees may waive this mandatory retirement age policy with respect to individual Trustees. The executive officers and Advisory Board Members hold office without limit in time, except that any officer and Advisory Board Member may resign or may be removed by a vote of a majority of the Trustees at any regular meeting or any special meeting of the Trustees. Except as indicated, each individual has held the office shown or other offices in the same company for the past five years.
The fund's Statement of Additional Information (SAI) includes more information about the Trustees. To request a free copy, call Fidelity at 1-877-208-0098.
Interested Trustees*:
Correspondence intended for each Trustee who is an interested person may be sent to Fidelity Investments, 82 Devonshire Street, Boston, Massachusetts 02109.
Name, Age; Principal Occupation |
Edward C. Johnson 3d (75)** |
| Year of Election or Appointment: 1984 Mr. Johnson is Chairman of the Board of Trustees. Mr. Johnson serves as Chief Executive Officer, Chairman, and a Director of FMR Corp.; a Director and Chairman of the Board and of the Executive Committee of FMR; Chairman and a Director of Fidelity Management & Research (Far East) Inc.; Chairman and a Director of Fidelity Investments Money Management, Inc.; and Chairman (2001-present) and a Director (2000-present) of FMR Co., Inc. |
Abigail P. Johnson (43)** |
| Year of Election or Appointment: 2001 Ms. Johnson serves as President of Fidelity Employer Services Company (FESCO) (2005-present). She is President and a Director of Fidelity Investments Money Management, Inc. (2001-present), FMR Co., Inc. (2001-present), and a Director of FMR Corp. Previously, Ms. Johnson served as President and a Director of FMR (2001-2005), Senior Vice President of the Fidelity funds (2001-2005), and managed a number of Fidelity funds. |
Stephen P. Jonas (52) |
| Year of Election or Appointment: 2005 Mr. Jonas is Senior Vice President of the fund (2005-present). He also serves as Senior Vice President of other Fidelity funds (2005-present). Mr. Jonas is Executive Director of FMR (2005-present). Previously, Mr. Jonas served as President of Fidelity Enterprise Operations and Risk Services (2004-2005), Chief Administrative Officer (2002-2004), and Chief Financial Officer of FMR Co. (1998-2000). Mr. Jonas has been with Fidelity Investments since 1987 and has held various financial and management positions including Chief Financial Officer with FMR. In addition, he serves on the Boards of Boston Ballet (2003-present) and Simmons College (2003-present). |
Robert L. Reynolds (53) |
| Year of Election or Appointment: 2003 Mr. Reynolds is a Director (2003-present) and Chief Operating Officer (2002-present) of FMR Corp. He also serves on the Board at Fidelity Investments Canada, Ltd. (2000-present). Previously, Mr. Reynolds served as President of Fidelity Investments Institutional Retirement Group (1996-2000). |
* Trustees have been determined to be "Interested Trustees" by virtue of, among other things, their affiliation with the trust or various entities under common control with FMR.
** Edward C. Johnson 3d, Trustee, is Abigail P. Johnson's father.
Annual Report
Independent Trustees:
Correspondence intended for each Independent Trustee (that is, the Trustees other than the Interested Trustees) may be sent to Fidelity Investments, P.O. Box 55235, Boston, Massachusetts 02205-5235.
Name, Age; Principal Occupation |
Dennis J. Dirks (57) |
| Year of Election or Appointment: 2005 Prior to his retirement in May 2003, Mr. Dirks was Chief Operating Officer and a member of the Board of The Depository Trust & Clearing Corporation (DTCC) (1999-2003). He also served as President, Chief Operating Officer, and Board member of The Depository Trust Company (DTC) (1999-2003) and President and Board member of the National Securities Clearing Corporation (NSCC) (1999-2003). In addition, Mr. Dirks served as Chief Executive Officer and Board member of the Government Securities Clearing Corporation (2001-2003) and Chief Executive Officer and Board member of the Mortgage-Backed Securities Clearing Corporation (2001-2003). Mr. Dirks also serves as a Trustee of Manhattan College (2005-present). |
Robert M. Gates (61) |
| Year of Election or Appointment: 1997 Dr. Gates is Vice Chairman of the Independent Trustees (2005-present). Dr. Gates is President of Texas A&M University (2002-present). He was Director of the Central Intelligence Agency (CIA) from 1991 to 1993. From 1989 to 1991, Dr. Gates served as Assistant to the President of the United States and Deputy National Security Advisor. Dr. Gates is a Director of NACCO Industries, Inc. (mining and manufacturing), Parker Drilling Co., Inc. (drilling and rental tools for the energy industry, 2001-present), and Brinker International (restaurant management, 2003-present). Previously, Dr. Gates served as a Director of LucasVarity PLC (automotive components and diesel engines), a Director of TRW Inc. (automotive, space, defense, and information technology), and Dean of the George Bush School of Government and Public Service at Texas A&M University (1999-2001). Dr. Gates also is a Trustee of the Forum for International Policy. |
George H. Heilmeier (69) |
| Year of Election or Appointment: 2004 Dr. Heilmeier is Chairman Emeritus of Telcordia Technologies (communication software and systems), where prior to his retirement, he served as company Chairman and Chief Executive Officer. He currently serves on the Boards of Directors of The Mitre Corporation (systems engineering and information technology support for the government), and HRL Laboratories (private research and development, 2004-present). He is Chairman of the General Motors Science & Technology Advisory Board and a Life Fellow of the Institute of Electrical and Electronics Engineers (IEEE) (2000-present). Dr. Heilmeier is a member of the Defense Science Board and the National Security Agency Advisory Board. He is also a member of the National Academy of Engineering, the American Academy of Arts and Sciences, and the Board of Overseers of the School of Engineering and Applied Science of the University of Pennsylvania. Previously, Dr. Heilmeier served as a Director of TRW Inc. (automotive, space, defense, and information technology, 1992-2002), Compaq (1994-2002), Automatic Data Processing, Inc. (ADP) (technology-based business outsourcing, 1995-2002), INET Technologies Inc. (telecommunications network surveillance, 2001-2004), and Teletech Holdings (customer management services). He is the recipient of the 2005 Kyoto Prize in Advanced Technology for his invention of the liquid display. |
Marie L. Knowles (58) |
| Year of Election or Appointment: 2001 Prior to Ms. Knowles' retirement in June 2000, she served as Executive Vice President and Chief Financial Officer of Atlantic Richfield Company (ARCO) (diversified energy, 1996-2000). From 1993 to 1996, she was a Senior Vice President of ARCO and President of ARCO Transportation Company. She served as a Director of ARCO from 1996 to 1998. She currently serves as a Director of Phelps Dodge Corporation (copper mining and manufacturing) and McKesson Corporation (healthcare service, 2002-present). Ms. Knowles is a Trustee of the Brookings Institution and the Catalina Island Conservancy and also serves as a member of the Advisory Board for the School of Engineering of the University of Southern California. |
Ned C. Lautenbach (61) |
| Year of Election or Appointment: 2000 Mr. Lautenbach has been a partner of Clayton, Dubilier & Rice, Inc. (private equity investment firm) since September 1998. Previously, Mr. Lautenbach was with the International Business Machines Corporation (IBM) from 1968 until his retirement in 1998. Mr. Lautenbach serves as a Director of Italtel Holding S.p.A. (telecommunications (Milan, Italy), 2004-present) and Eaton Corporation (diversified industrial) as well as the Philharmonic Center for the Arts in Naples, Florida. He also is a member of the Board of Trustees of Fairfield University (2005-present), as well as a member of the Council on Foreign Relations. |
Marvin L. Mann (72) |
| Year of Election or Appointment: 1993 Mr. Mann is Chairman of the Independent Trustees (2001-present). He is Chairman Emeritus of Lexmark International, Inc. (computer peripherals), where he served as CEO until April 1998, retired as Chairman May 1999, and remains a member of the Board. Prior to 1991, he held the positions of Vice President of International Business Machines Corporation (IBM) and President and General Manager of various IBM divisions and subsidiaries. He is a member of the Executive Committee of the Independent Director's Council of the Investment Company Institute. In addition, Mr. Mann is a member of the President's Cabinet at the University of Alabama and the Board of Visitors of the Culverhouse College of Commerce and Business Administration at the University of Alabama. |
William O. McCoy (71) |
| Year of Election or Appointment: 1997 Prior to his retirement in December 1994, Mr. McCoy was Vice Chairman of the Board of BellSouth Corporation (telecommunications) and President of BellSouth Enterprises. He is currently a Director of Liberty Corporation (holding company), Duke Realty Corporation (real estate), and Progress Energy, Inc. (electric utility). He is also a partner of Franklin Street Partners (private investment management firm) and a member of the Research Triangle Foundation Board. In addition, Mr. McCoy served as the Interim Chancellor (1999-2000) and a member of the Board of Visitors for the University of North Carolina at Chapel Hill and currently serves on the Board of Directors of the University of North Carolina Health Care System and the Board of Visitors of the Kenan-Flagler Business School (University of North Carolina at Chapel Hill). He also served as Vice President of Finance for the University of North Carolina (16-school system). |
Cornelia M. Small (61) |
| Year of Election or Appointment: 2005 Ms. Small is a member (2000-present) and Chairperson (2002-present) of the Investment Committee, and a member (2002-present) of the Board of Trustees of Smith College. Previously, she served as Chief Investment Officer (1999-2000), Director of Global Equity Investments (1996-1999), and a member of the Board of Directors of Scudder, Stevens & Clark (1990-1997) and Scudder Kemper Investments (1997-1998). In addition, Ms. Small served as Co-Chair (2000-2003) of the Annual Fund for the Fletcher School of Law and Diplomacy. |
William S. Stavropoulos (66) |
| Year of Election or Appointment: 2002 Mr. Stavropoulos is Chairman of the Board (2000-present) and a Member of the Board of Directors of The Dow Chemical Company. Since joining The Dow Chemical Company in 1967, Mr. Stavropoulos served in numerous senior management positions, including President (1993-2000; 2002-2003), CEO (1995-2000; 2002-2004), and Chairman of the Executive Committee (2000-2004). Currently, he is a Director of NCR Corporation (data warehousing and technology solutions), BellSouth Corporation (telecommunications), Chemical Financial Corporation, Maersk Inc. (industrial conglomerate, 2002-present), and Metalmark Capital (private equity investment firm, 2005-present). He also serves as a member of the Board of Trustees of the American Enterprise Institute for Public Policy Research. In addition, Mr. Stavropoulos is a member of The Business Council, J.P. Morgan International Council and the University of Notre Dame Advisory Council for the College of Science. |
Kenneth L. Wolfe (66) |
| Year of Election or Appointment: 2005 Mr. Wolfe also serves as a Trustee (2005-present) or Member of the Advisory Board (2004-present) of other investment companies advised by FMR. Prior to his retirement in 2001, Mr. Wolfe was Chairman and Chief Executive Officer of Hershey Foods Corporation (1993-2001). He currently serves as a member of the boards of Adelphia Communications Corporation (2003-present), Bausch & Lomb, Inc., and Revlon Inc. (2004-present). |
Annual Report
Advisory Board Members and Executive Officers:
Correspondence intended for Mr. Gamper may be sent to Fidelity Investments, P.O. Box 55235, Boston, Massachusetts 02205-5235. Correspondence intended for each executive officer and Mr. Lynch may be sent to Fidelity Investments, 82 Devonshire Street, Boston, Massachusetts 02109.
Name, Age; Principal Occupation |
Albert R. Gamper, Jr. (63) |
| Year of Election or Appointment: 2005 Member of the Advisory Board of Fidelity Securities Fund. Prior to his retirement in December 2004, Mr. Gamper served as Chairman of the Board of CIT Group Inc. (commercial finance). During his tenure with CIT Group Inc. Mr. Gamper served in numerous senior management positions, including Chairman (1987-1989; 1999-2001; 2002-2004), Chief Executive Officer (1987-2004), and President (1989-2002). He currently serves as a member of the Board of Directors of Public Service Enterprise Group (utilities, 2001-present), Chairman of the Board of Governors, Rutgers University (2004-present), and Chairman of the Board of Saint Barnabas Health Care System. |
Peter S. Lynch (61) |
| Year of Election or Appointment: 2003 Member of the Advisory Board of Fidelity Securities Fund. Vice Chairman and a Director of FMR, and Vice Chairman (2001-present) and a Director (2000-present) of FMR Co., Inc. Previously, Mr. Lynch served as a Trustee of the Fidelity funds (1990-2003). In addition, he serves as a Trustee of Boston College, Massachusetts Eye & Ear Infirmary, Historic Deerfield, John F. Kennedy Library, and the Museum of Fine Arts of Boston. |
Dwight D. Churchill (51) |
| Year of Election or Appointment: 2005 Vice President of the fund. Mr. Churchill also serves as Vice President of certain Equity Funds (2005-present) and certain High Income Funds (2005-present). Previously, he served as Head of Fidelity's Fixed-Income Division (2000-2005), Vice President of Fidelity's Money Market Funds (2000-2005), Vice President of Fidelity's Bond Funds, and Senior Vice President of FIMM (2000) and FMR. Mr. Churchill joined Fidelity in 1993 as Vice President and Group Leader of Taxable Fixed-Income Investments. |
Walter C. Donovan (43) |
| Year of Election or Appointment: 2005 Vice President of the fund. Mr. Donovan also serves as Vice President of Fidelity's High Income Funds (2005-present), Fidelity's Fixed-Income Funds (2005-present), certain Asset Allocation Funds (2005-present), and certain Balanced Funds (2005-present). Mr. Donovan also serves as Executive Vice President of FMR (2005-present) and FMRC (2005-present). Previously, Mr. Donovan served as Vice President and Director of Fidelity's International Equity Trading group (1998-2005). |
Eric D. Roiter (56) |
| Year of Election or Appointment: 2004 Secretary of the fund. He also serves as Secretary of other Fidelity funds; Vice President, General Counsel, and Secretary of FMR Co., Inc. (2001-present) and FMR; Assistant Secretary of Fidelity Management & Research (U.K.) Inc. (2001-present), Fidelity Management & Research (Far East) Inc. (2001-present), and Fidelity Investments Money Management, Inc. (2001-present). Mr. Roiter is an Adjunct Member, Faculty of Law, at Boston College Law School (2003-present). Previously, Mr. Roiter served as Vice President and Secretary of Fidelity Distributors Corporation (FDC) (1998-2005). |
Stuart Fross (45) |
| Year of Election or Appointment: 2004 Assistant Secretary of the fund. Mr. Fross also serves as Assistant Secretary of other Fidelity funds (2003-present), Vice President and Secretary of FDC (2005-present), and is an employee of FMR. |
Christine Reynolds (46) |
| Year of Election or Appointment: 2004 President, Treasurer, and Anti-Money Laundering (AML) officer of the fund. Ms. Reynolds also serves as President, Treasurer, and AML officer of other Fidelity funds (2004) and is a Vice President (2003) and an employee (2002) of FMR. Before joining Fidelity Investments, Ms. Reynolds worked at PricewaterhouseCoopers LLP (PwC) (1980-2002), where she was most recently an audit partner with PwC's investment management practice. |
Timothy F. Hayes (54) |
| Year of Election or Appointment: 2004 Chief Financial Officer of the fund. Mr. Hayes also serves as Chief Financial Officer of other Fidelity funds (2002-present) and President of Fidelity Investment Operations (2005-present) which includes Fidelity Pricing and Cash Management Services Group (FPCMS), where he served as President (1998-2005). Mr. Hayes serves as President of Fidelity Service Company (2003-present) where he also serves as a Director. Mr. Hayes also served as President of Fidelity Investments Operations Group (FIOG, 2002-2005). |
Kenneth A. Rathgeber (58) |
| Year of Election or Appointment: 2004 Chief Compliance Officer of the fund. Mr. Rathgeber also serves as Chief Compliance Officer of other Fidelity funds (2004) and Executive Vice President of Risk Oversight for Fidelity Investments (2002). Previously, he served as Executive Vice President and Chief Operating Officer for Fidelity Investments Institutional Services Company, Inc. (1998-2002). |
John R. Hebble (47) |
| Year of Election or Appointment: 2004 Deputy Treasurer of the fund. Mr. Hebble also serves as Deputy Treasurer of other Fidelity funds (2003), and is an employee of FMR. Before joining Fidelity Investments, Mr. Hebble worked at Deutsche Asset Management where he served as Director of Fund Accounting (2002-2003) and Assistant Treasurer of the Scudder Funds (1998-2003). |
Bryan A. Mehrmann (44) |
| Year of Election or Appointment: 2005 Deputy Treasurer of the fund. Mr. Mehrmann also serves as Deputy Treasurer of other Fidelity funds (2005-present) and is an employee of FMR. Previously, Mr. Mehrmann served as Vice President of Fidelity Investments Institutional Services Group (FIIS)/Fidelity Investments Institutional Operations Corporation, Inc. (FIIOC) Client Services (1998-2004). |
Kimberley H. Monasterio (41) |
| Year of Election or Appointment: 2004 Deputy Treasurer of the fund. Ms. Monasterio also serves as Deputy Treasurer of other Fidelity funds (2004) and is an employee of FMR (2004). Before joining Fidelity Investments, Ms. Monasterio served as Treasurer (2000-2004) and Chief Financial Officer (2002-2004) of the Franklin Templeton Funds and Senior Vice President of Franklin Templeton Services, LLC (2000-2004). |
Kenneth B. Robins (35) |
| Year of Election or Appointment:2005 Deputy Treasurer of the fund. Mr. Robins also serves as Deputy Treasurer of other Fidelity funds (2005-present) and is an employee of FMR (2004-present). Before joining Fidelity Investments, Mr. Robins worked at KPMG LLP, where he was a partner in KPMG's department of professional practice (2002-2004) and a Senior Manager (1999-2000). In addition, Mr. Robins served as Assistant Chief Accountant, United States Securities and Exchange Commission (2000-2002). |
Robert G. Byrnes (38) |
| Year of Election or Appointment: 2005 Assistant Treasurer of the fund. Mr. Byrnes also serves as Assistant Treasurer of other Fidelity funds (2005-present) and is an employee of FMR (2005-present). Previously, Mr. Byrnes served as Vice President of FPCMS (2003-2005). Before joining Fidelity Investments, Mr. Byrnes worked at Deutsche Asset Management where he served as Vice President of the Investment Operations Group (2000-2003). |
John H. Costello (58) |
| Year of Election or Appointment: 2004 Assistant Treasurer of the fund. Mr. Costello also serves as Assistant Treasurer of other Fidelity funds and is an employee of FMR. |
Peter L. Lydecker (51) |
| Year of Election or Appointment: 2004 Assistant Treasurer of the fund. Mr. Lydecker also serves as Assistant Treasurer of other Fidelity funds (2004) and is an employee of FMR. |
Mark Osterheld (50) |
| Year of Election or Appointment: 2004 Assistant Treasurer of the fund. Mr. Osterheld also serves as Assistant Treasurer of other Fidelity funds (2002) and is an employee of FMR. |
Gary W. Ryan (46) |
| Year of Election or Appointment: 2005 Assistant Treasurer of the fund. Mr. Ryan also serves as Assistant Treasurer of other Fidelity funds (2005-present) and is an employee of FMR (2005-present). Previously, Mr. Ryan served as Vice President of Fund Reporting in FPCMS (1999-2005). |
Salvatore Schiavone (39) |
| Year of Election or Appointment: 2005 Assistant Treasurer of the fund. Mr. Schiavone also serves as Assistant Treasurer of other Fidelity funds (2005-present) and is an employee of FMR (2005-present). Before joining Fidelity Investments, Mr. Schiavone worked at Deutsche Asset Management, where he most recently served as Assistant Treasurer (2003-2005) of the Scudder Funds and Vice President and Head of Fund Reporting (1996-2003). |
Annual Report
Distributions
The Board of Trustees of Advisor Small Cap Value Fund voted to pay to shareholders of record at the opening of business on record date, the following distributions per share derived from capital gains realized from sales of portfolio securities:
| Pay Date | Record Date | Capital Gains |
Class A | 9/12/05 | 9/9/05 | $0.255 |
| | | |
Class T | 9/12/05 | 9/9/05 | $0.257 |
| | | |
Class B | 9/12/05 | 9/9/05 | $0.224 |
| | | |
Class C | 9/12/05 | 9/9/05 | $0.228 |
| | | |
The fund hereby designates as capital gain dividends: for dividends with respect to the taxable year ended July 31, 2005, $16,591, or, if subsequently determined to be different, the net capital gain of such year.
Class A designates 57% of the dividend distributed in December 2004 during the fiscal year as qualifying for the dividends-received deduction for corporate shareholders.
Class A designates 100% of the dividend distributed in December, during the fiscal year as amounts which may be taken into account as a dividend for purposes of the maximum rate under section 1(h)(11) of the Internal Revenue Code.
The fund will notify shareholders in January 2006 of amounts for use in preparing 2005 income tax returns.
Annual Report
Board Approval of Investment Advisory Contracts and Management Fees
Small Cap Value Fund
Each year, typically in July, the Board of Trustees, including the independent Trustees (together, the Board), votes on the renewal of the management contract and sub-advisory agreements (together, the Advisory Contracts) for the fund. The Board, assisted by the advice of fund counsel and independent Trustees' counsel, requests and considers a broad range of information throughout the year.
The Board meets regularly each month except August and takes into account throughout the year matters bearing on Advisory Contracts. The Board, acting directly and through its separate committees, considers at each of its meetings factors that are relevant to the annual renewal of the fund's Advisory Contracts, including the services and support provided to the fund and its shareholders by Fidelity. At the time of the renewal, the Board had 11 standing committees, each composed of independent Trustees with varying backgrounds, to which the Board has assigned specific subject matter responsibilities in order to enhance effective decision-making by the Board. Each committee has adopted a written charter outlining the structure and purposes of the committee. One such committee, the Equity Contract Committee, meets periodically during the first six months of each year and as necessary to consider matters specifically related to the annual renewal of Advisory Contracts. The committee requests and receives information on, and makes recommendations to the independent Trustees concerning, the approval and annual review of the Advisory Contracts.
At its July 2005 meeting, the Board of Trustees, including the independent Trustees, unanimously determined to renew the Advisory Contracts for the fund. In reaching its determination, the Board considered all factors it believed relevant, including (1) the nature, extent, and quality of the services to be provided to the fund and its shareholders by Fidelity (including the investment performance of the fund); (2) the competitiveness of the management fee and total expenses of the fund; (3) the total costs of the services to be provided by and the profits to be realized by the investment adviser and its affiliates from the relationship with the fund; (4) the extent to which economies of scale would be realized as the fund grows; and (5) whether fee levels reflect these economies of scale, if any, for the benefit of fund shareholders.
In determining whether to renew the Advisory Contracts for the fund, the Board ultimately reached a determination, with the assistance of fund counsel and independent Trustees' counsel, that the renewal of the Advisory Contracts and the compensation to be received by Fidelity under the management contract is consistent with Fidelity's fiduciary duty under applicable law. In addition to evaluating the specific factors noted above, the Board, in reaching its determination, is aware that shareholders in the fund have a broad range of investment choices available to them, including a wide choice among mutual funds offered by competitors to Fidelity, and that the fund's shareholders, with the opportunity to review and weigh the disclosure provided by the fund in its prospectus and other public disclosures, have chosen to invest in this fund, managed by Fidelity.
Annual Report
Board Approval of Investment Advisory Contracts and
Management Fees - continued
Nature, Extent, and Quality of Services Provided by Fidelity. The Board considered staffing within the investment adviser, FMR, and the sub-advisers (together, the Investment Advisers), including the background of the fund's portfolio manager and the fund's investment objective and discipline. The independent Trustees also had discussions with senior management of Fidelity's investment operations and investment groups. The Board considered the structure of the portfolio manager compensation program and whether this structure provides appropriate incentives.
Fidelity Resources Dedicated to Investment Management and Support Services. The Board reviewed the size, education, and experience of the Investment Advisers' investment staff, their use of technology, and the Investment Advisers' approach to recruiting, training, and retaining portfolio managers and other research, advisory, and management personnel. The Board considered Fidelity's extensive global research capabilities that enable the Investment Advisers to aggregate data from various sources in an effort to produce positive investment results. The Board noted that Fidelity's analysts have access to a variety of technological tools that enable them to perform both fundamental and quantitative analysis and to specialize in various disciplines. The Board also considered that Fidelity's portfolio managers and analysts have access to daily portfolio attribution that allows for monitoring of a fund's portfolio, as well as an electronic communication system that provides immediate real-time access to research concerning issuers and credit enhancers.
Shareholder and Administrative Services. The Board considered the nature, extent, quality, and cost of administrative, distribution, and shareholder services performed by the Investment Advisers and their affiliates under the Advisory Contracts and under separate agreements covering transfer agency, pricing and bookkeeping, and securities lending services for the fund. The Board also considered the nature and extent of the Investment Advisers' supervision of third party service providers, principally custodians and subcustodians. The Board reviewed the allocation of fund brokerage, including allocations to brokers affiliated with the Investment Advisers, the use of brokerage commissions to pay fund expenses, and the use of "soft" commission dollars to pay for research services. The Board also considered that Fidelity voluntarily decided in 2004 to stop using "soft" commission dollars to pay for market data and, instead, to pay for that data out of its own resources. The Board also considered the resources devoted to, and the record of compliance with, the fund's compliance policies and procedures.
The Board noted that the growth of fund assets across the complex allows Fidelity to reinvest in the development of services designed to enhance the value or convenience of the Fidelity funds as investment vehicles. These services include 24-hour access to account information and market information through phone representatives and over the Internet, and investor education materials and asset allocation tools.
Annual Report
Investment in a Large Fund Family. The Board considered the benefits to shareholders of investing in a Fidelity fund, including the benefits of investing in a fund that is part of a large family of funds offering a variety of investment disciplines and providing for a large variety of mutual fund investor services. For example, fund shareholders are offered the privilege of exchanging shares of the fund for shares of other Fidelity funds, as set forth in the fund's prospectus, without paying an additional sales charge. The Board noted that, since July 2004, Fidelity has taken a number of actions that benefited particular funds, including (i) voluntarily deciding in 2004 to stop using "soft" commission dollars to pay for market data and, instead, to pay for that data out of its own resources, (ii) contractually agreeing to impose management fee reductions and expense limitations on its five Spartan stock index funds and its stock index fund available through variable insurance products, (iii) contractually agreeing to eliminate the management fees on the Fidelity Freedom Funds and the Fidelity Advisor Freedom Funds, (iv) contractually agreeing to reduce the management fees on most of its investment-grade taxable bond funds, and (v) contractually agreeing to impose expense limitations on its retail and Spartan investment-grade taxable bond funds.
Investment Performance. The Board considered whether the fund has operated within its investment objective, as well as its record of compliance with its investment restrictions. The Board noted that it is not possible to evaluate performance in any comprehensive fashion because the fund had been in operation for less than one calendar year. Once the fund has been in operation for at least one calendar year, the Board will review the fund's absolute investment performance for each class, as well as the fund's relative investment performance for each class measured against (i) a broad-based securities market index and (ii) a peer group of mutual funds deemed appropriate by the Board.
The Board also considered that, beginning November 1, 2005, the fund's management fee will be subject to upward or downward adjustment depending upon whether, and to what extent, the fund's investment performance for the performance period exceeds, or is exceeded by, the record (over the same period) of a Board-approved performance adjustment index. The Board realizes that the performance adjustment provides FMR with a strong economic incentive to seek to achieve superior performance for the fund's shareholders and helps to more closely align the interests of FMR and the fund's shareholders.
The Board has had thorough discussions with FMR throughout the year about the Board's and FMR's concerns about equity research, equity fund performance, and compliance with internal policies governing gifts and entertainment. FMR has taken steps that it believes will refocus and strengthen equity research and equity portfolio management and trading. The Board noted with favor FMR's recent reorganization of its senior management team and FMR's plans to dedicate additional resources to investment research, and participated in the process that led to those changes.
Annual Report
Board Approval of Investment Advisory Contracts and
Management Fees - continued
Based on its review, and giving particular weight to the nature and quality of the resources dedicated by the Investment Advisers to maintain and improve relative performance, the Board concluded that the nature, extent, and quality of the services provided by Fidelity will benefit the fund's shareholders, particularly in light of the Board's view that the fund's shareholders benefit from investing in a fund that is part of a large family of funds offering a variety of investment disciplines and services.
Competitiveness of Management Fee and Total Fund Expenses. The Board considered the fund's management fee and total expenses compared to "mapped groups" of competitive funds and classes. Fidelity creates "mapped groups" by combining similar Lipper investment objective categories that have comparable management fee characteristics. Combining Lipper investment objective categories aids the Board's management fee and total expense comparisons by broadening the competitive group used for comparison and by reducing the number of universes to which various Fidelity funds are compared.
The Board considered two proprietary management fee comparisons for the period of the fund's operations shown in the chart below. The group of Lipper funds used by the Board for management fee comparisons is referred to below as the "Total Mapped Group" and, for the reasons explained above, is broader than the Lipper peer group used by the Board for performance comparisons. The Total Mapped Group comparison focuses on a fund's standing relative to the total universe of comparable funds available to investors, in terms of gross management fees before expense reimbursements or caps. "TMG %" represents the percentage of funds in the Total Mapped Group that had management fees that were lower than the fund's. For example, a TMG % of 16% means that 84% of the funds in the Total Mapped Group had higher management fees than the fund. The "Asset-Size Peer Group" (ASPG) comparison focuses on a fund's standing relative to non-Fidelity funds similar in size to the fund within the Total Mapped Group. The ASPG represents at least 15% of the funds in the Total Mapped Group with comparable asset size and management fee characteristics, subject to a minimum of 50 funds (or all funds in the Total Mapped Group if fewer than 50). Additional information, such as the ASPG quartile ("quadrant") in which the fund's management fee ranked, is also included in the chart and considered by the Board.
Annual Report
The Board noted that the fund's management fee ranked below the median of its Total Mapped Group and below the median of its ASPG for the period.
Based on its review, the Board concluded that the fund's management fee was fair and reasonable in light of the services that the fund receives and the other factors considered.
In its review of each class's total expenses, the Board considered the fund's management fee as well as other fund or class expenses, as applicable, such as transfer agent fees, pricing and bookkeeping fees, fund-paid 12b-1 fees, and custodial, legal, and audit fees. The Board also noted the effects of any waivers and reimbursements on fees and expenses. As part of its review, the Board also considered current and historical total expenses of each class of the fund compared to competitive fund median expenses. Each class of the fund is compared to those funds and classes in the Total Mapped Group (used by the Board for management fee comparisons) that have a similar sales load structure.
The Board noted that the total expenses of Fidelity Small Cap Value Fund (retail class) ranked below its competitive median for the period, the total expenses of Class A ranked equal to its competitive median for the period, and the total expenses of each of Class B, Class C, Class T and Institutional Class ranked above its competitive median for the period. The Board considered that the fund launched in November 2004 and that the classes were above median because of high expenses in basis points due to their small size. The Board noted that the fund offers multiple classes, each of which has a different sales load and 12b-1 fee structure, and that the multiple structures are intended to offer a range of pricing options for the intermediary market. The Board also noted that the total expenses of the classes vary primarily by the level of their 12b-1 fees, although differences in transfer agent fees may also cause expenses to vary from class to class.
Annual Report
Board Approval of Investment Advisory Contracts and
Management Fees - continued
Furthermore, the Board considered that, effective June 1, 2005, FMR voluntarily agreed to reimburse each class of the fund to the extent that total operating expenses (excluding 12b-1 fees and certain other expenses) exceed 115 basis points. The Board considered that, if the voluntary expense reimbursements had been in effect in 2004, the total expenses of each of Class A, Class B and Class C would have ranked below the median and the total expenses of Institutional Class would have ranked equal to the median.
In its review of total expenses, the Board also considered Fidelity fee structures and other information on clients that FMR and its affiliates service in other competitive markets, such as other mutual funds advised or subadvised by FMR or its affiliates, pension plan clients, and other institutional clients.
Based on its review, the Board concluded that the total expenses for each class of the fund were reasonable, although in some cases above the median of the universe presented for comparison, in light of the services that the fund and its shareholders receive and the other factors considered.
Costs of the Services and Profitability. The Board considered the revenues earned and the expenses incurred by Fidelity in conducting the business of developing, marketing, distributing, managing, administering and servicing the fund and its shareholders. The Board also considered the level of Fidelity's profits in respect of all the Fidelity funds.
On an annual basis, FMR presents to the Board Fidelity's profitability for the fund. Fidelity calculates the profitability for each fund, as well as aggregate profitability for groups of Fidelity funds and all Fidelity funds, using a series of detailed revenue and cost allocation methodologies which originate with the audited books and records of Fidelity. The Audit Committee of the Board reviews any significant changes from the prior year's methodologies.
PricewaterhouseCoopers LLP (PwC), independent registered accounting firm and auditor to Fidelity and certain Fidelity funds, has been engaged annually by the Board as part of the Board's assessment of the results of Fidelity's profitability analysis. PwC's engagement includes the review and assessment of Fidelity's methodologies used in determining the revenues and expenses attributable to Fidelity's mutual fund business, and completion of agreed-upon procedures surrounding the mathematical accuracy of fund profitability and its conformity to allocation methodologies. After considering PwC's reports issued under the engagement and information provided by Fidelity, the Board believes that while other allocation methods may also be reasonable, Fidelity's profitability methodologies are reasonable in all material respects.
Annual Report
The Board has also reviewed Fidelity's non-fund businesses and any fall-out benefits related to the mutual fund business as well as cases where Fidelity's affiliates may benefit from or be related to the fund's business. In addition, a special committee of the Board reviewed services provided to Fidelity by its affiliates and determined that the fees that Fidelity paid for such services were reasonable.
The Board considered the costs of the services provided by and the profits realized by Fidelity in connection with the operation of the fund and determined that the amount of profit is a fair entrepreneurial profit for the management of the fund.
Economies of Scale. The Board considered whether there have been economies of scale in respect of the management of the Fidelity funds, whether the Fidelity funds (including the fund) have appropriately benefited from any such economies of scale, and whether there is potential for realization of any further economies of scale. The Board considered the extent to which the fund will benefit from economies of scale through increased services to the fund, through waivers or reimbursements, or through fee or expense reductions, including reductions that occur through operation of the transfer agent agreement. The transfer agent fee varies in part based on the number of accounts in the fund. If the number of accounts decreases or the average account size increases, the overall transfer agent fee rate decreases.
The Board recognized that the fund's management contract incorporates a "group fee" structure, which provides for lower fee rates as total fund assets under FMR's management increase, and for higher fee rates as total fund assets under FMR's management decrease. The Board considered that the group fee is designed to deliver the benefits of economies of scale to fund shareholders when total fund assets increase, even if assets of any particular fund are unchanged or have declined, because some portion of Fidelity's costs are attributable to services provided to all Fidelity funds, and all funds benefit if those costs can be allocated among more assets. The Board concluded that, given the group fee structure, fund shareholders will achieve a certain level of economies of scale as assets under FMR's management increase at the fund complex level, regardless of whether Fidelity achieves any such economies of scale.
The Board further concluded that any potential economies of scale are being shared between fund shareholders and Fidelity in an appropriate manner.
Additional Information Requested by the Board. In order to develop fully the factual basis for consideration of the Advisory Contracts, the Board requested additional information regarding (i) equity fund transfer agency fees; (ii) Fidelity's fund profitability methodology and the impact of various changes in the methodology over time; (iii) benefits to shareholders from economies of scale; (iv) composition and characteristics of various fund and industry data used in comparisons; and (v) compensation of portfolio managers and research analysts.
Annual Report
Board Approval of Investment Advisory Contracts and
Management Fees - continued
Based on its evaluation of all of the conclusions noted above, and after considering all material factors, the Board ultimately concluded that the existing advisory fee structures are fair and reasonable, and that the fund's existing Advisory Contracts should be renewed.
Annual Report
Managing Your Investments
Fidelity offers several ways to conveniently manage your personal investments via your telephone or PC. You can access your account information, conduct trades and research your investments 24 hours a day.
By Phone
Fidelity Automated Service Telephone provides a single toll-free number to access account balances, positions, quotes and trading. It's easy to navigate the service, and on your first call, the system will help you create a personal identification number (PIN) for security.
(phone_graphic)
Fidelity Automated
Service Telephone (FAST®)
1-800-544-5555
Press
1 For mutual fund and brokerage trading.
2 For quotes.*
3 For account balances and holdings.
4 To review orders and mutual
fund activity.
5 To change your PIN.
*0 To speak to a Fidelity representative.
By PC
Fidelity's web site on the Internet provides a wide range of information, including daily financial news, fund performance, interactive planning tools and news about Fidelity products and services.
(computer_graphic)
Fidelity's Web Site
www.fidelity.com
* When you call the quotes line, please remember that a fund's yield and return will vary and, except for money market funds, share price will also vary. This means that you may have a gain or loss when you sell your shares. There is no assurance that money market funds will be able to maintain a stable $1 share price; an investment in a money market fund is not insured or guaranteed by the U.S. government. Total returns are historical and include changes in share price, reinvestment of dividends and capital gains, and the effects of any sales charges.
Annual Report
To Visit Fidelity
For directions and hours,
please call 1-800-544-9797.
Arizona
7001 West Ray Road
Chandler, AZ
7373 N. Scottsdale Road
Scottsdale, AZ
California
815 East Birch Street
Brea, CA
1411 Chapin Avenue
Burlingame, CA
851 East Hamilton Avenue
Campbell, CA
19200 Von Karman Avenue
Irvine, CA
601 Larkspur Landing Circle
Larkspur, CA
10100 Santa Monica Blvd.
Los Angeles, CA
27101 Puerta Real
Mission Viejo, CA
73-575 El Paseo
Palm Desert, CA
251 University Avenue
Palo Alto, CA
123 South Lake Avenue
Pasadena, CA
16995 Bernardo Ctr. Drive
Rancho Bernardo, CA
1740 Arden Way
Sacramento, CA
7676 Hazard Center Drive
San Diego, CA
8 Montgomery Street
San Francisco, CA
3793 State Street
Santa Barbara, CA
21701 Hawthorne Boulevard
Torrance, CA
2001 North Main Street
Walnut Creek, CA
6300 Canoga Avenue
Woodland Hills, CA
Colorado
1625 Broadway
Denver, CO
9185 East Westview Road
Littleton, CO
Connecticut
48 West Putnam Avenue
Greenwich, CT
265 Church Street
New Haven, CT
300 Atlantic Street
Stamford, CT
29 South Main Street
West Hartford, CT
Delaware
222 Delaware Avenue
Wilmington, DE
Florida
4400 N. Federal Highway
Boca Raton, FL
121 Alhambra Plaza
Coral Gables, FL
2948 N. Federal Highway
Ft. Lauderdale, FL
1907 West State Road 434
Longwood, FL
8880 Tamiami Trail, North
Naples, FL
3550 Tamiami Trail, South
Sarasota, FL
1502 N. Westshore Blvd.
Tampa, FL
2465 State Road 7
Wellington, FL
3501 PGA Boulevard
West Palm Beach, FL
Georgia
3445 Peachtree Road, N.E.
Atlanta, GA
1000 Abernathy Road
Atlanta, GA
Illinois
One North LaSalle Street
Chicago, IL
875 North Michigan Ave.
Chicago, IL
1415 West 22nd Street
Oak Brook, IL
1700 East Golf Road
Schaumburg, IL
3232 Lake Avenue
Wilmette, IL
Indiana
4729 East 82nd Street
Indianapolis, IN
Kansas
5400 College Boulevard
Overland Park, KS
Maine
Three Canal Plaza
Portland, ME
Maryland
7315 Wisconsin Avenue
Bethesda, MD
One W. Pennsylvania Ave.
Towson, MD
Massachusetts
801 Boylston Street
Boston, MA
155 Congress Street
Boston, MA
300 Granite Street
Braintree, MA
44 Mall Road
Burlington, MA
405 Cochituate Road
Framingham, MA
416 Belmont Street
Worcester, MA
Michigan
500 E. Eisenhower Pkwy.
Ann Arbor, MI
280 Old N. Woodward Ave.
Birmingham, MI
43420 Grand River Avenue
Novi, MI
29155 Northwestern Hwy.
Southfield, MI
Minnesota
7600 France Avenue South
Edina, MN
Missouri
8885 Ladue Road
Ladue, MO
Annual Report
Nevada
2225 Village Walk Drive
Henderson, NV
New Jersey
150 Essex Street
Millburn, NJ
56 South Street
Morristown, NJ
396 Route 17, North
Paramus, NJ
3518 Route 1 North
Princeton, NJ
530 Highway 35
Shrewsbury, NJ
New York
1055 Franklin Avenue
Garden City, NY
37 West Jericho Turnpike
Huntington Station, NY
1271 Avenue of the Americas
New York, NY
61 Broadway
New York, NY
350 Park Avenue
New York, NY
200 Fifth Avenue
New York, NY
733 Third Avenue
New York, NY
11 Penn Plaza
New York, NY
2070 Broadway
New York, NY
1075 Northern Blvd.
Roslyn, NY
North Carolina
4611 Sharon Road
Charlotte, NC
Ohio
3805 Edwards Road
Cincinnati, OH
1324 Polaris Parkway
Columbus, OH
28699 Chagrin Boulevard
Woodmere Village, OH
Oregon
16850 SW 72nd Avenue
Tigard, OR
Pennsylvania
600 West DeKalb Pike
King of Prussia, PA
1735 Market Street
Philadelphia, PA
12001 Perry Highway
Wexford, PA
Rhode Island
47 Providence Place
Providence, RI
Tennessee
6150 Poplar Avenue
Memphis, TN
Texas
10000 Research Boulevard
Austin, TX
4001 Northwest Parkway
Dallas, TX
12532 Memorial Drive
Houston, TX
2701 Drexel Drive
Houston, TX
6500 N. MacArthur Blvd.
Irving, TX
6005 West Park Boulevard
Plano, TX
14100 San Pedro
San Antonio, TX
1576 East Southlake Blvd.
Southlake, TX
19740 IH 45 North
Spring, TX
Utah
215 South State Street
Salt Lake City, UT
Virginia
1861 International Drive
McLean, VA
Washington
411 108th Avenue, N.E.
Bellevue, WA
1518 6th Avenue
Seattle, WA
Washington, DC
1900 K Street, N.W.
Washington, DC
Wisconsin
595 North Barker Road
Brookfield, WI
Fidelity Brokerage Services, Inc., 100 Summer St., Boston, MA 02110 Member NYSE/SIPC
Annual Report
To Write Fidelity
We'll give your correspondence immediate attention and send you written confirmation upon completion of your request.
(letter_graphic)
Making Changes
To Your Account
(such as changing name, address, bank, etc.)
Fidelity Investments
P.O. Box 770001
Cincinnati, OH 45277-0002
(letter_graphic)
For Non-Retirement
Accounts
Buying shares
Fidelity Investments
P.O. Box 770001
Cincinnati, OH 45277-0003
Overnight Express
Fidelity Investments
Attn: Distribution Services
100 Crosby Parkway - KC1H
Covington, KY 41015
Selling shares
Fidelity Investments
P.O. Box 770001
Cincinnati, OH 45277-0035
Overnight Express
Fidelity Investments
Attn: Distribution Services
100 Crosby Parkway - KC1H
Covington, KY 41015
General Correspondence
Fidelity Investments
P.O. Box 500
Merrimack, NH 03054-0500
(letter_graphic)
For Retirement
Accounts
Buying shares
Fidelity Investments
P.O. Box 770001
Cincinnati, OH 45277-0003
Selling shares
Fidelity Investments
P.O. Box 770001
Cincinnati, OH 45277-0035
Overnight Express
Fidelity Investments
Attn: Distribution Services
100 Crosby Parkway - KC1H
Covington, KY 41015
General Correspondence
Fidelity Investments
P.O. Box 500
Merrimack, NH 03054-0500
Annual Report
Annual Report
Investment Adviser
Fidelity Management & Research Company
Boston, MA
Investment Sub-Advisers
FMR Co., Inc.
Fidelity Management & Research
(U.K.) Inc.
Fidelity Management & Research
(Far East) Inc.
Fidelity International Investment Advisors
Fidelity Investments Japan Limited
Fidelity International Investment Advisors (U.K.) Limited
General Distributor
Fidelity Distributors Corporation
Boston, MA
Transfer and Service Agents
Fidelity Investments Institutional
Operations Company, Inc.
Boston, MA
Fidelity Service Company, Inc.
Boston, MA
Custodian
Citibank, N.A.
New York, NY
ASCV-UANN-0905
1.803731.100
(Fidelity Investment logo)(registered trademark)
Corporate Headquarters
82 Devonshire St., Boston, MA 02109
www.fidelity.com
(Fidelity Investment logo)(registered trademark)
Fidelity Advisor
Small Cap Value
Fund - Institutional Class
Annual Report
July 31, 2005
Institutional Class
is a class of Fidelity®
Small Cap Value Fund
(2_fidelity_logos) (Registered_Trademark)
Contents
Chairman's Message | <Click Here> | Ned Johnson's message to shareholders. |
Performance | <Click Here> | How the fund has done over time. |
Management's Discussion | <Click Here> | The manager's review of fund performance, strategy and outlook |
Shareholder Expense Example | <Click Here> | An example of shareholder expenses. |
Investment Changes | <Click Here> | A summary of the fund's investments. |
Investments | <Click Here> | A complete list of the fund's investments with their market values. |
Financial Statements | <Click Here> | Statements of assets and liabilities, operations, and changes in net assets,
as well as financial highlights. |
Notes | <Click Here> | Notes to the financial statements. |
Report of Independent Registered Public Accounting Firm | <Click Here> | |
Trustees and Officers | <Click Here> | |
Distributions | <Click Here> | |
Board Approval of Investment Advisory Contracts and Management Fees | <Click Here> | |
To view a fund's proxy voting guidelines and proxy voting record for the 12-month period ended June 30, visit www.fidelity.com/proxyvotingresults or visit the Securities and Exchange Commission's (SEC) web site at www.sec.gov. You may also call 1-877-208-0098 to request a free copy of the proxy voting guidelines.
Standard & Poor's, S&P and S&P 500 are registered service marks of The McGraw-Hill Companies, Inc. and have been licensed for use by Fidelity Distributors Corporation.
Other third party marks appearing herein are the property of their respective owners.
All other marks appearing herein are registered or unregistered trademarks or service marks of FMR Corp. or an affiliated company.
Annual Report
This report and the financial statements contained herein are submitted for the general information of the shareholders of the fund. This report is not authorized for distribution to prospective investors in the fund unless preceded or accompanied by an effective prospectus.
A fund files its complete schedule of portfolio holdings with the SEC for the first and third quarters of each fiscal year on Form N-Q. Forms N-Q are available on the SEC's web site at http://www.sec.gov. A fund's Forms N-Q may be reviewed and copied at the SEC's Public Reference Room in Washington, DC. Information regarding the operation of the SEC's Public Reference Room may be obtained by calling 1-800-SEC-0330. For a complete list of a fund's portfolio holdings, view the most recent quarterly holdings report, semiannual report, or annual report on Fidelity's web site at http://www.advisor.fidelity.com.
NOT FDIC INSURED · MAY LOSE VALUE · NO BANK GUARANTEE
Neither the fund nor Fidelity Distributors Corporation is a bank.
Annual Report
Chairman's Message
(photo_of_Edward_C_Johnson_3d)
Dear Shareholder:
During the past year or so, much has been reported about the mutual fund industry, and much of it has been more critical than I believe is warranted. Allegations that some companies have been less than forthright with their shareholders have cast a shadow on the entire industry. I continue to find these reports disturbing, and assert that they do not create an accurate picture of the industry overall. Therefore, I would like to remind everyone where Fidelity stands on these issues. I will say two things specifically regarding allegations that some mutual fund companies were in violation of the Securities and Exchange Commission's forward pricing rules or were involved in so-called "market timing" activities.
First, Fidelity has no agreements that permit customers who buy fund shares after 4 p.m. to obtain the 4 p.m. price. This is not a new policy. This is not to say that someone could not deceive the company through fraudulent acts. However, we are extremely diligent in preventing fraud from occurring in this manner - and in every other. But I underscore again that Fidelity has no so-called "agreements" that sanction illegal practices.
Second, Fidelity continues to stand on record, as we have for years, in opposition to predatory short-term trading that adversely affects shareholders in a mutual fund. Back in the 1980s, we initiated a fee - which is returned to the fund and, therefore, to investors - to discourage this activity. Further, we took the lead several years ago in developing a Fair Value Pricing Policy to prevent market timing on foreign securities in our funds. I am confident we will find other ways to make it more difficult for predatory traders to operate. However, this will only be achieved through close cooperation among regulators, legislators and the industry.
Yes, there have been unfortunate instances of unethical and illegal activity within the mutual fund industry from time to time. That is true of any industry. When this occurs, confessed or convicted offenders should be dealt with appropriately. But we are still concerned about the risk of over-regulation and the quick application of simplistic solutions to intricate problems. Every system can be improved, and we support and applaud well thought out improvements by regulators, legislators and industry representatives that achieve the common goal of building and protecting the value of investors' holdings.
For nearly 60 years, Fidelity has worked very hard to improve its products and service to justify your trust. When our family founded this company in 1946, we had only a few hundred customers. Today, we serve more than 18 million customers including individual investors and participants in retirement plans across America.
Let me close by saying that we do not take your trust in us for granted, and we realize that we must always work to improve all aspects of our service to you. In turn, we urge you to continue your active participation with your financial matters, so that your interests can be well served.
Best regards,
/s/Edward C. Johnson 3d
Edward C. Johnson 3d
Annual Report
Fidelity Advisor Small Cap Value Fund - Institutional Class
Performance: The Bottom Line
Average annual total return reflects the change in the value of an investment, assuming reinvestment of the class' dividend income and capital gains (the profits earned upon the sale of securities that have grown in value) and assuming a constant rate of performance each year. The $10,000 table and the fund's returns do not reflect the deduction of taxes that a shareholder would pay on fund distributions or the redemption of fund shares. During periods of reimbursement by Fidelity, a fund's total return will be greater than it would be had the reimbursement not occurred. How a fund did yesterday is no guarantee of how it will do tomorrow.
Average annual total returns take Fidelity Advisor Small Cap Value Fund's cumulative total return and show you what would have happened if Fidelity Advisor Small Cap Value Fund shares has performed at a constant rate each year. These numbers will be reported once the fund is a year old.
$10,000 Over Life of Fund
Let's say hypothetically that $10,000 was invested in Fidelity Advisor Small Cap Value Fund - Institutional Class on November 3, 2004, when the fund started. The chart shows how the value of your investment would have changed, and also shows how the Russell 2000® Value Index performed over the same period.
Annual Report
Management's Discussion of Fund Performance
Comments from Katherine Lieberman, Portfolio Manager of Fidelity Advisor Small Cap Value Fund
A late-inning rally on Wall Street helped push some key U.S. equity indexes to four-year highs by the conclusion of the 12-month period ending July 31, 2005. Spurred on by bullish economic data and strong corporate earnings, investors enjoyed a stellar month of July, capping off a turbulent 12-month period for U.S. equity markets. Stock prices bounced up and down during most of the year, moving in cadence with gyrations in the price of crude oil and investors' gathering and ebbing concerns about inflation. The Federal Reserve Board raised short-term interest rates eight times during the period, also affecting overall market sentiment. Despite their fluctuations, the major equity indexes finished on a high note, with the Standard & Poor's 500SM Index and the NASDAQ Composite® Index posting gains of 14.05% and 16.51%, respectively, for the period. The small-cap Russell 2000® Index rose 24.78% and the Russell Midcap® Index jumped 28.93%, while the blue-chips' Dow Jones Industrial AverageSM advanced only 7.29%.
Since its inception on November 3, 2004, through July 31, 2005, the fund's Institutional Class shares were up 28.36%, solidly outperforming the 16.66% return for the Russell 2000 Value Index during the same period. Favorable individual stock selection within a number of sectors as well as an overweighting in the energy sector made the biggest contributions to the fund's performance relative to its index. The fund also was helped by its holdings in late-cycle, construction-related stocks. Energy stocks such as exploration and production (E&P) companies benefited from high oil prices and increased production volumes, while energy services companies benefited from increased demand. Among the fund's top performers were E&P company Quicksilver Resources and energy services company Oil States International, while late-cycle construction company WESCO International was a notable absolute contributor. RC2 Corp., which makes learning toys, and designer denim company True Religion Apparel also boosted the fund's performance in absolute terms and relative to the sector index. I sold True Religion to lock in profits. In terms of disappointments, fashion-related stocks Innovo Group and Deckers Outdoor Corporation held back the fund's overall returns. Another specialty retailer, Cost Plus, was a detractor as well. Elsewhere, scant exposure to strong-performing utilities stocks further dampened the fund's relative return.
The views expressed in this statement reflect those of the portfolio manager only through the end of the period of the report as stated on the cover and do not necessarily represent the views of Fidelity or any other person in the Fidelity organization. Any such views are subject to change at any time based upon market or other conditions and Fidelity disclaims any responsibility to update such views. These views may not be relied on as investment advice and, because investment decisions for a Fidelity fund are based on numerous factors, may not be relied on as an indication of trading intent on behalf of any Fidelity fund.
Annual Report
Shareholder Expense Example
As a shareholder of the Fund, you incur two types of costs: (1) transaction costs, including sales charges (loads) on purchase payments or redemption proceeds, redemption fees, and (2) ongoing costs, including management fees, distribution and/or service (12b-1) fees and other Fund expenses. This Example is intended to help you understand your ongoing costs (in dollars) of investing in the Fund and to compare these costs with the ongoing costs of investing in other mutual funds.
The Example is based on an investment of $1,000 invested at the beginning of the period and held for the entire period (February 1, 2005 to July 31, 2005).
Actual Expenses
The first line of the table below for each class of the Fund provides information about actual account values and actual expenses. You may use the information in this line, together with the amount you invested, to estimate the expenses that you paid over the period. Simply divide your account value by $1,000.00 (for example, an $8,600 account value divided by $1,000.00 = 8.6), then multiply the result by the number in the first line for a class of the Fund under the heading entitled "Expenses Paid During Period" to estimate the expenses you paid on your account during this period. A small balance maintenance fee of $12.00 that is charged once a year may apply for certain accounts with a value of less than $2,000. This fee is not included in the table below. If it was, the estimate of expenses you paid during the period would be higher, and your ending account value lower, by this amount.
Hypothetical Example for Comparison Purposes
The second line of the table below for each class of the Fund provides information about hypothetical account values and hypothetical expenses based on a Class' actual expense ratio and an assumed rate of return of 5% per year before expenses, which is not the Class' actual return. The hypothetical account values and expenses may not be used to estimate the actual ending account balance or expenses you paid for the period. You may use this information to compare the ongoing costs of investing in the Fund and other funds. To do so, compare this 5% hypothetical example with the 5% hypothetical examples that appear in the shareholder reports of the other funds. A small balance maintenance fee of $12.00 that is charged once a year may apply for certain accounts with a value of less than $2,000. This fee is not included in the table below. If it was, the estimate of expenses you paid during the period would be higher, and your ending account value lower, by this amount.
Please note that the expenses shown in the table are meant to highlight your ongoing costs only and do not reflect any transaction costs. Therefore, the second line of the table is useful in comparing ongoing costs only, and will not help you determine the relative total costs of owning different funds. In addition, if these transactional costs were included, your costs would have been higher.
Annual Report
Shareholder Expense Example - continued
| Beginning
Account Value
February 1, 2005 | Ending
Account Value
July 31, 2005 | Expenses Paid
During Period*
February 1, 2005
to July 31, 2005 |
Class A | | | |
Actual | $ 1,000.00 | $ 1,154.20 | $ 7.64 |
HypotheticalA | $ 1,000.00 | $ 1,017.70 | $ 7.15 |
Class T | | | |
Actual | $ 1,000.00 | $ 1,151.40 | $ 8.91 |
HypotheticalA | $ 1,000.00 | $ 1,016.51 | $ 8.35 |
Class B | | | |
Actual | $ 1,000.00 | $ 1,148.90 | $ 11.62 |
HypotheticalA | $ 1,000.00 | $ 1,013.98 | $ 10.89 |
Class C | | | |
Actual | $ 1,000.00 | $ 1,149.80 | $ 11.51 |
HypotheticalA | $ 1,000.00 | $ 1,014.08 | $ 10.79 |
Small Cap Value | | | |
Actual | $ 1,000.00 | $ 1,155.90 | $ 5.51 |
HypotheticalA | $ 1,000.00 | $ 1,019.69 | $ 5.16 |
Institutional Class | | | |
Actual | $ 1,000.00 | $ 1,155.90 | $ 5.56 |
HypotheticalA | $ 1,000.00 | $ 1,019.64 | $ 5.21 |
A 5% return per year before expenses
* Expenses are equal to each Class' annualized expense ratio (shown in the table below); multiplied by the average account value over the period, multiplied by 181/365 (to reflect the one-half year period).
| Annualized
Expense Ratio |
Class A | 1.43% |
Class T | 1.67% |
Class B | 2.18% |
Class C | 2.16% |
Small Cap Value | 1.03% |
Institutional Class | 1.04% |
Annual Report
Investment Changes
Top Ten Stocks as of July 31, 2005 |
| % of fund's
net assets | % of fund's net assets
6 months ago |
RC2 Corp. | 3.3 | 4.9 |
Maverick Tube Corp. | 2.8 | 1.0 |
WESCO International, Inc. | 2.2 | 0.4 |
Compass Minerals International, Inc. | 2.1 | 0.0 |
Comstock Resources, Inc. | 1.6 | 0.0 |
Pioneer Companies, Inc. | 1.6 | 1.3 |
Steven Madden Ltd. | 1.6 | 2.3 |
USI Holdings Corp. | 1.6 | 1.3 |
Park-Ohio Holdings Corp. | 1.6 | 1.2 |
Carlisle Companies, Inc. | 1.4 | 0.7 |
| 19.8 | |
Top Five Market Sectors as of July 31, 2005 |
| % of fund's
net assets | % of fund's net assets
6 months ago |
Consumer Discretionary | 20.6 | 28.4 |
Financials | 18.7 | 20.7 |
Industrials | 18.2 | 11.9 |
Energy | 15.0 | 17.6 |
Information Technology | 7.0 | 4.0 |
Asset Allocation (% of fund's net assets) |
As of July 31, 2005 * | As of January 31, 2005 ** |
| Stocks 91.5% | | | Stocks 92.1% | |
| Bonds 0.8% | | | Bonds 0.0% | |
| Short-Term
Investments and
Net Other Assets 7.7% | | | Short-Term
Investments and
Net Other Assets 7.9% | |
* Foreign investments | 10.8% | | ** Foreign investments | 12.0% | |

Annual Report
Investments July 31, 2005
Showing Percentage of Net Assets
Common Stocks - 91.5% |
| Shares | | Value (Note 1) |
CONSUMER DISCRETIONARY - 20.5% |
Auto Components - 0.5% |
Spartan Motors, Inc. | 293,410 | | $ 3,438,765 |
Automobiles - 0.8% |
Monaco Coach Corp. | 199,200 | | 3,486,000 |
National R.V. Holdings, Inc. (a) | 167,700 | | 1,282,905 |
| | 4,768,905 |
Diversified Consumer Services - 0.8% |
Steiner Leisure Ltd. (a) | 142,030 | | 4,908,557 |
Hotels, Restaurants & Leisure - 1.7% |
AFC Enterprises, Inc. | 130,000 | | 1,779,700 |
Applebee's International, Inc. | 110,000 | | 2,916,100 |
Kerzner International Ltd. (a) | 39,470 | | 2,358,333 |
La Quinta Corp. unit (a) | 211,300 | | 1,901,700 |
Steak n Shake Co. (a) | 70,000 | | 1,515,500 |
| | 10,471,333 |
Household Durables - 1.7% |
Department 56, Inc. (a) | 248,000 | | 3,119,840 |
Interface, Inc. Class A (a) | 293,190 | | 2,993,470 |
Jarden Corp. (a) | 112,500 | | 4,315,500 |
| | 10,428,810 |
Leisure Equipment & Products - 4.9% |
Marine Products Corp. | 138,530 | | 1,953,273 |
MarineMax, Inc. (a) | 178,200 | | 5,926,932 |
Mega Bloks, Inc. (a) | 129,200 | | 2,694,063 |
RC2 Corp. (a) | 500,000 | | 20,404,994 |
| | 30,979,262 |
Media - 1.1% |
Emmis Communications Corp. Class A (a)(d) | 129,100 | | 2,650,423 |
Harris Interactive, Inc. (a) | 345,900 | | 1,393,977 |
Thomas Nelson, Inc. | 115,000 | | 2,626,600 |
| | 6,671,000 |
Multiline Retail - 0.9% |
Tuesday Morning Corp. | 162,300 | | 5,730,813 |
Specialty Retail - 4.9% |
Cost Plus, Inc. (a) | 265,630 | | 5,984,644 |
Genesco, Inc. (a) | 87,990 | | 3,279,387 |
Kirkland's, Inc. (a) | 348,306 | | 2,873,525 |
La Senza Corp. (sub. vtg.) | 44,100 | | 662,752 |
Le Chateau, Inc. Class A (sub. vtg.) | 32,500 | | 1,267,509 |
Monro Muffler Brake, Inc. | 70,500 | | 2,037,450 |
Common Stocks - continued |
| Shares | | Value (Note 1) |
CONSUMER DISCRETIONARY - continued |
Specialty Retail - continued |
Pacific Sunwear of California, Inc. (a) | 321,000 | | $ 7,829,190 |
Peacock Group PLC | 300,000 | | 1,384,071 |
Sonic Automotive, Inc. Class A (sub. vtg.) | 219,800 | | 5,121,340 |
| | 30,439,868 |
Textiles, Apparel & Luxury Goods - 3.2% |
Innovo Group, Inc. (a)(e) | 1,696,580 | | 3,902,134 |
Oxford Industries, Inc. | 131,560 | | 6,184,636 |
Steven Madden Ltd. (a) | 450,110 | | 10,059,959 |
| | 20,146,729 |
TOTAL CONSUMER DISCRETIONARY | | 127,984,042 |
CONSUMER STAPLES - 1.3% |
Food Products - 1.3% |
Delta & Pine Land Co. | 55,000 | | 1,471,250 |
Diamond Foods, Inc. | 70,600 | | 1,563,790 |
Green Mountain Coffee Roasters, Inc. (a) | 40,580 | | 1,422,329 |
Poore Brothers, Inc. (a) | 776,790 | | 3,806,271 |
| | 8,263,640 |
ENERGY - 15.0% |
Energy Equipment & Services - 7.2% |
Hornbeck Offshore Services, Inc. (a) | 240,000 | | 7,176,000 |
Maverick Tube Corp. (a) | 520,620 | | 17,268,965 |
NS Group, Inc. (a) | 210,000 | | 8,914,500 |
Oil States International, Inc. (a) | 245,360 | | 7,257,749 |
Pason Systems, Inc. | 225,300 | | 4,434,786 |
| | 45,052,000 |
Oil, Gas & Consumable Fuels - 7.8% |
Alon USA Energy, Inc. | 3,300 | | 58,575 |
Comstock Resources, Inc. (a) | 368,700 | | 10,209,303 |
Denbury Resources, Inc. (a) | 30,590 | | 1,431,612 |
Encore Acquisition Co. (a) | 96,120 | | 3,031,625 |
Gastar Exploration Ltd. (a) | 850,000 | | 2,291,012 |
Gastar Exploration Ltd. (a)(g) | 1,509,607 | | 3,661,970 |
Holly Corp. | 140,000 | | 6,554,800 |
KCS Energy, Inc. (a) | 100,000 | | 1,964,000 |
Penn Virginia Corp. | 45,670 | | 2,463,897 |
Petroleum Development Corp. (a) | 81,700 | | 3,058,848 |
Plains Exploration & Production Co. (a) | 105,000 | | 4,047,750 |
Common Stocks - continued |
| Shares | | Value (Note 1) |
ENERGY - continued |
Oil, Gas & Consumable Fuels - continued |
Quicksilver Resources, Inc. (a) | 161,850 | | $ 6,855,966 |
Range Resources Corp. | 62,150 | | 1,898,061 |
Top Tankers, Inc. | 68,300 | | 1,047,729 |
| | 48,575,148 |
TOTAL ENERGY | | 93,627,148 |
FINANCIALS - 18.7% |
Capital Markets - 0.2% |
Affiliated Managers Group, Inc. (a) | 16,000 | | 1,140,800 |
Commercial Banks - 3.9% |
Cathay General Bancorp | 50,120 | | 1,781,265 |
Center Financial Corp., California | 186,160 | | 4,756,388 |
Hanmi Financial Corp. | 175,040 | | 3,325,760 |
Nara Bancorp, Inc. | 82,650 | | 1,284,381 |
Preferred Bank, Los Angeles California | 135,000 | | 5,667,300 |
Texas Capital Bancshares, Inc. (a) | 108,200 | | 2,555,684 |
Wintrust Financial Corp. | 90,260 | | 4,840,644 |
| | 24,211,422 |
Diversified Financial Services - 1.8% |
Marlin Business Services Corp. (a) | 354,509 | | 7,887,825 |
Nasdaq Stock Market, Inc. (a) | 160,000 | | 3,624,000 |
| | 11,511,825 |
Insurance - 7.7% |
Arch Capital Group Ltd. (a) | 51,090 | | 2,350,140 |
Aspen Insurance Holdings Ltd. | 154,000 | | 4,375,140 |
HCC Insurance Holdings, Inc. | 112,020 | | 3,105,194 |
IPC Holdings Ltd. | 153,340 | | 6,202,603 |
National Interstate Corp. | 65,300 | | 1,297,511 |
Ohio Casualty Corp. | 230,000 | | 5,876,500 |
Philadelphia Consolidated Holdings Corp. (a) | 76,080 | | 6,316,162 |
Platinum Underwriters Holdings Ltd. | 69,900 | | 2,423,433 |
Specialty Underwriters' Alliance, Inc. | 382,130 | | 3,827,338 |
United America Indemnity Ltd. Class A (a) | 127,412 | | 2,335,462 |
USI Holdings Corp. (a) | 780,448 | | 10,009,246 |
| | 48,118,729 |
Real Estate - 4.6% |
American Campus Communities, Inc. | 243,720 | | 6,105,186 |
Capital Automotive (REIT) (SBI) | 29,800 | | 1,170,246 |
Common Stocks - continued |
| Shares | | Value (Note 1) |
FINANCIALS - continued |
Real Estate - continued |
CB Richard Ellis Group, Inc. Class A (a) | 25,000 | | $ 1,151,000 |
CenterPoint Properties Trust (SBI) | 40,000 | | 1,754,400 |
Columbia Equity Trust, Inc. | 80,000 | | 1,246,400 |
Education Realty Trust, Inc. | 56,300 | | 1,116,429 |
Far East Consortium International Ltd. | 3,175,000 | | 1,368,253 |
Feldman Mall Properties, Inc. | 212,400 | | 2,973,600 |
GMH Communities Trust | 209,100 | | 3,134,409 |
Kilroy Realty Corp. | 87,080 | | 4,536,868 |
Macquarie Goodman Group unit | 595,067 | | 1,829,012 |
Reckson Associates Realty Corp. | 44,570 | | 1,565,298 |
Ticon Industrial Connection PCL (For. Reg.) | 3,000,000 | | 713,000 |
| | 28,664,101 |
Thrifts & Mortgage Finance - 0.5% |
NetBank, Inc. | 310,000 | | 2,892,300 |
TOTAL FINANCIALS | | 116,539,177 |
HEALTH CARE - 4.0% |
Health Care Equipment & Supplies - 0.2% |
Pihsiang Machinery Manufacturing Co. | 670,000 | | 1,345,466 |
Health Care Providers & Services - 3.8% |
Air Methods Corp. (a) | 140,187 | | 1,195,795 |
America Service Group, Inc. (a) | 320,960 | | 6,926,317 |
ICON PLC sponsored ADR (a) | 214,360 | | 8,392,194 |
Medtox Scientific, Inc. (a) | 369,090 | | 2,594,703 |
PSS World Medical, Inc. (a) | 309,730 | | 4,528,253 |
| | 23,637,262 |
TOTAL HEALTH CARE | | 24,982,728 |
INDUSTRIALS - 18.2% |
Aerospace & Defense - 0.9% |
Kaman Corp. Class A | 275,800 | | 5,378,100 |
Air Freight & Logistics - 1.6% |
Park-Ohio Holdings Corp. (a) | 491,420 | | 9,985,654 |
Building Products - 0.3% |
Quixote Corp. | 92,200 | | 1,874,426 |
Commercial Services & Supplies - 2.5% |
Banta Corp. | 136,900 | | 6,535,606 |
Hudson Highland Group, Inc. (a) | 130,000 | | 2,701,400 |
Common Stocks - continued |
| Shares | | Value (Note 1) |
INDUSTRIALS - continued |
Commercial Services & Supplies - continued |
PeopleSupport, Inc. | 132,300 | | $ 1,268,757 |
Speedy Hire PLC | 140,000 | | 1,796,216 |
Standard Parking Corp. (a) | 111,084 | | 1,941,748 |
Waste Services, Inc. (a) | 365,000 | | 1,423,500 |
| | 15,667,227 |
Construction & Engineering - 1.8% |
Comfort Systems USA, Inc. (a) | 771,600 | | 5,979,900 |
URS Corp. (a) | 136,500 | | 5,111,925 |
| | 11,091,825 |
Electrical Equipment - 1.6% |
Acuity Brands, Inc. | 217,250 | | 6,339,355 |
C&D Technologies, Inc. | 330,000 | | 3,323,100 |
| | 9,662,455 |
Industrial Conglomerates - 1.4% |
Carlisle Companies, Inc. | 135,800 | | 8,943,788 |
Machinery - 4.6% |
Albany International Corp. Class A | 45,700 | | 1,601,328 |
Freightcar America, Inc. | 115,000 | | 3,686,900 |
Kinik Co. | 582,000 | | 1,716,599 |
Manitowoc Co., Inc. | 107,360 | | 4,900,984 |
Tennant Co. | 140,000 | | 5,180,000 |
Wabtec Corp. | 125,900 | | 3,075,737 |
Watts Water Technologies, Inc. Class A | 236,110 | | 8,618,015 |
| | 28,779,563 |
Trading Companies & Distributors - 3.5% |
UAP Holding Corp. | 436,200 | | 8,462,280 |
WESCO International, Inc. (a) | 400,000 | | 13,624,000 |
| | 22,086,280 |
TOTAL INDUSTRIALS | | 113,469,318 |
INFORMATION TECHNOLOGY - 7.0% |
Computers & Peripherals - 0.1% |
iCAD, Inc. (a) | 215,000 | | 767,550 |
Electronic Equipment & Instruments - 4.0% |
KEMET Corp. (a) | 548,200 | | 4,593,916 |
Mettler-Toledo International, Inc. (a) | 150,000 | | 7,875,000 |
ScanSource, Inc. (a) | 80,000 | | 3,818,400 |
Common Stocks - continued |
| Shares | | Value (Note 1) |
INFORMATION TECHNOLOGY - continued |
Electronic Equipment & Instruments - continued |
Tektronix, Inc. | 325,000 | | $ 8,144,500 |
Winland Electronics, Inc. (a) | 120,360 | | 535,602 |
| | 24,967,418 |
Internet Software & Services - 1.2% |
j2 Global Communications, Inc. (a)(d) | 160,000 | | 6,417,600 |
SonicWALL, Inc. (a) | 200,000 | | 1,068,000 |
| | 7,485,600 |
IT Services - 0.5% |
Forrester Research, Inc. (a) | 26,968 | | 532,079 |
Telvent GIT SA | 253,900 | | 2,749,483 |
| | 3,281,562 |
Semiconductors & Semiconductor Equipment - 0.5% |
MKS Instruments, Inc. (a) | 166,100 | | 3,174,171 |
Software - 0.7% |
Blackbaud, Inc. | 115,749 | | 1,655,211 |
Hyperion Solutions Corp. (a) | 10,000 | | 470,600 |
Moldflow Corp. (a) | 124,498 | | 1,949,639 |
| | 4,075,450 |
TOTAL INFORMATION TECHNOLOGY | | 43,751,751 |
MATERIALS - 6.1% |
Chemicals - 4.0% |
Albemarle Corp. | 214,700 | | 8,180,070 |
Cytec Industries, Inc. | 115,070 | | 5,221,877 |
Pioneer Companies, Inc. (a) | 420,290 | | 10,200,438 |
Spartech Corp. | 60,000 | | 1,123,800 |
| | 24,726,185 |
Metals & Mining - 2.1% |
Compass Minerals International, Inc. | 530,000 | | 13,488,500 |
TOTAL MATERIALS | | 38,214,685 |
TELECOMMUNICATION SERVICES - 0.5% |
Diversified Telecommunication Services - 0.5% |
New Skies Satellites Holdings Ltd. | 150,000 | | 3,105,000 |
Common Stocks - continued |
| Shares | | Value (Note 1) |
UTILITIES - 0.2% |
Gas Utilities - 0.2% |
Xinao Gas Holdings Ltd. | 1,302,000 | | $ 1,030,063 |
TOTAL COMMON STOCKS (Cost $514,738,650) | 570,967,552 |
Nonconvertible Bonds - 0.8% |
| Principal Amount | | |
CONSUMER DISCRETIONARY - 0.1% |
Hotels, Restaurants & Leisure - 0.1% |
Uno Restaurant Corp. 10% 2/15/11 (f) | $ 1,000,000 | | 965,000 |
HEALTH CARE - 0.7% |
Health Care Providers & Services - 0.7% |
Hanger Orthopedic Group, Inc. 10.375% 2/15/09 | 4,301,000 | | 4,301,000 |
TOTAL NONCONVERTIBLE BONDS (Cost $4,992,804) | 5,266,000 |
Money Market Funds - 9.2% |
| Shares | | |
Fidelity Cash Central Fund, 3.31% (b) | 52,708,903 | | 52,708,903 |
Fidelity Securities Lending Cash Central Fund, 3.32% (b)(c) | 4,949,800 | | 4,949,800 |
TOTAL MONEY MARKET FUNDS (Cost $57,658,703) | 57,658,703 |
Cash Equivalents - 0.5% |
| Maturity
Amount | | |
Investments in repurchase agreements (Collateralized by U.S. Government Obligations, in a joint trading account at 3.27%, dated 7/29/05 due 8/1/05)
(Cost $2,892,000) | $ 2,892,788 | | $ 2,892,000 |
TOTAL INVESTMENT PORTFOLIO - 102.0% (Cost $580,282,157) | | 636,784,255 |
NET OTHER ASSETS - (2.0)% | | (12,557,638) |
NET ASSETS - 100% | $ 624,226,617 |
Legend |
(a) Non-income producing |
(b) Affiliated fund that is available only to investment companies and other accounts managed by Fidelity Investments. The rate quoted is the annualized seven-day yield of the fund at period end. A complete listing of the fund's holdings as of its most recent quarter end is available upon request. |
(c) Investment made with cash collateral received from securities on loan. |
(d) Security or a portion of the security is on loan at period end. |
(e) Affiliated company |
(f) Security exempt from registration under Rule 144A of the Securities Act of 1933. These securities may be resold in transactions exempt from registration, normally to qualified institutional buyers. At the period end, the value of these securities amounted to $965,000 or 0.2% of net assets. |
(g) Restricted securities - Investment in securities not registered under the Securities Act of 1933 (excluding 144A issues). At the end of the period, the value of restricted securities (excluding 144A issues) amounted to $3,661,970 or 0.6% of net assets. |
Additional information on each holding is as follows: |
Security | Acquisition Date | Acquisition Cost |
Gastar Exploration Ltd. | 6/13/05 | $ 3,999,855 |
Other Information |
Distribution of investments by country of issue, as a percentage of total net assets, is as follows: |
United States of America | 89.2% |
Bermuda | 3.0% |
Canada | 2.4% |
Ireland | 1.4% |
Bahamas (Nassau) | 1.2% |
Others (individually less than 1%) | 2.8% |
Total | 100.0% |
An affiliated company is a company in which the fund has ownership of at least 5% of the voting securities. Companies which are affiliates of the fund at period-end are noted in the fund's Schedule of Investments. Transactions during the period with companies which are or were affiliates are as follows: |
Affiliate | Value, beginning of period | Purchases | Sales Proceeds | Dividend Income | Value,
end of
period |
Innovo Group, Inc. | $ - | $ 7,565,418 | $ - | $ - | $ 3,902,134 |
Total | $ - | $ 7,565,418 | $ - | $ - | $ 3,902,134 |
See accompanying notes which are an integral part of the financial statements.
Annual Report
Financial Statements
Statement of Assets and Liabilities
| July 31, 2005 |
| | |
Assets | | |
Investment in securities, at value (including securities loaned of $4,823,803 and repurchase agreements of $2,892,000) (cost $580,282,157) - See accompanying schedule | | $ 636,784,255 |
Cash | | 467 |
Foreign currency held at value (cost $203,113) | | 201,893 |
Receivable for investments sold | | 8,213,753 |
Receivable for fund shares sold | | 10,686,933 |
Dividends receivable | | 154,554 |
Interest receivable | | 377,732 |
Prepaid expenses | | 23,797 |
Receivable from investment adviser for expense reductions | | 1,035 |
Other receivables | | 107,399 |
Total assets | | 656,551,818 |
| | |
Liabilities | | |
Payable for investments purchased | $ 26,628,826 | |
Payable for fund shares redeemed | 275,193 | |
Accrued management fee | 328,037 | |
Distribution fees payable | 16,537 | |
Other affiliated payables | 100,174 | |
Other payables and accrued expenses | 26,634 | |
Collateral on securities loaned, at value | 4,949,800 | |
Total liabilities | | 32,325,201 |
| | |
Net Assets | | $ 624,226,617 |
Net Assets consist of: | | |
Paid in capital | | $ 552,739,748 |
Undistributed net investment income | | 5,374 |
Accumulated undistributed net realized gain (loss) on investments and foreign currency transactions | | 14,982,417 |
Net unrealized appreciation (depreciation) on investments and assets and liabilities in foreign currencies | | 56,499,078 |
Net Assets | | $ 624,226,617 |
See accompanying notes which are an integral part of the financial statements.
Annual Report
Statement of Assets and Liabilities - continued
| July 31, 2005 |
| | |
Calculation of Maximum Offering Price
Class A:
Net Asset Value and redemption price per share
($9,390,087 ÷ 733,847 shares) | | $ 12.80 |
| | |
Maximum offering price per share (100/94.25 of $12.80) | | $ 13.58 |
Class T:
Net Asset Value and redemption price per share ($12,724,811 ÷ 995,632 shares) | | $ 12.78 |
| | |
Maximum offering price per share (100/96.50 of $12.78) | | $ 13.24 |
Class B:
Net Asset Value and offering price per share ($3,930,896 ÷ 308,759 shares) A | | $ 12.73 |
| | |
Class C:
Net Asset Value and offering price per share ($11,731,652 ÷ 921,136 shares) A | | $ 12.74 |
| | |
Small Cap Value:
Net Asset Value, offering price and redemption price per share ($582,688,643 ÷ 45,410,224 shares) | | $ 12.83 |
| | |
Institutional Class:
Net Asset Value, offering price and redemption price per share ($3,760,528 ÷ 293,101 shares) | | $ 12.83 |
A Redemption price per share is equal to net asset value less any applicable contingent deferred sales charge.
See accompanying notes which are an integral part of the financial statements.
Annual Report
Financial Statements - continued
Statement of Operations
| For the period November 3, 2004 (commencement of operations) to July 31, 2005 |
| | |
Investment Income | | |
Dividends | | $ 1,417,528 |
Interest | | 567,033 |
Security lending | | 319 |
Total income | | 1,984,880 |
| | |
Expenses | | |
Management fee | $ 1,558,541 | |
Transfer agent fees | 458,714 | |
Distribution fees | 72,234 | |
Accounting and security lending fees | 90,433 | |
Independent trustees' compensation | 767 | |
Custodian fees and expenses | 31,181 | |
Registration fees | 118,829 | |
Audit | 32,133 | |
Legal | 218 | |
Miscellaneous | 536 | |
Total expenses before reductions | 2,363,586 | |
Expense reductions | (129,800) | 2,233,786 |
Net investment income (loss) | | (248,906) |
Realized and Unrealized Gain (Loss) Net realized gain (loss) on: | | |
Investment securities | 15,314,106 | |
Foreign currency transactions | (7,814) | |
Total net realized gain (loss) | | 15,306,292 |
Change in net unrealized appreciation (depreciation) on: Investment securities | 56,502,098 | |
Assets and liabilities in foreign currencies | (3,020) | |
Total change in net unrealized appreciation (depreciation) | | 56,499,078 |
Net gain (loss) | | 71,805,370 |
Net increase (decrease) in net assets resulting from operations | | $ 71,556,464 |
See accompanying notes which are an integral part of the financial statements.
Annual Report
Statement of Changes in Net Assets
| For the period
November 3, 2004
(commencement
of operations) to
July 31, 2005 |
Increase (Decrease) in Net Assets | |
Operations | |
Net investment income (loss) | $ (248,906) |
Net realized gain (loss) | 15,306,292 |
Change in net unrealized appreciation (depreciation) | 56,499,078 |
Net increase (decrease) in net assets resulting
from operations | 71,556,464 |
Distributions to shareholders from net investment income | (69,595) |
Share transactions - net increase (decrease) | 552,608,856 |
Redemption fees | 130,892 |
Total increase (decrease) in net assets | 624,226,617 |
| |
Net Assets | |
Beginning of period | - |
End of period (including undistributed net investment income of $5,374) | $ 624,226,617 |
See accompanying notes which are an integral part of the financial statements.
Annual Report
Financial Highlights - Class A
Year ended July 31, | 2005 F |
Selected Per-Share Data | |
Net asset value, beginning of period | $ 10.00 |
Income from Investment Operations | |
Net investment income (loss) E | (.04) |
Net realized and unrealized gain (loss) | 2.84 |
Total from investment operations | 2.80 |
Distributions from net investment income | (.01) |
Redemption fees added to paid in capital E | .01 |
Net asset value, end of period | $ 12.80 |
Total Return B, C, D | 28.06% |
Ratios to Average Net Assets G | |
Expenses before expense reductions | 1.46% A |
Expenses net of voluntary waivers, if any | 1.44% A |
Expenses net of all reductions | 1.38% A |
Net investment income (loss) | (.46)% A |
Supplemental Data | |
Net assets, end of period (000 omitted) | $ 9,390 |
Portfolio turnover rate | 60% A |
A Annualized
B Total returns for periods of less than one year are not annualized.
C Total returns would have been lower had certain expenses not been reduced during the periods shown.
D Total returns do not include the effect of the sales charges.
E Calculated based on average shares outstanding during the period.
F For the period November 3, 2004 (commencement of operations) to July 31, 2005.
G Expense ratios reflect operating expenses of the class. Expenses before reductions do not reflect amounts reimbursed by the investment adviser or reductions from brokerage service arrangements or other expense offset arrangements and do not represent the amount paid by the class during periods when reimbursements or reductions occur. Expense ratios before reductions for start-up periods may not be representative of longer-term operating periods. Expenses net of any voluntary waivers reflect expenses after reimbursement by the investment adviser but prior to reductions from brokerage service arrangements or other expense offset arrangements. Expenses net of all reductions represent the net expenses paid by the class.
See accompanying notes which are an integral part of the financial statements.
Annual Report
Financial Highlights - Class T
Year ended July 31, | 2005 F |
Selected Per-Share Data | |
Net asset value, beginning of period | $ 10.00 |
Income from Investment Operations | |
Net investment income (loss) E | (.06) |
Net realized and unrealized gain (loss) | 2.83 |
Total from investment operations | 2.77 |
Redemption fees added to paid in capital E | .01 |
Net asset value, end of period | $ 12.78 |
Total Return B, C, D | 27.80% |
Ratios to Average Net Assets G | |
Expenses before expense reductions | 1.72% A |
Expenses net of voluntary waivers, if any | 1.68% A |
Expenses net of all reductions | 1.62% A |
Net investment income (loss) | (.70)% A |
Supplemental Data | |
Net assets, end of period (000 omitted) | $ 12,725 |
Portfolio turnover rate | 60% A |
A Annualized
B Total returns for periods of less than one year are not annualized.
C Total returns would have been lower had certain expenses not been reduced during the periods shown.
D Total returns do not include the effect of the sales charges.
E Calculated based on average shares outstanding during the period.
F For the period November 3, 2004 (commencement of operations) to July 31, 2005.
G Expense ratios reflect operating expenses of the class. Expenses before reductions do not reflect amounts reimbursed by the investment adviser or reductions from brokerage service arrangements or other expense offset arrangements and do not represent the amount paid by the class during periods when reimbursements or reductions occur. Expense ratios before reductions for start-up periods may not be representative of longer-term operating periods. Expenses net of any voluntary waivers reflect expenses after reimbursement by the investment adviser but prior to reductions from brokerage service arrangements or other expense offset arrangements. Expenses net of all reductions represent the net expenses paid by the class.
See accompanying notes which are an integral part of the financial statements.
Annual Report
Financial Highlights - Class B
Year ended July 31, | 2005 F |
Selected Per-Share Data | |
Net asset value, beginning of period | $ 10.00 |
Income from Investment Operations | |
Net investment income (loss) E | (.10) |
Net realized and unrealized gain (loss) | 2.82 |
Total from investment operations | 2.72 |
Redemption fees added to paid in capital E | .01 |
Net asset value, end of period | $ 12.73 |
Total Return B, C, D | 27.30% |
Ratios to Average Net Assets G | |
Expenses before expense reductions | 2.24% A |
Expenses net of voluntary waivers, if any | 2.19% A |
Expenses net of all reductions | 2.13% A |
Net investment income (loss) | (1.21)% A |
Supplemental Data | |
Net assets, end of period (000 omitted) | $ 3,931 |
Portfolio turnover rate | 60% A |
A Annualized
B Total returns for periods of less than one year are not annualized.
C Total returns would have been lower had certain expenses not been reduced during the periods shown.
D Total returns do not include the effect of the contingent deferred sales charge.
E Calculated based on average shares outstanding during the period.
F For the period November 3, 2004 (commencement of operations) to July 31, 2005.
G Expense ratios reflect operating expenses of the class. Expenses before reductions do not reflect amounts reimbursed by the investment adviser or reductions from brokerage service arrangements or other expense offset arrangements and do not represent the amount paid by the class during periods when reimbursements or reductions occur. Expense ratios before reductions for start-up periods may not be representative of longer-term operating periods. Expenses net of any voluntary waivers reflect expenses after reimbursement by the investment adviser but prior to reductions from brokerage service arrangements or other expense offset arrangements. Expenses net of all reductions represent the net expenses paid by the class.
See accompanying notes which are an integral part of the financial statements.
Annual Report
Financial Highlights - Class C
Year ended July 31, | 2005 F |
Selected Per-Share Data | |
Net asset value, beginning of period | $ 10.00 |
Income from Investment Operations | |
Net investment income (loss) E | (.10) |
Net realized and unrealized gain (loss) | 2.83 |
Total from investment operations | 2.73 |
Redemption fees added to paid in capital E | .01 |
Net asset value, end of period | $ 12.74 |
Total Return B, C, D | 27.40% |
Ratios to Average Net Assets G | |
Expenses before expense reductions | 2.17% A |
Expenses net of voluntary waivers, if any | 2.17% A |
Expenses net of all reductions | 2.11% A |
Net investment income (loss) | (1.19)% A |
Supplemental Data | |
Net assets, end of period (000 omitted) | $ 11,732 |
Portfolio turnover rate | 60% A |
A Annualized
B Total returns for periods of less than one year are not annualized.
C Total returns would have been lower had certain expenses not been reduced during the periods shown.
D Total returns do not include the effect of the contingent deferred sales charge.
E Calculated based on average shares outstanding during the period.
F For the period November 3, 2004 (commencement of operations) to July 31, 2005.
G Expense ratios reflect operating expenses of the class. Expenses before reductions do not reflect amounts reimbursed by the investment adviser or reductions from brokerage service arrangements or other expense offset arrangements and do not represent the amount paid by the class during periods when reimbursements or reductions occur. Expense ratios before reductions for start-up periods may not be representative of longer-term operating periods. Expenses net of any voluntary waivers reflect expenses after reimbursement by the investment adviser but prior to reductions from brokerage service arrangements or other expense offset arrangements. Expenses net of all reductions represent the net expenses paid by the class.
See accompanying notes which are an integral part of the financial statements.
Annual Report
Financial Highlights - Small Cap Value
Year ended July 31, | 2005 E |
Selected Per-Share Data | |
Net asset value, beginning of period | $ 10.00 |
Income from Investment Operations | |
Net investment income (loss) D | (.01) |
Net realized and unrealized gain (loss) | 2.84 |
Total from investment operations | 2.83 |
Distributions from net investment income | (.01) |
Redemption fees added to paid in capital D | .01 |
Net asset value, end of period | $ 12.83 |
Total Return B, C | 28.36% |
Ratios to Average Net Assets F | |
Expenses before expense reductions | 1.05% A |
Expenses net of voluntary waivers, if any | 1.05% A |
Expenses net of all reductions | .99% A |
Net investment income (loss) | (.08)% A |
Supplemental Data | |
Net assets, end of period (000 omitted) | $ 582,689 |
Portfolio turnover rate | 60% A |
A Annualized
B Total returns for periods of less than one year are not annualized.
C Total returns would have been lower had certain expenses not been reduced during the periods shown.
D Calculated based on average shares outstanding during the period.
E For the period November 3, 2004 (commencement of operations) to July 31, 2005.
F Expense ratios reflect operating expenses of the class. Expenses before reductions do not reflect amounts reimbursed by the investment adviser or reductions from brokerage service arrangements or other expense offset arrangements and do not represent the amount paid by the class during periods when reimbursements or reductions occur. Expense ratios before reductions for start-up periods may not be representative of longer-term operating periods. Expenses net of any voluntary waivers reflect expenses after reimbursement by the investment adviser but prior to reductions from brokerage service arrangements or other expense offset arrangements. Expenses net of all reductions represent the net expenses paid by the class.
See accompanying notes which are an integral part of the financial statements.
Annual Report
Financial Highlights - Institutional Class
Year ended July 31, | 2005 E |
Selected Per-Share Data | |
Net asset value, beginning of period | $ 10.00 |
Income from Investment Operations | |
Net investment income (loss) D | (.01) |
Net realized and unrealized gain (loss) | 2.84 |
Total from investment operations | 2.83 |
Distributions from net investment income | (.01) |
Redemption fees added to paid in capital D | .01 |
Net asset value, end of period | $ 12.83 |
Total Return B, C | 28.36% |
Ratios to Average Net Assets F | |
Expenses before expense reductions | 1.07% A |
Expenses net of voluntary waivers, if any | 1.07% A |
Expenses net of all reductions | 1.01% A |
Net investment income (loss) | (.10)% A |
Supplemental Data | |
Net assets, end of period (000 omitted) | $ 3,761 |
Portfolio turnover rate | 60% A |
A Annualized
B Total returns for periods of less than one year are not annualized.
C Total returns would have been lower had certain expenses not been reduced during the periods shown.
D Calculated based on average shares outstanding during the period.
E For the period November 3, 2004 (commencement of operations) to July 31, 2005.
F Expense ratios reflect operating expenses of the class. Expenses before reductions do not reflect amounts reimbursed by the investment adviser or reductions from brokerage service arrangements or other expense offset arrangements and do not represent the amount paid by the class during periods when reimbursements or reductions occur. Expense ratios before reductions for start-up periods may not be representative of longer-term operating periods. Expenses net of any voluntary waivers reflect expenses after reimbursement by the investment adviser but prior to reductions from brokerage service arrangements or other expense offset arrangements. Expenses net of all reductions represent the net expenses paid by the class.
See accompanying notes which are an integral part of the financial statements.
Annual Report
Notes to Financial Statements
For the period ended July 31, 2005
1. Significant Accounting Policies.
Fidelity Small Cap Value Fund (the fund) is a non-diversified fund of Fidelity Securities Fund (the trust) and is authorized to issue an unlimited number of shares. The trust is registered under the Investment Company Act of 1940, as amended (the 1940 Act), as an open-end management investment company organized as a Massachusetts business trust.
The fund offers Class A, Class T, Class B, Class C, Small Cap Value, and Institutional Class shares, each of which has equal rights as to assets and voting privileges. Each class has exclusive voting rights with respect to matters that affect that class. Class B shares will automatically convert to Class A shares after a holding period of seven years from the initial date of purchase. Investment income, realized and unrealized capital gains and losses, the common expenses of the fund, and certain fund-level expense reductions, if any, are allocated on a pro rata basis to each class based on the relative net assets of each class to the total net assets of the fund. Each class differs with respect to transfer agent and distribution and service plan fees incurred. Certain expense reductions also differ by class.
The financial statements have been prepared in conformity with accounting principles generally accepted in the United States of America, which require management to make certain estimates and assumptions at the date of the financial statements. The following summarizes the significant accounting policies of the fund:
Security Valuation. Net asset value per share (NAV calculation) is calculated as of the close of business of the New York Stock Exchange, normally 4:00 p.m. Eastern time. Equity securities, including restricted securities, for which market quotations are available are valued at the last sale price or official closing price (closing bid price or last evaluated quote if no sale has occurred) on the primary market or exchange on which they trade. Debt securities, including restricted securities, for which quotations are readily available are valued at their most recent bid prices (sales prices if the principal market is an exchange) in the principal market in which such securities are normally traded, as determined by recognized dealers in such securities, or securities are valued on the basis of information provided by a pricing service. Pricing services use valuation matrices that incorporate both dealer-supplied valuations and valuation models. If prices are not readily available or do not accurately reflect fair value for a security, or if a security's value has been materially affected by events occurring after the close of the exchange or market on which the security is principally traded, that security may be valued by another method that the Board of Trustees believes accurately reflects fair value. A security's valuation may differ depending on the method used for determining value. Price movements in futures contracts and ADRs, market and trading trends, the bid/ask quotes of brokers and off-exchange institutional trading may be reviewed in the
Annual Report
1. Significant Accounting Policies - continued
Security Valuation - continued
course of making a good faith determination of a security's fair value. Short-term securities with remaining maturities of sixty days or less for which quotations are not readily available are valued on the basis of amortized cost. Investments in open-end investment companies are valued at their net asset value each business day.
Foreign Currency. The fund uses foreign currency contracts to facilitate transactions in foreign-denominated securities. Losses from these transactions may arise from changes in the value of the foreign currency or if the counterparties do not perform under the contracts' terms.
Foreign-denominated assets, including investment securities, and liabilities are translated into U.S. dollars at the exchange rate at period end. Purchases and sales of investment securities, income and dividends received and expenses denominated in foreign currencies are translated into U.S. dollars at the exchange rate in effect on the transaction date.
The effects of exchange rate fluctuations on investments are included with the net realized and unrealized gain (loss) on investment securities. Other foreign currency transactions resulting in realized and unrealized gain (loss) are disclosed separately.
Investment Transactions and Income. Security transactions are accounted for as of trade date. Gains and losses on securities sold are determined on the basis of identified cost. Dividend income is recorded on the ex-dividend date, except for certain dividends from foreign securities where the ex-dividend date may have passed, which are recorded as soon as the fund is informed of the ex-dividend date. Non-cash dividends included in dividend income, if any, are recorded at the fair market value of the securities received. Distributions received on securities that represent a return of capital or capital gain are recorded as a reduction of cost of investments and/or as a realized gain. The fund estimates the components of distributions received that may be considered return of capital distributions or capital gain distributions. Interest income is accrued as earned. Interest income includes coupon interest and amortization of premium and accretion of discount on debt securities. Investment income is recorded net of foreign taxes withheld where recovery of such taxes is uncertain.
Expenses. Most expenses of the trust can be directly attributed to a fund. Expenses which cannot be directly attributed are apportioned among each fund in the trust.
Income Tax Information and Distributions to Shareholders. Each year, the fund intends to qualify as a regulated investment company by distributing all of its taxable income and realized gains under Subchapter M of the Internal Revenue Code. As a result, no provision for income taxes is required in the accompanying financial statements.
Annual Report
Notes to Financial Statements - continued
1. Significant Accounting Policies - continued
Income Tax Information and Distributions to Shareholders - continued
Foreign taxes are provided for based on the fund's understanding of the tax rules and rates that exist in the foreign markets in which it invests.
Distributions are recorded on the ex-dividend date. Income dividends and capital gain distributions are declared separately for each class. Income and capital gain distributions are determined in accordance with income tax regulations, which may differ from generally accepted accounting principles. In addition, the fund will claim a portion of the payment made to redeeming shareholders as a distribution for income tax purposes.
Capital accounts within the financial statements are adjusted for permanent book-tax differences. These adjustments have no impact on net assets or the results of operations. Temporary book-tax differences will reverse in a subsequent period.
Book-tax differences are primarily due to short-term capital gains, foreign currency transactions, passive foreign investment companies (PFIC) and losses deferred due to wash sales.
The tax-basis components of distributable earnings and the federal tax cost as of period end were as follows:
Unrealized appreciation | $ 67,705,489 | |
Unrealized depreciation | (11,339,549) | |
Net unrealized appreciation (depreciation) | 56,365,940 | |
Undistributed ordinary income | 14,695,235 | |
| | |
Cost for federal income tax purposes | $ 580,418,315 | |
The tax character of distributions paid was as follows:
| July 31, 2005 | |
Ordinary Income | $ 69,595 | |
Short-Term Trading (Redemption) Fees. Shares held in the fund less than 90 days are subject to a redemption fee equal to 1.50% of the proceeds of the redeemed shares. All redemption fees, including any estimated redemption fees paid by Fidelity Management and Research Company (FMR), are retained by the fund and accounted for as an addition to paid in capital.
Annual Report
2. Operating Policies.
Repurchase Agreements. FMR has received an Exemptive Order from the Securities and Exchange Commission (the SEC) which permits the fund and other affiliated entities of FMR to transfer uninvested cash balances into joint trading accounts which are then invested in repurchase agreements. The fund may also invest directly with institutions in repurchase agreements. Repurchase agreements are collateralized by government or non-government securities. Collateral is held in segregated accounts with custodian banks and may be obtained in the event of a default of the counterparty. The fund monitors, on a daily basis, the value of the collateral to ensure it is at least equal to the principal amount of the repurchase agreement (including accrued interest). In the event of a default by the counterparty, realization of the collateral proceeds could be delayed, during which time the value of the collateral may decline.
Restricted Securities. The fund may invest in securities that are subject to legal or contractual restrictions on resale. These securities generally may be resold in transactions exempt from registration or to the public if the securities are registered. Disposal of these securities may involve time-consuming negotiations and expense, and prompt sale at an acceptable price may be difficult. Information regarding restricted securities is included at the end of the fund's Schedule of Investments.
3. Purchases and Sales of Investments.
Purchases and sales of securities, other than short-term securities and U.S. government securities, aggregated $635,585,396 and $130,951,513, respectively.
4. Fees and Other Transactions with Affiliates.
Management Fee. FMR and its affiliates provide the fund with investment management related services for which the fund pays a monthly management fee. The management fee is the sum of an individual fund fee rate that is based on an annual rate of .45% of the fund's average net assets and a group fee rate that averaged .27% during the period. The group fee rate is based upon the average net assets of all the mutual funds advised by FMR. The group fee rate decreases as assets under management increase and increases as assets under management decrease. In addition, the management fee is subject to a performance adjustment (up to a maximum of ± .20% of the fund's average net assets over a 36 month performance period). The upward or downward adjustment to the management fee is based on the fund's relative investment performance as compared to an appropriate benchmark index. The fund's performance adjustment will not take effect until November 2005. Subsequent months will be added until the performance period includes 36 months. For the period, the total annualized management fee rate was .72% of the fund's average net assets.
Annual Report
Notes to Financial Statements - continued
4. Fees and Other Transactions with Affiliates - continued
Distribution and Service Plan. In accordance with Rule 12b-1 of the 1940 Act, the fund has adopted separate Distribution and Service Plans for each class of shares. Certain classes pay Fidelity Distributors Corporation (FDC), an affiliate of FMR, separate Distribution and Service Fees, each of which is based on an annual percentage of each class' average net assets. In addition, FDC may pay financial intermediaries for selling shares of the fund and providing shareholder support services. For the period, the Distribution and Service Fee rates and the total amounts paid to and retained by FDC were as follows:
| Distribution
Fee | Service
Fee | Paid to
FDC | Retained
by FDC |
Class A | 0% | .25% | $ 7,461 | $ 1,194 |
Class T | .25% | .25% | 12,596 | 2,172 |
Class B | .75% | .25% | 14,541 | 12,157 |
Class C | .75% | .25% | 37,636 | 16,080 |
| | | $ 72,234 | $ 31,603 |
Sales Load. FDC receives a front-end sales charge of up to 5.75% for selling Class A shares, and 3.50% for selling Class T shares, some of which is paid to financial intermediaries for selling shares of the fund. FDC receives the proceeds of contingent deferred sales charges levied on Class A, Class T, Class B, and Class C redemptions. These charges depend on the holding period. The deferred sales charges range from 5% to 1% for Class B, 1% for Class C, and .25% for certain purchases of Class A and Class T shares.
For the period, sales charge amounts retained by FDC were as follows:
| Retained
by FDC | |
Class A | $ 24,744 | |
Class T | 6,938 | |
Class B* | 1,116 | |
Class C* | 324 | |
| $ 33,122 | |
* When Class B and Class C shares are initially sold, FDC pays commissions from its own resources to financial intermediaries through which the sales are made.
Transfer Agent Fees. Fidelity Investments Institutional Operations Company, Inc. (FIIOC), an affiliate of FMR, is the transfer, dividend disbursing and shareholder servicing agent for each class of the fund, except for Small Cap Value. Fidelity Service Company, Inc. (FSC), an affiliate of FMR, is the transfer agent for Small Cap Value shares. FIIOC and FSC receive account fees and asset-based fees that vary according to the account size and type of account of the shareholders of the respective classes of the fund.
Annual Report
4. Fees and Other Transactions with Affiliates - continued
Transfer Agent Fees - continued
FIIOC and FSC pay for typesetting, printing and mailing of shareholder reports, except proxy statements. For the period the total transfer agent fees paid by each class to FIIOC or FSC, were as follows:
| Amount | % of
Average
Net Assets |
Class A | $ 10,531 | .35* |
Class T | 8,940 | .35* |
Class B | 5,110 | .35* |
Class C | 11,895 | .32* |
Small Cap Value | 419,553 | .21* |
Institutional Class | 2,685 | .19* |
| $ 458,714 | |
* Annualized
Accounting and Security Lending Fees. FSC maintains the fund's accounting records. The accounting fee is based on the level of average net assets for the month. Under a separate contract, FSC administers the security lending program. The security lending fee is based on the number and duration of lending transactions.
Central Funds. The fund may invest in affiliated Central Funds managed by Fidelity Investments Money Management, Inc. (FIMM), an affiliate of FMR. The Central Funds are open-end investment companies available only to investment companies and other accounts managed by FMR and its affiliates. The Money Market Central Funds seek preservation of capital and current income. The Central Funds do not pay a management fee. Income distributions earned by the fund are recorded as income in the accompanying financial statements and totaled $476,355 for the period.
Brokerage Commissions. The fund placed a portion of its portfolio transactions with brokerage firms which are affiliates of the investment adviser. The commissions paid to these affiliated firms were $50,063 for the period.
5. Committed Line of Credit.
The fund participates with other funds managed by FMR in a $4.2 billion credit facility (the "line of credit") to be utilized for temporary or emergency purposes to fund shareholder redemptions or for other short-term liquidity purposes. The fund has agreed to pay commitment fees on its pro rata portion of the line of credit. During the period, there were no borrowings on this line of credit.
Annual Report
Notes to Financial Statements - continued
6. Security Lending.
The fund lends portfolio securities from time to time in order to earn additional income. The fund receives collateral (in the form of U.S. Treasury obligations, letters of credit and/or cash) against the loaned securities and maintains collateral in an amount not less than 100% of the market value of the loaned securities during the period of the loan. The market value of the loaned securities is determined at the close of business of the fund and any additional required collateral is delivered to the fund on the next business day. If the borrower defaults on its obligation to return the securities loaned because of insolvency or other reasons, a fund could experience delays and costs in recovering the securities loaned or in gaining access to the collateral. Cash collateral is invested in the Fidelity Securities Lending Cash Central Fund. The value of loaned securities and cash collateral at period end are disclosed on the fund's Statement of Assets and Liabilities.
7. Expense Reductions.
FMR voluntarily agreed to reimburse each class to the extent annual operating expenses exceeded certain levels of average net assets as noted in the table below. Some expenses, for example interest expense, are excluded from this reimbursement.
The following classes were in reimbursement during the period:
| Expense
Limitations | Reimbursement
from adviser |
| | |
Class A | 1.50% - 1.40%* | $ 698 |
Class T | 1.75% - 1.65%* | 1,050 |
Class B | 2.25% - 2.15%* | 717 |
| | $ 2,465 |
* Expense limitation in effect at period end
Many of the brokers with whom FMR places trades on behalf of the fund provided services to the fund in addition to trade execution. These services included payments of certain expenses on behalf of the fund totaling $126,495 for the period. In addition, through arrangements with the fund's custodian, credits realized as a result of uninvested cash balances were used to reduce the fund's expenses. During the period, these credits reduced the fund's custody expenses by $840.
Annual Report
8. Other.
The fund's organizational documents provide former and current trustees and officers with a limited indemnification against liabilities arising in connection with the performance of their duties to the fund. In the normal course of business, the fund may also enter into contracts that provide general indemnifications. The fund's maximum exposure under these arrangements is unknown as this would be dependent on future claims that may be made against the fund. The risk of material loss from such claims is considered remote.
9. Distributions to Shareholders.
Distributions to shareholders of each class were as follows:
| Year ended
July 31, 2005 | |
From net investment income | | |
Class A | $ 724 | |
Small Cap Value | 68,438 | |
Institutional Class | 433 | |
Total | $ 69,595 | |
Annual Report
Notes to Financial Statements - continued
10. Share Transactions.
Transactions for each class of shares were as follows:
| Shares | Dollars |
| For the period
November 3, 2004
(commencement of
sale of shares) to
July 31, 2005 | For the period
November 3, 2004
(commencement of
sale of shares) to
July 31, 2005 |
Class A | | |
Shares sold | 750,692 | $ 8,523,912 |
Reinvestment of distributions | 54 | 590 |
Shares redeemed | (16,899) | (197,248) |
Net increase (decrease) | 733,847 | $ 8,327,254 |
Class T | | |
Shares sold | 1,010,520 | $ 11,960,654 |
Shares redeemed | (14,888) | (175,516) |
Net increase (decrease) | 995,632 | $ 11,785,138 |
Class B | | |
Shares sold | 314,195 | $ 3,487,462 |
Shares redeemed | (5,436) | (61,184) |
Net increase (decrease) | 308,759 | $ 3,426,278 |
Class C | | |
Shares sold | 952,687 | $ 10,586,807 |
Shares redeemed | (31,551) | (363,557) |
Net increase (decrease) | 921,136 | $ 10,223,250 |
Small Cap Value | | |
Shares sold | 49,836,348 | $ 566,509,509 |
Reinvestment of distributions | 6,024 | 66,450 |
Shares redeemed | (4,432,148) | (50,921,377) |
Net increase (decrease) | 45,410,224 | $ 515,654,582 |
Institutional Class | | |
Shares sold | 315,268 | $ 3,439,515 |
Reinvestment of distributions | 39 | 433 |
Shares redeemed | (22,206) | (247,594) |
Net increase (decrease) | 293,101 | $ 3,192,354 |
Annual Report
Report of Independent Registered Public Accounting Firm
To the Trustees of Fidelity Securities Fund and the Shareholders of Fidelity Small Cap Value Fund:
In our opinion, the accompanying statement of assets and liabilities, including the schedule of investments, and the related statements of operations and of changes in net assets and the financial highlights present fairly, in all material respects, the financial position of Fidelity Small Cap Value Fund (a fund of Fidelity Securities Fund) at July 31, 2005 and the results of its operations, the changes in its net assets and the financial highlights for the period indicated, in conformity with accounting principles generally accepted in the United States of America. These financial statements and financial highlights (hereafter referred to as "financial statements") are the responsibility of the Fidelity Small Cap Value Fund's management; our responsibility is to express an opinion on these financial statements based on our audit. We conducted our audit of these financial statements in accordance with the standards of the Public Company Accounting Oversight Board (United States). Those standards require that we plan and perform the audit to obtain reasonable assurance about whether the financial statements are free of material misstatement. An audit includes examining, on a test basis, evidence supporting the amounts and disclosures in the financial statements, assessing the accounting principles used and significant estimates made by management, and evaluating the overall financial statement presentation. We believe that our audit, which included confirmation of securities at July 31, 2005 by correspondence with the custodian and brokers, provides a reasonable basis for our opinion.
/s/ PricewaterhouseCoopers LLP
PricewaterhouseCoopers LLP
Boston, Massachusetts
September 13, 2005
Annual Report
Trustees and Officers
The Trustees, Members of the Advisory Board, and executive officers of the trust and fund, as applicable, are listed below. The Board of Trustees governs the fund and is responsible for protecting the interests of shareholders. The Trustees are experienced executives who meet periodically throughout the year to oversee the fund's activities, review contractual arrangements with companies that provide services to the fund, and review the fund's performance. Except for William O. McCoy, Stephen P. Jonas, and Kenneth L. Wolfe, each of the Trustees oversees 320 funds advised by FMR or an affiliate. Mr. McCoy oversees 322 funds advised by FMR or an affiliate. Mr. Jonas and Mr. Wolfe oversee 311 funds advised by FMR or an affiliate.
The Trustees hold office without limit in time except that (a) any Trustee may resign; (b) any Trustee may be removed by written instrument, signed by at least two-thirds of the number of Trustees prior to such removal; (c) any Trustee who requests to be retired or who has become incapacitated by illness or injury may be retired by written instrument signed by a majority of the other Trustees; and (d) any Trustee may be removed at any special meeting of shareholders by a two-thirds vote of the outstanding voting securities of the trust. Each Trustee who is not an interested person (as defined in the 1940 Act) (Independent Trustee), shall retire not later than the last day of the calendar year in which his or her 72nd birthday occurs. The Independent Trustees may waive this mandatory retirement age policy with respect to individual Trustees. The executive officers and Advisory Board Members hold office without limit in time, except that any officer and Advisory Board Member may resign or may be removed by a vote of a majority of the Trustees at any regular meeting or any special meeting of the Trustees. Except as indicated, each individual has held the office shown or other offices in the same company for the past five years.
The fund's Statement of Additional Information (SAI) includes more information about the Trustees. To request a free copy, call Fidelity at 1-877-208-0098.
Interested Trustees*:
Correspondence intended for each Trustee who is an interested person may be sent to Fidelity Investments, 82 Devonshire Street, Boston, Massachusetts 02109.
Name, Age; Principal Occupation |
Edward C. Johnson 3d (75)** |
| Year of Election or Appointment: 1984 Mr. Johnson is Chairman of the Board of Trustees. Mr. Johnson serves as Chief Executive Officer, Chairman, and a Director of FMR Corp.; a Director and Chairman of the Board and of the Executive Committee of FMR; Chairman and a Director of Fidelity Management & Research (Far East) Inc.; Chairman and a Director of Fidelity Investments Money Management, Inc.; and Chairman (2001-present) and a Director (2000-present) of FMR Co., Inc. |
Abigail P. Johnson (43)** |
| Year of Election or Appointment: 2001 Ms. Johnson serves as President of Fidelity Employer Services Company (FESCO) (2005-present). She is President and a Director of Fidelity Investments Money Management, Inc. (2001-present), FMR Co., Inc. (2001-present), and a Director of FMR Corp. Previously, Ms. Johnson served as President and a Director of FMR (2001-2005), Senior Vice President of the Fidelity funds (2001-2005), and managed a number of Fidelity funds. |
Stephen P. Jonas (52) |
| Year of Election or Appointment: 2005 Mr. Jonas is Senior Vice President of the fund (2005-present). He also serves as Senior Vice President of other Fidelity funds (2005-present). Mr. Jonas is Executive Director of FMR (2005-present). Previously, Mr. Jonas served as President of Fidelity Enterprise Operations and Risk Services (2004-2005), Chief Administrative Officer (2002-2004), and Chief Financial Officer of FMR Co. (1998-2000). Mr. Jonas has been with Fidelity Investments since 1987 and has held various financial and management positions including Chief Financial Officer with FMR. In addition, he serves on the Boards of Boston Ballet (2003-present) and Simmons College (2003-present). |
Robert L. Reynolds (53) |
| Year of Election or Appointment: 2003 Mr. Reynolds is a Director (2003-present) and Chief Operating Officer (2002-present) of FMR Corp. He also serves on the Board at Fidelity Investments Canada, Ltd. (2000-present). Previously, Mr. Reynolds served as President of Fidelity Investments Institutional Retirement Group (1996-2000). |
* Trustees have been determined to be "Interested Trustees" by virtue of, among other things, their affiliation with the trust or various entities under common control with FMR.
** Edward C. Johnson 3d, Trustee, is Abigail P. Johnson's father.
Annual Report
Independent Trustees:
Correspondence intended for each Independent Trustee (that is, the Trustees other than the Interested Trustees) may be sent to Fidelity Investments, P.O. Box 55235, Boston, Massachusetts 02205-5235.
Name, Age; Principal Occupation |
Dennis J. Dirks (57) |
| Year of Election or Appointment: 2005 Prior to his retirement in May 2003, Mr. Dirks was Chief Operating Officer and a member of the Board of The Depository Trust & Clearing Corporation (DTCC) (1999-2003). He also served as President, Chief Operating Officer, and Board member of The Depository Trust Company (DTC) (1999-2003) and President and Board member of the National Securities Clearing Corporation (NSCC) (1999-2003). In addition, Mr. Dirks served as Chief Executive Officer and Board member of the Government Securities Clearing Corporation (2001-2003) and Chief Executive Officer and Board member of the Mortgage-Backed Securities Clearing Corporation (2001-2003). Mr. Dirks also serves as a Trustee of Manhattan College (2005-present). |
Robert M. Gates (61) |
| Year of Election or Appointment: 1997 Dr. Gates is Vice Chairman of the Independent Trustees (2005-present). Dr. Gates is President of Texas A&M University (2002-present). He was Director of the Central Intelligence Agency (CIA) from 1991 to 1993. From 1989 to 1991, Dr. Gates served as Assistant to the President of the United States and Deputy National Security Advisor. Dr. Gates is a Director of NACCO Industries, Inc. (mining and manufacturing), Parker Drilling Co., Inc. (drilling and rental tools for the energy industry, 2001-present), and Brinker International (restaurant management, 2003-present). Previously, Dr. Gates served as a Director of LucasVarity PLC (automotive components and diesel engines), a Director of TRW Inc. (automotive, space, defense, and information technology), and Dean of the George Bush School of Government and Public Service at Texas A&M University (1999-2001). Dr. Gates also is a Trustee of the Forum for International Policy. |
George H. Heilmeier (69) |
| Year of Election or Appointment: 2004 Dr. Heilmeier is Chairman Emeritus of Telcordia Technologies (communication software and systems), where prior to his retirement, he served as company Chairman and Chief Executive Officer. He currently serves on the Boards of Directors of The Mitre Corporation (systems engineering and information technology support for the government), and HRL Laboratories (private research and development, 2004-present). He is Chairman of the General Motors Science & Technology Advisory Board and a Life Fellow of the Institute of Electrical and Electronics Engineers (IEEE) (2000-present). Dr. Heilmeier is a member of the Defense Science Board and the National Security Agency Advisory Board. He is also a member of the National Academy of Engineering, the American Academy of Arts and Sciences, and the Board of Overseers of the School of Engineering and Applied Science of the University of Pennsylvania. Previously, Dr. Heilmeier served as a Director of TRW Inc. (automotive, space, defense, and information technology, 1992-2002), Compaq (1994-2002), Automatic Data Processing, Inc. (ADP) (technology-based business outsourcing, 1995-2002), INET Technologies Inc. (telecommunications network surveillance, 2001-2004), and Teletech Holdings (customer management services). He is the recipient of the 2005 Kyoto Prize in Advanced Technology for his invention of the liquid display. |
Marie L. Knowles (58) |
| Year of Election or Appointment: 2001 Prior to Ms. Knowles' retirement in June 2000, she served as Executive Vice President and Chief Financial Officer of Atlantic Richfield Company (ARCO) (diversified energy, 1996-2000). From 1993 to 1996, she was a Senior Vice President of ARCO and President of ARCO Transportation Company. She served as a Director of ARCO from 1996 to 1998. She currently serves as a Director of Phelps Dodge Corporation (copper mining and manufacturing) and McKesson Corporation (healthcare service, 2002-present). Ms. Knowles is a Trustee of the Brookings Institution and the Catalina Island Conservancy and also serves as a member of the Advisory Board for the School of Engineering of the University of Southern California. |
Ned C. Lautenbach (61) |
| Year of Election or Appointment: 2000 Mr. Lautenbach has been a partner of Clayton, Dubilier & Rice, Inc. (private equity investment firm) since September 1998. Previously, Mr. Lautenbach was with the International Business Machines Corporation (IBM) from 1968 until his retirement in 1998. Mr. Lautenbach serves as a Director of Italtel Holding S.p.A. (telecommunications (Milan, Italy), 2004-present) and Eaton Corporation (diversified industrial) as well as the Philharmonic Center for the Arts in Naples, Florida. He also is a member of the Board of Trustees of Fairfield University (2005-present), as well as a member of the Council on Foreign Relations. |
Marvin L. Mann (72) |
| Year of Election or Appointment: 1993 Mr. Mann is Chairman of the Independent Trustees (2001-present). He is Chairman Emeritus of Lexmark International, Inc. (computer peripherals), where he served as CEO until April 1998, retired as Chairman May 1999, and remains a member of the Board. Prior to 1991, he held the positions of Vice President of International Business Machines Corporation (IBM) and President and General Manager of various IBM divisions and subsidiaries. He is a member of the Executive Committee of the Independent Director's Council of the Investment Company Institute. In addition, Mr. Mann is a member of the President's Cabinet at the University of Alabama and the Board of Visitors of the Culverhouse College of Commerce and Business Administration at the University of Alabama. |
William O. McCoy (71) |
| Year of Election or Appointment: 1997 Prior to his retirement in December 1994, Mr. McCoy was Vice Chairman of the Board of BellSouth Corporation (telecommunications) and President of BellSouth Enterprises. He is currently a Director of Liberty Corporation (holding company), Duke Realty Corporation (real estate), and Progress Energy, Inc. (electric utility). He is also a partner of Franklin Street Partners (private investment management firm) and a member of the Research Triangle Foundation Board. In addition, Mr. McCoy served as the Interim Chancellor (1999-2000) and a member of the Board of Visitors for the University of North Carolina at Chapel Hill and currently serves on the Board of Directors of the University of North Carolina Health Care System and the Board of Visitors of the Kenan-Flagler Business School (University of North Carolina at Chapel Hill). He also served as Vice President of Finance for the University of North Carolina (16-school system). |
Cornelia M. Small (61) |
| Year of Election or Appointment: 2005 Ms. Small is a member (2000-present) and Chairperson (2002-present) of the Investment Committee, and a member (2002-present) of the Board of Trustees of Smith College. Previously, she served as Chief Investment Officer (1999-2000), Director of Global Equity Investments (1996-1999), and a member of the Board of Directors of Scudder, Stevens & Clark (1990-1997) and Scudder Kemper Investments (1997-1998). In addition, Ms. Small served as Co-Chair (2000-2003) of the Annual Fund for the Fletcher School of Law and Diplomacy. |
William S. Stavropoulos (66) |
| Year of Election or Appointment: 2002 Mr. Stavropoulos is Chairman of the Board (2000-present) and a Member of the Board of Directors of The Dow Chemical Company. Since joining The Dow Chemical Company in 1967, Mr. Stavropoulos served in numerous senior management positions, including President (1993-2000; 2002-2003), CEO (1995-2000; 2002-2004), and Chairman of the Executive Committee (2000-2004). Currently, he is a Director of NCR Corporation (data warehousing and technology solutions), BellSouth Corporation (telecommunications), Chemical Financial Corporation, Maersk Inc. (industrial conglomerate, 2002-present), and Metalmark Capital (private equity investment firm, 2005-present). He also serves as a member of the Board of Trustees of the American Enterprise Institute for Public Policy Research. In addition, Mr. Stavropoulos is a member of The Business Council, J.P. Morgan International Council and the University of Notre Dame Advisory Council for the College of Science. |
Kenneth L. Wolfe (66) |
| Year of Election or Appointment: 2005 Mr. Wolfe also serves as a Trustee (2005-present) or Member of the Advisory Board (2004-present) of other investment companies advised by FMR. Prior to his retirement in 2001, Mr. Wolfe was Chairman and Chief Executive Officer of Hershey Foods Corporation (1993-2001). He currently serves as a member of the boards of Adelphia Communications Corporation (2003-present), Bausch & Lomb, Inc., and Revlon Inc. (2004-present). |
Annual Report
Advisory Board Members and Executive Officers:
Correspondence intended for Mr. Gamper may be sent to Fidelity Investments, P.O. Box 55235, Boston, Massachusetts 02205-5235. Correspondence intended for each executive officer and Mr. Lynch may be sent to Fidelity Investments, 82 Devonshire Street, Boston, Massachusetts 02109.
Name, Age; Principal Occupation |
Albert R. Gamper, Jr. (63) |
| Year of Election or Appointment: 2005 Member of the Advisory Board of Fidelity Securities Fund. Prior to his retirement in December 2004, Mr. Gamper served as Chairman of the Board of CIT Group Inc. (commercial finance). During his tenure with CIT Group Inc. Mr. Gamper served in numerous senior management positions, including Chairman (1987-1989; 1999-2001; 2002-2004), Chief Executive Officer (1987-2004), and President (1989-2002). He currently serves as a member of the Board of Directors of Public Service Enterprise Group (utilities, 2001-present), Chairman of the Board of Governors, Rutgers University (2004-present), and Chairman of the Board of Saint Barnabas Health Care System. |
Peter S. Lynch (61) |
| Year of Election or Appointment: 2003 Member of the Advisory Board of Fidelity Securities Fund. Vice Chairman and a Director of FMR, and Vice Chairman (2001-present) and a Director (2000-present) of FMR Co., Inc. Previously, Mr. Lynch served as a Trustee of the Fidelity funds (1990-2003). In addition, he serves as a Trustee of Boston College, Massachusetts Eye & Ear Infirmary, Historic Deerfield, John F. Kennedy Library, and the Museum of Fine Arts of Boston. |
Dwight D. Churchill (51) |
| Year of Election or Appointment: 2005 Vice President of the fund. Mr. Churchill also serves as Vice President of certain Equity Funds (2005-present) and certain High Income Funds (2005-present). Previously, he served as Head of Fidelity's Fixed-Income Division (2000-2005), Vice President of Fidelity's Money Market Funds (2000-2005), Vice President of Fidelity's Bond Funds, and Senior Vice President of FIMM (2000) and FMR. Mr. Churchill joined Fidelity in 1993 as Vice President and Group Leader of Taxable Fixed-Income Investments. |
Walter C. Donovan (43) |
| Year of Election or Appointment: 2005 Vice President of the fund. Mr. Donovan also serves as Vice President of Fidelity's High Income Funds (2005-present), Fidelity's Fixed-Income Funds (2005-present), certain Asset Allocation Funds (2005-present), and certain Balanced Funds (2005-present). Mr. Donovan also serves as Executive Vice President of FMR (2005-present) and FMRC (2005-present). Previously, Mr. Donovan served as Vice President and Director of Fidelity's International Equity Trading group (1998-2005). |
Eric D. Roiter (56) |
| Year of Election or Appointment: 2004 Secretary of the fund. He also serves as Secretary of other Fidelity funds; Vice President, General Counsel, and Secretary of FMR Co., Inc. (2001-present) and FMR; Assistant Secretary of Fidelity Management & Research (U.K.) Inc. (2001-present), Fidelity Management & Research (Far East) Inc. (2001-present), and Fidelity Investments Money Management, Inc. (2001-present). Mr. Roiter is an Adjunct Member, Faculty of Law, at Boston College Law School (2003-present). Previously, Mr. Roiter served as Vice President and Secretary of Fidelity Distributors Corporation (FDC) (1998-2005). |
Stuart Fross (45) |
| Year of Election or Appointment: 2004 Assistant Secretary of the fund. Mr. Fross also serves as Assistant Secretary of other Fidelity funds (2003-present), Vice President and Secretary of FDC (2005-present), and is an employee of FMR. |
Christine Reynolds (46) |
| Year of Election or Appointment: 2004 President, Treasurer, and Anti-Money Laundering (AML) officer of the fund. Ms. Reynolds also serves as President, Treasurer, and AML officer of other Fidelity funds (2004) and is a Vice President (2003) and an employee (2002) of FMR. Before joining Fidelity Investments, Ms. Reynolds worked at PricewaterhouseCoopers LLP (PwC) (1980-2002), where she was most recently an audit partner with PwC's investment management practice. |
Timothy F. Hayes (54) |
| Year of Election or Appointment: 2004 Chief Financial Officer of the fund. Mr. Hayes also serves as Chief Financial Officer of other Fidelity funds (2002-present) and President of Fidelity Investment Operations (2005-present) which includes Fidelity Pricing and Cash Management Services Group (FPCMS), where he served as President (1998-2005). Mr. Hayes serves as President of Fidelity Service Company (2003-present) where he also serves as a Director. Mr. Hayes also served as President of Fidelity Investments Operations Group (FIOG, 2002-2005). |
Kenneth A. Rathgeber (58) |
| Year of Election or Appointment: 2004 Chief Compliance Officer of the fund. Mr. Rathgeber also serves as Chief Compliance Officer of other Fidelity funds (2004) and Executive Vice President of Risk Oversight for Fidelity Investments (2002). Previously, he served as Executive Vice President and Chief Operating Officer for Fidelity Investments Institutional Services Company, Inc. (1998-2002). |
John R. Hebble (47) |
| Year of Election or Appointment: 2004 Deputy Treasurer of the fund. Mr. Hebble also serves as Deputy Treasurer of other Fidelity funds (2003), and is an employee of FMR. Before joining Fidelity Investments, Mr. Hebble worked at Deutsche Asset Management where he served as Director of Fund Accounting (2002-2003) and Assistant Treasurer of the Scudder Funds (1998-2003). |
Bryan A. Mehrmann (44) |
| Year of Election or Appointment: 2005 Deputy Treasurer of the fund. Mr. Mehrmann also serves as Deputy Treasurer of other Fidelity funds (2005-present) and is an employee of FMR. Previously, Mr. Mehrmann served as Vice President of Fidelity Investments Institutional Services Group (FIIS)/Fidelity Investments Institutional Operations Corporation, Inc. (FIIOC) Client Services (1998-2004). |
Kimberley H. Monasterio (41) |
| Year of Election or Appointment: 2004 Deputy Treasurer of the fund. Ms. Monasterio also serves as Deputy Treasurer of other Fidelity funds (2004) and is an employee of FMR (2004). Before joining Fidelity Investments, Ms. Monasterio served as Treasurer (2000-2004) and Chief Financial Officer (2002-2004) of the Franklin Templeton Funds and Senior Vice President of Franklin Templeton Services, LLC (2000-2004). |
Kenneth B. Robins (35) |
| Year of Election or Appointment:2005 Deputy Treasurer of the fund. Mr. Robins also serves as Deputy Treasurer of other Fidelity funds (2005-present) and is an employee of FMR (2004-present). Before joining Fidelity Investments, Mr. Robins worked at KPMG LLP, where he was a partner in KPMG's department of professional practice (2002-2004) and a Senior Manager (1999-2000). In addition, Mr. Robins served as Assistant Chief Accountant, United States Securities and Exchange Commission (2000-2002). |
Robert G. Byrnes (38) |
| Year of Election or Appointment: 2005 Assistant Treasurer of the fund. Mr. Byrnes also serves as Assistant Treasurer of other Fidelity funds (2005-present) and is an employee of FMR (2005-present). Previously, Mr. Byrnes served as Vice President of FPCMS (2003-2005). Before joining Fidelity Investments, Mr. Byrnes worked at Deutsche Asset Management where he served as Vice President of the Investment Operations Group (2000-2003). |
John H. Costello (58) |
| Year of Election or Appointment: 2004 Assistant Treasurer of the fund. Mr. Costello also serves as Assistant Treasurer of other Fidelity funds and is an employee of FMR. |
Peter L. Lydecker (51) |
| Year of Election or Appointment: 2004 Assistant Treasurer of the fund. Mr. Lydecker also serves as Assistant Treasurer of other Fidelity funds (2004) and is an employee of FMR. |
Mark Osterheld (50) |
| Year of Election or Appointment: 2004 Assistant Treasurer of the fund. Mr. Osterheld also serves as Assistant Treasurer of other Fidelity funds (2002) and is an employee of FMR. |
Gary W. Ryan (46) |
| Year of Election or Appointment: 2005 Assistant Treasurer of the fund. Mr. Ryan also serves as Assistant Treasurer of other Fidelity funds (2005-present) and is an employee of FMR (2005-present). Previously, Mr. Ryan served as Vice President of Fund Reporting in FPCMS (1999-2005). |
Salvatore Schiavone (39) |
| Year of Election or Appointment: 2005 Assistant Treasurer of the fund. Mr. Schiavone also serves as Assistant Treasurer of other Fidelity funds (2005-present) and is an employee of FMR (2005-present). Before joining Fidelity Investments, Mr. Schiavone worked at Deutsche Asset Management, where he most recently served as Assistant Treasurer (2003-2005) of the Scudder Funds and Vice President and Head of Fund Reporting (1996-2003). |
Annual Report
Distributions
The Board of Trustees of Advisor Small Cap Value Fund voted to pay to shareholders of record at the opening of business on record date, the following distributions per share derived from capital gains realized from sales of portfolio securities:
| Pay Date | Record Date | Capital Gains |
Institutional Class | 9/12/05 | 9/9/05 | $0.268 |
| | | |
The fund hereby designates as capital gain dividends: for dividends with respect to the taxable year ended July 31, 2005, $16,591, or, if subsequently determined to be different, the net capital gain of such year.
Institutional Class designates 62% of the dividends distributed in December 2004 during the fiscal year as qualifying for the dividends-received deduction for corporate shareholders.
Institutional Class designates 100% of the dividends distributed in December during the fiscal year as amounts which may be taken into account as a dividend for purposes of the maximum rate under section 1(h)(11) of the Internal Revenue Code.
The fund will notify shareholders in January 2006 of amounts for use in preparing 2005 income tax returns.
Annual Report
Board Approval of Investment Advisory Contracts and Management Fees
Small Cap Value Fund
Each year, typically in July, the Board of Trustees, including the independent Trustees (together, the Board), votes on the renewal of the management contract and sub-advisory agreements (together, the Advisory Contracts) for the fund. The Board, assisted by the advice of fund counsel and independent Trustees' counsel, requests and considers a broad range of information throughout the year.
The Board meets regularly each month except August and takes into account throughout the year matters bearing on Advisory Contracts. The Board, acting directly and through its separate committees, considers at each of its meetings factors that are relevant to the annual renewal of the fund's Advisory Contracts, including the services and support provided to the fund and its shareholders by Fidelity. At the time of the renewal, the Board had 11 standing committees, each composed of independent Trustees with varying backgrounds, to which the Board has assigned specific subject matter responsibilities in order to enhance effective decision-making by the Board. Each committee has adopted a written charter outlining the structure and purposes of the committee. One such committee, the Equity Contract Committee, meets periodically during the first six months of each year and as necessary to consider matters specifically related to the annual renewal of Advisory Contracts. The committee requests and receives information on, and makes recommendations to the independent Trustees concerning, the approval and annual review of the Advisory Contracts.
At its July 2005 meeting, the Board of Trustees, including the independent Trustees, unanimously determined to renew the Advisory Contracts for the fund. In reaching its determination, the Board considered all factors it believed relevant, including (1) the nature, extent, and quality of the services to be provided to the fund and its shareholders by Fidelity (including the investment performance of the fund); (2) the competitiveness of the management fee and total expenses of the fund; (3) the total costs of the services to be provided by and the profits to be realized by the investment adviser and its affiliates from the relationship with the fund; (4) the extent to which economies of scale would be realized as the fund grows; and (5) whether fee levels reflect these economies of scale, if any, for the benefit of fund shareholders.
In determining whether to renew the Advisory Contracts for the fund, the Board ultimately reached a determination, with the assistance of fund counsel and independent Trustees' counsel, that the renewal of the Advisory Contracts and the compensation to be received by Fidelity under the management contract is consistent with Fidelity's fiduciary duty under applicable law. In addition to evaluating the specific factors noted above, the Board, in reaching its determination, is aware that shareholders in the fund have a broad range of investment choices available to them, including a wide choice among mutual funds offered by competitors to Fidelity, and that the fund's shareholders, with the opportunity to review and weigh the disclosure provided by the fund in its prospectus and other public disclosures, have chosen to invest in this fund, managed by Fidelity.
Annual Report
Nature, Extent, and Quality of Services Provided by Fidelity. The Board considered staffing within the investment adviser, FMR, and the sub-advisers (together, the Investment Advisers), including the background of the fund's portfolio manager and the fund's investment objective and discipline. The independent Trustees also had discussions with senior management of Fidelity's investment operations and investment groups. The Board considered the structure of the portfolio manager compensation program and whether this structure provides appropriate incentives.
Fidelity Resources Dedicated to Investment Management and Support Services. The Board reviewed the size, education, and experience of the Investment Advisers' investment staff, their use of technology, and the Investment Advisers' approach to recruiting, training, and retaining portfolio managers and other research, advisory, and management personnel. The Board considered Fidelity's extensive global research capabilities that enable the Investment Advisers to aggregate data from various sources in an effort to produce positive investment results. The Board noted that Fidelity's analysts have access to a variety of technological tools that enable them to perform both fundamental and quantitative analysis and to specialize in various disciplines. The Board also considered that Fidelity's portfolio managers and analysts have access to daily portfolio attribution that allows for monitoring of a fund's portfolio, as well as an electronic communication system that provides immediate real-time access to research concerning issuers and credit enhancers.
Shareholder and Administrative Services. The Board considered the nature, extent, quality, and cost of administrative, distribution, and shareholder services performed by the Investment Advisers and their affiliates under the Advisory Contracts and under separate agreements covering transfer agency, pricing and bookkeeping, and securities lending services for the fund. The Board also considered the nature and extent of the Investment Advisers' supervision of third party service providers, principally custodians and subcustodians. The Board reviewed the allocation of fund brokerage, including allocations to brokers affiliated with the Investment Advisers, the use of brokerage commissions to pay fund expenses, and the use of "soft" commission dollars to pay for research services. The Board also considered that Fidelity voluntarily decided in 2004 to stop using "soft" commission dollars to pay for market data and, instead, to pay for that data out of its own resources. The Board also considered the resources devoted to, and the record of compliance with, the fund's compliance policies and procedures.
The Board noted that the growth of fund assets across the complex allows Fidelity to reinvest in the development of services designed to enhance the value or convenience of the Fidelity funds as investment vehicles. These services include 24-hour access to account information and market information through phone representatives and over the Internet, and investor education materials and asset allocation tools.
Annual Report
Board Approval of Investment Advisory Contracts and
Management Fees - continued
Investment in a Large Fund Family. The Board considered the benefits to shareholders of investing in a Fidelity fund, including the benefits of investing in a fund that is part of a large family of funds offering a variety of investment disciplines and providing for a large variety of mutual fund investor services. For example, fund shareholders are offered the privilege of exchanging shares of the fund for shares of other Fidelity funds, as set forth in the fund's prospectus, without paying an additional sales charge. The Board noted that, since July 2004, Fidelity has taken a number of actions that benefited particular funds, including (i) voluntarily deciding in 2004 to stop using "soft" commission dollars to pay for market data and, instead, to pay for that data out of its own resources, (ii) contractually agreeing to impose management fee reductions and expense limitations on its five Spartan stock index funds and its stock index fund available through variable insurance products, (iii) contractually agreeing to eliminate the management fees on the Fidelity Freedom Funds and the Fidelity Advisor Freedom Funds, (iv) contractually agreeing to reduce the management fees on most of its investment-grade taxable bond funds, and (v) contractually agreeing to impose expense limitations on its retail and Spartan investment-grade taxable bond funds.
Investment Performance. The Board considered whether the fund has operated within its investment objective, as well as its record of compliance with its investment restrictions. The Board noted that it is not possible to evaluate performance in any comprehensive fashion because the fund had been in operation for less than one calendar year. Once the fund has been in operation for at least one calendar year, the Board will review the fund's absolute investment performance for each class, as well as the fund's relative investment performance for each class measured against (i) a broad-based securities market index and (ii) a peer group of mutual funds deemed appropriate by the Board.
The Board also considered that, beginning November 1, 2005, the fund's management fee will be subject to upward or downward adjustment depending upon whether, and to what extent, the fund's investment performance for the performance period exceeds, or is exceeded by, the record (over the same period) of a Board-approved performance adjustment index. The Board realizes that the performance adjustment provides FMR with a strong economic incentive to seek to achieve superior performance for the fund's shareholders and helps to more closely align the interests of FMR and the fund's shareholders.
The Board has had thorough discussions with FMR throughout the year about the Board's and FMR's concerns about equity research, equity fund performance, and compliance with internal policies governing gifts and entertainment. FMR has taken steps that it believes will refocus and strengthen equity research and equity portfolio management and trading. The Board noted with favor FMR's recent reorganization of its senior management team and FMR's plans to dedicate additional resources to investment research, and participated in the process that led to those changes.
Annual Report
Based on its review, and giving particular weight to the nature and quality of the resources dedicated by the Investment Advisers to maintain and improve relative performance, the Board concluded that the nature, extent, and quality of the services provided by Fidelity will benefit the fund's shareholders, particularly in light of the Board's view that the fund's shareholders benefit from investing in a fund that is part of a large family of funds offering a variety of investment disciplines and services.
Competitiveness of Management Fee and Total Fund Expenses. The Board considered the fund's management fee and total expenses compared to "mapped groups" of competitive funds and classes. Fidelity creates "mapped groups" by combining similar Lipper investment objective categories that have comparable management fee characteristics. Combining Lipper investment objective categories aids the Board's management fee and total expense comparisons by broadening the competitive group used for comparison and by reducing the number of universes to which various Fidelity funds are compared.
The Board considered two proprietary management fee comparisons for the period of the fund's operations shown in the chart below. The group of Lipper funds used by the Board for management fee comparisons is referred to below as the "Total Mapped Group" and, for the reasons explained above, is broader than the Lipper peer group used by the Board for performance comparisons. The Total Mapped Group comparison focuses on a fund's standing relative to the total universe of comparable funds available to investors, in terms of gross management fees before expense reimbursements or caps. "TMG %" represents the percentage of funds in the Total Mapped Group that had management fees that were lower than the fund's. For example, a TMG % of 16% means that 84% of the funds in the Total Mapped Group had higher management fees than the fund. The "Asset-Size Peer Group" (ASPG) comparison focuses on a fund's standing relative to non-Fidelity funds similar in size to the fund within the Total Mapped Group. The ASPG represents at least 15% of the funds in the Total Mapped Group with comparable asset size and management fee characteristics, subject to a minimum of 50 funds (or all funds in the Total Mapped Group if fewer than 50). Additional information, such as the ASPG quartile ("quadrant") in which the fund's management fee ranked, is also included in the chart and considered by the Board.
Annual Report
Board Approval of Investment Advisory Contracts and
Management Fees - continued
The Board noted that the fund's management fee ranked below the median of its Total Mapped Group and below the median of its ASPG for the period.
Based on its review, the Board concluded that the fund's management fee was fair and reasonable in light of the services that the fund receives and the other factors considered.
In its review of each class's total expenses, the Board considered the fund's management fee as well as other fund or class expenses, as applicable, such as transfer agent fees, pricing and bookkeeping fees, fund-paid 12b-1 fees, and custodial, legal, and audit fees. The Board also noted the effects of any waivers and reimbursements on fees and expenses. As part of its review, the Board also considered current and historical total expenses of each class of the fund compared to competitive fund median expenses. Each class of the fund is compared to those funds and classes in the Total Mapped Group (used by the Board for management fee comparisons) that have a similar sales load structure.
The Board noted that the total expenses of Fidelity Small Cap Value Fund (retail class) ranked below its competitive median for the period, the total expenses of Class A ranked equal to its competitive median for the period, and the total expenses of each of Class B, Class C, Class T and Institutional Class ranked above its competitive median for the period. The Board considered that the fund launched in November 2004 and that the classes were above median because of high expenses in basis points due to their small size. The Board noted that the fund offers multiple classes, each of which has a different sales load and 12b-1 fee structure, and that the multiple structures are intended to offer a range of pricing options for the intermediary market. The Board also noted that the total expenses of the classes vary primarily by the level of their 12b-1 fees, although differences in transfer agent fees may also cause expenses to vary from class to class.
Annual Report
Furthermore, the Board considered that, effective June 1, 2005, FMR voluntarily agreed to reimburse each class of the fund to the extent that total operating expenses (excluding 12b-1 fees and certain other expenses) exceed 115 basis points. The Board considered that, if the voluntary expense reimbursements had been in effect in 2004, the total expenses of each of Class A, Class B and Class C would have ranked below the median and the total expenses of Institutional Class would have ranked equal to the median.
In its review of total expenses, the Board also considered Fidelity fee structures and other information on clients that FMR and its affiliates service in other competitive markets, such as other mutual funds advised or subadvised by FMR or its affiliates, pension plan clients, and other institutional clients.
Based on its review, the Board concluded that the total expenses for each class of the fund were reasonable, although in some cases above the median of the universe presented for comparison, in light of the services that the fund and its shareholders receive and the other factors considered.
Costs of the Services and Profitability. The Board considered the revenues earned and the expenses incurred by Fidelity in conducting the business of developing, marketing, distributing, managing, administering and servicing the fund and its shareholders. The Board also considered the level of Fidelity's profits in respect of all the Fidelity funds.
On an annual basis, FMR presents to the Board Fidelity's profitability for the fund. Fidelity calculates the profitability for each fund, as well as aggregate profitability for groups of Fidelity funds and all Fidelity funds, using a series of detailed revenue and cost allocation methodologies which originate with the audited books and records of Fidelity. The Audit Committee of the Board reviews any significant changes from the prior year's methodologies.
PricewaterhouseCoopers LLP (PwC), independent registered accounting firm and auditor to Fidelity and certain Fidelity funds, has been engaged annually by the Board as part of the Board's assessment of the results of Fidelity's profitability analysis. PwC's engagement includes the review and assessment of Fidelity's methodologies used in determining the revenues and expenses attributable to Fidelity's mutual fund business, and completion of agreed-upon procedures surrounding the mathematical accuracy of fund profitability and its conformity to allocation methodologies. After considering PwC's reports issued under the engagement and information provided by Fidelity, the Board believes that while other allocation methods may also be reasonable, Fidelity's profitability methodologies are reasonable in all material respects.
Annual Report
Board Approval of Investment Advisory Contracts and
Management Fees - continued
The Board has also reviewed Fidelity's non-fund businesses and any fall-out benefits related to the mutual fund business as well as cases where Fidelity's affiliates may benefit from or be related to the fund's business. In addition, a special committee of the Board reviewed services provided to Fidelity by its affiliates and determined that the fees that Fidelity paid for such services were reasonable.
The Board considered the costs of the services provided by and the profits realized by Fidelity in connection with the operation of the fund and determined that the amount of profit is a fair entrepreneurial profit for the management of the fund.
Economies of Scale. The Board considered whether there have been economies of scale in respect of the management of the Fidelity funds, whether the Fidelity funds (including the fund) have appropriately benefited from any such economies of scale, and whether there is potential for realization of any further economies of scale. The Board considered the extent to which the fund will benefit from economies of scale through increased services to the fund, through waivers or reimbursements, or through fee or expense reductions, including reductions that occur through operation of the transfer agent agreement. The transfer agent fee varies in part based on the number of accounts in the fund. If the number of accounts decreases or the average account size increases, the overall transfer agent fee rate decreases.
The Board recognized that the fund's management contract incorporates a "group fee" structure, which provides for lower fee rates as total fund assets under FMR's management increase, and for higher fee rates as total fund assets under FMR's management decrease. The Board considered that the group fee is designed to deliver the benefits of economies of scale to fund shareholders when total fund assets increase, even if assets of any particular fund are unchanged or have declined, because some portion of Fidelity's costs are attributable to services provided to all Fidelity funds, and all funds benefit if those costs can be allocated among more assets. The Board concluded that, given the group fee structure, fund shareholders will achieve a certain level of economies of scale as assets under FMR's management increase at the fund complex level, regardless of whether Fidelity achieves any such economies of scale.
The Board further concluded that any potential economies of scale are being shared between fund shareholders and Fidelity in an appropriate manner.
Additional Information Requested by the Board. In order to develop fully the factual basis for consideration of the Advisory Contracts, the Board requested additional information regarding (i) equity fund transfer agency fees; (ii) Fidelity's fund profitability methodology and the impact of various changes in the methodology over time; (iii) benefits to shareholders from economies of scale; (iv) composition and characteristics of various fund and industry data used in comparisons; and (v) compensation of portfolio managers and research analysts.
Annual Report
Based on its evaluation of all of the conclusions noted above, and after considering all material factors, the Board ultimately concluded that the existing advisory fee structures are fair and reasonable, and that the fund's existing Advisory Contracts should be renewed.
Annual Report
Managing Your Investments
Fidelity offers several ways to conveniently manage your personal investments via your telephone or PC. You can access your account information, conduct trades and research your investments 24 hours a day.
By Phone
Fidelity Automated Service Telephone provides a single toll-free number to access account balances, positions, quotes and trading. It's easy to navigate the service, and on your first call, the system will help you create a personal identification number (PIN) for security.
(phone_graphic)
Fidelity Automated
Service Telephone (FAST®)
1-800-544-5555
Press
1 For mutual fund and brokerage trading.
2 For quotes.*
3 For account balances and holdings.
4 To review orders and mutual
fund activity.
5 To change your PIN.
*0 To speak to a Fidelity representative.
By PC
Fidelity's web site on the Internet provides a wide range of information, including daily financial news, fund performance, interactive planning tools and news about Fidelity products and services.
(computer_graphic)
Fidelity's Web Site
www.fidelity.com
* When you call the quotes line, please remember that a fund's yield and return will vary and, except for money market funds, share price will also vary. This means that you may have a gain or loss when you sell your shares. There is no assurance that money market funds will be able to maintain a stable $1 share price; an investment in a money market fund is not insured or guaranteed by the U.S. government. Total returns are historical and include changes in share price, reinvestment of dividends and capital gains, and the effects of any sales charges.
Annual Report
To Write Fidelity
We'll give your correspondence immediate attention and send you written confirmation upon completion of your request.
(letter_graphic)
Making Changes
To Your Account
(such as changing name, address, bank, etc.)
Fidelity Investments
P.O. Box 770001
Cincinnati, OH 45277-0002
(letter_graphic)
For Non-Retirement
Accounts
Buying shares
Fidelity Investments
P.O. Box 770001
Cincinnati, OH 45277-0003
Overnight Express
Fidelity Investments
Attn: Distribution Services
100 Crosby Parkway - KC1H
Covington, KY 41015
Selling shares
Fidelity Investments
P.O. Box 770001
Cincinnati, OH 45277-0035
Overnight Express
Fidelity Investments
Attn: Distribution Services
100 Crosby Parkway - KC1H
Covington, KY 41015
General Correspondence
Fidelity Investments
P.O. Box 500
Merrimack, NH 03054-0500
(letter_graphic)
For Retirement
Accounts
Buying shares
Fidelity Investments
P.O. Box 770001
Cincinnati, OH 45277-0003
Selling shares
Fidelity Investments
P.O. Box 770001
Cincinnati, OH 45277-0035
Overnight Express
Fidelity Investments
Attn: Distribution Services
100 Crosby Parkway - KC1H
Covington, KY 41015
General Correspondence
Fidelity Investments
P.O. Box 500
Merrimack, NH 03054-0500
Annual Report
To Visit Fidelity
For directions and hours,
please call 1-800-544-9797.
Arizona
7001 West Ray Road
Chandler, AZ
7373 N. Scottsdale Road
Scottsdale, AZ
California
815 East Birch Street
Brea, CA
1411 Chapin Avenue
Burlingame, CA
851 East Hamilton Avenue
Campbell, CA
19200 Von Karman Avenue
Irvine, CA
601 Larkspur Landing Circle
Larkspur, CA
10100 Santa Monica Blvd.
Los Angeles, CA
27101 Puerta Real
Mission Viejo, CA
73-575 El Paseo
Palm Desert, CA
251 University Avenue
Palo Alto, CA
123 South Lake Avenue
Pasadena, CA
16995 Bernardo Ctr. Drive
Rancho Bernardo, CA
1740 Arden Way
Sacramento, CA
7676 Hazard Center Drive
San Diego, CA
8 Montgomery Street
San Francisco, CA
3793 State Street
Santa Barbara, CA
21701 Hawthorne Boulevard
Torrance, CA
2001 North Main Street
Walnut Creek, CA
6300 Canoga Avenue
Woodland Hills, CA
Colorado
1625 Broadway
Denver, CO
9185 East Westview Road
Littleton, CO
Connecticut
48 West Putnam Avenue
Greenwich, CT
265 Church Street
New Haven, CT
300 Atlantic Street
Stamford, CT
29 South Main Street
West Hartford, CT
Delaware
222 Delaware Avenue
Wilmington, DE
Florida
4400 N. Federal Highway
Boca Raton, FL
121 Alhambra Plaza
Coral Gables, FL
2948 N. Federal Highway
Ft. Lauderdale, FL
1907 West State Road 434
Longwood, FL
8880 Tamiami Trail, North
Naples, FL
3550 Tamiami Trail, South
Sarasota, FL
1502 N. Westshore Blvd.
Tampa, FL
2465 State Road 7
Wellington, FL
3501 PGA Boulevard
West Palm Beach, FL
Georgia
3445 Peachtree Road, N.E.
Atlanta, GA
1000 Abernathy Road
Atlanta, GA
Illinois
One North LaSalle Street
Chicago, IL
875 North Michigan Ave.
Chicago, IL
1415 West 22nd Street
Oak Brook, IL
1700 East Golf Road
Schaumburg, IL
3232 Lake Avenue
Wilmette, IL
Indiana
4729 East 82nd Street
Indianapolis, IN
Kansas
5400 College Boulevard
Overland Park, KS
Maine
Three Canal Plaza
Portland, ME
Maryland
7315 Wisconsin Avenue
Bethesda, MD
One W. Pennsylvania Ave.
Towson, MD
Massachusetts
801 Boylston Street
Boston, MA
155 Congress Street
Boston, MA
300 Granite Street
Braintree, MA
44 Mall Road
Burlington, MA
405 Cochituate Road
Framingham, MA
416 Belmont Street
Worcester, MA
Michigan
500 E. Eisenhower Pkwy.
Ann Arbor, MI
280 Old N. Woodward Ave.
Birmingham, MI
43420 Grand River Avenue
Novi, MI
29155 Northwestern Hwy.
Southfield, MI
Minnesota
7600 France Avenue South
Edina, MN
Missouri
8885 Ladue Road
Ladue, MO
Annual Report
Nevada
2225 Village Walk Drive
Henderson, NV
New Jersey
150 Essex Street
Millburn, NJ
56 South Street
Morristown, NJ
396 Route 17, North
Paramus, NJ
3518 Route 1 North
Princeton, NJ
530 Highway 35
Shrewsbury, NJ
New York
1055 Franklin Avenue
Garden City, NY
37 West Jericho Turnpike
Huntington Station, NY
1271 Avenue of the Americas
New York, NY
61 Broadway
New York, NY
350 Park Avenue
New York, NY
200 Fifth Avenue
New York, NY
733 Third Avenue
New York, NY
11 Penn Plaza
New York, NY
2070 Broadway
New York, NY
1075 Northern Blvd.
Roslyn, NY
North Carolina
4611 Sharon Road
Charlotte, NC
Ohio
3805 Edwards Road
Cincinnati, OH
1324 Polaris Parkway
Columbus, OH
28699 Chagrin Boulevard
Woodmere Village, OH
Oregon
16850 SW 72nd Avenue
Tigard, OR
Pennsylvania
600 West DeKalb Pike
King of Prussia, PA
1735 Market Street
Philadelphia, PA
12001 Perry Highway
Wexford, PA
Rhode Island
47 Providence Place
Providence, RI
Tennessee
6150 Poplar Avenue
Memphis, TN
Texas
10000 Research Boulevard
Austin, TX
4001 Northwest Parkway
Dallas, TX
12532 Memorial Drive
Houston, TX
2701 Drexel Drive
Houston, TX
6500 N. MacArthur Blvd.
Irving, TX
6005 West Park Boulevard
Plano, TX
14100 San Pedro
San Antonio, TX
1576 East Southlake Blvd.
Southlake, TX
19740 IH 45 North
Spring, TX
Utah
215 South State Street
Salt Lake City, UT
Virginia
1861 International Drive
McLean, VA
Washington
411 108th Avenue, N.E.
Bellevue, WA
1518 6th Avenue
Seattle, WA
Washington, DC
1900 K Street, N.W.
Washington, DC
Wisconsin
595 North Barker Road
Brookfield, WI
Fidelity Brokerage Services, Inc., 100 Summer St., Boston, MA 02110 Member NYSE/SIPC
Annual Report
Annual Report
Annual Report
Investment Adviser
Fidelity Management & Research Company
Boston, MA
Investment Sub-Advisers
FMR Co., Inc.
Fidelity Management & Research
(U.K.) Inc.
Fidelity Management & Research
(Far East) Inc.
Fidelity International Investment Advisors
Fidelity Investments Japan Limited
Fidelity International Investment Advisors (U.K.) Limited
General Distributor
Fidelity Distributors Corporation
Boston, MA
Transfer and Service Agents
Fidelity Investments Institutional
Operations Company, Inc.
Boston, MA
Fidelity Service Company, Inc.
Boston, MA
Custodian
Citibank, N.A.
New York, NY
ASCVI-UANN-0905
1.803743.100
(Fidelity Investment logo)(registered trademark)
Corporate Headquarters
82 Devonshire St., Boston, MA 02109
www.fidelity.com
Item 2. Code of Ethics
As of the end of the period, July 31, 2005, Fidelity Securities Fund (the trust) has adopted a code of ethics, as defined in Item 2 of Form N-CSR, that applies to its President and Treasurer and its Chief Financial Officer. A copy of the code of ethics is filed as an exhibit to this Form N-CSR.
Item 3. Audit Committee Financial Expert
The Board of Trustees of the trust has determined that Marie L. Knowles is an audit committee financial expert, as defined in Item 3 of Form N-CSR. Ms. Knowles is independent for purposes of Item 3 of Form N-CSR.
Item 4. Principal Accountant Fees and Services
(a) Audit Fees.
For the fiscal years ended July 31, 2005 and July 31, 2004, the aggregate Audit Fees billed by PricewaterhouseCoopers LLP (PwC) for professional services rendered for the audits of the financial statements, or services that are normally provided in connection with statutory and regulatory filings or engagements for those fiscal years, for Fidelity Blue Chip Value Fund, Fidelity Dividend Growth Fund, Fidelity Growth & Income Portfolio, Fidelity International Real Estate Fund, Fidelity Leveraged Company Stock Fund, Fidelity Small Cap Growth Fund and Fidelity Small Cap Value Fund (the funds) and for all funds in the Fidelity Group of Funds are shown in the table below.
Fund | 2005A,B,C,D | 2004A |
Fidelity Blue Chip Value Fund | $28,000 | $28,000 |
Fidelity Dividend Growth Fund | $102,000 | $86,000 |
Fidelity Growth & Income Portfolio | $162,000 | $151,000 |
Fidelity International Real Estate Fund | $35,000 | $0 |
Fidelity Leveraged Company Stock Fund | $45,000 | $43,000 |
Fidelity Small Cap Growth Fund | $27,000 | $0 |
Fidelity Small Cap Value Fund | $27,000 | $0 |
All funds in the Fidelity Group of Funds audited by PwC | $11,600,000 | $10,600,000 |
A | Aggregate amounts may reflect rounding. |
B | Fidelity International Real Estate Fund commenced operations on September 8, 2004. |
C | Fidelity Small Cap Growth Fund commenced operations on November 3, 2004. |
D | Fidelity Small Cap Value Fund commenced operations on November 3, 2004. |
For the fiscal years ended July 31, 2005 and July 31, 2004, the aggregate Audit Fees billed by Deloitte & Touche LLP, the member firms of Deloitte Touche Tohmatsu, and their respective affiliates (collectively, "Deloitte Entities") for professional services rendered for the audits of the financial statements, or services that are normally provided in connection with statutory and regulatory filings or engagements for those fiscal years, for Fidelity Blue Chip Growth Fund, Fidelity OTC Portfolio and Fidelity Real Estate Income Fund (the funds) and for all funds in the Fidelity Group of Funds are shown in the table below.
Fund | 2005A | 2004A |
Fidelity Blue Chip Growth Fund | $69,000 | $65,000 |
Fidelity OTC Portfolio | $52,000 | $50,000 |
Fidelity Real Estate Income Fund | $70,000 | $34,000 |
All funds in the Fidelity Group of Funds audited by Deloitte Entities | $4,800,000 | $4,200,000 |
A | Aggregate amounts may reflect rounding. |
(b) Audit-Related Fees.
In each of the fiscal years ended July 31, 2005 and July 31, 2004, the aggregate Audit-Related Fees billed by PwC for services rendered for assurance and related services to each fund that are reasonably related to the performance of the audit or review of the fund's financial statements, but not reported as Audit Fees, are shown in the table below.
Fund | 2005A,B,C,D | 2004 A |
Fidelity Blue Chip Value Fund | $0 | $0 |
Fidelity Dividend Growth Fund | $0 | $0 |
Fidelity Growth & Income Portfolio | $0 | $0 |
Fidelity International Real Estate Fund | $0 | $0 |
Fidelity Leveraged Company Stock Fund | $0 | $0 |
Fidelity Small Cap Growth Fund | $0 | $0 |
Fidelity Small Cap Value Fund | $0 | $0 |
A | Aggregate amounts may reflect rounding. |
B | Fidelity International Real Estate Fund commenced operations on September 8, 2004. |
C | Fidelity Small Cap Growth Fund commenced operations on November 3, 2004. |
D | Fidelity Small Cap Value Fund commenced operations on November 3, 2004. |
In each of the fiscal years ended July 31, 2005 and July 31, 2004, the aggregate Audit-Related Fees billed by Deloitte Entities for services rendered for assurance and related services to each fund that are reasonably related to the performance of the audit or review of the fund's financial statements, but not reported as Audit Fees, are shown in the table below.
Fund | 2005A | 2004 A |
Fidelity Blue Chip Growth Fund | $0 | $0 |
Fidelity OTC Portfolio | $0 | $0 |
Fidelity Real Estate Income Fund | $0 | $0 |
A | Aggregate amounts may reflect rounding. |
In each of the fiscal years ended July 31, 2005 and July 31, 2004, the aggregate Audit-Related Fees that were billed by PwC and Deloitte Entities that were required to be approved by the Audit Committee for services rendered on behalf of Fidelity Management & Research Company (FMR) and entities controlling, controlled by, or under common control with FMR (not including any sub-adviser whose role is primarily portfolio management and is subcontracted with or overseen by another investment adviser) that provide ongoing services to the funds ("Fund Service Providers") for assurance and related services that relate directly to the operations and financial reporting of each fund that are reasonably related to the performance of the audit or review of the fund's financial statements, but not reported as Audit Fees, are shown in the table below.
Billed By | 2005 A | 2004A |
PwC | $0 | $50,000 |
Deloitte Entities | $0 | $0 |
A | Aggregate amounts may reflect rounding. |
Fees included in the audit-related category comprise assurance and related services (e.g., due diligence services) that are traditionally performed by the independent registered public accounting firm. These audit-related services include due diligence related to mergers and acquisitions, accounting consultations and audits in connection with acquisitions, internal control reviews, attest services that are not required by statute or regulation and consultation concerning financial accounting and reporting standards.
(c) Tax Fees.
In each of the fiscal years ended July 31, 2005 and July 31, 2004, the aggregate Tax Fees billed by PwC for professional services rendered for tax compliance, tax advice, and tax planning for each fund is shown in the table below.
Fund | 2005A,B,C,D | 2004A |
Fidelity Blue Chip Value Fund | $2,500 | $2,300 |
Fidelity Dividend Growth Fund | $2,500 | $2,300 |
Fidelity Growth & Income Portfolio | $4,200 | $3,900 |
Fidelity International Real Estate Fund | $2,400 | $0 |
Fidelity Leveraged Company Stock Fund | $2,500 | $2,300 |
Fidelity Small Cap Growth Fund | $2,400 | $0 |
Fidelity Small Cap Value Fund | $2,400 | $0 |
A | Aggregate amounts may reflect rounding. |
B | Fidelity International Real Estate Fund commenced operations on September 8, 2004. |
C | Fidelity Small Cap Growth Fund commenced operations on November 3, 2004. |
D | Fidelity Small Cap Value Fund commenced operations on November 3, 2004. |
In each of the fiscal years ended July 31, 2005 and July 31, 2004, the aggregate Tax Fees billed by Deloitte Entities for professional services rendered for tax compliance, tax advice, and tax planning for each fund is shown in the table below.
Fund | 2005A | 2004A |
Fidelity Blue Chip Growth Fund | $4,500 | $4,400 |
Fidelity OTC Portfolio | $4,500 | $4,400 |
Fidelity Real Estate Income Fund | $3,200 | $3,200 |
A | Aggregate amounts may reflect rounding. |
In each of the fiscal years ended July 31, 2005 and July 31, 2004, the aggregate Tax Fees billed by PwC and Deloitte Entities that were required to be approved by the Audit Committee for professional services rendered on behalf of the Fund Service Providers for tax compliance, tax advice, and tax planning that relate directly to the operations and financial reporting of each fund is shown in the table below.
Billed By | 2005A | 2004A |
PwC | $0 | $0 |
Deloitte Entities | $0 | $0 |
A | Aggregate amounts may reflect rounding. |
Fees included in the Tax Fees category comprise all services performed by professional staff in the independent registered public accounting firm's tax division except those services related to the audit. Typically, this category would include fees for tax compliance, tax planning, and tax advice. Tax compliance, tax advice, and tax planning services include preparation of original and amended tax returns, claims for refund and tax payment-planning services, assistance with tax audits and appeals, tax advice related to mergers and acquisitions and requests for rulings or technical advice from taxing authorities.
(d) All Other Fees.
In each of the fiscal years ended July 31, 2005 and July 31, 2004, the aggregate Other Fees billed by PwC for all other non-audit services rendered to the funds is shown in the table below.
Fund | 2005A,B,C,D | 2004A |
Fidelity Blue Chip Value Fund | $1,400 | $1,200 |
Fidelity Dividend Growth Fund | $17,700 | $16,200 |
Fidelity Growth & Income Portfolio | $28,800 | $26,400 |
Fidelity International Real Estate Fund | $1,100 | $0 |
Fidelity Leveraged Company Stock Fund | $3,200 | $2,200 |
Fidelity Small Cap Growth Fund | $1,000 | $0 |
Fidelity Small Cap Value Fund | $1,100 | $0 |
A | Aggregate amounts may reflect rounding. |
B | Fidelity International Real Estate Fund commenced operations on September 8, 2004. |
C | Fidelity Small Cap Growth Fund commenced operations on November 3, 2004. |
D | Fidelity Small Cap Value Fund commenced operations on November 3, 2004. |
In each of the fiscal years ended July 31, 2005 and July 31, 2004, the aggregate Other Fees billed by Deloitte Entities for all other non-audit services rendered to the funds is shown in the table below.
Fund | 2005A | 2004A |
Fidelity Blue Chip Growth Fund | $0 | $0 |
Fidelity OTC Portfolio | $0 | $0 |
Fidelity Real Estate Income Fund | $0 | $0 |
A | Aggregate amounts may reflect rounding. |
In each of the fiscal years ended July 31, 2005 and July 31, 2004, the aggregate Other Fees billed by PwC and Deloitte Entities that were required to be approved by the Audit Committee for all other non-audit services rendered on behalf of the Fund Service Providers that relate directly to the operations and financial reporting of each fund is shown in the table below.
Billed By | 2005A | 2004A |
PwC | $280,000 | $280,000 |
Deloitte Entities | $210,000 | $790,000 |
A | Aggregate amounts may reflect rounding. |
Fees included in the All Other Fees category include services related to internal control reviews, strategy and other consulting, financial information systems design and implementation, consulting on other information systems, and other tax services unrelated to the fund.
(e) (1) | Audit Committee Pre-Approval Policies and Procedures: |
The trust's Audit Committee must pre-approve all audit and non-audit services provided by the independent registered public accounting firm relating to the operations or financial reporting of the funds. Prior to the commencement of any audit or non-audit services to a fund, the Audit Committee reviews the services to determine whether they are appropriate and permissible under applicable law.
The trust's Audit Committee has adopted policies and procedures to, among other purposes, provide a framework for the Committee's consideration of non-audit services by the audit firms that audit the Fidelity funds. The policies and procedures require that any non-audit service provided by a fund audit firm to a Fidelity Fund and any non-audit service provided by a fund auditor to a Fund Service Provider that relates directly to the operations and financial reporting of a Fidelity fund (Covered Service) are subject to approval by the Audit Committee before such service is provided. Non-audit services provided by a fund audit firm for a Fund Service Provider that do not relate directly to the operations and financial reporting of a Fidelity fund (Non-Covered Service) but that are expected to exceed $50,000 are also subject to pre-approval by the Audit Committee.
All Covered Services, as well as Non-Covered Services that are expected to exceed $50,000, must be approved in advance of provision of the service either: (i) by formal resolution of the Audit Committee, or (ii) by oral or written approval of the service by the Chair of the Audit Committee (or if the Chair is unavailable, such other member of the Audit Committee as may be designated by the Chair to act in the Chair's absence). The approval contemplated by (ii) above is permitted where the Treasurer determines that action on such an engagement is necessary before the next meeting of the Audit Committee. Neither pre-approval nor advance notice of Non-Covered Service engagements for which fees are not expected to exceed $50,000 is required; such engagements are to be reported to the Audit Committee monthly.
(e) (2) | Services approved pursuant to paragraph (c)(7)(i)(C) of Rule 2-01 of Regulation S-X: |
Audit-Related Fees:
There were no amounts that were approved by the Audit Committee pursuant to the de minimis exception for the fiscal years ended July 31, 2005 and July 31, 2004 on behalf of each fund.
There were no amounts that were required to be approved by the Audit Committee pursuant to the de minimis exception for the fiscal years ended July 31, 2005 and July 31, 2004 on behalf of the Fund Service Providers that relate directly to the operations and financial reporting of each fund.
Tax Fees:
There were no amounts that were approved by the Audit Committee pursuant to the de minimis exception for the fiscal years ended July 31, 2005 and July 31, 2004 on behalf of each fund.
There were no amounts that were required to be approved by the Audit Committee pursuant to the de minimis exception for the fiscal years ended July 31, 2005 and July 31, 2004 on behalf of the Fund Service Providers that relate directly to the operations and financial reporting of each fund.
All Other Fees:
There were no amounts that were approved by the Audit Committee pursuant to the de minimis exception for the fiscal years ended July 31, 2005 and July 31, 2004 on behalf of each fund.
There were no amounts that were required to be approved by the Audit Committee pursuant to the de minimis exception for the fiscal years ended July 31, 2005 and July 31, 2004 on behalf of the Fund Service Providers that relate directly to the operations and financial reporting of each fund.
(f) According to PwC for the fiscal year ended July 31, 2005, the percentage of hours spent on the audit of each fund's financial statements for the most recent fiscal year that were attributed to work performed by persons who are not full-time, permanent employees of PwC is as follows:
Fund | 2005 |
Fidelity Blue Chip Value Fund | 0% |
Fidelity Dividend Growth Fund | 0% |
Fidelity Growth & Income Portfolio | 0% |
Fidelity International Real Estate Fund | 0% |
Fidelity Leveraged Company Stock Fund | 0% |
Fidelity Small Cap Growth Fund | 0% |
Fidelity Small Cap Value Fund | 0% |
According to Deloitte Entities for the fiscal year ended July 31, 2005, the percentage of hours spent on the audit of each fund's financial statements for the most recent fiscal year that were attributed to work performed by persons who are not full-time, permanent employees of Deloitte Entities is as follows:
Fund | 2005 |
Fidelity Blue Chip Growth Fund | 0% |
Fidelity OTC Portfolio | 0% |
Fidelity Real Estate Income Fund | 0% |
(g) For the fiscal years ended July 31, 2005 and July 31, 2004, the aggregate fees billed by PwC of $3,650,000A and $1,900,000A for non-audit services rendered on behalf of the funds, FMR (not including any sub-adviser whose role is primarily portfolio management and is subcontracted with or overseen by another investment adviser) and Fund Service Providers relating to Covered Services and Non-Covered Services are shown in the table below.
| 2005A | 2004A |
Covered Services | $400,000 | $400,000 |
Non-Covered Services | $3,250,000 | $1,500,000 |
A | Aggregate amounts may reflect rounding. |
For the fiscal years ended July 31, 2005 and July 31, 2004, the aggregate fees billed by Deloitte Entities of $650,000A and $2,000,000A for non-audit services rendered on behalf of the fund, FMR (not including any sub-adviser whose role is primarily portfolio management and is subcontracted with or overseen by another investment adviser) and Fund Service Providers relating to Covered Services and Non-Covered Services are shown in the table below.
| 2005A | 2004A |
Covered Services | $250,000 | $800,000 |
Non-Covered Services | $400,000 | $1,200,000 |
A | Aggregate amounts may reflect rounding. |
(h) The trust's Audit Committee has considered Non-Covered Services that were not pre-approved that were provided by PwC and Deloitte Entities to Fund Service Providers to be compatible with maintaining the independence of PwC and Deloitte Entities in their audit of the funds, taking into account representations from PwC and Deloitte Entities, in accordance with Independence Standards Board Standard No.1, regarding their independence from the funds and their related entities.
Item 5. Audit Committee of Listed Registrants
Not applicable.
Item 6. Schedule of Investments
Not applicable.
Item 7. Disclosure of Proxy Voting Policies and Procedures for Closed-End Management Investment Companies
Not applicable.
Item 8. Portfolio Managers of Closed-End Management Investment Companies
Not applicable.
Item 9. Purchase of Equity Securities by Closed-End Management Investment Company and Affiliated Purchasers
Not applicable.
Item 10. Submission of Matters to a Vote of Security Holders
There were no material changes to the procedures by which shareholders may recommend nominees to the trust's Board of Trustees.
Item 11. Controls and Procedures
(a)(i) The President and Treasurer and the Chief Financial Officer have concluded that the trust's disclosure controls and procedures (as defined in Rule 30a-3(c) under the Investment Company Act) provide reasonable assurances that material information relating to the trust is made known to them by the appropriate persons, based on their evaluation of these controls and procedures as of a date within 90 days of the filing date of this report.
(a)(ii) There was no change in the trust's internal control over financial reporting (as defined in Rule 30a-3(d) under the Investment Company Act) that occurred during the second fiscal quarter of the period covered by this report that has materially affected, or is reasonably likely to materially affect, the trust's internal control over financial reporting.
Item 12. Exhibits
(a) | (1) | Code of Ethics pursuant to Item 2 of Form N-CSR is filed and attached hereto as EX-99.CODE ETH. |
(a) | (2) | Certification pursuant to Rule 30a-2(a) under the Investment Company Act of 1940 (17 CFR 270.30a-2(a)) is filed and attached hereto as Exhibit 99.CERT. |
(a) | (3) | Not applicable. |
(b) | | Certification pursuant to Rule 30a-2(b) under the Investment Company Act of 1940 (17 CFR 270.30a-2(b)) is furnished and attached hereto as Exhibit 99.906CERT. |
SIGNATURES
Pursuant to the requirements of the Securities Exchange Act of 1934 and the Investment Company Act of 1940, the registrant has duly caused this report to be signed on its behalf by the undersigned, thereunto duly authorized.
Fidelity Securities Fund
By: | /s/Christine Reynolds |
| Christine Reynolds |
| President and Treasurer |
| |
Date: | September 21, 2005 |
Pursuant to the requirements of the Securities Exchange Act of 1934 and the Investment Company Act of 1940, this report has been signed below by the following persons on behalf of the registrant and in the capacities and on the dates indicated.
By: | /s/Christine Reynolds |
| Christine Reynolds |
| President and Treasurer |
| |
Date: | September 21, 2005 |
By: | /s/Timothy F. Hayes |
| Timothy F. Hayes |
| Chief Financial Officer |
| |
Date: | September 21, 2005 |