UNITED STATES
SECURITIES AND EXCHANGE COMMISSION
Washington, D.C. 20549
FORM N-CSR
CERTIFIED SHAREHOLDER REPORT OF REGISTERED
MANAGEMENT INVESTMENT COMPANIES
Investment Company Act file number 811-4118
Fidelity Securities Fund
(Exact name of registrant as specified in charter)
82 Devonshire St., Boston, Massachusetts 02109
(Address of principal executive offices) (Zip code)
Eric D. Roiter, Secretary
82 Devonshire St.
Boston, Massachusetts 02109
(Name and address of agent for service)
Registrant's telephone number, including area code: 617-563-7000
Date of fiscal year end: | November 30 |
| |
Date of reporting period: | November 30, 2004 |
Item 1. Reports to Stockholders
Fidelity® Advisor
Aggressive Growth
Fund - Class A, Class T, Class B
and Class C
Annual Report
November 30, 2004
(2_fidelity_logos) (Registered_Trademark)
Contents
Chairman's Message | <Click Here> | Ned Johnson's message to shareholders. |
Performance | <Click Here> | How the fund has done over time. |
Management's Discussion | <Click Here> | The manager's review of fund performance, strategy and outlook. |
Shareholder Expense Example | <Click Here> | An example of shareholder expenses. |
Investment Changes | <Click Here> | A summary of major shifts in the fund's investments over the past six months. |
Investments | <Click Here> | A complete list of the fund's investments with their market values. |
Financial Statements | <Click Here> | Statements of assets and liabilities, operations, and changes in net assets,
as well as financial highlights. |
Notes | <Click Here> | Notes to the financial statements. |
Report of Independent Registered Public Accounting Firm | <Click Here> | |
Trustees and Officers | <Click Here> | |
Proxy Voting Results | <Click Here> | |
To view a fund's proxy voting guidelines and proxy voting record for the 12-month period ended June 30, visit www.fidelity.com/proxyvotingresults or visit the Securities and Exchange Commission's (SEC) web site at www.sec.gov. You may also call 1-877-208-0098 to request a free copy of the proxy voting guidelines.
Standard & Poor's, S&P and S&P 500 are registered service marks of The McGraw-Hill Companies, Inc. and have been licensed for use by Fidelity Distributors Corporation.
Other third party marks appearing herein are the property of their respective owners.
All other marks appearing herein are registered or unregistered trademarks or service marks of FMR Corp. or an affiliated company.
(Recycle graphic) This report is printed on recycled paper using soy-based inks.
Annual Report
This report and the financial statements contained herein are submitted for the general information of the shareholders of the fund. This report is not authorized for distribution to prospective investors in the fund unless preceded or accompanied by an effective prospectus.
A fund files its complete schedule of portfolio holdings with the SEC for the first and third quarters of each fiscal year on Form N-Q. Forms N-Q are available on the SEC's web site at http://www.sec.gov. A fund's Forms N-Q may be reviewed and copied at the SEC's Public Reference Room in Washington, DC. Information regarding the operation of the SEC's Public Reference Room may be obtained by calling 1-800-SEC-0330. For a complete list of a fund's portfolio holdings, view the most recent quarterly holdings report, semiannual report, or annual report on Fidelity's web site at http://www.advisor.fidelity.com.
NOT FDIC INSURED ·MAY LOSE VALUE ·NO BANK GUARANTEE
Neither the fund nor Fidelity Distributors Corporation is a bank.
Annual Report
Chairman's Message
(photo_of_Edward_C_Johnson_3d)
Dear Shareholder:
During the past year or so, much has been reported about the mutual fund industry, and much of it has been more critical than I believe is warranted. Allegations that some companies have been less than forthright with their shareholders have cast a shadow on the entire industry. I continue to find these reports disturbing, and assert that they do not create an accurate picture of the industry overall. Therefore, I would like to remind everyone where Fidelity stands on these issues. I will say two things specifically regarding allegations that some mutual fund companies were in violation of the Securities and Exchange Commission's forward pricing rules or were involved in so-called "market timing" activities.
First, Fidelity has no agreements that permit customers who buy fund shares after 4 p.m. to obtain the 4 p.m. price. This is not a new policy. This is not to say that someone could not deceive the company through fraudulent acts. However, we are extremely diligent in preventing fraud from occurring in this manner - and in every other. But I underscore again that Fidelity has no so-called "agreements" that sanction illegal practices.
Second, Fidelity continues to stand on record, as we have for years, in opposition to predatory short-term trading that adversely affects shareholders in a mutual fund. Back in the 1980s, we initiated a fee - which is returned to the fund and, therefore, to investors - - to discourage this activity. Further, we took the lead several years ago in developing a Fair Value Pricing Policy to prevent market timing on foreign securities in our funds. I am confident we will find other ways to make it more difficult for predatory traders to operate. However, this will only be achieved through close cooperation among regulators, legislators and the industry.
Yes, there have been unfortunate instances of unethical and illegal activity within the mutual fund industry from time to time. That is true of any industry. When this occurs, confessed or convicted offenders should be dealt with appropriately. But we are still concerned about the risk of over-regulation and the quick application of simplistic solutions to intricate problems. Every system can be improved, and we support and applaud well thought out improvements by regulators, legislators and industry representatives that achieve the common goal of building and protecting the value of investors' holdings.
For nearly 60 years, Fidelity has worked very hard to improve its products and service to justify your trust. When our family founded this company in 1946, we had only a few hundred customers. Today, we serve more than 18 million customers including individual investors and participants in retirement plans across America.
Let me close by saying that we do not take your trust in us for granted, and we realize that we must always work to improve all aspects of our service to you. In turn, we urge you to continue your active participation with your financial matters, so that your interests can be well served.
Best regards,
/s/Edward C. Johnson 3d
Edward C. Johnson 3d
Annual Report
Performance: The Bottom Line
Average annual total return reflects the change in the value of an investment, assuming reinvestment of the class' dividend income and capital gains (the profits earned upon the sale of securities that have grown in value) and assuming a constant rate of performance each year. The $10,000 table and the fund's returns do not reflect the deduction of taxes that a shareholder would pay on fund distributions or the redemption of fund shares. During periods of reimbursement by Fidelity, a fund's total return will be greater than it would be had the reimbursement not occurred. How a fund did yesterday is no guarantee of how it will do tomorrow. Returns may reflect the conversion of Class B shares to Class A shares after a maximum of seven years.
Average Annual Total Returns
Periods ended November 30, 2004 | | | Past 1
year | Life of
fundA |
Class A (incl. 5.75% sales charge) | | | 1.18% | -5.00% |
Class T (incl. 3.50% sales charge) | | | 3.42% | -4.70% |
Class B (incl. contingent deferred sales charge)B | | | 1.63% | -4.78% |
Class C (incl. contingent deferred sales charge)C | | | 5.62% | -4.27% |
A From November 13, 2000.
B Class B shares' contingent deferred sales charges included in the past one year and life of fund total return figures are 5% and 2%, respectively.
C Class C shares' contingent deferred sales charges included in the past one year and life of fund total return figures are 1% and 0%, respectively.
Annual Report
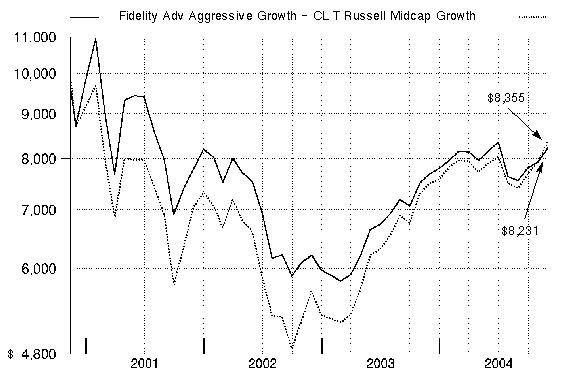
$10,000 Over Life of Fund
Let's say hypothetically that $10,000 was invested in Fidelity® Advisor Aggressive Growth Fund - Class T on November 13, 2000, when the fund started, and the current 3.50% sales charge was paid. The chart shows how the value of your investment would have changed, and also shows how the Russell Midcap® Growth Index performed over the same period.
Annual Report
Management's Discussion of Fund Performance
Comments from Rajiv Kaul, Portfolio Manager of Fidelity® Advisor Aggressive Growth Fund
Despite surging oil prices, a struggling job market and four interest rate hikes in a five-month span, U.S. equity markets posted solid returns for the 12-month period ending November 30, 2004, and were closing in on a second straight year in the black. There was great disparity in the market during the past year. For instance, value stocks trounced their growth counterparts during the period. To illustrate, the Russell 1000® Value Index shot up 19.67%, while the Russell 1000 Growth Index rose only 5.83%. Meanwhile, small- and mid-cap stocks vastly outperformed larger-cap stocks. Energy was the best-performing sector of the market, propelled by a spike in oil prices. Conversely, technology stocks dipped lower in response to a slowdown in corporate capital spending. For the 12-month period overall, the Standard & Poor's 500SM Index returned 12.86% - slightly above its historical average. Elsewhere, the Dow Jones Industrial AverageSM rose 8.87% and the tech-heavy NASDAQ Composite® Index advanced 7.50%.
For the 12 months ending November 30, 2004, the fund's Class A, Class T, Class B and Class C shares returned 7.36%, 7.17%, 6.63% and 6.62%, respectively, which fell short of the 11.40% return of the Russell Midcap® Growth Index and the 12.52% gain of the LipperSM Mid-Cap Funds Average. The last month or so of the period saw significant underperformance in the pharmaceuticals and biotechnology group, where the fund carried a large overweighting. ImClone Systems was the biggest detractor compared with the index and also hurt on an absolute basis. The stock had a huge run-up from March through the end of June but was subsequently hit with profit taking. Millennium Pharmaceuticals also struggled, as the stock experienced volatility even as the company continued to narrow its losses. On the positive side, Irish drug stock Elan was by far the fund's best performer both in absolute terms and relative to the index. The stock was boosted by the Food and Drug Administration's approval of Tysabri, the company's drug for multiple sclerosis. Internet portal Yahoo! also turned in a strong performance, as the company's paid-search business got a boost from its acquisition of Overture Services.
The views expressed in this statement reflect those of the portfolio manager only through the end of the period of the report as stated on the cover and do not necessarily represent the views of Fidelity or any other person in the Fidelity organization. Any such views are subject to change at any time based upon market or other conditions and Fidelity disclaims any responsibility to update such views. These views may not be relied on as investment advice and, because investment decisions for a Fidelity fund are based on numerous factors, may not be relied on as an indication of trading intent on behalf of any Fidelity fund.
Annual Report
Shareholder Expense Example
As a shareholder of the Fund, you incur two types of costs: (1) transaction costs, including sales charges (loads) on purchase payments or redemption proceeds, and (2) ongoing costs, including management fees, distribution and/or service (12b-1) fees and other Fund expenses. This Example is intended to help you understand your ongoing costs (in dollars) of investing in the Fund and to compare these costs with the ongoing costs of investing in other mutual funds.
The Example is based on an investment of $1,000 invested at the beginning of the period and held for the entire period (June 1, 2004 to November 30, 2004).
Actual Expenses
The first line of the table below for each class of the Fund provides information about actual account values and actual expenses. You may use the information in this line, together with the amount you invested, to estimate the expenses that you paid over the period. Simply divide your account value by $1,000.00 (for example, an $8,600 account value divided by $1,000.00 = 8.6), then multiply the result by the number in the first line for a class of the Fund under the heading entitled "Expenses Paid During Period" to estimate the expenses you paid on your account during this period.
Hypothetical Example for Comparison Purposes
The second line of the table below for each class of the Fund provides information about hypothetical account values and hypothetical expenses based on a Class' actual expense ratio and an assumed rate of return of 5% per year before expenses, which is not the Class' actual return. The hypothetical account values and expenses may not be used to estimate the actual ending account balance or expenses you paid for the period. You may use this information to compare the ongoing costs of investing in the Fund and other funds. To do so, compare this 5% hypothetical example with the 5% hypothetical examples that appear in the shareholder reports of the other funds.
Please note that the expenses shown in the table are meant to highlight your ongoing costs only and do not reflect any transaction costs. Therefore, the second line of the table is useful in comparing ongoing costs only, and will not help you determine the relative total costs of owning different funds. In addition, if these transactional costs were included, your costs would have been higher.
Annual Report
| Beginning
Account Value
June 1, 2004 | Ending
Account Value
November 30, 2004 | Expenses Paid
During Period*
June 1, 2004
to November 30, 2004 |
Class A | | | |
Actual | $ 1,000.00 | $ 1,010.60 | $ 7.54** |
HypotheticalA | $ 1,000.00 | $ 1,017.41 | $ 7.59** |
Class T | | | |
Actual | $ 1,000.00 | $ 1,009.50 | $ 8.79** |
HypotheticalA | $ 1,000.00 | $ 1,016.14 | $ 8.86** |
Class B | | | |
Actual | $ 1,000.00 | $ 1,007.20 | $ 11.29** |
HypotheticalA | $ 1,000.00 | $ 1,013.61 | $ 11.39** |
Class C | | | |
Actual | $ 1,000.00 | $ 1,007.20 | $ 11.29** |
HypotheticalA | $ 1,000.00 | $ 1,013.61 | $ 11.39** |
Institutional Class | | | |
Actual | $ 1,000.00 | $ 1,012.80 | $ 6.29** |
HypotheticalA | $ 1,000.00 | $ 1,018.67 | $ 6.33** |
A 5% return per year before expenses
*Expenses are equal to each Class' annualized expense ratio (shown in the table below); multiplied by the average account value over the period, multiplied by 183/366 (to reflect the one-half year period).
| Annualized
Expense Ratio |
Class A | 1.50%** |
Class T | 1.75%** |
Class B | 2.25%** |
Class C | 2.25%** |
Institutional Class | 1.25%** |
**If changes to voluntary expense limitations effective February 1, 2005 had been in effect during the period, the annualized expense ratio and the expenses paid in the actual and hypothetical examples above would have been as follows:
| Annualized
Expense Ratio | Expenses
Paid |
Class A | 1.30% | |
Actual | | $ 6.53** |
HypotheticalA | | $ 6.58** |
Class T | 1.55% | |
Actual | | $ 7.79** |
HypotheticalA | | $ 7.85** |
Class B | 2.05% | |
Actual | | $ 10.29** |
HypotheticalA | | $ 10.38** |
Class C | 2.05% | |
Actual | | $ 10.29** |
HypotheticalA | | $ 10.38** |
Institutional Class | 1.05% | |
Actual | | $ 5.28** |
HypotheticalA | | $ 5.32** |
A 5% return per year before expenses
Annual Report
Investment Changes
Top Ten Stocks as of November 30, 2004 |
| % of fund's
net assets | % of fund's net assets
6 months ago |
Genentech, Inc. | 3.4 | 4.1 |
Biogen Idec, Inc. | 3.3 | 3.3 |
Elan Corp. PLC sponsored ADR | 2.8 | 3.2 |
Juniper Networks, Inc. | 2.3 | 0.2 |
Biomet, Inc. | 2.2 | 1.8 |
Microchip Technology, Inc. | 1.7 | 1.8 |
Millennium Pharmaceuticals, Inc. | 1.2 | 1.3 |
Baker Hughes, Inc. | 1.2 | 0.0 |
Intel Corp. | 1.2 | 0.1 |
QUALCOMM, Inc. | 1.1 | 1.0 |
| 20.4 | |
Top Five Market Sectors as of November 30, 2004 |
| % of fund's
net assets | % of fund's net assets
6 months ago |
Health Care | 32.3 | 35.6 |
Information Technology | 26.4 | 26.4 |
Consumer Discretionary | 15.3 | 17.8 |
Industrials | 8.5 | 6.3 |
Energy | 5.3 | 2.9 |
Asset Allocation (% of fund's net assets) |
As of November 30, 2004 * | As of May 31, 2004 ** |
 | Stocks 97.3% | | | Stocks 97.0% | |
 | Short-Term
Investments and
Net Other Assets 2.7% | | | Short-Term
Investments and
Net Other Assets 3.0% | |
* Foreign
investments | 6.4% | | ** Foreign
investments | 7.1% | |

Annual Report
Investments November 30, 2004
Showing Percentage of Net Assets
Common Stocks - 97.3% |
| Shares | | Value (Note 1) |
CONSUMER DISCRETIONARY - 15.3% |
Auto Components - 0.2% |
Gentex Corp. | 800 | | $ 25,856 |
Johnson Controls, Inc. | 700 | | 42,980 |
| | 68,836 |
Hotels, Restaurants & Leisure - 4.1% |
Brinker International, Inc. (a) | 3,680 | | 125,598 |
California Pizza Kitchen, Inc. (a) | 2,600 | | 65,130 |
Harrah's Entertainment, Inc. | 960 | | 58,944 |
Hilton Hotels Corp. | 6,600 | | 136,356 |
International Game Technology | 710 | | 25,099 |
Krispy Kreme Doughnuts, Inc. (a) | 1,800 | | 18,126 |
Mandalay Resort Group | 800 | | 55,760 |
Marriott International, Inc. Class A | 1,890 | | 107,447 |
Outback Steakhouse, Inc. | 1,700 | | 73,610 |
Penn National Gaming, Inc. (a) | 2,200 | | 116,094 |
Starbucks Corp. (a) | 2,020 | | 113,645 |
Station Casinos, Inc. | 2,100 | | 119,784 |
Sunterra Corp. (a) | 1,500 | | 16,545 |
The Cheesecake Factory, Inc. (a) | 1,480 | | 72,357 |
Wendy's International, Inc. | 4,400 | | 156,948 |
Yum! Brands, Inc. | 8,780 | | 398,612 |
| | 1,660,055 |
Household Durables - 1.9% |
Black & Decker Corp. | 1,910 | | 160,612 |
Fortune Brands, Inc. | 3,800 | | 298,224 |
Harman International Industries, Inc. | 1,720 | | 211,302 |
Mohawk Industries, Inc. (a) | 980 | | 85,946 |
| | 756,084 |
Internet & Catalog Retail - 0.6% |
eBay, Inc. (a) | 2,200 | | 247,390 |
eDiets.com, Inc. (a) | 400 | | 1,400 |
| | 248,790 |
Leisure Equipment & Products - 0.6% |
Brunswick Corp. | 3,400 | | 165,988 |
Mattel, Inc. | 1,960 | | 37,142 |
Polaris Industries, Inc. | 800 | | 52,720 |
| | 255,850 |
Media - 2.4% |
E.W. Scripps Co. Class A | 4,100 | | 191,634 |
Entercom Communications Corp. Class A (a) | 540 | | 19,451 |
Common Stocks - continued |
| Shares | | Value (Note 1) |
CONSUMER DISCRETIONARY - continued |
Media - continued |
Getty Images, Inc. (a) | 1,480 | | $ 86,210 |
Lamar Advertising Co. Class A (a) | 810 | | 31,946 |
NTL, Inc. (a) | 1,582 | | 110,076 |
Pixar (a) | 1,670 | | 151,419 |
Playboy Enterprises, Inc. Class B (non-vtg.) (a) | 200 | | 2,420 |
Radio One, Inc. Class D (non-vtg.) (a) | 1,000 | | 13,950 |
The New York Times Co. Class A | 2,140 | | 87,740 |
Univision Communications, Inc. Class A (a) | 2,700 | | 81,270 |
Westwood One, Inc. (a) | 2,590 | | 58,068 |
XM Satellite Radio Holdings, Inc. Class A (a) | 3,500 | | 129,185 |
| | 963,369 |
Multiline Retail - 0.9% |
99 Cents Only Stores (a) | 500 | | 7,460 |
Big Lots, Inc. (a) | 3,930 | | 45,588 |
Dollar General Corp. | 2,500 | | 49,375 |
Dollar Tree Stores, Inc. (a) | 3,560 | | 99,075 |
Family Dollar Stores, Inc. | 2,450 | | 71,785 |
Nordstrom, Inc. | 2,500 | | 109,375 |
| | 382,658 |
Specialty Retail - 3.9% |
Abercrombie & Fitch Co. Class A | 2,400 | | 109,320 |
AutoZone, Inc. (a) | 690 | | 59,064 |
Bed Bath & Beyond, Inc. (a) | 3,100 | | 123,777 |
Chico's FAS, Inc. (a) | 4,720 | | 182,192 |
Christopher & Banks Corp. | 3,690 | | 72,804 |
Circuit City Stores, Inc. | 1,600 | | 24,944 |
Foot Locker, Inc. | 1,000 | | 25,980 |
Hot Topic, Inc. (a) | 4,155 | | 68,017 |
Jo-Ann Stores, Inc. (a) | 700 | | 19,264 |
Kirkland's, Inc. (a) | 1,200 | | 11,520 |
PETsMART, Inc. | 6,360 | | 217,957 |
Pier 1 Imports, Inc. | 1,100 | | 20,064 |
RadioShack Corp. | 1,300 | | 41,041 |
Ross Stores, Inc. | 10,480 | | 281,912 |
Select Comfort Corp. (a) | 6,890 | | 134,286 |
Weight Watchers International, Inc. (a) | 2,810 | | 111,417 |
Williams-Sonoma, Inc. (a) | 2,170 | | 79,444 |
| | 1,583,003 |
Common Stocks - continued |
| Shares | | Value (Note 1) |
CONSUMER DISCRETIONARY - continued |
Textiles, Apparel & Luxury Goods - 0.7% |
Coach, Inc. (a) | 5,580 | | $ 278,107 |
Kenneth Cole Productions, Inc. Class A (sub. vtg.) | 550 | | 16,236 |
| | 294,343 |
TOTAL CONSUMER DISCRETIONARY | | 6,212,988 |
CONSUMER STAPLES - 2.3% |
Food & Staples Retailing - 0.9% |
CVS Corp. | 6,100 | | 276,757 |
Whole Foods Market, Inc. | 1,310 | | 118,909 |
| | 395,666 |
Food Products - 1.1% |
Bunge Ltd. | 600 | | 31,632 |
Del Monte Foods Co. (a) | 11,890 | | 129,007 |
Hershey Foods Corp. | 3,680 | | 190,624 |
McCormick & Co., Inc. (non-vtg.) | 1,700 | | 61,965 |
Smithfield Foods, Inc. (a) | 700 | | 20,335 |
Wm. Wrigley Jr. Co. | 70 | | 4,816 |
| | 438,379 |
Personal Products - 0.3% |
Estee Lauder Companies, Inc. Class A | 2,900 | | 126,556 |
TOTAL CONSUMER STAPLES | | 960,601 |
ENERGY - 5.3% |
Energy Equipment & Services - 3.9% |
Baker Hughes, Inc. | 10,900 | | 483,197 |
BJ Services Co. | 200 | | 10,134 |
Cooper Cameron Corp. (a) | 3,700 | | 193,103 |
ENSCO International, Inc. | 2,110 | | 66,064 |
Halliburton Co. | 600 | | 24,810 |
Nabors Industries Ltd. (a) | 1,260 | | 65,520 |
Noble Corp. (a) | 1,870 | | 90,602 |
Patterson-UTI Energy, Inc. | 6,640 | | 132,800 |
Smith International, Inc. (a) | 3,530 | | 213,812 |
Weatherford International Ltd. (a) | 5,430 | | 289,853 |
| | 1,569,895 |
Oil & Gas - 1.4% |
EOG Resources, Inc. | 1,400 | | 105,098 |
Pioneer Natural Resources Co. | 5,170 | | 181,984 |
Common Stocks - continued |
| Shares | | Value (Note 1) |
ENERGY - continued |
Oil & Gas - continued |
Teekay Shipping Corp. | 3,640 | | $ 193,866 |
Valero Energy Corp. | 400 | | 18,716 |
XTO Energy, Inc. | 2,100 | | 76,335 |
| | 575,999 |
TOTAL ENERGY | | 2,145,894 |
FINANCIALS - 3.7% |
Capital Markets - 2.1% |
Ameritrade Holding Corp. (a) | 7,880 | | 109,768 |
E*TRADE Financial Corp. (a) | 8,700 | | 120,582 |
Eaton Vance Corp. (non-vtg.) | 3,010 | | 144,330 |
Federated Investors, Inc. Class B (non-vtg.) | 1,580 | | 46,484 |
Goldman Sachs Group, Inc. | 400 | | 41,904 |
Investors Financial Services Corp. | 200 | | 8,768 |
Legg Mason, Inc. | 2,880 | | 196,243 |
SEI Investments Co. | 1,800 | | 70,398 |
T. Rowe Price Group, Inc. | 1,250 | | 73,950 |
Waddell & Reed Financial, Inc. Class A | 2,400 | | 54,480 |
| | 866,907 |
Commercial Banks - 0.6% |
North Fork Bancorp, Inc., New York | 2,100 | | 60,480 |
Sumitomo Mitsui Financial Group, Inc. | 10 | | 69,488 |
Synovus Financial Corp. | 3,640 | | 98,280 |
UnionBanCal Corp. | 300 | | 18,549 |
| | 246,797 |
Real Estate - 0.0% |
Catellus Development Corp. | 77 | | 2,418 |
Thrifts & Mortgage Finance - 1.0% |
Countrywide Financial Corp. | 400 | | 13,284 |
MGIC Investment Corp. | 1,600 | | 108,800 |
New York Community Bancorp, Inc. | 5,073 | | 100,344 |
Radian Group, Inc. | 3,000 | | 153,750 |
The PMI Group, Inc. | 300 | | 12,354 |
| | 388,532 |
TOTAL FINANCIALS | | 1,504,654 |
Common Stocks - continued |
| Shares | | Value (Note 1) |
HEALTH CARE - 32.3% |
Biotechnology - 13.9% |
Alkermes, Inc. (a) | 900 | | $ 12,411 |
Amylin Pharmaceuticals, Inc. (a) | 2,990 | | 60,936 |
Biogen Idec, Inc. (a) | 23,080 | | 1,354,334 |
Celgene Corp. (a) | 5,840 | | 160,133 |
Cephalon, Inc. (a) | 1,440 | | 68,443 |
Charles River Laboratories International, Inc. (a) | 1,720 | | 80,410 |
Dendreon Corp. (a) | 10,700 | | 104,967 |
DOV Pharmaceutical, Inc. (a) | 7,000 | | 129,570 |
Dyax Corp. (a) | 3,700 | | 29,341 |
Enzon Pharmaceuticals, Inc. (a) | 2,500 | | 33,850 |
Genentech, Inc. (a) | 28,740 | | 1,386,699 |
Genzyme Corp. - General Division (a) | 300 | | 16,803 |
Gilead Sciences, Inc. (a) | 600 | | 20,676 |
Harvard Bioscience, Inc. (a) | 2,600 | | 10,322 |
ICOS Corp. (a) | 600 | | 14,490 |
ImClone Systems, Inc. (a) | 7,870 | | 332,271 |
Invitrogen Corp. (a) | 800 | | 48,400 |
Medarex, Inc. (a) | 15,500 | | 168,950 |
MedImmune, Inc. (a) | 8,710 | | 231,686 |
Millennium Pharmaceuticals, Inc. (a) | 39,580 | | 499,500 |
Neurocrine Biosciences, Inc. (a) | 240 | | 11,040 |
ONYX Pharmaceuticals, Inc. (a) | 1,500 | | 46,920 |
Oscient Pharmaceuticals Corp. (a) | 7,642 | | 24,913 |
OSI Pharmaceuticals, Inc. (a) | 400 | | 19,032 |
Pharmion Corp. | 10,300 | | 436,102 |
Protein Design Labs, Inc. (a) | 18,470 | | 334,676 |
Trimeris, Inc. (a) | 1,400 | | 17,374 |
| | 5,654,249 |
Health Care Equipment & Supplies - 6.6% |
Advanced Medical Optics, Inc. (a) | 1,600 | | 66,528 |
Alcon, Inc. | 290 | | 21,611 |
Bausch & Lomb, Inc. | 500 | | 29,440 |
Baxter International, Inc. | 10,330 | | 326,945 |
Beckman Coulter, Inc. | 1,700 | | 111,282 |
Biomet, Inc. | 19,130 | | 915,753 |
C.R. Bard, Inc. | 4,760 | | 285,172 |
Cooper Companies, Inc. | 600 | | 41,718 |
Cyberonics, Inc. (a) | 600 | | 11,142 |
Cytyc Corp. (a) | 3,500 | | 93,940 |
DENTSPLY International, Inc. | 1,650 | | 86,807 |
Common Stocks - continued |
| Shares | | Value (Note 1) |
HEALTH CARE - continued |
Health Care Equipment & Supplies - continued |
Edwards Lifesciences Corp. (a) | 3,300 | | $ 124,113 |
Inverness Medical Innovations, Inc. (a) | 1,200 | | 29,160 |
ResMed, Inc. (a) | 2,600 | | 130,156 |
Waters Corp. (a) | 2,250 | | 104,985 |
Zimmer Holdings, Inc. (a) | 3,510 | | 286,416 |
| | 2,665,168 |
Health Care Providers & Services - 4.6% |
AmerisourceBergen Corp. | 620 | | 36,543 |
Andrx Corp. (a) | 1,400 | | 24,920 |
Anthem, Inc. (a) | 1,000 | | 101,330 |
Cerner Corp. (a) | 800 | | 42,176 |
Computer Programs & Systems, Inc. | 100 | | 2,160 |
Covance, Inc. (a) | 3,100 | | 122,326 |
Coventry Health Care, Inc. (a) | 1,760 | | 87,349 |
DaVita, Inc. (a) | 450 | | 14,949 |
Health Management Associates, Inc. Class A | 4,640 | | 102,498 |
Henry Schein, Inc. (a) | 1,300 | | 84,734 |
Humana, Inc. (a) | 1,400 | | 34,748 |
Laboratory Corp. of America Holdings (a) | 1,400 | | 67,130 |
Lincare Holdings, Inc. (a) | 7,700 | | 297,143 |
Medco Health Solutions, Inc. (a) | 84 | | 3,168 |
Omnicare, Inc. | 700 | | 22,687 |
PacifiCare Health Systems, Inc. (a) | 400 | | 19,360 |
Patterson Companies, Inc. (a) | 1,400 | | 57,204 |
Pharmaceutical Product Development, Inc. (a) | 2,000 | | 84,220 |
Quest Diagnostics, Inc. | 1,000 | | 93,750 |
Renal Care Group, Inc. (a) | 2,100 | | 69,930 |
Triad Hospitals, Inc. (a) | 670 | | 24,582 |
UnitedHealth Group, Inc. | 3,940 | | 326,429 |
Universal Health Services, Inc. Class B | 2,720 | | 123,814 |
WellChoice, Inc. (a) | 900 | | 44,091 |
| | 1,887,241 |
Pharmaceuticals - 7.2% |
aaiPharma, Inc. (a) | 850 | | 2,627 |
Allergan, Inc. | 20 | | 1,470 |
Barr Pharmaceuticals, Inc. (a) | 1,927 | | 75,249 |
Elan Corp. PLC sponsored ADR (a) | 43,220 | | 1,141,008 |
Endo Pharmaceuticals Holdings, Inc. (a) | 3,700 | | 75,776 |
Eon Labs, Inc. (a) | 900 | | 24,264 |
Guilford Pharmaceuticals, Inc. (a) | 9,400 | | 53,016 |
Common Stocks - continued |
| Shares | | Value (Note 1) |
HEALTH CARE - continued |
Pharmaceuticals - continued |
Impax Laboratories, Inc. (a) | 10,800 | | $ 135,216 |
IVAX Corp. (a) | 2,750 | | 42,928 |
MGI Pharma, Inc. (a) | 12,300 | | 331,977 |
NitroMed, Inc. | 7,200 | | 150,480 |
Salix Pharmaceuticals Ltd. (a) | 900 | | 13,635 |
Schering-Plough Corp. | 19,900 | | 355,215 |
Sepracor, Inc. (a) | 10,250 | | 456,228 |
UCB SA | 1,110 | | 57,413 |
Watson Pharmaceuticals, Inc. (a) | 950 | | 27,598 |
| | 2,944,100 |
TOTAL HEALTH CARE | | 13,150,758 |
INDUSTRIALS - 8.5% |
Aerospace & Defense - 1.7% |
EADS NV | 5,180 | | 156,651 |
EDO Corp. | 2,500 | | 76,175 |
Embraer - Empresa Brasileira de Aeronautica SA sponsored ADR | 3,030 | | 84,749 |
KVH Industries, Inc. (a) | 200 | | 2,020 |
Lockheed Martin Corp. | 1,800 | | 109,512 |
Precision Castparts Corp. | 1,500 | | 97,260 |
Rockwell Collins, Inc. | 4,300 | | 171,398 |
| | 697,765 |
Air Freight & Logistics - 0.2% |
Expeditors International of Washington, Inc. | 1,000 | | 53,260 |
Ryder System, Inc. | 500 | | 26,820 |
| | 80,080 |
Airlines - 0.3% |
Southwest Airlines Co. | 8,000 | | 125,840 |
Building Products - 0.7% |
American Standard Companies, Inc. (a) | 6,790 | | 264,403 |
Trex Co., Inc. (a) | 400 | | 18,780 |
| | 283,183 |
Commercial Services & Supplies - 2.5% |
Career Education Corp. (a) | 1,900 | | 73,910 |
ChoicePoint, Inc. (a) | 526 | | 23,065 |
Cintas Corp. | 3,898 | | 174,319 |
Corinthian Colleges, Inc. (a) | 900 | | 15,683 |
Common Stocks - continued |
| Shares | | Value (Note 1) |
INDUSTRIALS - continued |
Commercial Services & Supplies - continued |
Education Management Corp. (a) | 1,438 | | $ 47,655 |
Equifax, Inc. | 2,330 | | 64,355 |
H&R Block, Inc. | 2,390 | | 114,003 |
Herman Miller, Inc. | 2,130 | | 52,319 |
HNI Corp. | 800 | | 33,912 |
Manpower, Inc. | 200 | | 9,674 |
Pitney Bowes, Inc. | 3,050 | | 133,499 |
Robert Half International, Inc. | 10,530 | | 284,626 |
| | 1,027,020 |
Construction & Engineering - 0.3% |
Dycom Industries, Inc. (a) | 1,400 | | 40,796 |
Granite Construction, Inc. | 2,200 | | 58,388 |
MasTec, Inc. (a) | 800 | | 6,712 |
| | 105,896 |
Electrical Equipment - 0.1% |
Rockwell Automation, Inc. | 1,100 | | 52,030 |
Industrial Conglomerates - 0.6% |
3M Co. | 1,090 | | 86,753 |
Tyco International Ltd. | 4,720 | | 160,338 |
| | 247,091 |
Machinery - 0.9% |
AGCO Corp. (a) | 2,030 | | 44,234 |
Astec Industries, Inc. (a) | 2,900 | | 48,256 |
Dover Corp. | 2,100 | | 84,945 |
ITT Industries, Inc. | 1,760 | | 149,811 |
Pall Corp. | 700 | | 18,963 |
SPX Corp. | 500 | | 20,555 |
| | 366,764 |
Road & Rail - 0.5% |
Burlington Northern Santa Fe Corp. | 1,000 | | 45,040 |
CSX Corp. | 1,000 | | 38,130 |
Norfolk Southern Corp. | 2,600 | | 89,258 |
Union Pacific Corp. | 600 | | 38,064 |
| | 210,492 |
Common Stocks - continued |
| Shares | | Value (Note 1) |
INDUSTRIALS - continued |
Trading Companies & Distributors - 0.7% |
Fastenal Co. | 4,020 | | $ 245,863 |
MSC Industrial Direct Co., Inc. Class A | 600 | | 21,372 |
| | 267,235 |
TOTAL INDUSTRIALS | | 3,463,396 |
INFORMATION TECHNOLOGY - 26.4% |
Communications Equipment - 5.6% |
Advanced Fibre Communications, Inc. (a) | 1,100 | | 17,985 |
Andrew Corp. (a) | 2,100 | | 29,820 |
Arris Group, Inc. (a) | 500 | | 2,845 |
AudioCodes Ltd. (a) | 8,160 | | 119,952 |
Avocent Corp. (a) | 1,000 | | 37,930 |
CIENA Corp. (a) | 10,000 | | 25,500 |
Corning, Inc. (a) | 17,470 | | 219,773 |
Enterasys Networks, Inc. (a) | 13,270 | | 23,223 |
Extreme Networks, Inc. (a) | 1,700 | | 11,611 |
Finisar Corp. (a) | 26,500 | | 48,495 |
InterDigital Communication Corp. (a) | 1,200 | | 24,420 |
JDS Uniphase Corp. (a) | 9,500 | | 30,115 |
Juniper Networks, Inc. (a) | 33,600 | | 925,008 |
Motorola, Inc. | 1,040 | | 20,030 |
Polycom, Inc. (a) | 870 | | 19,871 |
Powerwave Technologies, Inc. (a) | 3,900 | | 31,543 |
QUALCOMM, Inc. | 11,120 | | 462,814 |
SafeNet, Inc. (a) | 4,789 | | 170,776 |
Sycamore Networks, Inc. (a) | 3,500 | | 13,125 |
Tellabs, Inc. (a) | 5,100 | | 43,605 |
| | 2,278,441 |
Computers & Peripherals - 2.3% |
Apple Computer, Inc. (a) | 2,800 | | 187,740 |
Dell, Inc. (a) | 600 | | 24,312 |
Diebold, Inc. | 4,110 | | 218,652 |
Electronics for Imaging, Inc. (a) | 1,643 | | 27,487 |
Emulex Corp. (a) | 3,900 | | 55,146 |
Hutchinson Technology, Inc. (a) | 500 | | 16,385 |
Lexmark International, Inc. Class A (a) | 3,620 | | 307,338 |
Maxtor Corp. (a) | 3,500 | | 13,370 |
QLogic Corp. (a) | 600 | | 20,634 |
Common Stocks - continued |
| Shares | | Value (Note 1) |
INFORMATION TECHNOLOGY - continued |
Computers & Peripherals - continued |
Seagate Technology | 1,500 | | $ 22,470 |
Western Digital Corp. (a) | 3,100 | | 30,287 |
| | 923,821 |
Electronic Equipment & Instruments - 1.1% |
Arrow Electronics, Inc. (a) | 1,500 | | 36,795 |
CDW Corp. | 1,200 | | 78,864 |
Celestica, Inc. (sub. vtg.) (a) | 900 | | 13,698 |
Ingram Micro, Inc. Class A (a) | 800 | | 15,392 |
KEMET Corp. (a) | 2,700 | | 23,922 |
Molex, Inc. | 100 | | 2,757 |
Sanmina-SCI Corp. (a) | 3,900 | | 34,437 |
Solectron Corp. (a) | 21,500 | | 134,375 |
Symbol Technologies, Inc. | 7,770 | | 117,793 |
| | 458,033 |
Internet Software & Services - 2.5% |
Ask Jeeves, Inc. (a) | 1,200 | | 31,008 |
Google, Inc. Class A | 1,800 | | 329,400 |
Interwoven, Inc. (a) | 2,319 | | 22,494 |
Lastminute.com PLC (a) | 500 | | 981 |
Retek, Inc. (a) | 2,785 | | 16,989 |
VeriSign, Inc. (a) | 6,100 | | 200,690 |
Vignette Corp. (a) | 18,180 | | 23,089 |
Yahoo!, Inc. (a) | 10,180 | | 382,972 |
| | 1,007,623 |
IT Services - 2.0% |
Anteon International Corp. (a) | 400 | | 14,808 |
BearingPoint, Inc. (a) | 1,600 | | 13,920 |
Computer Sciences Corp. (a) | 400 | | 21,640 |
CSG Systems International, Inc. (a) | 65 | | 1,181 |
DST Systems, Inc. (a) | 1,400 | | 68,250 |
Fiserv, Inc. (a) | 2,970 | | 114,375 |
Infosys Technologies Ltd. sponsored ADR | 4,120 | | 296,310 |
Iron Mountain, Inc. (a) | 1,305 | | 39,320 |
Paychex, Inc. | 640 | | 21,222 |
SunGard Data Systems, Inc. (a) | 7,810 | | 207,043 |
The BISYS Group, Inc. (a) | 1,880 | | 30,099 |
| | 828,168 |
Common Stocks - continued |
| Shares | | Value (Note 1) |
INFORMATION TECHNOLOGY - continued |
Office Electronics - 1.2% |
Xerox Corp. (a) | 1,800 | | $ 27,576 |
Zebra Technologies Corp. Class A (a) | 9,100 | | 457,548 |
| | 485,124 |
Semiconductors & Semiconductor Equipment - 8.1% |
Agere Systems, Inc.: | | | |
Class A (a) | 20,030 | | 27,441 |
Class B (a) | 15,700 | | 21,352 |
Altera Corp. (a) | 10,500 | | 238,140 |
Brooks Automation, Inc. (a) | 4,300 | | 66,005 |
Conexant Systems, Inc. (a) | 17,650 | | 35,124 |
Cree, Inc. (a) | 1,100 | | 39,358 |
DuPont Photomasks, Inc. (a) | 100 | | 2,638 |
Integrated Circuit Systems, Inc. (a) | 5,900 | | 139,476 |
Integrated Device Technology, Inc. (a) | 6,990 | | 79,337 |
Intel Corp. | 21,300 | | 476,055 |
Intersil Corp. Class A | 10,100 | | 162,610 |
KLA-Tencor Corp. (a) | 40 | | 1,802 |
Lam Research Corp. (a) | 5,180 | | 134,732 |
Linear Technology Corp. | 3,600 | | 137,376 |
Maxim Integrated Products, Inc. | 5,600 | | 229,376 |
Microchip Technology, Inc. | 24,270 | | 683,929 |
Micron Technology, Inc. (a) | 2,990 | | 33,129 |
Novellus Systems, Inc. (a) | 3,600 | | 96,984 |
NVIDIA Corp. (a) | 1,441 | | 27,566 |
Photronics, Inc. (a) | 8,200 | | 154,488 |
PMC-Sierra, Inc. (a) | 27,030 | | 298,411 |
Rambus, Inc. (a) | 800 | | 18,488 |
Silicon Laboratories, Inc. (a) | 380 | | 11,453 |
STMicroelectronics NV (NY Shares) | 7,100 | | 142,000 |
Taiwan Semiconductor Manufacturing Co. Ltd. sponsored ADR | 136 | | 1,084 |
United Microelectronics Corp. sponsored ADR | 558 | | 1,953 |
Varian Semiconductor Equipment Associates, Inc. (a) | 1,200 | | 42,624 |
| | 3,302,931 |
Software - 3.6% |
Adobe Systems, Inc. | 5,820 | | 352,459 |
BEA Systems, Inc. (a) | 9,250 | | 74,740 |
BMC Software, Inc. (a) | 1,700 | | 31,586 |
Citrix Systems, Inc. (a) | 4,470 | | 105,537 |
Cognos, Inc. (a) | 500 | | 19,508 |
Concord Communications, Inc. (a) | 100 | | 929 |
Common Stocks - continued |
| Shares | | Value (Note 1) |
INFORMATION TECHNOLOGY - continued |
Software - continued |
E.piphany, Inc. (a) | 3,054 | | $ 13,804 |
FileNET Corp. (a) | 1,898 | | 50,885 |
Jack Henry & Associates, Inc. | 1,290 | | 24,871 |
Macrovision Corp. (a) | 100 | | 2,655 |
Manhattan Associates, Inc. (a) | 304 | | 7,387 |
Mercury Interactive Corp. (a) | 6,100 | | 278,221 |
Parametric Technology Corp. (a) | 12,800 | | 74,880 |
Secure Computing Corp. (a) | 167 | | 1,740 |
Siebel Systems, Inc. (a) | 19,619 | | 197,760 |
VERITAS Software Corp. (a) | 10,800 | | 236,520 |
| | 1,473,482 |
TOTAL INFORMATION TECHNOLOGY | | 10,757,623 |
MATERIALS - 2.7% |
Chemicals - 0.9% |
Dow Chemical Co. | 1,600 | | 80,752 |
Ferro Corp. | 2,500 | | 57,200 |
Great Lakes Chemical Corp. | 1,500 | | 43,950 |
International Flavors & Fragrances, Inc. | 1,200 | | 48,600 |
Praxair, Inc. | 2,700 | | 121,230 |
| | 351,732 |
Construction Materials - 0.1% |
Vulcan Materials Co. | 800 | | 41,480 |
Containers & Packaging - 0.7% |
Owens-Illinois, Inc. (a) | 3,410 | | 71,337 |
Pactiv Corp. (a) | 1,500 | | 37,275 |
Sealed Air Corp. (a) | 3,370 | | 173,252 |
| | 281,864 |
Metals & Mining - 1.0% |
Freeport-McMoRan Copper & Gold, Inc. Class B | 3,050 | | 119,347 |
Massey Energy Co. | 2,800 | | 98,336 |
Metal Management, Inc. (a) | 600 | | 15,768 |
Nucor Corp. | 1,000 | | 52,900 |
Phelps Dodge Corp. | 1,400 | | 135,982 |
| | 422,333 |
TOTAL MATERIALS | | 1,097,409 |
Common Stocks - continued |
| Shares | | Value (Note 1) |
TELECOMMUNICATION SERVICES - 0.8% |
Diversified Telecommunication Services - 0.1% |
Philippine Long Distance Telephone Co. sponsored ADR (a) | 1,000 | | $ 24,520 |
XO Communications, Inc. (a) | 1,600 | | 4,368 |
| | 28,888 |
Wireless Telecommunication Services - 0.7% |
Alamosa Holdings, Inc. (a) | 1,800 | | 19,620 |
America Movil SA de CV sponsored ADR | 600 | | 28,026 |
InPhonic, Inc. | 1,700 | | 43,367 |
KDDI Corp. | 15 | | 74,056 |
NII Holdings, Inc. (a) | 500 | | 21,630 |
USA Mobility, Inc. (a) | 1,400 | | 50,904 |
Wireless Facilities, Inc. (a) | 5,900 | | 48,852 |
| | 286,455 |
TOTAL TELECOMMUNICATION SERVICES | | 315,343 |
TOTAL COMMON STOCKS (Cost $35,302,811) | 39,608,666 |
Money Market Funds - 2.8% |
Fidelity Cash Central Fund, 1.98% (b)
(Cost $1,130,579) | 1,130,579 | | 1,130,579 |
TOTAL INVESTMENT PORTFOLIO - 100.1% (Cost $36,433,390) | | 40,739,245 |
NET OTHER ASSETS - (0.1)% | | (33,066) |
NET ASSETS - 100% | $ 40,706,179 |
Legend |
(a) Non-income producing |
(b) Affiliated fund that is available only to investment companies and other accounts managed by Fidelity Investments. The rate quoted is the annualized seven-day yield of the fund at period end. A complete listing of the fund's holdings as of its most recent fiscal year end is available upon request. |
Income Tax Information |
At November 30, 2004, the fund had a capital loss carryforward of approximately $11,252,000 of which $4,312,000 and $6,940,000 will expire on November 30, 2009 and 2010, respectively. |
See accompanying notes which are an integral part of the financial statements.
Annual Report
Financial Statements
Statement of Assets and Liabilities
November 30, 2004 |
| | |
Assets | | |
Investment in securities, at value (cost $36,433,390) - See accompanying schedule | | $ 40,739,245 |
Receivable for investments sold | | 129,337 |
Receivable for fund shares sold | | 48,746 |
Dividends receivable | | 16,866 |
Interest receivable | | 1,699 |
Prepaid expenses | | 166 |
Receivable from investment adviser for expense reductions | | 6,801 |
Other receivables | | 4,892 |
Total assets | | 40,947,752 |
| | |
Liabilities | | |
Payable for investments purchased | $ 71,860 | |
Payable for fund shares redeemed | 72,600 | |
Accrued management fee | 21,170 | |
Transfer agent fee payable | 19,512 | |
Distribution fees payable | 23,165 | |
Other affiliated payables | 2,750 | |
Other payables and accrued expenses | 30,516 | |
Total liabilities | | 241,573 |
| | |
Net Assets | | $ 40,706,179 |
Net Assets consist of: | | |
Paid in capital | | $ 47,812,848 |
Accumulated undistributed net realized gain (loss) on investments and foreign currency transactions | | (11,412,582) |
Net unrealized appreciation (depreciation) on investments and assets and liabilities in foreign currencies | | 4,305,913 |
Net Assets | | $ 40,706,179 |
See accompanying notes which are an integral part of the financial statements.
Annual Report
Financial Statements - continued
Statement of Assets and Liabilities - continued
November 30, 2004 |
| | |
Calculation of Maximum Offering Price
Class A:
Net Asset Value and redemption price per share
($6,227,314 ÷ 723,113 shares) | | $ 8.61 |
| | |
Maximum offering price per share (100/94.25 of $8.61) | | $ 9.14 |
Class T:
Net Asset Value and redemption price per share
($15,101,116 ÷ 1,772,461 shares) | | $ 8.52 |
| | |
Maximum offering price per share (100/96.50 of $8.52) | | $ 8.83 |
Class B:
Net Asset Value and offering price per share
($9,593,481 ÷ 1,147,730 shares)A | | $ 8.36 |
| | |
Class C:
Net Asset Value and offering price per share
($9,135,812 ÷ 1,091,273 shares)A | | $ 8.37 |
| | |
Institutional Class:
Net Asset Value, offering price and redemption price per share ($648,456 ÷ 74,311 shares) | | $ 8.73 |
A Redemption price per share is equal to net asset value less any applicable contingent deferred sales charge.
See accompanying notes which are an integral part of the financial statements.
Annual Report
Statement of Operations
Year ended November 30, 2004 |
| | |
Investment Income | | |
Dividends | | $ 148,396 |
Interest | | 10,824 |
Security lending | | 1,490 |
Total income | | 160,710 |
| | |
Expenses | | |
Management fee | $ 236,989 | |
Transfer agent fees | 236,776 | |
Distribution fees | 263,312 | |
Accounting and security lending fees | 35,416 | |
Non-interested trustees' compensation | 198 | |
Custodian fees and expenses | 17,165 | |
Registration fees | 54,121 | |
Audit | 34,872 | |
Legal | 1,814 | |
Miscellaneous | 8,871 | |
Total expenses before reductions | 889,534 | |
Expense reductions | (169,206) | 720,328 |
Net investment income (loss) | | (559,618) |
Realized and Unrealized Gain (Loss) Net realized gain (loss) on: | | |
Investment securities | 3,515,901 | |
Foreign currency transactions | 145 | |
Total net realized gain (loss) | | 3,516,046 |
Change in net unrealized appreciation (depreciation) on: Investment securities | (473,602) | |
Assets and liabilities in foreign currencies | 49 | |
Total change in net unrealized appreciation (depreciation) | | (473,553) |
Net gain (loss) | | 3,042,493 |
Net increase (decrease) in net assets resulting from operations | | $ 2,482,875 |
See accompanying notes which are an integral part of the financial statements.
Annual Report
Financial Statements - continued
Statement of Changes in Net Assets
| Year ended
November 30,
2004 | Year ended
November 30,
2003 |
Increase (Decrease) in Net Assets | | |
Operations | | |
Net investment income (loss) | $ (559,618) | $ (374,848) |
Net realized gain (loss) | 3,516,046 | 2,514,920 |
Change in net unrealized appreciation (depreciation) | (473,553) | 4,055,009 |
Net increase (decrease) in net assets resulting
from operations | 2,482,875 | 6,195,081 |
Share transactions - net increase (decrease) | 4,161,402 | 1,324,213 |
Total increase (decrease) in net assets | 6,644,277 | 7,519,294 |
| | |
Net Assets | | |
Beginning of period | 34,061,902 | 26,542,608 |
End of period | $ 40,706,179 | $ 34,061,902 |
See accompanying notes which are an integral part of the financial statements.
Annual Report
Financial Highlights - Class A
Years ended November 30, | 2004 | 2003 | 2002 | 2001 | 2000F |
Selected Per-Share Data | | | | | |
Net asset value, beginning of period | $ 8.02 | $ 6.47 | $ 8.08 | $ 9.05 | $ 10.00 |
Income from Investment Operations | | | | | |
Net investment income (loss)E | (.09) | (.06) | (.08) | (.01) | -H |
Net realized and unrealized gain (loss) | .68 | 1.61 | (1.53) | (.95) | (.95) |
Total from investment operations | .59 | 1.55 | (1.61) | (.96) | (.95) |
Distributions from net realized gain | - | - | - | (.01) | - |
Net asset value, end of period | $ 8.61 | $ 8.02 | $ 6.47 | $ 8.08 | $ 9.05 |
Total ReturnB,C,D | 7.36% | 23.96% | (19.93)% | (10.62)% | (9.50)% |
Ratios to Average Net AssetsG | | | | | |
Expenses before expense reductions | 1.90% | 2.25% | 2.05% | 2.06% | 31.94%A |
Expenses net of voluntary waivers, if any | 1.50% | 1.54% | 1.69% | 1.75% | 1.75%A |
Expenses net of all reductions | 1.45% | 1.47% | 1.49% | 1.71% | 1.75%A |
Net investment income (loss) | (1.03)% | (.89)% | (1.07)% | (.14)% | .99%A |
Supplemental Data | | | | | |
Net assets, end of period (000 omitted) | $ 6,227 | $ 4,177 | $ 2,620 | $ 3,320 | $ 1,789 |
Portfolio turnover rate | 94% | 158% | 473% | 481% | 139%A |
A Annualized
B Total returns for periods of less than one year are not annualized.
C Total returns would have been lower had certain expenses not been reduced during the periods shown.
D Total returns do not include the effect of the sales charges.
E Calculated based on average shares outstanding during the period.
F For the period November 13, 2000 (commencement of operations) to November 30, 2000.
G Expense ratios reflect operating expenses of the class. Expenses before reductions do not reflect amounts reimbursed by the investment adviser or reductions from brokerage service arrangements or other expense offset arrangements and do not represent the amount paid by the class during periods when reimbursements or reductions occur. Expense ratios before reductions for start-up periods may not be representative of longer-term operating periods. Expenses net of any voluntary waivers reflect expenses after reimbursement by the investment adviser but prior to reductions from brokerage service arrangements or other expense offset arrangements. Expenses net of all reductions represent the net expenses paid by the class.
H Amount represents less than $.01 per share.
See accompanying notes which are an integral part of the financial statements.
Annual Report
Financial Highlights - Class T
Years ended November 30, | 2004 | 2003 | 2002 | 2001 | 2000F |
Selected Per-Share Data | | | | | |
Net asset value, beginning of period | $ 7.95 | $ 6.43 | $ 8.06 | $ 9.05 | $ 10.00 |
Income from Investment Operations | | | | | |
Net investment income (loss)E | (.11) | (.08) | (.10) | (.03) | -H |
Net realized and unrealized gain (loss) | .68 | 1.60 | (1.53) | (.95) | (.95) |
Total from investment operations | .57 | 1.52 | (1.63) | (.98) | (.95) |
Distributions from net realized gain | - | - | - | (.01) | - |
Net asset value, end of period | $ 8.52 | $ 7.95 | $ 6.43 | $ 8.06 | $ 9.05 |
Total ReturnB,C,D | 7.17% | 23.64% | (20.22)% | (10.84)% | (9.50)% |
Ratios to Average Net AssetsG | | | | | |
Expenses before expense reductions | 2.25% | 2.47% | 2.16% | 2.30% | 32.36%A |
Expenses net of voluntary waivers, if any | 1.75% | 1.79% | 1.92% | 2.00% | 2.00%A |
Expenses net of all reductions | 1.71% | 1.72% | 1.72% | 1.96% | 2.00%A |
Net investment income (loss) | (1.28)% | (1.14)% | (1.29)% | (.39)% | .74%A |
Supplemental Data | | | | | |
Net assets, end of period (000 omitted) | $ 15,101 | $ 12,458 | $ 10,511 | $ 14,165 | $ 2,767 |
Portfolio turnover rate | 94% | 158% | 473% | 481% | 139%A |
A Annualized
B Total returns for periods of less than one year are not annualized.
C Total returns would have been lower had certain expenses not been reduced during the periods shown.
D Total returns do not include the effect of the sales charges.
E Calculated based on average shares outstanding during the period.
F For the period November 13, 2000 (commencement of operations) to November 30, 2000.
G Expense ratios reflect operating expenses of the class. Expenses before reductions do not reflect amounts reimbursed by the investment adviser or reductions from brokerage service arrangements or other expense offset arrangements and do not represent the amount paid by the class during periods when reimbursements or reductions occur. Expense ratios before reductions for start-up periods may not be representative of longer-term operating periods. Expenses net of any voluntary waivers reflect expenses after reimbursement by the investment adviser but prior to reductions from brokerage service arrangements or other expense offset arrangements. Expenses net of all reductions represent the net expenses paid by the class.
H Amount represents less than $.01 per share.
See accompanying notes which are an integral part of the financial statements.
Annual Report
Financial Highlights - Class B
Years ended November 30, | 2004 | 2003 | 2002 | 2001 | 2000F |
Selected Per-Share Data | | | | | |
Net asset value, beginning of period | $ 7.84 | $ 6.37 | $ 8.02 | $ 9.05 | $ 10.00 |
Income from Investment Operations | | | | | |
Net investment income (loss)E | (.14) | (.11) | (.13) | (.08) | -H |
Net realized and unrealized gain (loss) | .66 | 1.58 | (1.52) | (.94) | (.95) |
Total from investment operations | .52 | 1.47 | (1.65) | (1.02) | (.95) |
Distributions from net realized gain | - | - | - | (.01) | - |
Net asset value, end of period | $ 8.36 | $ 7.84 | $ 6.37 | $ 8.02 | $ 9.05 |
Total ReturnB,C,D | 6.63% | 23.08% | (20.57)% | (11.29)% | (9.50)% |
Ratios to Average Net AssetsG | | | | | |
Expenses before expense reductions | 2.67% | 2.92% | 2.73% | 2.86% | 32.87%A |
Expenses net of voluntary waivers, if any | 2.25% | 2.25% | 2.43% | 2.50% | 2.50%A |
Expenses net of all reductions | 2.21% | 2.18% | 2.23% | 2.46% | 2.50%A |
Net investment income (loss) | (1.78)% | (1.60)% | (1.81)% | (.89)% | .24%A |
Supplemental Data | | | | | |
Net assets, end of period (000 omitted) | $ 9,593 | $ 8,422 | $ 6,262 | $ 8,038 | $ 1,659 |
Portfolio turnover rate | 94% | 158% | 473% | 481% | 139%A |
A Annualized
B Total returns for periods of less than one year are not annualized.
C Total returns would have been lower had certain expenses not been reduced during the periods shown.
D Total returns do not include the effect of the contingent deferred sales charge.
E Calculated based on average shares outstanding during the period.
F For the period November 13, 2000 (commencement of operations) to November 30, 2000.
G Expense ratios reflect operating expenses of the class. Expenses before reductions do not reflect amounts reimbursed by the investment adviser or reductions from brokerage service arrangements or other expense offset arrangements and do not represent the amount paid by the class during periods when reimbursements or reductions occur. Expense ratios before reductions for start-up periods may not be representative of longer-term operating periods. Expenses net of any voluntary waivers reflect expenses after reimbursement by the investment adviser but prior to reductions from brokerage service arrangements or other expense offset arrangements. Expenses net of all reductions represent the net expenses paid by the class.
H Amount represents less than $.01 per share.
See accompanying notes which are an integral part of the financial statements.
Annual Report
Financial Highlights - Class C
Years ended November 30, | 2004 | 2003 | 2002 | 2001 | 2000F |
Selected Per-Share Data | | | | | |
Net asset value, beginning of period | $ 7.85 | $ 6.38 | $ 8.03 | $ 9.05 | $ 10.00 |
Income from Investment Operations | | | | | |
Net investment income (loss)E | (.14) | (.11) | (.13) | (.08) | -H |
Net realized and unrealized gain (loss) | .66 | 1.58 | (1.52) | (.93) | (.95) |
Total from investment operations | .52 | 1.47 | (1.65) | (1.01) | (.95) |
Distributions from net realized gain | - | - | - | (.01) | - |
Net asset value, end of period | $ 8.37 | $ 7.85 | $ 6.38 | $ 8.03 | $ 9.05 |
Total ReturnB,C,D | 6.62% | 23.04% | (20.55)% | (11.18)% | (9.50)% |
Ratios to Average Net AssetsG | | | | | |
Expenses before expense reductions | 2.52% | 2.77% | 2.58% | 2.79% | 32.69%A |
Expenses net of voluntary waivers, if any | 2.25% | 2.25% | 2.36% | 2.50% | 2.50%A |
Expenses net of all reductions | 2.21% | 2.18% | 2.16% | 2.46% | 2.50%A |
Net investment income (loss) | (1.78)% | (1.61)% | (1.74)% | (.89)% | .24%A |
Supplemental Data | | | | | |
Net assets, end of period (000 omitted) | $ 9,136 | $ 8,427 | $ 6,636 | $ 8,532 | $ 1,224 |
Portfolio turnover rate | 94% | 158% | 473% | 481% | 139%A |
A Annualized
B Total returns for periods of less than one year are not annualized.
C Total returns would have been lower had certain expenses not been reduced during the periods shown.
D Total returns do not include the effect of the contingent deferred sales charge.
E Calculated based on average shares outstanding during the period.
F For the period November 13, 2000 (commencement of operations) to November 30, 2000.
G Expense ratios reflect operating expenses of the class. Expenses before reductions do not reflect amounts reimbursed by the investment adviser or reductions from brokerage service arrangements or other expense offset arrangements and do not represent the amount paid by the class during periods when reimbursements or reductions occur. Expense ratios before reductions for start-up periods may not be representative of longer-term operating periods. Expenses net of any voluntary waivers reflect expenses after reimbursement by the investment adviser but prior to reductions from brokerage service arrangements or other expense offset arrangements. Expenses net of all reductions represent the net expenses paid by the class.
H Amount represents less than $.01 per share.
See accompanying notes which are an integral part of the financial statements.
Annual Report
Financial Highlights - Institutional Class
Years ended November 30, | 2004 | 2003 | 2002 | 2001 | 2000E |
Selected Per-Share Data | | | | | |
Net asset value, beginning of period | $ 8.10 | $ 6.52 | $ 8.11 | $ 9.06 | $ 10.00 |
Income from Investment Operations | | | | | |
Net investment income (loss)D | (.07) | (.04) | (.05) | .01 | .01 |
Net realized and unrealized gain (loss) | .70 | 1.62 | (1.54) | (.95) | (.95) |
Total from investment operations | .63 | 1.58 | (1.59) | (.94) | (.94) |
Distributions from net realized gain | - | - | - | (.01) | - |
Net asset value, end of period | $ 8.73 | $ 8.10 | $ 6.52 | $ 8.11 | $ 9.06 |
Total ReturnB,C | 7.78% | 24.23% | (19.61)% | (10.39)% | (9.40)% |
Ratios to Average Net AssetsF | | | | | |
Expenses before expense reductions | 1.35% | 1.61% | 1.43% | 1.73% | 31.51%A |
Expenses net of voluntary waivers, if any | 1.25% | 1.25% | 1.27% | 1.50% | 1.50%A |
Expenses net of all reductions | 1.20% | 1.18% | 1.07% | 1.46% | 1.50%A |
Net investment income (loss) | (.78)% | (.61)% | (.64)% | .11% | 1.24%A |
Supplemental Data | | | | | |
Net assets, end of period (000 omitted) | $ 648 | $ 579 | $ 513 | $ 761 | $ 325 |
Portfolio turnover rate | 94% | 158% | 473% | 481% | 139%A |
A Annualized
B Total returns for periods of less than one year are not annualized.
C Total returns would have been lower had certain expenses not been reduced during the periods shown.
D Calculated based on average shares outstanding during the period.
E For the period November 13, 2000 (commencement of operations) to November 30, 2000.
F Expense ratios reflect operating expenses of the class. Expenses before reductions do not reflect amounts reimbursed by the investment adviser or reductions from brokerage service arrangements or other expense offset arrangements and do not represent the amount paid by the class during periods when reimbursements or reductions occur. Expense ratios before reductions for start-up periods may not be representative of longer-term operating periods. Expenses net of any voluntary waivers reflect expenses after reimbursement by the investment adviser but prior to reductions from brokerage service arrangements or other expense offset arrangements. Expenses net of all reductions represent the net expenses paid by the class.
See accompanying notes which are an integral part of the financial statements.
Annual Report
Notes to Financial Statements
For the period ended November 30, 2004
1. Significant Accounting Policies.
Fidelity Advisor Aggressive Growth Fund (the fund) is a fund of Fidelity Securities Fund (the trust) and is authorized to issue an unlimited number of shares. The trust is registered under the Investment Company Act of 1940, as amended (the 1940 Act), as an open-end management investment company organized as a Massachusetts business trust.
The fund offers Class A, Class T, Class B, Class C and Institutional Class shares, each of which has equal rights as to assets and voting privileges. Each class has exclusive voting rights with respect to matters that affect that class. Class B shares will automatically convert to Class A shares after a holding period of seven years from the initial date of purchase. Investment income, realized and unrealized capital gains and losses, the common expenses of the fund, and certain fund-level expense reductions, if any, are allocated on a pro rata basis to each class based on the relative net assets of each class to the total net assets of the fund. Each class differs with respect to transfer agent and distribution and service plan fees incurred. Certain expense reductions also differ by class.
The financial statements have been prepared in conformity with accounting principles generally accepted in the United States of America, which require management to make certain estimates and assumptions at the date of the financial statements. The following summarizes the significant accounting policies of the fund:
Security Valuation. Net asset value per share (NAV calculation) is calculated as of the close of business of the New York Stock Exchange, normally 4:00 p.m. Eastern time. Equity securities, including restricted securities, for which market quotations are available are valued at the last sale price or official closing price (closing bid price or last evaluated quote if no sale has occurred) on the primary market or exchange on which they trade. If prices are not readily available or do not accurately reflect fair value for a security, or if a security's value has been materially affected by events occurring after the close of the exchange or market on which the security is principally traded, that security may be valued by another method that the Board of Trustees believes accurately reflects fair value. A security's valuation may differ depending on the method used for determining value. Price movements in futures contracts and ADRs, market and trading trends, the bid/ask quotes of brokers and off-exchange institutional trading may be reviewed in the course of making a good faith determination of a security's fair value. Short-term securities with remaining maturities of sixty days or less for which quotations are not readily available are valued on the basis of amortized cost. Investments in open-end investment companies are valued at their net asset value each business day.
Annual Report
Notes to Financial Statements - continued
1. Significant Accounting Policies - continued
Foreign Currency. The fund uses foreign currency contracts to facilitate transactions in foreign-denominated securities. Losses from these transactions may arise from changes in the value of the foreign currency or if the counterparties do not perform under the contracts' terms.
Foreign-denominated assets, including investment securities, and liabilities are translated into U.S. dollars at the exchange rate at period end. Purchases and sales of investment securities, income and dividends received and expenses denominated in foreign currencies are translated into U.S. dollars at the exchange rate in effect on the transaction date.
The effects of exchange rate fluctuations on investments are included with the net realized and unrealized gain (loss) on investment securities. Other foreign currency transactions resulting in realized and unrealized gain (loss) are disclosed separately.
Investment Transactions and Income. Security transactions are accounted for as of trade date. Gains and losses on securities sold are determined on the basis of identified cost and may include proceeds received from litigation. Dividend income is recorded on the ex-dividend date, except for certain dividends from foreign securities where the ex-dividend date may have passed, which are recorded as soon as the fund is informed of the ex-dividend date. Non-cash dividends included in dividend income, if any, are recorded at the fair market value of the securities received. Distributions received on securities that represent a return of capital or capital gain are recorded as a reduction of cost of investments and/or as a realized gain. The fund estimates the components of distributions received that may be considered return of capital distributions or capital gain distributions. Interest income is accrued as earned. Interest income includes coupon interest and amortization of premium and accretion of discount on debt securities. Investment income is recorded net of foreign taxes withheld where recovery of such taxes is uncertain.
Expenses. Most expenses of the trust can be directly attributed to a fund. Expenses which cannot be directly attributed are apportioned among the funds in the trust.
Income Tax Information and Distributions to Shareholders. Each year, the fund intends to qualify as a regulated investment company by distributing all of its taxable income and realized gains under Subchapter M of the Internal Revenue Code. As a result, no provision for income taxes is required in the accompanying financial statements. Foreign taxes are provided for based on the fund's understanding of the tax rules and rates that exist in the foreign markets in which it invests.
Annual Report
1. Significant Accounting Policies - continued
Income Tax Information and Distributions to Shareholders - continued
Distributions are recorded on the ex-dividend date. Income dividends and capital gain distributions are declared separately for each class. Income and capital gain distributions are determined in accordance with income tax regulations, which may differ from generally accepted accounting principles. Capital accounts within the financial statements are adjusted for permanent book-tax differences. These adjustments have no impact on net assets or the results of operations. Temporary book-tax differences will reverse in a subsequent period.
Book-tax differences are primarily due to foreign currency transactions, net operating losses, capital loss carryforwards and losses deferred due to wash sales.
The tax-basis components of distributable earnings and the federal tax cost as of period end were as follows:
Unrealized appreciation | $ 6,709,458 | |
Unrealized depreciation | (2,564,356) | |
Net unrealized appreciation (depreciation) | 4,145,102 | |
Capital loss carryforward | (11,251,773) | |
| | |
Cost for federal income tax purposes | $ 36,594,143 | |
2. Operating Policies.
Repurchase Agreements. Fidelity Management & Research Company (FMR) has received an Exemptive Order from the Securities and Exchange Commission (the SEC) which permits the fund and other affiliated entities of FMR to transfer uninvested cash balances into joint trading accounts. These accounts are then invested in repurchase agreements that are collateralized by U.S. Treasury or Government obligations. The fund may also invest directly with institutions, in repurchase agreements that are collateralized by commercial paper obligations and corporate obligations. Collateral is held in segregated accounts with custodian banks and may be obtained in the event of a default of the counterparty. Collateral is marked-to-market daily and maintained at a value at least equal to the principal amount of the repurchase agreement (including accrued interest).
3. Purchases and Sales of Investments.
Purchases and sales of securities, other than short-term securities and U.S. government securities, aggregated $38,658,445 and $34,956,184, respectively.
Annual Report
Notes to Financial Statements - continued
4. Fees and Other Transactions with Affiliates.
Management Fee. FMR and its affiliates provide the fund with investment management related services for which the fund pays a monthly management fee. The management fee is the sum of an individual fund fee rate that is based on an annual rate of .35% of the fund's average net assets and a group fee rate that averaged .28% during the period. The group fee rate is based upon the average net assets of all the mutual funds advised by FMR. The group fee rate decreases as assets under management increase and increases as assets under management decrease. For the period, the total annual management fee rate was .63% of the fund's average net assets.
Distribution and Service Plan. In accordance with Rule 12b-1 of the 1940 Act, the fund has adopted separate Distribution and Service Plans for each class of shares. Certain classes pay Fidelity Distributors Corporation (FDC), an affiliate of FMR, separate Distribution and Service Fees, each of which is based on an annual percentage of each class' average net assets. In addition, FDC may pay financial intermediaries for selling shares of the fund and providing shareholder support services. For the period, the Distribution and Service Fee rates and the total amounts paid to and retained by FDC were as follows:
| Distribution
Fee | Service
Fee | Paid to
FDC | Retained
by FDC |
Class A | 0% | .25% | $ 13,408 | $ 85 |
Class T | .25% | .25% | 69,244 | - |
Class B | .75% | .25% | 90,272 | 67,703 |
Class C | .75% | .25% | 90,388 | 17,563 |
| | | $ 263,312 | $ 85,351 |
Sales Load. FDC receives a front-end sales charge of up to 5.75% for selling Class A shares, and 3.50% for selling Class T shares, some of which is paid to financial intermediaries for selling shares of the fund. FDC receives the proceeds of contingent deferred sales charges levied on Class A, Class T, Class B, and Class C redemptions. These charges depend on the holding period. The deferred sales charges range from 5% to 1% for Class B, 1% for Class C, and .25% for certain purchases of Class A and Class T shares.
For the period, sales charge amounts retained by FDC were as follows:
| Retained
by FDC |
Class A | $ 16,284 |
Class T | 12,714 |
Class B* | 45,970 |
Class C* | 2,682 |
| $ 77,650 |
* When Class B and Class C shares are initially sold, FDC pays commissions from its own resources to financial intermediaries through which the sales are made.
Annual Report
4. Fees and Other Transactions with Affiliates - continued
Transfer Agent Fees. Fidelity Investments Institutional Operations Company, Inc. (FIIOC), an affiliate of FMR, is the transfer, dividend disbursing and shareholder servicing agent for each class of the fund. FIIOC receives account fees and asset-based fees that vary according to the account size and type of account of the shareholders of the respective classes of the fund. FIIOC pays for typesetting, printing and mailing of shareholder reports, except proxy statements. For the period, the total transfer agent fees paid by each class to FIIOC were as follows:
| Amount | % of
Average
Net Assets |
Class A | $ 33,387 | .62 |
Class T | 99,338 | .72 |
Class B | 57,498 | .64 |
Class C | 44,539 | .49 |
Institutional Class | 2,014 | .32 |
| $ 236,776 | |
Accounting Fees. Fidelity Service Company, Inc. (FSC), an affiliate of FMR, maintains the fund's accounting records. The fee is based on the level of average net assets for the month.
Central Funds. The fund may invest in affiliated Central Funds managed by Fidelity Investments Money Management, Inc. (FIMM), an affiliate of FMR. The Central Funds are open-end investment companies available only to investment companies and other accounts managed by FMR and its affiliates. The Central Funds seek preservation of capital and current income and do not pay a management fee. Income distributions earned by the fund are recorded as income in the accompanying financial statements and totaled $11,404 for the period.
Brokerage Commissions. The fund placed a portion of its portfolio transactions with brokerage firms which are affiliates of the investment adviser. The commissions paid to these affiliated firms were $4,028 for the period.
5. Committed Line of Credit.
The fund participates with other funds managed by FMR in a $4.2 billion credit facility (the "line of credit") to be utilized for temporary or emergency purposes to fund shareholder redemptions or for other short-term liquidity purposes. The fund has agreed to pay commitment fees on its pro rata portion of the line of credit. During the period, there were no borrowings on this line of credit.
Annual Report
Notes to Financial Statements - continued
6. Security Lending.
The fund lends portfolio securities from time to time in order to earn additional income. The fund receives collateral (in the form of U.S. Treasury obligations, letters of credit and/or cash) against the loaned securities and maintains collateral in an amount not less than 100% of the market value of the loaned securities during the period of the loan. The market value of the loaned securities is determined at the close of business of the fund and any additional required collateral is delivered to the fund on the next business day. If the borrower defaults on its obligation to return the securities loaned because of insolvency or other reasons, a fund could experience delays and costs in recovering the securities loaned or in gaining access to the collateral. Cash collateral is invested in cash equivalents. At period end there were no security loans outstanding.
7. Expense Reductions.
FMR voluntarily agreed to reimburse each class to the extent annual operating expenses exceeded certain levels of average net assets as noted in the table below. Some expenses, for example interest expense, are excluded from this reimbursement.
| Expense
Limitations | Reimbursement
from adviser |
Class A | 1.50% | $ 21,629 |
Class T | 1.75% | 68,762 |
Class B | 2.25% | 37,379 |
Class C | 2.25% | 24,471 |
Institutional Class | 1.25% | 653 |
| | $ 152,894 |
Many of the brokers with whom FMR places trades on behalf of the fund provided services to the fund in addition to trade execution. These services included payments of certain expenses on behalf of the fund totaling $16,312 for the period.
Annual Report
8. Share Transactions.
Transactions for each class of shares were as follows:
| Shares | Dollars |
Years ended November 30, | 2004 | 2003 | 2004 | 2003 |
Class A | | | | |
Shares sold | 377,272 | 244,577 | $ 3,139,679 | $ 1,722,170 |
Shares redeemed | (175,236) | (128,450) | (1,453,350) | (880,316) |
Net increase (decrease) | 202,036 | 116,127 | $ 1,686,329 | $ 841,854 |
Class T | | | | |
Shares sold | 758,262 | 442,489 | $ 6,209,847 | $ 3,023,259 |
Shares redeemed | (552,792) | (509,774) | (4,525,646) | (3,391,934) |
Net increase (decrease) | 205,470 | (67,285) | $ 1,684,201 | $ (368,675) |
Class B | | | | |
Shares sold | 359,634 | 340,312 | $ 2,916,093 | $ 2,312,985 |
Shares redeemed | (286,300) | (249,139) | (2,305,579) | (1,653,902) |
Net increase (decrease) | 73,334 | 91,173 | $ 610,514 | $ 659,083 |
Class C | | | | |
Shares sold | 368,284 | 327,135 | $ 2,975,514 | $ 2,159,687 |
Shares redeemed | (350,351) | (293,843) | (2,819,767) | (1,926,688) |
Net increase (decrease) | 17,933 | 33,292 | $ 155,747 | $ 232,999 |
Institutional Class | | | | |
Shares sold | 22,481 | 11,899 | $ 187,161 | $ 86,133 |
Shares redeemed | (19,658) | (19,157) | (162,550) | (127,181) |
Net increase (decrease) | 2,823 | (7,258) | $ 24,611 | $ (41,048) |
Annual Report
Report of Independent Registered Public Accounting Firm
To the Trustees of Fidelity Securities Fund and the Shareholders of Fidelity Advisor Aggressive Growth Fund:
In our opinion, the accompanying statement of assets and liabilities, including the schedule of investments, and the related statements of operations and of changes in net assets and the financial highlights present fairly, in all material respects, the financial position of Fidelity Advisor Aggressive Growth Fund (a fund of Fidelity Securities Fund) at November 30, 2004 and the results of its operations, the changes in its net assets and the financial highlights for the periods indicated, in conformity with accounting principles generally accepted in the United States of America. These financial statements and financial highlights (hereafter referred to as "financial statements") are the responsibility of the Fidelity Advisor Aggressive Growth Fund's management; our responsibility is to express an opinion on these financial statements based on our audits. We conducted our audits of these financial statements in accordance with the standards of the Public Company Accounting Oversight Board (United States). Those standards require that we plan and perform the audit to obtain reasonable assurance about whether the financial statements are free of material misstatement. An audit includes examining, on a test basis, evidence supporting the amounts and disclosures in the financial statements, assessing the accounting principles used and significant estimates made by management, and evaluating the overall financial statement presentation. We believe that our audits, which included confirmation of securities at November 30, 2004 by correspondence with the custodian and brokers, provide a reasonable basis for our opinion.
/s/PricewaterhouseCoopers LLP
PricewaterhouseCoopers LLP
Boston, Massachusetts
January 11, 2005
Annual Report
Trustees and Officers
The Trustees, Member of the Advisory Board, and executive officers of the trust and fund, as applicable, are listed below. The Board of Trustees governs the fund and is responsible for protecting the interests of shareholders. The Trustees are experienced executives who meet periodically throughout the year to oversee the fund's activities, review contractual arrangements with companies that provide services to the fund, and review the fund's performance. Except for William O. McCoy, Dennis J. Dirks, and Kenneth L. Wolfe, each of the Trustees oversees 301 funds advised by FMR or an affiliate. Mr. McCoy oversees 303 funds advised by FMR or an affiliate. Mr. Dirks and Mr. Wolfe oversee 223 funds advised by FMR or an affiliate.
The Trustees hold office without limit in time except that (a) any Trustee may resign; (b) any Trustee may be removed by written instrument, signed by at least two-thirds of the number of Trustees prior to such removal; (c) any Trustee who requests to be retired or who has become incapacitated by illness or injury may be retired by written instrument signed by a majority of the other Trustees; and (d) any Trustee may be removed at any special meeting of shareholders by a two-thirds vote of the outstanding voting securities of the trust. In any event, each non-interested Trustee shall retire not later than the last day of the calendar year in which his or her 72nd birthday occurs. The executive officers and Advisory Board Member hold office without limit in time, except that any officer and Advisory Board Member may resign or may be removed by a vote of a majority of the Trustees at any regular meeting or any special meeting of the Trustees. Except as indicated, each individual has held the office shown or other offices in the same company for the past five years.
The fund's Statement of Additional Information (SAI) includes more information about the Trustees. To request a free copy, call Fidelity at 1-877-208-0098.
Interested Trustees*:
Correspondence intended for each Trustee who is an "interested person" (as defined in the 1940 Act) may be sent to Fidelity Investments, 82 Devonshire Street, Boston, Massachusetts 02109.
Name, Age; Principal Occupation |
Edward C. Johnson 3d (74)** |
| Year of Election or Appointment: 1984 Mr. Johnson is Chairman of the Board of Trustees. Mr. Johnson serves as Chief Executive Officer, Chairman, and a Director of FMR Corp.; a Director and Chairman of the Board and of the Executive Committee of FMR; Chairman and a Director of Fidelity Management & Research (Far East) Inc.; Chairman (1998) and a Director of Fidelity Investments Money Management, Inc.; and Chairman (2001) and a Director (2000) of FMR Co., Inc. |
Abigail P. Johnson (42)** |
| Year of Election or Appointment: 2001 Senior Vice President of Advisor Aggressive Growth (2001). Ms. Johnson also serves as Senior Vice President of other Fidelity funds (2001). She is President and a Director of FMR (2001), Fidelity Investments Money Management, Inc. (2001), FMR Co., Inc. (2001), and a Director of FMR Corp. Previously, Ms. Johnson managed a number of Fidelity funds. |
Laura B. Cronin (50) |
| Year of Election or Appointment: 2003 Ms. Cronin is an Executive Vice President (2002) and Chief Financial Officer (2002) of FMR Corp. and is a member of the Fidelity Management Committee (2003). Previously, Ms. Cronin served as Vice President of Finance of FMR (1997-1999), and Chief Financial Officer of FMR (1999-2001), Fidelity Personal Investments (2001), and Fidelity Brokerage Company (2001-2002). |
Robert L. Reynolds (52) |
| Year of Election or Appointment: 2003 Mr. Reynolds is a Director (2003) and Chief Operating Officer (2002) of FMR Corp. and is the head of the Fidelity Management Committee (2003). He also serves on the Board at Fidelity Investments Canada, Ltd. (2000). Previously, Mr. Reynolds served as President of Fidelity Investments Institutional Retirement Group (1996-2000). |
* Trustees have been determined to be "Interested Trustees" by virtue of, among other things, their affiliation with the trust or various entities under common control with FMR.
** Edward C. Johnson 3d, Trustee, is Abigail P. Johnson's father.
Annual Report
Non-Interested Trustees:
Correspondence intended for each non-interested Trustee (that is, the Trustees other than the Interested Trustees) may be sent to Fidelity Investments, P.O. Box 55235, Boston, Massachusetts 02205-5235.
Name, Age; Principal Occupation |
Dennis J. Dirks (56) |
| Year of Election or Appointment: 2005 Mr. Dirks also serves as a Trustee (2005) or Member of the Advisory Board (2004) of other investment companies advised by FMR. Prior to his retirement in May 2003, Mr. Dirks was Chief Operating Officer and a member of the Board of The Depository Trust & Clearing Corporation (DTCC) (1999-2003). He also served as President, Chief Operating Officer, and Board member of The Depository Trust Company (DTC) (1999-2003) and President and Board member of the National Securities Clearing Corporation (NSCC) (1999-2003). In addition, Mr. Dirks served as Chief Executive Officer and Board member of the Government Securities Clearing Corporation (2001-2003) and Chief Executive Officer and Board member of the Mortgage-Backed Securities Clearing Corporation (2001-2003). |
Robert M. Gates (61) |
| Year of Election or Appointment: 1997 Dr. Gates is Vice Chairman of non-interested Trustees (2005). Dr. Gates is President of Texas A&M University (2002). He was Director of the Central Intelligence Agency (CIA) from 1991 to 1993. From 1989 to 1991, Dr. Gates served as Assistant to the President of the United States and Deputy National Security Advisor. Dr. Gates is a Director of NACCO Industries, Inc. (mining and manufacturing), Parker Drilling Co., Inc. (drilling and rental tools for the energy industry, 2001), and Brinker International (restaurant management, 2003). He also serves as a member of the Advisory Board of VoteHere.net (secure Internet voting, 2001). Previously, Dr. Gates served as a Director of LucasVarity PLC (automotive components and diesel engines), a Director of TRW Inc. (automotive, space, defense, and information technology), and Dean of the George Bush School of Government and Public Service at Texas A&M University (1999-2001). Dr. Gates also is a Trustee of the Forum for International Policy. |
George H. Heilmeier (68) |
| Year of Election or Appointment: 2004 Dr. Heilmeier is Chairman Emeritus of Telcordia Technologies (communication software and systems), where prior to his retirement, he served as company Chairman and Chief Executive Officer. He currently serves on the Boards of Directors of The Mitre Corporation (systems engineering and information technology support for the government), INET Technologies Inc. (telecommunications network surveillance, 2001), Teletech Holdings (customer management services), and HRL Laboratories (private research and development, 2004). He is Chairman of the General Motors Technology Advisory Committee and a Life Fellow of the Institute of Electrical and Electronics Engineers (IEEE) (2000). Dr. Heilmeier is a member of the Defense Science Board and the National Security Agency Advisory Board. He is also a member of the National Academy of Engineering, the American Academy of Arts and Sciences, and the Board of Overseers of the School of Engineering and Applied Science of the University of Pennsylvania. Previously, Dr. Heilmeier served as a Director of TRW Inc. (automotive, space, defense, and information technology, 1992-2002), Compaq (1994-2002), and Automatic Data Processing, Inc. (ADP) (technologybased business outsourcing, 1995-2002). |
Marie L. Knowles (58) |
| Year of Election or Appointment: 2001 Prior to Ms. Knowles' retirement in June 2000, she served as Executive Vice President and Chief Financial Officer of Atlantic Richfield Company (ARCO) (diversified energy, 1996-2000). From 1993 to 1996, she was a Senior Vice President of ARCO and President of ARCO Transportation Company. She served as a Director of ARCO from 1996 to 1998. She currently serves as a Director of Phelps Dodge Corporation (copper mining and manufacturing) and McKesson Corporation (healthcare service, 2002). Ms. Knowles is a Trustee of the Brookings Institution and the Catalina Island Conservancy and also serves as a member of the Advisory Board for the School of Engineering of the University of Southern California. |
Ned C. Lautenbach (60) |
| Year of Election or Appointment: 2000 Mr. Lautenbach has been a partner of Clayton, Dubilier & Rice, Inc. (private equity investment firm) since September 1998. Previously, Mr. Lautenbach was with the International Business Machines Corporation (IBM) from 1968 until his retirement in 1998. He was most recently Senior Vice President and Group Executive of Worldwide Sales and Services. From 1993 to 1995, he was Chairman of IBM World Trade Corporation, and from 1994 to 1998 was a member of IBM's Corporate Executive Committee. Mr. Lautenbach serves as Co-Chairman and a Director of Covansys, Inc. (global provider of business and technology solutions, 2000). In addition, he is a Director of Italtel Holding S.p.A. (telecommunications (Milan, Italy), 2004) and Eaton Corporation (diversified industrial) as well as the Philharmonic Center for the Arts in Naples, Florida (1999). He also is a member of the Council on Foreign Relations. |
Marvin L. Mann (71) |
| Year of Election or Appointment: 1993 Mr. Mann is Chairman of the non-interested Trustees (2001). He is Chairman Emeritus of Lexmark International, Inc. (computer peripherals), where he served as CEO until April 1998, retired as Chairman May 1999, and remains a member of the Board. Prior to 1991, he held the positions of Vice President of International Business Machines Corporation (IBM) and President and General Manager of various IBM divisions and subsidiaries. He is a member of the Executive Committee of the Independent Director's Council of the Investment Company Institute. In addition, Mr. Mann is a member of the President's Cabinet at the University of Alabama and the Board of Visitors of the Culverhouse College of Commerce and Business Administration at the University of Alabama. |
William O. McCoy (71) |
| Year of Election or Appointment: 1997 Prior to his retirement in December 1994, Mr. McCoy was Vice Chairman of the Board of BellSouth Corporation (telecommunications) and President of BellSouth Enterprises. He is currently a Director of Liberty Corporation (holding company), Duke Realty Corporation (real estate), and Progress Energy, Inc. (electric utility). He is also a partner of Franklin Street Partners (private investment management firm) and a member of the Research Triangle Foundation Board. In addition, Mr. McCoy served as the Interim Chancellor (1999-2000) and a member of the Board of Visitors (1994-1998) for the University of North Carolina at Chapel Hill and currently serves on the Board of Directors of the University of North Carolina Health Care System and the Board of Visitors of the Kenan-Flagler Business School (University of North Carolina at Chapel Hill). He also served as Vice President of Finance for the University of North Carolina (16-school system, 1995-1998). |
Cornelia M. Small (60) |
| Year of Election or Appointment: 2005 Ms. Small is a member (2000) and Chairperson (2002) of the Investment Committee, and a member (2002) of the Board of Trustees of Smith College. Previously, she served as Chief Investment Officer (1999-2000), Director of Global Equity Investments (1996-1999), and a member of the Board of Directors of Scudder, Stevens & Clark (1990-1997) and Scudder Kemper Investments (1997-1998). In addition, Ms. Small served as Co-Chair (2000-2003) of the Annual Fund for the Fletcher School of Law and Diplomacy. |
William S. Stavropoulos (65) |
| Year of Election or Appointment: 2002 Mr. Stavropoulos is Chairman of the Board (2000), CEO (2002), a position he previously held from 1995-2000, Chairman of the Executive Committee (2000), and a Member of the Board of Directors of The Dow Chemical Company. Since joining The Dow Chemical Company in 1967, Mr. Stavropoulos served in numerous senior management positions, including President (1993-2000; 2002-2003). Currently, he is a Director of NCR Corporation (data warehousing and technology solutions), BellSouth Corporation (telecommunications), Chemical Financial Corporation, and Maersk Inc. (industrial conglomerate, 2002). He also serves as a member of the Board of Trustees of the American Enterprise Institute for Public Policy Research. In addition, Mr. Stavropoulos is a member of The Business Council, J.P. Morgan International Council and the University of Notre Dame Advisory Council for the College of Science. |
Kenneth L. Wolfe (65) |
| Year of Election or Appointment: 2005 Mr. Wolfe also serves as a Trustee (2005) or Member of the Advisory Board (2004) of other investment companies advised by FMR. Prior to his retirement in 2001, Mr. Wolfe was Chairman and Chief Executive Officer of Hershey Foods Corporation (1993-2001). He currently serves as a member of the boards of Adelphia Communications Corporation (2003), Bausch & Lomb, Inc., and Revlon Inc. (2004). |
Advisory Board Member and Executive Officers:
Correspondence intended for each executive officer and Mr. Lynch may be sent to Fidelity Investments, 82 Devonshire Street, Boston, Massachusetts 02109.
Name, Age; Principal Occupation |
Peter S. Lynch (61) |
| Year of Election or Appointment: 2003 Member of the Advisory Board of Fidelity Securities Fund. Vice Chairman and a Director of FMR, and Vice Chairman (2001) and a Director (2000) of FMR Co., Inc. Previously, Mr. Lynch served as a Trustee of the Fidelity funds (1990-2003). Prior to May 31, 1990, he was a Director of FMR and Executive Vice President of FMR (a position he held until March 31, 1991), Vice President of Fidelity® Magellan® Fund and FMR Growth Group Leader, and Managing Director of FMR Corp. Mr. Lynch was also Vice President of Fidelity Investments Corporate Services. In addition, he serves as a Trustee of Boston College, Massachusetts Eye & Ear Infirmary, Historic Deerfield, John F. Kennedy Library, and the Museum of Fine Arts of Boston. |
John B. McDowell (46) |
| Year of Election or Appointment: 2002 Vice President of Advisor Aggressive Growth. Mr. McDowell also serves as Vice President of certain Equity Funds (2002). He is Senior Vice President of FMR (1999), FMR Co., Inc. (2001), and Fidelity Management Trust Company (FMTC). Since joining Fidelity Investments in 1985, Mr. McDowell has worked as a research analyst and manager. |
Rajiv Kaul (33) |
| Year of Election or Appointment: 2003 Vice President of Advisor Aggressive Growth. Mr. Kaul serves as Vice President of another fund advised by FMR. Prior to assuming his current responsibilities, Mr. Kaul managed a variety of Fidelity funds. Mr. Kaul also serves as Vice President of FMR (2003) and FMR Co., Inc. (2003). |
Eric D. Roiter (56) |
| Year of Election or Appointment: 2000 Secretary of Advisor Aggressive Growth. He also serves as Secretary of other Fidelity funds (1998); Vice President, General Counsel, and Clerk of FMR Co., Inc. (2001) and FMR (1998); Vice President and Clerk of FDC (1998); Assistant Clerk of Fidelity Management & Research (U.K.) Inc. (2001) and Fidelity Management & Research (Far East) Inc. (2001); and Assistant Secretary of Fidelity Investments Money Management, Inc. (2001). Prior to joining Fidelity, Mr. Roiter was with the law firm of Debevoise & Plimpton, as an associate (1981-1984) and as a partner (1985-1997), and served as an Assistant General Counsel of the U.S. Securities and Exchange Commission (1979-1981). Mr. Roiter is an Adjunct Member, Faculty of Law, at Boston College Law School (2003). |
Stuart Fross (45) |
| Year of Election or Appointment: 2003 Assistant Secretary of Advisor Aggressive Growth. Mr. Fross also serves as Assistant Secretary of other Fidelity funds (2003) and is an employee of FMR. |
Christine Reynolds (46) |
| Year of Election or Appointment: 2004 President, Treasurer, and Anti-Money Laundering (AML) officer of Advisor Aggressive Growth. Ms. Reynolds also serves as President, Treasurer, and AML officer of other Fidelity funds (2004) and is a Vice President (2003) and an employee (2002) of FMR. Before joining Fidelity Investments, Ms. Reynolds worked at PricewaterhouseCoopers LLP (PwC) (1980-2002), where she was most recently an audit partner with PwC's investment management practice. |
Timothy F. Hayes (53) |
| Year of Election or Appointment: 2002 Chief Financial Officer of Advisor Aggressive Growth. Mr. Hayes also serves as Chief Financial Officer of other Fidelity funds (2002). Recently he was appointed President of Fidelity Service Company (2003) where he also serves as a Director. Mr. Hayes also serves as President of Fidelity Investments Operations Group (FIOG, 2002), which includes Fidelity Pricing and Cash Management Services Group (FPCMS), where he was appointed President in 1998. Previously, Mr. Hayes served as Chief Financial Officer of Fidelity Investments Corporate Systems and Service Group (1998) and Fidelity Systems Company (1997-1998). |
Kenneth A. Rathgeber (57) |
| Year of Election or Appointment: 2004 Chief Compliance Officer of Advisor Aggressive Growth. Mr. Rathgeber also serves as Chief Compliance Officer of other Fidelity funds (2004) and Executive Vice President of Risk Oversight for Fidelity Investments (2002). Previously, he served as Executive Vice President and Chief Operating Officer for Fidelity Investments Institutional Services Company, Inc. (1998-2002). |
John R. Hebble (46) |
| Year of Election or Appointment: 2003 Deputy Treasurer of Advisor Aggressive Growth. Mr. Hebble also serves as Deputy Treasurer of other Fidelity funds (2003), and is an employee of FMR. Before joining Fidelity Investments, Mr. Hebble worked at Deutsche Asset Management where he served as Director of Fund Accounting (2002-2003) and Assistant Treasurer of the Scudder Funds (1998-2003). |
Kimberley H. Monasterio (40) |
| Year of Election or Appointment: 2004 Deputy Treasurer of Advisor Aggressive Growth. Ms. Monasterio also serves as Deputy Treasurer of other Fidelity funds (2004) and is an employee of FMR (2004). Before joining Fidelity Investments, Ms. Monasterio served as Treasurer (2000-2004) and Chief Financial Officer (2002-2004) of the Franklin Templeton Funds and Senior Vice President of Franklin Templeton Services, LLC (2000-2004). |
John H. Costello (58) |
| Year of Election or Appointment: 2000 Assistant Treasurer of Advisor Aggressive Growth. Mr. Costello also serves as Assistant Treasurer of other Fidelity funds and is an employee of FMR. |
Peter L. Lydecker (50) |
| Year of Election or Appointment: 2004 Assistant Treasurer of Advisor Aggressive Growth. Mr. Lydecker also serves as Assistant Treasurer of other Fidelity funds (2004) and is an employee of FMR. |
Mark Osterheld (49) |
| Year of Election or Appointment: 2002 Assistant Treasurer of Advisor Aggressive Growth. Mr. Osterheld also serves as Assistant Treasurer of other Fidelity funds (2002) and is an employee of FMR. |
Kenneth B. Robins (35) |
| Year of Election or Appointment: 2004 Assistant Treasurer of Advisor Aggressive Growth. Mr. Robins also serves as Assistant Treasurer of other Fidelity funds (2004) and is an employee of FMR (2004). Before joining Fidelity Investments, Mr. Robins worked at KPMG LLP, where he was a partner in KPMG's department of professional practice (2002-2004) and a Senior Manager (1999-2000). In addition, Mr. Robins served as Assistant Chief Accountant, United States Securities and Exchange Commission (2000-2002). |
Thomas J. Simpson (46) |
| Year of Election or Appointment: 2000 Assistant Treasurer of Advisor Aggressive Growth. Mr. Simpson is Assistant Treasurer of other Fidelity funds (2000) and an employee of FMR (1996). Prior to joining FMR, Mr. Simpson was Vice President and Fund Controller of Liberty Investment Services (1987-1995). |
Annual Report
Proxy Voting Results
A special meeting of the fund's shareholders was held on June 16, 2004. The results of votes taken among shareholders on proposals before them are reported below. Each vote reported represents one dollar of net asset value held on the record date for the meeting.
PROPOSAL 1 |
To amend the Declaration of Trust to allow the Board of Trustees, if permitted by applicable law, to authorize fund mergers without shareholder approval.A |
| # of
Votes | % of
Votes |
Affirmative | 31,883,774,629.45 | 74.417 |
Against | 8,183,381,781.77 | 19.100 |
Abstain | 1,638,852,719.00 | 3.825 |
Broker
Non-Votes | 1,138,987,331.08 | 2.658 |
TOTAL | 42,844,996,461.30 | 100.000 |
PROPOSAL 2 |
To elect a Board of Trustees.A |
| # of
Votes | % of
Votes |
J. Michael Cook |
Affirmative | 40,460,518,026.37 | 94.435 |
Withheld | 2,384,478,434.93 | 5.565 |
TOTAL | 42,844,996,461.30 | 100.000 |
Ralph F. Cox |
Affirmative | 40,352,191,948.09 | 94.182 |
Withheld | 2,492,804,513.21 | 5.818 |
TOTAL | 42,844,996,461.30 | 100.000 |
Laura B. Cronin |
Affirmative | 40,424,410,070.14 | 94.350 |
Withheld | 2,420,586,391.16 | 5.650 |
TOTAL | 42,844,996,461.30 | 100.000 |
Robert M. Gates |
Affirmative | 40,432,546,388.62 | 94.369 |
Withheld | 2,412,450,072.68 | 5.631 |
TOTAL | 42,844,996,461.30 | 100.000 |
George H. Heilmeier |
Affirmative | 40,445,405,455.55 | 94.399 |
Withheld | 2,399,591,005.75 | 5.601 |
TOTAL | 42,844,996,461.30 | 100.000 |
Abigail P. Johnson |
Affirmative | 40,331,726,176.04 | 94.134 |
Withheld | 2,513,270,285.26 | 5.866 |
TOTAL | 42,844,996,461.30 | 100.000 |
Edward C. Johnson 3d |
Affirmative | 40,301,779,769.00 | 94.064 |
Withheld | 2,543,216,692.30 | 5.936 |
TOTAL | 42,844,996,461.30 | 100.000 |
Donald J. Kirk |
Affirmative | 40,378,377,883.82 | 94.243 |
Withheld | 2,466,618,577.48 | 5.757 |
TOTAL | 42,844,996,461.30 | 100.000 |
Marie L. Knowles |
Affirmative | 40,472,201,003.05 | 94.462 |
Withheld | 2,372,795,458.25 | 5.538 |
TOTAL | 42,844,996,461.30 | 100.000 |
Ned C. Lautenbach |
Affirmative | 40,485,953,391.65 | 94.494 |
Withheld | 2,359,043,069.65 | 5.506 |
TOTAL | 42,844,996,461.30 | 100.000 |
Marvin L. Mann |
Affirmative | 40,392,875,977.31 | 94.277 |
Withheld | 2,452,120,483.99 | 5.723 |
TOTAL | 42,844,996,461.30 | 100.000 |
William O. McCoy |
Affirmative | 40,409,897,384.16 | 94.316 |
Withheld | 2,435,099,077.14 | 5.684 |
TOTAL | 42,844,996,461.30 | 100.000 |
| # of
Votes | % of
Votes |
Robert L. Reynolds |
Affirmative | 40,470,266,358.65 | 94.457 |
Withheld | 2,374,730,102.65 | 5.543 |
TOTAL | 42,844,996,461.30 | 100.000 |
William S. Stavropoulos |
Affirmative | 40,442,710,981.11 | 94.393 |
Withheld | 2,402,285,480.19 | 5.607 |
TOTAL | 42,844,996,461.30 | 100.000 |
A Denotes trust-wide proposals and voting results. |
Annual Report
Investment Adviser
Fidelity Management & Research Company
Boston, MA
Investment Sub-Advisers
FMR Co., Inc.
Fidelity Management & Research
(U.K.) Inc.
Fidelity Management & Research
(Far East) Inc.
Fidelity International Investment Advisors
Fidelity Investments Japan Limited
Fidelity International Investment Advisors (U.K.) Limited
General Distributor
Fidelity Distributors Corporation
Boston, MA
Transfer and Shareholder
Servicing Agents
Fidelity Investments Institutional
Operations Company, Inc.
Boston, MA
Custodian
State Street Bank and Trust Company
Quincy, MA
(Fidelity Investment logo)(registered trademark)
Corporate Headquarters
82 Devonshire St., Boston, MA 02109
www.fidelity.com
AAG-UANN-0105
1.786669.101
Fidelity® Advisor
Aggressive Growth
Fund - Institutional Class
Annual Report
November 30, 2004
(2_fidelity_logos) (Registered_Trademark)
Contents
Chairman's Message | <Click Here> | Ned Johnson's message to shareholders. |
Performance | <Click Here> | How the fund has done over time. |
Management's Discussion | <Click Here> | The manager's review of fund performance, strategy and outlook. |
Shareholder Expense Example | <Click Here> | An example of shareholder expenses. |
Investment Changes | <Click Here> | A summary of major shifts in the fund's investments over the past six months. |
Investments | <Click Here> | A complete list of the fund's investments with their market values. |
Financial Statements | <Click Here> | Statements of assets and liabilities, operations, and changes in net assets,
as well as financial highlights. |
Notes | <Click Here> | Notes to the financial statements. |
Report of Independent Registered Public Accounting Firm | <Click Here> | |
Trustees and Officers | <Click Here> | |
Proxy Voting Results | <Click Here> | |
| | |
To view a fund's proxy voting guidelines and proxy voting record for the 12-month period ended June 30, visit www.fidelity.com/proxyvotingresults or visit the Securities and Exchange Commission's (SEC) web site at www.sec.gov. You may also call 1-877-208-0098 to request a free copy of the proxy voting guidelines.
Standard & Poor's, S&P and S&P 500 are registered service marks of The McGraw-Hill Companies, Inc. and have been licensed for use by Fidelity Distributors Corporation.
Other third party marks appearing herein are the property of their respective owners.
All other marks appearing herein are registered or unregistered trademarks or service marks of FMR Corp. or an affiliated company.
(Recycle graphic) This report is printed on recycled paper using soy-based inks.
Annual Report
This report and the financial statements contained herein are submitted for the general information of the shareholders of the fund. This report is not authorized for distribution to prospective investors in the fund unless preceded or accompanied by an effective prospectus.
A fund files its complete schedule of portfolio holdings with the SEC for the first and third quarters of each fiscal year on Form N-Q. Forms N-Q are available on the SEC's web site at http://www.sec.gov. A fund's Forms N-Q may be reviewed and copied at the SEC's Public Reference Room in Washington, DC. Information regarding the operation of the SEC's Public Reference Room may be obtained by calling 1-800-SEC-0330. For a complete list of a fund's portfolio holdings, view the most recent quarterly holdings report, semiannual report, or annual report on Fidelity's web site at http://www.advisor.fidelity.com.
NOT FDIC INSURED ·MAY LOSE VALUE ·NO BANK GUARANTEE
Neither the fund nor Fidelity Distributors Corporation is a bank.
Annual Report
Chairman's Message
(photo_of_Edward_C_Johnson_3d)
Dear Shareholder:
During the past year or so, much has been reported about the mutual fund industry, and much of it has been more critical than I believe is warranted. Allegations that some companies have been less than forthright with their shareholders have cast a shadow on the entire industry. I continue to find these reports disturbing, and assert that they do not create an accurate picture of the industry overall. Therefore, I would like to remind everyone where Fidelity stands on these issues. I will say two things specifically regarding allegations that some mutual fund companies were in violation of the Securities and Exchange Commission's forward pricing rules or were involved in so-called "market timing" activities.
First, Fidelity has no agreements that permit customers who buy fund shares after 4 p.m. to obtain the 4 p.m. price. This is not a new policy. This is not to say that someone could not deceive the company through fraudulent acts. However, we are extremely diligent in preventing fraud from occurring in this manner - and in every other. But I underscore again that Fidelity has no so-called "agreements" that sanction illegal practices.
Second, Fidelity continues to stand on record, as we have for years, in opposition to predatory short-term trading that adversely affects shareholders in a mutual fund. Back in the 1980s, we initiated a fee - which is returned to the fund and, therefore, to investors - - to discourage this activity. Further, we took the lead several years ago in developing a Fair Value Pricing Policy to prevent market timing on foreign securities in our funds. I am confident we will find other ways to make it more difficult for predatory traders to operate. However, this will only be achieved through close cooperation among regulators, legislators and the industry.
Yes, there have been unfortunate instances of unethical and illegal activity within the mutual fund industry from time to time. That is true of any industry. When this occurs, confessed or convicted offenders should be dealt with appropriately. But we are still concerned about the risk of over-regulation and the quick application of simplistic solutions to intricate problems. Every system can be improved, and we support and applaud well thought out improvements by regulators, legislators and industry representatives that achieve the common goal of building and protecting the value of investors' holdings.
For nearly 60 years, Fidelity has worked very hard to improve its products and service to justify your trust. When our family founded this company in 1946, we had only a few hundred customers. Today, we serve more than 18 million customers including individual investors and participants in retirement plans across America.
Let me close by saying that we do not take your trust in us for granted, and we realize that we must always work to improve all aspects of our service to you. In turn, we urge you to continue your active participation with your financial matters, so that your interests can be well served.
Best regards,
/s/Edward C. Johnson 3d
Edward C. Johnson 3d
Annual Report
Performance: The Bottom Line
Average annual total return reflects the change in the value of an investment, assuming reinvestment of the class' dividend income and capital gains (the profits earned upon the sale of securities that have grown in value) and assuming a constant rate of performance each year. The $10,000 table and the fund's returns do not reflect the deduction of taxes that a shareholder would pay on fund distributions or the redemption of fund shares. During periods of reimbursement by Fidelity, a fund's total return will be greater than it would be had the reimbursement not occurred. How a fund did yesterday is no guarantee of how it will do tomorrow.
Average Annual Total Returns
Periods ended November 30, 2004 | Past 1
year | Life of
fundA |
Institutional Class | 7.78% | -3.27% |
A From November 13, 2000.
$10,000 Over Life of Fund
Let's say hypothetically that $10,000 was invested in Fidelity® Advisor Aggressive Growth Fund - Institutional Class on November 13, 2000, when the fund started. The chart shows how the value of your investment would have changed, and also shows how the Russell Midcap® Growth Index performed over the same period.
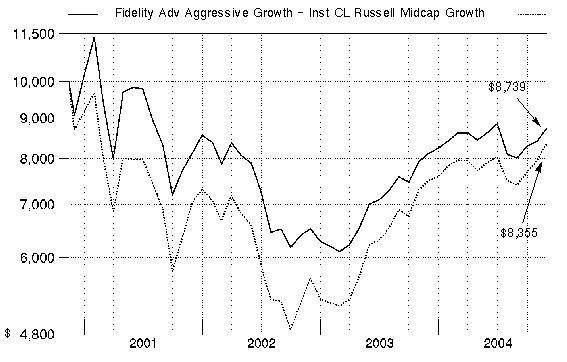
Annual Report
Management's Discussion of Fund Performance
Comments from Rajiv Kaul, Portfolio Manager of Fidelity® Advisor Aggressive Growth Fund
Despite surging oil prices, a struggling job market and four interest rate hikes in a five-month span, U.S. equity markets posted solid gains for the 12-month period ending November 30, 2004, and were closing in on a second straight year in the black. There was great disparity in the market during the past year. For instance, value stocks trounced their growth counterparts during the period. To illustrate, the Russell 1000® Value Index shot up 19.67%, while the Russell 1000 Growth Index rose only 5.83%. Meanwhile, small- and mid-cap stocks vastly outperformed larger-cap stocks. Energy was the best-performing sector of the market, propelled by a spike in oil prices. Conversely, technology stocks dipped lower in response to a slowdown in corporate capital spending. For the 12-month period overall, the Standard & Poor's 500SM Index returned 12.86% - slightly above its historical average. Elsewhere, the Dow Jones Industrial AverageSM rose 8.87% and the tech-heavy NASDAQ Composite® Index advanced 7.50%.
For the 12 months ending November 30, 2004, the funds Institutional Class shares returned 7.78%, which fell short of the 11.40% return of the Russell Midcap® Growth Index and the 12.52% gain of the LipperSM Mid-Cap Funds Average. The last month or so of the period saw significant underperformance in the pharmaceuticals and biotechnology group, where the fund carried a large overweighting. ImClone Systems was the biggest detractor compared with the index and also hurt on an absolute basis. The stock had a huge run-up from March through the end of June but was subsequently hit with profit taking. Millennium Pharmaceuticals also struggled, as the stock experienced volatility even as the company continued to narrow its losses. On the positive side, Irish drug stock Elan was by far the fund's best performer both in absolute terms and relative to the index. The stock was boosted by the Food and Drug Administration's approval of Tysabri, the company's drug for multiple sclerosis. Internet portal Yahoo! also turned in a strong performance, as the company's paid-search business got a boost from its acquisition of Overture Services.
The views expressed in this statement reflect those of the portfolio manager only through the end of the period of the report as stated on the cover and do not necessarily represent the views of Fidelity or any other person in the Fidelity organization. Any such views are subject to change at any time based upon market or other conditions and Fidelity disclaims any responsibility to update such views. These views may not be relied on as investment advice and, because investment decisions for a Fidelity fund are based on numerous factors, may not be relied on as an indication of trading intent on behalf of any Fidelity fund.
Annual Report
Shareholder Expense Example
As a shareholder of the Fund, you incur two types of costs: (1) transaction costs, including sales charges (loads) on purchase payments or redemption proceeds, and (2) ongoing costs, including management fees, distribution and/or service (12b-1) fees and other Fund expenses. This Example is intended to help you understand your ongoing costs (in dollars) of investing in the Fund and to compare these costs with the ongoing costs of investing in other mutual funds.
The Example is based on an investment of $1,000 invested at the beginning of the period and held for the entire period (June 1, 2004 to November 30, 2004).
Actual Expenses
The first line of the table below for each class of the Fund provides information about actual account values and actual expenses. You may use the information in this line, together with the amount you invested, to estimate the expenses that you paid over the period. Simply divide your account value by $1,000.00 (for example, an $8,600 account value divided by $1,000.00 = 8.6), then multiply the result by the number in the first line for a class of the Fund under the heading entitled "Expenses Paid During Period" to estimate the expenses you paid on your account during this period.
Hypothetical Example for Comparison Purposes
The second line of the table below for each class of the Fund provides information about hypothetical account values and hypothetical expenses based on a Class' actual expense ratio and an assumed rate of return of 5% per year before expenses, which is not the Class' actual return. The hypothetical account values and expenses may not be used to estimate the actual ending account balance or expenses you paid for the period. You may use this information to compare the ongoing costs of investing in the Fund and other funds. To do so, compare this 5% hypothetical example with the 5% hypothetical examples that appear in the shareholder reports of the other funds.
Please note that the expenses shown in the table are meant to highlight your ongoing costs only and do not reflect any transaction costs. Therefore, the second line of the table is useful in comparing ongoing costs only, and will not help you determine the relative total costs of owning different funds. In addition, if these transactional costs were included, your costs would have been higher.
Annual Report
| Beginning
Account Value
June 1, 2004 | Ending
Account Value
November 30, 2004 | Expenses Paid
During Period*
June 1, 2004
to November 30, 2004 |
Class A | | | |
Actual | $ 1,000.00 | $ 1,010.60 | $ 7.54** |
HypotheticalA | $ 1,000.00 | $ 1,017.41 | $ 7.59** |
Class T | | | |
Actual | $ 1,000.00 | $ 1,009.50 | $ 8.79** |
HypotheticalA | $ 1,000.00 | $ 1,016.14 | $ 8.86** |
Class B | | | |
Actual | $ 1,000.00 | $ 1,007.20 | $ 11.29** |
HypotheticalA | $ 1,000.00 | $ 1,013.61 | $ 11.39** |
Class C | | | |
Actual | $ 1,000.00 | $ 1,007.20 | $ 11.29** |
HypotheticalA | $ 1,000.00 | $ 1,013.61 | $ 11.39** |
Institutional Class | | | |
Actual | $ 1,000.00 | $ 1,012.80 | $ 6.29** |
HypotheticalA | $ 1,000.00 | $ 1,018.67 | $ 6.33** |
A 5% return per year before expenses
*Expenses are equal to each Class' annualized expense ratio (shown in the table below); multiplied by the average account value over the period, multiplied by 183/366 (to reflect the one-half year period).
| Annualized
Expense Ratio |
Class A | 1.50%** |
Class T | 1.75%** |
Class B | 2.25%** |
Class C | 2.25%** |
Institutional Class | 1.25%** |
Annual Report
**If changes to voluntary expense limitations effective February 1, 2005 had been in effect during the period, the annualized expense ratio and the expenses paid in the actual and hypothetical examples above would have been as follows:
| Annualized
Expense Ratio | Expenses
Paid |
Class A | 1.30% | |
Actual | | $ 6.53** |
HypotheticalA | | $ 6.58** |
Class T | 1.55% | |
Actual | | $ 7.79** |
HypotheticalA | | $ 7.85** |
Class B | 2.05% | |
Actual | | $ 10.29** |
HypotheticalA | | $ 10.38** |
Class C | 2.05% | |
Actual | | $ 10.29** |
HypotheticalA | | $ 10.38** |
Institutional Class | 1.05% | |
Actual | | $ 5.28** |
HypotheticalA | | $ 5.32** |
A 5% return per year before expenses
Annual Report
Investment Changes
Top Ten Stocks as of November 30, 2004 |
| % of fund's
net assets | % of fund's net assets
6 months ago |
Genentech, Inc. | 3.4 | 4.1 |
Biogen Idec, Inc. | 3.3 | 3.3 |
Elan Corp. PLC sponsored ADR | 2.8 | 3.2 |
Juniper Networks, Inc. | 2.3 | 0.2 |
Biomet, Inc. | 2.2 | 1.8 |
Microchip Technology, Inc. | 1.7 | 1.8 |
Millennium Pharmaceuticals, Inc. | 1.2 | 1.3 |
Baker Hughes, Inc. | 1.2 | 0.0 |
Intel Corp. | 1.2 | 0.1 |
QUALCOMM, Inc. | 1.1 | 1.0 |
| 20.4 | |
Top Five Market Sectors as of November 30, 2004 |
| % of fund's
net assets | % of fund's net assets
6 months ago |
Health Care | 32.3 | 35.6 |
Information Technology | 26.4 | 26.4 |
Consumer Discretionary | 15.3 | 17.8 |
Industrials | 8.5 | 6.3 |
Energy | 5.3 | 2.9 |
Asset Allocation (% of fund's net assets) |
As of November 30, 2004 * | As of May 31, 2004 ** |
| Stocks 97.3% | | | Stocks 97.0% | |
| Short-Term
Investments and
Net Other Assets 2.7% | | | Short-Term
Investments and
Net Other Assets 3.0% | |
* Foreign
investments | 6.4% | | ** Foreign
investments | 7.1% | |

Annual Report
Investments November 30, 2004
Showing Percentage of Net Assets
Common Stocks - 97.3% |
| Shares | | Value (Note 1) |
CONSUMER DISCRETIONARY - 15.3% |
Auto Components - 0.2% |
Gentex Corp. | 800 | | $ 25,856 |
Johnson Controls, Inc. | 700 | | 42,980 |
| | 68,836 |
Hotels, Restaurants & Leisure - 4.1% |
Brinker International, Inc. (a) | 3,680 | | 125,598 |
California Pizza Kitchen, Inc. (a) | 2,600 | | 65,130 |
Harrah's Entertainment, Inc. | 960 | | 58,944 |
Hilton Hotels Corp. | 6,600 | | 136,356 |
International Game Technology | 710 | | 25,099 |
Krispy Kreme Doughnuts, Inc. (a) | 1,800 | | 18,126 |
Mandalay Resort Group | 800 | | 55,760 |
Marriott International, Inc. Class A | 1,890 | | 107,447 |
Outback Steakhouse, Inc. | 1,700 | | 73,610 |
Penn National Gaming, Inc. (a) | 2,200 | | 116,094 |
Starbucks Corp. (a) | 2,020 | | 113,645 |
Station Casinos, Inc. | 2,100 | | 119,784 |
Sunterra Corp. (a) | 1,500 | | 16,545 |
The Cheesecake Factory, Inc. (a) | 1,480 | | 72,357 |
Wendy's International, Inc. | 4,400 | | 156,948 |
Yum! Brands, Inc. | 8,780 | | 398,612 |
| | 1,660,055 |
Household Durables - 1.9% |
Black & Decker Corp. | 1,910 | | 160,612 |
Fortune Brands, Inc. | 3,800 | | 298,224 |
Harman International Industries, Inc. | 1,720 | | 211,302 |
Mohawk Industries, Inc. (a) | 980 | | 85,946 |
| | 756,084 |
Internet & Catalog Retail - 0.6% |
eBay, Inc. (a) | 2,200 | | 247,390 |
eDiets.com, Inc. (a) | 400 | | 1,400 |
| | 248,790 |
Leisure Equipment & Products - 0.6% |
Brunswick Corp. | 3,400 | | 165,988 |
Mattel, Inc. | 1,960 | | 37,142 |
Polaris Industries, Inc. | 800 | | 52,720 |
| | 255,850 |
Media - 2.4% |
E.W. Scripps Co. Class A | 4,100 | | 191,634 |
Entercom Communications Corp. Class A (a) | 540 | | 19,451 |
Common Stocks - continued |
| Shares | | Value (Note 1) |
CONSUMER DISCRETIONARY - continued |
Media - continued |
Getty Images, Inc. (a) | 1,480 | | $ 86,210 |
Lamar Advertising Co. Class A (a) | 810 | | 31,946 |
NTL, Inc. (a) | 1,582 | | 110,076 |
Pixar (a) | 1,670 | | 151,419 |
Playboy Enterprises, Inc. Class B (non-vtg.) (a) | 200 | | 2,420 |
Radio One, Inc. Class D (non-vtg.) (a) | 1,000 | | 13,950 |
The New York Times Co. Class A | 2,140 | | 87,740 |
Univision Communications, Inc. Class A (a) | 2,700 | | 81,270 |
Westwood One, Inc. (a) | 2,590 | | 58,068 |
XM Satellite Radio Holdings, Inc. Class A (a) | 3,500 | | 129,185 |
| | 963,369 |
Multiline Retail - 0.9% |
99 Cents Only Stores (a) | 500 | | 7,460 |
Big Lots, Inc. (a) | 3,930 | | 45,588 |
Dollar General Corp. | 2,500 | | 49,375 |
Dollar Tree Stores, Inc. (a) | 3,560 | | 99,075 |
Family Dollar Stores, Inc. | 2,450 | | 71,785 |
Nordstrom, Inc. | 2,500 | | 109,375 |
| | 382,658 |
Specialty Retail - 3.9% |
Abercrombie & Fitch Co. Class A | 2,400 | | 109,320 |
AutoZone, Inc. (a) | 690 | | 59,064 |
Bed Bath & Beyond, Inc. (a) | 3,100 | | 123,777 |
Chico's FAS, Inc. (a) | 4,720 | | 182,192 |
Christopher & Banks Corp. | 3,690 | | 72,804 |
Circuit City Stores, Inc. | 1,600 | | 24,944 |
Foot Locker, Inc. | 1,000 | | 25,980 |
Hot Topic, Inc. (a) | 4,155 | | 68,017 |
Jo-Ann Stores, Inc. (a) | 700 | | 19,264 |
Kirkland's, Inc. (a) | 1,200 | | 11,520 |
PETsMART, Inc. | 6,360 | | 217,957 |
Pier 1 Imports, Inc. | 1,100 | | 20,064 |
RadioShack Corp. | 1,300 | | 41,041 |
Ross Stores, Inc. | 10,480 | | 281,912 |
Select Comfort Corp. (a) | 6,890 | | 134,286 |
Weight Watchers International, Inc. (a) | 2,810 | | 111,417 |
Williams-Sonoma, Inc. (a) | 2,170 | | 79,444 |
| | 1,583,003 |
Common Stocks - continued |
| Shares | | Value (Note 1) |
CONSUMER DISCRETIONARY - continued |
Textiles, Apparel & Luxury Goods - 0.7% |
Coach, Inc. (a) | 5,580 | | $ 278,107 |
Kenneth Cole Productions, Inc. Class A (sub. vtg.) | 550 | | 16,236 |
| | 294,343 |
TOTAL CONSUMER DISCRETIONARY | | 6,212,988 |
CONSUMER STAPLES - 2.3% |
Food & Staples Retailing - 0.9% |
CVS Corp. | 6,100 | | 276,757 |
Whole Foods Market, Inc. | 1,310 | | 118,909 |
| | 395,666 |
Food Products - 1.1% |
Bunge Ltd. | 600 | | 31,632 |
Del Monte Foods Co. (a) | 11,890 | | 129,007 |
Hershey Foods Corp. | 3,680 | | 190,624 |
McCormick & Co., Inc. (non-vtg.) | 1,700 | | 61,965 |
Smithfield Foods, Inc. (a) | 700 | | 20,335 |
Wm. Wrigley Jr. Co. | 70 | | 4,816 |
| | 438,379 |
Personal Products - 0.3% |
Estee Lauder Companies, Inc. Class A | 2,900 | | 126,556 |
TOTAL CONSUMER STAPLES | | 960,601 |
ENERGY - 5.3% |
Energy Equipment & Services - 3.9% |
Baker Hughes, Inc. | 10,900 | | 483,197 |
BJ Services Co. | 200 | | 10,134 |
Cooper Cameron Corp. (a) | 3,700 | | 193,103 |
ENSCO International, Inc. | 2,110 | | 66,064 |
Halliburton Co. | 600 | | 24,810 |
Nabors Industries Ltd. (a) | 1,260 | | 65,520 |
Noble Corp. (a) | 1,870 | | 90,602 |
Patterson-UTI Energy, Inc. | 6,640 | | 132,800 |
Smith International, Inc. (a) | 3,530 | | 213,812 |
Weatherford International Ltd. (a) | 5,430 | | 289,853 |
| | 1,569,895 |
Oil & Gas - 1.4% |
EOG Resources, Inc. | 1,400 | | 105,098 |
Pioneer Natural Resources Co. | 5,170 | | 181,984 |
Common Stocks - continued |
| Shares | | Value (Note 1) |
ENERGY - continued |
Oil & Gas - continued |
Teekay Shipping Corp. | 3,640 | | $ 193,866 |
Valero Energy Corp. | 400 | | 18,716 |
XTO Energy, Inc. | 2,100 | | 76,335 |
| | 575,999 |
TOTAL ENERGY | | 2,145,894 |
FINANCIALS - 3.7% |
Capital Markets - 2.1% |
Ameritrade Holding Corp. (a) | 7,880 | | 109,768 |
E*TRADE Financial Corp. (a) | 8,700 | | 120,582 |
Eaton Vance Corp. (non-vtg.) | 3,010 | | 144,330 |
Federated Investors, Inc. Class B (non-vtg.) | 1,580 | | 46,484 |
Goldman Sachs Group, Inc. | 400 | | 41,904 |
Investors Financial Services Corp. | 200 | | 8,768 |
Legg Mason, Inc. | 2,880 | | 196,243 |
SEI Investments Co. | 1,800 | | 70,398 |
T. Rowe Price Group, Inc. | 1,250 | | 73,950 |
Waddell & Reed Financial, Inc. Class A | 2,400 | | 54,480 |
| | 866,907 |
Commercial Banks - 0.6% |
North Fork Bancorp, Inc., New York | 2,100 | | 60,480 |
Sumitomo Mitsui Financial Group, Inc. | 10 | | 69,488 |
Synovus Financial Corp. | 3,640 | | 98,280 |
UnionBanCal Corp. | 300 | | 18,549 |
| | 246,797 |
Real Estate - 0.0% |
Catellus Development Corp. | 77 | | 2,418 |
Thrifts & Mortgage Finance - 1.0% |
Countrywide Financial Corp. | 400 | | 13,284 |
MGIC Investment Corp. | 1,600 | | 108,800 |
New York Community Bancorp, Inc. | 5,073 | | 100,344 |
Radian Group, Inc. | 3,000 | | 153,750 |
The PMI Group, Inc. | 300 | | 12,354 |
| | 388,532 |
TOTAL FINANCIALS | | 1,504,654 |
Common Stocks - continued |
| Shares | | Value (Note 1) |
HEALTH CARE - 32.3% |
Biotechnology - 13.9% |
Alkermes, Inc. (a) | 900 | | $ 12,411 |
Amylin Pharmaceuticals, Inc. (a) | 2,990 | | 60,936 |
Biogen Idec, Inc. (a) | 23,080 | | 1,354,334 |
Celgene Corp. (a) | 5,840 | | 160,133 |
Cephalon, Inc. (a) | 1,440 | | 68,443 |
Charles River Laboratories International, Inc. (a) | 1,720 | | 80,410 |
Dendreon Corp. (a) | 10,700 | | 104,967 |
DOV Pharmaceutical, Inc. (a) | 7,000 | | 129,570 |
Dyax Corp. (a) | 3,700 | | 29,341 |
Enzon Pharmaceuticals, Inc. (a) | 2,500 | | 33,850 |
Genentech, Inc. (a) | 28,740 | | 1,386,699 |
Genzyme Corp. - General Division (a) | 300 | | 16,803 |
Gilead Sciences, Inc. (a) | 600 | | 20,676 |
Harvard Bioscience, Inc. (a) | 2,600 | | 10,322 |
ICOS Corp. (a) | 600 | | 14,490 |
ImClone Systems, Inc. (a) | 7,870 | | 332,271 |
Invitrogen Corp. (a) | 800 | | 48,400 |
Medarex, Inc. (a) | 15,500 | | 168,950 |
MedImmune, Inc. (a) | 8,710 | | 231,686 |
Millennium Pharmaceuticals, Inc. (a) | 39,580 | | 499,500 |
Neurocrine Biosciences, Inc. (a) | 240 | | 11,040 |
ONYX Pharmaceuticals, Inc. (a) | 1,500 | | 46,920 |
Oscient Pharmaceuticals Corp. (a) | 7,642 | | 24,913 |
OSI Pharmaceuticals, Inc. (a) | 400 | | 19,032 |
Pharmion Corp. | 10,300 | | 436,102 |
Protein Design Labs, Inc. (a) | 18,470 | | 334,676 |
Trimeris, Inc. (a) | 1,400 | | 17,374 |
| | 5,654,249 |
Health Care Equipment & Supplies - 6.6% |
Advanced Medical Optics, Inc. (a) | 1,600 | | 66,528 |
Alcon, Inc. | 290 | | 21,611 |
Bausch & Lomb, Inc. | 500 | | 29,440 |
Baxter International, Inc. | 10,330 | | 326,945 |
Beckman Coulter, Inc. | 1,700 | | 111,282 |
Biomet, Inc. | 19,130 | | 915,753 |
C.R. Bard, Inc. | 4,760 | | 285,172 |
Cooper Companies, Inc. | 600 | | 41,718 |
Cyberonics, Inc. (a) | 600 | | 11,142 |
Cytyc Corp. (a) | 3,500 | | 93,940 |
DENTSPLY International, Inc. | 1,650 | | 86,807 |
Common Stocks - continued |
| Shares | | Value (Note 1) |
HEALTH CARE - continued |
Health Care Equipment & Supplies - continued |
Edwards Lifesciences Corp. (a) | 3,300 | | $ 124,113 |
Inverness Medical Innovations, Inc. (a) | 1,200 | | 29,160 |
ResMed, Inc. (a) | 2,600 | | 130,156 |
Waters Corp. (a) | 2,250 | | 104,985 |
Zimmer Holdings, Inc. (a) | 3,510 | | 286,416 |
| | 2,665,168 |
Health Care Providers & Services - 4.6% |
AmerisourceBergen Corp. | 620 | | 36,543 |
Andrx Corp. (a) | 1,400 | | 24,920 |
Anthem, Inc. (a) | 1,000 | | 101,330 |
Cerner Corp. (a) | 800 | | 42,176 |
Computer Programs & Systems, Inc. | 100 | | 2,160 |
Covance, Inc. (a) | 3,100 | | 122,326 |
Coventry Health Care, Inc. (a) | 1,760 | | 87,349 |
DaVita, Inc. (a) | 450 | | 14,949 |
Health Management Associates, Inc. Class A | 4,640 | | 102,498 |
Henry Schein, Inc. (a) | 1,300 | | 84,734 |
Humana, Inc. (a) | 1,400 | | 34,748 |
Laboratory Corp. of America Holdings (a) | 1,400 | | 67,130 |
Lincare Holdings, Inc. (a) | 7,700 | | 297,143 |
Medco Health Solutions, Inc. (a) | 84 | | 3,168 |
Omnicare, Inc. | 700 | | 22,687 |
PacifiCare Health Systems, Inc. (a) | 400 | | 19,360 |
Patterson Companies, Inc. (a) | 1,400 | | 57,204 |
Pharmaceutical Product Development, Inc. (a) | 2,000 | | 84,220 |
Quest Diagnostics, Inc. | 1,000 | | 93,750 |
Renal Care Group, Inc. (a) | 2,100 | | 69,930 |
Triad Hospitals, Inc. (a) | 670 | | 24,582 |
UnitedHealth Group, Inc. | 3,940 | | 326,429 |
Universal Health Services, Inc. Class B | 2,720 | | 123,814 |
WellChoice, Inc. (a) | 900 | | 44,091 |
| | 1,887,241 |
Pharmaceuticals - 7.2% |
aaiPharma, Inc. (a) | 850 | | 2,627 |
Allergan, Inc. | 20 | | 1,470 |
Barr Pharmaceuticals, Inc. (a) | 1,927 | | 75,249 |
Elan Corp. PLC sponsored ADR (a) | 43,220 | | 1,141,008 |
Endo Pharmaceuticals Holdings, Inc. (a) | 3,700 | | 75,776 |
Eon Labs, Inc. (a) | 900 | | 24,264 |
Guilford Pharmaceuticals, Inc. (a) | 9,400 | | 53,016 |
Common Stocks - continued |
| Shares | | Value (Note 1) |
HEALTH CARE - continued |
Pharmaceuticals - continued |
Impax Laboratories, Inc. (a) | 10,800 | | $ 135,216 |
IVAX Corp. (a) | 2,750 | | 42,928 |
MGI Pharma, Inc. (a) | 12,300 | | 331,977 |
NitroMed, Inc. | 7,200 | | 150,480 |
Salix Pharmaceuticals Ltd. (a) | 900 | | 13,635 |
Schering-Plough Corp. | 19,900 | | 355,215 |
Sepracor, Inc. (a) | 10,250 | | 456,228 |
UCB SA | 1,110 | | 57,413 |
Watson Pharmaceuticals, Inc. (a) | 950 | | 27,598 |
| | 2,944,100 |
TOTAL HEALTH CARE | | 13,150,758 |
INDUSTRIALS - 8.5% |
Aerospace & Defense - 1.7% |
EADS NV | 5,180 | | 156,651 |
EDO Corp. | 2,500 | | 76,175 |
Embraer - Empresa Brasileira de Aeronautica SA sponsored ADR | 3,030 | | 84,749 |
KVH Industries, Inc. (a) | 200 | | 2,020 |
Lockheed Martin Corp. | 1,800 | | 109,512 |
Precision Castparts Corp. | 1,500 | | 97,260 |
Rockwell Collins, Inc. | 4,300 | | 171,398 |
| | 697,765 |
Air Freight & Logistics - 0.2% |
Expeditors International of Washington, Inc. | 1,000 | | 53,260 |
Ryder System, Inc. | 500 | | 26,820 |
| | 80,080 |
Airlines - 0.3% |
Southwest Airlines Co. | 8,000 | | 125,840 |
Building Products - 0.7% |
American Standard Companies, Inc. (a) | 6,790 | | 264,403 |
Trex Co., Inc. (a) | 400 | | 18,780 |
| | 283,183 |
Commercial Services & Supplies - 2.5% |
Career Education Corp. (a) | 1,900 | | 73,910 |
ChoicePoint, Inc. (a) | 526 | | 23,065 |
Cintas Corp. | 3,898 | | 174,319 |
Corinthian Colleges, Inc. (a) | 900 | | 15,683 |
Common Stocks - continued |
| Shares | | Value (Note 1) |
INDUSTRIALS - continued |
Commercial Services & Supplies - continued |
Education Management Corp. (a) | 1,438 | | $ 47,655 |
Equifax, Inc. | 2,330 | | 64,355 |
H&R Block, Inc. | 2,390 | | 114,003 |
Herman Miller, Inc. | 2,130 | | 52,319 |
HNI Corp. | 800 | | 33,912 |
Manpower, Inc. | 200 | | 9,674 |
Pitney Bowes, Inc. | 3,050 | | 133,499 |
Robert Half International, Inc. | 10,530 | | 284,626 |
| | 1,027,020 |
Construction & Engineering - 0.3% |
Dycom Industries, Inc. (a) | 1,400 | | 40,796 |
Granite Construction, Inc. | 2,200 | | 58,388 |
MasTec, Inc. (a) | 800 | | 6,712 |
| | 105,896 |
Electrical Equipment - 0.1% |
Rockwell Automation, Inc. | 1,100 | | 52,030 |
Industrial Conglomerates - 0.6% |
3M Co. | 1,090 | | 86,753 |
Tyco International Ltd. | 4,720 | | 160,338 |
| | 247,091 |
Machinery - 0.9% |
AGCO Corp. (a) | 2,030 | | 44,234 |
Astec Industries, Inc. (a) | 2,900 | | 48,256 |
Dover Corp. | 2,100 | | 84,945 |
ITT Industries, Inc. | 1,760 | | 149,811 |
Pall Corp. | 700 | | 18,963 |
SPX Corp. | 500 | | 20,555 |
| | 366,764 |
Road & Rail - 0.5% |
Burlington Northern Santa Fe Corp. | 1,000 | | 45,040 |
CSX Corp. | 1,000 | | 38,130 |
Norfolk Southern Corp. | 2,600 | | 89,258 |
Union Pacific Corp. | 600 | | 38,064 |
| | 210,492 |
Common Stocks - continued |
| Shares | | Value (Note 1) |
INDUSTRIALS - continued |
Trading Companies & Distributors - 0.7% |
Fastenal Co. | 4,020 | | $ 245,863 |
MSC Industrial Direct Co., Inc. Class A | 600 | | 21,372 |
| | 267,235 |
TOTAL INDUSTRIALS | | 3,463,396 |
INFORMATION TECHNOLOGY - 26.4% |
Communications Equipment - 5.6% |
Advanced Fibre Communications, Inc. (a) | 1,100 | | 17,985 |
Andrew Corp. (a) | 2,100 | | 29,820 |
Arris Group, Inc. (a) | 500 | | 2,845 |
AudioCodes Ltd. (a) | 8,160 | | 119,952 |
Avocent Corp. (a) | 1,000 | | 37,930 |
CIENA Corp. (a) | 10,000 | | 25,500 |
Corning, Inc. (a) | 17,470 | | 219,773 |
Enterasys Networks, Inc. (a) | 13,270 | | 23,223 |
Extreme Networks, Inc. (a) | 1,700 | | 11,611 |
Finisar Corp. (a) | 26,500 | | 48,495 |
InterDigital Communication Corp. (a) | 1,200 | | 24,420 |
JDS Uniphase Corp. (a) | 9,500 | | 30,115 |
Juniper Networks, Inc. (a) | 33,600 | | 925,008 |
Motorola, Inc. | 1,040 | | 20,030 |
Polycom, Inc. (a) | 870 | | 19,871 |
Powerwave Technologies, Inc. (a) | 3,900 | | 31,543 |
QUALCOMM, Inc. | 11,120 | | 462,814 |
SafeNet, Inc. (a) | 4,789 | | 170,776 |
Sycamore Networks, Inc. (a) | 3,500 | | 13,125 |
Tellabs, Inc. (a) | 5,100 | | 43,605 |
| | 2,278,441 |
Computers & Peripherals - 2.3% |
Apple Computer, Inc. (a) | 2,800 | | 187,740 |
Dell, Inc. (a) | 600 | | 24,312 |
Diebold, Inc. | 4,110 | | 218,652 |
Electronics for Imaging, Inc. (a) | 1,643 | | 27,487 |
Emulex Corp. (a) | 3,900 | | 55,146 |
Hutchinson Technology, Inc. (a) | 500 | | 16,385 |
Lexmark International, Inc. Class A (a) | 3,620 | | 307,338 |
Maxtor Corp. (a) | 3,500 | | 13,370 |
QLogic Corp. (a) | 600 | | 20,634 |
Common Stocks - continued |
| Shares | | Value (Note 1) |
INFORMATION TECHNOLOGY - continued |
Computers & Peripherals - continued |
Seagate Technology | 1,500 | | $ 22,470 |
Western Digital Corp. (a) | 3,100 | | 30,287 |
| | 923,821 |
Electronic Equipment & Instruments - 1.1% |
Arrow Electronics, Inc. (a) | 1,500 | | 36,795 |
CDW Corp. | 1,200 | | 78,864 |
Celestica, Inc. (sub. vtg.) (a) | 900 | | 13,698 |
Ingram Micro, Inc. Class A (a) | 800 | | 15,392 |
KEMET Corp. (a) | 2,700 | | 23,922 |
Molex, Inc. | 100 | | 2,757 |
Sanmina-SCI Corp. (a) | 3,900 | | 34,437 |
Solectron Corp. (a) | 21,500 | | 134,375 |
Symbol Technologies, Inc. | 7,770 | | 117,793 |
| | 458,033 |
Internet Software & Services - 2.5% |
Ask Jeeves, Inc. (a) | 1,200 | | 31,008 |
Google, Inc. Class A | 1,800 | | 329,400 |
Interwoven, Inc. (a) | 2,319 | | 22,494 |
Lastminute.com PLC (a) | 500 | | 981 |
Retek, Inc. (a) | 2,785 | | 16,989 |
VeriSign, Inc. (a) | 6,100 | | 200,690 |
Vignette Corp. (a) | 18,180 | | 23,089 |
Yahoo!, Inc. (a) | 10,180 | | 382,972 |
| | 1,007,623 |
IT Services - 2.0% |
Anteon International Corp. (a) | 400 | | 14,808 |
BearingPoint, Inc. (a) | 1,600 | | 13,920 |
Computer Sciences Corp. (a) | 400 | | 21,640 |
CSG Systems International, Inc. (a) | 65 | | 1,181 |
DST Systems, Inc. (a) | 1,400 | | 68,250 |
Fiserv, Inc. (a) | 2,970 | | 114,375 |
Infosys Technologies Ltd. sponsored ADR | 4,120 | | 296,310 |
Iron Mountain, Inc. (a) | 1,305 | | 39,320 |
Paychex, Inc. | 640 | | 21,222 |
SunGard Data Systems, Inc. (a) | 7,810 | | 207,043 |
The BISYS Group, Inc. (a) | 1,880 | | 30,099 |
| | 828,168 |
Common Stocks - continued |
| Shares | | Value (Note 1) |
INFORMATION TECHNOLOGY - continued |
Office Electronics - 1.2% |
Xerox Corp. (a) | 1,800 | | $ 27,576 |
Zebra Technologies Corp. Class A (a) | 9,100 | | 457,548 |
| | 485,124 |
Semiconductors & Semiconductor Equipment - 8.1% |
Agere Systems, Inc.: | | | |
Class A (a) | 20,030 | | 27,441 |
Class B (a) | 15,700 | | 21,352 |
Altera Corp. (a) | 10,500 | | 238,140 |
Brooks Automation, Inc. (a) | 4,300 | | 66,005 |
Conexant Systems, Inc. (a) | 17,650 | | 35,124 |
Cree, Inc. (a) | 1,100 | | 39,358 |
DuPont Photomasks, Inc. (a) | 100 | | 2,638 |
Integrated Circuit Systems, Inc. (a) | 5,900 | | 139,476 |
Integrated Device Technology, Inc. (a) | 6,990 | | 79,337 |
Intel Corp. | 21,300 | | 476,055 |
Intersil Corp. Class A | 10,100 | | 162,610 |
KLA-Tencor Corp. (a) | 40 | | 1,802 |
Lam Research Corp. (a) | 5,180 | | 134,732 |
Linear Technology Corp. | 3,600 | | 137,376 |
Maxim Integrated Products, Inc. | 5,600 | | 229,376 |
Microchip Technology, Inc. | 24,270 | | 683,929 |
Micron Technology, Inc. (a) | 2,990 | | 33,129 |
Novellus Systems, Inc. (a) | 3,600 | | 96,984 |
NVIDIA Corp. (a) | 1,441 | | 27,566 |
Photronics, Inc. (a) | 8,200 | | 154,488 |
PMC-Sierra, Inc. (a) | 27,030 | | 298,411 |
Rambus, Inc. (a) | 800 | | 18,488 |
Silicon Laboratories, Inc. (a) | 380 | | 11,453 |
STMicroelectronics NV (NY Shares) | 7,100 | | 142,000 |
Taiwan Semiconductor Manufacturing Co. Ltd. sponsored ADR | 136 | | 1,084 |
United Microelectronics Corp. sponsored ADR | 558 | | 1,953 |
Varian Semiconductor Equipment Associates, Inc. (a) | 1,200 | | 42,624 |
| | 3,302,931 |
Software - 3.6% |
Adobe Systems, Inc. | 5,820 | | 352,459 |
BEA Systems, Inc. (a) | 9,250 | | 74,740 |
BMC Software, Inc. (a) | 1,700 | | 31,586 |
Citrix Systems, Inc. (a) | 4,470 | | 105,537 |
Cognos, Inc. (a) | 500 | | 19,508 |
Concord Communications, Inc. (a) | 100 | | 929 |
Common Stocks - continued |
| Shares | | Value (Note 1) |
INFORMATION TECHNOLOGY - continued |
Software - continued |
E.piphany, Inc. (a) | 3,054 | | $ 13,804 |
FileNET Corp. (a) | 1,898 | | 50,885 |
Jack Henry & Associates, Inc. | 1,290 | | 24,871 |
Macrovision Corp. (a) | 100 | | 2,655 |
Manhattan Associates, Inc. (a) | 304 | | 7,387 |
Mercury Interactive Corp. (a) | 6,100 | | 278,221 |
Parametric Technology Corp. (a) | 12,800 | | 74,880 |
Secure Computing Corp. (a) | 167 | | 1,740 |
Siebel Systems, Inc. (a) | 19,619 | | 197,760 |
VERITAS Software Corp. (a) | 10,800 | | 236,520 |
| | 1,473,482 |
TOTAL INFORMATION TECHNOLOGY | | 10,757,623 |
MATERIALS - 2.7% |
Chemicals - 0.9% |
Dow Chemical Co. | 1,600 | | 80,752 |
Ferro Corp. | 2,500 | | 57,200 |
Great Lakes Chemical Corp. | 1,500 | | 43,950 |
International Flavors & Fragrances, Inc. | 1,200 | | 48,600 |
Praxair, Inc. | 2,700 | | 121,230 |
| | 351,732 |
Construction Materials - 0.1% |
Vulcan Materials Co. | 800 | | 41,480 |
Containers & Packaging - 0.7% |
Owens-Illinois, Inc. (a) | 3,410 | | 71,337 |
Pactiv Corp. (a) | 1,500 | | 37,275 |
Sealed Air Corp. (a) | 3,370 | | 173,252 |
| | 281,864 |
Metals & Mining - 1.0% |
Freeport-McMoRan Copper & Gold, Inc. Class B | 3,050 | | 119,347 |
Massey Energy Co. | 2,800 | | 98,336 |
Metal Management, Inc. (a) | 600 | | 15,768 |
Nucor Corp. | 1,000 | | 52,900 |
Phelps Dodge Corp. | 1,400 | | 135,982 |
| | 422,333 |
TOTAL MATERIALS | | 1,097,409 |
Common Stocks - continued |
| Shares | | Value (Note 1) |
TELECOMMUNICATION SERVICES - 0.8% |
Diversified Telecommunication Services - 0.1% |
Philippine Long Distance Telephone Co. sponsored ADR (a) | 1,000 | | $ 24,520 |
XO Communications, Inc. (a) | 1,600 | | 4,368 |
| | 28,888 |
Wireless Telecommunication Services - 0.7% |
Alamosa Holdings, Inc. (a) | 1,800 | | 19,620 |
America Movil SA de CV sponsored ADR | 600 | | 28,026 |
InPhonic, Inc. | 1,700 | | 43,367 |
KDDI Corp. | 15 | | 74,056 |
NII Holdings, Inc. (a) | 500 | | 21,630 |
USA Mobility, Inc. (a) | 1,400 | | 50,904 |
Wireless Facilities, Inc. (a) | 5,900 | | 48,852 |
| | 286,455 |
TOTAL TELECOMMUNICATION SERVICES | | 315,343 |
TOTAL COMMON STOCKS (Cost $35,302,811) | 39,608,666 |
Money Market Funds - 2.8% |
Fidelity Cash Central Fund, 1.98% (b)
(Cost $1,130,579) | 1,130,579 | | 1,130,579 |
TOTAL INVESTMENT PORTFOLIO - 100.1% (Cost $36,433,390) | | 40,739,245 |
NET OTHER ASSETS - (0.1)% | | (33,066) |
NET ASSETS - 100% | $ 40,706,179 |
Legend |
(a) Non-income producing |
(b) Affiliated fund that is available only to investment companies and other accounts managed by Fidelity Investments. The rate quoted is the annualized seven-day yield of the fund at period end. A complete listing of the fund's holdings as of its most recent fiscal year end is available upon request. |
Income Tax Information |
At November 30, 2004, the fund had a capital loss carryforward of approximately $11,252,000 of which $4,312,000 and $6,940,000 will expire on November 30, 2009 and 2010, respectively. |
See accompanying notes which are an integral part of the financial statements.
Annual Report
Financial Statements
Statement of Assets and Liabilities
November 30, 2004 |
| | |
Assets | | |
Investment in securities, at value (cost $36,433,390) - See accompanying schedule | | $ 40,739,245 |
Receivable for investments sold | | 129,337 |
Receivable for fund shares sold | | 48,746 |
Dividends receivable | | 16,866 |
Interest receivable | | 1,699 |
Prepaid expenses | | 166 |
Receivable from investment adviser for expense reductions | | 6,801 |
Other receivables | | 4,892 |
Total assets | | 40,947,752 |
| | |
Liabilities | | |
Payable for investments purchased | $ 71,860 | |
Payable for fund shares redeemed | 72,600 | |
Accrued management fee | 21,170 | |
Transfer agent fee payable | 19,512 | |
Distribution fees payable | 23,165 | |
Other affiliated payables | 2,750 | |
Other payables and accrued expenses | 30,516 | |
Total liabilities | | 241,573 |
| | |
Net Assets | | $ 40,706,179 |
Net Assets consist of: | | |
Paid in capital | | $ 47,812,848 |
Accumulated undistributed net realized gain (loss) on investments and foreign currency transactions | | (11,412,582) |
Net unrealized appreciation (depreciation) on investments and assets and liabilities in foreign currencies | | 4,305,913 |
Net Assets | | $ 40,706,179 |
See accompanying notes which are an integral part of the financial statements.
Annual Report
Financial Statements - continued
Statement of Assets and Liabilities - continued
November 30, 2004 |
| | |
Calculation of Maximum Offering Price
Class A:
Net Asset Value and redemption price per share
($6,227,314 ÷ 723,113 shares) | | $ 8.61 |
| | |
Maximum offering price per share (100/94.25 of $8.61) | | $ 9.14 |
Class T:
Net Asset Value and redemption price per share
($15,101,116 ÷ 1,772,461 shares) | | $ 8.52 |
| | |
Maximum offering price per share (100/96.50 of $8.52) | | $ 8.83 |
Class B:
Net Asset Value and offering price per share
($9,593,481 ÷ 1,147,730 shares)A | | $ 8.36 |
| | |
Class C:
Net Asset Value and offering price per share
($9,135,812 ÷ 1,091,273 shares)A | | $ 8.37 |
| | |
Institutional Class:
Net Asset Value, offering price and redemption price per share ($648,456 ÷ 74,311 shares) | | $ 8.73 |
A Redemption price per share is equal to net asset value less any applicable contingent deferred sales charge.
See accompanying notes which are an integral part of the financial statements.
Annual Report
Statement of Operations
Year ended November 30, 2004 |
| | |
Investment Income | | |
Dividends | | $ 148,396 |
Interest | | 10,824 |
Security lending | | 1,490 |
Total income | | 160,710 |
| | |
Expenses | | |
Management fee | $ 236,989 | |
Transfer agent fees | 236,776 | |
Distribution fees | 263,312 | |
Accounting and security lending fees | 35,416 | |
Non-interested trustees' compensation | 198 | |
Custodian fees and expenses | 17,165 | |
Registration fees | 54,121 | |
Audit | 34,872 | |
Legal | 1,814 | |
Miscellaneous | 8,871 | |
Total expenses before reductions | 889,534 | |
Expense reductions | (169,206) | 720,328 |
Net investment income (loss) | | (559,618) |
Realized and Unrealized Gain (Loss) Net realized gain (loss) on: | | |
Investment securities | 3,515,901 | |
Foreign currency transactions | 145 | |
Total net realized gain (loss) | | 3,516,046 |
Change in net unrealized appreciation (depreciation) on: Investment securities | (473,602) | |
Assets and liabilities in foreign currencies | 49 | |
Total change in net unrealized appreciation (depreciation) | | (473,553) |
Net gain (loss) | | 3,042,493 |
Net increase (decrease) in net assets resulting from operations | | $ 2,482,875 |
See accompanying notes which are an integral part of the financial statements.
Annual Report
Financial Statements - continued
Statement of Changes in Net Assets
| Year ended
November 30,
2004 | Year ended
November 30,
2003 |
Increase (Decrease) in Net Assets | | |
Operations | | |
Net investment income (loss) | $ (559,618) | $ (374,848) |
Net realized gain (loss) | 3,516,046 | 2,514,920 |
Change in net unrealized appreciation (depreciation) | (473,553) | 4,055,009 |
Net increase (decrease) in net assets resulting
from operations | 2,482,875 | 6,195,081 |
Share transactions - net increase (decrease) | 4,161,402 | 1,324,213 |
Total increase (decrease) in net assets | 6,644,277 | 7,519,294 |
| | |
Net Assets | | |
Beginning of period | 34,061,902 | 26,542,608 |
End of period | $ 40,706,179 | $ 34,061,902 |
See accompanying notes which are an integral part of the financial statements.
Annual Report
Financial Highlights - Class A
Years ended November 30, | 2004 | 2003 | 2002 | 2001 | 2000F |
Selected Per-Share Data | | | | | |
Net asset value, beginning of period | $ 8.02 | $ 6.47 | $ 8.08 | $ 9.05 | $ 10.00 |
Income from Investment Operations | | | | | |
Net investment income (loss)E | (.09) | (.06) | (.08) | (.01) | -H |
Net realized and unrealized gain (loss) | .68 | 1.61 | (1.53) | (.95) | (.95) |
Total from investment operations | .59 | 1.55 | (1.61) | (.96) | (.95) |
Distributions from net realized gain | - | - | - | (.01) | - |
Net asset value, end of period | $ 8.61 | $ 8.02 | $ 6.47 | $ 8.08 | $ 9.05 |
Total ReturnB,C,D | 7.36% | 23.96% | (19.93)% | (10.62)% | (9.50)% |
Ratios to Average Net AssetsG | | | | | |
Expenses before expense reductions | 1.90% | 2.25% | 2.05% | 2.06% | 31.94%A |
Expenses net of voluntary waivers, if any | 1.50% | 1.54% | 1.69% | 1.75% | 1.75%A |
Expenses net of all reductions | 1.45% | 1.47% | 1.49% | 1.71% | 1.75%A |
Net investment income (loss) | (1.03)% | (.89)% | (1.07)% | (.14)% | .99%A |
Supplemental Data | | | | | |
Net assets, end of period (000 omitted) | $ 6,227 | $ 4,177 | $ 2,620 | $ 3,320 | $ 1,789 |
Portfolio turnover rate | 94% | 158% | 473% | 481% | 139%A |
A Annualized
B Total returns for periods of less than one year are not annualized.
C Total returns would have been lower had certain expenses not been reduced during the periods shown.
D Total returns do not include the effect of the sales charges.
E Calculated based on average shares outstanding during the period.
F For the period November 13, 2000 (commencement of operations) to November 30, 2000.
G Expense ratios reflect operating expenses of the class. Expenses before reductions do not reflect amounts reimbursed by the investment adviser or reductions from brokerage service arrangements or other expense offset arrangements and do not represent the amount paid by the class during periods when reimbursements or reductions occur. Expense ratios before reductions for start-up periods may not be representative of longer-term operating periods. Expenses net of any voluntary waivers reflect expenses after reimbursement by the investment adviser but prior to reductions from brokerage service arrangements or other expense offset arrangements. Expenses net of all reductions represent the net expenses paid by the class.
H Amount represents less than $.01 per share.
See accompanying notes which are an integral part of the financial statements.
Annual Report
Financial Highlights - Class T
Years ended November 30, | 2004 | 2003 | 2002 | 2001 | 2000F |
Selected Per-Share Data | | | | | |
Net asset value, beginning of period | $ 7.95 | $ 6.43 | $ 8.06 | $ 9.05 | $ 10.00 |
Income from Investment Operations | | | | | |
Net investment income (loss)E | (.11) | (.08) | (.10) | (.03) | -H |
Net realized and unrealized gain (loss) | .68 | 1.60 | (1.53) | (.95) | (.95) |
Total from investment operations | .57 | 1.52 | (1.63) | (.98) | (.95) |
Distributions from net realized gain | - | - | - | (.01) | - |
Net asset value, end of period | $ 8.52 | $ 7.95 | $ 6.43 | $ 8.06 | $ 9.05 |
Total ReturnB,C,D | 7.17% | 23.64% | (20.22)% | (10.84)% | (9.50)% |
Ratios to Average Net AssetsG | | | | | |
Expenses before expense reductions | 2.25% | 2.47% | 2.16% | 2.30% | 32.36%A |
Expenses net of voluntary waivers, if any | 1.75% | 1.79% | 1.92% | 2.00% | 2.00%A |
Expenses net of all reductions | 1.71% | 1.72% | 1.72% | 1.96% | 2.00%A |
Net investment income (loss) | (1.28)% | (1.14)% | (1.29)% | (.39)% | .74%A |
Supplemental Data | | | | | |
Net assets, end of period (000 omitted) | $ 15,101 | $ 12,458 | $ 10,511 | $ 14,165 | $ 2,767 |
Portfolio turnover rate | 94% | 158% | 473% | 481% | 139%A |
A Annualized
B Total returns for periods of less than one year are not annualized.
C Total returns would have been lower had certain expenses not been reduced during the periods shown.
D Total returns do not include the effect of the sales charges.
E Calculated based on average shares outstanding during the period.
F For the period November 13, 2000 (commencement of operations) to November 30, 2000.
G Expense ratios reflect operating expenses of the class. Expenses before reductions do not reflect amounts reimbursed by the investment adviser or reductions from brokerage service arrangements or other expense offset arrangements and do not represent the amount paid by the class during periods when reimbursements or reductions occur. Expense ratios before reductions for start-up periods may not be representative of longer-term operating periods. Expenses net of any voluntary waivers reflect expenses after reimbursement by the investment adviser but prior to reductions from brokerage service arrangements or other expense offset arrangements. Expenses net of all reductions represent the net expenses paid by the class.
H Amount represents less than $.01 per share.
See accompanying notes which are an integral part of the financial statements.
Annual Report
Financial Highlights - Class B
Years ended November 30, | 2004 | 2003 | 2002 | 2001 | 2000F |
Selected Per-Share Data | | | | | |
Net asset value, beginning of period | $ 7.84 | $ 6.37 | $ 8.02 | $ 9.05 | $ 10.00 |
Income from Investment Operations | | | | | |
Net investment income (loss)E | (.14) | (.11) | (.13) | (.08) | -H |
Net realized and unrealized gain (loss) | .66 | 1.58 | (1.52) | (.94) | (.95) |
Total from investment operations | .52 | 1.47 | (1.65) | (1.02) | (.95) |
Distributions from net realized gain | - | - | - | (.01) | - |
Net asset value, end of period | $ 8.36 | $ 7.84 | $ 6.37 | $ 8.02 | $ 9.05 |
Total ReturnB,C,D | 6.63% | 23.08% | (20.57)% | (11.29)% | (9.50)% |
Ratios to Average Net AssetsG | | | | | |
Expenses before expense reductions | 2.67% | 2.92% | 2.73% | 2.86% | 32.87%A |
Expenses net of voluntary waivers, if any | 2.25% | 2.25% | 2.43% | 2.50% | 2.50%A |
Expenses net of all reductions | 2.21% | 2.18% | 2.23% | 2.46% | 2.50%A |
Net investment income (loss) | (1.78)% | (1.60)% | (1.81)% | (.89)% | .24%A |
Supplemental Data | | | | | |
Net assets, end of period (000 omitted) | $ 9,593 | $ 8,422 | $ 6,262 | $ 8,038 | $ 1,659 |
Portfolio turnover rate | 94% | 158% | 473% | 481% | 139%A |
A Annualized
B Total returns for periods of less than one year are not annualized.
C Total returns would have been lower had certain expenses not been reduced during the periods shown.
D Total returns do not include the effect of the contingent deferred sales charge.
E Calculated based on average shares outstanding during the period.
F For the period November 13, 2000 (commencement of operations) to November 30, 2000.
G Expense ratios reflect operating expenses of the class. Expenses before reductions do not reflect amounts reimbursed by the investment adviser or reductions from brokerage service arrangements or other expense offset arrangements and do not represent the amount paid by the class during periods when reimbursements or reductions occur. Expense ratios before reductions for start-up periods may not be representative of longer-term operating periods. Expenses net of any voluntary waivers reflect expenses after reimbursement by the investment adviser but prior to reductions from brokerage service arrangements or other expense offset arrangements. Expenses net of all reductions represent the net expenses paid by the class.
H Amount represents less than $.01 per share.
See accompanying notes which are an integral part of the financial statements.
Annual Report
Financial Highlights - Class C
Years ended November 30, | 2004 | 2003 | 2002 | 2001 | 2000F |
Selected Per-Share Data | | | | | |
Net asset value, beginning of period | $ 7.85 | $ 6.38 | $ 8.03 | $ 9.05 | $ 10.00 |
Income from Investment Operations | | | | | |
Net investment income (loss)E | (.14) | (.11) | (.13) | (.08) | -H |
Net realized and unrealized gain (loss) | .66 | 1.58 | (1.52) | (.93) | (.95) |
Total from investment operations | .52 | 1.47 | (1.65) | (1.01) | (.95) |
Distributions from net realized gain | - | - | - | (.01) | - |
Net asset value, end of period | $ 8.37 | $ 7.85 | $ 6.38 | $ 8.03 | $ 9.05 |
Total ReturnB,C,D | 6.62% | 23.04% | (20.55)% | (11.18)% | (9.50)% |
Ratios to Average Net AssetsG | | | | | |
Expenses before expense reductions | 2.52% | 2.77% | 2.58% | 2.79% | 32.69%A |
Expenses net of voluntary waivers, if any | 2.25% | 2.25% | 2.36% | 2.50% | 2.50%A |
Expenses net of all reductions | 2.21% | 2.18% | 2.16% | 2.46% | 2.50%A |
Net investment income (loss) | (1.78)% | (1.61)% | (1.74)% | (.89)% | .24%A |
Supplemental Data | | | | | |
Net assets, end of period (000 omitted) | $ 9,136 | $ 8,427 | $ 6,636 | $ 8,532 | $ 1,224 |
Portfolio turnover rate | 94% | 158% | 473% | 481% | 139%A |
A Annualized
B Total returns for periods of less than one year are not annualized.
C Total returns would have been lower had certain expenses not been reduced during the periods shown.
D Total returns do not include the effect of the contingent deferred sales charge.
E Calculated based on average shares outstanding during the period.
F For the period November 13, 2000 (commencement of operations) to November 30, 2000.
G Expense ratios reflect operating expenses of the class. Expenses before reductions do not reflect amounts reimbursed by the investment adviser or reductions from brokerage service arrangements or other expense offset arrangements and do not represent the amount paid by the class during periods when reimbursements or reductions occur. Expense ratios before reductions for start-up periods may not be representative of longer-term operating periods. Expenses net of any voluntary waivers reflect expenses after reimbursement by the investment adviser but prior to reductions from brokerage service arrangements or other expense offset arrangements. Expenses net of all reductions represent the net expenses paid by the class.
H Amount represents less than $.01 per share.
See accompanying notes which are an integral part of the financial statements.
Annual Report
Financial Highlights - Institutional Class
Years ended November 30, | 2004 | 2003 | 2002 | 2001 | 2000E |
Selected Per-Share Data | | | | | |
Net asset value, beginning of period | $ 8.10 | $ 6.52 | $ 8.11 | $ 9.06 | $ 10.00 |
Income from Investment Operations | | | | | |
Net investment income (loss)D | (.07) | (.04) | (.05) | .01 | .01 |
Net realized and unrealized gain (loss) | .70 | 1.62 | (1.54) | (.95) | (.95) |
Total from investment operations | .63 | 1.58 | (1.59) | (.94) | (.94) |
Distributions from net realized gain | - | - | - | (.01) | - |
Net asset value, end of period | $ 8.73 | $ 8.10 | $ 6.52 | $ 8.11 | $ 9.06 |
Total ReturnB,C | 7.78% | 24.23% | (19.61)% | (10.39)% | (9.40)% |
Ratios to Average Net AssetsF | | | | | |
Expenses before expense reductions | 1.35% | 1.61% | 1.43% | 1.73% | 31.51%A |
Expenses net of voluntary waivers, if any | 1.25% | 1.25% | 1.27% | 1.50% | 1.50%A |
Expenses net of all reductions | 1.20% | 1.18% | 1.07% | 1.46% | 1.50%A |
Net investment income (loss) | (.78)% | (.61)% | (.64)% | .11% | 1.24%A |
Supplemental Data | | | | | |
Net assets, end of period (000 omitted) | $ 648 | $ 579 | $ 513 | $ 761 | $ 325 |
Portfolio turnover rate | 94% | 158% | 473% | 481% | 139%A |
A Annualized
B Total returns for periods of less than one year are not annualized.
C Total returns would have been lower had certain expenses not been reduced during the periods shown.
D Calculated based on average shares outstanding during the period.
E For the period November 13, 2000 (commencement of operations) to November 30, 2000.
F Expense ratios reflect operating expenses of the class. Expenses before reductions do not reflect amounts reimbursed by the investment adviser or reductions from brokerage service arrangements or other expense offset arrangements and do not represent the amount paid by the class during periods when reimbursements or reductions occur. Expense ratios before reductions for start-up periods may not be representative of longer-term operating periods. Expenses net of any voluntary waivers reflect expenses after reimbursement by the investment adviser but prior to reductions from brokerage service arrangements or other expense offset arrangements. Expenses net of all reductions represent the net expenses paid by the class.
See accompanying notes which are an integral part of the financial statements.
Annual Report
Notes to Financial Statements
For the period ended November 30, 2004
1. Significant Accounting Policies.
Fidelity Advisor Aggressive Growth Fund (the fund) is a fund of Fidelity Securities Fund (the trust) and is authorized to issue an unlimited number of shares. The trust is registered under the Investment Company Act of 1940, as amended (the 1940 Act), as an open-end management investment company organized as a Massachusetts business trust.
The fund offers Class A, Class T, Class B, Class C and Institutional Class shares, each of which has equal rights as to assets and voting privileges. Each class has exclusive voting rights with respect to matters that affect that class. Class B shares will automatically convert to Class A shares after a holding period of seven years from the initial date of purchase. Investment income, realized and unrealized capital gains and losses, the common expenses of the fund, and certain fund-level expense reductions, if any, are allocated on a pro rata basis to each class based on the relative net assets of each class to the total net assets of the fund. Each class differs with respect to transfer agent and distribution and service plan fees incurred. Certain expense reductions also differ by class.
The financial statements have been prepared in conformity with accounting principles generally accepted in the United States of America, which require management to make certain estimates and assumptions at the date of the financial statements. The following summarizes the significant accounting policies of the fund:
Security Valuation. Net asset value per share (NAV calculation) is calculated as of the close of business of the New York Stock Exchange, normally 4:00 p.m. Eastern time. Equity securities, including restricted securities, for which market quotations are available are valued at the last sale price or official closing price (closing bid price or last evaluated quote if no sale has occurred) on the primary market or exchange on which they trade. If prices are not readily available or do not accurately reflect fair value for a security, or if a security's value has been materially affected by events occurring after the close of the exchange or market on which the security is principally traded, that security may be valued by another method that the Board of Trustees believes accurately reflects fair value. A security's valuation may differ depending on the method used for determining value. Price movements in futures contracts and ADRs, market and trading trends, the bid/ask quotes of brokers and off-exchange institutional trading may be reviewed in the course of making a good faith determination of a security's fair value. Short-term securities with remaining maturities of sixty days or less for which quotations are not readily available are valued on the basis of amortized cost. Investments in open-end investment companies are valued at their net asset value each business day.
Annual Report
Notes to Financial Statements - continued
1. Significant Accounting Policies - continued
Foreign Currency. The fund uses foreign currency contracts to facilitate transactions in foreign-denominated securities. Losses from these transactions may arise from changes in the value of the foreign currency or if the counterparties do not perform under the contracts' terms.
Foreign-denominated assets, including investment securities, and liabilities are translated into U.S. dollars at the exchange rate at period end. Purchases and sales of investment securities, income and dividends received and expenses denominated in foreign currencies are translated into U.S. dollars at the exchange rate in effect on the transaction date.
The effects of exchange rate fluctuations on investments are included with the net realized and unrealized gain (loss) on investment securities. Other foreign currency transactions resulting in realized and unrealized gain (loss) are disclosed separately.
Investment Transactions and Income. Security transactions are accounted for as of trade date. Gains and losses on securities sold are determined on the basis of identified cost and may include proceeds received from litigation. Dividend income is recorded on the ex-dividend date, except for certain dividends from foreign securities where the ex-dividend date may have passed, which are recorded as soon as the fund is informed of the ex-dividend date. Non-cash dividends included in dividend income, if any, are recorded at the fair market value of the securities received. Distributions received on securities that represent a return of capital or capital gain are recorded as a reduction of cost of investments and/or as a realized gain. The fund estimates the components of distributions received that may be considered return of capital distributions or capital gain distributions. Interest income is accrued as earned. Interest income includes coupon interest and amortization of premium and accretion of discount on debt securities. Investment income is recorded net of foreign taxes withheld where recovery of such taxes is uncertain.
Expenses. Most expenses of the trust can be directly attributed to a fund. Expenses which cannot be directly attributed are apportioned among the funds in the trust.
Income Tax Information and Distributions to Shareholders. Each year, the fund intends to qualify as a regulated investment company by distributing all of its taxable income and realized gains under Subchapter M of the Internal Revenue Code. As a result, no provision for income taxes is required in the accompanying financial statements. Foreign taxes are provided for based on the fund's understanding of the tax rules and rates that exist in the foreign markets in which it invests.
Annual Report
1. Significant Accounting Policies - continued
Income Tax Information and Distributions to Shareholders - continued
Distributions are recorded on the ex-dividend date. Income dividends and capital gain distributions are declared separately for each class. Income and capital gain distributions are determined in accordance with income tax regulations, which may differ from generally accepted accounting principles. Capital accounts within the financial statements are adjusted for permanent book-tax differences. These adjustments have no impact on net assets or the results of operations. Temporary book-tax differences will reverse in a subsequent period.
Book-tax differences are primarily due to foreign currency transactions, net operating losses, capital loss carryforwards and losses deferred due to wash sales.
The tax-basis components of distributable earnings and the federal tax cost as of period end were as follows:
Unrealized appreciation | $ 6,709,458 | |
Unrealized depreciation | (2,564,356) | |
Net unrealized appreciation (depreciation) | 4,145,102 | |
Capital loss carryforward | (11,251,773) | |
| | |
Cost for federal income tax purposes | $ 36,594,143 | |
2. Operating Policies.
Repurchase Agreements. Fidelity Management & Research Company (FMR) has received an Exemptive Order from the Securities and Exchange Commission (the SEC) which permits the fund and other affiliated entities of FMR to transfer uninvested cash balances into joint trading accounts. These accounts are then invested in repurchase agreements that are collateralized by U.S. Treasury or Government obligations. The fund may also invest directly with institutions, in repurchase agreements that are collateralized by commercial paper obligations and corporate obligations. Collateral is held in segregated accounts with custodian banks and may be obtained in the event of a default of the counterparty. Collateral is marked-to-market daily and maintained at a value at least equal to the principal amount of the repurchase agreement (including accrued interest).
3. Purchases and Sales of Investments.
Purchases and sales of securities, other than short-term securities and U.S. government securities, aggregated $38,658,445 and $34,956,184, respectively.
Annual Report
Notes to Financial Statements - continued
4. Fees and Other Transactions with Affiliates.
Management Fee. FMR and its affiliates provide the fund with investment management related services for which the fund pays a monthly management fee. The management fee is the sum of an individual fund fee rate that is based on an annual rate of .35% of the fund's average net assets and a group fee rate that averaged .28% during the period. The group fee rate is based upon the average net assets of all the mutual funds advised by FMR. The group fee rate decreases as assets under management increase and increases as assets under management decrease. For the period, the total annual management fee rate was .63% of the fund's average net assets.
Distribution and Service Plan. In accordance with Rule 12b-1 of the 1940 Act, the fund has adopted separate Distribution and Service Plans for each class of shares. Certain classes pay Fidelity Distributors Corporation (FDC), an affiliate of FMR, separate Distribution and Service Fees, each of which is based on an annual percentage of each class' average net assets. In addition, FDC may pay financial intermediaries for selling shares of the fund and providing shareholder support services. For the period, the Distribution and Service Fee rates and the total amounts paid to and retained by FDC were as follows:
| Distribution
Fee | Service
Fee | Paid to
FDC | Retained
by FDC |
Class A | 0% | .25% | $ 13,408 | $ 85 |
Class T | .25% | .25% | 69,244 | - |
Class B | .75% | .25% | 90,272 | 67,703 |
Class C | .75% | .25% | 90,388 | 17,563 |
| | | $ 263,312 | $ 85,351 |
Sales Load. FDC receives a front-end sales charge of up to 5.75% for selling Class A shares, and 3.50% for selling Class T shares, some of which is paid to financial intermediaries for selling shares of the fund. FDC receives the proceeds of contingent deferred sales charges levied on Class A, Class T, Class B, and Class C redemptions. These charges depend on the holding period. The deferred sales charges range from 5% to 1% for Class B, 1% for Class C, and .25% for certain purchases of Class A and Class T shares.
For the period, sales charge amounts retained by FDC were as follows:
| Retained
by FDC |
Class A | $ 16,284 |
Class T | 12,714 |
Class B* | 45,970 |
Class C* | 2,682 |
| $ 77,650 |
* When Class B and Class C shares are initially sold, FDC pays commissions from its own resources to financial intermediaries through which the sales are made.
Annual Report
4. Fees and Other Transactions with Affiliates - continued
Transfer Agent Fees. Fidelity Investments Institutional Operations Company, Inc. (FIIOC), an affiliate of FMR, is the transfer, dividend disbursing and shareholder servicing agent for each class of the fund. FIIOC receives account fees and asset-based fees that vary according to the account size and type of account of the shareholders of the respective classes of the fund. FIIOC pays for typesetting, printing and mailing of shareholder reports, except proxy statements. For the period, the total transfer agent fees paid by each class to FIIOC were as follows:
| Amount | % of
Average
Net Assets |
Class A | $ 33,387 | .62 |
Class T | 99,338 | .72 |
Class B | 57,498 | .64 |
Class C | 44,539 | .49 |
Institutional Class | 2,014 | .32 |
| $ 236,776 | |
Accounting Fees. Fidelity Service Company, Inc. (FSC), an affiliate of FMR, maintains the fund's accounting records. The fee is based on the level of average net assets for the month.
Central Funds. The fund may invest in affiliated Central Funds managed by Fidelity Investments Money Management, Inc. (FIMM), an affiliate of FMR. The Central Funds are open-end investment companies available only to investment companies and other accounts managed by FMR and its affiliates. The Central Funds seek preservation of capital and current income and do not pay a management fee. Income distributions earned by the fund are recorded as income in the accompanying financial statements and totaled $11,404 for the period.
Brokerage Commissions. The fund placed a portion of its portfolio transactions with brokerage firms which are affiliates of the investment adviser. The commissions paid to these affiliated firms were $4,028 for the period.
5. Committed Line of Credit.
The fund participates with other funds managed by FMR in a $4.2 billion credit facility (the "line of credit") to be utilized for temporary or emergency purposes to fund shareholder redemptions or for other short-term liquidity purposes. The fund has agreed to pay commitment fees on its pro rata portion of the line of credit. During the period, there were no borrowings on this line of credit.
Annual Report
Notes to Financial Statements - continued
6. Security Lending.
The fund lends portfolio securities from time to time in order to earn additional income. The fund receives collateral (in the form of U.S. Treasury obligations, letters of credit and/or cash) against the loaned securities and maintains collateral in an amount not less than 100% of the market value of the loaned securities during the period of the loan. The market value of the loaned securities is determined at the close of business of the fund and any additional required collateral is delivered to the fund on the next business day. If the borrower defaults on its obligation to return the securities loaned because of insolvency or other reasons, a fund could experience delays and costs in recovering the securities loaned or in gaining access to the collateral. Cash collateral is invested in cash equivalents. At period end there were no security loans outstanding.
7. Expense Reductions.
FMR voluntarily agreed to reimburse each class to the extent annual operating expenses exceeded certain levels of average net assets as noted in the table below. Some expenses, for example interest expense, are excluded from this reimbursement.
| Expense
Limitations | Reimbursement
from adviser |
Class A | 1.50% | $ 21,629 |
Class T | 1.75% | 68,762 |
Class B | 2.25% | 37,379 |
Class C | 2.25% | 24,471 |
Institutional Class | 1.25% | 653 |
| | $ 152,894 |
Many of the brokers with whom FMR places trades on behalf of the fund provided services to the fund in addition to trade execution. These services included payments of certain expenses on behalf of the fund totaling $16,312 for the period.
Annual Report
8. Share Transactions.
Transactions for each class of shares were as follows:
| Shares | Dollars |
Years ended November 30, | 2004 | 2003 | 2004 | 2003 |
Class A | | | | |
Shares sold | 377,272 | 244,577 | $ 3,139,679 | $ 1,722,170 |
Shares redeemed | (175,236) | (128,450) | (1,453,350) | (880,316) |
Net increase (decrease) | 202,036 | 116,127 | $ 1,686,329 | $ 841,854 |
Class T | | | | |
Shares sold | 758,262 | 442,489 | $ 6,209,847 | $ 3,023,259 |
Shares redeemed | (552,792) | (509,774) | (4,525,646) | (3,391,934) |
Net increase (decrease) | 205,470 | (67,285) | $ 1,684,201 | $ (368,675) |
Class B | | | | |
Shares sold | 359,634 | 340,312 | $ 2,916,093 | $ 2,312,985 |
Shares redeemed | (286,300) | (249,139) | (2,305,579) | (1,653,902) |
Net increase (decrease) | 73,334 | 91,173 | $ 610,514 | $ 659,083 |
Class C | | | | |
Shares sold | 368,284 | 327,135 | $ 2,975,514 | $ 2,159,687 |
Shares redeemed | (350,351) | (293,843) | (2,819,767) | (1,926,688) |
Net increase (decrease) | 17,933 | 33,292 | $ 155,747 | $ 232,999 |
Institutional Class | | | | |
Shares sold | 22,481 | 11,899 | $ 187,161 | $ 86,133 |
Shares redeemed | (19,658) | (19,157) | (162,550) | (127,181) |
Net increase (decrease) | 2,823 | (7,258) | $ 24,611 | $ (41,048) |
Annual Report
Report of Independent Registered Public Accounting Firm
To the Trustees of Fidelity Securities Fund and the Shareholders of Fidelity Advisor Aggressive Growth Fund:
In our opinion, the accompanying statement of assets and liabilities, including the schedule of investments, and the related statements of operations and of changes in net assets and the financial highlights present fairly, in all material respects, the financial position of Fidelity Advisor Aggressive Growth Fund (a fund of Fidelity Securities Fund) at November 30, 2004 and the results of its operations, the changes in its net assets and the financial highlights for the periods indicated, in conformity with accounting principles generally accepted in the United States of America. These financial statements and financial highlights (hereafter referred to as "financial statements") are the responsibility of the Fidelity Advisor Aggressive Growth Fund's management; our responsibility is to express an opinion on these financial statements based on our audits. We conducted our audits of these financial statements in accordance with the standards of the Public Company Accounting Oversight Board (United States). Those standards require that we plan and perform the audit to obtain reasonable assurance about whether the financial statements are free of material misstatement. An audit includes examining, on a test basis, evidence supporting the amounts and disclosures in the financial statements, assessing the accounting principles used and significant estimates made by management, and evaluating the overall financial statement presentation. We believe that our audits, which included confirmation of securities at November 30, 2004 by correspondence with the custodian and brokers, provide a reasonable basis for our opinion.
/s/PricewaterhouseCoopers LLP
PricewaterhouseCoopers LLP
Boston, Massachusetts
January 11, 2005
Annual Report
Trustees and Officers
The Trustees, Member of the Advisory Board, and executive officers of the trust and fund, as applicable, are listed below. The Board of Trustees governs the fund and is responsible for protecting the interests of shareholders. The Trustees are experienced executives who meet periodically throughout the year to oversee the fund's activities, review contractual arrangements with companies that provide services to the fund, and review the fund's performance. Except for William O. McCoy, Dennis J. Dirks, and Kenneth L. Wolfe, each of the Trustees oversees 301 funds advised by FMR or an affiliate. Mr. McCoy oversees 303 funds advised by FMR or an affiliate. Mr. Dirks and Mr. Wolfe oversee 223 funds advised by FMR or an affiliate.
The Trustees hold office without limit in time except that (a) any Trustee may resign; (b) any Trustee may be removed by written instrument, signed by at least two-thirds of the number of Trustees prior to such removal; (c) any Trustee who requests to be retired or who has become incapacitated by illness or injury may be retired by written instrument signed by a majority of the other Trustees; and (d) any Trustee may be removed at any special meeting of shareholders by a two-thirds vote of the outstanding voting securities of the trust. In any event, each non-interested Trustee shall retire not later than the last day of the calendar year in which his or her 72nd birthday occurs. The executive officers and Advisory Board Member hold office without limit in time, except that any officer and Advisory Board Member may resign or may be removed by a vote of a majority of the Trustees at any regular meeting or any special meeting of the Trustees. Except as indicated, each individual has held the office shown or other offices in the same company for the past five years.
The fund's Statement of Additional Information (SAI) includes more information about the Trustees. To request a free copy, call Fidelity at 1-877-208-0098.
Interested Trustees*:
Correspondence intended for each Trustee who is an "interested person" (as defined in the 1940 Act) may be sent to Fidelity Investments, 82 Devonshire Street, Boston, Massachusetts 02109.
Name, Age; Principal Occupation |
Edward C. Johnson 3d (74)** |
| Year of Election or Appointment: 1984 Mr. Johnson is Chairman of the Board of Trustees. Mr. Johnson serves as Chief Executive Officer, Chairman, and a Director of FMR Corp.; a Director and Chairman of the Board and of the Executive Committee of FMR; Chairman and a Director of Fidelity Management & Research (Far East) Inc.; Chairman (1998) and a Director of Fidelity Investments Money Management, Inc.; and Chairman (2001) and a Director (2000) of FMR Co., Inc. |
Abigail P. Johnson (42)** |
| Year of Election or Appointment: 2001 Senior Vice President of Advisor Aggressive Growth (2001). Ms. Johnson also serves as Senior Vice President of other Fidelity funds (2001). She is President and a Director of FMR (2001), Fidelity Investments Money Management, Inc. (2001), FMR Co., Inc. (2001), and a Director of FMR Corp. Previously, Ms. Johnson managed a number of Fidelity funds. |
Laura B. Cronin (50) |
| Year of Election or Appointment: 2003 Ms. Cronin is an Executive Vice President (2002) and Chief Financial Officer (2002) of FMR Corp. and is a member of the Fidelity Management Committee (2003). Previously, Ms. Cronin served as Vice President of Finance of FMR (1997-1999), and Chief Financial Officer of FMR (1999-2001), Fidelity Personal Investments (2001), and Fidelity Brokerage Company (2001-2002). |
Robert L. Reynolds (52) |
| Year of Election or Appointment: 2003 Mr. Reynolds is a Director (2003) and Chief Operating Officer (2002) of FMR Corp. and is the head of the Fidelity Management Committee (2003). He also serves on the Board at Fidelity Investments Canada, Ltd. (2000). Previously, Mr. Reynolds served as President of Fidelity Investments Institutional Retirement Group (1996-2000). |
* Trustees have been determined to be "Interested Trustees" by virtue of, among other things, their affiliation with the trust or various entities under common control with FMR.
** Edward C. Johnson 3d, Trustee, is Abigail P. Johnson's father.
Annual Report
Non-Interested Trustees:
Correspondence intended for each non-interested Trustee (that is, the Trustees other than the Interested Trustees) may be sent to Fidelity Investments, P.O. Box 55235, Boston, Massachusetts 02205-5235.
Name, Age; Principal Occupation |
Dennis J. Dirks (56) |
| Year of Election or Appointment: 2005 Mr. Dirks also serves as a Trustee (2005) or Member of the Advisory Board (2004) of other investment companies advised by FMR. Prior to his retirement in May 2003, Mr. Dirks was Chief Operating Officer and a member of the Board of The Depository Trust & Clearing Corporation (DTCC) (1999-2003). He also served as President, Chief Operating Officer, and Board member of The Depository Trust Company (DTC) (1999-2003) and President and Board member of the National Securities Clearing Corporation (NSCC) (1999-2003). In addition, Mr. Dirks served as Chief Executive Officer and Board member of the Government Securities Clearing Corporation (2001-2003) and Chief Executive Officer and Board member of the Mortgage-Backed Securities Clearing Corporation (2001-2003). |
Robert M. Gates (61) |
| Year of Election or Appointment: 1997 Dr. Gates is Vice Chairman of non-interested Trustees (2005). Dr. Gates is President of Texas A&M University (2002). He was Director of the Central Intelligence Agency (CIA) from 1991 to 1993. From 1989 to 1991, Dr. Gates served as Assistant to the President of the United States and Deputy National Security Advisor. Dr. Gates is a Director of NACCO Industries, Inc. (mining and manufacturing), Parker Drilling Co., Inc. (drilling and rental tools for the energy industry, 2001), and Brinker International (restaurant management, 2003). He also serves as a member of the Advisory Board of VoteHere.net (secure Internet voting, 2001). Previously, Dr. Gates served as a Director of LucasVarity PLC (automotive components and diesel engines), a Director of TRW Inc. (automotive, space, defense, and information technology), and Dean of the George Bush School of Government and Public Service at Texas A&M University (1999-2001). Dr. Gates also is a Trustee of the Forum for International Policy. |
George H. Heilmeier (68) |
| Year of Election or Appointment: 2004 Dr. Heilmeier is Chairman Emeritus of Telcordia Technologies (communication software and systems), where prior to his retirement, he served as company Chairman and Chief Executive Officer. He currently serves on the Boards of Directors of The Mitre Corporation (systems engineering and information technology support for the government), INET Technologies Inc. (telecommunications network surveillance, 2001), Teletech Holdings (customer management services), and HRL Laboratories (private research and development, 2004). He is Chairman of the General Motors Technology Advisory Committee and a Life Fellow of the Institute of Electrical and Electronics Engineers (IEEE) (2000). Dr. Heilmeier is a member of the Defense Science Board and the National Security Agency Advisory Board. He is also a member of the National Academy of Engineering, the American Academy of Arts and Sciences, and the Board of Overseers of the School of Engineering and Applied Science of the University of Pennsylvania. Previously, Dr. Heilmeier served as a Director of TRW Inc. (automotive, space, defense, and information technology, 1992-2002), Compaq (1994-2002), and Automatic Data Processing, Inc. (ADP) (technologybased business outsourcing, 1995-2002). |
Marie L. Knowles (58) |
| Year of Election or Appointment: 2001 Prior to Ms. Knowles' retirement in June 2000, she served as Executive Vice President and Chief Financial Officer of Atlantic Richfield Company (ARCO) (diversified energy, 1996-2000). From 1993 to 1996, she was a Senior Vice President of ARCO and President of ARCO Transportation Company. She served as a Director of ARCO from 1996 to 1998. She currently serves as a Director of Phelps Dodge Corporation (copper mining and manufacturing) and McKesson Corporation (healthcare service, 2002). Ms. Knowles is a Trustee of the Brookings Institution and the Catalina Island Conservancy and also serves as a member of the Advisory Board for the School of Engineering of the University of Southern California. |
Ned C. Lautenbach (60) |
| Year of Election or Appointment: 2000 Mr. Lautenbach has been a partner of Clayton, Dubilier & Rice, Inc. (private equity investment firm) since September 1998. Previously, Mr. Lautenbach was with the International Business Machines Corporation (IBM) from 1968 until his retirement in 1998. He was most recently Senior Vice President and Group Executive of Worldwide Sales and Services. From 1993 to 1995, he was Chairman of IBM World Trade Corporation, and from 1994 to 1998 was a member of IBM's Corporate Executive Committee. Mr. Lautenbach serves as Co-Chairman and a Director of Covansys, Inc. (global provider of business and technology solutions, 2000). In addition, he is a Director of Italtel Holding S.p.A. (telecommunications (Milan, Italy), 2004) and Eaton Corporation (diversified industrial) as well as the Philharmonic Center for the Arts in Naples, Florida (1999). He also is a member of the Council on Foreign Relations. |
Marvin L. Mann (71) |
| Year of Election or Appointment: 1993 Mr. Mann is Chairman of the non-interested Trustees (2001). He is Chairman Emeritus of Lexmark International, Inc. (computer peripherals), where he served as CEO until April 1998, retired as Chairman May 1999, and remains a member of the Board. Prior to 1991, he held the positions of Vice President of International Business Machines Corporation (IBM) and President and General Manager of various IBM divisions and subsidiaries. He is a member of the Executive Committee of the Independent Director's Council of the Investment Company Institute. In addition, Mr. Mann is a member of the President's Cabinet at the University of Alabama and the Board of Visitors of the Culverhouse College of Commerce and Business Administration at the University of Alabama. |
William O. McCoy (71) |
| Year of Election or Appointment: 1997 Prior to his retirement in December 1994, Mr. McCoy was Vice Chairman of the Board of BellSouth Corporation (telecommunications) and President of BellSouth Enterprises. He is currently a Director of Liberty Corporation (holding company), Duke Realty Corporation (real estate), and Progress Energy, Inc. (electric utility). He is also a partner of Franklin Street Partners (private investment management firm) and a member of the Research Triangle Foundation Board. In addition, Mr. McCoy served as the Interim Chancellor (1999-2000) and a member of the Board of Visitors (1994-1998) for the University of North Carolina at Chapel Hill and currently serves on the Board of Directors of the University of North Carolina Health Care System and the Board of Visitors of the Kenan-Flagler Business School (University of North Carolina at Chapel Hill). He also served as Vice President of Finance for the University of North Carolina (16-school system, 1995-1998). |
Cornelia M. Small (60) |
| Year of Election or Appointment: 2005 Ms. Small is a member (2000) and Chairperson (2002) of the Investment Committee, and a member (2002) of the Board of Trustees of Smith College. Previously, she served as Chief Investment Officer (1999-2000), Director of Global Equity Investments (1996-1999), and a member of the Board of Directors of Scudder, Stevens & Clark (1990-1997) and Scudder Kemper Investments (1997-1998). In addition, Ms. Small served as Co-Chair (2000-2003) of the Annual Fund for the Fletcher School of Law and Diplomacy. |
William S. Stavropoulos (65) |
| Year of Election or Appointment: 2002 Mr. Stavropoulos is Chairman of the Board (2000), CEO (2002), a position he previously held from 1995-2000, Chairman of the Executive Committee (2000), and a Member of the Board of Directors of The Dow Chemical Company. Since joining The Dow Chemical Company in 1967, Mr. Stavropoulos served in numerous senior management positions, including President (1993-2000; 2002-2003). Currently, he is a Director of NCR Corporation (data warehousing and technology solutions), BellSouth Corporation (telecommunications), Chemical Financial Corporation, and Maersk Inc. (industrial conglomerate, 2002). He also serves as a member of the Board of Trustees of the American Enterprise Institute for Public Policy Research. In addition, Mr. Stavropoulos is a member of The Business Council, J.P. Morgan International Council and the University of Notre Dame Advisory Council for the College of Science. |
Kenneth L. Wolfe (65) |
| Year of Election or Appointment: 2005 Mr. Wolfe also serves as a Trustee (2005) or Member of the Advisory Board (2004) of other investment companies advised by FMR. Prior to his retirement in 2001, Mr. Wolfe was Chairman and Chief Executive Officer of Hershey Foods Corporation (1993-2001). He currently serves as a member of the boards of Adelphia Communications Corporation (2003), Bausch & Lomb, Inc., and Revlon Inc. (2004). |
Advisory Board Member and Executive Officers:
Correspondence intended for each executive officer and Mr. Lynch may be sent to Fidelity Investments, 82 Devonshire Street, Boston, Massachusetts 02109.
Name, Age; Principal Occupation |
Peter S. Lynch (61) |
| Year of Election or Appointment: 2003 Member of the Advisory Board of Fidelity Securities Fund. Vice Chairman and a Director of FMR, and Vice Chairman (2001) and a Director (2000) of FMR Co., Inc. Previously, Mr. Lynch served as a Trustee of the Fidelity funds (1990-2003). Prior to May 31, 1990, he was a Director of FMR and Executive Vice President of FMR (a position he held until March 31, 1991), Vice President of Fidelity® Magellan® Fund and FMR Growth Group Leader, and Managing Director of FMR Corp. Mr. Lynch was also Vice President of Fidelity Investments Corporate Services. In addition, he serves as a Trustee of Boston College, Massachusetts Eye & Ear Infirmary, Historic Deerfield, John F. Kennedy Library, and the Museum of Fine Arts of Boston. |
John B. McDowell (46) |
| Year of Election or Appointment: 2002 Vice President of Advisor Aggressive Growth. Mr. McDowell also serves as Vice President of certain Equity Funds (2002). He is Senior Vice President of FMR (1999), FMR Co., Inc. (2001), and Fidelity Management Trust Company (FMTC). Since joining Fidelity Investments in 1985, Mr. McDowell has worked as a research analyst and manager. |
Rajiv Kaul (33) |
| Year of Election or Appointment: 2003 Vice President of Advisor Aggressive Growth. Mr. Kaul serves as Vice President of another fund advised by FMR. Prior to assuming his current responsibilities, Mr. Kaul managed a variety of Fidelity funds. Mr. Kaul also serves as Vice President of FMR (2003) and FMR Co., Inc. (2003). |
Eric D. Roiter (56) |
| Year of Election or Appointment: 2000 Secretary of Advisor Aggressive Growth. He also serves as Secretary of other Fidelity funds (1998); Vice President, General Counsel, and Clerk of FMR Co., Inc. (2001) and FMR (1998); Vice President and Clerk of FDC (1998); Assistant Clerk of Fidelity Management & Research (U.K.) Inc. (2001) and Fidelity Management & Research (Far East) Inc. (2001); and Assistant Secretary of Fidelity Investments Money Management, Inc. (2001). Prior to joining Fidelity, Mr. Roiter was with the law firm of Debevoise & Plimpton, as an associate (1981-1984) and as a partner (1985-1997), and served as an Assistant General Counsel of the U.S. Securities and Exchange Commission (1979-1981). Mr. Roiter is an Adjunct Member, Faculty of Law, at Boston College Law School (2003). |
Stuart Fross (45) |
| Year of Election or Appointment: 2003 Assistant Secretary of Advisor Aggressive Growth. Mr. Fross also serves as Assistant Secretary of other Fidelity funds (2003) and is an employee of FMR. |
Christine Reynolds (46) |
| Year of Election or Appointment: 2004 President, Treasurer, and Anti-Money Laundering (AML) officer of Advisor Aggressive Growth. Ms. Reynolds also serves as President, Treasurer, and AML officer of other Fidelity funds (2004) and is a Vice President (2003) and an employee (2002) of FMR. Before joining Fidelity Investments, Ms. Reynolds worked at PricewaterhouseCoopers LLP (PwC) (1980-2002), where she was most recently an audit partner with PwC's investment management practice. |
Timothy F. Hayes (53) |
| Year of Election or Appointment: 2002 Chief Financial Officer of Advisor Aggressive Growth. Mr. Hayes also serves as Chief Financial Officer of other Fidelity funds (2002). Recently he was appointed President of Fidelity Service Company (2003) where he also serves as a Director. Mr. Hayes also serves as President of Fidelity Investments Operations Group (FIOG, 2002), which includes Fidelity Pricing and Cash Management Services Group (FPCMS), where he was appointed President in 1998. Previously, Mr. Hayes served as Chief Financial Officer of Fidelity Investments Corporate Systems and Service Group (1998) and Fidelity Systems Company (1997-1998). |
Kenneth A. Rathgeber (57) |
| Year of Election or Appointment: 2004 Chief Compliance Officer of Advisor Aggressive Growth. Mr. Rathgeber also serves as Chief Compliance Officer of other Fidelity funds (2004) and Executive Vice President of Risk Oversight for Fidelity Investments (2002). Previously, he served as Executive Vice President and Chief Operating Officer for Fidelity Investments Institutional Services Company, Inc. (1998-2002). |
John R. Hebble (46) |
| Year of Election or Appointment: 2003 Deputy Treasurer of Advisor Aggressive Growth. Mr. Hebble also serves as Deputy Treasurer of other Fidelity funds (2003), and is an employee of FMR. Before joining Fidelity Investments, Mr. Hebble worked at Deutsche Asset Management where he served as Director of Fund Accounting (2002-2003) and Assistant Treasurer of the Scudder Funds (1998-2003). |
Kimberley H. Monasterio (40) |
| Year of Election or Appointment: 2004 Deputy Treasurer of Advisor Aggressive Growth. Ms. Monasterio also serves as Deputy Treasurer of other Fidelity funds (2004) and is an employee of FMR (2004). Before joining Fidelity Investments, Ms. Monasterio served as Treasurer (2000-2004) and Chief Financial Officer (2002-2004) of the Franklin Templeton Funds and Senior Vice President of Franklin Templeton Services, LLC (2000-2004). |
John H. Costello (58) |
| Year of Election or Appointment: 2000 Assistant Treasurer of Advisor Aggressive Growth. Mr. Costello also serves as Assistant Treasurer of other Fidelity funds and is an employee of FMR. |
Peter L. Lydecker (50) |
| Year of Election or Appointment: 2004 Assistant Treasurer of Advisor Aggressive Growth. Mr. Lydecker also serves as Assistant Treasurer of other Fidelity funds (2004) and is an employee of FMR. |
Mark Osterheld (49) |
| Year of Election or Appointment: 2002 Assistant Treasurer of Advisor Aggressive Growth. Mr. Osterheld also serves as Assistant Treasurer of other Fidelity funds (2002) and is an employee of FMR. |
Kenneth B. Robins (35) |
| Year of Election or Appointment: 2004 Assistant Treasurer of Advisor Aggressive Growth. Mr. Robins also serves as Assistant Treasurer of other Fidelity funds (2004) and is an employee of FMR (2004). Before joining Fidelity Investments, Mr. Robins worked at KPMG LLP, where he was a partner in KPMG's department of professional practice (2002-2004) and a Senior Manager (1999-2000). In addition, Mr. Robins served as Assistant Chief Accountant, United States Securities and Exchange Commission (2000-2002). |
Thomas J. Simpson (46) |
| Year of Election or Appointment: 2000 Assistant Treasurer of Advisor Aggressive Growth. Mr. Simpson is Assistant Treasurer of other Fidelity funds (2000) and an employee of FMR (1996). Prior to joining FMR, Mr. Simpson was Vice President and Fund Controller of Liberty Investment Services (1987-1995). |
Annual Report
Proxy Voting Results
A special meeting of the fund's shareholders was held on June 16, 2004. The results of votes taken among shareholders on proposals before them are reported below. Each vote reported represents one dollar of net asset value held on the record date for the meeting.
PROPOSAL 1 |
To amend the Declaration of Trust to allow the Board of Trustees, if permitted by applicable law, to authorize fund mergers without shareholder approval.A |
| # of
Votes | % of
Votes |
Affirmative | 31,883,774,629.45 | 74.417 |
Against | 8,183,381,781.77 | 19.100 |
Abstain | 1,638,852,719.00 | 3.825 |
Broker
Non-Votes | 1,138,987,331.08 | 2.658 |
TOTAL | 42,844,996,461.30 | 100.000 |
PROPOSAL 2 |
To elect a Board of Trustees.A |
| # of
Votes | % of
Votes |
J. Michael Cook |
Affirmative | 40,460,518,026.37 | 94.435 |
Withheld | 2,384,478,434.93 | 5.565 |
TOTAL | 42,844,996,461.30 | 100.000 |
Ralph F. Cox |
Affirmative | 40,352,191,948.09 | 94.182 |
Withheld | 2,492,804,513.21 | 5.818 |
TOTAL | 42,844,996,461.30 | 100.000 |
Laura B. Cronin |
Affirmative | 40,424,410,070.14 | 94.350 |
Withheld | 2,420,586,391.16 | 5.650 |
TOTAL | 42,844,996,461.30 | 100.000 |
Robert M. Gates |
Affirmative | 40,432,546,388.62 | 94.369 |
Withheld | 2,412,450,072.68 | 5.631 |
TOTAL | 42,844,996,461.30 | 100.000 |
George H. Heilmeier |
Affirmative | 40,445,405,455.55 | 94.399 |
Withheld | 2,399,591,005.75 | 5.601 |
TOTAL | 42,844,996,461.30 | 100.000 |
Abigail P. Johnson |
Affirmative | 40,331,726,176.04 | 94.134 |
Withheld | 2,513,270,285.26 | 5.866 |
TOTAL | 42,844,996,461.30 | 100.000 |
Edward C. Johnson 3d |
Affirmative | 40,301,779,769.00 | 94.064 |
Withheld | 2,543,216,692.30 | 5.936 |
TOTAL | 42,844,996,461.30 | 100.000 |
Donald J. Kirk |
Affirmative | 40,378,377,883.82 | 94.243 |
Withheld | 2,466,618,577.48 | 5.757 |
TOTAL | 42,844,996,461.30 | 100.000 |
Marie L. Knowles |
Affirmative | 40,472,201,003.05 | 94.462 |
Withheld | 2,372,795,458.25 | 5.538 |
TOTAL | 42,844,996,461.30 | 100.000 |
Ned C. Lautenbach |
Affirmative | 40,485,953,391.65 | 94.494 |
Withheld | 2,359,043,069.65 | 5.506 |
TOTAL | 42,844,996,461.30 | 100.000 |
Marvin L. Mann |
Affirmative | 40,392,875,977.31 | 94.277 |
Withheld | 2,452,120,483.99 | 5.723 |
TOTAL | 42,844,996,461.30 | 100.000 |
William O. McCoy |
Affirmative | 40,409,897,384.16 | 94.316 |
Withheld | 2,435,099,077.14 | 5.684 |
TOTAL | 42,844,996,461.30 | 100.000 |
| # of
Votes | % of
Votes |
Robert L. Reynolds |
Affirmative | 40,470,266,358.65 | 94.457 |
Withheld | 2,374,730,102.65 | 5.543 |
TOTAL | 42,844,996,461.30 | 100.000 |
William S. Stavropoulos |
Affirmative | 40,442,710,981.11 | 94.393 |
Withheld | 2,402,285,480.19 | 5.607 |
TOTAL | 42,844,996,461.30 | 100.000 |
A Denotes trust-wide proposals and voting results. |
Annual Report
Annual Report
Annual Report
Annual Report
Investment Adviser
Fidelity Management & Research Company
Boston, MA
Investment Sub-Advisers
FMR Co., Inc.
Fidelity Management & Research
(U.K.) Inc.
Fidelity Management & Research
(Far East) Inc.
Fidelity International Investment Advisors
Fidelity Investments Japan Limited
Fidelity International Investment Advisors (U.K.) Limited
General Distributor
Fidelity Distributors Corporation
Boston, MA
Transfer and Shareholder
Servicing Agents
Fidelity Investments Institutional
Operations Company, Inc.
Boston, MA
Custodian
State Street Bank and Trust Company
Quincy, MA
(Fidelity Investment logo)(registered trademark)
Corporate Headquarters
82 Devonshire St., Boston, MA 02109
www.fidelity.com
AAGI-UANN-0105
1.786670.101
Item 2. Code of Ethics
As of the end of the period, November 30, 2004, Fidelity Securities Fund (the trust) has adopted a code of ethics, as defined in Item 2 of Form N-CSR, that applies to its President and Treasurer and its Chief Financial Officer. A copy of the code of ethics is filed as an exhibit to this Form N-CSR.
Item 3. Audit Committee Financial Expert
The Board of Trustees of the trust has determined that Marie L. Knowles is an audit committee financial expert, as defined in Item 3 of Form N-CSR. Ms. Knowles is independent for purposes of Item 3 of Form N-CSR.
Item 4. Principal Accountant Fees and Services
(a) Audit Fees.
For the fiscal years ended November 30, 2004 and November 30, 2003, the aggregate Audit Fees billed by PricewaterhouseCoopers LLP (PwC) for professional services rendered for the audits of the financial statements, or services that are normally provided in connection with statutory and regulatory filings or engagements for those fiscal years, for the Fidelity Advisor Aggressive Growth Fund (the fund) and for all funds in the Fidelity Group of Funds are shown in the table below.
Fund | 2004A | 2003A |
Fidelity Advisor Aggressive Growth Fund | $33,000 | $39,000 |
All funds in the Fidelity Group of Funds audited by PwC | $10,600,000 | $10,500,000 |
A | Aggregate amounts may reflect rounding. |
(b) Audit-Related Fees.
In each of the fiscal years ended November 30, 2004 and November 30, 2003 the aggregate Audit-Related Fees billed by PwC for services rendered for assurance and related services to the fund that are reasonably related to the performance of the audit or review of the fund's financial statements, but not reported as Audit Fees, are shown in the table below.
Fund | 2004A | 2003A,B |
Fidelity Advisor Aggressive Growth Fund | $0 | $0 |
A | Aggregate amounts may reflect rounding. |
B | Includes amounts related to non-audit services prior to May 6, 2003 that would have been subject to pre-approval if the SEC rules relating to the pre-approval of non-audit services had been in effect at that time. |
In each of the fiscal years ended November 30, 2004 and November 30, 2003, the aggregate Audit-Related Fees that were billed by PwC that were required to be approved by the Audit Committee for services rendered on behalf of Fidelity Management & Research Company (FMR) and entities controlling, controlled by, or under common control with FMR (not including any sub-adviser whose role is primarily portfolio management and is subcontracted with or overseen by another investment adviser) that provide ongoing services to the fund ("Fund Service Providers") for assurance and related services that relate directly to the operations and financial reporting of the fund that are reasonably related to the performance of the audit or review of the fund's financial statements, but not reported as Audit Fees, are shown in the table below.
Billed By | 2004A | 2003A,B |
PwC | $0 | $50,000 |
A | Aggregate amounts may reflect rounding. |
B | Includes amounts related to non-audit services prior to May 6, 2003 that would have been subject to pre-approval if the SEC rules relating to the pre-approval of non-audit services had been in effect at that time. |
Fees included in the audit-related category comprise assurance and related services (e.g., due diligence services) that are traditionally performed by the independent registered public accounting firm. These audit-related services include due diligence related to mergers and acquisitions, accounting consultations and audits in connection with acquisitions, internal control reviews, attest services that are not required by statute or regulation and consultation concerning financial accounting and reporting standards.
(c) Tax Fees.
In each of the fiscal years ended November 30, 2004 and November 30, 2003, the aggregate Tax Fees billed by PwC for professional services rendered for tax compliance, tax advice, and tax planning for the fund is shown in the table below.
Fund | 2004A | 2003A,B |
Fidelity Advisor Aggressive Growth Fund | $2,400 | $2,200 |
A | Aggregate amounts may reflect rounding. |
B | Includes amounts related to non-audit services prior to May 6, 2003 that would have been subject to pre-approval if the SEC rules relating to the pre-approval of non-audit services had been in effect at that time. |
In each of the fiscal years ended November 30, 2004 and November 30, 2003, the aggregate Tax Fees billed by PwC that were required to be approved by the Audit Committee for professional services rendered on behalf of the Fund Service Providers for tax compliance, tax advice, and tax planning that relate directly to the operations and financial reporting of the fund is shown in the table below.
Billed By | 2004A | 2003A,B |
PwC | $0 | $0 |
A | Aggregate amounts may reflect rounding. |
B | Includes amounts related to non-audit services prior to May 6, 2003 that would have been subject to pre-approval if the SEC rules relating to the pre-approval of non-audit services had been in effect at that time. |
Fees included in the Tax Fees category comprise all services performed by professional staff in the independent registered public accounting firm's tax division except those services related to the audit. Typically, this category would include fees for tax compliance, tax planning, and tax advice. Tax compliance, tax advice, and tax planning services include preparation of original and amended tax returns, claims for refund and tax payment-planning services, assistance with tax audits and appeals, tax advice related to mergers and acquisitions and requests for rulings or technical advice from taxing authorities.
(d) All Other Fees.
In each of the fiscal years ended November 30, 2004 and November 30, 2003, the aggregate Other Fees billed by PwC for all other non-audit services rendered to the fund is shown in the table below.
Fund | 2004A | 2003A,B |
Fidelity Advisor Aggressive Growth Fund | $1,300 | $1,300 |
A | Aggregate amounts may reflect rounding. |
B | Includes amounts related to non-audit services prior to May 6, 2003 that would have been subject to pre-approval if the SEC rules relating to the pre-approval of non-audit services had been in effect at that time. |
In each of the fiscal years ended November 30, 2004 and November 30, 2003, the aggregate Other Fees billed by PwC that were required to be approved by the Audit Committee for all other non-audit services rendered on behalf of the Fund Service Providers that relate directly to the operations and financial reporting of the fund is shown in the table below.
Billed By | 2004A | 2003A,B |
PwC | $540,000 | $140,000 |
A | Aggregate amounts may reflect rounding. |
B | Includes amounts related to non-audit services prior to May 6, 2003 that would have been subject to pre-approval if the SEC rules relating to the pre-approval of non-audit services had been in effect at that time. |
Fees included in the All Other Fees category include services related to internal control reviews, strategy and other consulting, financial information systems design and implementation, consulting on other information systems, and other tax services unrelated to the fund.
(e) (1) | Audit Committee Pre-Approval Policies and Procedures: |
The trust's Audit Committee must pre-approve all audit and non-audit services provided by the independent registered public accounting firm relating to the operations or financial reporting of the fund. Prior to the commencement of any audit or non-audit services to a fund, the Audit Committee reviews the services to determine whether they are appropriate and permissible under applicable law.
The trust's Audit Committee has adopted policies and procedures to, among other purposes, provide a framework for the Committee's consideration of non-audit services by the audit firms that audit the Fidelity funds. The policies and procedures require that any non-audit service provided by a fund audit firm to a Fidelity Fund and any non-audit service provided by a fund auditor to a Fund Service Provider that relates directly to the operations and financial reporting of a Fidelity fund (Covered Service) are subject to approval by the Audit Committee before such service is provided. Non-audit services provided by a fund audit firm for a Fund Service Provider that do not relate directly to the operations and financial reporting of a Fidelity fund (Non-Covered Service) but that are expected to exceed $50,000 are also subject to pre-approval by the Audit Committee.
All Covered Services, as well as Non-Covered Services that are expected to exceed $50,000, must be approved in advance of provision of the service either: (i) by formal resolution of the Audit Committee, or (ii) by oral or written approval of the service by the Chair of the Audit Committee (or if the Chair is unavailable, such other member of the Audit Committee as may be designated by the Chair to act in the Chair's absence). The approval contemplated by (ii) above is permitted where the Treasurer determines that action on such an engagement is necessary before the next meeting of the Audit Committee. Neither pre-approval nor advance notice of Non-Covered Service engagements for which fees are not expected to exceed $50,000 is required; such engagements are to be reported to the Audit Committee monthly.
(e) (2) | Services approved pursuant to paragraph (c)(7)(i)(C) of Rule 2-01 of Regulation S-X: |
Audit-Related Fees:
There were no amounts, including amounts related to non-audit services prior to May 6, 2003 that would have been subject to pre-approval if the SEC rules relating to the pre-approval of non-audit services had been in effect at that time, that were approved by the Audit Committee pursuant to the de minimis exception for the fiscal years ended November 30, 2004 and November 30, 2003 on behalf of the fund.
There were no amounts, including amounts related to non-audit services prior to May 6, 2003 that would have been subject to pre-approval if the SEC rules relating to the pre-approval of non-audit services had been in effect at that time, that were required to be approved by the Audit Committee pursuant to the de minimis exception for the fiscal years ended November 30, 2004 and November 30, 2003 on behalf of the Fund Service Providers that relate directly to the operations and financial reporting of the fund.
Tax Fees:
There were no amounts, including amounts related to non-audit services prior to May 6, 2003 that would have been subject to pre-approval if the SEC rules relating to the pre-approval of non-audit services had been in effect at that time, that were approved by the Audit Committee pursuant to the de minimis exception for the fiscal years ended November 30, 2004 and November 30, 2003 on behalf of the fund.
There were no amounts, including amounts related to non-audit services prior to May 6, 2003 that would have been subject to pre-approval if the SEC rules relating to the pre-approval of non-audit services had been in effect at that time, that were required to be approved by the Audit Committee pursuant to the de minimis exception for the fiscal years ended November 30, 2004 and November 30, 2003 on behalf of the Fund Service Providers that relate directly to the operations and financial reporting of the fund.
All Other Fees:
There were no amounts, including amounts related to non-audit services prior to May 6, 2003 that would have been subject to pre-approval if the SEC rules relating to the pre-approval of non-audit services had been in effect at that time, that were approved by the Audit Committee pursuant to the de minimis exception for the fiscal years ended November 30, 2004 and November 30, 2003 on behalf of the fund.
There were no amounts, including amounts related to non-audit services prior to May 6, 2003 that would have been subject to pre-approval if the SEC rules relating to the pre-approval of non-audit services had been in effect at that time, that were required to be approved by the Audit Committee pursuant to the de minimis exception for the fiscal years ended November 30, 2004 and November 30, 2003 on behalf of the Fund Service Providers that relate directly to the operations and financial reporting of the fund.
(f) According to PwC for the fiscal year ended November 30, 2004, the percentage of hours spent on the audit of the fund's financial statements for the most recent fiscal year that were attributed to work performed by persons who are not full-time, permanent employees of PwC is as follows:
Fund | 2004 |
Fidelity Advisor Aggressive Growth Fund | 0% |
(g) For the fiscal years ended November 30, 2004 and November 30, 2003, the aggregate fees billed by PwC of $2,700,000A and $1,850,000A,B for non-audit services rendered on behalf of the funds, FMR (not including any sub-adviser whose role is primarily portfolio management and is subcontracted with or overseen by another investment adviser) and Fund Service Providers relating to Covered Services and Non-Covered Services are shown in the table below.
| 2004A | 2003A,B |
Covered Services | $550,000 | $200,000 |
Non-Covered Services | $2,150,000 | $1,650,000 |
A | Aggregate amounts may reflect rounding. |
B | Includes amounts related to non-audit services prior to May 6, 2003 that would have been subject to pre-approval if the SEC rules relating to the pre-approval of non-audit services had been in effect at that time. |
(h) The trust's Audit Committee has considered Non-Covered Services that were not pre-approved that were provided by PwC to Fund Service Providers to be compatible with maintaining the independence of PwC in its audit of the fund, taking into account representations from PwC, in accordance with Independence Standards Board Standard No.1, regarding its independence from the fund and its related entities.
Item 5. Audit Committee of Listed Registrants
Not applicable.
Item 6. Schedule of Investments
Not applicable.
Item 7. Disclosure of Proxy Voting Policies and Procedures for Closed-End Management Investment Companies
Not applicable.
Item 8. Portfolio Managers of Closed-End Management Investment Companies
Not applicable.
Item 9. Purchase of Equity Securities by Closed-End Management Investment Company and Affiliated Purchasers
Not applicable.
Item 10. Submission of Matters to a Vote of Security Holders
There were no material changes to the procedures by which shareholders may recommend nominees to the trust's Board of Trustees.
Item 11. Controls and Procedures
(a)(i) The President and Treasurer and the Chief Financial Officer have concluded that the trust's disclosure controls and procedures (as defined in Rule 30a-3(c) under the Investment Company Act) provide reasonable assurances that material information relating to the trust is made known to them by the appropriate persons, based on their evaluation of these controls and procedures as of a date within 90 days of the filing date of this report.
(a)(ii) There was no change in the trust's internal control over financial reporting (as defined in Rule 30a-3(d) under the Investment Company Act) that occurred during the second fiscal quarter of the period covered by this report that has materially affected, or is reasonably likely to materially affect, the trust's internal control over financial reporting.
Item 12. Exhibits
(a) | (1) | Code of Ethics pursuant to Item 2 of Form N-CSR is filed and attached hereto as EX-99.CODE ETH. |
(a) | (2) | Certification pursuant to Rule 30a-2(a) under the Investment Company Act of 1940 (17 CFR 270.30a-2(a)) is filed and attached hereto as Exhibit 99.CERT. |
(a) | (3) | Not applicable. |
(b) | | Certification pursuant to Rule 30a-2(b) under the Investment Company Act of 1940 (17 CFR 270.30a-2(b)) is furnished and attached hereto as Exhibit 99.906CERT. |
SIGNATURES
Pursuant to the requirements of the Securities Exchange Act of 1934 and the Investment Company Act of 1940, the registrant has duly caused this report to be signed on its behalf by the undersigned, thereunto duly authorized.
Fidelity Securities Fund
By: | /s/Christine Reynolds |
| Christine Reynolds |
| President and Treasurer |
| |
Date: | January 24, 2005 |
Pursuant to the requirements of the Securities Exchange Act of 1934 and the Investment Company Act of 1940, this report has been signed below by the following persons on behalf of the registrant and in the capacities and on the dates indicated.
By: | /s/Christine Reynolds |
| Christine Reynolds |
| President and Treasurer |
| |
Date: | January 24, 2005 |
By: | /s/Timothy F. Hayes |
| Timothy F. Hayes |
| Chief Financial Officer |
| |
Date: | January 24, 2005 |