UNITED STATES
SECURITIES AND EXCHANGE COMMISSION
Washington, D.C. 20549
FORM N-CSR
CERTIFIED SHAREHOLDER REPORT OF REGISTERED
MANAGEMENT INVESTMENT COMPANIES
Investment Company Act file number 811-4118
Fidelity Securities Fund
(Exact name of registrant as specified in charter)
82 Devonshire St., Boston, Massachusetts 02109
(Address of principal executive offices) (Zip code)
Eric D. Roiter, Secretary
82 Devonshire St.
Boston, Massachusetts 02109
(Name and address of agent for service)
Registrant's telephone number, including area code: 617-563-7000
Date of fiscal year end: | November 30 |
| |
Date of reporting period: | November 30, 2005 |
Item 1. Reports to Stockholders

Fidelity® Advisor
Aggressive Growth
Fund - Class A, Class T, Class B
and Class C
|
Annual Report
November 30, 2005
|

| Contents | | | | |
| |
| Chairman’s Message | | 4 | | Ned Johnson’s message to shareholders. |
| Performance | | 5 | | How the fund has done over time. |
| Management’s Discussion | | 7 | | The manager’s review of fund |
| | | | | performance, strategy and outlook. |
| Shareholder Expense | | 8 | | An example of shareholder expenses. |
| Example | | | | |
| Investment Changes | | 10 | | A summary of major shifts in the fund’s |
| | | | | investments over the past six months. |
| Investments | | 11 | | A complete list of the fund’s investments |
| | | | | with their market values. |
| Financial Statements | | 17 | | Statements of assets and liabilities, |
| | | | | operations, and changes in net assets, |
| | | | | as well as financial highlights. |
| Notes | | 26 | | Notes to the financial statements. |
| Report of Independent | | 34 | | |
| Registered Public | | | | |
| Accounting Firm | | | | |
| Trustees and Officers | | 35 | | |
| Board Approval of | | 45 | | |
| Investment Advisory | | | | |
| Contracts and | | | | |
| Management Fees | | | | |
| | To view a fund’s proxy voting guidelines and proxy voting record for the 12 month period
ended June 30, visit www.fidelity.com/proxyvotingresults or visit the Securities and Exchange
Commission’s (SEC) web site at www.sec.gov. You may also call 1-877-208-0098 to request a free
copy of the proxy voting guidelines.
Standard & Poor’s, S&P and S&P 500 are registered service marks of The McGraw Hill Companies,
Inc. and have been licensed for use by Fidelity Distributors Corporation.
Other third party marks appearing herein are the property of their respective owners.
All other marks appearing herein are registered or unregistered trademarks or service marks
of FMR Corp. or an affiliated company.
|
Annual Report 2
This report and the financial statements contained herein are submitted for the general information
of the shareholders of the fund. This report is not authorized for distribution to prospective investors
in the fund unless preceded or accompanied by an effective prospectus.
A fund files its complete schedule of portfolio holdings with the SEC for the first and third
quarters of each fiscal year on Form N Q. Forms N Q are available on the SEC’s web site at
http://www.sec.gov. A fund’s Forms N Q may be reviewed and copied at the SEC’s Public Reference
Room in Washington, DC. Information regarding the operation of the SEC’s Public Reference
Room may be obtained by calling 1-800-SEC-0330. For a complete list of a fund’s portfolio hold
ings, view the most recent quarterly holdings report, semiannual report, or annual report on
Fidelity’s web site at http://www.advisor.fidelity.com.
NOT FDIC INSURED · MAY LOSE VALUE · NO BANK GUARANTEE
Neither the fund nor Fidelity Distributors Corporation is a bank.
|
3 Annual Report
Chairman’s Message
(photograph of Edward C. Johnson 3d)
Dear Shareholder:
During the past year or so, much has been reported about the mutual fund industry, and much of it has been more critical than I believe is warranted. Allegations that some companies have been less than forthright with their shareholders have cast a shadow on the entire industry. I continue to find these reports disturbing, and assert that they do not create an accurate picture of the industry overall. Therefore, I would like to remind every one where Fidelity stands on these issues. I will say two things specifically regarding allegations that some mutual fund companies were in violation of the Securities and Exchange Commission’s forward pricing rules or were involved in so called “market timing” activities.
First, Fidelity has no agreements that permit customers who buy fund shares after 4 p.m. to obtain the 4 p.m. price. This is not a new policy. This is not to say that some one could not deceive the company through fraudulent acts. However, we are extremely diligent in preventing fraud from occurring in this manner and in every other. But I underscore again that Fidelity has no so called “agreements” that sanction illegal practices.
Second, Fidelity continues to stand on record, as we have for years, in opposition to predatory short term trading that adversely affects shareholders in a mutual fund. Back in the 1980s, we initiated a fee which is returned to the fund and, therefore, to investors to discourage this activity. Further, we took the lead several years ago in developing a Fair Value Pricing Policy to prevent market timing on foreign securities in our funds. I am confident we will find other ways to make it more difficult for predatory traders to operate. However, this will only be achieved through close cooperation among regulators, legislators and the industry.
Yes, there have been unfortunate instances of unethical and illegal activity within the mutual fund industry from time to time. That is true of any industry. When this occurs, confessed or convicted offenders should be dealt with appropriately. But we are still concerned about the risk of over regulation and the quick application of simplistic solutions to intricate problems. Every system can be improved, and we support and applaud well thought out improvements by regulators, legislators and industry representatives that achieve the common goal of building and protecting the value of investors’ holdings.
For nearly 60 years, Fidelity has worked very hard to improve its products and service to justify your trust. When our family founded this company in 1946, we had only a few hundred customers. Today, we serve more than 18 million customers including individual investors and participants in retirement plans across America.
Let me close by saying that we do not take your trust in us for granted, and we realize that we must always work to improve all aspects of our service to you. In turn, we urge you to continue your active participation with your financial matters, so that your interests can be well served.
Best regards,
/s/ Edward C. Johnson 3d
Edward C. Johnson 3d
Annual Report 4
Performance: The Bottom Line
Average annual total return reflects the change in the value of an investment, assuming reinvestment of the class’ dividend income and capital gains (the profits earned upon the sale of securities that have grown in value) and assuming a constant rate of performance each year. The $10,000 table and the fund’s returns do not reflect the deduction of taxes that a shareholder would pay on fund distribu tions or the redemption of fund shares. During periods of reimbursement by Fidelity, a fund’s total return will be greater than it would be had the reimburse ment not occurred. How a fund did yesterday is no guarantee of how it will do tomorrow.
| Average Annual Total Returns | | | | | | |
| Periods ended November 30, 2005 | | Past 1 | | Past 5 | | Life of |
| | | year | | years | | fundA |
| Class A (incl. 5.75% sales charge) | | 3.12% | | 0.36% | | 2.31% |
| Class T (incl. 3.50% sales charge) | | 5.22% | | 0.17% | | 2.12% |
| Class B (incl. contingent deferred | | | | | | |
| sales charge)B | | 3.49% | | 0.34% | | 2.09% |
| Class C (incl. contingent deferred | | | | | | |
| sales charge)C | | 7.48% | | 0.09% | | 1.87% |
A From November 13, 2000.
B Class B shares’ contingent deferred sales charges included in the past one year, past 5 year, and
life of fund total return figures are 5%, 2% and 1%, respectively.
C Class C shares’ contingent deferred sales charges included in the past one year, past 5 year, and
life of fund total return figures are 1%, 0% and 0%, respectively.
|
5 Annual Report
5
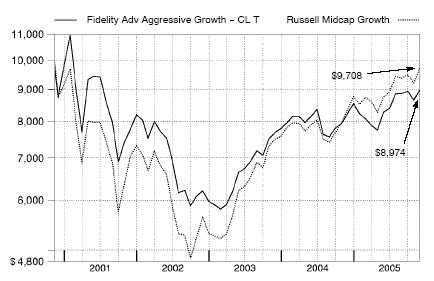
| | $10,000 Over Life of Fund
|
Let’s say hypothetically that $10,000 was invested in Fidelity® Advisor Aggressive Growth Fund Class T on November 13, 2000, when the fund started, and the current 3.50% sales charge was paid. The chart shows how the value of your investment would have changed, and also shows how the Russell Midcap® Growth Index performed over the same period.
Management’s Discussion of Fund Performance
Comments from Steven Calhoun, Portfolio Manager of Fidelity® Advisor Aggressive Growth Fund
Numerous events unfolded during the 12 month period ending November 30, 2005, that were major influences on the U.S. equity markets. Issues exerting downward pressure on stocks included higher levels of inflation, eight short term interest rate hikes by the Federal Reserve Board, exorbitant energy prices, and a Category 4 hurricane that devas tated both the city of New Orleans and several nearby oil production and refinery facilities. Grabbing most of the markets’ upbeat headlines was consistent strength in consumer spending, corporate earnings and gross domestic product (GDP). When all was said and done, investors demonstrated their conviction in the economy, pushing stocks higher across the board. By period end, the Standard & Poor’s 500SM Index, the NASDAQ Composite® Index and the Dow Jones Industrial AverageSM approached or exceeded four and a half year highs. For the 12 months overall, the S&P 500® was up 8.44%, the NASDAQ® rose 7.28% and the Dow advanced 6.07%, threatening to eclipse the 11,000 threshold for the first time since 2001.
For the 12 months ending November 30, 2005, the fund’s Class A, Class T, Class B and Class C shares returned 9.41%, 9.04%, 8.49% and 8.48%, respectively (excluding sales charges), well behind the 16.20% return of the Russell Midcap® Growth Index and the 13.30% gain of the LipperSM Mid Cap Funds Average. Most of the underperformance versus the index occurred during the first half of the period, when several holdings in the phar maceuticals and biotechnology group particularly Biogen Idec and Ireland based Elan suffered steep declines. Questions about the safety of the companies’ jointly developed multiple sclerosis drug, Tysabri, and its voluntary withdrawal from the market early in 2005 hurt both stocks. I sold Elan and Biogen Idec shortly after taking over the fund in June. Elsewhere, Chinese online gaming stock Shanda Interactive Entertainment was one of my picks that didn’t work out. On the other hand, fund performance benefited from both an overweighting and stock selection in energy a sector I added to during the period. Biotechnology bellwether Genentech was by far the fund’s top contributor. Positive test results for a number of the company’s drugs fueled a strong advance in its stock, and I liquidated the position to lock in profits. Internet search engine Google was another strong contributor, its stock price lifted by several upward revisions in earnings growth.
The views expressed in this statement reflect those of the portfolio manager only through the end of the period of the report as stated on the cover and do not necessarily represent the views of Fidelity or any other person in the Fidelity organization. Any such views are subject to change at any time based upon market or other conditions and Fidelity disclaims any responsibility to update such views. These views may not be relied on as investment advice and, because investment decisions for a Fidelity fund are based on numerous factors, may not be relied on as an indication of trading intent on behalf of any Fidelity fund.
Shareholder Expense Example
As a shareholder of the Fund, you incur two types of costs: (1) transaction costs, including sales charges (loads) on purchase payments or redemption proceeds, and (2) ongoing costs, including management fees, distribution and/or service (12b 1) fees and other Fund expenses. This Example is intended to help you understand your ongoing costs (in dollars) of investing in the Fund and to compare these costs with the ongoing costs of investing in other mutual funds.
The Example is based on an investment of $1,000 invested at the beginning of the period and held for the entire period (June 1, 2005 to November 30, 2005).
The first line of the table below for each class of the Fund provides information about actual account values and actual expenses. You may use the information in this line, together with the amount you invested, to estimate the expenses that you paid over the period. Simply divide your account value by $1,000.00 (for example, an $8,600 account value divided by $1,000.00 = 8.6), then multiply the result by the number in the first line for a class of the Fund under the heading entitled “Expenses Paid During Period” to estimate the expenses you paid on your account during this period.
Hypothetical Example for Comparison Purposes
The second line of the table below for each class of the Fund provides information about hypothetical account values and hypothetical expenses based on a Class’ actual expense ratio and an assumed rate of return of 5% per year before expenses, which is not the Class’ actual return. The hypothetical account values and expenses may not be used to estimate the actual ending account balance or expenses you paid for the period. You may use this information to compare the ongoing costs of investing in the Fund and other funds. To do so, compare this 5% hypothetical example with the 5% hypothetical examples that appear in the shareholder reports of the other funds.
Please note that the expenses shown in the table are meant to highlight your ongoing costs only and do not reflect any transaction costs. Therefore, the second line of the table is useful in comparing ongoing costs only, and will not help you determine the relative total costs of owning different funds. In addition, if these transactional costs were included, your costs would have been higher.
| | | | | | | | | | | Expenses Paid |
| | | | | Beginning | | Ending | | During Period* |
| | | | | Account Value | | Account Value | | June 1, 2005 to |
| | | | | June 1, 2005 | | November 30, 2005 | | November 30, 2005 |
| Class A | | | | | | | | | | | | |
| Actual | | $ | | 1,000.00 | | $ | | 1,087.80 | | $ | | 6.80 |
| HypotheticalA | | $ | | 1,000.00 | | $ | | 1,018.55 | | $ | | 6.58 |
| Class T | | | | | | | | | | | | |
| Actual | | $ | | 1,000.00 | | $ | | 1,085.30 | | $ | | 8.10 |
| HypotheticalA | | $ | | 1,000.00 | | $ | | 1,017.30 | | $ | | 7.84 |
| Class B | | | | | | | | | | | | |
| Actual | | $ | | 1,000.00 | | $ | | 1,082.30 | | $ | | 10.70 |
| HypotheticalA | | $ | | 1,000.00 | | $ | | 1,014.79 | | $ | | 10.35 |
| Class C | | | | | | | | | | | | |
| Actual | | $ | | 1,000.00 | | $ | | 1,082.20 | | $ | | 10.70 |
| HypotheticalA | | $ | | 1,000.00 | | $ | | 1,014.79 | | $ | | 10.35 |
| Institutional Class | | | | | | | | | | | | |
| Actual | | $ | | 1,000.00 | | $ | | 1,088.70 | | $ | | 5.50 |
| HypotheticalA | | $ | | 1,000.00 | | $ | | 1,019.80 | | $ | | 5.32 |
| |
| A 5% return per year before expenses | | | | | | | | |
* Expenses are equal to each Class’ annualized expense ratio (shown in the table below); multiplied by the average account value over the period, multiplied by 183/365 (to reflect the one half year period).
| | | Annualized |
| | | Expense Ratio |
| Class A | | 1.30% |
| Class T | | 1.55% |
| Class B | | 2.05% |
| Class C | | 2.05% |
| Institutional Class | | 1.05% |
9 Annual Report
| Investment Changes | | | | |
| |
| |
| Top Ten Stocks as of November 30, 2005 | | | | |
| | | % of fund’s | | % of fund’s net assets |
| | | net assets | | 6 months ago |
| St. Jude Medical, Inc. | | 3.2 | | 0.0 |
| KB Home | | 2.6 | | 0.0 |
| Potash Corp. of Saskatchewan | | 2.5 | | 0.6 |
| Abercrombie & Fitch Co. Class A | | 2.1 | | 0.4 |
| D.R. Horton, Inc. | | 2.1 | | 0.0 |
| Google, Inc. Class A (sub. vtg.) | | 2.1 | | 0.7 |
| Urban Outfitters, Inc. | | 2.1 | | 0.0 |
| Ameritrade Holding Corp. | | 2.1 | | 0.3 |
| INAMED Corp. | | 2.0 | | 0.0 |
| Agrium, Inc. | | 2.0 | | 0.0 |
| | | 22.8 | | |
| Top Five Market Sectors as of November 30, 2005 | | |
| | | % of fund’s | | % of fund’s net assets |
| | | net assets | | 6 months ago |
| Health Care | | 31.4 | | 29.2 |
| Information Technology | | 20.2 | | 26.9 |
| Consumer Discretionary | | 15.4 | | 17.1 |
| Energy | | 11.3 | | 7.3 |
| Materials | | 7.6 | | 3.2 |
Annual Report 10
| Investments November 30, 2005 | | |
| Showing Percentage of Net Assets | | | | | | |
| |
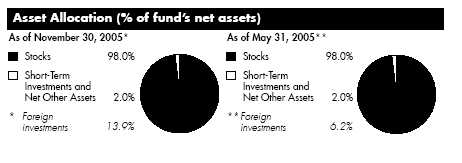
| Common Stocks 98.0% | | | | | | |
| | | Shares | | Value (Note 1) |
| |
| CONSUMER DISCRETIONARY – 15.4% | | | | | | |
| Hotels, Restaurants & Leisure 2.6% | | | | | | |
| Kerzner International Ltd. (a) | | 1,900 | | $ | | 123,519 |
| Penn National Gaming, Inc. (a) | | 15,067 | | | | 499,772 |
| Station Casinos, Inc. | | 6,600 | | | | 457,644 |
| | | | | | | 1,080,935 |
| Household Durables – 4.8% | | | | | | |
| D.R. Horton, Inc. | | 24,561 | | | | 870,442 |
| KB Home | | 15,400 | | | | 1,074,458 |
| | | | | | | 1,944,900 |
| Media – 1.1% | | | | | | |
| Getty Images, Inc. (a) | | 4,980 | | | | 454,624 |
| Specialty Retail – 6.9% | | | | | | |
| Abercrombie & Fitch Co. Class A | | 14,300 | | | | 876,876 |
| Best Buy Co., Inc. | | 13,950 | | | | 672,948 |
| Tiffany & Co., Inc. | | 10,600 | | | | 431,420 |
| Urban Outfitters, Inc. (a) | | 27,300 | | | | 842,478 |
| | | | | | | 2,823,722 |
| |
| TOTAL CONSUMER DISCRETIONARY | | | | | | 6,304,181 |
| |
| CONSUMER STAPLES 2.0% | | | | | | |
| Food & Staples Retailing – 2.0% | | | | | | |
| Whole Foods Market, Inc. | | 5,610 | | | | 826,241 |
| ENERGY 11.3% | | | | | | |
| Energy Equipment & Services – 4.4% | | | | | | |
| Baker Hughes, Inc. | | 7,800 | | | | 447,330 |
| ENSCO International, Inc. | | 9,300 | | | | 440,448 |
| Halliburton Co. | | 7,400 | | | | 471,010 |
| Weatherford International Ltd. (a) | | 6,830 | | | | 474,753 |
| | | | | | | 1,833,541 |
| Oil, Gas & Consumable Fuels – 6.9% | | | | | | |
| Arch Coal, Inc. | | 5,600 | | | | 431,424 |
| Chesapeake Energy Corp. | | 14,400 | | | | 416,880 |
| EOG Resources, Inc. | | 8,800 | | | | 631,400 |
| Peabody Energy Corp. | | 5,300 | | | | 417,958 |
| |
| |
| |
| |
| See accompanying notes which are an integral part of the financial statements. | | | | |
| |
| 11 | | | | Annual Report |
| Investments continued | | | | | | |
| |
| Common Stocks continued | | | | | | |
| | | Shares | | Value (Note 1) |
| |
| ENERGY – continued | | | | | | |
| Oil, Gas & Consumable Fuels – continued | | | | | | |
| Range Resources Corp. | | 12,500 | | $ | | 465,500 |
| Ultra Petroleum Corp. (a) | | 8,500 | | | | 457,130 |
| | | | | | | 2,820,292 |
| |
| TOTAL ENERGY | | | | | | 4,653,833 |
| |
| FINANCIALS – 2.8% | | | | | | |
| Capital Markets 2.1% | | | | | | |
| Ameritrade Holding Corp. (a) | | 35,900 | | | | 838,624 |
| Diversified Financial Services – 0.6% | | | | | | |
| Indiabulls Financial Services Ltd. | | 3,553 | | | | 12,763 |
| Indiabulls Financial Services Ltd. GDR (e) | | 11,268 | | | | 40,451 |
| IntercontinentalExchange, Inc. | | 6,500 | | | | 209,950 |
| | | | | | | 263,164 |
| Real Estate 0.1% | | | | | | |
| Sinochem Hong Kong Holding Ltd. (a) | | 189,200 | | | | 32,938 |
| |
| TOTAL FINANCIALS | | | | | | 1,134,726 |
| |
| HEALTH CARE – 31.4% | | | | | | |
| Biotechnology – 6.8% | | | | | | |
| Alnylam Pharmaceuticals, Inc. (a) | | 15,100 | | | | 189,656 |
| Amgen, Inc. (a) | | 7,500 | | | | 606,975 |
| Celgene Corp. (a) | | 11,640 | | | | 709,109 |
| Martek Biosciences (a) | | 16,300 | | | | 427,223 |
| MedImmune, Inc. (a) | | 12,110 | | | | 434,870 |
| Protein Design Labs, Inc. (a) | | 15,170 | | | | 422,485 |
| | | | | | | 2,790,318 |
| Health Care Equipment & Supplies – 16.7% | | | | | | |
| Alcon, Inc. | | 2,900 | | | | 406,580 |
| American Medical Systems Holdings, Inc. (a) | | 44,800 | | | | 824,320 |
| China Medical Technologies, Inc. sponsored ADR | | 3,400 | | | | 106,182 |
| Cyberonics, Inc. (a) | | 23,500 | | | | 662,935 |
| INAMED Corp. (a) | | 10,000 | | | | 838,400 |
| Integra LifeSciences Holdings Corp. (a) | | 12,000 | | | | 438,480 |
| Kyphon, Inc. (a) | | 9,500 | | | | 403,655 |
| Mentor Corp. | | 13,300 | | | | 648,242 |
| NeuroMetrix, Inc. (a) | | 6,406 | | | | 199,163 |
| NuVasive, Inc. (a) | | 20,600 | | | | 354,320 |
| ResMed, Inc. (a) | | 1,300 | | | | 53,040 |
See accompanying notes which are an integral part of the financial statements.
| Common Stocks continued | | | | |
| | | Shares | | Value (Note 1) |
| |
| HEALTH CARE – continued | | | | |
| Health Care Equipment & Supplies – continued | | | | |
| St. Jude Medical, Inc. (a) | | 28,000 | | $ 1,337,560 |
| Ventana Medical Systems, Inc. (a) | | 15,120 | | 582,271 |
| | | | | 6,855,148 |
| Health Care Providers & Services – 4.6% | | | | |
| Caremark Rx, Inc. (a) | | 8,400 | | 431,676 |
| Covance, Inc. (a) | | 9,100 | | 432,614 |
| Humana, Inc. (a) | | 13,850 | | 634,746 |
| Sierra Health Services, Inc. (a) | | 5,200 | | 406,744 |
| | | | | 1,905,780 |
| Pharmaceuticals – 3.3% | | | | |
| Allergan, Inc. | | 5,300 | | 530,000 |
| Medicis Pharmaceutical Corp. Class A | | 13,500 | | 430,785 |
| Sepracor, Inc. (a) | | 7,150 | | 393,107 |
| | | | | 1,353,892 |
| |
| TOTAL HEALTH CARE | | | | 12,905,138 |
| |
| INDUSTRIALS – 7.3% | | | | |
| Air Freight & Logistics – 2.7% | | | | |
| Expeditors International of Washington, Inc. | | 9,500 | | 674,595 |
| UTI Worldwide, Inc. | | 4,581 | | 445,685 |
| | | | | 1,120,280 |
| Commercial Services & Supplies – 1.2% | | | | |
| Stericycle, Inc. (a) | | 7,770 | | 476,456 |
| Construction & Engineering – 1.2% | | | | |
| Quanta Services, Inc. (a) | | 34,600 | | 489,590 |
| Electrical Equipment – 1.0% | | | | |
| AMETEK, Inc. | | 10,100 | | 430,361 |
| Machinery – 1.2% | | | | |
| Deere & Co. | | 7,000 | | 485,450 |
| |
| TOTAL INDUSTRIALS | | | | 3,002,137 |
| |
| INFORMATION TECHNOLOGY – 20.2% | | | | |
| Communications Equipment – 4.4% | | | | |
| ADC Telecommunications, Inc. (a) | | 28,100 | | 574,083 |
| Comverse Technology, Inc. (a) | | 23,473 | | 615,227 |
See accompanying notes which are an integral part of the financial statements.
13 Annual Report
| Investments continued | | | | | | |
| |
| Common Stocks continued | | | | | | |
| | | Shares | | Value (Note 1) |
| |
| INFORMATION TECHNOLOGY – continued | | | | | | |
| Communications Equipment – continued | | | | | | |
| Corning, Inc. (a) | | 6,170 | | $ | | 124,943 |
| Ixia (a) | | 35,796 | | | | 493,269 |
| | | | | | | 1,807,522 |
| Computers & Peripherals – 1.1% | | | | | | |
| Sun Microsystems, Inc. (a) | | 112,300 | | | | 423,371 |
| Internet Software & Services – 3.1% | | | | | | |
| Google, Inc. Class A (sub. vtg.) (a) | | 2,100 | | | | 850,479 |
| VeriSign, Inc. (a) | | 19,600 | | | | 435,708 |
| | | | | | | 1,286,187 |
| Semiconductors & Semiconductor Equipment – 6.0% | | | | | | |
| ARM Holdings PLC sponsored ADR | | 73,300 | | | | 461,057 |
| ASML Holding NV (NY Shares) (a) | | 36,900 | | | | 707,004 |
| Microchip Technology, Inc. | | 17,570 | | | | 586,135 |
| National Semiconductor Corp. | | 17,600 | | | | 455,488 |
| PMC-Sierra, Inc. (a) | | 34,030 | | | | 267,816 |
| | | | | | | 2,477,500 |
| Software 5.6% | | | | | | |
| Activision, Inc. (a) | | 31,210 | | | | 415,405 |
| Citrix Systems, Inc. (a) | | 14,670 | | | | 398,144 |
| Cognos, Inc. (a) | | 12,500 | | | | 417,935 |
| Hyperion Solutions Corp. (a) | | 8,732 | | | | 462,359 |
| Shanda Interactive Entertainment Ltd. sponsored ADR (a)(d) | | 35,100 | | | | 599,859 |
| | | | | | | 2,293,702 |
| |
| TOTAL INFORMATION TECHNOLOGY | | | | | | 8,288,282 |
| |
| MATERIALS 7.6% | | | | | | |
| Chemicals – 6.6% | | | | | | |
| Agrium, Inc. | | 41,100 | | | | 837,186 |
| Monsanto Co. | | 11,400 | | | | 835,278 |
| Potash Corp. of Saskatchewan | | 14,100 | | | | 1,027,235 |
| | | | | | | 2,699,699 |
| Construction Materials 1.0% | | | | | | |
| Martin Marietta Materials, Inc. | | 5,800 | | | | 435,638 |
| |
| TOTAL MATERIALS | | | | | | 3,135,337 |
| |
| TOTAL COMMON STOCKS | | | | | | |
| (Cost $38,478,860) | | | | 40,249,875 |
See accompanying notes which are an integral part of the financial statements.
| Money Market Funds 1.8% | | | | | | | | |
| | | Shares | | | | Value (Note 1) |
| Fidelity Cash Central Fund, 4.08% (b) | | 505,186 | | | | | | $ 505,186 |
| Fidelity Securities Lending Cash Central Fund, 4.09% (b)(c) | | 234,500 | | | | | | 234,500 |
| TOTAL MONEY MARKET FUNDS | | | | | | | | |
| (Cost $739,686) | | | | | | | | 739,686 |
| TOTAL INVESTMENT PORTFOLIO 99.8% | | | | | | | | |
| (Cost $39,218,546) | | | | | | 40,989,561 |
| |
| NET OTHER ASSETS – 0.2% | | | | | | | | 97,262 |
| NET ASSETS 100% | | | | | | $ 41,086,823 |
Legend
(a) Non-income producing
(b) Affiliated fund that is available only to
investment companies and other
accounts managed by Fidelity
Investments. The rate quoted is the
annualized seven-day yield of the fund
at period end. A complete unaudited
listing of the fund’s holdings as of its
most recent quarter end is available
upon request.
|
(c) Investment made with cash collateral
received from securities on loan.
(d) Security or a portion of the security is on
loan at period end.
(e) Security exempt from registration under
Rule 144A of the Securities Act of 1933.
These securities may be resold in
transactions exempt from registration,
normally to qualified institutional buyers.
At the period end, the value of these
securities amounted to $40,451 or 0.1%
of net assets.
|
Affiliated Central Funds
Information regarding income received by the fund from the affiliated Central funds during the period is as follows:
| Fund | | | | Income received |
| Fidelity Cash Central Fund | | | $ | 31,473 |
| Fidelity Securities Lending Cash Central Fund | | | | 13,012 |
| Total | | | $ | 44,485 |
See accompanying notes which are an integral part of the financial statements.
15 Annual Report
Investments continued
Other Information
Distribution of investments by country of issue, as a percentage of total net assets, is as follows:
| United States of America | | 86.1% |
| Canada | | 6.7% |
| Netherlands | | 1.7% |
| China | | 1.5% |
| United Kingdom | | 1.1% |
| British Virgin Islands | | 1.1% |
| Switzerland | | 1.0% |
| Others (individually less than 1%) . | | 0.8% |
| | | 100.0% |
Income Tax Information
At November 30, 2005, the fund had a capital loss carryforward of approximately $4,868,687 all of which will expire on November 30, 2010.
See accompanying notes which are an integral part of the financial statements.
Annual Report 16
| Financial Statements | | | | | | | | |
| |
| |
| Statement of Assets and Liabilities | | | | | | | | |
| | | | | | | November 30, 2005 |
| |
| Assets | | | | | | | | |
| Investment in securities, at value (including securities | | | | | | | | |
| loaned of $229,006) See accompanying schedule: | | | | | | | | �� |
| Unaffiliated issuers (cost $38,478,860) | | $ | | 40,249,875 | | | | |
| Affiliated Central Funds (cost $739,686) | | | | 739,686 | | | | |
| Total Investments (cost $39,218,546) | | | | | | $ | | 40,989,561 |
| Receivable for investments sold | | | | | | | | 1,186,148 |
| Receivable for fund shares sold | | | | | | | | 19,576 |
| Dividends receivable | | | | | | | | 10,260 |
| Interest receivable | | | | | | | | 3,679 |
| Prepaid expenses | | | | | | | | 223 |
| Receivable from investment adviser for expense | | | | | | | | |
| reductions | | | | | | | | 2,639 |
| Other receivables | | | | | | | | 7,105 |
| Total assets | | | | | | | | 42,219,191 |
| |
| Liabilities | | | | | | | | |
| Payable to custodian bank | | $ | | 15,305 | | | | |
| Payable for investments purchased | | | | 721,481 | | | | |
| Payable for fund shares redeemed | | | | 71,871 | | | | |
| Accrued management fee | | | | 21,212 | | | | |
| Distribution fees payable | | | | 22,525 | | | | |
| Other affiliated payables | | | | 12,992 | | | | |
| Other payables and accrued expenses | | | | 32,482 | | | | |
| Collateral on securities loaned, at value | | | | 234,500 | | | | |
| Total liabilities | | | | | | | | 1,132,368 |
| |
| Net Assets | | | | | | $ | | 41,086,823 |
| Net Assets consist of: | | | | | | | | |
| Paid in capital | | | | | | $ | | 44,331,194 |
| Accumulated undistributed net realized gain (loss) on | | | | | | | | |
| investments and foreign currency transactions | | | | | | | | (5,015,392) |
| Net unrealized appreciation (depreciation) on | | | | | | | | |
| investments and assets and liabilities in foreign | | | | | | | | |
| currencies | | | | | | | | 1,771,021 |
| Net Assets | | | | | | $ | | 41,086,823 |
See accompanying notes which are an integral part of the financial statements.
17 Annual Report
| Financial Statements continued | | | | | | |
| |
| Statement of Assets and Liabilities continued | | | | |
| | | | | November 30, 2005 |
| |
| Calculation of Maximum Offering Price | | | | | | |
| Class A: | | | | | | |
| Net Asset Value and redemption price per share | | | | | | |
| ($7,206,274 ÷ 765,380 shares) | | | | $ | | 9.42 |
| Maximum offering price per share (100/94.25 of $9.42) | | . | | $ | | 9.99 |
| Class T: | | | | | | |
| Net Asset Value and redemption price per share | | | | | | |
| ($16,331,474 ÷ 1,757,820 shares) | | | | $ | | 9.29 |
| Maximum offering price per share (100/96.50 of $9.29) | | . | | $ | | 9.63 |
| Class B: | | | | | | |
| Net Asset Value and offering price per share | | | | | | |
| ($9,236,782 ÷ 1,018,397 shares)A | | | | $ | | 9.07 |
| Class C: | | | | | | |
| Net Asset Value and offering price per share | | | | | | |
| ($7,790,540 ÷ 857,606 shares)A | | | | $ | | 9.08 |
| Institutional Class: | | | | | | |
| Net Asset Value, offering price and redemption price per | | | | |
| ��share ($521,753 ÷ 54,546 shares) | | | | $ | | 9.57 |
| |
| A Redemption price per share is equal to net asset value less any applicable contingent deferred sales charge. | | | | |
See accompanying notes which are an integral part of the financial statements.
Annual Report 18
| Statement of Operations | | | | | | |
| | | | | Year ended November 30, 2005 |
| |
| Investment Income | | | | | | |
| Dividends | | | | $ | | 179,184 |
| Special dividends | | | | | | 25,350 |
| Interest | | | | | | 174 |
| Income from affiliated Central Funds (including $14,741 | | | | |
| from security lending) | | | | | | 44,485 |
| Total income | | | | | | 249,193 |
| |
| Expenses | | | | | | |
| Management fee | | $ | | 248,991 | | |
| Transfer agent fees | | | | 163,113 | | |
| Distribution fees | | | | 267,185 | | |
| Accounting and security lending fees | | | | 19,495 | | |
| Independent trustees’ compensation | | | | 184 | | |
| Custodian fees and expenses | | | | 24,524 | | |
| Registration fees | | | | 52,965 | | |
| Audit | | | | 40,084 | | |
| Legal | | | | 678 | | |
| Miscellaneous | | | | 1,794 | | |
| Total expenses before reductions | | | | 819,013 | | |
| Expense reductions | | | | (150,331) | | 668,682 |
| |
| Net investment income (loss) | | | | | | (419,489) |
| Realized and Unrealized Gain (Loss) | | | | | | |
| Net realized gain (loss) on: | | | | | | |
| Investment securities: | | | | | | |
| Unaffiliated issuers | | | | 6,396,199 | | |
| Foreign currency transactions | | | | (848) | | |
| Total net realized gain (loss) | | | | | | 6,395,351 |
| Change in net unrealized appreciation (depreciation) on: | | | | |
| Investment securities | | | | (2,534,840) | | |
| Assets and liabilities in foreign currencies | | | | (52) | | |
| Total change in net unrealized appreciation | | | | | | |
| (depreciation) | | | | | | (2,534,892) |
| Net gain (loss) | | | | | | 3,860,459 |
| Net increase (decrease) in net assets resulting from | | | | | | |
| operations | | | | $ | | 3,440,970 |
See accompanying notes which are an integral part of the financial statements.
19 Annual Report
| Financial Statements continued | | | | | | | | |
| |
| |
| Statement of Changes in Net Assets | | | | | | | | |
| | | | | Year ended | | | | Year ended |
| | | | | November 30, | | | | November 30, |
| | | | | 2005 | | | | 2004 |
| Increase (Decrease) in Net Assets | | | | | | | | |
| Operations | | | | | | | | |
| Net investment income (loss) | | $ | | (419,489) | | $ | | (559,618) |
| Net realized gain (loss) | | | | 6,395,351 | | | | 3,516,046 |
| Change in net unrealized appreciation (depreciation) . | | | | (2,534,892) | | | | (473,553) |
| Net increase (decrease) in net assets resulting | | | | | | | | |
| from operations | | | | 3,440,970 | | | | 2,482,875 |
| Share transactions - net increase (decrease) | | | | (3,060,326) | | | | 4,161,402 |
| Total increase (decrease) in net assets | | | | 380,644 | | | | 6,644,277 |
| |
| Net Assets | | | | | | | | |
| Beginning of period | | | | 40,706,179 | | | | 34,061,902 |
| End of period | | $ | | 41,086,823 | | $ | | 40,706,179 |
See accompanying notes which are an integral part of the financial statements.
| Financial Highlights Class A | | | | | | | | | | | | | | | | |
| Years ended November 30, | | 2005 | | | | 2004 | | | | 2003 | | | | 2002 | | | | 2001 |
| Selected Per Share Data | | | | | | | | | | | | | | | | | | |
| Net asset value, beginning of | | | | | | | | | | | | | | | | | | |
| period | | $ 8.61 | | $ | | 8.02 | | $ | | 6.47 | | $ | | 8.08 | | $ | | 9.05 |
| Income from Investment | | | | | | | | | | | | | | | | | | |
| Operations | | | | | | | | | | | | | | | | | | |
| Net investment income | | | | | | | | | | | | | | | | | | |
| (loss)C | | (.06)D | | | | (.09) | | | | (.06) | | | | (.08) | | | | (.01) |
| Net realized and unrealized | | | | | | | | | | | | | | | | | | |
| gain (loss) | | 87 | | | | .68 | | | | 1.61 | | | | (1.53) | | | | (.95) |
| Total from investment | | | | | | | | | | | | | | | | | | |
| operations | | 81 | | | | .59 | | | | 1.55 | | | | (1.61) | | | | (.96) |
| Distributions from net realized | | | | | | | | | | | | | | | | | | |
| gain | | — | | | | — | | | | — | | | | — | | | | (.01) |
| Net asset value, end of period | | $ 9.42 | | $ | | 8.61 | | $ | | 8.02 | | $ | | 6.47 | | $ | | 8.08 |
| Total ReturnA,B | | 9.41% | | | | 7.36% | | | | 23.96% | | | | (19.93)% | | | | (10.62)% |
| Ratios to Average Net AssetsE | | | | | | | | | | | | | | | | | | |
| Expenses before reductions . | | 1.60% | | | | 1.90% | | | | 2.25% | | | | 2.05% | | | | 2.06% |
| Expenses net of fee waivers, | | | | | | | | | | | | | | | | | | |
| if any | | 1.33% | | | | 1.50% | | | | 1.54% | | | | 1.69% | | | | 1.75% |
| Expenses net of all | | | | | | | | | | | | | | | | | | |
| reductions | | 1.25% | | | | 1.45% | | | | 1.47% | | | | 1.49% | | | | 1.71% |
| Net investment income (loss) | | (.63)%D | | | | (1.03)% | | | | (.89)% | | | | (1.07)% | | | | (.14)% |
| Supplemental Data | | | | | | | | | | | | | | | | | | |
| Net assets, end of period | | | | | | | | | | | | | | | | | | |
| (000 omitted) | | $ 7,206 | | $ | | 6,227 | | $ | | 4,177 | | $ | | 2,620 | | $ | | 3,320 |
| Portfolio turnover rate | | 213% | | | | 94% | | | | 158% | | | | 473% | | | | 481% |
A Total returns would have been lower had certain expenses not been reduced during the periods shown.
B Total returns do not include the effect of the sales charges.
C Calculated based on average shares outstanding during the period.
D Investment income per share reflects a special dividend which amounted to $.01 per share. Excluding the special dividend, the ratio of net
investment income to average net assets would have been (.69)%.
E Expense ratios reflect operating expenses of the class. Expenses before reductions do not reflect amounts reimbursed by the investment adviser or
reductions from brokerage service arrangements or other expense offset arrangements and do not represent the amount paid by the class during
periods when reimbursements or reductions occur. Expenses net of fee waivers reflect expenses after reimbursement by the investment adviser but
prior to reductions from brokerage service arrangements or other expense offset arrangements. Expenses net of all reductions represent the net
expenses paid by the class.
|
See accompanying notes which are an integral part of the financial statements.
21 Annual Report
| Financial Highlights Class T | | | | | | | | |
| Years ended November 30, | | 2005 | | 2004 | | 2003 | | 2002 | | 2001 |
| Selected Per Share Data | | | | | | | | | | |
| Net asset value, beginning of | | | | | | | | | | |
| period | | $ 8.52 | | $ 7.95 | | $ 6.43 | | $ 8.06 | | $ 9.05 |
| Income from Investment | | | | | | | | | | |
| Operations | | | | | | | | | | |
| Net investment income | | | | | | | | | | |
| (loss)C | | (.08)D | | (.11) | | (.08) | | (.10) | | (.03) |
| Net realized and unrealized | | | | | | | | | | |
| gain (loss) | | 85 | | .68 | | 1.60 | | (1.53) | | (.95) |
| Total from investment | | | | | | | | | | |
| operations | | 77 | | .57 | | 1.52 | | (1.63) | | (.98) |
| Distributions from net realized | | | | | | | | | | |
| gain | | — | | — | | — | | — | | (.01) |
| Net asset value, end of period | | $ 9.29 | | $ 8.52 | | $ 7.95 | | $ 6.43 | | $ 8.06 |
| Total ReturnA,B | | 9.04% | | 7.17% | | 23.64% | | (20.22)% | | (10.84)% |
| Ratios to Average Net AssetsE | | | | | | | | | | |
| Expenses before reductions . | | 1.93% | | 2.25% | | 2.47% | | 2.16% | | 2.30% |
| Expenses net of fee waivers, | | | | | | | | | | |
| if any | | 1.58% | | 1.75% | | 1.79% | | 1.92% | | 2.00% |
| Expenses net of all | | | | | | | | | | |
| reductions | | 1.50% | | 1.71% | | 1.72% | | 1.72% | | 1.96% |
| Net investment income (loss) | | (.88)%D | | (1.28)% | | (1.14)% | | (1.29)% | | (.39)% |
| Supplemental Data | | | | | | | | | | |
| Net assets, end of period | | | | | | | | | | |
| (000 omitted) | | $16,331 | | $15,101 | | $12,458 | | $10,511 | | $14,165 |
| Portfolio turnover rate | | 213% | | 94% | | 158% | | 473% | | 481% |
A Total returns would have been lower had certain expenses not been reduced during the periods shown.
B Total returns do not include the effect of the sales charges.
C Calculated based on average shares outstanding during the period.
D Investment income per share reflects a special dividend which amounted to $.01 per share. Excluding the special dividend, the ratio of net
investment income to average net assets would have been (.94)%.
E Expense ratios reflect operating expenses of the class. Expenses before reductions do not reflect amounts reimbursed by the investment adviser or
reductions from brokerage service arrangements or other expense offset arrangements and do not represent the amount paid by the class during
periods when reimbursements or reductions occur. Expenses net of fee waivers reflect expenses after reimbursement by the investment adviser but
prior to reductions from brokerage service arrangements or other expense offset arrangements. Expenses net of all reductions represent the net
expenses paid by the class.
|
See accompanying notes which are an integral part of the financial statements.
| Financial Highlights Class B | | | | | | | | | | | | | | | | |
| Years ended November 30, | | 2005 | | | | 2004 | | | | 2003 | | | | 2002 | | | | 2001 |
| Selected Per Share Data | | | | | | | | | | | | | | | | | | |
| Net asset value, beginning of | | | | | | | | | | | | | | | | | | |
| period | | $ 8.36 | | $ | | 7.84 | | $ | | 6.37 | | $ | | 8.02 | | $ | | 9.05 |
| Income from Investment | | | | | | | | | | | | | | | | | | |
| Operations | | | | | | | | | | | | | | | | | | |
| Net investment income | | | | | | | | | | | | | | | | | | |
| (loss)C | | (.12)D | | | | (.14) | | | | (.11) | | | | (.13) | | | | (.08) |
| Net realized and unrealized | | | | | | | | | | | | | | | | | | |
| gain (loss) | | 83 | | | | .66 | | | | 1.58 | | | | (1.52) | | | | (.94) |
| Total from investment | | | | | | | | | | | | | | | | | | |
| operations | | 71 | | | | .52 | | | | 1.47 | | | | (1.65) | | | | (1.02) |
| Distributions from net realized | | | | | | | | | | | | | | | | | | |
| gain | | — | | | | — | | | | — | | | | — | | | | (.01) |
| Net asset value, end of period | | $ 9.07 | | $ | | 8.36 | | $ | | 7.84 | | $ | | 6.37 | | $ | | 8.02 |
| Total ReturnA,B | | 8.49% | | | | 6.63% | | | | 23.08% | | | | (20.57)% | | | | (11.29)% |
| Ratios to Average Net AssetsE | | | | | | | | | | | | | | | | | | |
| Expenses before reductions . | | 2.35% | | | | 2.67% | | | | 2.92% | | | | 2.73% | | | | 2.86% |
| Expenses net of fee waivers, | | | | | | | | | | | | | | | | | | |
| if any | | 2.09% | | | | 2.25% | | | | 2.25% | | | | 2.43% | | | | 2.50% |
| Expenses net of all | | | | | | | | | | | | | | | | | | |
| reductions | | 2.00% | | | | 2.21% | | | | 2.18% | | | | 2.23% | | | | 2.46% |
| Net investment income (loss) | | (1.38)%D | | | | (1.78)% | | | | (1.60)% | | | | (1.81)% | | | | (.89)% |
| Supplemental Data | | | | | | | | | | | | | | | | | | |
| Net assets, end of period | | | | | | | | | | | | | | | | | | |
| (000 omitted) | | $ 9,237 | | $ | | 9,593 | | $ | | 8,422 | | $ | | 6,262 | | $ | | 8,038 |
| Portfolio turnover rate | | 213% | | | | 94% | | | | 158% | | | | 473% | | | | 481% |
A Total returns would have been lower had certain expenses not been reduced during the periods shown.
B Total returns do not include the effect of the contingent deferred sales charge.
C Calculated based on average shares outstanding during the period.
D Investment income per share reflects a special dividend which amounted to $.01 per share. Excluding the special dividend, the ratio of net
investment income to average net assets would have been (1.44)% .
E Expense ratios reflect operating expenses of the class. Expenses before reductions do not reflect amounts reimbursed by the investment adviser or
reductions from brokerage service arrangements or other expense offset arrangements and do not represent the amount paid by the class during
periods when reimbursements or reductions occur. Expenses net of fee waivers reflect expenses after reimbursement by the investment adviser but
prior to reductions from brokerage service arrangements or other expense offset arrangements. Expenses net of all reductions represent the net
expenses paid by the class.
|
See accompanying notes which are an integral part of the financial statements.
23 Annual Report
| Financial Highlights Class C | | | | | | | | | | | | | | | | |
| Years ended November 30, | | 2005 | | | | 2004 | | | | 2003 | | | | 2002 | | | | 2001 |
| Selected Per Share Data | | | | | | | | | | | | | | | | | | |
| Net asset value, beginning of | | | | | | | | | | | | | | | | | | |
| period | | $ 8.37 | | $ | | 7.85 | | $ | | 6.38 | | $ | | 8.03 | | $ | | 9.05 |
| Income from Investment | | | | | | | | | | | | | | | | | | |
| Operations | | | | | | | | | | | | | | | | | | |
| Net investment income | | | | | | | | | | | | | | | | | | |
| (loss)C | | (.12)D | | | | (.14) | | | | (.11) | | | | (.13) | | | | (.08) |
| Net realized and unrealized | | | | | | | | | | | | | | | | | | |
| gain (loss) | | 83 | | | | .66 | | | | 1.58 | | | | (1.52) | | | | (.93) |
| Total from investment | | | | | | | | | | | | | | | | | | |
| operations | | 71 | | | | .52 | | | | 1.47 | | | | (1.65) | | | | (1.01) |
| Distributions from net realized | | | | | | | | | | | | | | | | | | |
| gain | | — | | | | — | | | | — | | | | — | | | | (.01) |
| Net asset value, end of period | | $ 9.08 | | $ | | 8.37 | | $ | | 7.85 | | $ | | 6.38 | | $ | | 8.03 |
| Total ReturnA,B | | 8.48% | | | | 6.62% | | | | 23.04% | | | | (20.55)% | | | | (11.18)% |
| Ratios to Average Net AssetsE | | | | | | | | | | | | | | | | | | |
| Expenses before reductions . | | 2.34% | | | | 2.52% | | | | 2.77% | | | | 2.58% | | | | 2.79% |
| Expenses net of fee waivers, | | | | | | | | | | | | | | | | | | |
| if any | | 2.09% | | | | 2.25% | | | | 2.25% | | | | 2.36% | | | | 2.50% |
| Expenses net of all | | | | | | | | | | | | | | | | | | |
| reductions | | 2.01% | | | | 2.21% | | | | 2.18% | | | | 2.16% | | | | 2.46% |
| Net investment income (loss) | | (1.38)%D | | | | (1.78)% | | | | (1.61)% | | | | (1.74)% | | | | (.89)% |
| Supplemental Data | | | | | | | | | | | | | | | | | | |
| Net assets, end of period | | | | | | | | | | | | | | | | | | |
| (000 omitted) | | $ 7,791 | | $ | | 9,136 | | $ | | 8,427 | | $ | | 6,636 | | $ | | 8,532 |
| Portfolio turnover rate | | 213% | | | | 94% | | | | 158% | | | | 473% | | | | 481% |
A Total returns would have been lower had certain expenses not been reduced during the periods shown.
B Total returns do not include the effect of the contingent deferred sales charge.
C Calculated based on average shares outstanding during the period.
D Investment income per share reflects a special dividend which amounted to $.01 per share. Excluding the special dividend, the ratio of net
investment income to average net assets would have been (1.44)% .
E Expense ratios reflect operating expenses of the class. Expenses before reductions do not reflect amounts reimbursed by the investment adviser or
reductions from brokerage service arrangements or other expense offset arrangements and do not represent the amount paid by the class during
periods when reimbursements or reductions occur. Expenses net of fee waivers reflect expenses after reimbursement by the investment adviser but
prior to reductions from brokerage service arrangements or other expense offset arrangements. Expenses net of all reductions represent the net
expenses paid by the class.
|
See accompanying notes which are an integral part of the financial statements.
| Financial Highlights Institutional Class | | | | | | | | | | | | |
| Years ended November 30, | | | | 2005 | | | | 2004 | | | | 2003 | | | | 2002 | | | | 2001 |
| Selected Per Share Data | | | | | | | | | | | | | | | | | | | | |
| Net asset value, beginning of | | | | | | | | | | | | | | | | | | | | |
| period | | $ | | 8.73 | | $ | | 8.10 | | $ | | 6.52 | | $ | | 8.11 | | $ | | 9.06 |
| Income from Investment | | | | | | | | | | | | | | | | | | | | |
| Operations | | | | | | | | | | | | | | | | | | | | |
| Net investment income | | | | | | | | | | | | | | | | | | | | |
| (loss)B | | | | (.03)C | | | | (.07) | | | | (.04) | | | | (.05) | | | | .01 |
| Net realized and unrealized | | | | | | | | | | | | | | | | | | | | |
| gain (loss) | | | | 87 | | | | .70 | | | | 1.62 | | | | (1.54) | | | | (.95) |
| Total from investment | | | | | | | | | | | | | | | | | | | | |
| operations | | | | 84 | | | | .63 | | | | 1.58 | | | | (1.59) | | | | (.94) |
| Distributions from net realized | | | | | | | | | | | | | | | | | | | | |
| gain | | | | — | | | | — | | | | — | | | | — | | | | (.01) |
| Net asset value, end of period | | $ | | 9.57 | | $ | | 8.73 | | $ | | 8.10 | | $ | | 6.52 | | $ | | 8.11 |
| Total ReturnA | | | | 9.62% | | | | 7.78% | | | | 24.23% | | | | (19.61)% | | | | (10.39)% |
| Ratios to Average Net AssetsD | | | | | | | | | | | | | | | | | | | | |
| Expenses before reductions . | | | | 1.28% | | | | 1.35% | | | | 1.61% | | | | 1.43% | | | | 1.73% |
| Expenses net of fee waivers, | | | | | | | | | | | | | | | | | | | | |
| if any | | | | 1.09% | | | | 1.25% | | | | 1.25% | | | | 1.27% | | | | 1.50% |
| Expenses net of all | | | | | | | | | | | | | | | | | | | | |
| reductions | | | | 1.01% | | | | 1.20% | | | | 1.18% | | | | 1.07% | | | | 1.46% |
| Net investment income (loss) | | | | (.38)%C | | | | (.78)% | | | | (.61)% | | | | (.64)% | | | | .11% |
| Supplemental Data | | | | | | | | | | | | | | | | | | | | |
| Net assets, end of period | | | | | | | | | | | | | | | | | | | | |
| (000 omitted) | | $ | | 522 | | $ | | 648 | | $ | | 579 | | $ | | 513 | | $ | | 761 |
| Portfolio turnover rate | | | | 213% | | | | 94% | | | | 158% | | | | 473% | | | | 481% |
A Total returns would have been lower had certain expenses not been reduced during the periods shown.
B Calculated based on average shares outstanding during the period.
C Investment income per share reflects a special dividend which amounted to $.01 per share. Excluding the special dividend, the ratio of net
investment income to average net assets would have been (.44)%.
D Expense ratios reflect operating expenses of the class. Expenses before reductions do not reflect amounts reimbursed by the investment adviser or
reductions from brokerage service arrangements or other expense offset arrangements and do not represent the amount paid by the class during
periods when reimbursements or reductions occur. Expenses net of fee waivers reflect expenses after reimbursement by the investment adviser but
prior to reductions from brokerage service arrangements or other expense offset arrangements. Expenses net of all reductions represent the net
expenses paid by the class.
|
See accompanying notes which are an integral part of the financial statements.
25 Annual Report
Notes to Financial Statements
For the period ended November 30, 2005
1. Significant Accounting Policies.
Fidelity Advisor Aggressive Growth Fund (the fund) is a fund of Fidelity Securities Fund (the trust) and is authorized to issue an unlimited number of shares. The trust is regis tered under the Investment Company Act of 1940, as amended (the 1940 Act), as an open end management investment company organized as a Massachusetts business trust.
The fund offers Class A, Class T, Class B, Class C and Institutional Class shares, each of which has equal rights as to assets and voting privileges. Each class has exclusive voting rights with respect to matters that affect that class. Class B shares will automatically convert to Class A shares after a holding period of seven years from the initial date of purchase. Investment income, realized and unrealized capital gains and losses, the common expenses of the fund, and certain fund level expense reductions, if any, are allocated on a pro rata basis to each class based on the relative net assets of each class to the total net assets of the fund. Each class differs with respect to transfer agent and distribution and service plan fees incurred. Certain expense reductions also differ by class.
The fund may invest in affiliated money market central funds (Money Market Central Funds) which are open end investment companies available to investment companies and other accounts managed by Fidelity Management & Research Company (FMR) and its affiliates. The financial statements have been prepared in conformity with accounting principles generally accepted in the United States of America, which require manage ment to make certain estimates and assumptions at the date of the financial statements. The following summarizes the significant accounting policies of the fund:
Security Valuation. Investments are valued and net asset value (NAV) per share is calculated (NAV calculation) as of the close of business of the New York Stock Exchange (NYSE), normally 4:00 p.m. Eastern time. Wherever possible, the fund uses independent pricing services approved by the Board of Trustees to value its investments.
Equity securities, including restricted securities, for which market quotations are readily available, are valued at the last reported sale price or official closing price as reported by an independent pricing service on the primary market or exchange on which they are traded. In the event there were no sales during the day or closing prices are not available, securities are valued at the last quoted bid price. Investments in open end mutual funds are valued at their closing net asset value each business day. Short term securities with remaining maturities of sixty days or less for which quotations are not readily available are valued at amortized cost, which approximates value.
When current market prices or quotations are not readily available or do not accurately reflect fair value, valuations may be determined in accordance with procedures adopted by the Board of Trustees. For example, when developments occur between the close of a
| 1. Significant Accounting Policies continued |
Security Valuation - continued | | |
market and the close of the NYSE that may materially affect the value of some or all of the securities, or when trading in a security is halted, those securities may be fair valued. Factors used in the determination of fair value may include monitoring news to identify significant market or security specific events such as changes in the value of U.S. securi ties market, reviewing developments in foreign markets and evaluating the performance of ADRs, futures contracts and exchange traded funds. Because the fund’s utilization of fair value pricing depends on market activity, the frequency with which fair value pricing is used can not be predicted and may be utilized to a significant extent. The value of securities used for NAV calculation under fair value pricing may differ from published prices for the same securities.
Foreign Currency. The fund uses foreign currency contracts to facilitate transactions in foreign denominated securities. Losses from these transactions may arise from changes in the value of the foreign currency or if the counterparties do not perform under the contracts’ terms.
Foreign denominated assets, including investment securities, and liabilities are trans lated into U.S. dollars at the exchange rate at period end. Purchases and sales of invest ment securities, income and dividends received and expenses denominated in foreign currencies are translated into U.S. dollars at the exchange rate in effect on the transac tion date.
The effects of exchange rate fluctuations on investments are included with the net realized and unrealized gain (loss) on investment securities. Other foreign currency transactions resulting in realized and unrealized gain (loss) are disclosed separately.
Investment Transactions and Income. Security transactions are accounted for as of trade date. Gains and losses on securities sold are determined on the basis of identified cost and may include proceeds received from litigation. Dividend income is recorded on the ex dividend date, except for certain dividends from foreign securities where the ex dividend date may have passed, which are recorded as soon as the fund is informed of the ex dividend date. Non cash dividends included in dividend income, if any, are recorded at the fair market value of the securities received. Distributions received on securities that represent a return of capital or capital gain are recorded as a reduction of cost of investments and/or as a realized gain. The fund estimates the components of distributions received that may be considered return of capital distributions or capital gain distributions. Large, non recurring dividends recognized by the fund are presented separately on the Statement of Operations as “Special Dividends” and the impact of these dividends to net investment income per share is presented in the Financial Highlights. Interest income is accrued as earned. Interest income includes coupon interest and
27 Annual Report
Notes to Financial Statements continued
1. Significant Accounting Policies continued
Investment Transactions and Income continued
amortization of premium and accretion of discount on debt securities. Investment income is recorded net of foreign taxes withheld where recovery of such taxes is uncertain.
Expenses. Most expenses of the trust can be directly attributed to a fund. Expenses which cannot be directly attributed are apportioned among each fund in the trust.
Income Tax Information and Distributions to Shareholders. Each year, the fund intends to qualify as a regulated investment company by distributing all of its taxable income and realized gains under Subchapter M of the Internal Revenue Code. As a result, no provision for income taxes is required in the accompanying financial statements. Foreign taxes are provided for based on the fund’s understanding of the tax rules and rates that exist in the foreign markets in which it invests.
Distributions are recorded on the ex dividend date. Income dividends and capital gain distributions are declared separately for each class. Income and capital gain distribu tions are determined in accordance with income tax regulations, which may differ from generally accepted accounting principles.
Capital accounts within the financial statements are adjusted for permanent book tax differences. These adjustments have no impact on net assets or the results of operations. Temporary book tax differences will reverse in a subsequent period.
Book tax differences are primarily due to foreign currency transactions, net operating losses, capital loss carryforwards and losses deferred due to wash sales.
The tax basis components of distributable earnings and the federal tax cost as of period end were as follows:
| Unrealized appreciation | | $ | | 3,856,048 |
| Unrealized depreciation | | | | (2,231,737) |
| Net unrealized appreciation (depreciation) | | | | 1,624,311 |
| Capital loss carryforward | | | | (4,868,687) |
| |
| Cost for federal income tax purposes | | $ | | 39,365,250 |
| |
| |
| 2. Operating Policies. | | | | |
Repurchase Agreements. Fidelity Management & Research Company (FMR) has received an Exemptive Order from the Securities and Exchange Commission (the SEC) which permits the fund and other affiliated entities of FMR to transfer uninvested cash balances into joint trading accounts which are then invested in repurchase agreements. The fund may also invest directly with institutions in repurchase agreements.
2. Operating Policies continued
Repurchase Agreements continued
Repurchase agreements are collateralized by government or non government securities. Collateral is held in segregated accounts with custodian banks and may be obtained in the event of a default of the counterparty. The fund monitors, on a daily basis, the value of the collateral to ensure it is at least equal to the principal amount of the repurchase agreement (including accrued interest). In the event of a default by the counterparty, realization of the collateral proceeds could be delayed, during which time the value of the collateral may decline.
Restricted Securities. The fund may invest in securities that are subject to legal or contractual restrictions on resale. These securities generally may be resold in transac tions exempt from registration or to the public if the securities are registered. Disposal of these securities may involve time consuming negotiations and expense, and prompt sale at an acceptable price may be difficult. Information regarding restricted securities is included at the end of the fund’s Schedule of Investments.
3. Purchases and Sales of Investments.
Purchases and sales of securities, other than short term securities and U.S. government securities, aggregated $83,741,320 and $86,961,259, respectively.
4. Fees and Other Transactions with Affiliates.
Management Fee. FMR and its affiliates provide the fund with investment manage ment related services for which the fund pays a monthly management fee. The manage ment fee is the sum of an individual fund fee rate that is based on an annual rate of .35% of the fund’s average net assets and a group fee rate that averaged .27% during the period. The group fee rate is based upon the average net assets of all the mutual funds advised by FMR. The group fee rate decreases as assets under management increase and increases as assets under management decrease. For the period, the total annual man agement fee rate was .62% of the fund’s average net assets.
Distribution and Service Plan. In accordance with Rule 12b 1 of the 1940 Act, the fund has adopted separate Distribution and Service Plans for each class of shares. Certain classes pay Fidelity Distributors Corporation (FDC), an affiliate of FMR, separate Distribution and Service Fees, each of which is based on an annual percentage of each class’ average net assets. In addition, FDC may pay financial intermediaries for selling shares of the fund and providing shareholder support services. For the period, the
29 Annual Report
| Notes to Financial Statements continued | | |
| |
| 4. Fees and Other Transactions with Affiliates continued |
Distribution and Service Plan continued | | |
Distribution and Service Fee rates and the total amounts paid to and retained by FDC were as follows:
| | | Distribution | | Service | | | | Paid to | | | | Retained |
| | | Fee | | Fee | | | | FDC | | | | by FDC |
| Class A | | 0% | | .25% | | $ | | 16,640 | | $ | | 84 |
| Class T | | 25% | | .25% | | | | 78,040 | | | | 55 |
| Class B | | 75% | | .25% | | | | 91,900 | | | | 68,924 |
| Class C | | 75% | | .25% | | | | 80,605 | | | | 9,071 |
| | | | | | | $ | | 267,185 | | $ | | 78,134 |
Sales Load. FDC receives a front end sales charge of up to 5.75% for selling Class A shares, and 3.50% for selling Class T shares, some of which is paid to financial intermedi aries for selling shares of the fund. FDC receives the proceeds of contingent deferred sales charges levied on Class A, Class T, Class B, and Class C redemptions. These charges depend on the holding period. The deferred sales charges range from 5% to 1% for Class B, 1% for Class C, and .25% for certain purchases of Class A and Class T shares.
For the period, sales charge amounts retained by FDC were as follows:
| | |
| | | | | Retained |
| | | | | by FDC |
| Class A | | | $ | 9,510 |
| Class T | | | | 12,616 |
| Class B* | | | | 37,989 |
| Class C* | | | | 1,521 |
| | | $ | | 61,636 |
* When Class B and Class C shares are initially sold, FDC pays commissions from its own resources to financial intermediaries through which the sales are made.
Transfer Agent Fees. Fidelity Investments Institutional Operations Company, Inc. (FIIOC), an affiliate of FMR, is the transfer, dividend disbursing and shareholder servic ing agent for each class of the fund. FIIOC receives account fees and asset based fees that vary according to the account size and type of account of the shareholders of the respective classes of the fund. FIIOC pays for typesetting, printing and mailing of share holder reports, except proxy statements. For the period the total transfer agent fees paid
| 4. Fees and Other Transactions with Affiliates continued |
| |
| Transfer Agent Fees continued | | | | |
| |
| by each class to FIIOC, were as follows: | | | | |
| | | | | | | % of Average |
| | | | | Amount | | Net Assets |
| Class A | | $ | | 25,250 | | .38 |
| Class T | | | | 71,752 | | .46 |
| Class B | | | | 34,699 | | .38 |
| Class C | | | | 29,674 | | .37 |
| Institutional Class | | | | 1,738 | | .31 |
| | | $ | | 163,113 | | |
Accounting and Security Lending Fees. Fidelity Service Company, Inc. (FSC), an affiliate of FMR, maintains the fund’s accounting records. The accounting fee is based on the level of average net assets for the month. Under a separate contract, FSC administers the security lending program. The security lending fee is based on the number and duration of lending transactions.
Affiliated Central Funds. The fund may invest in Money Market Central Funds which seek preservation of capital and current income and are managed by Fidelity Invest ments Money Management, Inc. (FIMM), an affiliate of FMR.
The Money Market Central Funds do not pay a management fee.
Brokerage Commissions. The fund placed a portion of its portfolio transactions with brokerage firms which are affiliates of the investment adviser. The commissions paid to these affiliated firms were $2,250 for the period.
5. Committed Line of Credit.
|
The fund participates with other funds managed by FMR in a $4.2 billion credit facility (the “line of credit”) to be utilized for temporary or emergency purposes to fund share holder redemptions or for other short term liquidity purposes. The fund has agreed to pay commitment fees on its pro rata portion of the line of credit. During the period, there were no borrowings on this line of credit.
The fund lends portfolio securities from time to time in order to earn additional income. The fund receives collateral (in the form of U.S. Treasury obligations, letters of credit and/or cash) against the loaned securities and maintains collateral in an amount not less than 100% of the market value of the loaned securities during the period of the loan. The market value of the loaned securities is determined at the close of business of the fund
31 Annual Report
Notes to Financial Statements continued
6. Security Lending continued
and any additional required collateral is delivered to the fund on the next business day. If the borrower defaults on its obligation to return the securities loaned because of insol vency or other reasons, a fund could experience delays and costs in recovering the securities loaned or in gaining access to the collateral. Cash collateral is invested in the Fidelity Securities Lending Cash Central Fund. The value of loaned securities and cash collateral at period end are disclosed on the fund’s Statement of Assets and Liabilities. Security lending income represents the income earned on investing cash collateral, less fees and expenses associated with the loan, plus any premium payments that may be received on the loan of certain types of securities.
FMR voluntarily agreed to reimburse each class to the extent annual operating expenses exceeded certain levels of average net assets as noted in the table below. Some expenses, for example interest expense, are excluded from this reimbursement.
The following classes were in reimbursement during the period:
| | | | |
| | | Expense | | | | Reimbursement |
| | | Limitations | | | | from adviser |
| Class A | | 1.50% - 1.30%* | | $ | | 17,727 |
| Class T | | 1.75% - 1.55%* | | | | 53,916 |
| Class B | | 2.25% - 2.05%* | | | | 24,000 |
| Class C | | 2.25% - 2.05%* | | | | 20,183 |
| Institutional Class | | 1.25% - 1.05%* | | | | 1,073 |
| | | | | | | | | $ | | 116,899 |
| * Expense limitation in effect at period end. | | | | | | | | | | |
Many of the brokers with whom FMR places trades on behalf of the fund provided services to the fund in addition to trade execution. These services included payments of certain expenses on behalf of the fund totaling $33,432 for the period.
The fund’s organizational documents provide former and current trustees and officers with a limited indemnification against liabilities arising in connection with the perfor mance of their duties to the fund. In the normal course of business, the fund may also enter into contracts that provide general indemnifications. The fund’s maximum expo sure under these arrangements is unknown as this would be dependent on future claims that may be made against the fund. The risk of material loss from such claims is considered remote.
| 9. Share Transactions. | | | | | | | | | | |
| |
| Transactions for each class of shares were as follows: | | | | | | | | |
| |
| | | Shares | | | | Dollars |
| Years ended November 30, | | 2005 | | 2004 | | | | 2005 | | | | 2004 |
| Class A | | | | | | | | | | | | |
| Shares sold | | 270,002 | | 377,272 | | $ | | 2,351,220 | | $ | | 3,139,679 |
| Shares redeemed | | (227,735) | | (175,236) | | | | (2,008,944) | | | | (1,453,350) |
| Net increase (decrease) . | | 42,267 | | 202,036 | | $ | | 342,276 | | $ | | 1,686,329 |
| Class T | | | | | | | | | | | | |
| Shares sold | | 613,840 | | 758,262 | | $ | | 5,303,116 | | $ | | 6,209,847 |
| Shares redeemed | | (628,481) | | (552,792) | | | | (5,486,557) | | | | (4,525,646) |
| Net increase (decrease) . | | (14,641) | | 205,470 | | $ | | (183,441) | | $ | | 1,684,201 |
| Class B | | | | | | | | | | | | |
| Shares sold | | 183,867 | | 359,634 | | $ | | 1,559,053 | | $ | | 2,916,093 |
| Shares redeemed | | (313,200) | | (286,300) | | | | (2,654,466) | | | | (2,305,579) |
| Net increase (decrease) . | | (129,333) | | 73,334 | | $ | | (1,095,413) | | $ | | 610,514 |
| Class C | | | | | | | | | | | | |
| Shares sold | | 159,513 | | 368,284 | | $ | | 1,357,035 | | $ | | 2,975,514 |
| Shares redeemed | | (393,180) | | (350,351) | | | | (3,315,155) | | | | (2,819,767) |
| Net increase (decrease) . | | (233,667) | | 17,933 | | $ | | (1,958,120) | | $ | | 155,747 |
| Institutional Class | | | | | | | | | | | | |
| Shares sold | | 10,062 | | 22,481 | | $ | | 90,084 | | $ | | 187,161 |
| Shares redeemed | | (29,827) | | (19,658) | | | | (255,712) | | | | (162,550) |
| Net increase (decrease) . | | (19,765) | | 2,823 | | $ | | (165,628) | | $ | | 24,611 |
33 Annual Report
Report of Independent Registered Public Accounting Firm
To the Trustees of Fidelity Securities Fund and the Shareholders of Fidelity Advisor Aggressive Growth Fund:
In our opinion, the accompanying statement of assets and liabilities, including the sched ule of investments, and the related statements of operations and of changes in net assets and the financial highlights present fairly, in all material respects, the financial position of Fidelity Advisor Aggressive Growth Fund (a fund of Fidelity Securities Fund) at Novem ber 30, 2005 and the results of its operations, the changes in its net assets and the financial highlights for the periods indicated, in conformity with accounting principles generally accepted in the United States of America. These financial statements and financial highlights (hereafter referred to as “financial statements”) are the responsibility of the Fidelity Advisor Aggressive Growth Fund’s management; our responsibility is to express an opinion on these financial statements based on our audits. We conducted our audits of these financial statements in accordance with the standards of the Public Company Accounting Oversight Board (United States). Those standards require that we plan and perform the audit to obtain reasonable assurance about whether the financial statements are free of material misstatement. An audit includes examining, on a test basis, evidence supporting the amounts and disclosures in the financial statements, assessing the accounting principles used and significant estimates made by management, and evaluating the overall financial statement presentation. We believe that our audits, which included confirmation of securities at November 30, 2005 by correspondence with the custodian and brokers, provide a reasonable basis for our opinion.
/s/ PricewaterhouseCoopers LLP
PricewaterhouseCoopers LLP
Boston, Massachusetts
January 17, 2006
|
Trustees and Officers
The Trustees, Members of the Advisory Board, and executive officers of the trust and fund, as applicable, are listed below. The Board of Trustees governs the fund and is responsible for protecting the interests of shareholders. The Trustees are experienced executives who meet periodically throughout the year to oversee the fund’s activities, review contractual arrangements with companies that provide services to the fund, and review the fund’s performance. Except for William O. McCoy, each of the Trustees oversees 326 funds advised by FMR or an affiliate. Mr. McCoy oversees 328 funds advised by FMR or an affiliate.
The Trustees hold office without limit in time except that (a) any Trustee may resign; (b) any Trustee may be removed by written instrument, signed by at least two thirds of the number of Trustees prior to such removal; (c) any Trustee who requests to be retired or who has become incapacitated by illness or injury may be retired by written instru ment signed by a majority of the other Trustees; and (d) any Trustee may be removed at any special meeting of shareholders by a two thirds vote of the outstanding voting securities of the trust. Each Trustee who is not an interested person (as defined in the 1940 Act) (Independent Trustee), shall retire not later than the last day of the calendar year in which his or her 72nd birthday occurs. The Independent Trustees may waive this mandatory retirement age policy with respect to individual Trustees. The executive officers and Advisory Board Members hold office without limit in time, except that any officer and Advisory Board Member may resign or may be removed by a vote of a majority of the Trustees at any regular meeting or any special meeting of the Trustees. Except as indicated, each individual has held the office shown or other offices in the same company for the past five years.
The fund’s Statement of Additional Information (SAI) includes more information about the Trustees. To request a free copy, call Fidelity at 1-877-208-0098.
Correspondence intended for each Trustee who is an interested person may be sent to Fidelity Investments, 82 Devonshire Street, Boston, Massachusetts 02109.
| | Name, Age; Principal Occupation
Edward C. Johnson 3d (75)
|
Year of Election or Appointment: 1984
Mr. Johnson is Chairman of the Board of Trustees. Mr. Johnson serves as Chief Executive Officer, Chairman, and a Director of FMR Corp.; a Di rector and Chairman of the Board and of the Executive Committee of FMR; Chairman and a Director of Fidelity Management & Research (Far East) Inc.; Chairman and a Director of Fidelity Investments Money Man agement, Inc.; and Chairman (2001 present) and a Director (2000 present) of FMR Co., Inc.
35 Annual Report
Trustees and Officers - continued
| | Name, Age; Principal Occupation
Stephen P. Jonas (52)
|
Year of Election or Appointment: 2005
Mr. Jonas is Senior Vice President of Advisor Aggressive Growth (2005 present). He also serves as Senior Vice President of other Fidelity funds (2005 present). Mr. Jonas is Executive Director of FMR
(2005 present). Previously, Mr. Jonas served as President of Fidelity En terprise Operations and Risk Services (2004 2005), Chief Administra tive Officer (2002 2004), and Chief Financial Officer of FMR Co. (1998 2000). Mr. Jonas has been with Fidelity Investments since 1987 and has held various financial and management positions including Chief Financial Officer of FMR. In addition, he serves on the Boards of Boston Ballet (2003 present) and Simmons College (2003 present).
Year of Election or Appointment: 2003
Mr. Reynolds is a Director (2003 present) and Chief Operating Officer (2002 present) of FMR Corp. He also serves on the Board at Fidelity Investments Canada, Ltd. (2000 present). Previously, Mr. Reynolds served as President of Fidelity Investments Institutional Retirement Group (1996 2000).
* Trustees have been determined to be “Interested Trustees” by virtue of, among other things, their affiliation with the trust or various entities under common control with FMR.
Correspondence intended for each Independent Trustee (that is, the Trustees other than the Interested Trustees) may be sent to Fidelity Investments, P.O. Box 55235, Boston, Massachusetts 02205 5235.
| | Name, Age; Principal Occupation
Dennis J. Dirks (57)
|
Year of Election or Appointment: 2005
Prior to his retirement in May 2003, Mr. Dirks was Chief Operating Officer and a member of the Board of The Depository Trust & Clearing Corporation (DTCC) (1999 2003). He also served as President, Chief Operating Officer, and Board member of The Depository Trust Company (DTC) (1999 2003) and President and Board member of the National Securities Clearing Corporation (NSCC) (1999 2003). In addi tion, Mr. Dirks served as Chief Executive Officer and Board member of the Government Securities Clearing Corporation (2001 2003) and Chief Executive Officer and Board member of the Mortgage Backed Securities Clearing Corporation (2001 2003). Mr. Dirks also serves as a Trustee of Manhattan College (2005 present).
Year of Election or Appointment: 1997
Dr. Gates is Chairman of the Independent Trustees (2006 present). Dr. Gates is President of Texas A&M University (2002 present). He was Director of the Central Intelligence Agency (CIA) from 1991 to 1993. From 1989 to 1991, Dr. Gates served as Assistant to the President of the United States and Deputy National Security Advisor. Dr. Gates is a Director of NACCO Industries, Inc. (mining and manufacturing), Parker Drilling Co., Inc. (drilling and rental tools for the energy industry, 2001 present), and Brinker International (restaurant management, 2003 present). Previously, Dr. Gates served as a Director of LucasVarity PLC (automotive components and diesel engines), a Director of TRW Inc. (automotive, space, defense, and information technology), and Dean of the George Bush School of Government and Public Service at Texas A&M University (1999 2001). Dr. Gates also is a Trustee of the Forum for International Policy.
37 Annual Report
Trustees and Officers - continued
| | Name, Age; Principal Occupation
George H. Heilmeier (69)
|
Year of Election or Appointment: 2004
Dr. Heilmeier is Chairman Emeritus of Telcordia Technologies (communication software and systems), where prior to his retirement, he served as company Chairman and Chief Executive Officer. He currently serves on the Boards of Directors of The Mitre Corporation (systems engineer ing and information technology support for the government), and HRL Laboratories (private research and development, 2004 present). He is Chairman of the General Motors Science & Technology Advisory Board and a Life Fellow of the Institute of Electrical and Electronics Engineers (IEEE) (2000 present). Dr. Heilmeier is a member of the Defense Science Board and the National Security Agency Advisory Board. He is also a member of the National Academy of Engineering, the American Academy of Arts and Sciences, and the Board of Overseers of the School of Engineering and Applied Science of the University of Pennsyl vania. Previously, Dr. Heilmeier served as a Director of TRW Inc. (auto motive, space, defense, and information technology, 1992 2002), Compaq (1994 2002), Automatic Data Processing, Inc. (ADP) (technology based business outsourcing, 1995 2002), INET Technolo gies Inc. (telecommunications network surveillance, 2001 2004), and Teletech Holdings (customer management services). He is the recipient of the 2005 Kyoto Prize in Advanced Technology for his invention of the liquid display.
Year of Election or Appointment: 2001
Prior to Ms. Knowles’ retirement in June 2000, she served as Executive Vice President and Chief Financial Officer of Atlantic Richfield Company (ARCO) (diversified energy, 1996 2000). From 1993 to 1996, she was a Senior Vice President of ARCO and President of ARCO Transportation Company. She served as a Director of ARCO from 1996 to 1998. She currently serves as a Director of Phelps Dodge Corporation (copper mining and manufacturing) and McKesson Corporation (healthcare ser vice, 2002 present). Ms. Knowles is a Trustee of the Brookings Institution and the Catalina Island Conservancy and also serves as a member of the Advisory Board for the School of Engineering of the University of Southern California.
Name, Age; Principal Occupation
Ned C. Lautenbach (61)
|
Year of Election or Appointment: 2000
Mr. Lautenbach has been a partner of Clayton, Dubilier & Rice, Inc. (private equity investment firm) since September 1998. Previously, Mr. Lautenbach was with the International Business Machines Corporation (IBM) from 1968 until his retirement in 1998. Mr. Lautenbach serves as a Director of Italtel Holding S.p.A. (telecommunications (Milan, Italy), 2004 present) and Eaton Corporation (diversified industrial) as well as the Philharmonic Center for the Arts in Naples, Florida. He also is a member of the Board of Trustees of Fairfield University (2005 present), as well as a member of the Council on Foreign Relations.
Year of Election or Appointment: 1997
Prior to his retirement in December 1994, Mr. McCoy was Vice Chair man of the Board of BellSouth Corporation (telecommunications) and President of BellSouth Enterprises. He is currently a Director of Liberty Corporation (holding company), Duke Realty Corporation (real estate), and Progress Energy, Inc. (electric utility). He is also a partner of Frank lin Street Partners (private investment management firm) and a member of the Research Triangle Foundation Board. In addition, Mr. McCoy served as the Interim Chancellor (1999 2000) and a member of the Board of Visitors for the University of North Carolina at Chapel Hill and currently serves on the Board of Directors of the University of North Carolina Health Care System and the Board of Visitors of the Kenan Flagler Business School (University of North Carolina at Chapel Hill). He also served as Vice President of Finance for the University of North Car olina (16 school system).
Year of Election or Appointment: 2005
Ms. Small is a member (2000 present) and Chairperson (2002 present) of the Investment Committee, and a member (2002 present) of the Board of Trustees of Smith College. Previously, she served as Chief In vestment Officer (1999 2000), Director of Global Equity Investments (1996 1999), and a member of the Board of Directors of Scudder, Stevens & Clark (1990 1997) and Scudder Kemper Investments (1997 1998). In addition, Ms. Small served as Co Chair (2000 2003) of the Annual Fund for the Fletcher School of Law and Diplomacy.
39 Annual Report
Trustees and Officers - continued
| | Name, Age; Principal Occupation
William S. Stavropoulos (66)
|
Year of Election or Appointment: 2002
Mr. Stavropoulos is Chairman of the Board (2000 present) and a Mem ber of the Board of Directors of The Dow Chemical Company. Since joining The Dow Chemical Company in 1967, Mr. Stavropoulos served in numerous senior management positions, including President (1993 2000; 2002 2003), CEO (1995 2000; 2002 2004), and Chair man of the Executive Committee (2000 2004). Currently, he is a Direc tor of NCR Corporation (data warehousing and technology solutions), BellSouth Corporation (telecommunications), Chemical Financial Corpo ration, Maersk Inc. (industrial conglomerate, 2002 present), and Metal mark Capital (private equity investment firm, 2005 present). He also serves as a member of the Board of Trustees of the American Enterprise Institute for Public Policy Research. In addition, Mr. Stavropoulos is a member of The Business Council, J.P. Morgan International Council and the University of Notre Dame Advisory Council for the College of Science.
Year of Election or Appointment: 2005
Prior to his retirement in 2001, Mr. Wolfe was Chairman and Chief Executive Officer of Hershey Foods Corporation (1993 2001). He cur rently serves as a member of the boards of Adelphia Communications Corporation (2003 present), Bausch & Lomb, Inc., and Revlon Inc. (2004 present).
Advisory Board Members and Executive Officers:
Correspondence intended for Mr. Gamper may be sent to Fidelity Investments, P.O. Box 55235, Boston, Massachusetts 02205 5235. Correspondence intended for each executive officer and Mr. Lynch may be sent to Fidelity Investments, 82 Devonshire Street, Boston, Massachusetts 02109.
| | Name, Age; Principal Occupation
Albert R. Gamper, Jr. (63)
|
Year of Election or Appointment: 2005
Member of the Advisory Board of Fidelity Securities Fund. Mr. Gamper also serves as a Trustee (2006 present) or Member of the Advisory Board (2005 present) of other investment companies advised by FMR. Prior to his retirement in December 2004, Mr. Gamper served as Chair man of the Board of CIT Group Inc. (commercial finance). During his tenure with CIT Group Inc. Mr. Gamper served in numerous senior man agement positions, including Chairman (1987 1989; 1999 2001; 2002 2004), Chief Executive Officer (1987 2004), and President (1989 2002). He currently serves as a member of the Board of Direc tors of Public Service Enterprise Group (utilities, 2001 present), Chair man of the Board of Governors, Rutgers University (2004 present), and Chairman of the Board of Saint Barnabas Health Care System.
Year of Election or Appointment: 2003
Member of the Advisory Board of Fidelity Securities Fund. Vice Chair man and a Director of FMR, and Vice Chairman (2001 present) and a Director (2000 present) of FMR Co., Inc. Previously, Mr. Lynch served as a Trustee of the Fidelity funds (1990 2003). In addition, he serves as a Trustee of Boston College, Massachusetts Eye & Ear Infirmary, Historic Deerfield, John F. Kennedy Library, and the Museum of Fine Arts of Boston.
Year of Election or Appointment: 2005
Vice President of Advisor Aggressive Growth. Mr. Churchill also serves as Vice President of certain Equity Funds (2005 present) and certain High Income Funds (2005 present). Previously, he served as Head of Fidelity’s Fixed Income Division (2000 2005), Vice President of Fidelity’s Money Market Funds (2000 2005), Vice President of Fidelity’s Bond Funds, and Senior Vice President of FIMM (2000) and FMR. Mr. Chur chill joined Fidelity in 1993 as Vice President and Group Leader of Tax able Fixed Income Investments.
41 Annual Report
Trustees and Officers - continued
| | Name, Age; Principal Occupation
Steve Calhoun (34)
|
Year of Election or Appointment: 2005
Vice President of Advisor Aggressive Growth. Mr. Calhoun is also Vice President of other funds advised by FMR. Prior to assuming his current responsibilities, Mr. Calhoun has worked as a research analyst and manager. Mr. Calhoun also serves as Vice President of FMR (2005) and FMR Co., Inc. (2005).
Year of Election or Appointment: 2000
Secretary of Advisor Aggressive Growth. He also serves as Secretary of other Fidelity funds; Vice President, General Counsel, and Secretary of FMR Co., Inc. (2001 present) and FMR; Assistant Secretary of Fidelity Management & Research (U.K.) Inc. (2001 present), Fidelity Manage ment & Research (Far East) Inc. (2001 present), and Fidelity Investments Money Management, Inc. (2001 present). Mr. Roiter is an Adjunct Member, Faculty of Law, at Boston College Law School (2003 present). Previously, Mr. Roiter served as Vice President and Secretary of Fidelity Distributors Corporation (FDC) (1998 2005).
Year of Election or Appointment: 2003
Assistant Secretary of Advisor Aggressive Growth. Mr. Fross also serves as Assistant Secretary of other Fidelity funds (2003 present), Vice Presi dent and Secretary of FDC (2005 present), and is an employee of FMR.
Year of Election or Appointment: 2004
President, Treasurer, and Anti Money Laundering (AML) officer of Advi sor Aggressive Growth. Ms. Reynolds also serves as President, Treasurer, and AML officer of other Fidelity funds (2004) and is a Vice President (2003) and an employee (2002) of FMR. Before joining Fidelity Investments, Ms. Reynolds worked at PricewaterhouseCoopers LLP (PwC) (1980 2002), where she was most recently an audit partner with PwC’s investment management practice.
Year of Election or Appointment: 2005
Chief Financial Officer of Advisor Aggressive Growth. Mr. Murphy also serves as Chief Financial Officer of other Fidelity funds (2005 present). He also serves as Senior Vice President of Fidelity Pricing and Cash Management Services Group (FPCMS).
Name, Age; Principal Occupation
Kenneth A. Rathgeber (58)
|
Year of Election or Appointment: 2004
Chief Compliance Officer of Advisor Aggressive Growth. Mr. Rathgeber also serves as Chief Compliance Officer of other Fidelity funds (2004) and Executive Vice President of Risk Oversight for Fidelity Investments (2002). Previously, he served as Executive Vice President and Chief Op erating Officer for Fidelity Investments Institutional Services Company, Inc. (1998 2002).
Year of Election or Appointment: 2003
Deputy Treasurer of Advisor Aggressive Growth. Mr. Hebble also serves as Deputy Treasurer of other Fidelity funds (2003), and is an employee of FMR. Before joining Fidelity Investments, Mr. Hebble worked at Deutsche Asset Management where he served as Director of Fund Ac counting (2002 2003) and Assistant Treasurer of the Scudder Funds (1998 2003).
Year of Election or Appointment: 2005
Deputy Treasurer of Advisor Aggressive Growth. Mr. Mehrmann also serves as Deputy Treasurer of other Fidelity funds (2005 present) and is an employee of FMR. Previously, Mr. Mehrmann served as Vice Presi dent of Fidelity Investments Institutional Services Group (FIIS)/Fidelity Investments Institutional Operations Corporation, Inc. (FIIOC) Client Ser vices (1998 2004).
Kimberley H. Monasterio (41)
|
Year of Election or Appointment: 2004
Deputy Treasurer of Advisor Aggressive Growth. Ms. Monasterio also serves as Deputy Treasurer of other Fidelity funds (2004) and is an em ployee of FMR (2004). Before joining Fidelity Investments, Ms. Monas terio served as Treasurer (2000 2004) and Chief Financial Officer (2002 2004) of the Franklin Templeton Funds and Senior Vice President of Franklin Templeton Services, LLC (2000 2004).
Year of Election or Appointment: 2005
Deputy Treasurer of Advisor Aggressive Growth. Mr. Robins also serves as Deputy Treasurer of other Fidelity funds (2005 present) and is an employee of FMR (2004 present). Before joining Fidelity Investments, Mr. Robins worked at KPMG LLP, where he was a partner in KPMG’s department of professional practice (2002 2004) and a Senior Manager (1999 2000). In addition, Mr. Robins served as Assistant Chief Accountant, United States Securities and Exchange Commission (2000 2002).
43 Annual Report
Trustees and Officers - continued
| | Name, Age; Principal Occupation
Robert G. Byrnes (38)
|
Year of Election or Appointment: 2005
Assistant Treasurer of Advisor Aggressive Growth. Mr. Byrnes also serves as Assistant Treasurer of other Fidelity funds (2005 present) and is an employee of FMR (2005 present). Previously, Mr. Byrnes served as Vice President of FPCMS (2003 2005). Before joining Fidelity Invest ments, Mr. Byrnes worked at Deutsche Asset Management where he served as Vice President of the Investment Operations Group (2000 2003).
Year of Election or Appointment: 2000
Assistant Treasurer of Advisor Aggressive Growth. Mr. Costello also serves as Assistant Treasurer of other Fidelity funds and is an employee of FMR.
Year of Election or Appointment: 2004
Assistant Treasurer of Advisor Aggressive Growth. Mr. Lydecker also serves as Assistant Treasurer of other Fidelity funds (2004) and is an employee of FMR.
Year of Election or Appointment: 2002
Assistant Treasurer of Advisor Aggressive Growth. Mr. Osterheld also serves as Assistant Treasurer of other Fidelity funds (2002) and is an employee of FMR.
Year of Election or Appointment: 2005
Assistant Treasurer of Advisor Aggressive Growth. Mr. Ryan also serves as Assistant Treasurer of other Fidelity funds (2005 present) and is an employee of FMR (2005 present). Previously, Mr. Ryan served as Vice President of Fund Reporting in FPCMS (1999 2005).
Year of Election or Appointment: 2005
Assistant Treasurer of Advisor Aggressive Growth. Mr. Schiavone also serves as Assistant Treasurer of other Fidelity funds (2005 present) and is an employee of FMR (2005 present). Before joining Fidelity Invest ments, Mr. Schiavone worked at Deutsche Asset Management, where he most recently served as Assistant Treasurer (2003 2005) of the Scudder Funds and Vice President and Head of Fund Reporting (1996 2003).
Board Approval of Investment Advisory Contracts and Management Fees
Advisor Aggressive Growth Fund
Each year, typically in July, the Board of Trustees, including the independent Trustees (together, the Board), votes on the renewal of the management contract and sub advisory agreements (together, the Advisory Contracts) for the fund. The Board, assisted by the advice of fund counsel and independent Trustees’ counsel, requests and considers a broad range of information throughout the year.
The Board meets regularly each month except August and takes into account throughout the year matters bearing on Advisory Contracts. The Board, acting directly and through its separate committees, considers at each of its meetings factors that are relevant to the annual renewal of the fund’s Advisory Contracts, including the services and support provided to the fund and its shareholders by Fidelity. At the time of the renewal, the Board had 11 standing committees, each composed of independent Trustees with varying backgrounds, to which the Board has assigned specific subject matter responsibilities in order to enhance effective decision making by the Board. Each committee has adopted a written charter outlining the structure and purposes of the committee. One such com mittee, the Equity Contract Committee, meets periodically during the first six months of each year and as necessary to consider matters specifically related to the annual renewal of Advisory Contracts. The committee requests and receives information on, and makes recommendations to the independent Trustees concerning, the approval and annual review of the Advisory Contracts.
At its July 2005 meeting, the Board of Trustees, including the independent Trustees, unanimously determined to renew the Advisory Contracts for the fund. In reaching its determination, the Board considered all factors it believed relevant, including (1) the nature, extent, and quality of the services to be provided to the fund and its shareholders by Fidelity (including the investment performance of the fund); (2) the competitiveness of the management fee and total expenses of the fund; (3) the total costs of the services to be provided by and the profits to be realized by the investment adviser and its affiliates from the relationship with the fund; (4) the extent to which economies of scale would be realized as the fund grows; and (5) whether fee levels reflect these economies of scale, if any, for the benefit of fund shareholders.
In determining whether to renew the Advisory Contracts for the fund, the Board ulti mately reached a determination, with the assistance of fund counsel and independent Trustees’ counsel, that the renewal of the Advisory Contracts and the compensation to be received by Fidelity under the management contract is consistent with Fidelity’s fidu ciary duty under applicable law. In addition to evaluating the specific factors noted above, the Board, in reaching its determination, is aware that shareholders in the fund have a broad range of investment choices available to them, including a wide choice among mutual funds offered by competitors to Fidelity, and that the fund’s shareholders, with the opportunity to review and weigh the disclosure provided by the fund in its
45 Annual Report
Board Approval of Investment Advisory Contracts and Management Fees continued
prospectus and other public disclosures, have chosen to invest in this fund, managed by Fidelity.
Nature, Extent, and Quality of Services Provided by Fidelity. The Board consid ered staffing within the investment adviser, FMR, and the sub advisers (together, the Investment Advisers), including the background of the fund’s portfolio manager and the fund’s investment objective and discipline. The independent Trustees also had discus sions with senior management of Fidelity’s investment operations and investment groups. The Board considered the structure of the portfolio manager compensation program and whether this structure provides appropriate incentives.
Fidelity Resources Dedicated to Investment Management and Support Services. The Board reviewed the size, education, and experience of the Investment Advisers’ invest ment staff, their use of technology, and the Investment Advisers’ approach to recruiting, training, and retaining portfolio managers and other research, advisory, and manage ment personnel. The Board considered Fidelity’s extensive global research capabilities that enable the Investment Advisers to aggregate data from various sources in an effort to produce positive investment results. The Board noted that Fidelity’s analysts have access to a variety of technological tools that enable them to perform both fundamental and quantitative analysis and to specialize in various disciplines. The Board also considered that Fidelity’s portfolio managers and analysts have access to daily portfolio attribution that allows for monitoring of a fund’s portfolio, as well as an electronic communication system that provides immediate real time access to research concerning issuers and credit enhancers.
Shareholder and Administrative Services. The Board considered the nature, extent, quality, and cost of administrative, distribution, and shareholder services performed by the Investment Advisers and their affiliates under the Advisory Contracts and under separate agreements covering transfer agency, pricing and bookkeeping, and securities lending services for the fund. The Board also considered the nature and extent of the Investment Advisers’ supervision of third party service providers, principally custodians and subcustodians. The Board reviewed the allocation of fund brokerage, including allocations to brokers affiliated with the Investment Advisers, the use of brokerage commissions to pay fund expenses, and the use of “soft” commission dollars to pay for research services. The Board also considered that Fidelity voluntarily decided in 2004 to stop using “soft” commission dollars to pay for market data and, instead, to pay for that data out of its own resources. The Board also considered the resources devoted to, and the record of compliance with, the fund’s compliance policies and procedures.
The Board noted that the growth of fund assets across the complex allows Fidelity to reinvest in the development of services designed to enhance the value or convenience of the Fidelity funds as investment vehicles. These services include 24 hour access to
account information and market information through phone representatives and over the Internet, and investor education materials and asset allocation tools.
Investment in a Large Fund Family. The Board considered the benefits to shareholders of investing in a Fidelity fund, including the benefits of investing in a fund that is part of a large family of funds offering a variety of investment disciplines and providing for a large variety of mutual fund investor services. For example, fund shareholders are offered the privilege of exchanging shares of the fund for shares of other Fidelity funds, as set forth in the fund’s prospectus, without paying an additional sales charge. The Board noted that, since the last Advisory Contract renewals in July 2004, Fidelity has taken a number of actions that benefited particular funds, including (i) voluntarily deciding in 2004 to stop using “soft” commission dollars to pay for market data and, instead, to pay for that data out of its own resources, (ii) contractually agreeing to impose management fee reductions and expense limitations on its five Spartan stock index funds and its stock index fund available through variable insurance products, (iii) contractually agreeing to eliminate the management fees on the Fidelity Freedom Funds and the Fidelity Advisor Freedom Funds, (iv) contractually agreeing to reduce the management fees on most of its investment grade taxable bond funds, and (v) contractually agreeing to impose expense limitations on its retail and Spartan investment grade taxable bond funds.
Investment Performance and Compliance. The Board considered whether the fund has operated within its investment objective, as well as its record of compliance with its investment restrictions. It also reviewed the fund’s absolute investment performance for each class, as well as the fund’s relative investment performance for each class measured against (i) a broad based securities market index, and (ii) a peer group of mutual funds deemed appropriate by the Board over multiple periods. Because the fund had been in existence less than five calendar years, the following charts considered by the Board show, over the one and three year periods ended December 31, 2004, the returns of Class C and Institutional Class of the fund, the returns of a broad based securities market index (“benchmark”), and a range of returns of a peer group of mutual funds identified by Lipper Inc. as having an investment objective similar to that of the fund. The returns of Class C and Institutional Class represent the performance of classes with the highest and lowest 12b 1 fees, respectively (not necessarily with the highest and lowest total expenses). The box within each chart shows the 25th percentile return (bottom of box) and the 75th percentile return (top of box) of the Lipper peer group. Returns shown above the box are in the first quartile and returns shown below the box are in the fourth quartile. The percentage beaten numbers noted below each chart correspond to the percentile box and represent the percentage of funds in the Lipper peer group whose performance was equal to or lower than that of the class indicated.
47 Annual Report
Board Approval of Investment Advisory Contracts and Management Fees continued
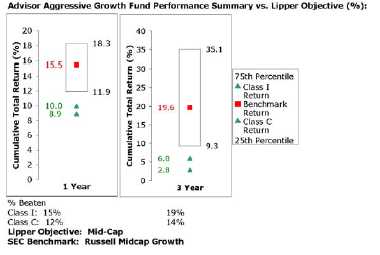
The Board reviewed the fund’s relative investment performance against its Lipper peer group and stated that the performance of Institutional Class of the fund was in the fourth quartile for the one and three year periods. The Board also stated that the relative investment performance of the fund was lower than its benchmark over time. The Board considered that the variations in performance among the fund’s classes reflect the variations in class expenses, which result in lower performance for higher expense classes. The Board discussed with FMR actions to be taken by FMR to improve the fund’s disappointing performance.
The Board has had thorough discussions with FMR throughout the year about the Board’s and FMR’s concerns about equity research, equity fund performance, and compliance with internal policies governing gifts and entertainment. FMR has taken steps that it believes will refocus and strengthen equity research and equity portfolio management and compliance. The Board noted with favor FMR’s recent reorganization of its senior management team and FMR’s plans to dedicate additional resources to investment research, and participated in the process that led to those changes.
Based on its review, and giving particular weight to the nature and quality of the resources dedicated by the Investment Advisers to maintain and improve relative performance, the Board concluded that the nature, extent, and quality of the services provided by Fidelity will benefit the fund’s shareholders, particularly in light of the Board’s view that the fund’s shareholders benefit from investing in a fund that is part of a large family of funds offering a variety of investment disciplines and services.
Competitiveness of Management Fee and Total Fund Expenses. The Board considered the fund’s management fee and total expenses compared to “mapped groups”
of competitive funds and classes. Fidelity creates “mapped groups” by combining similar Lipper investment objective categories that have comparable management fee charac teristics. Combining Lipper investment objective categories aids the Board’s manage ment fee and total expense comparisons by broadening the competitive group used for comparison and by reducing the number of universes to which various Fidelity funds are compared.
The Board considered two proprietary management fee comparisons for the 12 month periods shown in the chart below. The group of Lipper funds used by the Board for management fee comparisons is referred to below as the “Total Mapped Group” and, for the reasons explained above, is broader than the Lipper peer group used by the Board for performance comparisons. The Total Mapped Group comparison focuses on a fund’s standing relative to the total universe of comparable funds available to investors, in terms of gross management fees before expense reimbursements or caps. “TMG %” represents the percentage of funds in the Total Mapped Group that had management fees that were lower than the fund’s. For example, a TMG % of 21% means that 79% of the funds in the Total Mapped Group had higher management fees than the fund. The “Asset Size Peer Group” (ASPG) comparison focuses on a fund’s standing relative to non Fidelity funds similar in size to the fund within the Total Mapped Group. The ASPG represents at least 15% of the funds in the Total Mapped Group with comparable asset size and management fee characteristics, subject to a minimum of 50 funds (or all funds in the Total Mapped Group if fewer than 50). Additional information, such as the ASPG quartile (“quadrant”) in which the fund’s management fee ranked, is also included in the chart and considered by the Board.
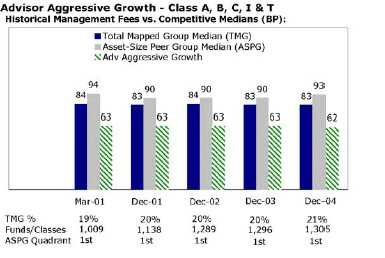
49 Annual Report
Board Approval of Investment Advisory Contracts and Management Fees continued
The Board noted that the fund’s management fee ranked below the median of its Total Mapped Group and below the median of its ASPG for 2004.
Based on its review, the Board concluded that the fund’s management fee was fair and reasonable in light of the services that the fund receives and the other factors considered.
In its review of each class’s total expenses, the Board considered the fund’s management fee as well as other fund or class expenses, as applicable, such as transfer agent fees, pricing and bookkeeping fees, fund paid 12b 1 fees, and custodial, legal, and audit fees. The Board also noted the effects of any waivers and reimbursements on fees and expenses. As part of its review, the Board also considered current and historical total expenses of each class of the fund compared to competitive fund median expenses. Each class of the fund is compared to those funds and classes in the Total Mapped Group (used by the Board for management fee comparisons) that have a similar sales load structure.
The Board noted that the total expenses of each class ranked above its competitive median for 2004. The Board noted that the fund offers multiple classes, each of which has a different sales load and 12b 1 fee structure, and that the multiple structures are intended to offer a range of pricing options for the intermediary market. The Board also noted that the total expenses of the classes vary primarily by the level of their 12b 1 fees, although differences in transfer agent fees may also cause expenses to vary from class to class.
Furthermore, the Board considered that on December 16, 2004, it had approved changes (effective January 1, 2005) in the transfer agent and service agreements for the fund that established maximum transfer agent fees and eliminated the minimum pricing and bookkeeping fee to prevent small funds or funds with small average account sizes from having relatively high fees in basis points (the “small fund fee reductions”). The Board considered that, if the small fund fee reductions had been in effect in 2004, the total expenses of each of Class A, Class B, and Class C would have ranked below the median.
In its review of total expenses, the Board also considered Fidelity fee structures and other information on clients that FMR and its affiliates service in other competitive markets, such as other mutual funds advised or subadvised by FMR or its affiliates, pension plan clients, and other institutional clients.
Based on its review, the Board concluded that the total expenses for each class of the fund were reasonable, although in all cases above the median of the universe presented for comparison, in light of the services that the fund and its shareholders receive and the other factors considered.
Costs of the Services and Profitability. The Board considered the revenues earned and the expenses incurred by Fidelity in conducting the business of developing,
marketing, distributing, managing, administering and servicing the fund and its share holders. The Board also considered the level of Fidelity’s profits in respect of all the Fidelity funds.
On an annual basis, FMR presents to the Board Fidelity’s profitability for the fund. Fidelity calculates the profitability for each fund, as well as aggregate profitability for groups of Fidelity funds and all Fidelity funds, using a series of detailed revenue and cost allocation methodologies which originate with the audited books and records of Fidelity. The Audit Committee of the Board reviews any significant changes from the prior year’s methodologies.
PricewaterhouseCoopers LLP (PwC), independent registered accounting firm and auditor to Fidelity and certain Fidelity funds, has been engaged annually by the Board as part of the Board’s assessment of the results of Fidelity’s profitability analysis. PwC’s engagement includes the review and assessment of Fidelity’s methodologies used in determining the revenues and expenses attributable to Fidelity’s mutual fund business, and completion of agreed upon procedures surrounding the mathematical accuracy of fund profitability and its conformity to allocation methodologies. After considering PwC’s reports issued under the engagement and information provided by Fidelity, the Board believes that while other allocation methods may also be reasonable, Fidelity’s profitabil ity methodologies are reasonable in all material respects.
The Board has also reviewed Fidelity’s non fund businesses and any fall out benefits related to the mutual fund business as well as cases where Fidelity’s affiliates may benefit from or be related to the fund’s business. In addition, a special committee of the Board reviewed services provided to Fidelity by its affiliates and determined that the fees that Fidelity paid for such services were reasonable.
The Board considered the costs of the services provided by and the profits realized by Fidelity in connection with the operation of the fund and determined that the amount of profit is a fair entrepreneurial profit for the management of the fund.
Economies of Scale. The Board considered whether there have been economies of scale in respect of the management of the Fidelity funds, whether the Fidelity funds (including the fund) have appropriately benefited from any such economies of scale, and whether there is potential for realization of any further economies of scale. The Board considered the extent to which the fund will benefit from economies of scale through increased services to the fund, through waivers or reimbursements, or through fee or expense reductions, including reductions that occur through operation of the transfer agent agreement. The transfer agent fee varies in part based on the number of accounts in the fund. If the number of accounts decreases or the average account size increases, the overall transfer agent fee rate decreases.
51 Annual Report
Board Approval of Investment Advisory Contracts and Management Fees continued
The Board recognized that the fund’s management contract incorporates a “group fee” structure, which provides for lower fee rates as total fund assets under FMR’s manage ment increase, and for higher fee rates as total fund assets under FMR’s management decrease. The Board considered that the group fee is designed to deliver the benefits of economies of scale to fund shareholders when total fund assets increase, even if assets of any particular fund are unchanged or have declined, because some portion of Fidelity’s costs are attributable to services provided to all Fidelity funds, and all funds benefit if those costs can be allocated among more assets. The Board concluded that, given the group fee structure, fund shareholders will achieve a certain level of economies of scale as assets under FMR’s management increase at the fund complex level, regardless of whether Fidelity achieves any such economies of scale.
The Board further concluded that any potential economies of scale are being shared between fund shareholders and Fidelity in an appropriate manner.
Additional Information Requested by the Board. In order to develop fully the factual basis for consideration of the Advisory Contracts, the Board requested additional information regarding (i) equity fund transfer agency fees; (ii) Fidelity’s fund profitability methodology and the impact of various changes in the methodology over time; (iii) benefits to shareholders from economies of scale; (iv) composition and characteristics of various fund and industry data used in comparisons; and (v) com pensation of portfolio managers and research analysts.
Based on its evaluation of all of the conclusions noted above, and after considering all material factors, the Board ultimately concluded that the existing advisory fee structures are fair and reasonable, and that the fund’s existing Advisory Contracts should be renewed.
53 Annual Report
Investment Adviser
Fidelity Management & Research Company
Boston, MA
Investment Sub Advisers
FMR Co., Inc.
Fidelity Management & Research
(U.K.) Inc.
Fidelity Management & Research
(Far East) Inc.
Fidelity International Investment Advisors
Fidelity Investments Japan Limited
Fidelity International Investment Advisors (U.K.) Limited
General Distributor
Fidelity Distributors Corporation
Boston, MA
Transfer and Service Agents
Fidelity Investments Institutional
Operations Company, Inc.
Boston, MA
Fidelity Service Company, Inc.
Boston, MA
Custodian
State Street Bank and Trust Company
Quincy, MA
|
AAG UANN-0106
1.786669.102
|


| | Fidelity® Advisor
Aggressive Growth
Fund - Institutional Class
|
Annual Report
November 30, 2005
|

| Contents | | | | |
| |
| Chairman’s Message | | 4 | | Ned Johnson’s message to shareholders. |
| Performance | | 5 | | How the fund has done over time. |
| Management’s Discussion | | 6 | | The manager’s review of fund |
| | | | | performance, strategy and outlook. |
| Shareholder Expense | | 7 | | An example of shareholder expenses. |
| Example | | | | |
| Investment Changes | | 9 | | A summary of major shifts in the fund’s |
| | | | | investments over the past six months. |
| Investments | | 10 | | A complete list of the fund’s investments |
| | | | | with their market values. |
| Financial Statements | | 16 | | Statements of assets and liabilities, |
| | | | | operations, and changes in net assets, |
| | | | | as well as financial highlights. |
| Notes | | 25 | | Notes to the financial statements. |
| Report of Independent | | 33 | | |
| Registered Public | | | | |
| Accounting Firm | | | | |
| Trustees and Officers | | 34 | | |
| Board Approval of | | 44 | | |
| Investment Advisory | | | | |
| Contracts and | | | | |
| Management Fees | | | | |
To view a fund’s proxy voting guidelines and proxy voting record for the 12 month period ended
June 30, visit www.fidelity.com/proxyvotingresults or visit the Securities and Exchange Commis
sion’s (SEC) web site at www.sec.gov. You may also call 1-877-208-0098 to request a free copy of
the proxy voting guidelines.
Standard & Poor’s, S&P and S&P 500 are registered service marks of The McGraw Hill Companies, Inc.
and have been licensed for use by Fidelity Distributors Corporation.
Other third party marks appearing herein are the property of their respective owners.
All other marks appearing herein are registered or unregistered trademarks or service marks
of FMR Corp. or an affiliated company.
|
This report and the financial statements contained herein are submitted for the general information
of the shareholders of the fund. This report is not authorized for distribution to prospective investors
in the fund unless preceded or accompanied by an effective prospectus.
A fund files its complete schedule of portfolio holdings with the SEC for the first and third
quarters of each fiscal year on Form N Q. Forms N Q are available on the SEC’s web site at
http://www.sec.gov. A fund’s Forms N Q may be reviewed and copied at the SEC’s Public Reference
Room in Washington, DC. Information regarding the operation of the SEC’s Public Reference
Room may be obtained by calling 1-800-SEC-0330. For a complete list of a fund’s portfolio hold
ings, view the most recent quarterly holdings report, semiannual report, or annual report on
Fidelity’s web site at http://www.advisor.fidelity.com.
NOT FDIC INSURED · MAY LOSE VALUE · NO BANK GUARANTEE
Neither the fund nor Fidelity Distributors Corporation is a bank.
|
3 Annual Report
Chairman’s Message
(photograph of Edward C Johnson 3d)
Dear Shareholder:
During the past year or so, much has been reported about the mutual fund industry, and much of it has been more critical than I believe is warranted. Allegations that some companies have been less than forthright with their shareholders have cast a shadow on the entire industry. I continue to find these reports disturbing, and assert that they do not create an accurate picture of the industry overall. Therefore, I would like to remind every one where Fidelity stands on these issues. I will say two things specifically regarding allegations that some mutual fund companies were in violation of the Securities and Exchange Commission’s forward pricing rules or were involved in so called “market timing” activities.
First, Fidelity has no agreements that permit customers who buy fund shares after 4 p.m. to obtain the 4 p.m. price. This is not a new policy. This is not to say that some one could not deceive the company through fraudulent acts. However, we are extremely diligent in preventing fraud from occurring in this manner and in every other. But I underscore again that Fidelity has no so called “agreements” that sanction illegal practices.
Second, Fidelity continues to stand on record, as we have for years, in opposition to predatory short term trading that adversely affects shareholders in a mutual fund. Back in the 1980s, we initiated a fee which is returned to the fund and, therefore, to investors to discourage this activity. Further, we took the lead several years ago in developing a Fair Value Pricing Policy to prevent market timing on foreign securities in our funds. I am confident we will find other ways to make it more difficult for predatory traders to operate. However, this will only be achieved through close cooperation among regulators, legislators and the industry.
Yes, there have been unfortunate instances of unethical and illegal activity within the mutual fund industry from time to time. That is true of any industry. When this occurs, confessed or convicted offenders should be dealt with appropriately. But we are still concerned about the risk of over regulation and the quick application of simplistic solutions to intricate problems. Every system can be improved, and we support and applaud well thought out improvements by regulators, legislators and industry representatives that achieve the common goal of building and protecting the value of investors’ holdings.
For nearly 60 years, Fidelity has worked very hard to improve its products and service to justify your trust. When our family founded this company in 1946, we had only a few hundred customers. Today, we serve more than 18 million customers including individual investors and participants in retirement plans across America.
Let me close by saying that we do not take your trust in us for granted, and we realize that we must always work to improve all aspects of our service to you. In turn, we urge you to continue your active participation with your financial matters, so that your interests can be well served.
Best regards,
/s/ Edward C. Johnson 3d
Edward C. Johnson 3d
Annual Report 4
Performance: The Bottom Line
Average annual total return reflects the change in the value of an investment, assuming reinvestment of the class’ dividend income and capital gains (the profits earned upon the sale of securities that have grown in value) and assuming a constant rate of performance each year. The $10,000 table and the fund’s returns do not reflect the deduction of taxes that a shareholder would pay on fund distributions or the redemption of fund shares. During periods of reimbursement by Fidelity, a fund’s total return will be greater than it would be had the reimbursement not occurred. How a fund did yesterday is no guaran tee of how it will do tomorrow.
| Average Annual Total Returns | | | | | | |
| Periods ended November 30, 2005 | | Past 1 | | Past 5 | | Life of |
| | | year | | years | | fundA |
| Institutional Class | | 9.62% | | 1.12% | | 0.85% |
| A From November 13, 2000. | | | | | | |
$10,000 Over Life of Fund | | | | | | |
Let’s say hypothetically that $10,000 was invested in Fidelity® Advisor Aggressive Growth Fund Institutional Class on November 13, 2000, when the fund started. The chart shows how the value of your investment would have changed, and also shows how the Russell Midcap® Growth Index performed over the same period.
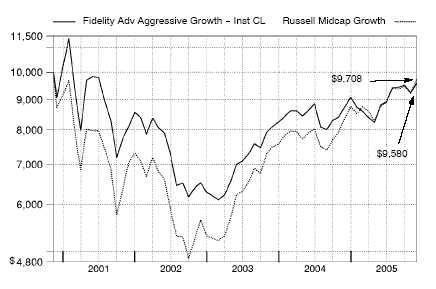
5 Annual Report
5
Management’s Discussion of Fund Performance
Comments from Steven Calhoun, Portfolio Manager of Fidelity® Advisor Aggressive Growth Fund
Numerous events unfolded during the 12 month period ending November 30, 2005, that were major influences on the U.S. equity markets. Issues exerting downward pressure on stocks included higher levels of inflation, eight short term interest rate hikes by the Federal Reserve Board, exorbitant energy prices, and a Category 4 hurricane that devas tated both the city of New Orleans and several nearby oil production and refinery facilities. Grabbing most of the markets’ upbeat headlines was consistent strength in consumer spending, corporate earnings and gross domestic product (GDP). When all was said and done, investors demonstrated their conviction in the economy, pushing stocks higher across the board. By period end, the Standard & Poor’s 500SM Index, the NASDAQ Composite® Index and the Dow Jones Industrial AverageSM approached or exceeded four and a half year highs. For the 12 months overall, the S&P 500® was up 8.44%, the NASDAQ® rose 7.28% and the Dow advanced 6.07%, threatening to eclipse the 11,000 threshold for the first time since 2001.
For the 12 months ending November 30, 2005, the fund’s Institutional Class shares re turned 9.62%, well behind the 16.20% return of the Russell Midcap® Growth Index and the 13.30% gain of the LipperSM Mid Cap Funds Average. Most of the underperformance versus the index occurred during the first half of the period, when several holdings in the phar maceuticals and biotechnology group particularly Biogen Idec and Ireland based Elan suffered steep declines. Questions about the safety of the companies’ jointly developed multiple sclerosis drug, Tysabri, and its voluntary withdrawal from the market early in 2005 hurt both stocks. I sold Elan and Biogen Idec shortly after taking over the fund in June. Elsewhere, Chinese online gaming stock Shanda Interactive Entertainment was one of my picks that didn’t work out. On the other hand, fund performance benefited from both an overweighting and stock selection in energy a sector I added to during the period. Biotechnology bellwether Genentech was by far the fund’s top contributor. Positive test results for a number of the company’s drugs fueled a strong advance in its stock, and I liquidated the position to lock in profits. Internet search engine Google was another strong contributor, its stock price lifted by several upward revisions in earnings growth.
The views expressed in this statement reflect those of the portfolio manager only through the end of the period of the report as stated on the cover and do not necessarily represent the views of Fidelity or any other person in the Fidelity organization. Any such views are subject to change at any time based upon market or other conditions and Fidelity disclaims any responsibility to update such views. These views may not be relied on as investment advice and, because investment decisions for a Fidelity fund are based on numerous factors, may not be relied on as an indication of trading intent on behalf of any Fidelity fund.
Shareholder Expense Example
As a shareholder of the Fund, you incur two types of costs: (1) transaction costs, including sales charges (loads) on purchase payments or redemption proceeds, and (2) ongoing costs, including management fees, distribution and/or service (12b 1) fees and other Fund expenses. This Example is intended to help you understand your ongoing costs (in dollars) of investing in the Fund and to compare these costs with the ongoing costs of investing in other mutual funds.
The Example is based on an investment of $1,000 invested at the beginning of the period and held for the entire period (June 1, 2005 to November 30, 2005).
The first line of the table below for each class of the Fund provides information about actual account values and actual expenses. You may use the information in this line, together with the amount you invested, to estimate the expenses that you paid over the period. Simply divide your account value by $1,000.00 (for example, an $8,600 account value divided by $1,000.00 = 8.6), then multiply the result by the number in the first line for a class of the Fund under the heading entitled “Expenses Paid During Period” to estimate the expenses you paid on your account during this period.
Hypothetical Example for Comparison Purposes
The second line of the table below for each class of the Fund provides information about hypothetical account values and hypothetical expenses based on a Class’ actual expense ratio and an assumed rate of return of 5% per year before expenses, which is not the Class’ actual return. The hypothetical account values and expenses may not be used to estimate the actual ending account balance or expenses you paid for the period. You may use this information to compare the ongoing costs of investing in the Fund and other funds. To do so, compare this 5% hypothetical example with the 5% hypothetical examples that appear in the shareholder reports of the other funds.
7 Annual Report
Shareholder Expense Example continued
Please note that the expenses shown in the table are meant to highlight your ongoing costs only and do not reflect any transaction costs. Therefore, the second line of the table is useful in comparing ongoing costs only, and will not help you determine the relative total costs of owning different funds. In addition, if these transactional costs were included, your costs would have been higher.
| | | | | | | | | | | Expenses Paid |
| | | | | Beginning | | Ending | | During Period* |
| | | | | Account Value | | Account Value | | June 1, 2005 to |
| | | | | June 1, 2005 | | November 30, 2005 | | November 30, 2005 |
| Class A | | | | | | | | | | | | |
| Actual | | $ | | 1,000.00 | | $ | | 1,087.80 | | $ | | 6.80 |
| HypotheticalA | | $ | | 1,000.00 | | $ | | 1,018.55 | | $ | | 6.58 |
| Class T | | | | | | | | | | | | |
| Actual | | $ | | 1,000.00 | | $ | | 1,085.30 | | $ | | 8.10 |
| HypotheticalA | | $ | | 1,000.00 | | $ | | 1,017.30 | | $ | | 7.84 |
| Class B | | | | | | | | | | | | |
| Actual | | $ | | 1,000.00 | | $ | | 1,082.30 | | $ | | 10.70 |
| HypotheticalA | | $ | | 1,000.00 | | $ | | 1,014.79 | | $ | | 10.35 |
| Class C | | | | | | | | | | | | |
| Actual | | $ | | 1,000.00 | | $ | | 1,082.20 | | $ | | 10.70 |
| HypotheticalA | | $ | | 1,000.00 | | $ | | 1,014.79 | | $ | | 10.35 |
| Institutional Class | | | | | | | | | | | | |
| Actual | | $ | | 1,000.00 | | $ | | 1,088.70 | | $ | | 5.50 |
| HypotheticalA | | $ | | 1,000.00 | | $ | | 1,019.80 | | $ | | 5.32 |
| |
| A 5% return per year before expenses | | | | | | | | |
* Expenses are equal to each Class’ annualized expense ratio (shown in the table below); multiplied by the average account value over the period, multiplied by 183/365 (to reflect the one half year period).
| | | Annualized |
| | | Expense Ratio |
| Class A | | 1.30% |
| Class T | | 1.55% |
| Class B | | 2.05% |
| Class C | | 2.05% |
| Institutional Class | | 1.05% |
| Investment Changes | | | | |
| |
| |
| Top Ten Stocks as of November 30, 2005 | | | | |
| | | % of fund’s | | % of fund’s net assets |
| | | net assets | | 6 months ago |
| St. Jude Medical, Inc. | | 3.2 | | 0.0 |
| KB Home | | 2.6 | | 0.0 |
| Potash Corp. of Saskatchewan | | 2.5 | | 0.6 |
| Abercrombie & Fitch Co. Class A | | 2.1 | | 0.4 |
| D.R. Horton, Inc. | | 2.1 | | 0.0 |
| Google, Inc. Class A (sub. vtg.) | | 2.1 | | 0.7 |
| Urban Outfitters, Inc. | | 2.1 | | 0.0 |
| Ameritrade Holding Corp. | | 2.1 | | 0.3 |
| INAMED Corp. | | 2.0 | | 0.0 |
| Agrium, Inc. | | 2.0 | | 0.0 |
| | | 22.8 | | |
Top Five Market Sectors as of November 30, 2005 | | |
| | | % of fund’s | | % of fund’s net assets |
| | | net assets | | 6 months ago |
| Health Care | | 31.4 | | 29.2 |
| Information Technology | | 20.2 | | 26.9 |
| Consumer Discretionary | | 15.4 | | 17.1 |
| Energy | | 11.3 | | 7.3 |
| Materials | | 7.6 | | 3.2 |
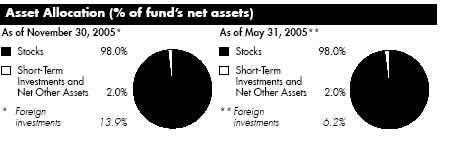
9 Annual Report
| Investments November 30, 2005 | | |
| Showing Percentage of Net Assets | | | | | | | | |
| |
| Common Stocks 98.0% | | | | | | | | |
| | | | | Shares | | Value (Note 1) |
| |
| CONSUMER DISCRETIONARY – 15.4% | | | | | | | | |
| Hotels, Restaurants & Leisure 2.6% | | | | | | | | |
| Kerzner International Ltd. (a) | | | | 1,900 | | $ | | 123,519 |
| Penn National Gaming, Inc. (a) | | | | 15,067 | | | | 499,772 |
| Station Casinos, Inc. | | | | 6,600 | | | | 457,644 |
| | | | | | | | | 1,080,935 |
| Household Durables – 4.8% | | | | | | | | |
| D.R. Horton, Inc. | | | | 24,561 | | | | 870,442 |
| KB Home | | | | 15,400 | | | | 1,074,458 |
| | | | | | | | | 1,944,900 |
| Media – 1.1% | | | | | | | | |
| Getty Images, Inc. (a) | | | | 4,980 | | | | 454,624 |
| Specialty Retail – 6.9% | | | | | | | | |
| Abercrombie & Fitch Co. Class A | | | | 14,300 | | | | 876,876 |
| Best Buy Co., Inc. | | | | 13,950 | | | | 672,948 |
| Tiffany & Co., Inc. | | | | 10,600 | | | | 431,420 |
| Urban Outfitters, Inc. (a) | | | | 27,300 | | | | 842,478 |
| | | | | | | | | 2,823,722 |
| |
| TOTAL CONSUMER DISCRETIONARY | | | | | | | | 6,304,181 |
| |
| CONSUMER STAPLES 2.0% | | | | | | | | |
| Food & Staples Retailing – 2.0% | | | | | | | | |
| Whole Foods Market, Inc. | | | | 5,610 | | | | 826,241 |
| ENERGY 11.3% | | | | | | | | |
| Energy Equipment & Services – 4.4% | | | | | | | | |
| Baker Hughes, Inc. | | | | 7,800 | | | | 447,330 |
| ENSCO International, Inc. | | | | 9,300 | | | | 440,448 |
| Halliburton Co. | | | | 7,400 | | | | 471,010 |
| Weatherford International Ltd. (a) | | | | 6,830 | | | | 474,753 |
| | | | | | | | | 1,833,541 |
| Oil, Gas & Consumable Fuels – 6.9% | | | | | | | | |
| Arch Coal, Inc. | | | | 5,600 | | | | 431,424 |
| Chesapeake Energy Corp. | | | | 14,400 | | | | 416,880 |
| EOG Resources, Inc. | | | | 8,800 | | | | 631,400 |
| Peabody Energy Corp. | | | | 5,300 | | | | 417,958 |
| |
| |
| |
| |
| See accompanying notes which are an integral part of the financial statements. | | | | |
| |
| Annual Report | | 10 | | | | | | |
| Common Stocks continued | | | | | | |
| | | Shares | | Value (Note 1) |
| |
| ENERGY – continued | | | | | | |
| Oil, Gas & Consumable Fuels – continued | | | | | | |
| Range Resources Corp. | | 12,500 | | $ | | 465,500 |
| Ultra Petroleum Corp. (a) | | 8,500 | | | | 457,130 |
| | | | | | | 2,820,292 |
| |
| TOTAL ENERGY | | | | | | 4,653,833 |
| |
| FINANCIALS – 2.8% | | | | | | |
| Capital Markets 2.1% | | | | | | |
| Ameritrade Holding Corp. (a) | | 35,900 | | | | 838,624 |
| Diversified Financial Services – 0.6% | | | | | | |
| Indiabulls Financial Services Ltd. | | 3,553 | | | | 12,763 |
| Indiabulls Financial Services Ltd. GDR (e) | | 11,268 | | | | 40,451 |
| IntercontinentalExchange, Inc. | | 6,500 | | | | 209,950 |
| | | | | | | 263,164 |
| Real Estate 0.1% | | | | | | |
| Sinochem Hong Kong Holding Ltd. (a) | | 189,200 | | | | 32,938 |
| |
| TOTAL FINANCIALS | | | | | | 1,134,726 |
| |
| HEALTH CARE – 31.4% | | | | | | |
| Biotechnology – 6.8% | | | | | | |
| Alnylam Pharmaceuticals, Inc. (a) | | 15,100 | | | | 189,656 |
| Amgen, Inc. (a) | | 7,500 | | | | 606,975 |
| Celgene Corp. (a) | | 11,640 | | | | 709,109 |
| Martek Biosciences (a) | | 16,300 | | | | 427,223 |
| MedImmune, Inc. (a) | | 12,110 | | | | 434,870 |
| Protein Design Labs, Inc. (a) | | 15,170 | | | | 422,485 |
| | | | | | | 2,790,318 |
| Health Care Equipment & Supplies – 16.7% | | | | | | |
| Alcon, Inc. | | 2,900 | | | | 406,580 |
| American Medical Systems Holdings, Inc. (a) | | 44,800 | | | | 824,320 |
| China Medical Technologies, Inc. sponsored ADR | | 3,400 | | | | 106,182 |
| Cyberonics, Inc. (a) | | 23,500 | | | | 662,935 |
| INAMED Corp. (a) | | 10,000 | | | | 838,400 |
| Integra LifeSciences Holdings Corp. (a) | | 12,000 | | | | 438,480 |
| Kyphon, Inc. (a) | | 9,500 | | | | 403,655 |
| Mentor Corp. | | 13,300 | | | | 648,242 |
| NeuroMetrix, Inc. (a) | | 6,406 | | | | 199,163 |
| NuVasive, Inc. (a) | | 20,600 | | | | 354,320 |
| ResMed, Inc. (a) | | 1,300 | | | | 53,040 |
See accompanying notes which are an integral part of the financial statements.
11 Annual Report
| Investments continued | | | | |
| |
| Common Stocks continued | | | | |
| | | Shares | | Value (Note 1) |
| |
| HEALTH CARE – continued | | | | |
| Health Care Equipment & Supplies – continued | | | | |
| St. Jude Medical, Inc. (a) | | 28,000 | | $ 1,337,560 |
| Ventana Medical Systems, Inc. (a) | | 15,120 | | 582,271 |
| | | | | 6,855,148 |
| Health Care Providers & Services – 4.6% | | | | |
| Caremark Rx, Inc. (a) | | 8,400 | | 431,676 |
| Covance, Inc. (a) | | 9,100 | | 432,614 |
| Humana, Inc. (a) | | 13,850 | | 634,746 |
| Sierra Health Services, Inc. (a) | | 5,200 | | 406,744 |
| | | | | 1,905,780 |
| Pharmaceuticals – 3.3% | | | | |
| Allergan, Inc. | | 5,300 | | 530,000 |
| Medicis Pharmaceutical Corp. Class A | | 13,500 | | 430,785 |
| Sepracor, Inc. (a) | | 7,150 | | 393,107 |
| | | | | 1,353,892 |
| |
| TOTAL HEALTH CARE | | | | 12,905,138 |
| |
| INDUSTRIALS – 7.3% | | | | |
| Air Freight & Logistics – 2.7% | | | | |
| Expeditors International of Washington, Inc. | | 9,500 | | 674,595 |
| UTI Worldwide, Inc. | | 4,581 | | 445,685 |
| | | | | 1,120,280 |
| Commercial Services & Supplies – 1.2% | | | | |
| Stericycle, Inc. (a) | | 7,770 | | 476,456 |
| Construction & Engineering – 1.2% | | | | |
| Quanta Services, Inc. (a) | | 34,600 | | 489,590 |
| Electrical Equipment – 1.0% | | | | |
| AMETEK, Inc. | | 10,100 | | 430,361 |
| Machinery – 1.2% | | | | |
| Deere & Co. | | 7,000 | | 485,450 |
| |
| TOTAL INDUSTRIALS | | | | 3,002,137 |
| |
| INFORMATION TECHNOLOGY – 20.2% | | | | |
| Communications Equipment – 4.4% | | | | |
| ADC Telecommunications, Inc. (a) | | 28,100 | | 574,083 |
| Comverse Technology, Inc. (a) | | 23,473 | | 615,227 |
See accompanying notes which are an integral part of the financial statements.
| Common Stocks continued | | | | | | |
| | | Shares | | Value (Note 1) |
| |
| INFORMATION TECHNOLOGY – continued | | | | | | |
| Communications Equipment – continued | | | | | | |
| Corning, Inc. (a) | | 6,170 | | $ | | 124,943 |
| Ixia (a) | | 35,796 | | | | 493,269 |
| | | | | | | 1,807,522 |
| Computers & Peripherals – 1.1% | | | | | | |
| Sun Microsystems, Inc. (a) | | 112,300 | | | | 423,371 |
| Internet Software & Services – 3.1% | | | | | | |
| Google, Inc. Class A (sub. vtg.) (a) | | 2,100 | | | | 850,479 |
| VeriSign, Inc. (a) | | 19,600 | | | | 435,708 |
| | | | | | | 1,286,187 |
| Semiconductors & Semiconductor Equipment – 6.0% | | | | | | |
| ARM Holdings PLC sponsored ADR | | 73,300 | | | | 461,057 |
| ASML Holding NV (NY Shares) (a) | | 36,900 | | | | 707,004 |
| Microchip Technology, Inc. | | 17,570 | | | | 586,135 |
| National Semiconductor Corp. | | 17,600 | | | | 455,488 |
| PMC-Sierra, Inc. (a) | | 34,030 | | | | 267,816 |
| | | | | | | 2,477,500 |
| Software 5.6% | | | | | | |
| Activision, Inc. (a) | | 31,210 | | | | 415,405 |
| Citrix Systems, Inc. (a) | | 14,670 | | | | 398,144 |
| Cognos, Inc. (a) | | 12,500 | | | | 417,935 |
| Hyperion Solutions Corp. (a) | | 8,732 | | | | 462,359 |
| Shanda Interactive Entertainment Ltd. sponsored ADR (a)(d) | | 35,100 | | | | 599,859 |
| | | | | | | 2,293,702 |
| |
| TOTAL INFORMATION TECHNOLOGY | | | | | | 8,288,282 |
| |
| MATERIALS 7.6% | | | | | | |
| Chemicals – 6.6% | | | | | | |
| Agrium, Inc. | | 41,100 | | | | 837,186 |
| Monsanto Co. | | 11,400 | | | | 835,278 |
| Potash Corp. of Saskatchewan | | 14,100 | | | | 1,027,235 |
| | | | | | | 2,699,699 |
| Construction Materials 1.0% | | | | | | |
| Martin Marietta Materials, Inc. | | 5,800 | | | | 435,638 |
| |
| TOTAL MATERIALS | | | | | | 3,135,337 |
| |
| TOTAL COMMON STOCKS | | | | | | |
| (Cost $38,478,860) | | | | 40,249,875 |
See accompanying notes which are an integral part of the financial statements.
13 Annual Report
| Investments continued | | | | | | | | |
| |
| Money Market Funds 1.8% | | | | | | | | |
| | | Shares | | | | Value (Note 1) |
| Fidelity Cash Central Fund, 4.08% (b) | | 505,186 | | | | $ | | 505,186 |
| Fidelity Securities Lending Cash Central Fund, 4.09% (b)(c) | | 234,500 | | | | | | 234,500 |
| TOTAL MONEY MARKET FUNDS | | | | | | | | |
| (Cost $739,686) | | | | | | | | 739,686 |
| TOTAL INVESTMENT PORTFOLIO 99.8% | | | | | | | | |
| (Cost $39,218,546) | | | | | | 40,989,561 |
| |
| NET OTHER ASSETS – 0.2% | | | | | | | | 97,262 |
| NET ASSETS 100% | | | | | | $ | | 41,086,823 |
Legend
(a) Non-income producing
(b) Affiliated fund that is available only to
investment companies and other
accounts managed by Fidelity
Investments. The rate quoted is the
annualized seven-day yield of the fund
at period end. A complete unaudited
listing of the fund’s holdings as of its
most recent quarter end is available
upon request.
|
(c) Investment made with cash collateral
received from securities on loan.
(d) Security or a portion of the security is on
loan at period end.
(e) Security exempt from registration under
Rule 144A of the Securities Act of 1933.
These securities may be resold in
transactions exempt from registration,
normally to qualified institutional buyers.
At the period end, the value of these
securities amounted to $40,451 or 0.1%
of net assets.
|
Affiliated Central Funds
Information regarding income received by the fund from the affiliated Central funds during the period is as follows:
| Fund | | | | Income received |
| Fidelity Cash Central Fund | | | $ | 31,473 |
| Fidelity Securities Lending Cash Central Fund | | | | 13,012 |
| Total | | | $ | 44,485 |
See accompanying notes which are an integral part of the financial statements.
Annual Report 14
Other Information
Distribution of investments by country of issue, as a percentage of total net assets, is as follows:
| United States of America | | 86.1% |
| Canada | | 6.7% |
| Netherlands | | 1.7% |
| China | | 1.5% |
| United Kingdom | | 1.1% |
| British Virgin Islands | | 1.1% |
| Switzerland | | 1.0% |
| Others (individually less than 1%) . | | 0.8% |
| | | 100.0% |
Income Tax Information
At November 30, 2005, the fund had a capital loss carryforward of approximately $4,868,687 all of which will expire on November 30, 2010.
See accompanying notes which are an integral part of the financial statements.
15 Annual Report
| Financial Statements | | | | | | | | |
| |
| |
| Statement of Assets and Liabilities | | | | | | | | |
| | | | | | | November 30, 2005 |
| |
| Assets | | | | | | | | |
| Investment in securities, at value (including securities | | | | | | | | |
| loaned of $229,006) See accompanying schedule: | | | | | | | | |
| Unaffiliated issuers (cost $38,478,860) | | $ | | 40,249,875 | | | | |
| Affiliated Central Funds (cost $739,686) | | | | 739,686 | | | | |
| Total Investments (cost $39,218,546) | | | | | | $ | | 40,989,561 |
| Receivable for investments sold | | | | | | | | 1,186,148 |
| Receivable for fund shares sold | | | | | | | | 19,576 |
| Dividends receivable | | | | | | | | 10,260 |
| Interest receivable | | | | | | | | 3,679 |
| Prepaid expenses | | | | | | | | 223 |
| Receivable from investment adviser for expense | | | | | | | | |
| reductions | | | | | | | | 2,639 |
| Other receivables | | | | | | | | 7,105 |
| Total assets | | | | | | | | 42,219,191 |
| |
| Liabilities | | | | | | | | |
| Payable to custodian bank | | $ | | 15,305 | | | | |
| Payable for investments purchased | | | | 721,481 | | | | |
| Payable for fund shares redeemed | | | | 71,871 | | | | |
| Accrued management fee | | | | 21,212 | | | | |
| Distribution fees payable | | | | 22,525 | | | | |
| Other affiliated payables | | | | 12,992 | | | | |
| Other payables and accrued expenses | | | | 32,482 | | | | |
| Collateral on securities loaned, at value | | | | 234,500 | | | | |
| Total liabilities | | | | | | | | 1,132,368 |
| |
| Net Assets | | | | | | $ | | 41,086,823 |
| Net Assets consist of: | | | | | | | | |
| Paid in capital | | | | | | $ | | 44,331,194 |
| Accumulated undistributed net realized gain (loss) on | | | | | | | | |
| investments and foreign currency transactions | | | | | | | | (5,015,392) |
| Net unrealized appreciation (depreciation) on | | | | | | | | |
| investments and assets and liabilities in foreign | | | | | | | | |
| currencies | | | | | | | | 1,771,021 |
| Net Assets | | | | | | $ | | 41,086,823 |
See accompanying notes which are an integral part of the financial statements.
| Statement of Assets and Liabilities continued | | | | |
| | | | | November 30, 2005 |
| |
| Calculation of Maximum Offering Price | | | | | | |
| Class A: | | | | | | |
| Net Asset Value and redemption price per share | | | | | | |
| ($7,206,274 ÷ 765,380 shares) | | | | $ | | 9.42 |
| |
| Maximum offering price per share (100/94.25 of $9.42) | | . | | $ | | 9.99 |
| Class T: | | | | | | |
| Net Asset Value and redemption price per share | | | | | | |
| ($16,331,474 ÷ 1,757,820 shares) | | | | $ | | 9.29 |
| |
| Maximum offering price per share (100/96.50 of $9.29) | | . | | $ | | 9.63 |
| Class B: | | | | | | |
| Net Asset Value and offering price per share | | | | | | |
| ($9,236,782 ÷ 1,018,397 shares)A | | | | $ | | 9.07 |
| |
| Class C: | | | | | | |
| Net Asset Value and offering price per share | | | | | | |
| ($7,790,540 ÷ 857,606 shares)A | | | | $ | | 9.08 |
| |
| Institutional Class: | | | | | | |
| Net Asset Value, offering price and redemption price per | | | | |
| share ($521,753 ÷ 54,546 shares) | | | | $ | | 9.57 |
| |
| A Redemption price per share is equal to net asset value less any applicable contingent deferred sales charge. | | | | |
See accompanying notes which are an integral part of the financial statements.
17 Annual Report
| Financial Statements continued | | | | | | |
| |
| Statement of Operations | | | | | | |
| | | | | Year ended November 30, 2005 |
| |
| Investment Income | | | | | | |
| Dividends | | | | $ | | 179,184 |
| Special dividends | | | | | | 25,350 |
| Interest | | | | | | 174 |
| Income from affiliated Central Funds (including $14,741 | | | | |
| from security lending) | | | | | | 44,485 |
| Total income | | | | | | 249,193 |
| |
| Expenses | | | | | | |
| Management fee | | $ | | 248,991 | | |
| Transfer agent fees | | | | 163,113 | | |
| Distribution fees | | | | 267,185 | | |
| Accounting and security lending fees | | | | 19,495 | | |
| Independent trustees’ compensation | | | | 184 | | |
| Custodian fees and expenses | | | | 24,524 | | |
| Registration fees | | | | 52,965 | | |
| Audit | | | | 40,084 | | |
| Legal | | | | 678 | | |
| Miscellaneous | | | | 1,794 | | |
| Total expenses before reductions | | | | 819,013 | | |
| Expense reductions | | | | (150,331) | | 668,682 |
| |
| Net investment income (loss) | | | | | | (419,489) |
| Realized and Unrealized Gain (Loss) | | | | | | |
| Net realized gain (loss) on: | | | | | | |
| Investment securities: | | | | | | |
| Unaffiliated issuers | | | | 6,396,199 | | |
| Foreign currency transactions | | | | (848) | | |
| Total net realized gain (loss) | | | | | | 6,395,351 |
| Change in net unrealized appreciation (depreciation) on: | | | | |
| Investment securities | | | | (2,534,840) | | |
| Assets and liabilities in foreign currencies | | | | (52) | | |
| Total change in net unrealized appreciation | | | | | | |
| (depreciation) | | | | | | (2,534,892) |
| Net gain (loss) | | | | | | 3,860,459 |
| Net increase (decrease) in net assets resulting from | | | | | | |
| operations | | | | $ | | 3,440,970 |
See accompanying notes which are an integral part of the financial statements.
| Statement of Changes in Net Assets | | | | | | | | |
| | | | | Year ended | | | | Year ended |
| | | | | November 30, | | | | November 30, |
| | | | | 2005 | | | | 2004 |
| Increase (Decrease) in Net Assets | | | | | | | | |
| Operations | | | | | | | | |
| Net investment income (loss) | | $ | | (419,489) | | $ | | (559,618) |
| Net realized gain (loss) | | | | 6,395,351 | | | | 3,516,046 |
| Change in net unrealized appreciation (depreciation) . | | | | (2,534,892) | | | | (473,553) |
| Net increase (decrease) in net assets resulting | | | | | | | | |
| from operations | | | | 3,440,970 | | | | 2,482,875 |
| Share transactions - net increase (decrease) | | | | (3,060,326) | | | | 4,161,402 |
| Total increase (decrease) in net assets | | | | 380,644 | | | | 6,644,277 |
| |
| Net Assets | | | | | | | | |
| Beginning of period | | | | 40,706,179 | | | | 34,061,902 |
| End of period | | $ | | 41,086,823 | | $ | | 40,706,179 |
See accompanying notes which are an integral part of the financial statements.
19 Annual Report
| Financial Highlights Class A | | | | | | | | | | | | | | | | |
| Years ended November 30, | | 2005 | | | | 2004 | | | | 2003 | | | | 2002 | | | | 2001 |
| Selected Per Share Data | | | | | | | | | | | | | | | | | | |
| Net asset value, beginning of | | | | | | | | | | | | | | | | | | |
| period | | $ 8.61 | | $ | | 8.02 | | $ | | 6.47 | | $ | | 8.08 | | $ | | 9.05 |
| Income from Investment | | | | | | | | | | | | | | | | | | |
| Operations | | | | | | | | | | | | | | | | | | |
| Net investment income | | | | | | | | | | | | | | | | | | |
| (loss)C | | (.06)D | | | | (.09) | | | | (.06) | | | | (.08) | | | | (.01) |
| Net realized and unrealized | | | | | | | | | | | | | | | | | | |
| gain (loss) | | 87 | | | | .68 | | | | 1.61 | | | | (1.53) | | | | (.95) |
| Total from investment | | | | | | | | | | | | | | | | | | |
| operations | | 81 | | | | .59 | | | | 1.55 | | | | (1.61) | | | | (.96) |
| Distributions from net realized | | | | | | | | | | | | | | | | | | |
| gain | | — | | | | — | | | | — | | | | — | | | | (.01) |
| Net asset value, end of period | | $ 9.42 | | $ | | 8.61 | | $ | | 8.02 | | $ | | 6.47 | | $ | | 8.08 |
| Total ReturnA,B | | 9.41% | | | | 7.36% | | | | 23.96% | | | | (19.93)% | | | | (10.62)% |
| Ratios to Average Net AssetsE | | | | | | | | | | | | | | | | | | |
| Expenses before reductions . | | 1.60% | | | | 1.90% | | | | 2.25% | | | | 2.05% | | | | 2.06% |
| Expenses net of fee waivers, | | | | | | | | | | | | | | | | | | |
| if any | | 1.33% | | | | 1.50% | | | | 1.54% | | | | 1.69% | | | | 1.75% |
| Expenses net of all | | | | | | | | | | | | | | | | | | |
| reductions | | 1.25% | | | | 1.45% | | | | 1.47% | | | | 1.49% | | | | 1.71% |
| Net investment income (loss) | | (.63)%D | | | | (1.03)% | | | | (.89)% | | | | (1.07)% | | | | (.14)% |
| Supplemental Data | | | | | | | | | | | | | | | | | | |
| Net assets, end of period | | | | | | | | | | | | | | | | | | |
| (000 omitted) | | $ 7,206 | | $ | | 6,227 | | $ | | 4,177 | | $ | | 2,620 | | $ | | 3,320 |
| Portfolio turnover rate | | 213% | | | | 94% | | | | 158% | | | | 473% | | | | 481% |
A Total returns would have been lower had certain expenses not been reduced during the periods shown.
B Total returns do not include the effect of the sales charges.
C Calculated based on average shares outstanding during the period.
D Investment income per share reflects a special dividend which amounted to $.01 per share. Excluding the special dividend, the ratio of net
investment income to average net assets would have been (.69)%.
E Expense ratios reflect operating expenses of the class. Expenses before reductions do not reflect amounts reimbursed by the investment adviser or
reductions from brokerage service arrangements or other expense offset arrangements and do not represent the amount paid by the class during
periods when reimbursements or reductions occur. Expenses net of fee waivers reflect expenses after reimbursement by the investment adviser but
prior to reductions from brokerage service arrangements or other expense offset arrangements. Expenses net of all reductions represent the net
expenses paid by the class.
|
See accompanying notes which are an integral part of the financial statements.
| Financial Highlights Class T | | | | | | | | |
| Years ended November 30, | | 2005 | | 2004 | | 2003 | | 2002 | | 2001 |
| Selected Per Share Data | | | | | | | | | | |
| Net asset value, beginning of | | | | | | | | | | |
| period | | $ 8.52 | | $ 7.95 | | $ 6.43 | | $ 8.06 | | $ 9.05 |
| Income from Investment | | | | | | | | | | |
| Operations | | | | | | | | | | |
| Net investment income | | | | | | | | | | |
| (loss)C | | (.08)D | | (.11) | | (.08) | | (.10) | | (.03) |
| Net realized and unrealized | | | | | | | | | | |
| gain (loss) | | 85 | | .68 | | 1.60 | | (1.53) | | (.95) |
| Total from investment | | | | | | | | | | |
| operations | | 77 | | .57 | | 1.52 | | (1.63) | | (.98) |
| Distributions from net realized | | | | | | | | | | |
| gain | | — | | — | | — | | — | | (.01) |
| Net asset value, end of period | | $ 9.29 | | $ 8.52 | | $ 7.95 | | $ 6.43 | | $ 8.06 |
| Total ReturnA,B | | 9.04% | | 7.17% | | 23.64% | | (20.22)% | | (10.84)% |
| Ratios to Average Net AssetsE | | | | | | | | | | |
| Expenses before reductions . | | 1.93% | | 2.25% | | 2.47% | | 2.16% | | 2.30% |
| Expenses net of fee waivers, | | | | | | | | | | |
| if any | | 1.58% | | 1.75% | | 1.79% | | 1.92% | | 2.00% |
| Expenses net of all | | | | | | | | | | |
| reductions | | 1.50% | | 1.71% | | 1.72% | | 1.72% | | 1.96% |
| Net investment income (loss) | | (.88)%D | | (1.28)% | | (1.14)% | | (1.29)% | | (.39)% |
| Supplemental Data | | | | | | | | | | |
| Net assets, end of period | | | | | | | | | | |
| (000 omitted) | | $16,331 | | $15,101 | | $12,458 | | $10,511 | | $14,165 |
| Portfolio turnover rate | | 213% | | 94% | | 158% | | 473% | | 481% |
A Total returns would have been lower had certain expenses not been reduced during the periods shown.
B Total returns do not include the effect of the sales charges.
C Calculated based on average shares outstanding during the period.
D Investment income per share reflects a special dividend which amounted to $.01 per share. Excluding the special dividend, the ratio of net
investment income to average net assets would have been (.94)%.
E Expense ratios reflect operating expenses of the class. Expenses before reductions do not reflect amounts reimbursed by the investment adviser or
reductions from brokerage service arrangements or other expense offset arrangements and do not represent the amount paid by the class during
periods when reimbursements or reductions occur. Expenses net of fee waivers reflect expenses after reimbursement by the investment adviser but
prior to reductions from brokerage service arrangements or other expense offset arrangements. Expenses net of all reductions represent the net
expenses paid by the class.
|
See accompanying notes which are an integral part of the financial statements.
21 Annual Report
| Financial Highlights Class B | | | | | | | | | | | | | | | | |
| Years ended November 30, | | 2005 | | | | 2004 | | | | 2003 | | | | 2002 | | | | 2001 |
| Selected Per Share Data | | | | | | | | | | | | | | | | | | |
| Net asset value, beginning of | | | | | | | | | | | | | | | | | | |
| period | | $ 8.36 | | $ | | 7.84 | | $ | | 6.37 | | $ | | 8.02 | | $ | | 9.05 |
| Income from Investment | | | | | | | | | | | | | | | | | | |
| Operations | | | | | | | | | | | | | | | | | | |
| Net investment income | | | | | | | | | | | | | | | | | | |
| (loss)C | | (.12)D | | | | (.14) | | | | (.11) | | | | (.13) | | | | (.08) |
| Net realized and unrealized | | | | | | | | | | | | | | | | | | |
| gain (loss) | | 83 | | | | .66 | | | | 1.58 | | | | (1.52) | | | | (.94) |
| Total from investment | | | | | | | | | | | | | | | | | | |
| operations | | 71 | | | | .52 | | | | 1.47 | | | | (1.65) | | | | (1.02) |
| Distributions from net realized | | | | | | | | | | | | | | | | | | |
| gain | | — | | | | — | | | | — | | | | — | | | | (.01) |
| Net asset value, end of period | | $ 9.07 | | $ | | 8.36 | | $ | | 7.84 | | $ | | 6.37 | | $ | | 8.02 |
| Total ReturnA,B | | 8.49% | | | | 6.63% | | | | 23.08% | | | | (20.57)% | | | | (11.29)% |
| Ratios to Average Net AssetsE | | | | | | | | | | | | | | | | | | |
| Expenses before reductions . | | 2.35% | | | | 2.67% | | | | 2.92% | | | | 2.73% | | | | 2.86% |
| Expenses net of fee waivers, | | | | | | | | | | | | | | | | | | |
| if any | | 2.09% | | | | 2.25% | | | | 2.25% | | | | 2.43% | | | | 2.50% |
| Expenses net of all | | | | | | | | | | | | | | | | | | |
| reductions | | 2.00% | | | | 2.21% | | | | 2.18% | | | | 2.23% | | | | 2.46% |
| Net investment income (loss) | | (1.38)%D | | | | (1.78)% | | | | (1.60)% | | | | (1.81)% | | | | (.89)% |
| Supplemental Data | | | | | | | | | | | | | | | | | | |
| Net assets, end of period | | | | | | | | | | | | | | | | | | |
| (000 omitted) | | $ 9,237 | | $ | | 9,593 | | $ | | 8,422 | | $ | | 6,262 | | $ | | 8,038 |
| Portfolio turnover rate | | 213% | | | | 94% | | | | 158% | | | | 473% | | | | 481% |
A Total returns would have been lower had certain expenses not been reduced during the periods shown.
B Total returns do not include the effect of the contingent deferred sales charge.
C Calculated based on average shares outstanding during the period.
D Investment income per share reflects a special dividend which amounted to $.01 per share. Excluding the special dividend, the ratio of net
investment income to average net assets would have been (1.44)% .
E Expense ratios reflect operating expenses of the class. Expenses before reductions do not reflect amounts reimbursed by the investment adviser or
reductions from brokerage service arrangements or other expense offset arrangements and do not represent the amount paid by the class during
periods when reimbursements or reductions occur. Expenses net of fee waivers reflect expenses after reimbursement by the investment adviser but
prior to reductions from brokerage service arrangements or other expense offset arrangements. Expenses net of all reductions represent the net
expenses paid by the class.
|
See accompanying notes which are an integral part of the financial statements.
| Financial Highlights Class C | | | | | | | | | | | | | | | | |
| Years ended November 30, | | 2005 | | | | 2004 | | | | 2003 | | | | 2002 | | | | 2001 |
| Selected Per Share Data | | | | | | | | | | | | | | | | | | |
| Net asset value, beginning of | | | | | | | | | | | | | | | | | | |
| period | | $ 8.37 | | $ | | 7.85 | | $ | | 6.38 | | $ | | 8.03 | | $ | | 9.05 |
| Income from Investment | | | | | | | | | | | | | | | | | | |
| Operations | | | | | | | | | | | | | | | | | | |
| Net investment income | | | | | | | | | | | | | | | | | | |
| (loss)C | | (.12)D | | | | (.14) | | | | (.11) | | | | (.13) | | | | (.08) |
| Net realized and unrealized | | | | | | | | | | | | | | | | | | |
| gain (loss) | | 83 | | | | .66 | | | | 1.58 | | | | (1.52) | | | | (.93) |
| Total from investment | | | | | | | | | | | | | | | | | | |
| operations | | 71 | | | | .52 | | | | 1.47 | | | | (1.65) | | | | (1.01) |
| Distributions from net realized | | | | | | | | | | | | | | | | | | |
| gain | | — | | | | — | | | | — | | | | — | | | | (.01) |
| Net asset value, end of period | | $ 9.08 | | $ | | 8.37 | | $ | | 7.85 | | $ | | 6.38 | | $ | | 8.03 |
| Total ReturnA,B | | 8.48% | | | | 6.62% | | | | 23.04% | | | | (20.55)% | | | | (11.18)% |
| Ratios to Average Net AssetsE | | | | | | | | | | | | | | | | | | |
| Expenses before reductions . | | 2.34% | | | | 2.52% | | | | 2.77% | | | | 2.58% | | | | 2.79% |
| Expenses net of fee waivers, | | | | | | | | | | | | | | | | | | |
| if any | | 2.09% | | | | 2.25% | | | | 2.25% | | | | 2.36% | | | | 2.50% |
| Expenses net of all | | | | | | | | | | | | | | | | | | |
| reductions | | 2.01% | | | | 2.21% | | | | 2.18% | | | | 2.16% | | | | 2.46% |
| Net investment income (loss) | | (1.38)%D | | | | (1.78)% | | | | (1.61)% | | | | (1.74)% | | | | (.89)% |
| Supplemental Data | | | | | | | | | | | | | | | | | | |
| Net assets, end of period | | | | | | | | | | | | | | | | | | |
| (000 omitted) | | $ 7,791 | | $ | | 9,136 | | $ | | 8,427 | | $ | | 6,636 | | $ | | 8,532 |
| Portfolio turnover rate | | 213% | | | | 94% | | | | 158% | | | | 473% | | | | 481% |
A Total returns would have been lower had certain expenses not been reduced during the periods shown.
B Total returns do not include the effect of the contingent deferred sales charge.
C Calculated based on average shares outstanding during the period.
D Investment income per share reflects a special dividend which amounted to $.01 per share. Excluding the special dividend, the ratio of net
investment income to average net assets would have been (1.44)% .
E Expense ratios reflect operating expenses of the class. Expenses before reductions do not reflect amounts reimbursed by the investment adviser or
reductions from brokerage service arrangements or other expense offset arrangements and do not represent the amount paid by the class during
periods when reimbursements or reductions occur. Expenses net of fee waivers reflect expenses after reimbursement by the investment adviser but
prior to reductions from brokerage service arrangements or other expense offset arrangements. Expenses net of all reductions represent the net
expenses paid by the class.
|
See accompanying notes which are an integral part of the financial statements.
23 Annual Report
| Financial Highlights Institutional Class | | | | | | | | | | | | |
| Years ended November 30, | | | | 2005 | | | | 2004 | | | | 2003 | | | | 2002 | | | | 2001 |
| Selected Per Share Data | | | | | | | | | | | | | | | | | | | | |
| Net asset value, beginning of | | | | | | | | | | | | | | | | | | | | |
| period | | $ | | 8.73 | | $ | | 8.10 | | $ | | 6.52 | | $ | | 8.11 | | $ | | 9.06 |
| Income from Investment | | | | | | | | | | | | | | | | | | | | |
| Operations | | | | | | | | | | | | | | | | | | | | |
| Net investment income | | | | | | | | | | | | | | | | | | | | |
| (loss)B | | | | (.03)C | | | | (.07) | | | | (.04) | | | | (.05) | | | | .01 |
| Net realized and unrealized | | | | | | | | | | | | | | | | | | | | |
| gain (loss) | | | | 87 | | | | .70 | | | | 1.62 | | | | (1.54) | | | | (.95) |
| Total from investment | | | | | | | | | | | | | | | | | | | | |
| operations | | | | 84 | | | | .63 | | | | 1.58 | | | | (1.59) | | | | (.94) |
| Distributions from net realized | | | | | | | | | | | | | | | | | | | | |
| gain | | | | — | | | | — | | | | — | | | | — | | | | (.01) |
| Net asset value, end of period | | $ | | 9.57 | | $ | | 8.73 | | $ | | 8.10 | | $ | | 6.52 | | $ | | 8.11 |
| Total ReturnA | | | | 9.62% | | | | 7.78% | | | | 24.23% | | | | (19.61)% | | | | (10.39)% |
| Ratios to Average Net AssetsD | | | | | | | | | | | | | | | | | | | | |
| Expenses before reductions . | | | | 1.28% | | | | 1.35% | | | | 1.61% | | | | 1.43% | | | | 1.73% |
| Expenses net of fee waivers, | | | | | | | | | | | | | | | | | | | | |
| if any | | | | 1.09% | | | | 1.25% | | | | 1.25% | | | | 1.27% | | | | 1.50% |
| Expenses net of all | | | | | | | | | | | | | | | | | | | | |
| reductions | | | | 1.01% | | | | 1.20% | | | | 1.18% | | | | 1.07% | | | | 1.46% |
| Net investment income (loss) | | | | (.38)%C | | | | (.78)% | | | | (.61)% | | | | (.64)% | | | | .11% |
| Supplemental Data | | | | | | | | | | | | | | | | | | | | |
| Net assets, end of period | | | | | | | | | | | | | | | | | | | | |
| (000 omitted) | | $ | | 522 | | $ | | 648 | | $ | | 579 | | $ | | 513 | | $ | | 761 |
| Portfolio turnover rate | | | | 213% | | | | 94% | | | | 158% | | | | 473% | | | | 481% |
A Total returns would have been lower had certain expenses not been reduced during the periods shown.
B Calculated based on average shares outstanding during the period.
C Investment income per share reflects a special dividend which amounted to $.01 per share. Excluding the special dividend, the ratio of net
investment income to average net assets would have been (.44)%.
D Expense ratios reflect operating expenses of the class. Expenses before reductions do not reflect amounts reimbursed by the investment adviser or
reductions from brokerage service arrangements or other expense offset arrangements and do not represent the amount paid by the class during
periods when reimbursements or reductions occur. Expenses net of fee waivers reflect expenses after reimbursement by the investment adviser but
prior to reductions from brokerage service arrangements or other expense offset arrangements. Expenses net of all reductions represent the net
expenses paid by the class.
|
See accompanying notes which are an integral part of the financial statements.
Notes to Financial Statements
For the period ended November 30, 2005
1. Significant Accounting Policies.
Fidelity Advisor Aggressive Growth Fund (the fund) is a fund of Fidelity Securities Fund (the trust) and is authorized to issue an unlimited number of shares. The trust is regis tered under the Investment Company Act of 1940, as amended (the 1940 Act), as an open end management investment company organized as a Massachusetts business trust.
The fund offers Class A, Class T, Class B, Class C and Institutional Class shares, each of which has equal rights as to assets and voting privileges. Each class has exclusive voting rights with respect to matters that affect that class. Class B shares will automatically convert to Class A shares after a holding period of seven years from the initial date of purchase. Investment income, realized and unrealized capital gains and losses, the common expenses of the fund, and certain fund level expense reductions, if any, are allocated on a pro rata basis to each class based on the relative net assets of each class to the total net assets of the fund. Each class differs with respect to transfer agent and distribution and service plan fees incurred. Certain expense reductions also differ by class.
The fund may invest in affiliated money market central funds (Money Market Central Funds) which are open end investment companies available to investment companies and other accounts managed by Fidelity Management & Research Company (FMR) and its affiliates. The financial statements have been prepared in conformity with accounting principles generally accepted in the United States of America, which require manage ment to make certain estimates and assumptions at the date of the financial statements. The following summarizes the significant accounting policies of the fund:
Security Valuation. Investments are valued and net asset value (NAV) per share is calculated (NAV calculation) as of the close of business of the New York Stock Exchange (NYSE), normally 4:00 p.m. Eastern time. Wherever possible, the fund uses independent pricing services approved by the Board of Trustees to value its investments.
Equity securities, including restricted securities, for which market quotations are readily available, are valued at the last reported sale price or official closing price as reported by an independent pricing service on the primary market or exchange on which they are traded. In the event there were no sales during the day or closing prices are not available, securities are valued at the last quoted bid price. Investments in open end mutual funds are valued at their closing net asset value each business day. Short term securities with remaining maturities of sixty days or less for which quotations are not readily available are valued at amortized cost, which approximates value.
When current market prices or quotations are not readily available or do not accurately reflect fair value, valuations may be determined in accordance with procedures adopted by the Board of Trustees. For example, when developments occur between the close of a
25 Annual Report
Notes to Financial Statements continued
1. Significant Accounting Policies continued
Security Valuation - continued
market and the close of the NYSE that may materially affect the value of some or all of the securities, or when trading in a security is halted, those securities may be fair valued. Factors used in the determination of fair value may include monitoring news to identify significant market or security specific events such as changes in the value of U.S. securi ties market, reviewing developments in foreign markets and evaluating the performance of ADRs, futures contracts and exchange traded funds. Because the fund’s utilization of fair value pricing depends on market activity, the frequency with which fair value pricing is used can not be predicted and may be utilized to a significant extent. The value of securities used for NAV calculation under fair value pricing may differ from published prices for the same securities.
Foreign Currency. The fund uses foreign currency contracts to facilitate transactions in foreign denominated securities. Losses from these transactions may arise from changes in the value of the foreign currency or if the counterparties do not perform under the contracts’ terms.
Foreign denominated assets, including investment securities, and liabilities are trans lated into U.S. dollars at the exchange rate at period end. Purchases and sales of invest ment securities, income and dividends received and expenses denominated in foreign currencies are translated into U.S. dollars at the exchange rate in effect on the transac tion date.
The effects of exchange rate fluctuations on investments are included with the net realized and unrealized gain (loss) on investment securities. Other foreign currency transactions resulting in realized and unrealized gain (loss) are disclosed separately.
Investment Transactions and Income. Security transactions are accounted for as of trade date. Gains and losses on securities sold are determined on the basis of identified cost and may include proceeds received from litigation. Dividend income is recorded on the ex dividend date, except for certain dividends from foreign securities where the ex dividend date may have passed, which are recorded as soon as the fund is informed of the ex dividend date. Non cash dividends included in dividend income, if any, are recorded at the fair market value of the securities received. Distributions received on securities that represent a return of capital or capital gain are recorded as a reduction of cost of investments and/or as a realized gain. The fund estimates the components of distributions received that may be considered return of capital distributions or capital gain distributions. Large, non recurring dividends recognized by the fund are presented separately on the Statement of Operations as “Special Dividends” and the impact of these dividends to net investment income per share is presented in the Financial Highlights. Interest income is accrued as earned. Interest income includes coupon interest and
1. Significant Accounting Policies continued
Investment Transactions and Income continued
amortization of premium and accretion of discount on debt securities. Investment income is recorded net of foreign taxes withheld where recovery of such taxes is uncertain.
Expenses. Most expenses of the trust can be directly attributed to a fund. Expenses which cannot be directly attributed are apportioned among each fund in the trust.
Income Tax Information and Distributions to Shareholders. Each year, the fund intends to qualify as a regulated investment company by distributing all of its taxable income and realized gains under Subchapter M of the Internal Revenue Code. As a result, no provision for income taxes is required in the accompanying financial statements. Foreign taxes are provided for based on the fund’s understanding of the tax rules and rates that exist in the foreign markets in which it invests.
Distributions are recorded on the ex dividend date. Income dividends and capital gain distributions are declared separately for each class. Income and capital gain distribu tions are determined in accordance with income tax regulations, which may differ from generally accepted accounting principles.
Capital accounts within the financial statements are adjusted for permanent book tax differences. These adjustments have no impact on net assets or the results of operations. Temporary book tax differences will reverse in a subsequent period.
Book tax differences are primarily due to foreign currency transactions, net operating losses, capital loss carryforwards and losses deferred due to wash sales.
The tax basis components of distributable earnings and the federal tax cost as of period end were as follows:
| Unrealized appreciation | | $ | | 3,856,048 |
| Unrealized depreciation | | | | (2,231,737) |
| Net unrealized appreciation (depreciation) | | | | 1,624,311 |
| Capital loss carryforward | | | | (4,868,687) |
| |
| Cost for federal income tax purposes | | $ | | 39,365,250 |
| |
| |
| 2. Operating Policies. | | | | |
Repurchase Agreements. Fidelity Management & Research Company (FMR) has received an Exemptive Order from the Securities and Exchange Commission (the SEC) which permits the fund and other affiliated entities of FMR to transfer uninvested cash balances into joint trading accounts which are then invested in repurchase agreements. The fund may also invest directly with institutions in repurchase agreements.
27 Annual Report
Notes to Financial Statements continued
2. Operating Policies continued
Repurchase Agreements continued
Repurchase agreements are collateralized by government or non government securities. Collateral is held in segregated accounts with custodian banks and may be obtained in the event of a default of the counterparty. The fund monitors, on a daily basis, the value of the collateral to ensure it is at least equal to the principal amount of the repurchase agreement (including accrued interest). In the event of a default by the counterparty, realization of the collateral proceeds could be delayed, during which time the value of the collateral may decline.
Restricted Securities. The fund may invest in securities that are subject to legal or contractual restrictions on resale. These securities generally may be resold in transac tions exempt from registration or to the public if the securities are registered. Disposal of these securities may involve time consuming negotiations and expense, and prompt sale at an acceptable price may be difficult. Information regarding restricted securities is included at the end of the fund’s Schedule of Investments.
3. Purchases and Sales of Investments.
Purchases and sales of securities, other than short term securities and U.S. government securities, aggregated $83,741,320 and $86,961,259, respectively.
4. Fees and Other Transactions with Affiliates.
Management Fee. FMR and its affiliates provide the fund with investment manage ment related services for which the fund pays a monthly management fee. The manage ment fee is the sum of an individual fund fee rate that is based on an annual rate of .35% of the fund’s average net assets and a group fee rate that averaged .27% during the period. The group fee rate is based upon the average net assets of all the mutual funds advised by FMR. The group fee rate decreases as assets under management increase and increases as assets under management decrease. For the period, the total annual man agement fee rate was .62% of the fund’s average net assets.
Distribution and Service Plan. In accordance with Rule 12b 1 of the 1940 Act, the fund has adopted separate Distribution and Service Plans for each class of shares. Certain classes pay Fidelity Distributors Corporation (FDC), an affiliate of FMR, separate Distribution and Service Fees, each of which is based on an annual percentage of each class’ average net assets. In addition, FDC may pay financial intermediaries for selling shares of the fund and providing shareholder support services. For the period, the
| 4. Fees and Other Transactions with Affiliates continued |
Distribution and Service Plan continued | | |
Distribution and Service Fee rates and the total amounts paid to and retained by FDC were as follows:
| | | Distribution | | Service | | | | Paid to | | | | Retained |
| | | Fee | | Fee | | | | FDC | | | | by FDC |
| Class A | | 0% | | .25% | | $ | | 16,640 | | $ | | 84 |
| Class T | | 25% | | .25% | | | | 78,040 | | | | 55 |
| Class B | | 75% | | .25% | | | | 91,900 | | | | 68,924 |
| Class C | | 75% | | .25% | | | | 80,605 | | | | 9,071 |
| | | | | | | $ | | 267,185 | | $ | | 78,134 |
Sales Load. FDC receives a front end sales charge of up to 5.75% for selling Class A shares, and 3.50% for selling Class T shares, some of which is paid to financial intermedi aries for selling shares of the fund. FDC receives the proceeds of contingent deferred sales charges levied on Class A, Class T, Class B, and Class C redemptions. These charges depend on the holding period. The deferred sales charges range from 5% to 1% for Class B, 1% for Class C, and .25% for certain purchases of Class A and Class T shares.
| For the period, sales charge amounts retained by FDC were as follows: | | |
| | | | | Retained |
| | | | | by FDC |
| Class A | | | $ | 9,510 |
| Class T | | | | 12,616 |
| Class B* | | | | 37,989 |
| Class C* | | | | 1,521 |
| | | | $ | 61,636 |
* When Class B and Class C shares are initially sold, FDC pays commissions from its own resources to financial intermediaries through which the sales are made.
Transfer Agent Fees. Fidelity Investments Institutional Operations Company, Inc. (FIIOC), an affiliate of FMR, is the transfer, dividend disbursing and shareholder servic ing agent for each class of the fund. FIIOC receives account fees and asset based fees that vary according to the account size and type of account of the shareholders of the respective classes of the fund. FIIOC pays for typesetting, printing and mailing of share holder reports, except proxy statements. For the period the total transfer agent fees paid
29 Annual Report
| Notes to Financial Statements continued | | |
| |
| 4. Fees and Other Transactions with Affiliates continued |
| |
| Transfer Agent Fees continued | | | | | | |
| |
by each class to FIIOC, were as follows:
| | | | | | |
| | | | | | | % of Average |
| | | | | Amount | | Net Assets |
| Class A | | $ | | 25,250 | | .38 |
| Class T | | | | 71,752 | | .46 |
| Class B | | | | 34,699 | | .38 |
| Class C | | | | 29,674 | | .37 |
| Institutional Class | | | | 1,738 | | .31 |
| | | $ | | 163,113 | | |
Accounting and Security Lending Fees. Fidelity Service Company, Inc. (FSC), an affiliate of FMR, maintains the fund’s accounting records. The accounting fee is based on the level of average net assets for the month. Under a separate contract, FSC administers the security lending program. The security lending fee is based on the number and duration of lending transactions.
Affiliated Central Funds. The fund may invest in Money Market Central Funds which seek preservation of capital and current income and are managed by Fidelity Invest ments Money Management, Inc. (FIMM), an affiliate of FMR.
The Money Market Central Funds do not pay a management fee.
Brokerage Commissions. The fund placed a portion of its portfolio transactions with brokerage firms which are affiliates of the investment adviser. The commissions paid to these affiliated firms were $2,250 for the period.
5. Committed Line of Credit.
|
The fund participates with other funds managed by FMR in a $4.2 billion credit facility (the “line of credit”) to be utilized for temporary or emergency purposes to fund share holder redemptions or for other short term liquidity purposes. The fund has agreed to pay commitment fees on its pro rata portion of the line of credit. During the period, there were no borrowings on this line of credit.
The fund lends portfolio securities from time to time in order to earn additional income. The fund receives collateral (in the form of U.S. Treasury obligations, letters of credit and/or cash) against the loaned securities and maintains collateral in an amount not less than 100% of the market value of the loaned securities during the period of the loan. The market value of the loaned securities is determined at the close of business of the fund
6. Security Lending continued
and any additional required collateral is delivered to the fund on the next business day. If the borrower defaults on its obligation to return the securities loaned because of insol vency or other reasons, a fund could experience delays and costs in recovering the securities loaned or in gaining access to the collateral. Cash collateral is invested in the Fidelity Securities Lending Cash Central Fund. The value of loaned securities and cash collateral at period end are disclosed on the fund’s Statement of Assets and Liabilities. Security lending income represents the income earned on investing cash collateral, less fees and expenses associated with the loan, plus any premium payments that may be received on the loan of certain types of securities.
FMR voluntarily agreed to reimburse each class to the extent annual operating expenses exceeded certain levels of average net assets as noted in the table below. Some expenses, for example interest expense, are excluded from this reimbursement.
| The following classes were in reimbursement during the period: | | | | |
| | | Expense | | | | Reimbursement |
| | | Limitations | | | | from adviser |
| Class A | | 1.50% - 1.30%* | | $ | | 17,727 |
| Class T | | 1.75% - 1.55%* | | | | 53,916 |
| Class B | | 2.25% - 2.05%* | | | | 24,000 |
| Class C | | 2.25% - 2.05%* | | | | 20,183 |
| Institutional Class | | 1.25% - 1.05%* | | | | 1,073 |
| | | | | | | | | $ | | 116,899 |
| * Expense limitation in effect at period end. | | | | | | | | | | |
Many of the brokers with whom FMR places trades on behalf of the fund provided services to the fund in addition to trade execution. These services included payments of certain expenses on behalf of the fund totaling $33,432 for the period.
The fund’s organizational documents provide former and current trustees and officers with a limited indemnification against liabilities arising in connection with the perfor mance of their duties to the fund. In the normal course of business, the fund may also enter into contracts that provide general indemnifications. The fund’s maximum expo sure under these arrangements is unknown as this would be dependent on future claims that may be made against the fund. The risk of material loss from such claims is considered remote.
31 Annual Report
| Notes to Financial Statements continued | | | | |
| |
| 9. Share Transactions. | | | | | | | | | | |
| |
| Transactions for each class of shares were as follows: | | | | | | | | |
| |
| | | Shares | | | | Dollars |
| Years ended November 30, | | 2005 | | 2004 | | | | 2005 | | | | 2004 |
| Class A | | | | | | | | | | | | |
| Shares sold | | 270,002 | | 377,272 | | $ | | 2,351,220 | | $ | | 3,139,679 |
| Shares redeemed | | (227,735) | | (175,236) | | | | (2,008,944) | | | | (1,453,350) |
| Net increase (decrease) . | | 42,267 | | 202,036 | | $ | | 342,276 | | $ | | 1,686,329 |
| Class T | | | | | | | | | | | | |
| Shares sold | | 613,840 | | 758,262 | | $ | | 5,303,116 | | $ | | 6,209,847 |
| Shares redeemed | | (628,481) | | (552,792) | | | | (5,486,557) | | | | (4,525,646) |
| Net increase (decrease) . | | (14,641) | | 205,470 | | $ | | (183,441) | | $ | | 1,684,201 |
| Class B | | | | | | | | | | | | |
| Shares sold | | 183,867 | | 359,634 | | $ | | 1,559,053 | | $ | | 2,916,093 |
| Shares redeemed | | (313,200) | | (286,300) | | | | (2,654,466) | | | | (2,305,579) |
| Net increase (decrease) . | | (129,333) | | 73,334 | | $ | | (1,095,413) | | $ | | 610,514 |
| Class C | | | | | | | | | | | | |
| Shares sold | | 159,513 | | 368,284 | | $ | | 1,357,035 | | $ | | 2,975,514 |
| Shares redeemed | | (393,180) | | (350,351) | | | | (3,315,155) | | | | (2,819,767) |
| Net increase (decrease) . | | (233,667) | | 17,933 | | $ | | (1,958,120) | | $ | | 155,747 |
| Institutional Class | | | | | | | | | | | | |
| Shares sold | | 10,062 | | 22,481 | | $ | | 90,084 | | $ | | 187,161 |
| Shares redeemed | | (29,827) | | (19,658) | | | | (255,712) | | | | (162,550) |
| Net increase (decrease) . | | (19,765) | | 2,823 | | $ | | (165,628) | | $ | | 24,611 |
Report of Independent Registered Public Accounting Firm
To the Trustees of Fidelity Securities Fund and the Shareholders of Fidelity Advisor Aggressive Growth Fund:
In our opinion, the accompanying statement of assets and liabilities, including the sched ule of investments, and the related statements of operations and of changes in net assets and the financial highlights present fairly, in all material respects, the financial position of Fidelity Advisor Aggressive Growth Fund (a fund of Fidelity Securities Fund) at Novem ber 30, 2005 and the results of its operations, the changes in its net assets and the financial highlights for the periods indicated, in conformity with accounting principles generally accepted in the United States of America. These financial statements and financial highlights (hereafter referred to as “financial statements”) are the responsibility of the Fidelity Advisor Aggressive Growth Fund’s management; our responsibility is to express an opinion on these financial statements based on our audits. We conducted our audits of these financial statements in accordance with the standards of the Public Company Accounting Oversight Board (United States). Those standards require that we plan and perform the audit to obtain reasonable assurance about whether the financial statements are free of material misstatement. An audit includes examining, on a test basis, evidence supporting the amounts and disclosures in the financial statements, assessing the accounting principles used and significant estimates made by management, and evaluating the overall financial statement presentation. We believe that our audits, which included confirmation of securities at November 30, 2005 by correspondence with the custodian and brokers, provide a reasonable basis for our opinion.
/s/ PricewaterhouseCoopers LLP
PricewaterhouseCoopers LLP
Boston, Massachusetts
January 17, 2006
|
33 Annual Report
Trustees and Officers
The Trustees, Members of the Advisory Board, and executive officers of the trust and fund, as applicable, are listed below. The Board of Trustees governs the fund and is responsible for protecting the interests of shareholders. The Trustees are experienced executives who meet periodically throughout the year to oversee the fund’s activities, review contractual arrangements with companies that provide services to the fund, and review the fund’s performance. Except for William O. McCoy, each of the Trustees oversees 326 funds advised by FMR or an affiliate. Mr. McCoy oversees 328 funds advised by FMR or an affiliate.
The Trustees hold office without limit in time except that (a) any Trustee may resign; (b) any Trustee may be removed by written instrument, signed by at least two thirds of the number of Trustees prior to such removal; (c) any Trustee who requests to be retired or who has become incapacitated by illness or injury may be retired by written instru ment signed by a majority of the other Trustees; and (d) any Trustee may be removed at any special meeting of shareholders by a two thirds vote of the outstanding voting securities of the trust. Each Trustee who is not an interested person (as defined in the 1940 Act) (Independent Trustee), shall retire not later than the last day of the calendar year in which his or her 72nd birthday occurs. The Independent Trustees may waive this mandatory retirement age policy with respect to individual Trustees. The executive officers and Advisory Board Members hold office without limit in time, except that any officer and Advisory Board Member may resign or may be removed by a vote of a majority of the Trustees at any regular meeting or any special meeting of the Trustees. Except as indicated, each individual has held the office shown or other offices in the same company for the past five years.
The fund’s Statement of Additional Information (SAI) includes more information about the Trustees. To request a free copy, call Fidelity at 1-877-208-0098.
Correspondence intended for each Trustee who is an interested person may be sent to Fidelity Investments, 82 Devonshire Street, Boston, Massachusetts 02109.
| | Name, Age; Principal Occupation
Edward C. Johnson 3d (75)
|
Year of Election or Appointment: 1984
Mr. Johnson is Chairman of the Board of Trustees. Mr. Johnson serves as Chief Executive Officer, Chairman, and a Director of FMR Corp.; a Di rector and Chairman of the Board and of the Executive Committee of FMR; Chairman and a Director of Fidelity Management & Research (Far East) Inc.; Chairman and a Director of Fidelity Investments Money Man agement, Inc.; and Chairman (2001 present) and a Director (2000 present) of FMR Co., Inc.
| | Name, Age; Principal Occupation
Stephen P. Jonas (52)
|
Year of Election or Appointment: 2005
Mr. Jonas is Senior Vice President of Advisor Aggressive Growth (2005 present). He also serves as Senior Vice President of other Fidelity funds (2005 present). Mr. Jonas is Executive Director of FMR
(2005 present). Previously, Mr. Jonas served as President of Fidelity En terprise Operations and Risk Services (2004 2005), Chief Administra tive Officer (2002 2004), and Chief Financial Officer of FMR Co. (1998 2000). Mr. Jonas has been with Fidelity Investments since 1987 and has held various financial and management positions including Chief Financial Officer of FMR. In addition, he serves on the Boards of Boston Ballet (2003 present) and Simmons College (2003 present).
Year of Election or Appointment: 2003
Mr. Reynolds is a Director (2003 present) and Chief Operating Officer (2002 present) of FMR Corp. He also serves on the Board at Fidelity Investments Canada, Ltd. (2000 present). Previously, Mr. Reynolds served as President of Fidelity Investments Institutional Retirement Group (1996 2000).
* Trustees have been determined to be “Interested Trustees” by virtue of, among other things, their affiliation with the trust or various entities under common control with FMR.
35 Annual Report
Trustees and Officers - continued
Independent Trustees:
Correspondence intended for each Independent Trustee (that is, the Trustees other than the Interested Trustees) may be sent to Fidelity Investments, P.O. Box 55235, Boston, Massachusetts 02205 5235.
| | Name, Age; Principal Occupation
Dennis J. Dirks (57)
|
Year of Election or Appointment: 2005
Prior to his retirement in May 2003, Mr. Dirks was Chief Operating Officer and a member of the Board of The Depository Trust & Clearing Corporation (DTCC) (1999 2003). He also served as President, Chief Operating Officer, and Board member of The Depository Trust Company (DTC) (1999 2003) and President and Board member of the National Securities Clearing Corporation (NSCC) (1999 2003). In addi tion, Mr. Dirks served as Chief Executive Officer and Board member of the Government Securities Clearing Corporation (2001 2003) and Chief Executive Officer and Board member of the Mortgage Backed Securities Clearing Corporation (2001 2003). Mr. Dirks also serves as a Trustee of Manhattan College (2005 present).
Year of Election or Appointment: 1997
Dr. Gates is Chairman of the Independent Trustees (2006 present). Dr. Gates is President of Texas A&M University (2002 present). He was Director of the Central Intelligence Agency (CIA) from 1991 to 1993. From 1989 to 1991, Dr. Gates served as Assistant to the President of the United States and Deputy National Security Advisor. Dr. Gates is a Director of NACCO Industries, Inc. (mining and manufacturing), Parker Drilling Co., Inc. (drilling and rental tools for the energy industry, 2001 present), and Brinker International (restaurant management, 2003 present). Previously, Dr. Gates served as a Director of LucasVarity PLC (automotive components and diesel engines), a Director of TRW Inc. (automotive, space, defense, and information technology), and Dean of the George Bush School of Government and Public Service at Texas A&M University (1999 2001). Dr. Gates also is a Trustee of the Forum for International Policy.
Name, Age; Principal Occupation
George H. Heilmeier (69)
|
Year of Election or Appointment: 2004
Dr. Heilmeier is Chairman Emeritus of Telcordia Technologies (commu nication software and systems), where prior to his retirement, he served as company Chairman and Chief Executive Officer. He currently serves on the Boards of Directors of The Mitre Corporation (systems engineer ing and information technology support for the government), and HRL Laboratories (private research and development, 2004 present). He is Chairman of the General Motors Science & Technology Advisory Board and a Life Fellow of the Institute of Electrical and Electronics Engineers (IEEE) (2000 present). Dr. Heilmeier is a member of the Defense Science Board and the National Security Agency Advisory Board. He is also a member of the National Academy of Engineering, the American Academy of Arts and Sciences, and the Board of Overseers of the School of Engineering and Applied Science of the University of Pennsyl vania. Previously, Dr. Heilmeier served as a Director of TRW Inc. (auto motive, space, defense, and information technology, 1992 2002), Compaq (1994 2002), Automatic Data Processing, Inc. (ADP) (technology based business outsourcing, 1995 2002), INET Technolo gies Inc. (telecommunications network surveillance, 2001 2004), and Teletech Holdings (customer management services). He is the recipient of the 2005 Kyoto Prize in Advanced Technology for his invention of the liquid display.
Year of Election or Appointment: 2001
Prior to Ms. Knowles’ retirement in June 2000, she served as Executive Vice President and Chief Financial Officer of Atlantic Richfield Company (ARCO) (diversified energy, 1996 2000). From 1993 to 1996, she was a Senior Vice President of ARCO and President of ARCO Transportation Company. She served as a Director of ARCO from 1996 to 1998. She currently serves as a Director of Phelps Dodge Corporation (copper mining and manufacturing) and McKesson Corporation (healthcare ser vice, 2002 present). Ms. Knowles is a Trustee of the Brookings Institution and the Catalina Island Conservancy and also serves as a member of the Advisory Board for the School of Engineering of the University of Southern California.
37 Annual Report
Trustees and Officers - continued
| | Name, Age; Principal Occupation
Ned C. Lautenbach (61)
|
Year of Election or Appointment: 2000
Mr. Lautenbach has been a partner of Clayton, Dubilier & Rice, Inc. (private equity investment firm) since September 1998. Previously, Mr. Lautenbach was with the International Business Machines Corporation (IBM) from 1968 until his retirement in 1998. Mr. Lautenbach serves as a Director of Italtel Holding S.p.A. (telecommunications (Milan, Italy), 2004 present) and Eaton Corporation (diversified industrial) as well as the Philharmonic Center for the Arts in Naples, Florida. He also is a member of the Board of Trustees of Fairfield University (2005 present), as well as a member of the Council on Foreign Relations.
Year of Election or Appointment: 1997
Prior to his retirement in December 1994, Mr. McCoy was Vice Chair man of the Board of BellSouth Corporation (telecommunications) and President of BellSouth Enterprises. He is currently a Director of Liberty Corporation (holding company), Duke Realty Corporation (real estate), and Progress Energy, Inc. (electric utility). He is also a partner of Frank lin Street Partners (private investment management firm) and a member of the Research Triangle Foundation Board. In addition, Mr. McCoy served as the Interim Chancellor (1999 2000) and a member of the Board of Visitors for the University of North Carolina at Chapel Hill and currently serves on the Board of Directors of the University of North Carolina Health Care System and the Board of Visitors of the Kenan Flagler Business School (University of North Carolina at Chapel Hill). He also served as Vice President of Finance for the University of North Car olina (16 school system).
Year of Election or Appointment: 2005
Ms. Small is a member (2000 present) and Chairperson (2002 present) of the Investment Committee, and a member (2002 present) of the Board of Trustees of Smith College. Previously, she served as Chief In vestment Officer (1999 2000), Director of Global Equity Investments (1996 1999), and a member of the Board of Directors of Scudder, Stevens & Clark (1990 1997) and Scudder Kemper Investments (1997 1998). In addition, Ms. Small served as Co Chair (2000 2003) of the Annual Fund for the Fletcher School of Law and Diplomacy.
Name, Age; Principal Occupation
William S. Stavropoulos (66)
|
Year of Election or Appointment: 2002
Mr. Stavropoulos is Chairman of the Board (2000 present) and a Mem ber of the Board of Directors of The Dow Chemical Company. Since joining The Dow Chemical Company in 1967, Mr. Stavropoulos served in numerous senior management positions, including President (1993 2000; 2002 2003), CEO (1995 2000; 2002 2004), and Chair man of the Executive Committee (2000 2004). Currently, he is a Direc tor of NCR Corporation (data warehousing and technology solutions), BellSouth Corporation (telecommunications), Chemical Financial Corpo ration, Maersk Inc. (industrial conglomerate, 2002 present), and Metal mark Capital (private equity investment firm, 2005 present). He also serves as a member of the Board of Trustees of the American Enterprise Institute for Public Policy Research. In addition, Mr. Stavropoulos is a member of The Business Council, J.P. Morgan International Council and the University of Notre Dame Advisory Council for the College of Science.
Year of Election or Appointment: 2005
Prior to his retirement in 2001, Mr. Wolfe was Chairman and Chief Executive Officer of Hershey Foods Corporation (1993 2001). He cur rently serves as a member of the boards of Adelphia Communications Corporation (2003 present), Bausch & Lomb, Inc., and Revlon Inc. (2004 present).
39 Annual Report
Trustees and Officers - continued
Advisory Board Members and Executive Officers:
Correspondence intended for Mr. Gamper may be sent to Fidelity Investments, P.O. Box 55235, Boston, Massachusetts 02205 5235. Correspondence intended for each executive officer and Mr. Lynch may be sent to Fidelity Investments, 82 Devonshire Street, Boston, Massachusetts 02109.
| | Name, Age; Principal Occupation
Albert R. Gamper, Jr. (63)
|
Year of Election or Appointment: 2005
Member of the Advisory Board of Fidelity Securities Fund. Mr. Gamper also serves as a Trustee (2006 present) or Member of the Advisory Board (2005 present) of other investment companies advised by FMR. Prior to his retirement in December 2004, Mr. Gamper served as Chair man of the Board of CIT Group Inc. (commercial finance). During his tenure with CIT Group Inc. Mr. Gamper served in numerous senior man agement positions, including Chairman (1987 1989; 1999 2001; 2002 2004), Chief Executive Officer (1987 2004), and President (1989 2002). He currently serves as a member of the Board of Direc tors of Public Service Enterprise Group (utilities, 2001 present), Chair man of the Board of Governors, Rutgers University (2004 present), and Chairman of the Board of Saint Barnabas Health Care System.
Year of Election or Appointment: 2003
Member of the Advisory Board of Fidelity Securities Fund. Vice Chair man and a Director of FMR, and Vice Chairman (2001 present) and a Director (2000 present) of FMR Co., Inc. Previously, Mr. Lynch served as a Trustee of the Fidelity funds (1990 2003). In addition, he serves as a Trustee of Boston College, Massachusetts Eye & Ear Infirmary, Historic Deerfield, John F. Kennedy Library, and the Museum of Fine Arts of Boston.
Year of Election or Appointment: 2005
Vice President of Advisor Aggressive Growth. Mr. Churchill also serves as Vice President of certain Equity Funds (2005 present) and certain High Income Funds (2005 present). Previously, he served as Head of Fidelity’s Fixed Income Division (2000 2005), Vice President of Fidelity’s Money Market Funds (2000 2005), Vice President of Fidelity’s Bond Funds, and Senior Vice President of FIMM (2000) and FMR. Mr. Chur chill joined Fidelity in 1993 as Vice President and Group Leader of Tax able Fixed Income Investments.
Name, Age; Principal Occupation
Steve Calhoun (34)
|
Year of Election or Appointment: 2005
Vice President of Advisor Aggressive Growth. Mr. Calhoun is also Vice President of other funds advised by FMR. Prior to assuming his current responsibilities, Mr. Calhoun has worked as a research analyst and manager. Mr. Calhoun also serves as Vice President of FMR (2005) and FMR Co., Inc. (2005).
Year of Election or Appointment: 2000
Secretary of Advisor Aggressive Growth. He also serves as Secretary of other Fidelity funds; Vice President, General Counsel, and Secretary of FMR Co., Inc. (2001 present) and FMR; Assistant Secretary of Fidelity Management & Research (U.K.) Inc. (2001 present), Fidelity Manage ment & Research (Far East) Inc. (2001 present), and Fidelity Investments Money Management, Inc. (2001 present). Mr. Roiter is an Adjunct Member, Faculty of Law, at Boston College Law School (2003 present). Previously, Mr. Roiter served as Vice President and Secretary of Fidelity Distributors Corporation (FDC) (1998 2005).
Year of Election or Appointment: 2003
Assistant Secretary of Advisor Aggressive Growth. Mr. Fross also serves as Assistant Secretary of other Fidelity funds (2003 present), Vice Presi dent and Secretary of FDC (2005 present), and is an employee of FMR.
Year of Election or Appointment: 2004
President, Treasurer, and Anti Money Laundering (AML) officer of Advi sor Aggressive Growth. Ms. Reynolds also serves as President, Treasurer, and AML officer of other Fidelity funds (2004) and is a Vice President (2003) and an employee (2002) of FMR. Before joining Fidelity Investments, Ms. Reynolds worked at PricewaterhouseCoopers LLP (PwC) (1980 2002), where she was most recently an audit partner with PwC’s investment management practice.
Year of Election or Appointment: 2005
Chief Financial Officer of Advisor Aggressive Growth. Mr. Murphy also serves as Chief Financial Officer of other Fidelity funds (2005 present). He also serves as Senior Vice President of Fidelity Pricing and Cash Management Services Group (FPCMS).
41 Annual Report
Trustees and Officers - continued
| | Name, Age; Principal Occupation
Kenneth A. Rathgeber (58)
|
Year of Election or Appointment: 2004
Chief Compliance Officer of Advisor Aggressive Growth. Mr. Rathgeber also serves as Chief Compliance Officer of other Fidelity funds (2004) and Executive Vice President of Risk Oversight for Fidelity Investments (2002). Previously, he served as Executive Vice President and Chief Op erating Officer for Fidelity Investments Institutional Services Company, Inc. (1998 2002).
Year of Election or Appointment: 2003
Deputy Treasurer of Advisor Aggressive Growth. Mr. Hebble also serves as Deputy Treasurer of other Fidelity funds (2003), and is an employee of FMR. Before joining Fidelity Investments, Mr. Hebble worked at Deutsche Asset Management where he served as Director of Fund Ac counting (2002 2003) and Assistant Treasurer of the Scudder Funds (1998 2003).
Year of Election or Appointment: 2005
Deputy Treasurer of Advisor Aggressive Growth. Mr. Mehrmann also serves as Deputy Treasurer of other Fidelity funds (2005 present) and is an employee of FMR. Previously, Mr. Mehrmann served as Vice Presi dent of Fidelity Investments Institutional Services Group (FIIS)/Fidelity Investments Institutional Operations Corporation, Inc. (FIIOC) Client Ser vices (1998 2004).
| | Kimberley H. Monasterio (41)
|
Year of Election or Appointment: 2004
Deputy Treasurer of Advisor Aggressive Growth. Ms. Monasterio also serves as Deputy Treasurer of other Fidelity funds (2004) and is an em ployee of FMR (2004). Before joining Fidelity Investments, Ms. Monas terio served as Treasurer (2000 2004) and Chief Financial Officer (2002 2004) of the Franklin Templeton Funds and Senior Vice President of Franklin Templeton Services, LLC (2000 2004).
Year of Election or Appointment: 2005
Deputy Treasurer of Advisor Aggressive Growth. Mr. Robins also serves as Deputy Treasurer of other Fidelity funds (2005 present) and is an employee of FMR (2004 present). Before joining Fidelity Investments, Mr. Robins worked at KPMG LLP, where he was a partner in KPMG’s department of professional practice (2002 2004) and a Senior Manager (1999 2000). In addition, Mr. Robins served as Assistant Chief Accountant, United States Securities and Exchange Commission (2000 2002).
Name, Age; Principal Occupation
Robert G. Byrnes (38)
|
Year of Election or Appointment: 2005
Assistant Treasurer of Advisor Aggressive Growth. Mr. Byrnes also serves as Assistant Treasurer of other Fidelity funds (2005 present) and is an employee of FMR (2005 present). Previously, Mr. Byrnes served as Vice President of FPCMS (2003 2005). Before joining Fidelity Invest ments, Mr. Byrnes worked at Deutsche Asset Management where he served as Vice President of the Investment Operations Group (2000 2003).
Year of Election or Appointment: 2000
Assistant Treasurer of Advisor Aggressive Growth. Mr. Costello also serves as Assistant Treasurer of other Fidelity funds and is an employee of FMR.
Year of Election or Appointment: 2004
Assistant Treasurer of Advisor Aggressive Growth. Mr. Lydecker also serves as Assistant Treasurer of other Fidelity funds (2004) and is an employee of FMR.
Year of Election or Appointment: 2002
Assistant Treasurer of Advisor Aggressive Growth. Mr. Osterheld also serves as Assistant Treasurer of other Fidelity funds (2002) and is an employee of FMR.
Year of Election or Appointment: 2005
Assistant Treasurer of Advisor Aggressive Growth. Mr. Ryan also serves as Assistant Treasurer of other Fidelity funds (2005 present) and is an employee of FMR (2005 present). Previously, Mr. Ryan served as Vice President of Fund Reporting in FPCMS (1999 2005).
Year of Election or Appointment: 2005
Assistant Treasurer of Advisor Aggressive Growth. Mr. Schiavone also serves as Assistant Treasurer of other Fidelity funds (2005 present) and is an employee of FMR (2005 present). Before joining Fidelity Invest ments, Mr. Schiavone worked at Deutsche Asset Management, where he most recently served as Assistant Treasurer (2003 2005) of the Scudder Funds and Vice President and Head of Fund Reporting (1996 2003).
43 Annual Report
Board Approval of Investment Advisory Contracts and Management Fees
Advisor Aggressive Growth Fund
Each year, typically in July, the Board of Trustees, including the independent Trustees (together, the Board), votes on the renewal of the management contract and sub advisory agreements (together, the Advisory Contracts) for the fund. The Board, assisted by the advice of fund counsel and independent Trustees’ counsel, requests and considers a broad range of information throughout the year.
The Board meets regularly each month except August and takes into account throughout the year matters bearing on Advisory Contracts. The Board, acting directly and through its separate committees, considers at each of its meetings factors that are relevant to the annual renewal of the fund’s Advisory Contracts, including the services and support provided to the fund and its shareholders by Fidelity. At the time of the renewal, the Board had 11 standing committees, each composed of independent Trustees with varying backgrounds, to which the Board has assigned specific subject matter responsibilities in order to enhance effective decision making by the Board. Each committee has adopted a written charter outlining the structure and purposes of the committee. One such com mittee, the Equity Contract Committee, meets periodically during the first six months of each year and as necessary to consider matters specifically related to the annual renewal of Advisory Contracts. The committee requests and receives information on, and makes recommendations to the independent Trustees concerning, the approval and annual review of the Advisory Contracts.
At its July 2005 meeting, the Board of Trustees, including the independent Trustees, unanimously determined to renew the Advisory Contracts for the fund. In reaching its determination, the Board considered all factors it believed relevant, including (1) the nature, extent, and quality of the services to be provided to the fund and its shareholders by Fidelity (including the investment performance of the fund); (2) the competitiveness of the management fee and total expenses of the fund; (3) the total costs of the services to be provided by and the profits to be realized by the investment adviser and its affiliates from the relationship with the fund; (4) the extent to which economies of scale would be realized as the fund grows; and (5) whether fee levels reflect these economies of scale, if any, for the benefit of fund shareholders.
In determining whether to renew the Advisory Contracts for the fund, the Board ulti mately reached a determination, with the assistance of fund counsel and independent Trustees’ counsel, that the renewal of the Advisory Contracts and the compensation to be received by Fidelity under the management contract is consistent with Fidelity’s fidu ciary duty under applicable law. In addition to evaluating the specific factors noted above, the Board, in reaching its determination, is aware that shareholders in the fund have a broad range of investment choices available to them, including a wide choice among mutual funds offered by competitors to Fidelity, and that the fund’s shareholders, with the opportunity to review and weigh the disclosure provided by the fund in its
prospectus and other public disclosures, have chosen to invest in this fund, managed by Fidelity.
Nature, Extent, and Quality of Services Provided by Fidelity. The Board consid ered staffing within the investment adviser, FMR, and the sub advisers (together, the Investment Advisers), including the background of the fund’s portfolio manager and the fund’s investment objective and discipline. The independent Trustees also had discus sions with senior management of Fidelity’s investment operations and investment groups. The Board considered the structure of the portfolio manager compensation program and whether this structure provides appropriate incentives.
Fidelity Resources Dedicated to Investment Management and Support Services. The Board reviewed the size, education, and experience of the Investment Advisers’ invest ment staff, their use of technology, and the Investment Advisers’ approach to recruiting, training, and retaining portfolio managers and other research, advisory, and manage ment personnel. The Board considered Fidelity’s extensive global research capabilities that enable the Investment Advisers to aggregate data from various sources in an effort to produce positive investment results. The Board noted that Fidelity’s analysts have access to a variety of technological tools that enable them to perform both fundamental and quantitative analysis and to specialize in various disciplines. The Board also considered that Fidelity’s portfolio managers and analysts have access to daily portfolio attribution that allows for monitoring of a fund’s portfolio, as well as an electronic communication system that provides immediate real time access to research concerning issuers and credit enhancers.
Shareholder and Administrative Services. The Board considered the nature, extent, quality, and cost of administrative, distribution, and shareholder services performed by the Investment Advisers and their affiliates under the Advisory Contracts and under separate agreements covering transfer agency, pricing and bookkeeping, and securities lending services for the fund. The Board also considered the nature and extent of the Investment Advisers’ supervision of third party service providers, principally custodians and subcustodians. The Board reviewed the allocation of fund brokerage, including allocations to brokers affiliated with the Investment Advisers, the use of brokerage commissions to pay fund expenses, and the use of “soft” commission dollars to pay for research services. The Board also considered that Fidelity voluntarily decided in 2004 to stop using “soft” commission dollars to pay for market data and, instead, to pay for that data out of its own resources. The Board also considered the resources devoted to, and the record of compliance with, the fund’s compliance policies and procedures.
The Board noted that the growth of fund assets across the complex allows Fidelity to reinvest in the development of services designed to enhance the value or convenience of the Fidelity funds as investment vehicles. These services include 24 hour access to
45 Annual Report
Board Approval of Investment Advisory Contracts and Management Fees continued
account information and market information through phone representatives and over the Internet, and investor education materials and asset allocation tools.
Investment in a Large Fund Family. The Board considered the benefits to shareholders of investing in a Fidelity fund, including the benefits of investing in a fund that is part of a large family of funds offering a variety of investment disciplines and providing for a large variety of mutual fund investor services. For example, fund shareholders are offered the privilege of exchanging shares of the fund for shares of other Fidelity funds, as set forth in the fund’s prospectus, without paying an additional sales charge. The Board noted that, since the last Advisory Contract renewals in July 2004, Fidelity has taken a number of actions that benefited particular funds, including (i) voluntarily deciding in 2004 to stop using “soft” commission dollars to pay for market data and, instead, to pay for that data out of its own resources, (ii) contractually agreeing to impose management fee reductions and expense limitations on its five Spartan stock index funds and its stock index fund available through variable insurance products, (iii) contractually agreeing to eliminate the management fees on the Fidelity Freedom Funds and the Fidelity Advisor Freedom Funds, (iv) contractually agreeing to reduce the management fees on most of its investment grade taxable bond funds, and (v) contractually agreeing to impose expense limitations on its retail and Spartan investment grade taxable bond funds.
Investment Performance and Compliance. The Board considered whether the fund has operated within its investment objective, as well as its record of compliance with its investment restrictions. It also reviewed the fund’s absolute investment performance for each class, as well as the fund’s relative investment performance for each class measured against (i) a broad based securities market index, and (ii) a peer group of mutual funds deemed appropriate by the Board over multiple periods. Because the fund had been in existence less than five calendar years, the following charts considered by the Board show, over the one and three year periods ended December 31, 2004, the returns of Class C and Institutional Class of the fund, the returns of a broad based securities market index (“benchmark”), and a range of returns of a peer group of mutual funds identified by Lipper Inc. as having an investment objective similar to that of the fund. The returns of Class C and Institutional Class represent the performance of classes with the highest and lowest 12b 1 fees, respectively (not necessarily with the highest and lowest total expenses). The box within each chart shows the 25th percentile return (bottom of box) and the 75th percentile return (top of box) of the Lipper peer group. Returns shown above the box are in the first quartile and returns shown below the box are in the fourth quartile. The percentage beaten numbers noted below each chart correspond to the percentile box and represent the percentage of funds in the Lipper peer group whose performance was equal to or lower than that of the class indicated.

The Board reviewed the fund’s relative investment performance against its Lipper peer group and stated that the performance of Institutional Class of the fund was in the fourth quartile for the one and three year periods. The Board also stated that the relative investment performance of the fund was lower than its benchmark over time. The Board considered that the variations in performance among the fund’s classes reflect the variations in class expenses, which result in lower performance for higher expense classes. The Board discussed with FMR actions to be taken by FMR to improve the fund’s disappointing performance.
The Board has had thorough discussions with FMR throughout the year about the Board’s and FMR’s concerns about equity research, equity fund performance, and compliance with internal policies governing gifts and entertainment. FMR has taken steps that it believes will refocus and strengthen equity research and equity portfolio management and compliance. The Board noted with favor FMR’s recent reorganization of its senior management team and FMR’s plans to dedicate additional resources to investment research, and participated in the process that led to those changes.
Based on its review, and giving particular weight to the nature and quality of the resources dedicated by the Investment Advisers to maintain and improve relative performance, the Board concluded that the nature, extent, and quality of the services provided by Fidelity will benefit the fund’s shareholders, particularly in light of the Board’s view that the fund’s shareholders benefit from investing in a fund that is part of a large family of funds offering a variety of investment disciplines and services.
Competitiveness of Management Fee and Total Fund Expenses. The Board considered the fund’s management fee and total expenses compared to “mapped groups”
47 Annual Report
Board Approval of Investment Advisory Contracts and Management Fees continued
of competitive funds and classes. Fidelity creates “mapped groups” by combining similar Lipper investment objective categories that have comparable management fee charac teristics. Combining Lipper investment objective categories aids the Board’s manage ment fee and total expense comparisons by broadening the competitive group used for comparison and by reducing the number of universes to which various Fidelity funds are compared.
The Board considered two proprietary management fee comparisons for the 12 month periods shown in the chart below. The group of Lipper funds used by the Board for management fee comparisons is referred to below as the “Total Mapped Group” and, for the reasons explained above, is broader than the Lipper peer group used by the Board for performance comparisons. The Total Mapped Group comparison focuses on a fund’s standing relative to the total universe of comparable funds available to investors, in terms of gross management fees before expense reimbursements or caps. “TMG %” represents the percentage of funds in the Total Mapped Group that had management fees that were lower than the fund’s. For example, a TMG % of 21% means that 79% of the funds in the Total Mapped Group had higher management fees than the fund. The “Asset Size Peer Group” (ASPG) comparison focuses on a fund’s standing relative to non Fidelity funds similar in size to the fund within the Total Mapped Group. The ASPG represents at least 15% of the funds in the Total Mapped Group with comparable asset size and management fee characteristics, subject to a minimum of 50 funds (or all funds in the Total Mapped Group if fewer than 50). Additional information, such as the ASPG quartile (“quadrant”) in which the fund’s management fee ranked, is also included in the chart and considered by the Board.
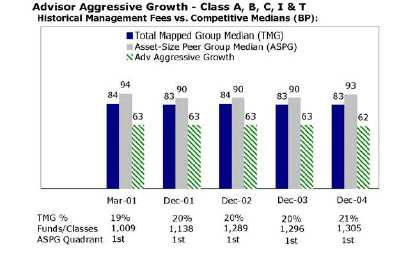
Annual Report 48
The Board noted that the fund’s management fee ranked below the median of its Total Mapped Group and below the median of its ASPG for 2004.
Based on its review, the Board concluded that the fund’s management fee was fair and reasonable in light of the services that the fund receives and the other factors considered.
In its review of each class’s total expenses, the Board considered the fund’s management fee as well as other fund or class expenses, as applicable, such as transfer agent fees, pricing and bookkeeping fees, fund paid 12b 1 fees, and custodial, legal, and audit fees. The Board also noted the effects of any waivers and reimbursements on fees and expenses. As part of its review, the Board also considered current and historical total expenses of each class of the fund compared to competitive fund median expenses. Each class of the fund is compared to those funds and classes in the Total Mapped Group (used by the Board for management fee comparisons) that have a similar sales load structure.
The Board noted that the total expenses of each class ranked above its competitive median for 2004. The Board noted that the fund offers multiple classes, each of which has a different sales load and 12b 1 fee structure, and that the multiple structures are intended to offer a range of pricing options for the intermediary market. The Board also noted that the total expenses of the classes vary primarily by the level of their 12b 1 fees, although differences in transfer agent fees may also cause expenses to vary from class to class.
Furthermore, the Board considered that on December 16, 2004, it had approved changes (effective January 1, 2005) in the transfer agent and service agreements for the fund that established maximum transfer agent fees and eliminated the minimum pricing and bookkeeping fee to prevent small funds or funds with small average account sizes from having relatively high fees in basis points (the “small fund fee reductions”). The Board considered that, if the small fund fee reductions had been in effect in 2004, the total expenses of each of Class A, Class B, and Class C would have ranked below the median.
In its review of total expenses, the Board also considered Fidelity fee structures and other information on clients that FMR and its affiliates service in other competitive markets, such as other mutual funds advised or subadvised by FMR or its affiliates, pension plan clients, and other institutional clients.
Based on its review, the Board concluded that the total expenses for each class of the fund were reasonable, although in all cases above the median of the universe presented for comparison, in light of the services that the fund and its shareholders receive and the other factors considered.
Costs of the Services and Profitability. The Board considered the revenues earned and the expenses incurred by Fidelity in conducting the business of developing,
49 Annual Report
Board Approval of Investment Advisory Contracts and Management Fees continued
marketing, distributing, managing, administering and servicing the fund and its share holders. The Board also considered the level of Fidelity’s profits in respect of all the Fidelity funds.
On an annual basis, FMR presents to the Board Fidelity’s profitability for the fund. Fidelity calculates the profitability for each fund, as well as aggregate profitability for groups of Fidelity funds and all Fidelity funds, using a series of detailed revenue and cost allocation methodologies which originate with the audited books and records of Fidelity. The Audit Committee of the Board reviews any significant changes from the prior year’s methodologies.
PricewaterhouseCoopers LLP (PwC), independent registered accounting firm and auditor to Fidelity and certain Fidelity funds, has been engaged annually by the Board as part of the Board’s assessment of the results of Fidelity’s profitability analysis. PwC’s engagement includes the review and assessment of Fidelity’s methodologies used in determining the revenues and expenses attributable to Fidelity’s mutual fund business, and completion of agreed upon procedures surrounding the mathematical accuracy of fund profitability and its conformity to allocation methodologies. After considering PwC’s reports issued under the engagement and information provided by Fidelity, the Board believes that while other allocation methods may also be reasonable, Fidelity’s profitabil ity methodologies are reasonable in all material respects.
The Board has also reviewed Fidelity’s non fund businesses and any fall out benefits related to the mutual fund business as well as cases where Fidelity’s affiliates may benefit from or be related to the fund’s business. In addition, a special committee of the Board reviewed services provided to Fidelity by its affiliates and determined that the fees that Fidelity paid for such services were reasonable.
The Board considered the costs of the services provided by and the profits realized by Fidelity in connection with the operation of the fund and determined that the amount of profit is a fair entrepreneurial profit for the management of the fund.
Economies of Scale. The Board considered whether there have been economies of scale in respect of the management of the Fidelity funds, whether the Fidelity funds (including the fund) have appropriately benefited from any such economies of scale, and whether there is potential for realization of any further economies of scale. The Board considered the extent to which the fund will benefit from economies of scale through increased services to the fund, through waivers or reimbursements, or through fee or expense reductions, including reductions that occur through operation of the transfer agent agreement. The transfer agent fee varies in part based on the number of accounts in the fund. If the number of accounts decreases or the average account size increases, the overall transfer agent fee rate decreases.
The Board recognized that the fund’s management contract incorporates a “group fee” structure, which provides for lower fee rates as total fund assets under FMR’s manage ment increase, and for higher fee rates as total fund assets under FMR’s management decrease. The Board considered that the group fee is designed to deliver the benefits of economies of scale to fund shareholders when total fund assets increase, even if assets of any particular fund are unchanged or have declined, because some portion of Fidelity’s costs are attributable to services provided to all Fidelity funds, and all funds benefit if those costs can be allocated among more assets. The Board concluded that, given the group fee structure, fund shareholders will achieve a certain level of economies of scale as assets under FMR’s management increase at the fund complex level, regardless of whether Fidelity achieves any such economies of scale.
The Board further concluded that any potential economies of scale are being shared between fund shareholders and Fidelity in an appropriate manner.
Additional Information Requested by the Board. In order to develop fully the factual basis for consideration of the Advisory Contracts, the Board requested additional information regarding (i) equity fund transfer agency fees; (ii) Fidelity’s fund profitability methodology and the impact of various changes in the methodology over time; (iii) benefits to shareholders from economies of scale; (iv) composition and characteristics of various fund and industry data used in comparisons; and (v) com pensation of portfolio managers and research analysts.
Based on its evaluation of all of the conclusions noted above, and after considering all material factors, the Board ultimately concluded that the existing advisory fee structures are fair and reasonable, and that the fund’s existing Advisory Contracts should be renewed.
51 Annual Report
53 Annual Report
55 Annual Report
Investment Adviser
Fidelity Management & Research Company
Boston, MA
Investment Sub Advisers
FMR Co., Inc.
Fidelity Management & Research
(U.K.) Inc.
Fidelity Management & Research
(Far East) Inc.
Fidelity International Investment Advisors
Fidelity Investments Japan Limited
Fidelity International Investment Advisors (U.K.) Limited
General Distributor
Fidelity Distributors Corporation
Boston, MA
Transfer and Service Agents
Fidelity Investments Institutional
Operations Company, Inc.
Boston, MA
Fidelity Service Company, Inc.
Boston, MA
Custodian
State Street Bank and Trust Company
Quincy, MA
|
AAGI-UANN-0106
1.786670.102
|

Item 2. Code of Ethics
As of the end of the period, November 30, 2005, Fidelity Securities Fund (the trust) has adopted a code of ethics, as defined in Item 2 of Form N-CSR, that applies to its President and Treasurer and its Chief Financial Officer. A copy of the code of ethics is filed as an exhibit to this Form N-CSR.
Item 3. Audit Committee Financial Expert
The Board of Trustees of the trust has determined that Marie L. Knowles is an audit committee financial expert, as defined in Item 3 of Form N-CSR. Ms. Knowles is independent for purposes of Item 3 of Form N-CSR.
Item 4. Principal Accountant Fees and Services
(a) Audit Fees.
For the fiscal years ended November 30, 2005 and November 30, 2004, the aggregate Audit Fees billed by PricewaterhouseCoopers LLP (PwC) for professional services rendered for the audits of the financial statements, or services that are normally provided in connection with statutory and regulatory filings or engagements for those fiscal years, for the Fidelity Advisor Aggressive Growth Fund (the fund) and for all funds in the Fidelity Group of Funds are shown in the table below.
Fund | 2005A | 2004A |
Fidelity Advisor Aggressive Growth Fund | $34,000 | $33,000 |
All funds in the Fidelity Group of Funds audited by PwC | $12,100,000 | $10,600,000 |
A | Aggregate amounts may reflect rounding. |
(b) Audit-Related Fees.
In each of the fiscal years ended November 30, 2005 and November 30, 2004 the aggregate Audit-Related Fees billed by PwC for services rendered for assurance and related services to the fund that are reasonably related to the performance of the audit or review of the fund's financial statements, but not reported as Audit Fees, are shown in the table below.
Fund | 2005A | 2004A |
Fidelity Advisor Aggressive Growth Fund | $0 | $0 |
A | Aggregate amounts may reflect rounding. |
In each of the fiscal years ended November 30, 2005 and November 30, 2004, the aggregate Audit-Related Fees that were billed by PwC that were required to be approved by the Audit Committee for services rendered on behalf of Fidelity Management & Research Company (FMR) and entities controlling, controlled by, or under common control with FMR (not including any sub-adviser whose role is primarily portfolio management and is subcontracted with or overseen by another investment adviser) that provide ongoing services to the fund ("Fund Service Providers") for assurance and related services that relate directly to the operations and financial reporting of the fund that are reasonably related to the performance of the audit or review of the fund's financial statements, but not reported as Audit Fees, are shown in the table below.
Billed By | 2005A | 2004A |
PwC | $0 | $0 |
A | Aggregate amounts may reflect rounding. |
Fees included in the audit-related category comprise assurance and related services (e.g., due diligence services) that are traditionally performed by the independent registered public accounting firm. These audit-related services include due diligence related to mergers and acquisitions, accounting consultations and audits in connection with acquisitions, internal control reviews, attest services that are not required by statute or regulation and consultation concerning financial accounting and reporting standards.
(c) Tax Fees.
In each of the fiscal years ended November 30, 2005 and November 30, 2004, the aggregate Tax Fees billed by PwC for professional services rendered for tax compliance, tax advice, and tax planning for the fund is shown in the table below.
Fund | 2005A | 2004A |
Fidelity Advisor Aggressive Growth Fund | $2,500 | $2,400 |
A | Aggregate amounts may reflect rounding. |
In each of the fiscal years ended November 30, 2005 and November 30, 2004, the aggregate Tax Fees billed by PwC that were required to be approved by the Audit Committee for professional services rendered on behalf of the Fund Service Providers for tax compliance, tax advice, and tax planning that relate directly to the operations and financial reporting of the fund is shown in the table below.
Billed By | 2005A | 2004A |
PwC | $0 | $0 |
A | Aggregate amounts may reflect rounding. |
Fees included in the Tax Fees category comprise all services performed by professional staff in the independent registered public accounting firm's tax division except those services related to the audit. Typically, this category would include fees for tax compliance, tax planning, and tax advice. Tax compliance, tax advice, and tax planning services include preparation of original and amended tax returns, claims for refund and tax payment-planning services, assistance with tax audits and appeals, tax advice related to mergers and acquisitions and requests for rulings or technical advice from taxing authorities.
(d) All Other Fees.
In each of the fiscal years ended November 30, 2005 and November 30, 2004, the aggregate Other Fees billed by PwC for all other non-audit services rendered to the fund is shown in the table below.
Fund | 2005A | 2004A |
Fidelity Advisor Aggressive Growth Fund | $1,400 | $1,300 |
A | Aggregate amounts may reflect rounding. |
In each of the fiscal years ended November 30, 2005 and November 30, 2004, the aggregate Other Fees billed by PwC that were required to be approved by the Audit Committee for all other non-audit services rendered on behalf of the Fund Service Providers that relate directly to the operations and financial reporting of the fund is shown in the table below.
Billed By | 2005A | 2004A |
PwC | $170,000 | $540,000 |
A | Aggregate amounts may reflect rounding. |
Fees included in the All Other Fees category include services related to internal control reviews, strategy and other consulting, financial information systems design and implementation, consulting on other information systems, and other tax services unrelated to the fund.
(e) (1) | Audit Committee Pre-Approval Policies and Procedures: |
The trust's Audit Committee must pre-approve all audit and non-audit services provided by the independent registered public accounting firm relating to the operations or financial reporting of the fund. Prior to the commencement of any audit or non-audit services to a fund, the Audit Committee reviews the services to determine whether they are appropriate and permissible under applicable law.
The trust's Audit Committee has adopted policies and procedures to, among other purposes, provide a framework for the Committee's consideration of non-audit services by the audit firms that audit the Fidelity funds. The policies and procedures require that any non-audit service provided by a fund audit firm to a Fidelity Fund and any non-audit service provided by a fund auditor to a Fund Service Provider that relates directly to the operations and financial reporting of a Fidelity fund (Covered Service) are subject to approval by the Audit Committee before such service is provided. Non-audit services provided by a fund audit firm for a Fund Service Provider that do not relate directly to the operations and financial reporting of a Fidelity fund (Non-Covered Service) but that are expected to exceed $50,000 are also subject to pre-approval by the Audit Committee.
All Covered Services, as well as Non-Covered Services that are expected to exceed $50,000, must be approved in advance of provision of the service either: (i) by formal resolution of the Audit Committee, or (ii) by oral or written approval of the service by the Chair of the Audit Committee (or if the Chair is unavailable, such other member of the Audit Committee as may be designated by the Chair to act in the Chair's absence). The approval contemplated by (ii) above is permitted where the Treasurer determines that action on such an engagement is necessary before the next meeting of the Audit Committee. Neither pre-approval nor advance notice of Non-Covered Service engagements for which fees are not expected to exceed $50,000 is required; such engagements are to be reported to the Audit Committee monthly.
(e) (2) | Services approved pursuant to paragraph (c)(7)(i)(C) of Rule 2-01 of Regulation S-X: |
Audit-Related Fees:
There were no amounts that were approved by the Audit Committee pursuant to the de minimis exception for the fiscal years ended November 30, 2005 and November 30, 2004 on behalf of the fund.
There were no amounts that were required to be approved by the Audit Committee pursuant to the de minimis exception for the fiscal years ended November 30, 2005 and November 30, 2004 on behalf of the Fund Service Providers that relate directly to the operations and financial reporting of the fund.
Tax Fees:
There were no amounts that were approved by the Audit Committee pursuant to the de minimis exception for the fiscal years ended November 30, 2005 and November 30, 2004 on behalf of the fund.
There were no amounts that were required to be approved by the Audit Committee pursuant to the de minimis exception for the fiscal years ended November 30, 2005 and November 30, 2004 on behalf of the Fund Service Providers that relate directly to the operations and financial reporting of the fund.
All Other Fees:
There were no amounts that were approved by the Audit Committee pursuant to the de minimis exception for the fiscal years ended November 30, 2005 and November 30, 2004 on behalf of the fund.
There were no amounts that were required to be approved by the Audit Committee pursuant to the de minimis exception for the fiscal years ended November 30, 2005 and November 30, 2004 on behalf of the Fund Service Providers that relate directly to the operations and financial reporting of the fund.
(f) Not applicable.
(g) For the fiscal years ended November 30, 2005 and November 30, 2004, the aggregate fees billed by PwC of $3,650,000A and $2,700,000A for non-audit services rendered on behalf of the fund, FMR (not including any sub-adviser whose role is primarily portfolio management and is subcontracted with or overseen by another investment adviser) and Fund Service Providers relating to Covered Services and Non-Covered Services are shown in the table below.
| 2005A | 2004A |
Covered Services | $150,000 | $550,000 |
Non-Covered Services | $3,500,000 | $2,150,000 |
A | Aggregate amounts may reflect rounding. |
(h) The trust's Audit Committee has considered Non-Covered Services that were not pre-approved that were provided by PwC to Fund Service Providers to be compatible with maintaining the independence of PwC in its audit of the fund, taking into account representations from PwC, in accordance with Independence Standards Board Standard No.1, regarding its independence from the fund and its related entities.
Item 5. Audit Committee of Listed Registrants
Not applicable.
Item 6. Schedule of Investments
Not applicable.
Item 7. Disclosure of Proxy Voting Policies and Procedures for Closed-End Management Investment Companies
Not applicable.
Item 8. Portfolio Managers of Closed-End Management Investment Companies
Not applicable.
Item 9. Purchase of Equity Securities by Closed-End Management Investment Company and Affiliated Purchasers
Not applicable.
Item 10. Submission of Matters to a Vote of Security Holders
There were no material changes to the procedures by which shareholders may recommend nominees to the trust's Board of Trustees.
Item 11. Controls and Procedures
(a)(i) The President and Treasurer and the Chief Financial Officer have concluded that the trust's disclosure controls and procedures (as defined in Rule 30a-3(c) under the Investment Company Act) provide reasonable assurances that material information relating to the trust is made known to them by the appropriate persons, based on their evaluation of these controls and procedures as of a date within 90 days of the filing date of this report.
(a)(ii) There was no change in the trust's internal control over financial reporting (as defined in Rule 30a-3(d) under the Investment Company Act) that occurred during the second fiscal quarter of the period covered by this report that has materially affected, or is reasonably likely to materially affect, the trust's internal control over financial reporting.
Item 12. Exhibits
(a) | (1) | Code of Ethics pursuant to Item 2 of Form N-CSR is filed and attached hereto as EX-99.CODE ETH. |
(a) | (2) | Certification pursuant to Rule 30a-2(a) under the Investment Company Act of 1940 (17 CFR 270.30a-2(a)) is filed and attached hereto as Exhibit 99.CERT. |
(a) | (3) | Not applicable. |
(b) | | Certification pursuant to Rule 30a-2(b) under the Investment Company Act of 1940 (17 CFR 270.30a-2(b)) is furnished and attached hereto as Exhibit 99.906CERT. |
SIGNATURES
Pursuant to the requirements of the Securities Exchange Act of 1934 and the Investment Company Act of 1940, the registrant has duly caused this report to be signed on its behalf by the undersigned, thereunto duly authorized.
Fidelity Securities Fund
By: | /s/Christine Reynolds |
| Christine Reynolds |
| President and Treasurer |
| |
Date: | January 20, 2006 |
Pursuant to the requirements of the Securities Exchange Act of 1934 and the Investment Company Act of 1940, this report has been signed below by the following persons on behalf of the registrant and in the capacities and on the dates indicated.
By: | /s/Christine Reynolds |
| Christine Reynolds |
| President and Treasurer |
| |
Date: | January 20, 2006 |
By: | /s/Paul M. Murphy |
| Paul M. Murphy |
| Chief Financial Officer |
| |
Date: | January 20, 2006 |