UNITED STATES
SECURITIES AND EXCHANGE COMMISSION
Washington, D.C. 20549
FORM N-CSR
CERTIFIED SHAREHOLDER REPORT OF REGISTERED
MANAGEMENT INVESTMENT COMPANIES
Investment Company Act file number 811-4118
Fidelity Securities Fund
(Exact name of registrant as specified in charter)
82 Devonshire St., Boston, Massachusetts 02109
(Address of principal executive offices) (Zip code)
Scott C. Goebel, Secretary
82 Devonshire St.
Boston, Massachusetts 02109
(Name and address of agent for service)
Registrant's telephone number, including area code: 617-563-7000
Date of fiscal year end: | July 31 |
| |
Date of reporting period: | July 31, 2011 |
Item 1. Reports to Stockholders
Fidelity®
Blue Chip Growth
Fund
Annual Report
July 31, 2011
(2_fidelity_logos) (Registered_Trademark)
Contents
Chairman's Message | <Click Here> | The Chairman's message to shareholders. |
Performance | <Click Here> | How the fund has done over time. |
Management's Discussion of Fund Performance | <Click Here> | The Portfolio Manager's review of fund performance and strategy. |
Shareholder Expense Example | <Click Here> | An example of shareholder expenses. |
Investment Changes | <Click Here> | A summary of major shifts in the fund's investments over the past six months. |
Investments | <Click Here> | A complete list of the fund's investments with their market values. |
Financial Statements | <Click Here> | Statements of assets and liabilities, operations, and changes in net assets,
as well as financial highlights. |
Notes | <Click Here> | Notes to the financial statements. |
Report of Independent Registered Public Accounting Firm | <Click Here> | |
Trustees and Officers | <Click Here> | |
Distributions | <Click Here> | |
Board Approval of Investment Advisory Contracts and Management Fees | <Click Here> | |
To view a fund's proxy voting guidelines and proxy voting record for the 12-month period ended June 30, visit http://www.fidelity.com/proxyvotingresults or visit the Securities and Exchange Commission's (SEC) web site at http://www.sec.gov. You may also call 1-800-544-8544 to request a free copy of the proxy voting guidelines.
Standard & Poor's, S&P and S&P 500 are registered service marks of The McGraw-Hill Companies, Inc. and have been licensed for use by Fidelity Distributors Corporation.
Other third party marks appearing herein are the property of their respective owners.
All other marks appearing herein are registered or unregistered trademarks or service marks of FMR LLC or an affiliated company.
Annual Report
This report and the financial statements contained herein are submitted for the general information of the shareholders of the fund. This report is not authorized for distribution to prospective investors in the fund unless preceded or accompanied by an effective prospectus.
A fund files its complete schedule of portfolio holdings with the SEC for the first and third quarters of each fiscal year on Form N-Q. Forms N-Q are available on the SEC's web site at http://www.sec.gov. A fund's Forms N-Q may be reviewed and copied at the SEC's Public Reference Room in Washington, DC. Information regarding the operation of the SEC's Public Reference Room may be obtained by calling 1-800-SEC-0330. For a complete list of a fund's portfolio holdings, view the most recent holdings listing, semiannual report, or annual report on Fidelity's web site at http://www.fidelity.com, http://www.advisor.fidelity.com, or http://www.401k.com, as applicable.
NOT FDIC INSURED • MAY LOSE VALUE • NO BANK GUARANTEE
Neither the fund nor Fidelity Distributors Corporation is a bank.
Annual Report
(photo_of_James_C_Curvey)
Dear Shareholder:
The second half of 2011 began with U.S. equities continuing to give back some of the gains achieved earlier in the year. In the days leading up to July 31, markets were shaken by a political stalemate in which Congress struggled to address the debt ceiling issue before an early-August deadline. The resulting uncertainty held back markets in July, the third consecutive monthly decline for equities, effectively reversing the positive momentum seen through the end of April. Financial markets are always unpredictable, of course, but there are several time-tested investment principles that can help put the odds in your favor.
One of the basic tenets is to invest for the long term. Over time, riding out the markets' inevitable ups and downs has proven much more effective than selling into panic or chasing the hottest trend. Even missing only a few of the markets' best days can significantly diminish investor returns. Patience also affords the benefits of compounding - of earning interest on additional income or reinvested dividends and capital gains. There can be tax advantages and cost benefits to consider as well. While staying the course doesn't eliminate risk, it can considerably lessen the effect of short-term declines.
You can further manage your investing risk through diversification. And today, more than ever, geographic diversification should be taken into account. Studies indicate that asset allocation is the single most important determinant of a portfolio's long-term success. The right mix of stocks, bonds and cash - aligned to your particular risk tolerance and investment objective - is very important. Age-appropriate rebalancing is also an essential aspect of asset allocation. For younger investors, an emphasis on equities - which historically have been the best-performing asset class over time - is encouraged. As investors near their specific goal, such as retirement or sending a child to college, consideration may be given to replacing volatile assets (e.g. common stocks) with more-stable fixed investments (bonds or savings plans).
A third principle - investing regularly - can help lower the average cost of your purchases. Investing a certain amount of money each month or quarter helps ensure you won't pay for all your shares at market highs. This strategy - known as dollar cost averaging - also reduces "emotion" from investing, helping shareholders avoid selling weak performers just prior to an upswing, or chasing a hot performer just before a correction.
We invite you to contact us via the Internet, through our Investor Centers or by phone. It is our privilege to provide you the information you need to make the investments that are right for you.
Sincerely,
(The acting chairman's signature appears here.)
James C. Curvey
Acting Chairman
Average annual total return reflects the change in the value of an investment, assuming reinvestment of the class' distributions from dividend income and capital gains (the profits earned upon the sale of securities that have grown in value, if any) and assuming a constant rate of performance each year. The $10,000 table and the fund's returns do not reflect the deduction of taxes that a shareholder would pay on fund distributions or the redemption of fund shares. During periods of reimbursement by Fidelity, a fund's total return will be greater than it would be had the reimbursement not occurred. How a fund did yesterday is no guarantee of how it will do tomorrow.
Average Annual Total Returns
Periods ended July 31, 2011 | Past 1
year | Past 5
years | Past 10
years |
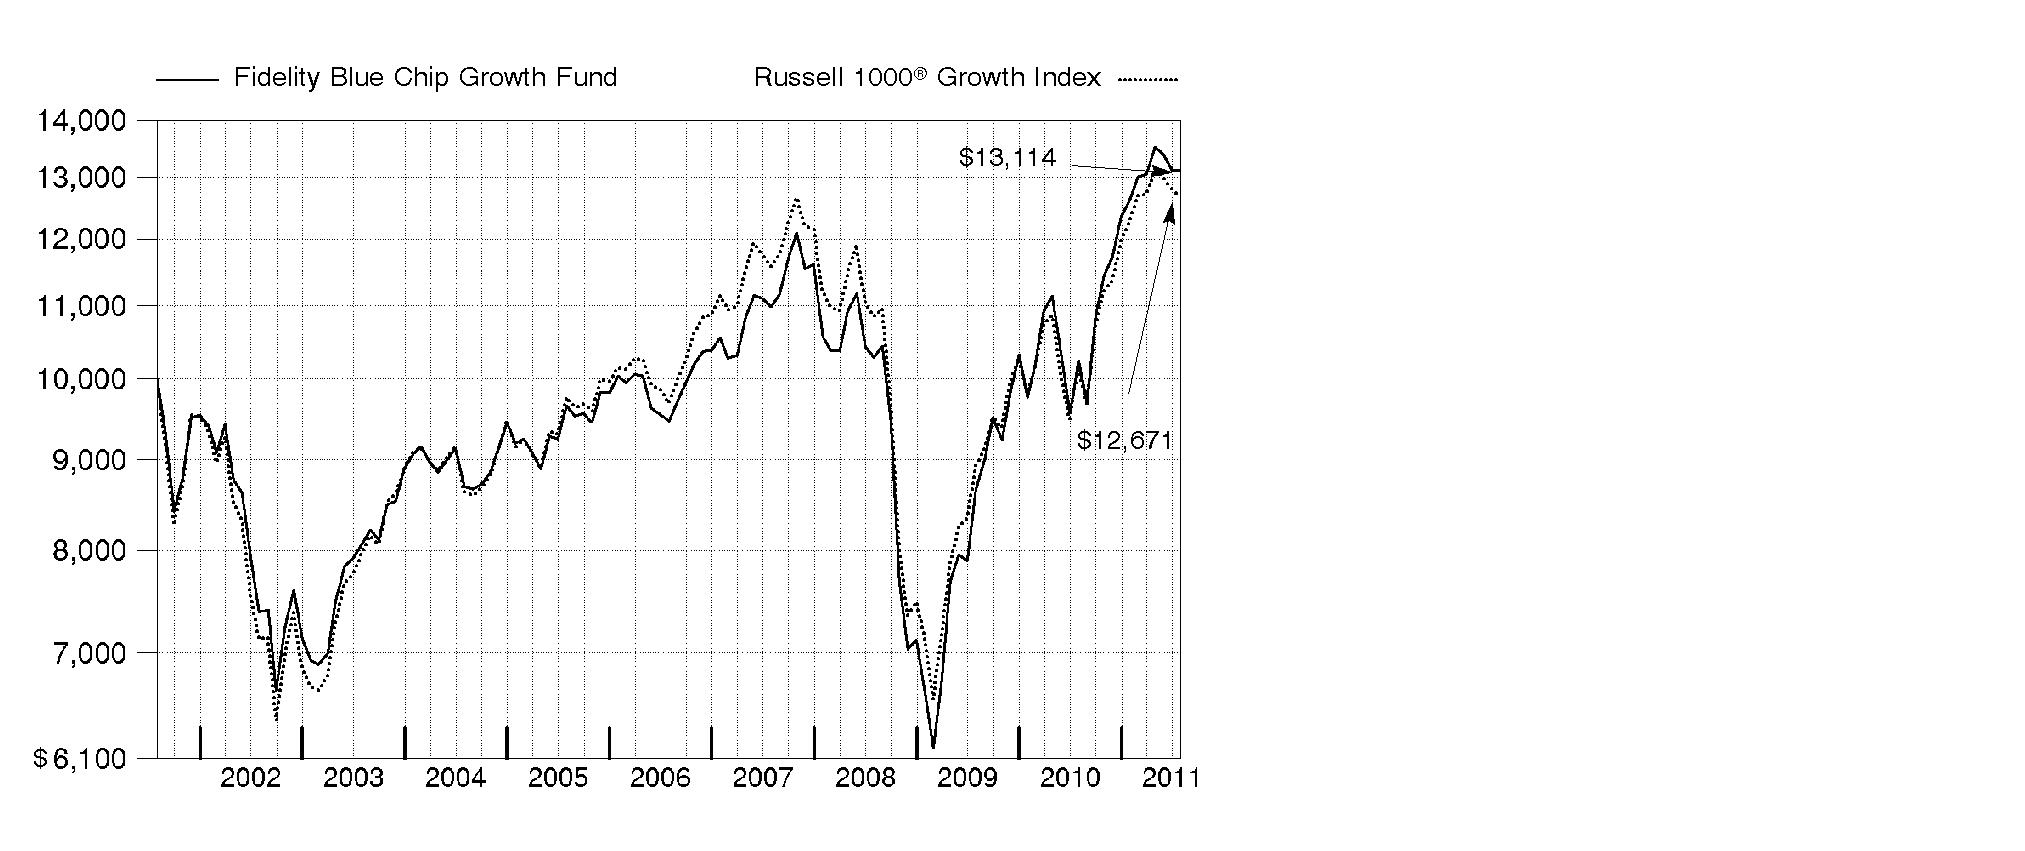
Fidelity® Blue Chip Growth Fund | 28.12% | 6.75% | 2.75% |
$10,000 Over 10 Years
Let's say hypothetically that $10,000 was invested in Fidelity® Blue Chip Growth Fund, a class of the fund, on July 31, 2001. The chart shows how the value of your investment would have changed, and also shows how the Russell 1000® Growth Index performed over the same period.
Annual Report
Market Recap: U.S. stocks registered solid double-digit gains for the 12 months ending July 31, 2011, extending a rally that began more than two years earlier. Despite a rough start in August 2010, markets turned positive in September, as increased demand for capital goods and other upbeat indicators trumped investor worry about a U.S. recessionary relapse. The broad market, as measured by the S&P 500® Index, rose 9% that month, its biggest September gain in 71 years. Seven more monthly advances followed, fueled by encouraging corporate earnings and economic activity. However, volatility picked up in the period's latter months, as markets reacted to continued high U.S. unemployment, nagging debt troubles in Europe and looming legislative battles over the federal debt ceiling. May unemployment rose above 9% for the first time in 2011, contributing to a traditional "June swoon" for stocks. Market uncertainty lingered in July, when the S&P 500® posted its second-biggest monthly loss of the period. For the full year, the S&P 500® climbed 19.65%, while the blue-chip-laden Dow Jones Industrial AverageSM rose a comparable 19.09% and the technology-heavy Nasdaq Composite® Index gained 23.40%. On the capitalization spectrum, stocks of mid-cap companies fared best, with the Russell Midcap® Index rising 24.51% and the small-cap Russell 2000® Index adding 23.92%.
Comments from Sonu Kalra, Portfolio Manager of Fidelity® Blue Chip Growth Fund: For the year, the fund's Retail Class shares rose 28.12%, solidly outpacing the 24.76% return of the Russell 1000® Growth Index. Security selection drove the fund's outperformance, mainly within technology, consumer discretionary and consumer staples. The top individual contributor was an underweighting in Cisco Systems. This producer of networking and communications tech products missed earnings estimates and its core IP (Internet protocol) switching business came under pressure from lower-cost competitors. Cisco was removed from the Russell 1000® Growth Index in June as part of the benchmark's annual rebalancing. Elsewhere, tech giant Apple - the fund's largest holding - helped, as did coal producer Massey Energy, which was acquired by Alpha Natural Resources. From an industry perspective, positioning in diversified financials hurt the most. Not owning index constituent International Business Machines was the biggest individual detractor, as the IT solutions/consulting services provider delivered solid earnings growth through disciplined operational expense management and also bought back some of its stock. Diversified financials firm Citigroup also hampered results. Some of the names I've mentioned in this review were not in the index, and some were sold by period end.
The views expressed above reflect those of the portfolio manager(s) only through the end of the period as stated on the cover of this report and do not necessarily represent the views of Fidelity or any other person in the Fidelity organization. Any such views are subject to change at any time based upon market or other conditions and Fidelity disclaims any responsibility to update such views. These views may not be relied on as investment advice and, because investment decisions for a Fidelity fund are based on numerous factors, may not be relied on as an indication of trading intent on behalf of any Fidelity fund.
Annual Report
Shareholder Expense Example
As a shareholder of the Fund, you incur two types of costs: (1) transaction costs, and (2) ongoing costs, including management fees and other Fund expenses. This Example is intended to help you understand your ongoing costs (in dollars) of investing in the Fund and to compare these costs with the ongoing costs of investing in other mutual funds.
The Example is based on an investment of $1,000 invested at the beginning of the period and held for the entire period (February 1, 2011 to July 31, 2011).
Actual Expenses
The first line of the accompanying table for each class of the Fund provides information about actual account values and actual expenses. You may use the information in this line, together with the amount you invested, to estimate the expenses that you paid over the period. Simply divide your account value by $1,000.00 (for example, an $8,600 account value divided by $1,000.00 = 8.6), then multiply the result by the number in the first line for a class of the Fund under the heading entitled "Expenses Paid During Period" to estimate the expenses you paid on your account during this period. A small balance maintenance fee of $12.00 that is charged once a year may apply for certain accounts with a value of less than $2,000. This fee is not included in the table below. If it was, the estimate of expenses you paid during the period would be higher, and your ending account value lower, by this amount. In addition, the Fund, as a shareholder in the underlying Fidelity Central Funds, will indirectly bear its pro-rata share of the fees and expenses incurred by the underlying Fidelity Central Funds. These fees and expenses are not included in the Fund's annualized expense ratio used to calculate the expense estimate in the table below.
Hypothetical Example for Comparison Purposes
The second line of the accompanying table for each class of the Fund provides information about hypothetical account values and hypothetical expenses based on a Class' actual expense ratio and an assumed rate of return of 5% per year before expenses, which is not the Class' actual return. The hypothetical account values and expenses may not be used to estimate the actual ending account balance or expenses you paid for the period. You may use this information to compare the ongoing costs of investing in the Fund and other funds. To do so, compare this 5% hypothetical example with the 5% hypothetical examples that appear in the shareholder reports of the other funds. A small balance maintenance fee of $12.00 that is charged once a year may apply for certain accounts with a value of less than $2,000. This fee is not included in the table below. If it was, the estimate of expenses you paid during the period would be higher, and your ending account value lower, by this amount. In addition, the Fund, as a shareholder in the underlying Fidelity Central Funds, will indirectly bear its pro-rata share of the fees and expenses incurred by the underlying Fidelity Central Funds. These fees and expenses are not included in the Fund's annualized expense ratio used to calculate the expense estimate in the table below.
Please note that the expenses shown in the table are meant to highlight your ongoing costs only and do not reflect any transaction costs. Therefore, the second line of the table is useful in comparing ongoing costs only, and will not help you determine the relative total costs of owning different funds.
Annual Report
Shareholder Expense Example - continued
| Annualized
Expense Ratio | Beginning
Account Value
February 1, 2011 | Ending
Account Value
July 31, 2011 | Expenses Paid
During Period*
February 1, 2011 to July 31, 2011 |
Blue Chip Growth | .94% | | | |
Actual | | $ 1,000.00 | $ 1,040.60 | $ 4.76 |
Hypothetical A | | $ 1,000.00 | $ 1,020.13 | $ 4.71 |
Class K | .78% | | | |
Actual | | $ 1,000.00 | $ 1,041.70 | $ 3.95 |
Hypothetical A | | $ 1,000.00 | $ 1,020.93 | $ 3.91 |
Class F | .73% | | | |
Actual | | $ 1,000.00 | $ 1,041.90 | $ 3.70 |
Hypothetical A | | $ 1,000.00 | $ 1,021.17 | $ 3.66 |
A 5% return per year before expenses
* Expenses are equal to each Class' annualized expense ratio, multiplied by the average account value over the period, multiplied by 181/365 (to reflect the one-half year period).
Annual Report
Investment Changes (Unaudited)
Top Ten Stocks as of July 31, 2011 |
| % of fund's
net assets | % of fund's net assets
6 months ago |
Apple, Inc. | 8.1 | 6.9 |
Google, Inc. Class A | 4.7 | 3.7 |
Amazon.com, Inc. | 2.4 | 2.0 |
QUALCOMM, Inc. | 2.3 | 3.0 |
Halliburton Co. | 2.0 | 0.8 |
Exxon Mobil Corp. | 2.0 | 3.1 |
Philip Morris International, Inc. | 1.8 | 1.5 |
The Coca-Cola Co. | 1.8 | 1.5 |
McDonald's Corp. | 1.7 | 0.7 |
Oracle Corp. | 1.6 | 1.5 |
| 28.4 | |
Top Five Market Sectors as of July 31, 2011 |
| % of fund's
net assets | % of fund's net assets
6 months ago |
Information Technology | 33.8 | 36.7 |
Consumer Discretionary | 19.2 | 16.9 |
Energy | 10.8 | 10.4 |
Consumer Staples | 10.6 | 7.3 |
Health Care | 9.9 | 6.7 |
Asset Allocation (% of fund's net assets) |
As of July 31, 2011* | As of January 31, 2011** |
 | Stocks 99.6% | | | Stocks 99.8% | |
 | Convertible
Securities 0.2% | |  | Convertible
Securities 0.0% | |
 | Short-Term
Investments and
Net Other Assets 0.2% | | | Short-Term
Investments and
Net Other Assets 0.2% | |
* Foreign investments | 13.0% | | ** Foreign investments | 11.2% | |

Annual Report
Investments July 31, 2011
Showing Percentage of Net Assets
Common Stocks - 98.3% |
| Shares | | Value (000s) |
CONSUMER DISCRETIONARY - 17.8% |
Auto Components - 0.6% |
Lear Corp. | 136,700 | | $ 6,698 |
Tenneco, Inc. (a) | 697,298 | | 27,850 |
TRW Automotive Holdings Corp. (a) | 772,100 | | 38,968 |
Visteon Corp. (a) | 173,100 | | 10,853 |
| | 84,369 |
Automobiles - 1.0% |
Bayerische Motoren Werke AG (BMW) | 428,637 | | 43,001 |
Brilliance China Automotive Holdings Ltd. (a) | 4,058,000 | | 5,181 |
Hyundai Motor Co. | 75,033 | | 16,725 |
Kia Motors Corp. | 152,660 | | 11,207 |
Tesla Motors, Inc. (a)(d) | 2,597,600 | | 73,174 |
| | 149,288 |
Diversified Consumer Services - 1.3% |
Coinstar, Inc. (a)(d) | 249,427 | | 12,187 |
New Oriental Education & Technology Group, Inc. sponsored ADR (a) | 101,800 | | 13,003 |
Weight Watchers International, Inc. | 2,086,172 | | 161,032 |
| | 186,222 |
Hotels, Restaurants & Leisure - 5.2% |
Arcos Dorados Holdings, Inc. | 1,324,400 | | 31,070 |
Bravo Brio Restaurant Group, Inc. | 750,800 | | 16,780 |
Brinker International, Inc. | 758,000 | | 18,207 |
Chipotle Mexican Grill, Inc. (a) | 145,100 | | 47,097 |
Dunkin' Brands Group, Inc. | 855,100 | | 24,738 |
Jubilant Foodworks Ltd. (a) | 533,088 | | 10,305 |
Las Vegas Sands Corp. (a) | 2,155,000 | | 101,673 |
Life Time Fitness, Inc. (a) | 120,100 | | 5,015 |
McDonald's Corp. | 2,853,430 | | 246,765 |
MGM Mirage, Inc. (a)(d) | 1,149,700 | | 17,372 |
Panera Bread Co. Class A (a) | 254,800 | | 29,381 |
Starbucks Corp. | 2,904,900 | | 116,457 |
WMS Industries, Inc. (a) | 262,500 | | 7,237 |
Wyndham Worldwide Corp. | 1,100,485 | | 38,066 |
Yum! Brands, Inc. | 756,700 | | 39,969 |
| | 750,132 |
Household Durables - 0.2% |
Beazer Homes USA, Inc. (a)(d) | 3,151,700 | | 9,140 |
SodaStream International Ltd. | 255,200 | | 18,719 |
| | 27,859 |
Common Stocks - continued |
| Shares | | Value (000s) |
CONSUMER DISCRETIONARY - continued |
Internet & Catalog Retail - 3.1% |
Amazon.com, Inc. (a) | 1,544,600 | | $ 343,704 |
Netflix, Inc. (a) | 70,900 | | 18,859 |
Priceline.com, Inc. (a) | 157,000 | | 84,411 |
| | 446,974 |
Media - 0.5% |
DISH Network Corp. Class A (a) | 1,251,100 | | 37,070 |
Focus Media Holding Ltd. ADR (a)(d) | 528,900 | | 17,396 |
Pandora Media, Inc. | 35,800 | | 540 |
ReachLocal, Inc. (a)(d) | 720,300 | | 13,102 |
| | 68,108 |
Multiline Retail - 1.5% |
Macy's, Inc. | 4,195,000 | | 121,110 |
Target Corp. | 1,785,179 | | 91,919 |
| | 213,029 |
Specialty Retail - 2.4% |
Abercrombie & Fitch Co. Class A | 126,600 | | 9,257 |
Ascena Retail Group, Inc. (a) | 1,118,600 | | 36,153 |
AutoZone, Inc. (a) | 9,500 | | 2,712 |
Bed Bath & Beyond, Inc. (a) | 616,900 | | 36,082 |
Chico's FAS, Inc. | 1,336,300 | | 20,165 |
Cia.Hering SA | 254,600 | | 5,456 |
Dick's Sporting Goods, Inc. (a) | 377,400 | | 13,964 |
Foot Locker, Inc. | 1,330,800 | | 28,918 |
Francescas Holdings Corp. | 280,300 | | 7,361 |
Limited Brands, Inc. | 1,414,800 | | 53,564 |
Ross Stores, Inc. | 179,600 | | 13,608 |
rue21, Inc. (a)(d) | 200,000 | | 6,574 |
Teavana Holdings, Inc. | 19,300 | | 544 |
TJX Companies, Inc. | 1,562,740 | | 86,420 |
Ulta Salon, Cosmetics & Fragrance, Inc. (a) | 342,500 | | 21,588 |
Vitamin Shoppe, Inc. (a) | 195,000 | | 8,494 |
| | 350,860 |
Textiles, Apparel & Luxury Goods - 2.0% |
Arezzo Industria e Comercio SA | 1,121,000 | | 16,050 |
Coach, Inc. | 169,300 | | 10,930 |
Crocs, Inc. (a) | 1,421,500 | | 44,536 |
Deckers Outdoor Corp. (a) | 180,800 | | 17,944 |
Fossil, Inc. (a) | 425,600 | | 53,485 |
Gitanjali Gems Ltd. | 2,187,799 | | 15,333 |
Common Stocks - continued |
| Shares | | Value (000s) |
CONSUMER DISCRETIONARY - continued |
Textiles, Apparel & Luxury Goods - continued |
NIKE, Inc. Class B | 603,000 | | $ 54,360 |
Polo Ralph Lauren Corp. Class A | 130,200 | | 17,586 |
Steven Madden Ltd. (a) | 271,950 | | 10,361 |
Under Armour, Inc. Class A (sub. vtg.) (a)(d) | 440,600 | | 32,344 |
Vera Bradley, Inc. (d) | 354,325 | | 12,851 |
| | 285,780 |
TOTAL CONSUMER DISCRETIONARY | | 2,562,621 |
CONSUMER STAPLES - 10.6% |
Beverages - 3.4% |
Anheuser-Busch InBev SA NV ADR | 504,500 | | 29,049 |
Dr Pepper Snapple Group, Inc. | 2,421,400 | | 91,432 |
Hansen Natural Corp. (a) | 680,600 | | 52,148 |
PepsiCo, Inc. | 932,800 | | 59,737 |
The Coca-Cola Co. | 3,769,700 | | 256,377 |
| | 488,743 |
Food & Staples Retailing - 2.7% |
Casey's General Stores, Inc. | 258,600 | | 11,637 |
Chefs' Warehouse Holdings | 198,400 | | 3,522 |
Costco Wholesale Corp. | 578,700 | | 45,283 |
CVS Caremark Corp. | 2,635,400 | | 95,797 |
Droga Raia SA | 635,700 | | 11,782 |
Sun Art Retail Group Ltd. | 977,500 | | 1,257 |
Walgreen Co. | 3,296,100 | | 128,680 |
Whole Foods Market, Inc. | 1,463,100 | | 97,589 |
| | 395,547 |
Food Products - 1.6% |
Calbee, Inc. | 408,300 | | 17,188 |
Danone | 396,900 | | 28,400 |
Dean Foods Co. (a) | 1,170,900 | | 12,903 |
Diamond Foods, Inc. (d) | 271,500 | | 19,437 |
Green Mountain Coffee Roasters, Inc. (a) | 1,222,600 | | 127,089 |
Mead Johnson Nutrition Co. Class A | 277,200 | | 19,784 |
| | 224,801 |
Personal Products - 0.6% |
Estee Lauder Companies, Inc. Class A | 684,100 | | 71,769 |
Herbalife Ltd. | 296,461 | | 16,519 |
| | 88,288 |
Common Stocks - continued |
| Shares | | Value (000s) |
CONSUMER STAPLES - continued |
Tobacco - 2.3% |
Altria Group, Inc. | 1,081,100 | | $ 28,433 |
Lorillard, Inc. | 412,100 | | 43,773 |
Philip Morris International, Inc. | 3,608,500 | | 256,817 |
| | 329,023 |
TOTAL CONSUMER STAPLES | | 1,526,402 |
ENERGY - 10.8% |
Energy Equipment & Services - 5.6% |
Baker Hughes, Inc. | 1,249,800 | | 96,710 |
Cameron International Corp. (a) | 208,800 | | 11,680 |
Carbo Ceramics, Inc. | 129,800 | | 20,258 |
Halliburton Co. | 5,300,800 | | 290,113 |
Helmerich & Payne, Inc. | 218,100 | | 15,060 |
ION Geophysical Corp. (a) | 606,700 | | 6,152 |
National Oilwell Varco, Inc. | 1,180,000 | | 95,073 |
Schlumberger Ltd. | 2,556,100 | | 230,995 |
Transocean Ltd. (United States) | 680,000 | | 41,861 |
| | 807,902 |
Oil, Gas & Consumable Fuels - 5.2% |
Alpha Natural Resources, Inc. (a) | 1,894,799 | | 80,927 |
Amyris, Inc. | 34,657 | | 802 |
Anadarko Petroleum Corp. | 194,800 | | 16,083 |
Cabot Oil & Gas Corp. | 768,300 | | 56,916 |
Chesapeake Energy Corp. | 772,800 | | 26,546 |
Chevron Corp. | 715,000 | | 74,374 |
Continental Resources, Inc. (a) | 271,700 | | 18,636 |
EV Energy Partners LP | 241,100 | | 16,969 |
Exxon Mobil Corp. | 3,501,900 | | 279,417 |
Hess Corp. | 419,900 | | 28,788 |
Marathon Petroleum Corp. | 383,200 | | 16,780 |
Occidental Petroleum Corp. | 1,137,600 | | 111,690 |
Solazyme, Inc. | 180,800 | | 4,131 |
Western Refining, Inc. (a)(d) | 889,200 | | 18,166 |
| | 750,225 |
TOTAL ENERGY | | 1,558,127 |
Common Stocks - continued |
| Shares | | Value (000s) |
FINANCIALS - 2.4% |
Capital Markets - 0.3% |
Morgan Stanley | 1,693,400 | | $ 37,678 |
Commercial Banks - 0.2% |
HDFC Bank Ltd. | 1,262,465 | | 13,895 |
ICICI Bank Ltd. | 666,777 | | 15,588 |
| | 29,483 |
Consumer Finance - 0.4% |
Discover Financial Services | 1,578,300 | | 40,420 |
Shriram Transport Finance Co. Ltd. | 1,309,840 | | 18,978 |
| | 59,398 |
Diversified Financial Services - 1.3% |
Citigroup, Inc. | 4,889,020 | | 187,445 |
Real Estate Management & Development - 0.2% |
Parsvnath Developers Ltd. (a)(e) | 21,771,340 | | 22,924 |
Thrifts & Mortgage Finance - 0.0% |
Housing Development Finance Corp. Ltd. | 335,144 | | 5,223 |
TOTAL FINANCIALS | | 342,151 |
HEALTH CARE - 9.8% |
Biotechnology - 2.5% |
Alexion Pharmaceuticals, Inc. (a) | 622,900 | | 35,381 |
Alkermes, Inc. (a) | 917,100 | | 15,811 |
Amarin Corp. PLC ADR (a) | 1,645,200 | | 22,276 |
Amylin Pharmaceuticals, Inc. (a) | 1,832,100 | | 21,820 |
ARIAD Pharmaceuticals, Inc. (a) | 1,000,000 | | 11,890 |
Biogen Idec, Inc. (a) | 516,000 | | 52,565 |
Cepheid, Inc. (a) | 94,400 | | 3,565 |
Exelixis, Inc. (a) | 2,913,200 | | 22,432 |
Human Genome Sciences, Inc. (a) | 1,012,500 | | 21,273 |
InterMune, Inc. (a) | 778,802 | | 25,996 |
Micromet, Inc. (a) | 1,322,420 | | 7,485 |
Pharmasset, Inc. (a) | 64,800 | | 7,865 |
Regeneron Pharmaceuticals, Inc. (a) | 137,500 | | 7,296 |
Vertex Pharmaceuticals, Inc. (a) | 2,107,300 | | 109,285 |
| | 364,940 |
Health Care Equipment & Supplies - 1.2% |
C. R. Bard, Inc. | 117,200 | | 11,565 |
Covidien PLC | 1,321,600 | | 67,124 |
Edwards Lifesciences Corp. (a) | 165,100 | | 11,780 |
Common Stocks - continued |
| Shares | | Value (000s) |
HEALTH CARE - continued |
Health Care Equipment & Supplies - continued |
Mako Surgical Corp. (a) | 200,000 | | $ 5,762 |
The Cooper Companies, Inc. | 564,072 | | 43,146 |
Volcano Corp. (a) | 186,400 | | 5,855 |
William Demant Holding A/S (a) | 126,000 | | 11,057 |
Zoll Medical Corp. (a) | 130,900 | | 9,118 |
| | 165,407 |
Health Care Providers & Services - 3.5% |
Accretive Health, Inc. (a) | 642,000 | | 19,286 |
Aetna, Inc. | 217,900 | | 9,041 |
AmerisourceBergen Corp. | 176,900 | | 6,777 |
Apollo Hospitals Enterprise Ltd. | 649,448 | | 7,742 |
CIGNA Corp. | 382,800 | | 19,052 |
Express Scripts, Inc. (a) | 2,271,280 | | 123,240 |
Humana, Inc. | 311,100 | | 23,202 |
McKesson Corp. | 1,148,000 | | 93,126 |
Medco Health Solutions, Inc. (a) | 2,014,100 | | 126,647 |
Omnicare, Inc. | 50,300 | | 1,534 |
UnitedHealth Group, Inc. | 660,000 | | 32,756 |
Universal Health Services, Inc. Class B | 325,200 | | 16,143 |
WellPoint, Inc. | 266,900 | | 18,029 |
| | 496,575 |
Health Care Technology - 0.5% |
Cerner Corp. (a) | 978,200 | | 65,041 |
SXC Health Solutions Corp. (a) | 163,800 | | 10,367 |
| | 75,408 |
Life Sciences Tools & Services - 0.2% |
Illumina, Inc. (a) | 220,400 | | 13,764 |
Sequenom, Inc. (a)(d) | 2,457,600 | | 17,351 |
| | 31,115 |
Pharmaceuticals - 1.9% |
Allergan, Inc. | 126,100 | | 10,253 |
AVANIR Pharmaceuticals Class A (a)(d) | 1,264,000 | | 4,740 |
Elan Corp. PLC sponsored ADR (a) | 2,231,100 | | 24,676 |
Endocyte, Inc. | 1,477,700 | | 19,698 |
GlaxoSmithKline PLC sponsored ADR | 345,300 | | 15,338 |
Johnson & Johnson | 1,943,800 | | 125,939 |
Novo Nordisk A/S Series B | 76,779 | | 9,391 |
Sanofi-Aventis sponsored ADR | 371,600 | | 14,400 |
Common Stocks - continued |
| Shares | | Value (000s) |
HEALTH CARE - continued |
Pharmaceuticals - continued |
Shire PLC sponsored ADR | 152,700 | | $ 15,881 |
Valeant Pharmaceuticals International, Inc. (Canada) | 499,900 | | 27,517 |
| | 267,833 |
TOTAL HEALTH CARE | | 1,401,278 |
INDUSTRIALS - 9.4% |
Aerospace & Defense - 3.7% |
BE Aerospace, Inc. (a) | 177,700 | | 7,072 |
Honeywell International, Inc. | 940,800 | | 49,956 |
Precision Castparts Corp. | 787,600 | | 127,103 |
The Boeing Co. | 2,166,100 | | 152,645 |
United Technologies Corp. | 2,463,600 | | 204,085 |
| | 540,861 |
Air Freight & Logistics - 0.4% |
United Parcel Service, Inc. Class B | 769,600 | | 53,272 |
Airlines - 0.2% |
Copa Holdings SA Class A | 426,600 | | 27,989 |
Building Products - 0.2% |
Armstrong World Industries, Inc. | 920,900 | | 36,376 |
Commercial Services & Supplies - 0.1% |
Swisher Hygiene, Inc. (g) | 1,159,960 | | 5,243 |
Swisher Hygiene, Inc. (g) | 935,531 | | 3,806 |
| | 9,049 |
Construction & Engineering - 0.9% |
Fluor Corp. | 1,660,700 | | 105,504 |
KBR, Inc. | 550,900 | | 19,640 |
| | 125,144 |
Electrical Equipment - 0.3% |
Polypore International, Inc. (a) | 667,500 | | 45,390 |
Industrial Conglomerates - 1.2% |
Carlisle Companies, Inc. | 319,900 | | 13,829 |
Danaher Corp. | 2,360,600 | | 115,929 |
General Electric Co. | 2,358,000 | | 42,232 |
| | 171,990 |
Machinery - 1.7% |
Caterpillar, Inc. | 446,300 | | 44,090 |
Cummins, Inc. | 730,900 | | 76,657 |
Fanuc Corp. | 169,500 | | 32,176 |
Common Stocks - continued |
| Shares | | Value (000s) |
INDUSTRIALS - continued |
Machinery - continued |
Ingersoll-Rand Co. Ltd. | 921,300 | | $ 34,475 |
Jain Irrigation Systems Ltd. | 780,008 | | 3,073 |
Kennametal, Inc. | 176,100 | | 6,944 |
Pall Corp. | 443,900 | | 22,009 |
WABCO Holdings, Inc. (a) | 399,900 | | 25,214 |
| | 244,638 |
Road & Rail - 0.6% |
CSX Corp. | 787,200 | | 19,342 |
Union Pacific Corp. | 649,400 | | 66,551 |
| | 85,893 |
Trading Companies & Distributors - 0.1% |
Mills Estruturas e Servicos de Engenharia SA | 827,400 | | 11,201 |
TOTAL INDUSTRIALS | | 1,351,803 |
INFORMATION TECHNOLOGY - 33.8% |
Communications Equipment - 3.6% |
Alcatel-Lucent SA sponsored ADR (a) | 25,984,395 | | 105,237 |
Cisco Systems, Inc. | 1,378,300 | | 22,011 |
HTC Corp. | 23,300 | | 692 |
Juniper Networks, Inc. (a) | 2,002,700 | | 46,843 |
Polycom, Inc. (a) | 847,300 | | 22,903 |
QUALCOMM, Inc. | 6,009,000 | | 329,173 |
Riverbed Technology, Inc. (a) | 700 | | 20 |
| | 526,879 |
Computers & Peripherals - 10.0% |
Apple, Inc. (a) | 2,968,300 | | 1,159,056 |
EMC Corp. (a) | 3,372,000 | | 87,942 |
Fusion-io, Inc. | 100,600 | | 2,979 |
NetApp, Inc. (a)(d) | 2,672,700 | | 127,007 |
SanDisk Corp. (a) | 1,455,800 | | 61,915 |
| | 1,438,899 |
Electronic Equipment & Components - 0.1% |
Fabrinet (a) | 683,381 | | 10,524 |
TE Connectivity Ltd. | 155,045 | | 5,338 |
| | 15,862 |
Internet Software & Services - 7.2% |
Baidu.com, Inc. sponsored ADR (a) | 198,700 | | 31,210 |
eBay, Inc. (a) | 3,588,840 | | 117,535 |
Common Stocks - continued |
| Shares | | Value (000s) |
INFORMATION TECHNOLOGY - continued |
Internet Software & Services - continued |
Facebook, Inc. Class B (a)(g) | 636,167 | | $ 15,904 |
Google, Inc. Class A (a) | 1,115,967 | | 673,698 |
GREE, Inc. | 356,900 | | 8,194 |
IAC/InterActiveCorp (a) | 463,500 | | 19,184 |
INFO Edge India Ltd. | 293,110 | | 4,969 |
Mail.ru Group Ltd. GDR (a)(f) | 1,193,100 | | 42,618 |
OpenTable, Inc. (a) | 139,651 | | 9,896 |
Rackspace Hosting, Inc. (a) | 1,959,600 | | 78,384 |
SINA Corp. (a) | 60,100 | | 6,496 |
Velti PLC (a) | 1,398,000 | | 23,081 |
| | 1,031,169 |
IT Services - 2.7% |
Accenture PLC Class A | 698,100 | | 41,286 |
Cognizant Technology Solutions Corp. Class A (a) | 1,541,100 | | 107,677 |
MasterCard, Inc. Class A | 611,400 | | 185,407 |
ServiceSource International, Inc. (d) | 322,900 | | 6,025 |
Visa, Inc. Class A | 524,923 | | 44,902 |
| | 385,297 |
Semiconductors & Semiconductor Equipment - 3.9% |
Altera Corp. | 1,336,000 | | 54,616 |
Avago Technologies Ltd. | 3,152,700 | | 106,025 |
Broadcom Corp. Class A | 3,610,500 | | 133,841 |
Freescale Semiconductor Holdings I Ltd. | 1,955,069 | | 31,926 |
GT Solar International, Inc. (a)(d) | 1,567,100 | | 21,375 |
Marvell Technology Group Ltd. (a) | 3,088,986 | | 45,779 |
NVIDIA Corp. (a) | 6,614,973 | | 91,485 |
NXP Semiconductors NV | 2,090,000 | | 41,340 |
PMC-Sierra, Inc. (a) | 4,712,600 | | 32,941 |
| | 559,328 |
Software - 6.3% |
BroadSoft, Inc. (a) | 815,700 | | 23,827 |
Check Point Software Technologies Ltd. (a) | 1,510,000 | | 87,052 |
Citrix Systems, Inc. (a) | 363,000 | | 26,151 |
Electronic Arts, Inc. (a) | 1,201,000 | | 26,722 |
Informatica Corp. (a) | 1,168,000 | | 59,720 |
Microsoft Corp. | 4,475,400 | | 122,626 |
MicroStrategy, Inc. Class A (a) | 44,800 | | 7,140 |
Nuance Communications, Inc. (a) | 1,265,900 | | 25,331 |
Oracle Corp. | 7,566,300 | | 231,377 |
QLIK Technologies, Inc. | 1,011,763 | | 30,667 |
Common Stocks - continued |
| Shares | | Value (000s) |
INFORMATION TECHNOLOGY - continued |
Software - continued |
RealPage, Inc. (d) | 66,073 | | $ 1,589 |
Red Hat, Inc. (a) | 1,604,700 | | 67,526 |
Rovi Corp. (a) | 150,200 | | 7,956 |
salesforce.com, Inc. (a) | 730,265 | | 105,677 |
VMware, Inc. Class A (a) | 860,700 | | 86,363 |
| | 909,724 |
TOTAL INFORMATION TECHNOLOGY | | 4,867,158 |
MATERIALS - 3.7% |
Chemicals - 2.6% |
Celanese Corp. Class A | 268,700 | | 14,813 |
CF Industries Holdings, Inc. | 591,800 | | 91,918 |
E.I. du Pont de Nemours & Co. | 676,000 | | 34,760 |
LyondellBasell Industries NV Class A | 1,734,300 | | 68,435 |
Monsanto Co. | 240,700 | | 17,687 |
Potash Corp. of Saskatchewan, Inc. | 252,800 | | 14,595 |
Rockwood Holdings, Inc. (a) | 572,600 | | 34,625 |
The Mosaic Co. | 1,343,700 | | 95,026 |
| | 371,859 |
Containers & Packaging - 0.1% |
Ball Corp. | 365,600 | | 14,185 |
Metals & Mining - 1.0% |
Carpenter Technology Corp. | 733,325 | | 42,122 |
Freeport-McMoRan Copper & Gold, Inc. | 1,615,000 | | 85,530 |
Royal Gold, Inc. | 188,800 | | 12,102 |
| | 139,754 |
TOTAL MATERIALS | | 525,798 |
TOTAL COMMON STOCKS (Cost $10,729,699) | 14,135,338 |
Preferred Stocks - 1.5% |
| | | |
Convertible Preferred Stocks - 0.2% |
CONSUMER DISCRETIONARY - 0.1% |
Textiles, Apparel & Luxury Goods - 0.1% |
Michael Kors Holdings Ltd. (a)(g) | 325,704 | | 15,000 |
Preferred Stocks - continued |
| Shares | | Value (000s) |
Convertible Preferred Stocks - continued |
HEALTH CARE - 0.1% |
Pharmaceuticals - 0.1% |
Merrimack Pharmaceuticals, Inc. Series G (g) | 2,142,858 | | $ 15,000 |
TOTAL CONVERTIBLE PREFERRED STOCKS | | 30,000 |
Nonconvertible Preferred Stocks - 1.3% |
CONSUMER DISCRETIONARY - 1.3% |
Automobiles - 1.3% |
Porsche Automobil Holding SE (Germany) | 1,026,800 | | 79,197 |
Volkswagen AG | 547,800 | | 109,762 |
| | 188,959 |
TOTAL PREFERRED STOCKS (Cost $171,905) | 218,959 |
Money Market Funds - 1.0% |
| | | |
Fidelity Securities Lending Cash Central Fund,
0.15% (b)(c)
(Cost $146,021) | 146,021,398 | | 146,021 |
TOTAL INVESTMENT PORTFOLIO - 100.8% (Cost $11,047,625) | | 14,500,318 |
NET OTHER ASSETS (LIABILITIES) - (0.8)% | | (109,870) |
NET ASSETS - 100% | $ 14,390,448 |
Legend |
(a) Non-income producing |
(b) Affiliated fund that is available only to investment companies and other accounts managed by Fidelity Investments. The rate quoted is the annualized seven-day yield of the fund at period end. A complete unaudited listing of the fund's holdings as of its most recent quarter end is available upon request. In addition, each Fidelity Central Fund's financial statements, which are not covered by the Fund's Report of Independent Registered Public Accounting Firm, are available on the SEC's website or upon request. |
(c) Investment made with cash collateral received from securities on loan. |
(d) Security or a portion of the security is on loan at period end. |
(e) Affiliated company |
(f) Security exempt from registration under Rule 144A of the Securities Act of 1933. These securities may be resold in transactions exempt from registration, normally to qualified institutional buyers. At the end of the period, the value of these securities amounted to $42,618,000 or 0.3% of net assets. |
(g) Restricted securities - Investment in securities not registered under the Securities Act of 1933 (excluding 144A issues). At the end of the period, the value of restricted securities (excluding 144A issues) amounted to $54,953,000 or 0.4% of net assets. |
Additional information on each restricted holding is as follows: |
Security | Acquisition Date | Acquisition Cost (000s) |
Facebook, Inc. Class B | 3/31/11 - 5/19/11 | $ 15,909 |
Merrimack Pharmaceuticals, Inc. Series G | 3/31/11 | $ 15,000 |
Michael Kors Holdings Ltd. | 7/8/11 | $ 15,000 |
Swisher Hygiene, Inc. | 3/22/11 | $ 5,800 |
Swisher Hygiene, Inc. | 4/15/11 | $ 7,204 |
Affiliated Central Funds |
Information regarding fiscal year to date income earned by the Fund from investments in Fidelity Central Funds is as follows: |
Fund | Income earned
(Amounts in thousands) |
Fidelity Cash Central Fund | $ 54 |
Fidelity Securities Lending Cash Central Fund | 1,516 |
Total | $ 1,570 |
Other Affiliated Issuers |
An affiliated company is a company in which the Fund has ownership of at least 5% of the voting securities. Fiscal year to date transactions with companies which are or were affiliates are as follows: |
Affiliates
(Amounts in thousands) | Value, beginning of period | Purchases | Sales Proceeds | Dividend Income | Value,
end of
period |
Furniture Brands International, Inc. | $ 16,160 | $ - | $ 14,466 | $ - | $ - |
Parsvnath Developers Ltd. | 18,023 | 14,168 | - | - | 22,924 |
Total | $ 34,183 | $ 14,168 | $ 14,466 | $ - | $ 22,924 |
Other Information |
The following is a summary of the inputs used, as of July 31, 2011, involving the Fund's assets and liabilities carried at fair value. The inputs or methodology used for valuing securities may not be an indication of the risk associated with investing in those securities. For more information on valuation inputs, and their aggregation into the levels used in the tables below, please refer to the Security Valuation section in the accompanying Notes to Financial Statements. |
Valuation Inputs at Reporting Date: |
Description
(Amounts in thousands) | Total | Level 1 | Level 2 | Level 3 |
Investments in Securities: | | | | |
Equities: | | | | |
Consumer Discretionary | $ 2,766,580 | $ 2,751,580 | $ - | $ 15,000 |
Consumer Staples | 1,526,402 | 1,526,402 | - | - |
Energy | 1,558,127 | 1,558,127 | - | - |
Financials | 342,151 | 312,668 | 29,483 | - |
Health Care | 1,416,278 | 1,391,887 | 9,391 | 15,000 |
Industrials | 1,351,803 | 1,347,997 | 3,806 | - |
Information Technology | 4,867,158 | 4,851,254 | - | 15,904 |
Materials | 525,798 | 525,798 | - | - |
Money Market Funds | 146,021 | 146,021 | - | - |
Total Investments in Securities: | $ 14,500,318 | $ 14,411,734 | $ 42,680 | $ 45,904 |
The following is a reconciliation of Investments in Securities for which Level 3 inputs were used in determining value: |
(Amounts in thousands) | |
Investments in Securities: | |
Beginning Balance | $ 6,774 |
Total Realized Gain (Loss) | (1,136) |
Total Unrealized Gain (Loss) | 170 |
Cost of Purchases | 45,908 |
Proceeds of Sales | (5,812) |
Amortization/Accretion | - |
Transfers in to Level 3 | - |
Transfers out of Level 3 | - |
Ending Balance | $ 45,904 |
The change in unrealized gain (loss) for the period attributable to Level 3 securities held at July 31, 2011 | $ (4) |
The information used in the above reconciliation represents fiscal year to date activity for any Investments in Securities identified as using Level 3 inputs at either the beginning or the end of the current fiscal period. Transfers in or out of Level 3 represent the beginning value of any Security or Instrument where a change in the pricing level occurred from the beginning to the end of the period. The cost of purchases and the proceeds of sales may include securities received or delivered through corporate actions or exchanges. Realized and unrealized gains (losses) disclosed in the reconciliation are included in Net Gain (Loss) on the Fund's Statement of Operations. |
Distribution of investments by country of issue, as a percentage of total net assets, is as follows: (Unaudited) |
United States of America | 87.0% |
Germany | 1.6% |
Curacao | 1.6% |
Ireland | 1.2% |
France | 1.0% |
Others (Individually Less Than 1%) | 7.6% |
| 100.0% |
Income Tax Information |
The Fund intends to elect to defer to its fiscal year ending July 31, 2012 approximately $7,175,000 of currency losses recognized during the period November 1, 2010 to July 31, 2011. |
See accompanying notes which are an integral part of the financial statements.
Annual Report
Statement of Assets and Liabilities
Amounts in thousands (except per-share amounts) | July 31, 2011 |
| | |
Assets | | |
Investment in securities, at value (including securities loaned of $140,857) - See accompanying schedule: Unaffiliated issuers (cost $10,870,753) | $ 14,331,373 | |
Fidelity Central Funds (cost $146,021) | 146,021 | |
Other affiliated issuers (cost $30,851) | 22,924 | |
Total Investments (cost $11,047,625) | | $ 14,500,318 |
Receivable for investments sold | | 325,167 |
Receivable for fund shares sold | | 13,859 |
Dividends receivable | | 3,107 |
Distributions receivable from Fidelity Central Funds | | 193 |
Other receivables | | 1,218 |
Total assets | | 14,843,862 |
| | |
Liabilities | | |
Payable to custodian bank | $ 93 | |
Payable for investments purchased | 217,799 | |
Payable for fund shares redeemed | 70,986 | |
Accrued management fee | 8,786 | |
Notes payable to affiliates | 6,851 | |
Other affiliated payables | 2,289 | |
Other payables and accrued expenses | 589 | |
Collateral on securities loaned, at value | 146,021 | |
Total liabilities | | 453,414 |
| | |
Net Assets | | $ 14,390,448 |
Net Assets consist of: | | |
Paid in capital | | $ 10,512,137 |
Accumulated net investment loss | | (7,667) |
Accumulated undistributed net realized gain (loss) on investments and foreign currency transactions | | 433,284 |
Net unrealized appreciation (depreciation) on investments and assets and liabilities in foreign currencies | | 3,452,694 |
Net Assets | | $ 14,390,448 |
See accompanying notes which are an integral part of the financial statements.
Annual Report
Financial Statements - continued
Statement of Assets and Liabilities - continued
Amounts in thousands (except per-share amounts) | July 31, 2011 |
| | |
Blue Chip Growth:
Net Asset Value, offering price and redemption price per share ($12,024,038 ÷ 249,612 shares) | | $ 48.17 |
| | |
Class K:
Net Asset Value, offering price and redemption price per share ($1,454,854 ÷ 30,179 shares) | | $ 48.21 |
| | |
Class F:
Net Asset Value, offering price and redemption price per share ($911,556 ÷ 18,896 shares) | | $ 48.24 |
See accompanying notes which are an integral part of the financial statements.
Annual Report
Statement of Operations
Amounts in thousands | Year ended July 31, 2011 |
| | |
Investment Income | | |
Dividends | | $ 116,312 |
Interest | | 4 |
Income from Fidelity Central Funds | | 1,570 |
Total income | | 117,886 |
| | |
Expenses | | |
Management fee
Basic fee | $ 76,012 | |
Performance adjustment | 19,530 | |
Transfer agent fees | 26,204 | |
Accounting and security lending fees | 1,466 | |
Custodian fees and expenses | 448 | |
Independent trustees' compensation | 72 | |
Appreciation in deferred trustee compensation account | 1 | |
Registration fees | 144 | |
Audit | 111 | |
Legal | 64 | |
Interest | 15 | |
Miscellaneous | 139 | |
Total expenses before reductions | 124,206 | |
Expense reductions | (1,803) | 122,403 |
Net investment income (loss) | | (4,517) |
Realized and Unrealized Gain (Loss) Net realized gain (loss) on: | | |
Investment securities: | | |
Unaffiliated issuers | 1,575,157 | |
Other affiliated issuers | (10,044) | |
Foreign currency transactions | (2,955) | |
Total net realized gain (loss) | | 1,562,158 |
Change in net unrealized appreciation (depreciation) on: Investment securities (net of decrease in deferred foreign taxes of $49) | 1,651,481 | |
Assets and liabilities in foreign currencies | 176 | |
Total change in net unrealized appreciation (depreciation) | | 1,651,657 |
Net gain (loss) | | 3,213,815 |
Net increase (decrease) in net assets resulting from operations | | $ 3,209,298 |
See accompanying notes which are an integral part of the financial statements.
Annual Report
Financial Statements - continued
Statement of Changes in Net Assets
Amounts in thousands | Year ended
July 31,
2011 | Year ended
July 31,
2010 |
Increase (Decrease) in Net Assets | | |
Operations | | |
Net investment income (loss) | $ (4,517) | $ 13,622 |
Net realized gain (loss) | 1,562,158 | 1,055,028 |
Change in net unrealized appreciation (depreciation) | 1,651,657 | 793,347 |
Net increase (decrease) in net assets resulting
from operations | 3,209,298 | 1,861,997 |
Distributions to shareholders from net investment income | (2,405) | (57,433) |
Distributions to shareholders from net realized gain | (12,451) | - |
Total distributions | (14,856) | (57,433) |
Share transactions - net increase (decrease) | (352,214) | (538,131) |
Total increase (decrease) in net assets | 2,842,228 | 1,266,433 |
| | |
Net Assets | | |
Beginning of period | 11,548,220 | 10,281,787 |
End of period (including accumulated net investment loss of $7,667 and undistributed net investment income of $2,062, respectively) | $ 14,390,448 | $ 11,548,220 |
See accompanying notes which are an integral part of the financial statements.
Annual Report
Financial Highlights - Blue Chip Growth
Years ended July 31, | 2011 | 2010 | 2009 | 2008 | 2007 |
Selected Per-Share Data | | | | | |
Net asset value, beginning of period | $ 37.63 | $ 31.97 | $ 39.06 | $ 46.88 | $ 41.54 |
Income from Investment Operations | | | | | |
Net investment income (loss) B | (.03) | .04 | .27 | .35 | .32 |
Net realized and unrealized gain (loss) | 10.61 | 5.80 | (6.36) | (2.89) | 6.19 |
Total from investment operations | 10.58 | 5.84 | (6.09) | (2.54) | 6.51 |
Distributions from net investment income | (.00) F, G | (.18) | (.29) | (.33) | (.24) |
Distributions from net realized gain | (.04) F | - | (.71) | (4.95) | (.93) |
Total distributions | (.04) | (.18) | (1.00) | (5.28) | (1.17) |
Net asset value, end of period | $ 48.17 | $ 37.63 | $ 31.97 | $ 39.06 | $ 46.88 |
Total Return A | 28.12% | 18.29% | (15.85)% | (6.30)% | 16.02% |
Ratios to Average Net Assets C,E | | | | | |
Expenses before reductions | .94% | .94% | .76% | .58% | .60% |
Expenses net of fee waivers, if any | .94% | .94% | .76% | .58% | .60% |
Expenses net of all reductions | .92% | .93% | .76% | .57% | .59% |
Net investment income (loss) | (.06)% | .10% | .93% | .81% | .72% |
Supplemental Data | | | | | |
Net assets, end of period (in millions) | $ 12,024 | $ 10,295 | $ 9,691 | $ 13,349 | $ 18,616 |
Portfolio turnover rate D | 132% | 135% | 134% | 82% | 87% |
A Total returns would have been lower if certain expenses had not been reduced during the applicable periods shown.
B Calculated based on average shares outstanding during the period.
C Fees and expenses of any underlying Fidelity Central Funds are not included in the Fund's expense ratio. The Fund indirectly bears its proportionate share of the expenses of any underlying Fidelity Central Funds.
D Amount does not include the portfolio activity of any underlying Fidelity Central Funds.
E Expense ratios reflect operating expenses of the class. Expenses before reductions do not reflect amounts reimbursed by the investment adviser or reductions from brokerage service arrangements or reductions from other expense offset arrangements and do not represent the amount paid by the class during periods when reimbursements or reductions occur. Expenses net of fee waivers reflect expenses after reimbursement by the investment adviser but prior to reductions from brokerage service arrangements or other expense offset arrangements. Expenses net of all reductions represent the net expenses paid by the class.
F The amount shown reflects certain reclassifications related to book to tax differences.
G Amount represents less than $.01 per share.
See accompanying notes which are an integral part of the financial statements.
Annual Report
Financial Highlights - Class K
Years ended July 31, | 2011 | 2010 | 2009 | 2008 G |
Selected Per-Share Data | | | | |
Net asset value, beginning of period | $ 37.66 | $ 32.01 | $ 39.07 | $ 41.81 |
Income from Investment Operations | | | | |
Net investment income (loss) D | .05 | .11 | .32 | .10 |
Net realized and unrealized gain (loss) | 10.62 | 5.79 | (6.33) | (2.84) |
Total from investment operations | 10.67 | 5.90 | (6.01) | (2.74) |
Distributions from net investment income | (.05) I | (.25) | (.34) | - |
Distributions from net realized gain | (.07) I | - | (.71) | - |
Total distributions | (.12) | (.25) | (1.05) | - |
Net asset value, end of period | $ 48.21 | $ 37.66 | $ 32.01 | $ 39.07 |
Total Return B,C | 28.37% | 18.48% | (15.61)% | (6.55)% |
Ratios to Average Net Assets E,H | | | | |
Expenses before reductions | .77% | .75% | .53% | .41% A |
Expenses net of fee waivers, if any | .77% | .75% | .53% | .41% A |
Expenses net of all reductions | .76% | .74% | .52% | .41% A |
Net investment income (loss) | .11% | .30% | 1.16% | 1.09% A |
Supplemental Data | | | | |
Net assets, end of period (000 omitted) | $ 1,454,854 | $ 931,601 | $ 590,673 | $ 93 |
Portfolio turnover rate F | 132% | 135% | 134% | 82% |
A Annualized
B Total returns for periods of less than one year are not annualized.
C Total returns would have been lower if certain expenses had not been reduced during the applicable periods shown.
D Calculated based on average shares outstanding during the period.
E Fees and expenses of any underlying Fidelity Central Funds are not included in the Fund's expense ratio. The Fund indirectly bears its proportionate share of the expenses of any underlying Fidelity Central Funds.
F Amount does not include the portfolio activity of any underlying Fidelity Central Funds.
G For the period May 9, 2008 (commencement of sale of shares) to July 31, 2008.
H Expense ratios reflect operating expenses of the class. Expenses before reductions do not reflect amounts reimbursed by the investment adviser or reductions from brokerage service arrangements or reductions from other expense offset arrangements and do not represent the amount paid by the class during periods when reimbursements or reductions occur. Expense ratios before reductions for start-up periods may not be representative of longer-term operating periods. Expenses net of fee waivers reflect expenses after reimbursement by the investment adviser but prior to reductions from brokerage service arrangements or other expense offset arrangements. Expenses net of all reductions represent the net expenses paid by the class.
I The amount shown reflects certain reclassifications related to book to tax differences.
See accompanying notes which are an integral part of the financial statements.
Annual Report
Financial Highlights - Class F
Years ended July 31, | 2011 | 2010 | 2009 G |
Selected Per-Share Data | | | |
Net asset value, beginning of period | $ 37.69 | $ 31.98 | $ 29.16 |
Income from Investment Operations | | | |
Net investment income (loss) D | .07 | .13 | - I |
Net realized and unrealized gain (loss) | 10.61 | 5.80 | 2.82 |
Total from investment operations | 10.68 | 5.93 | 2.82 |
Distributions from net investment income | (.06) J | (.22) | - |
Distributions from net realized gain | (.08) J | - | - |
Total distributions | (.13) K | (.22) | - |
Net asset value, end of period | $ 48.24 | $ 37.69 | $ 31.98 |
Total Return B,C | 28.41% | 18.59% | 9.67% |
Ratios to Average Net Assets E,H | | | |
Expenses before reductions | .72% | .70% | .51% A |
Expenses net of fee waivers, if any | .72% | .70% | .51% A |
Expenses net of all reductions | .71% | .68% | .51% A |
Net investment income (loss) | .16% | .35% | (.05)% A |
Supplemental Data | | | |
Net assets, end of period (000 omitted) | $ 911,556 | $ 321,409 | $ 261 |
Portfolio turnover rate F | 132% | 135% | 134% |
A Annualized
B Total returns for periods of less than one year are not annualized.
C Total returns would have been lower if certain expenses had not been reduced during the applicable periods shown.
D Calculated based on average shares outstanding during the period.
E Fees and expenses of any underlying Fidelity Central Funds are not included in the Fund's expense ratio. The Fund indirectly bears its proportionate share of the expenses of any underlying Fidelity Central Funds.
F Amount does not include the portfolio activity of any underlying Fidelity Central Funds.
G For the period June 26, 2009 (commencement of sale of shares) to July 31, 2009.
H Expense ratios reflect operating expenses of the class. Expenses before reductions do not reflect amounts reimbursed by the investment adviser or reductions from brokerage service arrangements or reductions from other expense offset arrangements and do not represent the amount paid by the class during periods when reimbursements or reductions occur. Expense ratios before reductions for start-up periods may not be representative of longer-term operating periods. Expenses net of fee waivers reflect expenses after reimbursement by the investment adviser but prior to reductions from brokerage service arrangements or other expense offset arrangements. Expenses net of all reductions represent the net expenses paid by the class.
I Amount represents less than $.01 per share.
J The amount shown reflects certain reclassifications related to book to tax differences.
K Total distributions of $.13 per share is comprised of distributions from net investment income of $.058 and distributions from net realized gain of $.076 per share.
See accompanying notes which are an integral part of the financial statements.
Annual Report
Notes to Financial Statements
For the period ended July 31, 2011
(Amounts in thousands except ratios)
1. Organization.
Fidelity Blue Chip Growth Fund (the Fund) is a fund of Fidelity Securities Fund (the Trust) and is authorized to issue an unlimited number of shares. The Trust is registered under the Investment Company Act of 1940, as amended (the 1940 Act), as an open-end management investment company organized as a Massachusetts business trust. The Fund offers Blue Chip Growth, Class K and Class F shares, each of which has equal rights as to assets and voting privileges. Each class has exclusive voting rights with respect to matters that affect that class. Class F shares of the Fund are only available for purchase by mutual funds for which Fidelity Management & Research Company (FMR) or an affiliate serves as investment manager. Investment income, realized and unrealized capital gains and losses, the common expenses of the Fund, and certain fund-level expense reductions, if any, are allocated on a pro-rata basis to each class based on the relative net assets of each class to the total net assets of the Fund. Each class differs with respect to transfer agent fees incurred. Certain expense reductions may also differ by class.
2. Investments in Fidelity Central Funds.
The Fund invests in Fidelity Central Funds, which are open-end investment companies available only to other investment companies and accounts managed by FMR and its affiliates. The Fund's Schedule of Investments lists each of the Fidelity Central Funds held as of period end, if any, as an investment of the Fund, but does not include the underlying holdings of each Fidelity Central Fund. As an Investing Fund, the Fund indirectly bears its proportionate share of the expenses of the underlying Fidelity Central Funds.
The Money Market Central Funds seek preservation of capital and current income and are managed by Fidelity Investments Money Management, Inc. (FIMM), an affiliate of FMR.
A complete unaudited list of holdings for each Fidelity Central Fund is available upon request or at the Securities and Exchange Commission (the SEC) web site at www.sec.gov. In addition, the financial statements of the Fidelity Central Funds, which are not covered by the Fund's Report of Independent Registered Public Accounting Firm, are available on the SEC web site or upon request.
3. Significant Accounting Policies.
The financial statements have been prepared in conformity with accounting principles generally accepted in the United States of America (GAAP), which require management to make certain estimates and assumptions at the date of the financial statements. Actual results could differ from those estimates. Subsequent events, if any, through the date that the financial statements were issued have been evaluated in the preparation of
Annual Report
Notes to Financial Statements - continued
(Amounts in thousands except ratios)
3. Significant Accounting Policies - continued
the financial statements. The following summarizes the significant accounting policies of the Fund:
Security Valuation. Investments are valued as of 4:00 p.m. Eastern time on the last calendar day of the period. The Fund uses independent pricing services approved by the Board of Trustees to value its investments. When current market prices or quotations are not readily available or reliable, valuations may be determined in good faith in accordance with procedures adopted by the Board of Trustees. Factors used in determining value may include market or security specific events. The frequency with which these procedures are used cannot be predicted and they may be utilized to a significant extent. The value used for net asset value (NAV) calculation under these procedures may differ from published prices for the same securities.
The Fund categorizes the inputs to valuation techniques used to value its investments into a disclosure hierarchy consisting of three levels as shown below:
Level 1 - quoted prices in active markets for identical investments
Level 2 - other significant observable inputs (including quoted prices for similar investments, interest rates, prepayment speeds, etc.)
Level 3 - unobservable inputs (including the Fund's own assumptions based on the best information available)
Changes in valuation techniques may result in transfers in or out of an assigned level within the disclosure hierarchy. The aggregate value of investments by input level, as of July 31, 2011, as well as a roll forward of Level 3 securities, is included at the end of the Fund's Schedule of Investments. Valuation techniques used to value the Fund's investments by major category are as follows:
Equity securities, including restricted securities, for which market quotations are readily available, are valued at the last reported sale price or official closing price as reported by an independent pricing service on the primary market or exchange on which they are traded and are categorized as Level 1 in the hierarchy. In the event there were no sales during the day or closing prices are not available, securities are valued at the last quoted bid price or may be valued using the last available price and are generally categorized as Level 2 in the hierarchy. For foreign equity securities, when significant market or security specific events arise, comparisons to the valuation of American Depositary Receipts (ADRs), futures contracts, Exchange-traded funds (ETFs) and certain indexes as well as quoted prices for similar securities are used and are categorized as Level 2 in the hierarchy in these circumstances. Utilizing these techniques may result in transfers between Level 1 and Level 2. For restricted equity securities and private placements where
Annual Report
3. Significant Accounting Policies - continued
Security Valuation - continued
observable inputs are limited, assumptions about market activity and risk are used and are categorized as Level 3 in the hierarchy.
Investments in open-end mutual funds, including the Fidelity Central Funds, are valued at their closing net asset value each business day and are categorized as Level 1 in the hierarchy.
Foreign Currency. The Fund may use foreign currency contracts to facilitate transactions in foreign-denominated securities. Gains and losses from these transactions may arise from changes in the value of the foreign currency or if the counterparties do not perform under the contracts' terms.
Foreign-denominated assets, including investment securities, and liabilities are translated into U.S. dollars at the exchange rate at period end. Purchases and sales of investment securities, income and dividends received and expenses denominated in foreign currencies are translated into U.S. dollars at the exchange rate in effect on the transaction date.
The effects of exchange rate fluctuations on investments are included with the net realized and unrealized gain (loss) on investment securities. Other foreign currency transactions resulting in realized and unrealized gain (loss) are disclosed separately.
Investment Transactions and Income. For financial reporting purposes, the Fund's investment holdings and NAV include trades executed through the end of the last business day of the period. The NAV per share for processing shareholder transactions is calculated as of the close of business of the New York Stock Exchange (NYSE), normally 4:00 p.m. Eastern time and includes trades executed through the end of the prior business day. Gains and losses on securities sold are determined on the basis of identified cost and may include proceeds received from litigation. Dividend income is recorded on the ex-dividend date, except for certain dividends from foreign securities where the ex-dividend date may have passed, which are recorded as soon as the Fund is informed of the ex-dividend date. Non-cash dividends included in dividend income, if any, are recorded at the fair market value of the securities received. Distributions received on securities that represent a return of capital or capital gain are recorded as a reduction of cost of investments and/or as a realized gain. The Fund estimates the components of distributions received that may be considered return of capital distributions or capital gain distributions. Interest income and distributions from the Fidelity Central Funds are accrued as earned. Interest income includes coupon interest and amortization of premium and accretion of discount on debt securities. Investment income is recorded net of foreign taxes withheld where recovery of such taxes is uncertain.
Annual Report
Notes to Financial Statements - continued
(Amounts in thousands except ratios)
3. Significant Accounting Policies - continued
Expenses. Expenses directly attributable to a fund are charged to that fund. Expenses attributable to more than one fund are allocated among the respective funds on the basis of relative net assets or other appropriate methods. Expense estimates are accrued in the period to which they relate and adjustments are made when actual amounts are known.
Deferred Trustee Compensation. Under a Deferred Compensation Plan (the Plan), independent Trustees may elect to defer receipt of a portion of their annual compensation. Deferred amounts are invested in a cross-section of Fidelity funds, are marked-to-market and remain in the Fund until distributed in accordance with the Plan. The investment of deferred amounts and the offsetting payable to the Trustees are included in the accompanying Statement of Assets and Liabilities.
Income Tax Information and Distributions to Shareholders. Each year, the Fund intends to qualify as a regulated investment company, including distributing substantially all of its taxable income and realized gains under Subchapter M of the Internal Revenue Code and filing its U.S. federal tax return. As a result, no provision for income taxes is required. As of July 31, 2011, the Fund did not have any unrecognized tax benefits in the financial statements. A fund's federal tax return is subject to examination by the Internal Revenue Service (IRS) for a period of three years. Foreign taxes are provided for based on the Fund's understanding of the tax rules and rates that exist in the foreign markets in which it invests.
Distributions are declared and recorded on the ex-dividend date. Income dividends and capital gain distributions are declared separately for each class. Income and capital gain distributions are determined in accordance with income tax regulations, which may differ from GAAP. These differences resulted in distribution reclassifications. In addition, the Fund claimed a portion of the payment made to redeeming shareholders as a distribution for income tax purposes.
Capital accounts within the financial statements are adjusted for permanent book-tax differences. These adjustments have no impact on net assets or the results of operations. Temporary book-tax differences will reverse in a subsequent period.
Book-tax differences are primarily due to foreign currency transactions, passive foreign investment companies (PFIC), partnerships, deferred trustees compensation, capital loss carryforwards and losses deferred due to wash sales and excise tax regulations.
Annual Report
3. Significant Accounting Policies - continued
Income Tax Information and Distributions to Shareholders - continued
The federal tax cost of investment securities and unrealized appreciation (depreciation) as of period end were as follows:
Gross unrealized appreciation | $ 3,629,356 |
Gross unrealized depreciation | (223,692) |
Net unrealized appreciation (depreciation) on securities and other investments | $ 3,405,664 |
| |
Tax Cost | $ 11,094,654 |
The tax-based components of distributable earnings as of period end were as follows:
Undistributed long-term capital gain | $ 480,312 |
Net unrealized appreciation (depreciation) | $ 3,405,665 |
Under the recently enacted Regulated Investment Company Modernization Act of 2010 (the Act), the Fund will be permitted to carry forward capital losses incurred in taxable years beginning after December 22, 2010 for an unlimited period. However, any losses incurred during those future taxable years will be required to be utilized prior to any losses incurred in pre-enactment taxable years, which generally expire after eight years from when they are incurred. Additionally, post-enactment capital losses that are carried forward will retain their character as either short-term or long-term capital losses rather than being considered all short-term as under previous law. The Fund's first fiscal year end subject to the Act will be July 31, 2012.
The tax character of distributions paid was as follows:
| July 31, 2011 | July 31, 2010 |
Ordinary Income | $ 2,405 | $ 57,433 |
Long-term Capital Gains | 12,451 | - |
Total | $ 14,856 | $ 57,433 |
New Accounting Pronouncement. In May 2011, the Financial Accounting Standards Board issued Accounting Standard Update No. 2011-04, Fair Value Measurement (Topic 820) - Amendments to Achieve Common Fair Value Measurement and Disclosure Requirements in U.S. GAAP and IFRSs. The update changes the wording used to describe the requirements in GAAP for measuring fair value and for disclosing information about fair value measurements. The update is effective during interim and annual periods beginning after December 15, 2011. Management is currently evaluating the impact of the update's adoption on the Fund's financial statement disclosures.
Annual Report
Notes to Financial Statements - continued
(Amounts in thousands except ratios)
4. Operating Policies.
Restricted Securities. The Fund may invest in securities that are subject to legal or contractual restrictions on resale. These securities generally may be resold in transactions exempt from registration or to the public if the securities are registered. Disposal of these securities may involve time-consuming negotiations and expense, and prompt sale at an acceptable price may be difficult. Information regarding restricted securities is included at the end of the Fund's Schedule of Investments.
5. Purchases and Sales of Investments.
Purchases and sales of securities, other than short-term securities, aggregated $17,822,174 and $18,155,781, respectively.
6. Fees and Other Transactions with Affiliates.
Management Fee. FMR and its affiliates provide the Fund with investment management related services for which the Fund pays a monthly management fee. The management fee is the sum of an individual fund fee rate that is based on an annual rate of .30% of the Fund's average net assets and a group fee rate that averaged .26% during the period. The group fee rate is based upon the average net assets of all the mutual funds advised by FMR. The group fee rate decreases as assets under management increase and increases as assets under management decrease. In addition, the management fee is subject to a performance adjustment (up to a maximum of ± .20% of the Fund's average net assets over a 36 month performance period). The upward or downward adjustment to the management fee is based on the relative investment performance of Blue Chip Growth as compared to an appropriate benchmark index. For the period, the total annual management fee rate, including the performance adjustment, was .70% of the Fund's average net assets.
Transfer Agent Fees. Fidelity Investments Institutional Operations Company, Inc. (FIIOC), an affiliate of FMR, is the transfer, dividend disbursing and shareholder servicing agent for each class of the Fund. FIIOC receives account fees and asset-based fees that vary according to the account size and type of account of the shareholders of Blue Chip Growth. FIIOC receives an asset-based fee of Class K's average net assets. FIIOC receives no fees for providing transfer agency services to Class F. FIIOC pays for typesetting, printing and mailing of shareholder reports, except proxy statements.
Annual Report
6. Fees and Other Transactions with Affiliates - continued
Transfer Agent Fees - continued
For the period, transfer agent fees for each class were as follows:
| Amount | % of
Average
Net Assets |
Blue Chip Growth | $ 25,585 | .22 |
Class K | 619 | .05 |
| $ 26,204 | |
Accounting and Security Lending Fees. Fidelity Service Company, Inc. (FSC), an affiliate of FMR, maintains the Fund's accounting records. The accounting fee is based on the level of average net assets for the month. Under a separate contract, FSC administers the security lending program. The security lending fee is based on the number and duration of lending transactions.
Brokerage Commissions. The Fund placed a portion of its portfolio transactions with brokerage firms which are affiliates of the investment adviser. The commissions paid to these affiliated firms were $536 for the period.
Interfund Lending Program. Pursuant to an Exemptive Order issued by the SEC, the Fund, along with other registered investment companies having management contracts with FMR, may participate in an interfund lending program. This program provides an alternative credit facility allowing the funds to borrow from, or lend money to, other participating affiliated funds. Any open loans, including accrued interest, at period end are presented under the caption "Notes payable to affiliates" in the Fund's Statement of Assets and Liabilities. The Fund's activity in this program during the period for which loans were outstanding was as follows:
Borrower or Lender | Average Daily
Loan Balance | Weighted Average Interest Rate | Interest
Expense |
Borrower | $ 18,305 | .44% | $ 12 |
7. Committed Line of Credit.
The Fund participates with other funds managed by FMR or an affiliate in a $4.0 billion credit facility (the "line of credit") to be utilized for temporary or emergency purposes to fund shareholder redemptions or for other short-term liquidity purposes. The Fund has agreed to pay commitment fees on its pro-rata portion of the line of credit, which amounted to $45 and is reflected in Miscellaneous expenses on the Statement of Operations. During the period, there were no borrowings on this line of credit.
Annual Report
Notes to Financial Statements - continued
(Amounts in thousands except ratios)
8. Security Lending.
The Fund lends portfolio securities through a lending agent from time to time in order to earn additional income. The lending agent may loan securities to certain qualified borrowers, including Fidelity Capital Markets (FCM), a broker-dealer affiliated with the Fund. On the settlement date of the loan, the Fund receives collateral (in the form of U.S. Treasury obligations, letters of credit and/or cash) against the loaned securities and maintains collateral in an amount not less than 100% of the market value of the loaned securities during the period of the loan. The market value of the loaned securities is determined at the close of business of the Fund and any additional required collateral is delivered to the Fund on the next business day. If the borrower defaults on its obligation to return the securities loaned because of insolvency or other reasons, a fund could experience delays and costs in recovering the securities loaned or in gaining access to the collateral. Any cash collateral received is invested in the Fidelity Securities Lending Cash Central Fund. The value of loaned securities and cash collateral at period end are disclosed on the Fund's Statement of Assets and Liabilities. The value of securities loaned to FCM at period end was $1,503. Security lending income represents the income earned on investing cash collateral, less rebates paid to borrowers and lending agent fees associated with the loan, plus any premium payments received for lending certain types of securities. Security lending income is presented in the Statement of Operations as a component of income from Fidelity Central Funds. Total security lending income during the period amounted to $1,516, including $24 from securities loaned to FCM.
9. Bank Borrowings.
The Fund is permitted to have bank borrowings for temporary or emergency purposes to fund shareholder redemptions or for other short-term liquidity requirements. The Fund has established borrowing arrangements with certain banks. The interest rate on the borrowings is the bank's base rate, as revised from time to time. The average daily loan balance during the period for which loans were outstanding amounted to $27,562. The weighted average interest rate was .69%. The interest expense amounted to $3 under the bank borrowing program. At period end, there were no bank borrowings outstanding.
10. Expense Reductions.
Many of the brokers with whom FMR places trades on behalf of the Fund provided services to the Fund in addition to trade execution. These services included payments of certain expenses on behalf of the Fund totaling $1,802 for the period. In addition, through arrangements with the Fund's custodian, credits realized as a result of uninvested cash balances were used to reduce the Fund's expenses. During the period, these credits reduced the Fund's custody expenses by $1.
Annual Report
11. Distributions to Shareholders.
Distributions to shareholders of each class were as follows:
Years ended July 31, | 2011 | 2010 |
From net investment income | | |
Blue Chip Growth | $ 670 | $ 52,296 |
Class K | 1,165 | 4,902 |
Class F | 570 | 235 |
Total | $ 2,405 | $ 57,433 |
From net realized gain | | |
Blue Chip Growth | $ 9,690 | $ - |
Class K | 1,750 | - |
Class F | 1,011 | - |
Total | $ 12,451 | $ - |
12. Share Transactions.
Transactions for each class of shares were as follows:
| Shares | Dollars |
Years ended July 31, | 2011 | 2010 A | 2011 | 2010 A |
Blue Chip Growth | | | | |
Shares sold | 42,281 | 41,698 | $ 1,904,203 | $ 1,553,486 |
Conversion to Class K | - | (604) | - | (19,981) |
Reinvestment of distributions | 232 | 1,459 | 10,166 | 51,338 |
Shares redeemed | (66,514) | (72,051) | (2,974,498) | (2,676,741) |
Net increase (decrease) | (24,001) | (29,498) | $ (1,060,129) | $ (1,091,898) |
Class K | | | | |
Shares sold | 13,902 | 11,377 | $ 625,856 | $ 427,050 |
Conversion from Blue Chip Growth | - | 603 | - | 19,981 |
Reinvestment of distributions | 70 | 139 | 2,916 | 4,902 |
Shares redeemed | (8,528) | (5,839) | (379,087) | (218,811) |
Net increase (decrease) | 5,444 | 6,280 | $ 249,685 | $ 233,122 |
Class F | | | | |
Shares sold | 12,501 | 8,796 | $ 558,704 | $ 331,310 |
Reinvestment of distributions | 38 | 6 | 1,580 | 235 |
Shares redeemed | (2,171) | (282) | (102,054) | (10,900) |
Net increase (decrease) | 10,368 | 8,520 | $ 458,230 | $ 320,645 |
A Conversion transactions for Class K and Blue Chip Growth are presented for the period August 1, 2009 through August 31, 2009.
Annual Report
Notes to Financial Statements - continued
(Amounts in thousands except ratios)
13. Other.
The Fund's organizational documents provide former and current trustees and officers with a limited indemnification against liabilities arising in connection with the performance of their duties to the Fund. In the normal course of business, the Fund may also enter into contracts that provide general indemnifications. The Fund's maximum exposure under these arrangements is unknown as this would be dependent on future claims that may be made against the Fund. The risk of material loss from such claims is considered remote.
Annual Report
To the Trustees of Fidelity Securities Fund and Shareholders of Fidelity Blue Chip Growth Fund:
We have audited the accompanying statement of assets and liabilities of Fidelity Blue Chip Growth Fund (the Fund), a fund of Fidelity Securities Fund, including the schedule of investments, as of July 31, 2011, and the related statement of operations for the year then ended, the statement of changes in net assets for each of the two years in the period then ended, and the financial highlights for each of the five years in the period then ended. These financial statements and financial highlights are the responsibility of the Fund's management. Our responsibility is to express an opinion on these financial statements and financial highlights based on our audits.
We conducted our audits in accordance with the standards of the Public Company Accounting Oversight Board (United States). Those standards require that we plan and perform the audit to obtain reasonable assurance about whether the financial statements and financial highlights are free of material misstatement. The Fund is not required to have, nor were we engaged to perform, an audit of its internal control over financial reporting. Our audits included consideration of internal control over financial reporting as a basis for designing audit procedures that are appropriate in the circumstances, but not for the purpose of expressing an opinion on the effectiveness of the Fund's internal control over financial reporting. Accordingly, we express no such opinion. An audit also includes examining, on a test basis, evidence supporting the amounts and disclosures in the financial statements, assessing the accounting principles used and significant estimates made by management, as well as evaluating the overall financial statement presentation. Our procedures included confirmation of securities owned as of July 31, 2011, by correspondence with the custodians and brokers; where replies were not received from brokers, we performed other auditing procedures. We believe that our audits provide a reasonable basis for our opinion.
In our opinion, the financial statements and financial highlights referred to above present fairly, in all material respects, the financial position of Fidelity Blue Chip Growth Fund as of July 31, 2011, the results of its operations for the year then ended, the changes in its net assets for each of the two years in the period then ended, and the financial highlights for each of the five years in the period then ended, in conformity with accounting principles generally accepted in the United States of America.
/s/ Deloitte & Touche LLP
DELOITTE & TOUCHE LLP
Boston, Massachusetts
September 16, 2011
Annual Report
The Trustees, Members of the Advisory Board, and executive officers of the trust and fund, as applicable, are listed below. The Board of Trustees governs the fund and is responsible for protecting the interests of shareholders. The Trustees are experienced executives who meet periodically throughout the year to oversee the fund's activities, review contractual arrangements with companies that provide services to the fund, oversee management of the risks associated with such activities and contractual arrangements, and review the fund's performance. Except for James C. Curvey, each of the Trustees oversees 221 funds advised by FMR or an affiliate. Mr. Curvey oversees 419 funds advised by FMR or an affiliate.
The Trustees hold office without limit in time except that (a) any Trustee may resign; (b) any Trustee may be removed by written instrument, signed by at least two-thirds of the number of Trustees prior to such removal; (c) any Trustee who requests to be retired or who has become incapacitated by illness or injury may be retired by written instrument signed by a majority of the other Trustees; and (d) any Trustee may be removed at any special meeting of shareholders by a two-thirds vote of the outstanding voting securities of the trust. Each Trustee who is not an interested person (as defined in the 1940 Act) (Independent Trustee), shall retire not later than the last day of the calendar year in which his or her 75th birthday occurs. The Independent Trustees may waive this mandatory retirement age policy with respect to individual Trustees. The executive officers and Advisory Board Members hold office without limit in time, except that any officer and Advisory Board Member may resign or may be removed by a vote of a majority of the Trustees at any regular meeting or any special meeting of the Trustees. Except as indicated, each individual has held the office shown or other offices in the same company for the past five years.
Experience, Skills, Attributes, and Qualifications of the Fund's Trustees. The Governance and Nominating Committee has adopted a statement of policy that describes the experience, qualifications, attributes, and skills that are necessary and desirable for potential Independent Trustee candidates (Statement of Policy). The Board believes that each Trustee satisfied at the time he or she was initially elected or appointed a Trustee, and continues to satisfy, the standards contemplated by the Statement of Policy. The Governance and Nominating Committee also engages professional search firms to help identify potential Independent Trustee candidates who have the experience, qualifications, attributes, and skills consistent with the Statement of Policy. From time to time, additional criteria based on the composition and skills of the current Independent Trustees, as well as experience or skills that may be appropriate in light of future changes to board composition, business conditions, and regulatory or other developments, have also been considered by the professional search firms and the Governance and Nominating Committee. In addition, the Board takes into account the Trustees' commitment and participation in Board and committee meetings, as well as their leadership of standing and ad hoc committees throughout their tenure.
In determining that a particular Trustee was and continues to be qualified to serve as a Trustee, the Board has considered a variety of criteria, none of which, in isolation, was controlling. The Board believes that, collectively, the Trustees have balanced and diverse experience, qualifications, attributes, and skills, which allow the Board to operate effectively in governing the fund and protecting the interests of shareholders. Information about the specific experience, skills, attributes, and qualifications of each Trustee, which in each case led to the Board's conclusion that the Trustee should serve (or continue to serve) as a trustee of the fund, is provided below.
Annual Report
Trustees and Officers - continued
Board Structure and Oversight Function. James C. Curvey is an interested person (as defined in the 1940 Act) and currently serves as Acting Chairman. The Trustees have determined that an interested Chairman is appropriate and benefits shareholders because an interested Chairman has a personal and professional stake in the quality and continuity of services provided to the fund. Independent Trustees exercise their informed business judgment to appoint an individual of their choosing to serve as Chairman, regardless of whether the Trustee happens to be independent or a member of management. The Independent Trustees have determined that they can act independently and effectively without having an Independent Trustee serve as Chairman and that a key structural component for assuring that they are in a position to do so is for the Independent Trustees to constitute a substantial majority for the Board. The Independent Trustees also regularly meet in executive session. Ned C. Lautenbach serves as Chairman of the Independent Trustees and as such (i) acts as a liaison between the Independent Trustees and management with respect to matters important to the Independent Trustees and (ii) with management prepares agendas for Board meetings.
Fidelity funds are overseen by different Boards of Trustees. The fund's Board oversees Fidelity's equity and high income funds and another Board oversees Fidelity's investment-grade bond, money market, and asset allocation funds. The asset allocation funds may invest in Fidelity funds overseen by the fund's Board. The use of separate Boards, each with its own committee structure, allows the Trustees of each group of Fidelity funds to focus on the unique issues of the funds they oversee, including common research, investment, and operational issues. On occasion, the separate Boards establish joint committees to address issues of overlapping consequences for the Fidelity funds overseen by each Board.
The Trustees operate using a system of committees to facilitate the timely and efficient consideration of all matters of importance to the Trustees, the fund, and fund shareholders and to facilitate compliance with legal and regulatory requirements and oversight of the fund's activities and associated risks. The Board, acting through its committees, has charged FMR and its affiliates with (i) identifying events or circumstances the occurrence of which could have demonstrably adverse effects on the fund's business and/or reputation; (ii) implementing processes and controls to lessen the possibility that such events or circumstances occur or to mitigate the effects of such events or circumstances if they do occur; and (iii) creating and maintaining a system designed to evaluate continuously business and market conditions in order to facilitate the identification and implementation processes described in (i) and (ii) above. Because the day-to-day operations and activities of the fund are carried out by or through FMR, its affiliates and other service providers, the fund's exposure to risks is mitigated but not eliminated by the processes overseen by the Trustees. While each of the Board's committees has responsibility for overseeing different aspects of the fund's activities, oversight is exercised primarily through the Operations, Audit, and Compliance Committees. Appropriate personnel, including but not limited to the fund's Chief Compliance Officer (CCO), FMR's internal auditor, the independent accountants, the fund's Treasurer and portfolio management personnel, make periodic reports to the Board's committees, as appropriate. The responsibilities of each committee, including their oversight responsibilities, are described further under "Standing Committees of the Fund's Trustees."
Annual Report
The fund's Statement of Additional Information (SAI) includes more information about the Trustees. To request a free copy, call Fidelity at 1-800-544-8544.
Interested Trustees*:
Correspondence intended for each Trustee who is an interested person may be sent to Fidelity Investments, 82 Devonshire Street, Boston, Massachusetts 02109.
Name, Age; Principal Occupations and Other Relevant Experience+ |
James C. Curvey (76) |
| Year of Election or Appointment: 2007
Mr. Curvey is Trustee and Acting Chairman of the Board of Trustees of certain Trusts. Mr. Curvey also serves as Trustee (2007-present) of other investment companies advised by FMR. Mr. Curvey is a Director of Fidelity Investments Money Management, Inc. (2009-present), Director of Fidelity Research & Analysis Co. (2009-present) and Director of FMR and FMR Co., Inc. (2007-present). Mr. Curvey is also Vice Chairman (2007-present) and Director of FMR LLC. In addition, Mr. Curvey serves as an Overseer for the Boston Symphony Orchestra and a member of the Trustees of Villanova University. Previously, Mr. Curvey was the Vice Chairman (2006-2007) and Director (2000-2007) of FMR Corp. |
Ronald P. O'Hanley (54) |
| Year of Election or Appointment: 2011
Mr. O'Hanley is Director of FMR Co., Inc. (2010-present), Director of Fidelity Investments Money Management, Inc. (2010-present), Director of Fidelity Research & Analysis Company (2010-present), President of Fidelity Asset Management and Corporate Services and a member of Fidelity's Executive Committee (2010-present). Previously, Mr. O'Hanley served as President and Chief Executive Officer of BNY Mellon Asset Management (2007-2010). Mr. O'Hanley also served as Vice Chairman of Bank New York Mellon Corp. and a member of that firm's Executive Committee. Prior to the 2007 merger of The Bank of New York and Mellon Financial Corporation, he was Vice Chairman of Mellon Financial Corporation and President and Chief Executive Officer of Mellon Asset Management. He joined Mellon in February 1997. Mr. O'Hanley currently serves as Chairman of the Boston Public Library Foundation Board of Directors and sits on the Board of Directors of Beth Israel Deaconess Medical Center, the Board of Trustees of the Marine Biological Laboratory and the Advisory Board of the Maxwell School of Citizenship and Public Administration at Syracuse University. Mr. O'Hanley also chairs the Council on Asset Management for the Financial Services Roundtable and is a member of the Board of Directors of Institutional Investor's U.S. Institute. |
* Trustees have been determined to be "Interested Trustees" by virtue of, among other things, their affiliation with the trust or various entities under common control with FMR.
+ The information above includes each Trustee's principal occupation during the last five years and other information relating to the experience, attributes, and skills relevant to each Trustee's qualifications to serve as a Trustee, which led to the conclusion that each Trustee should serve as a Trustee for the fund.
Independent Trustees:
Correspondence intended for each Independent Trustee (that is, the Trustees other than the Interested Trustees) may be sent to Fidelity Investments, P.O. Box 55235, Boston, Massachusetts 02205-5235.
Annual Report
Name, Age; Principal Occupations and Other Relevant Experience+ |
Dennis J. Dirks (63) |
| Year of Election or Appointment: 2005 Prior to his retirement in May 2003, Mr. Dirks was Chief Operating Officer and a member of the Board of The Depository Trust & Clearing Corporation (DTCC). He also served as President, Chief Operating Officer, and Board member of The Depository Trust Company (DTC) and President and Board member of the National Securities Clearing Corporation (NSCC). In addition, Mr. Dirks served as Chief Executive Officer and Board member of the Government Securities Clearing Corporation, Chief Executive Officer and Board member of the Mortgage-Backed Securities Clearing Corporation, as a Trustee and a member of the Finance Committee of Manhattan College (2005-2008), and as a Trustee and a member of the Finance Committee of AHRC of Nassau County (2006-2008). Mr. Dirks is a member of the Independent Directors Council (IDC) Governing Council (2010-Present) and Board of Directors for The Brookville Center for Children's Services, Inc. (2009-present). |
Alan J. Lacy (57) |
| Year of Election or Appointment: 2008 Mr. Lacy serves as Senior Adviser (2007-present) of Oak Hill Capital Partners, L.P. (private equity). Mr. Lacy also served as Chief Executive Officer (2000-2005) and Vice Chairman (2005-2006) of Sears Holdings Corporation and Sears, Roebuck and Co. (retail). In addition, Mr. Lacy serves as a member of the Board of Directors of Dave & Buster's, Inc. (restaurant and entertainment complexes, 2010-present), The Hillman Companies, Inc. (hardware wholesalers, 2010-present), and Bristol-Myers Squibb Company (global pharmaceuticals, 2007-present). Mr. Lacy is a member of the Board of Trustees of The National Parks Conservation Association (2006-Present). Previously, Mr. Lacy served as Chairman of the Board of Trustees of the National Parks Conservation Association (2008-2011) and as a member of the Board of Directors for the Western Union Company (global money transfer, 2006-2011). |
Ned C. Lautenbach (67) |
| Year of Election or Appointment: 2000 Mr. Lautenbach is Chairman of the Independent Trustees of the Equity and High Income Funds (2006-present). Mr. Lautenbach currently serves as the Lead Director of the Eaton Corporation Board of Directors (diversified industrial, 1997-present). Mr. Lautenbach is also a member of the Board of Directors of the Philharmonic Center for the Arts in Naples, Florida (1999-present); a member of the Board of Trustees of Fairfield University (2005-present); and a member of the Council on Foreign Relations (1994-present). Previously, Mr. Lautenbach was a Partner/Advisory Partner at Clayton, Dubilier & Rice, LLC (private equity investment, 1998-2010), as well as a Director of Sony Corporation (2006-2007). |
Joseph Mauriello (66) |
| Year of Election or Appointment: 2008 Prior to his retirement in January 2006, Mr. Mauriello served in numerous senior management positions including Deputy Chairman and Chief Operating Officer (2004-2005), and Vice Chairman of Financial Services (2002-2004) of KPMG LLP US (professional services, 1965-2005). Mr. Mauriello currently serves as a member of the Board of Directors of XL Group plc. (global insurance and re-insurance, 2006-present) and of Arcadia Resources Inc. (health care services and products, 2007-present). Previously, Mr. Mauriello served as a Director of the Hamilton Funds of the Bank of New York (2006-2007). |
Robert W. Selander (60) |
| Year of Election or Appointment: 2011
Previously, Mr. Selander served as a Member of the Advisory Board of Fidelity's Equity and High Income Funds (2011), Executive Vice Chairman (2010), Chief Executive Officer (2009-2010), and President and Chief Executive Officer (1997-2009) of Mastercard, Inc. |
Cornelia M. Small (67) |
| Year of Election or Appointment: 2005 Ms. Small is a member of the Board of Directors of the Teagle Foundation (2009-present). Ms. Small is also a member of the Investment Committee, and Chair (2008-present) and a member of the Board of Trustees of Smith College. In addition, Ms. Small serves on the Investment Committee of the Berkshire Taconic Community Foundation (2008-present). Previously, Ms. Small served as Chairperson of the Investment Committee (2002-2008) of Smith College. In addition, Ms. Small served as Chief Investment Officer, Director of Global Equity Investments, and a member of the Board of Directors of Scudder, Stevens & Clark and Scudder Kemper Investments. |
William S. Stavropoulos (72) |
| Year of Election or Appointment: 2002 Mr. Stavropoulos is Vice Chairman of the Independent Trustees of the Equity and High Income Funds (2006-present). Mr. Stavropoulos serves as President and Founder of the Michigan Baseball Foundation, the Great Lakes Loons (2007-present). Mr. Stavropoulos is Chairman Emeritus of the Board of Directors of The Dow Chemical Company, where he previously served in numerous senior management positions, including President, CEO (1995-2000; 2002-2004), Chairman of the Executive Committee (2000-2006), and as a member of the Board of Directors (1990-2006). Currently, Mr. Stavropoulos is Chairman of Univar (global distributor of commodity and specialty chemicals, 2010-present), a Director of Teradata Corporation (data warehousing and technology solutions, 2008-present), Chemical Financial Corporation, Maersk Inc. (industrial conglomerate), Tyco International, Inc. (multinational manufacturing and services, 2007-present), and a member of the Advisory Board for Metalmark Capital (private equity investment, 2005-present). Mr. Stavropoulos is a special advisor to Clayton, Dubilier & Rice, LLC (private equity investment). In addition, Mr. Stavropoulos is a member of the University of Notre Dame Advisory Council for the College of Science. |
David M. Thomas (62) |
| Year of Election or Appointment: 2008 Previously, Mr. Thomas served as Executive Chairman (2005-2006) and Chairman and Chief Executive Officer (2000-2005) of IMS Health, Inc. (pharmaceutical and healthcare information solutions). In addition, Mr. Thomas serves as a member of the Board of Directors of Fortune Brands, Inc. (consumer products), and Interpublic Group of Companies, Inc. (marketing communication, 2004-present). |
Michael E. Wiley (60) |
| Year of Election or Appointment: 2008 Mr. Wiley also serves as a Director of Asia Pacific Exploration Consolidated (international oil and gas exploration and production, 2008-present). Mr. Wiley serves as a Director of Tesoro Corporation (independent oil refiner and marketer, 2005-present), and a Director of Bill Barrett Corporation (exploration and production, 2005-present). In addition, Mr. Wiley also serves as a Director of Post Oak Bank (privately-held bank, 2004-present). Previously, Mr. Wiley served as a member of the Board of Trustees of the University of Tulsa (2000-2006; 2007-2010), as a Senior Energy Advisor of Katzenbach Partners, LLC (consulting, 2006-2007), as an Advisory Director of Riverstone Holdings (private investment), Chairman, President, and CEO of Baker Hughes, Inc. (oilfield services, 2000-2004), and as Director of Spinnaker Exploration Company (exploration and production, 2001-2005). |
Annual Report
Trustees and Officers - continued
+ The information above includes each Trustee's principal occupation during the last five years and other information relating to the experience, attributes, and skills relevant to each Trustee's qualifications to serve as a Trustee, which led to the conclusion that each Trustee should serve as a Trustee for the fund.
Advisory Board Members and Executive Officers:
Correspondence intended for each executive officer, Edward C. Johnson 3d, and Peter S. Lynch may be sent to Fidelity Investments, 82 Devonshire Street, Boston, Massachusetts 02109.
Name, Age; Principal Occupation |
Edward C. Johnson 3d (81) |
| Year of Election or Appointment: 2011 Member of the Advisory Board of Fidelity's Equity and High Income Funds. Mr. Johnson serves as Chief Executive Officer, Chairman, and a Director of FMR LLC, and also serves as Chairman and Director of FIL Limited. Previously, Mr. Johnson served as a Trustee and Chairman of the Board of certain Fidelity Trusts, Chairman and a Director of FMR, Chairman and a Director of FMR Co., Inc., and President of FMR LLC (2006-2007). |
Peter S. Lynch (67) |
| Year of Election or Appointment: 2003 Member of the Advisory Board of Fidelity's Equity and High Income Funds. Mr. Lynch is Vice Chairman and a Director of FMR and FMR Co., Inc. In addition, Mr. Lynch serves as a Trustee of Boston College and as the Chairman of the Inner-City Scholarship Fund. Previously, Mr. Lynch served on the Special Olympics International Board of Directors (1997-2006). |
Kenneth B. Robins (41) |
| Year of Election or Appointment: 2008 President and Treasurer of Fidelity's Equity and High Income Funds. Mr. Robins also serves as President and Treasurer (2010-present) and Assistant Treasurer (2009-present) of other Fidelity funds and is an employee of Fidelity Investments (2004-present). Previously, Mr. Robins served as Deputy Treasurer of the Fidelity funds (2005-2008) and Treasurer and Chief Financial Officer of The North Carolina Capital Management Trust: Cash and Term Portfolios (2006-2008). |
Bruce T. Herring (45) |
| Year of Election or Appointment: 2006 Vice President of certain Equity Funds. Mr. Herring also serves as Chief Investment Officer and Director of Fidelity Management & Research (U.K.) Inc. (2010-present) and Group Chief Investments Officer of FMR. Previously, Mr. Herring served as Vice President (2005-2006) and Senior Vice President (2006-2007) of Fidelity Management & Research Company, Vice President of FMR Co., Inc. (2001-2007) and as a portfolio manager for Fidelity U.S. Equity Funds. |
Brian B. Hogan (46) |
| Year of Election or Appointment: 2009 Vice President of Equity and High Income Funds. Mr. Hogan also serves as President of FMR's Equity Division (2009-present). Previously, Mr. Hogan served as Senior Vice President, Equity Research of FMR (2006-2009) and as a portfolio manager. |
Scott C. Goebel (43) |
| Year of Election or Appointment: 2008 Secretary and Chief Legal Officer (CLO) of the Fidelity funds. Mr. Goebel also serves as Secretary of Fidelity Investments Money Management, Inc. (FIMM) (2010-present) and Fidelity Research and Analysis Company (FRAC) (2010-present); Secretary and CLO of The North Carolina Capital Management Trust: Cash and Term Portfolios (2008-present); General Counsel, Secretary, and Senior Vice President of FMR (2008-present) and FMR Co., Inc. (2008-present); employed by FMR LLC or an affiliate (2001-present); Chief Legal Officer of Fidelity Management & Research (Hong Kong) Limited (2008-present) and Assistant Secretary of Fidelity Management & Research (Japan) Inc. (2008-present), and Fidelity Management & Research (U.K.) Inc. (2008-present). Previously, Mr. Goebel served as Assistant Secretary of FIMM (2008-2010), FRAC (2008-2010), and the Funds (2007-2008) and as Vice President and Secretary of Fidelity Distributors Corporation (FDC) (2005-2007). |
William C. Coffey (42) |
| Year of Election or Appointment: 2009 Assistant Secretary of Fidelity's Equity and High Income Funds. Mr. Coffey also serves as Senior Vice President and Deputy General Counsel of FMR LLC (2010-present), and is an employee of Fidelity Investments. Previously, Mr. Coffey served as Vice President and Associate General Counsel of FMR LLC (2005-2009). |
Holly C. Laurent (57) |
| Year of Election or Appointment: 2008 Anti-Money Laundering (AML) Officer of the Fidelity funds. Ms. Laurent also serves as AML Officer of The North Carolina Capital Management Trust: Cash and Term Portfolios (2008-present) and is an employee of Fidelity Investments. Previously, Ms. Laurent was Senior Vice President and Head of Legal for Fidelity Business Services India Pvt. Ltd. (2006-2008), and Senior Vice President, Deputy General Counsel and Group Head for FMR LLC (2005-2006). |
Christine Reynolds (52) |
| Year of Election or Appointment: 2008 Chief Financial Officer of the Fidelity funds. Ms. Reynolds became President of Fidelity Pricing and Cash Management Services (FPCMS) in August 2008. Ms. Reynolds served as Chief Operating Officer of FPCMS (2007-2008). Previously, Ms. Reynolds served as President, Treasurer, and Anti-Money Laundering officer of the Fidelity funds (2004-2007). |
Kenneth A. Rathgeber (64) |
| Year of Election or Appointment: 2004 Chief Compliance Officer of Fidelity's Equity and High Income Funds. Mr. Rathgeber is Chief Compliance Officer of Fidelity Management & Research (Hong Kong) Limited (2008-present), Fidelity Management & Research (Japan) Inc. (2008-present), FMR (2005-present), FMR Co., Inc. (2005-present), Fidelity Management & Research (U.K.) Inc. (2005-present), Fidelity Research & Analysis Company (2005-present), Fidelity Investments Money Management, Inc. (2005-present), Pyramis Global Advisors, LLC (2005-present), and Strategic Advisers, Inc. (2005-present). |
Jeffrey S. Christian (49) |
| Year of Election or Appointment: 2009 Deputy Treasurer of the Fidelity funds. Mr. Christian is an employee of Fidelity Investments. Previously, Mr. Christian served as Chief Financial Officer (2008-2009) of certain Fidelity funds and Senior Vice President of Fidelity Pricing and Cash Management Services (FPCMS) (2004-2009). |
Bryan A. Mehrmann (50) |
| Year of Election or Appointment: 2005 Deputy Treasurer of the Fidelity funds. Mr. Mehrmann is an employee of Fidelity Investments. |
Adrien E. Deberghes (43) |
| Year of Election or Appointment: 2008 Deputy Treasurer of Fidelity's Equity and High Income Funds. Mr. Deberghes also serves as Assistant Treasurer of other Fidelity funds (2010-present) and is an employee of Fidelity Investments (2008-present). Previously, Mr. Deberghes served as Senior Vice President of Mutual Fund Administration at State Street Corporation (2007-2008), Senior Director of Mutual Fund Administration at Investors Bank & Trust (2005-2007), and Director of Finance for Dunkin' Brands (2000-2005). |
Stephanie J. Dorsey (42) |
| Year of Election or Appointment: 2010 Assistant Treasurer of Fidelity's Equity and High Income Funds. Ms. Dorsey also serves as Deputy Treasurer of other Fidelity funds (2008-present) and is an employee of Fidelity Investments (2008-present). Previously, Ms. Dorsey served as Treasurer (2004-2008) of the JPMorgan Mutual Funds and Vice President (2004-2008) of JPMorgan Chase Bank. |
John R. Hebble (53) |
| Year of Election or Appointment: 2009 Assistant Treasurer of Fidelity's Equity and High Income Funds. Mr. Hebble also serves as President (2011-present), Treasurer, and Chief Financial Officer of The North Carolina Capital Management Trust: Cash and Term Portfolios (2008-present), President and Treasurer of other Fidelity funds (2008-present) and is an employee of Fidelity Investments. |
Gary W. Ryan (52) |
| Year of Election or Appointment: 2005 Assistant Treasurer of the Fidelity funds. Mr. Ryan is an employee of Fidelity Investments. Previously, Mr. Ryan served as Vice President of Fund Reporting in Fidelity Pricing and Cash Management Services (FPCMS) (1999-2005). |
Jonathan Davis (43) |
| Year of Election or Appointment: 2010 Assistant Treasurer of the Fidelity funds. Mr. Davis is an employee of Fidelity Investments. Previously, Mr. Davis served as Vice President and Associate General Counsel of FMR LLC (2003-2010). |
Annual Report
The Board of Trustees of Fidelity Blue Chip Growth Fund voted to pay on September 12, 2011, to shareholders of record at the opening of business on September 09, 2011, a distribution of $1.598 per share derived from capital gains realized from sales of portfolio securities.
The fund designates 100% of the dividends distributed in September and December, during the fiscal year as qualifying for the dividends-received deduction for corporate shareholders.
The fund designates 100% of the dividends distributed during the fiscal year as amounts which may be taken into account as a dividend for purposes of the maximum rate under section 1(h)(11) of the Internal Revenue Code.
The fund hereby designates as a capital gain dividend with respect to the taxable year ended July 31, 2011, $504,225,963, or, if subsequently determined to be different, the net capital gain of such year.
The fund will notify shareholders in January 2012 of amounts for use in preparing 2011 income tax returns.
Annual Report
Board Approval of Investment Advisory Contracts and Management Fees
Fidelity Blue Chip Growth Fund
Each year, the Board of Trustees, including the Independent Trustees (together, the Board), votes on the renewal of the management contract and sub-advisory agreements (together, the Advisory Contracts) for the fund. The Board, assisted by the advice of fund counsel and Independent Trustees' counsel, requests and considers a broad range of information relevant to the renewal of the Advisory Contracts throughout the year.
The Board meets regularly and considers at each of its meetings factors that are relevant to its annual consideration of the renewal of the fund's Advisory Contracts, including the services and support provided to the fund and its shareholders. The Board has established various standing committees, each composed of Independent Trustees with varying backgrounds, to which the Board has assigned specific subject matter responsibilities in order to enhance effective decision-making by the Board. The Board, acting directly and through its Committees, requests and receives information concerning the annual consideration of the renewal of the fund's Advisory Contracts. The Board also meets as needed to consider matters specifically related to the Board's annual consideration of the renewal of Advisory Contracts. Members of the Board may also meet with trustees of other Fidelity funds through ad hoc joint committees to discuss certain matters relevant to the Fidelity funds.
At its July 2011 meeting, the Board of Trustees, including the Independent Trustees, unanimously determined to renew the fund's Advisory Contracts. In reaching its determination, the Board considered all factors it believed relevant, including (i) the nature, extent, and quality of the services to be provided to the fund and its shareholders (including the investment performance of the fund); (ii) the competitiveness of the fund's management fee and total expense ratio; (iii) the total costs of the services to be provided by and the profits to be realized by Fidelity from its relationship with the fund; (iv) the extent to which economies of scale would be realized as the fund grows; and (v) whether fee levels reflect these economies of scale, if any, for the benefit of fund shareholders.
In considering whether to renew the Advisory Contracts for the fund, the Board reached a determination, with the assistance of fund counsel and Independent Trustees' counsel and through the exercise of its business judgment, that the renewal of the Advisory Contracts is in the best interests of the fund and its shareholders and that the compensation payable under the Advisory Contracts is fair and reasonable. The Board's decision to renew the Advisory Contracts was not based on any single factor, but rather was based on a comprehensive consideration of all the information provided to the Board at its meetings throughout the year. The Board, in reaching its determination to renew the Advisory Contracts, is aware that shareholders in the fund have a broad range of investment choices available to them, including a wide choice among mutual funds offered by Fidelity's competitors, and that the fund's shareholders, who have the opportunity to review and weigh the disclosure provided by the fund in its prospectus and other public disclosures, have chosen to invest in this fund, managed by Fidelity.
Annual Report
Board Approval of Investment Advisory Contracts and
Management Fees - continued
Nature, Extent, and Quality of Services Provided. The Board considered the staffing within the investment adviser, FMR, and the sub-advisers (together, the Investment Advisers), including the backgrounds of the fund's investment personnel and the fund's investment objective and discipline. The Independent Trustees also had discussions with senior management of Fidelity's investment operations and investment groups. The Board considered the structure of the portfolio manager compensation program and whether this structure provides appropriate incentives to act in the best interests of the fund.
Resources Dedicated to Investment Management and Support Services. The Board and the Fund Oversight and Research Committees reviewed the general qualifications and capabilities of the Investment Advisers' investment staff, including its size, education, experience, and resources, as well as the Investment Advisers' approach to recruiting, training, managing, and compensating investment personnel. The Board also noted that FMR has devoted increased resources to non-U.S. offices. The Board noted that Fidelity's analysts have extensive resources, tools and capabilities which allow them to conduct sophisticated quantitative and fundamental analysis, as well as credit analysis of issuers, counterparties and enhancers. The Board also believes that Fidelity's investment professionals have sufficient access to global information and data so as to provide competitive investment results over time, and that those professionals also have access to sophisticated tools which permit them to assess portfolio construction and risk and performance attribution characteristics continuously, as well as to transmit new information and research conclusions rapidly around the world. Additionally, in their deliberations, the Board considered the Investment Advisers' trading capabilities and resources which are an integral part of the investment management process.
Shareholder and Administrative Services. The Board considered (i) the nature, extent, quality, and cost of advisory, administrative, and shareholder services performed by the Investment Advisers and their affiliates under the Advisory Contracts and under separate agreements covering transfer agency, pricing and bookkeeping, and securities lending services for the fund; (ii) the nature and extent of the investment adviser's supervision of third party service providers, principally custodians and subcustodians; and (iii) the resources devoted to, and the record of compliance with, the fund's compliance policies and procedures. The Board also reviewed the allocation of fund brokerage, including allocations to brokers affiliated with the Investment Advisers, the use of brokerage commissions to pay fund expenses, and the use of "soft" commission dollars to pay for research services.
The Board noted that the growth of fund assets over time across the complex allows Fidelity to reinvest in the development of services designed to enhance the value or convenience of the Fidelity funds as investment vehicles. These services include 24-hour access to account information and market information through telephone representatives and over the Internet, investor education materials and asset allocation tools, and the expanded availability of Fidelity Investor Centers, with 35 new branches opening since 2010.
Annual Report
Investment in a Large Fund Family. The Board considered the benefits to shareholders of investing in a Fidelity fund, including the benefits of investing in a fund that is part of a large family of funds offering a variety of investment disciplines and providing a large variety of mutual fund investor services. The Board noted that Fidelity had taken, or had made recommendations that resulted in the Fidelity funds taking, a number of actions over the previous year that benefited particular funds, including (i) continuing to dedicate additional resources to investment research and support of the senior management team that oversees asset management; (ii) rationalizing product lines through the mergers of six funds into other funds; (iii) continuing to migrate the Freedom Funds to dedicated lower cost underlying funds; (iv) obtaining shareholder approval to broaden the investment strategies for Fidelity Consumer Finance Portfolio, Fidelity Emerging Asia Fund, and Fidelity Environment and Alternative Energy Portfolio; (v) contractually agreeing to reduce the management fees and impose other expense limitations on Spartan® 500 Index Fund and U.S. Bond Index Fund in connection with launching new institutional classes of these funds; (vi) changing the name, primary and supplemental benchmarks, and investment policies of Fidelity Global Strategies Fund to support the fund's flexible investment mandate and global orientation; and (vii) reducing the transfer agency account fee rates on certain accounts.
Investment Performance. The Board considered whether the fund has operated in accordance with its investment objective, as well as its record of compliance with its investment restrictions. It also reviewed the fund's absolute investment performance for each class, as well as the fund's relative investment performance for each class measured over multiple periods against (i) a broad-based securities market index, and (ii) a peer group of mutual funds deemed appropriate by Fidelity and reviewed by the Board. The following charts considered by the Board show, over the one-, three-, and five-year periods ended December 31, 2010, as available, the cumulative total returns of Class F and the retail class of the fund, the cumulative total returns of a broad-based securities market index ("benchmark"), and a range of cumulative total returns of a peer group of mutual funds identified by Morningstar, Inc. as having an investment style similar to that of the fund based on underlying portfolio holdings. The returns of Class F and the retail class show the performance of the highest and lowest performing classes, respectively (based on one-year performance). The box within each chart shows the 25th percentile return (bottom of box) and the 75th percentile return (top of box) of the peer group. Returns shown above the box are in the first quartile and returns shown below the box are in the fourth quartile. The percentage beaten numbers noted below each chart correspond to the percentile box and represent the percentage of funds in the peer group whose performance was equal to or lower than that of the class indicated.
Annual Report
Board Approval of Investment Advisory Contracts and
Management Fees - continued
Fidelity Blue Chip Growth Fund
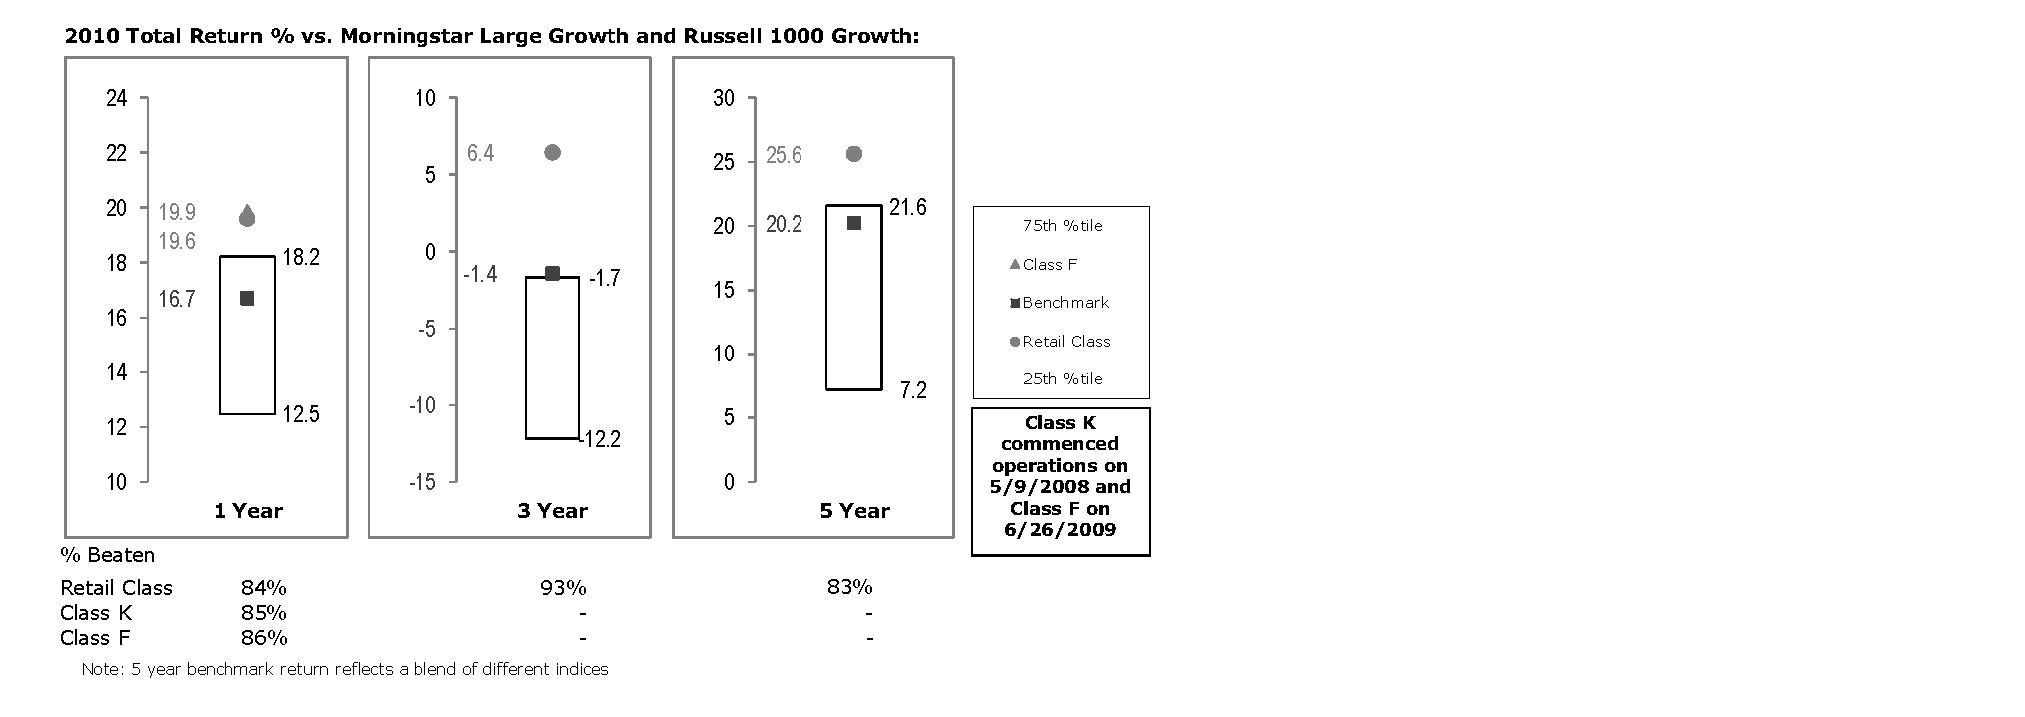
The Board reviewed the fund's relative investment performance against its peer group and noted that the performance of the retail class of the fund (the class with the longest performance record) was in the first quartile for all the periods shown. The Board also noted that the investment performance of the retail class of the fund compared favorably to its benchmark for all the periods shown. The Board considered that the variations in performance among the fund's classes reflect the variations in class expenses, which result in lower performance for higher expense classes. The Board also reviewed the fund's performance since inception as well as performance in the current year.
The Board also considered that the fund's management fee is subject to upward or downward adjustment depending upon whether, and to what extent, the fund's investment performance for the performance period exceeds, or is exceeded by, the record (over the same period) of a Board-approved performance adjustment index. The Board noted that the performance adjustment provides FMR with a strong economic incentive to seek to achieve superior performance for the fund's shareholders and helps to more closely align the interests of FMR and the fund's shareholders.
Based on its review, the Board concluded that the nature, extent, and quality of services provided to the fund under the Advisory Contracts should benefit the fund's shareholders.
Annual Report
Competitiveness of Management Fee and Total Expense Ratio. The Board considered the fund's management fee and total expense ratio compared to "mapped groups" of competitive funds and classes. Fidelity creates "mapped groups" by combining similar Lipper investment objective categories that have comparable management fee characteristics. Combining Lipper investment objective categories aids the Board's management fee and total expense ratio comparisons by broadening the competitive group used for comparison and by reducing the number of universes to which various Fidelity funds are compared.
Management Fee. The Board considered two proprietary management fee comparisons for the 12-month periods shown in the chart below. The group of Lipper funds used by the Board for management fee comparisons is referred to below as the "Total Mapped Group." The Total Mapped Group comparison focuses on a fund's standing relative to the total universe of comparable funds available to investors in terms of gross management fees before expense reimbursements or caps, and without giving effect to the fund's performance adjustment. "TMG %" represents the percentage of funds in the Total Mapped Group that had management fees that were lower than the fund's. For example, a TMG % of 10% means that 90% of the funds in the Total Mapped Group had higher management fees than the fund. The "Asset-Size Peer Group" (ASPG) comparison focuses on a fund's standing relative to non-Fidelity funds similar in size to the fund within the Total Mapped Group. The ASPG represents at least 15% of the funds in the Total Mapped Group with comparable asset size and management fee characteristics, subject to a minimum of 50 funds (or all funds in the Total Mapped Group if fewer than 50). Additional information, such as the ASPG quartile in which the fund's management fee ranked and the impact of the fund's performance adjustment, is also included in the chart and considered by the Board.
Annual Report
Board Approval of Investment Advisory Contracts and
Management Fees - continued
Fidelity Blue Chip Growth Fund
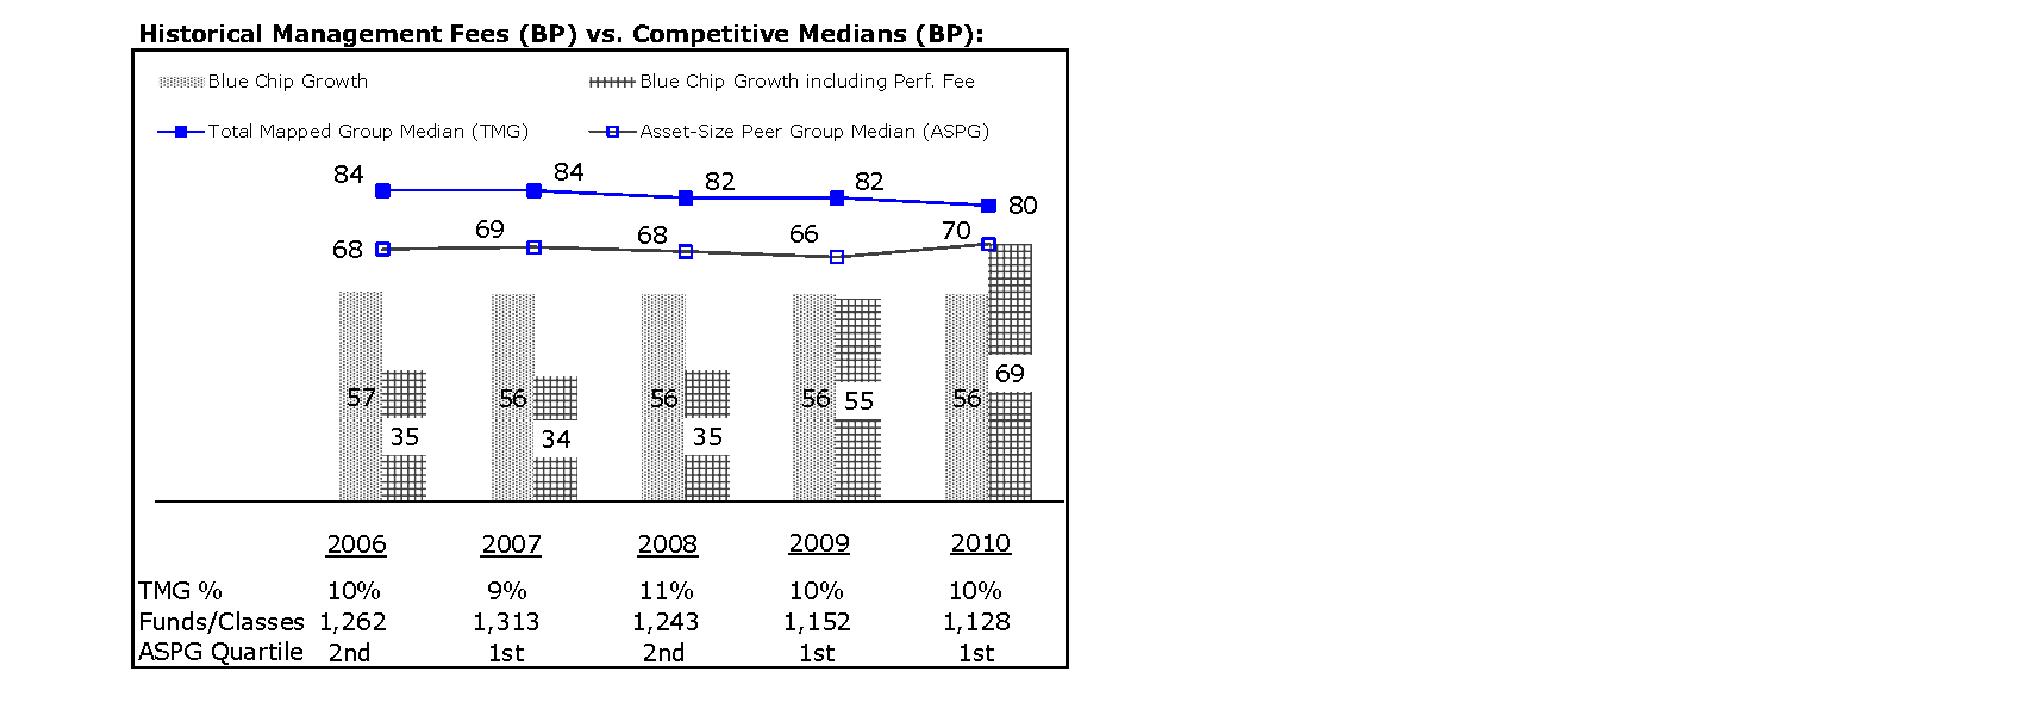
The Board noted that the fund's management fee ranked below the median of its Total Mapped Group and below the median of its ASPG for 2010. The Board also noted the effect of the fund's positive performance adjustment on the fund's management fee ranking. The Board noted that the performance adjustment for each year represents calculations for performance periods that differ from the periods shown in the performance charts above.
Furthermore, the Board considered that shareholders approved a prospective change in the index used to calculate the fund's performance adjustment beginning June 1, 2006. The Board also considered that, because the performance adjustment is based on a rolling 36-month measurement period, during a transition period the fund's performance is compared to a blended index return that reflects the performance of the former index for the portion of the measurement period prior to June 1, 2006 and the performance of the current index for the remainder of the measurement period. The Board noted that the fund's performance adjustments for 2006 through 2009 shown in the chart above reflect the effect of using the blended index return to calculate the fund's performance adjustment.
Based on its review, the Board concluded that the fund's management fee is fair and reasonable in light of the services that the fund receives and the other factors considered.
Total Expense Ratio. In its review of each class's total expense ratio, the Board considered the fund's management fee as well as other fund or class expenses, as applicable, such as transfer agent fees, pricing and bookkeeping fees, and custodial, legal, and audit fees. The Board also noted the effects of any waivers and reimbursements on fees and expenses, as well as the impact of the fund's performance adjustment. As part of its review, the Board also considered the current and historical total expense ratios of each class of the fund compared to competitive fund median expenses. Each class of the fund is compared to those funds and classes in the Total Mapped Group (used by the Board for management fee comparisons) that have a similar sales load structure.
Annual Report
The Board noted that the total expense ratio of each class ranked below its competitive median for 2010. The Board considered that various factors, including 12b-1 fees, positive or negative performance adjustments, and relatively higher other expenses in the case of small fund size, can affect total expense ratios.
Fees Charged to Other Fidelity Clients. The Board also considered Fidelity fee structures and other information with respect to clients of FMR and its affiliates, such as other mutual funds advised or subadvised by FMR or its affiliates, pension plan clients, and other institutional clients. In March 2010, the Board created an ad hoc joint committee with the board of other Fidelity funds (the Committee) to review and compare Fidelity's institutional investment advisory business with its business of providing services to the Fidelity funds, including the differences in services provided, fees charged, and costs incurred, as well as competition in their respective marketplaces.
Based on its review of total expense ratios and fees charged to other Fidelity clients, the Board concluded that the total expense ratio of each class of the fund was reasonable in light of the services that the fund and its shareholders receive and the other factors considered, including the findings of the Committee.
Costs of the Services and Profitability. The Board considered the revenues earned and the expenses incurred by Fidelity in conducting the business of developing, marketing, distributing, managing, administering and servicing the fund and its shareholders. The Board also considered the level of Fidelity's profits in respect of all the Fidelity funds.
On an annual basis, FMR presents to the Board Fidelity's profitability for the fund. Fidelity calculates the profitability for each fund, as well as aggregate profitability for groups of Fidelity funds and all Fidelity funds, using a series of detailed revenue and cost allocation methodologies which originate with the books and records of Fidelity on which Fidelity's audited financial statements are based. The Audit Committee of the Board reviews any significant changes from the prior year's methodologies.
PricewaterhouseCoopers LLP (PwC), independent registered public accounting firm and auditor to Fidelity and certain Fidelity funds, has been engaged annually by the Board as part of the Board's assessment of Fidelity's profitability analysis. PwC's engagement includes the review and assessment of Fidelity's methodologies used in determining the revenues and expenses attributable to Fidelity's mutual fund business, and completion of agreed-upon procedures surrounding the mathematical accuracy of fund profitability and its conformity to allocation methodologies. After considering PwC's reports issued under the engagement and information provided by Fidelity, the Board concluded that while other allocation methods may also be reasonable, Fidelity's profitability methodologies are reasonable in all material respects.
Annual Report
Board Approval of Investment Advisory Contracts and
Management Fees - continued
The Board also reviewed Fidelity's non-fund businesses and fall-out benefits related to the mutual fund business as well as cases where Fidelity's affiliates may benefit from or be related to the fund's business.
The Board considered the costs of the services provided by and the profits realized by Fidelity in connection with the operation of the fund and was satisfied that the profitability was not excessive in the circumstances.
Economies of Scale. The Board considered whether there have been economies of scale in respect of the management of the Fidelity funds, whether the Fidelity funds (including the fund) have appropriately benefited from any such economies of scale, and whether there is potential for realization of any further economies of scale. The Board considered the extent to which the fund will benefit from economies of scale through increased services to the fund, through waivers or reimbursements, or through fee or expense reductions. The Board also noted that in 2009, it and the board of other Fidelity funds created an ad hoc committee (the Economies of Scale Committee) to analyze whether FMR attains economies of scale in respect of the management and servicing of the Fidelity funds, whether the Fidelity funds have appropriately benefited from such economies of scale, and whether there is potential for realization of any further economies of scale.
The Board recognized that the fund's management contract incorporates a "group fee" structure, which provides for lower group fee rates as total fund assets under FMR's management increase, and for higher group fee rates as total fund assets under FMR's management decrease. FMR calculates the group fee rates based on a tiered asset "breakpoint" schedule that varies based on asset class. The Board considered that the group fee is designed to deliver the benefits of economies of scale to fund shareholders when total Fidelity fund assets increase, even if assets of any particular fund are unchanged or have declined, because some portion of Fidelity's costs are attributable to services provided to all Fidelity funds, and all funds benefit if those costs can be allocated among more assets. The Board concluded that, given the group fee structure, fund shareholders will benefit from lower management fees as assets under FMR's management increase at the fund complex level, regardless of whether Fidelity achieves any such economies of scale.
The Board concluded, taking into account the analysis of the Economies of Scale Committee, that any potential economies of scale are being appropriately shared between fund shareholders and Fidelity.
Annual Report
Additional Information Requested by the Board. In order to develop fully the factual basis for consideration of the Fidelity funds' Advisory Contracts, the Board requested and received additional information on certain topics, including (i) fund performance trends, actions to be taken by FMR to improve certain funds' overall performance, and Fidelity's long-term strategies for certain funds; (ii) portfolio manager changes that have occurred during the past year and length of portfolio manager tenure for different categories of funds over time; (iii) Fidelity's compensation structure for portfolio managers and other key personnel and strategies for attracting and retaining non-investment personnel; (iv) the amount of the investment that each portfolio manager has made in the Fidelity fund(s) that he or she manages; (v) historical trends in Fidelity's realization of fall-out benefits; (vi) Fidelity's group fee structures and the rationale for the individual fee rates of certain funds; (vii) fund profitability methodology and the impact of certain factors on fund profitability results; (viii) trends regarding industry use of performance fee structures and Fidelity's compliance practices with respect to performance adjustment calculations; (ix) the fee structures in place for certain other Fidelity clients; and (x) explanations regarding the relative total expense ratios of certain funds and classes, total expense competitive trends, and actions that might be taken by FMR to reduce total expense ratios for certain funds and classes.
Based on its evaluation of all of the conclusions noted above, and after considering all factors it believed relevant, the Board ultimately concluded that the advisory fee structures are fair and reasonable, and that the fund's Advisory Contracts should be renewed.
Annual Report
Managing Your Investments
Fidelity offers several ways to conveniently manage your personal investments via your telephone or PC. You can access your account information, conduct trades and research your investments 24 hours a day.
By Phone
Fidelity Automated Service Telephone provides a single toll-free number to access account balances, positions, quotes and trading. It's easy to navigate the service, and on your first call, the system will help you create a personal identification number (PIN) for security.
(phone_graphic)
Fidelity Automated
Service Telephone (FAST®)
1-800-544-5555
Press
 For mutual fund and brokerage trading.
 For quotes.*
 For account balances and holdings.
 To review orders and mutual
fund activity.
 To change your PIN.

 To speak to a Fidelity representative.
By PC
Fidelity's web site on the Internet provides a wide range of information, including daily financial news, fund performance, interactive planning tools and news about Fidelity products and services.
(computer_graphic)
Fidelity's Web Site
www.fidelity.com
* When you call the quotes line, please remember that a fund's yield and return will vary and, except for money market funds, share price will also vary. This means that you may have a gain or loss when you sell your shares. There is no assurance that money market funds will be able to maintain a stable $1 share price; an investment in a money market fund is not insured or guaranteed by the U.S. government. Total returns are historical and include changes in share price, reinvestment of dividends and capital gains distributions, and the effects of any sales charges.
Annual Report
Investment Adviser
Fidelity Management & Research Company
Boston, MA
Investment Sub-Advisers
FMR Co., Inc.
Fidelity Management & Research
(U.K.) Inc.
Fidelity Management & Research
(Hong Kong) Limited
Fidelity Management & Research
(Japan) Inc.
General Distributor
Fidelity Distributors Corporation
Boston, MA
Transfer and Service Agents
Fidelity Investments Institutional
Operations Company, Inc.
Boston, MA
Fidelity Service Company, Inc.
Boston, MA
Custodian
Citibank, N.A.
New York, NY
The Fidelity Telephone Connection
Mutual Fund 24-Hour Service
Exchanges/Redemptions
and Account Assistance 1-800-544-6666
Product Information 1-800-544-6666
Retirement Accounts 1-800-544-4774
(8 a.m. - 9 p.m.)
TDD Service 1-800-544-0118
for the deaf and hearing impaired
(9 a.m. - 9 p.m. Eastern time)
Fidelity Automated Service
Telephone (FAST®) 1-800-544-5555
Automated line for quickest service
BCF-UANN-0911
1.789244.108

Fidelity®
Blue Chip Growth
Fund -
Class F
Annual Report
July 31, 2011
(2_fidelity_logos) (Registered_Trademark)
Contents
Performance | <Click Here> | How the fund has done over time. |
Management's Discussion of Fund Performance | <Click Here> | The Portfolio Manager's review of fundperformance and strategy. |
Shareholder Expense Example | <Click Here> | An example of shareholder expenses. |
Investment Changes | <Click Here> | A summary of major shifts in the fund's investments over the past six months. |
Investments | <Click Here> | A complete list of the fund's investments with their market values. |
Financial Statements | <Click Here> | Statements of assets and liabilities, operations, and changes in net assets,
as well as financial highlights. |
Notes | <Click Here> | Notes to the financial statements. |
Report of Independent Registered Public Accounting Firm | <Click Here> | |
Trustees and Officers | <Click Here> | |
Distributions | <Click Here> | |
Board Approval of Investment Advisory Contracts and Management Fees | <Click Here> | |
To view a fund's proxy voting guidelines and proxy voting record for the 12-month period ended June 30, visit http://www.fidelity.com/proxyvotingresults or visit the Securities and Exchange Commission's (SEC) web site at http://www.sec.gov. You may also call 1-800-835-5092 to request a free copy of the proxy voting guidelines.
Standard & Poor's, S&P and S&P 500 are registered service marks of The McGraw-Hill Companies, Inc. and have been licensed for use by Fidelity Distributors Corporation.
Other third party marks appearing herein are the property of their respective owners.
All other marks appearing herein are registered or unregistered trademarks or service marks of FMR LLC or an affiliated company.
Annual Report
This report and the financial statements contained herein are submitted for the general information of the shareholders of the fund. This report is not authorized for distribution to prospective investors in the fund unless preceded or accompanied by an effective prospectus.
A fund files its complete schedule of portfolio holdings with the SEC for the first and third quarters of each fiscal year on Form N-Q. Forms N-Q are available on the SEC's web site at http://www.sec.gov. A fund's Forms N-Q may be reviewed and copied at the SEC's Public Reference Room in Washington, DC. Information regarding the operation of the SEC's Public Reference Room may be obtained by calling 1-800-SEC-0330. For a complete list of a fund's portfolio holdings, view the most recent holdings listing, semiannual report, or annual report on Fidelity's web site at http://www.fidelity.com, http://www.advisor.fidelity.com, or http://www.401k.com, as applicable.
NOT FDIC INSURED • MAY LOSE VALUE • NO BANK GUARANTEE
Neither the fund nor Fidelity Distributors Corporation is a bank.
Annual Report
Average annual total return reflects the change in the value of an investment, assuming reinvestment of the class' distributions from dividend income and capital gains (the profits earned upon the sale of securities that have grown in value, if any) and assuming a constant rate of performance each year. The $10,000 table and the fund's returns do not reflect the deduction of taxes that a shareholder would pay on fund distributions or the redemption of fund shares. During periods of reimbursement by Fidelity, a fund's total return will be greater than it would be had the reimbursement not occurred. How a fund did yesterday is no guarantee of how it will do tomorrow.
Average Annual Total Returns
Periods ended July 31, 2011 | Past 1
year | Past 5
years | Past 10
years |
Class F A | 28.41% | 6.86% | 2.80% |
A The initial offering of Class F shares took place on June 26, 2009. Returns prior to June 26, 2009 are those of Fidelity® Blue Chip Growth Fund, the original class of the fund.
$10,000 Over 10 Years
Let's say hypothetically that $10,000 was invested in Fidelity® Blue Chip Growth Fund - Class F on July 31, 2001. The chart shows how the value of your investment would have changed, and also shows how the Russell 1000® Growth Index performed over the same period. The initial offering of Class F took place on June 26, 2009. See above for additional information regarding the performance of Class F.
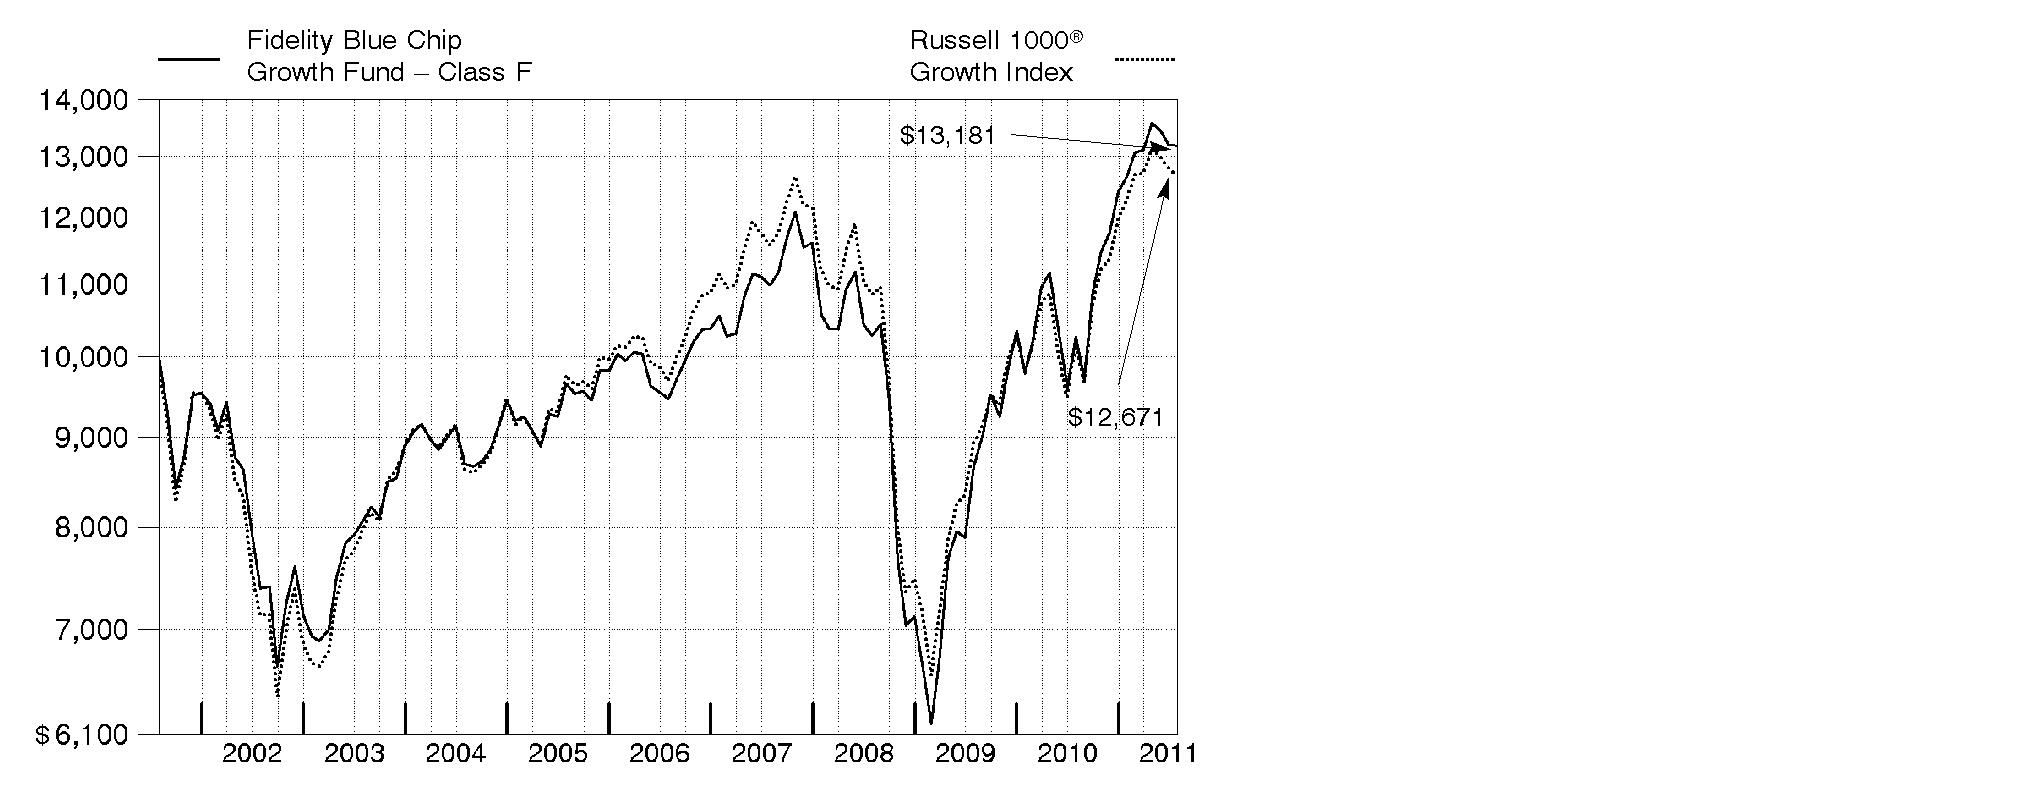
Annual Report
Market Recap: U.S. stocks registered solid double-digit gains for the 12 months ending July 31, 2011, extending a rally that began more than two years earlier. Despite a rough start in August 2010, markets turned positive in September, as increased demand for capital goods and other upbeat indicators trumped investor worry about a U.S. recessionary relapse. The broad market, as measured by the S&P 500® Index, rose 9% that month, its biggest September gain in 71 years. Seven more monthly advances followed, fueled by encouraging corporate earnings and economic activity. However, volatility picked up in the period's latter months, as markets reacted to continued high U.S. unemployment, nagging debt troubles in Europe and looming legislative battles over the federal debt ceiling. May unemployment rose above 9% for the first time in 2011, contributing to a traditional "June swoon" for stocks. Market uncertainty lingered in July, when the S&P 500® posted its second-biggest monthly loss of the period. For the full year, the S&P 500® climbed 19.65%, while the blue-chip-laden Dow Jones Industrial AverageSM rose a comparable 19.09% and the technology-heavy Nasdaq Composite® Index gained 23.40%. On the capitalization spectrum, stocks of mid-cap companies fared best, with the Russell Midcap® Index rising 24.51% and the small-cap Russell 2000® Index adding 23.92%.
Comments from Sonu Kalra, Portfolio Manager of Fidelity® Blue Chip Growth Fund: For the year, the fund's Class F shares rose 28.41%, solidly outpacing the 24.76% return of the Russell 1000® Growth Index. Security selection drove the fund's outperformance, mainly within technology, consumer discretionary and consumer staples. The top individual contributor was an underweighting in Cisco Systems. This producer of networking and communications tech products missed earnings estimates and its core IP (Internet protocol) switching business came under pressure from lower-cost competitors. Cisco was removed from the Russell 1000 Growth Index in June as part of the benchmark's annual rebalancing. Elsewhere, tech giant Apple - the fund's largest holding - helped, as did coal producer Massey Energy, which was acquired by Alpha Natural Resources. From an industry perspective, positioning in diversified financials hurt the most. Not owning index constituent International Business Machines was the biggest individual detractor, as the IT solutions/consulting services provider delivered solid earnings growth through disciplined operational expense management and also bought back some of its stock. Diversified financials firm Citigroup also hampered results. Some of the names I've mentioned in this review were not in the index, and some were sold by period end.
The views expressed above reflect those of the portfolio manager(s) only through the end of the period as stated on the cover of this report and do not necessarily represent the views of Fidelity or any other person in the Fidelity organization. Any such views are subject to change at any time based upon market or other conditions and Fidelity disclaims any responsibility to update such views. These views may not be relied on as investment advice and, because investment decisions for a Fidelity fund are based on numerous factors, may not be relied on as an indication of trading intent on behalf of any Fidelity fund.
Annual Report
Shareholder Expense Example
As a shareholder of the Fund, you incur two types of costs: (1) transaction costs, and (2) ongoing costs, including management fees and other Fund expenses. This Example is intended to help you understand your ongoing costs (in dollars) of investing in the Fund and to compare these costs with the ongoing costs of investing in other mutual funds.
The Example is based on an investment of $1,000 invested at the beginning of the period and held for the entire period (February 1, 2011 to July 31, 2011).
Actual Expenses
The first line of the accompanying table for each class of the Fund provides information about actual account values and actual expenses. You may use the information in this line, together with the amount you invested, to estimate the expenses that you paid over the period. Simply divide your account value by $1,000.00 (for example, an $8,600 account value divided by $1,000.00 = 8.6), then multiply the result by the number in the first line for a class of the Fund under the heading entitled "Expenses Paid During Period" to estimate the expenses you paid on your account during this period. A small balance maintenance fee of $12.00 that is charged once a year may apply for certain accounts with a value of less than $2,000. This fee is not included in the table below. If it was, the estimate of expenses you paid during the period would be higher, and your ending account value lower, by this amount. In addition, the Fund, as a shareholder in the underlying Fidelity Central Funds, will indirectly bear its pro-rata share of the fees and expenses incurred by the underlying Fidelity Central Funds. These fees and expenses are not included in the Fund's annualized expense ratio used to calculate the expense estimate in the table below.
Hypothetical Example for Comparison Purposes
The second line of the accompanying table for each class of the Fund provides information about hypothetical account values and hypothetical expenses based on a Class' actual expense ratio and an assumed rate of return of 5% per year before expenses, which is not the Class' actual return. The hypothetical account values and expenses may not be used to estimate the actual ending account balance or expenses you paid for the period. You may use this information to compare the ongoing costs of investing in the Fund and other funds. To do so, compare this 5% hypothetical example with the 5% hypothetical examples that appear in the shareholder reports of the other funds. A small balance maintenance fee of $12.00 that is charged once a year may apply for certain accounts with a value of less than $2,000. This fee is not included in the table below. If it was, the estimate of expenses you paid during the period would be higher, and your ending account value lower, by this amount. In addition, the Fund, as a shareholder in the underlying Fidelity Central Funds, will indirectly bear its pro-rata share of the fees and expenses incurred by the underlying Fidelity Central Funds. These fees and expenses are not included in the Fund's annualized expense ratio used to calculate the expense estimate in the table below.
Please note that the expenses shown in the table are meant to highlight your ongoing costs only and do not reflect any transaction costs. Therefore, the second line of the table is useful in comparing ongoing costs only, and will not help you determine the relative total costs of owning different funds.
Annual Report
| Annualized
Expense Ratio | Beginning
Account Value
February 1, 2011 | Ending
Account Value
July 31, 2011 | Expenses Paid
During Period*
February 1, 2011 to July 31, 2011 |
Blue Chip Growth | .94% | | | |
Actual | | $ 1,000.00 | $ 1,040.60 | $ 4.76 |
Hypothetical A | | $ 1,000.00 | $ 1,020.13 | $ 4.71 |
Class K | .78% | | | |
Actual | | $ 1,000.00 | $ 1,041.70 | $ 3.95 |
Hypothetical A | | $ 1,000.00 | $ 1,020.93 | $ 3.91 |
Class F | .73% | | | |
Actual | | $ 1,000.00 | $ 1,041.90 | $ 3.70 |
Hypothetical A | | $ 1,000.00 | $ 1,021.17 | $ 3.66 |
A 5% return per year before expenses
* Expenses are equal to each Class' annualized expense ratio, multiplied by the average account value over the period, multiplied by 181/365 (to reflect the one-half year period).
Annual Report
Investment Changes (Unaudited)
Top Ten Stocks as of July 31, 2011 |
| % of fund's
net assets | % of fund's net assets
6 months ago |
Apple, Inc. | 8.1 | 6.9 |
Google, Inc. Class A | 4.7 | 3.7 |
Amazon.com, Inc. | 2.4 | 2.0 |
QUALCOMM, Inc. | 2.3 | 3.0 |
Halliburton Co. | 2.0 | 0.8 |
Exxon Mobil Corp. | 2.0 | 3.1 |
Philip Morris International, Inc. | 1.8 | 1.5 |
The Coca-Cola Co. | 1.8 | 1.5 |
McDonald's Corp. | 1.7 | 0.7 |
Oracle Corp. | 1.6 | 1.5 |
| 28.4 | |
Top Five Market Sectors as of July 31, 2011 |
| % of fund's
net assets | % of fund's net assets
6 months ago |
Information Technology | 33.8 | 36.7 |
Consumer Discretionary | 19.2 | 16.9 |
Energy | 10.8 | 10.4 |
Consumer Staples | 10.6 | 7.3 |
Health Care | 9.9 | 6.7 |
Asset Allocation (% of fund's net assets) |
As of July 31, 2011* | As of January 31, 2011** |
| Stocks 99.6% | | | Stocks 99.8% | |
| Convertible
Securities 0.2% | | | Convertible
Securities 0.0% | |
| Short-Term
Investments and
Net Other Assets 0.2% | | | Short-Term
Investments and
Net Other Assets 0.2% | |
* Foreign investments | 13.0% | | ** Foreign investments | 11.2% | |

Annual Report
Investments July 31, 2011
Showing Percentage of Net Assets
Common Stocks - 98.3% |
| Shares | | Value (000s) |
CONSUMER DISCRETIONARY - 17.8% |
Auto Components - 0.6% |
Lear Corp. | 136,700 | | $ 6,698 |
Tenneco, Inc. (a) | 697,298 | | 27,850 |
TRW Automotive Holdings Corp. (a) | 772,100 | | 38,968 |
Visteon Corp. (a) | 173,100 | | 10,853 |
| | 84,369 |
Automobiles - 1.0% |
Bayerische Motoren Werke AG (BMW) | 428,637 | | 43,001 |
Brilliance China Automotive Holdings Ltd. (a) | 4,058,000 | | 5,181 |
Hyundai Motor Co. | 75,033 | | 16,725 |
Kia Motors Corp. | 152,660 | | 11,207 |
Tesla Motors, Inc. (a)(d) | 2,597,600 | | 73,174 |
| | 149,288 |
Diversified Consumer Services - 1.3% |
Coinstar, Inc. (a)(d) | 249,427 | | 12,187 |
New Oriental Education & Technology Group, Inc. sponsored ADR (a) | 101,800 | | 13,003 |
Weight Watchers International, Inc. | 2,086,172 | | 161,032 |
| | 186,222 |
Hotels, Restaurants & Leisure - 5.2% |
Arcos Dorados Holdings, Inc. | 1,324,400 | | 31,070 |
Bravo Brio Restaurant Group, Inc. | 750,800 | | 16,780 |
Brinker International, Inc. | 758,000 | | 18,207 |
Chipotle Mexican Grill, Inc. (a) | 145,100 | | 47,097 |
Dunkin' Brands Group, Inc. | 855,100 | | 24,738 |
Jubilant Foodworks Ltd. (a) | 533,088 | | 10,305 |
Las Vegas Sands Corp. (a) | 2,155,000 | | 101,673 |
Life Time Fitness, Inc. (a) | 120,100 | | 5,015 |
McDonald's Corp. | 2,853,430 | | 246,765 |
MGM Mirage, Inc. (a)(d) | 1,149,700 | | 17,372 |
Panera Bread Co. Class A (a) | 254,800 | | 29,381 |
Starbucks Corp. | 2,904,900 | | 116,457 |
WMS Industries, Inc. (a) | 262,500 | | 7,237 |
Wyndham Worldwide Corp. | 1,100,485 | | 38,066 |
Yum! Brands, Inc. | 756,700 | | 39,969 |
| | 750,132 |
Household Durables - 0.2% |
Beazer Homes USA, Inc. (a)(d) | 3,151,700 | | 9,140 |
SodaStream International Ltd. | 255,200 | | 18,719 |
| | 27,859 |
Common Stocks - continued |
| Shares | | Value (000s) |
CONSUMER DISCRETIONARY - continued |
Internet & Catalog Retail - 3.1% |
Amazon.com, Inc. (a) | 1,544,600 | | $ 343,704 |
Netflix, Inc. (a) | 70,900 | | 18,859 |
Priceline.com, Inc. (a) | 157,000 | | 84,411 |
| | 446,974 |
Media - 0.5% |
DISH Network Corp. Class A (a) | 1,251,100 | | 37,070 |
Focus Media Holding Ltd. ADR (a)(d) | 528,900 | | 17,396 |
Pandora Media, Inc. | 35,800 | | 540 |
ReachLocal, Inc. (a)(d) | 720,300 | | 13,102 |
| | 68,108 |
Multiline Retail - 1.5% |
Macy's, Inc. | 4,195,000 | | 121,110 |
Target Corp. | 1,785,179 | | 91,919 |
| | 213,029 |
Specialty Retail - 2.4% |
Abercrombie & Fitch Co. Class A | 126,600 | | 9,257 |
Ascena Retail Group, Inc. (a) | 1,118,600 | | 36,153 |
AutoZone, Inc. (a) | 9,500 | | 2,712 |
Bed Bath & Beyond, Inc. (a) | 616,900 | | 36,082 |
Chico's FAS, Inc. | 1,336,300 | | 20,165 |
Cia.Hering SA | 254,600 | | 5,456 |
Dick's Sporting Goods, Inc. (a) | 377,400 | | 13,964 |
Foot Locker, Inc. | 1,330,800 | | 28,918 |
Francescas Holdings Corp. | 280,300 | | 7,361 |
Limited Brands, Inc. | 1,414,800 | | 53,564 |
Ross Stores, Inc. | 179,600 | | 13,608 |
rue21, Inc. (a)(d) | 200,000 | | 6,574 |
Teavana Holdings, Inc. | 19,300 | | 544 |
TJX Companies, Inc. | 1,562,740 | | 86,420 |
Ulta Salon, Cosmetics & Fragrance, Inc. (a) | 342,500 | | 21,588 |
Vitamin Shoppe, Inc. (a) | 195,000 | | 8,494 |
| | 350,860 |
Textiles, Apparel & Luxury Goods - 2.0% |
Arezzo Industria e Comercio SA | 1,121,000 | | 16,050 |
Coach, Inc. | 169,300 | | 10,930 |
Crocs, Inc. (a) | 1,421,500 | | 44,536 |
Deckers Outdoor Corp. (a) | 180,800 | | 17,944 |
Fossil, Inc. (a) | 425,600 | | 53,485 |
Gitanjali Gems Ltd. | 2,187,799 | | 15,333 |
Common Stocks - continued |
| Shares | | Value (000s) |
CONSUMER DISCRETIONARY - continued |
Textiles, Apparel & Luxury Goods - continued |
NIKE, Inc. Class B | 603,000 | | $ 54,360 |
Polo Ralph Lauren Corp. Class A | 130,200 | | 17,586 |
Steven Madden Ltd. (a) | 271,950 | | 10,361 |
Under Armour, Inc. Class A (sub. vtg.) (a)(d) | 440,600 | | 32,344 |
Vera Bradley, Inc. (d) | 354,325 | | 12,851 |
| | 285,780 |
TOTAL CONSUMER DISCRETIONARY | | 2,562,621 |
CONSUMER STAPLES - 10.6% |
Beverages - 3.4% |
Anheuser-Busch InBev SA NV ADR | 504,500 | | 29,049 |
Dr Pepper Snapple Group, Inc. | 2,421,400 | | 91,432 |
Hansen Natural Corp. (a) | 680,600 | | 52,148 |
PepsiCo, Inc. | 932,800 | | 59,737 |
The Coca-Cola Co. | 3,769,700 | | 256,377 |
| | 488,743 |
Food & Staples Retailing - 2.7% |
Casey's General Stores, Inc. | 258,600 | | 11,637 |
Chefs' Warehouse Holdings | 198,400 | | 3,522 |
Costco Wholesale Corp. | 578,700 | | 45,283 |
CVS Caremark Corp. | 2,635,400 | | 95,797 |
Droga Raia SA | 635,700 | | 11,782 |
Sun Art Retail Group Ltd. | 977,500 | | 1,257 |
Walgreen Co. | 3,296,100 | | 128,680 |
Whole Foods Market, Inc. | 1,463,100 | | 97,589 |
| | 395,547 |
Food Products - 1.6% |
Calbee, Inc. | 408,300 | | 17,188 |
Danone | 396,900 | | 28,400 |
Dean Foods Co. (a) | 1,170,900 | | 12,903 |
Diamond Foods, Inc. (d) | 271,500 | | 19,437 |
Green Mountain Coffee Roasters, Inc. (a) | 1,222,600 | | 127,089 |
Mead Johnson Nutrition Co. Class A | 277,200 | | 19,784 |
| | 224,801 |
Personal Products - 0.6% |
Estee Lauder Companies, Inc. Class A | 684,100 | | 71,769 |
Herbalife Ltd. | 296,461 | | 16,519 |
| | 88,288 |
Common Stocks - continued |
| Shares | | Value (000s) |
CONSUMER STAPLES - continued |
Tobacco - 2.3% |
Altria Group, Inc. | 1,081,100 | | $ 28,433 |
Lorillard, Inc. | 412,100 | | 43,773 |
Philip Morris International, Inc. | 3,608,500 | | 256,817 |
| | 329,023 |
TOTAL CONSUMER STAPLES | | 1,526,402 |
ENERGY - 10.8% |
Energy Equipment & Services - 5.6% |
Baker Hughes, Inc. | 1,249,800 | | 96,710 |
Cameron International Corp. (a) | 208,800 | | 11,680 |
Carbo Ceramics, Inc. | 129,800 | | 20,258 |
Halliburton Co. | 5,300,800 | | 290,113 |
Helmerich & Payne, Inc. | 218,100 | | 15,060 |
ION Geophysical Corp. (a) | 606,700 | | 6,152 |
National Oilwell Varco, Inc. | 1,180,000 | | 95,073 |
Schlumberger Ltd. | 2,556,100 | | 230,995 |
Transocean Ltd. (United States) | 680,000 | | 41,861 |
| | 807,902 |
Oil, Gas & Consumable Fuels - 5.2% |
Alpha Natural Resources, Inc. (a) | 1,894,799 | | 80,927 |
Amyris, Inc. | 34,657 | | 802 |
Anadarko Petroleum Corp. | 194,800 | | 16,083 |
Cabot Oil & Gas Corp. | 768,300 | | 56,916 |
Chesapeake Energy Corp. | 772,800 | | 26,546 |
Chevron Corp. | 715,000 | | 74,374 |
Continental Resources, Inc. (a) | 271,700 | | 18,636 |
EV Energy Partners LP | 241,100 | | 16,969 |
Exxon Mobil Corp. | 3,501,900 | | 279,417 |
Hess Corp. | 419,900 | | 28,788 |
Marathon Petroleum Corp. | 383,200 | | 16,780 |
Occidental Petroleum Corp. | 1,137,600 | | 111,690 |
Solazyme, Inc. | 180,800 | | 4,131 |
Western Refining, Inc. (a)(d) | 889,200 | | 18,166 |
| | 750,225 |
TOTAL ENERGY | | 1,558,127 |
Common Stocks - continued |
| Shares | | Value (000s) |
FINANCIALS - 2.4% |
Capital Markets - 0.3% |
Morgan Stanley | 1,693,400 | | $ 37,678 |
Commercial Banks - 0.2% |
HDFC Bank Ltd. | 1,262,465 | | 13,895 |
ICICI Bank Ltd. | 666,777 | | 15,588 |
| | 29,483 |
Consumer Finance - 0.4% |
Discover Financial Services | 1,578,300 | | 40,420 |
Shriram Transport Finance Co. Ltd. | 1,309,840 | | 18,978 |
| | 59,398 |
Diversified Financial Services - 1.3% |
Citigroup, Inc. | 4,889,020 | | 187,445 |
Real Estate Management & Development - 0.2% |
Parsvnath Developers Ltd. (a)(e) | 21,771,340 | | 22,924 |
Thrifts & Mortgage Finance - 0.0% |
Housing Development Finance Corp. Ltd. | 335,144 | | 5,223 |
TOTAL FINANCIALS | | 342,151 |
HEALTH CARE - 9.8% |
Biotechnology - 2.5% |
Alexion Pharmaceuticals, Inc. (a) | 622,900 | | 35,381 |
Alkermes, Inc. (a) | 917,100 | | 15,811 |
Amarin Corp. PLC ADR (a) | 1,645,200 | | 22,276 |
Amylin Pharmaceuticals, Inc. (a) | 1,832,100 | | 21,820 |
ARIAD Pharmaceuticals, Inc. (a) | 1,000,000 | | 11,890 |
Biogen Idec, Inc. (a) | 516,000 | | 52,565 |
Cepheid, Inc. (a) | 94,400 | | 3,565 |
Exelixis, Inc. (a) | 2,913,200 | | 22,432 |
Human Genome Sciences, Inc. (a) | 1,012,500 | | 21,273 |
InterMune, Inc. (a) | 778,802 | | 25,996 |
Micromet, Inc. (a) | 1,322,420 | | 7,485 |
Pharmasset, Inc. (a) | 64,800 | | 7,865 |
Regeneron Pharmaceuticals, Inc. (a) | 137,500 | | 7,296 |
Vertex Pharmaceuticals, Inc. (a) | 2,107,300 | | 109,285 |
| | 364,940 |
Health Care Equipment & Supplies - 1.2% |
C. R. Bard, Inc. | 117,200 | | 11,565 |
Covidien PLC | 1,321,600 | | 67,124 |
Edwards Lifesciences Corp. (a) | 165,100 | | 11,780 |
Common Stocks - continued |
| Shares | | Value (000s) |
HEALTH CARE - continued |
Health Care Equipment & Supplies - continued |
Mako Surgical Corp. (a) | 200,000 | | $ 5,762 |
The Cooper Companies, Inc. | 564,072 | | 43,146 |
Volcano Corp. (a) | 186,400 | | 5,855 |
William Demant Holding A/S (a) | 126,000 | | 11,057 |
Zoll Medical Corp. (a) | 130,900 | | 9,118 |
| | 165,407 |
Health Care Providers & Services - 3.5% |
Accretive Health, Inc. (a) | 642,000 | | 19,286 |
Aetna, Inc. | 217,900 | | 9,041 |
AmerisourceBergen Corp. | 176,900 | | 6,777 |
Apollo Hospitals Enterprise Ltd. | 649,448 | | 7,742 |
CIGNA Corp. | 382,800 | | 19,052 |
Express Scripts, Inc. (a) | 2,271,280 | | 123,240 |
Humana, Inc. | 311,100 | | 23,202 |
McKesson Corp. | 1,148,000 | | 93,126 |
Medco Health Solutions, Inc. (a) | 2,014,100 | | 126,647 |
Omnicare, Inc. | 50,300 | | 1,534 |
UnitedHealth Group, Inc. | 660,000 | | 32,756 |
Universal Health Services, Inc. Class B | 325,200 | | 16,143 |
WellPoint, Inc. | 266,900 | | 18,029 |
| | 496,575 |
Health Care Technology - 0.5% |
Cerner Corp. (a) | 978,200 | | 65,041 |
SXC Health Solutions Corp. (a) | 163,800 | | 10,367 |
| | 75,408 |
Life Sciences Tools & Services - 0.2% |
Illumina, Inc. (a) | 220,400 | | 13,764 |
Sequenom, Inc. (a)(d) | 2,457,600 | | 17,351 |
| | 31,115 |
Pharmaceuticals - 1.9% |
Allergan, Inc. | 126,100 | | 10,253 |
AVANIR Pharmaceuticals Class A (a)(d) | 1,264,000 | | 4,740 |
Elan Corp. PLC sponsored ADR (a) | 2,231,100 | | 24,676 |
Endocyte, Inc. | 1,477,700 | | 19,698 |
GlaxoSmithKline PLC sponsored ADR | 345,300 | | 15,338 |
Johnson & Johnson | 1,943,800 | | 125,939 |
Novo Nordisk A/S Series B | 76,779 | | 9,391 |
Sanofi-Aventis sponsored ADR | 371,600 | | 14,400 |
Common Stocks - continued |
| Shares | | Value (000s) |
HEALTH CARE - continued |
Pharmaceuticals - continued |
Shire PLC sponsored ADR | 152,700 | | $ 15,881 |
Valeant Pharmaceuticals International, Inc. (Canada) | 499,900 | | 27,517 |
| | 267,833 |
TOTAL HEALTH CARE | | 1,401,278 |
INDUSTRIALS - 9.4% |
Aerospace & Defense - 3.7% |
BE Aerospace, Inc. (a) | 177,700 | | 7,072 |
Honeywell International, Inc. | 940,800 | | 49,956 |
Precision Castparts Corp. | 787,600 | | 127,103 |
The Boeing Co. | 2,166,100 | | 152,645 |
United Technologies Corp. | 2,463,600 | | 204,085 |
| | 540,861 |
Air Freight & Logistics - 0.4% |
United Parcel Service, Inc. Class B | 769,600 | | 53,272 |
Airlines - 0.2% |
Copa Holdings SA Class A | 426,600 | | 27,989 |
Building Products - 0.2% |
Armstrong World Industries, Inc. | 920,900 | | 36,376 |
Commercial Services & Supplies - 0.1% |
Swisher Hygiene, Inc. (g) | 1,159,960 | | 5,243 |
Swisher Hygiene, Inc. (g) | 935,531 | | 3,806 |
| | 9,049 |
Construction & Engineering - 0.9% |
Fluor Corp. | 1,660,700 | | 105,504 |
KBR, Inc. | 550,900 | | 19,640 |
| | 125,144 |
Electrical Equipment - 0.3% |
Polypore International, Inc. (a) | 667,500 | | 45,390 |
Industrial Conglomerates - 1.2% |
Carlisle Companies, Inc. | 319,900 | | 13,829 |
Danaher Corp. | 2,360,600 | | 115,929 |
General Electric Co. | 2,358,000 | | 42,232 |
| | 171,990 |
Machinery - 1.7% |
Caterpillar, Inc. | 446,300 | | 44,090 |
Cummins, Inc. | 730,900 | | 76,657 |
Fanuc Corp. | 169,500 | | 32,176 |
Common Stocks - continued |
| Shares | | Value (000s) |
INDUSTRIALS - continued |
Machinery - continued |
Ingersoll-Rand Co. Ltd. | 921,300 | | $ 34,475 |
Jain Irrigation Systems Ltd. | 780,008 | | 3,073 |
Kennametal, Inc. | 176,100 | | 6,944 |
Pall Corp. | 443,900 | | 22,009 |
WABCO Holdings, Inc. (a) | 399,900 | | 25,214 |
| | 244,638 |
Road & Rail - 0.6% |
CSX Corp. | 787,200 | | 19,342 |
Union Pacific Corp. | 649,400 | | 66,551 |
| | 85,893 |
Trading Companies & Distributors - 0.1% |
Mills Estruturas e Servicos de Engenharia SA | 827,400 | | 11,201 |
TOTAL INDUSTRIALS | | 1,351,803 |
INFORMATION TECHNOLOGY - 33.8% |
Communications Equipment - 3.6% |
Alcatel-Lucent SA sponsored ADR (a) | 25,984,395 | | 105,237 |
Cisco Systems, Inc. | 1,378,300 | | 22,011 |
HTC Corp. | 23,300 | | 692 |
Juniper Networks, Inc. (a) | 2,002,700 | | 46,843 |
Polycom, Inc. (a) | 847,300 | | 22,903 |
QUALCOMM, Inc. | 6,009,000 | | 329,173 |
Riverbed Technology, Inc. (a) | 700 | | 20 |
| | 526,879 |
Computers & Peripherals - 10.0% |
Apple, Inc. (a) | 2,968,300 | | 1,159,056 |
EMC Corp. (a) | 3,372,000 | | 87,942 |
Fusion-io, Inc. | 100,600 | | 2,979 |
NetApp, Inc. (a)(d) | 2,672,700 | | 127,007 |
SanDisk Corp. (a) | 1,455,800 | | 61,915 |
| | 1,438,899 |
Electronic Equipment & Components - 0.1% |
Fabrinet (a) | 683,381 | | 10,524 |
TE Connectivity Ltd. | 155,045 | | 5,338 |
| | 15,862 |
Internet Software & Services - 7.2% |
Baidu.com, Inc. sponsored ADR (a) | 198,700 | | 31,210 |
eBay, Inc. (a) | 3,588,840 | | 117,535 |
Common Stocks - continued |
| Shares | | Value (000s) |
INFORMATION TECHNOLOGY - continued |
Internet Software & Services - continued |
Facebook, Inc. Class B (a)(g) | 636,167 | | $ 15,904 |
Google, Inc. Class A (a) | 1,115,967 | | 673,698 |
GREE, Inc. | 356,900 | | 8,194 |
IAC/InterActiveCorp (a) | 463,500 | | 19,184 |
INFO Edge India Ltd. | 293,110 | | 4,969 |
Mail.ru Group Ltd. GDR (a)(f) | 1,193,100 | | 42,618 |
OpenTable, Inc. (a) | 139,651 | | 9,896 |
Rackspace Hosting, Inc. (a) | 1,959,600 | | 78,384 |
SINA Corp. (a) | 60,100 | | 6,496 |
Velti PLC (a) | 1,398,000 | | 23,081 |
| | 1,031,169 |
IT Services - 2.7% |
Accenture PLC Class A | 698,100 | | 41,286 |
Cognizant Technology Solutions Corp. Class A (a) | 1,541,100 | | 107,677 |
MasterCard, Inc. Class A | 611,400 | | 185,407 |
ServiceSource International, Inc. (d) | 322,900 | | 6,025 |
Visa, Inc. Class A | 524,923 | | 44,902 |
| | 385,297 |
Semiconductors & Semiconductor Equipment - 3.9% |
Altera Corp. | 1,336,000 | | 54,616 |
Avago Technologies Ltd. | 3,152,700 | | 106,025 |
Broadcom Corp. Class A | 3,610,500 | | 133,841 |
Freescale Semiconductor Holdings I Ltd. | 1,955,069 | | 31,926 |
GT Solar International, Inc. (a)(d) | 1,567,100 | | 21,375 |
Marvell Technology Group Ltd. (a) | 3,088,986 | | 45,779 |
NVIDIA Corp. (a) | 6,614,973 | | 91,485 |
NXP Semiconductors NV | 2,090,000 | | 41,340 |
PMC-Sierra, Inc. (a) | 4,712,600 | | 32,941 |
| | 559,328 |
Software - 6.3% |
BroadSoft, Inc. (a) | 815,700 | | 23,827 |
Check Point Software Technologies Ltd. (a) | 1,510,000 | | 87,052 |
Citrix Systems, Inc. (a) | 363,000 | | 26,151 |
Electronic Arts, Inc. (a) | 1,201,000 | | 26,722 |
Informatica Corp. (a) | 1,168,000 | | 59,720 |
Microsoft Corp. | 4,475,400 | | 122,626 |
MicroStrategy, Inc. Class A (a) | 44,800 | | 7,140 |
Nuance Communications, Inc. (a) | 1,265,900 | | 25,331 |
Oracle Corp. | 7,566,300 | | 231,377 |
QLIK Technologies, Inc. | 1,011,763 | | 30,667 |
Common Stocks - continued |
| Shares | | Value (000s) |
INFORMATION TECHNOLOGY - continued |
Software - continued |
RealPage, Inc. (d) | 66,073 | | $ 1,589 |
Red Hat, Inc. (a) | 1,604,700 | | 67,526 |
Rovi Corp. (a) | 150,200 | | 7,956 |
salesforce.com, Inc. (a) | 730,265 | | 105,677 |
VMware, Inc. Class A (a) | 860,700 | | 86,363 |
| | 909,724 |
TOTAL INFORMATION TECHNOLOGY | | 4,867,158 |
MATERIALS - 3.7% |
Chemicals - 2.6% |
Celanese Corp. Class A | 268,700 | | 14,813 |
CF Industries Holdings, Inc. | 591,800 | | 91,918 |
E.I. du Pont de Nemours & Co. | 676,000 | | 34,760 |
LyondellBasell Industries NV Class A | 1,734,300 | | 68,435 |
Monsanto Co. | 240,700 | | 17,687 |
Potash Corp. of Saskatchewan, Inc. | 252,800 | | 14,595 |
Rockwood Holdings, Inc. (a) | 572,600 | | 34,625 |
The Mosaic Co. | 1,343,700 | | 95,026 |
| | 371,859 |
Containers & Packaging - 0.1% |
Ball Corp. | 365,600 | | 14,185 |
Metals & Mining - 1.0% |
Carpenter Technology Corp. | 733,325 | | 42,122 |
Freeport-McMoRan Copper & Gold, Inc. | 1,615,000 | | 85,530 |
Royal Gold, Inc. | 188,800 | | 12,102 |
| | 139,754 |
TOTAL MATERIALS | | 525,798 |
TOTAL COMMON STOCKS (Cost $10,729,699) | 14,135,338 |
Preferred Stocks - 1.5% |
| | | |
Convertible Preferred Stocks - 0.2% |
CONSUMER DISCRETIONARY - 0.1% |
Textiles, Apparel & Luxury Goods - 0.1% |
Michael Kors Holdings Ltd. (a)(g) | 325,704 | | 15,000 |
Preferred Stocks - continued |
| Shares | | Value (000s) |
Convertible Preferred Stocks - continued |
HEALTH CARE - 0.1% |
Pharmaceuticals - 0.1% |
Merrimack Pharmaceuticals, Inc. Series G (g) | 2,142,858 | | $ 15,000 |
TOTAL CONVERTIBLE PREFERRED STOCKS | | 30,000 |
Nonconvertible Preferred Stocks - 1.3% |
CONSUMER DISCRETIONARY - 1.3% |
Automobiles - 1.3% |
Porsche Automobil Holding SE (Germany) | 1,026,800 | | 79,197 |
Volkswagen AG | 547,800 | | 109,762 |
| | 188,959 |
TOTAL PREFERRED STOCKS (Cost $171,905) | 218,959 |
Money Market Funds - 1.0% |
| | | |
Fidelity Securities Lending Cash Central Fund,
0.15% (b)(c)
(Cost $146,021) | 146,021,398 | | 146,021 |
TOTAL INVESTMENT PORTFOLIO - 100.8% (Cost $11,047,625) | | 14,500,318 |
NET OTHER ASSETS (LIABILITIES) - (0.8)% | | (109,870) |
NET ASSETS - 100% | $ 14,390,448 |
Legend |
(a) Non-income producing |
(b) Affiliated fund that is available only to investment companies and other accounts managed by Fidelity Investments. The rate quoted is the annualized seven-day yield of the fund at period end. A complete unaudited listing of the fund's holdings as of its most recent quarter end is available upon request. In addition, each Fidelity Central Fund's financial statements, which are not covered by the Fund's Report of Independent Registered Public Accounting Firm, are available on the SEC's website or upon request. |
(c) Investment made with cash collateral received from securities on loan. |
(d) Security or a portion of the security is on loan at period end. |
(e) Affiliated company |
(f) Security exempt from registration under Rule 144A of the Securities Act of 1933. These securities may be resold in transactions exempt from registration, normally to qualified institutional buyers. At the end of the period, the value of these securities amounted to $42,618,000 or 0.3% of net assets. |
(g) Restricted securities - Investment in securities not registered under the Securities Act of 1933 (excluding 144A issues). At the end of the period, the value of restricted securities (excluding 144A issues) amounted to $54,953,000 or 0.4% of net assets. |
Additional information on each restricted holding is as follows: |
Security | Acquisition Date | Acquisition Cost (000s) |
Facebook, Inc. Class B | 3/31/11 - 5/19/11 | $ 15,909 |
Merrimack Pharmaceuticals, Inc. Series G | 3/31/11 | $ 15,000 |
Michael Kors Holdings Ltd. | 7/8/11 | $ 15,000 |
Swisher Hygiene, Inc. | 3/22/11 | $ 5,800 |
Swisher Hygiene, Inc. | 4/15/11 | $ 7,204 |
Affiliated Central Funds |
Information regarding fiscal year to date income earned by the Fund from investments in Fidelity Central Funds is as follows: |
Fund | Income earned
(Amounts in thousands) |
Fidelity Cash Central Fund | $ 54 |
Fidelity Securities Lending Cash Central Fund | 1,516 |
Total | $ 1,570 |
Other Affiliated Issuers |
An affiliated company is a company in which the Fund has ownership of at least 5% of the voting securities. Fiscal year to date transactions with companies which are or were affiliates are as follows: |
Affiliates
(Amounts in thousands) | Value, beginning of period | Purchases | Sales Proceeds | Dividend Income | Value,
end of
period |
Furniture Brands International, Inc. | $ 16,160 | $ - | $ 14,466 | $ - | $ - |
Parsvnath Developers Ltd. | 18,023 | 14,168 | - | - | 22,924 |
Total | $ 34,183 | $ 14,168 | $ 14,466 | $ - | $ 22,924 |
Other Information |
The following is a summary of the inputs used, as of July 31, 2011, involving the Fund's assets and liabilities carried at fair value. The inputs or methodology used for valuing securities may not be an indication of the risk associated with investing in those securities. For more information on valuation inputs, and their aggregation into the levels used in the tables below, please refer to the Security Valuation section in the accompanying Notes to Financial Statements. |
Valuation Inputs at Reporting Date: |
Description
(Amounts in thousands) | Total | Level 1 | Level 2 | Level 3 |
Investments in Securities: | | | | |
Equities: | | | | |
Consumer Discretionary | $ 2,766,580 | $ 2,751,580 | $ - | $ 15,000 |
Consumer Staples | 1,526,402 | 1,526,402 | - | - |
Energy | 1,558,127 | 1,558,127 | - | - |
Financials | 342,151 | 312,668 | 29,483 | - |
Health Care | 1,416,278 | 1,391,887 | 9,391 | 15,000 |
Industrials | 1,351,803 | 1,347,997 | 3,806 | - |
Information Technology | 4,867,158 | 4,851,254 | - | 15,904 |
Materials | 525,798 | 525,798 | - | - |
Money Market Funds | 146,021 | 146,021 | - | - |
Total Investments in Securities: | $ 14,500,318 | $ 14,411,734 | $ 42,680 | $ 45,904 |
The following is a reconciliation of Investments in Securities for which Level 3 inputs were used in determining value: |
(Amounts in thousands) | |
Investments in Securities: | |
Beginning Balance | $ 6,774 |
Total Realized Gain (Loss) | (1,136) |
Total Unrealized Gain (Loss) | 170 |
Cost of Purchases | 45,908 |
Proceeds of Sales | (5,812) |
Amortization/Accretion | - |
Transfers in to Level 3 | - |
Transfers out of Level 3 | - |
Ending Balance | $ 45,904 |
The change in unrealized gain (loss) for the period attributable to Level 3 securities held at July 31, 2011 | $ (4) |
The information used in the above reconciliation represents fiscal year to date activity for any Investments in Securities identified as using Level 3 inputs at either the beginning or the end of the current fiscal period. Transfers in or out of Level 3 represent the beginning value of any Security or Instrument where a change in the pricing level occurred from the beginning to the end of the period. The cost of purchases and the proceeds of sales may include securities received or delivered through corporate actions or exchanges. Realized and unrealized gains (losses) disclosed in the reconciliation are included in Net Gain (Loss) on the Fund's Statement of Operations. |
Distribution of investments by country of issue, as a percentage of total net assets, is as follows: (Unaudited) |
United States of America | 87.0% |
Germany | 1.6% |
Curacao | 1.6% |
Ireland | 1.2% |
France | 1.0% |
Others (Individually Less Than 1%) | 7.6% |
| 100.0% |
Income Tax Information |
The Fund intends to elect to defer to its fiscal year ending July 31, 2012 approximately $7,175,000 of currency losses recognized during the period November 1, 2010 to July 31, 2011. |
See accompanying notes which are an integral part of the financial statements.
Annual Report
Statement of Assets and Liabilities
Amounts in thousands (except per-share amounts) | July 31, 2011 |
| | |
Assets | | |
Investment in securities, at value (including securities loaned of $140,857) - See accompanying schedule: Unaffiliated issuers (cost $10,870,753) | $ 14,331,373 | |
Fidelity Central Funds (cost $146,021) | 146,021 | |
Other affiliated issuers (cost $30,851) | 22,924 | |
Total Investments (cost $11,047,625) | | $ 14,500,318 |
Receivable for investments sold | | 325,167 |
Receivable for fund shares sold | | 13,859 |
Dividends receivable | | 3,107 |
Distributions receivable from Fidelity Central Funds | | 193 |
Other receivables | | 1,218 |
Total assets | | 14,843,862 |
| | |
Liabilities | | |
Payable to custodian bank | $ 93 | |
Payable for investments purchased | 217,799 | |
Payable for fund shares redeemed | 70,986 | |
Accrued management fee | 8,786 | |
Notes payable to affiliates | 6,851 | |
Other affiliated payables | 2,289 | |
Other payables and accrued expenses | 589 | |
Collateral on securities loaned, at value | 146,021 | |
Total liabilities | | 453,414 |
| | |
Net Assets | | $ 14,390,448 |
Net Assets consist of: | | |
Paid in capital | | $ 10,512,137 |
Accumulated net investment loss | | (7,667) |
Accumulated undistributed net realized gain (loss) on investments and foreign currency transactions | | 433,284 |
Net unrealized appreciation (depreciation) on investments and assets and liabilities in foreign currencies | | 3,452,694 |
Net Assets | | $ 14,390,448 |
See accompanying notes which are an integral part of the financial statements.
Annual Report
Statement of Assets and Liabilities - continued
Amounts in thousands (except per-share amounts) | July 31, 2011 |
| | |
Blue Chip Growth:
Net Asset Value, offering price and redemption price per share ($12,024,038 ÷ 249,612 shares) | | $ 48.17 |
| | |
Class K:
Net Asset Value, offering price and redemption price per share ($1,454,854 ÷ 30,179 shares) | | $ 48.21 |
| | |
Class F:
Net Asset Value, offering price and redemption price per share ($911,556 ÷ 18,896 shares) | | $ 48.24 |
See accompanying notes which are an integral part of the financial statements.
Annual Report
Financial Statements - continued
Statement of Operations
Amounts in thousands | Year ended July 31, 2011 |
| | |
Investment Income | | |
Dividends | | $ 116,312 |
Interest | | 4 |
Income from Fidelity Central Funds | | 1,570 |
Total income | | 117,886 |
| | |
Expenses | | |
Management fee
Basic fee | $ 76,012 | |
Performance adjustment | 19,530 | |
Transfer agent fees | 26,204 | |
Accounting and security lending fees | 1,466 | |
Custodian fees and expenses | 448 | |
Independent trustees' compensation | 72 | |
Appreciation in deferred trustee compensation account | 1 | |
Registration fees | 144 | |
Audit | 111 | |
Legal | 64 | |
Interest | 15 | |
Miscellaneous | 139 | |
Total expenses before reductions | 124,206 | |
Expense reductions | (1,803) | 122,403 |
Net investment income (loss) | | (4,517) |
Realized and Unrealized Gain (Loss) Net realized gain (loss) on: | | |
Investment securities: | | |
Unaffiliated issuers | 1,575,157 | |
Other affiliated issuers | (10,044) | |
Foreign currency transactions | (2,955) | |
Total net realized gain (loss) | | 1,562,158 |
Change in net unrealized appreciation (depreciation) on: Investment securities (net of decrease in deferred foreign taxes of $49) | 1,651,481 | |
Assets and liabilities in foreign currencies | 176 | |
Total change in net unrealized appreciation (depreciation) | | 1,651,657 |
Net gain (loss) | | 3,213,815 |
Net increase (decrease) in net assets resulting from operations | | $ 3,209,298 |
See accompanying notes which are an integral part of the financial statements.
Annual Report
Statement of Changes in Net Assets
Amounts in thousands | Year ended
July 31,
2011 | Year ended
July 31,
2010 |
Increase (Decrease) in Net Assets | | |
Operations | | |
Net investment income (loss) | $ (4,517) | $ 13,622 |
Net realized gain (loss) | 1,562,158 | 1,055,028 |
Change in net unrealized appreciation (depreciation) | 1,651,657 | 793,347 |
Net increase (decrease) in net assets resulting
from operations | 3,209,298 | 1,861,997 |
Distributions to shareholders from net investment income | (2,405) | (57,433) |
Distributions to shareholders from net realized gain | (12,451) | - |
Total distributions | (14,856) | (57,433) |
Share transactions - net increase (decrease) | (352,214) | (538,131) |
Total increase (decrease) in net assets | 2,842,228 | 1,266,433 |
| | |
Net Assets | | |
Beginning of period | 11,548,220 | 10,281,787 |
End of period (including accumulated net investment loss of $7,667 and undistributed net investment income of $2,062, respectively) | $ 14,390,448 | $ 11,548,220 |
See accompanying notes which are an integral part of the financial statements.
Annual Report
Financial Highlights - Blue Chip Growth
Years ended July 31, | 2011 | 2010 | 2009 | 2008 | 2007 |
Selected Per-Share Data | | | | | |
Net asset value, beginning of period | $ 37.63 | $ 31.97 | $ 39.06 | $ 46.88 | $ 41.54 |
Income from Investment Operations | | | | | |
Net investment income (loss) B | (.03) | .04 | .27 | .35 | .32 |
Net realized and unrealized gain (loss) | 10.61 | 5.80 | (6.36) | (2.89) | 6.19 |
Total from investment operations | 10.58 | 5.84 | (6.09) | (2.54) | 6.51 |
Distributions from net investment income | (.00) F, G | (.18) | (.29) | (.33) | (.24) |
Distributions from net realized gain | (.04) F | - | (.71) | (4.95) | (.93) |
Total distributions | (.04) | (.18) | (1.00) | (5.28) | (1.17) |
Net asset value, end of period | $ 48.17 | $ 37.63 | $ 31.97 | $ 39.06 | $ 46.88 |
Total Return A | 28.12% | 18.29% | (15.85)% | (6.30)% | 16.02% |
Ratios to Average Net Assets C,E | | | | | |
Expenses before reductions | .94% | .94% | .76% | .58% | .60% |
Expenses net of fee waivers, if any | .94% | .94% | .76% | .58% | .60% |
Expenses net of all reductions | .92% | .93% | .76% | .57% | .59% |
Net investment income (loss) | (.06)% | .10% | .93% | .81% | .72% |
Supplemental Data | | | | | |
Net assets, end of period (in millions) | $ 12,024 | $ 10,295 | $ 9,691 | $ 13,349 | $ 18,616 |
Portfolio turnover rate D | 132% | 135% | 134% | 82% | 87% |
A Total returns would have been lower if certain expenses had not been reduced during the applicable periods shown.
B Calculated based on average shares outstanding during the period.
C Fees and expenses of any underlying Fidelity Central Funds are not included in the Fund's expense ratio. The Fund indirectly bears its proportionate share of the expenses of any underlying Fidelity Central Funds.
D Amount does not include the portfolio activity of any underlying Fidelity Central Funds.
E Expense ratios reflect operating expenses of the class. Expenses before reductions do not reflect amounts reimbursed by the investment adviser or reductions from brokerage service arrangements or reductions from other expense offset arrangements and do not represent the amount paid by the class during periods when reimbursements or reductions occur. Expenses net of fee waivers reflect expenses after reimbursement by the investment adviser but prior to reductions from brokerage service arrangements or other expense offset arrangements. Expenses net of all reductions represent the net expenses paid by the class.
F The amount shown reflects certain reclassifications related to book to tax differences.
G Amount represents less than $.01 per share.
See accompanying notes which are an integral part of the financial statements.
Annual Report
Financial Highlights - Class K
Years ended July 31, | 2011 | 2010 | 2009 | 2008 G |
Selected Per-Share Data | | | | |
Net asset value, beginning of period | $ 37.66 | $ 32.01 | $ 39.07 | $ 41.81 |
Income from Investment Operations | | | | |
Net investment income (loss) D | .05 | .11 | .32 | .10 |
Net realized and unrealized gain (loss) | 10.62 | 5.79 | (6.33) | (2.84) |
Total from investment operations | 10.67 | 5.90 | (6.01) | (2.74) |
Distributions from net investment income | (.05) I | (.25) | (.34) | - |
Distributions from net realized gain | (.07) I | - | (.71) | - |
Total distributions | (.12) | (.25) | (1.05) | - |
Net asset value, end of period | $ 48.21 | $ 37.66 | $ 32.01 | $ 39.07 |
Total Return B,C | 28.37% | 18.48% | (15.61)% | (6.55)% |
Ratios to Average Net Assets E,H | | | | |
Expenses before reductions | .77% | .75% | .53% | .41% A |
Expenses net of fee waivers, if any | .77% | .75% | .53% | .41% A |
Expenses net of all reductions | .76% | .74% | .52% | .41% A |
Net investment income (loss) | .11% | .30% | 1.16% | 1.09% A |
Supplemental Data | | | | |
Net assets, end of period (000 omitted) | $ 1,454,854 | $ 931,601 | $ 590,673 | $ 93 |
Portfolio turnover rate F | 132% | 135% | 134% | 82% |
A Annualized
B Total returns for periods of less than one year are not annualized.
C Total returns would have been lower if certain expenses had not been reduced during the applicable periods shown.
D Calculated based on average shares outstanding during the period.
E Fees and expenses of any underlying Fidelity Central Funds are not included in the Fund's expense ratio. The Fund indirectly bears its proportionate share of the expenses of any underlying Fidelity Central Funds.
F Amount does not include the portfolio activity of any underlying Fidelity Central Funds.
G For the period May 9, 2008 (commencement of sale of shares) to July 31, 2008.
H Expense ratios reflect operating expenses of the class. Expenses before reductions do not reflect amounts reimbursed by the investment adviser or reductions from brokerage service arrangements or reductions from other expense offset arrangements and do not represent the amount paid by the class during periods when reimbursements or reductions occur. Expense ratios before reductions for start-up periods may not be representative of longer-term operating periods. Expenses net of fee waivers reflect expenses after reimbursement by the investment adviser but prior to reductions from brokerage service arrangements or other expense offset arrangements. Expenses net of all reductions represent the net expenses paid by the class.
I The amount shown reflects certain reclassifications related to book to tax differences.
See accompanying notes which are an integral part of the financial statements.
Annual Report
Financial Highlights - Class F
Years ended July 31, | 2011 | 2010 | 2009 G |
Selected Per-Share Data | | | |
Net asset value, beginning of period | $ 37.69 | $ 31.98 | $ 29.16 |
Income from Investment Operations | | | |
Net investment income (loss) D | .07 | .13 | - I |
Net realized and unrealized gain (loss) | 10.61 | 5.80 | 2.82 |
Total from investment operations | 10.68 | 5.93 | 2.82 |
Distributions from net investment income | (.06) J | (.22) | - |
Distributions from net realized gain | (.08) J | - | - |
Total distributions | (.13) K | (.22) | - |
Net asset value, end of period | $ 48.24 | $ 37.69 | $ 31.98 |
Total Return B,C | 28.41% | 18.59% | 9.67% |
Ratios to Average Net Assets E,H | | | |
Expenses before reductions | .72% | .70% | .51% A |
Expenses net of fee waivers, if any | .72% | .70% | .51% A |
Expenses net of all reductions | .71% | .68% | .51% A |
Net investment income (loss) | .16% | .35% | (.05)% A |
Supplemental Data | | | |
Net assets, end of period (000 omitted) | $ 911,556 | $ 321,409 | $ 261 |
Portfolio turnover rate F | 132% | 135% | 134% |
A Annualized
B Total returns for periods of less than one year are not annualized.
C Total returns would have been lower if certain expenses had not been reduced during the applicable periods shown.
D Calculated based on average shares outstanding during the period.
E Fees and expenses of any underlying Fidelity Central Funds are not included in the Fund's expense ratio. The Fund indirectly bears its proportionate share of the expenses of any underlying Fidelity Central Funds.
F Amount does not include the portfolio activity of any underlying Fidelity Central Funds.
G For the period June 26, 2009 (commencement of sale of shares) to July 31, 2009.
H Expense ratios reflect operating expenses of the class. Expenses before reductions do not reflect amounts reimbursed by the investment adviser or reductions from brokerage service arrangements or reductions from other expense offset arrangements and do not represent the amount paid by the class during periods when reimbursements or reductions occur. Expense ratios before reductions for start-up periods may not be representative of longer-term operating periods. Expenses net of fee waivers reflect expenses after reimbursement by the investment adviser but prior to reductions from brokerage service arrangements or other expense offset arrangements. Expenses net of all reductions represent the net expenses paid by the class.
I Amount represents less than $.01 per share.
J The amount shown reflects certain reclassifications related to book to tax differences.
K Total distributions of $.13 per share is comprised of distributions from net investment income of $.058 and distributions from net realized gain of $.076 per share.
See accompanying notes which are an integral part of the financial statements.
Annual Report
Notes to Financial Statements
For the period ended July 31, 2011
(Amounts in thousands except ratios)
1. Organization.
Fidelity Blue Chip Growth Fund (the Fund) is a fund of Fidelity Securities Fund (the Trust) and is authorized to issue an unlimited number of shares. The Trust is registered under the Investment Company Act of 1940, as amended (the 1940 Act), as an open-end management investment company organized as a Massachusetts business trust. The Fund offers Blue Chip Growth, Class K and Class F shares, each of which has equal rights as to assets and voting privileges. Each class has exclusive voting rights with respect to matters that affect that class. Class F shares of the Fund are only available for purchase by mutual funds for which Fidelity Management & Research Company (FMR) or an affiliate serves as investment manager. Investment income, realized and unrealized capital gains and losses, the common expenses of the Fund, and certain fund-level expense reductions, if any, are allocated on a pro-rata basis to each class based on the relative net assets of each class to the total net assets of the Fund. Each class differs with respect to transfer agent fees incurred. Certain expense reductions may also differ by class.
2. Investments in Fidelity Central Funds.
The Fund invests in Fidelity Central Funds, which are open-end investment companies available only to other investment companies and accounts managed by FMR and its affiliates. The Fund's Schedule of Investments lists each of the Fidelity Central Funds held as of period end, if any, as an investment of the Fund, but does not include the underlying holdings of each Fidelity Central Fund. As an Investing Fund, the Fund indirectly bears its proportionate share of the expenses of the underlying Fidelity Central Funds.
The Money Market Central Funds seek preservation of capital and current income and are managed by Fidelity Investments Money Management, Inc. (FIMM), an affiliate of FMR.
A complete unaudited list of holdings for each Fidelity Central Fund is available upon request or at the Securities and Exchange Commission (the SEC) web site at www.sec.gov. In addition, the financial statements of the Fidelity Central Funds, which are not covered by the Fund's Report of Independent Registered Public Accounting Firm, are available on the SEC web site or upon request.
3. Significant Accounting Policies.
The financial statements have been prepared in conformity with accounting principles generally accepted in the United States of America (GAAP), which require management to make certain estimates and assumptions at the date of the financial statements. Actual results could differ from those estimates. Subsequent events, if any, through the date that the financial statements were issued have been evaluated in the preparation of
Annual Report
Notes to Financial Statements - continued
(Amounts in thousands except ratios)
3. Significant Accounting Policies - continued
the financial statements. The following summarizes the significant accounting policies of the Fund:
Security Valuation. Investments are valued as of 4:00 p.m. Eastern time on the last calendar day of the period. The Fund uses independent pricing services approved by the Board of Trustees to value its investments. When current market prices or quotations are not readily available or reliable, valuations may be determined in good faith in accordance with procedures adopted by the Board of Trustees. Factors used in determining value may include market or security specific events. The frequency with which these procedures are used cannot be predicted and they may be utilized to a significant extent. The value used for net asset value (NAV) calculation under these procedures may differ from published prices for the same securities.
The Fund categorizes the inputs to valuation techniques used to value its investments into a disclosure hierarchy consisting of three levels as shown below:
Level 1 - quoted prices in active markets for identical investments
Level 2 - other significant observable inputs (including quoted prices for similar investments, interest rates, prepayment speeds, etc.)
Level 3 - unobservable inputs (including the Fund's own assumptions based on the best information available)
Changes in valuation techniques may result in transfers in or out of an assigned level within the disclosure hierarchy. The aggregate value of investments by input level, as of July 31, 2011, as well as a roll forward of Level 3 securities, is included at the end of the Fund's Schedule of Investments. Valuation techniques used to value the Fund's investments by major category are as follows:
Equity securities, including restricted securities, for which market quotations are readily available, are valued at the last reported sale price or official closing price as reported by an independent pricing service on the primary market or exchange on which they are traded and are categorized as Level 1 in the hierarchy. In the event there were no sales during the day or closing prices are not available, securities are valued at the last quoted bid price or may be valued using the last available price and are generally categorized as Level 2 in the hierarchy. For foreign equity securities, when significant market or security specific events arise, comparisons to the valuation of American Depositary Receipts (ADRs), futures contracts, Exchange-traded funds (ETFs) and certain indexes as well as quoted prices for similar securities are used and are categorized as Level 2 in the hierarchy in these circumstances. Utilizing these techniques may result in transfers between Level 1 and Level 2. For restricted equity securities and private placements where
Annual Report
3. Significant Accounting Policies - continued
Security Valuation - continued
observable inputs are limited, assumptions about market activity and risk are used and are categorized as Level 3 in the hierarchy.
Investments in open-end mutual funds, including the Fidelity Central Funds, are valued at their closing net asset value each business day and are categorized as Level 1 in the hierarchy.
Foreign Currency. The Fund may use foreign currency contracts to facilitate transactions in foreign-denominated securities. Gains and losses from these transactions may arise from changes in the value of the foreign currency or if the counterparties do not perform under the contracts' terms.
Foreign-denominated assets, including investment securities, and liabilities are translated into U.S. dollars at the exchange rate at period end. Purchases and sales of investment securities, income and dividends received and expenses denominated in foreign currencies are translated into U.S. dollars at the exchange rate in effect on the transaction date.
The effects of exchange rate fluctuations on investments are included with the net realized and unrealized gain (loss) on investment securities. Other foreign currency transactions resulting in realized and unrealized gain (loss) are disclosed separately.
Investment Transactions and Income. For financial reporting purposes, the Fund's investment holdings and NAV include trades executed through the end of the last business day of the period. The NAV per share for processing shareholder transactions is calculated as of the close of business of the New York Stock Exchange (NYSE), normally 4:00 p.m. Eastern time and includes trades executed through the end of the prior business day. Gains and losses on securities sold are determined on the basis of identified cost and may include proceeds received from litigation. Dividend income is recorded on the ex-dividend date, except for certain dividends from foreign securities where the ex-dividend date may have passed, which are recorded as soon as the Fund is informed of the ex-dividend date. Non-cash dividends included in dividend income, if any, are recorded at the fair market value of the securities received. Distributions received on securities that represent a return of capital or capital gain are recorded as a reduction of cost of investments and/or as a realized gain. The Fund estimates the components of distributions received that may be considered return of capital distributions or capital gain distributions. Interest income and distributions from the Fidelity Central Funds are accrued as earned. Interest income includes coupon interest and amortization of premium and accretion of discount on debt securities. Investment income is recorded net of foreign taxes withheld where recovery of such taxes is uncertain.
Annual Report
Notes to Financial Statements - continued
(Amounts in thousands except ratios)
3. Significant Accounting Policies - continued
Expenses. Expenses directly attributable to a fund are charged to that fund. Expenses attributable to more than one fund are allocated among the respective funds on the basis of relative net assets or other appropriate methods. Expense estimates are accrued in the period to which they relate and adjustments are made when actual amounts are known.
Deferred Trustee Compensation. Under a Deferred Compensation Plan (the Plan), independent Trustees may elect to defer receipt of a portion of their annual compensation. Deferred amounts are invested in a cross-section of Fidelity funds, are marked-to-market and remain in the Fund until distributed in accordance with the Plan. The investment of deferred amounts and the offsetting payable to the Trustees are included in the accompanying Statement of Assets and Liabilities.
Income Tax Information and Distributions to Shareholders. Each year, the Fund intends to qualify as a regulated investment company, including distributing substantially all of its taxable income and realized gains under Subchapter M of the Internal Revenue Code and filing its U.S. federal tax return. As a result, no provision for income taxes is required. As of July 31, 2011, the Fund did not have any unrecognized tax benefits in the financial statements. A fund's federal tax return is subject to examination by the Internal Revenue Service (IRS) for a period of three years. Foreign taxes are provided for based on the Fund's understanding of the tax rules and rates that exist in the foreign markets in which it invests.
Distributions are declared and recorded on the ex-dividend date. Income dividends and capital gain distributions are declared separately for each class. Income and capital gain distributions are determined in accordance with income tax regulations, which may differ from GAAP. These differences resulted in distribution reclassifications. In addition, the Fund claimed a portion of the payment made to redeeming shareholders as a distribution for income tax purposes.
Capital accounts within the financial statements are adjusted for permanent book-tax differences. These adjustments have no impact on net assets or the results of operations. Temporary book-tax differences will reverse in a subsequent period.
Book-tax differences are primarily due to foreign currency transactions, passive foreign investment companies (PFIC), partnerships, deferred trustees compensation, capital loss carryforwards and losses deferred due to wash sales and excise tax regulations.
Annual Report
3. Significant Accounting Policies - continued
Income Tax Information and Distributions to Shareholders - continued
The federal tax cost of investment securities and unrealized appreciation (depreciation) as of period end were as follows:
Gross unrealized appreciation | $ 3,629,356 |
Gross unrealized depreciation | (223,692) |
Net unrealized appreciation (depreciation) on securities and other investments | $ 3,405,664 |
| |
Tax Cost | $ 11,094,654 |
The tax-based components of distributable earnings as of period end were as follows:
Undistributed long-term capital gain | $ 480,312 |
Net unrealized appreciation (depreciation) | $ 3,405,665 |
Under the recently enacted Regulated Investment Company Modernization Act of 2010 (the Act), the Fund will be permitted to carry forward capital losses incurred in taxable years beginning after December 22, 2010 for an unlimited period. However, any losses incurred during those future taxable years will be required to be utilized prior to any losses incurred in pre-enactment taxable years, which generally expire after eight years from when they are incurred. Additionally, post-enactment capital losses that are carried forward will retain their character as either short-term or long-term capital losses rather than being considered all short-term as under previous law. The Fund's first fiscal year end subject to the Act will be July 31, 2012.
The tax character of distributions paid was as follows:
| July 31, 2011 | July 31, 2010 |
Ordinary Income | $ 2,405 | $ 57,433 |
Long-term Capital Gains | 12,451 | - |
Total | $ 14,856 | $ 57,433 |
New Accounting Pronouncement. In May 2011, the Financial Accounting Standards Board issued Accounting Standard Update No. 2011-04, Fair Value Measurement (Topic 820) - Amendments to Achieve Common Fair Value Measurement and Disclosure Requirements in U.S. GAAP and IFRSs. The update changes the wording used to describe the requirements in GAAP for measuring fair value and for disclosing information about fair value measurements. The update is effective during interim and annual periods beginning after December 15, 2011. Management is currently evaluating the impact of the update's adoption on the Fund's financial statement disclosures.
Annual Report
Notes to Financial Statements - continued
(Amounts in thousands except ratios)
4. Operating Policies.
Restricted Securities. The Fund may invest in securities that are subject to legal or contractual restrictions on resale. These securities generally may be resold in transactions exempt from registration or to the public if the securities are registered. Disposal of these securities may involve time-consuming negotiations and expense, and prompt sale at an acceptable price may be difficult. Information regarding restricted securities is included at the end of the Fund's Schedule of Investments.
5. Purchases and Sales of Investments.
Purchases and sales of securities, other than short-term securities, aggregated $17,822,174 and $18,155,781, respectively.
6. Fees and Other Transactions with Affiliates.
Management Fee. FMR and its affiliates provide the Fund with investment management related services for which the Fund pays a monthly management fee. The management fee is the sum of an individual fund fee rate that is based on an annual rate of .30% of the Fund's average net assets and a group fee rate that averaged .26% during the period. The group fee rate is based upon the average net assets of all the mutual funds advised by FMR. The group fee rate decreases as assets under management increase and increases as assets under management decrease. In addition, the management fee is subject to a performance adjustment (up to a maximum of ± .20% of the Fund's average net assets over a 36 month performance period). The upward or downward adjustment to the management fee is based on the relative investment performance of Blue Chip Growth as compared to an appropriate benchmark index. For the period, the total annual management fee rate, including the performance adjustment, was .70% of the Fund's average net assets.
Transfer Agent Fees. Fidelity Investments Institutional Operations Company, Inc. (FIIOC), an affiliate of FMR, is the transfer, dividend disbursing and shareholder servicing agent for each class of the Fund. FIIOC receives account fees and asset-based fees that vary according to the account size and type of account of the shareholders of Blue Chip Growth. FIIOC receives an asset-based fee of Class K's average net assets. FIIOC receives no fees for providing transfer agency services to Class F. FIIOC pays for typesetting, printing and mailing of shareholder reports, except proxy statements.
Annual Report
6. Fees and Other Transactions with Affiliates - continued
Transfer Agent Fees - continued
For the period, transfer agent fees for each class were as follows:
| Amount | % of
Average
Net Assets |
Blue Chip Growth | $ 25,585 | .22 |
Class K | 619 | .05 |
| $ 26,204 | |
Accounting and Security Lending Fees. Fidelity Service Company, Inc. (FSC), an affiliate of FMR, maintains the Fund's accounting records. The accounting fee is based on the level of average net assets for the month. Under a separate contract, FSC administers the security lending program. The security lending fee is based on the number and duration of lending transactions.
Brokerage Commissions. The Fund placed a portion of its portfolio transactions with brokerage firms which are affiliates of the investment adviser. The commissions paid to these affiliated firms were $536 for the period.
Interfund Lending Program. Pursuant to an Exemptive Order issued by the SEC, the Fund, along with other registered investment companies having management contracts with FMR, may participate in an interfund lending program. This program provides an alternative credit facility allowing the funds to borrow from, or lend money to, other participating affiliated funds. Any open loans, including accrued interest, at period end are presented under the caption "Notes payable to affiliates" in the Fund's Statement of Assets and Liabilities. The Fund's activity in this program during the period for which loans were outstanding was as follows:
Borrower or Lender | Average Daily
Loan Balance | Weighted Average Interest Rate | Interest
Expense |
Borrower | $ 18,305 | .44% | $ 12 |
7. Committed Line of Credit.
The Fund participates with other funds managed by FMR or an affiliate in a $4.0 billion credit facility (the "line of credit") to be utilized for temporary or emergency purposes to fund shareholder redemptions or for other short-term liquidity purposes. The Fund has agreed to pay commitment fees on its pro-rata portion of the line of credit, which amounted to $45 and is reflected in Miscellaneous expenses on the Statement of Operations. During the period, there were no borrowings on this line of credit.
Annual Report
Notes to Financial Statements - continued
(Amounts in thousands except ratios)
8. Security Lending.
The Fund lends portfolio securities through a lending agent from time to time in order to earn additional income. The lending agent may loan securities to certain qualified borrowers, including Fidelity Capital Markets (FCM), a broker-dealer affiliated with the Fund. On the settlement date of the loan, the Fund receives collateral (in the form of U.S. Treasury obligations, letters of credit and/or cash) against the loaned securities and maintains collateral in an amount not less than 100% of the market value of the loaned securities during the period of the loan. The market value of the loaned securities is determined at the close of business of the Fund and any additional required collateral is delivered to the Fund on the next business day. If the borrower defaults on its obligation to return the securities loaned because of insolvency or other reasons, a fund could experience delays and costs in recovering the securities loaned or in gaining access to the collateral. Any cash collateral received is invested in the Fidelity Securities Lending Cash Central Fund. The value of loaned securities and cash collateral at period end are disclosed on the Fund's Statement of Assets and Liabilities. The value of securities loaned to FCM at period end was $1,503. Security lending income represents the income earned on investing cash collateral, less rebates paid to borrowers and lending agent fees associated with the loan, plus any premium payments received for lending certain types of securities. Security lending income is presented in the Statement of Operations as a component of income from Fidelity Central Funds. Total security lending income during the period amounted to $1,516, including $24 from securities loaned to FCM.
9. Bank Borrowings.
The Fund is permitted to have bank borrowings for temporary or emergency purposes to fund shareholder redemptions or for other short-term liquidity requirements. The Fund has established borrowing arrangements with certain banks. The interest rate on the borrowings is the bank's base rate, as revised from time to time. The average daily loan balance during the period for which loans were outstanding amounted to $27,562. The weighted average interest rate was .69%. The interest expense amounted to $3 under the bank borrowing program. At period end, there were no bank borrowings outstanding.
10. Expense Reductions.
Many of the brokers with whom FMR places trades on behalf of the Fund provided services to the Fund in addition to trade execution. These services included payments of certain expenses on behalf of the Fund totaling $1,802 for the period. In addition, through arrangements with the Fund's custodian, credits realized as a result of uninvested cash balances were used to reduce the Fund's expenses. During the period, these credits reduced the Fund's custody expenses by $1.
Annual Report
11. Distributions to Shareholders.
Distributions to shareholders of each class were as follows:
Years ended July 31, | 2011 | 2010 |
From net investment income | | |
Blue Chip Growth | $ 670 | $ 52,296 |
Class K | 1,165 | 4,902 |
Class F | 570 | 235 |
Total | $ 2,405 | $ 57,433 |
From net realized gain | | |
Blue Chip Growth | $ 9,690 | $ - |
Class K | 1,750 | - |
Class F | 1,011 | - |
Total | $ 12,451 | $ - |
12. Share Transactions.
Transactions for each class of shares were as follows:
| Shares | Dollars |
Years ended July 31, | 2011 | 2010 A | 2011 | 2010 A |
Blue Chip Growth | | | | |
Shares sold | 42,281 | 41,698 | $ 1,904,203 | $ 1,553,486 |
Conversion to Class K | - | (604) | - | (19,981) |
Reinvestment of distributions | 232 | 1,459 | 10,166 | 51,338 |
Shares redeemed | (66,514) | (72,051) | (2,974,498) | (2,676,741) |
Net increase (decrease) | (24,001) | (29,498) | $ (1,060,129) | $ (1,091,898) |
Class K | | | | |
Shares sold | 13,902 | 11,377 | $ 625,856 | $ 427,050 |
Conversion from Blue Chip Growth | - | 603 | - | 19,981 |
Reinvestment of distributions | 70 | 139 | 2,916 | 4,902 |
Shares redeemed | (8,528) | (5,839) | (379,087) | (218,811) |
Net increase (decrease) | 5,444 | 6,280 | $ 249,685 | $ 233,122 |
Class F | | | | |
Shares sold | 12,501 | 8,796 | $ 558,704 | $ 331,310 |
Reinvestment of distributions | 38 | 6 | 1,580 | 235 |
Shares redeemed | (2,171) | (282) | (102,054) | (10,900) |
Net increase (decrease) | 10,368 | 8,520 | $ 458,230 | $ 320,645 |
A Conversion transactions for Class K and Blue Chip Growth are presented for the period August 1, 2009 through August 31, 2009.
Annual Report
Notes to Financial Statements - continued
(Amounts in thousands except ratios)
13. Other.
The Fund's organizational documents provide former and current trustees and officers with a limited indemnification against liabilities arising in connection with the performance of their duties to the Fund. In the normal course of business, the Fund may also enter into contracts that provide general indemnifications. The Fund's maximum exposure under these arrangements is unknown as this would be dependent on future claims that may be made against the Fund. The risk of material loss from such claims is considered remote.
Annual Report
To the Trustees of Fidelity Securities Fund and Shareholders of Fidelity Blue Chip Growth Fund:
We have audited the accompanying statement of assets and liabilities of Fidelity Blue Chip Growth Fund (the Fund), a fund of Fidelity Securities Fund, including the schedule of investments, as of July 31, 2011, and the related statement of operations for the year then ended, the statement of changes in net assets for each of the two years in the period then ended, and the financial highlights for each of the five years in the period then ended. These financial statements and financial highlights are the responsibility of the Fund's management. Our responsibility is to express an opinion on these financial statements and financial highlights based on our audits.
We conducted our audits in accordance with the standards of the Public Company Accounting Oversight Board (United States). Those standards require that we plan and perform the audit to obtain reasonable assurance about whether the financial statements and financial highlights are free of material misstatement. The Fund is not required to have, nor were we engaged to perform, an audit of its internal control over financial reporting. Our audits included consideration of internal control over financial reporting as a basis for designing audit procedures that are appropriate in the circumstances, but not for the purpose of expressing an opinion on the effectiveness of the Fund's internal control over financial reporting. Accordingly, we express no such opinion. An audit also includes examining, on a test basis, evidence supporting the amounts and disclosures in the financial statements, assessing the accounting principles used and significant estimates made by management, as well as evaluating the overall financial statement presentation. Our procedures included confirmation of securities owned as of July 31, 2011, by correspondence with the custodians and brokers; where replies were not received from brokers, we performed other auditing procedures. We believe that our audits provide a reasonable basis for our opinion.
In our opinion, the financial statements and financial highlights referred to above present fairly, in all material respects, the financial position of Fidelity Blue Chip Growth Fund as of July 31, 2011, the results of its operations for the year then ended, the changes in its net assets for each of the two years in the period then ended, and the financial highlights for each of the five years in the period then ended, in conformity with accounting principles generally accepted in the United States of America.
/s/ Deloitte & Touche LLP
DELOITTE & TOUCHE LLP
Boston, Massachusetts
September 16, 2011
Annual Report
The Trustees, Members of the Advisory Board, and executive officers of the trust and fund, as applicable, are listed below. The Board of Trustees governs the fund and is responsible for protecting the interests of shareholders. The Trustees are experienced executives who meet periodically throughout the year to oversee the fund's activities, review contractual arrangements with companies that provide services to the fund, oversee management of the risks associated with such activities and contractual arrangements, and review the fund's performance. Except for James C. Curvey, each of the Trustees oversees 221 funds advised by FMR or an affiliate. Mr. Curvey oversees 419 funds advised by FMR or an affiliate.
The Trustees hold office without limit in time except that (a) any Trustee may resign; (b) any Trustee may be removed by written instrument, signed by at least two-thirds of the number of Trustees prior to such removal; (c) any Trustee who requests to be retired or who has become incapacitated by illness or injury may be retired by written instrument signed by a majority of the other Trustees; and (d) any Trustee may be removed at any special meeting of shareholders by a two-thirds vote of the outstanding voting securities of the trust. Each Trustee who is not an interested person (as defined in the 1940 Act) (Independent Trustee), shall retire not later than the last day of the calendar year in which his or her 75th birthday occurs. The Independent Trustees may waive this mandatory retirement age policy with respect to individual Trustees. The executive officers and Advisory Board Members hold office without limit in time, except that any officer and Advisory Board Member may resign or may be removed by a vote of a majority of the Trustees at any regular meeting or any special meeting of the Trustees. Except as indicated, each individual has held the office shown or other offices in the same company for the past five years.
Experience, Skills, Attributes, and Qualifications of the Fund's Trustees. The Governance and Nominating Committee has adopted a statement of policy that describes the experience, qualifications, attributes, and skills that are necessary and desirable for potential Independent Trustee candidates (Statement of Policy). The Board believes that each Trustee satisfied at the time he or she was initially elected or appointed a Trustee, and continues to satisfy, the standards contemplated by the Statement of Policy. The Governance and Nominating Committee also engages professional search firms to help identify potential Independent Trustee candidates who have the experience, qualifications, attributes, and skills consistent with the Statement of Policy. From time to time, additional criteria based on the composition and skills of the current Independent Trustees, as well as experience or skills that may be appropriate in light of future changes to board composition, business conditions, and regulatory or other developments, have also been considered by the professional search firms and the Governance and Nominating Committee. In addition, the Board takes into account the Trustees' commitment and participation in Board and committee meetings, as well as their leadership of standing and ad hoc committees throughout their tenure.
In determining that a particular Trustee was and continues to be qualified to serve as a Trustee, the Board has considered a variety of criteria, none of which, in isolation, was controlling. The Board believes that, collectively, the Trustees have balanced and diverse experience, qualifications, attributes, and skills, which allow the Board to operate effectively in governing the fund and protecting the interests of shareholders. Information about the specific experience, skills, attributes, and qualifications of each Trustee, which in each case led to the Board's conclusion that the Trustee should serve (or continue to serve) as a trustee of the fund, is provided below.
Annual Report
Trustees and Officers - continued
Board Structure and Oversight Function. James C. Curvey is an interested person (as defined in the 1940 Act) and currently serves as Acting Chairman. The Trustees have determined that an interested Chairman is appropriate and benefits shareholders because an interested Chairman has a personal and professional stake in the quality and continuity of services provided to the fund. Independent Trustees exercise their informed business judgment to appoint an individual of their choosing to serve as Chairman, regardless of whether the Trustee happens to be independent or a member of management. The Independent Trustees have determined that they can act independently and effectively without having an Independent Trustee serve as Chairman and that a key structural component for assuring that they are in a position to do so is for the Independent Trustees to constitute a substantial majority for the Board. The Independent Trustees also regularly meet in executive session. Ned C. Lautenbach serves as Chairman of the Independent Trustees and as such (i) acts as a liaison between the Independent Trustees and management with respect to matters important to the Independent Trustees and (ii) with management prepares agendas for Board meetings.
Fidelity funds are overseen by different Boards of Trustees. The fund's Board oversees Fidelity's equity and high income funds and another Board oversees Fidelity's investment-grade bond, money market, and asset allocation funds. The asset allocation funds may invest in Fidelity funds overseen by the fund's Board. The use of separate Boards, each with its own committee structure, allows the Trustees of each group of Fidelity funds to focus on the unique issues of the funds they oversee, including common research, investment, and operational issues. On occasion, the separate Boards establish joint committees to address issues of overlapping consequences for the Fidelity funds overseen by each Board.
The Trustees operate using a system of committees to facilitate the timely and efficient consideration of all matters of importance to the Trustees, the fund, and fund shareholders and to facilitate compliance with legal and regulatory requirements and oversight of the fund's activities and associated risks. The Board, acting through its committees, has charged FMR and its affiliates with (i) identifying events or circumstances the occurrence of which could have demonstrably adverse effects on the fund's business and/or reputation; (ii) implementing processes and controls to lessen the possibility that such events or circumstances occur or to mitigate the effects of such events or circumstances if they do occur; and (iii) creating and maintaining a system designed to evaluate continuously business and market conditions in order to facilitate the identification and implementation processes described in (i) and (ii) above. Because the day-to-day operations and activities of the fund are carried out by or through FMR, its affiliates and other service providers, the fund's exposure to risks is mitigated but not eliminated by the processes overseen by the Trustees. While each of the Board's committees has responsibility for overseeing different aspects of the fund's activities, oversight is exercised primarily through the Operations, Audit, and Compliance Committees. Appropriate personnel, including but not limited to the fund's Chief Compliance Officer (CCO), FMR's internal auditor, the independent accountants, the fund's Treasurer and portfolio management personnel, make periodic reports to the Board's committees, as appropriate. The responsibilities of each committee, including their oversight responsibilities, are described further under "Standing Committees of the Fund's Trustees."
Annual Report
The fund's Statement of Additional Information (SAI) includes more information about the Trustees. To request a free copy, call Fidelity at 1-800-835-5092.
Interested Trustees*:
Correspondence intended for each Trustee who is an interested person may be sent to Fidelity Investments, 82 Devonshire Street, Boston, Massachusetts 02109.
Name, Age; Principal Occupations and Other Relevant Experience+ |
James C. Curvey (76) |
| Year of Election or Appointment: 2007
Mr. Curvey is Trustee and Acting Chairman of the Board of Trustees of certain Trusts. Mr. Curvey also serves as Trustee (2007-present) of other investment companies advised by FMR. Mr. Curvey is a Director of Fidelity Investments Money Management, Inc. (2009-present), Director of Fidelity Research & Analysis Co. (2009-present) and Director of FMR and FMR Co., Inc. (2007-present). Mr. Curvey is also Vice Chairman (2007-present) and Director of FMR LLC. In addition, Mr. Curvey serves as an Overseer for the Boston Symphony Orchestra and a member of the Trustees of Villanova University. Previously, Mr. Curvey was the Vice Chairman (2006-2007) and Director (2000-2007) of FMR Corp. |
Ronald P. O'Hanley (54) |
| Year of Election or Appointment: 2011
Mr. O'Hanley is Director of FMR Co., Inc. (2010-present), Director of Fidelity Investments Money Management, Inc. (2010-present), Director of Fidelity Research & Analysis Company (2010-present), President of Fidelity Asset Management and Corporate Services and a member of Fidelity's Executive Committee (2010-present). Previously, Mr. O'Hanley served as President and Chief Executive Officer of BNY Mellon Asset Management (2007-2010). Mr. O'Hanley also served as Vice Chairman of Bank New York Mellon Corp. and a member of that firm's Executive Committee. Prior to the 2007 merger of The Bank of New York and Mellon Financial Corporation, he was Vice Chairman of Mellon Financial Corporation and President and Chief Executive Officer of Mellon Asset Management. He joined Mellon in February 1997. Mr. O'Hanley currently serves as Chairman of the Boston Public Library Foundation Board of Directors and sits on the Board of Directors of Beth Israel Deaconess Medical Center, the Board of Trustees of the Marine Biological Laboratory and the Advisory Board of the Maxwell School of Citizenship and Public Administration at Syracuse University. Mr. O'Hanley also chairs the Council on Asset Management for the Financial Services Roundtable and is a member of the Board of Directors of Institutional Investor's U.S. Institute. |
* Trustees have been determined to be "Interested Trustees" by virtue of, among other things, their affiliation with the trust or various entities under common control with FMR.
+ The information above includes each Trustee's principal occupation during the last five years and other information relating to the experience, attributes, and skills relevant to each Trustee's qualifications to serve as a Trustee, which led to the conclusion that each Trustee should serve as a Trustee for the fund.
Annual Report
Independent Trustees:
Correspondence intended for each Independent Trustee (that is, the Trustees other than the Interested Trustees) may be sent to Fidelity Investments, P.O. Box 55235, Boston, Massachusetts 02205-5235.
Name, Age; Principal Occupations and Other Relevant Experience+ |
Dennis J. Dirks (63) |
| Year of Election or Appointment: 2005 Prior to his retirement in May 2003, Mr. Dirks was Chief Operating Officer and a member of the Board of The Depository Trust & Clearing Corporation (DTCC). He also served as President, Chief Operating Officer, and Board member of The Depository Trust Company (DTC) and President and Board member of the National Securities Clearing Corporation (NSCC). In addition, Mr. Dirks served as Chief Executive Officer and Board member of the Government Securities Clearing Corporation, Chief Executive Officer and Board member of the Mortgage-Backed Securities Clearing Corporation, as a Trustee and a member of the Finance Committee of Manhattan College (2005-2008), and as a Trustee and a member of the Finance Committee of AHRC of Nassau County (2006-2008). Mr. Dirks is a member of the Independent Directors Council (IDC) Governing Council (2010-Present) and Board of Directors for The Brookville Center for Children's Services, Inc. (2009-present). |
Alan J. Lacy (57) |
| Year of Election or Appointment: 2008 Mr. Lacy serves as Senior Adviser (2007-present) of Oak Hill Capital Partners, L.P. (private equity). Mr. Lacy also served as Chief Executive Officer (2000-2005) and Vice Chairman (2005-2006) of Sears Holdings Corporation and Sears, Roebuck and Co. (retail). In addition, Mr. Lacy serves as a member of the Board of Directors of Dave & Buster's, Inc. (restaurant and entertainment complexes, 2010-present), The Hillman Companies, Inc. (hardware wholesalers, 2010-present), and Bristol-Myers Squibb Company (global pharmaceuticals, 2007-present). Mr. Lacy is a member of the Board of Trustees of The National Parks Conservation Association (2006-Present). Previously, Mr. Lacy served as Chairman of the Board of Trustees of the National Parks Conservation Association (2008-2011) and as a member of the Board of Directors for the Western Union Company (global money transfer, 2006-2011). |
Ned C. Lautenbach (67) |
| Year of Election or Appointment: 2000 Mr. Lautenbach is Chairman of the Independent Trustees of the Equity and High Income Funds (2006-present). Mr. Lautenbach currently serves as the Lead Director of the Eaton Corporation Board of Directors (diversified industrial, 1997-present). Mr. Lautenbach is also a member of the Board of Directors of the Philharmonic Center for the Arts in Naples, Florida (1999-present); a member of the Board of Trustees of Fairfield University (2005-present); and a member of the Council on Foreign Relations (1994-present). Previously, Mr. Lautenbach was a Partner/Advisory Partner at Clayton, Dubilier & Rice, LLC (private equity investment, 1998-2010), as well as a Director of Sony Corporation (2006-2007). |
Joseph Mauriello (66) |
| Year of Election or Appointment: 2008 Prior to his retirement in January 2006, Mr. Mauriello served in numerous senior management positions including Deputy Chairman and Chief Operating Officer (2004-2005), and Vice Chairman of Financial Services (2002-2004) of KPMG LLP US (professional services, 1965-2005). Mr. Mauriello currently serves as a member of the Board of Directors of XL Group plc. (global insurance and re-insurance, 2006-present) and of Arcadia Resources Inc. (health care services and products, 2007-present). Previously, Mr. Mauriello served as a Director of the Hamilton Funds of the Bank of New York (2006-2007). |
Robert W. Selander (60) |
| Year of Election or Appointment: 2011
Previously, Mr. Selander served as a Member of the Advisory Board of Fidelity's Equity and High Income Funds (2011), Executive Vice Chairman (2010), Chief Executive Officer (2009-2010), and President and Chief Executive Officer (1997-2009) of Mastercard, Inc. |
Cornelia M. Small (67) |
| Year of Election or Appointment: 2005 Ms. Small is a member of the Board of Directors of the Teagle Foundation (2009-present). Ms. Small is also a member of the Investment Committee, and Chair (2008-present) and a member of the Board of Trustees of Smith College. In addition, Ms. Small serves on the Investment Committee of the Berkshire Taconic Community Foundation (2008-present). Previously, Ms. Small served as Chairperson of the Investment Committee (2002-2008) of Smith College. In addition, Ms. Small served as Chief Investment Officer, Director of Global Equity Investments, and a member of the Board of Directors of Scudder, Stevens & Clark and Scudder Kemper Investments. |
William S. Stavropoulos (72) |
| Year of Election or Appointment: 2002 Mr. Stavropoulos is Vice Chairman of the Independent Trustees of the Equity and High Income Funds (2006-present). Mr. Stavropoulos serves as President and Founder of the Michigan Baseball Foundation, the Great Lakes Loons (2007-present). Mr. Stavropoulos is Chairman Emeritus of the Board of Directors of The Dow Chemical Company, where he previously served in numerous senior management positions, including President, CEO (1995-2000; 2002-2004), Chairman of the Executive Committee (2000-2006), and as a member of the Board of Directors (1990-2006). Currently, Mr. Stavropoulos is Chairman of Univar (global distributor of commodity and specialty chemicals, 2010-present), a Director of Teradata Corporation (data warehousing and technology solutions, 2008-present), Chemical Financial Corporation, Maersk Inc. (industrial conglomerate), Tyco International, Inc. (multinational manufacturing and services, 2007-present), and a member of the Advisory Board for Metalmark Capital (private equity investment, 2005-present). Mr. Stavropoulos is a special advisor to Clayton, Dubilier & Rice, LLC (private equity investment). In addition, Mr. Stavropoulos is a member of the University of Notre Dame Advisory Council for the College of Science. |
David M. Thomas (62) |
| Year of Election or Appointment: 2008 Previously, Mr. Thomas served as Executive Chairman (2005-2006) and Chairman and Chief Executive Officer (2000-2005) of IMS Health, Inc. (pharmaceutical and healthcare information solutions). In addition, Mr. Thomas serves as a member of the Board of Directors of Fortune Brands, Inc. (consumer products), and Interpublic Group of Companies, Inc. (marketing communication, 2004-present). |
Michael E. Wiley (60) |
| Year of Election or Appointment: 2008 Mr. Wiley also serves as a Director of Asia Pacific Exploration Consolidated (international oil and gas exploration and production, 2008-present). Mr. Wiley serves as a Director of Tesoro Corporation (independent oil refiner and marketer, 2005-present), and a Director of Bill Barrett Corporation (exploration and production, 2005-present). In addition, Mr. Wiley also serves as a Director of Post Oak Bank (privately-held bank, 2004-present). Previously, Mr. Wiley served as a member of the Board of Trustees of the University of Tulsa (2000-2006; 2007-2010), as a Senior Energy Advisor of Katzenbach Partners, LLC (consulting, 2006-2007), as an Advisory Director of Riverstone Holdings (private investment), Chairman, President, and CEO of Baker Hughes, Inc. (oilfield services, 2000-2004), and as Director of Spinnaker Exploration Company (exploration and production, 2001-2005). |
Annual Report
Trustees and Officers - continued
+ The information above includes each Trustee's principal occupation during the last five years and other information relating to the experience, attributes, and skills relevant to each Trustee's qualifications to serve as a Trustee, which led to the conclusion that each Trustee should serve as a Trustee for the fund.
Advisory Board Members and Executive Officers:
Correspondence intended for each executive officer, Edward C. Johnson 3d, and Peter S. Lynch may be sent to Fidelity Investments, 82 Devonshire Street, Boston, Massachusetts 02109.
Name, Age; Principal Occupation |
Edward C. Johnson 3d (81) |
| Year of Election or Appointment: 2011 Member of the Advisory Board of Fidelity's Equity and High Income Funds. Mr. Johnson serves as Chief Executive Officer, Chairman, and a Director of FMR LLC, and also serves as Chairman and Director of FIL Limited. Previously, Mr. Johnson served as a Trustee and Chairman of the Board of certain Fidelity Trusts, Chairman and a Director of FMR, Chairman and a Director of FMR Co., Inc., and President of FMR LLC (2006-2007). |
Peter S. Lynch (67) |
| Year of Election or Appointment: 2003 Member of the Advisory Board of Fidelity's Equity and High Income Funds. Mr. Lynch is Vice Chairman and a Director of FMR and FMR Co., Inc. In addition, Mr. Lynch serves as a Trustee of Boston College and as the Chairman of the Inner-City Scholarship Fund. Previously, Mr. Lynch served on the Special Olympics International Board of Directors (1997-2006). |
Kenneth B. Robins (41) |
| Year of Election or Appointment: 2008 President and Treasurer of Fidelity's Equity and High Income Funds. Mr. Robins also serves as President and Treasurer (2010-present) and Assistant Treasurer (2009-present) of other Fidelity funds and is an employee of Fidelity Investments (2004-present). Previously, Mr. Robins served as Deputy Treasurer of the Fidelity funds (2005-2008) and Treasurer and Chief Financial Officer of The North Carolina Capital Management Trust: Cash and Term Portfolios (2006-2008). |
Bruce T. Herring (45) |
| Year of Election or Appointment: 2006 Vice President of certain Equity Funds. Mr. Herring also serves as Chief Investment Officer and Director of Fidelity Management & Research (U.K.) Inc. (2010-present) and Group Chief Investments Officer of FMR. Previously, Mr. Herring served as Vice President (2005-2006) and Senior Vice President (2006-2007) of Fidelity Management & Research Company, Vice President of FMR Co., Inc. (2001-2007) and as a portfolio manager for Fidelity U.S. Equity Funds. |
Brian B. Hogan (46) |
| Year of Election or Appointment: 2009 Vice President of Equity and High Income Funds. Mr. Hogan also serves as President of FMR's Equity Division (2009-present). Previously, Mr. Hogan served as Senior Vice President, Equity Research of FMR (2006-2009) and as a portfolio manager. |
Scott C. Goebel (43) |
| Year of Election or Appointment: 2008 Secretary and Chief Legal Officer (CLO) of the Fidelity funds. Mr. Goebel also serves as Secretary of Fidelity Investments Money Management, Inc. (FIMM) (2010-present) and Fidelity Research and Analysis Company (FRAC) (2010-present); Secretary and CLO of The North Carolina Capital Management Trust: Cash and Term Portfolios (2008-present); General Counsel, Secretary, and Senior Vice President of FMR (2008-present) and FMR Co., Inc. (2008-present); employed by FMR LLC or an affiliate (2001-present); Chief Legal Officer of Fidelity Management & Research (Hong Kong) Limited (2008-present) and Assistant Secretary of Fidelity Management & Research (Japan) Inc. (2008-present), and Fidelity Management & Research (U.K.) Inc. (2008-present). Previously, Mr. Goebel served as Assistant Secretary of FIMM (2008-2010), FRAC (2008-2010), and the Funds (2007-2008) and as Vice President and Secretary of Fidelity Distributors Corporation (FDC) (2005-2007). |
William C. Coffey (42) |
| Year of Election or Appointment: 2009 Assistant Secretary of Fidelity's Equity and High Income Funds. Mr. Coffey also serves as Senior Vice President and Deputy General Counsel of FMR LLC (2010-present), and is an employee of Fidelity Investments. Previously, Mr. Coffey served as Vice President and Associate General Counsel of FMR LLC (2005-2009). |
Holly C. Laurent (57) |
| Year of Election or Appointment: 2008 Anti-Money Laundering (AML) Officer of the Fidelity funds. Ms. Laurent also serves as AML Officer of The North Carolina Capital Management Trust: Cash and Term Portfolios (2008-present) and is an employee of Fidelity Investments. Previously, Ms. Laurent was Senior Vice President and Head of Legal for Fidelity Business Services India Pvt. Ltd. (2006-2008), and Senior Vice President, Deputy General Counsel and Group Head for FMR LLC (2005-2006). |
Christine Reynolds (52) |
| Year of Election or Appointment: 2008 Chief Financial Officer of the Fidelity funds. Ms. Reynolds became President of Fidelity Pricing and Cash Management Services (FPCMS) in August 2008. Ms. Reynolds served as Chief Operating Officer of FPCMS (2007-2008). Previously, Ms. Reynolds served as President, Treasurer, and Anti-Money Laundering officer of the Fidelity funds (2004-2007). |
Kenneth A. Rathgeber (64) |
| Year of Election or Appointment: 2004 Chief Compliance Officer of Fidelity's Equity and High Income Funds. Mr. Rathgeber is Chief Compliance Officer of Fidelity Management & Research (Hong Kong) Limited (2008-present), Fidelity Management & Research (Japan) Inc. (2008-present), FMR (2005-present), FMR Co., Inc. (2005-present), Fidelity Management & Research (U.K.) Inc. (2005-present), Fidelity Research & Analysis Company (2005-present), Fidelity Investments Money Management, Inc. (2005-present), Pyramis Global Advisors, LLC (2005-present), and Strategic Advisers, Inc. (2005-present). |
Jeffrey S. Christian (49) |
| Year of Election or Appointment: 2009 Deputy Treasurer of the Fidelity funds. Mr. Christian is an employee of Fidelity Investments. Previously, Mr. Christian served as Chief Financial Officer (2008-2009) of certain Fidelity funds and Senior Vice President of Fidelity Pricing and Cash Management Services (FPCMS) (2004-2009). |
Bryan A. Mehrmann (50) |
| Year of Election or Appointment: 2005 Deputy Treasurer of the Fidelity funds. Mr. Mehrmann is an employee of Fidelity Investments. |
Adrien E. Deberghes (43) |
| Year of Election or Appointment: 2008 Deputy Treasurer of Fidelity's Equity and High Income Funds. Mr. Deberghes also serves as Assistant Treasurer of other Fidelity funds (2010-present) and is an employee of Fidelity Investments (2008-present). Previously, Mr. Deberghes served as Senior Vice President of Mutual Fund Administration at State Street Corporation (2007-2008), Senior Director of Mutual Fund Administration at Investors Bank & Trust (2005-2007), and Director of Finance for Dunkin' Brands (2000-2005). |
Stephanie J. Dorsey (42) |
| Year of Election or Appointment: 2010 Assistant Treasurer of Fidelity's Equity and High Income Funds. Ms. Dorsey also serves as Deputy Treasurer of other Fidelity funds (2008-present) and is an employee of Fidelity Investments (2008-present). Previously, Ms. Dorsey served as Treasurer (2004-2008) of the JPMorgan Mutual Funds and Vice President (2004-2008) of JPMorgan Chase Bank. |
John R. Hebble (53) |
| Year of Election or Appointment: 2009 Assistant Treasurer of Fidelity's Equity and High Income Funds. Mr. Hebble also serves as President (2011-present), Treasurer, and Chief Financial Officer of The North Carolina Capital Management Trust: Cash and Term Portfolios (2008-present), President and Treasurer of other Fidelity funds (2008-present) and is an employee of Fidelity Investments. |
Gary W. Ryan (52) |
| Year of Election or Appointment: 2005 Assistant Treasurer of the Fidelity funds. Mr. Ryan is an employee of Fidelity Investments. Previously, Mr. Ryan served as Vice President of Fund Reporting in Fidelity Pricing and Cash Management Services (FPCMS) (1999-2005). |
Jonathan Davis (43) |
| Year of Election or Appointment: 2010 Assistant Treasurer of the Fidelity funds. Mr. Davis is an employee of Fidelity Investments. Previously, Mr. Davis served as Vice President and Associate General Counsel of FMR LLC (2003-2010). |
Annual Report
The Board of Trustees of Fidelity Blue Chip Growth Fund voted to pay shareholders of record at the opening of business on record date, the following distributions per share derived from capital gains realized from sales of portfolio securities:
| Pay Date | Record Date | Capital Gains |
Class F | 09/12/11 | 09/09/11 | $1.598 |
Class F designates 100% of the dividends distributed in September and December, during the fiscal year as qualifying for the dividends-received deduction for corporate shareholders.
Class F designates 100% of the dividends distributed during the fiscal year as amounts which may be taken into account as a dividend for purposes of the maximum rate under section 1(h)(11) of the Internal Revenue Code.
The fund hereby designates as a capital gain dividend with respect to the taxable year ended July 31, 2011, $504,225,963, or, if subsequently determined to be different, the net capital gain of such year.
The fund will notify shareholders in January 2012 of amounts for use in preparing 2011 income tax returns.
Annual Report
Board Approval of Investment Advisory Contracts and Management Fees
Fidelity Blue Chip Growth Fund
Each year, the Board of Trustees, including the Independent Trustees (together, the Board), votes on the renewal of the management contract and sub-advisory agreements (together, the Advisory Contracts) for the fund. The Board, assisted by the advice of fund counsel and Independent Trustees' counsel, requests and considers a broad range of information relevant to the renewal of the Advisory Contracts throughout the year.
The Board meets regularly and considers at each of its meetings factors that are relevant to its annual consideration of the renewal of the fund's Advisory Contracts, including the services and support provided to the fund and its shareholders. The Board has established various standing committees, each composed of Independent Trustees with varying backgrounds, to which the Board has assigned specific subject matter responsibilities in order to enhance effective decision-making by the Board. The Board, acting directly and through its Committees, requests and receives information concerning the annual consideration of the renewal of the fund's Advisory Contracts. The Board also meets as needed to consider matters specifically related to the Board's annual consideration of the renewal of Advisory Contracts. Members of the Board may also meet with trustees of other Fidelity funds through ad hoc joint committees to discuss certain matters relevant to the Fidelity funds.
At its July 2011 meeting, the Board of Trustees, including the Independent Trustees, unanimously determined to renew the fund's Advisory Contracts. In reaching its determination, the Board considered all factors it believed relevant, including (i) the nature, extent, and quality of the services to be provided to the fund and its shareholders (including the investment performance of the fund); (ii) the competitiveness of the fund's management fee and total expense ratio; (iii) the total costs of the services to be provided by and the profits to be realized by Fidelity from its relationship with the fund; (iv) the extent to which economies of scale would be realized as the fund grows; and (v) whether fee levels reflect these economies of scale, if any, for the benefit of fund shareholders.
In considering whether to renew the Advisory Contracts for the fund, the Board reached a determination, with the assistance of fund counsel and Independent Trustees' counsel and through the exercise of its business judgment, that the renewal of the Advisory Contracts is in the best interests of the fund and its shareholders and that the compensation payable under the Advisory Contracts is fair and reasonable. The Board's decision to renew the Advisory Contracts was not based on any single factor, but rather was based on a comprehensive consideration of all the information provided to the Board at its meetings throughout the year. The Board, in reaching its determination to renew the Advisory Contracts, is aware that shareholders in the fund have a broad range of investment choices available to them, including a wide choice among mutual funds offered by Fidelity's competitors, and that the fund's shareholders, who have the opportunity to review and weigh the disclosure provided by the fund in its prospectus and other public disclosures, have chosen to invest in this fund, managed by Fidelity.
Annual Report
Board Approval of Investment Advisory Contracts and
Management Fees - continued
Nature, Extent, and Quality of Services Provided. The Board considered the staffing within the investment adviser, FMR, and the sub-advisers (together, the Investment Advisers), including the backgrounds of the fund's investment personnel and the fund's investment objective and discipline. The Independent Trustees also had discussions with senior management of Fidelity's investment operations and investment groups. The Board considered the structure of the portfolio manager compensation program and whether this structure provides appropriate incentives to act in the best interests of the fund.
Resources Dedicated to Investment Management and Support Services. The Board and the Fund Oversight and Research Committees reviewed the general qualifications and capabilities of the Investment Advisers' investment staff, including its size, education, experience, and resources, as well as the Investment Advisers' approach to recruiting, training, managing, and compensating investment personnel. The Board also noted that FMR has devoted increased resources to non-U.S. offices. The Board noted that Fidelity's analysts have extensive resources, tools and capabilities which allow them to conduct sophisticated quantitative and fundamental analysis, as well as credit analysis of issuers, counterparties and enhancers. The Board also believes that Fidelity's investment professionals have sufficient access to global information and data so as to provide competitive investment results over time, and that those professionals also have access to sophisticated tools which permit them to assess portfolio construction and risk and performance attribution characteristics continuously, as well as to transmit new information and research conclusions rapidly around the world. Additionally, in their deliberations, the Board considered the Investment Advisers' trading capabilities and resources which are an integral part of the investment management process.
Shareholder and Administrative Services. The Board considered (i) the nature, extent, quality, and cost of advisory, administrative, and shareholder services performed by the Investment Advisers and their affiliates under the Advisory Contracts and under separate agreements covering transfer agency, pricing and bookkeeping, and securities lending services for the fund; (ii) the nature and extent of the investment adviser's supervision of third party service providers, principally custodians and subcustodians; and (iii) the resources devoted to, and the record of compliance with, the fund's compliance policies and procedures. The Board also reviewed the allocation of fund brokerage, including allocations to brokers affiliated with the Investment Advisers, the use of brokerage commissions to pay fund expenses, and the use of "soft" commission dollars to pay for research services.
The Board noted that the growth of fund assets over time across the complex allows Fidelity to reinvest in the development of services designed to enhance the value or convenience of the Fidelity funds as investment vehicles. These services include 24-hour access to account information and market information through telephone representatives and over the Internet, investor education materials and asset allocation tools, and the expanded availability of Fidelity Investor Centers, with 35 new branches opening since 2010.
Annual Report
Investment in a Large Fund Family. The Board considered the benefits to shareholders of investing in a Fidelity fund, including the benefits of investing in a fund that is part of a large family of funds offering a variety of investment disciplines and providing a large variety of mutual fund investor services. The Board noted that Fidelity had taken, or had made recommendations that resulted in the Fidelity funds taking, a number of actions over the previous year that benefited particular funds, including (i) continuing to dedicate additional resources to investment research and support of the senior management team that oversees asset management; (ii) rationalizing product lines through the mergers of six funds into other funds; (iii) continuing to migrate the Freedom Funds to dedicated lower cost underlying funds; (iv) obtaining shareholder approval to broaden the investment strategies for Fidelity Consumer Finance Portfolio, Fidelity Emerging Asia Fund, and Fidelity Environment and Alternative Energy Portfolio; (v) contractually agreeing to reduce the management fees and impose other expense limitations on Spartan® 500 Index Fund and U.S. Bond Index Fund in connection with launching new institutional classes of these funds; (vi) changing the name, primary and supplemental benchmarks, and investment policies of Fidelity Global Strategies Fund to support the fund's flexible investment mandate and global orientation; and (vii) reducing the transfer agency account fee rates on certain accounts.
Investment Performance. The Board considered whether the fund has operated in accordance with its investment objective, as well as its record of compliance with its investment restrictions. It also reviewed the fund's absolute investment performance for each class, as well as the fund's relative investment performance for each class measured over multiple periods against (i) a broad-based securities market index, and (ii) a peer group of mutual funds deemed appropriate by Fidelity and reviewed by the Board. The following charts considered by the Board show, over the one-, three-, and five-year periods ended December 31, 2010, as available, the cumulative total returns of Class F and the retail class of the fund, the cumulative total returns of a broad-based securities market index ("benchmark"), and a range of cumulative total returns of a peer group of mutual funds identified by Morningstar, Inc. as having an investment style similar to that of the fund based on underlying portfolio holdings. The returns of Class F and the retail class show the performance of the highest and lowest performing classes, respectively (based on one-year performance). The box within each chart shows the 25th percentile return (bottom of box) and the 75th percentile return (top of box) of the peer group. Returns shown above the box are in the first quartile and returns shown below the box are in the fourth quartile. The percentage beaten numbers noted below each chart correspond to the percentile box and represent the percentage of funds in the peer group whose performance was equal to or lower than that of the class indicated.
Annual Report
Board Approval of Investment Advisory Contracts and
Management Fees - continued
Fidelity Blue Chip Growth Fund
The Board reviewed the fund's relative investment performance against its peer group and noted that the performance of the retail class of the fund (the class with the longest performance record) was in the first quartile for all the periods shown. The Board also noted that the investment performance of the retail class of the fund compared favorably to its benchmark for all the periods shown. The Board considered that the variations in performance among the fund's classes reflect the variations in class expenses, which result in lower performance for higher expense classes. The Board also reviewed the fund's performance since inception as well as performance in the current year.
The Board also considered that the fund's management fee is subject to upward or downward adjustment depending upon whether, and to what extent, the fund's investment performance for the performance period exceeds, or is exceeded by, the record (over the same period) of a Board-approved performance adjustment index. The Board noted that the performance adjustment provides FMR with a strong economic incentive to seek to achieve superior performance for the fund's shareholders and helps to more closely align the interests of FMR and the fund's shareholders.
Based on its review, the Board concluded that the nature, extent, and quality of services provided to the fund under the Advisory Contracts should benefit the fund's shareholders.
Annual Report
Competitiveness of Management Fee and Total Expense Ratio. The Board considered the fund's management fee and total expense ratio compared to "mapped groups" of competitive funds and classes. Fidelity creates "mapped groups" by combining similar Lipper investment objective categories that have comparable management fee characteristics. Combining Lipper investment objective categories aids the Board's management fee and total expense ratio comparisons by broadening the competitive group used for comparison and by reducing the number of universes to which various Fidelity funds are compared.
Management Fee. The Board considered two proprietary management fee comparisons for the 12-month periods shown in the chart below. The group of Lipper funds used by the Board for management fee comparisons is referred to below as the "Total Mapped Group." The Total Mapped Group comparison focuses on a fund's standing relative to the total universe of comparable funds available to investors in terms of gross management fees before expense reimbursements or caps, and without giving effect to the fund's performance adjustment. "TMG %" represents the percentage of funds in the Total Mapped Group that had management fees that were lower than the fund's. For example, a TMG % of 10% means that 90% of the funds in the Total Mapped Group had higher management fees than the fund. The "Asset-Size Peer Group" (ASPG) comparison focuses on a fund's standing relative to non-Fidelity funds similar in size to the fund within the Total Mapped Group. The ASPG represents at least 15% of the funds in the Total Mapped Group with comparable asset size and management fee characteristics, subject to a minimum of 50 funds (or all funds in the Total Mapped Group if fewer than 50). Additional information, such as the ASPG quartile in which the fund's management fee ranked and the impact of the fund's performance adjustment, is also included in the chart and considered by the Board.
Annual Report
Board Approval of Investment Advisory Contracts and
Management Fees - continued
Fidelity Blue Chip Growth Fund
The Board noted that the fund's management fee ranked below the median of its Total Mapped Group and below the median of its ASPG for 2010. The Board also noted the effect of the fund's positive performance adjustment on the fund's management fee ranking. The Board noted that the performance adjustment for each year represents calculations for performance periods that differ from the periods shown in the performance charts above.
Furthermore, the Board considered that shareholders approved a prospective change in the index used to calculate the fund's performance adjustment beginning June 1, 2006. The Board also considered that, because the performance adjustment is based on a rolling 36-month measurement period, during a transition period the fund's performance is compared to a blended index return that reflects the performance of the former index for the portion of the measurement period prior to June 1, 2006 and the performance of the current index for the remainder of the measurement period. The Board noted that the fund's performance adjustments for 2006 through 2009 shown in the chart above reflect the effect of using the blended index return to calculate the fund's performance adjustment.
Based on its review, the Board concluded that the fund's management fee is fair and reasonable in light of the services that the fund receives and the other factors considered.
Total Expense Ratio. In its review of each class's total expense ratio, the Board considered the fund's management fee as well as other fund or class expenses, as applicable, such as transfer agent fees, pricing and bookkeeping fees, and custodial, legal, and audit fees. The Board also noted the effects of any waivers and reimbursements on fees and expenses, as well as the impact of the fund's performance adjustment. As part of its review, the Board also considered the current and historical total expense ratios of each class of the fund compared to competitive fund median expenses. Each class of the fund is compared to those funds and classes in the Total Mapped Group (used by the Board for management fee comparisons) that have a similar sales load structure.
Annual Report
The Board noted that the total expense ratio of each class ranked below its competitive median for 2010. The Board considered that various factors, including 12b-1 fees, positive or negative performance adjustments, and relatively higher other expenses in the case of small fund size, can affect total expense ratios.
Fees Charged to Other Fidelity Clients. The Board also considered Fidelity fee structures and other information with respect to clients of FMR and its affiliates, such as other mutual funds advised or subadvised by FMR or its affiliates, pension plan clients, and other institutional clients. In March 2010, the Board created an ad hoc joint committee with the board of other Fidelity funds (the Committee) to review and compare Fidelity's institutional investment advisory business with its business of providing services to the Fidelity funds, including the differences in services provided, fees charged, and costs incurred, as well as competition in their respective marketplaces.
Based on its review of total expense ratios and fees charged to other Fidelity clients, the Board concluded that the total expense ratio of each class of the fund was reasonable in light of the services that the fund and its shareholders receive and the other factors considered, including the findings of the Committee.
Costs of the Services and Profitability. The Board considered the revenues earned and the expenses incurred by Fidelity in conducting the business of developing, marketing, distributing, managing, administering and servicing the fund and its shareholders. The Board also considered the level of Fidelity's profits in respect of all the Fidelity funds.
On an annual basis, FMR presents to the Board Fidelity's profitability for the fund. Fidelity calculates the profitability for each fund, as well as aggregate profitability for groups of Fidelity funds and all Fidelity funds, using a series of detailed revenue and cost allocation methodologies which originate with the books and records of Fidelity on which Fidelity's audited financial statements are based. The Audit Committee of the Board reviews any significant changes from the prior year's methodologies.
PricewaterhouseCoopers LLP (PwC), independent registered public accounting firm and auditor to Fidelity and certain Fidelity funds, has been engaged annually by the Board as part of the Board's assessment of Fidelity's profitability analysis. PwC's engagement includes the review and assessment of Fidelity's methodologies used in determining the revenues and expenses attributable to Fidelity's mutual fund business, and completion of agreed-upon procedures surrounding the mathematical accuracy of fund profitability and its conformity to allocation methodologies. After considering PwC's reports issued under the engagement and information provided by Fidelity, the Board concluded that while other allocation methods may also be reasonable, Fidelity's profitability methodologies are reasonable in all material respects.
Annual Report
Board Approval of Investment Advisory Contracts and
Management Fees - continued
The Board also reviewed Fidelity's non-fund businesses and fall-out benefits related to the mutual fund business as well as cases where Fidelity's affiliates may benefit from or be related to the fund's business.
The Board considered the costs of the services provided by and the profits realized by Fidelity in connection with the operation of the fund and was satisfied that the profitability was not excessive in the circumstances.
Economies of Scale. The Board considered whether there have been economies of scale in respect of the management of the Fidelity funds, whether the Fidelity funds (including the fund) have appropriately benefited from any such economies of scale, and whether there is potential for realization of any further economies of scale. The Board considered the extent to which the fund will benefit from economies of scale through increased services to the fund, through waivers or reimbursements, or through fee or expense reductions. The Board also noted that in 2009, it and the board of other Fidelity funds created an ad hoc committee (the Economies of Scale Committee) to analyze whether FMR attains economies of scale in respect of the management and servicing of the Fidelity funds, whether the Fidelity funds have appropriately benefited from such economies of scale, and whether there is potential for realization of any further economies of scale.
The Board recognized that the fund's management contract incorporates a "group fee" structure, which provides for lower group fee rates as total fund assets under FMR's management increase, and for higher group fee rates as total fund assets under FMR's management decrease. FMR calculates the group fee rates based on a tiered asset "breakpoint" schedule that varies based on asset class. The Board considered that the group fee is designed to deliver the benefits of economies of scale to fund shareholders when total Fidelity fund assets increase, even if assets of any particular fund are unchanged or have declined, because some portion of Fidelity's costs are attributable to services provided to all Fidelity funds, and all funds benefit if those costs can be allocated among more assets. The Board concluded that, given the group fee structure, fund shareholders will benefit from lower management fees as assets under FMR's management increase at the fund complex level, regardless of whether Fidelity achieves any such economies of scale.
The Board concluded, taking into account the analysis of the Economies of Scale Committee, that any potential economies of scale are being appropriately shared between fund shareholders and Fidelity.
Annual Report
Additional Information Requested by the Board. In order to develop fully the factual basis for consideration of the Fidelity funds' Advisory Contracts, the Board requested and received additional information on certain topics, including (i) fund performance trends, actions to be taken by FMR to improve certain funds' overall performance, and Fidelity's long-term strategies for certain funds; (ii) portfolio manager changes that have occurred during the past year and length of portfolio manager tenure for different categories of funds over time; (iii) Fidelity's compensation structure for portfolio managers and other key personnel and strategies for attracting and retaining non-investment personnel; (iv) the amount of the investment that each portfolio manager has made in the Fidelity fund(s) that he or she manages; (v) historical trends in Fidelity's realization of fall-out benefits; (vi) Fidelity's group fee structures and the rationale for the individual fee rates of certain funds; (vii) fund profitability methodology and the impact of certain factors on fund profitability results; (viii) trends regarding industry use of performance fee structures and Fidelity's compliance practices with respect to performance adjustment calculations; (ix) the fee structures in place for certain other Fidelity clients; and (x) explanations regarding the relative total expense ratios of certain funds and classes, total expense competitive trends, and actions that might be taken by FMR to reduce total expense ratios for certain funds and classes.
Based on its evaluation of all of the conclusions noted above, and after considering all factors it believed relevant, the Board ultimately concluded that the advisory fee structures are fair and reasonable, and that the fund's Advisory Contracts should be renewed.
Annual Report
Managing Your Investments
Fidelity offers several ways to conveniently manage your workplace benefits (including your workplace savings plan, investments, and additional services) via your telephone or PC. You can access your plan and account information and research your investments 24 hours a day.
By Phone
Fidelity provides a single toll-free number to access plan information, account balances, positions, and quotes*. It's easy to navigate the service, and on your first call, the system will help you create a personal identification number (PIN) for security.
(phone_graphic)
Fidelity Workplace
Investing
1-800-835-5092
By PC
Fidelity's web site on the Internet provides a wide range of information, including plan information, daily financial news, fund performance, interactive planning tools, and news about Fidelity products and services.
(computer_graphic)
Fidelity's Web Site
www.401k.com
* When you call the quotes line, please remember that a fund's yield and return will vary and, except for money market funds, share price will also vary. This means that you may have a gain or loss when you sell your shares. There is no assurance that money market funds will be able to maintain a stable $1 share price; an investment in a money market fund is not insured or guaranteed by the U.S. government. Total returns are historical and include changes in share price, reinvestment of dividends and capital gains distributions, and the effects of any sales charges.
Annual Report
To Write Fidelity
We'll give your correspondence immediate attention and send you written confirmation upon completion of your request.
(letter_graphic)
For Non-Retirement
Accounts
Buying shares
Fidelity Investments
P.O. Box 770001
Cincinnati, OH 45277-0003
Overnight Express
Fidelity Investments
Attn: Distribution Services
100 Crosby Parkway - KC1H
Covington, KY 41015
Selling shares
Fidelity Investments
P.O. Box 770001
Cincinnati, OH 45277-0035
Overnight Express
Fidelity Investments
Attn: Distribution Services
100 Crosby Parkway - KC1H
Covington, KY 41015
General Correspondence
Fidelity Investments
P.O. Box 500
Merrimack, NH 03054-0500
(letter_graphic)
For Retirement
Accounts
Buying shares
Fidelity Investments
P.O. Box 770001
Cincinnati, OH 45277-0003
Selling shares
Fidelity Investments
P.O. Box 770001
Cincinnati, OH 45277-0035
Overnight Express
Fidelity Investments
Attn: Distribution Services
100 Crosby Parkway - KC1H
Covington, KY 41015
General Correspondence
Fidelity Investments
P.O. Box 500
Merrimack, NH 03054-0500
Annual Report
Investment Adviser
Fidelity Management & Research Company
Boston, MA
Investment Sub-Advisers
FMR Co., Inc.
Fidelity Management & Research
(U.K.) Inc.
Fidelity Management & Research
(Hong Kong) Limited
Fidelity Management & Research
(Japan) Inc.
General Distributor
Fidelity Distributors Corporation
Boston, MA
Transfer and Service Agents
Fidelity Investments Institutional
Operations Company, Inc.
Boston, MA
Fidelity Service Company, Inc.
Boston, MA
Custodian
Citibank, N.A.
New York, NY
BCF-F-ANN-0911
1.891663.102
Fidelity®
Blue Chip Growth
Fund -
Class K
Annual Report
July 31, 2011
(2_fidelity_logos) (Registered_Trademark)
Contents
Chairman's Message | <Click Here> | The Chairman's message to shareholders. |
Performance | <Click Here> | How the fund has done over time. |
Management's Discussion of Fund Performance | <Click Here> | The Portfolio Manager's review of fundperformance and strategy. |
Shareholder Expense Example | <Click Here> | An example of shareholder expenses. |
Investment Changes | <Click Here> | A summary of major shifts in the fund's investments over the past six months. |
Investments | <Click Here> | A complete list of the fund's investments with their market values. |
Financial Statements | <Click Here> | Statements of assets and liabilities, operations, and changes in net assets,
as well as financial highlights. |
Notes | <Click Here> | Notes to the financial statements. |
Report of Independent Registered Public Accounting Firm | <Click Here> | |
Trustees and Officers | <Click Here> | |
Distributions | <Click Here> | |
Board Approval of Investment Advisory Contracts and Management Fees | <Click Here> | |
To view a fund's proxy voting guidelines and proxy voting record for the 12-month period ended June 30, visit http://www.fidelity.com/proxyvotingresults or visit the Securities and Exchange Commission's (SEC) web site at http://www.sec.gov. You may also call 1-800-835-5092 to request a free copy of the proxy voting guidelines.
Standard & Poor's, S&P and S&P 500 are registered service marks of The McGraw-Hill Companies, Inc. and have been licensed for use by Fidelity Distributors Corporation.
Other third party marks appearing herein are the property of their respective owners.
All other marks appearing herein are registered or unregistered trademarks or service marks of FMR LLC or an affiliated company.
Annual Report
This report and the financial statements contained herein are submitted for the general information of the shareholders of the fund. This report is not authorized for distribution to prospective investors in the fund unless preceded or accompanied by an effective prospectus.
A fund files its complete schedule of portfolio holdings with the SEC for the first and third quarters of each fiscal year on Form N-Q. Forms N-Q are available on the SEC's web site at http://www.sec.gov. A fund's Forms N-Q may be reviewed and copied at the SEC's Public Reference Room in Washington, DC. Information regarding the operation of the SEC's Public Reference Room may be obtained by calling 1-800-SEC-0330. For a complete list of a fund's portfolio holdings, view the most recent holdings listing, semiannual report, or annual report on Fidelity's web site at http://www.fidelity.com, http://www.advisor.fidelity.com, or http://www.401k.com, as applicable.
NOT FDIC INSURED • MAY LOSE VALUE • NO BANK GUARANTEE
Neither the fund nor Fidelity Distributors Corporation is a bank.
Annual Report
(photo_of_James_C_Curvey)
Dear Shareholder:
The second half of 2011 began with U.S. equities continuing to give back some of the gains achieved earlier in the year. In the days leading up to July 31, markets were shaken by a political stalemate in which Congress struggled to address the debt ceiling issue before an early-August deadline. The resulting uncertainty held back markets in July, the third consecutive monthly decline for equities, effectively reversing the positive momentum seen through the end of April. Financial markets are always unpredictable, of course, but there are several time-tested investment principles that can help put the odds in your favor.
One of the basic tenets is to invest for the long term. Over time, riding out the markets' inevitable ups and downs has proven much more effective than selling into panic or chasing the hottest trend. Even missing only a few of the markets' best days can significantly diminish investor returns. Patience also affords the benefits of compounding - of earning interest on additional income or reinvested dividends and capital gains. There can be tax advantages and cost benefits to consider as well. While staying the course doesn't eliminate risk, it can considerably lessen the effect of short-term declines.
You can further manage your investing risk through diversification. And today, more than ever, geographic diversification should be taken into account. Studies indicate that asset allocation is the single most important determinant of a portfolio's long-term success. The right mix of stocks, bonds and cash - aligned to your particular risk tolerance and investment objective - is very important. Age-appropriate rebalancing is also an essential aspect of asset allocation. For younger investors, an emphasis on equities - which historically have been the best-performing asset class over time - is encouraged. As investors near their specific goal, such as retirement or sending a child to college, consideration may be given to replacing volatile assets (e.g. common stocks) with more-stable fixed investments (bonds or savings plans).
A third principle - investing regularly - can help lower the average cost of your purchases. Investing a certain amount of money each month or quarter helps ensure you won't pay for all your shares at market highs. This strategy - known as dollar cost averaging - also reduces "emotion" from investing, helping shareholders avoid selling weak performers just prior to an upswing, or chasing a hot performer just before a correction.
We invite you to contact us via the Internet, through our Investor Centers or by phone. It is our privilege to provide you the information you need to make the investments that are right for you.
Sincerely,
(The acting chairman's signature appears here.)
James C. Curvey
Acting Chairman
Annual Report
Average annual total return reflects the change in the value of an investment, assuming reinvestment of the class' distributions from dividend income and capital gains (the profits earned upon the sale of securities that have grown in value, if any) and assuming a constant rate of performance each year. The $10,000 table and the fund's returns do not reflect the deduction of taxes that a shareholder would pay on fund distributions or the redemption of fund shares. During periods of reimbursement by Fidelity, a fund's total return will be greater than it would be had the reimbursement not occurred. How a fund did yesterday is no guarantee of how it will do tomorrow.
Average Annual Total Returns
Periods ended July 31, 2011 | Past 1
year | Past 5
years | Past 10
years |
Class K A | 28.37% | 6.89% | 2.82% |
A The initial offering of Class K shares took place on May 9, 2008. Returns prior to May 9, 2008 are those of Fidelity® Blue Chip Growth Fund, the original class of the fund.
$10,000 Over 10 Years
Let's say hypothetically that $10,000 was invested in Fidelity® Blue Chip Growth Fund - Class K on July 31, 2001. The chart shows how the value of your investment would have changed, and also shows how the Russell 1000® Growth Index performed over the same period. The initial offering of Class K took place on May 9, 2008. See above for additional information regarding the performance of Class K.
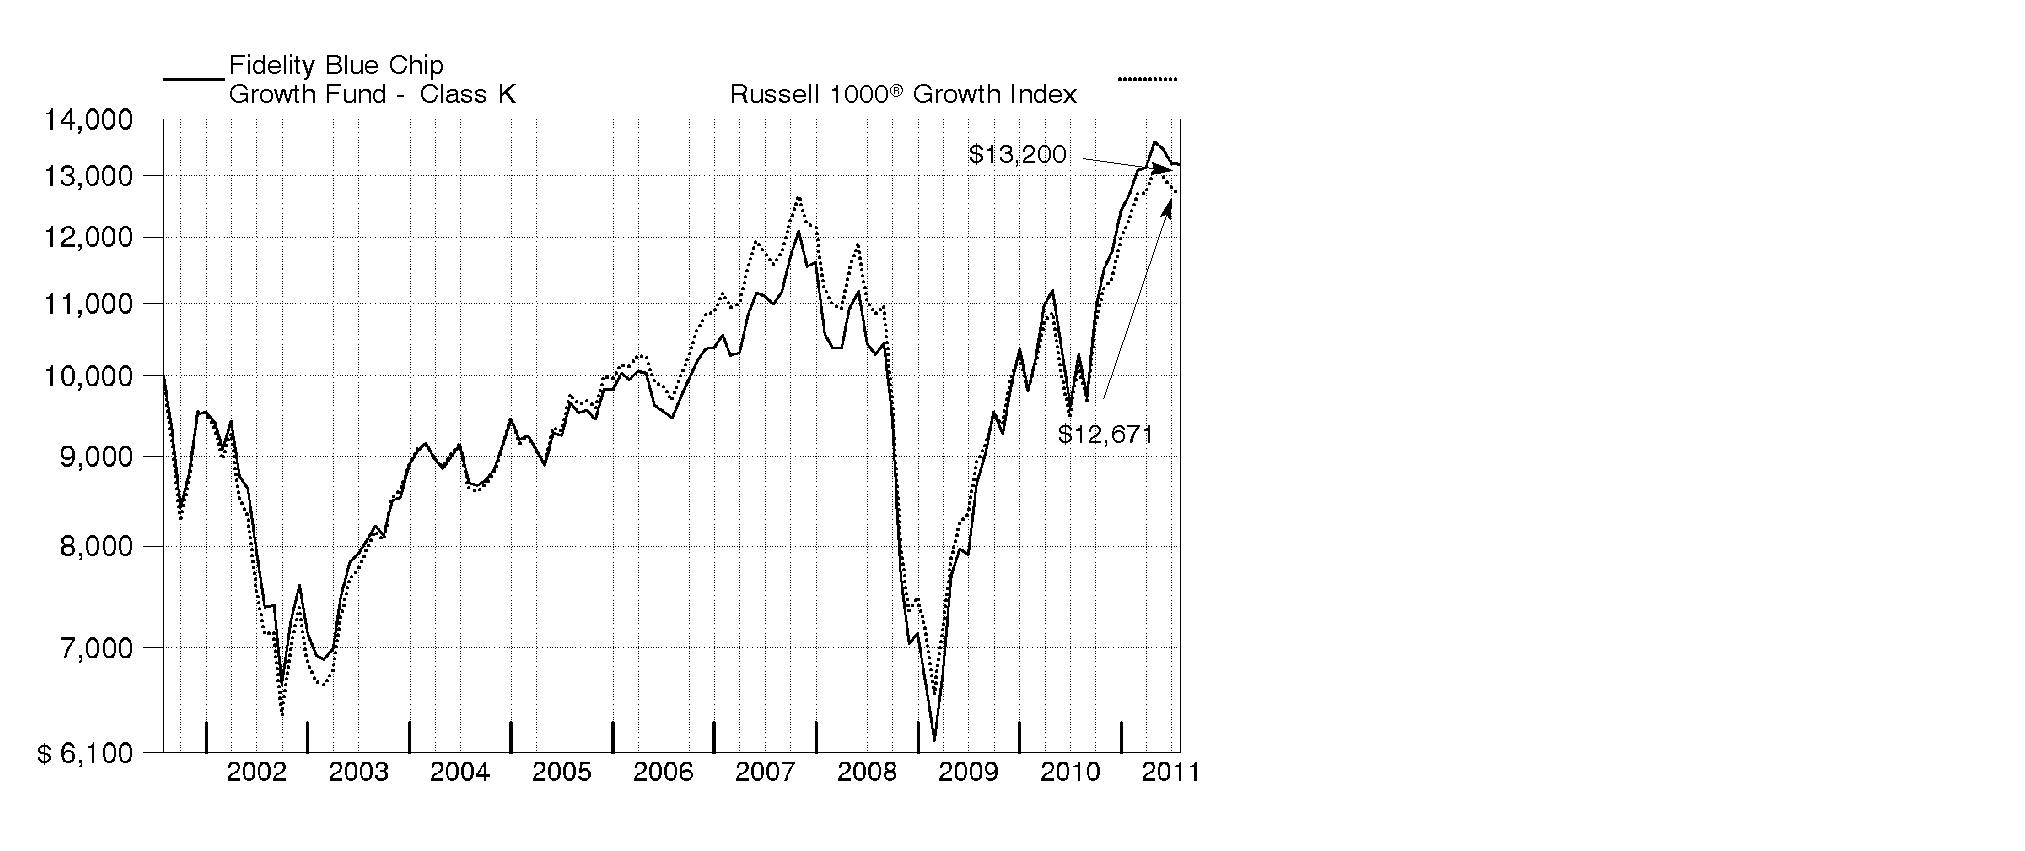
Annual Report
Market Recap: U.S. stocks registered solid double-digit gains for the 12 months ending July 31, 2011, extending a rally that began more than two years earlier. Despite a rough start in August 2010, markets turned positive in September, as increased demand for capital goods and other upbeat indicators trumped investor worry about a U.S. recessionary relapse. The broad market, as measured by the S&P 500® Index, rose 9% that month, its biggest September gain in 71 years. Seven more monthly advances followed, fueled by encouraging corporate earnings and economic activity. However, volatility picked up in the period's latter months, as markets reacted to continued high U.S. unemployment, nagging debt troubles in Europe and looming legislative battles over the federal debt ceiling. May unemployment rose above 9% for the first time in 2011, contributing to a traditional "June swoon" for stocks. Market uncertainty lingered in July, when the S&P 500® posted its second-biggest monthly loss of the period. For the full year, the S&P 500® climbed 19.65%, while the blue-chip-laden Dow Jones Industrial AverageSM rose a comparable 19.09% and the technology-heavy Nasdaq Composite® Index gained 23.40%. On the capitalization spectrum, stocks of mid-cap companies fared best, with the Russell Midcap® Index rising 24.51% and the small-cap Russell 2000® Index adding 23.92%.
Comments from Sonu Kalra, Portfolio Manager of Fidelity® Blue Chip Growth Fund: For the year, the fund's Class K shares rose 28.37%, solidly outpacing the 24.76% return of the Russell 1000® Growth Index. Security selection drove the fund's outperformance, mainly within technology, consumer discretionary and consumer staples. The top individual contributor was an underweighting in Cisco Systems. This producer of networking and communications tech products missed earnings estimates and its core IP (Internet protocol) switching business came under pressure from lower-cost competitors. Cisco was removed from the Russell 1000 Growth Index in June as part of the benchmark's annual rebalancing. Elsewhere, tech giant Apple - the fund's largest holding - helped, as did coal producer Massey Energy, which was acquired by Alpha Natural Resources. From an industry perspective, positioning in diversified financials hurt the most. Not owning index constituent International Business Machines was the biggest individual detractor, as the IT solutions/consulting services provider delivered solid earnings growth through disciplined operational expense management and also bought back some of its stock. Diversified financials firm Citigroup also hampered results. Some of the names I've mentioned in this review were not in the index, and some were sold by period end.
The views expressed above reflect those of the portfolio manager(s) only through the end of the period as stated on the cover of this report and do not necessarily represent the views of Fidelity or any other person in the Fidelity organization. Any such views are subject to change at any time based upon market or other conditions and Fidelity disclaims any responsibility to update such views. These views may not be relied on as investment advice and, because investment decisions for a Fidelity fund are based on numerous factors, may not be relied on as an indication of trading intent on behalf of any Fidelity fund.
Annual Report
Shareholder Expense Example
As a shareholder of the Fund, you incur two types of costs: (1) transaction costs, and (2) ongoing costs, including management fees and other Fund expenses. This Example is intended to help you understand your ongoing costs (in dollars) of investing in the Fund and to compare these costs with the ongoing costs of investing in other mutual funds.
The Example is based on an investment of $1,000 invested at the beginning of the period and held for the entire period (February 1, 2011 to July 31, 2011).
Actual Expenses
The first line of the accompanying table for each class of the Fund provides information about actual account values and actual expenses. You may use the information in this line, together with the amount you invested, to estimate the expenses that you paid over the period. Simply divide your account value by $1,000.00 (for example, an $8,600 account value divided by $1,000.00 = 8.6), then multiply the result by the number in the first line for a class of the Fund under the heading entitled "Expenses Paid During Period" to estimate the expenses you paid on your account during this period. A small balance maintenance fee of $12.00 that is charged once a year may apply for certain accounts with a value of less than $2,000. This fee is not included in the table below. If it was, the estimate of expenses you paid during the period would be higher, and your ending account value lower, by this amount. In addition, the Fund, as a shareholder in the underlying Fidelity Central Funds, will indirectly bear its pro-rata share of the fees and expenses incurred by the underlying Fidelity Central Funds. These fees and expenses are not included in the Fund's annualized expense ratio used to calculate the expense estimate in the table below.
Hypothetical Example for Comparison Purposes
The second line of the accompanying table for each class of the Fund provides information about hypothetical account values and hypothetical expenses based on a Class' actual expense ratio and an assumed rate of return of 5% per year before expenses, which is not the Class' actual return. The hypothetical account values and expenses may not be used to estimate the actual ending account balance or expenses you paid for the period. You may use this information to compare the ongoing costs of investing in the Fund and other funds. To do so, compare this 5% hypothetical example with the 5% hypothetical examples that appear in the shareholder reports of the other funds. A small balance maintenance fee of $12.00 that is charged once a year may apply for certain accounts with a value of less than $2,000. This fee is not included in the table below. If it was, the estimate of expenses you paid during the period would be higher, and your ending account value lower, by this amount. In addition, the Fund, as a shareholder in the underlying Fidelity Central Funds, will indirectly bear its pro-rata share of the fees and expenses incurred by the underlying Fidelity Central Funds. These fees and expenses are not included in the Fund's annualized expense ratio used to calculate the expense estimate in the table below.
Please note that the expenses shown in the table are meant to highlight your ongoing costs only and do not reflect any transaction costs. Therefore, the second line of the table is useful in comparing ongoing costs only, and will not help you determine the relative total costs of owning different funds.
Annual Report
| Annualized
Expense Ratio | Beginning
Account Value
February 1, 2011 | Ending
Account Value
July 31, 2011 | Expenses Paid
During Period*
February 1, 2011 to July 31, 2011 |
Blue Chip Growth | .94% | | | |
Actual | | $ 1,000.00 | $ 1,040.60 | $ 4.76 |
Hypothetical A | | $ 1,000.00 | $ 1,020.13 | $ 4.71 |
Class K | .78% | | | |
Actual | | $ 1,000.00 | $ 1,041.70 | $ 3.95 |
Hypothetical A | | $ 1,000.00 | $ 1,020.93 | $ 3.91 |
Class F | .73% | | | |
Actual | | $ 1,000.00 | $ 1,041.90 | $ 3.70 |
Hypothetical A | | $ 1,000.00 | $ 1,021.17 | $ 3.66 |
A 5% return per year before expenses
* Expenses are equal to each Class' annualized expense ratio, multiplied by the average account value over the period, multiplied by 181/365 (to reflect the one-half year period).
Annual Report
Investment Changes (Unaudited)
Top Ten Stocks as of July 31, 2011 |
| % of fund's
net assets | % of fund's net assets
6 months ago |
Apple, Inc. | 8.1 | 6.9 |
Google, Inc. Class A | 4.7 | 3.7 |
Amazon.com, Inc. | 2.4 | 2.0 |
QUALCOMM, Inc. | 2.3 | 3.0 |
Halliburton Co. | 2.0 | 0.8 |
Exxon Mobil Corp. | 2.0 | 3.1 |
Philip Morris International, Inc. | 1.8 | 1.5 |
The Coca-Cola Co. | 1.8 | 1.5 |
McDonald's Corp. | 1.7 | 0.7 |
Oracle Corp. | 1.6 | 1.5 |
| 28.4 | |
Top Five Market Sectors as of July 31, 2011 |
| % of fund's
net assets | % of fund's net assets
6 months ago |
Information Technology | 33.8 | 36.7 |
Consumer Discretionary | 19.2 | 16.9 |
Energy | 10.8 | 10.4 |
Consumer Staples | 10.6 | 7.3 |
Health Care | 9.9 | 6.7 |
Asset Allocation (% of fund's net assets) |
As of July 31, 2011* | As of January 31, 2011** |
| Stocks 99.6% | | | Stocks 99.8% | |
| Convertible
Securities 0.2% | | | Convertible
Securities 0.0% | |
| Short-Term
Investments and
Net Other Assets 0.2% | | | Short-Term
Investments and
Net Other Assets 0.2% | |
* Foreign investments | 13.0% | | ** Foreign investments | 11.2% | |

Annual Report
Investments July 31, 2011
Showing Percentage of Net Assets
Common Stocks - 98.3% |
| Shares | | Value (000s) |
CONSUMER DISCRETIONARY - 17.8% |
Auto Components - 0.6% |
Lear Corp. | 136,700 | | $ 6,698 |
Tenneco, Inc. (a) | 697,298 | | 27,850 |
TRW Automotive Holdings Corp. (a) | 772,100 | | 38,968 |
Visteon Corp. (a) | 173,100 | | 10,853 |
| | 84,369 |
Automobiles - 1.0% |
Bayerische Motoren Werke AG (BMW) | 428,637 | | 43,001 |
Brilliance China Automotive Holdings Ltd. (a) | 4,058,000 | | 5,181 |
Hyundai Motor Co. | 75,033 | | 16,725 |
Kia Motors Corp. | 152,660 | | 11,207 |
Tesla Motors, Inc. (a)(d) | 2,597,600 | | 73,174 |
| | 149,288 |
Diversified Consumer Services - 1.3% |
Coinstar, Inc. (a)(d) | 249,427 | | 12,187 |
New Oriental Education & Technology Group, Inc. sponsored ADR (a) | 101,800 | | 13,003 |
Weight Watchers International, Inc. | 2,086,172 | | 161,032 |
| | 186,222 |
Hotels, Restaurants & Leisure - 5.2% |
Arcos Dorados Holdings, Inc. | 1,324,400 | | 31,070 |
Bravo Brio Restaurant Group, Inc. | 750,800 | | 16,780 |
Brinker International, Inc. | 758,000 | | 18,207 |
Chipotle Mexican Grill, Inc. (a) | 145,100 | | 47,097 |
Dunkin' Brands Group, Inc. | 855,100 | | 24,738 |
Jubilant Foodworks Ltd. (a) | 533,088 | | 10,305 |
Las Vegas Sands Corp. (a) | 2,155,000 | | 101,673 |
Life Time Fitness, Inc. (a) | 120,100 | | 5,015 |
McDonald's Corp. | 2,853,430 | | 246,765 |
MGM Mirage, Inc. (a)(d) | 1,149,700 | | 17,372 |
Panera Bread Co. Class A (a) | 254,800 | | 29,381 |
Starbucks Corp. | 2,904,900 | | 116,457 |
WMS Industries, Inc. (a) | 262,500 | | 7,237 |
Wyndham Worldwide Corp. | 1,100,485 | | 38,066 |
Yum! Brands, Inc. | 756,700 | | 39,969 |
| | 750,132 |
Household Durables - 0.2% |
Beazer Homes USA, Inc. (a)(d) | 3,151,700 | | 9,140 |
SodaStream International Ltd. | 255,200 | | 18,719 |
| | 27,859 |
Common Stocks - continued |
| Shares | | Value (000s) |
CONSUMER DISCRETIONARY - continued |
Internet & Catalog Retail - 3.1% |
Amazon.com, Inc. (a) | 1,544,600 | | $ 343,704 |
Netflix, Inc. (a) | 70,900 | | 18,859 |
Priceline.com, Inc. (a) | 157,000 | | 84,411 |
| | 446,974 |
Media - 0.5% |
DISH Network Corp. Class A (a) | 1,251,100 | | 37,070 |
Focus Media Holding Ltd. ADR (a)(d) | 528,900 | | 17,396 |
Pandora Media, Inc. | 35,800 | | 540 |
ReachLocal, Inc. (a)(d) | 720,300 | | 13,102 |
| | 68,108 |
Multiline Retail - 1.5% |
Macy's, Inc. | 4,195,000 | | 121,110 |
Target Corp. | 1,785,179 | | 91,919 |
| | 213,029 |
Specialty Retail - 2.4% |
Abercrombie & Fitch Co. Class A | 126,600 | | 9,257 |
Ascena Retail Group, Inc. (a) | 1,118,600 | | 36,153 |
AutoZone, Inc. (a) | 9,500 | | 2,712 |
Bed Bath & Beyond, Inc. (a) | 616,900 | | 36,082 |
Chico's FAS, Inc. | 1,336,300 | | 20,165 |
Cia.Hering SA | 254,600 | | 5,456 |
Dick's Sporting Goods, Inc. (a) | 377,400 | | 13,964 |
Foot Locker, Inc. | 1,330,800 | | 28,918 |
Francescas Holdings Corp. | 280,300 | | 7,361 |
Limited Brands, Inc. | 1,414,800 | | 53,564 |
Ross Stores, Inc. | 179,600 | | 13,608 |
rue21, Inc. (a)(d) | 200,000 | | 6,574 |
Teavana Holdings, Inc. | 19,300 | | 544 |
TJX Companies, Inc. | 1,562,740 | | 86,420 |
Ulta Salon, Cosmetics & Fragrance, Inc. (a) | 342,500 | | 21,588 |
Vitamin Shoppe, Inc. (a) | 195,000 | | 8,494 |
| | 350,860 |
Textiles, Apparel & Luxury Goods - 2.0% |
Arezzo Industria e Comercio SA | 1,121,000 | | 16,050 |
Coach, Inc. | 169,300 | | 10,930 |
Crocs, Inc. (a) | 1,421,500 | | 44,536 |
Deckers Outdoor Corp. (a) | 180,800 | | 17,944 |
Fossil, Inc. (a) | 425,600 | | 53,485 |
Gitanjali Gems Ltd. | 2,187,799 | | 15,333 |
Common Stocks - continued |
| Shares | | Value (000s) |
CONSUMER DISCRETIONARY - continued |
Textiles, Apparel & Luxury Goods - continued |
NIKE, Inc. Class B | 603,000 | | $ 54,360 |
Polo Ralph Lauren Corp. Class A | 130,200 | | 17,586 |
Steven Madden Ltd. (a) | 271,950 | | 10,361 |
Under Armour, Inc. Class A (sub. vtg.) (a)(d) | 440,600 | | 32,344 |
Vera Bradley, Inc. (d) | 354,325 | | 12,851 |
| | 285,780 |
TOTAL CONSUMER DISCRETIONARY | | 2,562,621 |
CONSUMER STAPLES - 10.6% |
Beverages - 3.4% |
Anheuser-Busch InBev SA NV ADR | 504,500 | | 29,049 |
Dr Pepper Snapple Group, Inc. | 2,421,400 | | 91,432 |
Hansen Natural Corp. (a) | 680,600 | | 52,148 |
PepsiCo, Inc. | 932,800 | | 59,737 |
The Coca-Cola Co. | 3,769,700 | | 256,377 |
| | 488,743 |
Food & Staples Retailing - 2.7% |
Casey's General Stores, Inc. | 258,600 | | 11,637 |
Chefs' Warehouse Holdings | 198,400 | | 3,522 |
Costco Wholesale Corp. | 578,700 | | 45,283 |
CVS Caremark Corp. | 2,635,400 | | 95,797 |
Droga Raia SA | 635,700 | | 11,782 |
Sun Art Retail Group Ltd. | 977,500 | | 1,257 |
Walgreen Co. | 3,296,100 | | 128,680 |
Whole Foods Market, Inc. | 1,463,100 | | 97,589 |
| | 395,547 |
Food Products - 1.6% |
Calbee, Inc. | 408,300 | | 17,188 |
Danone | 396,900 | | 28,400 |
Dean Foods Co. (a) | 1,170,900 | | 12,903 |
Diamond Foods, Inc. (d) | 271,500 | | 19,437 |
Green Mountain Coffee Roasters, Inc. (a) | 1,222,600 | | 127,089 |
Mead Johnson Nutrition Co. Class A | 277,200 | | 19,784 |
| | 224,801 |
Personal Products - 0.6% |
Estee Lauder Companies, Inc. Class A | 684,100 | | 71,769 |
Herbalife Ltd. | 296,461 | | 16,519 |
| | 88,288 |
Common Stocks - continued |
| Shares | | Value (000s) |
CONSUMER STAPLES - continued |
Tobacco - 2.3% |
Altria Group, Inc. | 1,081,100 | | $ 28,433 |
Lorillard, Inc. | 412,100 | | 43,773 |
Philip Morris International, Inc. | 3,608,500 | | 256,817 |
| | 329,023 |
TOTAL CONSUMER STAPLES | | 1,526,402 |
ENERGY - 10.8% |
Energy Equipment & Services - 5.6% |
Baker Hughes, Inc. | 1,249,800 | | 96,710 |
Cameron International Corp. (a) | 208,800 | | 11,680 |
Carbo Ceramics, Inc. | 129,800 | | 20,258 |
Halliburton Co. | 5,300,800 | | 290,113 |
Helmerich & Payne, Inc. | 218,100 | | 15,060 |
ION Geophysical Corp. (a) | 606,700 | | 6,152 |
National Oilwell Varco, Inc. | 1,180,000 | | 95,073 |
Schlumberger Ltd. | 2,556,100 | | 230,995 |
Transocean Ltd. (United States) | 680,000 | | 41,861 |
| | 807,902 |
Oil, Gas & Consumable Fuels - 5.2% |
Alpha Natural Resources, Inc. (a) | 1,894,799 | | 80,927 |
Amyris, Inc. | 34,657 | | 802 |
Anadarko Petroleum Corp. | 194,800 | | 16,083 |
Cabot Oil & Gas Corp. | 768,300 | | 56,916 |
Chesapeake Energy Corp. | 772,800 | | 26,546 |
Chevron Corp. | 715,000 | | 74,374 |
Continental Resources, Inc. (a) | 271,700 | | 18,636 |
EV Energy Partners LP | 241,100 | | 16,969 |
Exxon Mobil Corp. | 3,501,900 | | 279,417 |
Hess Corp. | 419,900 | | 28,788 |
Marathon Petroleum Corp. | 383,200 | | 16,780 |
Occidental Petroleum Corp. | 1,137,600 | | 111,690 |
Solazyme, Inc. | 180,800 | | 4,131 |
Western Refining, Inc. (a)(d) | 889,200 | | 18,166 |
| | 750,225 |
TOTAL ENERGY | | 1,558,127 |
Common Stocks - continued |
| Shares | | Value (000s) |
FINANCIALS - 2.4% |
Capital Markets - 0.3% |
Morgan Stanley | 1,693,400 | | $ 37,678 |
Commercial Banks - 0.2% |
HDFC Bank Ltd. | 1,262,465 | | 13,895 |
ICICI Bank Ltd. | 666,777 | | 15,588 |
| | 29,483 |
Consumer Finance - 0.4% |
Discover Financial Services | 1,578,300 | | 40,420 |
Shriram Transport Finance Co. Ltd. | 1,309,840 | | 18,978 |
| | 59,398 |
Diversified Financial Services - 1.3% |
Citigroup, Inc. | 4,889,020 | | 187,445 |
Real Estate Management & Development - 0.2% |
Parsvnath Developers Ltd. (a)(e) | 21,771,340 | | 22,924 |
Thrifts & Mortgage Finance - 0.0% |
Housing Development Finance Corp. Ltd. | 335,144 | | 5,223 |
TOTAL FINANCIALS | | 342,151 |
HEALTH CARE - 9.8% |
Biotechnology - 2.5% |
Alexion Pharmaceuticals, Inc. (a) | 622,900 | | 35,381 |
Alkermes, Inc. (a) | 917,100 | | 15,811 |
Amarin Corp. PLC ADR (a) | 1,645,200 | | 22,276 |
Amylin Pharmaceuticals, Inc. (a) | 1,832,100 | | 21,820 |
ARIAD Pharmaceuticals, Inc. (a) | 1,000,000 | | 11,890 |
Biogen Idec, Inc. (a) | 516,000 | | 52,565 |
Cepheid, Inc. (a) | 94,400 | | 3,565 |
Exelixis, Inc. (a) | 2,913,200 | | 22,432 |
Human Genome Sciences, Inc. (a) | 1,012,500 | | 21,273 |
InterMune, Inc. (a) | 778,802 | | 25,996 |
Micromet, Inc. (a) | 1,322,420 | | 7,485 |
Pharmasset, Inc. (a) | 64,800 | | 7,865 |
Regeneron Pharmaceuticals, Inc. (a) | 137,500 | | 7,296 |
Vertex Pharmaceuticals, Inc. (a) | 2,107,300 | | 109,285 |
| | 364,940 |
Health Care Equipment & Supplies - 1.2% |
C. R. Bard, Inc. | 117,200 | | 11,565 |
Covidien PLC | 1,321,600 | | 67,124 |
Edwards Lifesciences Corp. (a) | 165,100 | | 11,780 |
Common Stocks - continued |
| Shares | | Value (000s) |
HEALTH CARE - continued |
Health Care Equipment & Supplies - continued |
Mako Surgical Corp. (a) | 200,000 | | $ 5,762 |
The Cooper Companies, Inc. | 564,072 | | 43,146 |
Volcano Corp. (a) | 186,400 | | 5,855 |
William Demant Holding A/S (a) | 126,000 | | 11,057 |
Zoll Medical Corp. (a) | 130,900 | | 9,118 |
| | 165,407 |
Health Care Providers & Services - 3.5% |
Accretive Health, Inc. (a) | 642,000 | | 19,286 |
Aetna, Inc. | 217,900 | | 9,041 |
AmerisourceBergen Corp. | 176,900 | | 6,777 |
Apollo Hospitals Enterprise Ltd. | 649,448 | | 7,742 |
CIGNA Corp. | 382,800 | | 19,052 |
Express Scripts, Inc. (a) | 2,271,280 | | 123,240 |
Humana, Inc. | 311,100 | | 23,202 |
McKesson Corp. | 1,148,000 | | 93,126 |
Medco Health Solutions, Inc. (a) | 2,014,100 | | 126,647 |
Omnicare, Inc. | 50,300 | | 1,534 |
UnitedHealth Group, Inc. | 660,000 | | 32,756 |
Universal Health Services, Inc. Class B | 325,200 | | 16,143 |
WellPoint, Inc. | 266,900 | | 18,029 |
| | 496,575 |
Health Care Technology - 0.5% |
Cerner Corp. (a) | 978,200 | | 65,041 |
SXC Health Solutions Corp. (a) | 163,800 | | 10,367 |
| | 75,408 |
Life Sciences Tools & Services - 0.2% |
Illumina, Inc. (a) | 220,400 | | 13,764 |
Sequenom, Inc. (a)(d) | 2,457,600 | | 17,351 |
| | 31,115 |
Pharmaceuticals - 1.9% |
Allergan, Inc. | 126,100 | | 10,253 |
AVANIR Pharmaceuticals Class A (a)(d) | 1,264,000 | | 4,740 |
Elan Corp. PLC sponsored ADR (a) | 2,231,100 | | 24,676 |
Endocyte, Inc. | 1,477,700 | | 19,698 |
GlaxoSmithKline PLC sponsored ADR | 345,300 | | 15,338 |
Johnson & Johnson | 1,943,800 | | 125,939 |
Novo Nordisk A/S Series B | 76,779 | | 9,391 |
Sanofi-Aventis sponsored ADR | 371,600 | | 14,400 |
Common Stocks - continued |
| Shares | | Value (000s) |
HEALTH CARE - continued |
Pharmaceuticals - continued |
Shire PLC sponsored ADR | 152,700 | | $ 15,881 |
Valeant Pharmaceuticals International, Inc. (Canada) | 499,900 | | 27,517 |
| | 267,833 |
TOTAL HEALTH CARE | | 1,401,278 |
INDUSTRIALS - 9.4% |
Aerospace & Defense - 3.7% |
BE Aerospace, Inc. (a) | 177,700 | | 7,072 |
Honeywell International, Inc. | 940,800 | | 49,956 |
Precision Castparts Corp. | 787,600 | | 127,103 |
The Boeing Co. | 2,166,100 | | 152,645 |
United Technologies Corp. | 2,463,600 | | 204,085 |
| | 540,861 |
Air Freight & Logistics - 0.4% |
United Parcel Service, Inc. Class B | 769,600 | | 53,272 |
Airlines - 0.2% |
Copa Holdings SA Class A | 426,600 | | 27,989 |
Building Products - 0.2% |
Armstrong World Industries, Inc. | 920,900 | | 36,376 |
Commercial Services & Supplies - 0.1% |
Swisher Hygiene, Inc. (g) | 1,159,960 | | 5,243 |
Swisher Hygiene, Inc. (g) | 935,531 | | 3,806 |
| | 9,049 |
Construction & Engineering - 0.9% |
Fluor Corp. | 1,660,700 | | 105,504 |
KBR, Inc. | 550,900 | | 19,640 |
| | 125,144 |
Electrical Equipment - 0.3% |
Polypore International, Inc. (a) | 667,500 | | 45,390 |
Industrial Conglomerates - 1.2% |
Carlisle Companies, Inc. | 319,900 | | 13,829 |
Danaher Corp. | 2,360,600 | | 115,929 |
General Electric Co. | 2,358,000 | | 42,232 |
| | 171,990 |
Machinery - 1.7% |
Caterpillar, Inc. | 446,300 | | 44,090 |
Cummins, Inc. | 730,900 | | 76,657 |
Fanuc Corp. | 169,500 | | 32,176 |
Common Stocks - continued |
| Shares | | Value (000s) |
INDUSTRIALS - continued |
Machinery - continued |
Ingersoll-Rand Co. Ltd. | 921,300 | | $ 34,475 |
Jain Irrigation Systems Ltd. | 780,008 | | 3,073 |
Kennametal, Inc. | 176,100 | | 6,944 |
Pall Corp. | 443,900 | | 22,009 |
WABCO Holdings, Inc. (a) | 399,900 | | 25,214 |
| | 244,638 |
Road & Rail - 0.6% |
CSX Corp. | 787,200 | | 19,342 |
Union Pacific Corp. | 649,400 | | 66,551 |
| | 85,893 |
Trading Companies & Distributors - 0.1% |
Mills Estruturas e Servicos de Engenharia SA | 827,400 | | 11,201 |
TOTAL INDUSTRIALS | | 1,351,803 |
INFORMATION TECHNOLOGY - 33.8% |
Communications Equipment - 3.6% |
Alcatel-Lucent SA sponsored ADR (a) | 25,984,395 | | 105,237 |
Cisco Systems, Inc. | 1,378,300 | | 22,011 |
HTC Corp. | 23,300 | | 692 |
Juniper Networks, Inc. (a) | 2,002,700 | | 46,843 |
Polycom, Inc. (a) | 847,300 | | 22,903 |
QUALCOMM, Inc. | 6,009,000 | | 329,173 |
Riverbed Technology, Inc. (a) | 700 | | 20 |
| | 526,879 |
Computers & Peripherals - 10.0% |
Apple, Inc. (a) | 2,968,300 | | 1,159,056 |
EMC Corp. (a) | 3,372,000 | | 87,942 |
Fusion-io, Inc. | 100,600 | | 2,979 |
NetApp, Inc. (a)(d) | 2,672,700 | | 127,007 |
SanDisk Corp. (a) | 1,455,800 | | 61,915 |
| | 1,438,899 |
Electronic Equipment & Components - 0.1% |
Fabrinet (a) | 683,381 | | 10,524 |
TE Connectivity Ltd. | 155,045 | | 5,338 |
| | 15,862 |
Internet Software & Services - 7.2% |
Baidu.com, Inc. sponsored ADR (a) | 198,700 | | 31,210 |
eBay, Inc. (a) | 3,588,840 | | 117,535 |
Common Stocks - continued |
| Shares | | Value (000s) |
INFORMATION TECHNOLOGY - continued |
Internet Software & Services - continued |
Facebook, Inc. Class B (a)(g) | 636,167 | | $ 15,904 |
Google, Inc. Class A (a) | 1,115,967 | | 673,698 |
GREE, Inc. | 356,900 | | 8,194 |
IAC/InterActiveCorp (a) | 463,500 | | 19,184 |
INFO Edge India Ltd. | 293,110 | | 4,969 |
Mail.ru Group Ltd. GDR (a)(f) | 1,193,100 | | 42,618 |
OpenTable, Inc. (a) | 139,651 | | 9,896 |
Rackspace Hosting, Inc. (a) | 1,959,600 | | 78,384 |
SINA Corp. (a) | 60,100 | | 6,496 |
Velti PLC (a) | 1,398,000 | | 23,081 |
| | 1,031,169 |
IT Services - 2.7% |
Accenture PLC Class A | 698,100 | | 41,286 |
Cognizant Technology Solutions Corp. Class A (a) | 1,541,100 | | 107,677 |
MasterCard, Inc. Class A | 611,400 | | 185,407 |
ServiceSource International, Inc. (d) | 322,900 | | 6,025 |
Visa, Inc. Class A | 524,923 | | 44,902 |
| | 385,297 |
Semiconductors & Semiconductor Equipment - 3.9% |
Altera Corp. | 1,336,000 | | 54,616 |
Avago Technologies Ltd. | 3,152,700 | | 106,025 |
Broadcom Corp. Class A | 3,610,500 | | 133,841 |
Freescale Semiconductor Holdings I Ltd. | 1,955,069 | | 31,926 |
GT Solar International, Inc. (a)(d) | 1,567,100 | | 21,375 |
Marvell Technology Group Ltd. (a) | 3,088,986 | | 45,779 |
NVIDIA Corp. (a) | 6,614,973 | | 91,485 |
NXP Semiconductors NV | 2,090,000 | | 41,340 |
PMC-Sierra, Inc. (a) | 4,712,600 | | 32,941 |
| | 559,328 |
Software - 6.3% |
BroadSoft, Inc. (a) | 815,700 | | 23,827 |
Check Point Software Technologies Ltd. (a) | 1,510,000 | | 87,052 |
Citrix Systems, Inc. (a) | 363,000 | | 26,151 |
Electronic Arts, Inc. (a) | 1,201,000 | | 26,722 |
Informatica Corp. (a) | 1,168,000 | | 59,720 |
Microsoft Corp. | 4,475,400 | | 122,626 |
MicroStrategy, Inc. Class A (a) | 44,800 | | 7,140 |
Nuance Communications, Inc. (a) | 1,265,900 | | 25,331 |
Oracle Corp. | 7,566,300 | | 231,377 |
QLIK Technologies, Inc. | 1,011,763 | | 30,667 |
Common Stocks - continued |
| Shares | | Value (000s) |
INFORMATION TECHNOLOGY - continued |
Software - continued |
RealPage, Inc. (d) | 66,073 | | $ 1,589 |
Red Hat, Inc. (a) | 1,604,700 | | 67,526 |
Rovi Corp. (a) | 150,200 | | 7,956 |
salesforce.com, Inc. (a) | 730,265 | | 105,677 |
VMware, Inc. Class A (a) | 860,700 | | 86,363 |
| | 909,724 |
TOTAL INFORMATION TECHNOLOGY | | 4,867,158 |
MATERIALS - 3.7% |
Chemicals - 2.6% |
Celanese Corp. Class A | 268,700 | | 14,813 |
CF Industries Holdings, Inc. | 591,800 | | 91,918 |
E.I. du Pont de Nemours & Co. | 676,000 | | 34,760 |
LyondellBasell Industries NV Class A | 1,734,300 | | 68,435 |
Monsanto Co. | 240,700 | | 17,687 |
Potash Corp. of Saskatchewan, Inc. | 252,800 | | 14,595 |
Rockwood Holdings, Inc. (a) | 572,600 | | 34,625 |
The Mosaic Co. | 1,343,700 | | 95,026 |
| | 371,859 |
Containers & Packaging - 0.1% |
Ball Corp. | 365,600 | | 14,185 |
Metals & Mining - 1.0% |
Carpenter Technology Corp. | 733,325 | | 42,122 |
Freeport-McMoRan Copper & Gold, Inc. | 1,615,000 | | 85,530 |
Royal Gold, Inc. | 188,800 | | 12,102 |
| | 139,754 |
TOTAL MATERIALS | | 525,798 |
TOTAL COMMON STOCKS (Cost $10,729,699) | 14,135,338 |
Preferred Stocks - 1.5% |
| | | |
Convertible Preferred Stocks - 0.2% |
CONSUMER DISCRETIONARY - 0.1% |
Textiles, Apparel & Luxury Goods - 0.1% |
Michael Kors Holdings Ltd. (a)(g) | 325,704 | | 15,000 |
Preferred Stocks - continued |
| Shares | | Value (000s) |
Convertible Preferred Stocks - continued |
HEALTH CARE - 0.1% |
Pharmaceuticals - 0.1% |
Merrimack Pharmaceuticals, Inc. Series G (g) | 2,142,858 | | $ 15,000 |
TOTAL CONVERTIBLE PREFERRED STOCKS | | 30,000 |
Nonconvertible Preferred Stocks - 1.3% |
CONSUMER DISCRETIONARY - 1.3% |
Automobiles - 1.3% |
Porsche Automobil Holding SE (Germany) | 1,026,800 | | 79,197 |
Volkswagen AG | 547,800 | | 109,762 |
| | 188,959 |
TOTAL PREFERRED STOCKS (Cost $171,905) | 218,959 |
Money Market Funds - 1.0% |
| | | |
Fidelity Securities Lending Cash Central Fund,
0.15% (b)(c)
(Cost $146,021) | 146,021,398 | | 146,021 |
TOTAL INVESTMENT PORTFOLIO - 100.8% (Cost $11,047,625) | | 14,500,318 |
NET OTHER ASSETS (LIABILITIES) - (0.8)% | | (109,870) |
NET ASSETS - 100% | $ 14,390,448 |
Legend |
(a) Non-income producing |
(b) Affiliated fund that is available only to investment companies and other accounts managed by Fidelity Investments. The rate quoted is the annualized seven-day yield of the fund at period end. A complete unaudited listing of the fund's holdings as of its most recent quarter end is available upon request. In addition, each Fidelity Central Fund's financial statements, which are not covered by the Fund's Report of Independent Registered Public Accounting Firm, are available on the SEC's website or upon request. |
(c) Investment made with cash collateral received from securities on loan. |
(d) Security or a portion of the security is on loan at period end. |
(e) Affiliated company |
(f) Security exempt from registration under Rule 144A of the Securities Act of 1933. These securities may be resold in transactions exempt from registration, normally to qualified institutional buyers. At the end of the period, the value of these securities amounted to $42,618,000 or 0.3% of net assets. |
(g) Restricted securities - Investment in securities not registered under the Securities Act of 1933 (excluding 144A issues). At the end of the period, the value of restricted securities (excluding 144A issues) amounted to $54,953,000 or 0.4% of net assets. |
Additional information on each restricted holding is as follows: |
Security | Acquisition Date | Acquisition Cost (000s) |
Facebook, Inc. Class B | 3/31/11 - 5/19/11 | $ 15,909 |
Merrimack Pharmaceuticals, Inc. Series G | 3/31/11 | $ 15,000 |
Michael Kors Holdings Ltd. | 7/8/11 | $ 15,000 |
Swisher Hygiene, Inc. | 3/22/11 | $ 5,800 |
Swisher Hygiene, Inc. | 4/15/11 | $ 7,204 |
Affiliated Central Funds |
Information regarding fiscal year to date income earned by the Fund from investments in Fidelity Central Funds is as follows: |
Fund | Income earned
(Amounts in thousands) |
Fidelity Cash Central Fund | $ 54 |
Fidelity Securities Lending Cash Central Fund | 1,516 |
Total | $ 1,570 |
Other Affiliated Issuers |
An affiliated company is a company in which the Fund has ownership of at least 5% of the voting securities. Fiscal year to date transactions with companies which are or were affiliates are as follows: |
Affiliates
(Amounts in thousands) | Value, beginning of period | Purchases | Sales Proceeds | Dividend Income | Value,
end of
period |
Furniture Brands International, Inc. | $ 16,160 | $ - | $ 14,466 | $ - | $ - |
Parsvnath Developers Ltd. | 18,023 | 14,168 | - | - | 22,924 |
Total | $ 34,183 | $ 14,168 | $ 14,466 | $ - | $ 22,924 |
Other Information |
The following is a summary of the inputs used, as of July 31, 2011, involving the Fund's assets and liabilities carried at fair value. The inputs or methodology used for valuing securities may not be an indication of the risk associated with investing in those securities. For more information on valuation inputs, and their aggregation into the levels used in the tables below, please refer to the Security Valuation section in the accompanying Notes to Financial Statements. |
Valuation Inputs at Reporting Date: |
Description
(Amounts in thousands) | Total | Level 1 | Level 2 | Level 3 |
Investments in Securities: | | | | |
Equities: | | | | |
Consumer Discretionary | $ 2,766,580 | $ 2,751,580 | $ - | $ 15,000 |
Consumer Staples | 1,526,402 | 1,526,402 | - | - |
Energy | 1,558,127 | 1,558,127 | - | - |
Financials | 342,151 | 312,668 | 29,483 | - |
Health Care | 1,416,278 | 1,391,887 | 9,391 | 15,000 |
Industrials | 1,351,803 | 1,347,997 | 3,806 | - |
Information Technology | 4,867,158 | 4,851,254 | - | 15,904 |
Materials | 525,798 | 525,798 | - | - |
Money Market Funds | 146,021 | 146,021 | - | - |
Total Investments in Securities: | $ 14,500,318 | $ 14,411,734 | $ 42,680 | $ 45,904 |
The following is a reconciliation of Investments in Securities for which Level 3 inputs were used in determining value: |
(Amounts in thousands) | |
Investments in Securities: | |
Beginning Balance | $ 6,774 |
Total Realized Gain (Loss) | (1,136) |
Total Unrealized Gain (Loss) | 170 |
Cost of Purchases | 45,908 |
Proceeds of Sales | (5,812) |
Amortization/Accretion | - |
Transfers in to Level 3 | - |
Transfers out of Level 3 | - |
Ending Balance | $ 45,904 |
The change in unrealized gain (loss) for the period attributable to Level 3 securities held at July 31, 2011 | $ (4) |
The information used in the above reconciliation represents fiscal year to date activity for any Investments in Securities identified as using Level 3 inputs at either the beginning or the end of the current fiscal period. Transfers in or out of Level 3 represent the beginning value of any Security or Instrument where a change in the pricing level occurred from the beginning to the end of the period. The cost of purchases and the proceeds of sales may include securities received or delivered through corporate actions or exchanges. Realized and unrealized gains (losses) disclosed in the reconciliation are included in Net Gain (Loss) on the Fund's Statement of Operations. |
Distribution of investments by country of issue, as a percentage of total net assets, is as follows: (Unaudited) |
United States of America | 87.0% |
Germany | 1.6% |
Curacao | 1.6% |
Ireland | 1.2% |
France | 1.0% |
Others (Individually Less Than 1%) | 7.6% |
| 100.0% |
Income Tax Information |
The Fund intends to elect to defer to its fiscal year ending July 31, 2012 approximately $7,175,000 of currency losses recognized during the period November 1, 2010 to July 31, 2011. |
See accompanying notes which are an integral part of the financial statements.
Annual Report
Statement of Assets and Liabilities
Amounts in thousands (except per-share amounts) | July 31, 2011 |
| | |
Assets | | |
Investment in securities, at value (including securities loaned of $140,857) - See accompanying schedule: Unaffiliated issuers (cost $10,870,753) | $ 14,331,373 | |
Fidelity Central Funds (cost $146,021) | 146,021 | |
Other affiliated issuers (cost $30,851) | 22,924 | |
Total Investments (cost $11,047,625) | | $ 14,500,318 |
Receivable for investments sold | | 325,167 |
Receivable for fund shares sold | | 13,859 |
Dividends receivable | | 3,107 |
Distributions receivable from Fidelity Central Funds | | 193 |
Other receivables | | 1,218 |
Total assets | | 14,843,862 |
| | |
Liabilities | | |
Payable to custodian bank | $ 93 | |
Payable for investments purchased | 217,799 | |
Payable for fund shares redeemed | 70,986 | |
Accrued management fee | 8,786 | |
Notes payable to affiliates | 6,851 | |
Other affiliated payables | 2,289 | |
Other payables and accrued expenses | 589 | |
Collateral on securities loaned, at value | 146,021 | |
Total liabilities | | 453,414 |
| | |
Net Assets | | $ 14,390,448 |
Net Assets consist of: | | |
Paid in capital | | $ 10,512,137 |
Accumulated net investment loss | | (7,667) |
Accumulated undistributed net realized gain (loss) on investments and foreign currency transactions | | 433,284 |
Net unrealized appreciation (depreciation) on investments and assets and liabilities in foreign currencies | | 3,452,694 |
Net Assets | | $ 14,390,448 |
See accompanying notes which are an integral part of the financial statements.
Annual Report
Statement of Assets and Liabilities - continued
Amounts in thousands (except per-share amounts) | July 31, 2011 |
| | |
Blue Chip Growth:
Net Asset Value, offering price and redemption price per share ($12,024,038 ÷ 249,612 shares) | | $ 48.17 |
| | |
Class K:
Net Asset Value, offering price and redemption price per share ($1,454,854 ÷ 30,179 shares) | | $ 48.21 |
| | |
Class F:
Net Asset Value, offering price and redemption price per share ($911,556 ÷ 18,896 shares) | | $ 48.24 |
See accompanying notes which are an integral part of the financial statements.
Annual Report
Financial Statements - continued
Statement of Operations
Amounts in thousands | Year ended July 31, 2011 |
| | |
Investment Income | | |
Dividends | | $ 116,312 |
Interest | | 4 |
Income from Fidelity Central Funds | | 1,570 |
Total income | | 117,886 |
| | |
Expenses | | |
Management fee
Basic fee | $ 76,012 | |
Performance adjustment | 19,530 | |
Transfer agent fees | 26,204 | |
Accounting and security lending fees | 1,466 | |
Custodian fees and expenses | 448 | |
Independent trustees' compensation | 72 | |
Appreciation in deferred trustee compensation account | 1 | |
Registration fees | 144 | |
Audit | 111 | |
Legal | 64 | |
Interest | 15 | |
Miscellaneous | 139 | |
Total expenses before reductions | 124,206 | |
Expense reductions | (1,803) | 122,403 |
Net investment income (loss) | | (4,517) |
Realized and Unrealized Gain (Loss) Net realized gain (loss) on: | | |
Investment securities: | | |
Unaffiliated issuers | 1,575,157 | |
Other affiliated issuers | (10,044) | |
Foreign currency transactions | (2,955) | |
Total net realized gain (loss) | | 1,562,158 |
Change in net unrealized appreciation (depreciation) on: Investment securities (net of decrease in deferred foreign taxes of $49) | 1,651,481 | |
Assets and liabilities in foreign currencies | 176 | |
Total change in net unrealized appreciation (depreciation) | | 1,651,657 |
Net gain (loss) | | 3,213,815 |
Net increase (decrease) in net assets resulting from operations | | $ 3,209,298 |
See accompanying notes which are an integral part of the financial statements.
Annual Report
Statement of Changes in Net Assets
Amounts in thousands | Year ended
July 31,
2011 | Year ended
July 31,
2010 |
Increase (Decrease) in Net Assets | | |
Operations | | |
Net investment income (loss) | $ (4,517) | $ 13,622 |
Net realized gain (loss) | 1,562,158 | 1,055,028 |
Change in net unrealized appreciation (depreciation) | 1,651,657 | 793,347 |
Net increase (decrease) in net assets resulting
from operations | 3,209,298 | 1,861,997 |
Distributions to shareholders from net investment income | (2,405) | (57,433) |
Distributions to shareholders from net realized gain | (12,451) | - |
Total distributions | (14,856) | (57,433) |
Share transactions - net increase (decrease) | (352,214) | (538,131) |
Total increase (decrease) in net assets | 2,842,228 | 1,266,433 |
| | |
Net Assets | | |
Beginning of period | 11,548,220 | 10,281,787 |
End of period (including accumulated net investment loss of $7,667 and undistributed net investment income of $2,062, respectively) | $ 14,390,448 | $ 11,548,220 |
See accompanying notes which are an integral part of the financial statements.
Annual Report
Financial Highlights - Blue Chip Growth
Years ended July 31, | 2011 | 2010 | 2009 | 2008 | 2007 |
Selected Per-Share Data | | | | | |
Net asset value, beginning of period | $ 37.63 | $ 31.97 | $ 39.06 | $ 46.88 | $ 41.54 |
Income from Investment Operations | | | | | |
Net investment income (loss) B | (.03) | .04 | .27 | .35 | .32 |
Net realized and unrealized gain (loss) | 10.61 | 5.80 | (6.36) | (2.89) | 6.19 |
Total from investment operations | 10.58 | 5.84 | (6.09) | (2.54) | 6.51 |
Distributions from net investment income | (.00) F, G | (.18) | (.29) | (.33) | (.24) |
Distributions from net realized gain | (.04) F | - | (.71) | (4.95) | (.93) |
Total distributions | (.04) | (.18) | (1.00) | (5.28) | (1.17) |
Net asset value, end of period | $ 48.17 | $ 37.63 | $ 31.97 | $ 39.06 | $ 46.88 |
Total Return A | 28.12% | 18.29% | (15.85)% | (6.30)% | 16.02% |
Ratios to Average Net Assets C,E | | | | | |
Expenses before reductions | .94% | .94% | .76% | .58% | .60% |
Expenses net of fee waivers, if any | .94% | .94% | .76% | .58% | .60% |
Expenses net of all reductions | .92% | .93% | .76% | .57% | .59% |
Net investment income (loss) | (.06)% | .10% | .93% | .81% | .72% |
Supplemental Data | | | | | |
Net assets, end of period (in millions) | $ 12,024 | $ 10,295 | $ 9,691 | $ 13,349 | $ 18,616 |
Portfolio turnover rate D | 132% | 135% | 134% | 82% | 87% |
A Total returns would have been lower if certain expenses had not been reduced during the applicable periods shown.
B Calculated based on average shares outstanding during the period.
C Fees and expenses of any underlying Fidelity Central Funds are not included in the Fund's expense ratio. The Fund indirectly bears its proportionate share of the expenses of any underlying Fidelity Central Funds.
D Amount does not include the portfolio activity of any underlying Fidelity Central Funds.
E Expense ratios reflect operating expenses of the class. Expenses before reductions do not reflect amounts reimbursed by the investment adviser or reductions from brokerage service arrangements or reductions from other expense offset arrangements and do not represent the amount paid by the class during periods when reimbursements or reductions occur. Expenses net of fee waivers reflect expenses after reimbursement by the investment adviser but prior to reductions from brokerage service arrangements or other expense offset arrangements. Expenses net of all reductions represent the net expenses paid by the class.
F The amount shown reflects certain reclassifications related to book to tax differences.
G Amount represents less than $.01 per share.
See accompanying notes which are an integral part of the financial statements.
Annual Report
Financial Highlights - Class K
Years ended July 31, | 2011 | 2010 | 2009 | 2008 G |
Selected Per-Share Data | | | | |
Net asset value, beginning of period | $ 37.66 | $ 32.01 | $ 39.07 | $ 41.81 |
Income from Investment Operations | | | | |
Net investment income (loss) D | .05 | .11 | .32 | .10 |
Net realized and unrealized gain (loss) | 10.62 | 5.79 | (6.33) | (2.84) |
Total from investment operations | 10.67 | 5.90 | (6.01) | (2.74) |
Distributions from net investment income | (.05) I | (.25) | (.34) | - |
Distributions from net realized gain | (.07) I | - | (.71) | - |
Total distributions | (.12) | (.25) | (1.05) | - |
Net asset value, end of period | $ 48.21 | $ 37.66 | $ 32.01 | $ 39.07 |
Total Return B,C | 28.37% | 18.48% | (15.61)% | (6.55)% |
Ratios to Average Net Assets E,H | | | | |
Expenses before reductions | .77% | .75% | .53% | .41% A |
Expenses net of fee waivers, if any | .77% | .75% | .53% | .41% A |
Expenses net of all reductions | .76% | .74% | .52% | .41% A |
Net investment income (loss) | .11% | .30% | 1.16% | 1.09% A |
Supplemental Data | | | | |
Net assets, end of period (000 omitted) | $ 1,454,854 | $ 931,601 | $ 590,673 | $ 93 |
Portfolio turnover rate F | 132% | 135% | 134% | 82% |
A Annualized
B Total returns for periods of less than one year are not annualized.
C Total returns would have been lower if certain expenses had not been reduced during the applicable periods shown.
D Calculated based on average shares outstanding during the period.
E Fees and expenses of any underlying Fidelity Central Funds are not included in the Fund's expense ratio. The Fund indirectly bears its proportionate share of the expenses of any underlying Fidelity Central Funds.
F Amount does not include the portfolio activity of any underlying Fidelity Central Funds.
G For the period May 9, 2008 (commencement of sale of shares) to July 31, 2008.
H Expense ratios reflect operating expenses of the class. Expenses before reductions do not reflect amounts reimbursed by the investment adviser or reductions from brokerage service arrangements or reductions from other expense offset arrangements and do not represent the amount paid by the class during periods when reimbursements or reductions occur. Expense ratios before reductions for start-up periods may not be representative of longer-term operating periods. Expenses net of fee waivers reflect expenses after reimbursement by the investment adviser but prior to reductions from brokerage service arrangements or other expense offset arrangements. Expenses net of all reductions represent the net expenses paid by the class.
I The amount shown reflects certain reclassifications related to book to tax differences.
See accompanying notes which are an integral part of the financial statements.
Annual Report
Financial Highlights - Class F
Years ended July 31, | 2011 | 2010 | 2009 G |
Selected Per-Share Data | | | |
Net asset value, beginning of period | $ 37.69 | $ 31.98 | $ 29.16 |
Income from Investment Operations | | | |
Net investment income (loss) D | .07 | .13 | - I |
Net realized and unrealized gain (loss) | 10.61 | 5.80 | 2.82 |
Total from investment operations | 10.68 | 5.93 | 2.82 |
Distributions from net investment income | (.06) J | (.22) | - |
Distributions from net realized gain | (.08) J | - | - |
Total distributions | (.13) K | (.22) | - |
Net asset value, end of period | $ 48.24 | $ 37.69 | $ 31.98 |
Total Return B,C | 28.41% | 18.59% | 9.67% |
Ratios to Average Net Assets E,H | | | |
Expenses before reductions | .72% | .70% | .51% A |
Expenses net of fee waivers, if any | .72% | .70% | .51% A |
Expenses net of all reductions | .71% | .68% | .51% A |
Net investment income (loss) | .16% | .35% | (.05)% A |
Supplemental Data | | | |
Net assets, end of period (000 omitted) | $ 911,556 | $ 321,409 | $ 261 |
Portfolio turnover rate F | 132% | 135% | 134% |
A Annualized
B Total returns for periods of less than one year are not annualized.
C Total returns would have been lower if certain expenses had not been reduced during the applicable periods shown.
D Calculated based on average shares outstanding during the period.
E Fees and expenses of any underlying Fidelity Central Funds are not included in the Fund's expense ratio. The Fund indirectly bears its proportionate share of the expenses of any underlying Fidelity Central Funds.
F Amount does not include the portfolio activity of any underlying Fidelity Central Funds.
G For the period June 26, 2009 (commencement of sale of shares) to July 31, 2009.
H Expense ratios reflect operating expenses of the class. Expenses before reductions do not reflect amounts reimbursed by the investment adviser or reductions from brokerage service arrangements or reductions from other expense offset arrangements and do not represent the amount paid by the class during periods when reimbursements or reductions occur. Expense ratios before reductions for start-up periods may not be representative of longer-term operating periods. Expenses net of fee waivers reflect expenses after reimbursement by the investment adviser but prior to reductions from brokerage service arrangements or other expense offset arrangements. Expenses net of all reductions represent the net expenses paid by the class.
I Amount represents less than $.01 per share.
J The amount shown reflects certain reclassifications related to book to tax differences.
K Total distributions of $.13 per share is comprised of distributions from net investment income of $.058 and distributions from net realized gain of $.076 per share.
See accompanying notes which are an integral part of the financial statements.
Annual Report
Notes to Financial Statements
For the period ended July 31, 2011
(Amounts in thousands except ratios)
1. Organization.
Fidelity Blue Chip Growth Fund (the Fund) is a fund of Fidelity Securities Fund (the Trust) and is authorized to issue an unlimited number of shares. The Trust is registered under the Investment Company Act of 1940, as amended (the 1940 Act), as an open-end management investment company organized as a Massachusetts business trust. The Fund offers Blue Chip Growth, Class K and Class F shares, each of which has equal rights as to assets and voting privileges. Each class has exclusive voting rights with respect to matters that affect that class. Class F shares of the Fund are only available for purchase by mutual funds for which Fidelity Management & Research Company (FMR) or an affiliate serves as investment manager. Investment income, realized and unrealized capital gains and losses, the common expenses of the Fund, and certain fund-level expense reductions, if any, are allocated on a pro-rata basis to each class based on the relative net assets of each class to the total net assets of the Fund. Each class differs with respect to transfer agent fees incurred. Certain expense reductions may also differ by class.
2. Investments in Fidelity Central Funds.
The Fund invests in Fidelity Central Funds, which are open-end investment companies available only to other investment companies and accounts managed by FMR and its affiliates. The Fund's Schedule of Investments lists each of the Fidelity Central Funds held as of period end, if any, as an investment of the Fund, but does not include the underlying holdings of each Fidelity Central Fund. As an Investing Fund, the Fund indirectly bears its proportionate share of the expenses of the underlying Fidelity Central Funds.
The Money Market Central Funds seek preservation of capital and current income and are managed by Fidelity Investments Money Management, Inc. (FIMM), an affiliate of FMR.
A complete unaudited list of holdings for each Fidelity Central Fund is available upon request or at the Securities and Exchange Commission (the SEC) web site at www.sec.gov. In addition, the financial statements of the Fidelity Central Funds, which are not covered by the Fund's Report of Independent Registered Public Accounting Firm, are available on the SEC web site or upon request.
3. Significant Accounting Policies.
The financial statements have been prepared in conformity with accounting principles generally accepted in the United States of America (GAAP), which require management to make certain estimates and assumptions at the date of the financial statements. Actual results could differ from those estimates. Subsequent events, if any, through the date that the financial statements were issued have been evaluated in the preparation of
Annual Report
Notes to Financial Statements - continued
(Amounts in thousands except ratios)
3. Significant Accounting Policies - continued
the financial statements. The following summarizes the significant accounting policies of the Fund:
Security Valuation. Investments are valued as of 4:00 p.m. Eastern time on the last calendar day of the period. The Fund uses independent pricing services approved by the Board of Trustees to value its investments. When current market prices or quotations are not readily available or reliable, valuations may be determined in good faith in accordance with procedures adopted by the Board of Trustees. Factors used in determining value may include market or security specific events. The frequency with which these procedures are used cannot be predicted and they may be utilized to a significant extent. The value used for net asset value (NAV) calculation under these procedures may differ from published prices for the same securities.
The Fund categorizes the inputs to valuation techniques used to value its investments into a disclosure hierarchy consisting of three levels as shown below:
Level 1 - quoted prices in active markets for identical investments
Level 2 - other significant observable inputs (including quoted prices for similar investments, interest rates, prepayment speeds, etc.)
Level 3 - unobservable inputs (including the Fund's own assumptions based on the best information available)
Changes in valuation techniques may result in transfers in or out of an assigned level within the disclosure hierarchy. The aggregate value of investments by input level, as of July 31, 2011, as well as a roll forward of Level 3 securities, is included at the end of the Fund's Schedule of Investments. Valuation techniques used to value the Fund's investments by major category are as follows:
Equity securities, including restricted securities, for which market quotations are readily available, are valued at the last reported sale price or official closing price as reported by an independent pricing service on the primary market or exchange on which they are traded and are categorized as Level 1 in the hierarchy. In the event there were no sales during the day or closing prices are not available, securities are valued at the last quoted bid price or may be valued using the last available price and are generally categorized as Level 2 in the hierarchy. For foreign equity securities, when significant market or security specific events arise, comparisons to the valuation of American Depositary Receipts (ADRs), futures contracts, Exchange-traded funds (ETFs) and certain indexes as well as quoted prices for similar securities are used and are categorized as Level 2 in the hierarchy in these circumstances. Utilizing these techniques may result in transfers between Level 1 and Level 2. For restricted equity securities and private placements where
Annual Report
3. Significant Accounting Policies - continued
Security Valuation - continued
observable inputs are limited, assumptions about market activity and risk are used and are categorized as Level 3 in the hierarchy.
Investments in open-end mutual funds, including the Fidelity Central Funds, are valued at their closing net asset value each business day and are categorized as Level 1 in the hierarchy.
Foreign Currency. The Fund may use foreign currency contracts to facilitate transactions in foreign-denominated securities. Gains and losses from these transactions may arise from changes in the value of the foreign currency or if the counterparties do not perform under the contracts' terms.
Foreign-denominated assets, including investment securities, and liabilities are translated into U.S. dollars at the exchange rate at period end. Purchases and sales of investment securities, income and dividends received and expenses denominated in foreign currencies are translated into U.S. dollars at the exchange rate in effect on the transaction date.
The effects of exchange rate fluctuations on investments are included with the net realized and unrealized gain (loss) on investment securities. Other foreign currency transactions resulting in realized and unrealized gain (loss) are disclosed separately.
Investment Transactions and Income. For financial reporting purposes, the Fund's investment holdings and NAV include trades executed through the end of the last business day of the period. The NAV per share for processing shareholder transactions is calculated as of the close of business of the New York Stock Exchange (NYSE), normally 4:00 p.m. Eastern time and includes trades executed through the end of the prior business day. Gains and losses on securities sold are determined on the basis of identified cost and may include proceeds received from litigation. Dividend income is recorded on the ex-dividend date, except for certain dividends from foreign securities where the ex-dividend date may have passed, which are recorded as soon as the Fund is informed of the ex-dividend date. Non-cash dividends included in dividend income, if any, are recorded at the fair market value of the securities received. Distributions received on securities that represent a return of capital or capital gain are recorded as a reduction of cost of investments and/or as a realized gain. The Fund estimates the components of distributions received that may be considered return of capital distributions or capital gain distributions. Interest income and distributions from the Fidelity Central Funds are accrued as earned. Interest income includes coupon interest and amortization of premium and accretion of discount on debt securities. Investment income is recorded net of foreign taxes withheld where recovery of such taxes is uncertain.
Annual Report
Notes to Financial Statements - continued
(Amounts in thousands except ratios)
3. Significant Accounting Policies - continued
Expenses. Expenses directly attributable to a fund are charged to that fund. Expenses attributable to more than one fund are allocated among the respective funds on the basis of relative net assets or other appropriate methods. Expense estimates are accrued in the period to which they relate and adjustments are made when actual amounts are known.
Deferred Trustee Compensation. Under a Deferred Compensation Plan (the Plan), independent Trustees may elect to defer receipt of a portion of their annual compensation. Deferred amounts are invested in a cross-section of Fidelity funds, are marked-to-market and remain in the Fund until distributed in accordance with the Plan. The investment of deferred amounts and the offsetting payable to the Trustees are included in the accompanying Statement of Assets and Liabilities.
Income Tax Information and Distributions to Shareholders. Each year, the Fund intends to qualify as a regulated investment company, including distributing substantially all of its taxable income and realized gains under Subchapter M of the Internal Revenue Code and filing its U.S. federal tax return. As a result, no provision for income taxes is required. As of July 31, 2011, the Fund did not have any unrecognized tax benefits in the financial statements. A fund's federal tax return is subject to examination by the Internal Revenue Service (IRS) for a period of three years. Foreign taxes are provided for based on the Fund's understanding of the tax rules and rates that exist in the foreign markets in which it invests.
Distributions are declared and recorded on the ex-dividend date. Income dividends and capital gain distributions are declared separately for each class. Income and capital gain distributions are determined in accordance with income tax regulations, which may differ from GAAP. These differences resulted in distribution reclassifications. In addition, the Fund claimed a portion of the payment made to redeeming shareholders as a distribution for income tax purposes.
Capital accounts within the financial statements are adjusted for permanent book-tax differences. These adjustments have no impact on net assets or the results of operations. Temporary book-tax differences will reverse in a subsequent period.
Book-tax differences are primarily due to foreign currency transactions, passive foreign investment companies (PFIC), partnerships, deferred trustees compensation, capital loss carryforwards and losses deferred due to wash sales and excise tax regulations.
Annual Report
3. Significant Accounting Policies - continued
Income Tax Information and Distributions to Shareholders - continued
The federal tax cost of investment securities and unrealized appreciation (depreciation) as of period end were as follows:
Gross unrealized appreciation | $ 3,629,356 |
Gross unrealized depreciation | (223,692) |
Net unrealized appreciation (depreciation) on securities and other investments | $ 3,405,664 |
| |
Tax Cost | $ 11,094,654 |
The tax-based components of distributable earnings as of period end were as follows:
Undistributed long-term capital gain | $ 480,312 |
Net unrealized appreciation (depreciation) | $ 3,405,665 |
Under the recently enacted Regulated Investment Company Modernization Act of 2010 (the Act), the Fund will be permitted to carry forward capital losses incurred in taxable years beginning after December 22, 2010 for an unlimited period. However, any losses incurred during those future taxable years will be required to be utilized prior to any losses incurred in pre-enactment taxable years, which generally expire after eight years from when they are incurred. Additionally, post-enactment capital losses that are carried forward will retain their character as either short-term or long-term capital losses rather than being considered all short-term as under previous law. The Fund's first fiscal year end subject to the Act will be July 31, 2012.
The tax character of distributions paid was as follows:
| July 31, 2011 | July 31, 2010 |
Ordinary Income | $ 2,405 | $ 57,433 |
Long-term Capital Gains | 12,451 | - |
Total | $ 14,856 | $ 57,433 |
New Accounting Pronouncement. In May 2011, the Financial Accounting Standards Board issued Accounting Standard Update No. 2011-04, Fair Value Measurement (Topic 820) - Amendments to Achieve Common Fair Value Measurement and Disclosure Requirements in U.S. GAAP and IFRSs. The update changes the wording used to describe the requirements in GAAP for measuring fair value and for disclosing information about fair value measurements. The update is effective during interim and annual periods beginning after December 15, 2011. Management is currently evaluating the impact of the update's adoption on the Fund's financial statement disclosures.
Annual Report
Notes to Financial Statements - continued
(Amounts in thousands except ratios)
4. Operating Policies.
Restricted Securities. The Fund may invest in securities that are subject to legal or contractual restrictions on resale. These securities generally may be resold in transactions exempt from registration or to the public if the securities are registered. Disposal of these securities may involve time-consuming negotiations and expense, and prompt sale at an acceptable price may be difficult. Information regarding restricted securities is included at the end of the Fund's Schedule of Investments.
5. Purchases and Sales of Investments.
Purchases and sales of securities, other than short-term securities, aggregated $17,822,174 and $18,155,781, respectively.
6. Fees and Other Transactions with Affiliates.
Management Fee. FMR and its affiliates provide the Fund with investment management related services for which the Fund pays a monthly management fee. The management fee is the sum of an individual fund fee rate that is based on an annual rate of .30% of the Fund's average net assets and a group fee rate that averaged .26% during the period. The group fee rate is based upon the average net assets of all the mutual funds advised by FMR. The group fee rate decreases as assets under management increase and increases as assets under management decrease. In addition, the management fee is subject to a performance adjustment (up to a maximum of ± .20% of the Fund's average net assets over a 36 month performance period). The upward or downward adjustment to the management fee is based on the relative investment performance of Blue Chip Growth as compared to an appropriate benchmark index. For the period, the total annual management fee rate, including the performance adjustment, was .70% of the Fund's average net assets.
Transfer Agent Fees. Fidelity Investments Institutional Operations Company, Inc. (FIIOC), an affiliate of FMR, is the transfer, dividend disbursing and shareholder servicing agent for each class of the Fund. FIIOC receives account fees and asset-based fees that vary according to the account size and type of account of the shareholders of Blue Chip Growth. FIIOC receives an asset-based fee of Class K's average net assets. FIIOC receives no fees for providing transfer agency services to Class F. FIIOC pays for typesetting, printing and mailing of shareholder reports, except proxy statements.
Annual Report
6. Fees and Other Transactions with Affiliates - continued
Transfer Agent Fees - continued
For the period, transfer agent fees for each class were as follows:
| Amount | % of
Average
Net Assets |
Blue Chip Growth | $ 25,585 | .22 |
Class K | 619 | .05 |
| $ 26,204 | |
Accounting and Security Lending Fees. Fidelity Service Company, Inc. (FSC), an affiliate of FMR, maintains the Fund's accounting records. The accounting fee is based on the level of average net assets for the month. Under a separate contract, FSC administers the security lending program. The security lending fee is based on the number and duration of lending transactions.
Brokerage Commissions. The Fund placed a portion of its portfolio transactions with brokerage firms which are affiliates of the investment adviser. The commissions paid to these affiliated firms were $536 for the period.
Interfund Lending Program. Pursuant to an Exemptive Order issued by the SEC, the Fund, along with other registered investment companies having management contracts with FMR, may participate in an interfund lending program. This program provides an alternative credit facility allowing the funds to borrow from, or lend money to, other participating affiliated funds. Any open loans, including accrued interest, at period end are presented under the caption "Notes payable to affiliates" in the Fund's Statement of Assets and Liabilities. The Fund's activity in this program during the period for which loans were outstanding was as follows:
Borrower or Lender | Average Daily
Loan Balance | Weighted Average Interest Rate | Interest
Expense |
Borrower | $ 18,305 | .44% | $ 12 |
7. Committed Line of Credit.
The Fund participates with other funds managed by FMR or an affiliate in a $4.0 billion credit facility (the "line of credit") to be utilized for temporary or emergency purposes to fund shareholder redemptions or for other short-term liquidity purposes. The Fund has agreed to pay commitment fees on its pro-rata portion of the line of credit, which amounted to $45 and is reflected in Miscellaneous expenses on the Statement of Operations. During the period, there were no borrowings on this line of credit.
Annual Report
Notes to Financial Statements - continued
(Amounts in thousands except ratios)
8. Security Lending.
The Fund lends portfolio securities through a lending agent from time to time in order to earn additional income. The lending agent may loan securities to certain qualified borrowers, including Fidelity Capital Markets (FCM), a broker-dealer affiliated with the Fund. On the settlement date of the loan, the Fund receives collateral (in the form of U.S. Treasury obligations, letters of credit and/or cash) against the loaned securities and maintains collateral in an amount not less than 100% of the market value of the loaned securities during the period of the loan. The market value of the loaned securities is determined at the close of business of the Fund and any additional required collateral is delivered to the Fund on the next business day. If the borrower defaults on its obligation to return the securities loaned because of insolvency or other reasons, a fund could experience delays and costs in recovering the securities loaned or in gaining access to the collateral. Any cash collateral received is invested in the Fidelity Securities Lending Cash Central Fund. The value of loaned securities and cash collateral at period end are disclosed on the Fund's Statement of Assets and Liabilities. The value of securities loaned to FCM at period end was $1,503. Security lending income represents the income earned on investing cash collateral, less rebates paid to borrowers and lending agent fees associated with the loan, plus any premium payments received for lending certain types of securities. Security lending income is presented in the Statement of Operations as a component of income from Fidelity Central Funds. Total security lending income during the period amounted to $1,516, including $24 from securities loaned to FCM.
9. Bank Borrowings.
The Fund is permitted to have bank borrowings for temporary or emergency purposes to fund shareholder redemptions or for other short-term liquidity requirements. The Fund has established borrowing arrangements with certain banks. The interest rate on the borrowings is the bank's base rate, as revised from time to time. The average daily loan balance during the period for which loans were outstanding amounted to $27,562. The weighted average interest rate was .69%. The interest expense amounted to $3 under the bank borrowing program. At period end, there were no bank borrowings outstanding.
10. Expense Reductions.
Many of the brokers with whom FMR places trades on behalf of the Fund provided services to the Fund in addition to trade execution. These services included payments of certain expenses on behalf of the Fund totaling $1,802 for the period. In addition, through arrangements with the Fund's custodian, credits realized as a result of uninvested cash balances were used to reduce the Fund's expenses. During the period, these credits reduced the Fund's custody expenses by $1.
Annual Report
11. Distributions to Shareholders.
Distributions to shareholders of each class were as follows:
Years ended July 31, | 2011 | 2010 |
From net investment income | | |
Blue Chip Growth | $ 670 | $ 52,296 |
Class K | 1,165 | 4,902 |
Class F | 570 | 235 |
Total | $ 2,405 | $ 57,433 |
From net realized gain | | |
Blue Chip Growth | $ 9,690 | $ - |
Class K | 1,750 | - |
Class F | 1,011 | - |
Total | $ 12,451 | $ - |
12. Share Transactions.
Transactions for each class of shares were as follows:
| Shares | Dollars |
Years ended July 31, | 2011 | 2010 A | 2011 | 2010 A |
Blue Chip Growth | | | | |
Shares sold | 42,281 | 41,698 | $ 1,904,203 | $ 1,553,486 |
Conversion to Class K | - | (604) | - | (19,981) |
Reinvestment of distributions | 232 | 1,459 | 10,166 | 51,338 |
Shares redeemed | (66,514) | (72,051) | (2,974,498) | (2,676,741) |
Net increase (decrease) | (24,001) | (29,498) | $ (1,060,129) | $ (1,091,898) |
Class K | | | | |
Shares sold | 13,902 | 11,377 | $ 625,856 | $ 427,050 |
Conversion from Blue Chip Growth | - | 603 | - | 19,981 |
Reinvestment of distributions | 70 | 139 | 2,916 | 4,902 |
Shares redeemed | (8,528) | (5,839) | (379,087) | (218,811) |
Net increase (decrease) | 5,444 | 6,280 | $ 249,685 | $ 233,122 |
Class F | | | | |
Shares sold | 12,501 | 8,796 | $ 558,704 | $ 331,310 |
Reinvestment of distributions | 38 | 6 | 1,580 | 235 |
Shares redeemed | (2,171) | (282) | (102,054) | (10,900) |
Net increase (decrease) | 10,368 | 8,520 | $ 458,230 | $ 320,645 |
A Conversion transactions for Class K and Blue Chip Growth are presented for the period August 1, 2009 through August 31, 2009.
Annual Report
Notes to Financial Statements - continued
(Amounts in thousands except ratios)
13. Other.
The Fund's organizational documents provide former and current trustees and officers with a limited indemnification against liabilities arising in connection with the performance of their duties to the Fund. In the normal course of business, the Fund may also enter into contracts that provide general indemnifications. The Fund's maximum exposure under these arrangements is unknown as this would be dependent on future claims that may be made against the Fund. The risk of material loss from such claims is considered remote.
Annual Report
To the Trustees of Fidelity Securities Fund and Shareholders of Fidelity Blue Chip Growth Fund:
We have audited the accompanying statement of assets and liabilities of Fidelity Blue Chip Growth Fund (the Fund), a fund of Fidelity Securities Fund, including the schedule of investments, as of July 31, 2011, and the related statement of operations for the year then ended, the statement of changes in net assets for each of the two years in the period then ended, and the financial highlights for each of the five years in the period then ended. These financial statements and financial highlights are the responsibility of the Fund's management. Our responsibility is to express an opinion on these financial statements and financial highlights based on our audits.
We conducted our audits in accordance with the standards of the Public Company Accounting Oversight Board (United States). Those standards require that we plan and perform the audit to obtain reasonable assurance about whether the financial statements and financial highlights are free of material misstatement. The Fund is not required to have, nor were we engaged to perform, an audit of its internal control over financial reporting. Our audits included consideration of internal control over financial reporting as a basis for designing audit procedures that are appropriate in the circumstances, but not for the purpose of expressing an opinion on the effectiveness of the Fund's internal control over financial reporting. Accordingly, we express no such opinion. An audit also includes examining, on a test basis, evidence supporting the amounts and disclosures in the financial statements, assessing the accounting principles used and significant estimates made by management, as well as evaluating the overall financial statement presentation. Our procedures included confirmation of securities owned as of July 31, 2011, by correspondence with the custodians and brokers; where replies were not received from brokers, we performed other auditing procedures. We believe that our audits provide a reasonable basis for our opinion.
In our opinion, the financial statements and financial highlights referred to above present fairly, in all material respects, the financial position of Fidelity Blue Chip Growth Fund as of July 31, 2011, the results of its operations for the year then ended, the changes in its net assets for each of the two years in the period then ended, and the financial highlights for each of the five years in the period then ended, in conformity with accounting principles generally accepted in the United States of America.
/s/ Deloitte & Touche LLP
DELOITTE & TOUCHE LLP
Boston, Massachusetts
September 16, 2011
Annual Report
The Trustees, Members of the Advisory Board, and executive officers of the trust and fund, as applicable, are listed below. The Board of Trustees governs the fund and is responsible for protecting the interests of shareholders. The Trustees are experienced executives who meet periodically throughout the year to oversee the fund's activities, review contractual arrangements with companies that provide services to the fund, oversee management of the risks associated with such activities and contractual arrangements, and review the fund's performance. Except for James C. Curvey, each of the Trustees oversees 221 funds advised by FMR or an affiliate. Mr. Curvey oversees 419 funds advised by FMR or an affiliate.
The Trustees hold office without limit in time except that (a) any Trustee may resign; (b) any Trustee may be removed by written instrument, signed by at least two-thirds of the number of Trustees prior to such removal; (c) any Trustee who requests to be retired or who has become incapacitated by illness or injury may be retired by written instrument signed by a majority of the other Trustees; and (d) any Trustee may be removed at any special meeting of shareholders by a two-thirds vote of the outstanding voting securities of the trust. Each Trustee who is not an interested person (as defined in the 1940 Act) (Independent Trustee), shall retire not later than the last day of the calendar year in which his or her 75th birthday occurs. The Independent Trustees may waive this mandatory retirement age policy with respect to individual Trustees. The executive officers and Advisory Board Members hold office without limit in time, except that any officer and Advisory Board Member may resign or may be removed by a vote of a majority of the Trustees at any regular meeting or any special meeting of the Trustees. Except as indicated, each individual has held the office shown or other offices in the same company for the past five years.
Experience, Skills, Attributes, and Qualifications of the Fund's Trustees. The Governance and Nominating Committee has adopted a statement of policy that describes the experience, qualifications, attributes, and skills that are necessary and desirable for potential Independent Trustee candidates (Statement of Policy). The Board believes that each Trustee satisfied at the time he or she was initially elected or appointed a Trustee, and continues to satisfy, the standards contemplated by the Statement of Policy. The Governance and Nominating Committee also engages professional search firms to help identify potential Independent Trustee candidates who have the experience, qualifications, attributes, and skills consistent with the Statement of Policy. From time to time, additional criteria based on the composition and skills of the current Independent Trustees, as well as experience or skills that may be appropriate in light of future changes to board composition, business conditions, and regulatory or other developments, have also been considered by the professional search firms and the Governance and Nominating Committee. In addition, the Board takes into account the Trustees' commitment and participation in Board and committee meetings, as well as their leadership of standing and ad hoc committees throughout their tenure.
In determining that a particular Trustee was and continues to be qualified to serve as a Trustee, the Board has considered a variety of criteria, none of which, in isolation, was controlling. The Board believes that, collectively, the Trustees have balanced and diverse experience, qualifications, attributes, and skills, which allow the Board to operate effectively in governing the fund and protecting the interests of shareholders. Information about the specific experience, skills, attributes, and qualifications of each Trustee, which in each case led to the Board's conclusion that the Trustee should serve (or continue to serve) as a trustee of the fund, is provided below.
Annual Report
Trustees and Officers - continued
Board Structure and Oversight Function. James C. Curvey is an interested person (as defined in the 1940 Act) and currently serves as Acting Chairman. The Trustees have determined that an interested Chairman is appropriate and benefits shareholders because an interested Chairman has a personal and professional stake in the quality and continuity of services provided to the fund. Independent Trustees exercise their informed business judgment to appoint an individual of their choosing to serve as Chairman, regardless of whether the Trustee happens to be independent or a member of management. The Independent Trustees have determined that they can act independently and effectively without having an Independent Trustee serve as Chairman and that a key structural component for assuring that they are in a position to do so is for the Independent Trustees to constitute a substantial majority for the Board. The Independent Trustees also regularly meet in executive session. Ned C. Lautenbach serves as Chairman of the Independent Trustees and as such (i) acts as a liaison between the Independent Trustees and management with respect to matters important to the Independent Trustees and (ii) with management prepares agendas for Board meetings.
Fidelity funds are overseen by different Boards of Trustees. The fund's Board oversees Fidelity's equity and high income funds and another Board oversees Fidelity's investment-grade bond, money market, and asset allocation funds. The asset allocation funds may invest in Fidelity funds overseen by the fund's Board. The use of separate Boards, each with its own committee structure, allows the Trustees of each group of Fidelity funds to focus on the unique issues of the funds they oversee, including common research, investment, and operational issues. On occasion, the separate Boards establish joint committees to address issues of overlapping consequences for the Fidelity funds overseen by each Board.
The Trustees operate using a system of committees to facilitate the timely and efficient consideration of all matters of importance to the Trustees, the fund, and fund shareholders and to facilitate compliance with legal and regulatory requirements and oversight of the fund's activities and associated risks. The Board, acting through its committees, has charged FMR and its affiliates with (i) identifying events or circumstances the occurrence of which could have demonstrably adverse effects on the fund's business and/or reputation; (ii) implementing processes and controls to lessen the possibility that such events or circumstances occur or to mitigate the effects of such events or circumstances if they do occur; and (iii) creating and maintaining a system designed to evaluate continuously business and market conditions in order to facilitate the identification and implementation processes described in (i) and (ii) above. Because the day-to-day operations and activities of the fund are carried out by or through FMR, its affiliates and other service providers, the fund's exposure to risks is mitigated but not eliminated by the processes overseen by the Trustees. While each of the Board's committees has responsibility for overseeing different aspects of the fund's activities, oversight is exercised primarily through the Operations, Audit, and Compliance Committees. Appropriate personnel, including but not limited to the fund's Chief Compliance Officer (CCO), FMR's internal auditor, the independent accountants, the fund's Treasurer and portfolio management personnel, make periodic reports to the Board's committees, as appropriate. The responsibilities of each committee, including their oversight responsibilities, are described further under "Standing Committees of the Fund's Trustees."
Annual Report
The fund's Statement of Additional Information (SAI) includes more information about the Trustees. To request a free copy, call Fidelity at 1-800-835-5092.
Interested Trustees*:
Correspondence intended for each Trustee who is an interested person may be sent to Fidelity Investments, 82 Devonshire Street, Boston, Massachusetts 02109.
Name, Age; Principal Occupations and Other Relevant Experience+ |
James C. Curvey (76) |
| Year of Election or Appointment: 2007
Mr. Curvey is Trustee and Acting Chairman of the Board of Trustees of certain Trusts. Mr. Curvey also serves as Trustee (2007-present) of other investment companies advised by FMR. Mr. Curvey is a Director of Fidelity Investments Money Management, Inc. (2009-present), Director of Fidelity Research & Analysis Co. (2009-present) and Director of FMR and FMR Co., Inc. (2007-present). Mr. Curvey is also Vice Chairman (2007-present) and Director of FMR LLC. In addition, Mr. Curvey serves as an Overseer for the Boston Symphony Orchestra and a member of the Trustees of Villanova University. Previously, Mr. Curvey was the Vice Chairman (2006-2007) and Director (2000-2007) of FMR Corp. |
Ronald P. O'Hanley (54) |
| Year of Election or Appointment: 2011
Mr. O'Hanley is Director of FMR Co., Inc. (2010-present), Director of Fidelity Investments Money Management, Inc. (2010-present), Director of Fidelity Research & Analysis Company (2010-present), President of Fidelity Asset Management and Corporate Services and a member of Fidelity's Executive Committee (2010-present). Previously, Mr. O'Hanley served as President and Chief Executive Officer of BNY Mellon Asset Management (2007-2010). Mr. O'Hanley also served as Vice Chairman of Bank New York Mellon Corp. and a member of that firm's Executive Committee. Prior to the 2007 merger of The Bank of New York and Mellon Financial Corporation, he was Vice Chairman of Mellon Financial Corporation and President and Chief Executive Officer of Mellon Asset Management. He joined Mellon in February 1997. Mr. O'Hanley currently serves as Chairman of the Boston Public Library Foundation Board of Directors and sits on the Board of Directors of Beth Israel Deaconess Medical Center, the Board of Trustees of the Marine Biological Laboratory and the Advisory Board of the Maxwell School of Citizenship and Public Administration at Syracuse University. Mr. O'Hanley also chairs the Council on Asset Management for the Financial Services Roundtable and is a member of the Board of Directors of Institutional Investor's U.S. Institute. |
* Trustees have been determined to be "Interested Trustees" by virtue of, among other things, their affiliation with the trust or various entities under common control with FMR.
+ The information above includes each Trustee's principal occupation during the last five years and other information relating to the experience, attributes, and skills relevant to each Trustee's qualifications to serve as a Trustee, which led to the conclusion that each Trustee should serve as a Trustee for the fund.
Annual Report
Independent Trustees:
Correspondence intended for each Independent Trustee (that is, the Trustees other than the Interested Trustees) may be sent to Fidelity Investments, P.O. Box 55235, Boston, Massachusetts 02205-5235.
Name, Age; Principal Occupations and Other Relevant Experience+ |
Dennis J. Dirks (63) |
| Year of Election or Appointment: 2005 Prior to his retirement in May 2003, Mr. Dirks was Chief Operating Officer and a member of the Board of The Depository Trust & Clearing Corporation (DTCC). He also served as President, Chief Operating Officer, and Board member of The Depository Trust Company (DTC) and President and Board member of the National Securities Clearing Corporation (NSCC). In addition, Mr. Dirks served as Chief Executive Officer and Board member of the Government Securities Clearing Corporation, Chief Executive Officer and Board member of the Mortgage-Backed Securities Clearing Corporation, as a Trustee and a member of the Finance Committee of Manhattan College (2005-2008), and as a Trustee and a member of the Finance Committee of AHRC of Nassau County (2006-2008). Mr. Dirks is a member of the Independent Directors Council (IDC) Governing Council (2010-Present) and Board of Directors for The Brookville Center for Children's Services, Inc. (2009-present). |
Alan J. Lacy (57) |
| Year of Election or Appointment: 2008 Mr. Lacy serves as Senior Adviser (2007-present) of Oak Hill Capital Partners, L.P. (private equity). Mr. Lacy also served as Chief Executive Officer (2000-2005) and Vice Chairman (2005-2006) of Sears Holdings Corporation and Sears, Roebuck and Co. (retail). In addition, Mr. Lacy serves as a member of the Board of Directors of Dave & Buster's, Inc. (restaurant and entertainment complexes, 2010-present), The Hillman Companies, Inc. (hardware wholesalers, 2010-present), and Bristol-Myers Squibb Company (global pharmaceuticals, 2007-present). Mr. Lacy is a member of the Board of Trustees of The National Parks Conservation Association (2006-Present). Previously, Mr. Lacy served as Chairman of the Board of Trustees of the National Parks Conservation Association (2008-2011) and as a member of the Board of Directors for the Western Union Company (global money transfer, 2006-2011). |
Ned C. Lautenbach (67) |
| Year of Election or Appointment: 2000 Mr. Lautenbach is Chairman of the Independent Trustees of the Equity and High Income Funds (2006-present). Mr. Lautenbach currently serves as the Lead Director of the Eaton Corporation Board of Directors (diversified industrial, 1997-present). Mr. Lautenbach is also a member of the Board of Directors of the Philharmonic Center for the Arts in Naples, Florida (1999-present); a member of the Board of Trustees of Fairfield University (2005-present); and a member of the Council on Foreign Relations (1994-present). Previously, Mr. Lautenbach was a Partner/Advisory Partner at Clayton, Dubilier & Rice, LLC (private equity investment, 1998-2010), as well as a Director of Sony Corporation (2006-2007). |
Joseph Mauriello (66) |
| Year of Election or Appointment: 2008 Prior to his retirement in January 2006, Mr. Mauriello served in numerous senior management positions including Deputy Chairman and Chief Operating Officer (2004-2005), and Vice Chairman of Financial Services (2002-2004) of KPMG LLP US (professional services, 1965-2005). Mr. Mauriello currently serves as a member of the Board of Directors of XL Group plc. (global insurance and re-insurance, 2006-present) and of Arcadia Resources Inc. (health care services and products, 2007-present). Previously, Mr. Mauriello served as a Director of the Hamilton Funds of the Bank of New York (2006-2007). |
Robert W. Selander (60) |
| Year of Election or Appointment: 2011
Previously, Mr. Selander served as a Member of the Advisory Board of Fidelity's Equity and High Income Funds (2011), Executive Vice Chairman (2010), Chief Executive Officer (2009-2010), and President and Chief Executive Officer (1997-2009) of Mastercard, Inc. |
Cornelia M. Small (67) |
| Year of Election or Appointment: 2005 Ms. Small is a member of the Board of Directors of the Teagle Foundation (2009-present). Ms. Small is also a member of the Investment Committee, and Chair (2008-present) and a member of the Board of Trustees of Smith College. In addition, Ms. Small serves on the Investment Committee of the Berkshire Taconic Community Foundation (2008-present). Previously, Ms. Small served as Chairperson of the Investment Committee (2002-2008) of Smith College. In addition, Ms. Small served as Chief Investment Officer, Director of Global Equity Investments, and a member of the Board of Directors of Scudder, Stevens & Clark and Scudder Kemper Investments. |
William S. Stavropoulos (72) |
| Year of Election or Appointment: 2002 Mr. Stavropoulos is Vice Chairman of the Independent Trustees of the Equity and High Income Funds (2006-present). Mr. Stavropoulos serves as President and Founder of the Michigan Baseball Foundation, the Great Lakes Loons (2007-present). Mr. Stavropoulos is Chairman Emeritus of the Board of Directors of The Dow Chemical Company, where he previously served in numerous senior management positions, including President, CEO (1995-2000; 2002-2004), Chairman of the Executive Committee (2000-2006), and as a member of the Board of Directors (1990-2006). Currently, Mr. Stavropoulos is Chairman of Univar (global distributor of commodity and specialty chemicals, 2010-present), a Director of Teradata Corporation (data warehousing and technology solutions, 2008-present), Chemical Financial Corporation, Maersk Inc. (industrial conglomerate), Tyco International, Inc. (multinational manufacturing and services, 2007-present), and a member of the Advisory Board for Metalmark Capital (private equity investment, 2005-present). Mr. Stavropoulos is a special advisor to Clayton, Dubilier & Rice, LLC (private equity investment). In addition, Mr. Stavropoulos is a member of the University of Notre Dame Advisory Council for the College of Science. |
David M. Thomas (62) |
| Year of Election or Appointment: 2008 Previously, Mr. Thomas served as Executive Chairman (2005-2006) and Chairman and Chief Executive Officer (2000-2005) of IMS Health, Inc. (pharmaceutical and healthcare information solutions). In addition, Mr. Thomas serves as a member of the Board of Directors of Fortune Brands, Inc. (consumer products), and Interpublic Group of Companies, Inc. (marketing communication, 2004-present). |
Michael E. Wiley (60) |
| Year of Election or Appointment: 2008 Mr. Wiley also serves as a Director of Asia Pacific Exploration Consolidated (international oil and gas exploration and production, 2008-present). Mr. Wiley serves as a Director of Tesoro Corporation (independent oil refiner and marketer, 2005-present), and a Director of Bill Barrett Corporation (exploration and production, 2005-present). In addition, Mr. Wiley also serves as a Director of Post Oak Bank (privately-held bank, 2004-present). Previously, Mr. Wiley served as a member of the Board of Trustees of the University of Tulsa (2000-2006; 2007-2010), as a Senior Energy Advisor of Katzenbach Partners, LLC (consulting, 2006-2007), as an Advisory Director of Riverstone Holdings (private investment), Chairman, President, and CEO of Baker Hughes, Inc. (oilfield services, 2000-2004), and as Director of Spinnaker Exploration Company (exploration and production, 2001-2005). |
Annual Report
Trustees and Officers - continued
+ The information above includes each Trustee's principal occupation during the last five years and other information relating to the experience, attributes, and skills relevant to each Trustee's qualifications to serve as a Trustee, which led to the conclusion that each Trustee should serve as a Trustee for the fund.
Advisory Board Members and Executive Officers:
Correspondence intended for each executive officer, Edward C. Johnson 3d, and Peter S. Lynch may be sent to Fidelity Investments, 82 Devonshire Street, Boston, Massachusetts 02109.
Name, Age; Principal Occupation |
Edward C. Johnson 3d (81) |
| Year of Election or Appointment: 2011 Member of the Advisory Board of Fidelity's Equity and High Income Funds. Mr. Johnson serves as Chief Executive Officer, Chairman, and a Director of FMR LLC, and also serves as Chairman and Director of FIL Limited. Previously, Mr. Johnson served as a Trustee and Chairman of the Board of certain Fidelity Trusts, Chairman and a Director of FMR, Chairman and a Director of FMR Co., Inc., and President of FMR LLC (2006-2007). |
Peter S. Lynch (67) |
| Year of Election or Appointment: 2003 Member of the Advisory Board of Fidelity's Equity and High Income Funds. Mr. Lynch is Vice Chairman and a Director of FMR and FMR Co., Inc. In addition, Mr. Lynch serves as a Trustee of Boston College and as the Chairman of the Inner-City Scholarship Fund. Previously, Mr. Lynch served on the Special Olympics International Board of Directors (1997-2006). |
Kenneth B. Robins (41) |
| Year of Election or Appointment: 2008 President and Treasurer of Fidelity's Equity and High Income Funds. Mr. Robins also serves as President and Treasurer (2010-present) and Assistant Treasurer (2009-present) of other Fidelity funds and is an employee of Fidelity Investments (2004-present). Previously, Mr. Robins served as Deputy Treasurer of the Fidelity funds (2005-2008) and Treasurer and Chief Financial Officer of The North Carolina Capital Management Trust: Cash and Term Portfolios (2006-2008). |
Bruce T. Herring (45) |
| Year of Election or Appointment: 2006 Vice President of certain Equity Funds. Mr. Herring also serves as Chief Investment Officer and Director of Fidelity Management & Research (U.K.) Inc. (2010-present) and Group Chief Investments Officer of FMR. Previously, Mr. Herring served as Vice President (2005-2006) and Senior Vice President (2006-2007) of Fidelity Management & Research Company, Vice President of FMR Co., Inc. (2001-2007) and as a portfolio manager for Fidelity U.S. Equity Funds. |
Brian B. Hogan (46) |
| Year of Election or Appointment: 2009 Vice President of Equity and High Income Funds. Mr. Hogan also serves as President of FMR's Equity Division (2009-present). Previously, Mr. Hogan served as Senior Vice President, Equity Research of FMR (2006-2009) and as a portfolio manager. |
Scott C. Goebel (43) |
| Year of Election or Appointment: 2008 Secretary and Chief Legal Officer (CLO) of the Fidelity funds. Mr. Goebel also serves as Secretary of Fidelity Investments Money Management, Inc. (FIMM) (2010-present) and Fidelity Research and Analysis Company (FRAC) (2010-present); Secretary and CLO of The North Carolina Capital Management Trust: Cash and Term Portfolios (2008-present); General Counsel, Secretary, and Senior Vice President of FMR (2008-present) and FMR Co., Inc. (2008-present); employed by FMR LLC or an affiliate (2001-present); Chief Legal Officer of Fidelity Management & Research (Hong Kong) Limited (2008-present) and Assistant Secretary of Fidelity Management & Research (Japan) Inc. (2008-present), and Fidelity Management & Research (U.K.) Inc. (2008-present). Previously, Mr. Goebel served as Assistant Secretary of FIMM (2008-2010), FRAC (2008-2010), and the Funds (2007-2008) and as Vice President and Secretary of Fidelity Distributors Corporation (FDC) (2005-2007). |
William C. Coffey (42) |
| Year of Election or Appointment: 2009 Assistant Secretary of Fidelity's Equity and High Income Funds. Mr. Coffey also serves as Senior Vice President and Deputy General Counsel of FMR LLC (2010-present), and is an employee of Fidelity Investments. Previously, Mr. Coffey served as Vice President and Associate General Counsel of FMR LLC (2005-2009). |
Holly C. Laurent (57) |
| Year of Election or Appointment: 2008 Anti-Money Laundering (AML) Officer of the Fidelity funds. Ms. Laurent also serves as AML Officer of The North Carolina Capital Management Trust: Cash and Term Portfolios (2008-present) and is an employee of Fidelity Investments. Previously, Ms. Laurent was Senior Vice President and Head of Legal for Fidelity Business Services India Pvt. Ltd. (2006-2008), and Senior Vice President, Deputy General Counsel and Group Head for FMR LLC (2005-2006). |
Christine Reynolds (52) |
| Year of Election or Appointment: 2008 Chief Financial Officer of the Fidelity funds. Ms. Reynolds became President of Fidelity Pricing and Cash Management Services (FPCMS) in August 2008. Ms. Reynolds served as Chief Operating Officer of FPCMS (2007-2008). Previously, Ms. Reynolds served as President, Treasurer, and Anti-Money Laundering officer of the Fidelity funds (2004-2007). |
Kenneth A. Rathgeber (64) |
| Year of Election or Appointment: 2004 Chief Compliance Officer of Fidelity's Equity and High Income Funds. Mr. Rathgeber is Chief Compliance Officer of Fidelity Management & Research (Hong Kong) Limited (2008-present), Fidelity Management & Research (Japan) Inc. (2008-present), FMR (2005-present), FMR Co., Inc. (2005-present), Fidelity Management & Research (U.K.) Inc. (2005-present), Fidelity Research & Analysis Company (2005-present), Fidelity Investments Money Management, Inc. (2005-present), Pyramis Global Advisors, LLC (2005-present), and Strategic Advisers, Inc. (2005-present). |
Jeffrey S. Christian (49) |
| Year of Election or Appointment: 2009 Deputy Treasurer of the Fidelity funds. Mr. Christian is an employee of Fidelity Investments. Previously, Mr. Christian served as Chief Financial Officer (2008-2009) of certain Fidelity funds and Senior Vice President of Fidelity Pricing and Cash Management Services (FPCMS) (2004-2009). |
Bryan A. Mehrmann (50) |
| Year of Election or Appointment: 2005 Deputy Treasurer of the Fidelity funds. Mr. Mehrmann is an employee of Fidelity Investments. |
Adrien E. Deberghes (43) |
| Year of Election or Appointment: 2008 Deputy Treasurer of Fidelity's Equity and High Income Funds. Mr. Deberghes also serves as Assistant Treasurer of other Fidelity funds (2010-present) and is an employee of Fidelity Investments (2008-present). Previously, Mr. Deberghes served as Senior Vice President of Mutual Fund Administration at State Street Corporation (2007-2008), Senior Director of Mutual Fund Administration at Investors Bank & Trust (2005-2007), and Director of Finance for Dunkin' Brands (2000-2005). |
Stephanie J. Dorsey (42) |
| Year of Election or Appointment: 2010 Assistant Treasurer of Fidelity's Equity and High Income Funds. Ms. Dorsey also serves as Deputy Treasurer of other Fidelity funds (2008-present) and is an employee of Fidelity Investments (2008-present). Previously, Ms. Dorsey served as Treasurer (2004-2008) of the JPMorgan Mutual Funds and Vice President (2004-2008) of JPMorgan Chase Bank. |
John R. Hebble (53) |
| Year of Election or Appointment: 2009 Assistant Treasurer of Fidelity's Equity and High Income Funds. Mr. Hebble also serves as President (2011-present), Treasurer, and Chief Financial Officer of The North Carolina Capital Management Trust: Cash and Term Portfolios (2008-present), President and Treasurer of other Fidelity funds (2008-present) and is an employee of Fidelity Investments. |
Gary W. Ryan (52) |
| Year of Election or Appointment: 2005 Assistant Treasurer of the Fidelity funds. Mr. Ryan is an employee of Fidelity Investments. Previously, Mr. Ryan served as Vice President of Fund Reporting in Fidelity Pricing and Cash Management Services (FPCMS) (1999-2005). |
Jonathan Davis (43) |
| Year of Election or Appointment: 2010 Assistant Treasurer of the Fidelity funds. Mr. Davis is an employee of Fidelity Investments. Previously, Mr. Davis served as Vice President and Associate General Counsel of FMR LLC (2003-2010). |
Annual Report
The Board of Trustees of Fidelity Blue Chip Growth Fund voted to pay on record date, the following distributions per share derived from capital gains realized from sales of portfolio securities:
| Pay Date | Record Date | Capital Gains |
Class K | 9/12/11 | 9/09/11 | $1.598 |
Class K designates 100% of the dividends distributed in September and December, during the fiscal year as qualifying for the dividends-received deduction for corporate shareholders.
Class K designates 100% of the dividends distributed during the fiscal year as amounts which may be taken into account as a dividend for purposes of the maximum rate under section 1(h)(11) of the Internal Revenue Code.
The fund hereby designates as a capital gain dividend with respect to the taxable year ended July 31, 2011, $504,225,963, or, if subsequently determined to be different, the net capital gain of such year.
The fund will notify shareholders in January 2012 of amounts for use in preparing 2011 income tax returns.
Annual Report
Board Approval of Investment Advisory Contracts and Management Fees
Fidelity Blue Chip Growth Fund
Each year, the Board of Trustees, including the Independent Trustees (together, the Board), votes on the renewal of the management contract and sub-advisory agreements (together, the Advisory Contracts) for the fund. The Board, assisted by the advice of fund counsel and Independent Trustees' counsel, requests and considers a broad range of information relevant to the renewal of the Advisory Contracts throughout the year.
The Board meets regularly and considers at each of its meetings factors that are relevant to its annual consideration of the renewal of the fund's Advisory Contracts, including the services and support provided to the fund and its shareholders. The Board has established various standing committees, each composed of Independent Trustees with varying backgrounds, to which the Board has assigned specific subject matter responsibilities in order to enhance effective decision-making by the Board. The Board, acting directly and through its Committees, requests and receives information concerning the annual consideration of the renewal of the fund's Advisory Contracts. The Board also meets as needed to consider matters specifically related to the Board's annual consideration of the renewal of Advisory Contracts. Members of the Board may also meet with trustees of other Fidelity funds through ad hoc joint committees to discuss certain matters relevant to the Fidelity funds.
At its July 2011 meeting, the Board of Trustees, including the Independent Trustees, unanimously determined to renew the fund's Advisory Contracts. In reaching its determination, the Board considered all factors it believed relevant, including (i) the nature, extent, and quality of the services to be provided to the fund and its shareholders (including the investment performance of the fund); (ii) the competitiveness of the fund's management fee and total expense ratio; (iii) the total costs of the services to be provided by and the profits to be realized by Fidelity from its relationship with the fund; (iv) the extent to which economies of scale would be realized as the fund grows; and (v) whether fee levels reflect these economies of scale, if any, for the benefit of fund shareholders.
In considering whether to renew the Advisory Contracts for the fund, the Board reached a determination, with the assistance of fund counsel and Independent Trustees' counsel and through the exercise of its business judgment, that the renewal of the Advisory Contracts is in the best interests of the fund and its shareholders and that the compensation payable under the Advisory Contracts is fair and reasonable. The Board's decision to renew the Advisory Contracts was not based on any single factor, but rather was based on a comprehensive consideration of all the information provided to the Board at its meetings throughout the year. The Board, in reaching its determination to renew the Advisory Contracts, is aware that shareholders in the fund have a broad range of investment choices available to them, including a wide choice among mutual funds offered by Fidelity's competitors, and that the fund's shareholders, who have the opportunity to review and weigh the disclosure provided by the fund in its prospectus and other public disclosures, have chosen to invest in this fund, managed by Fidelity.
Annual Report
Board Approval of Investment Advisory Contracts and
Management Fees - continued
Nature, Extent, and Quality of Services Provided. The Board considered the staffing within the investment adviser, FMR, and the sub-advisers (together, the Investment Advisers), including the backgrounds of the fund's investment personnel and the fund's investment objective and discipline. The Independent Trustees also had discussions with senior management of Fidelity's investment operations and investment groups. The Board considered the structure of the portfolio manager compensation program and whether this structure provides appropriate incentives to act in the best interests of the fund.
Resources Dedicated to Investment Management and Support Services. The Board and the Fund Oversight and Research Committees reviewed the general qualifications and capabilities of the Investment Advisers' investment staff, including its size, education, experience, and resources, as well as the Investment Advisers' approach to recruiting, training, managing, and compensating investment personnel. The Board also noted that FMR has devoted increased resources to non-U.S. offices. The Board noted that Fidelity's analysts have extensive resources, tools and capabilities which allow them to conduct sophisticated quantitative and fundamental analysis, as well as credit analysis of issuers, counterparties and enhancers. The Board also believes that Fidelity's investment professionals have sufficient access to global information and data so as to provide competitive investment results over time, and that those professionals also have access to sophisticated tools which permit them to assess portfolio construction and risk and performance attribution characteristics continuously, as well as to transmit new information and research conclusions rapidly around the world. Additionally, in their deliberations, the Board considered the Investment Advisers' trading capabilities and resources which are an integral part of the investment management process.
Shareholder and Administrative Services. The Board considered (i) the nature, extent, quality, and cost of advisory, administrative, and shareholder services performed by the Investment Advisers and their affiliates under the Advisory Contracts and under separate agreements covering transfer agency, pricing and bookkeeping, and securities lending services for the fund; (ii) the nature and extent of the investment adviser's supervision of third party service providers, principally custodians and subcustodians; and (iii) the resources devoted to, and the record of compliance with, the fund's compliance policies and procedures. The Board also reviewed the allocation of fund brokerage, including allocations to brokers affiliated with the Investment Advisers, the use of brokerage commissions to pay fund expenses, and the use of "soft" commission dollars to pay for research services.
The Board noted that the growth of fund assets over time across the complex allows Fidelity to reinvest in the development of services designed to enhance the value or convenience of the Fidelity funds as investment vehicles. These services include 24-hour access to account information and market information through telephone representatives and over the Internet, investor education materials and asset allocation tools, and the expanded availability of Fidelity Investor Centers, with 35 new branches opening since 2010.
Annual Report
Investment in a Large Fund Family. The Board considered the benefits to shareholders of investing in a Fidelity fund, including the benefits of investing in a fund that is part of a large family of funds offering a variety of investment disciplines and providing a large variety of mutual fund investor services. The Board noted that Fidelity had taken, or had made recommendations that resulted in the Fidelity funds taking, a number of actions over the previous year that benefited particular funds, including (i) continuing to dedicate additional resources to investment research and support of the senior management team that oversees asset management; (ii) rationalizing product lines through the mergers of six funds into other funds; (iii) continuing to migrate the Freedom Funds to dedicated lower cost underlying funds; (iv) obtaining shareholder approval to broaden the investment strategies for Fidelity Consumer Finance Portfolio, Fidelity Emerging Asia Fund, and Fidelity Environment and Alternative Energy Portfolio; (v) contractually agreeing to reduce the management fees and impose other expense limitations on Spartan® 500 Index Fund and U.S. Bond Index Fund in connection with launching new institutional classes of these funds; (vi) changing the name, primary and supplemental benchmarks, and investment policies of Fidelity Global Strategies Fund to support the fund's flexible investment mandate and global orientation; and (vii) reducing the transfer agency account fee rates on certain accounts.
Investment Performance. The Board considered whether the fund has operated in accordance with its investment objective, as well as its record of compliance with its investment restrictions. It also reviewed the fund's absolute investment performance for each class, as well as the fund's relative investment performance for each class measured over multiple periods against (i) a broad-based securities market index, and (ii) a peer group of mutual funds deemed appropriate by Fidelity and reviewed by the Board. The following charts considered by the Board show, over the one-, three-, and five-year periods ended December 31, 2010, as available, the cumulative total returns of Class F and the retail class of the fund, the cumulative total returns of a broad-based securities market index ("benchmark"), and a range of cumulative total returns of a peer group of mutual funds identified by Morningstar, Inc. as having an investment style similar to that of the fund based on underlying portfolio holdings. The returns of Class F and the retail class show the performance of the highest and lowest performing classes, respectively (based on one-year performance). The box within each chart shows the 25th percentile return (bottom of box) and the 75th percentile return (top of box) of the peer group. Returns shown above the box are in the first quartile and returns shown below the box are in the fourth quartile. The percentage beaten numbers noted below each chart correspond to the percentile box and represent the percentage of funds in the peer group whose performance was equal to or lower than that of the class indicated.
Annual Report
Board Approval of Investment Advisory Contracts and
Management Fees - continued
Fidelity Blue Chip Growth Fund
The Board reviewed the fund's relative investment performance against its peer group and noted that the performance of the retail class of the fund (the class with the longest performance record) was in the first quartile for all the periods shown. The Board also noted that the investment performance of the retail class of the fund compared favorably to its benchmark for all the periods shown. The Board considered that the variations in performance among the fund's classes reflect the variations in class expenses, which result in lower performance for higher expense classes. The Board also reviewed the fund's performance since inception as well as performance in the current year.
The Board also considered that the fund's management fee is subject to upward or downward adjustment depending upon whether, and to what extent, the fund's investment performance for the performance period exceeds, or is exceeded by, the record (over the same period) of a Board-approved performance adjustment index. The Board noted that the performance adjustment provides FMR with a strong economic incentive to seek to achieve superior performance for the fund's shareholders and helps to more closely align the interests of FMR and the fund's shareholders.
Based on its review, the Board concluded that the nature, extent, and quality of services provided to the fund under the Advisory Contracts should benefit the fund's shareholders.
Annual Report
Competitiveness of Management Fee and Total Expense Ratio. The Board considered the fund's management fee and total expense ratio compared to "mapped groups" of competitive funds and classes. Fidelity creates "mapped groups" by combining similar Lipper investment objective categories that have comparable management fee characteristics. Combining Lipper investment objective categories aids the Board's management fee and total expense ratio comparisons by broadening the competitive group used for comparison and by reducing the number of universes to which various Fidelity funds are compared.
Management Fee. The Board considered two proprietary management fee comparisons for the 12-month periods shown in the chart below. The group of Lipper funds used by the Board for management fee comparisons is referred to below as the "Total Mapped Group." The Total Mapped Group comparison focuses on a fund's standing relative to the total universe of comparable funds available to investors in terms of gross management fees before expense reimbursements or caps, and without giving effect to the fund's performance adjustment. "TMG %" represents the percentage of funds in the Total Mapped Group that had management fees that were lower than the fund's. For example, a TMG % of 10% means that 90% of the funds in the Total Mapped Group had higher management fees than the fund. The "Asset-Size Peer Group" (ASPG) comparison focuses on a fund's standing relative to non-Fidelity funds similar in size to the fund within the Total Mapped Group. The ASPG represents at least 15% of the funds in the Total Mapped Group with comparable asset size and management fee characteristics, subject to a minimum of 50 funds (or all funds in the Total Mapped Group if fewer than 50). Additional information, such as the ASPG quartile in which the fund's management fee ranked and the impact of the fund's performance adjustment, is also included in the chart and considered by the Board.
Annual Report
Board Approval of Investment Advisory Contracts and
Management Fees - continued
Fidelity Blue Chip Growth Fund
The Board noted that the fund's management fee ranked below the median of its Total Mapped Group and below the median of its ASPG for 2010. The Board also noted the effect of the fund's positive performance adjustment on the fund's management fee ranking. The Board noted that the performance adjustment for each year represents calculations for performance periods that differ from the periods shown in the performance charts above.
Furthermore, the Board considered that shareholders approved a prospective change in the index used to calculate the fund's performance adjustment beginning June 1, 2006. The Board also considered that, because the performance adjustment is based on a rolling 36-month measurement period, during a transition period the fund's performance is compared to a blended index return that reflects the performance of the former index for the portion of the measurement period prior to June 1, 2006 and the performance of the current index for the remainder of the measurement period. The Board noted that the fund's performance adjustments for 2006 through 2009 shown in the chart above reflect the effect of using the blended index return to calculate the fund's performance adjustment.
Based on its review, the Board concluded that the fund's management fee is fair and reasonable in light of the services that the fund receives and the other factors considered.
Total Expense Ratio. In its review of each class's total expense ratio, the Board considered the fund's management fee as well as other fund or class expenses, as applicable, such as transfer agent fees, pricing and bookkeeping fees, and custodial, legal, and audit fees. The Board also noted the effects of any waivers and reimbursements on fees and expenses, as well as the impact of the fund's performance adjustment. As part of its review, the Board also considered the current and historical total expense ratios of each class of the fund compared to competitive fund median expenses. Each class of the fund is compared to those funds and classes in the Total Mapped Group (used by the Board for management fee comparisons) that have a similar sales load structure.
Annual Report
The Board noted that the total expense ratio of each class ranked below its competitive median for 2010. The Board considered that various factors, including 12b-1 fees, positive or negative performance adjustments, and relatively higher other expenses in the case of small fund size, can affect total expense ratios.
Fees Charged to Other Fidelity Clients. The Board also considered Fidelity fee structures and other information with respect to clients of FMR and its affiliates, such as other mutual funds advised or subadvised by FMR or its affiliates, pension plan clients, and other institutional clients. In March 2010, the Board created an ad hoc joint committee with the board of other Fidelity funds (the Committee) to review and compare Fidelity's institutional investment advisory business with its business of providing services to the Fidelity funds, including the differences in services provided, fees charged, and costs incurred, as well as competition in their respective marketplaces.
Based on its review of total expense ratios and fees charged to other Fidelity clients, the Board concluded that the total expense ratio of each class of the fund was reasonable in light of the services that the fund and its shareholders receive and the other factors considered, including the findings of the Committee.
Costs of the Services and Profitability. The Board considered the revenues earned and the expenses incurred by Fidelity in conducting the business of developing, marketing, distributing, managing, administering and servicing the fund and its shareholders. The Board also considered the level of Fidelity's profits in respect of all the Fidelity funds.
On an annual basis, FMR presents to the Board Fidelity's profitability for the fund. Fidelity calculates the profitability for each fund, as well as aggregate profitability for groups of Fidelity funds and all Fidelity funds, using a series of detailed revenue and cost allocation methodologies which originate with the books and records of Fidelity on which Fidelity's audited financial statements are based. The Audit Committee of the Board reviews any significant changes from the prior year's methodologies.
PricewaterhouseCoopers LLP (PwC), independent registered public accounting firm and auditor to Fidelity and certain Fidelity funds, has been engaged annually by the Board as part of the Board's assessment of Fidelity's profitability analysis. PwC's engagement includes the review and assessment of Fidelity's methodologies used in determining the revenues and expenses attributable to Fidelity's mutual fund business, and completion of agreed-upon procedures surrounding the mathematical accuracy of fund profitability and its conformity to allocation methodologies. After considering PwC's reports issued under the engagement and information provided by Fidelity, the Board concluded that while other allocation methods may also be reasonable, Fidelity's profitability methodologies are reasonable in all material respects.
Annual Report
Board Approval of Investment Advisory Contracts and
Management Fees - continued
The Board also reviewed Fidelity's non-fund businesses and fall-out benefits related to the mutual fund business as well as cases where Fidelity's affiliates may benefit from or be related to the fund's business.
The Board considered the costs of the services provided by and the profits realized by Fidelity in connection with the operation of the fund and was satisfied that the profitability was not excessive in the circumstances.
Economies of Scale. The Board considered whether there have been economies of scale in respect of the management of the Fidelity funds, whether the Fidelity funds (including the fund) have appropriately benefited from any such economies of scale, and whether there is potential for realization of any further economies of scale. The Board considered the extent to which the fund will benefit from economies of scale through increased services to the fund, through waivers or reimbursements, or through fee or expense reductions. The Board also noted that in 2009, it and the board of other Fidelity funds created an ad hoc committee (the Economies of Scale Committee) to analyze whether FMR attains economies of scale in respect of the management and servicing of the Fidelity funds, whether the Fidelity funds have appropriately benefited from such economies of scale, and whether there is potential for realization of any further economies of scale.
The Board recognized that the fund's management contract incorporates a "group fee" structure, which provides for lower group fee rates as total fund assets under FMR's management increase, and for higher group fee rates as total fund assets under FMR's management decrease. FMR calculates the group fee rates based on a tiered asset "breakpoint" schedule that varies based on asset class. The Board considered that the group fee is designed to deliver the benefits of economies of scale to fund shareholders when total Fidelity fund assets increase, even if assets of any particular fund are unchanged or have declined, because some portion of Fidelity's costs are attributable to services provided to all Fidelity funds, and all funds benefit if those costs can be allocated among more assets. The Board concluded that, given the group fee structure, fund shareholders will benefit from lower management fees as assets under FMR's management increase at the fund complex level, regardless of whether Fidelity achieves any such economies of scale.
The Board concluded, taking into account the analysis of the Economies of Scale Committee, that any potential economies of scale are being appropriately shared between fund shareholders and Fidelity.
Annual Report
Additional Information Requested by the Board. In order to develop fully the factual basis for consideration of the Fidelity funds' Advisory Contracts, the Board requested and received additional information on certain topics, including (i) fund performance trends, actions to be taken by FMR to improve certain funds' overall performance, and Fidelity's long-term strategies for certain funds; (ii) portfolio manager changes that have occurred during the past year and length of portfolio manager tenure for different categories of funds over time; (iii) Fidelity's compensation structure for portfolio managers and other key personnel and strategies for attracting and retaining non-investment personnel; (iv) the amount of the investment that each portfolio manager has made in the Fidelity fund(s) that he or she manages; (v) historical trends in Fidelity's realization of fall-out benefits; (vi) Fidelity's group fee structures and the rationale for the individual fee rates of certain funds; (vii) fund profitability methodology and the impact of certain factors on fund profitability results; (viii) trends regarding industry use of performance fee structures and Fidelity's compliance practices with respect to performance adjustment calculations; (ix) the fee structures in place for certain other Fidelity clients; and (x) explanations regarding the relative total expense ratios of certain funds and classes, total expense competitive trends, and actions that might be taken by FMR to reduce total expense ratios for certain funds and classes.
Based on its evaluation of all of the conclusions noted above, and after considering all factors it believed relevant, the Board ultimately concluded that the advisory fee structures are fair and reasonable, and that the fund's Advisory Contracts should be renewed.
Annual Report
Managing Your Investments
Fidelity offers several ways to conveniently manage your workplace benefits (including your workplace savings plan, investments, and additional services) via your telephone or PC. You can access your plan and account information and research your investments 24 hours a day.
By Phone
Fidelity provides a single toll-free number to access plan information, account balances, positions, and quotes*. It's easy to navigate the service, and on your first call, the system will help you create a personal identification number (PIN) for security.
(phone_graphic)
Fidelity Workplace
Investing
1-800-835-5092
By PC
Fidelity's web site on the Internet provides a wide range of information, including plan information, daily financial news, fund performance, interactive planning tools, and news about Fidelity products and services.
(computer_graphic)
Fidelity's Web Site
www.401k.com
* When you call the quotes line, please remember that a fund's yield and return will vary and, except for money market funds, share price will also vary. This means that you may have a gain or loss when you sell your shares. There is no assurance that money market funds will be able to maintain a stable $1 share price; an investment in a money market fund is not insured or guaranteed by the U.S. government. Total returns are historical and include changes in share price, reinvestment of dividends and capital gains distributions, and the effects of any sales charges.
Annual Report
Investment Adviser
Fidelity Management & Research Company
Boston, MA
Investment Sub-Advisers
FMR Co., Inc.
Fidelity Management & Research
(U.K.) Inc.
Fidelity Management & Research
(Hong Kong) Limited
Fidelity Management & Research
(Japan) Inc.
General Distributor
Fidelity Distributors Corporation
Boston, MA
Transfer and Service Agents
Fidelity Investments Institutional
Operations Company, Inc.
Boston, MA
Fidelity Service Company, Inc.
Boston, MA
Custodian
Citibank, N.A.
New York, NY
BCF-K-UANN-0911
1.863112.102
Fidelity®
Blue Chip Value
Fund
Annual Report
July 31, 2011
(2_fidelity_logos) (Registered_Trademark)
Contents
Chairman's Message | <Click Here> | The Chairman's message to shareholders. |
Performance | <Click Here> | How the fund has done over time. |
Management's Discussion of Fund Performance | <Click Here> | The Portfolio Manager's review of fundperformance and strategy. |
Shareholder Expense Example | <Click Here> | An example of shareholder expenses. |
Investment Changes | <Click Here> | A summary of major shifts in the fund's investments over the past 6 months. |
Investments | <Click Here> | A complete list of the fund's investments with their market values. |
Financial Statements | <Click Here> | Statements of assets and liabilities, operations, and changes in net assets, as well as financial highlights. |
Notes | <Click Here> | Notes to the financial statements. |
Report of Independent Registered Public Accounting Firm | <Click Here> | |
Trustees and Officers | <Click Here> | |
Distributions | <Click Here> | |
Board Approval of Investment Advisory Contracts and Management Fees | <Click Here> | |
To view a fund's proxy voting guidelines and proxy voting record for the 12-month period ended June 30, visit http://www.fidelity.com/proxyvotingresults or visit the Securities and Exchange Commission's (SEC) web site at http://www.sec.gov. You may also call 1-800-544-8544 to request a free copy of the proxy voting guidelines.
Standard & Poor's, S&P and S&P 500 are registered service marks of The McGraw-Hill Companies, Inc. and have been licensed for use by Fidelity Distributors Corporation.
Other third party marks appearing herein are the property of their respective owners.
All other marks appearing herein are registered or unregistered trademarks or service marks of FMR LLC or an affiliated company.
Annual Report
This report and the financial statements contained herein are submitted for the general information of the shareholders of the fund. This report is not authorized for distribution to prospective investors in the fund unless preceded or accompanied by an effective prospectus.
A fund files its complete schedule of portfolio holdings with the SEC for the first and third quarters of each fiscal year on Form N-Q. Forms N-Q are available on the SEC's web site at http://www.sec.gov. A fund's Forms N-Q may be reviewed and copied at the SEC's Public Reference Room in Washington, DC. Information regarding the operation of the SEC's Public Reference Room may be obtained by calling 1-800-SEC-0330. For a complete list of a fund's portfolio holdings, view the most recent holdings listing, semiannual report, or annual report on Fidelity's web site at http://www.fidelity.com, http://www.advisor.fidelity.com, or http://www.401k.com, as applicable.
NOT FDIC INSURED • MAY LOSE VALUE • NO BANK GUARANTEE
Neither the fund nor Fidelity Distributors Corporation is a bank.
Annual Report
(photo_of_James_C_Curvey)
Dear Shareholder:
The second half of 2011 began with U.S. equities continuing to give back some of the gains achieved earlier in the year. In the days leading up to July 31, markets were shaken by a political stalemate in which Congress struggled to address the debt ceiling issue before an early-August deadline. The resulting uncertainty held back markets in July, the third consecutive monthly decline for equities, effectively reversing the positive momentum seen through the end of April. Financial markets are always unpredictable, of course, but there are several time-tested investment principles that can help put the odds in your favor.
One of the basic tenets is to invest for the long term. Over time, riding out the markets' inevitable ups and downs has proven much more effective than selling into panic or chasing the hottest trend. Even missing only a few of the markets' best days can significantly diminish investor returns. Patience also affords the benefits of compounding - of earning interest on additional income or reinvested dividends and capital gains. There can be tax advantages and cost benefits to consider as well. While staying the course doesn't eliminate risk, it can considerably lessen the effect of short-term declines.
You can further manage your investing risk through diversification. And today, more than ever, geographic diversification should be taken into account. Studies indicate that asset allocation is the single most important determinant of a portfolio's long-term success. The right mix of stocks, bonds and cash - aligned to your particular risk tolerance and investment objective - is very important. Age-appropriate rebalancing is also an essential aspect of asset allocation. For younger investors, an emphasis on equities - which historically have been the best-performing asset class over time - is encouraged. As investors near their specific goal, such as retirement or sending a child to college, consideration may be given to replacing volatile assets (e.g. common stocks) with more-stable fixed investments (bonds or savings plans).
A third principle - investing regularly - can help lower the average cost of your purchases. Investing a certain amount of money each month or quarter helps ensure you won't pay for all your shares at market highs. This strategy - known as dollar cost averaging - also reduces "emotion" from investing, helping shareholders avoid selling weak performers just prior to an upswing, or chasing a hot performer just before a correction.
We invite you to contact us via the Internet, through our Investor Centers or by phone. It is our privilege to provide you the information you need to make the investments that are right for you.
Sincerely,
(The acting chairman's signature appears here.)
James C. Curvey
Acting Chairman
Annual Report
Average annual total return reflects the change in the value of an investment, assuming reinvestment of the fund's distributions from dividend income and capital gains (the profits earned upon the sale of securities that have grown in value, if any) and assuming a constant rate of performance each year. The $10,000 table and the fund's returns do not reflect the deduction of taxes that a shareholder would pay on fund distributions or the redemption of fund shares. During periods of reimbursement by Fidelity, a fund's total return will be greater than it would be had the reimbursement not occurred. How a fund did yesterday is no guarantee of how it will do tomorrow.
Average Annual Total Returns
Periods ended July 31, 2011 | Past 1
year | Past 5
years | Life of
fund A |
Fidelity® Blue Chip Value Fund | 12.14% | -1.91% | 3.49% |
A From June 17, 2003.
$10,000 Over Life of Fund
Let's say hypothetically that $10,000 was invested in Fidelity® Blue Chip Value Fund on June 17, 2003, when the fund started. The chart shows how the value of your investment would have changed, and also shows how the Russell 1000® Value Index performed over the same period.
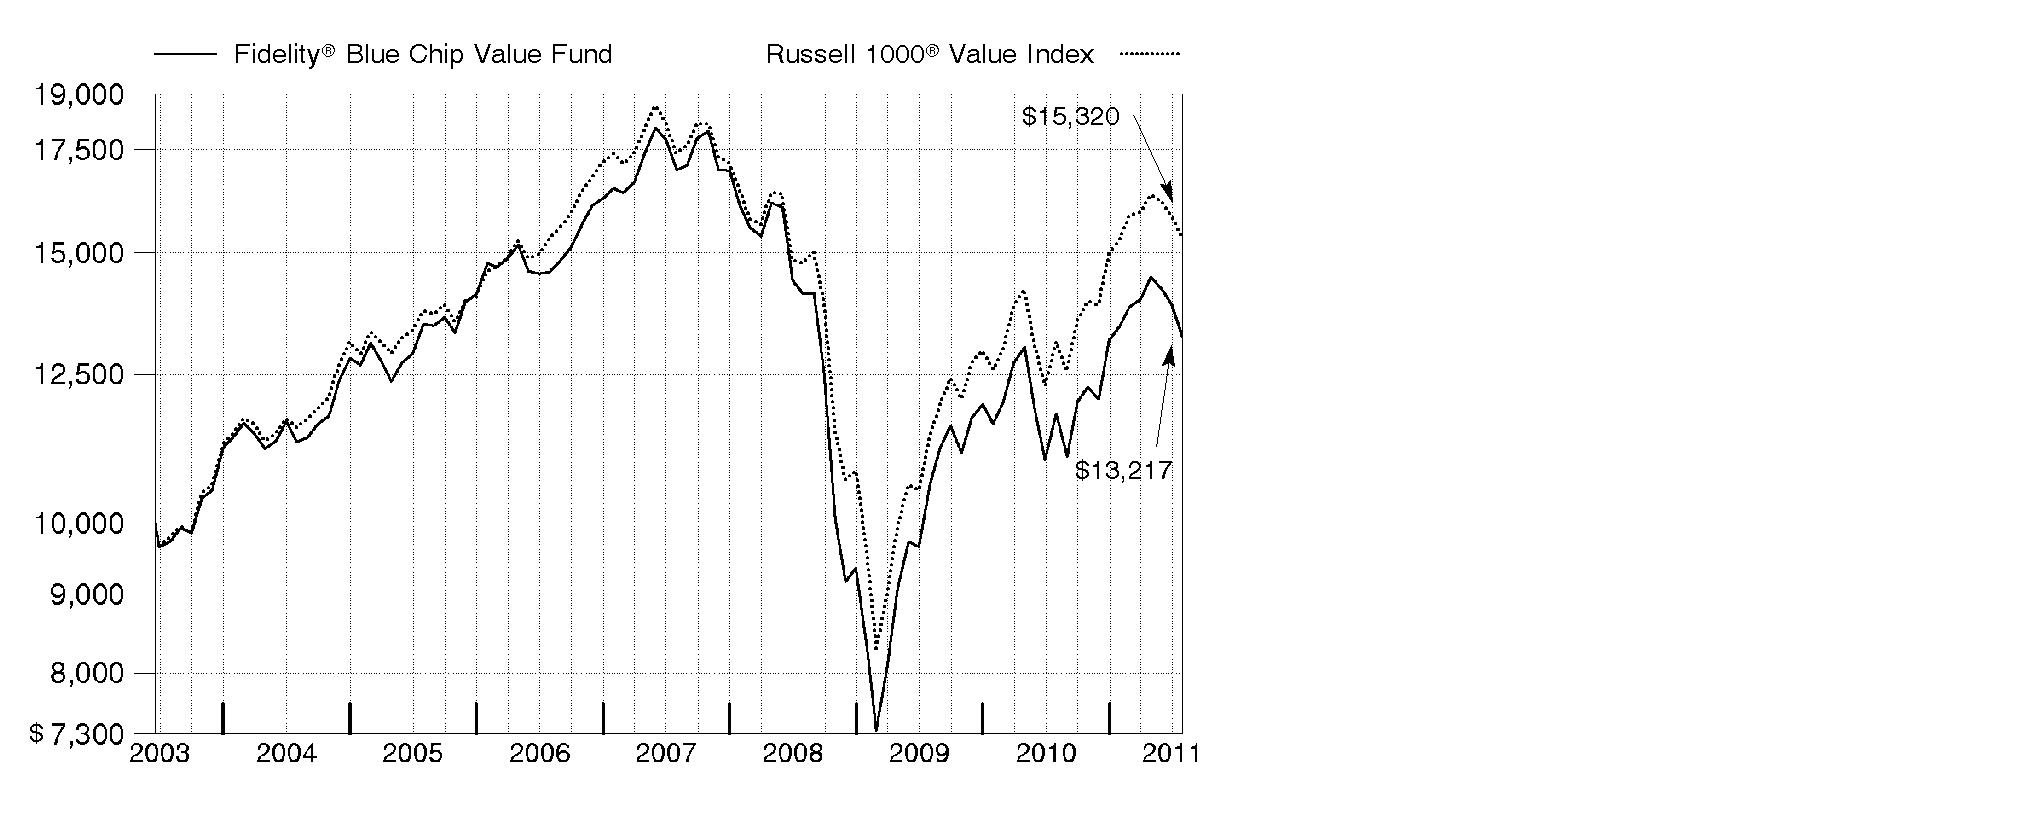
Annual Report
Market Recap: U.S. stocks registered solid double-digit gains for the 12 months ending July 31, 2011, extending a rally that began more than two years earlier. Despite a rough start in August 2010, markets turned positive in September, as increased demand for capital goods and other upbeat indicators trumped investor worry about a U.S. recessionary relapse. The broad market, as measured by the S&P 500® Index, rose 9% that month, its biggest September gain in 71 years. Seven more monthly advances followed, fueled by encouraging corporate earnings and economic activity. However, volatility picked up in the period's latter months, as markets reacted to continued high U.S. unemployment, nagging debt troubles in Europe and looming legislative battles over the federal debt ceiling. May unemployment rose above 9% for the first time in 2011, contributing to a traditional "June swoon" for stocks. Market uncertainty lingered in July, when the S&P 500® posted its second-biggest monthly loss of the period. For the full year, the S&P 500® climbed 19.65%, while the blue-chip-laden Dow Jones Industrial AverageSM rose a comparable 19.09% and the technology-heavy Nasdaq Composite® Index gained 23.40%. On the capitalization spectrum, stocks of mid-cap companies fared best, with the Russell Midcap® Index rising 24.51% and the small-cap Russell 2000® Index adding 23.92%.
Comments from Michael Chren, Portfolio Manager of Fidelity® Blue Chip Value Fund: For the year, the fund returned 12.14%, versus 16.76% for the Russell 1000® Value Index. The fund's underperformance was mainly driven by positioning in technology and financials. In tech, a sizable out-of-index stake in France-based telecommunications equipment manufacturer Alcatel-Lucent was the fund's biggest individual detractor. Positions in Hewlett-Packard and Xerox also suffered. Holdings in diversified financials hurt, with shares of Citigroup, Bank of America, JPMorgan Chase and Goldman Sachs Group all lagging. Investments in banking detracted, including stakes in Wells Fargo and a non-index position in mortgage insurer Radian Group, as did the fund's foreign holdings despite a weaker U.S. dollar. Stocks in consumer discretionary also hurt. On the positive side, positioning in consumer staples helped, including an out-of-index stake in Mexican brewer Grupo Modelo and U.S. cigarette manufacturer Lorillard. In energy, the fund saw good performance from Marathon Oil and coal producer Massey Energy, the latter of which was acquired during the period. Health care was another bright spot, led by large-cap drug companies Pfizer and Eli Lilly. Lastly, underweighting insurance-focused conglomerate Berkshire Hathaway paid off. Positioning in industrials also helped meaningfully. Some of these stocks were sold prior to period end.
The views expressed above reflect those of the portfolio manager(s) only through the end of the period as stated on the cover of this report and do not necessarily represent the views of Fidelity or any other person in the Fidelity organization. Any such views are subject to change at any time based upon market or other conditions and Fidelity disclaims any responsibility to update such views. These views may not be relied on as investment advice and, because investment decisions for a Fidelity fund are based on numerous factors, may not be relied on as an indication of trading intent on behalf of any Fidelity fund.
Annual Report
Shareholder Expense Example
As a shareholder of the Fund, you incur two types of costs: (1) transaction costs, and (2) ongoing costs, including management fees and other Fund expenses. This Example is intended to help you understand your ongoing costs (in dollars) of investing in the Fund and to compare these costs with the ongoing costs of investing in other mutual funds.
The Example is based on an investment of $1,000 invested at the beginning of the period and held for the entire period (February 1, 2011 to July 31, 2011).
Actual Expenses
The first line of the accompanying table provides information about actual account values and actual expenses. You may use the information in this line, together with the amount you invested, to estimate the expenses that you paid over the period. Simply divide your account value by $1,000.00 (for example, an $8,600 account value divided by $1,000.00 = 8.6), then multiply the result by the number in the first line under the heading entitled "Expenses Paid During Period" to estimate the expenses you paid on your account during this period. A small balance maintenance fee of $12.00 that is charged once a year may apply for certain accounts with a value of less than $2,000. This fee is not included in the table below. If it was, the estimate of expenses you paid during the period would be higher, and your ending account value lower, by this amount. In addition, the Fund, as a shareholder in the underlying Fidelity Central Funds, will indirectly bear its pro-rata share of the fees and expenses incurred by the underlying Fidelity Central Funds. These fees and expenses are not included in the Fund's annualized expense ratio used to calculate the expense estimate in the table below.
Hypothetical Example for Comparison Purposes
The second line of the accompanying table provides information about hypothetical account values and hypothetical expenses based on the Fund's actual expense ratio and an assumed rate of return of 5% per year before expenses, which is not the Fund's actual return. The hypothetical account values and expenses may not be used to estimate the actual ending account balance or expenses you paid for the period. You may use this information to compare the ongoing costs of investing in the Fund and other funds. To do so, compare this 5% hypothetical example with the 5% hypothetical examples that appear in the shareholder reports of the other funds. A small balance maintenance fee of $12.00 that is charged once a year may apply for certain accounts with a value of less than $2,000. This fee is not included in the table below. If it was, the estimate of expenses you paid during the period would be higher, and your ending account value lower, by this amount. In addition, the Fund, as a shareholder in the underlying Fidelity Central Funds, will indirectly bear its pro-rata share of the fees and expenses incurred by the underlying Fidelity Central Funds. These fees and expenses are not included in the Fund's annualized expense ratio used to calculate the expense estimate in the table below.
Please note that the expenses shown in the table are meant to highlight your ongoing costs only and do not reflect any transaction costs. Therefore, the second line of the table is useful in comparing ongoing costs only, and will not help you determine the relative total costs of owning different funds.
Annual Report
Shareholder Expense Example - continued
| Annualized Expense Ratio | Beginning
Account Value
February 1, 2011 | Ending
Account Value
July 31, 2011 | Expenses Paid
During Period*
February 1, 2011 to
July 31, 2011 |
Actual | .77% | $ 1,000.00 | $ 983.70 | $ 3.79 |
Hypothetical (5% return per year before expenses) | | $ 1,000.00 | $ 1,020.98 | $ 3.86 |
* Expenses are equal to the Fund's annualized expense ratio, multiplied by the average account value over the period, multiplied by 181/365 (to reflect the one-half year period).
Annual Report
Investment Changes (Unaudited)
Top Ten Stocks as of July 31, 2011 |
| % of fund's
net assets | % of fund's net assets
6 months ago |
Grupo Modelo SAB de CV Series C | 4.9 | 2.7 |
Citigroup, Inc. | 4.6 | 2.6 |
Garmin Ltd. | 4.3 | 2.8 |
Alcatel-Lucent SA sponsored ADR | 4.2 | 0.0 |
Pfizer, Inc. | 3.8 | 5.5 |
Goldman Sachs Group, Inc. | 3.7 | 1.4 |
Johnson & Johnson | 3.3 | 2.7 |
General Electric Co. | 3.2 | 3.5 |
Chevron Corp. | 3.0 | 2.7 |
Merck & Co., Inc. | 3.0 | 2.5 |
| 38.0 | |
Top Five Market Sectors as of July 31, 2011 |
| % of fund's
net assets | % of fund's net assets
6 months ago |
Financials | 25.8 | 22.4 |
Information Technology | 14.5 | 11.0 |
Health Care | 14.1 | 16.6 |
Energy | 12.0 | 12.3 |
Consumer Discretionary | 10.9 | 7.9 |
Asset Allocation (% of fund's net assets) |
As of July 31, 2011* | As of January 31, 2011** |
| Stocks 98.1% | | | Stocks 97.7% | |
| Short-Term
Investments and
Net Other Assets 1.9% | | | Short-Term
Investments and
Net Other Assets 2.3% | |
* Foreign investments | 24.1% | | ** Foreign investments | 22.3% | |

Annual Report
Investments July 31, 2011
Showing Percentage of Net Assets
Common Stocks - 98.1% |
| Shares | | Value |
CONSUMER DISCRETIONARY - 10.9% |
Automobiles - 0.3% |
Honda Motor Co. Ltd. | 38,200 | | $ 1,516,016 |
Household Durables - 4.3% |
D.R. Horton, Inc. | 15,656 | | 185,993 |
Garmin Ltd. (d) | 564,802 | | 18,429,489 |
| | 18,615,482 |
Media - 3.5% |
Comcast Corp. Class A (special) (non-vtg.) | 55,492 | | 1,295,183 |
Time Warner, Inc. | 115,200 | | 4,050,432 |
Washington Post Co. Class B (d) | 24,203 | | 9,736,867 |
| | 15,082,482 |
Multiline Retail - 1.9% |
JCPenney Co., Inc. | 193,321 | | 5,946,554 |
Target Corp. | 40,500 | | 2,085,345 |
| | 8,031,899 |
Specialty Retail - 0.9% |
American Eagle Outfitters, Inc. | 311,566 | | 4,093,977 |
TOTAL CONSUMER DISCRETIONARY | | 47,339,856 |
CONSUMER STAPLES - 9.6% |
Beverages - 4.9% |
Grupo Modelo SAB de CV Series C | 3,408,200 | | 21,026,031 |
Food & Staples Retailing - 1.8% |
CVS Caremark Corp. | 146,674 | | 5,331,600 |
Kroger Co. | 103,960 | | 2,585,485 |
| | 7,917,085 |
Food Products - 1.8% |
Dean Foods Co. (a) | 170,357 | | 1,877,334 |
Kraft Foods, Inc. Class A | 175,260 | | 6,025,439 |
| | 7,902,773 |
Tobacco - 1.1% |
Lorillard, Inc. | 42,777 | | 4,543,773 |
TOTAL CONSUMER STAPLES | | 41,389,662 |
ENERGY - 12.0% |
Energy Equipment & Services - 1.1% |
Transocean Ltd. (United States) | 81,815 | | 5,036,531 |
Common Stocks - continued |
| Shares | | Value |
ENERGY - continued |
Oil, Gas & Consumable Fuels - 10.9% |
Anadarko Petroleum Corp. | 63,700 | | $ 5,259,072 |
Apache Corp. | 19,300 | | 2,387,796 |
BP PLC sponsored ADR | 100,320 | | 4,558,541 |
Chevron Corp. | 126,800 | | 13,189,736 |
ConocoPhillips | 78,100 | | 5,622,419 |
Marathon Oil Corp. | 106,582 | | 3,300,845 |
Marathon Petroleum Corp. | 100,090 | | 4,382,941 |
Occidental Petroleum Corp. | 82,219 | | 8,072,261 |
Suncor Energy, Inc. | 8,200 | | 314,302 |
| | 47,087,913 |
TOTAL ENERGY | | 52,124,444 |
FINANCIALS - 25.8% |
Capital Markets - 7.2% |
Bank of New York Mellon Corp. | 177,900 | | 4,467,069 |
E*TRADE Financial Corp. (a) | 123,267 | | 1,957,480 |
Goldman Sachs Group, Inc. | 117,727 | | 15,889,613 |
Morgan Stanley | 190,878 | | 4,247,036 |
Northern Trust Corp. | 45,400 | | 2,038,687 |
State Street Corp. | 60,770 | | 2,520,132 |
| | 31,120,017 |
Commercial Banks - 5.3% |
Aozora Bank Ltd. | 1,828,000 | | 4,465,199 |
KeyCorp | 342,275 | | 2,751,891 |
Sumitomo Mitsui Financial Group, Inc. | 196,100 | | 6,170,705 |
Wells Fargo & Co. | 339,898 | | 9,496,750 |
| | 22,884,545 |
Consumer Finance - 0.7% |
Discover Financial Services | 115,081 | | 2,947,224 |
Diversified Financial Services - 8.1% |
Bank of America Corp. | 683,302 | | 6,634,862 |
Citigroup, Inc. | 512,788 | | 19,660,292 |
JPMorgan Chase & Co. | 218,016 | | 8,818,747 |
| | 35,113,901 |
Insurance - 4.3% |
Berkshire Hathaway, Inc. Class B (a) | 39,652 | | 2,940,989 |
First American Financial Corp. | 248,868 | | 3,979,399 |
Lincoln National Corp. | 39,000 | | 1,033,500 |
Common Stocks - continued |
| Shares | | Value |
FINANCIALS - continued |
Insurance - continued |
MetLife, Inc. | 170,632 | | $ 7,031,745 |
RenaissanceRe Holdings Ltd. | 22,300 | | 1,551,857 |
XL Group PLC Class A | 113,012 | | 2,319,006 |
| | 18,856,496 |
Thrifts & Mortgage Finance - 0.2% |
Radian Group, Inc. | 259,699 | | 823,246 |
TOTAL FINANCIALS | | 111,745,429 |
HEALTH CARE - 14.1% |
Biotechnology - 0.5% |
Gilead Sciences, Inc. (a) | 54,436 | | 2,305,909 |
Health Care Equipment & Supplies - 0.7% |
CareFusion Corp. (a) | 114,400 | | 3,019,016 |
Health Care Providers & Services - 1.1% |
Omnicare, Inc. | 149,079 | | 4,546,910 |
Pharmaceuticals - 11.8% |
Eli Lilly & Co. | 132,537 | | 5,076,167 |
Johnson & Johnson | 222,479 | | 14,414,414 |
Merck & Co., Inc. | 376,715 | | 12,857,283 |
Pfizer, Inc. | 857,184 | | 16,492,220 |
Sanofi-Aventis sponsored ADR | 56,500 | | 2,189,375 |
| | 51,029,459 |
TOTAL HEALTH CARE | | 60,901,294 |
INDUSTRIALS - 6.3% |
Aerospace & Defense - 1.4% |
Textron, Inc. | 82,706 | | 1,912,990 |
United Technologies Corp. | 50,500 | | 4,183,420 |
| | 6,096,410 |
Building Products - 0.3% |
Armstrong World Industries, Inc. | 30,718 | | 1,213,361 |
Construction & Engineering - 0.7% |
Jacobs Engineering Group, Inc. (a) | 75,450 | | 2,953,113 |
Electrical Equipment - 0.7% |
Alstom SA | 54,140 | | 2,859,210 |
Common Stocks - continued |
| Shares | | Value |
INDUSTRIALS - continued |
Industrial Conglomerates - 3.2% |
General Electric Co. | 779,941 | | $ 13,968,743 |
TOTAL INDUSTRIALS | | 27,090,837 |
INFORMATION TECHNOLOGY - 14.5% |
Communications Equipment - 7.4% |
Alcatel-Lucent SA sponsored ADR (a) | 4,531,560 | | 18,352,818 |
Cisco Systems, Inc. | 334,899 | | 5,348,337 |
Comverse Technology, Inc. (a) | 1,144,450 | | 8,583,375 |
| | 32,284,530 |
Computers & Peripherals - 2.4% |
Seagate Technology | 235,094 | | 3,265,456 |
Western Digital Corp. (a) | 209,298 | | 7,212,409 |
| | 10,477,865 |
Electronic Equipment & Components - 0.8% |
Corning, Inc. | 209,405 | | 3,331,634 |
Office Electronics - 1.2% |
Xerox Corp. | 548,500 | | 5,117,505 |
Semiconductors & Semiconductor Equipment - 1.7% |
Advanced Micro Devices, Inc. (a) | 986,633 | | 7,241,886 |
Software - 1.0% |
Microsoft Corp. | 157,703 | | 4,321,062 |
TOTAL INFORMATION TECHNOLOGY | | 62,774,482 |
MATERIALS - 2.9% |
Chemicals - 2.0% |
Clariant AG (Reg.) (a) | 544,277 | | 8,595,120 |
Metals & Mining - 0.9% |
Goldcorp, Inc. | 85,900 | | 4,107,987 |
TOTAL MATERIALS | | 12,703,107 |
TELECOMMUNICATION SERVICES - 1.1% |
Wireless Telecommunication Services - 1.1% |
Sprint Nextel Corp. (a) | 1,174,297 | | 4,967,276 |
Common Stocks - continued |
| Shares | | Value |
UTILITIES - 0.9% |
Electric Utilities - 0.9% |
NextEra Energy, Inc. | 69,475 | | $ 3,838,494 |
TOTAL COMMON STOCKS (Cost $452,880,547) | 424,874,881 |
Money Market Funds - 6.2% |
| | | |
Fidelity Cash Central Fund, 0.14% (b) | 10,039,020 | | 10,039,020 |
Fidelity Securities Lending Cash Central Fund, 0.15% (b)(c) | 16,871,573 | | 16,871,573 |
TOTAL MONEY MARKET FUNDS (Cost $26,910,593) | 26,910,593 |
TOTAL INVESTMENT PORTFOLIO - 104.3% (Cost $479,791,140) | | 451,785,474 |
NET OTHER ASSETS (LIABILITIES) - (4.3)% | | (18,738,781) |
NET ASSETS - 100% | $ 433,046,693 |
Legend |
(a) Non-income producing |
(b) Affiliated fund that is available only to investment companies and other accounts managed by Fidelity Investments. The rate quoted is the annualized seven-day yield of the fund at period end. A complete unaudited listing of the fund's holdings as of its most recent quarter end is available upon request. In addition, each Fidelity Central Fund's financial statements, which are not covered by the Fund's Report of Independent Registered Public Accounting Firm, are available on the SEC's website or upon request. |
(c) Investment made with cash collateral received from securities on loan. |
(d) Security or a portion of the security is on loan at period end. |
Affiliated Central Funds |
Information regarding fiscal year to date income earned by the Fund from investments in Fidelity Central Funds is as follows: |
Fund | Income earned |
Fidelity Cash Central Fund | $ 10,194 |
Fidelity Securities Lending Cash Central Fund | 295,567 |
Total | $ 305,761 |
Other Information |
The following is a summary of the inputs used, as of July 31, 2011, involving the Fund's assets and liabilities carried at fair value. The inputs or methodology used for valuing securities may not be an indication of the risk associated with investing in those securities. For more information on valuation inputs, and their aggregation into the levels used in the table below, please refer to the Security Valuation section in the accompanying Notes to Financial Statements. |
Valuation Inputs at Reporting Date: |
Description | Total | Level 1 | Level 2 | Level 3 |
Investments in Securities: | | | | |
Equities: | | | | |
Consumer Discretionary | $ 47,339,856 | $ 45,823,840 | $ 1,516,016 | $ - |
Consumer Staples | 41,389,662 | 41,389,662 | - | - |
Energy | 52,124,444 | 52,124,444 | - | - |
Financials | 111,745,429 | 105,574,724 | 6,170,705 | - |
Health Care | 60,901,294 | 60,901,294 | - | - |
Industrials | 27,090,837 | 27,090,837 | - | - |
Information Technology | 62,774,482 | 62,774,482 | - | - |
Materials | 12,703,107 | 12,703,107 | - | - |
Telecommunication Services | 4,967,276 | 4,967,276 | - | - |
Utilities | 3,838,494 | 3,838,494 | - | - |
Money Market Funds | 26,910,593 | 26,910,593 | - | - |
Total Investments in Securities: | $ 451,785,474 | $ 444,098,753 | $ 7,686,721 | $ - |
Distribution of investments by country of issue, as a percentage of total net assets, is as follows: (Unaudited) |
United States of America | 75.9% |
Switzerland | 7.4% |
France | 5.4% |
Mexico | 4.9% |
Japan | 2.7% |
Ireland | 1.2% |
United Kingdom | 1.1% |
Canada | 1.0% |
Others (Individually Less Than 1%) | 0.4% |
| 100.0% |
Income Tax Information |
At July 31, 2011, the Fund had a capital loss carryforward of approximately $132,406,877 of which $76,906,749 and $55,500,128 will expire in fiscal 2017 and 2018, respectively. Capital loss carryforwards are only available to offset future capital gains of the Fund to the extent provided by regulations and may be limited. |
See accompanying notes which are an integral part of the financial statements.
Annual Report
Statement of Assets and Liabilities
| July 31, 2011 |
Assets | | |
Investment in securities, at value (including securities loaned of $16,639,929) - See accompanying schedule: Unaffiliated issuers (cost $452,880,547) | $ 424,874,881 | |
Fidelity Central Funds (cost $26,910,593) | 26,910,593 | |
Total Investments (cost $479,791,140) | | $ 451,785,474 |
Receivable for investments sold | | 5,820,364 |
Receivable for fund shares sold | | 808,413 |
Dividends receivable | | 314,955 |
Distributions receivable from Fidelity Central Funds | | 38,972 |
Other receivables | | 32,789 |
Total assets | | 458,800,967 |
| | |
Liabilities | | |
Payable to custodian bank | $ 214 | |
Payable for investments purchased | 7,781,094 | |
Payable for fund shares redeemed | 612,914 | |
Accrued management fee | 151,721 | |
Other affiliated payables | 128,273 | |
Other payables and accrued expenses | 208,485 | |
Collateral on securities loaned, at value | 16,871,573 | |
Total liabilities | | 25,754,274 |
| | |
Net Assets | | $ 433,046,693 |
Net Assets consist of: | | |
Paid in capital | | $ 597,721,526 |
Undistributed net investment income | | 3,294,783 |
Accumulated undistributed net realized gain (loss) on investments and foreign currency transactions | | (139,802,100) |
Net unrealized appreciation (depreciation) on investments and assets and liabilities in foreign currencies | | (28,167,516) |
Net Assets, for 39,893,381 shares outstanding | | $ 433,046,693 |
Net Asset Value, offering price and redemption price per share ($433,046,693 ÷ 39,893,381 shares) | | $ 10.86 |
See accompanying notes which are an integral part of the financial statements.
Annual Report
Statement of Operations
| Year ended July 31, 2011 |
Investment Income | | |
Dividends | | $ 7,733,174 |
Interest | | 1 |
Income from Fidelity Central Funds | | 305,761 |
Total income | | 8,038,936 |
| | |
Expenses | | |
Management fee
Basic fee | $ 2,185,627 | |
Performance adjustment | (699,906) | |
Transfer agent fees | 1,174,835 | |
Accounting and security lending fees | 155,918 | |
Custodian fees and expenses | 44,919 | |
Independent trustees' compensation | 2,040 | |
Registration fees | 30,717 | |
Audit | 55,081 | |
Legal | 1,487 | |
Miscellaneous | 4,226 | |
Total expenses before reductions | 2,954,944 | |
Expense reductions | (67,650) | 2,887,294 |
Net investment income (loss) | | 5,151,642 |
Realized and Unrealized Gain (Loss) Net realized gain (loss) on: | | |
Investment securities: | | |
Unaffiliated issuers | 39,576,803 | |
Foreign currency transactions | (35,097) | |
Total net realized gain (loss) | | 39,541,706 |
Change in net unrealized appreciation (depreciation) on: Investment securities | (11,261,612) | |
Assets and liabilities in foreign currencies | (1,870) | |
Total change in net unrealized appreciation (depreciation) | | (11,263,482) |
Net gain (loss) | | 28,278,224 |
Net increase (decrease) in net assets resulting from operations | | $ 33,429,866 |
See accompanying notes which are an integral part of the financial statements.
Annual Report
Financial Statements - continued
Statement of Changes in Net Assets
| Year ended
July 31,
2011 | Year ended
July 31,
2010 |
Increase (Decrease) in Net Assets | | |
Operations | | |
Net investment income (loss) | $ 5,151,642 | $ 3,671,908 |
Net realized gain (loss) | 39,541,706 | 15,221,567 |
Change in net unrealized appreciation (depreciation) | (11,263,482) | 18,524,048 |
Net increase (decrease) in net assets resulting
from operations | 33,429,866 | 37,417,523 |
Distributions to shareholders from net investment income | (4,255,614) | (4,762,190) |
Distributions to shareholders from net realized gain | (151,971) | - |
Total distributions | (4,407,585) | (4,762,190) |
Share transactions
Proceeds from sales of shares | 201,830,415 | 59,027,300 |
Reinvestment of distributions | 4,272,411 | 4,632,338 |
Cost of shares redeemed | (126,991,551) | (104,167,012) |
Net increase (decrease) in net assets resulting from share transactions | 79,111,275 | (40,507,374) |
Total increase (decrease) in net assets | 108,133,556 | (7,852,041) |
| | |
Net Assets | | |
Beginning of period | 324,913,137 | 332,765,178 |
End of period (including undistributed net investment income of $3,294,783 and undistributed net investment income of $2,421,761, respectively) | $ 433,046,693 | $ 324,913,137 |
Other Information Shares | | |
Sold | 18,133,138 | 5,931,222 |
Issued in reinvestment of distributions | 426,327 | 479,700 |
Redeemed | (11,763,946) | (10,487,025) |
Net increase (decrease) | 6,795,519 | (4,076,103) |
See accompanying notes which are an integral part of the financial statements.
Annual Report
Financial Highlights
Years ended July 31, | 2011 | 2010 | 2009 | 2008 | 2007 |
Selected Per-Share Data | | | | | |
Net asset value, beginning of period | $ 9.82 | $ 8.95 | $ 12.15 | $ 15.46 | $ 13.95 |
Income from Investment Operations | | | | |
Net investment income (loss) B | .14 | .10 | .16 | .21 | .19 |
Net realized and unrealized gain (loss) | 1.04 | .90 | (3.17) | (2.68) | 2.05 |
Total from investment operations | 1.18 | 1.00 | (3.01) | (2.47) | 2.24 |
Distributions from net investment income | (.14) | (.13) | (.18) | (.16) | (.13) |
Distributions from net realized gain | (.01) | - | (.01) | (.68) | (.60) |
Total distributions | (.14) F | (.13) | (.19) | (.84) | (.73) |
Net asset value, end of period | $ 10.86 | $ 9.82 | $ 8.95 | $ 12.15 | $ 15.46 |
Total Return A | 12.14% | 11.20% | (24.89)% | (16.86)% | 16.60% |
Ratios to Average Net Assets C,E | | | | |
Expenses before reductions | .75% | .87% | .77% | .92% | .87% |
Expenses net of fee waivers, if any | .75% | .87% | .77% | .92% | .87% |
Expenses net of all reductions | .74% | .86% | .77% | .91% | .87% |
Net investment income (loss) | 1.31% | 1.05% | 1.87% | 1.46% | 1.25% |
Supplemental Data | | | | | |
Net assets, end of period (000 omitted) | $ 433,047 | $ 324,913 | $ 332,765 | $ 517,730 | $ 731,351 |
Portfolio turnover rate D | 141% | 59% | 69% | 61% | 92% |
A Total returns would have been lower if certain expenses had not been reduced during the applicable periods shown.
B Calculated based on average shares outstanding during the period.
C Fees and expenses of any underlying Fidelity Central Funds are not included in the Fund's expense ratio. The Fund indirectly bears its proportionate share of the expenses of any underlying Fidelity Central Funds.
D Amount does not include the portfolio activity of any underlying Fidelity Central Funds.
E Expense ratios reflect operating expenses of the Fund. Expenses before reductions do not reflect amounts reimbursed by the investment adviser or reductions from brokerage service arrangements or reductions from other expense offset arrangements and do not represent the amount paid by the Fund during periods when reimbursements or reductions occur. Expenses net of fee waivers reflect expenses after reimbursement by the investment adviser but prior to reductions from brokerage service arrangements or other expense offset arrangements. Expenses net of all reductions represent the net expenses paid by the Fund.
F Total distributions of $.14 per share is comprised of distributions from net investment income of $.135 and distributions from net realized gain of $.005 per share.
See accompanying notes which are an integral part of the financial statements.
Annual Report
Notes to Financial Statements
For the period ended July 31, 2011
1. Organization.
Fidelity Blue Chip Value Fund (the Fund) is a fund of Fidelity Securities Fund (the Trust) and is authorized to issue an unlimited number of shares. The Trust is registered under the Investment Company Act of 1940, as amended (the 1940 Act), as an open-end management investment company organized as a Massachusetts business trust.
2. Investments in Fidelity Central Funds.
The Fund invests in Fidelity Central Funds, which are open-end investment companies available only to other investment companies and accounts managed by Fidelity Management & Research Company (FMR) and its affiliates. The Fund's Schedule of Investments lists each of the Fidelity Central Funds held as of period end, if any, as an investment of the Fund, but does not include the underlying holdings of each Fidelity Central Fund. As an Investing Fund, the Fund indirectly bears its proportionate share of the expenses of the underlying Fidelity Central Funds.
The Money Market Central Funds seek preservation of capital and current income and are managed by Fidelity Investments Money Management, Inc. (FIMM), an affiliate of FMR.
A complete unaudited list of holdings for each Fidelity Central Fund is available upon request or at the Securities and Exchange Commission (the SEC) web site at www.sec.gov. In addition, the financial statements of the Fidelity Central Funds, which are not covered by the Fund's Report of Independent Registered Public Accounting Firm, are available on the SEC web site or upon request.
3. Significant Accounting Policies.
The financial statements have been prepared in conformity with accounting principles generally accepted in the United States of America (GAAP), which require management to make certain estimates and assumptions at the date of the financial statements. Actual results could differ from those estimates. Subsequent events, if any, through the date that the financial statements were issued have been evaluated in the preparation of the financial statements. The following summarizes the significant accounting policies of the Fund:
Security Valuation. Investments are valued as of 4:00 p.m. Eastern time on the last calendar day of the period. The Fund uses independent pricing services approved by the Board of Trustees to value its investments. When current market prices or quotations are not readily available or reliable, valuations may be determined in good faith in accordance with procedures adopted by the Board of Trustees. Factors used in determining value may include market or security specific events. The frequency with which these procedures are used cannot be predicted and they may be utilized to a significant extent.
Annual Report
Notes to Financial Statements - continued
3. Significant Accounting Policies - continued
Security Valuation - continued
The value used for net asset value (NAV) calculation under these procedures may differ from published prices for the same securities.
The Fund categorizes the inputs to valuation techniques used to value its investments into a disclosure hierarchy consisting of three levels as shown below:
Level 1 - quoted prices in active markets for identical investments
Level 2 - other significant observable inputs (including quoted prices for similar investments, interest rates, prepayment speeds, etc.)
Level 3 - unobservable inputs (including the Fund's own assumptions based on the best information available)
Changes in valuation techniques may result in transfers in or out of an assigned level within the disclosure hierarchy. The aggregate value of investments by input level, as of July 31, 2011, is included at the end of the Fund's Schedule of Investments. Valuation techniques used to value the Fund's investments by major category are as follows:
Equity securities, including restricted securities, for which market quotations are readily available, are valued at the last reported sale price or official closing price as reported by an independent pricing service on the primary market or exchange on which they are traded and are categorized as Level 1 in the hierarchy. In the event there were no sales during the day or closing prices are not available, securities are valued at the last quoted bid price or may be valued using the last available price and are generally categorized as Level 2 in the hierarchy. For foreign equity securities, when significant market or security specific events arise, comparisons to the valuation of American Depositary Receipts (ADRs), futures contracts, Exchange-traded funds (ETFs) and certain indexes as well as quoted prices for similar securities are used and are categorized as Level 2 in the hierarchy in these circumstances. Utilizing these techniques may result in transfers between Level 1 and Level 2. For restricted equity securities and private placements where observable inputs are limited, assumptions about market activity and risk are used and are categorized as Level 3 in the hierarchy.
Investments in open-end mutual funds, including the Fidelity Central Funds, are valued at their closing net asset value each business day and are categorized as Level 1 in the hierarchy.
Foreign Currency. The Fund may use foreign currency contracts to facilitate transactions in foreign-denominated securities. Gains and losses from these transactions may arise from changes in the value of the foreign currency or if the counterparties do not perform under the contracts' terms.
Annual Report
3. Significant Accounting Policies - continued
Foreign Currency - continued
Foreign-denominated assets, including investment securities, and liabilities are translated into U.S. dollars at the exchange rate at period end. Purchases and sales of investment securities, income and dividends received and expenses denominated in foreign currencies are translated into U.S. dollars at the exchange rate in effect on the transaction date.
The effects of exchange rate fluctuations on investments are included with the net realized and unrealized gain (loss) on investment securities. Other foreign currency transactions resulting in realized and unrealized gain (loss) are disclosed separately.
Investment Transactions and Income. For financial reporting purposes, the Fund's investment holdings and NAV include trades executed through the end of the last business day of the period. The NAV per share for processing shareholder transactions is calculated as of the close of business of the New York Stock Exchange (NYSE), normally 4:00 p.m. Eastern time and includes trades executed through the end of the prior business day. Gains and losses on securities sold are determined on the basis of identified cost and may include proceeds received from litigation. Dividend income is recorded on the ex-dividend date, except for certain dividends from foreign securities where the ex-dividend date may have passed, which are recorded as soon as the Fund is informed of the ex-dividend date. Non-cash dividends included in dividend income, if any, are recorded at the fair market value of the securities received. Distributions received on securities that represent a return of capital or capital gain are recorded as a reduction of cost of investments and/or as a realized gain. The Fund estimates the components of distributions received that may be considered return of capital distributions or capital gain distributions. Interest income and distributions from the Fidelity Central Funds are accrued as earned. Interest income includes coupon interest and amortization of premium and accretion of discount on debt securities. Investment income is recorded net of foreign taxes withheld where recovery of such taxes is uncertain.
Expenses. Expenses directly attributable to a fund are charged to that fund. Expenses attributable to more than one fund are allocated among the respective funds on the basis of relative net assets or other appropriate methods. Expense estimates are accrued in the period to which they relate and adjustments are made when actual amounts are known.
Income Tax Information and Distributions to Shareholders. Each year, the Fund intends to qualify as a regulated investment company, including distributing substantially all of its taxable income and realized gains under Subchapter M of the Internal Revenue Code and filing its U.S. federal tax return. As a result, no provision for income taxes is required. As of July 31, 2011, the Fund did not have any unrecognized tax benefits in the financial statements. A fund's federal tax return is subject to examination by the
Annual Report
Notes to Financial Statements - continued
3. Significant Accounting Policies - continued
Income Tax Information and Distributions to Shareholders - continued
Internal Revenue Service (IRS) for a period of three years. Foreign taxes are provided for based on the Fund's understanding of the tax rules and rates that exist in the foreign markets in which it invests.
Distributions are declared and recorded on the ex-dividend date. Income and capital gain distributions are determined in accordance with income tax regulations, which may differ from GAAP.
Capital accounts within the financial statements are adjusted for permanent book-tax differences. These adjustments have no impact on net assets or the results of operations. Temporary book-tax differences will reverse in a subsequent period.
Book-tax differences are primarily due to foreign currency transactions, partnerships, capital loss carryforwards and losses deferred due to wash sales.
The federal tax cost of investment securities and unrealized appreciation (depreciation) as of period end were as follows:
Gross unrealized appreciation | $ 15,400,562 |
Gross unrealized depreciation | (50,841,159) |
Net unrealized appreciation (depreciation) on securities and other investments | $ (35,440,597) |
| |
Tax Cost | $ 487,226,071 |
The tax-based components of distributable earnings as of period end were as follows:
Undistributed ordinary income | $ 3,334,491 |
Capital loss carryforward | $ (132,406,877) |
Net unrealized appreciation (depreciation) | $ (35,442,208) |
The tax character of distributions paid was as follows:
| July 31, 2011 | July 31,2010 |
Ordinary Income | $ 4,407,585 | $ 4,762,190 |
Under the recently enacted Regulated Investment Company Modernization Act of 2010 (the Act), the Fund will be permitted to carry forward capital losses incurred in taxable years beginning after December 22, 2010 for an unlimited period. However, any losses incurred during those future taxable years will be required to be utilized prior to any losses incurred in pre-enactment taxable years, which generally expire after eight years from when they are incurred. Additionally, post-enactment capital losses that are carried
Annual Report
3. Significant Accounting Policies - continued
Income Tax Information and Distributions to Shareholders - continued
forward will retain their character as either short-term or long-term capital losses rather than being considered all short-term as under previous law. The Fund's first fiscal year end subject to the Act will be July 31, 2012.
New Accounting Pronouncement. In May 2011, the Financial Accounting Standards Board issued Accounting Standard Update No. 2011-04, Fair Value Measurement (Topic 820) - Amendments to Achieve Common Fair Value Measurement and Disclosure Requirements in U.S. GAAP and IFRSs. The update changes the wording used to describe the requirements in GAAP for measuring fair value and for disclosing information about fair value measurements. The update is effective during interim and annual periods beginning after December 15, 2011. Management is currently evaluating the impact of the update's adoption on the Fund's financial statement disclosures.
4. Purchases and Sales of Investments.
Purchases and sales of securities, other than short-term securities, aggregated $619,923,331 and $545,923,444, respectively.
5. Fees and Other Transactions with Affiliates.
Management Fee. FMR and its affiliates provide the Fund with investment management related services for which the Fund pays a monthly management fee. The management fee is the sum of an individual fund fee rate that is based on an annual rate of .30% of the Fund's average net assets and a group fee rate that averaged .26% during the period. The group fee rate is based upon the average net assets of all the mutual funds advised by FMR. The group fee rate decreases as assets under management increase and increases as assets under management decrease. In addition, the management fee is subject to a performance adjustment (up to a maximum of ± .20% of the Fund's average net assets over a 36 month performance period). The upward or downward adjustment to the management fee is based on the Fund's relative investment performance as compared to an appropriate benchmark index. For the period, the total annual management fee rate, including the performance adjustment, was .38% of the Fund's average net assets.
Transfer Agent Fees. Fidelity Investments Institutional Operations Company, Inc. (FIIOC), an affiliate of FMR, is the Fund's transfer, dividend disbursing and shareholder servicing agent. FIIOC receives account fees and asset-based fees that vary according to account size and type of account. FIIOC pays for typesetting, printing and mailing of shareholder reports, except proxy statements. For the period, the transfer agent fees were equivalent to an annual rate of .30% of average net assets.
Annual Report
Notes to Financial Statements - continued
5. Fees and Other Transactions with Affiliates - continued
Accounting and Security Lending Fees. Fidelity Service Company, Inc. (FSC), an affiliate of FMR, maintains the Fund's accounting records. The accounting fee is based on the level of average net assets for the month. Under a separate contract, FSC administers the security lending program. The security lending fee is based on the number and duration of lending transactions.
Brokerage Commissions. The Fund placed a portion of its portfolio transactions with brokerage firms which are affiliates of the investment adviser. The commissions paid to these affiliated firms were $23,952 for the period.
6. Committed Line of Credit.
The Fund participates with other funds managed by FMR or an affiliate in a $4.0 billion credit facility (the "line of credit") to be utilized for temporary or emergency purposes to fund shareholder redemptions or for other short-term liquidity purposes. The Fund has agreed to pay commitment fees on its pro-rata portion of the line of credit, which amounted to $1,253 and is reflected in Miscellaneous expenses on the Statement of Operations. During the period, there were no borrowings on this line of credit.
7. Security Lending.
The Fund lends portfolio securities through a lending agent from time to time in order to earn additional income. The lending agent may loan securities to certain qualified borrowers, including Fidelity Capital Markets (FCM), a broker-dealer affiliated with the Fund. On the settlement date of the loan, the Fund receives collateral (in the form of U.S. Treasury obligations, letters of credit and/or cash) against the loaned securities and maintains collateral in an amount not less than 100% of the market value of the loaned securities during the period of the loan. The market value of the loaned securities is determined at the close of business of the Fund and any additional required collateral is delivered to the Fund on the next business day. If the borrower defaults on its obligation to return the securities loaned because of insolvency or other reasons, a fund could experience delays and costs in recovering the securities loaned or in gaining access to the collateral. Any cash collateral received is invested in the Fidelity Securities Lending Cash Central Fund. The value of loaned securities and cash collateral at period end are disclosed on the Fund's Statement of Assets and Liabilities. Security lending income represents the income earned on investing cash collateral, less rebates paid to borrowers and lending agent fees associated with the loan, plus any premium payments received for lending certain types of securities. Security lending income is presented in the Statement of Operations as a component of income from Fidelity Central Funds. Total security lending income during the period amounted to $295,567, including $19,271 from securities loaned to FCM. During the period, there were no securities loaned to FCM.
Annual Report
8. Expense Reductions.
Many of the brokers with whom FMR places trades on behalf of the Fund provided services to the Fund in addition to trade execution. These services included payments of certain expenses on behalf of the Fund totaling $67,650 for the period.
9. Other.
The Fund's organizational documents provide former and current trustees and officers with a limited indemnification against liabilities arising in connection with the performance of their duties to the Fund. In the normal course of business, the Fund may also enter into contracts that provide general indemnifications. The Fund's maximum exposure under these arrangements is unknown as this would be dependent on future claims that may be made against the Fund. The risk of material loss from such claims is considered remote.
Annual Report
To the Trustees of Fidelity Securities Fund and the Shareholders of Fidelity Blue Chip Value Fund:
In our opinion, the accompanying statement of assets and liabilities, including the schedule of investments, and the related statements of operations and of changes in net assets and the financial highlights present fairly, in all material respects, the financial position of Fidelity Blue Chip Value Fund (a fund of Fidelity Securities Fund) at July 31, 2011, the results of its operations for the year then ended, the changes in its net assets for each of the two years in the period then ended and the financial highlights for each of the five years in the period then ended, in conformity with accounting principles generally accepted in the United States of America. These financial statements and financial highlights (hereafter referred to as "financial statements") are the responsibility of the Fidelity Blue Chip Value Fund's management. Our responsibility is to express an opinion on these financial statements based on our audits. We conducted our audits of these financial statements in accordance with the standards of the Public Company Accounting Oversight Board (United States). Those standards require that we plan and perform the audit to obtain reasonable assurance about whether the financial statements are free of material misstatement. An audit includes examining, on a test basis, evidence supporting the amounts and disclosures in the financial statements, assessing the accounting principles used and significant estimates made by management, and evaluating the overall financial statement presentation. We believe that our audits, which included confirmation of securities at July 31, 2011 by correspondence with the custodian and brokers, provide a reasonable basis for our opinion.
/s/ PricewaterhouseCoopers LLP
PricewaterhouseCoopers LLP
Boston, Massachusetts
September 13, 2011
Annual Report
The Trustees, Members of the Advisory Board, and executive officers of the trust and fund, as applicable, are listed below. The Board of Trustees governs the fund and is responsible for protecting the interests of shareholders. The Trustees are experienced executives who meet periodically throughout the year to oversee the fund's activities, review contractual arrangements with companies that provide services to the fund, oversee management of the risks associated with such activities and contractual arrangements, and review the fund's performance. Except for James C. Curvey, each of the Trustees oversees 221 funds advised by FMR or an affiliate. Mr. Curvey oversees 419 funds advised by FMR or an affiliate.
The Trustees hold office without limit in time except that (a) any Trustee may resign; (b) any Trustee may be removed by written instrument, signed by at least two-thirds of the number of Trustees prior to such removal; (c) any Trustee who requests to be retired or who has become incapacitated by illness or injury may be retired by written instrument signed by a majority of the other Trustees; and (d) any Trustee may be removed at any special meeting of shareholders by a two-thirds vote of the outstanding voting securities of the trust. Each Trustee who is not an interested person (as defined in the 1940 Act) (Independent Trustee), shall retire not later than the last day of the calendar year in which his or her 75th birthday occurs. The Independent Trustees may waive this mandatory retirement age policy with respect to individual Trustees. The executive officers and Advisory Board Members hold office without limit in time, except that any officer and Advisory Board Member may resign or may be removed by a vote of a majority of the Trustees at any regular meeting or any special meeting of the Trustees. Except as indicated, each individual has held the office shown or other offices in the same company for the past five years.
Experience, Skills, Attributes, and Qualifications of the Fund's Trustees. The Governance and Nominating Committee has adopted a statement of policy that describes the experience, qualifications, attributes, and skills that are necessary and desirable for potential Independent Trustee candidates (Statement of Policy). The Board believes that each Trustee satisfied at the time he or she was initially elected or appointed a Trustee, and continues to satisfy, the standards contemplated by the Statement of Policy. The Governance and Nominating Committee also engages professional search firms to help identify potential Independent Trustee candidates who have the experience, qualifications, attributes, and skills consistent with the Statement of Policy. From time to time, additional criteria based on the composition and skills of the current Independent Trustees, as well as experience or skills that may be appropriate in light of future changes to board composition, business conditions, and regulatory or other developments, have also been considered by the professional search firms and the Governance and Nominating Committee. In addition, the Board takes into account the Trustees' commitment and participation in Board and committee meetings, as well as their leadership of standing and ad hoc committees throughout their tenure.
In determining that a particular Trustee was and continues to be qualified to serve as a Trustee, the Board has considered a variety of criteria, none of which, in isolation, was controlling. The Board believes that, collectively, the Trustees have balanced and diverse experience, qualifications, attributes, and skills, which allow the Board to operate effectively in governing the fund and protecting the interests of shareholders. Information about the specific experience, skills, attributes, and qualifications of each Trustee, which in each case led to the Board's conclusion that the Trustee should serve (or continue to serve) as a trustee of the fund, is provided below.
Annual Report
Trustees and Officers - continued
Board Structure and Oversight Function. James C. Curvey is an interested person (as defined in the 1940 Act) and currently serves as Acting Chairman. The Trustees have determined that an interested Chairman is appropriate and benefits shareholders because an interested Chairman has a personal and professional stake in the quality and continuity of services provided to the fund. Independent Trustees exercise their informed business judgment to appoint an individual of their choosing to serve as Chairman, regardless of whether the Trustee happens to be independent or a member of management. The Independent Trustees have determined that they can act independently and effectively without having an Independent Trustee serve as Chairman and that a key structural component for assuring that they are in a position to do so is for the Independent Trustees to constitute a substantial majority for the Board. The Independent Trustees also regularly meet in executive session. Ned C. Lautenbach serves as Chairman of the Independent Trustees and as such (i) acts as a liaison between the Independent Trustees and management with respect to matters important to the Independent Trustees and (ii) with management prepares agendas for Board meetings.
Fidelity funds are overseen by different Boards of Trustees. The fund's Board oversees Fidelity's equity and high income funds and another Board oversees Fidelity's investment-grade bond, money market, and asset allocation funds. The asset allocation funds may invest in Fidelity funds overseen by the fund's Board. The use of separate Boards, each with its own committee structure, allows the Trustees of each group of Fidelity funds to focus on the unique issues of the funds they oversee, including common research, investment, and operational issues. On occasion, the separate Boards establish joint committees to address issues of overlapping consequences for the Fidelity funds overseen by each Board.
The Trustees operate using a system of committees to facilitate the timely and efficient consideration of all matters of importance to the Trustees, the fund, and fund shareholders and to facilitate compliance with legal and regulatory requirements and oversight of the fund's activities and associated risks. The Board, acting through its committees, has charged FMR and its affiliates with (i) identifying events or circumstances the occurrence of which could have demonstrably adverse effects on the fund's business and/or reputation; (ii) implementing processes and controls to lessen the possibility that such events or circumstances occur or to mitigate the effects of such events or circumstances if they do occur; and (iii) creating and maintaining a system designed to evaluate continuously business and market conditions in order to facilitate the identification and implementation processes described in (i) and (ii) above. Because the day-to-day operations and activities of the fund are carried out by or through FMR, its affiliates and other service providers, the fund's exposure to risks is mitigated but not eliminated by the processes overseen by the Trustees. While each of the Board's committees has responsibility for overseeing different aspects of the fund's activities, oversight is exercised primarily through the Operations, Audit, and Compliance Committees. Appropriate personnel, including but not limited to the fund's Chief Compliance Officer (CCO), FMR's internal auditor, the independent accountants, the fund's Treasurer and portfolio management personnel, make periodic reports to the Board's committees, as appropriate. The responsibilities of each committee, including their oversight responsibilities, are described further under "Standing Committees of the Fund's Trustees."
Annual Report
The fund's Statement of Additional Information (SAI) includes more information about the Trustees. To request a free copy, call Fidelity at 1-800-544-8544.
Interested Trustees*:
Correspondence intended for each Trustee who is an interested person may be sent to Fidelity Investments, 82 Devonshire Street, Boston, Massachusetts 02109.
Name, Age; Principal Occupations and Other Relevant Experience+ |
James C. Curvey (76) |
| Year of Election or Appointment: 2007
Mr. Curvey is Trustee and Acting Chairman of the Board of Trustees of certain Trusts. Mr. Curvey also serves as Trustee (2007-present) of other investment companies advised by FMR. Mr. Curvey is a Director of Fidelity Investments Money Management, Inc. (2009-present), Director of Fidelity Research & Analysis Co. (2009-present) and Director of FMR and FMR Co., Inc. (2007-present). Mr. Curvey is also Vice Chairman (2007-present) and Director of FMR LLC. In addition, Mr. Curvey serves as an Overseer for the Boston Symphony Orchestra and a member of the Trustees of Villanova University. Previously, Mr. Curvey was the Vice Chairman (2006-2007) and Director (2000-2007) of FMR Corp. |
Ronald P. O'Hanley (54) |
| Year of Election or Appointment: 2011
Mr. O'Hanley is Director of FMR Co., Inc. (2010-present), Director of Fidelity Investments Money Management, Inc. (2010-present), Director of Fidelity Research & Analysis Company (2010-present), President of Fidelity Asset Management and Corporate Services and a member of Fidelity's Executive Committee (2010-present). Previously, Mr. O'Hanley served as President and Chief Executive Officer of BNY Mellon Asset Management (2007-2010). Mr. O'Hanley also served as Vice Chairman of Bank New York Mellon Corp. and a member of that firm's Executive Committee. Prior to the 2007 merger of The Bank of New York and Mellon Financial Corporation, he was Vice Chairman of Mellon Financial Corporation and President and Chief Executive Officer of Mellon Asset Management. He joined Mellon in February 1997. Mr. O'Hanley currently serves as Chairman of the Boston Public Library Foundation Board of Directors and sits on the Board of Directors of Beth Israel Deaconess Medical Center, the Board of Trustees of the Marine Biological Laboratory and the Advisory Board of the Maxwell School of Citizenship and Public Administration at Syracuse University. Mr. O'Hanley also chairs the Council on Asset Management for the Financial Services Roundtable and is a member of the Board of Directors of Institutional Investor's U.S. Institute. |
* Trustees have been determined to be "Interested Trustees" by virtue of, among other things, their affiliation with the trust or various entities under common control with FMR.
+ The information above includes each Trustee's principal occupation during the last five years and other information relating to the experience, attributes, and skills relevant to each Trustee's qualifications to serve as a Trustee, which led to the conclusion that each Trustee should serve as a Trustee for the fund.
Annual Report
Independent Trustees:
Correspondence intended for each Independent Trustee (that is, the Trustees other than the Interested Trustees) may be sent to Fidelity Investments, P.O. Box 55235, Boston, Massachusetts 02205-5235.
Name, Age; Principal Occupations and Other Relevant Experience+ |
Dennis J. Dirks (63) |
| Year of Election or Appointment: 2005 Prior to his retirement in May 2003, Mr. Dirks was Chief Operating Officer and a member of the Board of The Depository Trust & Clearing Corporation (DTCC). He also served as President, Chief Operating Officer, and Board member of The Depository Trust Company (DTC) and President and Board member of the National Securities Clearing Corporation (NSCC). In addition, Mr. Dirks served as Chief Executive Officer and Board member of the Government Securities Clearing Corporation, Chief Executive Officer and Board member of the Mortgage-Backed Securities Clearing Corporation, as a Trustee and a member of the Finance Committee of Manhattan College (2005-2008), and as a Trustee and a member of the Finance Committee of AHRC of Nassau County (2006-2008). Mr. Dirks is a member of the Independent Directors Council (IDC) Governing Council (2010-Present) and Board of Directors for The Brookville Center for Children's Services, Inc. (2009-present). |
Alan J. Lacy (57) |
| Year of Election or Appointment: 2008 Mr. Lacy serves as Senior Adviser (2007-present) of Oak Hill Capital Partners, L.P. (private equity). Mr. Lacy also served as Chief Executive Officer (2000-2005) and Vice Chairman (2005-2006) of Sears Holdings Corporation and Sears, Roebuck and Co. (retail). In addition, Mr. Lacy serves as a member of the Board of Directors of Dave & Buster's, Inc. (restaurant and entertainment complexes, 2010-present), The Hillman Companies, Inc. (hardware wholesalers, 2010-present), and Bristol-Myers Squibb Company (global pharmaceuticals, 2007-present). Mr. Lacy is a member of the Board of Trustees of The National Parks Conservation Association (2006-Present). Previously, Mr. Lacy served as Chairman of the Board of Trustees of the National Parks Conservation Association (2008-2011) and as a member of the Board of Directors for the Western Union Company (global money transfer, 2006-2011). |
Ned C. Lautenbach (67) |
| Year of Election or Appointment: 2000 Mr. Lautenbach is Chairman of the Independent Trustees of the Equity and High Income Funds (2006-present). Mr. Lautenbach currently serves as the Lead Director of the Eaton Corporation Board of Directors (diversified industrial, 1997-present). Mr. Lautenbach is also a member of the Board of Directors of the Philharmonic Center for the Arts in Naples, Florida (1999-present); a member of the Board of Trustees of Fairfield University (2005-present); and a member of the Council on Foreign Relations (1994-present). Previously, Mr. Lautenbach was a Partner/Advisory Partner at Clayton, Dubilier & Rice, LLC (private equity investment, 1998-2010), as well as a Director of Sony Corporation (2006-2007). |
Joseph Mauriello (66) |
| Year of Election or Appointment: 2008 Prior to his retirement in January 2006, Mr. Mauriello served in numerous senior management positions including Deputy Chairman and Chief Operating Officer (2004-2005), and Vice Chairman of Financial Services (2002-2004) of KPMG LLP US (professional services, 1965-2005). Mr. Mauriello currently serves as a member of the Board of Directors of XL Group plc. (global insurance and re-insurance, 2006-present) and of Arcadia Resources Inc. (health care services and products, 2007-present). Previously, Mr. Mauriello served as a Director of the Hamilton Funds of the Bank of New York (2006-2007). |
Robert W. Selander (60) |
| Year of Election or Appointment: 2011
Previously, Mr. Selander served as a Member of the Advisory Board of Fidelity's Equity and High Income Funds (2011), Executive Vice Chairman (2010), Chief Executive Officer (2009-2010), and President and Chief Executive Officer (1997-2009) of Mastercard, Inc. |
Cornelia M. Small (67) |
| Year of Election or Appointment: 2005 Ms. Small is a member of the Board of Directors of the Teagle Foundation (2009-present). Ms. Small is also a member of the Investment Committee, and Chair (2008-present) and a member of the Board of Trustees of Smith College. In addition, Ms. Small serves on the Investment Committee of the Berkshire Taconic Community Foundation (2008-present). Previously, Ms. Small served as Chairperson of the Investment Committee (2002-2008) of Smith College. In addition, Ms. Small served as Chief Investment Officer, Director of Global Equity Investments, and a member of the Board of Directors of Scudder, Stevens & Clark and Scudder Kemper Investments. |
William S. Stavropoulos (72) |
| Year of Election or Appointment: 2002 Mr. Stavropoulos is Vice Chairman of the Independent Trustees of the Equity and High Income Funds (2006-present). Mr. Stavropoulos serves as President and Founder of the Michigan Baseball Foundation, the Great Lakes Loons (2007-present). Mr. Stavropoulos is Chairman Emeritus of the Board of Directors of The Dow Chemical Company, where he previously served in numerous senior management positions, including President, CEO (1995-2000; 2002-2004), Chairman of the Executive Committee (2000-2006), and as a member of the Board of Directors (1990-2006). Currently, Mr. Stavropoulos is Chairman of Univar (global distributor of commodity and specialty chemicals, 2010-present), a Director of Teradata Corporation (data warehousing and technology solutions, 2008-present), Chemical Financial Corporation, Maersk Inc. (industrial conglomerate), Tyco International, Inc. (multinational manufacturing and services, 2007-present), and a member of the Advisory Board for Metalmark Capital (private equity investment, 2005-present). Mr. Stavropoulos is a special advisor to Clayton, Dubilier & Rice, LLC (private equity investment). In addition, Mr. Stavropoulos is a member of the University of Notre Dame Advisory Council for the College of Science. |
David M. Thomas (62) |
| Year of Election or Appointment: 2008 Previously, Mr. Thomas served as Executive Chairman (2005-2006) and Chairman and Chief Executive Officer (2000-2005) of IMS Health, Inc. (pharmaceutical and healthcare information solutions). In addition, Mr. Thomas serves as a member of the Board of Directors of Fortune Brands, Inc. (consumer products), and Interpublic Group of Companies, Inc. (marketing communication, 2004-present). |
Michael E. Wiley (60) |
| Year of Election or Appointment: 2008 Mr. Wiley also serves as a Director of Asia Pacific Exploration Consolidated (international oil and gas exploration and production, 2008-present). Mr. Wiley serves as a Director of Tesoro Corporation (independent oil refiner and marketer, 2005-present), and a Director of Bill Barrett Corporation (exploration and production, 2005-present). In addition, Mr. Wiley also serves as a Director of Post Oak Bank (privately-held bank, 2004-present). Previously, Mr. Wiley served as a member of the Board of Trustees of the University of Tulsa (2000-2006; 2007-2010), as a Senior Energy Advisor of Katzenbach Partners, LLC (consulting, 2006-2007), as an Advisory Director of Riverstone Holdings (private investment), Chairman, President, and CEO of Baker Hughes, Inc. (oilfield services, 2000-2004), and as Director of Spinnaker Exploration Company (exploration and production, 2001-2005). |
Annual Report
Trustees and Officers - continued
+ The information above includes each Trustee's principal occupation during the last five years and other information relating to the experience, attributes, and skills relevant to each Trustee's qualifications to serve as a Trustee, which led to the conclusion that each Trustee should serve as a Trustee for the fund.
Advisory Board Members and Executive Officers:
Correspondence intended for each executive officer, Edward C. Johnson 3d, and Peter S. Lynch may be sent to Fidelity Investments, 82 Devonshire Street, Boston, Massachusetts 02109.
Name, Age; Principal Occupation |
Edward C. Johnson 3d (81) |
| Year of Election or Appointment: 2011 Member of the Advisory Board of Fidelity's Equity and High Income Funds. Mr. Johnson serves as Chief Executive Officer, Chairman, and a Director of FMR LLC, and also serves as Chairman and Director of FIL Limited. Previously, Mr. Johnson served as a Trustee and Chairman of the Board of certain Fidelity Trusts, Chairman and a Director of FMR, Chairman and a Director of FMR Co., Inc., and President of FMR LLC (2006-2007). |
Peter S. Lynch (67) |
| Year of Election or Appointment: 2003 Member of the Advisory Board of Fidelity's Equity and High Income Funds. Mr. Lynch is Vice Chairman and a Director of FMR and FMR Co., Inc. In addition, Mr. Lynch serves as a Trustee of Boston College and as the Chairman of the Inner-City Scholarship Fund. Previously, Mr. Lynch served on the Special Olympics International Board of Directors (1997-2006). |
Kenneth B. Robins (41) |
| Year of Election or Appointment: 2008 President and Treasurer of Fidelity's Equity and High Income Funds. Mr. Robins also serves as President and Treasurer (2010-present) and Assistant Treasurer (2009-present) of other Fidelity funds and is an employee of Fidelity Investments (2004-present). Previously, Mr. Robins served as Deputy Treasurer of the Fidelity funds (2005-2008) and Treasurer and Chief Financial Officer of The North Carolina Capital Management Trust: Cash and Term Portfolios (2006-2008). |
Bruce T. Herring (45) |
| Year of Election or Appointment: 2006 Vice President of certain Equity Funds. Mr. Herring also serves as Chief Investment Officer and Director of Fidelity Management & Research (U.K.) Inc. (2010-present) and Group Chief Investments Officer of FMR. Previously, Mr. Herring served as Vice President (2005-2006) and Senior Vice President (2006-2007) of Fidelity Management & Research Company, Vice President of FMR Co., Inc. (2001-2007) and as a portfolio manager for Fidelity U.S. Equity Funds. |
Brian B. Hogan (46) |
| Year of Election or Appointment: 2009 Vice President of Equity and High Income Funds. Mr. Hogan also serves as President of FMR's Equity Division (2009-present). Previously, Mr. Hogan served as Senior Vice President, Equity Research of FMR (2006-2009) and as a portfolio manager. |
Scott C. Goebel (43) |
| Year of Election or Appointment: 2008 Secretary and Chief Legal Officer (CLO) of the Fidelity funds. Mr. Goebel also serves as Secretary of Fidelity Investments Money Management, Inc. (FIMM) (2010-present) and Fidelity Research and Analysis Company (FRAC) (2010-present); Secretary and CLO of The North Carolina Capital Management Trust: Cash and Term Portfolios (2008-present); General Counsel, Secretary, and Senior Vice President of FMR (2008-present) and FMR Co., Inc. (2008-present); employed by FMR LLC or an affiliate (2001-present); Chief Legal Officer of Fidelity Management & Research (Hong Kong) Limited (2008-present) and Assistant Secretary of Fidelity Management & Research (Japan) Inc. (2008-present), and Fidelity Management & Research (U.K.) Inc. (2008-present). Previously, Mr. Goebel served as Assistant Secretary of FIMM (2008-2010), FRAC (2008-2010), and the Funds (2007-2008) and as Vice President and Secretary of Fidelity Distributors Corporation (FDC) (2005-2007). |
William C. Coffey (42) |
| Year of Election or Appointment: 2009 Assistant Secretary of Fidelity's Equity and High Income Funds. Mr. Coffey also serves as Senior Vice President and Deputy General Counsel of FMR LLC (2010-present), and is an employee of Fidelity Investments. Previously, Mr. Coffey served as Vice President and Associate General Counsel of FMR LLC (2005-2009). |
Holly C. Laurent (57) |
| Year of Election or Appointment: 2008 Anti-Money Laundering (AML) Officer of the Fidelity funds. Ms. Laurent also serves as AML Officer of The North Carolina Capital Management Trust: Cash and Term Portfolios (2008-present) and is an employee of Fidelity Investments. Previously, Ms. Laurent was Senior Vice President and Head of Legal for Fidelity Business Services India Pvt. Ltd. (2006-2008), and Senior Vice President, Deputy General Counsel and Group Head for FMR LLC (2005-2006). |
Christine Reynolds (52) |
| Year of Election or Appointment: 2008 Chief Financial Officer of the Fidelity funds. Ms. Reynolds became President of Fidelity Pricing and Cash Management Services (FPCMS) in August 2008. Ms. Reynolds served as Chief Operating Officer of FPCMS (2007-2008). Previously, Ms. Reynolds served as President, Treasurer, and Anti-Money Laundering officer of the Fidelity funds (2004-2007). |
Kenneth A. Rathgeber (64) |
| Year of Election or Appointment: 2004 Chief Compliance Officer of Fidelity's Equity and High Income Funds. Mr. Rathgeber is Chief Compliance Officer of Fidelity Management & Research (Hong Kong) Limited (2008-present), Fidelity Management & Research (Japan) Inc. (2008-present), FMR (2005-present), FMR Co., Inc. (2005-present), Fidelity Management & Research (U.K.) Inc. (2005-present), Fidelity Research & Analysis Company (2005-present), Fidelity Investments Money Management, Inc. (2005-present), Pyramis Global Advisors, LLC (2005-present), and Strategic Advisers, Inc. (2005-present). |
Jeffrey S. Christian (49) |
| Year of Election or Appointment: 2009 Deputy Treasurer of the Fidelity funds. Mr. Christian is an employee of Fidelity Investments. Previously, Mr. Christian served as Chief Financial Officer (2008-2009) of certain Fidelity funds and Senior Vice President of Fidelity Pricing and Cash Management Services (FPCMS) (2004-2009). |
Bryan A. Mehrmann (50) |
| Year of Election or Appointment: 2005 Deputy Treasurer of the Fidelity funds. Mr. Mehrmann is an employee of Fidelity Investments. |
Adrien E. Deberghes (43) |
| Year of Election or Appointment: 2008 Deputy Treasurer of Fidelity's Equity and High Income Funds. Mr. Deberghes also serves as Assistant Treasurer of other Fidelity funds (2010-present) and is an employee of Fidelity Investments (2008-present). Previously, Mr. Deberghes served as Senior Vice President of Mutual Fund Administration at State Street Corporation (2007-2008), Senior Director of Mutual Fund Administration at Investors Bank & Trust (2005-2007), and Director of Finance for Dunkin' Brands (2000-2005). |
Stephanie J. Dorsey (42) |
| Year of Election or Appointment: 2010 Assistant Treasurer of Fidelity's Equity and High Income Funds. Ms. Dorsey also serves as Deputy Treasurer of other Fidelity funds (2008-present) and is an employee of Fidelity Investments (2008-present). Previously, Ms. Dorsey served as Treasurer (2004-2008) of the JPMorgan Mutual Funds and Vice President (2004-2008) of JPMorgan Chase Bank. |
John R. Hebble (53) |
| Year of Election or Appointment: 2009 Assistant Treasurer of Fidelity's Equity and High Income Funds. Mr. Hebble also serves as Treasurer and Chief Financial Officer of The North Carolina Capital Management Trust: Cash and Term Portfolios (2008-present), President and Treasurer of other Fidelity funds (2008-present) and is an employee of Fidelity Investments. |
Gary W. Ryan (52) |
| Year of Election or Appointment: 2005 Assistant Treasurer of the Fidelity funds. Mr. Ryan is an employee of Fidelity Investments. Previously, Mr. Ryan served as Vice President of Fund Reporting in Fidelity Pricing and Cash Management Services (FPCMS) (1999-2005). |
Jonathan Davis (43) |
| Year of Election or Appointment: 2010 Assistant Treasurer of the Fidelity funds. Mr. Davis is an employee of Fidelity Investments. Previously, Mr. Davis served as Vice President and Associate General Counsel of FMR LLC (2003-2010). |
Annual Report
The fund designates 100% of the dividends distributed during the fiscal year as qualifying for the dividends-received deduction for corporate shareholders.
The fund designates 100% of the dividends distributed during the fiscal year as amounts which may be taken into account as a dividend for the purposes of the maximum rate under section 1(h)(11) of the Internal Revenue Code.
The fund will notify shareholders in January 2012 of amounts for use in preparing 2011 income tax returns.
Annual Report
Board Approval of Investment Advisory Contracts and Management Fees
Fidelity Blue Chip Value Fund
Each year, the Board of Trustees, including the Independent Trustees (together, the Board), votes on the renewal of the management contract and sub-advisory agreements (together, the Advisory Contracts) for the fund. The Board, assisted by the advice of fund counsel and Independent Trustees' counsel, requests and considers a broad range of information relevant to the renewal of the Advisory Contracts throughout the year.
The Board meets regularly and considers at each of its meetings factors that are relevant to its annual consideration of the renewal of the fund's Advisory Contracts, including the services and support provided to the fund and its shareholders. The Board has established various standing committees, each composed of Independent Trustees with varying backgrounds, to which the Board has assigned specific subject matter responsibilities in order to enhance effective decision-making by the Board. The Board, acting directly and through its Committees, requests and receives information concerning the annual consideration of the renewal of the fund's Advisory Contracts. The Board also meets as needed to consider matters specifically related to the Board's annual consideration of the renewal of Advisory Contracts. Members of the Board may also meet with trustees of other Fidelity funds through ad hoc joint committees to discuss certain matters relevant to the Fidelity funds.
At its July 2011 meeting, the Board of Trustees, including the Independent Trustees, unanimously determined to renew the fund's Advisory Contracts. In reaching its determination, the Board considered all factors it believed relevant, including (i) the nature, extent, and quality of the services to be provided to the fund and its shareholders (including the investment performance of the fund); (ii) the competitiveness of the fund's management fee and total expense ratio; (iii) the total costs of the services to be provided by and the profits to be realized by Fidelity from its relationship with the fund; (iv) the extent to which economies of scale would be realized as the fund grows; and (v) whether fee levels reflect these economies of scale, if any, for the benefit of fund shareholders.
In considering whether to renew the Advisory Contracts for the fund, the Board reached a determination, with the assistance of fund counsel and Independent Trustees' counsel and through the exercise of its business judgment, that the renewal of the Advisory Contracts is in the best interests of the fund and its shareholders and that the compensation payable under the Advisory Contracts is fair and reasonable. The Board's decision to renew the Advisory Contracts was not based on any single factor, but rather was based on a comprehensive consideration of all the information provided to the Board at its meetings throughout the year. The Board, in reaching its determination to renew the Advisory Contracts, is aware that shareholders in the fund have a broad range of investment choices available to them, including a wide choice among mutual funds offered by Fidelity's competitors, and that the fund's shareholders, who have the opportunity to review and weigh the disclosure provided by the fund in its prospectus and other public disclosures, have chosen to invest in this fund, managed by Fidelity.
Annual Report
Board Approval of Investment Advisory Contracts and
Management Fees - continued
Nature, Extent, and Quality of Services Provided. The Board considered the staffing within the investment adviser, FMR, and the sub-advisers (together, the Investment Advisers), including the backgrounds of the fund's investment personnel and the fund's investment objective and discipline. The Independent Trustees also had discussions with senior management of Fidelity's investment operations and investment groups. The Board considered the structure of the portfolio manager compensation program and whether this structure provides appropriate incentives to act in the best interests of the fund.
Resources Dedicated to Investment Management and Support Services. The Board and the Fund Oversight and Research Committees reviewed the general qualifications and capabilities of the Investment Advisers' investment staff, including its size, education, experience, and resources, as well as the Investment Advisers' approach to recruiting, training, managing, and compensating investment personnel. The Board also noted that FMR has devoted increased resources to non-U.S. offices. The Board noted that Fidelity's analysts have extensive resources, tools and capabilities which allow them to conduct sophisticated quantitative and fundamental analysis, as well as credit analysis of issuers, counterparties and enhancers. The Board also believes that Fidelity's investment professionals have sufficient access to global information and data so as to provide competitive investment results over time, and that those professionals also have access to sophisticated tools which permit them to assess portfolio construction and risk and performance attribution characteristics continuously, as well as to transmit new information and research conclusions rapidly around the world. Additionally, in their deliberations, the Board considered the Investment Advisers' trading capabilities and resources which are an integral part of the investment management process.
Shareholder and Administrative Services. The Board considered (i) the nature, extent, quality, and cost of advisory, administrative, and shareholder services performed by the Investment Advisers and their affiliates under the Advisory Contracts and under separate agreements covering transfer agency, pricing and bookkeeping, and securities lending services for the fund; (ii) the nature and extent of the investment adviser's supervision of third party service providers, principally custodians and subcustodians; and (iii) the resources devoted to, and the record of compliance with, the fund's compliance policies and procedures. The Board also reviewed the allocation of fund brokerage, including allocations to brokers affiliated with the Investment Advisers, the use of brokerage commissions to pay fund expenses, and the use of "soft" commission dollars to pay for research services.
The Board noted that the growth of fund assets over time across the complex allows Fidelity to reinvest in the development of services designed to enhance the value or convenience of the Fidelity funds as investment vehicles. These services include 24-hour access to account information and market information through telephone representatives and over the Internet, investor education materials and asset allocation tools, and the expanded availability of Fidelity Investor Centers, with 35 new branches opening since 2010.
Annual Report
Investment in a Large Fund Family. The Board considered the benefits to shareholders of investing in a Fidelity fund, including the benefits of investing in a fund that is part of a large family of funds offering a variety of investment disciplines and providing a large variety of mutual fund investor services. The Board noted that Fidelity had taken, or had made recommendations that resulted in the Fidelity funds taking, a number of actions over the previous year that benefited particular funds, including (i) continuing to dedicate additional resources to investment research and support of the senior management team that oversees asset management; (ii) rationalizing product lines through the mergers of six funds into other funds; (iii) continuing to migrate the Freedom Funds to dedicated lower cost underlying funds; (iv) obtaining shareholder approval to broaden the investment strategies for Fidelity Consumer Finance Portfolio, Fidelity Emerging Asia Fund, and Fidelity Environment and Alternative Energy Portfolio; (v) contractually agreeing to reduce the management fees and impose other expense limitations on Spartan® 500 Index Fund and U.S. Bond Index Fund in connection with launching new institutional classes of these funds; (vi) changing the name, primary and supplemental benchmarks, and investment policies of Fidelity Global Strategies Fund to support the fund's flexible investment mandate and global orientation; and (vii) reducing the transfer agency account fee rates on certain accounts.
Investment Performance. The Board considered whether the fund has operated in accordance with its investment objective, as well as its record of compliance with its investment restrictions. It also reviewed the fund's absolute investment performance, as well as the fund's relative investment performance measured over multiple periods against (i) a broad-based securities market index, and (ii) a peer group of mutual funds deemed appropriate by Fidelity and reviewed by the Board. The following charts considered by the Board show, over the one-, three-, and five-year periods ended December 31, 2010, the fund's cumulative total returns, the cumulative total returns of a broad-based securities market index ("benchmark"), and a range of cumulative total returns of a peer group of mutual funds identified by Morningstar, Inc. as having an investment style similar to that of the fund based on underlying portfolio holdings. The box within each chart shows the 25th percentile return (bottom of box) and the 75th percentile return (top of box) of the peer group. Returns shown above the box are in the first quartile and returns shown below the box are in the fourth quartile. The percentage beaten number noted below each chart corresponds to the percentile box and represents the percentage of funds in the peer group whose performance was equal to or lower than that of the fund.
Annual Report
Board Approval of Investment Advisory Contracts and
Management Fees - continued
Fidelity Blue Chip Value Fund
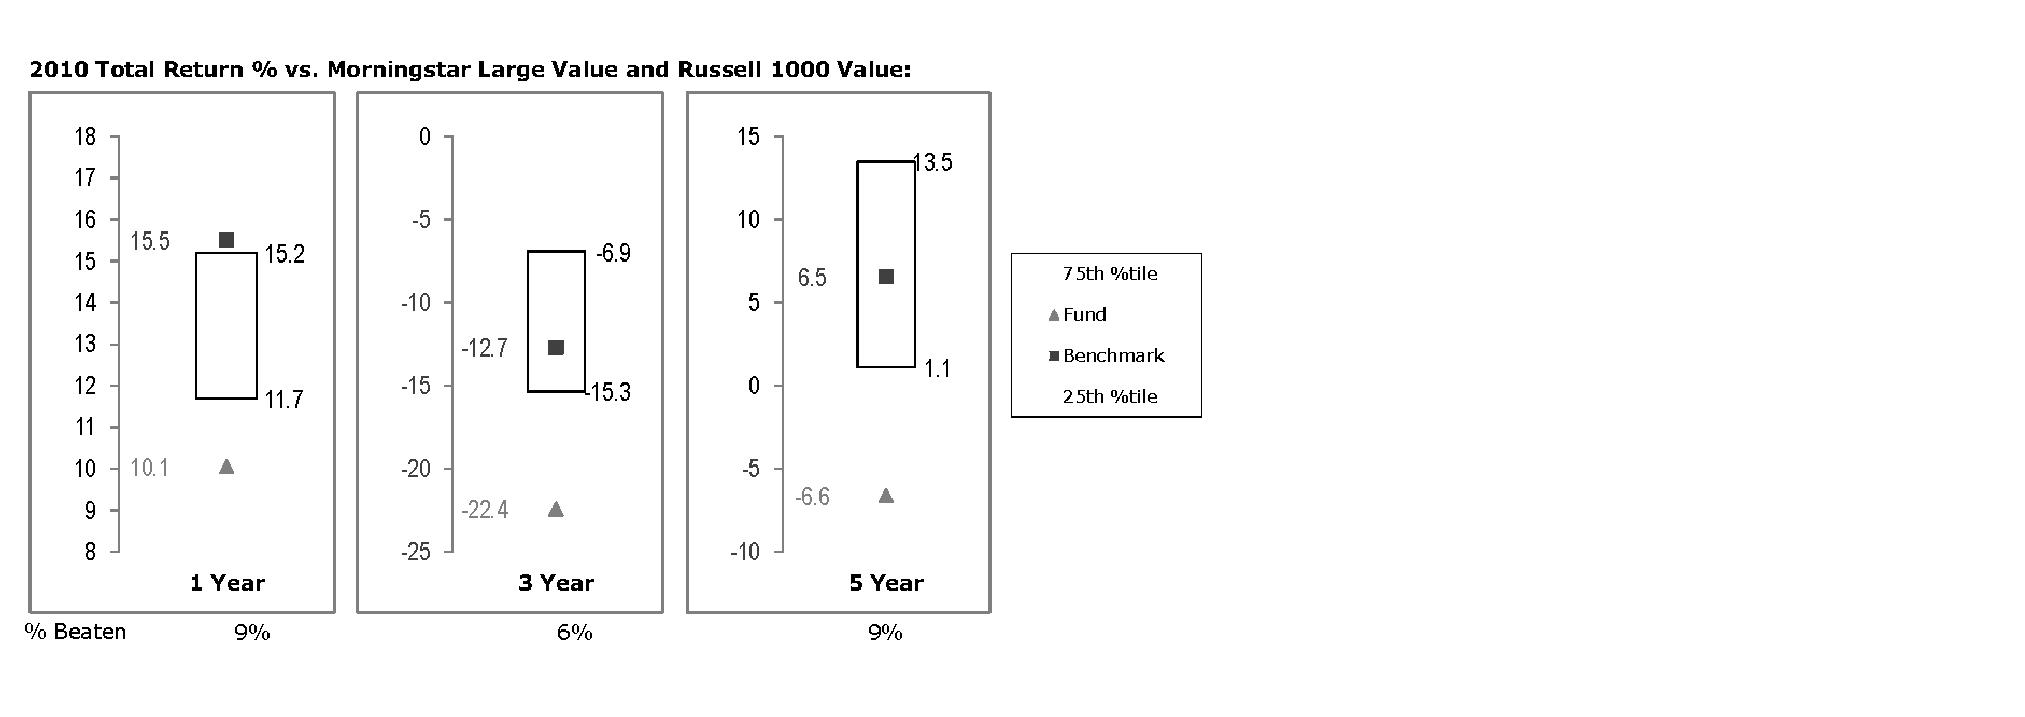
The Board reviewed the fund's relative investment performance against its peer group and noted that the performance of the fund was in the fourth quartile for all the periods shown. The Board also noted that the investment performance of the fund was lower than its benchmark for all the periods shown. The Board discussed with FMR actions that have been taken by FMR to improve the fund's disappointing performance relative to its peer group and benchmark. The Board also reviewed the fund's performance since inception as well as performance in the current year. The Board will continue to closely monitor the performance of the fund in the coming year and discuss with FMR other appropriate actions to address the performance of the fund.
The Board also considered that the fund's management fee is subject to upward or downward adjustment depending upon whether, and to what extent, the fund's investment performance for the performance period exceeds, or is exceeded by, the record (over the same period) of a Board-approved performance adjustment index. The Board noted that the performance adjustment provides FMR with a strong economic incentive to seek to achieve superior performance for the fund's shareholders and helps to more closely align the interests of FMR and the fund's shareholders.
Based on its review, the Board concluded that the nature, extent, and quality of services provided to the fund under the Advisory Contracts should benefit the fund's shareholders.
Competitiveness of Management Fee and Total Expense Ratio. The Board considered the fund's management fee and total expense ratio compared to "mapped groups" of competitive funds and classes. Fidelity creates "mapped groups" by combining similar Lipper investment objective categories that have comparable management fee characteristics. Combining Lipper investment objective categories aids the Board's management fee and total expense ratio comparisons by broadening the competitive group used for comparison and by reducing the number of universes to which various Fidelity funds are compared.
Annual Report
Management Fee. The Board considered two proprietary management fee comparisons for the 12-month periods shown in the chart below. The group of Lipper funds used by the Board for management fee comparisons is referred to below as the "Total Mapped Group." The Total Mapped Group comparison focuses on a fund's standing relative to the total universe of comparable funds available to investors in terms of gross management fees before expense reimbursements or caps, and without giving effect to the fund's performance adjustment. "TMG %" represents the percentage of funds in the Total Mapped Group that had management fees that were lower than the fund's. For example, a TMG % of 10% means that 90% of the funds in the Total Mapped Group had higher management fees than the fund. The "Asset-Size Peer Group" (ASPG) comparison focuses on a fund's standing relative to non-Fidelity funds similar in size to the fund within the Total Mapped Group. The ASPG represents at least 15% of the funds in the Total Mapped Group with comparable asset size and management fee characteristics, subject to a minimum of 50 funds (or all funds in the Total Mapped Group if fewer than 50). Additional information, such as the ASPG quartile in which the fund's management fee ranked and the impact of the fund's performance adjustment, is also included in the chart and considered by the Board.
Fidelity Blue Chip Value Fund
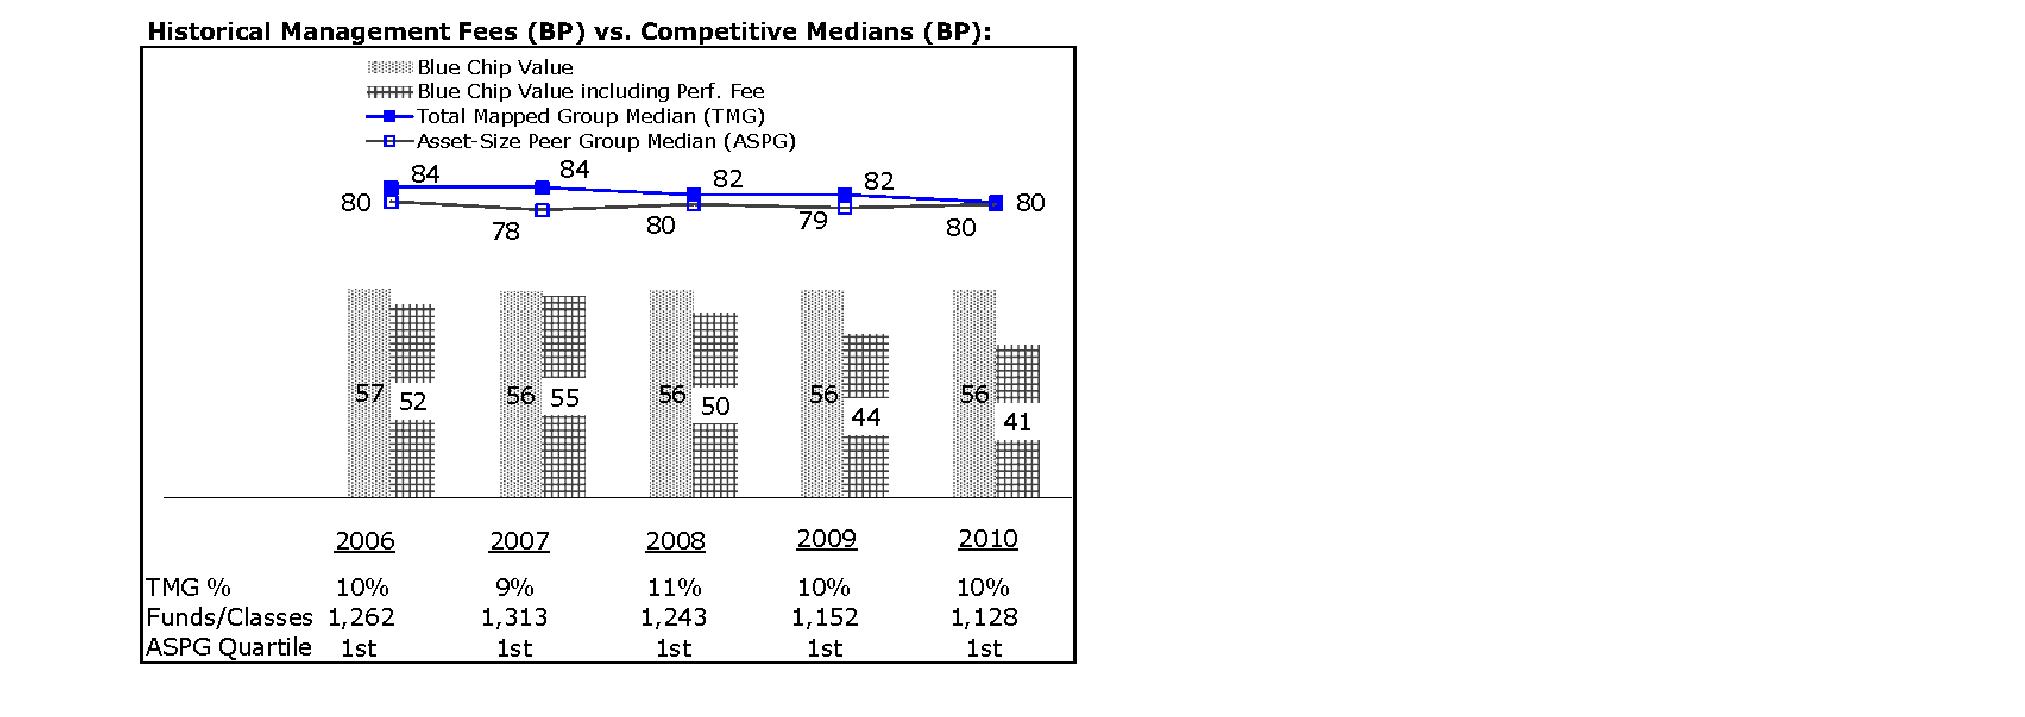
Annual Report
Board Approval of Investment Advisory Contracts and
Management Fees - continued
The Board noted that the fund's management fee ranked below the median of its Total Mapped Group and below the median of its ASPG for 2010. The Board also noted the effect of the fund's negative performance adjustment on the fund's management fee ranking. The Board noted that the performance adjustment for each year represents calculations for performance periods that differ from the periods shown in the performance charts above.
Based on its review, the Board concluded that the fund's management fee is fair and reasonable in light of the services that the fund receives and the other factors considered.
Total Expense Ratio. In its review of the fund's total expense ratio, the Board considered the fund's management fee as well as other fund expenses, such as transfer agent fees, pricing and bookkeeping fees, and custodial, legal, and audit fees. The Board also noted the effects of any waivers and reimbursements on fees and expenses, as well as the impact of the fund's performance adjustment. As part of its review, the Board also considered the current and historical total expense ratios of the fund compared to competitive fund median expenses. The fund is compared to those funds and classes in the Total Mapped Group (used by the Board for management fee comparisons) that have a similar sales load structure.
The Board noted that the fund's total expense ratio ranked below its competitive median for 2010. The Board considered that various factors, including 12b-1 fees, positive or negative performance adjustments, and relatively higher other expenses in the case of small fund size, can affect total expense ratios.
Fees Charged to Other Fidelity Clients. The Board also considered Fidelity fee structures and other information with respect to clients of FMR and its affiliates, such as other mutual funds advised or subadvised by FMR or its affiliates, pension plan clients, and other institutional clients. In March 2010, the Board created an ad hoc joint committee with the board of other Fidelity funds (the Committee) to review and compare Fidelity's institutional investment advisory business with its business of providing services to the Fidelity funds, including the differences in services provided, fees charged, and costs incurred, as well as competition in their respective marketplaces.
Based on its review of total expense ratios and fees charged to other Fidelity clients, the Board concluded that the fund's total expense ratio was reasonable in light of the services that the fund and its shareholders receive and the other factors considered, including the findings of the Committee.
Costs of the Services and Profitability. The Board considered the revenues earned and the expenses incurred by Fidelity in conducting the business of developing, marketing, distributing, managing, administering and servicing the fund and its shareholders. The Board also considered the level of Fidelity's profits in respect of all the Fidelity funds.
Annual Report
On an annual basis, FMR presents to the Board Fidelity's profitability for the fund. Fidelity calculates the profitability for each fund, as well as aggregate profitability for groups of Fidelity funds and all Fidelity funds, using a series of detailed revenue and cost allocation methodologies which originate with the books and records of Fidelity on which Fidelity's audited financial statements are based. The Audit Committee of the Board reviews any significant changes from the prior year's methodologies.
PricewaterhouseCoopers LLP (PwC), independent registered public accounting firm and auditor to Fidelity and certain Fidelity funds, has been engaged annually by the Board as part of the Board's assessment of Fidelity's profitability analysis. PwC's engagement includes the review and assessment of Fidelity's methodologies used in determining the revenues and expenses attributable to Fidelity's mutual fund business, and completion of agreed-upon procedures surrounding the mathematical accuracy of fund profitability and its conformity to allocation methodologies. After considering PwC's reports issued under the engagement and information provided by Fidelity, the Board concluded that while other allocation methods may also be reasonable, Fidelity's profitability methodologies are reasonable in all material respects.
The Board also reviewed Fidelity's non-fund businesses and fall-out benefits related to the mutual fund business as well as cases where Fidelity's affiliates may benefit from or be related to the fund's business.
The Board considered the costs of the services provided by and the profits realized by Fidelity in connection with the operation of the fund and was satisfied that the profitability was not excessive in the circumstances.
Economies of Scale. The Board considered whether there have been economies of scale in respect of the management of the Fidelity funds, whether the Fidelity funds (including the fund) have appropriately benefited from any such economies of scale, and whether there is potential for realization of any further economies of scale. The Board considered the extent to which the fund will benefit from economies of scale through increased services to the fund, through waivers or reimbursements, or through fee or expense reductions. The Board also noted that in 2009, it and the board of other Fidelity funds created an ad hoc committee (the Economies of Scale Committee) to analyze whether FMR attains economies of scale in respect of the management and servicing of the Fidelity funds, whether the Fidelity funds have appropriately benefited from such economies of scale, and whether there is potential for realization of any further economies of scale.
The Board recognized that the fund's management contract incorporates a "group fee" structure, which provides for lower group fee rates as total fund assets under FMR's management increase, and for higher group fee rates as total fund assets under FMR's management decrease. FMR calculates the group fee rates based on a tiered asset "breakpoint" schedule that varies based on asset class. The Board considered that the group fee is designed to deliver the benefits of economies of scale to fund shareholders when total Fidelity fund assets increase, even if assets of any particular fund are unchanged or have declined, because some portion of Fidelity's costs are attributable to services provided to all Fidelity funds, and all funds benefit if those costs can be allocated among more assets. The Board concluded that, given the group fee structure, fund shareholders will benefit from lower management fees as assets under FMR's management increase at the fund complex level, regardless of whether Fidelity achieves any such economies of scale.
Annual Report
Board Approval of Investment Advisory Contracts and
Management Fees - continued
The Board concluded, taking into account the analysis of the Economies of Scale Committee, that any potential economies of scale are being appropriately shared between fund shareholders and Fidelity.
Additional Information Requested by the Board. In order to develop fully the factual basis for consideration of the Fidelity funds' Advisory Contracts, the Board requested and received additional information on certain topics, including (i) fund performance trends, actions to be taken by FMR to improve certain funds' overall performance, and Fidelity's long-term strategies for certain funds; (ii) portfolio manager changes that have occurred during the past year and length of portfolio manager tenure for different categories of funds over time; (iii) Fidelity's compensation structure for portfolio managers and other key personnel and strategies for attracting and retaining non-investment personnel; (iv) the amount of the investment that each portfolio manager has made in the Fidelity fund(s) that he or she manages; (v) historical trends in Fidelity's realization of fall-out benefits; (vi) Fidelity's group fee structures and the rationale for the individual fee rates of certain funds; (vii) fund profitability methodology and the impact of certain factors on fund profitability results; (viii) trends regarding industry use of performance fee structures and Fidelity's compliance practices with respect to performance adjustment calculations; (ix) the fee structures in place for certain other Fidelity clients; and (x) explanations regarding the relative total expense ratios of certain funds and classes, total expense competitive trends, and actions that might be taken by FMR to reduce total expense ratios for certain funds and classes.
Based on its evaluation of all of the conclusions noted above, and after considering all factors it believed relevant, the Board ultimately concluded that the advisory fee structures are fair and reasonable, and that the fund's Advisory Contracts should be renewed.
Annual Report
Managing Your Investments
Fidelity offers several ways to conveniently manage your personal investments via your telephone or PC. You can access your account information, conduct trades and research your investments 24 hours a day.
By Phone
Fidelity Automated Service Telephone provides a single toll-free number to access account balances, positions, quotes and trading. It's easy to navigate the service, and on your first call, the system will help you create a personal identification number (PIN) for security.
(phone_graphic)
Fidelity Automated
Service Telephone (FAST®)
1-800-544-5555
Press
For mutual fund and brokerage trading.
For quotes.*
For account balances and holdings.
To review orders and mutual
fund activity.
To change your PIN.
To speak to a Fidelity representative.
By PC
Fidelity's web site on the Internet provides a wide range of information, including daily financial news, fund performance, interactive planning tools and news about Fidelity products and services.
(computer_graphic)
Fidelity's Web Site
www.fidelity.com
* When you call the quotes line, please remember that a fund's yield and return will vary and, except for money market funds, share price will also vary. This means that you may have a gain or loss when you sell your shares. There is no assurance that money market funds will be able to maintain a stable $1 share price; an investment in a money market fund is not insured or guaranteed by the U.S. government. Total returns are historical and include changes in share price, reinvestment of dividends and capital gains distributions, and the effects of any sales charges.
Annual Report
To Visit Fidelity
For directions and hours,
please call 1-800-544-9797.
Arizona
7001 West Ray Road
Chandler, AZ
15445 N. Scottsdale Road
Scottsdale, AZ
17550 North 75th Avenue
Glendale, AZ
5330 E. Broadway Blvd
Tucson, AZ
California
815 East Birch Street
Brea, CA
1411 Chapin Avenue
Burlingame, CA
851 East Hamilton Avenue
Campbell, CA
601 Larkspur Landing Circle
Larkspur, CA
2000 Avenue of the Stars
Los Angeles, CA
27101 Puerta Real
Mission Viejo, CA
73575 El Paseo
Palm Desert, CA
251 University Avenue
Palo Alto, CA
123 South Lake Avenue
Pasadena, CA
16656 Bernardo Ctr. Drive
Rancho Bernardo, CA
1220 Roseville Parkway
Roseville, CA
1740 Arden Way
Sacramento, CA
7676 Hazard Center Drive
San Diego, CA
11943 El Camino Real
San Diego, CA
8 Montgomery Street
San Francisco, CA
3793 State Street
Santa Barbara, CA
1200 Wilshire Boulevard
Santa Monica, CA
398 West El Camino Real
Sunnyvale, CA
111 South Westlake Blvd
Thousand Oaks, CA
21701 Hawthorne Boulevard
Torrance, CA
2001 North Main Street
Walnut Creek, CA
6326 Canoga Avenue
Woodland Hills, CA
2211 Michelson Drive
Irvine, CA
Colorado
281 East Flatiron Circle
Broomfield, CO
1625 Broadway
Denver, CO
9185 Westview Road
Lone Tree, CO
Connecticut
48 West Putnam Avenue
Greenwich, CT
265 Church Street
New Haven, CT
300 Atlantic Street
Stamford, CT
29 South Main Street
West Hartford, CT
1261 Post Road
Fairfield, CT
Delaware
400 Delaware Avenue
Wilmington, DE
Florida
175 East Altamonte Drive
Altamonte Springs, FL
1400 Glades Road
Boca Raton, FL
121 Alhambra Plaza
Coral Gables, FL
2948 N. Federal Highway
Ft. Lauderdale, FL
4671 Town Center Parkway
Jacksonville, FL
8880 Tamiami Trail, North
Naples, FL
230 Royal Palm Way
Palm Beach, FL
3501 PGA Boulevard
Palm Beach Gardens, FL
3550 Tamiami Trail, South
Sarasota, FL
1502 N. Westshore Blvd.
Tampa, FL
2465 State Road 7
Wellington, FL
Georgia
3242 Peachtree Road
Atlanta, GA
1000 Abernathy Road
Atlanta, GA
Illinois
One North LaSalle Street
Chicago, IL
401 North Michigan Avenue
Chicago, IL
One Skokie Valley Road
Highland Park, IL
1415 West 22nd Street
Oak Brook, IL
15105 S LaGrange Road
Orland Park, IL
1572 East Golf Road
Schaumburg, IL
1823 Freedom Drive
Naperville, IL
Indiana
8480 Keystone Crossing
Indianapolis, IN
Kansas
5400 College Boulevard
Overland Park, KS
Maine
Three Canal Plaza
Portland, ME
Maryland
7315 Wisconsin Avenue
Bethesda, MD
610 York Road
Towson, MD
Massachusetts
801 Boylston Street
Boston, MA
155 Congress Street
Boston, MA
300 Granite Street
Braintree, MA
44 Mall Road
Burlington, MA
238 Main Street
Cambridge, MA
200 Endicott Street
Danvers, MA
Annual Report
405 Cochituate Road
Framingham, MA
551 Boston Turnpike
Shrewsbury, MA
Michigan
500 E. Eisenhower Pkwy.
Ann Arbor, MI
280 N. Old Woodward Ave.
Birmingham, MI
30200 Northwestern Hwy.
Farmington Hills, MI
43420 Grand River Avenue
Novi, MI
3480 28th Street
Grand Rapids, MI
2425 S. Linden Road STE E
Flint, MI
Minnesota
7740 France Avenue South
Edina, MN
8342 3rd Street North
Oakdale, MN
Missouri
1524 South Lindbergh Blvd.
St. Louis, MO
Nevada
2225 Village Walk Drive
Henderson, NV
New Jersey
501 Route 73 South
Marlton, NJ
150 Essex Street
Millburn, NJ
35 Morris Street
Morristown, NJ
396 Route 17, North
Paramus, NJ
3518 Route 1 North
Princeton, NJ
530 Broad Street
Shrewsbury, NJ
New Mexico
2261 Q Street NE
Albuquerque, NM
New York
1130 Franklin Avenue
Garden City, NY
37 West Jericho Turnpike
Huntington Station, NY
1271 Avenue of the Americas
New York, NY
980 Madison Avenue
New York, NY
61 Broadway
New York, NY
350 Park Avenue
New York, NY
200 Fifth Avenue
New York, NY
733 Third Avenue
New York, NY
2070 Broadway
New York, NY
1075 Northern Blvd.
Roslyn, NY
799 Central Park Avenue
Scarsdale, NY
3349 Monroe Avenue
Rochester, NY
North Carolina
4611 Sharon Road
Charlotte, NC
7011 Fayetteville Road
Durham, NC
Ohio
3805 Edwards Road
Cincinnati, OH
1324 Polaris Parkway
Columbus, OH
1800 Crocker Road
Westlake, OH
28699 Chagrin Boulevard
Woodmere Village, OH
Oregon
7493 SW Bridgeport Road
Tigard, OR
Pennsylvania
600 West DeKalb Pike
King of Prussia, PA
1735 Market Street
Philadelphia, PA
12001 Perry Highway
Wexford, PA
Rhode Island
10 Memorial Boulevard
Providence, RI
Tennessee
3018 Peoples Street
Johnson City, TN
7628 West Farmington Blvd.
Germantown, TN
2035 Mallory Lane
Franklin, TN
Texas
10000 Research Boulevard
Austin, TX
4001 Northwest Parkway
Dallas, TX
12532 Memorial Drive
Houston, TX
2701 Drexel Drive
Houston, TX
6560 Fannin Street
Houston, TX
1701 Lake Robbins Drive
The Woodlands, TX
6500 N. MacArthur Blvd.
Irving, TX
6005 West Park Boulevard
Plano, TX
1576 East Southlake Blvd.
Southlake, TX
15600 Southwest Freeway
Sugar Land, TX
139 N. Loop 1604 East
San Antonio, TX
Utah
279 West South Temple
Salt Lake City, UT
Virginia
1861 International Drive
McLean, VA
11957 Democracy Drive
Reston, VA
Washington
10500 NE 8th Street
Bellevue, WA
1518 6th Avenue
Seattle, WA
304 Strander Blvd
Tukwila, WA
Washington, DC
1900 K Street, N.W.
Washington, DC
Wisconsin
16020 West Bluemound Road
Brookfield, WI
Fidelity Brokerage Services, Inc., 100 Summer St., Boston, MA 02110 Member NYSE/SIPC
Annual Report
To Write Fidelity
We'll give your correspondence immediate attention and send you written confirmation upon completion of your request.
(letter_graphic)
Making Changes
To Your Account
(such as changing name, address, bank, etc.)
Fidelity Investments
P.O. Box 770001
Cincinnati, OH 45277-0002
(letter_graphic)
For Non-Retirement
Accounts
Buying shares
Fidelity Investments
P.O. Box 770001
Cincinnati, OH 45277-0003
Overnight Express
Fidelity Investments
Attn: Distribution Services
100 Crosby Parkway - KC1H
Covington, KY 41015
Selling shares
Fidelity Investments
P.O. Box 770001
Cincinnati, OH 45277-0035
Overnight Express
Fidelity Investments
Attn: Distribution Services
100 Crosby Parkway - KC1H
Covington, KY 41015
General Correspondence
Fidelity Investments
P.O. Box 500
Merrimack, NH 03054-0500
(letter_graphic)
For Retirement
Accounts
Buying shares
Fidelity Investments
P.O. Box 770001
Cincinnati, OH 45277-0003
Selling shares
Fidelity Investments
P.O. Box 770001
Cincinnati, OH 45277-0035
Overnight Express
Fidelity Investments
Attn: Distribution Services
100 Crosby Parkway - KC1H
Covington, KY 41015
General Correspondence
Fidelity Investments
P.O. Box 500
Merrimack, NH 03054-0500
Annual Report
Investment Adviser
Fidelity Management & Research Company
Boston, MA
Investment Sub-Advisers
FMR Co., Inc.
Fidelity Management & Research
(U.K.) Inc.
Fidelity Management & Research
(Japan) Inc.
Fidelity Management & Research
(Hong Kong) Limited
General Distributor
Fidelity Distributors Corporation
Boston, MA
Transfer and Service Agents
Fidelity Investments Institutional
Operations Company, Inc.
Boston, MA
Fidelity Service Company, Inc.
Boston, MA
Custodian
Brown Brothers Harriman & Co.
Boston, MA
The Fidelity Telephone Connection
Mutual Fund 24-Hour Service
Exchanges/Redemptions
and Account Assistance 1-800-544-6666
Product Information 1-800-544-6666
Retirement Accounts 1-800-544-4774
(8 a.m. - 9 p.m.)
TDD Service 1-800-544-0118
for the deaf and hearing impaired
(9 a.m. - 9 p.m. Eastern time)
Fidelity Automated Service
Telephone (FAST®) 1-800-544-5555
Automated line for quickest service
BCV-UANN-0911
1.789709.108
Fidelity®
Dividend Growth
Fund
Annual Report
July 31, 2011
(2_fidelity_logos) (Registered_Trademark)
Contents
Chairman's Message | <Click Here> | The Chairman's message to shareholders. |
Performance | <Click Here> | How the fund has done over time. |
Management's Discussion of Fund Performance | <Click Here> | The Portfolio Manager's review of fund performance and strategy. |
Shareholder Expense Example | <Click Here> | An example of shareholder expenses. |
Investment Changes | <Click Here> | A summary of major shifts in the fund's investments over the past six months. |
Investments | <Click Here> | A complete list of the fund's investments with their market values. |
Financial Statements | <Click Here> | Statements of assets and liabilities, operations, and changes in net assets,
as well as financial highlights. |
Notes | <Click Here> | Notes to the financial statements. |
Report of Independent Registered Public Accounting Firm | <Click Here> | |
Trustees and Officers | <Click Here> | |
Distributions | <Click Here> | |
Board Approval of Investment Advisory Contracts and Management Fees | <Click Here> | |
To view a fund's proxy voting guidelines and proxy voting record for the 12-month period ended June 30, visit http://www.fidelity.com/proxyvotingresults or visit the Securities and Exchange Commission's (SEC) web site at http://www.sec.gov. You may also call 1-800-544-8544 to request a free copy of the proxy voting guidelines.
Standard & Poor's, S&P and S&P 500 are registered service marks of The McGraw-Hill Companies, Inc. and have been licensed for use by Fidelity Distributors Corporation.
Other third party marks appearing herein are the property of their respective owners.
All other marks appearing herein are registered or unregistered trademarks or service marks of FMR LLC or an affiliated company.
Annual Report
This report and the financial statements contained herein are submitted for the general information of the shareholders of the fund. This report is not authorized for distribution to prospective investors in the fund unless preceded or accompanied by an effective prospectus.
A fund files its complete schedule of portfolio holdings with the SEC for the first and third quarters of each fiscal year on Form N-Q. Forms N-Q are available on the SEC's web site at http://www.sec.gov. A fund's Forms N-Q may be reviewed and copied at the SEC's Public Reference Room in Washington, DC. Information regarding the operation of the SEC's Public Reference Room may be obtained by calling 1-800-SEC-0330. For a complete list of a fund's portfolio holdings, view the most recent holdings listing, semiannual report, or annual report on Fidelity's web site at http://www.fidelity.com, http://www.advisor.fidelity.com, or http://www.401k.com, as applicable.
NOT FDIC INSURED • MAY LOSE VALUE • NO BANK GUARANTEE
Neither the fund nor Fidelity Distributors Corporation is a bank.
Annual Report
(photo_of_James_C_Curvey)
Dear Shareholder:
The second half of 2011 began with U.S. equities continuing to give back some of the gains achieved earlier in the year. In the days leading up to July 31, markets were shaken by a political stalemate in which Congress struggled to address the debt ceiling issue before an early-August deadline. The resulting uncertainty held back markets in July, the third consecutive monthly decline for equities, effectively reversing the positive momentum seen through the end of April. Financial markets are always unpredictable, of course, but there are several time-tested investment principles that can help put the odds in your favor.
One of the basic tenets is to invest for the long term. Over time, riding out the markets' inevitable ups and downs has proven much more effective than selling into panic or chasing the hottest trend. Even missing only a few of the markets' best days can significantly diminish investor returns. Patience also affords the benefits of compounding - of earning interest on additional income or reinvested dividends and capital gains. There can be tax advantages and cost benefits to consider as well. While staying the course doesn't eliminate risk, it can considerably lessen the effect of short-term declines.
You can further manage your investing risk through diversification. And today, more than ever, geographic diversification should be taken into account. Studies indicate that asset allocation is the single most important determinant of a portfolio's long-term success. The right mix of stocks, bonds and cash - aligned to your particular risk tolerance and investment objective - is very important. Age-appropriate rebalancing is also an essential aspect of asset allocation. For younger investors, an emphasis on equities - which historically have been the best-performing asset class over time - is encouraged. As investors near their specific goal, such as retirement or sending a child to college, consideration may be given to replacing volatile assets (e.g. common stocks) with more-stable fixed investments (bonds or savings plans).
A third principle - investing regularly - can help lower the average cost of your purchases. Investing a certain amount of money each month or quarter helps ensure you won't pay for all your shares at market highs. This strategy - known as dollar cost averaging - also reduces "emotion" from investing, helping shareholders avoid selling weak performers just prior to an upswing, or chasing a hot performer just before a correction.
We invite you to contact us via the Internet, through our Investor Centers or by phone. It is our privilege to provide you the information you need to make the investments that are right for you.
Sincerely,
(The acting chairman's signature appears here.)
James C. Curvey
Acting Chairman
Annual Report
Average annual total return reflects the change in the value of an investment, assuming reinvestment of the class' distributions from dividend income and capital gains (the profits earned upon the sale of securities that have grown in value, if any) and assuming a constant rate of performance each year. The $10,000 table and the fund's returns do not reflect the deduction of taxes that a shareholder would pay on fund distributions or the redemption of fund shares. During periods of reimbursement by Fidelity, a fund's total return will be greater than it would be had the reimbursement not occurred. How a fund did yesterday is no guarantee of how it will do tomorrow.
Average Annual Total Returns
Periods ended July 31, 2011 | Past 1
year | Past 5
years | Past 10
years |
Fidelity® Dividend Growth Fund | 22.57% | 3.77% | 2.54% |
$10,000 Over 10 Years
Let's say hypothetically that $10,000 was invested in Fidelity® Dividend Growth Fund, a class of the fund, on July 31, 2001. The chart shows how the value of your investment would have changed, and also shows how the S&P 500® Index performed over the same period.

Annual Report
Market Recap: U.S. stocks registered solid double-digit gains for the 12 months ending July 31, 2011, extending a rally that began more than two years earlier. Despite a rough start in August 2010, markets turned positive in September, as increased demand for capital goods and other upbeat indicators trumped investor worry about a U.S. recessionary relapse. The broad market, as measured by the S&P 500® Index, rose 9% that month, its biggest September gain in 71 years. Seven more monthly advances followed, fueled by encouraging corporate earnings and economic activity. However, volatility picked up in the period's latter months, as markets reacted to continued high U.S. unemployment, nagging debt troubles in Europe and looming legislative battles over the federal debt ceiling. May unemployment rose above 9% for the first time in 2011, contributing to a traditional "June swoon" for stocks. Market uncertainty lingered in July, when the S&P 500® posted its second-biggest monthly loss of the period. For the full year, the S&P 500® climbed 19.65%, while the blue-chip-laden Dow Jones Industrial AverageSM rose a comparable 19.09% and the technology-heavy Nasdaq Composite® Index gained 23.40%. On the capitalization spectrum, stocks of mid-cap companies fared best, with the Russell Midcap® Index rising 24.51% and the small-cap Russell 2000® Index adding 23.92%.
Comments from Lawrence Rakers, Portfolio Manager of Fidelity® Dividend Growth Fund: For the year, the fund's Retail Class shares returned 22.57%, topping the S&P 500. Stock selection in health care, industrials and technology aided performance. From a market-capitalization perspective, investments in the mid- and small-cap segments helped. The fund's foreign exposure lifted overall performance, aided in part by a weaker U.S. dollar. The top relative contributor was Atmel, which makes semiconductors that support various touch-screen applications. Strong consumer demand for smartphones and tablet computers enabled our holdings in the stock to gain more than 186%. Other contributors included drilling rig provider National Oilwell Varco and specialty chemicals manufacturer W.R. Grace. Underweighting two lagging index components, Bank of America and insurance-focused conglomerate Berkshire Hathaway, also helped. Atmel and W.R. Grace were not in the index, and the fund did not hold Atmel or Bank of America at period end. The only significant negative sector influence was consumer discretionary, fueled mainly by poor picks in retailing. In terms of individual detractors, the fund was hurt by underweighting or not owning some strong-performing index components, including energy majors Exxon Mobil and Chevron, technology services heavyweight International Business Machines and Internet retailer Amazon.com.
The views expressed above reflect those of the portfolio manager(s) only through the end of the period as stated on the cover of this report and do not necessarily represent the views of Fidelity or any other person in the Fidelity organization. Any such views are subject to change at any time based upon market or other conditions and Fidelity disclaims any responsibility to update such views. These views may not be relied on as investment advice and, because investment decisions for a Fidelity fund are based on numerous factors, may not be relied on as an indication of trading intent on behalf of any Fidelity fund.
Annual Report
Shareholder Expense Example
As a shareholder of the Fund, you incur two types of costs: (1) transaction costs, and (2) ongoing costs, including management fees and other Fund expenses. This Example is intended to help you understand your ongoing costs (in dollars) of investing in the Fund and to compare these costs with the ongoing costs of investing in other mutual funds.
The Example is based on an investment of $1,000 invested at the beginning of the period and held for the entire period (February 1, 2011 to July 31, 2011).
Actual Expenses
The first line of the accompanying table for each class of the Fund provides information about actual account values and actual expenses. You may use the information in this line, together with the amount you invested, to estimate the expenses that you paid over the period. Simply divide your account value by $1,000.00 (for example, an $8,600 account value divided by $1,000.00 = 8.6), then multiply the result by the number in the first line for a class of the Fund under the heading entitled "Expenses Paid During Period" to estimate the expenses you paid on your account during this period. A small balance maintenance fee of $12.00 that is charged once a year may apply for certain accounts with a value of less than $2,000. This fee is not included in the table below. If it was, the estimate of expenses you paid during the period would be higher, and your ending account value lower, by this amount. In addition, the Fund, as a shareholder in the underlying Fidelity Central Funds, will indirectly bear its pro-rata share of the fees and expenses incurred by the underlying Fidelity Central Funds. These fees and expenses are not included in the Fund's annualized expense ratio used to calculate the expense estimate in the table below.
Hypothetical Example for Comparison Purposes
The second line of the accompanying table for each class of the Fund provides information about hypothetical account values and hypothetical expenses based on a Class' actual expense ratio and an assumed rate of return of 5% per year before expenses, which is not the Class' actual return. The hypothetical account values and expenses may not be used to estimate the actual ending account balance or expenses you paid for the period. You may use this information to compare the ongoing costs of investing in the Fund and other funds. To do so, compare this 5% hypothetical example with the 5% hypothetical examples that appear in the shareholder reports of the other funds. A small balance maintenance fee of $12.00 that is charged once a year may apply for certain accounts with a value of less than $2,000. This fee is not included in the table below. If it was, the estimate of expenses you paid during the period would be higher, and your ending account value lower, by this amount. In addition, the Fund, as a shareholder in the underlying Fidelity Central Funds, will indirectly bear its pro-rata share of the fees and expenses incurred by the underlying Fidelity Central Funds. These fees and expenses are not included in the Fund's annualized expense ratio used to calculate the expense estimate in the table below.
Please note that the expenses shown in the table are meant to highlight your ongoing costs only and do not reflect any transaction costs. Therefore, the second line of the table is useful in comparing ongoing costs only, and will not help you determine the relative total costs of owning different funds.
Annual Report
Shareholder Expense Example - continued
| Annualized Expense Ratio | Beginning
Account Value
February 1, 2011 | Ending
Account Value
July 31, 2011 | Expenses Paid
During Period*
February 1, 2011
to July 31, 2011 |
Dividend Growth | .93% | | | |
Actual | | $ 1,000.00 | $ 993.80 | $ 4.60 |
HypotheticalA | | $ 1,000.00 | $ 1,020.18 | $ 4.66 |
Class K | .78% | | | |
Actual | | $ 1,000.00 | $ 994.90 | $ 3.86 |
HypotheticalA | | $ 1,000.00 | $ 1,020.93 | $ 3.91 |
A 5% return per year before expenses
* Expenses are equal to each Class' annualized expense ratio, multiplied by the average account value over the period, multiplied by 181/365 (to reflect the one-half year period).
Annual Report
Investment Changes (Unaudited)
Top Ten Stocks as of July 31, 2011 |
| % of fund's
net assets | % of fund's net assets
6 months ago |
Apple, Inc. | 3.1 | 2.7 |
Wells Fargo & Co. | 1.5 | 1.8 |
Citigroup, Inc. | 1.4 | 1.6 |
JPMorgan Chase & Co. | 1.4 | 1.6 |
The Coca-Cola Co. | 1.4 | 1.3 |
General Electric Co. | 1.3 | 1.3 |
Procter & Gamble Co. | 1.1 | 0.7 |
Philip Morris International, Inc. | 1.1 | 0.8 |
Oracle Corp. | 1.0 | 0.9 |
Exxon Mobil Corp. | 0.9 | 0.3 |
| 14.2 | |
Top Five Market Sectors as of July 31, 2011 |
| % of fund's
net assets | % of fund's net assets
6 months ago |
Information Technology | 16.4 | 17.3 |
Industrials | 14.5 | 14.5 |
Financials | 14.0 | 15.8 |
Energy | 13.7 | 12.2 |
Consumer Discretionary | 11.0 | 10.7 |
Asset Allocation (% of fund's net assets) |
As of July 31, 2011 * | As of January 31, 2011 ** |
| Stocks and Investment Companies 99.0% | | | Stocks and Investment Companies 97.8% | |
| Convertible
Securities 0.7% | | | Convertible
Securities 1.1% | |
| Short-Term
Investments and
Net Other Assets 0.3% | | | Short-Term
Investments and
Net Other Assets 1.1% | |
* Foreign investments | 20.8% | | ** Foreign investments | 19.6% | |

Annual Report
Investments July 31, 2011
Showing Percentage of Net Assets
Common Stocks - 98.6% |
| Shares | | Value (000s) |
CONSUMER DISCRETIONARY - 10.6% |
Auto Components - 0.5% |
Autoliv, Inc. | 32,700 | | $ 2,163 |
Minth Group Ltd. | 4,178,000 | | 6,712 |
Modine Manufacturing Co. (a) | 659,005 | | 9,826 |
Tenneco, Inc. (a) | 449,723 | | 17,962 |
TRW Automotive Holdings Corp. (a) | 187,287 | | 9,452 |
| | 46,115 |
Automobiles - 0.4% |
Bajaj Auto Ltd. | 20,403 | | 678 |
Harley-Davidson, Inc. | 307,705 | | 13,351 |
Honda Motor Co. Ltd. | 151,500 | | 6,012 |
Thor Industries, Inc. | 16,300 | | 403 |
Winnebago Industries, Inc. (a)(d) | 1,869,336 | | 15,684 |
| | 36,128 |
Distributors - 0.1% |
Silver Base Group Holdings Ltd. | 11,002,000 | | 10,079 |
Diversified Consumer Services - 0.6% |
Anhanguera Educacional Participacoes SA | 61,200 | | 1,187 |
DeVry, Inc. | 206,485 | | 12,831 |
Grand Canyon Education, Inc. (a) | 555,923 | | 8,556 |
Service Corp. International | 1,072,000 | | 11,224 |
Stewart Enterprises, Inc. Class A | 1,785,724 | | 12,411 |
Weight Watchers International, Inc. | 123,500 | | 9,533 |
| | 55,742 |
Hotels, Restaurants & Leisure - 2.0% |
Accor SA | 314,961 | | 13,925 |
Ajisen (China) Holdings Ltd. | 1,876,000 | | 3,692 |
Bravo Brio Restaurant Group, Inc. | 482,615 | | 10,786 |
Brinker International, Inc. | 1,096,707 | | 26,343 |
Club Mediterranee SA (a) | 609,547 | | 14,477 |
Denny's Corp. (a) | 2,354,503 | | 8,971 |
DineEquity, Inc. (a)(d) | 462,765 | | 24,110 |
McDonald's Corp. | 262,259 | | 22,680 |
NH Hoteles SA (a) | 613,573 | | 3,861 |
O'Charleys, Inc. (a)(e) | 1,502,425 | | 9,150 |
Sands China Ltd. (a) | 3,935,600 | | 11,841 |
Spur Corp. Ltd. | 2,155,450 | | 4,484 |
Starbucks Corp. | 139,130 | | 5,578 |
Common Stocks - continued |
| Shares | | Value (000s) |
CONSUMER DISCRETIONARY - continued |
Hotels, Restaurants & Leisure - continued |
WMS Industries, Inc. (a) | 977,143 | | $ 26,940 |
Wyndham Worldwide Corp. | 270,833 | | 9,368 |
| | 196,206 |
Household Durables - 0.4% |
Dorel Industries, Inc. Class B (sub. vtg.) | 248,500 | | 7,280 |
Garmin Ltd. (d) | 267,668 | | 8,734 |
Lennar Corp. Class A | 109,500 | | 1,937 |
Newell Rubbermaid, Inc. | 692,167 | | 10,742 |
Standard Pacific Corp. (a)(d) | 2,610,820 | | 7,467 |
Techtronic Industries Co. Ltd. | 7,675,000 | | 8,016 |
| | 44,176 |
Internet & Catalog Retail - 0.0% |
Liberty Media Corp. Interactive Series A (a) | 102,000 | | 1,674 |
Leisure Equipment & Products - 0.1% |
Giant Manufacturing Co. Ltd. | 429,000 | | 1,716 |
Hasbro, Inc. | 261,601 | | 10,349 |
Summer Infant, Inc. (a) | 231,730 | | 1,995 |
| | 14,060 |
Media - 2.6% |
Antena 3 Television SA | 285,600 | | 2,273 |
Comcast Corp.: | | | |
Class A | 51,870 | | 1,246 |
Class A (special) (non-vtg.) | 2,514,015 | | 58,677 |
Dentsu, Inc. | 201,300 | | 6,298 |
DISH Network Corp. Class A (a) | 474,345 | | 14,055 |
Havas SA (d) | 474,651 | | 2,230 |
JC Decaux SA (a) | 57,200 | | 1,580 |
Kabel Deutschland Holding AG (a) | 168,900 | | 9,529 |
MDC Partners, Inc. Class A (sub. vtg.) | 1,194,639 | | 23,857 |
Mood Media Corp. | 1,083,500 | | 3,504 |
Mood Media Corp. (g) | 2,002,900 | | 6,478 |
The Walt Disney Co. | 1,283,625 | | 49,574 |
Time Warner Cable, Inc. | 260,956 | | 19,131 |
Time Warner, Inc. | 1,335,749 | | 46,965 |
Valassis Communications, Inc. (a) | 411,984 | | 11,041 |
| | 256,438 |
Multiline Retail - 0.9% |
Maoye International Holdings Ltd. | 22,874,000 | | 10,918 |
Marisa Lojas SA | 747,600 | | 10,506 |
Common Stocks - continued |
| Shares | | Value (000s) |
CONSUMER DISCRETIONARY - continued |
Multiline Retail - continued |
PPR SA | 76,800 | | $ 14,235 |
Target Corp. | 1,026,921 | | 52,876 |
| | 88,535 |
Specialty Retail - 2.5% |
Advance Auto Parts, Inc. | 466,900 | | 25,665 |
American Eagle Outfitters, Inc. | 448,713 | | 5,896 |
Asbury Automotive Group, Inc. (a) | 479,969 | | 10,334 |
Best Buy Co., Inc. | 364,842 | | 10,070 |
Big 5 Sporting Goods Corp. | 455,600 | | 3,759 |
Carphone Warehouse Group PLC | 1,419,949 | | 9,621 |
Casual Male Retail Group, Inc. (a) | 1,897,014 | | 7,986 |
Citi Trends, Inc. (a) | 274,100 | | 3,846 |
DSW, Inc. Class A (a) | 69,379 | | 3,676 |
Fast Retailing Co. Ltd. | 36,800 | | 6,541 |
Foot Locker, Inc. | 712,327 | | 15,479 |
Foschini Ltd. | 1,061,804 | | 13,967 |
GOME Electrical Appliances Holdings Ltd. | 6,022,000 | | 2,843 |
Guess?, Inc. | 253,409 | | 9,660 |
Hengdeli Holdings Ltd. | 18,822,000 | | 9,346 |
Home Depot, Inc. | 338,968 | | 11,840 |
Limited Brands, Inc. | 124,700 | | 4,721 |
Lowe's Companies, Inc. | 2,009,712 | | 43,370 |
Lumber Liquidators Holdings, Inc. (a)(d) | 403,619 | | 6,341 |
MarineMax, Inc. (a) | 776,868 | | 7,139 |
Office Depot, Inc. (a) | 122,608 | | 463 |
OfficeMax, Inc. (a) | 1,209,322 | | 8,562 |
SuperGroup PLC (a) | 576,787 | | 10,084 |
Urban Outfitters, Inc. (a) | 544,268 | | 17,710 |
| | 248,919 |
Textiles, Apparel & Luxury Goods - 0.5% |
Bosideng International Holdings Ltd. | 21,804,000 | | 6,407 |
G-III Apparel Group Ltd. (a) | 441,792 | | 13,638 |
Peak Sport Products Co. Ltd. | 4,855,000 | | 2,822 |
PVH Corp. | 296,663 | | 21,226 |
VF Corp. | 81,636 | | 9,535 |
| | 53,628 |
TOTAL CONSUMER DISCRETIONARY | | 1,051,700 |
Common Stocks - continued |
| Shares | | Value (000s) |
CONSUMER STAPLES - 8.9% |
Beverages - 2.4% |
Anheuser-Busch InBev SA NV | 302,047 | | $ 17,384 |
Britvic PLC | 1,710,164 | | 9,851 |
Carlsberg A/S Series B | 155,800 | | 15,324 |
Dr Pepper Snapple Group, Inc. | 441,360 | | 16,666 |
Grupo Modelo SAB de CV Series C | 2,577,900 | | 15,904 |
PepsiCo, Inc. | 458,223 | | 29,345 |
The Coca-Cola Co. | 2,019,741 | | 137,363 |
| | 241,837 |
Food & Staples Retailing - 1.5% |
Casey's General Stores, Inc. | 231,842 | | 10,433 |
CVS Caremark Corp. | 2,026,938 | | 73,679 |
Droga Raia SA | 345,600 | | 6,405 |
Eurocash SA | 443,959 | | 4,340 |
Kroger Co. | 250,835 | | 6,238 |
Susser Holdings Corp. (a) | 629,230 | | 10,263 |
Sysco Corp. | 93,955 | | 2,874 |
Walgreen Co. | 988,918 | | 38,607 |
| | 152,839 |
Food Products - 1.7% |
Archer Daniels Midland Co. | 669,479 | | 20,339 |
Calavo Growers, Inc. | 499,533 | | 10,325 |
Calbee, Inc. | 57,200 | | 2,408 |
Danone | 183,800 | | 13,152 |
Flowers Foods, Inc. (d) | 459,918 | | 10,081 |
Green Mountain Coffee Roasters, Inc. (a) | 312,600 | | 32,495 |
Kraft Foods, Inc. Class A | 1,263,241 | | 43,430 |
Orion Corp. | 2,040 | | 991 |
Sara Lee Corp. | 798,146 | | 15,253 |
Shenguan Holdings Group Ltd. | 4,564,000 | | 2,922 |
TreeHouse Foods, Inc. (a) | 282,074 | | 14,566 |
| | 165,962 |
Household Products - 1.4% |
Colgate-Palmolive Co. | 43,230 | | 3,648 |
Procter & Gamble Co. | 1,766,302 | | 108,610 |
Spectrum Brands Holdings, Inc. (a) | 411,959 | | 10,999 |
Unicharm Corp. | 314,800 | | 14,234 |
Youyuan International Holdings Ltd. (a) | 8,394,000 | | 3,877 |
| | 141,368 |
Common Stocks - continued |
| Shares | | Value (000s) |
CONSUMER STAPLES - continued |
Personal Products - 0.2% |
BaWang International (Group) Holding Ltd. | 10,702,000 | | $ 1,758 |
Biostime International Holdings Ltd. | 1,186,500 | | 2,597 |
Estee Lauder Companies, Inc. Class A | 111,635 | | 11,712 |
Hengan International Group Co. Ltd. | 825,000 | | 7,172 |
| | 23,239 |
Tobacco - 1.7% |
Altria Group, Inc. | 1,202,848 | | 31,635 |
British American Tobacco PLC (United Kingdom) | 241,000 | | 11,126 |
Imperial Tobacco Group PLC | 389,210 | | 13,526 |
KT&G Corp. | 34,272 | | 2,132 |
Philip Morris International, Inc. | 1,496,319 | | 106,493 |
| | 164,912 |
TOTAL CONSUMER STAPLES | | 890,157 |
ENERGY - 13.7% |
Energy Equipment & Services - 4.7% |
Aker Drilling ASA (a) | 1,191,860 | | 3,630 |
Aker Solutions ASA | 1,398,971 | | 24,631 |
Baker Hughes, Inc. | 507,010 | | 39,232 |
Basic Energy Services, Inc. (a) | 81,600 | | 2,643 |
Cal Dive International, Inc. (a) | 1,652,183 | | 9,219 |
Cameron International Corp. (a) | 380,313 | | 21,275 |
Cathedral Energy Services Ltd. | 1,333,000 | | 11,901 |
Ensco International Ltd. ADR | 57,100 | | 3,041 |
Essential Energy Services Ltd. (a) | 2,325,300 | | 5,354 |
Halliburton Co. | 1,170,475 | | 64,060 |
Helmerich & Payne, Inc. | 81,752 | | 5,645 |
Hornbeck Offshore Services, Inc. (a) | 45,000 | | 1,253 |
ION Geophysical Corp. (a) | 2,084,278 | | 21,135 |
Kvaerner ASA (a) | 1,398,971 | | 2,972 |
National Oilwell Varco, Inc. | 1,022,223 | | 82,361 |
Noble Corp. | 329,108 | | 12,134 |
Pioneer Drilling Co. (a) | 228,188 | | 3,713 |
Saipem SpA | 287,799 | | 15,044 |
Schlumberger Ltd. | 947,454 | | 85,621 |
Superior Energy Services, Inc. (a) | 122,634 | | 5,088 |
Transocean Ltd. (United States) | 334,326 | | 20,581 |
Trinidad Drilling Ltd. | 249,200 | | 2,606 |
Unit Corp. (a) | 194,078 | | 11,647 |
Common Stocks - continued |
| Shares | | Value (000s) |
ENERGY - continued |
Energy Equipment & Services - continued |
Vantage Drilling Co. (a) | 5,557,916 | | $ 9,059 |
Xtreme Coil Drilling Corp. (a) | 885,200 | | 4,457 |
| | 468,302 |
Oil, Gas & Consumable Fuels - 9.0% |
3Legs Resources PLC | 284,300 | | 1,120 |
Alpha Natural Resources, Inc. (a) | 207,839 | | 8,877 |
Americas Petrogas, Inc. (a) | 1,986,700 | | 4,658 |
Americas Petrogas, Inc. (a)(f) | 2,250,000 | | 5,275 |
Anadarko Petroleum Corp. | 348,235 | | 28,750 |
Apache Corp. | 313,528 | | 38,790 |
Bonavista Energy Corp. (a)(f) | 166,200 | | 5,001 |
BP PLC sponsored ADR | 71,503 | | 3,249 |
BPZ Energy, Inc. (a)(d) | 2,387,127 | | 8,641 |
C&C Energia Ltd. (a) | 572,800 | | 6,085 |
Cabot Oil & Gas Corp. | 57,300 | | 4,245 |
Chesapeake Energy Corp. | 959,327 | | 32,953 |
Chevron Corp. | 800,724 | | 83,291 |
Concho Resources, Inc. (a) | 100 | | 9 |
Crown Point Ventures Ltd. (a) | 654,400 | | 1,096 |
Crown Point Ventures Ltd. (a)(f) | 1,487,700 | | 2,491 |
CVR Energy, Inc. (a) | 1,144,744 | | 30,736 |
Denbury Resources, Inc. (a) | 731,593 | | 14,134 |
Double Eagle Petroleum Co. (a)(e) | 977,903 | | 10,542 |
El Paso Corp. | 81,688 | | 1,679 |
EOG Resources, Inc. | 179,445 | | 18,303 |
EV Energy Partners LP | 123,890 | | 8,719 |
Exxon Mobil Corp. | 1,138,674 | | 90,855 |
Georesources, Inc. (a) | 28,600 | | 730 |
Gran Tierra Energy, Inc. (Canada) (a) | 674,500 | | 4,702 |
Gulfport Energy Corp. (a) | 491,957 | | 17,937 |
HollyFrontier Corp. | 565,328 | | 42,620 |
InterOil Corp. (a)(d) | 268,719 | | 16,822 |
Kosmos Energy Ltd. | 530,200 | | 8,054 |
Madalena Ventures, Inc. (a) | 918,000 | | 740 |
Marathon Oil Corp. | 448,256 | | 13,882 |
Marathon Petroleum Corp. | 356,628 | | 15,617 |
Niko Resources Ltd. | 168,100 | | 11,561 |
Noble Energy, Inc. | 207,424 | | 20,676 |
Northern Oil & Gas, Inc. (a)(d) | 2,373,722 | | 52,554 |
OAO Gazprom sponsored ADR | 1,009,700 | | 14,802 |
Common Stocks - continued |
| Shares | | Value (000s) |
ENERGY - continued |
Oil, Gas & Consumable Fuels - continued |
Occidental Petroleum Corp. | 539,522 | | $ 52,970 |
Painted Pony Petroleum Ltd. (a)(f) | 116,500 | | 1,725 |
Painted Pony Petroleum Ltd. Class A (a) | 61,300 | | 908 |
Paladin Energy Ltd. (Australia) (a) | 3,364,814 | | 9,685 |
Pan Orient Energy Corp. (a) | 938,500 | | 4,312 |
PetroBakken Energy Ltd. Class A (d) | 281,726 | | 4,146 |
Petroleum Development Corp. (a) | 208,509 | | 7,573 |
Resolute Energy Corp. (a)(d) | 973,974 | | 15,866 |
Suncor Energy, Inc. | 271,400 | | 10,403 |
TAG Oil Ltd. (a) | 899,300 | | 6,448 |
Talisman Energy, Inc. | 664,600 | | 12,104 |
Targa Resources Corp. | 148,200 | | 5,003 |
Tesoro Corp. (a) | 922,716 | | 22,413 |
Tourmaline Oil Corp. (a)(f) | 192,600 | | 7,187 |
Valero Energy Corp. | 993,642 | | 24,960 |
Voyager Oil & Gas, Inc. (a)(d)(e) | 3,538,244 | | 11,252 |
Voyager Oil & Gas, Inc. warrants 2/4/16 (a)(e) | 1,198,388 | | 1,539 |
Whiting Petroleum Corp. (a) | 632,309 | | 37,053 |
Williams Companies, Inc. | 901,730 | | 28,585 |
| | 894,328 |
TOTAL ENERGY | | 1,362,630 |
FINANCIALS - 13.7% |
Capital Markets - 2.1% |
American Capital Ltd. (a) | 472,225 | | 4,566 |
Ashmore Group PLC | 1,677,600 | | 11,107 |
Bank of New York Mellon Corp. | 516,208 | | 12,962 |
BlackRock, Inc. Class A | 53,484 | | 9,545 |
FXCM, Inc. Class A (d) | 327,100 | | 3,304 |
Goldman Sachs Group, Inc. | 331,877 | | 44,793 |
GP Investments Ltd. (depositary receipt) (a) | 2,714,019 | | 8,486 |
ICAP PLC | 1,355,800 | | 9,967 |
International Communications Group, Inc. (a) | 559,836 | | 6,186 |
Invesco Ltd. | 648,687 | | 14,388 |
Knight Capital Group, Inc. Class A (a) | 709,600 | | 8,026 |
Morgan Stanley | 1,993,624 | | 44,358 |
State Street Corp. | 620,173 | | 25,719 |
TD Ameritrade Holding Corp. | 518,677 | | 9,523 |
| | 212,930 |
Common Stocks - continued |
| Shares | | Value (000s) |
FINANCIALS - continued |
Commercial Banks - 3.0% |
Associated Banc-Corp. | 842,596 | | $ 11,501 |
Banco Pine SA | 970,700 | | 6,477 |
Bank of Ireland (g) | 42,633,112 | | 5,789 |
CapitalSource, Inc. | 5,432,245 | | 35,092 |
CIT Group, Inc. (a) | 485,710 | | 19,302 |
Comerica, Inc. | 241,002 | | 7,719 |
Commercial Bank of Qatar GDR (Reg. S) | 1,270,830 | | 5,165 |
Guaranty Trust Bank PLC GDR (Reg. S) | 793,992 | | 3,295 |
Huntington Bancshares, Inc. | 940,859 | | 5,687 |
Itau Unibanco Banco Multiplo SA sponsored ADR | 267,500 | | 5,449 |
KeyCorp | 774,000 | | 6,223 |
Regions Financial Corp. | 2,968,759 | | 18,080 |
SunTrust Banks, Inc. | 327,213 | | 8,013 |
Susquehanna Bancshares, Inc. | 900,925 | | 6,784 |
Wells Fargo & Co. | 5,538,941 | | 154,758 |
| | 299,334 |
Consumer Finance - 0.8% |
American Express Co. | 772,301 | | 38,646 |
Discover Financial Services | 776,127 | | 19,877 |
Imperial Holdings, Inc. (a) | 451,296 | | 4,364 |
SLM Corp. | 698,132 | | 10,884 |
| | 73,771 |
Diversified Financial Services - 3.4% |
Citigroup, Inc. | 3,647,823 | | 139,858 |
CME Group, Inc. | 58,227 | | 16,839 |
Infrastructure Development Finance Co. Ltd. | 2,345,734 | | 6,688 |
JPMorgan Chase & Co. | 3,440,554 | | 139,170 |
PICO Holdings, Inc. (a)(e) | 1,207,264 | | 32,970 |
| | 335,525 |
Insurance - 1.9% |
AEGON NV (a) | 1,896,127 | | 10,851 |
AFLAC, Inc. | 516,898 | | 23,808 |
Assured Guaranty Ltd. | 2,289,114 | | 32,391 |
Berkshire Hathaway, Inc. Class B (a) | 368,652 | | 27,343 |
Genworth Financial, Inc. Class A (a) | 3,248,702 | | 27,029 |
Hanover Insurance Group, Inc. | 65,471 | | 2,371 |
Hartford Financial Services Group, Inc. | 159,500 | | 3,735 |
Lincoln National Corp. | 491,950 | | 13,037 |
Common Stocks - continued |
| Shares | | Value (000s) |
FINANCIALS - continued |
Insurance - continued |
MetLife, Inc. | 968,117 | | $ 39,896 |
Prudential Financial, Inc. | 187,900 | | 11,026 |
| | 191,487 |
Real Estate Investment Trusts - 1.8% |
Beni Stabili SpA SIIQ | 4,141,000 | | 3,695 |
Boston Properties, Inc. | 112,291 | | 12,056 |
Campus Crest Communities, Inc. | 340,903 | | 4,084 |
CBL & Associates Properties, Inc. | 1,572,040 | | 27,919 |
Douglas Emmett, Inc. | 460,912 | | 9,218 |
Education Realty Trust, Inc. | 826,300 | | 7,255 |
Excel Trust, Inc. | 149,700 | | 1,717 |
Franklin Street Properties Corp. | 606,400 | | 7,647 |
Prologis, Inc. | 847,697 | | 30,203 |
Public Storage | 110,619 | | 13,233 |
SL Green Realty Corp. | 262,270 | | 21,511 |
Sunstone Hotel Investors, Inc. (a) | 407,900 | | 3,634 |
Weyerhaeuser Co. | 1,586,676 | | 31,718 |
| | 173,890 |
Real Estate Management & Development - 0.7% |
CB Richard Ellis Group, Inc. Class A (a) | 2,060,326 | | 44,915 |
Forest City Enterprises, Inc. Class A (a) | 531,282 | | 9,568 |
Iguatemi Empresa de Shopping Centers SA | 357,900 | | 7,822 |
Kenedix, Inc. (a) | 45,234 | | 8,845 |
| | 71,150 |
TOTAL FINANCIALS | | 1,358,087 |
HEALTH CARE - 10.8% |
Biotechnology - 3.0% |
Acorda Therapeutics, Inc. (a) | 232,700 | | 6,609 |
Alexion Pharmaceuticals, Inc. (a) | 261,400 | | 14,848 |
Allos Therapeutics, Inc. (a) | 122,400 | | 228 |
AMAG Pharmaceuticals, Inc. (a) | 236,392 | | 3,501 |
Amgen, Inc. | 869,759 | | 47,576 |
Amylin Pharmaceuticals, Inc. (a) | 598,370 | | 7,127 |
Ardea Biosciences, Inc. (a) | 753,132 | | 17,623 |
ARIAD Pharmaceuticals, Inc. (a) | 1,842,209 | | 21,904 |
ArQule, Inc. (a) | 1,017,083 | | 5,696 |
AVEO Pharmaceuticals, Inc. (a) | 1,125,309 | | 21,505 |
Common Stocks - continued |
| Shares | | Value (000s) |
HEALTH CARE - continued |
Biotechnology - continued |
Biogen Idec, Inc. (a) | 284,122 | | $ 28,944 |
Dynavax Technologies Corp. (a) | 2,621,070 | | 7,339 |
Gilead Sciences, Inc. (a) | 222,825 | | 9,439 |
Horizon Pharma, Inc. | 448,800 | | 4,057 |
Human Genome Sciences, Inc. (a) | 349,700 | | 7,347 |
Infinity Pharmaceuticals, Inc. (a) | 175,819 | | 1,582 |
InterMune, Inc. (a) | 200,311 | | 6,686 |
Isis Pharmaceuticals, Inc. (a) | 347,500 | | 3,002 |
Micromet, Inc. (a) | 1,097,200 | | 6,210 |
NPS Pharmaceuticals, Inc. (a) | 553,635 | | 5,348 |
PDL BioPharma, Inc. | 1,012,800 | | 6,269 |
SIGA Technologies, Inc. (a)(d) | 1,719,274 | | 13,084 |
Theravance, Inc. (a) | 1,273,261 | | 27,222 |
Thrombogenics NV (a)(d) | 392,497 | | 9,475 |
United Therapeutics Corp. (a) | 225,400 | | 12,933 |
ZIOPHARM Oncology, Inc. (a) | 1,285,652 | | 6,994 |
| | 302,548 |
Health Care Equipment & Supplies - 1.7% |
Baxter International, Inc. | 534,153 | | 31,072 |
Boston Scientific Corp. (a) | 1,864,800 | | 13,352 |
C. R. Bard, Inc. | 218,797 | | 21,591 |
Conceptus, Inc. (a)(d) | 593,201 | | 6,757 |
Covidien PLC | 627,178 | | 31,854 |
Genmark Diagnostics, Inc. (a) | 538,300 | | 2,675 |
GN Store Nordic AS | 842,174 | | 7,634 |
Orthofix International NV (a) | 432,888 | | 18,281 |
Sirona Dental Systems, Inc. (a) | 284,800 | | 14,405 |
William Demant Holding A/S (a) | 115,354 | | 10,123 |
Zimmer Holdings, Inc. (a) | 154,142 | | 9,252 |
| | 166,996 |
Health Care Providers & Services - 3.0% |
Accretive Health, Inc. (a) | 44,078 | | 1,324 |
AmerisourceBergen Corp. | 240,980 | | 9,232 |
Brookdale Senior Living, Inc. (a) | 1,925,300 | | 41,182 |
Catalyst Health Solutions, Inc. (a) | 323,190 | | 21,179 |
CIGNA Corp. | 789,781 | | 39,307 |
Community Health Systems, Inc. (a) | 342,718 | | 8,856 |
DaVita, Inc. (a) | 222,298 | | 18,571 |
Diagnosticos da America SA | 1,246,000 | | 15,463 |
Emeritus Corp. (a) | 439,233 | | 8,631 |
Common Stocks - continued |
| Shares | | Value (000s) |
HEALTH CARE - continued |
Health Care Providers & Services - continued |
Express Scripts, Inc. (a) | 938,600 | | $ 50,928 |
HealthSpring, Inc. (a) | 155,429 | | 6,379 |
McKesson Corp. | 334,692 | | 27,150 |
Medco Health Solutions, Inc. (a) | 534,961 | | 33,638 |
Sun Healthcare Group, Inc. (a) | 617,262 | | 4,321 |
Sunrise Senior Living, Inc. (a) | 97,528 | | 860 |
Universal Health Services, Inc. Class B | 204,587 | | 10,156 |
| | 297,177 |
Life Sciences Tools & Services - 0.5% |
Agilent Technologies, Inc. (a) | 656,768 | | 27,689 |
Sequenom, Inc. (a) | 802,300 | | 5,664 |
Thermo Fisher Scientific, Inc. (a) | 343,917 | | 20,666 |
| | 54,019 |
Pharmaceuticals - 2.6% |
Auxilium Pharmaceuticals, Inc. (a) | 195,571 | | 3,665 |
Cadence Pharmaceuticals, Inc. (a)(d) | 3,288,995 | | 28,450 |
Cardiome Pharma Corp. (a) | 719,200 | | 3,576 |
Columbia Laboratories, Inc. (a) | 797,400 | | 2,281 |
GlaxoSmithKline PLC | 989,400 | | 22,061 |
GlaxoSmithKline PLC sponsored ADR | 518,729 | | 23,042 |
Merck & Co., Inc. | 2,237,049 | | 76,350 |
Novo Nordisk A/S Series B | 198,837 | | 24,321 |
Roche Holding AG (participation certificate) | 12,239 | | 2,200 |
Sanofi-Aventis | 204,458 | | 15,886 |
Teva Pharmaceutical Industries Ltd. sponsored ADR | 341,419 | | 15,924 |
Valeant Pharmaceuticals International, Inc. (Canada) | 508,900 | | 28,012 |
Watson Pharmaceuticals, Inc. (a) | 179,792 | | 12,069 |
| | 257,837 |
TOTAL HEALTH CARE | | 1,078,577 |
INDUSTRIALS - 14.4% |
Aerospace & Defense - 3.4% |
Bombardier, Inc. Class B (sub. vtg.) | 1,287,700 | | 7,790 |
DigitalGlobe, Inc. (a) | 388,961 | | 10,160 |
Esterline Technologies Corp. (a) | 156,121 | | 11,923 |
GeoEye, Inc. (a)(e) | 1,335,110 | | 53,351 |
Goodrich Corp. | 243,654 | | 23,181 |
Honeywell International, Inc. | 587,730 | | 31,208 |
Meggitt PLC | 4,020,941 | | 25,631 |
Common Stocks - continued |
| Shares | | Value (000s) |
INDUSTRIALS - continued |
Aerospace & Defense - continued |
Precision Castparts Corp. | 161,205 | | $ 26,015 |
Raytheon Co. | 421,426 | | 18,850 |
Rockwell Collins, Inc. | 187,700 | | 10,340 |
Safran SA | 163,500 | | 6,820 |
Textron, Inc. | 1,525,478 | | 35,284 |
Ultra Electronics Holdings PLC | 196,400 | | 5,072 |
United Technologies Corp. | 846,496 | | 70,124 |
| | 335,749 |
Airlines - 0.2% |
Copa Holdings SA Class A | 257,797 | | 16,914 |
Building Products - 0.6% |
Armstrong World Industries, Inc. | 271,340 | | 10,718 |
Lennox International, Inc. | 114,186 | | 4,223 |
Masco Corp. | 1,497,434 | | 15,798 |
Owens Corning (a) | 632,507 | | 22,505 |
Quanex Building Products Corp. | 285,987 | | 4,481 |
| | 57,725 |
Commercial Services & Supplies - 0.8% |
Babcock International Group PLC | 12,200 | | 135 |
KAR Auction Services, Inc. (a) | 119,585 | | 2,126 |
Knoll, Inc. | 566,988 | | 10,348 |
Pitney Bowes, Inc. (d) | 218,912 | | 4,718 |
Republic Services, Inc. | 710,647 | | 20,630 |
Schawk, Inc. Class A | 205,667 | | 3,247 |
Steelcase, Inc. Class A | 1,357,663 | | 13,482 |
Swisher Hygiene, Inc. (g) | 903,330 | | 4,083 |
Swisher Hygiene, Inc. (g) | 1,177,734 | | 4,791 |
The Geo Group, Inc. (a) | 621,348 | | 12,924 |
| | 76,484 |
Construction & Engineering - 1.5% |
AECOM Technology Corp. (a) | 12,300 | | 304 |
Chiyoda Corp. | 1,679,000 | | 21,510 |
Dycom Industries, Inc. (a) | 776,533 | | 13,232 |
Fluor Corp. | 494,307 | | 31,403 |
Foster Wheeler AG (a) | 1,411,695 | | 38,257 |
Great Lakes Dredge & Dock Corp. | 622,073 | | 3,701 |
Jacobs Engineering Group, Inc. (a) | 122,616 | | 4,799 |
Common Stocks - continued |
| Shares | | Value (000s) |
INDUSTRIALS - continued |
Construction & Engineering - continued |
MasTec, Inc. (a) | 361,600 | | $ 7,550 |
Shaw Group, Inc. (a) | 1,181,531 | | 30,578 |
| | 151,334 |
Electrical Equipment - 1.3% |
Alstom SA | 319,494 | | 16,873 |
AMETEK, Inc. | 267,932 | | 11,387 |
Cooper Industries PLC Class A | 169,112 | | 8,846 |
Emerson Electric Co. | 653,805 | | 32,095 |
Fushi Copperweld, Inc. (a) | 580,088 | | 4,101 |
GrafTech International Ltd. (a) | 597,247 | | 11,503 |
Powell Industries, Inc. (a) | 45,000 | | 1,734 |
Prysmian SpA | 655,100 | | 12,152 |
Regal-Beloit Corp. | 285,674 | | 17,320 |
Roper Industries, Inc. | 77,639 | | 6,338 |
Zumtobel AG | 347,930 | | 8,176 |
| | 130,525 |
Industrial Conglomerates - 1.9% |
Carlisle Companies, Inc. | 222,875 | | 9,635 |
Cookson Group PLC | 1,046,653 | | 11,065 |
Danaher Corp. | 299,081 | | 14,688 |
General Electric Co. | 7,129,839 | | 127,695 |
Koninklijke Philips Electronics NV | 532,800 | | 13,233 |
Rheinmetall AG | 202,900 | | 17,029 |
| | 193,345 |
Machinery - 1.7% |
Actuant Corp. Class A | 589,902 | | 14,576 |
Charter International PLC | 1,453,900 | | 19,094 |
Cummins, Inc. | 102,381 | | 10,738 |
Dover Corp. | 168,071 | | 10,163 |
Fiat Industrial SpA (a) | 1,369,500 | | 18,113 |
Gardner Denver, Inc. | 65,422 | | 5,580 |
Haitian International Holdings Ltd. | 2,203,000 | | 2,668 |
Ingersoll-Rand Co. Ltd. | 697,332 | | 26,094 |
Kone Oyj (B Shares) | 8,100 | | 470 |
Navistar International Corp. (a) | 652,167 | | 33,463 |
Pall Corp. | 271,128 | | 13,443 |
Stanley Black & Decker, Inc. | 287,339 | | 18,898 |
| | 173,300 |
Common Stocks - continued |
| Shares | | Value (000s) |
INDUSTRIALS - continued |
Professional Services - 0.6% |
CBIZ, Inc. (a) | 715,013 | | $ 5,334 |
FTI Consulting, Inc. (a) | 290,094 | | 10,528 |
Kforce, Inc. (a) | 767,945 | | 10,582 |
Robert Half International, Inc. | 484,515 | | 13,266 |
SR Teleperformance SA | 412,788 | | 10,667 |
Towers Watson & Co. | 140,554 | | 8,595 |
| | 58,972 |
Road & Rail - 1.8% |
Arkansas Best Corp. | 265,197 | | 6,381 |
Con-way, Inc. | 409,981 | | 15,014 |
CSX Corp. | 2,431,300 | | 59,737 |
Norfolk Southern Corp. | 254,749 | | 19,284 |
Saia, Inc. (a)(e) | 865,075 | | 13,037 |
Tegma Gestao Logistica | 114,400 | | 1,752 |
Union Pacific Corp. | 513,926 | | 52,667 |
Universal Truckload Services, Inc. (a) | 516,527 | | 8,213 |
| | 176,085 |
Trading Companies & Distributors - 0.6% |
Barloworld Ltd. | 584,400 | | 5,642 |
Beacon Roofing Supply, Inc. (a) | 517,300 | | 11,060 |
DXP Enterprises, Inc. (a) | 200,300 | | 5,446 |
Kaman Corp. | 318,466 | | 11,344 |
Mills Estruturas e Servicos de Engenharia SA | 290,000 | | 3,926 |
Mitsui & Co. Ltd. | 183,900 | | 3,477 |
Rush Enterprises, Inc. Class A (a) | 514,150 | | 10,278 |
Watsco, Inc. | 114,885 | | 6,799 |
| | 57,972 |
TOTAL INDUSTRIALS | | 1,428,405 |
INFORMATION TECHNOLOGY - 16.4% |
Communications Equipment - 2.1% |
Alcatel-Lucent SA sponsored ADR (a) | 2,693,176 | | 10,907 |
Calix Networks, Inc. (a) | 1,225,615 | | 22,478 |
Cisco Systems, Inc. | 4,322,457 | | 69,030 |
Comverse Technology, Inc. (a) | 2,547,500 | | 19,106 |
Juniper Networks, Inc. (a) | 1,090,363 | | 25,504 |
Polycom, Inc. (a) | 265,318 | | 7,172 |
QUALCOMM, Inc. | 510,635 | | 27,973 |
Common Stocks - continued |
| Shares | | Value (000s) |
INFORMATION TECHNOLOGY - continued |
Communications Equipment - continued |
Tekelec (a) | 939,950 | | $ 7,379 |
ViaSat, Inc. (a) | 355,398 | | 15,968 |
| | 205,517 |
Computers & Peripherals - 3.6% |
Apple, Inc. (a) | 775,376 | | 302,767 |
Hewlett-Packard Co. | 1,520,453 | | 53,459 |
| | 356,226 |
Electronic Equipment & Components - 1.3% |
Arrow Electronics, Inc. (a) | 519,167 | | 18,041 |
Avnet, Inc. (a) | 936,688 | | 27,445 |
Corning, Inc. | 1,804,266 | | 28,706 |
Funtalk China Holdings Ltd. (a)(d) | 653,009 | | 4,571 |
HLS Systems International Ltd. (a) | 486,535 | | 3,391 |
Ingram Micro, Inc. Class A (a) | 371,850 | | 6,898 |
Jabil Circuit, Inc. | 351,252 | | 6,431 |
Molex, Inc. (d) | 629,880 | | 14,790 |
TE Connectivity Ltd. | 584,756 | | 20,133 |
| | 130,406 |
Internet Software & Services - 1.0% |
DealerTrack Holdings, Inc. (a) | 224,800 | | 5,213 |
DeNA Co. Ltd. | 57,100 | | 2,853 |
eAccess Ltd. (d) | 20,253 | | 8,973 |
eBay, Inc. (a) | 1,061,226 | | 34,755 |
Facebook, Inc. Class B (a)(g) | 488,526 | | 12,213 |
Google, Inc. Class A (a) | 37,649 | | 22,728 |
Renren, Inc. ADR (d) | 828,400 | | 8,972 |
| | 95,707 |
IT Services - 1.8% |
Acxiom Corp. (a) | 475,918 | | 6,539 |
Alliance Data Systems Corp. (a)(d) | 216,691 | | 21,309 |
Atos Origin SA | 188,010 | | 10,384 |
Cognizant Technology Solutions Corp. Class A (a) | 368,580 | | 25,753 |
Fidelity National Information Services, Inc. | 642,635 | | 19,292 |
Fiserv, Inc. (a) | 167,581 | | 10,115 |
Heartland Payment Systems, Inc. | 413,000 | | 8,690 |
MasterCard, Inc. Class A | 168,526 | | 51,106 |
Unisys Corp. (a) | 588,393 | | 12,221 |
Common Stocks - continued |
| Shares | | Value (000s) |
INFORMATION TECHNOLOGY - continued |
IT Services - continued |
Virtusa Corp. (a) | 335,742 | | $ 6,601 |
Visa, Inc. Class A | 111,100 | | 9,503 |
| | 181,513 |
Office Electronics - 0.3% |
Xerox Corp. | 3,401,481 | | 31,736 |
Semiconductors & Semiconductor Equipment - 4.0% |
Advanced Micro Devices, Inc. (a) | 1,719,566 | | 12,622 |
Analog Devices, Inc. | 562,140 | | 19,338 |
ASML Holding NV | 1,134,406 | | 40,442 |
Avago Technologies Ltd. | 636,989 | | 21,422 |
Cymer, Inc. (a) | 980,731 | | 43,182 |
Entropic Communications, Inc. (a)(d) | 486,484 | | 3,250 |
Fairchild Semiconductor International, Inc. (a) | 444,156 | | 6,667 |
Freescale Semiconductor Holdings I Ltd. | 1,365,627 | | 22,301 |
Himax Technologies, Inc. sponsored ADR | 1,586,515 | | 2,776 |
International Rectifier Corp. (a) | 27,100 | | 696 |
Intersil Corp. Class A | 1,226,995 | | 14,785 |
Lam Research Corp. (a) | 486,387 | | 19,884 |
LTX-Credence Corp. (a)(e) | 3,354,337 | | 24,118 |
Marvell Technology Group Ltd. (a) | 3,561,372 | | 52,780 |
Maxim Integrated Products, Inc. | 805,357 | | 18,491 |
Microchip Technology, Inc. (d) | 56,679 | | 1,913 |
Micron Technology, Inc. (a) | 3,351,022 | | 24,697 |
NVIDIA Corp. (a) | 770,396 | | 10,655 |
NXP Semiconductors NV | 987,742 | | 19,538 |
ON Semiconductor Corp. (a) | 2,961,294 | | 25,734 |
Spansion, Inc. Class A (a) | 342,948 | | 6,235 |
Standard Microsystems Corp. (a) | 73,600 | | 1,741 |
TriQuint Semiconductor, Inc. (a) | 356,512 | | 2,681 |
| | 395,948 |
Software - 2.3% |
Aspen Technology, Inc. (a) | 631,355 | | 9,786 |
Autodesk, Inc. (a) | 200,539 | | 6,899 |
BMC Software, Inc. (a) | 459,757 | | 19,871 |
Check Point Software Technologies Ltd. (a) | 261,418 | | 15,071 |
Citrix Systems, Inc. (a) | 143,105 | | 10,309 |
DemandTec, Inc. (a) | 831,862 | | 5,956 |
Informatica Corp. (a) | 327,098 | | 16,725 |
JDA Software Group, Inc. (a) | 430,823 | | 12,046 |
Micro Focus International PLC | 2,179,019 | | 10,374 |
Common Stocks - continued |
| Shares | | Value (000s) |
INFORMATION TECHNOLOGY - continued |
Software - continued |
Oracle Corp. | 3,293,279 | | $ 100,708 |
Pegasystems, Inc. | 181,537 | | 7,327 |
Solera Holdings, Inc. | 85,733 | | 4,791 |
Sourcefire, Inc. (a) | 289,775 | | 7,123 |
TIBCO Software, Inc. (a) | 151,198 | | 3,937 |
| | 230,923 |
TOTAL INFORMATION TECHNOLOGY | | 1,627,976 |
MATERIALS - 6.3% |
Chemicals - 2.8% |
Air Products & Chemicals, Inc. | 118,149 | | 10,483 |
Ashland, Inc. | 187,460 | | 11,480 |
CF Industries Holdings, Inc. | 40,789 | | 6,335 |
Clariant AG (Reg.) (a) | 1,447,820 | | 22,864 |
CVR Partners LP | 385,700 | | 9,045 |
Dow Chemical Co. | 779,917 | | 27,196 |
Ecolab, Inc. | 224,833 | | 11,242 |
Ferro Corp. (a) | 102,273 | | 1,332 |
Huabao International Holdings Ltd. | 8,219,461 | | 6,960 |
Israel Chemicals Ltd. | 347,600 | | 5,893 |
Kraton Performance Polymers, Inc. (a) | 280,523 | | 10,127 |
Lanxess AG | 69,451 | | 5,604 |
LyondellBasell Industries NV Class A | 475,173 | | 18,750 |
PolyOne Corp. | 644,904 | | 9,996 |
Spartech Corp. (a)(e) | 1,622,853 | | 9,331 |
The Mosaic Co. | 523,160 | | 36,998 |
W.R. Grace & Co. (a) | 1,203,625 | | 60,711 |
Yara International ASA | 299,000 | | 17,137 |
| | 281,484 |
Construction Materials - 0.1% |
HeidelbergCement AG | 258,244 | | 14,267 |
Containers & Packaging - 0.2% |
Rock-Tenn Co. Class A | 287,442 | | 17,666 |
Metals & Mining - 3.2% |
Anglo American PLC (United Kingdom) | 225,500 | | 10,735 |
Avion Gold Corp. (a) | 3,402,700 | | 7,123 |
Commercial Metals Co. | 1,022,250 | | 14,833 |
Eldorado Gold Corp. | 1,021,878 | | 17,595 |
First Quantum Minerals Ltd. | 66,100 | | 9,164 |
Common Stocks - continued |
| Shares | | Value (000s) |
MATERIALS - continued |
Metals & Mining - continued |
Freeport-McMoRan Copper & Gold, Inc. | 647,185 | | $ 34,275 |
Goldcorp, Inc. | 805,700 | | 38,531 |
Grande Cache Coal Corp. (a) | 738,500 | | 6,740 |
Gulf Resources, Inc. (a) | 1,894,460 | | 6,631 |
Iluka Resources Ltd. | 85,843 | | 1,675 |
Ivanhoe Mines Ltd. (a) | 1,820,965 | | 47,687 |
Kenmare Resources PLC (a) | 614,300 | | 559 |
Kinross Gold Corp. | 817,445 | | 13,347 |
Mirabela Nickel Ltd. (a) | 2,167,107 | | 4,524 |
Newcrest Mining Ltd. | 892,648 | | 38,787 |
Pan American Silver Corp. | 297,400 | | 8,976 |
Randgold Resources Ltd. sponsored ADR | 365,123 | | 33,157 |
Reliance Steel & Aluminum Co. | 81,850 | | 3,848 |
Ternium SA sponsored ADR | 180,795 | | 5,241 |
United States Steel Corp. (d) | 282,820 | | 11,310 |
| | 314,738 |
TOTAL MATERIALS | | 628,155 |
TELECOMMUNICATION SERVICES - 1.2% |
Diversified Telecommunication Services - 0.6% |
AT&T, Inc. | 369,889 | | 10,823 |
CenturyLink, Inc. | 269,446 | | 9,999 |
China Unicom (Hong Kong) Ltd. | 5,138,000 | | 10,263 |
Iliad SA | 121,637 | | 15,625 |
Koninklijke KPN NV (d) | 710,030 | | 10,147 |
Telefonica SA sponsored ADR | 115,160 | | 2,570 |
| | 59,427 |
Wireless Telecommunication Services - 0.6% |
American Tower Corp. Class A (a) | 146,900 | | 7,717 |
NII Holdings, Inc. (a) | 258,000 | | 10,926 |
SBA Communications Corp. Class A (a) | 320,550 | | 12,235 |
Sprint Nextel Corp. (a) | 2,850,607 | | 12,058 |
TIM Participacoes SA | 2,311,706 | | 11,401 |
Turkcell Iletisim Hizmet AS | 1,697,000 | | 8,719 |
| | 63,056 |
TOTAL TELECOMMUNICATION SERVICES | | 122,483 |
Common Stocks - continued |
| Shares | | Value (000s) |
UTILITIES - 2.6% |
Electric Utilities - 1.0% |
American Electric Power Co., Inc. | 472,195 | | $ 17,405 |
Centrais Eletricas Brasileiras SA (Electrobras) (PN-B) sponsored ADR (d) | 502,200 | | 7,704 |
Ceske Energeticke Zavody AS | 50,000 | | 2,584 |
Edison International | 328,591 | | 12,509 |
Fortum Corp. | 122,386 | | 3,244 |
NextEra Energy, Inc. | 377,156 | | 20,838 |
NV Energy, Inc. | 486,328 | | 7,217 |
PPL Corp. | 707,453 | | 19,738 |
Tata Power Co. Ltd. | 142,060 | | 4,117 |
| | 95,356 |
Gas Utilities - 0.2% |
Aygaz AS | 81,860 | | 509 |
China Gas Holdings Ltd. | 11,094,000 | | 4,171 |
ONEOK, Inc. | 130,788 | | 9,520 |
| | 14,200 |
Independent Power Producers & Energy Traders - 0.7% |
The AES Corp. (a) | 5,940,556 | | 73,128 |
Multi-Utilities - 0.7% |
CenterPoint Energy, Inc. | 590,285 | | 11,558 |
CMS Energy Corp. | 345,170 | | 6,607 |
National Grid PLC | 1,268,400 | | 12,412 |
PG&E Corp. | 271,157 | | 11,234 |
Public Service Enterprise Group, Inc. | 550,714 | | 18,036 |
Sempra Energy | 223,022 | | 11,305 |
| | 71,152 |
TOTAL UTILITIES | | 253,836 |
TOTAL COMMON STOCKS (Cost $8,541,722) | 9,802,006 |
Preferred Stocks - 0.7% |
| | | |
Convertible Preferred Stocks - 0.5% |
CONSUMER DISCRETIONARY - 0.2% |
Automobiles - 0.2% |
General Motors Co. 4.75% | 368,500 | | 17,028 |
Preferred Stocks - continued |
| Shares | | Value (000s) |
Convertible Preferred Stocks - continued |
FINANCIALS - 0.2% |
Diversified Financial Services - 0.2% |
Citigroup, Inc. 7.50% | 157,200 | | $ 17,630 |
INFORMATION TECHNOLOGY - 0.0% |
IT Services - 0.0% |
Unisys Corp. 6.25% | 93,800 | | 6,356 |
UTILITIES - 0.1% |
Electric Utilities - 0.1% |
PPL Corp. 9.50% | 187,100 | | 10,494 |
TOTAL CONVERTIBLE PREFERRED STOCKS | | 51,508 |
Nonconvertible Preferred Stocks - 0.2% |
CONSUMER DISCRETIONARY - 0.2% |
Automobiles - 0.2% |
Volkswagen AG | 96,900 | | 19,416 |
TOTAL PREFERRED STOCKS (Cost $61,340) | 70,924 |
Investment Companies - 0.2% |
| | | |
Ares Capital Corp.
(Cost $13,382) | 1,052,680 | | 16,990 |
Convertible Bonds - 0.2% |
| Principal Amount (000s) | | |
FINANCIALS - 0.1% |
Thrifts & Mortgage Finance - 0.1% |
MGIC Investment Corp. 9% 4/1/63 (f) | | $ 18,163 | | 12,305 |
INDUSTRIALS - 0.1% |
Electrical Equipment - 0.1% |
Aspen Aerogels, Inc. 8% 6/1/14 (g) | | 4,085 | | 4,085 |
Convertible Bonds - continued |
| Principal Amount (000s) | | Value (000s) |
TELECOMMUNICATION SERVICES - 0.0% |
Diversified Telecommunication Services - 0.0% |
Clearwire Communications LLC/Clearwire Finance, Inc. 8.25% 12/1/40 (f) | | $ 4,080 | | $ 2,739 |
TOTAL CONVERTIBLE BONDS (Cost $16,737) | 19,129 |
Money Market Funds - 1.7% |
| Shares | | |
Fidelity Cash Central Fund, 0.14% (b) | 14,746,846 | | 14,747 |
Fidelity Securities Lending Cash Central Fund, 0.15% (b)(c) | 156,594,819 | | 156,595 |
TOTAL MONEY MARKET FUNDS (Cost $171,342) | 171,342 |
TOTAL INVESTMENT PORTFOLIO - 101.4% (Cost $8,804,523) | 10,080,391 |
NET OTHER ASSETS (LIABILITIES) - (1.4)% | (137,676) |
NET ASSETS - 100% | $ 9,942,715 |
Legend |
(a) Non-income producing |
(b) Affiliated fund that is available only to investment companies and other accounts managed by Fidelity Investments. The rate quoted is the annualized seven-day yield of the fund at period end. A complete unaudited listing of the fund's holdings as of its most recent quarter end is available upon request. In addition, each Fidelity Central Fund's financial statements, which are not covered by the Fund's Report of Independent Registered Public Accounting Firm, are available on the SEC's website or upon request. |
(c) Investment made with cash collateral received from securities on loan. |
(d) Security or a portion of the security is on loan at period end. |
(e) Affiliated company |
(f) Security exempt from registration under Rule 144A of the Securities Act of 1933. These securities may be resold in transactions exempt from registration, normally to qualified institutional buyers. At the end of the period, the value of these securities amounted to $36,723,000 or 0.4% of net assets. |
(g) Restricted securities - Investment in securities not registered under the Securities Act of 1933 (excluding 144A issues). At the end of the period, the value of restricted securities (excluding 144A issues) amounted to $37,439,000 or 0.4% of net assets. |
Additional information on each restricted holding is as follows: |
Security | Acquisition Date | Acquisition Cost (000s) |
Aspen Aerogels, Inc. 8% 6/1/14 | 6/1/11 | $ 4,085 |
Bank of Ireland | 7/29/11 | $ 6,064 |
Facebook, Inc. Class B | 3/31/11 - 5/19/11 | $ 12,217 |
Mood Media Corp. | 2/2/11 | $ 4,054 |
Swisher Hygiene, Inc. | 3/22/11 - 4/15/11 | $ 13,586 |
Affiliated Central Funds |
Information regarding fiscal year to date income earned by the Fund from investments in Fidelity Central Funds is as follows: |
Fund | Income earned
(Amounts in thousands) |
Fidelity Cash Central Fund | $ 108 |
Fidelity Securities Lending Cash Central Fund | 2,562 |
Total | $ 2,670 |
Other Affiliated Issuers |
An affiliated company is a company in which the Fund has ownership of at least 5% of the voting securities. Fiscal year to date transactions with companies which are or were affiliates are as follows: |
Affiliate
(Amounts in thousands) | Value, beginning of period | Purchases | Sales Proceeds | Dividend Income | Value,
end of
period |
Double Eagle Petroleum Co. | $ - | $ 8,444 | $ - | $ - | $ 10,542 |
GeoEye, Inc. | 18,774 | 27,896 | - | - | 53,351 |
Gulf Resources, Inc. | 5,042 | 946 | 2,579 | - | - |
Gulf Resources, Inc. | 16,406 | - | - | - | - |
LTX-Credence Corp. | 24,000 | 4,614 | 1,147 | - | 24,118 |
O'Charleys, Inc. | 9,141 | 1,279 | - | - | 9,150 |
PICO Holdings, Inc. | 38,871 | 687 | 1,564 | - | 32,970 |
Saia, Inc. | 11,583 | 1,315 | - | - | 13,037 |
Spartech Corp. | 15,775 | 2,635 | 1,873 | - | 9,331 |
Voyager Oil & Gas, Inc. | - | 12,230 | 1 | - | 11,252 |
Voyager Oil & Gas, Inc. warrants 2/4/16 | - | 108 | - | - | 1,539 |
Winnebago Industries, Inc. | 16,261 | 4,025 | - | - | - |
Total | $ 155,853 | $ 64,179 | $ 7,164 | $ - | $ 165,290 |
Other Information |
The following is a summary of the inputs used, as of July 31, 2011, involving the Fund's assets and liabilities carried at fair value. The inputs or methodology used for valuing securities may not be an indication of the risk associated with investing in those securities. For more information on valuation inputs, and their aggregation into the levels used in the tables below, please refer to the Security Valuation section in the accompanying Notes to Financial Statements. |
Valuation Inputs at Reporting Date: |
Description
(Amounts in thousands) | Total | Level 1 | Level 2 | Level 3 |
Investments in Securities: | | | | |
Equities: | | | | |
Consumer Discretionary | $ 1,088,144 | $ 1,082,132 | $ 6,012 | $ - |
Consumer Staples | 890,157 | 861,647 | 28,510 | - |
Energy | 1,362,630 | 1,356,090 | 6,540 | - |
Financials | 1,375,717 | 1,359,077 | 10,851 | 5,789 |
Health Care | 1,078,577 | 1,016,309 | 62,268 | - |
Industrials | 1,428,405 | 1,410,381 | 18,024 | - |
Information Technology | 1,634,332 | 1,622,119 | - | 12,213 |
Materials | 628,155 | 628,155 | - | - |
Telecommunication Services | 122,483 | 103,501 | 18,982 | - |
Utilities | 264,330 | 251,918 | 12,412 | - |
Investment Companies | 16,990 | 16,990 | - | - |
Corporate Bonds | 19,129 | - | 19,129 | - |
Money Market Funds | 171,342 | 171,342 | - | - |
Total Investments in Securities: | $ 10,080,391 | $ 9,879,661 | $ 182,728 | $ 18,002 |
The following is a reconciliation of Investments in Securities for which Level 3 inputs were used in determining value: |
(Amounts in thousands) | |
Investments in Securities: | |
Beginning Balance | $ - |
Total Realized Gain (Loss) | - |
Total Unrealized Gain (Loss) | (279) |
Cost of Purchases | 18,281 |
Proceeds of Sales | - |
Amortization/Accretion | - |
Transfers in to Level 3 | - |
Transfers out of Level 3 | - |
Ending Balance | $ 18,002 |
The change in unrealized gain (loss) for the period attributable to Level 3 securities held at July 31, 2011 | $ (279) |
The information used in the above reconciliation represents fiscal year to date activity for any Investments in Securities identified as using Level 3 inputs at either the beginning or the end of the current fiscal period. Transfers in or out of Level 3 represent the beginning value of any Security or Instrument where a change in the pricing level occurred from the beginning to the end of the period. The cost of purchases and the proceeds of sales may include securities received or delivered through corporate actions or exchanges. Realized and unrealized gains (losses) disclosed in the reconciliation are included in Net Gain (Loss) on the Fund's Statement of Operations. |
Distribution of investments by country of issue, as a percentage of total net assets, is as follows: (Unaudited) |
United States of America | 79.2% |
Canada | 3.6% |
United Kingdom | 1.9% |
France | 1.6% |
Bermuda | 1.4% |
Switzerland | 1.2% |
Netherlands | 1.1% |
Others (Individually Less Than 1%) | 10.0% |
| 100.0% |
Income Tax Information |
At July 31, 2011, the Fund had a capital loss carryforward of approximately $41,875,000 all of which will expire in fiscal 2018. Capital loss carryforwards are only available to offset future capital gains of the Fund to the extent provided by regulations and may be limited. |
See accompanying notes which are an integral part of the financial statements.
Annual Report
Statement of Assets and Liabilities
Amounts in thousands (except per-share amounts) | July 31, 2011 |
| | |
Assets | | |
Investment in securities, at value (including securities loaned of $152,805) - See accompanying schedule: Unaffiliated issuers (cost $8,467,548) | $ 9,743,759 | |
Fidelity Central Funds (cost $171,342) | 171,342 | |
Other affiliated issuers (cost $165,633) | 165,290 | |
Total Investments (cost $8,804,523) | | $ 10,080,391 |
Cash | | 104 |
Foreign currency held at value (cost $527) | | 527 |
Receivable for investments sold | | 112,559 |
Receivable for fund shares sold | | 6,308 |
Dividends receivable | | 8,055 |
Interest receivable | | 649 |
Distributions receivable from Fidelity Central Funds | | 409 |
Other receivables | | 649 |
Total assets | | 10,209,651 |
| | |
Liabilities | | |
Payable for investments purchased | $ 84,500 | |
Payable for fund shares redeemed | 16,616 | |
Accrued management fee | 6,090 | |
Other affiliated payables | 1,719 | |
Other payables and accrued expenses | 1,416 | |
Collateral on securities loaned, at value | 156,595 | |
Total liabilities | | 266,936 |
| | |
Net Assets | | $ 9,942,715 |
Net Assets consist of: | | |
Paid in capital | | $ 8,758,078 |
Undistributed net investment income | | 22,949 |
Accumulated undistributed net realized gain (loss) on investments and foreign currency transactions | | (113,290) |
Net unrealized appreciation (depreciation) on investments and assets and liabilities in foreign currencies | | 1,274,978 |
Net Assets | | $ 9,942,715 |
See accompanying notes which are an integral part of the financial statements.
Annual Report
Financial Statements - continued
Statement of Assets and Liabilities - continued
Amounts in thousands (except per-share amounts) | July 31, 2011 |
| | |
Dividend Growth:
Net Asset Value, offering price and redemption price
per share ($9,308,780 ÷ 321,451 shares) | | $ 28.96 |
| | |
Class K:
Net Asset Value, offering price and redemption price per share ($633,935 ÷ 21,877 shares) | | $ 28.98 |
See accompanying notes which are an integral part of the financial statements.
Annual Report
Statement of Operations
Amounts in thousands | Year ended July 31, 2011 |
| | |
Investment Income | | |
Dividends | | $ 122,532 |
Interest | | 7,730 |
Income from Fidelity Central Funds | | 2,670 |
Total income | | 132,932 |
| | |
Expenses | | |
Management fee
Basic fee | $ 54,190 | |
Performance adjustment | 13,876 | |
Transfer agent fees | 19,362 | |
Accounting and security lending fees | 1,306 | |
Custodian fees and expenses | 514 | |
Independent trustees' compensation | 53 | |
Registration fees | 148 | |
Audit | 88 | |
Legal | 43 | |
Miscellaneous | 98 | |
Total expenses before reductions | 89,678 | |
Expense reductions | (565) | 89,113 |
Net investment income (loss) | | 43,819 |
Realized and Unrealized Gain (Loss) Net realized gain (loss) on: | | |
Investment securities: | | |
Unaffiliated issuers | 809,337 | |
Other affiliated issuers | (5,052) | |
Foreign currency transactions | (2,084) | |
Total net realized gain (loss) | | 802,201 |
Change in net unrealized appreciation (depreciation) on: Investment securities | 997,622 | |
Assets and liabilities in foreign currencies | 85 | |
Total change in net unrealized appreciation (depreciation) | | 997,707 |
Net gain (loss) | | 1,799,908 |
Net increase (decrease) in net assets resulting from operations | | $ 1,843,727 |
See accompanying notes which are an integral part of the financial statements.
Annual Report
Financial Statements - continued
Statement of Changes in Net Assets
Amounts in thousands | Year ended
July 31,
2011 | Year ended
July 31,
2010 |
Increase (Decrease) in Net Assets | | |
Operations | | |
Net investment income (loss) | $ 43,819 | $ 44,690 |
Net realized gain (loss) | 802,201 | 922,532 |
Change in net unrealized appreciation (depreciation) | 997,707 | 264,038 |
Net increase (decrease) in net assets resulting
from operations | 1,843,727 | 1,231,260 |
Distributions to shareholders from net investment income | (51,737) | (39,369) |
Distributions to shareholders from net realized gain | (26,364) | (16,428) |
Total distributions | (78,101) | (55,797) |
Share transactions - net increase (decrease) | 91,677 | 104,895 |
Total increase (decrease) in net assets | 1,857,303 | 1,280,358 |
| | |
Net Assets | | |
Beginning of period | 8,085,412 | 6,805,054 |
End of period (including undistributed net investment income of $22,949 and undistributed net investment income of $31,691, respectively) | $ 9,942,715 | $ 8,085,412 |
See accompanying notes which are an integral part of the financial statements.
Annual Report
Financial Highlights - Dividend Growth
Years ended July 31, | 2011 | 2010 | 2009 | 2008 | 2007 |
Selected Per-Share Data | | | | | |
Net asset value, beginning of period | $ 23.84 | $ 20.25 | $ 25.40 | $ 32.73 | $ 29.50 |
Income from Investment Operations | | | | | |
Net investment income (loss) B | .12 | .13E | .24 | .43 | .52 F |
Net realized and unrealized gain (loss) | 5.23 | 3.63 | (4.01) | (5.08) | 3.98 |
Total from investment operations | 5.35 | 3.76 | (3.77) | (4.65) | 4.50 |
Distributions from net investment income | (.15) | (.12) | (.37) | (.45) | (.45) |
Distributions from net realized gain | (.08) | (.05) | (1.01) | (2.23) | (.82) |
Total distributions | (.23) | (.17) | (1.38) H | (2.68) | (1.27) |
Net asset value, end of period | $ 28.96 | $ 23.84 | $ 20.25 | $ 25.40 | $ 32.73 |
Total Return A | 22.57% | 18.59% | (15.33)% | (15.45)% | 15.62% |
Ratios to Average Net Assets C,G | | | | | |
Expenses before reductions | .93% | .93% | .62% | .64% | .61% |
Expenses net of fee waivers, if any | .93% | .93% | .62% | .64% | .61% |
Expenses net of all reductions | .93% | .92% | .62% | .63% | .60% |
Net investment income (loss) | .44% | .56% E | 1.34% | 1.47% | 1.62% F |
Supplemental Data | | | | | |
Net assets, end of period (in millions) | $ 9,309 | $ 7,730 | $ 6,603 | $ 9,502 | $ 16,265 |
Portfolio turnover rate D | 67% | 85% | 177% | 52% | 36% |
A Total returns would have been lower if certain expenses had not been reduced during the applicable periods shown.
B Calculated based on average shares outstanding during the period.
C Fees and expenses of any underlying Fidelity Central Funds are not included in the Fund's expense ratio. The Fund indirectly bears its proportionate share of the expenses of any underlying Fidelity Central Funds.
D Amount does not include the portfolio activity of any underlying Fidelity Central Funds.
E Investment income per share reflects a special dividend which amounted to $.04 per share. Excluding the special dividend, the ratio of net investment income (loss) to average net assets would have been .40%.
F Investment income per share reflects a special dividend which amounted to $.07 per share. Excluding the special dividend, the ratio of net investment income (loss) to average net assets would have been 1.40%.
G Expense ratios reflect operating expenses of the class. Expenses before reductions do not reflect amounts reimbursed by the investment adviser or reductions from brokerage service arrangements or reductions from other expense offset arrangements and do not represent the amount paid by the class during periods when reimbursements or reductions occur. Expenses net of fee waivers reflect expenses after reimbursement by the investment adviser but prior to reductions from brokerage service arrangements or other expense offset arrangements. Expenses net of all reductions represent the net expenses paid by the class.
H Total distributions of $1.38 per share is comprised of distributions from net investment income of $.374 and distributions from net realized gain of $1.005 per share.
See accompanying notes which are an integral part of the financial statements.
Annual Report
Financial Highlights - Class K
Years ended July 31, | 2011 | 2010 | 2009 | 2008 H |
Selected Per-Share Data | | | | |
Net asset value, beginning of period | $ 23.86 | $ 20.26 | $ 25.41 | $ 27.72 |
Income from Investment Operations | | | | |
Net investment income (loss) D | .17 | .18 G | .26 | .10 |
Net realized and unrealized gain (loss) | 5.22 | 3.63 | (4.00) | (2.41) |
Total from investment operations | 5.39 | 3.81 | (3.74) | (2.31) |
Distributions from net investment income | (.20) | (.16) | (.41) | - |
Distributions from net realized gain | (.08) | (.05) | (1.01) | - |
Total distributions | (.27) K | (.21) | (1.41) J | - |
Net asset value, end of period | $ 28.98 | $ 23.86 | $ 20.26 | $ 25.41 |
Total Return B,C | 22.79% | 18.86% | (15.16)% | (8.33)% |
Ratios to Average Net Assets E,I | | | | |
Expenses before reductions | .78% | .72% | .40% | .47% A |
Expenses net of fee waivers, if any | .78% | .72% | .40% | .47% A |
Expenses net of all reductions | .77% | .71% | .39% | .47% A |
Net investment income (loss) | .60% | .76% G | 1.57% | 1.66% A |
Supplemental Data | | | | |
Net assets, end of period (000 omitted) | $ 633,935 | $ 355,463 | $ 201,625 | $ 92 |
Portfolio turnover rate F | 67% | 85% | 177% | 52% |
A Annualized
B Total returns for periods of less than one year are not annualized.
C Total returns would have been lower if certain expenses had not been reduced during the applicable periods shown.
D Calculated based on average shares outstanding during the period.
E Fees and expenses of any underlying Fidelity Central Funds are not included in the Fund's expense ratio. The Fund indirectly bears its proportionate share of the expenses of any underlying Fidelity Central Funds.
F Amount does not include the portfolio activity of any underlying Fidelity Central Funds.
G Investment income per share reflects a special dividend which amounted to $.04 per share. Excluding the special dividend, the ratio of net investment income (loss) to average net assets would have been .60%.
H For the period May 9, 2008 (commencement of sale of shares) to July 31, 2008.
I Expense ratios reflect operating expenses of the class. Expenses before reductions do not reflect amounts reimbursed by the investment adviser or reductions from brokerage service arrangements or reductions from other expense offset arrangements and do not represent the amount paid by the class during periods when reimbursements or reductions occur. Expense ratios before reductions for start-up periods may not be representative of longer-term operating periods. Expenses net of fee waivers reflect expenses after reimbursement by the investment adviser but prior to reductions from brokerage service arrangements or other expense offset arrangements. Expenses net of all reductions represent the net expenses paid by the class.
J Total distributions of $1.41 per share is comprised of distributions from net investment income of $.407 and distributions from net realized gain of $1.005 per share.
K Total distributions of $.27 per share is comprised of distributions from net investment income of $.197 and distributions from net realized gain of $.077 per share.
See accompanying notes which are an integral part of the financial statements.
Annual Report
Notes to Financial Statements
For the period ended July 31, 2011
(Amounts in thousands except ratios)
1. Organization.
Fidelity Dividend Growth Fund (the Fund) is a fund of Fidelity Securities Fund (the Trust) and is authorized to issue an unlimited number of shares. The Trust is registered under the Investment Company Act of 1940, as amended (the 1940 Act), as an open-end management investment company organized as a Massachusetts business trust. The Fund offers Dividend Growth and Class K shares, each of which has equal rights as to assets and voting privileges. Each class has exclusive voting rights with respect to matters that affect that class. Investment income, realized and unrealized capital gains and losses, the common expenses of the Fund, and certain fund-level expense reductions, if any, are allocated on a pro-rata basis to each class based on the relative net assets of each class to the total net assets of the Fund. Each class differs with respect to transfer agent fees incurred. Certain expense reductions may also differ by class.
2. Investments in Fidelity Central Funds.
The Fund invests in Fidelity Central Funds, which are open-end investment companies available only to other investment companies and accounts managed by Fidelity Management & Research Company (FMR) and its affiliates. The Fund's Schedule of Investments lists each of the Fidelity Central Funds held as of period end, if any, as an investment of the Fund, but does not include the underlying holdings of each Fidelity Central Fund. As an Investing Fund, the Fund indirectly bears its proportionate share of the expenses of the underlying Fidelity Central Funds.
The Money Market Central Funds seek preservation of capital and current income and are managed by Fidelity Investments Money Management, Inc. (FIMM), an affiliate of FMR.
A complete unaudited list of holdings for each Fidelity Central Fund is available upon request or at the Securities and Exchange Commission (the SEC) web site at www.sec.gov. In addition, the financial statements of the Fidelity Central Funds, which are not covered by the Fund's Report of Independent Registered Public Accounting Firm, are available on the SEC web site or upon request.
3. Significant Accounting Policies.
The financial statements have been prepared in conformity with accounting principles generally accepted in the United States of America (GAAP), which require management to make certain estimates and assumptions at the date of the financial statements. Actual results could differ from those estimates. Subsequent events, if any, through the date that the financial statements were issued have been evaluated in the preparation of the financial statements. The following summarizes the significant accounting policies of the Fund:
Annual Report
3. Significant Accounting Policies - continued
Security Valuation. Investments are valued as of 4:00 p.m. Eastern time on the last calendar day of the period. The Fund uses independent pricing services approved by the Board of Trustees to value its investments. When current market prices or quotations are not readily available or reliable, valuations may be determined in good faith in accordance with procedures adopted by the Board of Trustees. Factors used in determining value may include market or security specific events, changes in interest rates and credit quality. The frequency with which these procedures are used cannot be predicted and they may be utilized to a significant extent. The value used for net asset value (NAV) calculation under these procedures may differ from published prices for the same securities.
The Fund categorizes the inputs to valuation techniques used to value its investments into a disclosure hierarchy consisting of three levels as shown below:
Level 1 - quoted prices in active markets for identical investments
Level 2 - other significant observable inputs (including quoted prices for similar investments, interest rates, prepayment speeds, etc.)
Level 3 - unobservable inputs (including the Fund's own assumptions based on the best information available)
Changes in valuation techniques may result in transfers in or out of an assigned level within the disclosure hierarchy. The aggregate value of investments by input level, as of July 31, 2011, as well as a roll forward of Level 3 securities, is included at the end of the Fund's Schedule of Investments. Valuation techniques used to value the Fund's investments by major category are as follows:
Equity securities, including restricted securities, for which market quotations are readily available, are valued at the last reported sale price or official closing price as reported by an independent pricing service on the primary market or exchange on which they are traded and are categorized as Level 1 in the hierarchy. In the event there were no sales during the day or closing prices are not available, securities are valued at the last quoted bid price or may be valued using the last available price and are generally categorized as Level 2 in the hierarchy. For foreign equity securities, when significant market or security specific events arise, comparisons to the valuation of American Depositary Receipts (ADRs), futures contracts, Exchange-traded funds (ETFs) and certain indexes as well as quoted prices for similar securities are used and are categorized as Level 2 in the hierarchy in these circumstances. Utilizing these techniques may result in transfers between Level 1 and Level 2. For restricted equity securities and private placements where observable inputs are limited, assumptions about market activity and risk are used and are categorized as Level 3 in the hierarchy.
Annual Report
Notes to Financial Statements - continued
(Amounts in thousands except ratios)
3. Significant Accounting Policies - continued
Security Valuation - continued
Debt securities, including restricted securities, are valued based on evaluated prices received from independent pricing services or from dealers who make markets in such securities. For corporate bonds, pricing services utilize matrix pricing which considers yield or price of bonds of comparable quality, coupon, maturity and type as well as dealer supplied prices and are generally categorized as Level 2 in the hierarchy. When independent prices are unavailable or unreliable, debt securities may be valued utilizing pricing matrices which consider similar factors that would be used by independent pricing services. These are generally categorized as Level 2 in the hierarchy but may be Level 3 depending on the circumstances.
Investments in open-end mutual funds, including the Fidelity Central Funds, are valued at their closing net asset value each business day and are categorized as Level 1 in the hierarchy.
Foreign Currency. The Fund may use foreign currency contracts to facilitate transactions in foreign-denominated securities. Gains and losses from these transactions may arise from changes in the value of the foreign currency or if the counterparties do not perform under the contracts' terms.
Foreign-denominated assets, including investment securities, and liabilities are translated into U.S. dollars at the exchange rate at period end. Purchases and sales of investment securities, income and dividends received and expenses denominated in foreign currencies are translated into U.S. dollars at the exchange rate in effect on the transaction date.
The effects of exchange rate fluctuations on investments are included with the net realized and unrealized gain (loss) on investment securities. Other foreign currency transactions resulting in realized and unrealized gain (loss) are disclosed separately.
Investment Transactions and Income. For financial reporting purposes, the Fund's investment holdings and NAV include trades executed through the end of the last business day of the period. The NAV per share for processing shareholder transactions is calculated as of the close of business of the New York Stock Exchange (NYSE), normally 4:00 p.m. Eastern time and includes trades executed through the end of the prior business day. Gains and losses on securities sold are determined on the basis of identified cost and may include proceeds received from litigation. Dividend income is recorded on the ex-dividend date, except for certain dividends from foreign securities where the ex-dividend date may have passed, which are recorded as soon as the Fund is informed of the ex-dividend date. Non-cash dividends included in dividend income, if any, are recorded at the fair market value of the securities received. Interest income and distributions from the Fidelity Central Funds are accrued as earned. Interest income
Annual Report
3. Significant Accounting Policies - continued
Investment Transactions and Income - continued
includes coupon interest and amortization of premium and accretion of discount on debt securities. Investment income is recorded net of foreign taxes withheld where recovery of such taxes is uncertain.
Expenses. Expenses directly attributable to a fund are charged to that fund. Expenses attributable to more than one fund are allocated among the respective funds on the basis of relative net assets or other appropriate methods. Expense estimates are accrued in the period to which they relate and adjustments are made when actual amounts are known.
Deferred Trustee Compensation. Under a Deferred Compensation Plan (the Plan), independent Trustees may elect to defer receipt of a portion of their annual compensation. Deferred amounts are invested in a cross-section of Fidelity funds, are marked-to-market and remain in the Fund until distributed in accordance with the Plan. The investment of deferred amounts and the offsetting payable to the Trustees are included in the accompanying Statement of Assets and Liabilities.
Income Tax Information and Distributions to Shareholders. Each year, the Fund intends to qualify as a regulated investment company, including distributing substantially all of its taxable income and realized gains under Subchapter M of the Internal Revenue Code and filing its U.S. federal tax return. As a result, no provision for income taxes is required. As of July 31, 2011, the Fund did not have any unrecognized tax benefits in the financial statements. A fund's federal tax return is subject to examination by the Internal Revenue Service (IRS) for a period of three years. Foreign taxes are provided for based on the Fund's understanding of the tax rules and rates that exist in the foreign markets in which it invests.
Distributions are declared and recorded on the ex-dividend date. Income dividends and capital gain distributions are declared separately for each class. Income and capital gain distributions are determined in accordance with income tax regulations, which may differ from GAAP. In addition, the Fund claimed a portion of the payment made to redeeming shareholders as a distribution for income tax purposes.
Capital accounts within the financial statements are adjusted for permanent book-tax differences. These adjustments have no impact on net assets or the results of operations. Temporary book-tax differences will reverse in a subsequent period.
Book-tax differences are primarily due to foreign currency transactions, passive foreign investment companies (PFIC), market discount, equity-debt classifications, partnerships, deferred trustees compensation, capital loss carryforwards and losses deferred due to wash sales.
Annual Report
Notes to Financial Statements - continued
(Amounts in thousands except ratios)
3. Significant Accounting Policies - continued
Income Tax Information and Distributions to Shareholders - continued
The federal tax cost of investment securities and unrealized appreciation (depreciation) as of period end were as follows:
Gross unrealized appreciation | $ 1,675,274 |
Gross unrealized depreciation | (473,832) |
Net unrealized appreciation (depreciation) on securities and other investments | $ 1,201,442 |
| |
Tax Cost | $ 8,878,949 |
The tax-based components of distributable earnings as of period end were as follows:
Undistributed ordinary income | $ 26,540 |
Capital loss carryforward | $ (41,875) |
Net unrealized appreciation (depreciation) | $ 1,200,553 |
Under the recently enacted Regulated Investment Company Modernization Act of 2010 (the Act), the Fund will be permitted to carry forward capital losses incurred in taxable years beginning after December 22, 2010 for an unlimited period. However, any losses incurred during those future taxable years will be required to be utilized prior to any losses incurred in pre-enactment taxable years, which generally expire after eight years from when they are incurred. Additionally, post-enactment capital losses that are carried forward will retain their character as either short-term or long-term capital losses rather than being considered all short-term as under previous law. The Fund's first fiscal year end subject to the Act will be July 31, 2012.
The tax character of distributions paid was as follows:
| July 31, 2011 | July 31, 2010 |
Ordinary Income | $ 78,101 | $ 55,797 |
New Accounting Pronouncement. In May 2011, the Financial Accounting Standards Board issued Accounting Standard Update No. 2011-04, Fair Value Measurement (Topic 820) - Amendments to Achieve Common Fair Value Measurement and Disclosure Requirements in U.S. GAAP and IFRSs. The update changes the wording used to describe the requirements in GAAP for measuring fair value and for disclosing information about fair value measurements. The update is effective during interim and annual periods beginning after December 15, 2011. Management is currently evaluating the impact of the update's adoption on the Fund's financial statement disclosures.
Annual Report
4. Operating Policies.
Restricted Securities. The Fund may invest in securities that are subject to legal or contractual restrictions on resale. These securities generally may be resold in transactions exempt from registration or to the public if the securities are registered. Disposal of these securities may involve time-consuming negotiations and expense, and prompt sale at an acceptable price may be difficult. Information regarding restricted securities is included at the end of the Fund's Schedule of Investments.
5. Purchases and Sales of Investments.
Purchases and sales of securities, other than short-term securities, aggregated $6,534,955 and $6,441,727, respectively.
6. Fees and Other Transactions with Affiliates.
Management Fee. FMR and its affiliates provide the Fund with investment management related services for which the Fund pays a monthly management fee. The management fee is the sum of an individual fund fee rate that is based on an annual rate of .30% of the Fund's average net assets and a group fee rate that averaged .26% during the period. The group fee rate is based upon the average net assets of all the mutual funds advised by FMR. The group fee rate decreases as assets under management increase and increases as assets under management decrease. In addition, the management fee is subject to a performance adjustment (up to a maximum of ± .20% of the Fund's average net assets over a 36 month performance period). The upward or downward adjustment to the management fee is based on the relative investment performance of Dividend Growth as compared to an appropriate benchmark index. For the period, the total annual management fee rate, including the performance adjustment, was .70% of the Fund's average net assets.
Transfer Agent Fees. Fidelity Investments Institutional Operations Company, Inc. (FIIOC), an affiliate of FMR, is the transfer, dividend disbursing and shareholder servicing agent for each class of the Fund. FIIOC receives account fees and asset-based fees that vary according to the account size and type of account of the shareholders of Dividend Growth. FIIOC receives no fees for providing transfer agency services to Class F. FIIOC pays for typesetting, printing and mailing of shareholder reports, except proxy statements. For the period, transfer agent fees for each class were as follows:
| Amount | % of
Average
Net Assets |
Dividend Growth | $ 19,090 | .21 |
Class K | 272 | .05 |
| $ 19,362 | |
Annual Report
Notes to Financial Statements - continued
(Amounts in thousands except ratios)
6. Fees and Other Transactions with Affiliates - continued
Accounting and Security Lending Fees. Fidelity Service Company, Inc. (FSC), an affiliate of FMR, maintains the Fund's accounting records. The accounting fee is based on the level of average net assets for the month. Under a separate contract, FSC administers the security lending program. The security lending fee is based on the number and duration of lending transactions.
Brokerage Commissions. The Fund placed a portion of its portfolio transactions with brokerage firms which are affiliates of the investment adviser. The commissions paid to these affiliated firms were $190 for the period.
Interfund Lending Program. Pursuant to an Exemptive Order issued by the SEC, the Fund, along with other registered investment companies having management contracts with FMR, may participate in an interfund lending program. This program provides an alternative credit facility allowing the funds to borrow from, or lend money to, other participating affiliated funds. The interest expense amounted to fifty-nine dollars under the interfund lending program. The Fund's activity in this program during the period for which loans were outstanding was as follows:
Borrower or Lender | Average Daily Loan Balance | Weighted Average Interest Rate |
Borrower | $ 6,139 | .35% |
7. Committed Line of Credit.
The Fund participates with other funds managed by FMR or an affiliate in a $4.0 billion credit facility (the "line of credit") to be utilized for temporary or emergency purposes to fund shareholder redemptions or for other short-term liquidity purposes. The Fund has agreed to pay commitment fees on its pro-rata portion of the line of credit, which amounted to $32 and is reflected in Miscellaneous expenses on the Statement of Operations. During the period, there were no borrowings on this line of credit.
8. Security Lending.
The Fund lends portfolio securities through a lending agent from time to time in order to earn additional income. The lending agent may loan securities to certain qualified borrowers, including Fidelity Capital Markets (FCM), a broker-dealer affiliated with the Fund. On the settlement date of the loan, the Fund receives collateral (in the form of U.S. Treasury obligations, letters of credit and/or cash) against the loaned securities and maintains collateral in an amount not less than 100% of the market value of the loaned securities during the period of the loan. The market value of the loaned securities is determined at the close of business of the Fund and any additional required collateral is delivered to the Fund on the next business day. If the borrower defaults on its obligation
Annual Report
8. Security Lending - continued
to return the securities loaned because of insolvency or other reasons, a fund could experience delays and costs in recovering the securities loaned or in gaining access to the collateral. Any cash collateral received is invested in the Fidelity Securities Lending Cash Central Fund. The value of loaned securities and cash collateral at period end are disclosed on the Fund's Statement of Assets and Liabilities. The value of securities loaned to FCM at period end was $897. Security lending income represents the income earned on investing cash collateral, less rebates paid to borrowers and lending agent fees associated with the loan, plus any premium payments received for lending certain types of securities. Security lending income is presented in the Statement of Operations as a component of income from Fidelity Central Funds. Total security lending income during the period amounted to $2,562, including $80 from securities loaned to FCM.
9. Expense Reductions.
Many of the brokers with whom FMR places trades on behalf of the Fund provided services in addition to trade execution. These services included payments of certain expenses on behalf of the Fund totaling $565 for the period.
10. Distributions to Shareholders.
Distributions to shareholders of each class were as follows:
Years ended July 31, | 2011 | 2010 |
From net investment income | | |
Dividend Growth | $ 48,547 | $ 37,603 |
Class K | 3,190 | 1,766 |
Total | $ 51,737 | $ 39,369 |
From net realized gain | | |
Dividend Growth | $ 25,105 | $ 15,884 |
Class K | 1,259 | 544 |
Total | $ 26,364 | $ 16,428 |
11. Share Transactions.
Transactions for each class of shares were as follows:
| Shares | Dollars |
Years ended July 31, | 2011 | 2010 | 2011 | 2010 |
Dividend Growth | | | | |
Shares sold | 76,617 | 100,583 | $ 2,092,410 | $ 2,382,785 |
Reinvestment of distributions | 2,707 | 2,281 | 68,380 | 51,426 |
Shares redeemed | (82,166) | (104,744) | (2,266,445) | (2,445,083) |
Net increase (decrease) | (2,842) | (1,880) | $ (105,655) | $ (10,872) |
Annual Report
Notes to Financial Statements - continued
(Amounts in thousands except ratios)
11. Share Transactions - continued
| Shares | Dollars |
Years ended July 31, | 2011 | 2010 | 2011 | 2010 |
Class K | | | | |
Shares sold | 11,524 | 7,715 | $ 323,383 | $ 180,965 |
Reinvestment of distributions | 175 | 102 | 4,449 | 2,310 |
Shares redeemed | (4,720) | (2,870) | (130,500) | (67,508) |
Net increase (decrease) | 6,979 | 4,947 | $ 197,332 | $ 115,767 |
12. Other.
The Fund's organizational documents provide former and current trustees and officers with a limited indemnification against liabilities arising in connection with the performance of their duties to the Fund. In the normal course of business, the Fund may also enter into contracts that provide general indemnifications. The Fund's maximum exposure under these arrangements is unknown as this would be dependent on future claims that may be made against the Fund. The risk of material loss from such claims is considered remote.
Annual Report
To the Trustees of Fidelity Securities Fund and the Shareholders of Fidelity Dividend Growth Fund:
In our opinion, the accompanying statement of assets and liabilities, including the schedule of investments, and the related statements of operations and of changes in net assets and the financial highlights present fairly, in all material respects, the financial position of Fidelity Dividend Growth Fund (a fund of Fidelity Securities Fund) at July 31, 2011, the results of its operations for the year then ended, the changes in its net assets for each of the two years in the period then ended and the financial highlights for each of the periods indicated, in conformity with accounting principles generally accepted in the United States of America. These financial statements and financial highlights (hereafter referred to as "financial statements") are the responsibility of the Fidelity Dividend Growth Fund's management. Our responsibility is to express an opinion on these financial statements based on our audits. We conducted our audits of these financial statements in accordance with the standards of the Public Company Accounting Oversight Board (United States). Those standards require that we plan and perform the audit to obtain reasonable assurance about whether the financial statements are free of material misstatement. An audit includes examining, on a test basis, evidence supporting the amounts and disclosures in the financial statements, assessing the accounting principles used and significant estimates made by management, and evaluating the overall financial statement presentation. We believe that our audits, which included confirmation of securities at July 31, 2011 by correspondence with the custodian and brokers, provide a reasonable basis for our opinion.
/s/PricewaterhouseCoopers LLP
PricewaterhouseCoopers LLP
Boston, Massachusetts
September 15, 2011
Annual Report
The Trustees, Members of the Advisory Board, and executive officers of the trust and fund, as applicable, are listed below. The Board of Trustees governs the fund and is responsible for protecting the interests of shareholders. The Trustees are experienced executives who meet periodically throughout the year to oversee the fund's activities, review contractual arrangements with companies that provide services to the fund, oversee management of the risks associated with such activities and contractual arrangements, and review the fund's performance. Except for Mr. James C. Curvey, each of the Trustees oversees 221 funds advised by FMR or an affiliate. Mr. Curvey oversees 419 funds advised by FMR or an affiliate.
The Trustees hold office without limit in time except that (a) any Trustee may resign; (b) any Trustee may be removed by written instrument, signed by at least two-thirds of the number of Trustees prior to such removal; (c) any Trustee who requests to be retired or who has become incapacitated by illness or injury may be retired by written instrument signed by a majority of the other Trustees; and (d) any Trustee may be removed at any special meeting of shareholders by a two-thirds vote of the outstanding voting securities of the trust. Each Trustee who is not an interested person (as defined in the 1940 Act) (Independent Trustee), shall retire not later than the last day of the calendar year in which his or her 75th birthday occurs. The Independent Trustees may waive this mandatory retirement age policy with respect to individual Trustees. The executive officers and Advisory Board Members hold office without limit in time, except that any officer and Advisory Board Member may resign or may be removed by a vote of a majority of the Trustees at any regular meeting or any special meeting of the Trustees. Except as indicated, each individual has held the office shown or other offices in the same company for the past five years.
Experience, Skills, Attributes, and Qualifications of the Fund's Trustees. The Governance and Nominating Committee has adopted a statement of policy that describes the experience, qualifications, attributes, and skills that are necessary and desirable for potential Independent Trustee candidates (Statement of Policy). The Board believes that each Trustee satisfied at the time he or she was initially elected or appointed a Trustee, and continues to satisfy, the standards contemplated by the Statement of Policy. The Governance and Nominating Committee also engages professional search firms to help identify potential Independent Trustee candidates who have the experience, qualifications, attributes, and skills consistent with the Statement of Policy. From time to time, additional criteria based on the composition and skills of the current Independent Trustees, as well as experience or skills that may be appropriate in light of future changes to board composition, business conditions, and regulatory or other developments, have also been considered by the professional search firms and the Governance and Nominating Committee. In addition, the Board takes into account the Trustees' commitment and participation in Board and committee meetings, as well as their leadership of standing and ad hoc committees throughout their tenure.
In determining that a particular Trustee was and continues to be qualified to serve as a Trustee, the Board has considered a variety of criteria, none of which, in isolation, was controlling. The Board believes that, collectively, the Trustees have balanced and diverse experience, qualifications, attributes, and skills, which allow the Board to operate effectively in governing the fund and protecting the interests of shareholders. Information about the specific experience, skills, attributes, and qualifications of each Trustee, which in each case led to the Board's conclusion that the Trustee should serve (or continue to serve) as a trustee of the fund, is provided below.
Annual Report
Board Structure and Oversight Function. James C. Curvey is an interested person (as defined in the 1940 Act) and currently serves as Acting Chairman. The Trustees have determined that an interested Chairman is appropriate and benefits shareholders because an interested Chairman has a personal and professional stake in the quality and continuity of services provided to the fund. Independent Trustees exercise their informed business judgment to appoint an individual of their choosing to serve as Chairman, regardless of whether the Trustee happens to be independent or a member of management. The Independent Trustees have determined that they can act independently and effectively without having an Independent Trustee serve as Chairman and that a key structural component for assuring that they are in a position to do so is for the Independent Trustees to constitute a substantial majority for the Board. The Independent Trustees also regularly meet in executive session. Ned C. Lautenbach serves as Chairman of the Independent Trustees and as such (i) acts as a liaison between the Independent Trustees and management with respect to matters important to the Independent Trustees and (ii) with management prepares agendas for Board meetings.
Fidelity funds are overseen by different Boards of Trustees. The fund's Board oversees Fidelity's equity and high income funds and another Board oversees Fidelity's investment-grade bond, money market, and asset allocation funds. The asset allocation funds may invest in Fidelity funds overseen by the fund's Board. The use of separate Boards, each with its own committee structure, allows the Trustees of each group of Fidelity funds to focus on the unique issues of the funds they oversee, including common research, investment, and operational issues. On occasion, the separate Boards establish joint committees to address issues of overlapping consequences for the Fidelity funds overseen by each Board.
The Trustees operate using a system of committees to facilitate the timely and efficient consideration of all matters of importance to the Trustees, the fund, and fund shareholders and to facilitate compliance with legal and regulatory requirements and oversight of the fund's activities and associated risks. The Board, acting through its committees, has charged FMR and its affiliates with (i) identifying events or circumstances the occurrence of which could have demonstrably adverse effects on the fund's business and/or reputation; (ii) implementing processes and controls to lessen the possibility that such events or circumstances occur or to mitigate the effects of such events or circumstances if they do occur; and (iii) creating and maintaining a system designed to evaluate continuously business and market conditions in order to facilitate the identification and implementation processes described in (i) and (ii) above. Because the day-to-day operations and activities of the fund are carried out by or through FMR, its affiliates and other service providers, the fund's exposure to risks is mitigated but not eliminated by the processes overseen by the Trustees. While each of the Board's committees has responsibility for overseeing different aspects of the fund's activities, oversight is exercised primarily through the Operations, Audit, and Compliance Committees. Appropriate personnel, including but not limited to the fund's Chief Compliance Officer (CCO), FMR's internal auditor, the independent accountants, the fund's Treasurer and portfolio management personnel, make periodic reports to the Board's committees, as appropriate. The responsibilities of each committee, including their oversight responsibilities, are described further under "Standing Committees of the Fund's Trustees."
Annual Report
Trustees and Officers - continued
The fund's Statement of Additional Information (SAI) includes more information about the Trustees. To request a free copy, call Fidelity at 1-800-544-8544.
Interested Trustees*:
Correspondence intended for each Trustee who is an interested person may be sent to Fidelity Investments, 82 Devonshire Street, Boston, Massachusetts 02109.
Name, Age; Principal Occupations and Other Relevant Experience+ |
James C. Curvey (76) |
| Year of Election or Appointment: 2007 Mr. Curvey is Trustee and Acting Chairman of the Board of Trustees of certain Trusts. Mr. Curvey also serves as Trustee (2007-present) of other investment companies advised by FMR. Mr. Curvey is a Director of Fidelity Investments Money Management, Inc. (2009-present), Director of Fidelity Research & Analysis Co. (2009-present) and Director of FMR and FMR Co., Inc. (2007-present). Mr. Curvey is also Vice Chairman (2007-present) and Director of FMR LLC. In addition, Mr. Curvey serves as an Overseer for the Boston Symphony Orchestra and a member of the Trustees of Villanova University. Previously, Mr. Curvey was the Vice Chairman (2006-2007) and Director (2000-2007) of FMR Corp. |
Ronald P. O'Hanley (54) |
| Year of Election or Appointment: 2011 Mr. O'Hanley is Director of FMR Co., Inc. (2010-present), Director of Fidelity Investments Money Management, Inc. (2010-present), Director of Fidelity Research & Analysis Company (2010-present), President of Fidelity Asset Management and Corporate Services and a member of Fidelity's Executive Committee (2010-present). Previously, Mr. O'Hanley served as President and Chief Executive Officer of BNY Mellon Asset Management (2007-2010). Mr. O'Hanley also served as Vice Chairman of Bank New York Mellon Corp. and a member of that firm's Executive Committee. Prior to the 2007 merger of The Bank of New York and Mellon Financial Corporation, he was Vice Chairman of Mellon Financial Corporation and President and Chief Executive Officer of Mellon Asset Management. He joined Mellon in February 1997. Mr. O'Hanley currently serves as Chairman of the Boston Public Library Foundation Board of Directors and sits on the Board of Directors of Beth Israel Deaconess Medical Center, the Board of Trustees of the Marine Biological Laboratory and the Advisory Board of the Maxwell School of Citizenship and Public Administration at Syracuse University. Mr. O'Hanley also chairs the Council on Asset Management for the Financial Services Roundtable and is a member of the Board of Directors of Institutional Investor's U.S. Institute. |
* Trustees have been determined to be "Interested Trustees" by virtue of, among other things, their affiliation with the trust or various entities under common control with FMR.
+ The information above includes each Trustee's principal occupation during the last five years and other information relating to the experience, attributes, and skills relevant to each Trustee's qualifications to serve as a Trustee, which led to the conclusion that each Trustee should serve as a Trustee for the fund.
Annual Report
Trustees and Officers - continued
Independent Trustees:
Correspondence intended for each Independent Trustee (that is, the Trustees other than the Interested Trustees) may be sent to Fidelity Investments, P.O. Box 55235, Boston, Massachusetts 02205-5235.
Name, Age; Principal Occupations and Other Relevant Experience+ |
Dennis J. Dirks (63) |
| Year of Election or Appointment: 2005 Prior to his retirement in May 2003, Mr. Dirks was Chief Operating Officer and a member of the Board of The Depository Trust & Clearing Corporation (DTCC). He also served as President, Chief Operating Officer, and Board member of The Depository Trust Company (DTC) and President and Board member of the National Securities Clearing Corporation (NSCC). In addition, Mr. Dirks served as Chief Executive Officer and Board member of the Government Securities Clearing Corporation, Chief Executive Officer and Board member of the Mortgage-Backed Securities Clearing Corporation, as a Trustee and a member of the Finance Committee of Manhattan College (2005-2008), and as a Trustee and a member of the Finance Committee of AHRC of Nassau County (2006-2008). Mr. Dirks is a member of the Independent Directors Council (IDC) Governing Council (2010-Present) and Board of Directors for The Brookville Center for Children's Services, Inc. (2009-present). |
Alan J. Lacy (57) |
| Year of Election or Appointment: 2008 Mr. Lacy serves as Senior Adviser (2007-present) of Oak Hill Capital Partners, L.P. (private equity). Mr. Lacy also served as Chief Executive Officer (2000-2005) and Vice Chairman (2005-2006) of Sears Holdings Corporation and Sears, Roebuck and Co. (retail). In addition, Mr. Lacy serves as a member of the Board of Directors of Dave & Buster's, Inc. (restaurant and entertainment complexes, 2010-present), The Hillman Companies, Inc. (hardware wholesalers, 2010-present), and Bristol-Myers Squibb Company (global pharmaceuticals, 2007-present). Mr. Lacy is a member of the Board of Trustees of The National Parks Conservation Association (2006-Present). Previously, Mr. Lacy served as Chairman of the Board of Trustees of the National Parks Conservation Association (2008-2011) and as a member of the Board of Directors for the Western Union Company (global money transfer, 2006-2011). |
Ned C. Lautenbach (67) |
| Year of Election or Appointment: 2000 Mr. Lautenbach is Chairman of the Independent Trustees of the Equity and High Income Funds (2006-present). Mr. Lautenbach currently serves as the Lead Director of the Eaton Corporation Board of Directors (diversified industrial, 1997-present). Mr. Lautenbach is also a member of the Board of Directors of the Philharmonic Center for the Arts in Naples, Florida (1999-present); a member of the Board of Trustees of Fairfield University (2005-present); and a member of the Council on Foreign Relations (1994-present). Previously, Mr. Lautenbach was a Partner/Advisory Partner at Clayton, Dubilier & Rice, LLC (private equity investment, 1998-2010), as well as a Director of Sony Corporation (2006-2007). |
Joseph Mauriello (66) |
| Year of Election or Appointment: 2008 Prior to his retirement in January 2006, Mr. Mauriello served in numerous senior management positions including Deputy Chairman and Chief Operating Officer (2004-2005), and Vice Chairman of Financial Services (2002-2004) of KPMG LLP US (professional services, 1965-2005). Mr. Mauriello currently serves as a member of the Board of Directors of XL Group plc. (global insurance and re-insurance, 2006-present) and of Arcadia Resources Inc. (health care services and products, 2007-present). Previously, Mr. Mauriello served as a Director of the Hamilton Funds of the Bank of New York (2006-2007). |
Robert W. Selander (60) |
| Year of Election or Appointment: 2011 Previously, Mr. Selander served as a Member of the Advisory Board of Fidelity's Equity and High Income Funds (2011), Executive Vice Chairman (2010), Chief Executive Officer (2009-2010), and President and Chief Executive Officer (1997-2009) of Mastercard, Inc. |
Cornelia M. Small (67) |
| Year of Election or Appointment: 2005 Ms. Small is a member of the Board of Directors of the Teagle Foundation (2009-present). Ms. Small is also a member of the Investment Committee, and Chair (2008-present) and a member of the Board of Trustees of Smith College. In addition, Ms. Small serves on the Investment Committee of the Berkshire Taconic Community Foundation (2008-present). Previously, Ms. Small served as Chairperson of the Investment Committee (2002-2008) of Smith College. In addition, Ms. Small served as Chief Investment Officer, Director of Global Equity Investments, and a member of the Board of Directors of Scudder, Stevens & Clark and Scudder Kemper Investments. |
William S. Stavropoulos (72) |
| Year of Election or Appointment: 2001 Mr. Stavropoulos is Vice Chairman of the Independent Trustees of the Equity and High Income Funds (2006-present). Mr. Stavropoulos serves as President and Founder of the Michigan Baseball Foundation, the Great Lakes Loons (2007-present). Mr. Stavropoulos is Chairman Emeritus of the Board of Directors of The Dow Chemical Company, where he previously served in numerous senior management positions, including President, CEO (1995-2000; 2002-2004), Chairman of the Executive Committee (2000-2006), and as a member of the Board of Directors (1990-2006). Currently, Mr. Stavropoulos is Chairman of Univar (global distributor of commodity and specialty chemicals, 2010-present), a Director of Teradata Corporation (data warehousing and technology solutions, 2008-present), Chemical Financial Corporation, Maersk Inc. (industrial conglomerate), Tyco International, Inc. (multinational manufacturing and services, 2007-present), and a member of the Advisory Board for Metalmark Capital (private equity investment, 2005-present). Mr. Stavropoulos is a special advisor to Clayton, Dubilier & Rice, LLC (private equity investment). In addition, Mr. Stavropoulos is a member of the University of Notre Dame Advisory Council for the College of Science. |
David M. Thomas (62) |
| Year of Election or Appointment: 2008 Previously, Mr. Thomas served as Executive Chairman (2005-2006) and Chairman and Chief Executive Officer (2000-2005) of IMS Health, Inc. (pharmaceutical and healthcare information solutions). In addition, Mr. Thomas serves as a member of the Board of Directors of Fortune Brands, Inc. (consumer products), and Interpublic Group of Companies, Inc. (marketing communication, 2004-present). |
Michael E. Wiley (60) |
| Year of Election or Appointment: 2008 Mr. Wiley also serves as a Director of Asia Pacific Exploration Consolidated (international oil and gas exploration and production, 2008-present). Mr. Wiley serves as a Director of Tesoro Corporation (independent oil refiner and marketer, 2005-present), and a Director of Bill Barrett Corporation (exploration and production, 2005-present). In addition, Mr. Wiley also serves as a Director of Post Oak Bank (privately-held bank, 2004-present). Previously, Mr. Wiley served as a member of the Board of Trustees of the University of Tulsa (2000-2006; 2007-2010), as a Senior Energy Advisor of Katzenbach Partners, LLC (consulting, 2006-2007), as an Advisory Director of Riverstone Holdings (private investment), Chairman, President, and CEO of Baker Hughes, Inc. (oilfield services, 2000-2004), and as Director of Spinnaker Exploration Company (exploration and production, 2001-2005). |
Annual Report
+ The information above includes each Trustee's principal occupation during the last five years and other information relating to the experience, attributes, and skills relevant to each Trustee's qualifications to serve as a Trustee, which led to the conclusion that each Trustee should serve as a Trustee for the fund.
Advisory Board Members and Executive Officers:
Correspondence intended for each executive officer, Edward C. Johnson 3d, and Peter S. Lynch may be sent to Fidelity Investments, 82 Devonshire Street, Boston, Massachusetts 02109.
Name, Age; Principal Occupation |
Edward C. Johnson 3d (81) |
| Year of Election or Appointment: 2011 Member of the Advisory Board of Fidelity's Equity and High Income Funds. Mr. Johnson serves as Chief Executive Officer, Chairman, and a Director of FMR LLC, and also serves as Chairman and Director of FIL Limited. Previously, Mr. Johnson served as a Trustee and Chairman of the Board of certain Fidelity Trusts, Chairman and a Director of FMR, Chairman and a Director of FMR Co., Inc., and President of FMR LLC (2006-2007). |
Peter S. Lynch (67) |
| Year of Election or Appointment: 2003 Member of the Advisory Board of Fidelity's Equity and High Income Funds. Mr. Lynch is Vice Chairman and a Director of FMR and FMR Co., Inc. In addition, Mr. Lynch serves as a Trustee of Boston College and as the Chairman of the Inner-City Scholarship Fund. Previously, Mr. Lynch served on the Special Olympics International Board of Directors (1997-2006). |
Kenneth B. Robins (41) |
| Year of Election or Appointment: 2008 President and Treasurer of Fidelity's Equity and High Income Funds. Mr. Robins also serves as President and Treasurer (2010-present) and Assistant Treasurer (2009-present) of other Fidelity funds and is an employee of Fidelity Investments (2004-present). Previously, Mr. Robins served as Deputy Treasurer of the Fidelity funds (2005-2008) and Treasurer and Chief Financial Officer of The North Carolina Capital Management Trust: Cash and Term Portfolios (2006-2008). |
Bruce T. Herring (45) |
| Year of Election or Appointment: 2006 Vice President of certain Equity Funds. Mr. Herring also serves as Chief Investment Officer and Director of Fidelity Management & Research (U.K.) Inc. (2010-present) and Group Chief Investments Officer of FMR. Previously, Mr. Herring served as Vice President (2005-2006) and Senior Vice President (2006-2007) of Fidelity Management & Research Company, Vice President of FMR Co., Inc. (2001-2007) and as a portfolio manager for Fidelity U.S. Equity Funds. |
Brian B. Hogan (46) |
| Year of Election or Appointment: 2009 Vice President of Equity and High Income Funds. Mr. Hogan also serves as President of FMR's Equity Division (2009-present). Previously, Mr. Hogan served as Senior Vice President, Equity Research of FMR (2006-2009) and as a portfolio manager. |
Scott C. Goebel (43) |
| Year of Election or Appointment: 2008 Secretary and Chief Legal Officer (CLO) of the Fidelity funds. Mr. Goebel also serves as Secretary of Fidelity Investments Money Management, Inc. (FIMM) (2010-present) and Fidelity Research and Analysis Company (FRAC) (2010-present); Secretary and CLO of The North Carolina Capital Management Trust: Cash and Term Portfolios (2008-present); General Counsel, Secretary, and Senior Vice President of FMR (2008-present) and FMR Co., Inc. (2008-present); employed by FMR LLC or an affiliate (2001-present); Chief Legal Officer of Fidelity Management & Research (Hong Kong) Limited (2008-present) and Assistant Secretary of Fidelity Management & Research (Japan) Inc. (2008-present), and Fidelity Management & Research (U.K.) Inc. (2008-present). Previously, Mr. Goebel served as Assistant Secretary of FIMM (2008-2010), FRAC (2008-2010), and the Funds (2007-2008) and as Vice President and Secretary of Fidelity Distributors Corporation (FDC) (2005-2007). |
William C. Coffey (42) |
| Year of Election or Appointment: 2009 Assistant Secretary of Fidelity's Equity and High Income Funds. Mr. Coffey also serves as Senior Vice President and Deputy General Counsel of FMR LLC (2010-present), and is an employee of Fidelity Investments. Previously, Mr. Coffey served as Vice President and Associate General Counsel of FMR LLC (2005-2009). |
Holly C. Laurent (57) |
| Year of Election or Appointment: 2008 Anti-Money Laundering (AML) Officer of the Fidelity funds. Ms. Laurent also serves as AML Officer of The North Carolina Capital Management Trust: Cash and Term Portfolios (2008-present) and is an employee of Fidelity Investments. Previously, Ms. Laurent was Senior Vice President and Head of Legal for Fidelity Business Services India Pvt. Ltd. (2006-2008), and Senior Vice President, Deputy General Counsel and Group Head for FMR LLC (2005-2006). |
Christine Reynolds (52) |
| Year of Election or Appointment: 2008 Chief Financial Officer of the Fidelity funds. Ms. Reynolds became President of Fidelity Pricing and Cash Management Services (FPCMS) in August 2008. Ms. Reynolds served as Chief Operating Officer of FPCMS (2007-2008). Previously, Ms. Reynolds served as President, Treasurer, and Anti-Money Laundering officer of the Fidelity funds (2004-2007). |
Kenneth A. Rathgeber (64) |
| Year of Election or Appointment: 2004 Chief Compliance Officer of Fidelity's Equity and High Income Funds. Mr. Rathgeber is Chief Compliance Officer of Fidelity Management & Research (Hong Kong) Limited (2008-present), Fidelity Management & Research (Japan) Inc. (2008-present), FMR (2005-present), FMR Co., Inc. (2005-present), Fidelity Management & Research (U.K.) Inc. (2005-present), Fidelity Research & Analysis Company (2005-present), Fidelity Investments Money Management, Inc. (2005-present), Pyramis Global Advisors, LLC (2005-present), and Strategic Advisers, Inc. (2005-present). |
Jeffrey S. Christian (49) |
| Year of Election or Appointment: 2009 Deputy Treasurer of the Fidelity funds. Mr. Christian is an employee of Fidelity Investments. Previously, Mr. Christian served as Chief Financial Officer (2008-2009) of certain Fidelity funds and Senior Vice President of Fidelity Pricing and Cash Management Services (FPCMS) (2004-2009). |
Bryan A. Mehrmann (50) |
| Year of Election or Appointment: 2005 Deputy Treasurer of the Fidelity funds. Mr. Mehrmann is an employee of Fidelity Investments. |
Adrien E. Deberghes (43) |
| Year of Election or Appointment: 2008 Deputy Treasurer of Fidelity's Equity and High Income Funds. Mr. Deberghes also serves as Assistant Treasurer of other Fidelity funds (2010-present) and is an employee of Fidelity Investments (2008-present). Previously, Mr. Deberghes served as Senior Vice President of Mutual Fund Administration at State Street Corporation (2007-2008), Senior Director of Mutual Fund Administration at Investors Bank & Trust (2005-2007), and Director of Finance for Dunkin' Brands (2000-2005). |
Stephanie J. Dorsey (42) |
| Year of Election or Appointment: 2010 Assistant Treasurer of Fidelity's Equity and High Income Funds. Ms. Dorsey also serves as Deputy Treasurer of other Fidelity funds (2008-present) and is an employee of Fidelity Investments (2008-present). Previously, Ms. Dorsey served as Treasurer (2004-2008) of the JPMorgan Mutual Funds and Vice President (2004-2008) of JPMorgan Chase Bank. |
John R. Hebble (53) |
| Year of Election or Appointment: 2009 Assistant Treasurer of Fidelity's Equity and High Income Funds. Mr. Hebble also serves as President (2011-present), Treasurer, and Chief Financial Officer of The North Carolina Capital Management Trust: Cash and Term Portfolios (2008-present), President and Treasurer of other Fidelity funds (2008-present) and is an employee of Fidelity Investments. |
Gary W. Ryan (52) |
| Year of Election or Appointment: 2005 Assistant Treasurer of the Fidelity funds. Mr. Ryan is an employee of Fidelity Investments. Previously, Mr. Ryan served as Vice President of Fund Reporting in Fidelity Pricing and Cash Management Services (FPCMS) (1999-2005). |
Jonathan Davis (43) |
| Year of Election or Appointment: 2010 Assistant Treasurer of the Fidelity funds. Mr. Davis is an employee of Fidelity Investments. Previously, Mr. Davis served as Vice President and Associate General Counsel of FMR LLC (2003-2010). |
Annual Report
The Board of Trustees of Fidelity Dividend Growth Fund voted to pay on record date, the following distributions per share derived from capital gains realized from sales of portfolio securities, and dividends derived from net investment income:
| Pay Date | Record Date | Dividends | Capital Gains |
Dividend Growth | 9/12/11 | 9/09/11 | $0.062 | $0.015 |
Dividend Growth designates 100% of the dividends distributed in September and December, respectively during the fiscal year as qualifying for the dividends-received deduction for corporate shareholders.
Dividend Growth designates 100% of the dividends distributed in September and December, respectively during the fiscal year as amounts which may be taken into account as a dividend for the purposes of the maximum rate under section 1(h)(11) of the Internal Revenue Code.
The fund will notify shareholders in January 2012 of amounts for use in preparing 2011 income tax returns.
Annual Report
Board Approval of Investment Advisory Contracts and Management Fees
Fidelity Dividend Growth Fund
Each year, the Board of Trustees, including the Independent Trustees (together, the Board), votes on the renewal of the management contract and sub-advisory agreements (together, the Advisory Contracts) for the fund. The Board, assisted by the advice of fund counsel and Independent Trustees' counsel, requests and considers a broad range of information relevant to the renewal of the Advisory Contracts throughout the year.
The Board meets regularly and considers at each of its meetings factors that are relevant to its annual consideration of the renewal of the fund's Advisory Contracts, including the services and support provided to the fund and its shareholders. The Board has established various standing committees, each composed of Independent Trustees with varying backgrounds, to which the Board has assigned specific subject matter responsibilities in order to enhance effective decision-making by the Board. The Board, acting directly and through its Committees, requests and receives information concerning the annual consideration of the renewal of the fund's Advisory Contracts. The Board also meets as needed to consider matters specifically related to the Board's annual consideration of the renewal of Advisory Contracts. Members of the Board may also meet with trustees of other Fidelity funds through ad hoc joint committees to discuss certain matters relevant to the Fidelity funds.
At its July 2011 meeting, the Board of Trustees, including the Independent Trustees, unanimously determined to renew the fund's Advisory Contracts. In reaching its determination, the Board considered all factors it believed relevant, including (i) the nature, extent, and quality of the services to be provided to the fund and its shareholders (including the investment performance of the fund); (ii) the competitiveness of the fund's management fee and total expense ratio; (iii) the total costs of the services to be provided by and the profits to be realized by Fidelity from its relationship with the fund; (iv) the extent to which economies of scale would be realized as the fund grows; and (v) whether fee levels reflect these economies of scale, if any, for the benefit of fund shareholders.
In considering whether to renew the Advisory Contracts for the fund, the Board reached a determination, with the assistance of fund counsel and Independent Trustees' counsel and through the exercise of its business judgment, that the renewal of the Advisory Contracts is in the best interests of the fund and its shareholders and that the compensation payable under the Advisory Contracts is fair and reasonable. The Board's decision to renew the Advisory Contracts was not based on any single factor, but rather was based on a comprehensive consideration of all the information provided to the Board at its meetings throughout the year. The Board, in reaching its determination to renew the Advisory Contracts, is aware that shareholders in the fund have a broad range of investment choices available to them, including a wide choice among mutual funds offered by Fidelity's competitors, and that the fund's shareholders, who have the opportunity to review and weigh the disclosure provided by the fund in its prospectus and other public disclosures, have chosen to invest in this fund, managed by Fidelity.
Annual Report
Nature, Extent, and Quality of Services Provided. The Board considered the staffing within the investment adviser, FMR, and the sub-advisers (together, the Investment Advisers), including the backgrounds of the fund's investment personnel and the fund's investment objective and discipline. The Independent Trustees also had discussions with senior management of Fidelity's investment operations and investment groups. The Board considered the structure of the portfolio manager compensation program and whether this structure provides appropriate incentives to act in the best interests of the fund.
Resources Dedicated to Investment Management and Support Services. The Board and the Fund Oversight and Research Committees reviewed the general qualifications and capabilities of the Investment Advisers' investment staff, including its size, education, experience, and resources, as well as the Investment Advisers' approach to recruiting, training, managing, and compensating investment personnel. The Board also noted that FMR has devoted increased resources to non-U.S. offices. The Board noted that Fidelity's analysts have extensive resources, tools and capabilities which allow them to conduct sophisticated quantitative and fundamental analysis, as well as credit analysis of issuers, counterparties and enhancers. The Board also believes that Fidelity's investment professionals have sufficient access to global information and data so as to provide competitive investment results over time, and that those professionals also have access to sophisticated tools which permit them to assess portfolio construction and risk and performance attribution characteristics continuously, as well as to transmit new information and research conclusions rapidly around the world. Additionally, in their deliberations, the Board considered the Investment Advisers' trading capabilities and resources which are an integral part of the investment management process.
Shareholder and Administrative Services. The Board considered (i) the nature, extent, quality, and cost of advisory, administrative, and shareholder services performed by the Investment Advisers and their affiliates under the Advisory Contracts and under separate agreements covering transfer agency, pricing and bookkeeping, and securities lending services for the fund; (ii) the nature and extent of the investment adviser's supervision of third party service providers, principally custodians and subcustodians; and (iii) the resources devoted to, and the record of compliance with, the fund's compliance policies and procedures. The Board also reviewed the allocation of fund brokerage, including allocations to brokers affiliated with the Investment Advisers, the use of brokerage commissions to pay fund expenses, and the use of "soft" commission dollars to pay for research services.
The Board noted that the growth of fund assets over time across the complex allows Fidelity to reinvest in the development of services designed to enhance the value or convenience of the Fidelity funds as investment vehicles. These services include 24-hour access to account information and market information through telephone representatives and over the Internet, investor education materials and asset allocation tools, and the expanded availability of Fidelity Investor Centers, with 35 new branches opening since 2010.
Annual Report
Board Approval of Investment Advisory Contracts and
Management Fees - continued
Investment in a Large Fund Family. The Board considered the benefits to shareholders of investing in a Fidelity fund, including the benefits of investing in a fund that is part of a large family of funds offering a variety of investment disciplines and providing a large variety of mutual fund investor services. The Board noted that Fidelity had taken, or had made recommendations that resulted in the Fidelity funds taking, a number of actions over the previous year that benefited particular funds, including (i) continuing to dedicate additional resources to investment research and support of the senior management team that oversees asset management; (ii) rationalizing product lines through the mergers of six funds into other funds; (iii) continuing to migrate the Freedom Funds to dedicated lower cost underlying funds; (iv) obtaining shareholder approval to broaden the investment strategies for Fidelity Consumer Finance Portfolio, Fidelity Emerging Asia Fund, and Fidelity Environment and Alternative Energy Portfolio; (v) contractually agreeing to reduce the management fees and impose other expense limitations on Spartan® 500 Index Fund and U.S. Bond Index Fund in connection with launching new institutional classes of these funds; (vi) changing the name, primary and supplemental benchmarks, and investment policies of Fidelity Global Strategies Fund to support the fund's flexible investment mandate and global orientation; and (vii) reducing the transfer agency account fee rates on certain accounts.
Investment Performance. The Board considered whether the fund has operated in accordance with its investment objective, as well as its record of compliance with its investment restrictions. It also reviewed the fund's absolute investment performance for each class, as well as the fund's relative investment performance for each class measured over multiple periods against (i) a broad-based securities market index, and (ii) a peer group of mutual funds deemed appropriate by Fidelity and reviewed by the Board. The following charts considered by the Board show, over the one-, three-, and five-year periods ended December 31, 2010, as available, the cumulative total returns of Class K and the retail class of the fund, the cumulative total returns of a broad-based securities market index ("benchmark"), and a range of cumulative total returns of a peer group of mutual funds identified by Morningstar, Inc. as having an investment style similar to that of the fund based on underlying portfolio holdings. The box within each chart shows the 25th percentile return (bottom of box) and the 75th percentile return (top of box) of the peer group. Returns shown above the box are in the first quartile and returns shown below the box are in the fourth quartile. The percentage beaten numbers noted below each chart correspond to the percentile box and represent the percentage of funds in the peer group whose performance was equal to or lower than that of the class indicated.
Annual Report
Fidelity Dividend Growth Fund
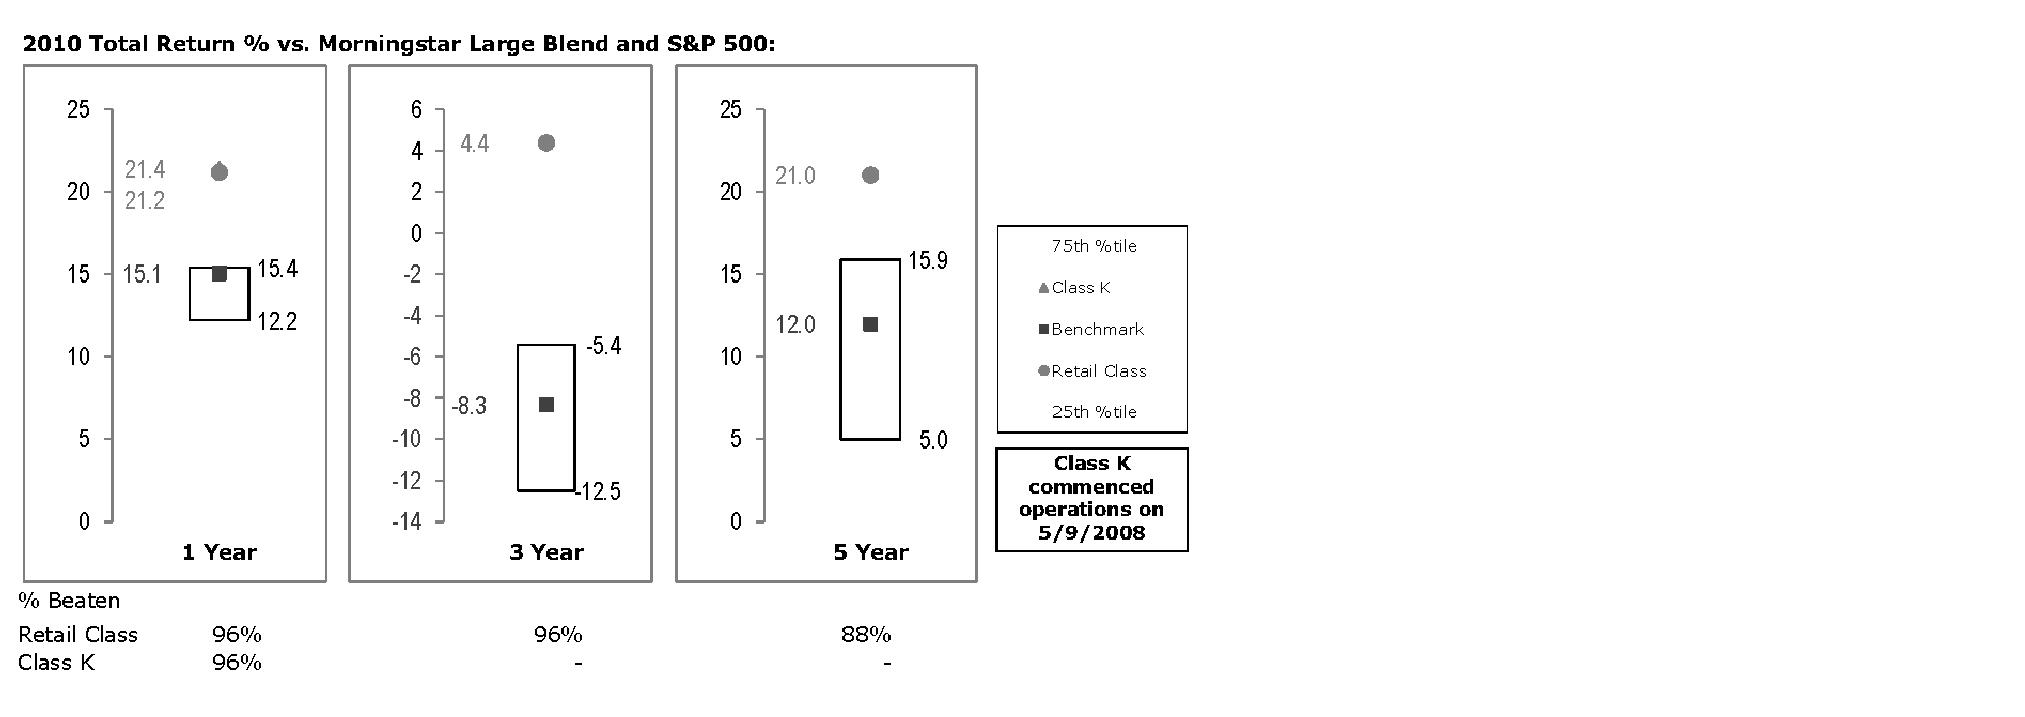
The Board reviewed the fund's relative investment performance against its peer group and noted that the performance of the retail class of the fund (the class with the longer performance record) was in the first quartile for all the periods shown. The Board also noted that the investment performance of the retail class of the fund compared favorably to its benchmark for all the periods shown. The Board considered that the variations in performance between the fund's classes reflect the variations in class expenses, which result in lower performance for the higher expense class. The Board also reviewed the fund's performance since inception as well as performance in the current year.
The Board also considered that the fund's management fee is subject to upward or downward adjustment depending upon whether, and to what extent, the fund's investment performance for the performance period exceeds, or is exceeded by, the record (over the same period) of a Board-approved performance adjustment index. The Board noted that the performance adjustment provides FMR with a strong economic incentive to seek to achieve superior performance for the fund's shareholders and helps to more closely align the interests of FMR and the fund's shareholders.
Based on its review, the Board concluded that the nature, extent, and quality of services provided to the fund under the Advisory Contracts should benefit the fund's shareholders.
Competitiveness of Management Fee and Total Expense Ratio. The Board considered the fund's management fee and total expense ratio compared to "mapped groups" of competitive funds and classes. Fidelity creates "mapped groups" by combining similar Lipper investment objective categories that have comparable management fee characteristics. Combining Lipper investment objective categories aids the Board's management fee and total expense ratio comparisons by broadening the competitive group used for comparison and by reducing the number of universes to which various Fidelity funds are compared.
Annual Report
Board Approval of Investment Advisory Contracts and
Management Fees - continued
Management Fee. The Board considered two proprietary management fee comparisons for the 12-month periods shown in the chart below. The group of Lipper funds used by the Board for management fee comparisons is referred to below as the "Total Mapped Group." The Total Mapped Group comparison focuses on a fund's standing relative to the total universe of comparable funds available to investors in terms of gross management fees before expense reimbursements or caps, and without giving effect to the fund's performance adjustment. "TMG %" represents the percentage of funds in the Total Mapped Group that had management fees that were lower than the fund's. For example, a TMG % of 10% means that 90% of the funds in the Total Mapped Group had higher management fees than the fund. The "Asset-Size Peer Group" (ASPG) comparison focuses on a fund's standing relative to non-Fidelity funds similar in size to the fund within the Total Mapped Group. The ASPG represents at least 15% of the funds in the Total Mapped Group with comparable asset size and management fee characteristics, subject to a minimum of 50 funds (or all funds in the Total Mapped Group if fewer than 50). Additional information, such as the ASPG quartile in which the fund's management fee ranked and the impact of the fund's performance adjustment, is also included in the chart and considered by the Board.
Fidelity Dividend Growth Fund
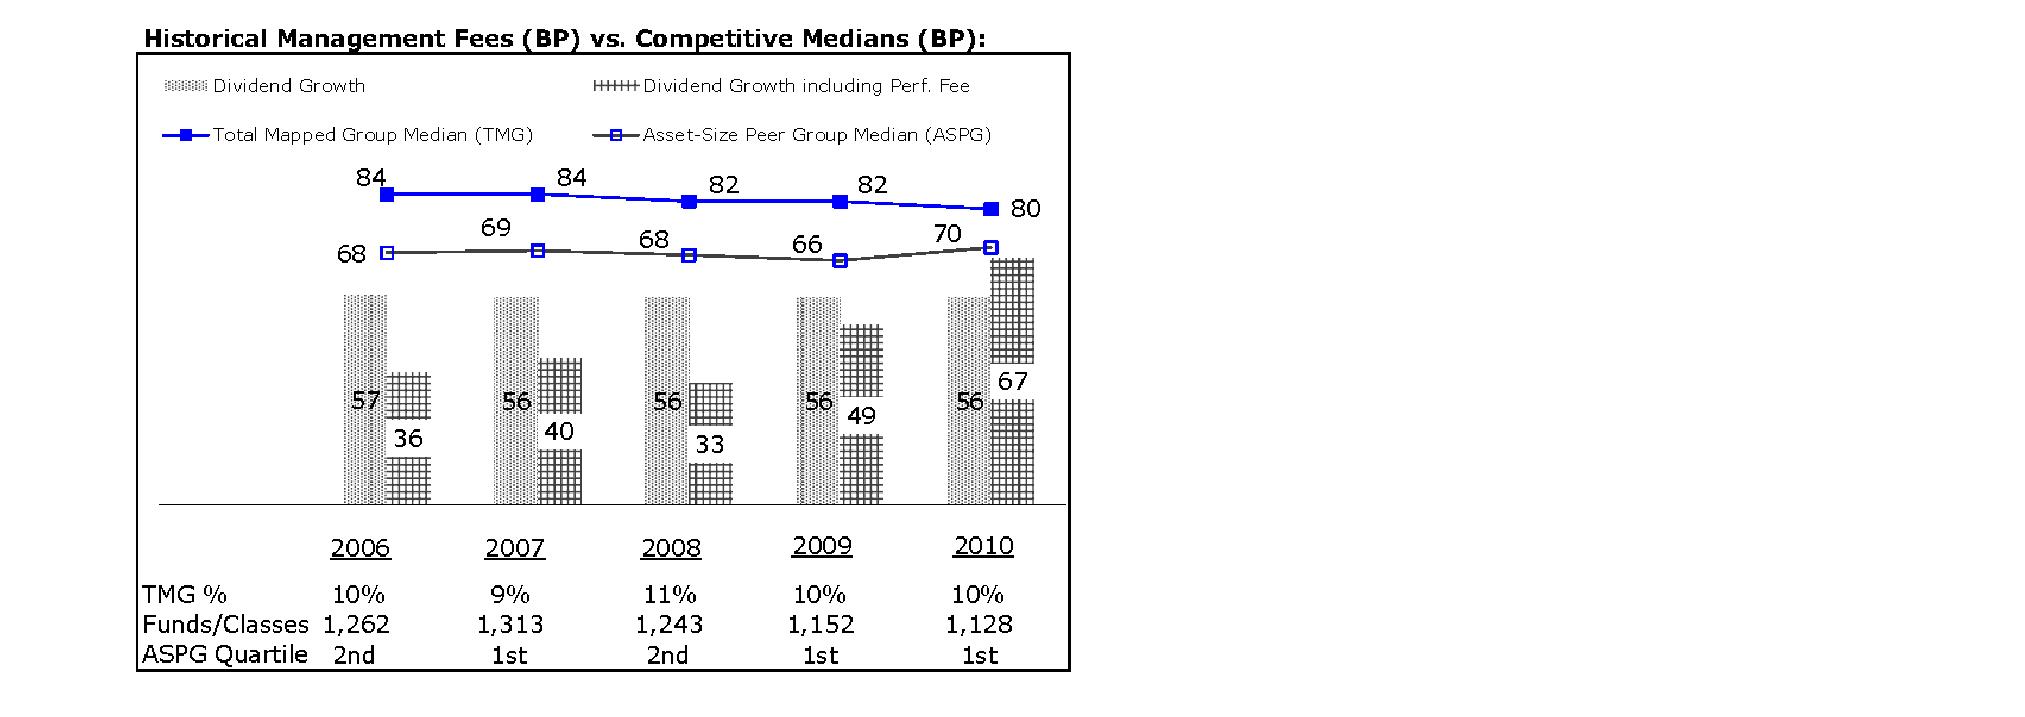
Annual Report
The Board noted that the fund's management fee ranked below the median of its Total Mapped Group and below the median of its ASPG for 2010. The Board also noted the effect of the fund's positive performance adjustment on the fund's management fee ranking. The Board noted that the performance adjustment for each year represents calculations for performance periods that differ from the periods shown in the performance charts above.
Based on its review, the Board concluded that the fund's management fee is fair and reasonable in light of the services that the fund receives and the other factors considered.
Total Expense Ratio. In its review of each class's total expense ratio, the Board considered the fund's management fee as well as other fund or class expenses, as applicable, such as transfer agent fees, pricing and bookkeeping fees, and custodial, legal, and audit fees. The Board also noted the effects of any waivers and reimbursements on fees and expenses, as well as the impact of the fund's performance adjustment. As part of its review, the Board also considered the current and historical total expense ratios of each class of the fund compared to competitive fund median expenses. Each class of the fund is compared to those funds and classes in the Total Mapped Group (used by the Board for management fee comparisons) that have a similar sales load structure.
The Board noted that the total expense ratio of each class ranked below its competitive median for 2010. The Board considered that various factors, including 12b-1 fees, positive or negative performance adjustments, and relatively higher other expenses in the case of small fund size, can affect total expense ratios.
Fees Charged to Other Fidelity Clients. The Board also considered Fidelity fee structures and other information with respect to clients of FMR and its affiliates, such as other mutual funds advised or subadvised by FMR or its affiliates, pension plan clients, and other institutional clients. In March 2010, the Board created an ad hoc joint committee with the board of other Fidelity funds (the Committee) to review and compare Fidelity's institutional investment advisory business with its business of providing services to the Fidelity funds, including the differences in services provided, fees charged, and costs incurred, as well as competition in their respective marketplaces.
Based on its review of total expense ratios and fees charged to other Fidelity clients, the Board concluded that the total expense ratio of each class of the fund was reasonable in light of the services that the fund and its shareholders receive and the other factors considered, including the findings of the Committee.
Costs of the Services and Profitability. The Board considered the revenues earned and the expenses incurred by Fidelity in conducting the business of developing, marketing, distributing, managing, administering and servicing the fund and its shareholders. The Board also considered the level of Fidelity's profits in respect of all the Fidelity funds.
Annual Report
Board Approval of Investment Advisory Contracts and
Management Fees - continued
On an annual basis, FMR presents to the Board Fidelity's profitability for the fund. Fidelity calculates the profitability for each fund, as well as aggregate profitability for groups of Fidelity funds and all Fidelity funds, using a series of detailed revenue and cost allocation methodologies which originate with the books and records of Fidelity on which Fidelity's audited financial statements are based. The Audit Committee of the Board reviews any significant changes from the prior year's methodologies.
PricewaterhouseCoopers LLP (PwC), independent registered public accounting firm and auditor to Fidelity and certain Fidelity funds, has been engaged annually by the Board as part of the Board's assessment of Fidelity's profitability analysis. PwC's engagement includes the review and assessment of Fidelity's methodologies used in determining the revenues and expenses attributable to Fidelity's mutual fund business, and completion of agreed-upon procedures surrounding the mathematical accuracy of fund profitability and its conformity to allocation methodologies. After considering PwC's reports issued under the engagement and information provided by Fidelity, the Board concluded that while other allocation methods may also be reasonable, Fidelity's profitability methodologies are reasonable in all material respects.
The Board also reviewed Fidelity's non-fund businesses and fall-out benefits related to the mutual fund business as well as cases where Fidelity's affiliates may benefit from or be related to the fund's business.
The Board considered the costs of the services provided by and the profits realized by Fidelity in connection with the operation of the fund and was satisfied that the profitability was not excessive in the circumstances.
Economies of Scale. The Board considered whether there have been economies of scale in respect of the management of the Fidelity funds, whether the Fidelity funds (including the fund) have appropriately benefited from any such economies of scale, and whether there is potential for realization of any further economies of scale. The Board considered the extent to which the fund will benefit from economies of scale through increased services to the fund, through waivers or reimbursements, or through fee or expense reductions. The Board also noted that in 2009, it and the board of other Fidelity funds created an ad hoc committee (the Economies of Scale Committee) to analyze whether FMR attains economies of scale in respect of the management and servicing of the Fidelity funds, whether the Fidelity funds have appropriately benefited from such economies of scale, and whether there is potential for realization of any further economies of scale.
The Board recognized that the fund's management contract incorporates a "group fee" structure, which provides for lower group fee rates as total fund assets under FMR's management increase, and for higher group fee rates as total fund assets under FMR's management decrease. FMR calculates the group fee rates based on a tiered asset "breakpoint" schedule that varies based on asset class. The Board considered that the group fee is designed to deliver the benefits of economies of scale to fund shareholders when total Fidelity fund assets increase, even if assets of any particular fund are unchanged or have declined, because some portion of Fidelity's costs are attributable to services provided to all Fidelity funds, and all funds benefit if those costs can be allocated among more assets. The Board concluded that, given the group fee structure, fund shareholders will benefit from lower management fees as assets under FMR's management increase at the fund complex level, regardless of whether Fidelity achieves any such economies of scale.
Annual Report
The Board concluded, taking into account the analysis of the Economies of Scale Committee, that any potential economies of scale are being appropriately shared between fund shareholders and Fidelity.
Additional Information Requested by the Board. In order to develop fully the factual basis for consideration of the Fidelity funds' Advisory Contracts, the Board requested and received additional information on certain topics, including (i) fund performance trends, actions to be taken by FMR to improve certain funds' overall performance, and Fidelity's long-term strategies for certain funds; (ii) portfolio manager changes that have occurred during the past year and length of portfolio manager tenure for different categories of funds over time; (iii) Fidelity's compensation structure for portfolio managers and other key personnel and strategies for attracting and retaining non-investment personnel; (iv) the amount of the investment that each portfolio manager has made in the Fidelity fund(s) that he or she manages; (v) historical trends in Fidelity's realization of fall-out benefits; (vi) Fidelity's group fee structures and the rationale for the individual fee rates of certain funds; (vii) fund profitability methodology and the impact of certain factors on fund profitability results; (viii) trends regarding industry use of performance fee structures and Fidelity's compliance practices with respect to performance adjustment calculations; (ix) the fee structures in place for certain other Fidelity clients; and (x) explanations regarding the relative total expense ratios of certain funds and classes, total expense competitive trends, and actions that might be taken by FMR to reduce total expense ratios for certain funds and classes.
Based on its evaluation of all of the conclusions noted above, and after considering all factors it believed relevant, the Board ultimately concluded that the advisory fee structures are fair and reasonable, and that the fund's Advisory Contracts should be renewed.
Annual Report
Managing Your Investments
Fidelity offers several ways to conveniently manage your personal investments via your telephone or PC. You can access your account information, conduct trades and research your investments 24 hours a day.
By Phone
Fidelity Automated Service Telephone provides a single toll-free number to access account balances, positions, quotes and trading. It's easy to navigate the service, and on your first call, the system will help you create a personal identification number (PIN) for security.
(phone_graphic)
Fidelity Automated
Service Telephone (FAST®)
1-800-544-5555
Press
For mutual fund and brokerage trading.
For quotes.*
For account balances and holdings.
To review orders and mutual
fund activity.
To change your PIN.
To speak to a Fidelity representative.
By PC
Fidelity's web site on the Internet provides a wide range of information, including daily financial news, fund performance, interactive planning tools and news about Fidelity products and services.
(computer_graphic)
Fidelity's Web Site
www.fidelity.com
* When you call the quotes line, please remember that a fund's yield and return will vary and, except for money market funds, share price will also vary. This means that you may have a gain or loss when you sell your shares. There is no assurance that money market funds will be able to maintain a stable $1 share price; an investment in a money market fund is not insured or guaranteed by the U.S. government. Total returns are historical and include changes in share price, reinvestment of dividends and capital gains distributions, and the effects of any sales charges.
Annual Report
To Write Fidelity
We'll give your correspondence immediate attention and send you written confirmation upon completion of your request.
(letter_graphic)
Making Changes
To Your Account
(such as changing name, address, bank, etc.)
Fidelity Investments
P.O. Box 770001
Cincinnati, OH 45277-0002
(letter_graphic)
For Non-Retirement
Accounts
Buying shares
Fidelity Investments
P.O. Box 770001
Cincinnati, OH 45277-0003
Overnight Express
Fidelity Investments
Attn: Distribution Services
100 Crosby Parkway - KC1H
Covington, KY 41015
Selling shares
Fidelity Investments
P.O. Box 770001
Cincinnati, OH 45277-0035
Overnight Express
Fidelity Investments
Attn: Distribution Services
100 Crosby Parkway - KC1H
Covington, KY 41015
General Correspondence
Fidelity Investments
P.O. Box 500
Merrimack, NH 03054-0500
(letter_graphic)
For Retirement
Accounts
Buying shares
Fidelity Investments
P.O. Box 770001
Cincinnati, OH 45277-0003
Selling shares
Fidelity Investments
P.O. Box 770001
Cincinnati, OH 45277-0035
Overnight Express
Fidelity Investments
Attn: Distribution Services
100 Crosby Parkway - KC1H
Covington, KY 41015
General Correspondence
Fidelity Investments
P.O. Box 500
Merrimack, NH 03054-0500
Annual Report
Investment Adviser
Fidelity Management & Research Company
Boston, MA
Investment Sub-Advisers
FMR Co., Inc.
Fidelity Management & Research
(U.K.) Inc.
Fidelity Management & Research
(Hong Kong) Limited
Fidelity Management & Research
(Japan) Inc.
General Distributor
Fidelity Distributors Corporation
Boston, MA
Transfer and Service Agents
Fidelity Investments Institutional
Operations Company, Inc.
Boston, MA
Fidelity Service Company, Inc.
Boston, MA
Custodian
Citibank, N.A.,
New York, NY
The Fidelity Telephone Connection
Mutual Fund 24-Hour Service
Exchanges/Redemptions
and Account Assistance 1-800-544-6666
Product Information 1-800-544-6666
Retirement Accounts 1-800-544-4774 (8 a.m. - 9 p.m.)
TDD Service 1-800-544-0118 for the deaf and hearing impaired
(9 a.m. - 9 p.m. Eastern time)
Fidelity Automated Service
Telephone (FAST®) 1-800-544-5555
Automated line for quickest service
DGF-UANN-0911
1.789245.108
Fidelity®
Dividend Growth
Fund -
Class K
Annual Report
July 31, 2011
(2_fidelity_logos) (Registered_Trademark)
Contents
Chairman's Message | <Click Here> | The Chairman's message to shareholders. |
Performance | <Click Here> | How the fund has done over time. |
Management's Discussion of Fund Performance | <Click Here> | The Portfolio Manager's review of fund performance and strategy. |
Shareholder Expense Example | <Click Here> | An example of shareholder expenses. |
Investment Changes | <Click Here> | A summary of major shifts in the fund's investments over the past six months. |
Investments | <Click Here> | A complete list of the fund's investments with their market values. |
Financial Statements | <Click Here> | Statements of assets and liabilities, operations, and changes in net assets,
as well as financial highlights. |
Notes | <Click Here> | Notes to the financial statements. |
Report of Independent Registered Public Accounting Firm | <Click Here> | |
Trustees and Officers | <Click Here> | |
Distributions | <Click Here> | |
Board Approval of Investment Advisory Contracts and Management Fees | <Click Here> | |
To view a fund's proxy voting guidelines and proxy voting record for the 12-month period ended June 30, visit http://www.fidelity.com/proxyvotingresults or visit the Securities and Exchange Commission's (SEC) web site at http://www.sec.gov. You may also call 1-800-835-5092 to request a free copy of the proxy voting guidelines.
Standard & Poor's, S&P and S&P 500 are registered service marks of The McGraw-Hill Companies, Inc. and have been licensed for use by Fidelity Distributors Corporation.
Other third party marks appearing herein are the property of their respective owners.
All other marks appearing herein are registered or unregistered trademarks or service marks of FMR LLC or an affiliated company.
Annual Report
This report and the financial statements contained herein are submitted for the general information of the shareholders of the fund. This report is not authorized for distribution to prospective investors in the fund unless preceded or accompanied by an effective prospectus.
A fund files its complete schedule of portfolio holdings with the SEC for the first and third quarters of each fiscal year on Form N-Q. Forms N-Q are available on the SEC's web site at http://www.sec.gov. A fund's Forms N-Q may be reviewed and copied at the SEC's Public Reference Room in Washington, DC. Information regarding the operation of the SEC's Public Reference Room may be obtained by calling 1-800-SEC-0330. For a complete list of a fund's portfolio holdings, view the most recent holdings listing, semiannual report, or annual report on Fidelity's web site at http://www.fidelity.com, http://www.advisor.fidelity.com, or http://www.401k.com, as applicable.
NOT FDIC INSURED • MAY LOSE VALUE • NO BANK GUARANTEE
Neither the fund nor Fidelity Distributors Corporation is a bank.
Annual Report
(photo_of_James_C_Curvey)
Dear Shareholder:
The second half of 2011 began with U.S. equities continuing to give back some of the gains achieved earlier in the year. In the days leading up to July 31, markets were shaken by a political stalemate in which Congress struggled to address the debt ceiling issue before an early-August deadline. The resulting uncertainty held back markets in July, the third consecutive monthly decline for equities, effectively reversing the positive momentum seen through the end of April. Financial markets are always unpredictable, of course, but there are several time-tested investment principles that can help put the odds in your favor.
One of the basic tenets is to invest for the long term. Over time, riding out the markets' inevitable ups and downs has proven much more effective than selling into panic or chasing the hottest trend. Even missing only a few of the markets' best days can significantly diminish investor returns. Patience also affords the benefits of compounding - of earning interest on additional income or reinvested dividends and capital gains. There can be tax advantages and cost benefits to consider as well. While staying the course doesn't eliminate risk, it can considerably lessen the effect of short-term declines.
You can further manage your investing risk through diversification. And today, more than ever, geographic diversification should be taken into account. Studies indicate that asset allocation is the single most important determinant of a portfolio's long-term success. The right mix of stocks, bonds and cash - aligned to your particular risk tolerance and investment objective - is very important. Age-appropriate rebalancing is also an essential aspect of asset allocation. For younger investors, an emphasis on equities - which historically have been the best-performing asset class over time - is encouraged. As investors near their specific goal, such as retirement or sending a child to college, consideration may be given to replacing volatile assets (e.g. common stocks) with more-stable fixed investments (bonds or savings plans).
A third principle - investing regularly - can help lower the average cost of your purchases. Investing a certain amount of money each month or quarter helps ensure you won't pay for all your shares at market highs. This strategy - known as dollar cost averaging - also reduces "emotion" from investing, helping shareholders avoid selling weak performers just prior to an upswing, or chasing a hot performer just before a correction.
We invite you to contact us via the Internet, through our Investor Centers or by phone. It is our privilege to provide you the information you need to make the investments that are right for you.
Sincerely,
(The acting chairman's signature appears here.)
James C. Curvey
Acting Chairman
Annual Report
Average annual total return reflects the change in the value of an investment, assuming reinvestment of the class' distributions from dividend income and capital gains (the profits earned upon the sale of securities that have grown in value, if any) and assuming a constant rate of performance each year. The $10,000 table and the fund's returns do not reflect the deduction of taxes that a shareholder would pay on fund distributions or the redemption of fund shares. During periods of reimbursement by Fidelity, a fund's total return will be greater than it would be had the reimbursement not occurred. How a fund did yesterday is no guarantee of how it will do tomorrow.
Average Annual Total Returns
Periods ended July 31, 2011 | Past 1
year | Past 5
years | Past 10
years |
Class K A | 22.79% | 3.90% | 2.60% |
A The initial offering of Class K shares took place on May 9, 2008. Returns prior to May 9, 2008 are those of Fidelity® Dividend Growth Fund, the original class of the fund.
$10,000 Over 10 Years
Let's say hypothetically that $10,000 was invested in Fidelity® Dividend Growth Fund - Class K on July 31, 2001. The chart shows how the value of your investment would have changed, and also shows how the S&P 500® Index performed over the same period. The initial offering of Class K took place on May 9, 2008. See above for additional information regarding the performance of Class K.
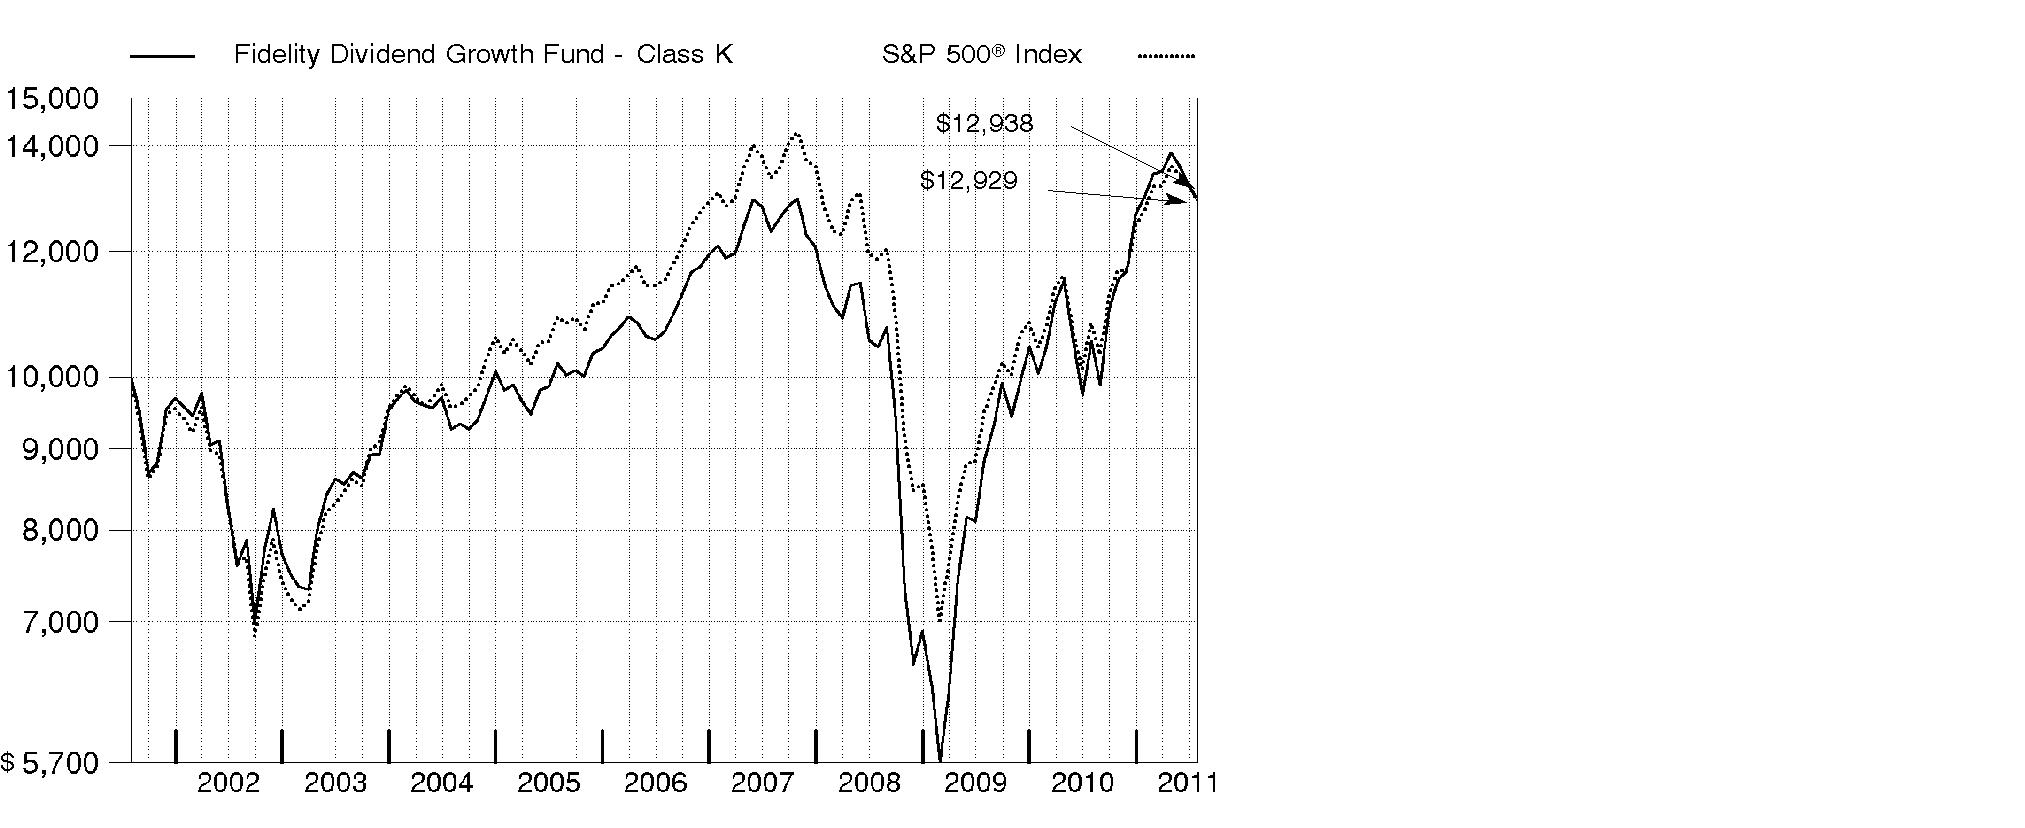
Annual Report
Market Recap: U.S. stocks registered solid double-digit gains for the 12 months ending July 31, 2011, extending a rally that began more than two years earlier. Despite a rough start in August 2010, markets turned positive in September, as increased demand for capital goods and other upbeat indicators trumped investor worry about a U.S. recessionary relapse. The broad market, as measured by the S&P 500® Index, rose 9% that month, its biggest September gain in 71 years. Seven more monthly advances followed, fueled by encouraging corporate earnings and economic activity. However, volatility picked up in the period's latter months, as markets reacted to continued high U.S. unemployment, nagging debt troubles in Europe and looming legislative battles over the federal debt ceiling. May unemployment rose above 9% for the first time in 2011, contributing to a traditional "June swoon" for stocks. Market uncertainty lingered in July, when the S&P 500® posted its second-biggest monthly loss of the period. For the full year, the S&P 500® climbed 19.65%, while the blue-chip-laden Dow Jones Industrial AverageSM rose a comparable 19.09% and the technology-heavy Nasdaq Composite® Index gained 23.40%. On the capitalization spectrum, stocks of mid-cap companies fared best, with the Russell Midcap® Index rising 24.51% and the small-cap Russell 2000® Index adding 23.92%.
Comments from Lawrence Rakers, Portfolio Manager of Fidelity® Dividend Growth Fund: For the year, the fund's Class K shares returned 22.79%, topping the S&P 500. Stock selection in health care, industrials and technology aided performance. From a market-capitalization perspective, investments in the mid- and small-cap segments helped. The fund's foreign exposure lifted overall performance, aided in part by a weaker U.S. dollar. The fund's top relative contributor was Atmel, which makes semiconductors that support various touch-screen applications. Strong consumer demand for smartphones and tablet computers enabled our holdings in the stock to gain more than 186%. Other contributors included drilling rig provider National Oilwell Varco and specialty chemicals manufacturer W.R. Grace. Underweighting two lagging index components, Bank of America and insurance-focused conglomerate Berkshire Hathaway, also helped. Atmel and W.R. Grace were not in the index, and the fund did not hold Atmel or Bank of America at period end. The only significant negative sector influence was consumer discretionary, fueled mainly by poor picks in retailing. In terms of individual detractors, the fund was hurt by underweighting or not owning some strong-performing index components, including energy majors Exxon Mobil and Chevron, technology services heavyweight International Business Machines and Internet retailer Amazon.com.
The views expressed above reflect those of the portfolio manager(s) only through the end of the period as stated on the cover of this report and do not necessarily represent the views of Fidelity or any other person in the Fidelity organization. Any such views are subject to change at any time based upon market or other conditions and Fidelity disclaims any responsibility to update such views. These views may not be relied on as investment advice and, because investment decisions for a Fidelity fund are based on numerous factors, may not be relied on as an indication of trading intent on behalf of any Fidelity fund.
Annual Report
Shareholder Expense Example
As a shareholder of the Fund, you incur two types of costs: (1) transaction costs, and (2) ongoing costs, including management fees and other Fund expenses. This Example is intended to help you understand your ongoing costs (in dollars) of investing in the Fund and to compare these costs with the ongoing costs of investing in other mutual funds.
The Example is based on an investment of $1,000 invested at the beginning of the period and held for the entire period (February 1, 2011 to July 31, 2011).
Actual Expenses
The first line of the accompanying table for each class of the Fund provides information about actual account values and actual expenses. You may use the information in this line, together with the amount you invested, to estimate the expenses that you paid over the period. Simply divide your account value by $1,000.00 (for example, an $8,600 account value divided by $1,000.00 = 8.6), then multiply the result by the number in the first line for a class of the Fund under the heading entitled "Expenses Paid During Period" to estimate the expenses you paid on your account during this period. A small balance maintenance fee of $12.00 that is charged once a year may apply for certain accounts with a value of less than $2,000. This fee is not included in the table below. If it was, the estimate of expenses you paid during the period would be higher, and your ending account value lower, by this amount. In addition, the Fund, as a shareholder in the underlying Fidelity Central Funds, will indirectly bear its pro-rata share of the fees and expenses incurred by the underlying Fidelity Central Funds. These fees and expenses are not included in the Fund's annualized expense ratio used to calculate the expense estimate in the table below.
Hypothetical Example for Comparison Purposes
The second line of the accompanying table for each class of the Fund provides information about hypothetical account values and hypothetical expenses based on a Class' actual expense ratio and an assumed rate of return of 5% per year before expenses, which is not the Class' actual return. The hypothetical account values and expenses may not be used to estimate the actual ending account balance or expenses you paid for the period. You may use this information to compare the ongoing costs of investing in the Fund and other funds. To do so, compare this 5% hypothetical example with the 5% hypothetical examples that appear in the shareholder reports of the other funds. A small balance maintenance fee of $12.00 that is charged once a year may apply for certain accounts with a value of less than $2,000. This fee is not included in the table below. If it was, the estimate of expenses you paid during the period would be higher, and your ending account value lower, by this amount. In addition, the Fund, as a shareholder in the underlying Fidelity Central Funds, will indirectly bear its pro-rata share of the fees and expenses incurred by the underlying Fidelity Central Funds. These fees and expenses are not included in the Fund's annualized expense ratio used to calculate the expense estimate in the table below.
Please note that the expenses shown in the table are meant to highlight your ongoing costs only and do not reflect any transaction costs. Therefore, the second line of the table is useful in comparing ongoing costs only, and will not help you determine the relative total costs of owning different funds.
Annual Report
| Annualized Expense Ratio | Beginning
Account Value
February 1, 2011 | Ending
Account Value
July 31, 2011 | Expenses Paid
During Period*
February 1, 2011
to July 31, 2011 |
Dividend Growth | .93% | | | |
Actual | | $ 1,000.00 | $ 993.80 | $ 4.60 |
HypotheticalA | | $ 1,000.00 | $ 1,020.18 | $ 4.66 |
Class K | .78% | | | |
Actual | | $ 1,000.00 | $ 994.90 | $ 3.86 |
HypotheticalA | | $ 1,000.00 | $ 1,020.93 | $ 3.91 |
A 5% return per year before expenses
* Expenses are equal to each Class' annualized expense ratio, multiplied by the average account value over the period, multiplied by 181/365 (to reflect the one-half year period).
Annual Report
Investment Changes (Unaudited)
Top Ten Stocks as of July 31, 2011 |
| % of fund's
net assets | % of fund's net assets
6 months ago |
Apple, Inc. | 3.1 | 2.7 |
Wells Fargo & Co. | 1.5 | 1.8 |
Citigroup, Inc. | 1.4 | 1.6 |
JPMorgan Chase & Co. | 1.4 | 1.6 |
The Coca-Cola Co. | 1.4 | 1.3 |
General Electric Co. | 1.3 | 1.3 |
Procter & Gamble Co. | 1.1 | 0.7 |
Philip Morris International, Inc. | 1.1 | 0.8 |
Oracle Corp. | 1.0 | 0.9 |
Exxon Mobil Corp. | 0.9 | 0.3 |
| 14.2 | |
Top Five Market Sectors as of July 31, 2011 |
| % of fund's
net assets | % of fund's net assets
6 months ago |
Information Technology | 16.4 | 17.3 |
Industrials | 14.5 | 14.5 |
Financials | 14.0 | 15.8 |
Energy | 13.7 | 12.2 |
Consumer Discretionary | 11.0 | 10.7 |
Asset Allocation (% of fund's net assets) |
As of July 31, 2011 * | As of January 31, 2011 ** |
| Stocks and Investment Companies 99.0% | | | Stocks and Investment Companies 97.8% | |
| Convertible
Securities 0.7% | | | Convertible
Securities 1.1% | |
| Short-Term
Investments and
Net Other Assets 0.3% | | | Short-Term
Investments and
Net Other Assets 1.1% | |
* Foreign investments | 20.8% | | ** Foreign investments | 19.6% | |

Annual Report
Investments July 31, 2011
Showing Percentage of Net Assets
Common Stocks - 98.6% |
| Shares | | Value (000s) |
CONSUMER DISCRETIONARY - 10.6% |
Auto Components - 0.5% |
Autoliv, Inc. | 32,700 | | $ 2,163 |
Minth Group Ltd. | 4,178,000 | | 6,712 |
Modine Manufacturing Co. (a) | 659,005 | | 9,826 |
Tenneco, Inc. (a) | 449,723 | | 17,962 |
TRW Automotive Holdings Corp. (a) | 187,287 | | 9,452 |
| | 46,115 |
Automobiles - 0.4% |
Bajaj Auto Ltd. | 20,403 | | 678 |
Harley-Davidson, Inc. | 307,705 | | 13,351 |
Honda Motor Co. Ltd. | 151,500 | | 6,012 |
Thor Industries, Inc. | 16,300 | | 403 |
Winnebago Industries, Inc. (a)(d) | 1,869,336 | | 15,684 |
| | 36,128 |
Distributors - 0.1% |
Silver Base Group Holdings Ltd. | 11,002,000 | | 10,079 |
Diversified Consumer Services - 0.6% |
Anhanguera Educacional Participacoes SA | 61,200 | | 1,187 |
DeVry, Inc. | 206,485 | | 12,831 |
Grand Canyon Education, Inc. (a) | 555,923 | | 8,556 |
Service Corp. International | 1,072,000 | | 11,224 |
Stewart Enterprises, Inc. Class A | 1,785,724 | | 12,411 |
Weight Watchers International, Inc. | 123,500 | | 9,533 |
| | 55,742 |
Hotels, Restaurants & Leisure - 2.0% |
Accor SA | 314,961 | | 13,925 |
Ajisen (China) Holdings Ltd. | 1,876,000 | | 3,692 |
Bravo Brio Restaurant Group, Inc. | 482,615 | | 10,786 |
Brinker International, Inc. | 1,096,707 | | 26,343 |
Club Mediterranee SA (a) | 609,547 | | 14,477 |
Denny's Corp. (a) | 2,354,503 | | 8,971 |
DineEquity, Inc. (a)(d) | 462,765 | | 24,110 |
McDonald's Corp. | 262,259 | | 22,680 |
NH Hoteles SA (a) | 613,573 | | 3,861 |
O'Charleys, Inc. (a)(e) | 1,502,425 | | 9,150 |
Sands China Ltd. (a) | 3,935,600 | | 11,841 |
Spur Corp. Ltd. | 2,155,450 | | 4,484 |
Starbucks Corp. | 139,130 | | 5,578 |
Common Stocks - continued |
| Shares | | Value (000s) |
CONSUMER DISCRETIONARY - continued |
Hotels, Restaurants & Leisure - continued |
WMS Industries, Inc. (a) | 977,143 | | $ 26,940 |
Wyndham Worldwide Corp. | 270,833 | | 9,368 |
| | 196,206 |
Household Durables - 0.4% |
Dorel Industries, Inc. Class B (sub. vtg.) | 248,500 | | 7,280 |
Garmin Ltd. (d) | 267,668 | | 8,734 |
Lennar Corp. Class A | 109,500 | | 1,937 |
Newell Rubbermaid, Inc. | 692,167 | | 10,742 |
Standard Pacific Corp. (a)(d) | 2,610,820 | | 7,467 |
Techtronic Industries Co. Ltd. | 7,675,000 | | 8,016 |
| | 44,176 |
Internet & Catalog Retail - 0.0% |
Liberty Media Corp. Interactive Series A (a) | 102,000 | | 1,674 |
Leisure Equipment & Products - 0.1% |
Giant Manufacturing Co. Ltd. | 429,000 | | 1,716 |
Hasbro, Inc. | 261,601 | | 10,349 |
Summer Infant, Inc. (a) | 231,730 | | 1,995 |
| | 14,060 |
Media - 2.6% |
Antena 3 Television SA | 285,600 | | 2,273 |
Comcast Corp.: | | | |
Class A | 51,870 | | 1,246 |
Class A (special) (non-vtg.) | 2,514,015 | | 58,677 |
Dentsu, Inc. | 201,300 | | 6,298 |
DISH Network Corp. Class A (a) | 474,345 | | 14,055 |
Havas SA (d) | 474,651 | | 2,230 |
JC Decaux SA (a) | 57,200 | | 1,580 |
Kabel Deutschland Holding AG (a) | 168,900 | | 9,529 |
MDC Partners, Inc. Class A (sub. vtg.) | 1,194,639 | | 23,857 |
Mood Media Corp. | 1,083,500 | | 3,504 |
Mood Media Corp. (g) | 2,002,900 | | 6,478 |
The Walt Disney Co. | 1,283,625 | | 49,574 |
Time Warner Cable, Inc. | 260,956 | | 19,131 |
Time Warner, Inc. | 1,335,749 | | 46,965 |
Valassis Communications, Inc. (a) | 411,984 | | 11,041 |
| | 256,438 |
Multiline Retail - 0.9% |
Maoye International Holdings Ltd. | 22,874,000 | | 10,918 |
Marisa Lojas SA | 747,600 | | 10,506 |
Common Stocks - continued |
| Shares | | Value (000s) |
CONSUMER DISCRETIONARY - continued |
Multiline Retail - continued |
PPR SA | 76,800 | | $ 14,235 |
Target Corp. | 1,026,921 | | 52,876 |
| | 88,535 |
Specialty Retail - 2.5% |
Advance Auto Parts, Inc. | 466,900 | | 25,665 |
American Eagle Outfitters, Inc. | 448,713 | | 5,896 |
Asbury Automotive Group, Inc. (a) | 479,969 | | 10,334 |
Best Buy Co., Inc. | 364,842 | | 10,070 |
Big 5 Sporting Goods Corp. | 455,600 | | 3,759 |
Carphone Warehouse Group PLC | 1,419,949 | | 9,621 |
Casual Male Retail Group, Inc. (a) | 1,897,014 | | 7,986 |
Citi Trends, Inc. (a) | 274,100 | | 3,846 |
DSW, Inc. Class A (a) | 69,379 | | 3,676 |
Fast Retailing Co. Ltd. | 36,800 | | 6,541 |
Foot Locker, Inc. | 712,327 | | 15,479 |
Foschini Ltd. | 1,061,804 | | 13,967 |
GOME Electrical Appliances Holdings Ltd. | 6,022,000 | | 2,843 |
Guess?, Inc. | 253,409 | | 9,660 |
Hengdeli Holdings Ltd. | 18,822,000 | | 9,346 |
Home Depot, Inc. | 338,968 | | 11,840 |
Limited Brands, Inc. | 124,700 | | 4,721 |
Lowe's Companies, Inc. | 2,009,712 | | 43,370 |
Lumber Liquidators Holdings, Inc. (a)(d) | 403,619 | | 6,341 |
MarineMax, Inc. (a) | 776,868 | | 7,139 |
Office Depot, Inc. (a) | 122,608 | | 463 |
OfficeMax, Inc. (a) | 1,209,322 | | 8,562 |
SuperGroup PLC (a) | 576,787 | | 10,084 |
Urban Outfitters, Inc. (a) | 544,268 | | 17,710 |
| | 248,919 |
Textiles, Apparel & Luxury Goods - 0.5% |
Bosideng International Holdings Ltd. | 21,804,000 | | 6,407 |
G-III Apparel Group Ltd. (a) | 441,792 | | 13,638 |
Peak Sport Products Co. Ltd. | 4,855,000 | | 2,822 |
PVH Corp. | 296,663 | | 21,226 |
VF Corp. | 81,636 | | 9,535 |
| | 53,628 |
TOTAL CONSUMER DISCRETIONARY | | 1,051,700 |
Common Stocks - continued |
| Shares | | Value (000s) |
CONSUMER STAPLES - 8.9% |
Beverages - 2.4% |
Anheuser-Busch InBev SA NV | 302,047 | | $ 17,384 |
Britvic PLC | 1,710,164 | | 9,851 |
Carlsberg A/S Series B | 155,800 | | 15,324 |
Dr Pepper Snapple Group, Inc. | 441,360 | | 16,666 |
Grupo Modelo SAB de CV Series C | 2,577,900 | | 15,904 |
PepsiCo, Inc. | 458,223 | | 29,345 |
The Coca-Cola Co. | 2,019,741 | | 137,363 |
| | 241,837 |
Food & Staples Retailing - 1.5% |
Casey's General Stores, Inc. | 231,842 | | 10,433 |
CVS Caremark Corp. | 2,026,938 | | 73,679 |
Droga Raia SA | 345,600 | | 6,405 |
Eurocash SA | 443,959 | | 4,340 |
Kroger Co. | 250,835 | | 6,238 |
Susser Holdings Corp. (a) | 629,230 | | 10,263 |
Sysco Corp. | 93,955 | | 2,874 |
Walgreen Co. | 988,918 | | 38,607 |
| | 152,839 |
Food Products - 1.7% |
Archer Daniels Midland Co. | 669,479 | | 20,339 |
Calavo Growers, Inc. | 499,533 | | 10,325 |
Calbee, Inc. | 57,200 | | 2,408 |
Danone | 183,800 | | 13,152 |
Flowers Foods, Inc. (d) | 459,918 | | 10,081 |
Green Mountain Coffee Roasters, Inc. (a) | 312,600 | | 32,495 |
Kraft Foods, Inc. Class A | 1,263,241 | | 43,430 |
Orion Corp. | 2,040 | | 991 |
Sara Lee Corp. | 798,146 | | 15,253 |
Shenguan Holdings Group Ltd. | 4,564,000 | | 2,922 |
TreeHouse Foods, Inc. (a) | 282,074 | | 14,566 |
| | 165,962 |
Household Products - 1.4% |
Colgate-Palmolive Co. | 43,230 | | 3,648 |
Procter & Gamble Co. | 1,766,302 | | 108,610 |
Spectrum Brands Holdings, Inc. (a) | 411,959 | | 10,999 |
Unicharm Corp. | 314,800 | | 14,234 |
Youyuan International Holdings Ltd. (a) | 8,394,000 | | 3,877 |
| | 141,368 |
Common Stocks - continued |
| Shares | | Value (000s) |
CONSUMER STAPLES - continued |
Personal Products - 0.2% |
BaWang International (Group) Holding Ltd. | 10,702,000 | | $ 1,758 |
Biostime International Holdings Ltd. | 1,186,500 | | 2,597 |
Estee Lauder Companies, Inc. Class A | 111,635 | | 11,712 |
Hengan International Group Co. Ltd. | 825,000 | | 7,172 |
| | 23,239 |
Tobacco - 1.7% |
Altria Group, Inc. | 1,202,848 | | 31,635 |
British American Tobacco PLC (United Kingdom) | 241,000 | | 11,126 |
Imperial Tobacco Group PLC | 389,210 | | 13,526 |
KT&G Corp. | 34,272 | | 2,132 |
Philip Morris International, Inc. | 1,496,319 | | 106,493 |
| | 164,912 |
TOTAL CONSUMER STAPLES | | 890,157 |
ENERGY - 13.7% |
Energy Equipment & Services - 4.7% |
Aker Drilling ASA (a) | 1,191,860 | | 3,630 |
Aker Solutions ASA | 1,398,971 | | 24,631 |
Baker Hughes, Inc. | 507,010 | | 39,232 |
Basic Energy Services, Inc. (a) | 81,600 | | 2,643 |
Cal Dive International, Inc. (a) | 1,652,183 | | 9,219 |
Cameron International Corp. (a) | 380,313 | | 21,275 |
Cathedral Energy Services Ltd. | 1,333,000 | | 11,901 |
Ensco International Ltd. ADR | 57,100 | | 3,041 |
Essential Energy Services Ltd. (a) | 2,325,300 | | 5,354 |
Halliburton Co. | 1,170,475 | | 64,060 |
Helmerich & Payne, Inc. | 81,752 | | 5,645 |
Hornbeck Offshore Services, Inc. (a) | 45,000 | | 1,253 |
ION Geophysical Corp. (a) | 2,084,278 | | 21,135 |
Kvaerner ASA (a) | 1,398,971 | | 2,972 |
National Oilwell Varco, Inc. | 1,022,223 | | 82,361 |
Noble Corp. | 329,108 | | 12,134 |
Pioneer Drilling Co. (a) | 228,188 | | 3,713 |
Saipem SpA | 287,799 | | 15,044 |
Schlumberger Ltd. | 947,454 | | 85,621 |
Superior Energy Services, Inc. (a) | 122,634 | | 5,088 |
Transocean Ltd. (United States) | 334,326 | | 20,581 |
Trinidad Drilling Ltd. | 249,200 | | 2,606 |
Unit Corp. (a) | 194,078 | | 11,647 |
Common Stocks - continued |
| Shares | | Value (000s) |
ENERGY - continued |
Energy Equipment & Services - continued |
Vantage Drilling Co. (a) | 5,557,916 | | $ 9,059 |
Xtreme Coil Drilling Corp. (a) | 885,200 | | 4,457 |
| | 468,302 |
Oil, Gas & Consumable Fuels - 9.0% |
3Legs Resources PLC | 284,300 | | 1,120 |
Alpha Natural Resources, Inc. (a) | 207,839 | | 8,877 |
Americas Petrogas, Inc. (a) | 1,986,700 | | 4,658 |
Americas Petrogas, Inc. (a)(f) | 2,250,000 | | 5,275 |
Anadarko Petroleum Corp. | 348,235 | | 28,750 |
Apache Corp. | 313,528 | | 38,790 |
Bonavista Energy Corp. (a)(f) | 166,200 | | 5,001 |
BP PLC sponsored ADR | 71,503 | | 3,249 |
BPZ Energy, Inc. (a)(d) | 2,387,127 | | 8,641 |
C&C Energia Ltd. (a) | 572,800 | | 6,085 |
Cabot Oil & Gas Corp. | 57,300 | | 4,245 |
Chesapeake Energy Corp. | 959,327 | | 32,953 |
Chevron Corp. | 800,724 | | 83,291 |
Concho Resources, Inc. (a) | 100 | | 9 |
Crown Point Ventures Ltd. (a) | 654,400 | | 1,096 |
Crown Point Ventures Ltd. (a)(f) | 1,487,700 | | 2,491 |
CVR Energy, Inc. (a) | 1,144,744 | | 30,736 |
Denbury Resources, Inc. (a) | 731,593 | | 14,134 |
Double Eagle Petroleum Co. (a)(e) | 977,903 | | 10,542 |
El Paso Corp. | 81,688 | | 1,679 |
EOG Resources, Inc. | 179,445 | | 18,303 |
EV Energy Partners LP | 123,890 | | 8,719 |
Exxon Mobil Corp. | 1,138,674 | | 90,855 |
Georesources, Inc. (a) | 28,600 | | 730 |
Gran Tierra Energy, Inc. (Canada) (a) | 674,500 | | 4,702 |
Gulfport Energy Corp. (a) | 491,957 | | 17,937 |
HollyFrontier Corp. | 565,328 | | 42,620 |
InterOil Corp. (a)(d) | 268,719 | | 16,822 |
Kosmos Energy Ltd. | 530,200 | | 8,054 |
Madalena Ventures, Inc. (a) | 918,000 | | 740 |
Marathon Oil Corp. | 448,256 | | 13,882 |
Marathon Petroleum Corp. | 356,628 | | 15,617 |
Niko Resources Ltd. | 168,100 | | 11,561 |
Noble Energy, Inc. | 207,424 | | 20,676 |
Northern Oil & Gas, Inc. (a)(d) | 2,373,722 | | 52,554 |
OAO Gazprom sponsored ADR | 1,009,700 | | 14,802 |
Common Stocks - continued |
| Shares | | Value (000s) |
ENERGY - continued |
Oil, Gas & Consumable Fuels - continued |
Occidental Petroleum Corp. | 539,522 | | $ 52,970 |
Painted Pony Petroleum Ltd. (a)(f) | 116,500 | | 1,725 |
Painted Pony Petroleum Ltd. Class A (a) | 61,300 | | 908 |
Paladin Energy Ltd. (Australia) (a) | 3,364,814 | | 9,685 |
Pan Orient Energy Corp. (a) | 938,500 | | 4,312 |
PetroBakken Energy Ltd. Class A (d) | 281,726 | | 4,146 |
Petroleum Development Corp. (a) | 208,509 | | 7,573 |
Resolute Energy Corp. (a)(d) | 973,974 | | 15,866 |
Suncor Energy, Inc. | 271,400 | | 10,403 |
TAG Oil Ltd. (a) | 899,300 | | 6,448 |
Talisman Energy, Inc. | 664,600 | | 12,104 |
Targa Resources Corp. | 148,200 | | 5,003 |
Tesoro Corp. (a) | 922,716 | | 22,413 |
Tourmaline Oil Corp. (a)(f) | 192,600 | | 7,187 |
Valero Energy Corp. | 993,642 | | 24,960 |
Voyager Oil & Gas, Inc. (a)(d)(e) | 3,538,244 | | 11,252 |
Voyager Oil & Gas, Inc. warrants 2/4/16 (a)(e) | 1,198,388 | | 1,539 |
Whiting Petroleum Corp. (a) | 632,309 | | 37,053 |
Williams Companies, Inc. | 901,730 | | 28,585 |
| | 894,328 |
TOTAL ENERGY | | 1,362,630 |
FINANCIALS - 13.7% |
Capital Markets - 2.1% |
American Capital Ltd. (a) | 472,225 | | 4,566 |
Ashmore Group PLC | 1,677,600 | | 11,107 |
Bank of New York Mellon Corp. | 516,208 | | 12,962 |
BlackRock, Inc. Class A | 53,484 | | 9,545 |
FXCM, Inc. Class A (d) | 327,100 | | 3,304 |
Goldman Sachs Group, Inc. | 331,877 | | 44,793 |
GP Investments Ltd. (depositary receipt) (a) | 2,714,019 | | 8,486 |
ICAP PLC | 1,355,800 | | 9,967 |
International Communications Group, Inc. (a) | 559,836 | | 6,186 |
Invesco Ltd. | 648,687 | | 14,388 |
Knight Capital Group, Inc. Class A (a) | 709,600 | | 8,026 |
Morgan Stanley | 1,993,624 | | 44,358 |
State Street Corp. | 620,173 | | 25,719 |
TD Ameritrade Holding Corp. | 518,677 | | 9,523 |
| | 212,930 |
Common Stocks - continued |
| Shares | | Value (000s) |
FINANCIALS - continued |
Commercial Banks - 3.0% |
Associated Banc-Corp. | 842,596 | | $ 11,501 |
Banco Pine SA | 970,700 | | 6,477 |
Bank of Ireland (g) | 42,633,112 | | 5,789 |
CapitalSource, Inc. | 5,432,245 | | 35,092 |
CIT Group, Inc. (a) | 485,710 | | 19,302 |
Comerica, Inc. | 241,002 | | 7,719 |
Commercial Bank of Qatar GDR (Reg. S) | 1,270,830 | | 5,165 |
Guaranty Trust Bank PLC GDR (Reg. S) | 793,992 | | 3,295 |
Huntington Bancshares, Inc. | 940,859 | | 5,687 |
Itau Unibanco Banco Multiplo SA sponsored ADR | 267,500 | | 5,449 |
KeyCorp | 774,000 | | 6,223 |
Regions Financial Corp. | 2,968,759 | | 18,080 |
SunTrust Banks, Inc. | 327,213 | | 8,013 |
Susquehanna Bancshares, Inc. | 900,925 | | 6,784 |
Wells Fargo & Co. | 5,538,941 | | 154,758 |
| | 299,334 |
Consumer Finance - 0.8% |
American Express Co. | 772,301 | | 38,646 |
Discover Financial Services | 776,127 | | 19,877 |
Imperial Holdings, Inc. (a) | 451,296 | | 4,364 |
SLM Corp. | 698,132 | | 10,884 |
| | 73,771 |
Diversified Financial Services - 3.4% |
Citigroup, Inc. | 3,647,823 | | 139,858 |
CME Group, Inc. | 58,227 | | 16,839 |
Infrastructure Development Finance Co. Ltd. | 2,345,734 | | 6,688 |
JPMorgan Chase & Co. | 3,440,554 | | 139,170 |
PICO Holdings, Inc. (a)(e) | 1,207,264 | | 32,970 |
| | 335,525 |
Insurance - 1.9% |
AEGON NV (a) | 1,896,127 | | 10,851 |
AFLAC, Inc. | 516,898 | | 23,808 |
Assured Guaranty Ltd. | 2,289,114 | | 32,391 |
Berkshire Hathaway, Inc. Class B (a) | 368,652 | | 27,343 |
Genworth Financial, Inc. Class A (a) | 3,248,702 | | 27,029 |
Hanover Insurance Group, Inc. | 65,471 | | 2,371 |
Hartford Financial Services Group, Inc. | 159,500 | | 3,735 |
Lincoln National Corp. | 491,950 | | 13,037 |
Common Stocks - continued |
| Shares | | Value (000s) |
FINANCIALS - continued |
Insurance - continued |
MetLife, Inc. | 968,117 | | $ 39,896 |
Prudential Financial, Inc. | 187,900 | | 11,026 |
| | 191,487 |
Real Estate Investment Trusts - 1.8% |
Beni Stabili SpA SIIQ | 4,141,000 | | 3,695 |
Boston Properties, Inc. | 112,291 | | 12,056 |
Campus Crest Communities, Inc. | 340,903 | | 4,084 |
CBL & Associates Properties, Inc. | 1,572,040 | | 27,919 |
Douglas Emmett, Inc. | 460,912 | | 9,218 |
Education Realty Trust, Inc. | 826,300 | | 7,255 |
Excel Trust, Inc. | 149,700 | | 1,717 |
Franklin Street Properties Corp. | 606,400 | | 7,647 |
Prologis, Inc. | 847,697 | | 30,203 |
Public Storage | 110,619 | | 13,233 |
SL Green Realty Corp. | 262,270 | | 21,511 |
Sunstone Hotel Investors, Inc. (a) | 407,900 | | 3,634 |
Weyerhaeuser Co. | 1,586,676 | | 31,718 |
| | 173,890 |
Real Estate Management & Development - 0.7% |
CB Richard Ellis Group, Inc. Class A (a) | 2,060,326 | | 44,915 |
Forest City Enterprises, Inc. Class A (a) | 531,282 | | 9,568 |
Iguatemi Empresa de Shopping Centers SA | 357,900 | | 7,822 |
Kenedix, Inc. (a) | 45,234 | | 8,845 |
| | 71,150 |
TOTAL FINANCIALS | | 1,358,087 |
HEALTH CARE - 10.8% |
Biotechnology - 3.0% |
Acorda Therapeutics, Inc. (a) | 232,700 | | 6,609 |
Alexion Pharmaceuticals, Inc. (a) | 261,400 | | 14,848 |
Allos Therapeutics, Inc. (a) | 122,400 | | 228 |
AMAG Pharmaceuticals, Inc. (a) | 236,392 | | 3,501 |
Amgen, Inc. | 869,759 | | 47,576 |
Amylin Pharmaceuticals, Inc. (a) | 598,370 | | 7,127 |
Ardea Biosciences, Inc. (a) | 753,132 | | 17,623 |
ARIAD Pharmaceuticals, Inc. (a) | 1,842,209 | | 21,904 |
ArQule, Inc. (a) | 1,017,083 | | 5,696 |
AVEO Pharmaceuticals, Inc. (a) | 1,125,309 | | 21,505 |
Common Stocks - continued |
| Shares | | Value (000s) |
HEALTH CARE - continued |
Biotechnology - continued |
Biogen Idec, Inc. (a) | 284,122 | | $ 28,944 |
Dynavax Technologies Corp. (a) | 2,621,070 | | 7,339 |
Gilead Sciences, Inc. (a) | 222,825 | | 9,439 |
Horizon Pharma, Inc. | 448,800 | | 4,057 |
Human Genome Sciences, Inc. (a) | 349,700 | | 7,347 |
Infinity Pharmaceuticals, Inc. (a) | 175,819 | | 1,582 |
InterMune, Inc. (a) | 200,311 | | 6,686 |
Isis Pharmaceuticals, Inc. (a) | 347,500 | | 3,002 |
Micromet, Inc. (a) | 1,097,200 | | 6,210 |
NPS Pharmaceuticals, Inc. (a) | 553,635 | | 5,348 |
PDL BioPharma, Inc. | 1,012,800 | | 6,269 |
SIGA Technologies, Inc. (a)(d) | 1,719,274 | | 13,084 |
Theravance, Inc. (a) | 1,273,261 | | 27,222 |
Thrombogenics NV (a)(d) | 392,497 | | 9,475 |
United Therapeutics Corp. (a) | 225,400 | | 12,933 |
ZIOPHARM Oncology, Inc. (a) | 1,285,652 | | 6,994 |
| | 302,548 |
Health Care Equipment & Supplies - 1.7% |
Baxter International, Inc. | 534,153 | | 31,072 |
Boston Scientific Corp. (a) | 1,864,800 | | 13,352 |
C. R. Bard, Inc. | 218,797 | | 21,591 |
Conceptus, Inc. (a)(d) | 593,201 | | 6,757 |
Covidien PLC | 627,178 | | 31,854 |
Genmark Diagnostics, Inc. (a) | 538,300 | | 2,675 |
GN Store Nordic AS | 842,174 | | 7,634 |
Orthofix International NV (a) | 432,888 | | 18,281 |
Sirona Dental Systems, Inc. (a) | 284,800 | | 14,405 |
William Demant Holding A/S (a) | 115,354 | | 10,123 |
Zimmer Holdings, Inc. (a) | 154,142 | | 9,252 |
| | 166,996 |
Health Care Providers & Services - 3.0% |
Accretive Health, Inc. (a) | 44,078 | | 1,324 |
AmerisourceBergen Corp. | 240,980 | | 9,232 |
Brookdale Senior Living, Inc. (a) | 1,925,300 | | 41,182 |
Catalyst Health Solutions, Inc. (a) | 323,190 | | 21,179 |
CIGNA Corp. | 789,781 | | 39,307 |
Community Health Systems, Inc. (a) | 342,718 | | 8,856 |
DaVita, Inc. (a) | 222,298 | | 18,571 |
Diagnosticos da America SA | 1,246,000 | | 15,463 |
Emeritus Corp. (a) | 439,233 | | 8,631 |
Common Stocks - continued |
| Shares | | Value (000s) |
HEALTH CARE - continued |
Health Care Providers & Services - continued |
Express Scripts, Inc. (a) | 938,600 | | $ 50,928 |
HealthSpring, Inc. (a) | 155,429 | | 6,379 |
McKesson Corp. | 334,692 | | 27,150 |
Medco Health Solutions, Inc. (a) | 534,961 | | 33,638 |
Sun Healthcare Group, Inc. (a) | 617,262 | | 4,321 |
Sunrise Senior Living, Inc. (a) | 97,528 | | 860 |
Universal Health Services, Inc. Class B | 204,587 | | 10,156 |
| | 297,177 |
Life Sciences Tools & Services - 0.5% |
Agilent Technologies, Inc. (a) | 656,768 | | 27,689 |
Sequenom, Inc. (a) | 802,300 | | 5,664 |
Thermo Fisher Scientific, Inc. (a) | 343,917 | | 20,666 |
| | 54,019 |
Pharmaceuticals - 2.6% |
Auxilium Pharmaceuticals, Inc. (a) | 195,571 | | 3,665 |
Cadence Pharmaceuticals, Inc. (a)(d) | 3,288,995 | | 28,450 |
Cardiome Pharma Corp. (a) | 719,200 | | 3,576 |
Columbia Laboratories, Inc. (a) | 797,400 | | 2,281 |
GlaxoSmithKline PLC | 989,400 | | 22,061 |
GlaxoSmithKline PLC sponsored ADR | 518,729 | | 23,042 |
Merck & Co., Inc. | 2,237,049 | | 76,350 |
Novo Nordisk A/S Series B | 198,837 | | 24,321 |
Roche Holding AG (participation certificate) | 12,239 | | 2,200 |
Sanofi-Aventis | 204,458 | | 15,886 |
Teva Pharmaceutical Industries Ltd. sponsored ADR | 341,419 | | 15,924 |
Valeant Pharmaceuticals International, Inc. (Canada) | 508,900 | | 28,012 |
Watson Pharmaceuticals, Inc. (a) | 179,792 | | 12,069 |
| | 257,837 |
TOTAL HEALTH CARE | | 1,078,577 |
INDUSTRIALS - 14.4% |
Aerospace & Defense - 3.4% |
Bombardier, Inc. Class B (sub. vtg.) | 1,287,700 | | 7,790 |
DigitalGlobe, Inc. (a) | 388,961 | | 10,160 |
Esterline Technologies Corp. (a) | 156,121 | | 11,923 |
GeoEye, Inc. (a)(e) | 1,335,110 | | 53,351 |
Goodrich Corp. | 243,654 | | 23,181 |
Honeywell International, Inc. | 587,730 | | 31,208 |
Meggitt PLC | 4,020,941 | | 25,631 |
Common Stocks - continued |
| Shares | | Value (000s) |
INDUSTRIALS - continued |
Aerospace & Defense - continued |
Precision Castparts Corp. | 161,205 | | $ 26,015 |
Raytheon Co. | 421,426 | | 18,850 |
Rockwell Collins, Inc. | 187,700 | | 10,340 |
Safran SA | 163,500 | | 6,820 |
Textron, Inc. | 1,525,478 | | 35,284 |
Ultra Electronics Holdings PLC | 196,400 | | 5,072 |
United Technologies Corp. | 846,496 | | 70,124 |
| | 335,749 |
Airlines - 0.2% |
Copa Holdings SA Class A | 257,797 | | 16,914 |
Building Products - 0.6% |
Armstrong World Industries, Inc. | 271,340 | | 10,718 |
Lennox International, Inc. | 114,186 | | 4,223 |
Masco Corp. | 1,497,434 | | 15,798 |
Owens Corning (a) | 632,507 | | 22,505 |
Quanex Building Products Corp. | 285,987 | | 4,481 |
| | 57,725 |
Commercial Services & Supplies - 0.8% |
Babcock International Group PLC | 12,200 | | 135 |
KAR Auction Services, Inc. (a) | 119,585 | | 2,126 |
Knoll, Inc. | 566,988 | | 10,348 |
Pitney Bowes, Inc. (d) | 218,912 | | 4,718 |
Republic Services, Inc. | 710,647 | | 20,630 |
Schawk, Inc. Class A | 205,667 | | 3,247 |
Steelcase, Inc. Class A | 1,357,663 | | 13,482 |
Swisher Hygiene, Inc. (g) | 903,330 | | 4,083 |
Swisher Hygiene, Inc. (g) | 1,177,734 | | 4,791 |
The Geo Group, Inc. (a) | 621,348 | | 12,924 |
| | 76,484 |
Construction & Engineering - 1.5% |
AECOM Technology Corp. (a) | 12,300 | | 304 |
Chiyoda Corp. | 1,679,000 | | 21,510 |
Dycom Industries, Inc. (a) | 776,533 | | 13,232 |
Fluor Corp. | 494,307 | | 31,403 |
Foster Wheeler AG (a) | 1,411,695 | | 38,257 |
Great Lakes Dredge & Dock Corp. | 622,073 | | 3,701 |
Jacobs Engineering Group, Inc. (a) | 122,616 | | 4,799 |
Common Stocks - continued |
| Shares | | Value (000s) |
INDUSTRIALS - continued |
Construction & Engineering - continued |
MasTec, Inc. (a) | 361,600 | | $ 7,550 |
Shaw Group, Inc. (a) | 1,181,531 | | 30,578 |
| | 151,334 |
Electrical Equipment - 1.3% |
Alstom SA | 319,494 | | 16,873 |
AMETEK, Inc. | 267,932 | | 11,387 |
Cooper Industries PLC Class A | 169,112 | | 8,846 |
Emerson Electric Co. | 653,805 | | 32,095 |
Fushi Copperweld, Inc. (a) | 580,088 | | 4,101 |
GrafTech International Ltd. (a) | 597,247 | | 11,503 |
Powell Industries, Inc. (a) | 45,000 | | 1,734 |
Prysmian SpA | 655,100 | | 12,152 |
Regal-Beloit Corp. | 285,674 | | 17,320 |
Roper Industries, Inc. | 77,639 | | 6,338 |
Zumtobel AG | 347,930 | | 8,176 |
| | 130,525 |
Industrial Conglomerates - 1.9% |
Carlisle Companies, Inc. | 222,875 | | 9,635 |
Cookson Group PLC | 1,046,653 | | 11,065 |
Danaher Corp. | 299,081 | | 14,688 |
General Electric Co. | 7,129,839 | | 127,695 |
Koninklijke Philips Electronics NV | 532,800 | | 13,233 |
Rheinmetall AG | 202,900 | | 17,029 |
| | 193,345 |
Machinery - 1.7% |
Actuant Corp. Class A | 589,902 | | 14,576 |
Charter International PLC | 1,453,900 | | 19,094 |
Cummins, Inc. | 102,381 | | 10,738 |
Dover Corp. | 168,071 | | 10,163 |
Fiat Industrial SpA (a) | 1,369,500 | | 18,113 |
Gardner Denver, Inc. | 65,422 | | 5,580 |
Haitian International Holdings Ltd. | 2,203,000 | | 2,668 |
Ingersoll-Rand Co. Ltd. | 697,332 | | 26,094 |
Kone Oyj (B Shares) | 8,100 | | 470 |
Navistar International Corp. (a) | 652,167 | | 33,463 |
Pall Corp. | 271,128 | | 13,443 |
Stanley Black & Decker, Inc. | 287,339 | | 18,898 |
| | 173,300 |
Common Stocks - continued |
| Shares | | Value (000s) |
INDUSTRIALS - continued |
Professional Services - 0.6% |
CBIZ, Inc. (a) | 715,013 | | $ 5,334 |
FTI Consulting, Inc. (a) | 290,094 | | 10,528 |
Kforce, Inc. (a) | 767,945 | | 10,582 |
Robert Half International, Inc. | 484,515 | | 13,266 |
SR Teleperformance SA | 412,788 | | 10,667 |
Towers Watson & Co. | 140,554 | | 8,595 |
| | 58,972 |
Road & Rail - 1.8% |
Arkansas Best Corp. | 265,197 | | 6,381 |
Con-way, Inc. | 409,981 | | 15,014 |
CSX Corp. | 2,431,300 | | 59,737 |
Norfolk Southern Corp. | 254,749 | | 19,284 |
Saia, Inc. (a)(e) | 865,075 | | 13,037 |
Tegma Gestao Logistica | 114,400 | | 1,752 |
Union Pacific Corp. | 513,926 | | 52,667 |
Universal Truckload Services, Inc. (a) | 516,527 | | 8,213 |
| | 176,085 |
Trading Companies & Distributors - 0.6% |
Barloworld Ltd. | 584,400 | | 5,642 |
Beacon Roofing Supply, Inc. (a) | 517,300 | | 11,060 |
DXP Enterprises, Inc. (a) | 200,300 | | 5,446 |
Kaman Corp. | 318,466 | | 11,344 |
Mills Estruturas e Servicos de Engenharia SA | 290,000 | | 3,926 |
Mitsui & Co. Ltd. | 183,900 | | 3,477 |
Rush Enterprises, Inc. Class A (a) | 514,150 | | 10,278 |
Watsco, Inc. | 114,885 | | 6,799 |
| | 57,972 |
TOTAL INDUSTRIALS | | 1,428,405 |
INFORMATION TECHNOLOGY - 16.4% |
Communications Equipment - 2.1% |
Alcatel-Lucent SA sponsored ADR (a) | 2,693,176 | | 10,907 |
Calix Networks, Inc. (a) | 1,225,615 | | 22,478 |
Cisco Systems, Inc. | 4,322,457 | | 69,030 |
Comverse Technology, Inc. (a) | 2,547,500 | | 19,106 |
Juniper Networks, Inc. (a) | 1,090,363 | | 25,504 |
Polycom, Inc. (a) | 265,318 | | 7,172 |
QUALCOMM, Inc. | 510,635 | | 27,973 |
Common Stocks - continued |
| Shares | | Value (000s) |
INFORMATION TECHNOLOGY - continued |
Communications Equipment - continued |
Tekelec (a) | 939,950 | | $ 7,379 |
ViaSat, Inc. (a) | 355,398 | | 15,968 |
| | 205,517 |
Computers & Peripherals - 3.6% |
Apple, Inc. (a) | 775,376 | | 302,767 |
Hewlett-Packard Co. | 1,520,453 | | 53,459 |
| | 356,226 |
Electronic Equipment & Components - 1.3% |
Arrow Electronics, Inc. (a) | 519,167 | | 18,041 |
Avnet, Inc. (a) | 936,688 | | 27,445 |
Corning, Inc. | 1,804,266 | | 28,706 |
Funtalk China Holdings Ltd. (a)(d) | 653,009 | | 4,571 |
HLS Systems International Ltd. (a) | 486,535 | | 3,391 |
Ingram Micro, Inc. Class A (a) | 371,850 | | 6,898 |
Jabil Circuit, Inc. | 351,252 | | 6,431 |
Molex, Inc. (d) | 629,880 | | 14,790 |
TE Connectivity Ltd. | 584,756 | | 20,133 |
| | 130,406 |
Internet Software & Services - 1.0% |
DealerTrack Holdings, Inc. (a) | 224,800 | | 5,213 |
DeNA Co. Ltd. | 57,100 | | 2,853 |
eAccess Ltd. (d) | 20,253 | | 8,973 |
eBay, Inc. (a) | 1,061,226 | | 34,755 |
Facebook, Inc. Class B (a)(g) | 488,526 | | 12,213 |
Google, Inc. Class A (a) | 37,649 | | 22,728 |
Renren, Inc. ADR (d) | 828,400 | | 8,972 |
| | 95,707 |
IT Services - 1.8% |
Acxiom Corp. (a) | 475,918 | | 6,539 |
Alliance Data Systems Corp. (a)(d) | 216,691 | | 21,309 |
Atos Origin SA | 188,010 | | 10,384 |
Cognizant Technology Solutions Corp. Class A (a) | 368,580 | | 25,753 |
Fidelity National Information Services, Inc. | 642,635 | | 19,292 |
Fiserv, Inc. (a) | 167,581 | | 10,115 |
Heartland Payment Systems, Inc. | 413,000 | | 8,690 |
MasterCard, Inc. Class A | 168,526 | | 51,106 |
Unisys Corp. (a) | 588,393 | | 12,221 |
Common Stocks - continued |
| Shares | | Value (000s) |
INFORMATION TECHNOLOGY - continued |
IT Services - continued |
Virtusa Corp. (a) | 335,742 | | $ 6,601 |
Visa, Inc. Class A | 111,100 | | 9,503 |
| | 181,513 |
Office Electronics - 0.3% |
Xerox Corp. | 3,401,481 | | 31,736 |
Semiconductors & Semiconductor Equipment - 4.0% |
Advanced Micro Devices, Inc. (a) | 1,719,566 | | 12,622 |
Analog Devices, Inc. | 562,140 | | 19,338 |
ASML Holding NV | 1,134,406 | | 40,442 |
Avago Technologies Ltd. | 636,989 | | 21,422 |
Cymer, Inc. (a) | 980,731 | | 43,182 |
Entropic Communications, Inc. (a)(d) | 486,484 | | 3,250 |
Fairchild Semiconductor International, Inc. (a) | 444,156 | | 6,667 |
Freescale Semiconductor Holdings I Ltd. | 1,365,627 | | 22,301 |
Himax Technologies, Inc. sponsored ADR | 1,586,515 | | 2,776 |
International Rectifier Corp. (a) | 27,100 | | 696 |
Intersil Corp. Class A | 1,226,995 | | 14,785 |
Lam Research Corp. (a) | 486,387 | | 19,884 |
LTX-Credence Corp. (a)(e) | 3,354,337 | | 24,118 |
Marvell Technology Group Ltd. (a) | 3,561,372 | | 52,780 |
Maxim Integrated Products, Inc. | 805,357 | | 18,491 |
Microchip Technology, Inc. (d) | 56,679 | | 1,913 |
Micron Technology, Inc. (a) | 3,351,022 | | 24,697 |
NVIDIA Corp. (a) | 770,396 | | 10,655 |
NXP Semiconductors NV | 987,742 | | 19,538 |
ON Semiconductor Corp. (a) | 2,961,294 | | 25,734 |
Spansion, Inc. Class A (a) | 342,948 | | 6,235 |
Standard Microsystems Corp. (a) | 73,600 | | 1,741 |
TriQuint Semiconductor, Inc. (a) | 356,512 | | 2,681 |
| | 395,948 |
Software - 2.3% |
Aspen Technology, Inc. (a) | 631,355 | | 9,786 |
Autodesk, Inc. (a) | 200,539 | | 6,899 |
BMC Software, Inc. (a) | 459,757 | | 19,871 |
Check Point Software Technologies Ltd. (a) | 261,418 | | 15,071 |
Citrix Systems, Inc. (a) | 143,105 | | 10,309 |
DemandTec, Inc. (a) | 831,862 | | 5,956 |
Informatica Corp. (a) | 327,098 | | 16,725 |
JDA Software Group, Inc. (a) | 430,823 | | 12,046 |
Micro Focus International PLC | 2,179,019 | | 10,374 |
Common Stocks - continued |
| Shares | | Value (000s) |
INFORMATION TECHNOLOGY - continued |
Software - continued |
Oracle Corp. | 3,293,279 | | $ 100,708 |
Pegasystems, Inc. | 181,537 | | 7,327 |
Solera Holdings, Inc. | 85,733 | | 4,791 |
Sourcefire, Inc. (a) | 289,775 | | 7,123 |
TIBCO Software, Inc. (a) | 151,198 | | 3,937 |
| | 230,923 |
TOTAL INFORMATION TECHNOLOGY | | 1,627,976 |
MATERIALS - 6.3% |
Chemicals - 2.8% |
Air Products & Chemicals, Inc. | 118,149 | | 10,483 |
Ashland, Inc. | 187,460 | | 11,480 |
CF Industries Holdings, Inc. | 40,789 | | 6,335 |
Clariant AG (Reg.) (a) | 1,447,820 | | 22,864 |
CVR Partners LP | 385,700 | | 9,045 |
Dow Chemical Co. | 779,917 | | 27,196 |
Ecolab, Inc. | 224,833 | | 11,242 |
Ferro Corp. (a) | 102,273 | | 1,332 |
Huabao International Holdings Ltd. | 8,219,461 | | 6,960 |
Israel Chemicals Ltd. | 347,600 | | 5,893 |
Kraton Performance Polymers, Inc. (a) | 280,523 | | 10,127 |
Lanxess AG | 69,451 | | 5,604 |
LyondellBasell Industries NV Class A | 475,173 | | 18,750 |
PolyOne Corp. | 644,904 | | 9,996 |
Spartech Corp. (a)(e) | 1,622,853 | | 9,331 |
The Mosaic Co. | 523,160 | | 36,998 |
W.R. Grace & Co. (a) | 1,203,625 | | 60,711 |
Yara International ASA | 299,000 | | 17,137 |
| | 281,484 |
Construction Materials - 0.1% |
HeidelbergCement AG | 258,244 | | 14,267 |
Containers & Packaging - 0.2% |
Rock-Tenn Co. Class A | 287,442 | | 17,666 |
Metals & Mining - 3.2% |
Anglo American PLC (United Kingdom) | 225,500 | | 10,735 |
Avion Gold Corp. (a) | 3,402,700 | | 7,123 |
Commercial Metals Co. | 1,022,250 | | 14,833 |
Eldorado Gold Corp. | 1,021,878 | | 17,595 |
First Quantum Minerals Ltd. | 66,100 | | 9,164 |
Common Stocks - continued |
| Shares | | Value (000s) |
MATERIALS - continued |
Metals & Mining - continued |
Freeport-McMoRan Copper & Gold, Inc. | 647,185 | | $ 34,275 |
Goldcorp, Inc. | 805,700 | | 38,531 |
Grande Cache Coal Corp. (a) | 738,500 | | 6,740 |
Gulf Resources, Inc. (a) | 1,894,460 | | 6,631 |
Iluka Resources Ltd. | 85,843 | | 1,675 |
Ivanhoe Mines Ltd. (a) | 1,820,965 | | 47,687 |
Kenmare Resources PLC (a) | 614,300 | | 559 |
Kinross Gold Corp. | 817,445 | | 13,347 |
Mirabela Nickel Ltd. (a) | 2,167,107 | | 4,524 |
Newcrest Mining Ltd. | 892,648 | | 38,787 |
Pan American Silver Corp. | 297,400 | | 8,976 |
Randgold Resources Ltd. sponsored ADR | 365,123 | | 33,157 |
Reliance Steel & Aluminum Co. | 81,850 | | 3,848 |
Ternium SA sponsored ADR | 180,795 | | 5,241 |
United States Steel Corp. (d) | 282,820 | | 11,310 |
| | 314,738 |
TOTAL MATERIALS | | 628,155 |
TELECOMMUNICATION SERVICES - 1.2% |
Diversified Telecommunication Services - 0.6% |
AT&T, Inc. | 369,889 | | 10,823 |
CenturyLink, Inc. | 269,446 | | 9,999 |
China Unicom (Hong Kong) Ltd. | 5,138,000 | | 10,263 |
Iliad SA | 121,637 | | 15,625 |
Koninklijke KPN NV (d) | 710,030 | | 10,147 |
Telefonica SA sponsored ADR | 115,160 | | 2,570 |
| | 59,427 |
Wireless Telecommunication Services - 0.6% |
American Tower Corp. Class A (a) | 146,900 | | 7,717 |
NII Holdings, Inc. (a) | 258,000 | | 10,926 |
SBA Communications Corp. Class A (a) | 320,550 | | 12,235 |
Sprint Nextel Corp. (a) | 2,850,607 | | 12,058 |
TIM Participacoes SA | 2,311,706 | | 11,401 |
Turkcell Iletisim Hizmet AS | 1,697,000 | | 8,719 |
| | 63,056 |
TOTAL TELECOMMUNICATION SERVICES | | 122,483 |
Common Stocks - continued |
| Shares | | Value (000s) |
UTILITIES - 2.6% |
Electric Utilities - 1.0% |
American Electric Power Co., Inc. | 472,195 | | $ 17,405 |
Centrais Eletricas Brasileiras SA (Electrobras) (PN-B) sponsored ADR (d) | 502,200 | | 7,704 |
Ceske Energeticke Zavody AS | 50,000 | | 2,584 |
Edison International | 328,591 | | 12,509 |
Fortum Corp. | 122,386 | | 3,244 |
NextEra Energy, Inc. | 377,156 | | 20,838 |
NV Energy, Inc. | 486,328 | | 7,217 |
PPL Corp. | 707,453 | | 19,738 |
Tata Power Co. Ltd. | 142,060 | | 4,117 |
| | 95,356 |
Gas Utilities - 0.2% |
Aygaz AS | 81,860 | | 509 |
China Gas Holdings Ltd. | 11,094,000 | | 4,171 |
ONEOK, Inc. | 130,788 | | 9,520 |
| | 14,200 |
Independent Power Producers & Energy Traders - 0.7% |
The AES Corp. (a) | 5,940,556 | | 73,128 |
Multi-Utilities - 0.7% |
CenterPoint Energy, Inc. | 590,285 | | 11,558 |
CMS Energy Corp. | 345,170 | | 6,607 |
National Grid PLC | 1,268,400 | | 12,412 |
PG&E Corp. | 271,157 | | 11,234 |
Public Service Enterprise Group, Inc. | 550,714 | | 18,036 |
Sempra Energy | 223,022 | | 11,305 |
| | 71,152 |
TOTAL UTILITIES | | 253,836 |
TOTAL COMMON STOCKS (Cost $8,541,722) | 9,802,006 |
Preferred Stocks - 0.7% |
| | | |
Convertible Preferred Stocks - 0.5% |
CONSUMER DISCRETIONARY - 0.2% |
Automobiles - 0.2% |
General Motors Co. 4.75% | 368,500 | | 17,028 |
Preferred Stocks - continued |
| Shares | | Value (000s) |
Convertible Preferred Stocks - continued |
FINANCIALS - 0.2% |
Diversified Financial Services - 0.2% |
Citigroup, Inc. 7.50% | 157,200 | | $ 17,630 |
INFORMATION TECHNOLOGY - 0.0% |
IT Services - 0.0% |
Unisys Corp. 6.25% | 93,800 | | 6,356 |
UTILITIES - 0.1% |
Electric Utilities - 0.1% |
PPL Corp. 9.50% | 187,100 | | 10,494 |
TOTAL CONVERTIBLE PREFERRED STOCKS | | 51,508 |
Nonconvertible Preferred Stocks - 0.2% |
CONSUMER DISCRETIONARY - 0.2% |
Automobiles - 0.2% |
Volkswagen AG | 96,900 | | 19,416 |
TOTAL PREFERRED STOCKS (Cost $61,340) | 70,924 |
Investment Companies - 0.2% |
| | | |
Ares Capital Corp.
(Cost $13,382) | 1,052,680 | | 16,990 |
Convertible Bonds - 0.2% |
| Principal Amount (000s) | | |
FINANCIALS - 0.1% |
Thrifts & Mortgage Finance - 0.1% |
MGIC Investment Corp. 9% 4/1/63 (f) | | $ 18,163 | | 12,305 |
INDUSTRIALS - 0.1% |
Electrical Equipment - 0.1% |
Aspen Aerogels, Inc. 8% 6/1/14 (g) | | 4,085 | | 4,085 |
Convertible Bonds - continued |
| Principal Amount (000s) | | Value (000s) |
TELECOMMUNICATION SERVICES - 0.0% |
Diversified Telecommunication Services - 0.0% |
Clearwire Communications LLC/Clearwire Finance, Inc. 8.25% 12/1/40 (f) | | $ 4,080 | | $ 2,739 |
TOTAL CONVERTIBLE BONDS (Cost $16,737) | 19,129 |
Money Market Funds - 1.7% |
| Shares | | |
Fidelity Cash Central Fund, 0.14% (b) | 14,746,846 | | 14,747 |
Fidelity Securities Lending Cash Central Fund, 0.15% (b)(c) | 156,594,819 | | 156,595 |
TOTAL MONEY MARKET FUNDS (Cost $171,342) | 171,342 |
TOTAL INVESTMENT PORTFOLIO - 101.4% (Cost $8,804,523) | 10,080,391 |
NET OTHER ASSETS (LIABILITIES) - (1.4)% | (137,676) |
NET ASSETS - 100% | $ 9,942,715 |
Legend |
(a) Non-income producing |
(b) Affiliated fund that is available only to investment companies and other accounts managed by Fidelity Investments. The rate quoted is the annualized seven-day yield of the fund at period end. A complete unaudited listing of the fund's holdings as of its most recent quarter end is available upon request. In addition, each Fidelity Central Fund's financial statements, which are not covered by the Fund's Report of Independent Registered Public Accounting Firm, are available on the SEC's website or upon request. |
(c) Investment made with cash collateral received from securities on loan. |
(d) Security or a portion of the security is on loan at period end. |
(e) Affiliated company |
(f) Security exempt from registration under Rule 144A of the Securities Act of 1933. These securities may be resold in transactions exempt from registration, normally to qualified institutional buyers. At the end of the period, the value of these securities amounted to $36,723,000 or 0.4% of net assets. |
(g) Restricted securities - Investment in securities not registered under the Securities Act of 1933 (excluding 144A issues). At the end of the period, the value of restricted securities (excluding 144A issues) amounted to $37,439,000 or 0.4% of net assets. |
Additional information on each restricted holding is as follows: |
Security | Acquisition Date | Acquisition Cost (000s) |
Aspen Aerogels, Inc. 8% 6/1/14 | 6/1/11 | $ 4,085 |
Bank of Ireland | 7/29/11 | $ 6,064 |
Facebook, Inc. Class B | 3/31/11 - 5/19/11 | $ 12,217 |
Mood Media Corp. | 2/2/11 | $ 4,054 |
Swisher Hygiene, Inc. | 3/22/11 - 4/15/11 | $ 13,586 |
Affiliated Central Funds |
Information regarding fiscal year to date income earned by the Fund from investments in Fidelity Central Funds is as follows: |
Fund | Income earned
(Amounts in thousands) |
Fidelity Cash Central Fund | $ 108 |
Fidelity Securities Lending Cash Central Fund | 2,562 |
Total | $ 2,670 |
Other Affiliated Issuers |
An affiliated company is a company in which the Fund has ownership of at least 5% of the voting securities. Fiscal year to date transactions with companies which are or were affiliates are as follows: |
Affiliate
(Amounts in thousands) | Value, beginning of period | Purchases | Sales Proceeds | Dividend Income | Value,
end of
period |
Double Eagle Petroleum Co. | $ - | $ 8,444 | $ - | $ - | $ 10,542 |
GeoEye, Inc. | 18,774 | 27,896 | - | - | 53,351 |
Gulf Resources, Inc. | 5,042 | 946 | 2,579 | - | - |
Gulf Resources, Inc. | 16,406 | - | - | - | - |
LTX-Credence Corp. | 24,000 | 4,614 | 1,147 | - | 24,118 |
O'Charleys, Inc. | 9,141 | 1,279 | - | - | 9,150 |
PICO Holdings, Inc. | 38,871 | 687 | 1,564 | - | 32,970 |
Saia, Inc. | 11,583 | 1,315 | - | - | 13,037 |
Spartech Corp. | 15,775 | 2,635 | 1,873 | - | 9,331 |
Voyager Oil & Gas, Inc. | - | 12,230 | 1 | - | 11,252 |
Voyager Oil & Gas, Inc. warrants 2/4/16 | - | 108 | - | - | 1,539 |
Winnebago Industries, Inc. | 16,261 | 4,025 | - | - | - |
Total | $ 155,853 | $ 64,179 | $ 7,164 | $ - | $ 165,290 |
Other Information |
The following is a summary of the inputs used, as of July 31, 2011, involving the Fund's assets and liabilities carried at fair value. The inputs or methodology used for valuing securities may not be an indication of the risk associated with investing in those securities. For more information on valuation inputs, and their aggregation into the levels used in the tables below, please refer to the Security Valuation section in the accompanying Notes to Financial Statements. |
Valuation Inputs at Reporting Date: |
Description
(Amounts in thousands) | Total | Level 1 | Level 2 | Level 3 |
Investments in Securities: | | | | |
Equities: | | | | |
Consumer Discretionary | $ 1,088,144 | $ 1,082,132 | $ 6,012 | $ - |
Consumer Staples | 890,157 | 861,647 | 28,510 | - |
Energy | 1,362,630 | 1,356,090 | 6,540 | - |
Financials | 1,375,717 | 1,359,077 | 10,851 | 5,789 |
Health Care | 1,078,577 | 1,016,309 | 62,268 | - |
Industrials | 1,428,405 | 1,410,381 | 18,024 | - |
Information Technology | 1,634,332 | 1,622,119 | - | 12,213 |
Materials | 628,155 | 628,155 | - | - |
Telecommunication Services | 122,483 | 103,501 | 18,982 | - |
Utilities | 264,330 | 251,918 | 12,412 | - |
Investment Companies | 16,990 | 16,990 | - | - |
Corporate Bonds | 19,129 | - | 19,129 | - |
Money Market Funds | 171,342 | 171,342 | - | - |
Total Investments in Securities: | $ 10,080,391 | $ 9,879,661 | $ 182,728 | $ 18,002 |
The following is a reconciliation of Investments in Securities for which Level 3 inputs were used in determining value: |
(Amounts in thousands) | |
Investments in Securities: | |
Beginning Balance | $ - |
Total Realized Gain (Loss) | - |
Total Unrealized Gain (Loss) | (279) |
Cost of Purchases | 18,281 |
Proceeds of Sales | - |
Amortization/Accretion | - |
Transfers in to Level 3 | - |
Transfers out of Level 3 | - |
Ending Balance | $ 18,002 |
The change in unrealized gain (loss) for the period attributable to Level 3 securities held at July 31, 2011 | $ (279) |
The information used in the above reconciliation represents fiscal year to date activity for any Investments in Securities identified as using Level 3 inputs at either the beginning or the end of the current fiscal period. Transfers in or out of Level 3 represent the beginning value of any Security or Instrument where a change in the pricing level occurred from the beginning to the end of the period. The cost of purchases and the proceeds of sales may include securities received or delivered through corporate actions or exchanges. Realized and unrealized gains (losses) disclosed in the reconciliation are included in Net Gain (Loss) on the Fund's Statement of Operations. |
Distribution of investments by country of issue, as a percentage of total net assets, is as follows: (Unaudited) |
United States of America | 79.2% |
Canada | 3.6% |
United Kingdom | 1.9% |
France | 1.6% |
Bermuda | 1.4% |
Switzerland | 1.2% |
Netherlands | 1.1% |
Others (Individually Less Than 1%) | 10.0% |
| 100.0% |
Income Tax Information |
At July 31, 2011, the Fund had a capital loss carryforward of approximately $41,875,000 all of which will expire in fiscal 2018. Capital loss carryforwards are only available to offset future capital gains of the Fund to the extent provided by regulations and may be limited. |
See accompanying notes which are an integral part of the financial statements.
Annual Report
Statement of Assets and Liabilities
Amounts in thousands (except per-share amounts) | July 31, 2011 |
| | |
Assets | | |
Investment in securities, at value (including securities loaned of $152,805) - See accompanying schedule: Unaffiliated issuers (cost $8,467,548) | $ 9,743,759 | |
Fidelity Central Funds (cost $171,342) | 171,342 | |
Other affiliated issuers (cost $165,633) | 165,290 | |
Total Investments (cost $8,804,523) | | $ 10,080,391 |
Cash | | 104 |
Foreign currency held at value (cost $527) | | 527 |
Receivable for investments sold | | 112,559 |
Receivable for fund shares sold | | 6,308 |
Dividends receivable | | 8,055 |
Interest receivable | | 649 |
Distributions receivable from Fidelity Central Funds | | 409 |
Other receivables | | 649 |
Total assets | | 10,209,651 |
| | |
Liabilities | | |
Payable for investments purchased | $ 84,500 | |
Payable for fund shares redeemed | 16,616 | |
Accrued management fee | 6,090 | |
Other affiliated payables | 1,719 | |
Other payables and accrued expenses | 1,416 | |
Collateral on securities loaned, at value | 156,595 | |
Total liabilities | | 266,936 |
| | |
Net Assets | | $ 9,942,715 |
Net Assets consist of: | | |
Paid in capital | | $ 8,758,078 |
Undistributed net investment income | | 22,949 |
Accumulated undistributed net realized gain (loss) on investments and foreign currency transactions | | (113,290) |
Net unrealized appreciation (depreciation) on investments and assets and liabilities in foreign currencies | | 1,274,978 |
Net Assets | | $ 9,942,715 |
See accompanying notes which are an integral part of the financial statements.
Annual Report
Statement of Assets and Liabilities - continued
Amounts in thousands (except per-share amounts) | July 31, 2011 |
| | |
Dividend Growth:
Net Asset Value, offering price and redemption price
per share ($9,308,780 ÷ 321,451 shares) | | $ 28.96 |
| | |
Class K:
Net Asset Value, offering price and redemption price per share ($633,935 ÷ 21,877 shares) | | $ 28.98 |
See accompanying notes which are an integral part of the financial statements.
Annual Report
Financial Statements - continued
Statement of Operations
Amounts in thousands | Year ended July 31, 2011 |
| | |
Investment Income | | |
Dividends | | $ 122,532 |
Interest | | 7,730 |
Income from Fidelity Central Funds | | 2,670 |
Total income | | 132,932 |
| | |
Expenses | | |
Management fee
Basic fee | $ 54,190 | |
Performance adjustment | 13,876 | |
Transfer agent fees | 19,362 | |
Accounting and security lending fees | 1,306 | |
Custodian fees and expenses | 514 | |
Independent trustees' compensation | 53 | |
Registration fees | 148 | |
Audit | 88 | |
Legal | 43 | |
Miscellaneous | 98 | |
Total expenses before reductions | 89,678 | |
Expense reductions | (565) | 89,113 |
Net investment income (loss) | | 43,819 |
Realized and Unrealized Gain (Loss) Net realized gain (loss) on: | | |
Investment securities: | | |
Unaffiliated issuers | 809,337 | |
Other affiliated issuers | (5,052) | |
Foreign currency transactions | (2,084) | |
Total net realized gain (loss) | | 802,201 |
Change in net unrealized appreciation (depreciation) on: Investment securities | 997,622 | |
Assets and liabilities in foreign currencies | 85 | |
Total change in net unrealized appreciation (depreciation) | | 997,707 |
Net gain (loss) | | 1,799,908 |
Net increase (decrease) in net assets resulting from operations | | $ 1,843,727 |
See accompanying notes which are an integral part of the financial statements.
Annual Report
Statement of Changes in Net Assets
Amounts in thousands | Year ended
July 31,
2011 | Year ended
July 31,
2010 |
Increase (Decrease) in Net Assets | | |
Operations | | |
Net investment income (loss) | $ 43,819 | $ 44,690 |
Net realized gain (loss) | 802,201 | 922,532 |
Change in net unrealized appreciation (depreciation) | 997,707 | 264,038 |
Net increase (decrease) in net assets resulting
from operations | 1,843,727 | 1,231,260 |
Distributions to shareholders from net investment income | (51,737) | (39,369) |
Distributions to shareholders from net realized gain | (26,364) | (16,428) |
Total distributions | (78,101) | (55,797) |
Share transactions - net increase (decrease) | 91,677 | 104,895 |
Total increase (decrease) in net assets | 1,857,303 | 1,280,358 |
| | |
Net Assets | | |
Beginning of period | 8,085,412 | 6,805,054 |
End of period (including undistributed net investment income of $22,949 and undistributed net investment income of $31,691, respectively) | $ 9,942,715 | $ 8,085,412 |
See accompanying notes which are an integral part of the financial statements.
Annual Report
Financial Highlights - Dividend Growth
Years ended July 31, | 2011 | 2010 | 2009 | 2008 | 2007 |
Selected Per-Share Data | | | | | |
Net asset value, beginning of period | $ 23.84 | $ 20.25 | $ 25.40 | $ 32.73 | $ 29.50 |
Income from Investment Operations | | | | | |
Net investment income (loss) B | .12 | .13E | .24 | .43 | .52 F |
Net realized and unrealized gain (loss) | 5.23 | 3.63 | (4.01) | (5.08) | 3.98 |
Total from investment operations | 5.35 | 3.76 | (3.77) | (4.65) | 4.50 |
Distributions from net investment income | (.15) | (.12) | (.37) | (.45) | (.45) |
Distributions from net realized gain | (.08) | (.05) | (1.01) | (2.23) | (.82) |
Total distributions | (.23) | (.17) | (1.38) H | (2.68) | (1.27) |
Net asset value, end of period | $ 28.96 | $ 23.84 | $ 20.25 | $ 25.40 | $ 32.73 |
Total Return A | 22.57% | 18.59% | (15.33)% | (15.45)% | 15.62% |
Ratios to Average Net Assets C,G | | | | | |
Expenses before reductions | .93% | .93% | .62% | .64% | .61% |
Expenses net of fee waivers, if any | .93% | .93% | .62% | .64% | .61% |
Expenses net of all reductions | .93% | .92% | .62% | .63% | .60% |
Net investment income (loss) | .44% | .56% E | 1.34% | 1.47% | 1.62% F |
Supplemental Data | | | | | |
Net assets, end of period (in millions) | $ 9,309 | $ 7,730 | $ 6,603 | $ 9,502 | $ 16,265 |
Portfolio turnover rate D | 67% | 85% | 177% | 52% | 36% |
A Total returns would have been lower if certain expenses had not been reduced during the applicable periods shown.
B Calculated based on average shares outstanding during the period.
C Fees and expenses of any underlying Fidelity Central Funds are not included in the Fund's expense ratio. The Fund indirectly bears its proportionate share of the expenses of any underlying Fidelity Central Funds.
D Amount does not include the portfolio activity of any underlying Fidelity Central Funds.
E Investment income per share reflects a special dividend which amounted to $.04 per share. Excluding the special dividend, the ratio of net investment income (loss) to average net assets would have been .40%.
F Investment income per share reflects a special dividend which amounted to $.07 per share. Excluding the special dividend, the ratio of net investment income (loss) to average net assets would have been 1.40%.
G Expense ratios reflect operating expenses of the class. Expenses before reductions do not reflect amounts reimbursed by the investment adviser or reductions from brokerage service arrangements or reductions from other expense offset arrangements and do not represent the amount paid by the class during periods when reimbursements or reductions occur. Expenses net of fee waivers reflect expenses after reimbursement by the investment adviser but prior to reductions from brokerage service arrangements or other expense offset arrangements. Expenses net of all reductions represent the net expenses paid by the class.
H Total distributions of $1.38 per share is comprised of distributions from net investment income of $.374 and distributions from net realized gain of $1.005 per share.
See accompanying notes which are an integral part of the financial statements.
Annual Report
Financial Highlights - Class K
Years ended July 31, | 2011 | 2010 | 2009 | 2008 H |
Selected Per-Share Data | | | | |
Net asset value, beginning of period | $ 23.86 | $ 20.26 | $ 25.41 | $ 27.72 |
Income from Investment Operations | | | | |
Net investment income (loss) D | .17 | .18 G | .26 | .10 |
Net realized and unrealized gain (loss) | 5.22 | 3.63 | (4.00) | (2.41) |
Total from investment operations | 5.39 | 3.81 | (3.74) | (2.31) |
Distributions from net investment income | (.20) | (.16) | (.41) | - |
Distributions from net realized gain | (.08) | (.05) | (1.01) | - |
Total distributions | (.27) K | (.21) | (1.41) J | - |
Net asset value, end of period | $ 28.98 | $ 23.86 | $ 20.26 | $ 25.41 |
Total Return B,C | 22.79% | 18.86% | (15.16)% | (8.33)% |
Ratios to Average Net Assets E,I | | | | |
Expenses before reductions | .78% | .72% | .40% | .47% A |
Expenses net of fee waivers, if any | .78% | .72% | .40% | .47% A |
Expenses net of all reductions | .77% | .71% | .39% | .47% A |
Net investment income (loss) | .60% | .76% G | 1.57% | 1.66% A |
Supplemental Data | | | | |
Net assets, end of period (000 omitted) | $ 633,935 | $ 355,463 | $ 201,625 | $ 92 |
Portfolio turnover rate F | 67% | 85% | 177% | 52% |
A Annualized
B Total returns for periods of less than one year are not annualized.
C Total returns would have been lower if certain expenses had not been reduced during the applicable periods shown.
D Calculated based on average shares outstanding during the period.
E Fees and expenses of any underlying Fidelity Central Funds are not included in the Fund's expense ratio. The Fund indirectly bears its proportionate share of the expenses of any underlying Fidelity Central Funds.
F Amount does not include the portfolio activity of any underlying Fidelity Central Funds.
G Investment income per share reflects a special dividend which amounted to $.04 per share. Excluding the special dividend, the ratio of net investment income (loss) to average net assets would have been .60%.
H For the period May 9, 2008 (commencement of sale of shares) to July 31, 2008.
I Expense ratios reflect operating expenses of the class. Expenses before reductions do not reflect amounts reimbursed by the investment adviser or reductions from brokerage service arrangements or reductions from other expense offset arrangements and do not represent the amount paid by the class during periods when reimbursements or reductions occur. Expense ratios before reductions for start-up periods may not be representative of longer-term operating periods. Expenses net of fee waivers reflect expenses after reimbursement by the investment adviser but prior to reductions from brokerage service arrangements or other expense offset arrangements. Expenses net of all reductions represent the net expenses paid by the class.
J Total distributions of $1.41 per share is comprised of distributions from net investment income of $.407 and distributions from net realized gain of $1.005 per share.
K Total distributions of $.27 per share is comprised of distributions from net investment income of $.197 and distributions from net realized gain of $.077 per share.
See accompanying notes which are an integral part of the financial statements.
Annual Report
Notes to Financial Statements
For the period ended July 31, 2011
(Amounts in thousands except ratios)
1. Organization.
Fidelity Dividend Growth Fund (the Fund) is a fund of Fidelity Securities Fund (the Trust) and is authorized to issue an unlimited number of shares. The Trust is registered under the Investment Company Act of 1940, as amended (the 1940 Act), as an open-end management investment company organized as a Massachusetts business trust. The Fund offers Dividend Growth and Class K shares, each of which has equal rights as to assets and voting privileges. Each class has exclusive voting rights with respect to matters that affect that class. Investment income, realized and unrealized capital gains and losses, the common expenses of the Fund, and certain fund-level expense reductions, if any, are allocated on a pro-rata basis to each class based on the relative net assets of each class to the total net assets of the Fund. Each class differs with respect to transfer agent fees incurred. Certain expense reductions may also differ by class.
2. Investments in Fidelity Central Funds.
The Fund invests in Fidelity Central Funds, which are open-end investment companies available only to other investment companies and accounts managed by Fidelity Management & Research Company (FMR) and its affiliates. The Fund's Schedule of Investments lists each of the Fidelity Central Funds held as of period end, if any, as an investment of the Fund, but does not include the underlying holdings of each Fidelity Central Fund. As an Investing Fund, the Fund indirectly bears its proportionate share of the expenses of the underlying Fidelity Central Funds.
The Money Market Central Funds seek preservation of capital and current income and are managed by Fidelity Investments Money Management, Inc. (FIMM), an affiliate of FMR.
A complete unaudited list of holdings for each Fidelity Central Fund is available upon request or at the Securities and Exchange Commission (the SEC) web site at www.sec.gov. In addition, the financial statements of the Fidelity Central Funds, which are not covered by the Fund's Report of Independent Registered Public Accounting Firm, are available on the SEC web site or upon request.
3. Significant Accounting Policies.
The financial statements have been prepared in conformity with accounting principles generally accepted in the United States of America (GAAP), which require management to make certain estimates and assumptions at the date of the financial statements. Actual results could differ from those estimates. Subsequent events, if any, through the date that the financial statements were issued have been evaluated in the preparation of the financial statements. The following summarizes the significant accounting policies of the Fund:
Annual Report
3. Significant Accounting Policies - continued
Security Valuation. Investments are valued as of 4:00 p.m. Eastern time on the last calendar day of the period. The Fund uses independent pricing services approved by the Board of Trustees to value its investments. When current market prices or quotations are not readily available or reliable, valuations may be determined in good faith in accordance with procedures adopted by the Board of Trustees. Factors used in determining value may include market or security specific events, changes in interest rates and credit quality. The frequency with which these procedures are used cannot be predicted and they may be utilized to a significant extent. The value used for net asset value (NAV) calculation under these procedures may differ from published prices for the same securities.
The Fund categorizes the inputs to valuation techniques used to value its investments into a disclosure hierarchy consisting of three levels as shown below:
Level 1 - quoted prices in active markets for identical investments
Level 2 - other significant observable inputs (including quoted prices for similar investments, interest rates, prepayment speeds, etc.)
Level 3 - unobservable inputs (including the Fund's own assumptions based on the best information available)
Changes in valuation techniques may result in transfers in or out of an assigned level within the disclosure hierarchy. The aggregate value of investments by input level, as of July 31, 2011, as well as a roll forward of Level 3 securities, is included at the end of the Fund's Schedule of Investments. Valuation techniques used to value the Fund's investments by major category are as follows:
Equity securities, including restricted securities, for which market quotations are readily available, are valued at the last reported sale price or official closing price as reported by an independent pricing service on the primary market or exchange on which they are traded and are categorized as Level 1 in the hierarchy. In the event there were no sales during the day or closing prices are not available, securities are valued at the last quoted bid price or may be valued using the last available price and are generally categorized as Level 2 in the hierarchy. For foreign equity securities, when significant market or security specific events arise, comparisons to the valuation of American Depositary Receipts (ADRs), futures contracts, Exchange-traded funds (ETFs) and certain indexes as well as quoted prices for similar securities are used and are categorized as Level 2 in the hierarchy in these circumstances. Utilizing these techniques may result in transfers between Level 1 and Level 2. For restricted equity securities and private placements where observable inputs are limited, assumptions about market activity and risk are used and are categorized as Level 3 in the hierarchy.
Annual Report
Notes to Financial Statements - continued
(Amounts in thousands except ratios)
3. Significant Accounting Policies - continued
Security Valuation - continued
Debt securities, including restricted securities, are valued based on evaluated prices received from independent pricing services or from dealers who make markets in such securities. For corporate bonds, pricing services utilize matrix pricing which considers yield or price of bonds of comparable quality, coupon, maturity and type as well as dealer supplied prices and are generally categorized as Level 2 in the hierarchy. When independent prices are unavailable or unreliable, debt securities may be valued utilizing pricing matrices which consider similar factors that would be used by independent pricing services. These are generally categorized as Level 2 in the hierarchy but may be Level 3 depending on the circumstances.
Investments in open-end mutual funds, including the Fidelity Central Funds, are valued at their closing net asset value each business day and are categorized as Level 1 in the hierarchy.
Foreign Currency. The Fund may use foreign currency contracts to facilitate transactions in foreign-denominated securities. Gains and losses from these transactions may arise from changes in the value of the foreign currency or if the counterparties do not perform under the contracts' terms.
Foreign-denominated assets, including investment securities, and liabilities are translated into U.S. dollars at the exchange rate at period end. Purchases and sales of investment securities, income and dividends received and expenses denominated in foreign currencies are translated into U.S. dollars at the exchange rate in effect on the transaction date.
The effects of exchange rate fluctuations on investments are included with the net realized and unrealized gain (loss) on investment securities. Other foreign currency transactions resulting in realized and unrealized gain (loss) are disclosed separately.
Investment Transactions and Income. For financial reporting purposes, the Fund's investment holdings and NAV include trades executed through the end of the last business day of the period. The NAV per share for processing shareholder transactions is calculated as of the close of business of the New York Stock Exchange (NYSE), normally 4:00 p.m. Eastern time and includes trades executed through the end of the prior business day. Gains and losses on securities sold are determined on the basis of identified cost and may include proceeds received from litigation. Dividend income is recorded on the ex-dividend date, except for certain dividends from foreign securities where the ex-dividend date may have passed, which are recorded as soon as the Fund is informed of the ex-dividend date. Non-cash dividends included in dividend income, if any, are recorded at the fair market value of the securities received. Interest income and distributions from the Fidelity Central Funds are accrued as earned. Interest income
Annual Report
3. Significant Accounting Policies - continued
Investment Transactions and Income - continued
includes coupon interest and amortization of premium and accretion of discount on debt securities. Investment income is recorded net of foreign taxes withheld where recovery of such taxes is uncertain.
Expenses. Expenses directly attributable to a fund are charged to that fund. Expenses attributable to more than one fund are allocated among the respective funds on the basis of relative net assets or other appropriate methods. Expense estimates are accrued in the period to which they relate and adjustments are made when actual amounts are known.
Deferred Trustee Compensation. Under a Deferred Compensation Plan (the Plan), independent Trustees may elect to defer receipt of a portion of their annual compensation. Deferred amounts are invested in a cross-section of Fidelity funds, are marked-to-market and remain in the Fund until distributed in accordance with the Plan. The investment of deferred amounts and the offsetting payable to the Trustees are included in the accompanying Statement of Assets and Liabilities.
Income Tax Information and Distributions to Shareholders. Each year, the Fund intends to qualify as a regulated investment company, including distributing substantially all of its taxable income and realized gains under Subchapter M of the Internal Revenue Code and filing its U.S. federal tax return. As a result, no provision for income taxes is required. As of July 31, 2011, the Fund did not have any unrecognized tax benefits in the financial statements. A fund's federal tax return is subject to examination by the Internal Revenue Service (IRS) for a period of three years. Foreign taxes are provided for based on the Fund's understanding of the tax rules and rates that exist in the foreign markets in which it invests.
Distributions are declared and recorded on the ex-dividend date. Income dividends and capital gain distributions are declared separately for each class. Income and capital gain distributions are determined in accordance with income tax regulations, which may differ from GAAP. In addition, the Fund claimed a portion of the payment made to redeeming shareholders as a distribution for income tax purposes.
Capital accounts within the financial statements are adjusted for permanent book-tax differences. These adjustments have no impact on net assets or the results of operations. Temporary book-tax differences will reverse in a subsequent period.
Book-tax differences are primarily due to foreign currency transactions, passive foreign investment companies (PFIC), market discount, equity-debt classifications, partnerships, deferred trustees compensation, capital loss carryforwards and losses deferred due to wash sales.
Annual Report
Notes to Financial Statements - continued
(Amounts in thousands except ratios)
3. Significant Accounting Policies - continued
Income Tax Information and Distributions to Shareholders - continued
The federal tax cost of investment securities and unrealized appreciation (depreciation) as of period end were as follows:
Gross unrealized appreciation | $ 1,675,274 |
Gross unrealized depreciation | (473,832) |
Net unrealized appreciation (depreciation) on securities and other investments | $ 1,201,442 |
| |
Tax Cost | $ 8,878,949 |
The tax-based components of distributable earnings as of period end were as follows:
Undistributed ordinary income | $ 26,540 |
Capital loss carryforward | $ (41,875) |
Net unrealized appreciation (depreciation) | $ 1,200,553 |
Under the recently enacted Regulated Investment Company Modernization Act of 2010 (the Act), the Fund will be permitted to carry forward capital losses incurred in taxable years beginning after December 22, 2010 for an unlimited period. However, any losses incurred during those future taxable years will be required to be utilized prior to any losses incurred in pre-enactment taxable years, which generally expire after eight years from when they are incurred. Additionally, post-enactment capital losses that are carried forward will retain their character as either short-term or long-term capital losses rather than being considered all short-term as under previous law. The Fund's first fiscal year end subject to the Act will be July 31, 2012.
The tax character of distributions paid was as follows:
| July 31, 2011 | July 31, 2010 |
Ordinary Income | $ 78,101 | $ 55,797 |
New Accounting Pronouncement. In May 2011, the Financial Accounting Standards Board issued Accounting Standard Update No. 2011-04, Fair Value Measurement (Topic 820) - Amendments to Achieve Common Fair Value Measurement and Disclosure Requirements in U.S. GAAP and IFRSs. The update changes the wording used to describe the requirements in GAAP for measuring fair value and for disclosing information about fair value measurements. The update is effective during interim and annual periods beginning after December 15, 2011. Management is currently evaluating the impact of the update's adoption on the Fund's financial statement disclosures.
Annual Report
4. Operating Policies.
Restricted Securities. The Fund may invest in securities that are subject to legal or contractual restrictions on resale. These securities generally may be resold in transactions exempt from registration or to the public if the securities are registered. Disposal of these securities may involve time-consuming negotiations and expense, and prompt sale at an acceptable price may be difficult. Information regarding restricted securities is included at the end of the Fund's Schedule of Investments.
5. Purchases and Sales of Investments.
Purchases and sales of securities, other than short-term securities, aggregated $6,534,955 and $6,441,727, respectively.
6. Fees and Other Transactions with Affiliates.
Management Fee. FMR and its affiliates provide the Fund with investment management related services for which the Fund pays a monthly management fee. The management fee is the sum of an individual fund fee rate that is based on an annual rate of .30% of the Fund's average net assets and a group fee rate that averaged .26% during the period. The group fee rate is based upon the average net assets of all the mutual funds advised by FMR. The group fee rate decreases as assets under management increase and increases as assets under management decrease. In addition, the management fee is subject to a performance adjustment (up to a maximum of ± .20% of the Fund's average net assets over a 36 month performance period). The upward or downward adjustment to the management fee is based on the relative investment performance of Dividend Growth as compared to an appropriate benchmark index. For the period, the total annual management fee rate, including the performance adjustment, was .70% of the Fund's average net assets.
Transfer Agent Fees. Fidelity Investments Institutional Operations Company, Inc. (FIIOC), an affiliate of FMR, is the transfer, dividend disbursing and shareholder servicing agent for each class of the Fund. FIIOC receives account fees and asset-based fees that vary according to the account size and type of account of the shareholders of Dividend Growth. FIIOC receives no fees for providing transfer agency services to Class F. FIIOC pays for typesetting, printing and mailing of shareholder reports, except proxy statements. For the period, transfer agent fees for each class were as follows:
| Amount | % of
Average
Net Assets |
Dividend Growth | $ 19,090 | .21 |
Class K | 272 | .05 |
| $ 19,362 | |
Annual Report
Notes to Financial Statements - continued
(Amounts in thousands except ratios)
6. Fees and Other Transactions with Affiliates - continued
Accounting and Security Lending Fees. Fidelity Service Company, Inc. (FSC), an affiliate of FMR, maintains the Fund's accounting records. The accounting fee is based on the level of average net assets for the month. Under a separate contract, FSC administers the security lending program. The security lending fee is based on the number and duration of lending transactions.
Brokerage Commissions. The Fund placed a portion of its portfolio transactions with brokerage firms which are affiliates of the investment adviser. The commissions paid to these affiliated firms were $190 for the period.
Interfund Lending Program. Pursuant to an Exemptive Order issued by the SEC, the Fund, along with other registered investment companies having management contracts with FMR, may participate in an interfund lending program. This program provides an alternative credit facility allowing the funds to borrow from, or lend money to, other participating affiliated funds. The interest expense amounted to fifty-nine dollars under the interfund lending program. The Fund's activity in this program during the period for which loans were outstanding was as follows:
Borrower or Lender | Average Daily Loan Balance | Weighted Average Interest Rate |
Borrower | $ 6,139 | .35% |
7. Committed Line of Credit.
The Fund participates with other funds managed by FMR or an affiliate in a $4.0 billion credit facility (the "line of credit") to be utilized for temporary or emergency purposes to fund shareholder redemptions or for other short-term liquidity purposes. The Fund has agreed to pay commitment fees on its pro-rata portion of the line of credit, which amounted to $32 and is reflected in Miscellaneous expenses on the Statement of Operations. During the period, there were no borrowings on this line of credit.
8. Security Lending.
The Fund lends portfolio securities through a lending agent from time to time in order to earn additional income. The lending agent may loan securities to certain qualified borrowers, including Fidelity Capital Markets (FCM), a broker-dealer affiliated with the Fund. On the settlement date of the loan, the Fund receives collateral (in the form of U.S. Treasury obligations, letters of credit and/or cash) against the loaned securities and maintains collateral in an amount not less than 100% of the market value of the loaned securities during the period of the loan. The market value of the loaned securities is determined at the close of business of the Fund and any additional required collateral is delivered to the Fund on the next business day. If the borrower defaults on its obligation
Annual Report
8. Security Lending - continued
to return the securities loaned because of insolvency or other reasons, a fund could experience delays and costs in recovering the securities loaned or in gaining access to the collateral. Any cash collateral received is invested in the Fidelity Securities Lending Cash Central Fund. The value of loaned securities and cash collateral at period end are disclosed on the Fund's Statement of Assets and Liabilities. The value of securities loaned to FCM at period end was $897. Security lending income represents the income earned on investing cash collateral, less rebates paid to borrowers and lending agent fees associated with the loan, plus any premium payments received for lending certain types of securities. Security lending income is presented in the Statement of Operations as a component of income from Fidelity Central Funds. Total security lending income during the period amounted to $2,562, including $80 from securities loaned to FCM.
9. Expense Reductions.
Many of the brokers with whom FMR places trades on behalf of the Fund provided services in addition to trade execution. These services included payments of certain expenses on behalf of the Fund totaling $565 for the period.
10. Distributions to Shareholders.
Distributions to shareholders of each class were as follows:
Years ended July 31, | 2011 | 2010 |
From net investment income | | |
Dividend Growth | $ 48,547 | $ 37,603 |
Class K | 3,190 | 1,766 |
Total | $ 51,737 | $ 39,369 |
From net realized gain | | |
Dividend Growth | $ 25,105 | $ 15,884 |
Class K | 1,259 | 544 |
Total | $ 26,364 | $ 16,428 |
11. Share Transactions.
Transactions for each class of shares were as follows:
| Shares | Dollars |
Years ended July 31, | 2011 | 2010 | 2011 | 2010 |
Dividend Growth | | | | |
Shares sold | 76,617 | 100,583 | $ 2,092,410 | $ 2,382,785 |
Reinvestment of distributions | 2,707 | 2,281 | 68,380 | 51,426 |
Shares redeemed | (82,166) | (104,744) | (2,266,445) | (2,445,083) |
Net increase (decrease) | (2,842) | (1,880) | $ (105,655) | $ (10,872) |
Annual Report
Notes to Financial Statements - continued
(Amounts in thousands except ratios)
11. Share Transactions - continued
| Shares | Dollars |
Years ended July 31, | 2011 | 2010 | 2011 | 2010 |
Class K | | | | |
Shares sold | 11,524 | 7,715 | $ 323,383 | $ 180,965 |
Reinvestment of distributions | 175 | 102 | 4,449 | 2,310 |
Shares redeemed | (4,720) | (2,870) | (130,500) | (67,508) |
Net increase (decrease) | 6,979 | 4,947 | $ 197,332 | $ 115,767 |
12. Other.
The Fund's organizational documents provide former and current trustees and officers with a limited indemnification against liabilities arising in connection with the performance of their duties to the Fund. In the normal course of business, the Fund may also enter into contracts that provide general indemnifications. The Fund's maximum exposure under these arrangements is unknown as this would be dependent on future claims that may be made against the Fund. The risk of material loss from such claims is considered remote.
Annual Report
To the Trustees of Fidelity Securities Fund and the Shareholders of Fidelity Dividend Growth Fund:
In our opinion, the accompanying statement of assets and liabilities, including the schedule of investments, and the related statements of operations and of changes in net assets and the financial highlights present fairly, in all material respects, the financial position of Fidelity Dividend Growth Fund (a fund of Fidelity Securities Fund) at July 31, 2011, the results of its operations for the year then ended, the changes in its net assets for each of the two years in the period then ended and the financial highlights for each of the periods indicated, in conformity with accounting principles generally accepted in the United States of America. These financial statements and financial highlights (hereafter referred to as "financial statements") are the responsibility of the Fidelity Dividend Growth Fund's management. Our responsibility is to express an opinion on these financial statements based on our audits. We conducted our audits of these financial statements in accordance with the standards of the Public Company Accounting Oversight Board (United States). Those standards require that we plan and perform the audit to obtain reasonable assurance about whether the financial statements are free of material misstatement. An audit includes examining, on a test basis, evidence supporting the amounts and disclosures in the financial statements, assessing the accounting principles used and significant estimates made by management, and evaluating the overall financial statement presentation. We believe that our audits, which included confirmation of securities at July 31, 2011 by correspondence with the custodian and brokers, provide a reasonable basis for our opinion.
/s/PricewaterhouseCoopers LLP
PricewaterhouseCoopers LLP
Boston, Massachusetts
September 15, 2011
Annual Report
The Trustees, Members of the Advisory Board, and executive officers of the trust and fund, as applicable, are listed below. The Board of Trustees governs the fund and is responsible for protecting the interests of shareholders. The Trustees are experienced executives who meet periodically throughout the year to oversee the fund's activities, review contractual arrangements with companies that provide services to the fund, oversee management of the risks associated with such activities and contractual arrangements, and review the fund's performance. Except for Mr. James C. Curvey, each of the Trustees oversees 221 funds advised by FMR or an affiliate. Mr. Curvey oversees 419 funds advised by FMR or an affiliate.
The Trustees hold office without limit in time except that (a) any Trustee may resign; (b) any Trustee may be removed by written instrument, signed by at least two-thirds of the number of Trustees prior to such removal; (c) any Trustee who requests to be retired or who has become incapacitated by illness or injury may be retired by written instrument signed by a majority of the other Trustees; and (d) any Trustee may be removed at any special meeting of shareholders by a two-thirds vote of the outstanding voting securities of the trust. Each Trustee who is not an interested person (as defined in the 1940 Act) (Independent Trustee), shall retire not later than the last day of the calendar year in which his or her 75th birthday occurs. The Independent Trustees may waive this mandatory retirement age policy with respect to individual Trustees. The executive officers and Advisory Board Members hold office without limit in time, except that any officer and Advisory Board Member may resign or may be removed by a vote of a majority of the Trustees at any regular meeting or any special meeting of the Trustees. Except as indicated, each individual has held the office shown or other offices in the same company for the past five years.
Experience, Skills, Attributes, and Qualifications of the Fund's Trustees. The Governance and Nominating Committee has adopted a statement of policy that describes the experience, qualifications, attributes, and skills that are necessary and desirable for potential Independent Trustee candidates (Statement of Policy). The Board believes that each Trustee satisfied at the time he or she was initially elected or appointed a Trustee, and continues to satisfy, the standards contemplated by the Statement of Policy. The Governance and Nominating Committee also engages professional search firms to help identify potential Independent Trustee candidates who have the experience, qualifications, attributes, and skills consistent with the Statement of Policy. From time to time, additional criteria based on the composition and skills of the current Independent Trustees, as well as experience or skills that may be appropriate in light of future changes to board composition, business conditions, and regulatory or other developments, have also been considered by the professional search firms and the Governance and Nominating Committee. In addition, the Board takes into account the Trustees' commitment and participation in Board and committee meetings, as well as their leadership of standing and ad hoc committees throughout their tenure.
In determining that a particular Trustee was and continues to be qualified to serve as a Trustee, the Board has considered a variety of criteria, none of which, in isolation, was controlling. The Board believes that, collectively, the Trustees have balanced and diverse experience, qualifications, attributes, and skills, which allow the Board to operate effectively in governing the fund and protecting the interests of shareholders. Information about the specific experience, skills, attributes, and qualifications of each Trustee, which in each case led to the Board's conclusion that the Trustee should serve (or continue to serve) as a trustee of the fund, is provided below.
Annual Report
Board Structure and Oversight Function. James C. Curvey is an interested person (as defined in the 1940 Act) and currently serves as Acting Chairman. The Trustees have determined that an interested Chairman is appropriate and benefits shareholders because an interested Chairman has a personal and professional stake in the quality and continuity of services provided to the fund. Independent Trustees exercise their informed business judgment to appoint an individual of their choosing to serve as Chairman, regardless of whether the Trustee happens to be independent or a member of management. The Independent Trustees have determined that they can act independently and effectively without having an Independent Trustee serve as Chairman and that a key structural component for assuring that they are in a position to do so is for the Independent Trustees to constitute a substantial majority for the Board. The Independent Trustees also regularly meet in executive session. Ned C. Lautenbach serves as Chairman of the Independent Trustees and as such (i) acts as a liaison between the Independent Trustees and management with respect to matters important to the Independent Trustees and (ii) with management prepares agendas for Board meetings.
Fidelity funds are overseen by different Boards of Trustees. The fund's Board oversees Fidelity's equity and high income funds and another Board oversees Fidelity's investment-grade bond, money market, and asset allocation funds. The asset allocation funds may invest in Fidelity funds overseen by the fund's Board. The use of separate Boards, each with its own committee structure, allows the Trustees of each group of Fidelity funds to focus on the unique issues of the funds they oversee, including common research, investment, and operational issues. On occasion, the separate Boards establish joint committees to address issues of overlapping consequences for the Fidelity funds overseen by each Board.
The Trustees operate using a system of committees to facilitate the timely and efficient consideration of all matters of importance to the Trustees, the fund, and fund shareholders and to facilitate compliance with legal and regulatory requirements and oversight of the fund's activities and associated risks. The Board, acting through its committees, has charged FMR and its affiliates with (i) identifying events or circumstances the occurrence of which could have demonstrably adverse effects on the fund's business and/or reputation; (ii) implementing processes and controls to lessen the possibility that such events or circumstances occur or to mitigate the effects of such events or circumstances if they do occur; and (iii) creating and maintaining a system designed to evaluate continuously business and market conditions in order to facilitate the identification and implementation processes described in (i) and (ii) above. Because the day-to-day operations and activities of the fund are carried out by or through FMR, its affiliates and other service providers, the fund's exposure to risks is mitigated but not eliminated by the processes overseen by the Trustees. While each of the Board's committees has responsibility for overseeing different aspects of the fund's activities, oversight is exercised primarily through the Operations, Audit, and Compliance Committees. Appropriate personnel, including but not limited to the fund's Chief Compliance Officer (CCO), FMR's internal auditor, the independent accountants, the fund's Treasurer and portfolio management personnel, make periodic reports to the Board's committees, as appropriate. The responsibilities of each committee, including their oversight responsibilities, are described further under "Standing Committees of the Fund's Trustees."
Annual Report
Trustees and Officers - continued
The fund's Statement of Additional Information (SAI) includes more information about the Trustees. To request a free copy, call Fidelity at 1-800-835-5092.
Interested Trustees*:
Correspondence intended for each Trustee who is an interested person may be sent to Fidelity Investments, 82 Devonshire Street, Boston, Massachusetts 02109.
Name, Age; Principal Occupations and Other Relevant Experience+ |
James C. Curvey (76) |
| Year of Election or Appointment: 2007 Mr. Curvey is Trustee and Acting Chairman of the Board of Trustees of certain Trusts. Mr. Curvey also serves as Trustee (2007-present) of other investment companies advised by FMR. Mr. Curvey is a Director of Fidelity Investments Money Management, Inc. (2009-present), Director of Fidelity Research & Analysis Co. (2009-present) and Director of FMR and FMR Co., Inc. (2007-present). Mr. Curvey is also Vice Chairman (2007-present) and Director of FMR LLC. In addition, Mr. Curvey serves as an Overseer for the Boston Symphony Orchestra and a member of the Trustees of Villanova University. Previously, Mr. Curvey was the Vice Chairman (2006-2007) and Director (2000-2007) of FMR Corp. |
Ronald P. O'Hanley (54) |
| Year of Election or Appointment: 2011 Mr. O'Hanley is Director of FMR Co., Inc. (2010-present), Director of Fidelity Investments Money Management, Inc. (2010-present), Director of Fidelity Research & Analysis Company (2010-present), President of Fidelity Asset Management and Corporate Services and a member of Fidelity's Executive Committee (2010-present). Previously, Mr. O'Hanley served as President and Chief Executive Officer of BNY Mellon Asset Management (2007-2010). Mr. O'Hanley also served as Vice Chairman of Bank New York Mellon Corp. and a member of that firm's Executive Committee. Prior to the 2007 merger of The Bank of New York and Mellon Financial Corporation, he was Vice Chairman of Mellon Financial Corporation and President and Chief Executive Officer of Mellon Asset Management. He joined Mellon in February 1997. Mr. O'Hanley currently serves as Chairman of the Boston Public Library Foundation Board of Directors and sits on the Board of Directors of Beth Israel Deaconess Medical Center, the Board of Trustees of the Marine Biological Laboratory and the Advisory Board of the Maxwell School of Citizenship and Public Administration at Syracuse University. Mr. O'Hanley also chairs the Council on Asset Management for the Financial Services Roundtable and is a member of the Board of Directors of Institutional Investor's U.S. Institute. |
* Trustees have been determined to be "Interested Trustees" by virtue of, among other things, their affiliation with the trust or various entities under common control with FMR.
+ The information above includes each Trustee's principal occupation during the last five years and other information relating to the experience, attributes, and skills relevant to each Trustee's qualifications to serve as a Trustee, which led to the conclusion that each Trustee should serve as a Trustee for the fund.
Annual Report
Trustees and Officers - continued
Independent Trustees:
Correspondence intended for each Independent Trustee (that is, the Trustees other than the Interested Trustees) may be sent to Fidelity Investments, P.O. Box 55235, Boston, Massachusetts 02205-5235.
Name, Age; Principal Occupations and Other Relevant Experience+ |
Dennis J. Dirks (63) |
| Year of Election or Appointment: 2005 Prior to his retirement in May 2003, Mr. Dirks was Chief Operating Officer and a member of the Board of The Depository Trust & Clearing Corporation (DTCC). He also served as President, Chief Operating Officer, and Board member of The Depository Trust Company (DTC) and President and Board member of the National Securities Clearing Corporation (NSCC). In addition, Mr. Dirks served as Chief Executive Officer and Board member of the Government Securities Clearing Corporation, Chief Executive Officer and Board member of the Mortgage-Backed Securities Clearing Corporation, as a Trustee and a member of the Finance Committee of Manhattan College (2005-2008), and as a Trustee and a member of the Finance Committee of AHRC of Nassau County (2006-2008). Mr. Dirks is a member of the Independent Directors Council (IDC) Governing Council (2010-Present) and Board of Directors for The Brookville Center for Children's Services, Inc. (2009-present). |
Alan J. Lacy (57) |
| Year of Election or Appointment: 2008 Mr. Lacy serves as Senior Adviser (2007-present) of Oak Hill Capital Partners, L.P. (private equity). Mr. Lacy also served as Chief Executive Officer (2000-2005) and Vice Chairman (2005-2006) of Sears Holdings Corporation and Sears, Roebuck and Co. (retail). In addition, Mr. Lacy serves as a member of the Board of Directors of Dave & Buster's, Inc. (restaurant and entertainment complexes, 2010-present), The Hillman Companies, Inc. (hardware wholesalers, 2010-present), and Bristol-Myers Squibb Company (global pharmaceuticals, 2007-present). Mr. Lacy is a member of the Board of Trustees of The National Parks Conservation Association (2006-Present). Previously, Mr. Lacy served as Chairman of the Board of Trustees of the National Parks Conservation Association (2008-2011) and as a member of the Board of Directors for the Western Union Company (global money transfer, 2006-2011). |
Ned C. Lautenbach (67) |
| Year of Election or Appointment: 2000 Mr. Lautenbach is Chairman of the Independent Trustees of the Equity and High Income Funds (2006-present). Mr. Lautenbach currently serves as the Lead Director of the Eaton Corporation Board of Directors (diversified industrial, 1997-present). Mr. Lautenbach is also a member of the Board of Directors of the Philharmonic Center for the Arts in Naples, Florida (1999-present); a member of the Board of Trustees of Fairfield University (2005-present); and a member of the Council on Foreign Relations (1994-present). Previously, Mr. Lautenbach was a Partner/Advisory Partner at Clayton, Dubilier & Rice, LLC (private equity investment, 1998-2010), as well as a Director of Sony Corporation (2006-2007). |
Joseph Mauriello (66) |
| Year of Election or Appointment: 2008 Prior to his retirement in January 2006, Mr. Mauriello served in numerous senior management positions including Deputy Chairman and Chief Operating Officer (2004-2005), and Vice Chairman of Financial Services (2002-2004) of KPMG LLP US (professional services, 1965-2005). Mr. Mauriello currently serves as a member of the Board of Directors of XL Group plc. (global insurance and re-insurance, 2006-present) and of Arcadia Resources Inc. (health care services and products, 2007-present). Previously, Mr. Mauriello served as a Director of the Hamilton Funds of the Bank of New York (2006-2007). |
Robert W. Selander (60) |
| Year of Election or Appointment: 2011 Previously, Mr. Selander served as a Member of the Advisory Board of Fidelity's Equity and High Income Funds (2011), Executive Vice Chairman (2010), Chief Executive Officer (2009-2010), and President and Chief Executive Officer (1997-2009) of Mastercard, Inc. |
Cornelia M. Small (67) |
| Year of Election or Appointment: 2005 Ms. Small is a member of the Board of Directors of the Teagle Foundation (2009-present). Ms. Small is also a member of the Investment Committee, and Chair (2008-present) and a member of the Board of Trustees of Smith College. In addition, Ms. Small serves on the Investment Committee of the Berkshire Taconic Community Foundation (2008-present). Previously, Ms. Small served as Chairperson of the Investment Committee (2002-2008) of Smith College. In addition, Ms. Small served as Chief Investment Officer, Director of Global Equity Investments, and a member of the Board of Directors of Scudder, Stevens & Clark and Scudder Kemper Investments. |
William S. Stavropoulos (72) |
| Year of Election or Appointment: 2001 Mr. Stavropoulos is Vice Chairman of the Independent Trustees of the Equity and High Income Funds (2006-present). Mr. Stavropoulos serves as President and Founder of the Michigan Baseball Foundation, the Great Lakes Loons (2007-present). Mr. Stavropoulos is Chairman Emeritus of the Board of Directors of The Dow Chemical Company, where he previously served in numerous senior management positions, including President, CEO (1995-2000; 2002-2004), Chairman of the Executive Committee (2000-2006), and as a member of the Board of Directors (1990-2006). Currently, Mr. Stavropoulos is Chairman of Univar (global distributor of commodity and specialty chemicals, 2010-present), a Director of Teradata Corporation (data warehousing and technology solutions, 2008-present), Chemical Financial Corporation, Maersk Inc. (industrial conglomerate), Tyco International, Inc. (multinational manufacturing and services, 2007-present), and a member of the Advisory Board for Metalmark Capital (private equity investment, 2005-present). Mr. Stavropoulos is a special advisor to Clayton, Dubilier & Rice, LLC (private equity investment). In addition, Mr. Stavropoulos is a member of the University of Notre Dame Advisory Council for the College of Science. |
David M. Thomas (62) |
| Year of Election or Appointment: 2008 Previously, Mr. Thomas served as Executive Chairman (2005-2006) and Chairman and Chief Executive Officer (2000-2005) of IMS Health, Inc. (pharmaceutical and healthcare information solutions). In addition, Mr. Thomas serves as a member of the Board of Directors of Fortune Brands, Inc. (consumer products), and Interpublic Group of Companies, Inc. (marketing communication, 2004-present). |
Michael E. Wiley (60) |
| Year of Election or Appointment: 2008 Mr. Wiley also serves as a Director of Asia Pacific Exploration Consolidated (international oil and gas exploration and production, 2008-present). Mr. Wiley serves as a Director of Tesoro Corporation (independent oil refiner and marketer, 2005-present), and a Director of Bill Barrett Corporation (exploration and production, 2005-present). In addition, Mr. Wiley also serves as a Director of Post Oak Bank (privately-held bank, 2004-present). Previously, Mr. Wiley served as a member of the Board of Trustees of the University of Tulsa (2000-2006; 2007-2010), as a Senior Energy Advisor of Katzenbach Partners, LLC (consulting, 2006-2007), as an Advisory Director of Riverstone Holdings (private investment), Chairman, President, and CEO of Baker Hughes, Inc. (oilfield services, 2000-2004), and as Director of Spinnaker Exploration Company (exploration and production, 2001-2005). |
Annual Report
+ The information above includes each Trustee's principal occupation during the last five years and other information relating to the experience, attributes, and skills relevant to each Trustee's qualifications to serve as a Trustee, which led to the conclusion that each Trustee should serve as a Trustee for the fund.
Advisory Board Members and Executive Officers:
Correspondence intended for each executive officer, Edward C. Johnson 3d, and Peter S. Lynch may be sent to Fidelity Investments, 82 Devonshire Street, Boston, Massachusetts 02109.
Name, Age; Principal Occupation |
Edward C. Johnson 3d (81) |
| Year of Election or Appointment: 2011 Member of the Advisory Board of Fidelity's Equity and High Income Funds. Mr. Johnson serves as Chief Executive Officer, Chairman, and a Director of FMR LLC, and also serves as Chairman and Director of FIL Limited. Previously, Mr. Johnson served as a Trustee and Chairman of the Board of certain Fidelity Trusts, Chairman and a Director of FMR, Chairman and a Director of FMR Co., Inc., and President of FMR LLC (2006-2007). |
Peter S. Lynch (67) |
| Year of Election or Appointment: 2003 Member of the Advisory Board of Fidelity's Equity and High Income Funds. Mr. Lynch is Vice Chairman and a Director of FMR and FMR Co., Inc. In addition, Mr. Lynch serves as a Trustee of Boston College and as the Chairman of the Inner-City Scholarship Fund. Previously, Mr. Lynch served on the Special Olympics International Board of Directors (1997-2006). |
Kenneth B. Robins (41) |
| Year of Election or Appointment: 2008 President and Treasurer of Fidelity's Equity and High Income Funds. Mr. Robins also serves as President and Treasurer (2010-present) and Assistant Treasurer (2009-present) of other Fidelity funds and is an employee of Fidelity Investments (2004-present). Previously, Mr. Robins served as Deputy Treasurer of the Fidelity funds (2005-2008) and Treasurer and Chief Financial Officer of The North Carolina Capital Management Trust: Cash and Term Portfolios (2006-2008). |
Bruce T. Herring (45) |
| Year of Election or Appointment: 2006 Vice President of certain Equity Funds. Mr. Herring also serves as Chief Investment Officer and Director of Fidelity Management & Research (U.K.) Inc. (2010-present) and Group Chief Investments Officer of FMR. Previously, Mr. Herring served as Vice President (2005-2006) and Senior Vice President (2006-2007) of Fidelity Management & Research Company, Vice President of FMR Co., Inc. (2001-2007) and as a portfolio manager for Fidelity U.S. Equity Funds. |
Brian B. Hogan (46) |
| Year of Election or Appointment: 2009 Vice President of Equity and High Income Funds. Mr. Hogan also serves as President of FMR's Equity Division (2009-present). Previously, Mr. Hogan served as Senior Vice President, Equity Research of FMR (2006-2009) and as a portfolio manager. |
Scott C. Goebel (43) |
| Year of Election or Appointment: 2008 Secretary and Chief Legal Officer (CLO) of the Fidelity funds. Mr. Goebel also serves as Secretary of Fidelity Investments Money Management, Inc. (FIMM) (2010-present) and Fidelity Research and Analysis Company (FRAC) (2010-present); Secretary and CLO of The North Carolina Capital Management Trust: Cash and Term Portfolios (2008-present); General Counsel, Secretary, and Senior Vice President of FMR (2008-present) and FMR Co., Inc. (2008-present); employed by FMR LLC or an affiliate (2001-present); Chief Legal Officer of Fidelity Management & Research (Hong Kong) Limited (2008-present) and Assistant Secretary of Fidelity Management & Research (Japan) Inc. (2008-present), and Fidelity Management & Research (U.K.) Inc. (2008-present). Previously, Mr. Goebel served as Assistant Secretary of FIMM (2008-2010), FRAC (2008-2010), and the Funds (2007-2008) and as Vice President and Secretary of Fidelity Distributors Corporation (FDC) (2005-2007). |
William C. Coffey (42) |
| Year of Election or Appointment: 2009 Assistant Secretary of Fidelity's Equity and High Income Funds. Mr. Coffey also serves as Senior Vice President and Deputy General Counsel of FMR LLC (2010-present), and is an employee of Fidelity Investments. Previously, Mr. Coffey served as Vice President and Associate General Counsel of FMR LLC (2005-2009). |
Holly C. Laurent (57) |
| Year of Election or Appointment: 2008 Anti-Money Laundering (AML) Officer of the Fidelity funds. Ms. Laurent also serves as AML Officer of The North Carolina Capital Management Trust: Cash and Term Portfolios (2008-present) and is an employee of Fidelity Investments. Previously, Ms. Laurent was Senior Vice President and Head of Legal for Fidelity Business Services India Pvt. Ltd. (2006-2008), and Senior Vice President, Deputy General Counsel and Group Head for FMR LLC (2005-2006). |
Christine Reynolds (52) |
| Year of Election or Appointment: 2008 Chief Financial Officer of the Fidelity funds. Ms. Reynolds became President of Fidelity Pricing and Cash Management Services (FPCMS) in August 2008. Ms. Reynolds served as Chief Operating Officer of FPCMS (2007-2008). Previously, Ms. Reynolds served as President, Treasurer, and Anti-Money Laundering officer of the Fidelity funds (2004-2007). |
Kenneth A. Rathgeber (64) |
| Year of Election or Appointment: 2004 Chief Compliance Officer of Fidelity's Equity and High Income Funds. Mr. Rathgeber is Chief Compliance Officer of Fidelity Management & Research (Hong Kong) Limited (2008-present), Fidelity Management & Research (Japan) Inc. (2008-present), FMR (2005-present), FMR Co., Inc. (2005-present), Fidelity Management & Research (U.K.) Inc. (2005-present), Fidelity Research & Analysis Company (2005-present), Fidelity Investments Money Management, Inc. (2005-present), Pyramis Global Advisors, LLC (2005-present), and Strategic Advisers, Inc. (2005-present). |
Jeffrey S. Christian (49) |
| Year of Election or Appointment: 2009 Deputy Treasurer of the Fidelity funds. Mr. Christian is an employee of Fidelity Investments. Previously, Mr. Christian served as Chief Financial Officer (2008-2009) of certain Fidelity funds and Senior Vice President of Fidelity Pricing and Cash Management Services (FPCMS) (2004-2009). |
Bryan A. Mehrmann (50) |
| Year of Election or Appointment: 2005 Deputy Treasurer of the Fidelity funds. Mr. Mehrmann is an employee of Fidelity Investments. |
Adrien E. Deberghes (43) |
| Year of Election or Appointment: 2008 Deputy Treasurer of Fidelity's Equity and High Income Funds. Mr. Deberghes also serves as Assistant Treasurer of other Fidelity funds (2010-present) and is an employee of Fidelity Investments (2008-present). Previously, Mr. Deberghes served as Senior Vice President of Mutual Fund Administration at State Street Corporation (2007-2008), Senior Director of Mutual Fund Administration at Investors Bank & Trust (2005-2007), and Director of Finance for Dunkin' Brands (2000-2005). |
Stephanie J. Dorsey (42) |
| Year of Election or Appointment: 2010 Assistant Treasurer of Fidelity's Equity and High Income Funds. Ms. Dorsey also serves as Deputy Treasurer of other Fidelity funds (2008-present) and is an employee of Fidelity Investments (2008-present). Previously, Ms. Dorsey served as Treasurer (2004-2008) of the JPMorgan Mutual Funds and Vice President (2004-2008) of JPMorgan Chase Bank. |
John R. Hebble (53) |
| Year of Election or Appointment: 2009 Assistant Treasurer of Fidelity's Equity and High Income Funds. Mr. Hebble also serves as President (2011-present), Treasurer, and Chief Financial Officer of The North Carolina Capital Management Trust: Cash and Term Portfolios (2008-present), President and Treasurer of other Fidelity funds (2008-present) and is an employee of Fidelity Investments. |
Gary W. Ryan (52) |
| Year of Election or Appointment: 2005 Assistant Treasurer of the Fidelity funds. Mr. Ryan is an employee of Fidelity Investments. Previously, Mr. Ryan served as Vice President of Fund Reporting in Fidelity Pricing and Cash Management Services (FPCMS) (1999-2005). |
Jonathan Davis (43) |
| Year of Election or Appointment: 2010 Assistant Treasurer of the Fidelity funds. Mr. Davis is an employee of Fidelity Investments. Previously, Mr. Davis served as Vice President and Associate General Counsel of FMR LLC (2003-2010). |
Annual Report
The Board of Trustees of Fidelity Dividend Growth Fund voted to pay on record date, the following distributions per share derived from capital gains realized from sales of portfolio securities, and dividends derived from net investment income:
| Pay Date | Record Date | Dividends | Capital Gains |
Class K | 9/12/11 | 9/09/11 | $0.091 | $0.015 |
Class K designates 100% of the dividends distributed in September and December, respectively during the fiscal year as qualifying for the dividends-received deduction for corporate shareholders.
Class K designates 100% of the dividends distributed in September and December, respectively during the fiscal year as amounts which may be taken into account as a dividend for the purposes of the maximum rate under section 1(h)(11) of the Internal Revenue Code.
The fund will notify shareholders in January 2012 of amounts for use in preparing 2011 income tax returns.
Annual Report
Board Approval of Investment Advisory Contracts and Management Fees
Fidelity Dividend Growth Fund
Each year, the Board of Trustees, including the Independent Trustees (together, the Board), votes on the renewal of the management contract and sub-advisory agreements (together, the Advisory Contracts) for the fund. The Board, assisted by the advice of fund counsel and Independent Trustees' counsel, requests and considers a broad range of information relevant to the renewal of the Advisory Contracts throughout the year.
The Board meets regularly and considers at each of its meetings factors that are relevant to its annual consideration of the renewal of the fund's Advisory Contracts, including the services and support provided to the fund and its shareholders. The Board has established various standing committees, each composed of Independent Trustees with varying backgrounds, to which the Board has assigned specific subject matter responsibilities in order to enhance effective decision-making by the Board. The Board, acting directly and through its Committees, requests and receives information concerning the annual consideration of the renewal of the fund's Advisory Contracts. The Board also meets as needed to consider matters specifically related to the Board's annual consideration of the renewal of Advisory Contracts. Members of the Board may also meet with trustees of other Fidelity funds through ad hoc joint committees to discuss certain matters relevant to the Fidelity funds.
At its July 2011 meeting, the Board of Trustees, including the Independent Trustees, unanimously determined to renew the fund's Advisory Contracts. In reaching its determination, the Board considered all factors it believed relevant, including (i) the nature, extent, and quality of the services to be provided to the fund and its shareholders (including the investment performance of the fund); (ii) the competitiveness of the fund's management fee and total expense ratio; (iii) the total costs of the services to be provided by and the profits to be realized by Fidelity from its relationship with the fund; (iv) the extent to which economies of scale would be realized as the fund grows; and (v) whether fee levels reflect these economies of scale, if any, for the benefit of fund shareholders.
In considering whether to renew the Advisory Contracts for the fund, the Board reached a determination, with the assistance of fund counsel and Independent Trustees' counsel and through the exercise of its business judgment, that the renewal of the Advisory Contracts is in the best interests of the fund and its shareholders and that the compensation payable under the Advisory Contracts is fair and reasonable. The Board's decision to renew the Advisory Contracts was not based on any single factor, but rather was based on a comprehensive consideration of all the information provided to the Board at its meetings throughout the year. The Board, in reaching its determination to renew the Advisory Contracts, is aware that shareholders in the fund have a broad range of investment choices available to them, including a wide choice among mutual funds offered by Fidelity's competitors, and that the fund's shareholders, who have the opportunity to review and weigh the disclosure provided by the fund in its prospectus and other public disclosures, have chosen to invest in this fund, managed by Fidelity.
Annual Report
Nature, Extent, and Quality of Services Provided. The Board considered the staffing within the investment adviser, FMR, and the sub-advisers (together, the Investment Advisers), including the backgrounds of the fund's investment personnel and the fund's investment objective and discipline. The Independent Trustees also had discussions with senior management of Fidelity's investment operations and investment groups. The Board considered the structure of the portfolio manager compensation program and whether this structure provides appropriate incentives to act in the best interests of the fund.
Resources Dedicated to Investment Management and Support Services. The Board and the Fund Oversight and Research Committees reviewed the general qualifications and capabilities of the Investment Advisers' investment staff, including its size, education, experience, and resources, as well as the Investment Advisers' approach to recruiting, training, managing, and compensating investment personnel. The Board also noted that FMR has devoted increased resources to non-U.S. offices. The Board noted that Fidelity's analysts have extensive resources, tools and capabilities which allow them to conduct sophisticated quantitative and fundamental analysis, as well as credit analysis of issuers, counterparties and enhancers. The Board also believes that Fidelity's investment professionals have sufficient access to global information and data so as to provide competitive investment results over time, and that those professionals also have access to sophisticated tools which permit them to assess portfolio construction and risk and performance attribution characteristics continuously, as well as to transmit new information and research conclusions rapidly around the world. Additionally, in their deliberations, the Board considered the Investment Advisers' trading capabilities and resources which are an integral part of the investment management process.
Shareholder and Administrative Services. The Board considered (i) the nature, extent, quality, and cost of advisory, administrative, and shareholder services performed by the Investment Advisers and their affiliates under the Advisory Contracts and under separate agreements covering transfer agency, pricing and bookkeeping, and securities lending services for the fund; (ii) the nature and extent of the investment adviser's supervision of third party service providers, principally custodians and subcustodians; and (iii) the resources devoted to, and the record of compliance with, the fund's compliance policies and procedures. The Board also reviewed the allocation of fund brokerage, including allocations to brokers affiliated with the Investment Advisers, the use of brokerage commissions to pay fund expenses, and the use of "soft" commission dollars to pay for research services.
The Board noted that the growth of fund assets over time across the complex allows Fidelity to reinvest in the development of services designed to enhance the value or convenience of the Fidelity funds as investment vehicles. These services include 24-hour access to account information and market information through telephone representatives and over the Internet, investor education materials and asset allocation tools, and the expanded availability of Fidelity Investor Centers, with 35 new branches opening since 2010.
Annual Report
Board Approval of Investment Advisory Contracts and
Management Fees - continued
Investment in a Large Fund Family. The Board considered the benefits to shareholders of investing in a Fidelity fund, including the benefits of investing in a fund that is part of a large family of funds offering a variety of investment disciplines and providing a large variety of mutual fund investor services. The Board noted that Fidelity had taken, or had made recommendations that resulted in the Fidelity funds taking, a number of actions over the previous year that benefited particular funds, including (i) continuing to dedicate additional resources to investment research and support of the senior management team that oversees asset management; (ii) rationalizing product lines through the mergers of six funds into other funds; (iii) continuing to migrate the Freedom Funds to dedicated lower cost underlying funds; (iv) obtaining shareholder approval to broaden the investment strategies for Fidelity Consumer Finance Portfolio, Fidelity Emerging Asia Fund, and Fidelity Environment and Alternative Energy Portfolio; (v) contractually agreeing to reduce the management fees and impose other expense limitations on Spartan® 500 Index Fund and U.S. Bond Index Fund in connection with launching new institutional classes of these funds; (vi) changing the name, primary and supplemental benchmarks, and investment policies of Fidelity Global Strategies Fund to support the fund's flexible investment mandate and global orientation; and (vii) reducing the transfer agency account fee rates on certain accounts.
Investment Performance. The Board considered whether the fund has operated in accordance with its investment objective, as well as its record of compliance with its investment restrictions. It also reviewed the fund's absolute investment performance for each class, as well as the fund's relative investment performance for each class measured over multiple periods against (i) a broad-based securities market index, and (ii) a peer group of mutual funds deemed appropriate by Fidelity and reviewed by the Board. The following charts considered by the Board show, over the one-, three-, and five-year periods ended December 31, 2010, as available, the cumulative total returns of Class K and the retail class of the fund, the cumulative total returns of a broad-based securities market index ("benchmark"), and a range of cumulative total returns of a peer group of mutual funds identified by Morningstar, Inc. as having an investment style similar to that of the fund based on underlying portfolio holdings. The box within each chart shows the 25th percentile return (bottom of box) and the 75th percentile return (top of box) of the peer group. Returns shown above the box are in the first quartile and returns shown below the box are in the fourth quartile. The percentage beaten numbers noted below each chart correspond to the percentile box and represent the percentage of funds in the peer group whose performance was equal to or lower than that of the class indicated.
Annual Report
Fidelity Dividend Growth Fund

The Board reviewed the fund's relative investment performance against its peer group and noted that the performance of the retail class of the fund (the class with the longer performance record) was in the first quartile for all the periods shown. The Board also noted that the investment performance of the retail class of the fund compared favorably to its benchmark for all the periods shown. The Board considered that the variations in performance between the fund's classes reflect the variations in class expenses, which result in lower performance for the higher expense class. The Board also reviewed the fund's performance since inception as well as performance in the current year.
The Board also considered that the fund's management fee is subject to upward or downward adjustment depending upon whether, and to what extent, the fund's investment performance for the performance period exceeds, or is exceeded by, the record (over the same period) of a Board-approved performance adjustment index. The Board noted that the performance adjustment provides FMR with a strong economic incentive to seek to achieve superior performance for the fund's shareholders and helps to more closely align the interests of FMR and the fund's shareholders.
Based on its review, the Board concluded that the nature, extent, and quality of services provided to the fund under the Advisory Contracts should benefit the fund's shareholders.
Competitiveness of Management Fee and Total Expense Ratio. The Board considered the fund's management fee and total expense ratio compared to "mapped groups" of competitive funds and classes. Fidelity creates "mapped groups" by combining similar Lipper investment objective categories that have comparable management fee characteristics. Combining Lipper investment objective categories aids the Board's management fee and total expense ratio comparisons by broadening the competitive group used for comparison and by reducing the number of universes to which various Fidelity funds are compared.
Annual Report
Board Approval of Investment Advisory Contracts and
Management Fees - continued
Management Fee. The Board considered two proprietary management fee comparisons for the 12-month periods shown in the chart below. The group of Lipper funds used by the Board for management fee comparisons is referred to below as the "Total Mapped Group." The Total Mapped Group comparison focuses on a fund's standing relative to the total universe of comparable funds available to investors in terms of gross management fees before expense reimbursements or caps, and without giving effect to the fund's performance adjustment. "TMG %" represents the percentage of funds in the Total Mapped Group that had management fees that were lower than the fund's. For example, a TMG % of 10% means that 90% of the funds in the Total Mapped Group had higher management fees than the fund. The "Asset-Size Peer Group" (ASPG) comparison focuses on a fund's standing relative to non-Fidelity funds similar in size to the fund within the Total Mapped Group. The ASPG represents at least 15% of the funds in the Total Mapped Group with comparable asset size and management fee characteristics, subject to a minimum of 50 funds (or all funds in the Total Mapped Group if fewer than 50). Additional information, such as the ASPG quartile in which the fund's management fee ranked and the impact of the fund's performance adjustment, is also included in the chart and considered by the Board.
Fidelity Dividend Growth Fund

Annual Report
The Board noted that the fund's management fee ranked below the median of its Total Mapped Group and below the median of its ASPG for 2010. The Board also noted the effect of the fund's positive performance adjustment on the fund's management fee ranking. The Board noted that the performance adjustment for each year represents calculations for performance periods that differ from the periods shown in the performance charts above.
Based on its review, the Board concluded that the fund's management fee is fair and reasonable in light of the services that the fund receives and the other factors considered.
Total Expense Ratio. In its review of each class's total expense ratio, the Board considered the fund's management fee as well as other fund or class expenses, as applicable, such as transfer agent fees, pricing and bookkeeping fees, and custodial, legal, and audit fees. The Board also noted the effects of any waivers and reimbursements on fees and expenses, as well as the impact of the fund's performance adjustment. As part of its review, the Board also considered the current and historical total expense ratios of each class of the fund compared to competitive fund median expenses. Each class of the fund is compared to those funds and classes in the Total Mapped Group (used by the Board for management fee comparisons) that have a similar sales load structure.
The Board noted that the total expense ratio of each class ranked below its competitive median for 2010. The Board considered that various factors, including 12b-1 fees, positive or negative performance adjustments, and relatively higher other expenses in the case of small fund size, can affect total expense ratios.
Fees Charged to Other Fidelity Clients. The Board also considered Fidelity fee structures and other information with respect to clients of FMR and its affiliates, such as other mutual funds advised or subadvised by FMR or its affiliates, pension plan clients, and other institutional clients. In March 2010, the Board created an ad hoc joint committee with the board of other Fidelity funds (the Committee) to review and compare Fidelity's institutional investment advisory business with its business of providing services to the Fidelity funds, including the differences in services provided, fees charged, and costs incurred, as well as competition in their respective marketplaces.
Based on its review of total expense ratios and fees charged to other Fidelity clients, the Board concluded that the total expense ratio of each class of the fund was reasonable in light of the services that the fund and its shareholders receive and the other factors considered, including the findings of the Committee.
Costs of the Services and Profitability. The Board considered the revenues earned and the expenses incurred by Fidelity in conducting the business of developing, marketing, distributing, managing, administering and servicing the fund and its shareholders. The Board also considered the level of Fidelity's profits in respect of all the Fidelity funds.
Annual Report
Board Approval of Investment Advisory Contracts and
Management Fees - continued
On an annual basis, FMR presents to the Board Fidelity's profitability for the fund. Fidelity calculates the profitability for each fund, as well as aggregate profitability for groups of Fidelity funds and all Fidelity funds, using a series of detailed revenue and cost allocation methodologies which originate with the books and records of Fidelity on which Fidelity's audited financial statements are based. The Audit Committee of the Board reviews any significant changes from the prior year's methodologies.
PricewaterhouseCoopers LLP (PwC), independent registered public accounting firm and auditor to Fidelity and certain Fidelity funds, has been engaged annually by the Board as part of the Board's assessment of Fidelity's profitability analysis. PwC's engagement includes the review and assessment of Fidelity's methodologies used in determining the revenues and expenses attributable to Fidelity's mutual fund business, and completion of agreed-upon procedures surrounding the mathematical accuracy of fund profitability and its conformity to allocation methodologies. After considering PwC's reports issued under the engagement and information provided by Fidelity, the Board concluded that while other allocation methods may also be reasonable, Fidelity's profitability methodologies are reasonable in all material respects.
The Board also reviewed Fidelity's non-fund businesses and fall-out benefits related to the mutual fund business as well as cases where Fidelity's affiliates may benefit from or be related to the fund's business.
The Board considered the costs of the services provided by and the profits realized by Fidelity in connection with the operation of the fund and was satisfied that the profitability was not excessive in the circumstances.
Economies of Scale. The Board considered whether there have been economies of scale in respect of the management of the Fidelity funds, whether the Fidelity funds (including the fund) have appropriately benefited from any such economies of scale, and whether there is potential for realization of any further economies of scale. The Board considered the extent to which the fund will benefit from economies of scale through increased services to the fund, through waivers or reimbursements, or through fee or expense reductions. The Board also noted that in 2009, it and the board of other Fidelity funds created an ad hoc committee (the Economies of Scale Committee) to analyze whether FMR attains economies of scale in respect of the management and servicing of the Fidelity funds, whether the Fidelity funds have appropriately benefited from such economies of scale, and whether there is potential for realization of any further economies of scale.
The Board recognized that the fund's management contract incorporates a "group fee" structure, which provides for lower group fee rates as total fund assets under FMR's management increase, and for higher group fee rates as total fund assets under FMR's management decrease. FMR calculates the group fee rates based on a tiered asset "breakpoint" schedule that varies based on asset class. The Board considered that the group fee is designed to deliver the benefits of economies of scale to fund shareholders when total Fidelity fund assets increase, even if assets of any particular fund are unchanged or have declined, because some portion of Fidelity's costs are attributable to services provided to all Fidelity funds, and all funds benefit if those costs can be allocated among more assets. The Board concluded that, given the group fee structure, fund shareholders will benefit from lower management fees as assets under FMR's management increase at the fund complex level, regardless of whether Fidelity achieves any such economies of scale.
Annual Report
The Board concluded, taking into account the analysis of the Economies of Scale Committee, that any potential economies of scale are being appropriately shared between fund shareholders and Fidelity.
Additional Information Requested by the Board. In order to develop fully the factual basis for consideration of the Fidelity funds' Advisory Contracts, the Board requested and received additional information on certain topics, including (i) fund performance trends, actions to be taken by FMR to improve certain funds' overall performance, and Fidelity's long-term strategies for certain funds; (ii) portfolio manager changes that have occurred during the past year and length of portfolio manager tenure for different categories of funds over time; (iii) Fidelity's compensation structure for portfolio managers and other key personnel and strategies for attracting and retaining non-investment personnel; (iv) the amount of the investment that each portfolio manager has made in the Fidelity fund(s) that he or she manages; (v) historical trends in Fidelity's realization of fall-out benefits; (vi) Fidelity's group fee structures and the rationale for the individual fee rates of certain funds; (vii) fund profitability methodology and the impact of certain factors on fund profitability results; (viii) trends regarding industry use of performance fee structures and Fidelity's compliance practices with respect to performance adjustment calculations; (ix) the fee structures in place for certain other Fidelity clients; and (x) explanations regarding the relative total expense ratios of certain funds and classes, total expense competitive trends, and actions that might be taken by FMR to reduce total expense ratios for certain funds and classes.
Based on its evaluation of all of the conclusions noted above, and after considering all factors it believed relevant, the Board ultimately concluded that the advisory fee structures are fair and reasonable, and that the fund's Advisory Contracts should be renewed.
Annual Report
Managing Your Investments
Fidelity offers several ways to conveniently manage your workplace benefits (including your workplace savings plan, investments, and additional services) via your telephone or PC. You can access your plan and account information and research your investments 24 hours a day.
By Phone
Fidelity provides a single toll-free number to access plan information, account balances, positions, and quotes*. It's easy to navigate the service, and on your first call, the system will help you create a personal identification number (PIN) for security.
(phone_graphic)
Fidelity Workplace
Investing
1-800-835-5092
By PC
Fidelity's web site on the Internet provides a wide range of information, including plan information, daily financial news, fund performance, interactive planning tools, and news about Fidelity products and services.
(computer_graphic)
Fidelity's Web Site
www.401k.com
* When you call the quotes line, please remember that a fund's yield and return will vary and, except for money market funds, share price will also vary. This means that you may have a gain or loss when you sell your shares. There is no assurance that money market funds will be able to maintain a stable $1 share price; an investment in a money market fund is not insured or guaranteed by the U.S. government. Total returns are historical and include changes in share price, reinvestment of dividends and capital gains distributions, and the effects of any sales charges.
Annual Report
To Write Fidelity
We'll give your correspondence immediate attention and send you written confirmation upon completion of your request.
(letter_graphic)
For Non-Retirement
Accounts
Buying shares
Fidelity Investments
P.O. Box 770001
Cincinnati, OH 45277-0003
Overnight Express
Fidelity Investments
Attn: Distribution Services
100 Crosby Parkway - KC1H
Covington, KY 41015
Selling shares
Fidelity Investments
P.O. Box 770001
Cincinnati, OH 45277-0035
Overnight Express
Fidelity Investments
Attn: Distribution Services
100 Crosby Parkway - KC1H
Covington, KY 41015
General Correspondence
Fidelity Investments
P.O. Box 500
Merrimack, NH 03054-0500
(letter_graphic)
For Retirement
Accounts
Buying shares
Fidelity Investments
P.O. Box 770001
Cincinnati, OH 45277-0003
Selling shares
Fidelity Investments
P.O. Box 770001
Cincinnati, OH 45277-0035
Overnight Express
Fidelity Investments
Attn: Distribution Services
100 Crosby Parkway - KC1H
Covington, KY 41015
General Correspondence
Fidelity Investments
P.O. Box 500
Merrimack, NH 03054-0500
Annual Report
Investment Adviser
Fidelity Management & Research Company
Boston, MA
Investment Sub-Advisers
FMR Co., Inc.
Fidelity Management & Research
(U.K.) Inc.
Fidelity Management & Research
(Hong Kong) Limited
Fidelity Management & Research
(Japan) Inc.
General Distributor
Fidelity Distributors Corporation
Boston, MA
Transfer and Service Agents
Fidelity Investments Institutional
Operations Company, Inc.
Boston, MA
Fidelity Service Company, Inc.
Boston, MA
Custodian
Citibank, N.A.,
New York, NY
DGF-K-UANN-0911
1.863064.102
Fidelity®
Growth & Income
Portfolio
Annual Report
July 31, 2011
(2_fidelity_logos) (Registered_Trademark)
Contents
Chairman's Message | <Click Here> | The Chairman's message to shareholders. |
Performance | <Click Here> | How the fund has done over time. |
Management's Discussion of Fund Performance | <Click Here> | The Portfolio Manager's review of fund performance and strategy. |
Shareholder Expense Example | <Click Here> | An example of shareholder expenses. |
Investment Changes | <Click Here> | A summary of major shifts in the fund's investments over the past six months. |
Investments | <Click Here> | A complete list of the fund's investments with their market values. |
Financial Statements | <Click Here> | Statements of assets and liabilities, operations, and changes in net assets, as well as financial highlights. |
Notes | <Click Here> | Notes to the financial statements. |
Report of Independent Registered Public Accounting Firm | <Click Here> | |
Trustees and Officers | <Click Here> | |
Distributions | <Click Here> | |
Board Approval of Investment Advisory Contracts and Management Fees | <Click Here> | |
To view a fund's proxy voting guidelines and proxy voting record for the 12-month period ended June 30, visit http://www.fidelity.com/proxyvotingresults or visit the Securities and Exchange Commission's (SEC) web site at http://www.sec.gov. You may also call 1-800-544-8544 to request a free copy of the proxy voting guidelines.
Standard & Poor's, S&P and S&P 500 are registered service marks of The McGraw-Hill Companies, Inc. and have been licensed for use by Fidelity Distributors Corporation.
Other third party marks appearing herein are the property of their respective owners.
All other marks appearing herein are registered or unregistered trademarks or service marks of FMR LLC or an affiliated company.
Annual Report
This report and the financial statements contained herein are submitted for the general information of the shareholders of the fund. This report is not authorized for distribution to prospective investors in the fund unless preceded or accompanied by an effective prospectus.
A fund files its complete schedule of portfolio holdings with the SEC for the first and third quarters of each fiscal year on Form N-Q. Forms N-Q are available on the SEC's web site at http://www.sec.gov. A fund's Forms N-Q may be reviewed and copied at the SEC's Public Reference Room in Washington, DC. Information regarding the operation of the SEC's Public Reference Room may be obtained by calling 1-800-SEC-0330. For a complete list of a fund's portfolio holdings, view the most recent holdings listing, semiannual report, or annual report on Fidelity's web site at http://www.fidelity.com, http://www.fidelity.advisor.com, or http://www.401k.com, as applicable.
NOT FDIC INSURED • MAY LOSE VALUE • NO BANK GUARANTEE
Neither the fund nor Fidelity Distributors Corporation is a bank.
Annual Report
(photo_of_James_C_Curvey)
Dear Shareholder:
The second half of 2011 began with U.S. equities continuing to give back some of the gains achieved earlier in the year. In the days leading up to July 31, markets were shaken by a political stalemate in which Congress struggled to address the debt ceiling issue before an early-August deadline. The resulting uncertainty held back markets in July, the third consecutive monthly decline for equities, effectively reversing the positive momentum seen through the end of April. Financial markets are always unpredictable, of course, but there are several time-tested investment principles that can help put the odds in your favor.
One of the basic tenets is to invest for the long term. Over time, riding out the markets' inevitable ups and downs has proven much more effective than selling into panic or chasing the hottest trend. Even missing only a few of the markets' best days can significantly diminish investor returns. Patience also affords the benefits of compounding - of earning interest on additional income or reinvested dividends and capital gains. There can be tax advantages and cost benefits to consider as well. While staying the course doesn't eliminate risk, it can considerably lessen the effect of short-term declines.
You can further manage your investing risk through diversification. And today, more than ever, geographic diversification should be taken into account. Studies indicate that asset allocation is the single most important determinant of a portfolio's long-term success. The right mix of stocks, bonds and cash - aligned to your particular risk tolerance and investment objective - is very important. Age-appropriate rebalancing is also an essential aspect of asset allocation. For younger investors, an emphasis on equities - which historically have been the best-performing asset class over time - is encouraged. As investors near their specific goal, such as retirement or sending a child to college, consideration may be given to replacing volatile assets (e.g. common stocks) with more-stable fixed investments (bonds or savings plans).
A third principle - investing regularly - can help lower the average cost of your purchases. Investing a certain amount of money each month or quarter helps ensure you won't pay for all your shares at market highs. This strategy - known as dollar cost averaging - also reduces "emotion" from investing, helping shareholders avoid selling weak performers just prior to an upswing, or chasing a hot performer just before a correction.
We invite you to contact us via the Internet, through our Investor Centers or by phone. It is our privilege to provide you the information you need to make the investments that are right for you.
Sincerely,
(The acting chairman's signature appears here.)
James C. Curvey
Acting Chairman
Annual Report
Average annual total return reflects the change in the value of an investment, assuming reinvestment of the class' distributions from dividend income and capital gains (the profits earned upon the sale of securities that have grown in value, if any) and assuming a constant rate of performance each year. The $10,000 table and the fund's returns do not reflect the deduction of taxes that a shareholder would pay on fund distributions or the redemption of fund shares. During periods of reimbursement by Fidelity, a fund's total return will be greater than it would be had the reimbursement not occurred. How a fund did yesterday is no guarantee of how it will do tomorrow.
Average Annual Total Returns
Periods ended July 31, 2011 | Past 1
year | Past 5
years | Past 10
years |
Fidelity® Growth & Income Portfolio | 19.16% | -4.56% | -1.69% |
$10,000 Over 10 Years
Let's say hypothetically that $10,000 was invested in Fidelity® Growth & Income Portfolio, a class of the fund, on July 31, 2001. The chart shows how the value of your investment would have changed, and also shows how the S&P 500® Index performed over the same period.
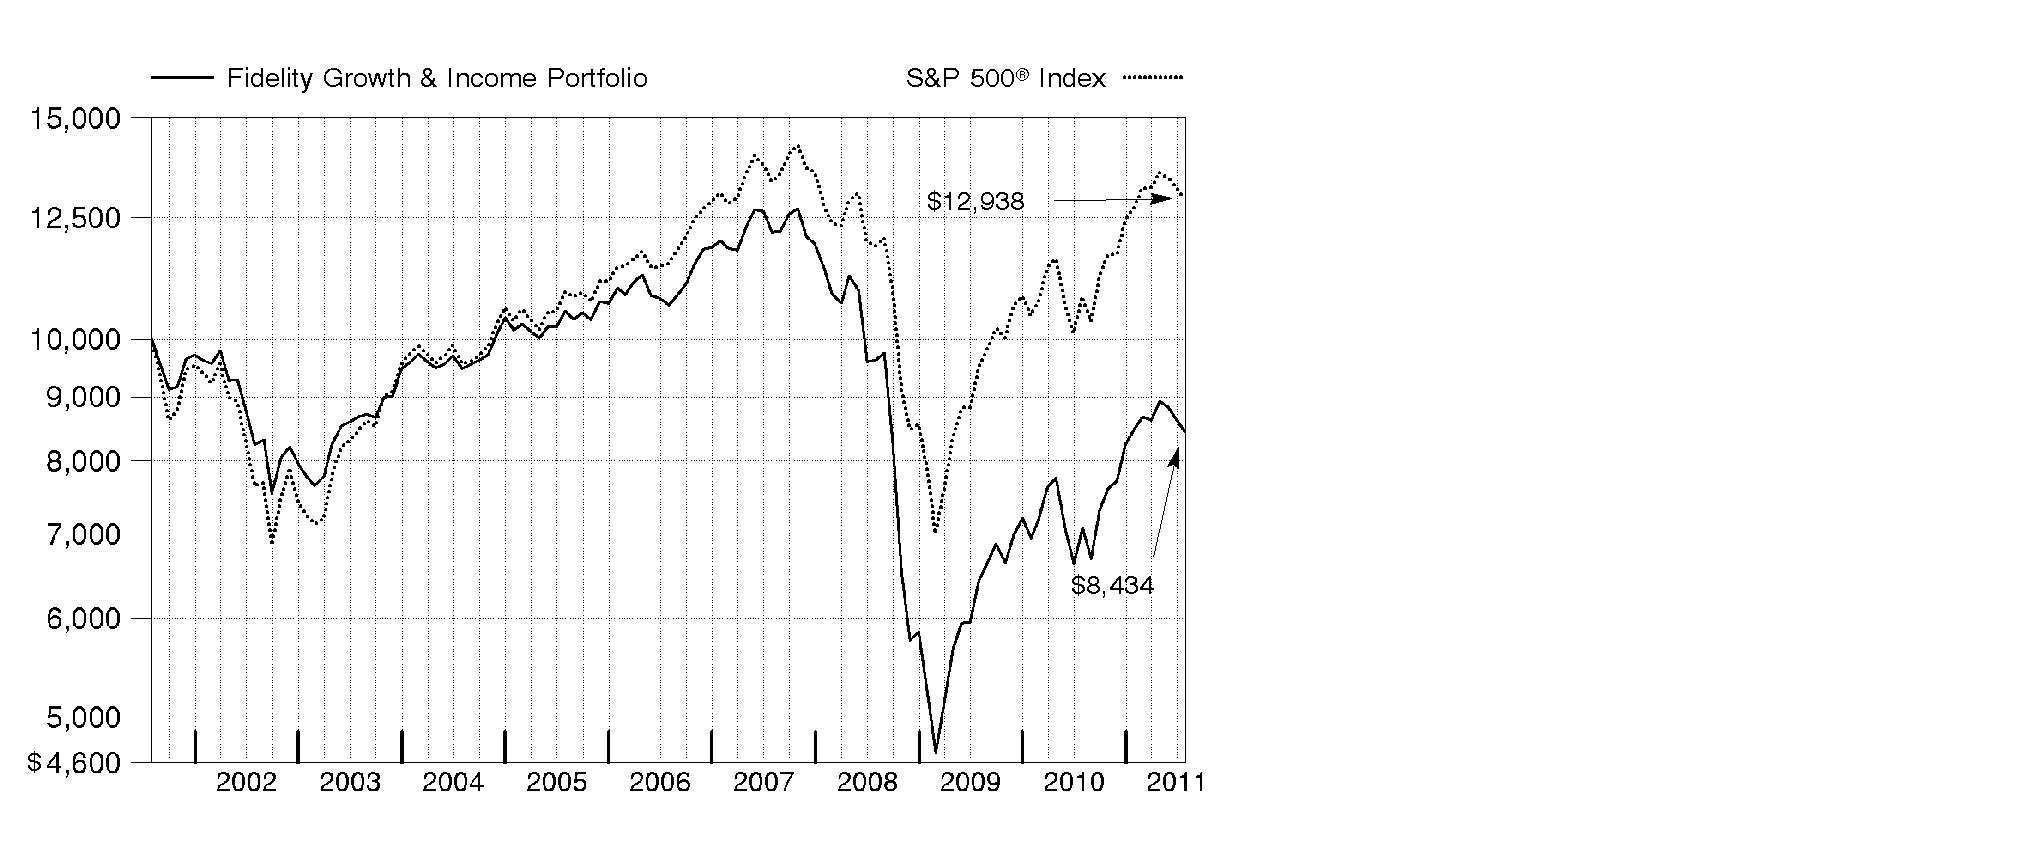
Annual Report
Market Recap: U.S. stocks registered solid double-digit gains for the 12 months ending July 31, 2011, extending a rally that began more than two years earlier. Despite a rough start in August 2010, markets turned positive in September, as increased demand for capital goods and other upbeat indicators trumped investor worry about a U.S. recessionary relapse. The broad market, as measured by the S&P 500® Index, rose 9% that month, its biggest September gain in 71 years. Seven more monthly advances followed, fueled by encouraging corporate earnings and economic activity. However, volatility picked up in the period's latter months, as markets reacted to continued high U.S. unemployment, nagging debt troubles in Europe and looming legislative battles over the federal debt ceiling. May unemployment rose above 9% for the first time in 2011, contributing to a traditional "June swoon" for stocks. Market uncertainty lingered in July, when the S&P 500® posted its second-biggest monthly loss of the period. For the full year, the S&P 500® climbed 19.65%, while the blue-chip-laden Dow Jones Industrial AverageSM rose a comparable 19.09% and the technology-heavy Nasdaq Composite® Index gained 23.40%. On the capitalization spectrum, stocks of mid-cap companies fared best, with the Russell Midcap® Index rising 24.51% and the small-cap Russell 2000® Index adding 23.92%.
Comments from Matthew Fruhan, who became Portfolio Manager of Fidelity® Growth & Income Portfolio on February 1, 2011: For the year, the fund's Retail Class shares gained 19.16%, modestly trailing the S&P 500. Security selection in retailing, energy and capital goods hurt, as did a modest cash position. Despite good stock picking overall in technology, overweight stakes in networking gear maker Cisco Systems and computer and peripherals maker Hewlett-Packard were the largest individual detractors. Cisco cut its earnings estimates during the second half of the period, and the stock suffered. HP's shares struggled due in part to the August 2010 resignation of its CEO. An average underweighting in tobacco firm Philip Morris International also detracted. I sold the stock before period end because I favored British American Tobacco, an out-of-index holding and the top relative contributor. Stock picking in consumer staples - where I increased exposure - financials and tech added value overall. In financials, the fund got a boost from a sizable stake in Citigroup early in the period, while an overweight in tech giant Apple also helped. In terms of market selection, overweighting banks and industrials was a drag on performance, while industry positioning in consumer staples was beneficial. The fund's foreign holdings also provided a boost, aided by a weaker U.S. dollar.
The views expressed above reflect those of the portfolio manager(s) only through the end of the period as stated on the cover of this report and do not necessarily represent the views of Fidelity or any other person in the Fidelity organization. Any such views are subject to change at any time based upon market or other conditions and Fidelity disclaims any responsibility to update such views. These views may not be relied on as investment advice and, because investment decisions for a Fidelity fund are based on numerous factors, may not be relied on as an indication of trading intent on behalf of any Fidelity fund.
Annual Report
Shareholder Expense Example
As a shareholder of the Fund, you incur two types of costs: (1) transaction costs, and (2) ongoing costs, including management fees and other Fund expenses. This Example is intended to help you understand your ongoing costs (in dollars) of investing in the Fund and to compare these costs with the ongoing costs of investing in other mutual funds.
The Example is based on an investment of $1,000 invested at the beginning of the period and held for the entire period (February 1, 2011 to July 31, 2011).
Actual Expenses
The first line of the accompanying table for each class of the Fund provides information about actual account values and actual expenses. You may use the information in this line, together with the amount you invested, to estimate the expenses that you paid over the period. Simply divide your account value by $1,000.00 (for example, an $8,600 account value divided by $1,000.00 = 8.6), then multiply the result by the number in the first line for a class of the Fund under the heading entitled "Expenses Paid During Period" to estimate the expenses you paid on your account during this period. A small balance maintenance fee of $12.00 that is charged once a year may apply for certain accounts with a value of less than $2,000. This fee is not included in the table below. If it was, the estimate of expenses you paid during the period would be higher, and your ending account value lower, by this amount. In addition, the Fund, as a shareholder in the underlying Fidelity Central Funds, will indirectly bear its pro-rata share of the fees and expenses incurred by the underlying Fidelity Central Funds. These fees and expenses are not included in the Fund's annualized expense ratio used to calculate the expense estimate in the table below.
Hypothetical Example for Comparison Purposes
The second line of the accompanying table for each class of the Fund provides information about hypothetical account values and hypothetical expenses based on a Class' actual expense ratio and an assumed rate of return of 5% per year before expenses, which is not the Class' actual return. The hypothetical account values and expenses may not be used to estimate the actual ending account balance or expenses you paid for the period. You may use this information to compare the ongoing costs of investing in the Fund and other funds. To do so, compare this 5% hypothetical example with the 5% hypothetical examples that appear in the shareholder reports of the other funds. A small balance maintenance fee of $12.00 that is charged once a year may apply for certain accounts with a value of less than $2,000. This fee is not included in the table below. If it was, the estimate of expenses you paid during the period would be higher, and your ending account value lower, by this amount. In addition, the Fund, as a shareholder in the underlying Fidelity Central Funds, will indirectly bear its pro-rata share of the fees and expenses incurred by the underlying Fidelity Central Funds. These fees and expenses are not included in the Fund's annualized expense ratio used to calculate the expense estimate in the table below.
Please note that the expenses shown in the table are meant to highlight your ongoing costs only and do not reflect any transaction costs. Therefore, the second line of the table is useful in comparing ongoing costs only, and will not help you determine the relative total costs of owning different funds.
Annual Report
Shareholder Expense Example - continued
| Annualized
Expense Ratio | Beginning
Account Value
February 1, 2011 | Ending
Account Value
July 31, 2011 | Expenses Paid
During Period*
February 1, 2011 to
July 31, 2011 |
Growth & Income | .71% | | | |
Actual | | $ 1,000.00 | $ 996.30 | $ 3.51 |
HypotheticalA | | $ 1,000.00 | $ 1,021.27 | $ 3.56 |
Class K | .54% | | | |
Actual | | $ 1,000.00 | $ 997.20 | $ 2.67 |
HypotheticalA | | $ 1,000.00 | $ 1,022.12 | $ 2.71 |
A 5% return per year before expenses
* Expenses are equal to each Class' annualized expense ratio, multiplied by the average account value over the period, multiplied by 181/365 (to reflect the one-half year period).
Annual Report
Investment Changes (Unaudited)
Top Ten Stocks as of July 31, 2011 |
| % of fund's
net assets | % of fund's net assets
6 months ago |
Wells Fargo & Co. | 3.9 | 2.5 |
Chevron Corp. | 3.8 | 0.0 |
Exxon Mobil Corp. | 3.6 | 5.0 |
Apple, Inc. | 3.6 | 3.9 |
JPMorgan Chase & Co. | 3.3 | 2.8 |
PepsiCo, Inc. | 2.1 | 0.3 |
Target Corp. | 1.9 | 1.2 |
Merck & Co., Inc. | 1.8 | 1.1 |
Google, Inc. Class A | 1.7 | 1.8 |
The Coca-Cola Co. | 1.6 | 2.2 |
| 27.3 | |
Top Five Market Sectors as of July 31, 2011 |
| % of fund's
net assets | % of fund's net assets
6 months ago |
Information Technology | 18.1 | 19.1 |
Financials | 17.6 | 19.2 |
Consumer Discretionary | 13.2 | 9.6 |
Industrials | 12.6 | 15.5 |
Consumer Staples | 11.8 | 7.2 |
Asset Allocation (% of fund's net assets) |
As of July 31, 2011 * | As of January 31, 2011 ** |
| Stocks 98.7% | | | Stocks 98.2% | |
| Convertible
Securities 0.8% | | | Convertible
Securities 0.2% | |
| Short-Term
Investments and
Net Other Assets 0.5% | | | Short-Term
Investments and
Net Other Assets 1.6% | |
* Foreign investments | 18.7% | | ** Foreign investments | 11.6% | |

Annual Report
Investments July 31, 2011
Showing Percentage of Net Assets
Common Stocks - 97.5% |
| Shares | | Value (000s) |
CONSUMER DISCRETIONARY - 11.9% |
Automobiles - 0.2% |
Bayerische Motoren Werke AG (BMW) | 112,994 | | $ 11,336 |
Distributors - 0.5% |
Li & Fung Ltd. | 11,452,000 | | 19,043 |
Pool Corp. | 190,179 | | 5,087 |
| | 24,130 |
Diversified Consumer Services - 0.2% |
Weight Watchers International, Inc. | 118,991 | | 9,185 |
Hotels, Restaurants & Leisure - 2.3% |
Carnival Corp. unit | 158,205 | | 5,268 |
McDonald's Corp. | 966,981 | | 83,625 |
Yum! Brands, Inc. | 712,138 | | 37,615 |
| | 126,508 |
Household Durables - 1.3% |
D.R. Horton, Inc. | 1,573,071 | | 18,688 |
KB Home (d) | 682,300 | | 5,793 |
Ryland Group, Inc. | 1,480,000 | | 21,800 |
Toll Brothers, Inc. (a) | 979,552 | | 19,552 |
Tupperware Brands Corp. | 97,691 | | 6,105 |
| | 71,938 |
Leisure Equipment & Products - 0.2% |
Hasbro, Inc. | 277,379 | | 10,973 |
Media - 2.9% |
Comcast Corp. Class A | 2,365,300 | | 56,815 |
Kabel Deutschland Holding AG (a) | 158,200 | | 8,925 |
Regal Entertainment Group Class A (d) | 343,264 | | 4,390 |
Time Warner, Inc. | 1,895,017 | | 66,629 |
Viacom, Inc. Class B (non-vtg.) | 407,691 | | 19,740 |
| | 156,499 |
Multiline Retail - 2.1% |
PPR SA (d) | 60,368 | | 11,189 |
Target Corp. | 2,030,609 | | 104,556 |
| | 115,745 |
Specialty Retail - 2.1% |
Esprit Holdings Ltd. | 2,168,000 | | 6,314 |
Limited Brands, Inc. | 157,100 | | 5,948 |
Lowe's Companies, Inc. | 3,502,483 | | 75,584 |
Staples, Inc. | 1,806,528 | | 29,013 |
| | 116,859 |
Common Stocks - continued |
| Shares | | Value (000s) |
CONSUMER DISCRETIONARY - continued |
Textiles, Apparel & Luxury Goods - 0.1% |
VF Corp. | 35,100 | | $ 4,100 |
TOTAL CONSUMER DISCRETIONARY | | 647,273 |
CONSUMER STAPLES - 11.8% |
Beverages - 4.8% |
Diageo PLC | 1,661,519 | | 33,800 |
Dr Pepper Snapple Group, Inc. | 757,584 | | 28,606 |
PepsiCo, Inc. | 1,789,103 | | 114,574 |
The Coca-Cola Co. | 1,275,569 | | 86,751 |
| | 263,731 |
Food & Staples Retailing - 1.1% |
CVS Caremark Corp. | 571,204 | | 20,763 |
Sysco Corp. | 260,812 | | 7,978 |
Walgreen Co. | 808,500 | | 31,564 |
| | 60,305 |
Food Products - 0.8% |
Danone | 618,677 | | 44,270 |
Tate & Lyle PLC | 149,065 | | 1,491 |
| | 45,761 |
Household Products - 3.0% |
Colgate-Palmolive Co. | 420,356 | | 35,470 |
Energizer Holdings, Inc. (a) | 38,400 | | 3,097 |
Kimberly-Clark Corp. | 725,186 | | 47,398 |
Procter & Gamble Co. | 1,285,267 | | 79,031 |
| | 164,996 |
Tobacco - 2.1% |
British American Tobacco PLC sponsored ADR | 820,532 | | 75,013 |
Lorillard, Inc. | 341,630 | | 36,288 |
| | 111,301 |
TOTAL CONSUMER STAPLES | | 646,094 |
ENERGY - 11.5% |
Energy Equipment & Services - 1.0% |
Exterran Partners LP | 763,120 | | 18,086 |
Saipem SpA | 133,169 | | 6,961 |
Transocean Ltd. (United States) | 464,694 | | 28,607 |
| | 53,654 |
Common Stocks - continued |
| Shares | | Value (000s) |
ENERGY - continued |
Oil, Gas & Consumable Fuels - 10.5% |
ARC Resources Ltd. (d) | 300,400 | | $ 7,832 |
Atlas Pipeline Partners, LP | 128,400 | | 4,393 |
Bonavista Energy Corp. (a)(e)(f) | 220,600 | | 6,638 |
Chevron Corp. | 1,986,091 | | 206,593 |
Daylight Energy Ltd. (d) | 2,154,000 | | 20,652 |
EXCO Resources, Inc. | 253,100 | | 4,027 |
Exxon Mobil Corp. | 2,435,576 | | 194,335 |
Inergy LP | 34,600 | | 1,094 |
Legacy Reserves LP | 92,830 | | 2,581 |
Penn West Petroleum Ltd. | 266,500 | | 5,936 |
PetroBakken Energy Ltd. Class A (d) | 235,900 | | 3,472 |
QEP Resources, Inc. | 142,200 | | 6,233 |
Royal Dutch Shell PLC Class A (United Kingdom) | 1,800,836 | | 65,970 |
Suncor Energy, Inc. | 715,400 | | 27,421 |
Williams Companies, Inc. | 457,429 | | 14,500 |
| | 571,677 |
TOTAL ENERGY | | 625,331 |
FINANCIALS - 17.6% |
Capital Markets - 2.7% |
AllianceBernstein Holding LP | 143,060 | | 2,432 |
Apollo Global Management LLC Class A | 558,717 | | 9,671 |
Ashmore Group PLC | 5,150,313 | | 34,098 |
Bank of New York Mellon Corp. | 176,687 | | 4,437 |
BlackRock, Inc. Class A | 29,100 | | 5,193 |
Charles Schwab Corp. | 398,573 | | 5,951 |
Goldman Sachs Group, Inc. | 75,359 | | 10,171 |
ICAP PLC | 491,900 | | 3,616 |
KKR & Co. LP | 1,033,060 | | 15,134 |
Morgan Stanley | 567,796 | | 12,633 |
Northern Trust Corp. | 505,971 | | 22,721 |
State Street Corp. | 152,500 | | 6,324 |
The Blackstone Group LP | 921,977 | | 15,314 |
| | 147,695 |
Commercial Banks - 7.9% |
Banco Daycoval SA (PN) | 170,600 | | 1,009 |
BB&T Corp. | 2,179,355 | | 55,966 |
DBS Group Holdings Ltd. | 515,164 | | 6,644 |
FirstMerit Corp. | 107,716 | | 1,574 |
Common Stocks - continued |
| Shares | | Value (000s) |
FINANCIALS - continued |
Commercial Banks - continued |
Regions Financial Corp. | 3,719,724 | | $ 22,653 |
Standard Chartered PLC (United Kingdom) | 898,053 | | 22,969 |
SunTrust Banks, Inc. | 624,209 | | 15,287 |
U.S. Bancorp | 2,902,500 | | 75,639 |
Wells Fargo & Co. | 7,569,401 | | 211,484 |
Zions Bancorporation | 736,454 | | 16,128 |
| | 429,353 |
Diversified Financial Services - 4.8% |
Bank of America Corp. | 1,120,753 | | 10,883 |
Citigroup, Inc. | 774,850 | | 29,708 |
JPMorgan Chase & Co. | 4,487,774 | | 181,530 |
KKR Financial Holdings LLC | 4,161,687 | | 39,494 |
| | 261,615 |
Insurance - 0.7% |
Everest Re Group Ltd. | 136,311 | | 11,194 |
Fidelity National Financial, Inc. Class A | 247,700 | | 4,038 |
Genworth Financial, Inc. Class A (a) | 1,177,857 | | 9,800 |
MetLife, Inc. unit (a) | 135,300 | | 10,574 |
| | 35,606 |
Real Estate Investment Trusts - 1.4% |
American Capital Agency Corp. | 192,700 | | 5,380 |
CBL & Associates Properties, Inc. | 815,696 | | 14,487 |
Public Storage | 208,966 | | 24,999 |
Ventas, Inc. | 343,500 | | 18,594 |
Weyerhaeuser Co. | 784,900 | | 15,690 |
| | 79,150 |
Thrifts & Mortgage Finance - 0.1% |
First Niagara Financial Group, Inc. | 524,662 | | 6,427 |
MGIC Investment Corp. (a) | 16,978 | | 68 |
Radian Group, Inc. | 545,030 | | 1,728 |
| | 8,223 |
TOTAL FINANCIALS | | 961,642 |
HEALTH CARE - 11.2% |
Biotechnology - 1.4% |
Amgen, Inc. | 1,158,204 | | 63,354 |
Common Stocks - continued |
| Shares | | Value (000s) |
HEALTH CARE - continued |
Biotechnology - continued |
ARIAD Pharmaceuticals, Inc. (a) | 419,781 | | $ 4,991 |
SIGA Technologies, Inc. (a)(d) | 1,094,553 | | 8,330 |
| | 76,675 |
Health Care Equipment & Supplies - 0.3% |
Alere, Inc. (a) | 284,400 | | 8,387 |
Meridian Bioscience, Inc. | 289,522 | | 6,254 |
Steris Corp. | 15,900 | | 556 |
| | 15,197 |
Health Care Providers & Services - 1.8% |
Brookdale Senior Living, Inc. (a) | 529,300 | | 11,322 |
McKesson Corp. | 648,754 | | 52,627 |
Medco Health Solutions, Inc. (a) | 584,375 | | 36,746 |
| | 100,695 |
Life Sciences Tools & Services - 0.5% |
Lonza Group AG | 131,026 | | 11,186 |
QIAGEN NV (a) | 946,200 | | 16,029 |
| | 27,215 |
Pharmaceuticals - 7.2% |
Abbott Laboratories | 647,127 | | 33,211 |
Cardiome Pharma Corp. (a) | 593,100 | | 2,949 |
GlaxoSmithKline PLC sponsored ADR | 1,559,969 | | 69,294 |
Johnson & Johnson | 1,123,808 | | 72,812 |
Merck & Co., Inc. | 2,934,546 | | 100,156 |
Pfizer, Inc. | 3,963,400 | | 76,256 |
Roche Holding AG (participation certificate) | 138,182 | | 24,839 |
Sanofi-Aventis | 139,612 | | 10,848 |
| | 390,365 |
TOTAL HEALTH CARE | | 610,147 |
INDUSTRIALS - 12.6% |
Aerospace & Defense - 4.1% |
Embraer SA sponsored ADR | 411,300 | | 12,142 |
Goodrich Corp. | 118,300 | | 11,255 |
Honeywell International, Inc. | 967,080 | | 51,352 |
Rockwell Collins, Inc. | 694,200 | | 38,243 |
The Boeing Co. | 696,700 | | 49,096 |
United Technologies Corp. | 782,000 | | 64,781 |
| | 226,869 |
Common Stocks - continued |
| Shares | | Value (000s) |
INDUSTRIALS - continued |
Air Freight & Logistics - 0.1% |
C.H. Robinson Worldwide, Inc. | 7,126 | | $ 515 |
United Parcel Service, Inc. Class B | 108,200 | | 7,490 |
| | 8,005 |
Building Products - 1.0% |
Lennox International, Inc. | 297,066 | | 10,986 |
Owens Corning (a) | 861,000 | | 30,634 |
Quanex Building Products Corp. | 781,178 | | 12,241 |
| | 53,861 |
Commercial Services & Supplies - 0.5% |
Aggreko PLC | 68,150 | | 2,163 |
Covanta Holding Corp. | 162,000 | | 2,799 |
Healthcare Services Group, Inc. | 385,500 | | 6,048 |
Republic Services, Inc. | 438,639 | | 12,734 |
Waste Management, Inc. | 188,668 | | 5,941 |
| | 29,685 |
Electrical Equipment - 0.8% |
Emerson Electric Co. | 704,325 | | 34,575 |
Prysmian SpA | 428,300 | | 7,945 |
| | 42,520 |
Industrial Conglomerates - 3.0% |
Danaher Corp. | 857,400 | | 42,107 |
General Electric Co. | 3,826,681 | | 68,536 |
Koninklijke Philips Electronics NV (depositary receipt) (NY Reg.) (d) | 2,069,680 | | 51,266 |
| | 161,909 |
Machinery - 1.8% |
Charter International PLC | 1,954,800 | | 25,672 |
Douglas Dynamics, Inc. | 355,300 | | 5,397 |
Graco, Inc. | 70,500 | | 3,097 |
Ingersoll-Rand Co. Ltd. | 1,655,764 | | 61,959 |
| | 96,125 |
Professional Services - 0.9% |
Bureau Veritas SA | 371,766 | | 30,394 |
IHS, Inc. Class A (a) | 63,548 | | 4,683 |
Michael Page International PLC | 1,677,857 | | 13,813 |
| | 48,890 |
Trading Companies & Distributors - 0.4% |
Air Lease Corp. Class A | 137,700 | | 3,364 |
Common Stocks - continued |
| Shares | | Value (000s) |
INDUSTRIALS - continued |
Trading Companies & Distributors - continued |
Beacon Roofing Supply, Inc. (a) | 315,600 | | $ 6,748 |
Watsco, Inc. | 200,673 | | 11,876 |
| | 21,988 |
TOTAL INDUSTRIALS | | 689,852 |
INFORMATION TECHNOLOGY - 18.1% |
Communications Equipment - 2.5% |
Cisco Systems, Inc. | 4,422,170 | | 70,622 |
HTC Corp. | 76,950 | | 2,286 |
Juniper Networks, Inc. (a) | 963,404 | | 22,534 |
QUALCOMM, Inc. | 781,410 | | 42,806 |
| | 138,248 |
Computers & Peripherals - 5.4% |
Apple, Inc. (a) | 495,700 | | 193,561 |
EMC Corp. (a) | 1,711,600 | | 44,639 |
Hewlett-Packard Co. | 1,619,295 | | 56,934 |
| | 295,134 |
Electronic Equipment & Components - 0.8% |
Coretronic Corp. | 8,956,000 | | 10,544 |
Corning, Inc. | 1,687,700 | | 26,851 |
Everlight Electronics Co. Ltd. | 3,402,000 | | 7,303 |
| | 44,698 |
Internet Software & Services - 1.9% |
eBay, Inc. (a) | 265,540 | | 8,696 |
Google, Inc. Class A (a) | 157,593 | | 95,137 |
| | 103,833 |
IT Services - 4.2% |
Fidelity National Information Services, Inc. | 552,855 | | 16,597 |
International Business Machines Corp. | 290,500 | | 52,827 |
MasterCard, Inc. Class A | 223,154 | | 67,671 |
Paychex, Inc. | 1,545,278 | | 43,623 |
Visa, Inc. Class A | 590,363 | | 50,500 |
| | 231,218 |
Office Electronics - 0.1% |
Xerox Corp. | 324,780 | | 3,030 |
Semiconductors & Semiconductor Equipment - 1.0% |
KLA-Tencor Corp. | 285,055 | | 11,351 |
Siliconware Precision Industries Co. Ltd. sponsored ADR (d) | 3,070,201 | | 15,136 |
Common Stocks - continued |
| Shares | | Value (000s) |
INFORMATION TECHNOLOGY - continued |
Semiconductors & Semiconductor Equipment - continued |
Taiwan Semiconductor Manufacturing Co. Ltd. | 4,171,000 | | $ 10,350 |
Taiwan Semiconductor Manufacturing Co. Ltd. sponsored ADR | 1,265,738 | | 15,645 |
| | 52,482 |
Software - 2.2% |
ANSYS, Inc. (a) | 162,516 | | 8,223 |
Autonomy Corp. PLC (a) | 1,435,497 | | 39,613 |
Microsoft Corp. | 2,411,274 | | 66,069 |
Oracle Corp. | 149,700 | | 4,578 |
| | 118,483 |
TOTAL INFORMATION TECHNOLOGY | | 987,126 |
MATERIALS - 0.9% |
Chemicals - 0.9% |
Air Products & Chemicals, Inc. | 109,656 | | 9,730 |
Ecolab, Inc. | 214,095 | | 10,705 |
PPG Industries, Inc. | 72,000 | | 6,062 |
Praxair, Inc. | 196,828 | | 20,399 |
| | 46,896 |
TELECOMMUNICATION SERVICES - 0.4% |
Diversified Telecommunication Services - 0.2% |
Koninklijke KPN NV (d) | 852,180 | | 12,178 |
Wireless Telecommunication Services - 0.2% |
American Tower Corp. Class A (a) | 212,100 | | 11,142 |
TOTAL TELECOMMUNICATION SERVICES | | 23,320 |
UTILITIES - 1.5% |
Electric Utilities - 0.6% |
American Electric Power Co., Inc. | 238,862 | | 8,804 |
FirstEnergy Corp. | 59,661 | | 2,664 |
NextEra Energy, Inc. | 105,653 | | 5,837 |
PPL Corp. | 518,753 | | 14,473 |
| | 31,778 |
Gas Utilities - 0.2% |
National Fuel Gas Co. | 147,465 | | 10,674 |
Common Stocks - continued |
| Shares | | Value (000s) |
UTILITIES - continued |
Multi-Utilities - 0.7% |
National Grid PLC | 3,284,100 | | $ 32,136 |
Veolia Environnement | 221,789 | | 4,993 |
| | 37,129 |
TOTAL UTILITIES | | 79,581 |
TOTAL COMMON STOCKS (Cost $5,236,131) | 5,317,262 |
Preferred Stocks - 1.8% |
| | | |
Convertible Preferred Stocks - 0.6% |
HEALTH CARE - 0.5% |
Health Care Equipment & Supplies - 0.4% |
Alere, Inc. 3.00% (a) | 93,854 | | 23,370 |
Health Care Providers & Services - 0.1% |
Omnicare Capital Trust II Series B, 4.00% | 79,200 | | 3,684 |
TOTAL HEALTH CARE | | 27,054 |
UTILITIES - 0.1% |
Electric Utilities - 0.1% |
PPL Corp. 8.75% | 120,200 | | 6,408 |
TOTAL CONVERTIBLE PREFERRED STOCKS | | 33,462 |
Nonconvertible Preferred Stocks - 1.2% |
CONSUMER DISCRETIONARY - 1.2% |
Automobiles - 1.2% |
Porsche Automobil Holding SE (Germany) | 409,450 | | 31,581 |
Volkswagen AG | 155,275 | | 31,112 |
| | 62,693 |
TOTAL PREFERRED STOCKS (Cost $90,094) | 96,155 |
Convertible Bonds - 0.2% |
| Principal
Amount (000s) | | Value (000s) |
CONSUMER DISCRETIONARY - 0.1% |
Leisure Equipment & Products - 0.1% |
Eastman Kodak Co. 7% 4/1/17 | | $ 8,400 | | $ 5,247 |
HEALTH CARE - 0.1% |
Health Care Providers & Services - 0.1% |
Omnicare, Inc. 3.75% 12/15/25 | | 5,450 | | 7,000 |
TOTAL CONVERTIBLE BONDS (Cost $14,000) | 12,247 |
Money Market Funds - 1.0% |
| Shares | | |
Fidelity Cash Central Fund, 0.14% (b) | 198 | | 0* |
Fidelity Securities Lending Cash Central Fund, 0.15% (b)(c) | 55,264,124 | | 55,264 |
TOTAL MONEY MARKET FUNDS (Cost $55,264) | | 55,264 |
TOTAL INVESTMENT PORTFOLIO - 100.5% (Cost $5,395,489) | | 5,480,928 |
NET OTHER ASSETS (LIABILITIES) - (0.5)% | | (25,418) |
NET ASSETS - 100% | $ 5,455,510 |
Legend |
(a) Non-income producing |
(b) Affiliated fund that is available only to investment companies and other accounts managed by Fidelity Investments. The rate quoted is the annualized seven-day yield of the fund at period end. A complete unaudited listing of the fund's holdings as of its most recent quarter end is available upon request. In addition, each Fidelity Central Fund's financial statements, which are not covered by the Fund's Report of Independent Registered Public Accounting Firm, are available on the SEC's website or upon request. |
(c) Investment made with cash collateral received from securities on loan. |
(d) Security or a portion of the security is on loan at period end. |
(e) Security exempt from registration under Rule 144A of the Securities Act of 1933. These securities may be resold in transactions exempt from registration, normally to qualified institutional buyers. At the end of the period, the value of these securities amounted to $6,638,000 or 0.1% of net assets. |
(f) Security or a portion of the security purchased on a delayed delivery or when-issued basis. |
* Amount represents less than $1,000 |
Affiliated Central Funds |
Information regarding fiscal year to date income earned by the Fund from investments in Fidelity Central Funds is as follows: |
Fund | Income earned
(Amounts in thousands) |
Fidelity Cash Central Fund | $ 90 |
Fidelity Securities Lending Cash Central Fund | 510 |
Total | $ 600 |
Other Information |
The following is a summary of the inputs used, as of July 31, 2011, involving the Fund's assets and liabilities carried at fair value. The inputs or methodology used for valuing securities may not be an indication of the risk associated with investing in those securities. For more information on valuation inputs, and their aggregation into the levels used in the tables below, please refer to the Security Valuation section in the accompanying Notes to Financial Statements. |
Valuation Inputs at Reporting Date: |
Description
(Amounts in thousands) | Total | Level 1 | Level 2 | Level 3 |
Investments in Securities: | | | | |
Equities: | | | | |
Consumer Discretionary | $ 709,966 | $ 709,966 | $ - | $ - |
Consumer Staples | 646,094 | 612,294 | 33,800 | - |
Energy | 625,331 | 552,723 | 72,608 | - |
Financials | 961,642 | 951,068 | 10,574 | - |
Health Care | 637,201 | 626,353 | 10,848 | - |
Industrials | 689,852 | 689,852 | - | - |
Information Technology | 987,126 | 976,776 | 10,350 | - |
Materials | 46,896 | 46,896 | - | - |
Telecommunication Services | 23,320 | 23,320 | - | - |
Utilities | 85,989 | 42,452 | 43,537 | - |
Corporate Bonds | 12,247 | - | 12,247 | - |
Money Market Funds | 55,264 | 55,264 | - | - |
Total Investments in Securities: | $ 5,480,928 | $ 5,286,964 | $ 193,964 | $ - |
The following is a reconciliation of Investments in Securities for which Level 3 inputs were used in determining value: |
(Amounts in thousands) | |
Investments in Securities: | |
Beginning Balance | $ 3,241 |
Total Realized Gain (Loss) | (544) |
Total Unrealized Gain (Loss) | 83 |
Cost of Purchases | - |
Proceeds of Sales | (2,780) |
Amortization/Accretion | - |
Transfers in to Level 3 | - |
Transfers out of Level 3 | - |
Ending Balance | $ - |
The change in unrealized gain (loss) for the period attributable to Level 3 securities held at July 31, 2011 | $ - |
The information used in the above reconciliation represents fiscal year to date activity for any Investments in Securities identified as using Level 3 inputs at either the beginning or the end of the current fiscal period. Transfers in or out of Level 3 represent the beginning value of any Security or Instrument where a change in the pricing level occurred from the beginning to the end of the period. The cost of purchases and the proceeds of sales may include securities received or delivered through corporate actions or exchanges. Realized and unrealized gains (losses) disclosed in the reconciliation are included in Net Gain (Loss) on the Fund's Statement of Operations. |
Distribution of investments by country of issue, as a percentage of total net assets, is as follows: (Unaudited) |
United States of America | 81.3% |
United Kingdom | 7.1% |
France | 1.9% |
Germany | 1.6% |
Netherlands | 1.4% |
Canada | 1.4% |
Switzerland | 1.2% |
Ireland | 1.1% |
Taiwan | 1.1% |
Others (Individually Less Than 1%) | 1.9% |
| 100.0% |
Income Tax Information |
At July 31, 2011, the Fund had a capital loss carryforward of approximately $4,828,805,000 of which $1,660,464,000 and $3,168,341,000 will expire in fiscal 2017 and 2018, respectively. Capital loss carryforwards are only available to offset future capital gains of the Fund to the extent provided by regulations and may be limited. |
See accompanying notes which are an integral part of the financial statements.
Annual Report
Statement of Assets and Liabilities
Amounts in thousands (except per-share amounts) | July 31, 2011 |
| | |
Assets | | |
Investment in securities, at value (including securities loaned of $52,792) - See accompanying schedule: Unaffiliated issuers (cost $5,340,225) | $ 5,425,664 | |
Fidelity Central Funds (cost $55,264) | 55,264 | |
Total Investments (cost $5,395,489) | | $ 5,480,928 |
Cash | | 39 |
Foreign currency held at value (cost $68) | | 68 |
Receivable for investments sold | | 110,966 |
Receivable for fund shares sold | | 1,026 |
Dividends receivable | | 9,120 |
Interest receivable | | 220 |
Distributions receivable from Fidelity Central Funds | | 24 |
Other receivables | | 940 |
Total assets | | 5,603,331 |
| | |
Liabilities | | |
Payable for investments purchased
Regular delivery | $ 59,009 | |
Delayed delivery | 6,592 | |
Payable for fund shares redeemed | 8,758 | |
Accrued management fee | 2,205 | |
Notes payable to affiliates | 14,172 | |
Other affiliated payables | 1,110 | |
Other payables and accrued expenses | 711 | |
Collateral on securities loaned, at value | 55,264 | |
Total liabilities | | 147,821 |
| | |
Net Assets | | $ 5,455,510 |
Net Assets consist of: | | |
Paid in capital | | $ 10,228,736 |
Undistributed net investment income | | 3,860 |
Accumulated undistributed net realized gain (loss) on investments and foreign currency transactions | | (4,862,649) |
Net unrealized appreciation (depreciation) on investments and assets and liabilities in foreign currencies | | 85,563 |
Net Assets | | $ 5,455,510 |
See accompanying notes which are an integral part of the financial statements.
Annual Report
Statement of Assets and Liabilities - continued
Amounts in thousands (except per-share amounts) | July 31, 2011 |
| | |
Growth & Income:
Net Asset Value, offering price and redemption price per share ($5,052,058 ÷ 271,868 shares) | | $ 18.58 |
| | |
Class K:
Net Asset Value, offering price and redemption price per share ($403,452 ÷ 21,725 shares) | | $ 18.57 |
See accompanying notes which are an integral part of the financial statements.
Annual Report
Financial Statements - continued
Statement of Operations
Amounts in thousands | Year ended July 31, 2011 |
| | |
Investment Income | | |
Dividends | | $ 107,127 |
Interest | | 314 |
Income from Fidelity Central Funds | | 600 |
Total income | | 108,041 |
| | |
Expenses | | |
Management fee | $ 27,506 | |
Transfer agent fees | 12,978 | |
Accounting and security lending fees | 1,127 | |
Custodian fees and expenses | 231 | |
Independent trustees' compensation | 36 | |
Appreciation in deferred trustee compensation account | 1 | |
Registration fees | 52 | |
Audit | 119 | |
Legal | 52 | |
Interest | 17 | |
Miscellaneous | 69 | |
Total expenses before reductions | 42,188 | |
Expense reductions | (765) | 41,423 |
Net investment income (loss) | | 66,618 |
Realized and Unrealized Gain (Loss) Net realized gain (loss) on: | | |
Investment securities: | | |
Unaffiliated issuers | 1,411,540 | |
Foreign currency transactions | (334) | |
Futures contracts | 415 | |
Total net realized gain (loss) | | 1,411,621 |
Change in net unrealized appreciation (depreciation) on: Investment securities | (422,884) | |
Assets and liabilities in foreign currencies | 117 | |
Total change in net unrealized appreciation (depreciation) | | (422,767) |
Net gain (loss) | | 988,854 |
Net increase (decrease) in net assets resulting from operations | | $ 1,055,472 |
See accompanying notes which are an integral part of the financial statements.
Annual Report
Statement of Changes in Net Assets
Amounts in thousands | Year ended
July 31,
2011 | Year ended
July 31,
2010 |
Increase (Decrease) in Net Assets | | |
Operations | | |
Net investment income (loss) | $ 66,618 | $ 40,566 |
Net realized gain (loss) | 1,411,621 | 534,831 |
Change in net unrealized appreciation (depreciation) | (422,767) | 81,662 |
Net increase (decrease) in net assets resulting
from operations | 1,055,472 | 657,059 |
Distributions to shareholders from net investment income | (61,849) | (38,583) |
Distributions to shareholders from net realized gain | - | (3,482) |
Total distributions | (61,849) | (42,065) |
Share transactions - net increase (decrease) | (1,247,529) | (1,247,688) |
Total increase (decrease) in net assets | (253,906) | (632,694) |
| | |
Net Assets | | |
Beginning of period | 5,709,416 | 6,342,110 |
End of period (including undistributed net investment income of $3,860 and undistributed net investment income of $1,085, respectively) | $ 5,455,510 | $ 5,709,416 |
See accompanying notes which are an integral part of the financial statements.
Annual Report
Financial Highlights - Growth & Income
Years ended July 31, | 2011 | 2010 | 2009 | 2008 | 2007 |
Selected Per-Share Data | | | | |
Net asset value, beginning of period | $ 15.75 | $ 14.38 | $ 21.88 | $ 31.92 | $ 34.16 |
Income from Investment Operations | | | | | |
Net investment income (loss) B | .20 | .10 | .15 | .35 | .27 |
Net realized and unrealized gain (loss) | 2.82 | 1.37 | (7.43) | (6.25) | 3.84 |
Total from investment operations | 3.02 | 1.47 | (7.28) | (5.90) | 4.11 |
Distributions from net investment income | (.19) | (.10) | (.19) | (.33) | (.27) |
Distributions from net realized gain | - | (.01) | (.03) | (3.81) | (6.08) |
Total distributions | (.19) | (.10) F | (.22) | (4.14) | (6.35) |
Net asset value, end of period | $ 18.58 | $ 15.75 | $ 14.38 | $ 21.88 | $ 31.92 |
Total Return A | 19.16% | 10.25% | (33.32)% | (20.91)% | 14.28% |
Ratios to Average Net Assets C, E | | | | |
Expenses before reductions | .72% | .75% | .78% | .68% | .68% |
Expenses net of fee waivers, if any | .72% | .75% | .78% | .68% | .68% |
Expenses net of all reductions | .71% | .74% | .78% | .67% | .67% |
Net investment income (loss) | 1.09% | .63% | 1.07% | 1.29% | .84% |
Supplemental Data | | | | |
Net assets, end of period (in millions) | $ 5,052 | $ 5,417 | $ 5,993 | $ 12,552 | $ 22,693 |
Portfolio turnover rate D | 129% | 98% | 122% | 52% | 52% |
A Total returns would have been lower if certain expenses had not been reduced during the applicable periods shown.
B Calculated based on average shares outstanding during the period.
C Fees and expenses of any underlying Fidelity Central Funds are not included in the Fund's expense ratio. The Fund indirectly bears its proportionate share of the expenses of any underlying Fidelity Central Funds.
D Amount does not include the portfolio activity of any underlying Fidelity Central Funds.
E Expense ratios reflect operating expenses of the class. Expenses before reductions do not reflect amounts reimbursed by the investment adviser or reductions from brokerage service arrangements or reductions from other expense offset arrangements and do not represent the amount paid by the class during periods when reimbursements or reductions occur. Expenses net of fee waivers reflect expenses after reimbursement by the investment adviser but prior to reductions from brokerage service arrangements or other expense offset arrangements. Expenses net of all reductions represent the net expenses paid by the class.
F Total distributions of $.10 per share is comprised of distributions from net investment income of $.095 and distributions from net realized gain of $.008 per share.
See accompanying notes which are an integral part of the financial statements.
Annual Report
Financial Highlights - Class K
Years ended July 31, | 2011 | 2010 | 2009 | 2008 G |
Selected Per-Share Data | | | |
Net asset value, beginning of period | $ 15.74 | $ 14.38 | $ 21.88 | $ 25.34 |
Income from Investment Operations | | | | |
Net investment income (loss) D | .23 | .13 | .16 | .09 |
Net realized and unrealized gain (loss) | 2.82 | 1.37 | (7.40) | (3.45) |
Total from investment operations | 3.05 | 1.50 | (7.24) | (3.36) |
Distributions from net investment income | (.22) | (.13) | (.23) | (.10) |
Distributions from net realized gain | - | (.01) | (.03) | - |
Total distributions | (.22) | (.14) I | (.26) | (.10) |
Net asset value, end of period | $ 18.57 | $ 15.74 | $ 14.38 | $ 21.88 |
Total Return B, C | 19.40% | 10.41% | (33.12)% | (13.22)% |
Ratios to Average Net Assets E, H | | | |
Expenses before reductions | .54% | .54% | .56% | .55% A |
Expenses net of fee waivers, if any | .54% | .54% | .56% | .55% A |
Expenses net of all reductions | .53% | .53% | .55% | .55% A |
Net investment income (loss) | 1.27% | .84% | 1.29% | 1.73% A |
Supplemental Data | | | |
Net assets, end of period (000 omitted) | $ 403,452 | $ 292,021 | $ 349,324 | $ 87 |
Portfolio turnover rate F | 129% | 98% | 122% | 52% |
A Annualized
B Total returns for periods of less than one year are not annualized.
C Total returns would have been lower if certain expenses had not been reduced during the applicable periods shown.
D Calculated based on average shares outstanding during the period.
E Fees and expenses of any underlying Fidelity Central Funds are not included in the Fund's expense ratio. The Fund indirectly bears its proportionate share of the expenses of any underlying Fidelity Central Funds.
F Amount does not include the portfolio activity of any underlying Fidelity Central Funds.
G For the period May 9, 2008 (commencement of sale of shares) to July 31, 2008.
H Expense ratios reflect operating expenses of the class. Expenses before reductions do not reflect amounts reimbursed by the investment adviser or reductions from brokerage service arrangements or reductions from other expense offset arrangements and do not represent the amount paid by the class during periods when reimbursements or reductions occur. Expense ratios before reductions for start-up periods may not be representative of longer-term operating periods. Expenses net of fee waivers reflect expenses after reimbursement by the investment adviser but prior to reductions from brokerage service arrangements or other expense offset arrangements. Expenses net of all reductions represent the net expenses paid by the class.
I Total distributions of $.14 per share is comprised of distributions from net investment income of $.129 and distributions from net realized gain of $.008 per share.
See accompanying notes which are an integral part of the financial statements.
Annual Report
Notes to Financial Statements
For the period ended July 31, 2011
(Amounts in thousands except ratios)
1. Organization.
Fidelity Growth & Income Portfolio (the Fund) is a fund of Fidelity Securities Fund (the Trust) and is authorized to issue an unlimited number of shares. The Trust is registered under the Investment Company Act of 1940, as amended (the 1940 Act), as an open-end management investment company organized as a Massachusetts business trust. The Fund offers Growth & Income shares and Class K shares, each of which has equal rights as to assets and voting privileges. Each class has exclusive voting rights with respect to matters that affect that class. Investment income, realized and unrealized capital gains and losses, the common expenses of the Fund, and certain fund-level expense reductions, if any, are allocated on a pro-rata basis to each class based on the relative net assets of each class to the total net assets of the Fund. Each class differs with respect to transfer agent fees incurred. Certain expense reductions may also differ by class.
2. Investments in Fidelity Central Funds.
The Fund invests in Fidelity Central Funds, which are open-end investment companies available only to other investment companies and accounts managed by Fidelity Management & Research Company (FMR) and its affiliates. The Fund's Schedule of Investments lists each of the Fidelity Central Funds held as of period end, if any, as an investment of the Fund, but does not include the underlying holdings of each Fidelity Central Fund. As an Investing Fund, the Fund indirectly bears its proportionate share of the expenses of the underlying Fidelity Central Funds.
The Money Market Central Funds seek preservation of capital and current income and are managed by Fidelity Investments Money Management, Inc. (FIMM), an affiliate of FMR.
A complete unaudited list of holdings for each Fidelity Central Fund is available upon request or at the Securities and Exchange Commission (the SEC) web site at www.sec.gov. In addition, the financial statements of the Fidelity Central Funds, which are not covered by the Fund's Report of Independent Registered Public Accounting Firm, are available on the SEC web site or upon request.
3. Significant Accounting Policies.
The financial statements have been prepared in conformity with accounting principles generally accepted in the United States of America (GAAP), which require management to make certain estimates and assumptions at the date of the financial statements. Actual results could differ from those estimates. Subsequent events, if any, through the date that the financial statements were issued have been evaluated in the preparation of the financial statements. The following summarizes the significant accounting policies of the Fund:
Annual Report
Notes to Financial Statements - continued
(Amounts in thousands except ratios)
3. Significant Accounting Policies - continued
Security Valuation. Investments are valued as of 4:00 p.m. Eastern time on the last calendar day of the period. The Fund uses independent pricing services approved by the Board of Trustees to value its investments. When current market prices or quotations are not readily available or reliable, valuations may be determined in good faith in accordance with procedures adopted by the Board of Trustees. Factors used in determining value may include market or security specific events, changes in interest rates and credit quality. The frequency with which these procedures are used cannot be predicted and they may be utilized to a significant extent. The value used for net asset value (NAV) calculation under these procedures may differ from published prices for the same securities.
The Fund categorizes the inputs to valuation techniques used to value its investments into a disclosure hierarchy consisting of three levels as shown below:
Level 1 - quoted prices in active markets for identical investments
Level 2 - other significant observable inputs (including quoted prices for similar investments, interest rates, prepayment speeds, etc.)
Level 3 - unobservable inputs (including the Fund's own assumptions based on the best information available)
Changes in valuation techniques may result in transfers in or out of an assigned level within the disclosure hierarchy. The aggregate value of investments by input level, as of July 31, 2011, as well as a roll forward of Level 3 securities, is included at the end of the Fund's Schedule of Investments. Valuation techniques used to value the Fund's investments by major category are as follows:
Equity securities, including restricted securities, for which market quotations are readily available, are valued at the last reported sale price or official closing price as reported by an independent pricing service on the primary market or exchange on which they are traded and are categorized as Level 1 in the hierarchy. In the event there were no sales during the day or closing prices are not available, securities are valued at the last quoted bid price or may be valued using the last available price and are generally categorized as Level 2 in the hierarchy. For foreign equity securities, when significant market or security specific events arise, comparisons to the valuation of American Depositary Receipts (ADRs), futures contracts, Exchange-traded funds (ETFs) and certain indexes as well as quoted prices for similar securities are used and are categorized as Level 2 in the hierarchy in these circumstances. Utilizing these techniques may result in transfers between Level 1 and Level 2. For restricted equity securities and private placements where observable inputs are limited, assumptions about market activity and risk are used and are categorized as Level 3 in the hierarchy.
Annual Report
3. Significant Accounting Policies - continued
Security Valuation - continued
Debt securities, including restricted securities, are valued based on evaluated prices received from independent pricing services or from dealers who make markets in such securities. For corporate bonds, pricing services utilize matrix pricing which considers yield or price of bonds of comparable quality, coupon, maturity and type as well as dealer supplied prices and are generally categorized as Level 2 in the hierarchy. When independent prices are unavailable or unreliable, debt securities may be valued utilizing pricing matrices which consider similar factors that would be used by independent pricing services. These are generally categorized as Level 2 in the hierarchy but may be Level 3 depending on the circumstances.
Investments in open-end mutual funds, including the Fidelity Central Funds, are valued at their closing net asset value each business day and are categorized as Level 1 in the hierarchy.
Foreign Currency. The Fund may use foreign currency contracts to facilitate transactions in foreign-denominated securities. Gains and losses from these transactions may arise from changes in the value of the foreign currency or if the counterparties do not perform under the contracts' terms.
Foreign-denominated assets, including investment securities, and liabilities are translated into U.S. dollars at the exchange rate at period end. Purchases and sales of investment securities, income and dividends received and expenses denominated in foreign currencies are translated into U.S. dollars at the exchange rate in effect on the transaction date.
The effects of exchange rate fluctuations on investments are included with the net realized and unrealized gain (loss) on investment securities. Other foreign currency transactions resulting in realized and unrealized gain (loss) are disclosed separately.
Investment Transactions and Income. For financial reporting purposes, the Fund's investment holdings and NAV include trades executed through the end of the last business day of the period. The NAV per share for processing shareholder transactions is calculated as of the close of business of the New York Stock Exchange (NYSE), normally 4:00 p.m. Eastern time and includes trades executed through the end of the prior business day. Gains and losses on securities sold are determined on the basis of identified cost and may include proceeds received from litigation. Dividend income is recorded on the ex-dividend date, except for certain dividends from foreign securities where the ex-dividend date may have passed, which are recorded as soon as the Fund is informed of the ex-dividend date. Non-cash dividends included in dividend income, if any, are recorded at the fair market value of the securities received. Distributions received on securities that represent a return of capital or capital gain are recorded as a reduction of
Annual Report
Notes to Financial Statements - continued
(Amounts in thousands except ratios)
3. Significant Accounting Policies - continued
Investment Transactions and Income - continued
cost of investments and/or as a realized gain. The Fund estimates the components of distributions received that may be considered return of capital distributions or capital gain distributions. Interest income and distributions from the Fidelity Central Funds are accrued as earned. Interest income includes coupon interest and amortization of premium and accretion of discount on debt securities. Investment income is recorded net of foreign taxes withheld where recovery of such taxes is uncertain.
Expenses. Expenses directly attributable to a fund are charged to that fund. Expenses attributable to more than one fund are allocated among the respective funds on the basis of relative net assets or other appropriate methods. Expense estimates are accrued in the period to which they relate and adjustments are made when actual amounts are known.
Deferred Trustee Compensation. Under a Deferred Compensation Plan (the Plan), independent Trustees may elect to defer receipt of a portion of their annual compensation. Deferred amounts are invested in a cross-section of Fidelity funds, are marked-to-market and remain in the Fund until distributed in accordance with the Plan. The investment of deferred amounts and the offsetting payable to the Trustees are included in the accompanying Statement of Assets and Liabilities.
Income Tax Information and Distributions to Shareholders. Each year, the Fund intends to qualify as a regulated investment company, including distributing substantially all of its taxable income and realized gains under Subchapter M of the Internal Revenue Code and filing its U.S. federal tax return. As a result, no provision for income taxes is required. As of July 31, 2011, the Fund did not have any unrecognized tax benefits in the financial statements. A fund's federal tax return is subject to examination by the Internal Revenue Service (IRS) for a period of three years. Foreign taxes are provided for based on the Fund's understanding of the tax rules and rates that exist in the foreign markets in which it invests.
Distributions are declared and recorded on the ex-dividend date. Income dividends and capital gain distributions are declared separately for each class. Income and capital gain distributions are determined in accordance with income tax regulations, which may differ from GAAP.
Capital accounts within the financial statements are adjusted for permanent book-tax differences. These adjustments have no impact on net assets or the results of operations. Temporary book-tax differences will reverse in a subsequent period.
Book-tax differences are primarily due to futures transactions, foreign currency transactions, passive foreign investment companies (PFIC), market discount, partnerships,
Annual Report
3. Significant Accounting Policies - continued
Income Tax Information and Distributions to Shareholders - continued
equity-debt classifications, deferred trustees compensation, capital loss carryforwards and losses deferred due to wash sales.
The federal tax cost of investment securities and unrealized appreciation (depreciation) as of period end were as follows:
Gross unrealized appreciation | $ 397,150 |
Gross unrealized depreciation | (345,525) |
Net unrealized appreciation (depreciation) on securities and other investments | $ 51,625 |
| |
Tax Cost | $ 5,429,303 |
The tax-based components of distributable earnings as of period end were as follows:
Undistributed ordinary income | $ 4,586 |
Capital loss carryforward | $ (4,828,805) |
Net unrealized appreciation (depreciation) | $ 51,750 |
Under the recently enacted Regulated Investment Company Modernization Act of 2010 (the Act), the Fund will be permitted to carry forward capital losses incurred in taxable years beginning after December 22, 2010 for an unlimited period. However, any losses incurred during those future taxable years will be required to be utilized prior to any losses incurred in pre-enactment taxable years, which generally expire after eight years from when they are incurred. Additionally, post-enactment capital losses that are carried forward will retain their character as either short-term or long-term capital losses rather than being considered all short-term as under previous law. The Fund's first fiscal year end subject to the Act will be July 31, 2012.
The tax character of distributions paid was as follows:
| July 31, 2011 | July 31, 2010 |
Ordinary Income | $ 61,849 | $ 42,065 |
New Accounting Pronouncement. In May 2011, the Financial Accounting Standards Board issued Accounting Standard Update No. 2011-04, Fair Value Measurement (Topic 820) - Amendments to Achieve Common Fair Value Measurement and Disclosure Requirements in U.S. GAAP and IFRSs. The update changes the wording used to describe the requirements in GAAP for measuring fair value and for disclosing information about fair value measurements. The update is effective during interim and annual periods beginning after December 15, 2011. Management is currently
Annual Report
Notes to Financial Statements - continued
(Amounts in thousands except ratios)
3. Significant Accounting Policies - continued
New Accounting Pronouncement - continued
evaluating the impact of the update's adoption on the Fund's financial statement disclosures.
4. Operating Policies.
Delayed Delivery Transactions and When-Issued Securities. The Fund may purchase or sell securities on a delayed delivery or when-issued basis. Payment and delivery may take place after the customary settlement period for that security. The price of the underlying securities and the date when the securities will be delivered and paid for are fixed at the time the transaction is negotiated. During the time a delayed delivery sell is outstanding, the contract is marked-to-market daily and equivalent deliverable securities are held for the transaction. The securities purchased on a delayed delivery or when-issued basis are identified as such in the Fund's Schedule of Investments. The Fund may receive compensation for interest forgone in the purchase of a delayed delivery or when-issued security. With respect to purchase commitments, the Fund identifies securities as segregated in its records with a value at least equal to the amount of the commitment. Losses may arise due to changes in the value of the underlying securities or if the counterparty does not perform under the contract's terms, or if the issuer does not issue the securities due to political, economic, or other factors.
Restricted Securities. The Fund may invest in securities that are subject to legal or contractual restrictions on resale. These securities generally may be resold in transactions exempt from registration or to the public if the securities are registered. Disposal of these securities may involve time-consuming negotiations and expense, and prompt sale at an acceptable price may be difficult. Information regarding restricted securities is included at the end of the Fund's Schedule of Investments.
5. Derivative Instruments.
Risk Exposures and the Use of Derivative Instruments. The Fund used derivative instruments (derivatives), including futures contracts, in order to meet its investment objectives. The strategy is to use derivatives to increase returns and to manage exposure to certain risks as defined below. The success of any strategy involving derivatives depends on analysis of numerous economic factors, and if the strategies for investment do not work as intended, the Fund may not achieve its objectives.
Annual Report
5. Derivative Instruments - continued
Risk Exposures and the Use of Derivative Instruments - continued
The Fund's use of derivatives increased or decreased its exposure to the following risk:
Equity Risk | Equity risk relates to the fluctuations in the value of financial instruments as a result of changes in market prices (other than those arising from interest rate risk or foreign exchange risk), whether caused by factors specific to an individual investment, its issuer, or all factors affecting all instruments traded in a market or market segment. |
The Fund is also exposed to additional risks from investing in derivatives, such as liquidity risk and counterparty credit risk. Liquidity risk is the risk that the Fund will be unable to sell the derivative in the open market in a timely manner. Counterparty credit risk is the risk that the counterparty will not be able to fulfill its obligation to the Fund.
The Fund's maximum risk of loss from counterparty credit risk is generally the aggregate unrealized appreciation and unpaid counterparty payments in excess of any collateral pledged by the counterparty to the Fund. Counterparty risk related to exchange-traded futures contracts is minimal because of the protection provided by the exchange on which they trade. Derivatives involve, to varying degrees, risk of loss in excess of the amounts recognized in the Statement of Assets and Liabilities.
Futures Contracts. A futures contract is an agreement between two parties to buy or sell a specified underlying instrument for a fixed price at a specified future date. The Fund used futures contracts to manage its exposure to the stock market.
Upon entering into a futures contract, a fund is required to deposit either cash or securities (initial margin) with a clearing broker in an amount equal to a certain percentage of the face value of the contract. Futures contracts are marked-to-market daily and subsequent payments (variation margin) are made or received by a fund depending on the daily fluctuations in the value of the futures contracts and are recorded as unrealized appreciation or (depreciation). This receivable and/or payable is included in daily variation margin on futures contracts in the Statement of Assets and Liabilities. Realized gain or (loss) is recorded upon the expiration or closing of a futures contract.
The underlying face amount at value of open futures contracts at period end, if any, is shown in the Schedule of Investments under the caption "Futures Contracts." This amount reflects each contract's exposure to the underlying instrument at period end. Securities deposited to meet initial margin requirements are identified in the Schedule of Investments.
Certain risks arise upon entering into futures contracts, including the risk that an illiquid market limits the ability to close out a futures contract prior to settlement date.
Annual Report
Notes to Financial Statements - continued
(Amounts in thousands except ratios)
5. Derivative Instruments - continued
Futures Contracts - continued
During the period the Fund recognized net realized gain (loss) of $415 related to its investment in futures contracts. This amount is included in the Statement of Operations.
6. Purchases and Sales of Investments.
Purchases and sales of securities, other than short-term securities, aggregated $7,628,344 and $8,873,741, respectively.
7. Fees and Other Transactions with Affiliates.
Management Fee. FMR and its affiliates provide the Fund with investment management related services for which the Fund pays a monthly management fee. The management fee is the sum of an individual fund fee rate that is based on an annual rate of .20% of the Fund's average net assets and a group fee rate that averaged .26% during the period. The group fee rate is based upon the average net assets of all the mutual funds advised by FMR. The group fee rate decreases as assets under management increase and increases as assets under management decrease. For the period, the total annual management fee rate was .46% of the Fund's average net assets.
Transfer Agent Fees. Fidelity Investments Institutional Operations Company, Inc. (FIIOC), an affiliate of FMR, is the transfer, dividend disbursing and shareholder servicing agent for each class of the Fund. FIIOC receives account fees and asset-based fees that vary according to the account size and type of account of the shareholders of Growth and Income. FIIOC receives an asset-based fee of Class K's average net assets. FIIOC pays for typesetting, printing and mailing of shareholder reports, except proxy statements. For the period, transfer agent fees for each class were as follows:
| Amount | % of
Average
Net Assets |
Growth & Income | $ 12,686 | .23 |
Class K | 292 | .05 |
| $ 12,978 | |
Accounting and Security Lending Fees. Fidelity Service Company, Inc. (FSC), an affiliate of FMR, maintains the Fund's accounting records. The accounting fee is based on the level of average net assets for the month. Under a separate contract, FSC administers the security lending program. The security lending fee is based on the number and duration of lending transactions.
Annual Report
7. Fees and Other Transactions with Affiliates - continued
Brokerage Commissions. The Fund placed a portion of its portfolio transactions with brokerage firms which are affiliates of the investment adviser. The commissions paid to these affiliated firms were $234 for the period.
Interfund Lending Program. Pursuant to an Exemptive Order issued by the SEC, the Fund, along with other registered investment companies having management contracts with FMR, may participate in an interfund lending program. This program provides an alternative credit facility allowing the funds to borrow from, or lend money to, other participating affiliated funds. Any open loans, including accrued interest, at period end are presented under the caption "Notes Payable to Affiliates" in the Fund's Statement of Assets and Liabilities. The Fund's activity in this program during the period for which loans were outstanding was as follows:
Borrower or Lender | Average Daily
Loan Balance | Weighted Average
Interest Rate | Interest
Expense |
Borrower | $ 17,476 | .35% | $ 17 |
8. Committed Line of Credit.
The Fund participates with other funds managed by FMR or an affiliate in a $4.0 billion credit facility (the "line of credit") to be utilized for temporary or emergency purposes to fund shareholder redemptions or for other short-term liquidity purposes. The Fund has agreed to pay commitment fees on its pro-rata portion of the line of credit, which amounted to $20 and is reflected in Miscellaneous expenses on the Statement of Operations. During the period, there were no borrowings on this line of credit.
9. Security Lending.
The Fund lends portfolio securities through a lending agent from time to time in order to earn additional income. The lending agent may loan securities to certain qualified borrowers, including Fidelity Capital Markets (FCM), a broker-dealer affiliated with the Fund. On the settlement date of the loan, the Fund receives collateral (in the form of U.S. Treasury obligations, letters of credit and/or cash) against the loaned securities and maintains collateral in an amount not less than 100% of the market value of the loaned securities during the period of the loan. The market value of the loaned securities is determined at the close of business of the Fund and any additional required collateral is delivered to the Fund on the next business day. If the borrower defaults on its obligation to return the securities loaned because of insolvency or other reasons, a fund could experience delays and costs in recovering the securities loaned or in gaining access to the collateral. Any cash collateral received is invested in the Fidelity Securities Lending Cash Central Fund. The value of loaned securities and cash collateral at period end are
Annual Report
Notes to Financial Statements - continued
(Amounts in thousands except ratios)
9. Security Lending - continued
disclosed on the Fund's Statement of Assets and Liabilities. Security lending income represents the income earned on investing cash collateral, less rebates paid to borrowers and lending agent fees associated with the loan, plus any premium payments received for lending certain types of securities. Security lending income is presented in the Statement of Operations as a component of income from Fidelity Central Funds. Total security lending income during the period amounted to $510. During the period, there were no securities loaned to FCM.
10. Bank Borrowings.
The Fund is permitted to have bank borrowings for temporary or emergency purposes to fund shareholder redemptions or for other short-term liquidity requirements. The Fund has established borrowing arrangements with certain banks. The interest rate on the borrowings is the bank's base rate, as revised from time to time. The average daily loan balance during the period for which loans were outstanding amounted to $3,766. The weighted average interest rate was .59%. The interest expense amounted to four hundred twenty-nine dollars under the bank borrowing program. At period end, there were no bank borrowings outstanding.
11. Expense Reductions.
Many of the brokers with whom FMR places trades on behalf of the Fund provided services to the Fund in addition to trade execution. These services included payments of certain expenses on behalf of the Fund totaling $765 for the period. In addition, through arrangements with the Fund's custodian credits realized as a result of uninvested cash balances were used to reduce the Fund's expenses. During the period, these credits reduced the Fund's custody expenses by one hundred sixty-eight dollars.
12. Distributions to Shareholders.
Distributions to shareholders of each class were as follows:
Years ended July 31, | 2011 | 2010 |
From net investment income | | |
Growth & Income | $ 54,597 | $ 36,263 |
Class K | 7,252 | 2,320 |
Total | $ 61,849 | $ 38,583 |
From net realized gain | | |
Growth & Income | $ - | $ 3,285 |
Class K | - | 197 |
Total | $ - | $ 3,482 |
Annual Report
13. Share Transactions.
Transactions for each class of shares were as follows:
| Shares | Dollars |
Years ended July 31, | 2011 | 2010 A | 2011 | 2010 A |
Growth & Income | | | | |
Shares sold | 10,892 | 18,939 | $ 196,623 | $ 300,805 |
Conversion to Class K | - | (593) | - | (8,751) |
Reinvestment of distributions | 2,827 | 2,436 | 52,490 | 38,201 |
Shares redeemed | (85,823) | (93,499) | (1,509,810) | (1,487,904) |
Net increase (decrease) | (72,104) | (72,717) | $ (1,260,697) | $ (1,157,649) |
Class K | | | | |
Shares sold | 26,831 | 8,408 | $ 447,073 | $ 133,367 |
Conversion from Growth & Income | - | 593 | - | 8,751 |
Reinvestment of distributions | 390 | 161 | 7,252 | 2,517 |
Shares redeemed | (24,047) | (14,911) | (441,157) | (234,674) |
Net increase (decrease) | 3,174 | (5,749) | $ 13,168 | $ (90,039) |
A Conversion transactions for Class K and Growth & Income are presented for the period August 1, 2009 through August 31, 2009.
14. Other.
The Fund's organizational documents provide former and current trustees and officers with a limited indemnification against liabilities arising in connection with the performance of their duties to the Fund. In the normal course of business, the Fund may also enter into contracts that provide general indemnifications. The Fund's maximum exposure under these arrangements is unknown as this would be dependent on future claims that may be made against the Fund. The risk of material loss from such claims is considered remote.
Annual Report
To the Trustees of Fidelity Securities Fund and the Shareholders of Fidelity Growth & Income Portfolio:
In our opinion, the accompanying statement of assets and liabilities, including the schedule of investments, and the related statements of operations and of changes in net assets and the financial highlights present fairly, in all material respects, the financial position of Fidelity Growth & Income Portfolio (a fund of Fidelity Securities Fund) at July 31, 2011, the results of its operations for the year then ended, the changes in its net assets for each of the two years in the period then ended and the financial highlights for each of the periods indicated, in conformity with accounting principles generally accepted in the United States of America. These financial statements and financial highlights (hereafter referred to as "financial statements") are the responsibility of the Fidelity Growth & Income Portfolio's management. Our responsibility is to express an opinion on these financial statements based on our audits. We conducted our audits of these financial statements in accordance with the standards of the Public Company Accounting Oversight Board (United States). Those standards require that we plan and perform the audit to obtain reasonable assurance about whether the financial statements are free of material misstatement. An audit includes examining, on a test basis, evidence supporting the amounts and disclosures in the financial statements, assessing the accounting principles used and significant estimates made by management, and evaluating the overall financial statement presentation. We believe that our audits, which included confirmation of securities at July 31, 2011 by correspondence with the custodian and brokers, provide a reasonable basis for our opinion.
/s/ PricewaterhouseCoopers LLP
PricewaterhouseCoopers LLP
Boston, Massachusetts
September 13, 2011
Annual Report
The Trustees, Members of the Advisory Board, and executive officers of the trust and fund, as applicable, are listed below. The Board of Trustees governs the fund and is responsible for protecting the interests of shareholders. The Trustees are experienced executives who meet periodically throughout the year to oversee the fund's activities, review contractual arrangements with companies that provide services to the fund, oversee management of the risks associated with such activities and contractual arrangements, and review the fund's performance. Except for James C. Curvey, each of the Trustees oversees 221 funds advised by FMR or an affiliate. Mr. Curvey oversees 419 funds advised by FMR or an affiliate.
The Trustees hold office without limit in time except that (a) any Trustee may resign; (b) any Trustee may be removed by written instrument, signed by at least two-thirds of the number of Trustees prior to such removal; (c) any Trustee who requests to be retired or who has become incapacitated by illness or injury may be retired by written instrument signed by a majority of the other Trustees; and (d) any Trustee may be removed at any special meeting of shareholders by a two-thirds vote of the outstanding voting securities of the trust. Each Trustee who is not an interested person (as defined in the 1940 Act) (Independent Trustee), shall retire not later than the last day of the calendar year in which his or her 75th birthday occurs. The Independent Trustees may waive this mandatory retirement age policy with respect to individual Trustees. The executive officers and Advisory Board Members hold office without limit in time, except that any officer and Advisory Board Member may resign or may be removed by a vote of a majority of the Trustees at any regular meeting or any special meeting of the Trustees. Except as indicated, each individual has held the office shown or other offices in the same company for the past five years.
Experience, Skills, Attributes, and Qualifications of the Fund's Trustees. The Governance and Nominating Committee has adopted a statement of policy that describes the experience, qualifications, attributes, and skills that are necessary and desirable for potential Independent Trustee candidates (Statement of Policy). The Board believes that each Trustee satisfied at the time he or she was initially elected or appointed a Trustee, and continues to satisfy, the standards contemplated by the Statement of Policy. The Governance and Nominating Committee also engages professional search firms to help identify potential Independent Trustee candidates who have the experience, qualifications, attributes, and skills consistent with the Statement of Policy. From time to time, additional criteria based on the composition and skills of the current Independent Trustees, as well as experience or skills that may be appropriate in light of future changes to board composition, business conditions, and regulatory or other developments, have also been considered by the professional search firms and the Governance and Nominating Committee. In addition, the Board takes into account the Trustees' commitment and participation in Board and committee meetings, as well as their leadership of standing and ad hoc committees throughout their tenure.
In determining that a particular Trustee was and continues to be qualified to serve as a Trustee, the Board has considered a variety of criteria, none of which, in isolation, was controlling. The Board believes that, collectively, the Trustees have balanced and diverse experience, qualifications, attributes, and skills, which allow the Board to operate effectively in governing the fund and protecting the interests of shareholders. Information about the specific experience, skills, attributes, and qualifications of each Trustee, which in each case led to the Board's conclusion that the Trustee should serve (or continue to serve) as a trustee of the fund, is provided below.
Annual Report
Board Structure and Oversight Function. James C. Curvey is an interested person (as defined in the 1940 Act) and currently serves as Acting Chairman. The Trustees have determined that an interested Chairman is appropriate and benefits shareholders because an interested Chairman has a personal and professional stake in the quality and continuity of services provided to the fund. Independent Trustees exercise their informed business judgment to appoint an individual of their choosing to serve as Chairman, regardless of whether the Trustee happens to be independent or a member of management. The Independent Trustees have determined that they can act independently and effectively without having an Independent Trustee serve as Chairman and that a key structural component for assuring that they are in a position to do so is for the Independent Trustees to constitute a substantial majority for the Board. The Independent Trustees also regularly meet in executive session. Ned C. Lautenbach serves as Chairman of the Independent Trustees and as such (i) acts as a liaison between the Independent Trustees and management with respect to matters important to the Independent Trustees and (ii) with management prepares agendas for Board meetings.
Fidelity funds are overseen by different Boards of Trustees. The fund's Board oversees Fidelity's equity and high income funds and another Board oversees Fidelity's investment-grade bond, money market, and asset allocation funds. The asset allocation funds may invest in Fidelity funds overseen by the fund's Board. The use of separate Boards, each with its own committee structure, allows the Trustees of each group of Fidelity funds to focus on the unique issues of the funds they oversee, including common research, investment, and operational issues. On occasion, the separate Boards establish joint committees to address issues of overlapping consequences for the Fidelity funds overseen by each Board.
The Trustees operate using a system of committees to facilitate the timely and efficient consideration of all matters of importance to the Trustees, the fund, and fund shareholders and to facilitate compliance with legal and regulatory requirements and oversight of the fund's activities and associated risks. The Board, acting through its committees, has charged FMR and its affiliates with (i) identifying events or circumstances the occurrence of which could have demonstrably adverse effects on the fund's business and/or reputation; (ii) implementing processes and controls to lessen the possibility that such events or circumstances occur or to mitigate the effects of such events or circumstances if they do occur; and (iii) creating and maintaining a system designed to evaluate continuously business and market conditions in order to facilitate the identification and implementation processes described in (i) and (ii) above. Because the day-to-day operations and activities of the fund are carried out by or through FMR, its affiliates and other service providers, the fund's exposure to risks is mitigated but not eliminated by the processes overseen by the Trustees. While each of the Board's committees has responsibility for overseeing different aspects of the fund's activities, oversight is exercised primarily through the Operations, Audit, and Compliance Committees. Appropriate personnel, including but not limited to the fund's Chief Compliance Officer (CCO), FMR's internal auditor, the independent accountants, the fund's Treasurer and portfolio management personnel, make periodic reports to the Board's committees, as appropriate. The responsibilities of each committee, including their oversight responsibilities, are described further under "Standing Committees of the Fund's Trustees."
Annual Report
Trustees and Officers - continued
The fund's Statement of Additional Information (SAI) includes more information about the Trustees. To request a free copy, call Fidelity at 1-800-544-8544.
Interested Trustees*:
Correspondence intended for each Trustee who is an interested person may be sent to Fidelity Investments, 82 Devonshire Street, Boston, Massachusetts 02109.
Name, Age; Principal Occupations and Other Relevant Experience+ |
James C. Curvey (76) |
| Year of Election or Appointment: 2007
Mr. Curvey is Trustee and Acting Chairman of the Board of Trustees of certain Trusts. Mr. Curvey also serves as Trustee (2007-present) of other investment companies advised by FMR. Mr. Curvey is a Director of Fidelity Investments Money Management, Inc. (2009-present), Director of Fidelity Research & Analysis Co. (2009-present) and Director of FMR and FMR Co., Inc. (2007-present). Mr. Curvey is also Vice Chairman (2007-present) and Director of FMR LLC. In addition, Mr. Curvey serves as an Overseer for the Boston Symphony Orchestra and a member of the Trustees of Villanova University. Previously, Mr. Curvey was the Vice Chairman (2006-2007) and Director (2000-2007) of FMR Corp. |
Ronald P. O'Hanley (54) |
| Year of Election or Appointment: 2011
Mr. O'Hanley is Director of FMR Co., Inc. (2010-present), Director of Fidelity Investments Money Management, Inc. (2010-present), Director of Fidelity Research & Analysis Company (2010-present), President of Fidelity Asset Management and Corporate Services and a member of Fidelity's Executive Committee (2010-present). Previously, Mr. O'Hanley served as President and Chief Executive Officer of BNY Mellon Asset Management (2007-2010). Mr. O'Hanley also served as Vice Chairman of Bank New York Mellon Corp. and a member of that firm's Executive Committee. Prior to the 2007 merger of The Bank of New York and Mellon Financial Corporation, he was Vice Chairman of Mellon Financial Corporation and President and Chief Executive Officer of Mellon Asset Management. He joined Mellon in February 1997. Mr. O'Hanley currently serves as Chairman of the Boston Public Library Foundation Board of Directors and sits on the Board of Directors of Beth Israel Deaconess Medical Center, the Board of Trustees of the Marine Biological Laboratory and the Advisory Board of the Maxwell School of Citizenship and Public Administration at Syracuse University. Mr. O'Hanley also chairs the Council on Asset Management for the Financial Services Roundtable and is a member of the Board of Directors of Institutional Investor's U.S. Institute. |
* Trustees have been determined to be "Interested Trustees" by virtue of, among other things, their affiliation with the trust or various entities under common control with FMR.
+ The information above includes each Trustee's principal occupation during the last five years and other information relating to the experience, attributes, and skills relevant to each Trustee's qualifications to serve as a Trustee, which led to the conclusion that each Trustee should serve as a Trustee for the fund.
Annual Report
Trustees and Officers - continued
Independent Trustees:
Correspondence intended for each Independent Trustee (that is, the Trustees other than the Interested Trustees) may be sent to Fidelity Investments, P.O. Box 55235, Boston, Massachusetts 02205-5235.
Name, Age; Principal Occupations and Other Relevant Experience+ |
Dennis J. Dirks (63) |
| Year of Election or Appointment: 2005 Prior to his retirement in May 2003, Mr. Dirks was Chief Operating Officer and a member of the Board of The Depository Trust & Clearing Corporation (DTCC). He also served as President, Chief Operating Officer, and Board member of The Depository Trust Company (DTC) and President and Board member of the National Securities Clearing Corporation (NSCC). In addition, Mr. Dirks served as Chief Executive Officer and Board member of the Government Securities Clearing Corporation, Chief Executive Officer and Board member of the Mortgage-Backed Securities Clearing Corporation, as a Trustee and a member of the Finance Committee of Manhattan College (2005-2008), and as a Trustee and a member of the Finance Committee of AHRC of Nassau County (2006-2008). Mr. Dirks is a member of the Independent Directors Council (IDC) Governing Council (2010-Present) and Board of Directors for The Brookville Center for Children's Services, Inc. (2009-present). |
Alan J. Lacy (57) |
| Year of Election or Appointment: 2008 Mr. Lacy serves as Senior Adviser (2007-present) of Oak Hill Capital Partners, L.P. (private equity). Mr. Lacy also served as Chief Executive Officer (2000-2005) and Vice Chairman (2005-2006) of Sears Holdings Corporation and Sears, Roebuck and Co. (retail). In addition, Mr. Lacy serves as a member of the Board of Directors of Dave & Buster's, Inc. (restaurant and entertainment complexes, 2010-present), The Hillman Companies, Inc. (hardware wholesalers, 2010-present), and Bristol-Myers Squibb Company (global pharmaceuticals, 2007-present). Mr. Lacy is a member of the Board of Trustees of The National Parks Conservation Association (2006-Present). Previously, Mr. Lacy served as Chairman of the Board of Trustees of the National Parks Conservation Association (2008-2011) and as a member of the Board of Directors for the Western Union Company (global money transfer, 2006-2011). |
Ned C. Lautenbach (67) |
| Year of Election or Appointment: 2000 Mr. Lautenbach is Chairman of the Independent Trustees of the Equity and High Income Funds (2006-present). Mr. Lautenbach currently serves as the Lead Director of the Eaton Corporation Board of Directors (diversified industrial, 1997-present). Mr. Lautenbach is also a member of the Board of Directors of the Philharmonic Center for the Arts in Naples, Florida (1999-present); a member of the Board of Trustees of Fairfield University (2005-present); and a member of the Council on Foreign Relations (1994-present). Previously, Mr. Lautenbach was a Partner/Advisory Partner at Clayton, Dubilier & Rice, LLC (private equity investment, 1998-2010), as well as a Director of Sony Corporation (2006-2007). |
Joseph Mauriello (66) |
| Year of Election or Appointment: 2008 Prior to his retirement in January 2006, Mr. Mauriello served in numerous senior management positions including Deputy Chairman and Chief Operating Officer (2004-2005), and Vice Chairman of Financial Services (2002-2004) of KPMG LLP US (professional services, 1965-2005). Mr. Mauriello currently serves as a member of the Board of Directors of XL Group plc. (global insurance and re-insurance, 2006-present) and of Arcadia Resources Inc. (health care services and products, 2007-present). Previously, Mr. Mauriello served as a Director of the Hamilton Funds of the Bank of New York (2006-2007). |
Robert W. Selander (60) |
| Year of Election or Appointment: 2011
Previously, Mr. Selander served as a Member of the Advisory Board of Fidelity's Equity and High Income Funds (2011), Executive Vice Chairman (2010), Chief Executive Officer (2009-2010), and President and Chief Executive Officer (1997-2009) of Mastercard, Inc. |
Cornelia M. Small (67) |
| Year of Election or Appointment: 2005 Ms. Small is a member of the Board of Directors of the Teagle Foundation (2009-present). Ms. Small is also a member of the Investment Committee, and Chair (2008-present) and a member of the Board of Trustees of Smith College. In addition, Ms. Small serves on the Investment Committee of the Berkshire Taconic Community Foundation (2008-present). Previously, Ms. Small served as Chairperson of the Investment Committee (2002-2008) of Smith College. In addition, Ms. Small served as Chief Investment Officer, Director of Global Equity Investments, and a member of the Board of Directors of Scudder, Stevens & Clark and Scudder Kemper Investments. |
William S. Stavropoulos (72) |
| Year of Election or Appointment: 2002 Mr. Stavropoulos is Vice Chairman of the Independent Trustees of the Equity and High Income Funds (2006-present). Mr. Stavropoulos serves as President and Founder of the Michigan Baseball Foundation, the Great Lakes Loons (2007-present). Mr. Stavropoulos is Chairman Emeritus of the Board of Directors of The Dow Chemical Company, where he previously served in numerous senior management positions, including President, CEO (1995-2000; 2002-2004), Chairman of the Executive Committee (2000-2006), and as a member of the Board of Directors (1990-2006). Currently, Mr. Stavropoulos is Chairman of Univar (global distributor of commodity and specialty chemicals, 2010-present), a Director of Teradata Corporation (data warehousing and technology solutions, 2008-present), Chemical Financial Corporation, Maersk Inc. (industrial conglomerate), Tyco International, Inc. (multinational manufacturing and services, 2007-present), and a member of the Advisory Board for Metalmark Capital (private equity investment, 2005-present). Mr. Stavropoulos is a special advisor to Clayton, Dubilier & Rice, LLC (private equity investment). In addition, Mr. Stavropoulos is a member of the University of Notre Dame Advisory Council for the College of Science. |
David M. Thomas (62) |
| Year of Election or Appointment: 2008 Previously, Mr. Thomas served as Executive Chairman (2005-2006) and Chairman and Chief Executive Officer (2000-2005) of IMS Health, Inc. (pharmaceutical and healthcare information solutions). In addition, Mr. Thomas serves as a member of the Board of Directors of Fortune Brands, Inc. (consumer products), and Interpublic Group of Companies, Inc. (marketing communication, 2004-present). |
Michael E. Wiley (60) |
| Year of Election or Appointment: 2008 Mr. Wiley also serves as a Director of Asia Pacific Exploration Consolidated (international oil and gas exploration and production, 2008-present). Mr. Wiley serves as a Director of Tesoro Corporation (independent oil refiner and marketer, 2005-present), and a Director of Bill Barrett Corporation (exploration and production, 2005-present). In addition, Mr. Wiley also serves as a Director of Post Oak Bank (privately-held bank, 2004-present). Previously, Mr. Wiley served as a member of the Board of Trustees of the University of Tulsa (2000-2006; 2007-2010), as a Senior Energy Advisor of Katzenbach Partners, LLC (consulting, 2006-2007), as an Advisory Director of Riverstone Holdings (private investment), Chairman, President, and CEO of Baker Hughes, Inc. (oilfield services, 2000-2004), and as Director of Spinnaker Exploration Company (exploration and production, 2001-2005). |
Annual Report
+ The information above includes each Trustee's principal occupation during the last five years and other information relating to the experience, attributes, and skills relevant to each Trustee's qualifications to serve as a Trustee, which led to the conclusion that each Trustee should serve as a Trustee for the fund.
Advisory Board Members and Executive Officers:
Correspondence intended for each executive officer, Edward C. Johnson 3d, and Peter S. Lynch may be sent to Fidelity Investments, 82 Devonshire Street, Boston, Massachusetts 02109.
Name, Age; Principal Occupation |
Edward C. Johnson 3d (81) |
| Year of Election or Appointment: 2011 Member of the Advisory Board of Fidelity's Equity and High Income Funds. Mr. Johnson serves as Chief Executive Officer, Chairman, and a Director of FMR LLC, and also serves as Chairman and Director of FIL Limited. Previously, Mr. Johnson served as a Trustee and Chairman of the Board of certain Fidelity Trusts, Chairman and a Director of FMR, Chairman and a Director of FMR Co., Inc., and President of FMR LLC (2006-2007). |
Peter S. Lynch (67) |
| Year of Election or Appointment: 2003 Member of the Advisory Board of Fidelity's Equity and High Income Funds. Mr. Lynch is Vice Chairman and a Director of FMR and FMR Co., Inc. In addition, Mr. Lynch serves as a Trustee of Boston College and as the Chairman of the Inner-City Scholarship Fund. Previously, Mr. Lynch served on the Special Olympics International Board of Directors (1997-2006). |
Kenneth B. Robins (41) |
| Year of Election or Appointment: 2008 President and Treasurer of Fidelity's Equity and High Income Funds. Mr. Robins also serves as President and Treasurer (2010-present) and Assistant Treasurer (2009-present) of other Fidelity funds and is an employee of Fidelity Investments (2004-present). Previously, Mr. Robins served as Deputy Treasurer of the Fidelity funds (2005-2008) and Treasurer and Chief Financial Officer of The North Carolina Capital Management Trust: Cash and Term Portfolios (2006-2008). |
Bruce T. Herring (45) |
| Year of Election or Appointment: 2006 Vice President of certain Equity Funds. Mr. Herring also serves as Chief Investment Officer and Director of Fidelity Management & Research (U.K.) Inc. (2010-present) and Group Chief Investments Officer of FMR. Previously, Mr. Herring served as Vice President (2005-2006) and Senior Vice President (2006-2007) of Fidelity Management & Research Company, Vice President of FMR Co., Inc. (2001-2007) and as a portfolio manager for Fidelity U.S. Equity Funds. |
Brian B. Hogan (46) |
| Year of Election or Appointment: 2009 Vice President of Equity and High Income Funds. Mr. Hogan also serves as President of FMR's Equity Division (2009-present). Previously, Mr. Hogan served as Senior Vice President, Equity Research of FMR (2006-2009) and as a portfolio manager. |
Scott C. Goebel (43) |
| Year of Election or Appointment: 2008 Secretary and Chief Legal Officer (CLO) of the Fidelity funds. Mr. Goebel also serves as Secretary of Fidelity Investments Money Management, Inc. (FIMM) (2010-present) and Fidelity Research and Analysis Company (FRAC) (2010-present); Secretary and CLO of The North Carolina Capital Management Trust: Cash and Term Portfolios (2008-present); General Counsel, Secretary, and Senior Vice President of FMR (2008-present) and FMR Co., Inc. (2008-present); employed by FMR LLC or an affiliate (2001-present); Chief Legal Officer of Fidelity Management & Research (Hong Kong) Limited (2008-present) and Assistant Secretary of Fidelity Management & Research (Japan) Inc. (2008-present), and Fidelity Management & Research (U.K.) Inc. (2008-present). Previously, Mr. Goebel served as Assistant Secretary of FIMM (2008-2010), FRAC (2008-2010), and the Funds (2007-2008) and as Vice President and Secretary of Fidelity Distributors Corporation (FDC) (2005-2007). |
William C. Coffey (42) |
| Year of Election or Appointment: 2009 Assistant Secretary of Fidelity's Equity and High Income Funds. Mr. Coffey also serves as Senior Vice President and Deputy General Counsel of FMR LLC (2010-present), and is an employee of Fidelity Investments. Previously, Mr. Coffey served as Vice President and Associate General Counsel of FMR LLC (2005-2009). |
Holly C. Laurent (57) |
| Year of Election or Appointment: 2008 Anti-Money Laundering (AML) Officer of the Fidelity funds. Ms. Laurent also serves as AML Officer of The North Carolina Capital Management Trust: Cash and Term Portfolios (2008-present) and is an employee of Fidelity Investments. Previously, Ms. Laurent was Senior Vice President and Head of Legal for Fidelity Business Services India Pvt. Ltd. (2006-2008), and Senior Vice President, Deputy General Counsel and Group Head for FMR LLC (2005-2006). |
Christine Reynolds (52) |
| Year of Election or Appointment: 2008 Chief Financial Officer of the Fidelity funds. Ms. Reynolds became President of Fidelity Pricing and Cash Management Services (FPCMS) in August 2008. Ms. Reynolds served as Chief Operating Officer of FPCMS (2007-2008). Previously, Ms. Reynolds served as President, Treasurer, and Anti-Money Laundering officer of the Fidelity funds (2004-2007). |
Kenneth A. Rathgeber (64) |
| Year of Election or Appointment: 2004 Chief Compliance Officer of Fidelity's Equity and High Income Funds. Mr. Rathgeber is Chief Compliance Officer of Fidelity Management & Research (Hong Kong) Limited (2008-present), Fidelity Management & Research (Japan) Inc. (2008-present), FMR (2005-present), FMR Co., Inc. (2005-present), Fidelity Management & Research (U.K.) Inc. (2005-present), Fidelity Research & Analysis Company (2005-present), Fidelity Investments Money Management, Inc. (2005-present), Pyramis Global Advisors, LLC (2005-present), and Strategic Advisers, Inc. (2005-present). |
Jeffrey S. Christian (49) |
| Year of Election or Appointment: 2009 Deputy Treasurer of the Fidelity funds. Mr. Christian is an employee of Fidelity Investments. Previously, Mr. Christian served as Chief Financial Officer (2008-2009) of certain Fidelity funds and Senior Vice President of Fidelity Pricing and Cash Management Services (FPCMS) (2004-2009). |
Bryan A. Mehrmann (50) |
| Year of Election or Appointment: 2005 Deputy Treasurer of the Fidelity funds. Mr. Mehrmann is an employee of Fidelity Investments. |
Adrien E. Deberghes (43) |
| Year of Election or Appointment: 2008 Deputy Treasurer of Fidelity's Equity and High Income Funds. Mr. Deberghes also serves as Assistant Treasurer of other Fidelity funds (2010-present) and is an employee of Fidelity Investments (2008-present). Previously, Mr. Deberghes served as Senior Vice President of Mutual Fund Administration at State Street Corporation (2007-2008), Senior Director of Mutual Fund Administration at Investors Bank & Trust (2005-2007), and Director of Finance for Dunkin' Brands (2000-2005). |
Stephanie J. Dorsey (42) |
| Year of Election or Appointment: 2010 Assistant Treasurer of Fidelity's Equity and High Income Funds. Ms. Dorsey also serves as Deputy Treasurer of other Fidelity funds (2008-present) and is an employee of Fidelity Investments (2008-present). Previously, Ms. Dorsey served as Treasurer (2004-2008) of the JPMorgan Mutual Funds and Vice President (2004-2008) of JPMorgan Chase Bank. |
John R. Hebble (53) |
| Year of Election or Appointment: 2009 Assistant Treasurer of Fidelity's Equity and High Income Funds. Mr. Hebble also serves as President (2011-present), Treasurer, and Chief Financial Officer of The North Carolina Capital Management Trust: Cash and Term Portfolios (2008-present), President and Treasurer of other Fidelity funds (2008-present) and is an employee of Fidelity Investments. |
Gary W. Ryan (52) |
| Year of Election or Appointment: 2005 Assistant Treasurer of the Fidelity funds. Mr. Ryan is an employee of Fidelity Investments. Previously, Mr. Ryan served as Vice President of Fund Reporting in Fidelity Pricing and Cash Management Services (FPCMS) (1999-2005). |
Jonathan Davis (43) |
| Year of Election or Appointment: 2010 Assistant Treasurer of the Fidelity funds. Mr. Davis is an employee of Fidelity Investments. Previously, Mr. Davis served as Vice President and Associate General Counsel of FMR LLC (2003-2010). |
Annual Report
A total of 0.03% of the dividends distributed during the fiscal year was derived from interest on U.S. Government securities which is generally exempt from state income tax.
Growth & Income designates 100% of the dividends distributed during the fiscal year as qualifying for the dividends-received deduction for corporate shareholders.
Growth & Income designates 100% of the dividends distributed during the fiscal year as amounts which may be taken into account as a dividend for purposes of the maximum rate under section 1(h)(11) of the Internal Revenue Code.
The fund will notify shareholders in January 2012 of amounts for use in preparing 2011 income tax returns.
Annual Report
Board Approval of Investment Advisory Contracts and Management Fees
Fidelity Growth & Income Portfolio
Each year, the Board of Trustees, including the Independent Trustees (together, the Board), votes on the renewal of the management contract and sub-advisory agreements (together, the Advisory Contracts) for the fund. The Board, assisted by the advice of fund counsel and Independent Trustees' counsel, requests and considers a broad range of information relevant to the renewal of the Advisory Contracts throughout the year.
The Board meets regularly and considers at each of its meetings factors that are relevant to its annual consideration of the renewal of the fund's Advisory Contracts, including the services and support provided to the fund and its shareholders. The Board has established various standing committees, each composed of Independent Trustees with varying backgrounds, to which the Board has assigned specific subject matter responsibilities in order to enhance effective decision-making by the Board. The Board, acting directly and through its Committees, requests and receives information concerning the annual consideration of the renewal of the fund's Advisory Contracts. The Board also meets as needed to consider matters specifically related to the Board's annual consideration of the renewal of Advisory Contracts. Members of the Board may also meet with trustees of other Fidelity funds through ad hoc joint committees to discuss certain matters relevant to the Fidelity funds.
At its July 2011 meeting, the Board of Trustees, including the Independent Trustees, unanimously determined to renew the fund's Advisory Contracts. In reaching its determination, the Board considered all factors it believed relevant, including (i) the nature, extent, and quality of the services to be provided to the fund and its shareholders (including the investment performance of the fund); (ii) the competitiveness of the fund's management fee and total expense ratio; (iii) the total costs of the services to be provided by and the profits to be realized by Fidelity from its relationship with the fund; (iv) the extent to which economies of scale would be realized as the fund grows; and (v) whether fee levels reflect these economies of scale, if any, for the benefit of fund shareholders.
In considering whether to renew the Advisory Contracts for the fund, the Board reached a determination, with the assistance of fund counsel and Independent Trustees' counsel and through the exercise of its business judgment, that the renewal of the Advisory Contracts is in the best interests of the fund and its shareholders and that the compensation payable under the Advisory Contracts is fair and reasonable. The Board's decision to renew the Advisory Contracts was not based on any single factor, but rather was based on a comprehensive consideration of all the information provided to the Board at its meetings throughout the year. The Board, in reaching its determination to renew the Advisory Contracts, is aware that shareholders in the fund have a broad range of investment choices available to them, including a wide choice among mutual funds offered by Fidelity's competitors, and that the fund's shareholders, who have the opportunity to review and weigh the disclosure provided by the fund in its prospectus and other public disclosures, have chosen to invest in this fund, managed by Fidelity.
Annual Report
Nature, Extent, and Quality of Services Provided. The Board considered the staffing within the investment adviser, FMR, and the sub-advisers (together, the Investment Advisers), including the backgrounds of the fund's investment personnel and the fund's investment objective and discipline. The Independent Trustees also had discussions with senior management of Fidelity's investment operations and investment groups. The Board considered the structure of the portfolio manager compensation program and whether this structure provides appropriate incentives to act in the best interests of the fund.
Resources Dedicated to Investment Management and Support Services. The Board and the Fund Oversight and Research Committees reviewed the general qualifications and capabilities of the Investment Advisers' investment staff, including its size, education, experience, and resources, as well as the Investment Advisers' approach to recruiting, training, managing, and compensating investment personnel. The Board also noted that FMR has devoted increased resources to non-U.S. offices. The Board noted that Fidelity's analysts have extensive resources, tools and capabilities which allow them to conduct sophisticated quantitative and fundamental analysis, as well as credit analysis of issuers, counterparties and enhancers. The Board also believes that Fidelity's investment professionals have sufficient access to global information and data so as to provide competitive investment results over time, and that those professionals also have access to sophisticated tools which permit them to assess portfolio construction and risk and performance attribution characteristics continuously, as well as to transmit new information and research conclusions rapidly around the world. Additionally, in their deliberations, the Board considered the Investment Advisers' trading capabilities and resources which are an integral part of the investment management process.
Shareholder and Administrative Services. The Board considered (i) the nature, extent, quality, and cost of advisory, administrative, and shareholder services performed by the Investment Advisers and their affiliates under the Advisory Contracts and under separate agreements covering transfer agency, pricing and bookkeeping, and securities lending services for the fund; (ii) the nature and extent of the investment adviser's supervision of third party service providers, principally custodians and subcustodians; and (iii) the resources devoted to, and the record of compliance with, the fund's compliance policies and procedures. The Board also reviewed the allocation of fund brokerage, including allocations to brokers affiliated with the Investment Advisers, the use of brokerage commissions to pay fund expenses, and the use of "soft" commission dollars to pay for research services.
The Board noted that the growth of fund assets over time across the complex allows Fidelity to reinvest in the development of services designed to enhance the value or convenience of the Fidelity funds as investment vehicles. These services include 24-hour access to account information and market information through telephone representatives and over the Internet, investor education materials and asset allocation tools, and the expanded availability of Fidelity Investor Centers, with 35 new branches opening since 2010.
Annual Report
Board Approval of Investment Advisory Contracts and
Management Fees - continued
Investment in a Large Fund Family. The Board considered the benefits to shareholders of investing in a Fidelity fund, including the benefits of investing in a fund that is part of a large family of funds offering a variety of investment disciplines and providing a large variety of mutual fund investor services. The Board noted that Fidelity had taken, or had made recommendations that resulted in the Fidelity funds taking, a number of actions over the previous year that benefited particular funds, including (i) continuing to dedicate additional resources to investment research and support of the senior management team that oversees asset management; (ii) rationalizing product lines through the mergers of six funds into other funds; (iii) continuing to migrate the Freedom Funds to dedicated lower cost underlying funds; (iv) obtaining shareholder approval to broaden the investment strategies for Fidelity Consumer Finance Portfolio, Fidelity Emerging Asia Fund, and Fidelity Environment and Alternative Energy Portfolio; (v) contractually agreeing to reduce the management fees and impose other expense limitations on Spartan® 500 Index Fund and U.S. Bond Index Fund in connection with launching new institutional classes of these funds; (vi) changing the name, primary and supplemental benchmarks, and investment policies of Fidelity Global Strategies Fund to support the fund's flexible investment mandate and global orientation; and (vii) reducing the transfer agency account fee rates on certain accounts.
Investment Performance. The Board considered whether the fund has operated in accordance with its investment objective, as well as its record of compliance with its investment restrictions. It also reviewed the fund's absolute investment performance for each class, as well as the fund's relative investment performance for each class measured over multiple periods against (i) a broad-based securities market index, and (ii) a peer group of mutual funds deemed appropriate by Fidelity and reviewed by the Board. The following charts considered by the Board show, over the one-, three-, and five-year periods ended December 31, 2010, as available, the cumulative total returns of Class K and the retail class of the fund, the cumulative total returns of a broad-based securities market index ("benchmark"), and a range of cumulative total returns of a peer group of mutual funds identified by Morningstar, Inc. as having an investment style similar to that of the fund based on underlying portfolio holdings. The box within each chart shows the 25th percentile return (bottom of box) and the 75th percentile return (top of box) of the peer group. Returns shown above the box are in the first quartile and returns shown below the box are in the fourth quartile. The percentage beaten numbers noted below each chart correspond to the percentile box and represent the percentage of funds in the peer group whose performance was equal to or lower than that of the class indicated.
Annual Report
Fidelity Growth & Income Portfolio
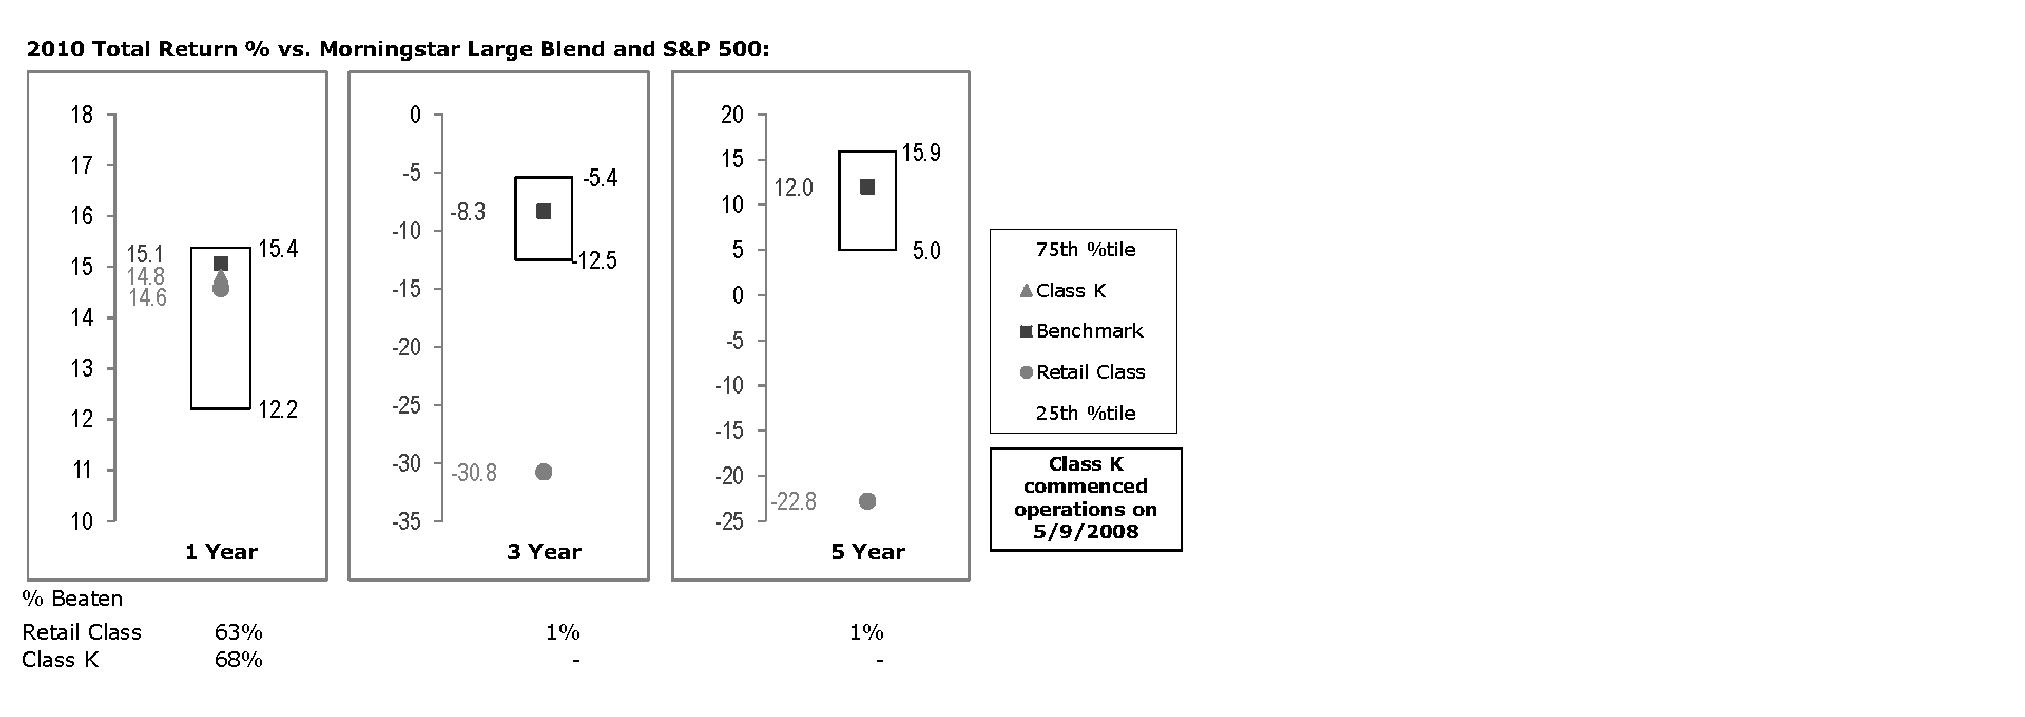
The Board reviewed the fund's relative investment performance against its peer group and noted that the performance of the retail class of the fund (the class with the longer performance record) was in the second quartile for the one-year period and the fourth quartile for the three- and five-year periods. The Board also noted that the investment performance of the fund was lower than its benchmark for all the periods shown. The Board considered that the variations in performance between the fund's classes reflect the variations in class expenses, which result in lower performance for the higher expense class. The Board also reviewed the fund's performance since inception as well as performance in the current year.
Based on its review, the Board concluded that the nature, extent, and quality of services provided to the fund under the Advisory Contracts should benefit the fund's shareholders.
Competitiveness of Management Fee and Total Expense Ratio. The Board considered the fund's management fee and total expense ratio compared to "mapped groups" of competitive funds and classes. Fidelity creates "mapped groups" by combining similar Lipper investment objective categories that have comparable management fee characteristics. Combining Lipper investment objective categories aids the Board's management fee and total expense ratio comparisons by broadening the competitive group used for comparison and by reducing the number of universes to which various Fidelity funds are compared.
Management Fee. The Board considered two proprietary management fee comparisons for the 12-month periods shown in the chart below. The group of Lipper funds used by the Board for management fee comparisons is referred to below as the "Total Mapped Group." The Total Mapped Group comparison focuses on a fund's standing relative to the total universe of comparable funds available to investors in terms of gross management fees before expense reimbursements or caps. "TMG %" represents the percentage of funds in the Total Mapped Group that had management fees that were lower than the fund's. For example, a TMG % of 13% means that 87% of the funds in the Total Mapped Group had higher management fees than the fund. The "Asset-Size Peer Group" (ASPG) comparison focuses on a fund's standing relative to non-Fidelity funds similar in size to the fund within the Total Mapped Group. The ASPG represents at least 15% of the funds in the Total Mapped Group with comparable asset size and management fee characteristics, subject to a minimum of 50 funds (or all funds in the Total Mapped Group if fewer than 50). Additional information, such as the ASPG quartile in which the fund's management fee ranked, is also included in the chart and considered by the Board.
Annual Report
Board Approval of Investment Advisory Contracts and
Management Fees - continued
Fidelity Growth & Income Portfolio
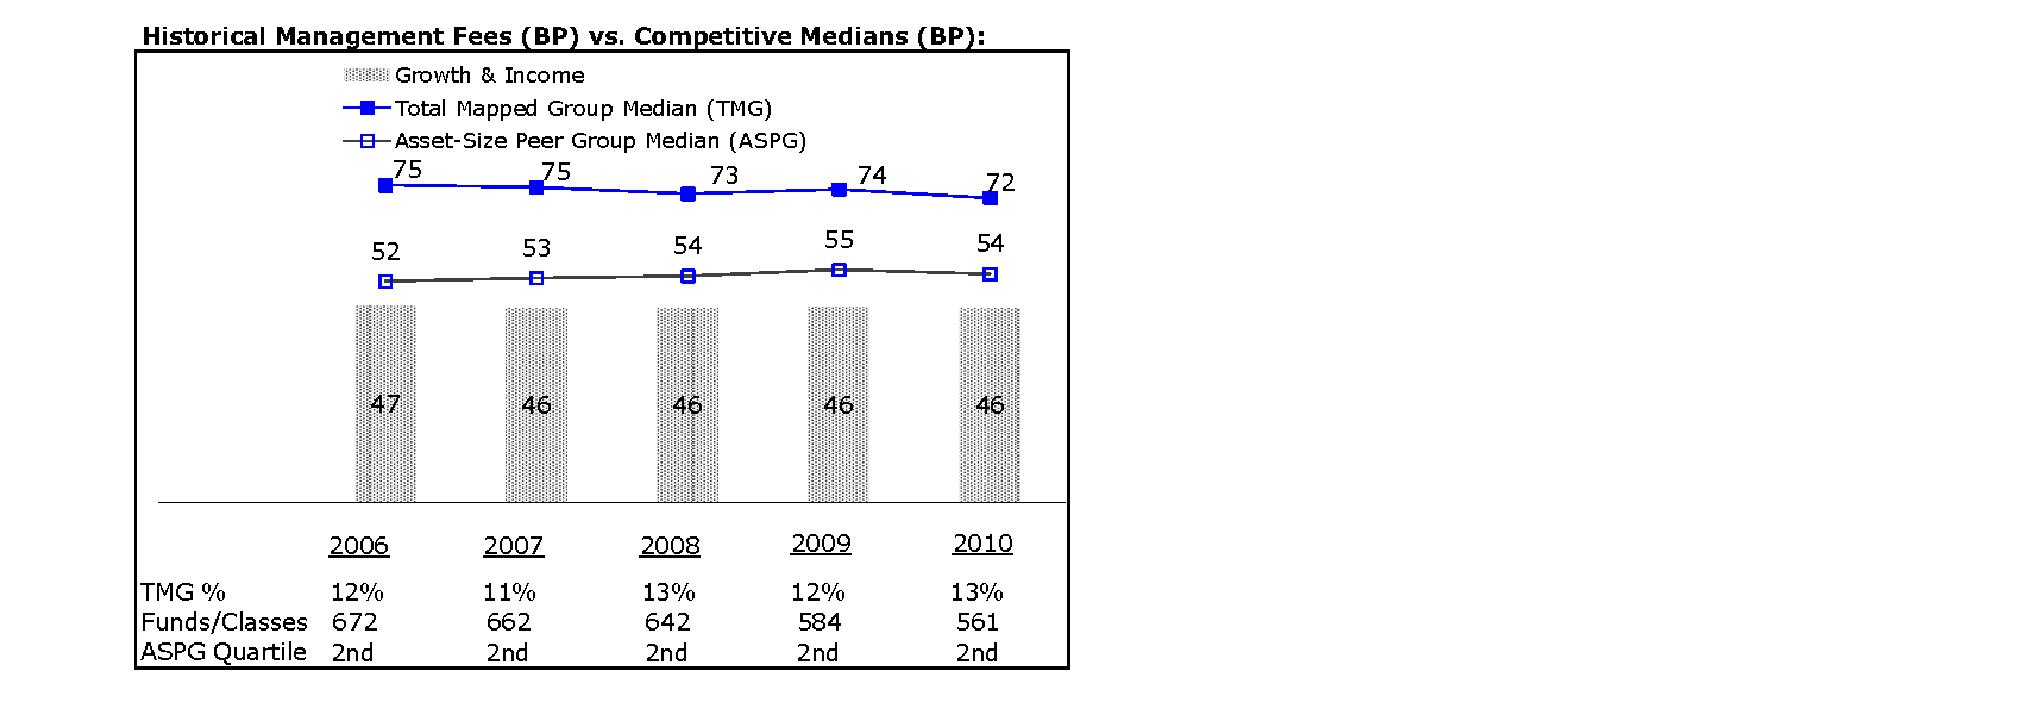
The Board noted that the fund's management fee ranked below the median of its Total Mapped Group and below the median of its ASPG for 2010.
Based on its review, the Board concluded that the fund's management fee is fair and reasonable in light of the services that the fund receives and the other factors considered.
Total Expense Ratio. In its review of each class's total expense ratio, the Board considered the fund's management fee as well as other fund or class expenses, as applicable, such as transfer agent fees, pricing and bookkeeping fees, and custodial, legal, and audit fees. The Board also noted the effects of any waivers and reimbursements on fees and expenses. As part of its review, the Board also considered the current and historical total expense ratios of each class of the fund compared to competitive fund median expenses. Each class of the fund is compared to those funds and classes in the Total Mapped Group (used by the Board for management fee comparisons) that have a similar sales load structure.
Annual Report
The Board noted that the total expense ratio of each class ranked below its competitive median for 2010. The Board considered that various factors, including 12b-1 fees, positive or negative performance adjustments, and relatively higher other expenses in the case of small fund size, can affect total expense ratios.
Fees Charged to Other Fidelity Clients. The Board also considered Fidelity fee structures and other information with respect to clients of FMR and its affiliates, such as other mutual funds advised or subadvised by FMR or its affiliates, pension plan clients, and other institutional clients. In March 2010, the Board created an ad hoc joint committee with the board of other Fidelity funds (the Committee) to review and compare Fidelity's institutional investment advisory business with its business of providing services to the Fidelity funds, including the differences in services provided, fees charged, and costs incurred, as well as competition in their respective marketplaces.
Based on its review of total expense ratios and fees charged to other Fidelity clients, the Board concluded that the total expense ratio of each class of the fund was reasonable in light of the services that the fund and its shareholders receive and the other factors considered, including the findings of the Committee.
Costs of the Services and Profitability. The Board considered the revenues earned and the expenses incurred by Fidelity in conducting the business of developing, marketing, distributing, managing, administering and servicing the fund and its shareholders. The Board also considered the level of Fidelity's profits in respect of all the Fidelity funds.
On an annual basis, FMR presents to the Board Fidelity's profitability for the fund. Fidelity calculates the profitability for each fund, as well as aggregate profitability for groups of Fidelity funds and all Fidelity funds, using a series of detailed revenue and cost allocation methodologies which originate with the books and records of Fidelity on which Fidelity's audited financial statements are based. The Audit Committee of the Board reviews any significant changes from the prior year's methodologies.
PricewaterhouseCoopers LLP (PwC), independent registered public accounting firm and auditor to Fidelity and certain Fidelity funds, has been engaged annually by the Board as part of the Board's assessment of Fidelity's profitability analysis. PwC's engagement includes the review and assessment of Fidelity's methodologies used in determining the revenues and expenses attributable to Fidelity's mutual fund business, and completion of agreed-upon procedures surrounding the mathematical accuracy of fund profitability and its conformity to allocation methodologies. After considering PwC's reports issued under the engagement and information provided by Fidelity, the Board concluded that while other allocation methods may also be reasonable, Fidelity's profitability methodologies are reasonable in all material respects.
Annual Report
Board Approval of Investment Advisory Contracts and
Management Fees - continued
The Board also reviewed Fidelity's non-fund businesses and fall-out benefits related to the mutual fund business as well as cases where Fidelity's affiliates may benefit from or be related to the fund's business.
The Board considered the costs of the services provided by and the profits realized by Fidelity in connection with the operation of the fund and was satisfied that the profitability was not excessive in the circumstances.
Economies of Scale. The Board considered whether there have been economies of scale in respect of the management of the Fidelity funds, whether the Fidelity funds (including the fund) have appropriately benefited from any such economies of scale, and whether there is potential for realization of any further economies of scale. The Board considered the extent to which the fund will benefit from economies of scale through increased services to the fund, through waivers or reimbursements, or through fee or expense reductions. The Board also noted that in 2009, it and the board of other Fidelity funds created an ad hoc committee (the Economies of Scale Committee) to analyze whether FMR attains economies of scale in respect of the management and servicing of the Fidelity funds, whether the Fidelity funds have appropriately benefited from such economies of scale, and whether there is potential for realization of any further economies of scale.
The Board recognized that the fund's management contract incorporates a "group fee" structure, which provides for lower group fee rates as total fund assets under FMR's management increase, and for higher group fee rates as total fund assets under FMR's management decrease. FMR calculates the group fee rates based on a tiered asset "breakpoint" schedule that varies based on asset class. The Board considered that the group fee is designed to deliver the benefits of economies of scale to fund shareholders when total Fidelity fund assets increase, even if assets of any particular fund are unchanged or have declined, because some portion of Fidelity's costs are attributable to services provided to all Fidelity funds, and all funds benefit if those costs can be allocated among more assets. The Board concluded that, given the group fee structure, fund shareholders will benefit from lower management fees as assets under FMR's management increase at the fund complex level, regardless of whether Fidelity achieves any such economies of scale.
The Board concluded, taking into account the analysis of the Economies of Scale Committee, that any potential economies of scale are being appropriately shared between fund shareholders and Fidelity.
Annual Report
Additional Information Requested by the Board. In order to develop fully the factual basis for consideration of the Fidelity funds' Advisory Contracts, the Board requested and received additional information on certain topics, including (i) fund performance trends, actions to be taken by FMR to improve certain funds' overall performance, and Fidelity's long-term strategies for certain funds; (ii) portfolio manager changes that have occurred during the past year and length of portfolio manager tenure for different categories of funds over time; (iii) Fidelity's compensation structure for portfolio managers and other key personnel and strategies for attracting and retaining non-investment personnel; (iv) the amount of the investment that each portfolio manager has made in the Fidelity fund(s) that he or she manages; (v) historical trends in Fidelity's realization of fall-out benefits; (vi) Fidelity's group fee structures and the rationale for the individual fee rates of certain funds; (vii) fund profitability methodology and the impact of certain factors on fund profitability results; (viii) trends regarding industry use of performance fee structures and Fidelity's compliance practices with respect to performance adjustment calculations; (ix) the fee structures in place for certain other Fidelity clients; and (x) explanations regarding the relative total expense ratios of certain funds and classes, total expense competitive trends, and actions that might be taken by FMR to reduce total expense ratios for certain funds and classes.
Based on its evaluation of all of the conclusions noted above, and after considering all factors it believed relevant, the Board ultimately concluded that the advisory fee structures are fair and reasonable, and that the fund's Advisory Contracts should be renewed.
Annual Report
Managing Your Investments
Fidelity offers several ways to conveniently manage your personal investments via your telephone or PC. You can access your account information, conduct trades and research your investments 24 hours a day.
By Phone
Fidelity Automated Service Telephone provides a single toll-free number to access account balances, positions, quotes and trading. It's easy to navigate the service, and on your first call, the system will help you create a personal identification number (PIN) for security.
(phone_graphic)
Fidelity Automated
Service Telephone (FAST®)
1-800-544-5555
Press
For mutual fund and brokerage trading.
For quotes.*
For account balances and holdings.
To review orders and mutual
fund activity.
To change your PIN.
To speak to a Fidelity representative.
By PC
Fidelity's web site on the Internet provides a wide range of information, including daily financial news, fund performance, interactive planning tools and news about Fidelity products and services.
(computer_graphic)
Fidelity's Web Site
www.fidelity.com
* When you call the quotes line, please remember that a fund's yield and return will vary and, except for money market funds, share price will also vary. This means that you may have a gain or loss when you sell your shares. There is no assurance that money market funds will be able to maintain a stable $1 share price; an investment in a money market fund is not insured or guaranteed by the U.S. government. Total returns are historical and include changes in share price, reinvestment of dividends and capital gains distributions, and the effects of any sales charges.
Annual Report
To Visit Fidelity
For directions and hours,
please call 1-800-544-9797.
Arizona
7001 West Ray Road
Chandler, AZ
15445 N. Scottsdale Road
Scottsdale, AZ
17550 North 75th Avenue
Glendale, AZ
5330 E. Broadway Blvd
Tucson, AZ
California
815 East Birch Street
Brea, CA
1411 Chapin Avenue
Burlingame, CA
851 East Hamilton Avenue
Campbell, CA
601 Larkspur Landing Circle
Larkspur, CA
2000 Avenue of the Stars
Los Angeles, CA
27101 Puerta Real
Mission Viejo, CA
73575 El Paseo
Palm Desert, CA
251 University Avenue
Palo Alto, CA
123 South Lake Avenue
Pasadena, CA
16656 Bernardo Ctr. Drive
Rancho Bernardo, CA
1220 Roseville Parkway
Roseville, CA
1740 Arden Way
Sacramento, CA
7676 Hazard Center Drive
San Diego, CA
11943 El Camino Real
San Diego, CA
8 Montgomery Street
San Francisco, CA
3793 State Street
Santa Barbara, CA
1200 Wilshire Boulevard
Santa Monica, CA
398 West El Camino Real
Sunnyvale, CA
111 South Westlake Blvd
Thousand Oaks, CA
21701 Hawthorne Boulevard
Torrance, CA
2001 North Main Street
Walnut Creek, CA
6326 Canoga Avenue
Woodland Hills, CA
2211 Michelson Drive
Irvine, CA
Colorado
281 East Flatiron Circle
Broomfield, CO
1625 Broadway
Denver, CO
9185 Westview Road
Lone Tree, CO
Connecticut
48 West Putnam Avenue
Greenwich, CT
265 Church Street
New Haven, CT
300 Atlantic Street
Stamford, CT
29 South Main Street
West Hartford, CT
1261 Post Road
Fairfield, CT
Delaware
400 Delaware Avenue
Wilmington, DE
Florida
175 East Altamonte Drive
Altamonte Springs, FL
1400 Glades Road
Boca Raton, FL
121 Alhambra Plaza
Coral Gables, FL
2948 N. Federal Highway
Ft. Lauderdale, FL
4671 Town Center Parkway
Jacksonville, FL
8880 Tamiami Trail, North
Naples, FL
230 Royal Palm Way
Palm Beach, FL
3501 PGA Boulevard
Palm Beach Gardens, FL
3550 Tamiami Trail, South
Sarasota, FL
1502 N. Westshore Blvd.
Tampa, FL
2465 State Road 7
Wellington, FL
Georgia
3242 Peachtree Road
Atlanta, GA
1000 Abernathy Road
Atlanta, GA
Illinois
One North LaSalle Street
Chicago, IL
401 North Michigan Avenue
Chicago, IL
One Skokie Valley Road
Highland Park, IL
1415 West 22nd Street
Oak Brook, IL
15105 S LaGrange Road
Orland Park, IL
1572 East Golf Road
Schaumburg, IL
1823 Freedom Drive
Naperville, IL
Indiana
8480 Keystone Crossing
Indianapolis, IN
Kansas
5400 College Boulevard
Overland Park, KS
Maine
Three Canal Plaza
Portland, ME
Maryland
7315 Wisconsin Avenue
Bethesda, MD
610 York Road
Towson, MD
Massachusetts
801 Boylston Street
Boston, MA
155 Congress Street
Boston, MA
300 Granite Street
Braintree, MA
44 Mall Road
Burlington, MA
238 Main Street
Cambridge, MA
200 Endicott Street
Danvers, MA
Fidelity Brokerage Services, Inc., 100 Summer St., Boston, MA 02110 Member NYSE/SIPC
Annual Report
405 Cochituate Road
Framingham, MA
551 Boston Turnpike
Shrewsbury, MA
Michigan
500 E. Eisenhower Pkwy.
Ann Arbor, MI
280 N. Old Woodward Ave.
Birmingham, MI
30200 Northwestern Hwy.
Farmington Hills, MI
43420 Grand River Avenue
Novi, MI
3480 28th Street
Grand Rapids, MI
2425 S. Linden Road STE E
Flint, MI
Minnesota
7740 France Avenue South
Edina, MN
8342 3rd Street North
Oakdale, MN
Missouri
1524 South Lindbergh Blvd.
St. Louis, MO
Nevada
2225 Village Walk Drive
Henderson, NV
New Jersey
501 Route 73 South
Marlton, NJ
150 Essex Street
Millburn, NJ
35 Morris Street
Morristown, NJ
396 Route 17, North
Paramus, NJ
3518 Route 1 North
Princeton, NJ
530 Broad Street
Shrewsbury, NJ
New Mexico
2261 Q Street NE
Albuquerque, NM
New York
1130 Franklin Avenue
Garden City, NY
37 West Jericho Turnpike
Huntington Station, NY
1271 Avenue of the Americas
New York, NY
980 Madison Avenue
New York, NY
61 Broadway
New York, NY
350 Park Avenue
New York, NY
200 Fifth Avenue
New York, NY
733 Third Avenue
New York, NY
2070 Broadway
New York, NY
1075 Northern Blvd.
Roslyn, NY
799 Central Park Avenue
Scarsdale, NY
3349 Monroe Avenue
Rochester, NY
North Carolina
4611 Sharon Road
Charlotte, NC
7011 Fayetteville Road
Durham, NC
Ohio
3805 Edwards Road
Cincinnati, OH
1324 Polaris Parkway
Columbus, OH
1800 Crocker Road
Westlake, OH
28699 Chagrin Boulevard
Woodmere Village, OH
Oregon
7493 SW Bridgeport Road
Tigard, OR
Pennsylvania
600 West DeKalb Pike
King of Prussia, PA
1735 Market Street
Philadelphia, PA
12001 Perry Highway
Wexford, PA
Rhode Island
10 Memorial Boulevard
Providence, RI
Tennessee
3018 Peoples Street
Johnson City, TN
7628 West Farmington Blvd.
Germantown, TN
2035 Mallory Lane
Franklin, TN
Texas
10000 Research Boulevard
Austin, TX
4001 Northwest Parkway
Dallas, TX
12532 Memorial Drive
Houston, TX
2701 Drexel Drive
Houston, TX
6560 Fannin Street
Houston, TX
1701 Lake Robbins Drive
The Woodlands, TX
6500 N. MacArthur Blvd.
Irving, TX
6005 West Park Boulevard
Plano, TX
1576 East Southlake Blvd.
Southlake, TX
15600 Southwest Freeway
Sugar Land, TX
139 N. Loop 1604 East
San Antonio, TX
Utah
279 West South Temple
Salt Lake City, UT
Virginia
1861 International Drive
McLean, VA
11957 Democracy Drive
Reston, VA
Washington
10500 NE 8th Street
Bellevue, WA
1518 6th Avenue
Seattle, WA
304 Strander Blvd
Tukwila, WA
Washington, DC
1900 K Street, N.W.
Washington, DC
Wisconsin
16020 West Bluemound Road
Brookfield, WI
Annual Report
Investment Adviser
Fidelity Management & Research Company
Boston, MA
Investment Sub-Advisers
FMR Co., Inc.
Fidelity Management & Research
(U.K.) Inc.
Fidelity Management & Research
(Japan) Inc.
Fidelity Management & Research
(Hong Kong) Limited
General Distributor
Fidelity Distributors Corporation
Boston, MA
Transfer and Service Agents
Fidelity Investments Institutional
Operations Company, Inc.
Boston, MA
Fidelity Service Company, Inc.
Boston, MA
Custodian
Northern Trust Company
Chicago, IL
The Fidelity Telephone Connection
Mutual Fund 24-Hour Service
Exchanges/Redemptions
and Account Assistance 1-800-544-6666
Product Information 1-800-544-6666
Retirement Accounts 1-800-544-4774
(8 a.m. - 9 p.m.)
TDD Service 1-800-544-0118
for the deaf and hearing impaired
(9 a.m. - 9 p.m. Eastern time)
Fidelity Automated Service
Telephone (FAST ®) 1-800-544-8544
Automated line for quickest service
GAI-UANN-0911
1.874515.103
Fidelity®
Growth & Income
Portfolio -
Class K
Annual Report
July 31, 2011
(2_fidelity_logos) (Registered_Trademark)
Contents
Chairman's Message | <Click Here> | The Chairman's message to shareholders. |
Performance | <Click Here> | How the fund has done over time. |
Management's Discussion of Fund Performance | <Click Here> | The Portfolio Manager's review of fund
performance and strategy. |
Shareholder Expense Example | <Click Here> | An example of shareholder expenses. |
Investment Changes | <Click Here> | A summary of major shifts in the fund's investments over the past six months. |
Investments | <Click Here> | A complete list of the fund's investments with their market values. |
Financial Statements | <Click Here> | Statements of assets and liabilities, operations, and changes in net assets,
as well as financial highlights. |
Notes | <Click Here> | Notes to the financial statements. |
Report of Independent Registered Public Accounting Firm | <Click Here> | |
Trustees and Officers | <Click Here> | |
Distributions | <Click Here> | |
Board Approval of Investment Advisory Contracts and Management Fees | <Click Here> | |
To view a fund's proxy voting guidelines and proxy voting record for the 12-month period ended June 30, visit http://www.fidelity.com/proxyvotingresults or visit the Securities and Exchange Commission's (SEC) web site at http://www.sec.gov. You may also call 1-800-835-5092 to request a free copy of the proxy voting guidelines.
Standard & Poor's, S&P and S&P 500 are registered service marks of The McGraw-Hill Companies, Inc. and have been licensed for use by Fidelity Distributors Corporation.
Other third party marks appearing herein are the property of their respective owners.
All other marks appearing herein are registered or unregistered trademarks or service marks of FMR LLC or an affiliated company.
Annual Report
This report and the financial statements contained herein are submitted for the general information of the shareholders of the fund. This report is not authorized for distribution to prospective investors in the fund unless preceded or accompanied by an effective prospectus.
A fund files its complete schedule of portfolio holdings with the SEC for the first and third quarters of each fiscal year on Form N-Q. Forms N-Q are available on the SEC's web site at http://www.sec.gov. A fund's Forms N-Q may be reviewed and copied at the SEC's Public Reference Room in Washington, DC. Information regarding the operation of the SEC's Public Reference Room may be obtained by calling 1-800-SEC-0330. For a complete list of a fund's portfolio holdings, view the most recent holdings listing, semiannual report, or annual report on Fidelity's web site at http://www.fidelity.com, http://www.fidelity.advisor.com, or http://www.401k.com, as applicable.
NOT FDIC INSURED • MAY LOSE VALUE • NO BANK GUARANTEE
Neither the fund nor Fidelity Distributors Corporation is a bank.
Annual Report
(photo_of_James_C_Curvey)
Dear Shareholder:
The second half of 2011 began with U.S. equities continuing to give back some of the gains achieved earlier in the year. In the days leading up to July 31, markets were shaken by a political stalemate in which Congress struggled to address the debt ceiling issue before an early-August deadline. The resulting uncertainty held back markets in July, the third consecutive monthly decline for equities, effectively reversing the positive momentum seen through the end of April. Financial markets are always unpredictable, of course, but there are several time-tested investment principles that can help put the odds in your favor.
One of the basic tenets is to invest for the long term. Over time, riding out the markets' inevitable ups and downs has proven much more effective than selling into panic or chasing the hottest trend. Even missing only a few of the markets' best days can significantly diminish investor returns. Patience also affords the benefits of compounding - of earning interest on additional income or reinvested dividends and capital gains. There can be tax advantages and cost benefits to consider as well. While staying the course doesn't eliminate risk, it can considerably lessen the effect of short-term declines.
You can further manage your investing risk through diversification. And today, more than ever, geographic diversification should be taken into account. Studies indicate that asset allocation is the single most important determinant of a portfolio's long-term success. The right mix of stocks, bonds and cash - aligned to your particular risk tolerance and investment objective - is very important. Age-appropriate rebalancing is also an essential aspect of asset allocation. For younger investors, an emphasis on equities - which historically have been the best-performing asset class over time - is encouraged. As investors near their specific goal, such as retirement or sending a child to college, consideration may be given to replacing volatile assets (e.g. common stocks) with more-stable fixed investments (bonds or savings plans).
A third principle - investing regularly - can help lower the average cost of your purchases. Investing a certain amount of money each month or quarter helps ensure you won't pay for all your shares at market highs. This strategy - known as dollar cost averaging - also reduces "emotion" from investing, helping shareholders avoid selling weak performers just prior to an upswing, or chasing a hot performer just before a correction.
We invite you to contact us via the Internet, through our Investor Centers or by phone. It is our privilege to provide you the information you need to make the investments that are right for you.
Sincerely,
(The acting chairman's signature appears here.)
James C. Curvey
Acting Chairman
Annual Report
Average annual total return reflects the change in the value of an investment, assuming reinvestment of the class' distributions from dividend income and capital gains (the profits earned upon the sale of securities that have grown in value, if any) and assuming a constant rate of performance each year. The $10,000 table and the fund's returns do not reflect the deduction of taxes that a shareholder would pay on fund distributions or the redemption of fund shares. During periods of reimbursement by Fidelity, a fund's total return will be greater than it would be had the reimbursement not occurred. How a fund did yesterday is no guarantee of how it will do tomorrow.
Average Annual Total Returns
Periods ended July 31, 2011 | Past 1
year | Past 5
years | Past 10
years |
Class K A | 19.40% | -4.44% | -1.62% |
A The initial offering of Class K shares took place on May 9, 2008. Returns prior to May 9, 2008 are those of Fidelity® Growth & Income Portfolio,
the original class of the fund.
$10,000 Over 10 Years
Let's say hypothetically that $10,000 was invested in Fidelity® Growth & Income Portfolio - Class K on July 31, 2001. The chart shows how the value of your investment would have changed, and also shows how the S&P 500® Index performed over the same period. The initial offering of Class K took place on May 9, 2008. See above for additional information regarding the performance of Class K.

Annual Report
Market Recap: U.S. stocks registered solid double-digit gains for the 12 months ending July 31, 2011, extending a rally that began more than two years earlier. Despite a rough start in August 2010, markets turned positive in September, as increased demand for capital goods and other upbeat indicators trumped investor worry about a U.S. recessionary relapse. The broad market, as measured by the S&P 500® Index, rose 9% that month, its biggest September gain in 71 years. Seven more monthly advances followed, fueled by encouraging corporate earnings and economic activity. However, volatility picked up in the period's latter months, as markets reacted to continued high U.S. unemployment, nagging debt troubles in Europe and looming legislative battles over the federal debt ceiling. May unemployment rose above 9% for the first time in 2011, contributing to a traditional "June swoon" for stocks. Market uncertainty lingered in July, when the S&P 500® posted its second-biggest monthly loss of the period. For the full year, the S&P 500® climbed 19.65%, while the blue-chip-laden Dow Jones Industrial AverageSM rose a comparable 19.09% and the technology-heavy Nasdaq Composite® Index gained 23.40%. On the capitalization spectrum, stocks of mid-cap companies fared best, with the Russell Midcap® Index rising 24.51% and the small-cap Russell 2000® Index adding 23.92%.
Comments from Matthew Fruhan, who became Portfolio Manager of Fidelity® Growth & Income Portfolio on February 1, 2011: For the year, the fund's Class K shares gained 19.40%, modestly trailing the S&P 500. Security selection in retailing, energy and capital goods hurt, as did a modest cash position. Despite good stock picking overall in technology, overweight stakes in networking gear maker Cisco Systems and computer and peripherals maker Hewlett-Packard were the largest individual detractors. Cisco cut its earnings estimates during the second half of the period, and the stock suffered. HP's shares struggled due in part to the August 2010 resignation of its CEO. An average underweighting in tobacco firm Philip Morris International also detracted. I sold the stock before period end because I favored British American Tobacco, an out-of-index holding and the top relative contributor. Stock picking in consumer staples - where I increased exposure - financials and tech added value overall. In financials, the fund got a boost from a sizable stake in Citigroup early in the period, while an overweight in tech giant Apple also helped. In terms of market selection, overweighting banks and industrials was a drag on performance, while industry positioning in consumer staples was beneficial. The fund's foreign holdings also provided a boost, aided by a weaker U.S. dollar.
The views expressed above reflect those of the portfolio manager(s) only through the end of the period as stated on the cover of this report and do not necessarily represent the views of Fidelity or any other person in the Fidelity organization. Any such views are subject to change at any time based upon market or other conditions and Fidelity disclaims any responsibility to update such views. These views may not be relied on as investment advice and, because investment decisions for a Fidelity fund are based on numerous factors, may not be relied on as an indication of trading intent on behalf of any Fidelity fund.
Annual Report
Shareholder Expense Example
As a shareholder of the Fund, you incur two types of costs: (1) transaction costs, and (2) ongoing costs, including management fees and other Fund expenses. This Example is intended to help you understand your ongoing costs (in dollars) of investing in the Fund and to compare these costs with the ongoing costs of investing in other mutual funds.
The Example is based on an investment of $1,000 invested at the beginning of the period and held for the entire period (February 1, 2011 to July 31, 2011).
Actual Expenses
The first line of the accompanying table for each class of the Fund provides information about actual account values and actual expenses. You may use the information in this line, together with the amount you invested, to estimate the expenses that you paid over the period. Simply divide your account value by $1,000.00 (for example, an $8,600 account value divided by $1,000.00 = 8.6), then multiply the result by the number in the first line for a class of the Fund under the heading entitled "Expenses Paid During Period" to estimate the expenses you paid on your account during this period. A small balance maintenance fee of $12.00 that is charged once a year may apply for certain accounts with a value of less than $2,000. This fee is not included in the table below. If it was, the estimate of expenses you paid during the period would be higher, and your ending account value lower, by this amount. In addition, the Fund, as a shareholder in the underlying Fidelity Central Funds, will indirectly bear its pro-rata share of the fees and expenses incurred by the underlying Fidelity Central Funds. These fees and expenses are not included in the Fund's annualized expense ratio used to calculate the expense estimate in the table below.
Hypothetical Example for Comparison Purposes
The second line of the accompanying table for each class of the Fund provides information about hypothetical account values and hypothetical expenses based on a Class' actual expense ratio and an assumed rate of return of 5% per year before expenses, which is not the Class' actual return. The hypothetical account values and expenses may not be used to estimate the actual ending account balance or expenses you paid for the period. You may use this information to compare the ongoing costs of investing in the Fund and other funds. To do so, compare this 5% hypothetical example with the 5% hypothetical examples that appear in the shareholder reports of the other funds. A small balance maintenance fee of $12.00 that is charged once a year may apply for certain accounts with a value of less than $2,000. This fee is not included in the table below. If it was, the estimate of expenses you paid during the period would be higher, and your ending account value lower, by this amount. In addition, the Fund, as a shareholder in the underlying Fidelity Central Funds, will indirectly bear its pro-rata share of the fees and expenses incurred by the underlying Fidelity Central Funds. These fees and expenses are not included in the Fund's annualized expense ratio used to calculate the expense estimate in the table below.
Please note that the expenses shown in the table are meant to highlight your ongoing costs only and do not reflect any transaction costs. Therefore, the second line of the table is useful in comparing ongoing costs only, and will not help you determine the relative total costs of owning different funds.
Annual Report
| Annualized
Expense Ratio | Beginning
Account Value
February 1, 2011 | Ending
Account Value
July 31, 2011 | Expenses Paid
During Period*
February 1, 2011 to
July 31, 2011 |
Growth & Income | .71% | | | |
Actual | | $ 1,000.00 | $ 996.30 | $ 3.51 |
HypotheticalA | | $ 1,000.00 | $ 1,021.27 | $ 3.56 |
Class K | .54% | | | |
Actual | | $ 1,000.00 | $ 997.20 | $ 2.67 |
HypotheticalA | | $ 1,000.00 | $ 1,022.12 | $ 2.71 |
A 5% return per year before expenses
* Expenses are equal to each Class' annualized expense ratio, multiplied by the average account value over the period, multiplied by 181/365 (to reflect the one-half year period).
Annual Report
Investment Changes (Unaudited)
Top Ten Stocks as of July 31, 2011 |
| % of fund's
net assets | % of fund's net assets
6 months ago |
Wells Fargo & Co. | 3.9 | 2.5 |
Chevron Corp. | 3.8 | 0.0 |
Exxon Mobil Corp. | 3.6 | 5.0 |
Apple, Inc. | 3.6 | 3.9 |
JPMorgan Chase & Co. | 3.3 | 2.8 |
PepsiCo, Inc. | 2.1 | 0.3 |
Target Corp. | 1.9 | 1.2 |
Merck & Co., Inc. | 1.8 | 1.1 |
Google, Inc. Class A | 1.7 | 1.8 |
The Coca-Cola Co. | 1.6 | 2.2 |
| 27.3 | |
Top Five Market Sectors as of July 31, 2011 |
| % of fund's
net assets | % of fund's net assets
6 months ago |
Information Technology | 18.1 | 19.1 |
Financials | 17.6 | 19.2 |
Consumer Discretionary | 13.2 | 9.6 |
Industrials | 12.6 | 15.5 |
Consumer Staples | 11.8 | 7.2 |
Asset Allocation (% of fund's net assets) |
As of July 31, 2011 * | As of January 31, 2011 ** |
| Stocks 98.7% | | | Stocks 98.2% | |
| Convertible
Securities 0.8% | | | Convertible
Securities 0.2% | |
| Short-Term
Investments and
Net Other Assets 0.5% | | | Short-Term
Investments and
Net Other Assets 1.6% | |
* Foreign investments | 18.7% | | ** Foreign investments | 11.6% | |

Annual Report
Investments July 31, 2011
Showing Percentage of Net Assets
Common Stocks - 97.5% |
| Shares | | Value (000s) |
CONSUMER DISCRETIONARY - 11.9% |
Automobiles - 0.2% |
Bayerische Motoren Werke AG (BMW) | 112,994 | | $ 11,336 |
Distributors - 0.5% |
Li & Fung Ltd. | 11,452,000 | | 19,043 |
Pool Corp. | 190,179 | | 5,087 |
| | 24,130 |
Diversified Consumer Services - 0.2% |
Weight Watchers International, Inc. | 118,991 | | 9,185 |
Hotels, Restaurants & Leisure - 2.3% |
Carnival Corp. unit | 158,205 | | 5,268 |
McDonald's Corp. | 966,981 | | 83,625 |
Yum! Brands, Inc. | 712,138 | | 37,615 |
| | 126,508 |
Household Durables - 1.3% |
D.R. Horton, Inc. | 1,573,071 | | 18,688 |
KB Home (d) | 682,300 | | 5,793 |
Ryland Group, Inc. | 1,480,000 | | 21,800 |
Toll Brothers, Inc. (a) | 979,552 | | 19,552 |
Tupperware Brands Corp. | 97,691 | | 6,105 |
| | 71,938 |
Leisure Equipment & Products - 0.2% |
Hasbro, Inc. | 277,379 | | 10,973 |
Media - 2.9% |
Comcast Corp. Class A | 2,365,300 | | 56,815 |
Kabel Deutschland Holding AG (a) | 158,200 | | 8,925 |
Regal Entertainment Group Class A (d) | 343,264 | | 4,390 |
Time Warner, Inc. | 1,895,017 | | 66,629 |
Viacom, Inc. Class B (non-vtg.) | 407,691 | | 19,740 |
| | 156,499 |
Multiline Retail - 2.1% |
PPR SA (d) | 60,368 | | 11,189 |
Target Corp. | 2,030,609 | | 104,556 |
| | 115,745 |
Specialty Retail - 2.1% |
Esprit Holdings Ltd. | 2,168,000 | | 6,314 |
Limited Brands, Inc. | 157,100 | | 5,948 |
Lowe's Companies, Inc. | 3,502,483 | | 75,584 |
Staples, Inc. | 1,806,528 | | 29,013 |
| | 116,859 |
Common Stocks - continued |
| Shares | | Value (000s) |
CONSUMER DISCRETIONARY - continued |
Textiles, Apparel & Luxury Goods - 0.1% |
VF Corp. | 35,100 | | $ 4,100 |
TOTAL CONSUMER DISCRETIONARY | | 647,273 |
CONSUMER STAPLES - 11.8% |
Beverages - 4.8% |
Diageo PLC | 1,661,519 | | 33,800 |
Dr Pepper Snapple Group, Inc. | 757,584 | | 28,606 |
PepsiCo, Inc. | 1,789,103 | | 114,574 |
The Coca-Cola Co. | 1,275,569 | | 86,751 |
| | 263,731 |
Food & Staples Retailing - 1.1% |
CVS Caremark Corp. | 571,204 | | 20,763 |
Sysco Corp. | 260,812 | | 7,978 |
Walgreen Co. | 808,500 | | 31,564 |
| | 60,305 |
Food Products - 0.8% |
Danone | 618,677 | | 44,270 |
Tate & Lyle PLC | 149,065 | | 1,491 |
| | 45,761 |
Household Products - 3.0% |
Colgate-Palmolive Co. | 420,356 | | 35,470 |
Energizer Holdings, Inc. (a) | 38,400 | | 3,097 |
Kimberly-Clark Corp. | 725,186 | | 47,398 |
Procter & Gamble Co. | 1,285,267 | | 79,031 |
| | 164,996 |
Tobacco - 2.1% |
British American Tobacco PLC sponsored ADR | 820,532 | | 75,013 |
Lorillard, Inc. | 341,630 | | 36,288 |
| | 111,301 |
TOTAL CONSUMER STAPLES | | 646,094 |
ENERGY - 11.5% |
Energy Equipment & Services - 1.0% |
Exterran Partners LP | 763,120 | | 18,086 |
Saipem SpA | 133,169 | | 6,961 |
Transocean Ltd. (United States) | 464,694 | | 28,607 |
| | 53,654 |
Common Stocks - continued |
| Shares | | Value (000s) |
ENERGY - continued |
Oil, Gas & Consumable Fuels - 10.5% |
ARC Resources Ltd. (d) | 300,400 | | $ 7,832 |
Atlas Pipeline Partners, LP | 128,400 | | 4,393 |
Bonavista Energy Corp. (a)(e)(f) | 220,600 | | 6,638 |
Chevron Corp. | 1,986,091 | | 206,593 |
Daylight Energy Ltd. (d) | 2,154,000 | | 20,652 |
EXCO Resources, Inc. | 253,100 | | 4,027 |
Exxon Mobil Corp. | 2,435,576 | | 194,335 |
Inergy LP | 34,600 | | 1,094 |
Legacy Reserves LP | 92,830 | | 2,581 |
Penn West Petroleum Ltd. | 266,500 | | 5,936 |
PetroBakken Energy Ltd. Class A (d) | 235,900 | | 3,472 |
QEP Resources, Inc. | 142,200 | | 6,233 |
Royal Dutch Shell PLC Class A (United Kingdom) | 1,800,836 | | 65,970 |
Suncor Energy, Inc. | 715,400 | | 27,421 |
Williams Companies, Inc. | 457,429 | | 14,500 |
| | 571,677 |
TOTAL ENERGY | | 625,331 |
FINANCIALS - 17.6% |
Capital Markets - 2.7% |
AllianceBernstein Holding LP | 143,060 | | 2,432 |
Apollo Global Management LLC Class A | 558,717 | | 9,671 |
Ashmore Group PLC | 5,150,313 | | 34,098 |
Bank of New York Mellon Corp. | 176,687 | | 4,437 |
BlackRock, Inc. Class A | 29,100 | | 5,193 |
Charles Schwab Corp. | 398,573 | | 5,951 |
Goldman Sachs Group, Inc. | 75,359 | | 10,171 |
ICAP PLC | 491,900 | | 3,616 |
KKR & Co. LP | 1,033,060 | | 15,134 |
Morgan Stanley | 567,796 | | 12,633 |
Northern Trust Corp. | 505,971 | | 22,721 |
State Street Corp. | 152,500 | | 6,324 |
The Blackstone Group LP | 921,977 | | 15,314 |
| | 147,695 |
Commercial Banks - 7.9% |
Banco Daycoval SA (PN) | 170,600 | | 1,009 |
BB&T Corp. | 2,179,355 | | 55,966 |
DBS Group Holdings Ltd. | 515,164 | | 6,644 |
FirstMerit Corp. | 107,716 | | 1,574 |
Common Stocks - continued |
| Shares | | Value (000s) |
FINANCIALS - continued |
Commercial Banks - continued |
Regions Financial Corp. | 3,719,724 | | $ 22,653 |
Standard Chartered PLC (United Kingdom) | 898,053 | | 22,969 |
SunTrust Banks, Inc. | 624,209 | | 15,287 |
U.S. Bancorp | 2,902,500 | | 75,639 |
Wells Fargo & Co. | 7,569,401 | | 211,484 |
Zions Bancorporation | 736,454 | | 16,128 |
| | 429,353 |
Diversified Financial Services - 4.8% |
Bank of America Corp. | 1,120,753 | | 10,883 |
Citigroup, Inc. | 774,850 | | 29,708 |
JPMorgan Chase & Co. | 4,487,774 | | 181,530 |
KKR Financial Holdings LLC | 4,161,687 | | 39,494 |
| | 261,615 |
Insurance - 0.7% |
Everest Re Group Ltd. | 136,311 | | 11,194 |
Fidelity National Financial, Inc. Class A | 247,700 | | 4,038 |
Genworth Financial, Inc. Class A (a) | 1,177,857 | | 9,800 |
MetLife, Inc. unit (a) | 135,300 | | 10,574 |
| | 35,606 |
Real Estate Investment Trusts - 1.4% |
American Capital Agency Corp. | 192,700 | | 5,380 |
CBL & Associates Properties, Inc. | 815,696 | | 14,487 |
Public Storage | 208,966 | | 24,999 |
Ventas, Inc. | 343,500 | | 18,594 |
Weyerhaeuser Co. | 784,900 | | 15,690 |
| | 79,150 |
Thrifts & Mortgage Finance - 0.1% |
First Niagara Financial Group, Inc. | 524,662 | | 6,427 |
MGIC Investment Corp. (a) | 16,978 | | 68 |
Radian Group, Inc. | 545,030 | | 1,728 |
| | 8,223 |
TOTAL FINANCIALS | | 961,642 |
HEALTH CARE - 11.2% |
Biotechnology - 1.4% |
Amgen, Inc. | 1,158,204 | | 63,354 |
Common Stocks - continued |
| Shares | | Value (000s) |
HEALTH CARE - continued |
Biotechnology - continued |
ARIAD Pharmaceuticals, Inc. (a) | 419,781 | | $ 4,991 |
SIGA Technologies, Inc. (a)(d) | 1,094,553 | | 8,330 |
| | 76,675 |
Health Care Equipment & Supplies - 0.3% |
Alere, Inc. (a) | 284,400 | | 8,387 |
Meridian Bioscience, Inc. | 289,522 | | 6,254 |
Steris Corp. | 15,900 | | 556 |
| | 15,197 |
Health Care Providers & Services - 1.8% |
Brookdale Senior Living, Inc. (a) | 529,300 | | 11,322 |
McKesson Corp. | 648,754 | | 52,627 |
Medco Health Solutions, Inc. (a) | 584,375 | | 36,746 |
| | 100,695 |
Life Sciences Tools & Services - 0.5% |
Lonza Group AG | 131,026 | | 11,186 |
QIAGEN NV (a) | 946,200 | | 16,029 |
| | 27,215 |
Pharmaceuticals - 7.2% |
Abbott Laboratories | 647,127 | | 33,211 |
Cardiome Pharma Corp. (a) | 593,100 | | 2,949 |
GlaxoSmithKline PLC sponsored ADR | 1,559,969 | | 69,294 |
Johnson & Johnson | 1,123,808 | | 72,812 |
Merck & Co., Inc. | 2,934,546 | | 100,156 |
Pfizer, Inc. | 3,963,400 | | 76,256 |
Roche Holding AG (participation certificate) | 138,182 | | 24,839 |
Sanofi-Aventis | 139,612 | | 10,848 |
| | 390,365 |
TOTAL HEALTH CARE | | 610,147 |
INDUSTRIALS - 12.6% |
Aerospace & Defense - 4.1% |
Embraer SA sponsored ADR | 411,300 | | 12,142 |
Goodrich Corp. | 118,300 | | 11,255 |
Honeywell International, Inc. | 967,080 | | 51,352 |
Rockwell Collins, Inc. | 694,200 | | 38,243 |
The Boeing Co. | 696,700 | | 49,096 |
United Technologies Corp. | 782,000 | | 64,781 |
| | 226,869 |
Common Stocks - continued |
| Shares | | Value (000s) |
INDUSTRIALS - continued |
Air Freight & Logistics - 0.1% |
C.H. Robinson Worldwide, Inc. | 7,126 | | $ 515 |
United Parcel Service, Inc. Class B | 108,200 | | 7,490 |
| | 8,005 |
Building Products - 1.0% |
Lennox International, Inc. | 297,066 | | 10,986 |
Owens Corning (a) | 861,000 | | 30,634 |
Quanex Building Products Corp. | 781,178 | | 12,241 |
| | 53,861 |
Commercial Services & Supplies - 0.5% |
Aggreko PLC | 68,150 | | 2,163 |
Covanta Holding Corp. | 162,000 | | 2,799 |
Healthcare Services Group, Inc. | 385,500 | | 6,048 |
Republic Services, Inc. | 438,639 | | 12,734 |
Waste Management, Inc. | 188,668 | | 5,941 |
| | 29,685 |
Electrical Equipment - 0.8% |
Emerson Electric Co. | 704,325 | | 34,575 |
Prysmian SpA | 428,300 | | 7,945 |
| | 42,520 |
Industrial Conglomerates - 3.0% |
Danaher Corp. | 857,400 | | 42,107 |
General Electric Co. | 3,826,681 | | 68,536 |
Koninklijke Philips Electronics NV (depositary receipt) (NY Reg.) (d) | 2,069,680 | | 51,266 |
| | 161,909 |
Machinery - 1.8% |
Charter International PLC | 1,954,800 | | 25,672 |
Douglas Dynamics, Inc. | 355,300 | | 5,397 |
Graco, Inc. | 70,500 | | 3,097 |
Ingersoll-Rand Co. Ltd. | 1,655,764 | | 61,959 |
| | 96,125 |
Professional Services - 0.9% |
Bureau Veritas SA | 371,766 | | 30,394 |
IHS, Inc. Class A (a) | 63,548 | | 4,683 |
Michael Page International PLC | 1,677,857 | | 13,813 |
| | 48,890 |
Trading Companies & Distributors - 0.4% |
Air Lease Corp. Class A | 137,700 | | 3,364 |
Common Stocks - continued |
| Shares | | Value (000s) |
INDUSTRIALS - continued |
Trading Companies & Distributors - continued |
Beacon Roofing Supply, Inc. (a) | 315,600 | | $ 6,748 |
Watsco, Inc. | 200,673 | | 11,876 |
| | 21,988 |
TOTAL INDUSTRIALS | | 689,852 |
INFORMATION TECHNOLOGY - 18.1% |
Communications Equipment - 2.5% |
Cisco Systems, Inc. | 4,422,170 | | 70,622 |
HTC Corp. | 76,950 | | 2,286 |
Juniper Networks, Inc. (a) | 963,404 | | 22,534 |
QUALCOMM, Inc. | 781,410 | | 42,806 |
| | 138,248 |
Computers & Peripherals - 5.4% |
Apple, Inc. (a) | 495,700 | | 193,561 |
EMC Corp. (a) | 1,711,600 | | 44,639 |
Hewlett-Packard Co. | 1,619,295 | | 56,934 |
| | 295,134 |
Electronic Equipment & Components - 0.8% |
Coretronic Corp. | 8,956,000 | | 10,544 |
Corning, Inc. | 1,687,700 | | 26,851 |
Everlight Electronics Co. Ltd. | 3,402,000 | | 7,303 |
| | 44,698 |
Internet Software & Services - 1.9% |
eBay, Inc. (a) | 265,540 | | 8,696 |
Google, Inc. Class A (a) | 157,593 | | 95,137 |
| | 103,833 |
IT Services - 4.2% |
Fidelity National Information Services, Inc. | 552,855 | | 16,597 |
International Business Machines Corp. | 290,500 | | 52,827 |
MasterCard, Inc. Class A | 223,154 | | 67,671 |
Paychex, Inc. | 1,545,278 | | 43,623 |
Visa, Inc. Class A | 590,363 | | 50,500 |
| | 231,218 |
Office Electronics - 0.1% |
Xerox Corp. | 324,780 | | 3,030 |
Semiconductors & Semiconductor Equipment - 1.0% |
KLA-Tencor Corp. | 285,055 | | 11,351 |
Siliconware Precision Industries Co. Ltd. sponsored ADR (d) | 3,070,201 | | 15,136 |
Common Stocks - continued |
| Shares | | Value (000s) |
INFORMATION TECHNOLOGY - continued |
Semiconductors & Semiconductor Equipment - continued |
Taiwan Semiconductor Manufacturing Co. Ltd. | 4,171,000 | | $ 10,350 |
Taiwan Semiconductor Manufacturing Co. Ltd. sponsored ADR | 1,265,738 | | 15,645 |
| | 52,482 |
Software - 2.2% |
ANSYS, Inc. (a) | 162,516 | | 8,223 |
Autonomy Corp. PLC (a) | 1,435,497 | | 39,613 |
Microsoft Corp. | 2,411,274 | | 66,069 |
Oracle Corp. | 149,700 | | 4,578 |
| | 118,483 |
TOTAL INFORMATION TECHNOLOGY | | 987,126 |
MATERIALS - 0.9% |
Chemicals - 0.9% |
Air Products & Chemicals, Inc. | 109,656 | | 9,730 |
Ecolab, Inc. | 214,095 | | 10,705 |
PPG Industries, Inc. | 72,000 | | 6,062 |
Praxair, Inc. | 196,828 | | 20,399 |
| | 46,896 |
TELECOMMUNICATION SERVICES - 0.4% |
Diversified Telecommunication Services - 0.2% |
Koninklijke KPN NV (d) | 852,180 | | 12,178 |
Wireless Telecommunication Services - 0.2% |
American Tower Corp. Class A (a) | 212,100 | | 11,142 |
TOTAL TELECOMMUNICATION SERVICES | | 23,320 |
UTILITIES - 1.5% |
Electric Utilities - 0.6% |
American Electric Power Co., Inc. | 238,862 | | 8,804 |
FirstEnergy Corp. | 59,661 | | 2,664 |
NextEra Energy, Inc. | 105,653 | | 5,837 |
PPL Corp. | 518,753 | | 14,473 |
| | 31,778 |
Gas Utilities - 0.2% |
National Fuel Gas Co. | 147,465 | | 10,674 |
Common Stocks - continued |
| Shares | | Value (000s) |
UTILITIES - continued |
Multi-Utilities - 0.7% |
National Grid PLC | 3,284,100 | | $ 32,136 |
Veolia Environnement | 221,789 | | 4,993 |
| | 37,129 |
TOTAL UTILITIES | | 79,581 |
TOTAL COMMON STOCKS (Cost $5,236,131) | 5,317,262 |
Preferred Stocks - 1.8% |
| | | |
Convertible Preferred Stocks - 0.6% |
HEALTH CARE - 0.5% |
Health Care Equipment & Supplies - 0.4% |
Alere, Inc. 3.00% (a) | 93,854 | | 23,370 |
Health Care Providers & Services - 0.1% |
Omnicare Capital Trust II Series B, 4.00% | 79,200 | | 3,684 |
TOTAL HEALTH CARE | | 27,054 |
UTILITIES - 0.1% |
Electric Utilities - 0.1% |
PPL Corp. 8.75% | 120,200 | | 6,408 |
TOTAL CONVERTIBLE PREFERRED STOCKS | | 33,462 |
Nonconvertible Preferred Stocks - 1.2% |
CONSUMER DISCRETIONARY - 1.2% |
Automobiles - 1.2% |
Porsche Automobil Holding SE (Germany) | 409,450 | | 31,581 |
Volkswagen AG | 155,275 | | 31,112 |
| | 62,693 |
TOTAL PREFERRED STOCKS (Cost $90,094) | 96,155 |
Convertible Bonds - 0.2% |
| Principal
Amount (000s) | | Value (000s) |
CONSUMER DISCRETIONARY - 0.1% |
Leisure Equipment & Products - 0.1% |
Eastman Kodak Co. 7% 4/1/17 | | $ 8,400 | | $ 5,247 |
HEALTH CARE - 0.1% |
Health Care Providers & Services - 0.1% |
Omnicare, Inc. 3.75% 12/15/25 | | 5,450 | | 7,000 |
TOTAL CONVERTIBLE BONDS (Cost $14,000) | 12,247 |
Money Market Funds - 1.0% |
| Shares | | |
Fidelity Cash Central Fund, 0.14% (b) | 198 | | 0* |
Fidelity Securities Lending Cash Central Fund, 0.15% (b)(c) | 55,264,124 | | 55,264 |
TOTAL MONEY MARKET FUNDS (Cost $55,264) | | 55,264 |
TOTAL INVESTMENT PORTFOLIO - 100.5% (Cost $5,395,489) | | 5,480,928 |
NET OTHER ASSETS (LIABILITIES) - (0.5)% | | (25,418) |
NET ASSETS - 100% | $ 5,455,510 |
Legend |
(a) Non-income producing |
(b) Affiliated fund that is available only to investment companies and other accounts managed by Fidelity Investments. The rate quoted is the annualized seven-day yield of the fund at period end. A complete unaudited listing of the fund's holdings as of its most recent quarter end is available upon request. In addition, each Fidelity Central Fund's financial statements, which are not covered by the Fund's Report of Independent Registered Public Accounting Firm, are available on the SEC's website or upon request. |
(c) Investment made with cash collateral received from securities on loan. |
(d) Security or a portion of the security is on loan at period end. |
(e) Security exempt from registration under Rule 144A of the Securities Act of 1933. These securities may be resold in transactions exempt from registration, normally to qualified institutional buyers. At the end of the period, the value of these securities amounted to $6,638,000 or 0.1% of net assets. |
(f) Security or a portion of the security purchased on a delayed delivery or when-issued basis. |
* Amount represents less than $1,000 |
Affiliated Central Funds |
Information regarding fiscal year to date income earned by the Fund from investments in Fidelity Central Funds is as follows: |
Fund | Income earned
(Amounts in thousands) |
Fidelity Cash Central Fund | $ 90 |
Fidelity Securities Lending Cash Central Fund | 510 |
Total | $ 600 |
Other Information |
The following is a summary of the inputs used, as of July 31, 2011, involving the Fund's assets and liabilities carried at fair value. The inputs or methodology used for valuing securities may not be an indication of the risk associated with investing in those securities. For more information on valuation inputs, and their aggregation into the levels used in the tables below, please refer to the Security Valuation section in the accompanying Notes to Financial Statements. |
Valuation Inputs at Reporting Date: |
Description
(Amounts in thousands) | Total | Level 1 | Level 2 | Level 3 |
Investments in Securities: | | | | |
Equities: | | | | |
Consumer Discretionary | $ 709,966 | $ 709,966 | $ - | $ - |
Consumer Staples | 646,094 | 612,294 | 33,800 | - |
Energy | 625,331 | 552,723 | 72,608 | - |
Financials | 961,642 | 951,068 | 10,574 | - |
Health Care | 637,201 | 626,353 | 10,848 | - |
Industrials | 689,852 | 689,852 | - | - |
Information Technology | 987,126 | 976,776 | 10,350 | - |
Materials | 46,896 | 46,896 | - | - |
Telecommunication Services | 23,320 | 23,320 | - | - |
Utilities | 85,989 | 42,452 | 43,537 | - |
Corporate Bonds | 12,247 | - | 12,247 | - |
Money Market Funds | 55,264 | 55,264 | - | - |
Total Investments in Securities: | $ 5,480,928 | $ 5,286,964 | $ 193,964 | $ - |
The following is a reconciliation of Investments in Securities for which Level 3 inputs were used in determining value: |
(Amounts in thousands) | |
Investments in Securities: | |
Beginning Balance | $ 3,241 |
Total Realized Gain (Loss) | (544) |
Total Unrealized Gain (Loss) | 83 |
Cost of Purchases | - |
Proceeds of Sales | (2,780) |
Amortization/Accretion | - |
Transfers in to Level 3 | - |
Transfers out of Level 3 | - |
Ending Balance | $ - |
The change in unrealized gain (loss) for the period attributable to Level 3 securities held at July 31, 2011 | $ - |
The information used in the above reconciliation represents fiscal year to date activity for any Investments in Securities identified as using Level 3 inputs at either the beginning or the end of the current fiscal period. Transfers in or out of Level 3 represent the beginning value of any Security or Instrument where a change in the pricing level occurred from the beginning to the end of the period. The cost of purchases and the proceeds of sales may include securities received or delivered through corporate actions or exchanges. Realized and unrealized gains (losses) disclosed in the reconciliation are included in Net Gain (Loss) on the Fund's Statement of Operations. |
Distribution of investments by country of issue, as a percentage of total net assets, is as follows: (Unaudited) |
United States of America | 81.3% |
United Kingdom | 7.1% |
France | 1.9% |
Germany | 1.6% |
Netherlands | 1.4% |
Canada | 1.4% |
Switzerland | 1.2% |
Ireland | 1.1% |
Taiwan | 1.1% |
Others (Individually Less Than 1%) | 1.9% |
| 100.0% |
Income Tax Information |
At July 31, 2011, the Fund had a capital loss carryforward of approximately $4,828,805,000 of which $1,660,464,000 and $3,168,341,000 will expire in fiscal 2017 and 2018, respectively. Capital loss carryforwards are only available to offset future capital gains of the Fund to the extent provided by regulations and may be limited. |
See accompanying notes which are an integral part of the financial statements.
Annual Report
Statement of Assets and Liabilities
Amounts in thousands (except per-share amounts) | July 31, 2011 |
| | |
Assets | | |
Investment in securities, at value (including securities loaned of $52,792) - See accompanying schedule: Unaffiliated issuers (cost $5,340,225) | $ 5,425,664 | |
Fidelity Central Funds (cost $55,264) | 55,264 | |
Total Investments (cost $5,395,489) | | $ 5,480,928 |
Cash | | 39 |
Foreign currency held at value (cost $68) | | 68 |
Receivable for investments sold | | 110,966 |
Receivable for fund shares sold | | 1,026 |
Dividends receivable | | 9,120 |
Interest receivable | | 220 |
Distributions receivable from Fidelity Central Funds | | 24 |
Other receivables | | 940 |
Total assets | | 5,603,331 |
| | |
Liabilities | | |
Payable for investments purchased
Regular delivery | $ 59,009 | |
Delayed delivery | 6,592 | |
Payable for fund shares redeemed | 8,758 | |
Accrued management fee | 2,205 | |
Notes payable to affiliates | 14,172 | |
Other affiliated payables | 1,110 | |
Other payables and accrued expenses | 711 | |
Collateral on securities loaned, at value | 55,264 | |
Total liabilities | | 147,821 |
| | |
Net Assets | | $ 5,455,510 |
Net Assets consist of: | | |
Paid in capital | | $ 10,228,736 |
Undistributed net investment income | | 3,860 |
Accumulated undistributed net realized gain (loss) on investments and foreign currency transactions | | (4,862,649) |
Net unrealized appreciation (depreciation) on investments and assets and liabilities in foreign currencies | | 85,563 |
Net Assets | | $ 5,455,510 |
See accompanying notes which are an integral part of the financial statements.
Annual Report
Financial Statements - continued
Statement of Assets and Liabilities - continued
Amounts in thousands (except per-share amounts) | July 31, 2011 |
| | |
Growth & Income:
Net Asset Value, offering price and redemption price per share ($5,052,058 ÷ 271,868 shares) | | $ 18.58 |
| | |
Class K:
Net Asset Value, offering price and redemption price per share ($403,452 ÷ 21,725 shares) | | $ 18.57 |
See accompanying notes which are an integral part of the financial statements.
Annual Report
Statement of Operations
Amounts in thousands | Year ended July 31, 2011 |
| | |
Investment Income | | |
Dividends | | $ 107,127 |
Interest | | 314 |
Income from Fidelity Central Funds | | 600 |
Total income | | 108,041 |
| | |
Expenses | | |
Management fee | $ 27,506 | |
Transfer agent fees | 12,978 | |
Accounting and security lending fees | 1,127 | |
Custodian fees and expenses | 231 | |
Independent trustees' compensation | 36 | |
Appreciation in deferred trustee compensation account | 1 | |
Registration fees | 52 | |
Audit | 119 | |
Legal | 52 | |
Interest | 17 | |
Miscellaneous | 69 | |
Total expenses before reductions | 42,188 | |
Expense reductions | (765) | 41,423 |
Net investment income (loss) | | 66,618 |
Realized and Unrealized Gain (Loss) Net realized gain (loss) on: | | |
Investment securities: | | |
Unaffiliated issuers | 1,411,540 | |
Foreign currency transactions | (334) | |
Futures contracts | 415 | |
Total net realized gain (loss) | | 1,411,621 |
Change in net unrealized appreciation (depreciation) on: Investment securities | (422,884) | |
Assets and liabilities in foreign currencies | 117 | |
Total change in net unrealized appreciation (depreciation) | | (422,767) |
Net gain (loss) | | 988,854 |
Net increase (decrease) in net assets resulting from operations | | $ 1,055,472 |
See accompanying notes which are an integral part of the financial statements.
Annual Report
Financial Statements - continued
Statement of Changes in Net Assets
Amounts in thousands | Year ended
July 31,
2011 | Year ended
July 31,
2010 |
Increase (Decrease) in Net Assets | | |
Operations | | |
Net investment income (loss) | $ 66,618 | $ 40,566 |
Net realized gain (loss) | 1,411,621 | 534,831 |
Change in net unrealized appreciation (depreciation) | (422,767) | 81,662 |
Net increase (decrease) in net assets resulting
from operations | 1,055,472 | 657,059 |
Distributions to shareholders from net investment income | (61,849) | (38,583) |
Distributions to shareholders from net realized gain | - | (3,482) |
Total distributions | (61,849) | (42,065) |
Share transactions - net increase (decrease) | (1,247,529) | (1,247,688) |
Total increase (decrease) in net assets | (253,906) | (632,694) |
| | |
Net Assets | | |
Beginning of period | 5,709,416 | 6,342,110 |
End of period (including undistributed net investment income of $3,860 and undistributed net investment income of $1,085, respectively) | $ 5,455,510 | $ 5,709,416 |
See accompanying notes which are an integral part of the financial statements.
Annual Report
Financial Highlights - Growth & Income
Years ended July 31, | 2011 | 2010 | 2009 | 2008 | 2007 |
Selected Per-Share Data | | | | |
Net asset value, beginning of period | $ 15.75 | $ 14.38 | $ 21.88 | $ 31.92 | $ 34.16 |
Income from Investment Operations | | | | | |
Net investment income (loss) B | .20 | .10 | .15 | .35 | .27 |
Net realized and unrealized gain (loss) | 2.82 | 1.37 | (7.43) | (6.25) | 3.84 |
Total from investment operations | 3.02 | 1.47 | (7.28) | (5.90) | 4.11 |
Distributions from net investment income | (.19) | (.10) | (.19) | (.33) | (.27) |
Distributions from net realized gain | - | (.01) | (.03) | (3.81) | (6.08) |
Total distributions | (.19) | (.10) F | (.22) | (4.14) | (6.35) |
Net asset value, end of period | $ 18.58 | $ 15.75 | $ 14.38 | $ 21.88 | $ 31.92 |
Total Return A | 19.16% | 10.25% | (33.32)% | (20.91)% | 14.28% |
Ratios to Average Net Assets C, E | | | | |
Expenses before reductions | .72% | .75% | .78% | .68% | .68% |
Expenses net of fee waivers, if any | .72% | .75% | .78% | .68% | .68% |
Expenses net of all reductions | .71% | .74% | .78% | .67% | .67% |
Net investment income (loss) | 1.09% | .63% | 1.07% | 1.29% | .84% |
Supplemental Data | | | | |
Net assets, end of period (in millions) | $ 5,052 | $ 5,417 | $ 5,993 | $ 12,552 | $ 22,693 |
Portfolio turnover rate D | 129% | 98% | 122% | 52% | 52% |
A Total returns would have been lower if certain expenses had not been reduced during the applicable periods shown.
B Calculated based on average shares outstanding during the period.
C Fees and expenses of any underlying Fidelity Central Funds are not included in the Fund's expense ratio. The Fund indirectly bears its proportionate share of the expenses of any underlying Fidelity Central Funds.
D Amount does not include the portfolio activity of any underlying Fidelity Central Funds.
E Expense ratios reflect operating expenses of the class. Expenses before reductions do not reflect amounts reimbursed by the investment adviser or reductions from brokerage service arrangements or reductions from other expense offset arrangements and do not represent the amount paid by the class during periods when reimbursements or reductions occur. Expenses net of fee waivers reflect expenses after reimbursement by the investment adviser but prior to reductions from brokerage service arrangements or other expense offset arrangements. Expenses net of all reductions represent the net expenses paid by the class.
F Total distributions of $.10 per share is comprised of distributions from net investment income of $.095 and distributions from net realized gain of $.008 per share.
See accompanying notes which are an integral part of the financial statements.
Annual Report
Financial Highlights - Class K
Years ended July 31, | 2011 | 2010 | 2009 | 2008 G |
Selected Per-Share Data | | | |
Net asset value, beginning of period | $ 15.74 | $ 14.38 | $ 21.88 | $ 25.34 |
Income from Investment Operations | | | | |
Net investment income (loss) D | .23 | .13 | .16 | .09 |
Net realized and unrealized gain (loss) | 2.82 | 1.37 | (7.40) | (3.45) |
Total from investment operations | 3.05 | 1.50 | (7.24) | (3.36) |
Distributions from net investment income | (.22) | (.13) | (.23) | (.10) |
Distributions from net realized gain | - | (.01) | (.03) | - |
Total distributions | (.22) | (.14) I | (.26) | (.10) |
Net asset value, end of period | $ 18.57 | $ 15.74 | $ 14.38 | $ 21.88 |
Total Return B, C | 19.40% | 10.41% | (33.12)% | (13.22)% |
Ratios to Average Net Assets E, H | | | |
Expenses before reductions | .54% | .54% | .56% | .55% A |
Expenses net of fee waivers, if any | .54% | .54% | .56% | .55% A |
Expenses net of all reductions | .53% | .53% | .55% | .55% A |
Net investment income (loss) | 1.27% | .84% | 1.29% | 1.73% A |
Supplemental Data | | | |
Net assets, end of period (000 omitted) | $ 403,452 | $ 292,021 | $ 349,324 | $ 87 |
Portfolio turnover rate F | 129% | 98% | 122% | 52% |
A Annualized
B Total returns for periods of less than one year are not annualized.
C Total returns would have been lower if certain expenses had not been reduced during the applicable periods shown.
D Calculated based on average shares outstanding during the period.
E Fees and expenses of any underlying Fidelity Central Funds are not included in the Fund's expense ratio. The Fund indirectly bears its proportionate share of the expenses of any underlying Fidelity Central Funds.
F Amount does not include the portfolio activity of any underlying Fidelity Central Funds.
G For the period May 9, 2008 (commencement of sale of shares) to July 31, 2008.
H Expense ratios reflect operating expenses of the class. Expenses before reductions do not reflect amounts reimbursed by the investment adviser or reductions from brokerage service arrangements or reductions from other expense offset arrangements and do not represent the amount paid by the class during periods when reimbursements or reductions occur. Expense ratios before reductions for start-up periods may not be representative of longer-term operating periods. Expenses net of fee waivers reflect expenses after reimbursement by the investment adviser but prior to reductions from brokerage service arrangements or other expense offset arrangements. Expenses net of all reductions represent the net expenses paid by the class.
I Total distributions of $.14 per share is comprised of distributions from net investment income of $.129 and distributions from net realized gain of $.008 per share.
See accompanying notes which are an integral part of the financial statements.
Annual Report
Notes to Financial Statements
For the period ended July 31, 2011
(Amounts in thousands except ratios)
1. Organization.
Fidelity Growth & Income Portfolio (the Fund) is a fund of Fidelity Securities Fund (the Trust) and is authorized to issue an unlimited number of shares. The Trust is registered under the Investment Company Act of 1940, as amended (the 1940 Act), as an open-end management investment company organized as a Massachusetts business trust. The Fund offers Growth & Income shares and Class K shares, each of which has equal rights as to assets and voting privileges. Each class has exclusive voting rights with respect to matters that affect that class. Investment income, realized and unrealized capital gains and losses, the common expenses of the Fund, and certain fund-level expense reductions, if any, are allocated on a pro-rata basis to each class based on the relative net assets of each class to the total net assets of the Fund. Each class differs with respect to transfer agent fees incurred. Certain expense reductions may also differ by class.
2. Investments in Fidelity Central Funds.
The Fund invests in Fidelity Central Funds, which are open-end investment companies available only to other investment companies and accounts managed by Fidelity Management & Research Company (FMR) and its affiliates. The Fund's Schedule of Investments lists each of the Fidelity Central Funds held as of period end, if any, as an investment of the Fund, but does not include the underlying holdings of each Fidelity Central Fund. As an Investing Fund, the Fund indirectly bears its proportionate share of the expenses of the underlying Fidelity Central Funds.
The Money Market Central Funds seek preservation of capital and current income and are managed by Fidelity Investments Money Management, Inc. (FIMM), an affiliate of FMR.
A complete unaudited list of holdings for each Fidelity Central Fund is available upon request or at the Securities and Exchange Commission (the SEC) web site at www.sec.gov. In addition, the financial statements of the Fidelity Central Funds, which are not covered by the Fund's Report of Independent Registered Public Accounting Firm, are available on the SEC web site or upon request.
3. Significant Accounting Policies.
The financial statements have been prepared in conformity with accounting principles generally accepted in the United States of America (GAAP), which require management to make certain estimates and assumptions at the date of the financial statements. Actual results could differ from those estimates. Subsequent events, if any, through the date that the financial statements were issued have been evaluated in the preparation of the financial statements. The following summarizes the significant accounting policies of the Fund:
Annual Report
Notes to Financial Statements - continued
(Amounts in thousands except ratios)
3. Significant Accounting Policies - continued
Security Valuation. Investments are valued as of 4:00 p.m. Eastern time on the last calendar day of the period. The Fund uses independent pricing services approved by the Board of Trustees to value its investments. When current market prices or quotations are not readily available or reliable, valuations may be determined in good faith in accordance with procedures adopted by the Board of Trustees. Factors used in determining value may include market or security specific events, changes in interest rates and credit quality. The frequency with which these procedures are used cannot be predicted and they may be utilized to a significant extent. The value used for net asset value (NAV) calculation under these procedures may differ from published prices for the same securities.
The Fund categorizes the inputs to valuation techniques used to value its investments into a disclosure hierarchy consisting of three levels as shown below:
Level 1 - quoted prices in active markets for identical investments
Level 2 - other significant observable inputs (including quoted prices for similar investments, interest rates, prepayment speeds, etc.)
Level 3 - unobservable inputs (including the Fund's own assumptions based on the best information available)
Changes in valuation techniques may result in transfers in or out of an assigned level within the disclosure hierarchy. The aggregate value of investments by input level, as of July 31, 2011, as well as a roll forward of Level 3 securities, is included at the end of the Fund's Schedule of Investments. Valuation techniques used to value the Fund's investments by major category are as follows:
Equity securities, including restricted securities, for which market quotations are readily available, are valued at the last reported sale price or official closing price as reported by an independent pricing service on the primary market or exchange on which they are traded and are categorized as Level 1 in the hierarchy. In the event there were no sales during the day or closing prices are not available, securities are valued at the last quoted bid price or may be valued using the last available price and are generally categorized as Level 2 in the hierarchy. For foreign equity securities, when significant market or security specific events arise, comparisons to the valuation of American Depositary Receipts (ADRs), futures contracts, Exchange-traded funds (ETFs) and certain indexes as well as quoted prices for similar securities are used and are categorized as Level 2 in the hierarchy in these circumstances. Utilizing these techniques may result in transfers between Level 1 and Level 2. For restricted equity securities and private placements where observable inputs are limited, assumptions about market activity and risk are used and are categorized as Level 3 in the hierarchy.
Annual Report
3. Significant Accounting Policies - continued
Security Valuation - continued
Debt securities, including restricted securities, are valued based on evaluated prices received from independent pricing services or from dealers who make markets in such securities. For corporate bonds, pricing services utilize matrix pricing which considers yield or price of bonds of comparable quality, coupon, maturity and type as well as dealer supplied prices and are generally categorized as Level 2 in the hierarchy. When independent prices are unavailable or unreliable, debt securities may be valued utilizing pricing matrices which consider similar factors that would be used by independent pricing services. These are generally categorized as Level 2 in the hierarchy but may be Level 3 depending on the circumstances.
Investments in open-end mutual funds, including the Fidelity Central Funds, are valued at their closing net asset value each business day and are categorized as Level 1 in the hierarchy.
Foreign Currency. The Fund may use foreign currency contracts to facilitate transactions in foreign-denominated securities. Gains and losses from these transactions may arise from changes in the value of the foreign currency or if the counterparties do not perform under the contracts' terms.
Foreign-denominated assets, including investment securities, and liabilities are translated into U.S. dollars at the exchange rate at period end. Purchases and sales of investment securities, income and dividends received and expenses denominated in foreign currencies are translated into U.S. dollars at the exchange rate in effect on the transaction date.
The effects of exchange rate fluctuations on investments are included with the net realized and unrealized gain (loss) on investment securities. Other foreign currency transactions resulting in realized and unrealized gain (loss) are disclosed separately.
Investment Transactions and Income. For financial reporting purposes, the Fund's investment holdings and NAV include trades executed through the end of the last business day of the period. The NAV per share for processing shareholder transactions is calculated as of the close of business of the New York Stock Exchange (NYSE), normally 4:00 p.m. Eastern time and includes trades executed through the end of the prior business day. Gains and losses on securities sold are determined on the basis of identified cost and may include proceeds received from litigation. Dividend income is recorded on the ex-dividend date, except for certain dividends from foreign securities where the ex-dividend date may have passed, which are recorded as soon as the Fund is informed of the ex-dividend date. Non-cash dividends included in dividend income, if any, are recorded at the fair market value of the securities received. Distributions received on securities that represent a return of capital or capital gain are recorded as a reduction of
Annual Report
Notes to Financial Statements - continued
(Amounts in thousands except ratios)
3. Significant Accounting Policies - continued
Investment Transactions and Income - continued
cost of investments and/or as a realized gain. The Fund estimates the components of distributions received that may be considered return of capital distributions or capital gain distributions. Interest income and distributions from the Fidelity Central Funds are accrued as earned. Interest income includes coupon interest and amortization of premium and accretion of discount on debt securities. Investment income is recorded net of foreign taxes withheld where recovery of such taxes is uncertain.
Expenses. Expenses directly attributable to a fund are charged to that fund. Expenses attributable to more than one fund are allocated among the respective funds on the basis of relative net assets or other appropriate methods. Expense estimates are accrued in the period to which they relate and adjustments are made when actual amounts are known.
Deferred Trustee Compensation. Under a Deferred Compensation Plan (the Plan), independent Trustees may elect to defer receipt of a portion of their annual compensation. Deferred amounts are invested in a cross-section of Fidelity funds, are marked-to-market and remain in the Fund until distributed in accordance with the Plan. The investment of deferred amounts and the offsetting payable to the Trustees are included in the accompanying Statement of Assets and Liabilities.
Income Tax Information and Distributions to Shareholders. Each year, the Fund intends to qualify as a regulated investment company, including distributing substantially all of its taxable income and realized gains under Subchapter M of the Internal Revenue Code and filing its U.S. federal tax return. As a result, no provision for income taxes is required. As of July 31, 2011, the Fund did not have any unrecognized tax benefits in the financial statements. A fund's federal tax return is subject to examination by the Internal Revenue Service (IRS) for a period of three years. Foreign taxes are provided for based on the Fund's understanding of the tax rules and rates that exist in the foreign markets in which it invests.
Distributions are declared and recorded on the ex-dividend date. Income dividends and capital gain distributions are declared separately for each class. Income and capital gain distributions are determined in accordance with income tax regulations, which may differ from GAAP.
Capital accounts within the financial statements are adjusted for permanent book-tax differences. These adjustments have no impact on net assets or the results of operations. Temporary book-tax differences will reverse in a subsequent period.
Book-tax differences are primarily due to futures transactions, foreign currency transactions, passive foreign investment companies (PFIC), market discount, partnerships,
Annual Report
3. Significant Accounting Policies - continued
Income Tax Information and Distributions to Shareholders - continued
equity-debt classifications, deferred trustees compensation, capital loss carryforwards and losses deferred due to wash sales.
The federal tax cost of investment securities and unrealized appreciation (depreciation) as of period end were as follows:
Gross unrealized appreciation | $ 397,150 |
Gross unrealized depreciation | (345,525) |
Net unrealized appreciation (depreciation) on securities and other investments | $ 51,625 |
| |
Tax Cost | $ 5,429,303 |
The tax-based components of distributable earnings as of period end were as follows:
Undistributed ordinary income | $ 4,586 |
Capital loss carryforward | $ (4,828,805) |
Net unrealized appreciation (depreciation) | $ 51,750 |
Under the recently enacted Regulated Investment Company Modernization Act of 2010 (the Act), the Fund will be permitted to carry forward capital losses incurred in taxable years beginning after December 22, 2010 for an unlimited period. However, any losses incurred during those future taxable years will be required to be utilized prior to any losses incurred in pre-enactment taxable years, which generally expire after eight years from when they are incurred. Additionally, post-enactment capital losses that are carried forward will retain their character as either short-term or long-term capital losses rather than being considered all short-term as under previous law. The Fund's first fiscal year end subject to the Act will be July 31, 2012.
The tax character of distributions paid was as follows:
| July 31, 2011 | July 31, 2010 |
Ordinary Income | $ 61,849 | $ 42,065 |
New Accounting Pronouncement. In May 2011, the Financial Accounting Standards Board issued Accounting Standard Update No. 2011-04, Fair Value Measurement (Topic 820) - Amendments to Achieve Common Fair Value Measurement and Disclosure Requirements in U.S. GAAP and IFRSs. The update changes the wording used to describe the requirements in GAAP for measuring fair value and for disclosing information about fair value measurements. The update is effective during interim and annual periods beginning after December 15, 2011. Management is currently
Annual Report
Notes to Financial Statements - continued
(Amounts in thousands except ratios)
3. Significant Accounting Policies - continued
New Accounting Pronouncement - continued
evaluating the impact of the update's adoption on the Fund's financial statement disclosures.
4. Operating Policies.
Delayed Delivery Transactions and When-Issued Securities. The Fund may purchase or sell securities on a delayed delivery or when-issued basis. Payment and delivery may take place after the customary settlement period for that security. The price of the underlying securities and the date when the securities will be delivered and paid for are fixed at the time the transaction is negotiated. During the time a delayed delivery sell is outstanding, the contract is marked-to-market daily and equivalent deliverable securities are held for the transaction. The securities purchased on a delayed delivery or when-issued basis are identified as such in the Fund's Schedule of Investments. The Fund may receive compensation for interest forgone in the purchase of a delayed delivery or when-issued security. With respect to purchase commitments, the Fund identifies securities as segregated in its records with a value at least equal to the amount of the commitment. Losses may arise due to changes in the value of the underlying securities or if the counterparty does not perform under the contract's terms, or if the issuer does not issue the securities due to political, economic, or other factors.
Restricted Securities. The Fund may invest in securities that are subject to legal or contractual restrictions on resale. These securities generally may be resold in transactions exempt from registration or to the public if the securities are registered. Disposal of these securities may involve time-consuming negotiations and expense, and prompt sale at an acceptable price may be difficult. Information regarding restricted securities is included at the end of the Fund's Schedule of Investments.
5. Derivative Instruments.
Risk Exposures and the Use of Derivative Instruments. The Fund used derivative instruments (derivatives), including futures contracts, in order to meet its investment objectives. The strategy is to use derivatives to increase returns and to manage exposure to certain risks as defined below. The success of any strategy involving derivatives depends on analysis of numerous economic factors, and if the strategies for investment do not work as intended, the Fund may not achieve its objectives.
Annual Report
5. Derivative Instruments - continued
Risk Exposures and the Use of Derivative Instruments - continued
The Fund's use of derivatives increased or decreased its exposure to the following risk:
Equity Risk | Equity risk relates to the fluctuations in the value of financial instruments as a result of changes in market prices (other than those arising from interest rate risk or foreign exchange risk), whether caused by factors specific to an individual investment, its issuer, or all factors affecting all instruments traded in a market or market segment. |
The Fund is also exposed to additional risks from investing in derivatives, such as liquidity risk and counterparty credit risk. Liquidity risk is the risk that the Fund will be unable to sell the derivative in the open market in a timely manner. Counterparty credit risk is the risk that the counterparty will not be able to fulfill its obligation to the Fund.
The Fund's maximum risk of loss from counterparty credit risk is generally the aggregate unrealized appreciation and unpaid counterparty payments in excess of any collateral pledged by the counterparty to the Fund. Counterparty risk related to exchange-traded futures contracts is minimal because of the protection provided by the exchange on which they trade. Derivatives involve, to varying degrees, risk of loss in excess of the amounts recognized in the Statement of Assets and Liabilities.
Futures Contracts. A futures contract is an agreement between two parties to buy or sell a specified underlying instrument for a fixed price at a specified future date. The Fund used futures contracts to manage its exposure to the stock market.
Upon entering into a futures contract, a fund is required to deposit either cash or securities (initial margin) with a clearing broker in an amount equal to a certain percentage of the face value of the contract. Futures contracts are marked-to-market daily and subsequent payments (variation margin) are made or received by a fund depending on the daily fluctuations in the value of the futures contracts and are recorded as unrealized appreciation or (depreciation). This receivable and/or payable is included in daily variation margin on futures contracts in the Statement of Assets and Liabilities. Realized gain or (loss) is recorded upon the expiration or closing of a futures contract.
The underlying face amount at value of open futures contracts at period end, if any, is shown in the Schedule of Investments under the caption "Futures Contracts." This amount reflects each contract's exposure to the underlying instrument at period end. Securities deposited to meet initial margin requirements are identified in the Schedule of Investments.
Certain risks arise upon entering into futures contracts, including the risk that an illiquid market limits the ability to close out a futures contract prior to settlement date.
Annual Report
Notes to Financial Statements - continued
(Amounts in thousands except ratios)
5. Derivative Instruments - continued
Futures Contracts - continued
During the period the Fund recognized net realized gain (loss) of $415 related to its investment in futures contracts. This amount is included in the Statement of Operations.
6. Purchases and Sales of Investments.
Purchases and sales of securities, other than short-term securities, aggregated $7,628,344 and $8,873,741, respectively.
7. Fees and Other Transactions with Affiliates.
Management Fee. FMR and its affiliates provide the Fund with investment management related services for which the Fund pays a monthly management fee. The management fee is the sum of an individual fund fee rate that is based on an annual rate of .20% of the Fund's average net assets and a group fee rate that averaged .26% during the period. The group fee rate is based upon the average net assets of all the mutual funds advised by FMR. The group fee rate decreases as assets under management increase and increases as assets under management decrease. For the period, the total annual management fee rate was .46% of the Fund's average net assets.
Transfer Agent Fees. Fidelity Investments Institutional Operations Company, Inc. (FIIOC), an affiliate of FMR, is the transfer, dividend disbursing and shareholder servicing agent for each class of the Fund. FIIOC receives account fees and asset-based fees that vary according to the account size and type of account of the shareholders of Growth and Income. FIIOC receives an asset-based fee of Class K's average net assets. FIIOC pays for typesetting, printing and mailing of shareholder reports, except proxy statements. For the period, transfer agent fees for each class were as follows:
| Amount | % of
Average
Net Assets |
Growth & Income | $ 12,686 | .23 |
Class K | 292 | .05 |
| $ 12,978 | |
Accounting and Security Lending Fees. Fidelity Service Company, Inc. (FSC), an affiliate of FMR, maintains the Fund's accounting records. The accounting fee is based on the level of average net assets for the month. Under a separate contract, FSC administers the security lending program. The security lending fee is based on the number and duration of lending transactions.
Annual Report
7. Fees and Other Transactions with Affiliates - continued
Brokerage Commissions. The Fund placed a portion of its portfolio transactions with brokerage firms which are affiliates of the investment adviser. The commissions paid to these affiliated firms were $234 for the period.
Interfund Lending Program. Pursuant to an Exemptive Order issued by the SEC, the Fund, along with other registered investment companies having management contracts with FMR, may participate in an interfund lending program. This program provides an alternative credit facility allowing the funds to borrow from, or lend money to, other participating affiliated funds. Any open loans, including accrued interest, at period end are presented under the caption "Notes Payable to Affiliates" in the Fund's Statement of Assets and Liabilities. The Fund's activity in this program during the period for which loans were outstanding was as follows:
Borrower or Lender | Average Daily
Loan Balance | Weighted Average
Interest Rate | Interest
Expense |
Borrower | $ 17,476 | .35% | $ 17 |
8. Committed Line of Credit.
The Fund participates with other funds managed by FMR or an affiliate in a $4.0 billion credit facility (the "line of credit") to be utilized for temporary or emergency purposes to fund shareholder redemptions or for other short-term liquidity purposes. The Fund has agreed to pay commitment fees on its pro-rata portion of the line of credit, which amounted to $20 and is reflected in Miscellaneous expenses on the Statement of Operations. During the period, there were no borrowings on this line of credit.
9. Security Lending.
The Fund lends portfolio securities through a lending agent from time to time in order to earn additional income. The lending agent may loan securities to certain qualified borrowers, including Fidelity Capital Markets (FCM), a broker-dealer affiliated with the Fund. On the settlement date of the loan, the Fund receives collateral (in the form of U.S. Treasury obligations, letters of credit and/or cash) against the loaned securities and maintains collateral in an amount not less than 100% of the market value of the loaned securities during the period of the loan. The market value of the loaned securities is determined at the close of business of the Fund and any additional required collateral is delivered to the Fund on the next business day. If the borrower defaults on its obligation to return the securities loaned because of insolvency or other reasons, a fund could experience delays and costs in recovering the securities loaned or in gaining access to the collateral. Any cash collateral received is invested in the Fidelity Securities Lending Cash Central Fund. The value of loaned securities and cash collateral at period end are
Annual Report
Notes to Financial Statements - continued
(Amounts in thousands except ratios)
9. Security Lending - continued
disclosed on the Fund's Statement of Assets and Liabilities. Security lending income represents the income earned on investing cash collateral, less rebates paid to borrowers and lending agent fees associated with the loan, plus any premium payments received for lending certain types of securities. Security lending income is presented in the Statement of Operations as a component of income from Fidelity Central Funds. Total security lending income during the period amounted to $510. During the period, there were no securities loaned to FCM.
10. Bank Borrowings.
The Fund is permitted to have bank borrowings for temporary or emergency purposes to fund shareholder redemptions or for other short-term liquidity requirements. The Fund has established borrowing arrangements with certain banks. The interest rate on the borrowings is the bank's base rate, as revised from time to time. The average daily loan balance during the period for which loans were outstanding amounted to $3,766. The weighted average interest rate was .59%. The interest expense amounted to four hundred twenty-nine dollars under the bank borrowing program. At period end, there were no bank borrowings outstanding.
11. Expense Reductions.
Many of the brokers with whom FMR places trades on behalf of the Fund provided services to the Fund in addition to trade execution. These services included payments of certain expenses on behalf of the Fund totaling $765 for the period. In addition, through arrangements with the Fund's custodian credits realized as a result of uninvested cash balances were used to reduce the Fund's expenses. During the period, these credits reduced the Fund's custody expenses by one hundred sixty-eight dollars.
12. Distributions to Shareholders.
Distributions to shareholders of each class were as follows:
Years ended July 31, | 2011 | 2010 |
From net investment income | | |
Growth & Income | $ 54,597 | $ 36,263 |
Class K | 7,252 | 2,320 |
Total | $ 61,849 | $ 38,583 |
From net realized gain | | |
Growth & Income | $ - | $ 3,285 |
Class K | - | 197 |
Total | $ - | $ 3,482 |
Annual Report
13. Share Transactions.
Transactions for each class of shares were as follows:
| Shares | Dollars |
Years ended July 31, | 2011 | 2010 A | 2011 | 2010 A |
Growth & Income | | | | |
Shares sold | 10,892 | 18,939 | $ 196,623 | $ 300,805 |
Conversion to Class K | - | (593) | - | (8,751) |
Reinvestment of distributions | 2,827 | 2,436 | 52,490 | 38,201 |
Shares redeemed | (85,823) | (93,499) | (1,509,810) | (1,487,904) |
Net increase (decrease) | (72,104) | (72,717) | $ (1,260,697) | $ (1,157,649) |
Class K | | | | |
Shares sold | 26,831 | 8,408 | $ 447,073 | $ 133,367 |
Conversion from Growth & Income | - | 593 | - | 8,751 |
Reinvestment of distributions | 390 | 161 | 7,252 | 2,517 |
Shares redeemed | (24,047) | (14,911) | (441,157) | (234,674) |
Net increase (decrease) | 3,174 | (5,749) | $ 13,168 | $ (90,039) |
A Conversion transactions for Class K and Growth & Income are presented for the period August 1, 2009 through August 31, 2009.
14. Other.
The Fund's organizational documents provide former and current trustees and officers with a limited indemnification against liabilities arising in connection with the performance of their duties to the Fund. In the normal course of business, the Fund may also enter into contracts that provide general indemnifications. The Fund's maximum exposure under these arrangements is unknown as this would be dependent on future claims that may be made against the Fund. The risk of material loss from such claims is considered remote.
Annual Report
To the Trustees of Fidelity Securities Fund and the Shareholders of Fidelity Growth & Income Portfolio:
In our opinion, the accompanying statement of assets and liabilities, including the schedule of investments, and the related statements of operations and of changes in net assets and the financial highlights present fairly, in all material respects, the financial position of Fidelity Growth & Income Portfolio (a fund of Fidelity Securities Fund) at July 31, 2011, the results of its operations for the year then ended, the changes in its net assets for each of the two years in the period then ended and the financial highlights for each of the periods indicated, in conformity with accounting principles generally accepted in the United States of America. These financial statements and financial highlights (hereafter referred to as "financial statements") are the responsibility of the Fidelity Growth & Income Portfolio's management. Our responsibility is to express an opinion on these financial statements based on our audits. We conducted our audits of these financial statements in accordance with the standards of the Public Company Accounting Oversight Board (United States). Those standards require that we plan and perform the audit to obtain reasonable assurance about whether the financial statements are free of material misstatement. An audit includes examining, on a test basis, evidence supporting the amounts and disclosures in the financial statements, assessing the accounting principles used and significant estimates made by management, and evaluating the overall financial statement presentation. We believe that our audits, which included confirmation of securities at July 31, 2011 by correspondence with the custodian and brokers, provide a reasonable basis for our opinion.
/s/ PricewaterhouseCoopers LLP
PricewaterhouseCoopers LLP
Boston, Massachusetts
September 13, 2011
Annual Report
The Trustees, Members of the Advisory Board, and executive officers of the trust and fund, as applicable, are listed below. The Board of Trustees governs the fund and is responsible for protecting the interests of shareholders. The Trustees are experienced executives who meet periodically throughout the year to oversee the fund's activities, review contractual arrangements with companies that provide services to the fund, oversee management of the risks associated with such activities and contractual arrangements, and review the fund's performance. Except for James C. Curvey, each of the Trustees oversees 221 funds advised by FMR or an affiliate. Mr. Curvey oversees 419 funds advised by FMR or an affiliate.
The Trustees hold office without limit in time except that (a) any Trustee may resign; (b) any Trustee may be removed by written instrument, signed by at least two-thirds of the number of Trustees prior to such removal; (c) any Trustee who requests to be retired or who has become incapacitated by illness or injury may be retired by written instrument signed by a majority of the other Trustees; and (d) any Trustee may be removed at any special meeting of shareholders by a two-thirds vote of the outstanding voting securities of the trust. Each Trustee who is not an interested person (as defined in the 1940 Act) (Independent Trustee), shall retire not later than the last day of the calendar year in which his or her 75th birthday occurs. The Independent Trustees may waive this mandatory retirement age policy with respect to individual Trustees. The executive officers and Advisory Board Members hold office without limit in time, except that any officer and Advisory Board Member may resign or may be removed by a vote of a majority of the Trustees at any regular meeting or any special meeting of the Trustees. Except as indicated, each individual has held the office shown or other offices in the same company for the past five years.
Experience, Skills, Attributes, and Qualifications of the Fund's Trustees. The Governance and Nominating Committee has adopted a statement of policy that describes the experience, qualifications, attributes, and skills that are necessary and desirable for potential Independent Trustee candidates (Statement of Policy). The Board believes that each Trustee satisfied at the time he or she was initially elected or appointed a Trustee, and continues to satisfy, the standards contemplated by the Statement of Policy. The Governance and Nominating Committee also engages professional search firms to help identify potential Independent Trustee candidates who have the experience, qualifications, attributes, and skills consistent with the Statement of Policy. From time to time, additional criteria based on the composition and skills of the current Independent Trustees, as well as experience or skills that may be appropriate in light of future changes to board composition, business conditions, and regulatory or other developments, have also been considered by the professional search firms and the Governance and Nominating Committee. In addition, the Board takes into account the Trustees' commitment and participation in Board and committee meetings, as well as their leadership of standing and ad hoc committees throughout their tenure.
In determining that a particular Trustee was and continues to be qualified to serve as a Trustee, the Board has considered a variety of criteria, none of which, in isolation, was controlling. The Board believes that, collectively, the Trustees have balanced and diverse experience, qualifications, attributes, and skills, which allow the Board to operate effectively in governing the fund and protecting the interests of shareholders. Information about the specific experience, skills, attributes, and qualifications of each Trustee, which in each case led to the Board's conclusion that the Trustee should serve (or continue to serve) as a trustee of the fund, is provided below.
Annual Report
Board Structure and Oversight Function. James C. Curvey is an interested person (as defined in the 1940 Act) and currently serves as Acting Chairman. The Trustees have determined that an interested Chairman is appropriate and benefits shareholders because an interested Chairman has a personal and professional stake in the quality and continuity of services provided to the fund. Independent Trustees exercise their informed business judgment to appoint an individual of their choosing to serve as Chairman, regardless of whether the Trustee happens to be independent or a member of management. The Independent Trustees have determined that they can act independently and effectively without having an Independent Trustee serve as Chairman and that a key structural component for assuring that they are in a position to do so is for the Independent Trustees to constitute a substantial majority for the Board. The Independent Trustees also regularly meet in executive session. Ned C. Lautenbach serves as Chairman of the Independent Trustees and as such (i) acts as a liaison between the Independent Trustees and management with respect to matters important to the Independent Trustees and (ii) with management prepares agendas for Board meetings.
Fidelity funds are overseen by different Boards of Trustees. The fund's Board oversees Fidelity's equity and high income funds and another Board oversees Fidelity's investment-grade bond, money market, and asset allocation funds. The asset allocation funds may invest in Fidelity funds overseen by the fund's Board. The use of separate Boards, each with its own committee structure, allows the Trustees of each group of Fidelity funds to focus on the unique issues of the funds they oversee, including common research, investment, and operational issues. On occasion, the separate Boards establish joint committees to address issues of overlapping consequences for the Fidelity funds overseen by each Board.
The Trustees operate using a system of committees to facilitate the timely and efficient consideration of all matters of importance to the Trustees, the fund, and fund shareholders and to facilitate compliance with legal and regulatory requirements and oversight of the fund's activities and associated risks. The Board, acting through its committees, has charged FMR and its affiliates with (i) identifying events or circumstances the occurrence of which could have demonstrably adverse effects on the fund's business and/or reputation; (ii) implementing processes and controls to lessen the possibility that such events or circumstances occur or to mitigate the effects of such events or circumstances if they do occur; and (iii) creating and maintaining a system designed to evaluate continuously business and market conditions in order to facilitate the identification and implementation processes described in (i) and (ii) above. Because the day-to-day operations and activities of the fund are carried out by or through FMR, its affiliates and other service providers, the fund's exposure to risks is mitigated but not eliminated by the processes overseen by the Trustees. While each of the Board's committees has responsibility for overseeing different aspects of the fund's activities, oversight is exercised primarily through the Operations, Audit, and Compliance Committees. Appropriate personnel, including but not limited to the fund's Chief Compliance Officer (CCO), FMR's internal auditor, the independent accountants, the fund's Treasurer and portfolio management personnel, make periodic reports to the Board's committees, as appropriate. The responsibilities of each committee, including their oversight responsibilities, are described further under "Standing Committees of the Fund's Trustees."
Annual Report
Trustees and Officers - continued
The fund's Statement of Additional Information (SAI) includes more information about the Trustees. To request a free copy, call Fidelity at 1-800-835-5092.
Interested Trustees*:
Correspondence intended for each Trustee who is an interested person may be sent to Fidelity Investments, 82 Devonshire Street, Boston, Massachusetts 02109.
Name, Age; Principal Occupations and Other Relevant Experience+ |
James C. Curvey (76) |
| Year of Election or Appointment: 2007
Mr. Curvey is Trustee and Acting Chairman of the Board of Trustees of certain Trusts. Mr. Curvey also serves as Trustee (2007-present) of other investment companies advised by FMR. Mr. Curvey is a Director of Fidelity Investments Money Management, Inc. (2009-present), Director of Fidelity Research & Analysis Co. (2009-present) and Director of FMR and FMR Co., Inc. (2007-present). Mr. Curvey is also Vice Chairman (2007-present) and Director of FMR LLC. In addition, Mr. Curvey serves as an Overseer for the Boston Symphony Orchestra and a member of the Trustees of Villanova University. Previously, Mr. Curvey was the Vice Chairman (2006-2007) and Director (2000-2007) of FMR Corp. |
Ronald P. O'Hanley (54) |
| Year of Election or Appointment: 2011
Mr. O'Hanley is Director of FMR Co., Inc. (2010-present), Director of Fidelity Investments Money Management, Inc. (2010-present), Director of Fidelity Research & Analysis Company (2010-present), President of Fidelity Asset Management and Corporate Services and a member of Fidelity's Executive Committee (2010-present). Previously, Mr. O'Hanley served as President and Chief Executive Officer of BNY Mellon Asset Management (2007-2010). Mr. O'Hanley also served as Vice Chairman of Bank New York Mellon Corp. and a member of that firm's Executive Committee. Prior to the 2007 merger of The Bank of New York and Mellon Financial Corporation, he was Vice Chairman of Mellon Financial Corporation and President and Chief Executive Officer of Mellon Asset Management. He joined Mellon in February 1997. Mr. O'Hanley currently serves as Chairman of the Boston Public Library Foundation Board of Directors and sits on the Board of Directors of Beth Israel Deaconess Medical Center, the Board of Trustees of the Marine Biological Laboratory and the Advisory Board of the Maxwell School of Citizenship and Public Administration at Syracuse University. Mr. O'Hanley also chairs the Council on Asset Management for the Financial Services Roundtable and is a member of the Board of Directors of Institutional Investor's U.S. Institute. |
* Trustees have been determined to be "Interested Trustees" by virtue of, among other things, their affiliation with the trust or various entities under common control with FMR.
+ The information above includes each Trustee's principal occupation during the last five years and other information relating to the experience, attributes, and skills relevant to each Trustee's qualifications to serve as a Trustee, which led to the conclusion that each Trustee should serve as a Trustee for the fund.
Annual Report
Trustees and Officers - continued
Independent Trustees:
Correspondence intended for each Independent Trustee (that is, the Trustees other than the Interested Trustees) may be sent to Fidelity Investments, P.O. Box 55235, Boston, Massachusetts 02205-5235.
Name, Age; Principal Occupations and Other Relevant Experience+ |
Dennis J. Dirks (63) |
| Year of Election or Appointment: 2005 Prior to his retirement in May 2003, Mr. Dirks was Chief Operating Officer and a member of the Board of The Depository Trust & Clearing Corporation (DTCC). He also served as President, Chief Operating Officer, and Board member of The Depository Trust Company (DTC) and President and Board member of the National Securities Clearing Corporation (NSCC). In addition, Mr. Dirks served as Chief Executive Officer and Board member of the Government Securities Clearing Corporation, Chief Executive Officer and Board member of the Mortgage-Backed Securities Clearing Corporation, as a Trustee and a member of the Finance Committee of Manhattan College (2005-2008), and as a Trustee and a member of the Finance Committee of AHRC of Nassau County (2006-2008). Mr. Dirks is a member of the Independent Directors Council (IDC) Governing Council (2010-Present) and Board of Directors for The Brookville Center for Children's Services, Inc. (2009-present). |
Alan J. Lacy (57) |
| Year of Election or Appointment: 2008 Mr. Lacy serves as Senior Adviser (2007-present) of Oak Hill Capital Partners, L.P. (private equity). Mr. Lacy also served as Chief Executive Officer (2000-2005) and Vice Chairman (2005-2006) of Sears Holdings Corporation and Sears, Roebuck and Co. (retail). In addition, Mr. Lacy serves as a member of the Board of Directors of Dave & Buster's, Inc. (restaurant and entertainment complexes, 2010-present), The Hillman Companies, Inc. (hardware wholesalers, 2010-present), and Bristol-Myers Squibb Company (global pharmaceuticals, 2007-present). Mr. Lacy is a member of the Board of Trustees of The National Parks Conservation Association (2006-Present). Previously, Mr. Lacy served as Chairman of the Board of Trustees of the National Parks Conservation Association (2008-2011) and as a member of the Board of Directors for the Western Union Company (global money transfer, 2006-2011). |
Ned C. Lautenbach (67) |
| Year of Election or Appointment: 2000 Mr. Lautenbach is Chairman of the Independent Trustees of the Equity and High Income Funds (2006-present). Mr. Lautenbach currently serves as the Lead Director of the Eaton Corporation Board of Directors (diversified industrial, 1997-present). Mr. Lautenbach is also a member of the Board of Directors of the Philharmonic Center for the Arts in Naples, Florida (1999-present); a member of the Board of Trustees of Fairfield University (2005-present); and a member of the Council on Foreign Relations (1994-present). Previously, Mr. Lautenbach was a Partner/Advisory Partner at Clayton, Dubilier & Rice, LLC (private equity investment, 1998-2010), as well as a Director of Sony Corporation (2006-2007). |
Joseph Mauriello (66) |
| Year of Election or Appointment: 2008 Prior to his retirement in January 2006, Mr. Mauriello served in numerous senior management positions including Deputy Chairman and Chief Operating Officer (2004-2005), and Vice Chairman of Financial Services (2002-2004) of KPMG LLP US (professional services, 1965-2005). Mr. Mauriello currently serves as a member of the Board of Directors of XL Group plc. (global insurance and re-insurance, 2006-present) and of Arcadia Resources Inc. (health care services and products, 2007-present). Previously, Mr. Mauriello served as a Director of the Hamilton Funds of the Bank of New York (2006-2007). |
Robert W. Selander (60) |
| Year of Election or Appointment: 2011
Previously, Mr. Selander served as a Member of the Advisory Board of Fidelity's Equity and High Income Funds (2011), Executive Vice Chairman (2010), Chief Executive Officer (2009-2010), and President and Chief Executive Officer (1997-2009) of Mastercard, Inc. |
Cornelia M. Small (67) |
| Year of Election or Appointment: 2005 Ms. Small is a member of the Board of Directors of the Teagle Foundation (2009-present). Ms. Small is also a member of the Investment Committee, and Chair (2008-present) and a member of the Board of Trustees of Smith College. In addition, Ms. Small serves on the Investment Committee of the Berkshire Taconic Community Foundation (2008-present). Previously, Ms. Small served as Chairperson of the Investment Committee (2002-2008) of Smith College. In addition, Ms. Small served as Chief Investment Officer, Director of Global Equity Investments, and a member of the Board of Directors of Scudder, Stevens & Clark and Scudder Kemper Investments. |
William S. Stavropoulos (72) |
| Year of Election or Appointment: 2002 Mr. Stavropoulos is Vice Chairman of the Independent Trustees of the Equity and High Income Funds (2006-present). Mr. Stavropoulos serves as President and Founder of the Michigan Baseball Foundation, the Great Lakes Loons (2007-present). Mr. Stavropoulos is Chairman Emeritus of the Board of Directors of The Dow Chemical Company, where he previously served in numerous senior management positions, including President, CEO (1995-2000; 2002-2004), Chairman of the Executive Committee (2000-2006), and as a member of the Board of Directors (1990-2006). Currently, Mr. Stavropoulos is Chairman of Univar (global distributor of commodity and specialty chemicals, 2010-present), a Director of Teradata Corporation (data warehousing and technology solutions, 2008-present), Chemical Financial Corporation, Maersk Inc. (industrial conglomerate), Tyco International, Inc. (multinational manufacturing and services, 2007-present), and a member of the Advisory Board for Metalmark Capital (private equity investment, 2005-present). Mr. Stavropoulos is a special advisor to Clayton, Dubilier & Rice, LLC (private equity investment). In addition, Mr. Stavropoulos is a member of the University of Notre Dame Advisory Council for the College of Science. |
David M. Thomas (62) |
| Year of Election or Appointment: 2008 Previously, Mr. Thomas served as Executive Chairman (2005-2006) and Chairman and Chief Executive Officer (2000-2005) of IMS Health, Inc. (pharmaceutical and healthcare information solutions). In addition, Mr. Thomas serves as a member of the Board of Directors of Fortune Brands, Inc. (consumer products), and Interpublic Group of Companies, Inc. (marketing communication, 2004-present). |
Michael E. Wiley (60) |
| Year of Election or Appointment: 2008 Mr. Wiley also serves as a Director of Asia Pacific Exploration Consolidated (international oil and gas exploration and production, 2008-present). Mr. Wiley serves as a Director of Tesoro Corporation (independent oil refiner and marketer, 2005-present), and a Director of Bill Barrett Corporation (exploration and production, 2005-present). In addition, Mr. Wiley also serves as a Director of Post Oak Bank (privately-held bank, 2004-present). Previously, Mr. Wiley served as a member of the Board of Trustees of the University of Tulsa (2000-2006; 2007-2010), as a Senior Energy Advisor of Katzenbach Partners, LLC (consulting, 2006-2007), as an Advisory Director of Riverstone Holdings (private investment), Chairman, President, and CEO of Baker Hughes, Inc. (oilfield services, 2000-2004), and as Director of Spinnaker Exploration Company (exploration and production, 2001-2005). |
Annual Report
+ The information above includes each Trustee's principal occupation during the last five years and other information relating to the experience, attributes, and skills relevant to each Trustee's qualifications to serve as a Trustee, which led to the conclusion that each Trustee should serve as a Trustee for the fund.
Advisory Board Member and Executive Officers:
Correspondence intended for each executive officer, Edward C. Johnson 3d, and Peter S. Lynch may be sent to Fidelity Investments, 82 Devonshire Street, Boston, Massachusetts 02109.
Name, Age; Principal Occupation |
Edward C. Johnson 3d (81) |
| Year of Election or Appointment: 2011 Member of the Advisory Board of Fidelity's Equity and High Income Funds. Mr. Johnson serves as Chief Executive Officer, Chairman, and a Director of FMR LLC, and also serves as Chairman and Director of FIL Limited. Previously, Mr. Johnson served as a Trustee and Chairman of the Board of certain Fidelity Trusts, Chairman and a Director of FMR, Chairman and a Director of FMR Co., Inc., and President of FMR LLC (2006-2007). |
Peter S. Lynch (67) |
| Year of Election or Appointment: 2003 Member of the Advisory Board of Fidelity's Equity and High Income Funds. Mr. Lynch is Vice Chairman and a Director of FMR and FMR Co., Inc. In addition, Mr. Lynch serves as a Trustee of Boston College and as the Chairman of the Inner-City Scholarship Fund. Previously, Mr. Lynch served on the Special Olympics International Board of Directors (1997-2006). |
Kenneth B. Robins (41) |
| Year of Election or Appointment: 2008 President and Treasurer of Fidelity's Equity and High Income Funds. Mr. Robins also serves as President and Treasurer (2010-present) and Assistant Treasurer (2009-present) of other Fidelity funds and is an employee of Fidelity Investments (2004-present). Previously, Mr. Robins served as Deputy Treasurer of the Fidelity funds (2005-2008) and Treasurer and Chief Financial Officer of The North Carolina Capital Management Trust: Cash and Term Portfolios (2006-2008). |
Bruce T. Herring (45) |
| Year of Election or Appointment: 2006 Vice President of certain Equity Funds. Mr. Herring also serves as Chief Investment Officer and Director of Fidelity Management & Research (U.K.) Inc. (2010-present) and Group Chief Investments Officer of FMR. Previously, Mr. Herring served as Vice President (2005-2006) and Senior Vice President (2006-2007) of Fidelity Management & Research Company, Vice President of FMR Co., Inc. (2001-2007) and as a portfolio manager for Fidelity U.S. Equity Funds. |
Brian B. Hogan (46) |
| Year of Election or Appointment: 2009 Vice President of Equity and High Income Funds. Mr. Hogan also serves as President of FMR's Equity Division (2009-present). Previously, Mr. Hogan served as Senior Vice President, Equity Research of FMR (2006-2009) and as a portfolio manager. |
Scott C. Goebel (43) |
| Year of Election or Appointment: 2008 Secretary and Chief Legal Officer (CLO) of the Fidelity funds. Mr. Goebel also serves as Secretary of Fidelity Investments Money Management, Inc. (FIMM) (2010-present) and Fidelity Research and Analysis Company (FRAC) (2010-present); Secretary and CLO of The North Carolina Capital Management Trust: Cash and Term Portfolios (2008-present); General Counsel, Secretary, and Senior Vice President of FMR (2008-present) and FMR Co., Inc. (2008-present); employed by FMR LLC or an affiliate (2001-present); Chief Legal Officer of Fidelity Management & Research (Hong Kong) Limited (2008-present) and Assistant Secretary of Fidelity Management & Research (Japan) Inc. (2008-present), and Fidelity Management & Research (U.K.) Inc. (2008-present). Previously, Mr. Goebel served as Assistant Secretary of FIMM (2008-2010), FRAC (2008-2010), and the Funds (2007-2008) and as Vice President and Secretary of Fidelity Distributors Corporation (FDC) (2005-2007). |
William C. Coffey (42) |
| Year of Election or Appointment: 2009 Assistant Secretary of Fidelity's Equity and High Income Funds. Mr. Coffey also serves as Senior Vice President and Deputy General Counsel of FMR LLC (2010-present), and is an employee of Fidelity Investments. Previously, Mr. Coffey served as Vice President and Associate General Counsel of FMR LLC (2005-2009). |
Holly C. Laurent (57) |
| Year of Election or Appointment: 2008 Anti-Money Laundering (AML) Officer of the Fidelity funds. Ms. Laurent also serves as AML Officer of The North Carolina Capital Management Trust: Cash and Term Portfolios (2008-present) and is an employee of Fidelity Investments. Previously, Ms. Laurent was Senior Vice President and Head of Legal for Fidelity Business Services India Pvt. Ltd. (2006-2008), and Senior Vice President, Deputy General Counsel and Group Head for FMR LLC (2005-2006). |
Christine Reynolds (52) |
| Year of Election or Appointment: 2008 Chief Financial Officer of the Fidelity funds. Ms. Reynolds became President of Fidelity Pricing and Cash Management Services (FPCMS) in August 2008. Ms. Reynolds served as Chief Operating Officer of FPCMS (2007-2008). Previously, Ms. Reynolds served as President, Treasurer, and Anti-Money Laundering officer of the Fidelity funds (2004-2007). |
Kenneth A. Rathgeber (64) |
| Year of Election or Appointment: 2004 Chief Compliance Officer of Fidelity's Equity and High Income Funds. Mr. Rathgeber is Chief Compliance Officer of Fidelity Management & Research (Hong Kong) Limited (2008-present), Fidelity Management & Research (Japan) Inc. (2008-present), FMR (2005-present), FMR Co., Inc. (2005-present), Fidelity Management & Research (U.K.) Inc. (2005-present), Fidelity Research & Analysis Company (2005-present), Fidelity Investments Money Management, Inc. (2005-present), Pyramis Global Advisors, LLC (2005-present), and Strategic Advisers, Inc. (2005-present). |
Jeffrey S. Christian (49) |
| Year of Election or Appointment: 2009 Deputy Treasurer of the Fidelity funds. Mr. Christian is an employee of Fidelity Investments. Previously, Mr. Christian served as Chief Financial Officer (2008-2009) of certain Fidelity funds and Senior Vice President of Fidelity Pricing and Cash Management Services (FPCMS) (2004-2009). |
Bryan A. Mehrmann (50) |
| Year of Election or Appointment: 2005 Deputy Treasurer of the Fidelity funds. Mr. Mehrmann is an employee of Fidelity Investments. |
Adrien E. Deberghes (43) |
| Year of Election or Appointment: 2008 Deputy Treasurer of Fidelity's Equity and High Income Funds. Mr. Deberghes also serves as Assistant Treasurer of other Fidelity funds (2010-present) and is an employee of Fidelity Investments (2008-present). Previously, Mr. Deberghes served as Senior Vice President of Mutual Fund Administration at State Street Corporation (2007-2008), Senior Director of Mutual Fund Administration at Investors Bank & Trust (2005-2007), and Director of Finance for Dunkin' Brands (2000-2005). |
Stephanie J. Dorsey (42) |
| Year of Election or Appointment: 2010 Assistant Treasurer of Fidelity's Equity and High Income Funds. Ms. Dorsey also serves as Deputy Treasurer of other Fidelity funds (2008-present) and is an employee of Fidelity Investments (2008-present). Previously, Ms. Dorsey served as Treasurer (2004-2008) of the JPMorgan Mutual Funds and Vice President (2004-2008) of JPMorgan Chase Bank. |
John R. Hebble (53) |
| Year of Election or Appointment: 2009 Assistant Treasurer of Fidelity's Equity and High Income Funds. Mr. Hebble also serves as President (2011-present), Treasurer, and Chief Financial Officer of The North Carolina Capital Management Trust: Cash and Term Portfolios (2008-present), President and Treasurer of other Fidelity funds (2008-present) and is an employee of Fidelity Investments. |
Gary W. Ryan (52) |
| Year of Election or Appointment: 2005 Assistant Treasurer of the Fidelity funds. Mr. Ryan is an employee of Fidelity Investments. Previously, Mr. Ryan served as Vice President of Fund Reporting in Fidelity Pricing and Cash Management Services (FPCMS) (1999-2005). |
Jonathan Davis (43) |
| Year of Election or Appointment: 2010 Assistant Treasurer of the Fidelity funds. Mr. Davis is an employee of Fidelity Investments. Previously, Mr. Davis served as Vice President and Associate General Counsel of FMR LLC (2003-2010). |
Annual Report
A total of 0.03% of the dividends distributed during the fiscal year was derived from interest on U.S. Government securities which is generally exempt from state income tax.
Class K designates 100% of the dividends distributed during the fiscal year as qualifying for the dividends-received deduction for corporate shareholders.
Class K designates 100% of the dividends distributed during the fiscal year as amounts which may be taken into account as a dividend for purposes of the maximum rate under section 1(h)(11) of the Internal Revenue Code.
The fund will notify shareholders in January 2012 of amounts for use in preparing 2011 income tax returns.
Annual Report
Board Approval of Investment Advisory Contracts and Management Fees
Fidelity Growth & Income Portfolio
Each year, the Board of Trustees, including the Independent Trustees (together, the Board), votes on the renewal of the management contract and sub-advisory agreements (together, the Advisory Contracts) for the fund. The Board, assisted by the advice of fund counsel and Independent Trustees' counsel, requests and considers a broad range of information relevant to the renewal of the Advisory Contracts throughout the year.
The Board meets regularly and considers at each of its meetings factors that are relevant to its annual consideration of the renewal of the fund's Advisory Contracts, including the services and support provided to the fund and its shareholders. The Board has established various standing committees, each composed of Independent Trustees with varying backgrounds, to which the Board has assigned specific subject matter responsibilities in order to enhance effective decision-making by the Board. The Board, acting directly and through its Committees, requests and receives information concerning the annual consideration of the renewal of the fund's Advisory Contracts. The Board also meets as needed to consider matters specifically related to the Board's annual consideration of the renewal of Advisory Contracts. Members of the Board may also meet with trustees of other Fidelity funds through ad hoc joint committees to discuss certain matters relevant to the Fidelity funds.
At its July 2011 meeting, the Board of Trustees, including the Independent Trustees, unanimously determined to renew the fund's Advisory Contracts. In reaching its determination, the Board considered all factors it believed relevant, including (i) the nature, extent, and quality of the services to be provided to the fund and its shareholders (including the investment performance of the fund); (ii) the competitiveness of the fund's management fee and total expense ratio; (iii) the total costs of the services to be provided by and the profits to be realized by Fidelity from its relationship with the fund; (iv) the extent to which economies of scale would be realized as the fund grows; and (v) whether fee levels reflect these economies of scale, if any, for the benefit of fund shareholders.
In considering whether to renew the Advisory Contracts for the fund, the Board reached a determination, with the assistance of fund counsel and Independent Trustees' counsel and through the exercise of its business judgment, that the renewal of the Advisory Contracts is in the best interests of the fund and its shareholders and that the compensation payable under the Advisory Contracts is fair and reasonable. The Board's decision to renew the Advisory Contracts was not based on any single factor, but rather was based on a comprehensive consideration of all the information provided to the Board at its meetings throughout the year. The Board, in reaching its determination to renew the Advisory Contracts, is aware that shareholders in the fund have a broad range of investment choices available to them, including a wide choice among mutual funds offered by Fidelity's competitors, and that the fund's shareholders, who have the opportunity to review and weigh the disclosure provided by the fund in its prospectus and other public disclosures, have chosen to invest in this fund, managed by Fidelity.
Annual Report
Nature, Extent, and Quality of Services Provided. The Board considered the staffing within the investment adviser, FMR, and the sub-advisers (together, the Investment Advisers), including the backgrounds of the fund's investment personnel and the fund's investment objective and discipline. The Independent Trustees also had discussions with senior management of Fidelity's investment operations and investment groups. The Board considered the structure of the portfolio manager compensation program and whether this structure provides appropriate incentives to act in the best interests of the fund.
Resources Dedicated to Investment Management and Support Services. The Board and the Fund Oversight and Research Committees reviewed the general qualifications and capabilities of the Investment Advisers' investment staff, including its size, education, experience, and resources, as well as the Investment Advisers' approach to recruiting, training, managing, and compensating investment personnel. The Board also noted that FMR has devoted increased resources to non-U.S. offices. The Board noted that Fidelity's analysts have extensive resources, tools and capabilities which allow them to conduct sophisticated quantitative and fundamental analysis, as well as credit analysis of issuers, counterparties and enhancers. The Board also believes that Fidelity's investment professionals have sufficient access to global information and data so as to provide competitive investment results over time, and that those professionals also have access to sophisticated tools which permit them to assess portfolio construction and risk and performance attribution characteristics continuously, as well as to transmit new information and research conclusions rapidly around the world. Additionally, in their deliberations, the Board considered the Investment Advisers' trading capabilities and resources which are an integral part of the investment management process.
Shareholder and Administrative Services. The Board considered (i) the nature, extent, quality, and cost of advisory, administrative, and shareholder services performed by the Investment Advisers and their affiliates under the Advisory Contracts and under separate agreements covering transfer agency, pricing and bookkeeping, and securities lending services for the fund; (ii) the nature and extent of the investment adviser's supervision of third party service providers, principally custodians and subcustodians; and (iii) the resources devoted to, and the record of compliance with, the fund's compliance policies and procedures. The Board also reviewed the allocation of fund brokerage, including allocations to brokers affiliated with the Investment Advisers, the use of brokerage commissions to pay fund expenses, and the use of "soft" commission dollars to pay for research services.
The Board noted that the growth of fund assets over time across the complex allows Fidelity to reinvest in the development of services designed to enhance the value or convenience of the Fidelity funds as investment vehicles. These services include 24-hour access to account information and market information through telephone representatives and over the Internet, investor education materials and asset allocation tools, and the expanded availability of Fidelity Investor Centers, with 35 new branches opening since 2010.
Annual Report
Board Approval of Investment Advisory Contracts and
Management Fees - continued
Investment in a Large Fund Family. The Board considered the benefits to shareholders of investing in a Fidelity fund, including the benefits of investing in a fund that is part of a large family of funds offering a variety of investment disciplines and providing a large variety of mutual fund investor services. The Board noted that Fidelity had taken, or had made recommendations that resulted in the Fidelity funds taking, a number of actions over the previous year that benefited particular funds, including (i) continuing to dedicate additional resources to investment research and support of the senior management team that oversees asset management; (ii) rationalizing product lines through the mergers of six funds into other funds; (iii) continuing to migrate the Freedom Funds to dedicated lower cost underlying funds; (iv) obtaining shareholder approval to broaden the investment strategies for Fidelity Consumer Finance Portfolio, Fidelity Emerging Asia Fund, and Fidelity Environment and Alternative Energy Portfolio; (v) contractually agreeing to reduce the management fees and impose other expense limitations on Spartan® 500 Index Fund and U.S. Bond Index Fund in connection with launching new institutional classes of these funds; (vi) changing the name, primary and supplemental benchmarks, and investment policies of Fidelity Global Strategies Fund to support the fund's flexible investment mandate and global orientation; and (vii) reducing the transfer agency account fee rates on certain accounts.
Investment Performance. The Board considered whether the fund has operated in accordance with its investment objective, as well as its record of compliance with its investment restrictions. It also reviewed the fund's absolute investment performance for each class, as well as the fund's relative investment performance for each class measured over multiple periods against (i) a broad-based securities market index, and (ii) a peer group of mutual funds deemed appropriate by Fidelity and reviewed by the Board. The following charts considered by the Board show, over the one-, three-, and five-year periods ended December 31, 2010, as available, the cumulative total returns of Class K and the retail class of the fund, the cumulative total returns of a broad-based securities market index ("benchmark"), and a range of cumulative total returns of a peer group of mutual funds identified by Morningstar, Inc. as having an investment style similar to that of the fund based on underlying portfolio holdings. The box within each chart shows the 25th percentile return (bottom of box) and the 75th percentile return (top of box) of the peer group. Returns shown above the box are in the first quartile and returns shown below the box are in the fourth quartile. The percentage beaten numbers noted below each chart correspond to the percentile box and represent the percentage of funds in the peer group whose performance was equal to or lower than that of the class indicated.
Annual Report
Fidelity Growth & Income Portfolio
The Board reviewed the fund's relative investment performance against its peer group and noted that the performance of the retail class of the fund (the class with the longer performance record) was in the second quartile for the one-year period and the fourth quartile for the three- and five-year periods. The Board also noted that the investment performance of the fund was lower than its benchmark for all the periods shown. The Board considered that the variations in performance between the fund's classes reflect the variations in class expenses, which result in lower performance for the higher expense class. The Board also reviewed the fund's performance since inception as well as performance in the current year.
Based on its review, the Board concluded that the nature, extent, and quality of services provided to the fund under the Advisory Contracts should benefit the fund's shareholders.
Competitiveness of Management Fee and Total Expense Ratio. The Board considered the fund's management fee and total expense ratio compared to "mapped groups" of competitive funds and classes. Fidelity creates "mapped groups" by combining similar Lipper investment objective categories that have comparable management fee characteristics. Combining Lipper investment objective categories aids the Board's management fee and total expense ratio comparisons by broadening the competitive group used for comparison and by reducing the number of universes to which various Fidelity funds are compared.
Management Fee. The Board considered two proprietary management fee comparisons for the 12-month periods shown in the chart below. The group of Lipper funds used by the Board for management fee comparisons is referred to below as the "Total Mapped Group." The Total Mapped Group comparison focuses on a fund's standing relative to the total universe of comparable funds available to investors in terms of gross management fees before expense reimbursements or caps. "TMG %" represents the percentage of funds in the Total Mapped Group that had management fees that were lower than the fund's. For example, a TMG % of 13% means that 87% of the funds in the Total Mapped Group had higher management fees than the fund. The "Asset-Size Peer Group" (ASPG) comparison focuses on a fund's standing relative to non-Fidelity funds similar in size to the fund within the Total Mapped Group. The ASPG represents at least 15% of the funds in the Total Mapped Group with comparable asset size and management fee characteristics, subject to a minimum of 50 funds (or all funds in the Total Mapped Group if fewer than 50). Additional information, such as the ASPG quartile in which the fund's management fee ranked, is also included in the chart and considered by the Board.
Annual Report
Board Approval of Investment Advisory Contracts and
Management Fees - continued
Fidelity Growth & Income Portfolio
The Board noted that the fund's management fee ranked below the median of its Total Mapped Group and below the median of its ASPG for 2010.
Based on its review, the Board concluded that the fund's management fee is fair and reasonable in light of the services that the fund receives and the other factors considered.
Total Expense Ratio. In its review of each class's total expense ratio, the Board considered the fund's management fee as well as other fund or class expenses, as applicable, such as transfer agent fees, pricing and bookkeeping fees, and custodial, legal, and audit fees. The Board also noted the effects of any waivers and reimbursements on fees and expenses. As part of its review, the Board also considered the current and historical total expense ratios of each class of the fund compared to competitive fund median expenses. Each class of the fund is compared to those funds and classes in the Total Mapped Group (used by the Board for management fee comparisons) that have a similar sales load structure.
Annual Report
The Board noted that the total expense ratio of each class ranked below its competitive median for 2010. The Board considered that various factors, including 12b-1 fees, positive or negative performance adjustments, and relatively higher other expenses in the case of small fund size, can affect total expense ratios.
Fees Charged to Other Fidelity Clients. The Board also considered Fidelity fee structures and other information with respect to clients of FMR and its affiliates, such as other mutual funds advised or subadvised by FMR or its affiliates, pension plan clients, and other institutional clients. In March 2010, the Board created an ad hoc joint committee with the board of other Fidelity funds (the Committee) to review and compare Fidelity's institutional investment advisory business with its business of providing services to the Fidelity funds, including the differences in services provided, fees charged, and costs incurred, as well as competition in their respective marketplaces.
Based on its review of total expense ratios and fees charged to other Fidelity clients, the Board concluded that the total expense ratio of each class of the fund was reasonable in light of the services that the fund and its shareholders receive and the other factors considered, including the findings of the Committee.
Costs of the Services and Profitability. The Board considered the revenues earned and the expenses incurred by Fidelity in conducting the business of developing, marketing, distributing, managing, administering and servicing the fund and its shareholders. The Board also considered the level of Fidelity's profits in respect of all the Fidelity funds.
On an annual basis, FMR presents to the Board Fidelity's profitability for the fund. Fidelity calculates the profitability for each fund, as well as aggregate profitability for groups of Fidelity funds and all Fidelity funds, using a series of detailed revenue and cost allocation methodologies which originate with the books and records of Fidelity on which Fidelity's audited financial statements are based. The Audit Committee of the Board reviews any significant changes from the prior year's methodologies.
PricewaterhouseCoopers LLP (PwC), independent registered public accounting firm and auditor to Fidelity and certain Fidelity funds, has been engaged annually by the Board as part of the Board's assessment of Fidelity's profitability analysis. PwC's engagement includes the review and assessment of Fidelity's methodologies used in determining the revenues and expenses attributable to Fidelity's mutual fund business, and completion of agreed-upon procedures surrounding the mathematical accuracy of fund profitability and its conformity to allocation methodologies. After considering PwC's reports issued under the engagement and information provided by Fidelity, the Board concluded that while other allocation methods may also be reasonable, Fidelity's profitability methodologies are reasonable in all material respects.
Annual Report
Board Approval of Investment Advisory Contracts and
Management Fees - continued
The Board also reviewed Fidelity's non-fund businesses and fall-out benefits related to the mutual fund business as well as cases where Fidelity's affiliates may benefit from or be related to the fund's business.
The Board considered the costs of the services provided by and the profits realized by Fidelity in connection with the operation of the fund and was satisfied that the profitability was not excessive in the circumstances.
Economies of Scale. The Board considered whether there have been economies of scale in respect of the management of the Fidelity funds, whether the Fidelity funds (including the fund) have appropriately benefited from any such economies of scale, and whether there is potential for realization of any further economies of scale. The Board considered the extent to which the fund will benefit from economies of scale through increased services to the fund, through waivers or reimbursements, or through fee or expense reductions. The Board also noted that in 2009, it and the board of other Fidelity funds created an ad hoc committee (the Economies of Scale Committee) to analyze whether FMR attains economies of scale in respect of the management and servicing of the Fidelity funds, whether the Fidelity funds have appropriately benefited from such economies of scale, and whether there is potential for realization of any further economies of scale.
The Board recognized that the fund's management contract incorporates a "group fee" structure, which provides for lower group fee rates as total fund assets under FMR's management increase, and for higher group fee rates as total fund assets under FMR's management decrease. FMR calculates the group fee rates based on a tiered asset "breakpoint" schedule that varies based on asset class. The Board considered that the group fee is designed to deliver the benefits of economies of scale to fund shareholders when total Fidelity fund assets increase, even if assets of any particular fund are unchanged or have declined, because some portion of Fidelity's costs are attributable to services provided to all Fidelity funds, and all funds benefit if those costs can be allocated among more assets. The Board concluded that, given the group fee structure, fund shareholders will benefit from lower management fees as assets under FMR's management increase at the fund complex level, regardless of whether Fidelity achieves any such economies of scale.
The Board concluded, taking into account the analysis of the Economies of Scale Committee, that any potential economies of scale are being appropriately shared between fund shareholders and Fidelity.
Annual Report
Additional Information Requested by the Board. In order to develop fully the factual basis for consideration of the Fidelity funds' Advisory Contracts, the Board requested and received additional information on certain topics, including (i) fund performance trends, actions to be taken by FMR to improve certain funds' overall performance, and Fidelity's long-term strategies for certain funds; (ii) portfolio manager changes that have occurred during the past year and length of portfolio manager tenure for different categories of funds over time; (iii) Fidelity's compensation structure for portfolio managers and other key personnel and strategies for attracting and retaining non-investment personnel; (iv) the amount of the investment that each portfolio manager has made in the Fidelity fund(s) that he or she manages; (v) historical trends in Fidelity's realization of fall-out benefits; (vi) Fidelity's group fee structures and the rationale for the individual fee rates of certain funds; (vii) fund profitability methodology and the impact of certain factors on fund profitability results; (viii) trends regarding industry use of performance fee structures and Fidelity's compliance practices with respect to performance adjustment calculations; (ix) the fee structures in place for certain other Fidelity clients; and (x) explanations regarding the relative total expense ratios of certain funds and classes, total expense competitive trends, and actions that might be taken by FMR to reduce total expense ratios for certain funds and classes.
Based on its evaluation of all of the conclusions noted above, and after considering all factors it believed relevant, the Board ultimately concluded that the advisory fee structures are fair and reasonable, and that the fund's Advisory Contracts should be renewed.
Annual Report
Managing Your Investments
Fidelity offers several ways to conveniently manage your workplace benefits (including your workplace savings plan, investments, and additional services) via your telephone or PC. You can access your plan and account information and research your investments 24 hours a day.
By Phone
Fidelity provides a single toll-free number to access plan information, account balances, positions, and quotes*. It's easy to navigate the service, and on your first call, the system will help you create a personal identification number (PIN) for security.
(phone_graphic)
Fidelity Workplace
Investing
1-800-835-5092
By PC
Fidelity's web site on the Internet provides a wide range of information, including plan information, daily financial news, fund performance, interactive planning tools, and news about Fidelity products and services.
(computer_graphic)
Fidelity's Web Site
www.401k.com
* When you call the quotes line, please remember that a fund's yield and return will vary and, except for money market funds, share price will also vary. This means that you may have a gain or loss when you sell your shares. There is no assurance that money market funds will be able to maintain a stable $1 share price; an investment in a money market fund is not insured or guaranteed by the U.S. government. Total returns are historical and include changes in share price, reinvestment of dividends and capital gains distributions, and the effects of any sales charges.
Annual Report
To Write Fidelity
We'll give your correspondence immediate attention and send you written confirmation upon completion of your request.
(letter_graphic)
For Non-Retirement
Accounts
Buying shares
Fidelity Investments
P.O. Box 770001
Cincinnati, OH 45277-0003
Overnight Express
Fidelity Investments
Attn: Distribution Services
100 Crosby Parkway - KC1H
Covington, KY 41015
Selling shares
Fidelity Investments
P.O. Box 770001
Cincinnati, OH 45277-0035
Overnight Express
Fidelity Investments
Attn: Distribution Services
100 Crosby Parkway - KC1H
Covington, KY 41015
General Correspondence
Fidelity Investments
P.O. Box 500
Merrimack, NH 03054-0500
(letter_graphic)
For Retirement
Accounts
Buying shares
Fidelity Investments
P.O. Box 770001
Cincinnati, OH 45277-0003
Selling shares
Fidelity Investments
P.O. Box 770001
Cincinnati, OH 45277-0035
Overnight Express
Fidelity Investments
Attn: Distribution Services
100 Crosby Parkway - KC1H
Covington, KY 41015
General Correspondence
Fidelity Investments
P.O. Box 500
Merrimack, NH 03054-0500
Annual Report
Investment Adviser
Fidelity Management & Research Company
Boston, MA
Investment Sub-Advisers
FMR Co., Inc.
Fidelity Management & Research
(U.K.) Inc.
Fidelity Management & Research
(Japan) Inc.
Fidelity Management & Research
(Hong Kong) Limited
General Distributor
Fidelity Distributors Corporation
Boston, MA
Transfer and Service Agents
Fidelity Investments Institutional
Operations Company, Inc.
Boston, MA
Fidelity Service Company, Inc.
Boston, MA
Custodian
Northern Trust Company
Chicago, IL
GAI-K-UANN-0911
1.863229.102
Fidelity®
International Real Estate
Fund
Annual Report
July 31, 2011
(2_fidelity_logos) (Registered_Trademark)
Contents
Chairman's Message | <Click Here> | The Chairman's message to shareholders. |
Performance | <Click Here> | How the fund has done over time. |
Management's Discussion of Fund Performance | <Click Here> | The Portfolio Manager's review of fundperformance and strategy. |
Shareholder Expense Example | <Click Here> | An example of shareholder expenses. |
Investment Changes | <Click Here> | A summary of major shifts in the fund's investments over the past six months. |
Investments | <Click Here> | A complete list of the fund's investments with their market values. |
Financial Statements | <Click Here> | Statements of assets and liabilities, operations, and changes in net assets,
as well as financial highlights. |
Notes | <Click Here> | Notes to the financial statements. |
Report of Independent Registered Public Accounting Firm | <Click Here> | |
Trustees and Officers | <Click Here> | |
Distributions | <Click Here> | |
Board Approval of Investment Advisory Contracts and Management Fees | <Click Here> | |
To view a fund's proxy voting guidelines and proxy voting record for the 12-month period ended June 30, visit http://www.fidelity.com/proxyvotingresults or visit the Securities and Exchange Commission's (SEC) web site at http://www.sec.gov. You may also call 1-800-544-8544 to request a free copy of the proxy voting guidelines.
Standard & Poor's, S&P and S&P 500 are registered service marks of The McGraw-Hill Companies, Inc. and have been licensed for use by Fidelity Distributors Corporation.
Other third party marks appearing herein are the property of their respective owners.
All other marks appearing herein are registered or unregistered trademarks or service marks of FMR LLC or an affiliated company.
Annual Report
This report and the financial statements contained herein are submitted for the general information of the shareholders of the fund. This report is not authorized for distribution to prospective investors in the fund unless preceded or accompanied by an effective prospectus.
A fund files its complete schedule of portfolio holdings with the SEC for the first and third quarters of each fiscal year on Form N-Q. Forms N-Q are available on the SEC's web site at http://www.sec.gov. A fund's Forms N-Q may be reviewed and copied at the SEC's Public Reference Room in Washington, DC. Information regarding the operation of the SEC's Public Reference Room may be obtained by calling 1-800-SEC-0330. For a complete list of a fund's portfolio holdings, view the most recent holdings listing, semiannual report, or annual report on Fidelity's web site at http://www.fidelity.com, http://www.advisor.fidelity.com, or http://www.401k.com, as applicable.
NOT FDIC INSURED • MAY LOSE VALUE • NO BANK GUARANTEE
Neither the fund nor Fidelity Distributors Corporation is a bank.
Annual Report
(photo_of_James_C_Curvey)
Dear Shareholder:
The second half of 2011 began with U.S. equities continuing to give back some of the gains achieved earlier in the year. In the days leading up to July 31, markets were shaken by a political stalemate in which Congress struggled to address the debt ceiling issue before an early-August deadline. The resulting uncertainty held back markets in July, the third consecutive monthly decline for equities, effectively reversing the positive momentum seen through the end of April. Financial markets are always unpredictable, of course, but there are several time-tested investment principles that can help put the odds in your favor.
One of the basic tenets is to invest for the long term. Over time, riding out the markets' inevitable ups and downs has proven much more effective than selling into panic or chasing the hottest trend. Even missing only a few of the markets' best days can significantly diminish investor returns. Patience also affords the benefits of compounding - of earning interest on additional income or reinvested dividends and capital gains. There can be tax advantages and cost benefits to consider as well. While staying the course doesn't eliminate risk, it can considerably lessen the effect of short-term declines.
You can further manage your investing risk through diversification. And today, more than ever, geographic diversification should be taken into account. Studies indicate that asset allocation is the single most important determinant of a portfolio's long-term success. The right mix of stocks, bonds and cash - aligned to your particular risk tolerance and investment objective - is very important. Age-appropriate rebalancing is also an essential aspect of asset allocation. For younger investors, an emphasis on equities - which historically have been the best-performing asset class over time - is encouraged. As investors near their specific goal, such as retirement or sending a child to college, consideration may be given to replacing volatile assets (e.g. common stocks) with more-stable fixed investments (bonds or savings plans).
A third principle - investing regularly - can help lower the average cost of your purchases. Investing a certain amount of money each month or quarter helps ensure you won't pay for all your shares at market highs. This strategy - known as dollar cost averaging - also reduces "emotion" from investing, helping shareholders avoid selling weak performers just prior to an upswing, or chasing a hot performer just before a correction.
We invite you to contact us via the Internet, through our Investor Centers or by phone. It is our privilege to provide you the information you need to make the investments that are right for you.
Sincerely,
(The acting chairman's signature appears here.)
James C. Curvey
Acting Chairman
Annual Report
Average annual total return reflects the change in the value of an investment, assuming reinvestment of the class' distributions from dividend income and capital gains (the profits earned upon the sale of securities that have grown in value, if any) and assuming a constant rate of performance each year. The $10,000 table and the fund's returns do not reflect the deduction of taxes that a shareholder would pay on fund distributions or the redemption of fund shares. During periods of reimbursement by Fidelity, a fund's total return will be greater than it would be had the reimbursement not occurred. How a fund did yesterday is no guarantee of how it will do tomorrow.
Average Annual Total Returns
Periods ended July 31, 2011 | Past 1
year | Past 5
years | Life of fund A |
Fidelity® International Real Estate Fund | 17.15% | -2.58% | 4.60% |
A From September 8, 2004.
$10,000 Over Life of Fund
Let's say hypothetically that $10,000 was invested in Fidelity® International Real Estate Fund, a class of the fund, on September 8, 2004, when the fund started. The chart shows how the value of your investment would have changed, and also shows how the MSCI® EAFE® (Europe, Australasia, Far East) Index performed over the same period.
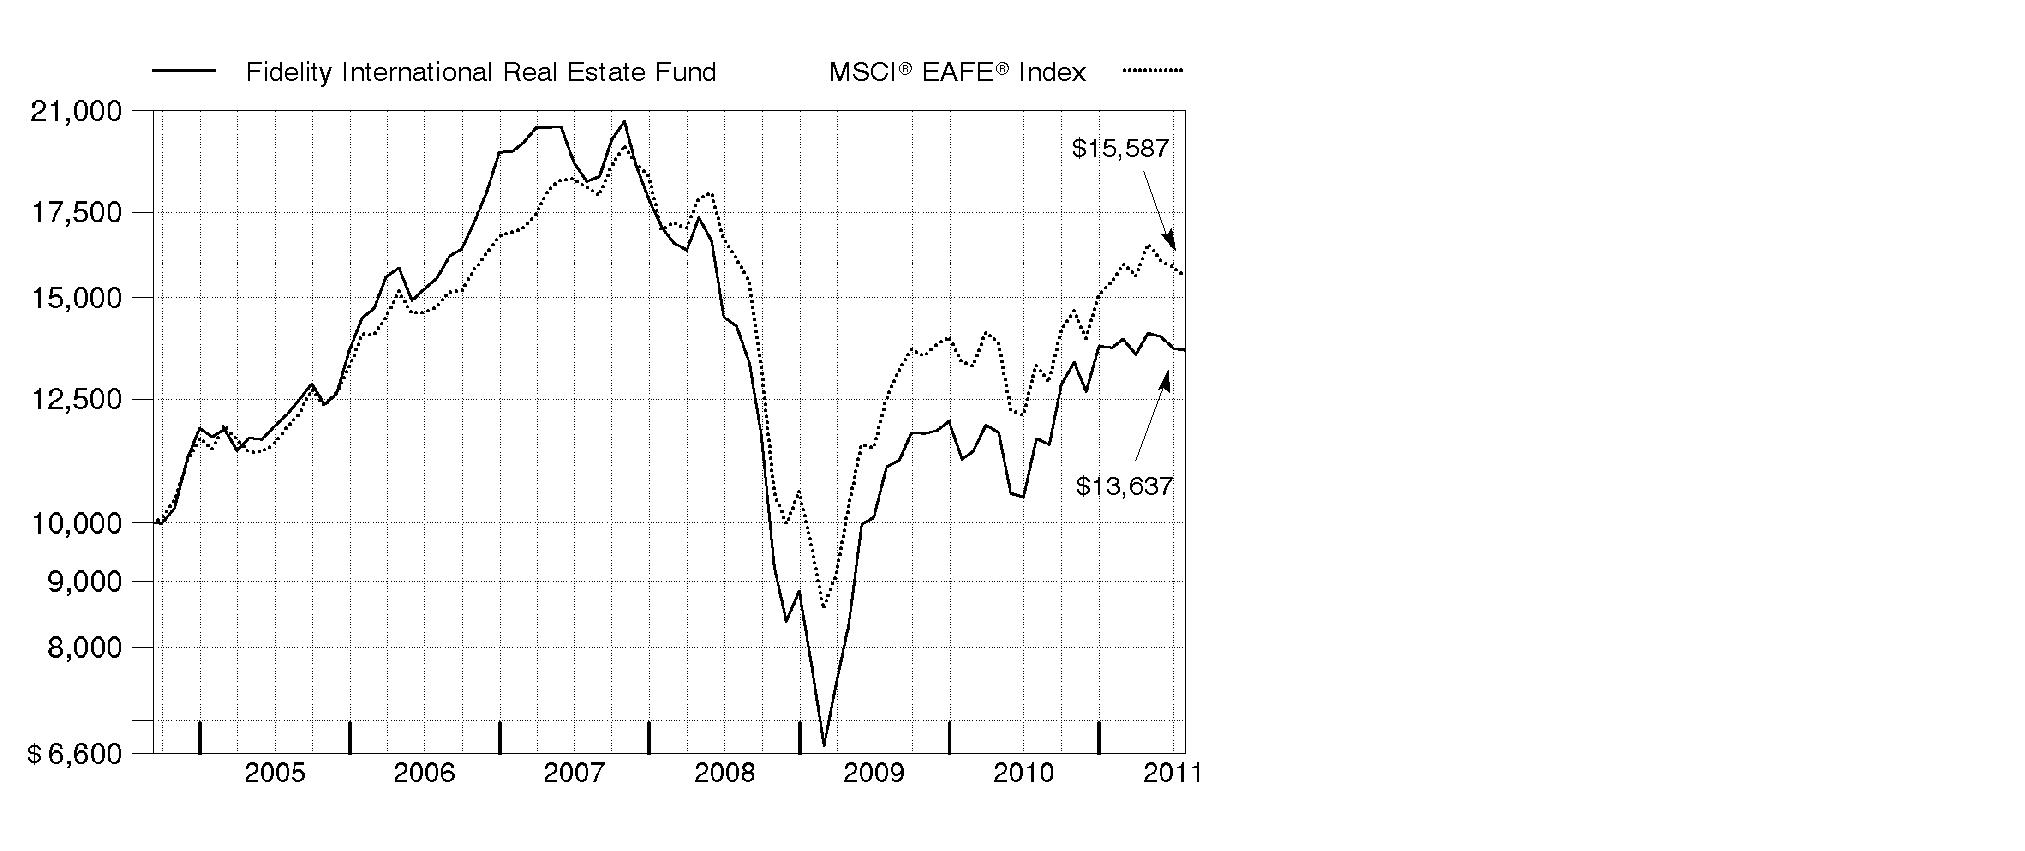
Annual Report
Market Recap: The year ending July 31, 2011, saw tremendous variability in the performance of international real estate securities. Between August 2010 and March 2011, international real estate stocks performed well, led by higher-risk property types. This situation changed abruptly in March with the Japanese earthquake and tsunami and the country's subsequent nuclear disaster. Questions about the impact of these events on global economic growth, along with rising inflation expectations in China and debt crises in Europe and the United States, led investors to favor lower-risk property types over more-speculative opportunities. In this environment, the FTSE® EPRASM/NAREIT® Developed ex North America Index - a proxy for international real estate stocks - returned 20.15%, although more than half of those gains came from a weaker U.S. dollar. In comparison, the U.S. real estate investment trust (REIT) market, as measured by the Dow Jones U.S. Select Real Estate Securities IndexSM, gained 25.23% during the same time span. The MSCI® EAFE® (Europe, Australasia, Far East) Index, which measures the performance of foreign developed-markets equities, rose 17.30%, compared with a return of 19.65% for the U.S. equity benchmark S&P 500® Index.
Comments from Guillermo de las Casas, Portfolio Manager of Fidelity® International Real Estate Fund: For the year, the fund's Retail Class shares returned 17.15%, lagging the FTSE® EPRASM/NAREIT® index. Stock picking in Singapore and Hong Kong hurt results, as did poor security selection in the U.K., lacking any exposure to strong-performing Swiss property stocks and a disappointing out-of-benchmark pick in Poland. In contrast, the fund benefited from various non-state-owned Chinese property companies with shares listed in Grand Cayman. Our German holdings also contributed meaningfully. The biggest individual detractor was Westfield Group. This Australia-based global mall developer and operator was hurt by the strength of the Australian dollar. In December 2010, Westfield spun off its Australian retail properties into a new company, a passive investment vehicle called Westfield Retail Trust. I underweighted - and ultimately sold - this latter stock, which proved to be a wise move given its decline. Other detractors of note were Singapore property developers Wing Tai Holdings and CapitaLand, and Hong Kong-based Kerry Properties and New World Development. On the plus side, the fund got a boost from significantly underweighting China Overseas Land & Investment and not owning lagging index constituents Sino Land and Shimao Property Holdings.
The views expressed above reflect those of the portfolio manager(s) only through the end of the period as stated on the cover of this report and do not necessarily represent the views of Fidelity or any other person in the Fidelity organization. Any such views are subject to change at any time based upon market or other conditions and Fidelity disclaims any responsibility to update such views. These views may not be relied on as investment advice and, because investment decisions for a Fidelity fund are based on numerous factors, may not be relied on as an indication of trading intent on behalf of any Fidelity fund.
Annual Report
Shareholder Expense Example
As a shareholder of the Fund, you incur two types of costs: (1) transaction costs, including sales charges (loads) on purchase payments or redemption proceeds, redemption fees, and (2) ongoing costs, including management fees, distribution and/or service (12b-1) fees and other Fund expenses. This Example is intended to help you understand your ongoing costs (in dollars) of investing in the Fund and to compare these costs with the ongoing costs of investing in other mutual funds.
The Example is based on an investment of $1,000 invested at the beginning of the period and held for the entire period (February 1, 2011 to July 31, 2011).
Actual Expenses
The first line of the accompanying table for each class of the Fund provides information about actual account values and actual expenses. You may use the information in this line, together with the amount you invested, to estimate the expenses that you paid over the period. Simply divide your account value by $1,000.00 (for example, an $8,600 account value divided by $1,000.00 = 8.6), then multiply the result by the number in the first line for a class of the Fund under the heading entitled "Expenses Paid During Period" to estimate the expenses you paid on your account during this period. A small balance maintenance fee of $12.00 that is charged once a year may apply for certain accounts with a value of less than $2,000. This fee is not included in the table below. If it was, the estimate of expenses you paid during the period would be higher, and your ending account value lower, by this amount. In addition, the Fund, as a shareholder in the underlying Fidelity Central Funds, will indirectly bear its pro-rata share of the fees and expenses incurred by the underlying Fidelity Central Funds. These fees and expenses are not included in the Fund's annualized expense ratio used to calculate the expense estimate in the table below.
Hypothetical Example for Comparison Purposes
The second line of the accompanying table for each class of the Fund provides information about hypothetical account values and hypothetical expenses based on a Class' actual expense ratio and an assumed rate of return of 5% per year before expenses, which is not the Class' actual return. The hypothetical account values and expenses may not be used to estimate the actual ending account balance or expenses you paid for the period. You may use this information to compare the ongoing costs of investing in the Fund and other funds. To do so, compare this 5% hypothetical example with the 5% hypothetical examples that appear in the shareholder reports of the other funds. A small balance maintenance fee of $12.00 that is charged once a year may apply for certain accounts with a value of less than $2,000. This fee is not included in the table below. If it was, the estimate of expenses you paid during the period would be higher, and your ending account value lower, by this amount. In addition, the Fund, as a shareholder in the underlying Fidelity Central Funds, will indirectly bear its pro-rata share of the fees and expenses incurred by the underlying Fidelity Central Funds. These fees and expenses are not included in the Fund's annualized expense ratio used to calculate the expense estimate in the table below.
Please note that the expenses shown in the table are meant to highlight your ongoing costs only and do not reflect any transaction costs. Therefore, the second line of the table is useful in comparing ongoing costs only, and will not help you determine the relative total costs of owning different funds. In addition, if these transactional costs were included, your costs would have been higher.
Annual Report
| Annualized Expense Ratio | Beginning
Account Value
February 1, 2011 | Ending
Account Value
July 31, 2011 | Expenses Paid
During Period*
February 1, 2011
to July 31, 2011 |
Class A | 1.42% | | | |
Actual | | $ 1,000.00 | $ 992.50 | $ 7.02 |
Hypothetical A | | $ 1,000.00 | $ 1,017.75 | $ 7.10 |
Class T | 1.69% | | | |
Actual | | $ 1,000.00 | $ 992.40 | $ 8.35 |
Hypothetical A | | $ 1,000.00 | $ 1,016.41 | $ 8.45 |
Class B | 2.17% | | | |
Actual | | $ 1,000.00 | $ 989.10 | $ 10.70 |
Hypothetical A | | $ 1,000.00 | $ 1,014.03 | $ 10.84 |
Class C | 2.18% | | | |
Actual | | $ 1,000.00 | $ 990.10 | $ 10.76 |
Hypothetical A | | $ 1,000.00 | $ 1,013.98 | $ 10.89 |
International Real Estate | 1.17% | | | |
Actual | | $ 1,000.00 | $ 994.70 | $ 5.79 |
Hypothetical A | | $ 1,000.00 | $ 1,018.99 | $ 5.86 |
Institutional Class | 1.17% | | | |
Actual | | $ 1,000.00 | $ 994.60 | $ 5.79 |
Hypothetical A | | $ 1,000.00 | $ 1,018.99 | $ 5.86 |
A 5% return per year before expenses
* Expenses are equal to each Class' annualized expense ratio, multiplied by the average account value over the period, multiplied by 181/365 (to reflect the one-half year period).
Annual Report
Investment Changes (Unaudited)
Top Ten Stocks as of July 31, 2011 |
| % of fund's
net assets | % of fund's net assets
6 months ago |
Mitsui Fudosan Co. Ltd. | 6.3 | 6.7 |
Sun Hung Kai Properties Ltd. | 6.0 | 8.1 |
Westfield Group unit | 5.9 | 5.5 |
Unibail-Rodamco | 5.6 | 4.3 |
Sumitomo Realty & Development Co. Ltd. | 3.9 | 3.3 |
Hang Lung Properties Ltd. | 3.6 | 2.8 |
Hongkong Land Holdings Ltd. | 3.6 | 1.9 |
Land Securities Group PLC | 2.7 | 2.0 |
Kerry Properties Ltd. | 2.5 | 2.6 |
The GPT Group unit | 2.5 | 2.0 |
| 42.6 | |
Top Five Countries as of July 31, 2011 |
(excluding cash equivalents) | % of fund's
net assets | % of fund's net assets
6 months ago |
Hong Kong | 21.4 | 21.8 |
Japan | 18.6 | 19.4 |
Australia | 13.0 | 15.5 |
United Kingdom | 10.3 | 11.9 |
Singapore | 8.8 | 6.3 |
Percentages are adjusted for the effect of open futures contracts, if applicable. |
Top Five REIT Sectors as of July 31, 2011 |
| % of fund's
net assets | % of fund's net assets
6 months ago |
REITs - Management/Investment | 21.2 | 21.5 |
REITs - Office Buildings | 5.9 | 5.8 |
REITs - Industrial Buildings | 3.5 | 2.3 |
REITs - Shopping Centers | 2.3 | 7.3 |
REITs - Health Care Facilities | 0.5 | 0.4 |
Asset Allocation (% of fund's net assets) |
As of July 31, 2011 * | As of January 31, 2011** |
| Stocks 97.5% | | | Stocks 98.8% | |
| Short-Term
Investments and
Net Other Assets 2.5% | | | Short-Term
Investments and
Net Other Assets 1.2% | |
* Foreign investments | 97.5% | | ** Foreign investments | 98.8% | |

Annual Report
Investments July 31, 2011
Showing Percentage of Net Assets
Common Stocks - 97.5% |
| Shares | | Value |
Australia - 13.0% |
Abacus Property Group unit | 1,789,587 | | $ 4,109,211 |
Charter Hall Group unit | 833,740 | | 1,914,416 |
FKP Property Group unit | 6,666,469 | | 4,650,814 |
Goodman Group unit | 6,501,169 | | 4,856,906 |
The GPT Group unit | 2,516,398 | | 8,321,568 |
Westfield Group unit | 2,287,195 | | 20,002,101 |
TOTAL AUSTRALIA | | 43,855,016 |
Bailiwick of Jersey - 0.9% |
Atrium European Real Estate Ltd. | 462,622 | | 2,965,974 |
Belgium - 0.5% |
Warehouses de Pauw | 28,835 | | 1,574,400 |
Bermuda - 2.0% |
Asia Standard International Group | 2,218,000 | | 546,404 |
Csi Properties Ltd. | 37,900,000 | | 1,312,967 |
Great Eagle Holdings Ltd. | 1,485,088 | | 4,897,067 |
TOTAL BERMUDA | | 6,756,438 |
Brazil - 1.8% |
Aliansce Shopping Centers SA | 107,500 | | 931,408 |
BR Malls Participacoes SA | 71,900 | | 837,103 |
Companhia Brasileira de Desenvolvimento Imobiliario Turistico (a) | 129,100 | | 1,690,318 |
Even Construtora e Incorporadora SA | 144,500 | | 707,036 |
Iguatemi Empresa de Shopping Centers SA | 52,800 | | 1,153,894 |
Tecnisa SA | 94,500 | | 723,736 |
TOTAL BRAZIL | | 6,043,495 |
Cayman Islands - 1.6% |
Glorious Property Holdings Ltd. (a) | 5,474,000 | | 1,685,648 |
SOHO China Ltd. | 3,420,500 | | 3,102,843 |
SPG Land (Holdings) Ltd. | 1,876,000 | | 649,901 |
TOTAL CAYMAN ISLANDS | | 5,438,392 |
Chile - 0.3% |
Parque Arauco SA | 512,608 | | 1,064,432 |
France - 7.9% |
Altarea | 22,697 | | 4,434,605 |
Societe de la Tour Eiffel | 22,995 | | 1,981,761 |
Common Stocks - continued |
| Shares | | Value |
France - continued |
Societe Fonciere Lyonnaise SA | 27,600 | | $ 1,514,503 |
Unibail-Rodamco | 83,907 | | 18,735,300 |
TOTAL FRANCE | | 26,666,169 |
Germany - 2.6% |
alstria office REIT-AG | 310,465 | | 4,523,369 |
GSW Immobilien AG | 73,550 | | 2,583,884 |
Hamborner (REIT) AG | 67,347 | | 688,017 |
IVG Immobilien AG (a) | 170,100 | | 1,172,182 |
TOTAL GERMANY | | 8,967,452 |
Hong Kong - 21.4% |
China Overseas Land & Investment Ltd. | 3,418,000 | | 7,674,690 |
China State Construction International Holdings Ltd. | 3,230,539 | | 3,237,254 |
Hang Lung Properties Ltd. | 3,292,000 | | 12,164,746 |
Hongkong Land Holdings Ltd. | 1,798,000 | | 12,082,560 |
Kerry Properties Ltd. | 1,771,000 | | 8,589,366 |
Magnificent Estates Ltd. | 13,844,000 | | 586,174 |
New World Development Co. Ltd. | 3,302,725 | | 4,864,801 |
Shangri-La Asia Ltd. | 658,000 | | 1,696,964 |
Soundwill Holdings Ltd. | 662,000 | | 995,489 |
Sun Hung Kai Properties Ltd. | 1,329,000 | | 20,223,691 |
TOTAL HONG KONG | | 72,115,735 |
Italy - 2.4% |
Beni Stabili SpA SIIQ | 3,753,700 | | 3,349,366 |
Immobiliare Grande Distribuzione SpA | 2,119,605 | | 4,315,551 |
Pirelli & C. Real Estate SpA (a) | 1,176,200 | | 642,716 |
TOTAL ITALY | | 8,307,633 |
Japan - 18.6% |
Goldcrest Co. Ltd. | 57,920 | | 1,361,363 |
Hulic Co. Ltd. | 524,000 | | 5,582,797 |
Japan Retail Fund Investment Corp. | 2,294 | | 3,585,632 |
Kenedix, Inc. (a)(d) | 41,527 | | 8,120,332 |
Mitsubishi Estate Co. Ltd. | 79,000 | | 1,420,594 |
Mitsui Fudosan Co. Ltd. | 1,112,000 | | 21,224,293 |
Nomura Real Estate Holdings, Inc. | 198,500 | | 3,649,419 |
Sumitomo Realty & Development Co. Ltd. | 529,000 | | 13,100,422 |
Tokyo Tatemono Co. Ltd. | 959,000 | | 3,924,966 |
Tosei Corp. (d) | 2,140 | | 653,136 |
TOTAL JAPAN | | 62,622,954 |
Common Stocks - continued |
| Shares | | Value |
Netherlands - 1.3% |
Corio NV | 73,000 | | $ 4,464,645 |
Poland - 0.6% |
Globe Trade Centre SA (a) | 354,000 | | 2,099,267 |
Russia - 0.5% |
LSR Group OJSC GDR (Reg. S) | 216,700 | | 1,636,085 |
Singapore - 8.8% |
CapitaLand Ltd. | 3,044,900 | | 7,333,148 |
Global Logistic Properties Ltd. | 4,420,000 | | 7,414,691 |
Mapletree Industrial (REIT) | 4,443,000 | | 4,519,931 |
Parkway Life REIT | 1,065,000 | | 1,645,061 |
Wing Tai Holdings Ltd. | 5,302,000 | | 6,516,597 |
Yanlord Land Group Ltd. | 2,080,000 | | 2,150,563 |
TOTAL SINGAPORE | | 29,579,991 |
Spain - 0.2% |
Inmobiliaria Colonial SA (a)(d) | 96,025 | | 651,235 |
Sweden - 2.8% |
Castellum AB (d) | 246,000 | | 3,569,666 |
Kungsleden AB | 196,589 | | 1,812,211 |
Wihlborgs Fastigheter AB | 283,700 | | 3,990,472 |
TOTAL SWEDEN | | 9,372,349 |
United Kingdom - 10.3% |
Big Yellow Group PLC | 1,174,700 | | 5,532,544 |
British Land Co. PLC | 799,789 | | 7,680,662 |
Great Portland Estates PLC | 331,554 | | 2,265,289 |
Helical Bar PLC | 905,300 | | 3,633,614 |
Land Securities Group PLC | 648,938 | | 9,108,286 |
Quintain Estates & Development PLC (a) | 2,148,600 | | 2,081,014 |
Safestore Holdings PLC | 621,100 | | 1,233,713 |
St. Modwen Properties PLC | 1,122,000 | | 3,188,286 |
TOTAL UNITED KINGDOM | | 34,723,408 |
TOTAL COMMON STOCKS (Cost $356,163,164) | 328,905,070 |
Money Market Funds - 1.7% |
| Shares | | Value |
Fidelity Cash Central Fund, 0.14% (b) | 3,455,115 | | $ 3,455,115 |
Fidelity Securities Lending Cash Central Fund, 0.15% (b)(c) | 2,246,812 | | 2,246,812 |
TOTAL MONEY MARKET FUNDS (Cost $5,701,927) | 5,701,927 |
TOTAL INVESTMENT PORTFOLIO - 99.2% (Cost $361,865,091) | 334,606,997 |
NET OTHER ASSETS (LIABILITIES) - 0.8% | | 2,544,171 |
NET ASSETS - 100% | $ 337,151,168 |
Legend |
(a) Non-income producing |
(b) Affiliated fund that is available only to investment companies and other accounts managed by Fidelity Investments. The rate quoted is the annualized seven-day yield of the fund at period end. A complete unaudited listing of the fund's holdings as of its most recent quarter end is available upon request. In addition, each Fidelity Central Fund's financial statements, which are not covered by the Fund's Report of Independent Registered Public Accounting Firm, are available on the SEC's website or upon request. |
(c) Investment made with cash collateral received from securities on loan. |
(d) Security or a portion of the security is on loan at period end. |
Affiliated Central Funds |
Information regarding fiscal year to date income earned by the Fund from investments in Fidelity Central Funds is as follows: |
Fund | Income earned |
Fidelity Cash Central Fund | $ 5,442 |
Fidelity Securities Lending Cash Central Fund | 168,341 |
Total | $ 173,783 |
Other Information |
All investments are categorized as Level 1 under the Fair Value Hierarchy. The inputs or methodology used for valuing securities may not be an indication of the risk associated with investing in those securities. For more information on valuation inputs, please refer to the Security Valuation section in the accompanying Notes to Financial Statements. |
Income Tax Information |
At July 31, 2011, the Fund had a capital loss carryforward of approximately $289,916,707 of which $153,317,175 and $136,599,532 will expire in fiscal 2017 and 2018, respectively. Capital loss carryforwards are only available to offset future capital gains of the Fund to the extent provided by regulations and may be limited. |
See accompanying notes which are an integral part of the financial statements.
Annual Report
Statement of Assets and Liabilities
| July 31, 2011 |
Assets | | |
Investment in securities, at value (including securities loaned of $2,134,155) - See accompanying schedule: Unaffiliated issuers (cost $356,163,164) | $ 328,905,070 | |
Fidelity Central Funds (cost $5,701,927) | 5,701,927 | |
Total Investments (cost $361,865,091) | | $ 334,606,997 |
Foreign currency held at value (cost $234,321) | | 235,566 |
Receivable for investments sold | | 7,589,065 |
Receivable for fund shares sold | | 237,833 |
Dividends receivable | | 860,853 |
Distributions receivable from Fidelity Central Funds | | 9,691 |
Other receivables | | 87,555 |
Total assets | | 343,627,560 |
| | |
Liabilities | | |
Payable to custodian bank | $ 168,407 | |
Payable for investments purchased | 3,139,399 | |
Payable for fund shares redeemed | 485,409 | |
Accrued management fee | 200,120 | |
Distribution and service plan fees payable | 5,831 | |
Other affiliated payables | 99,786 | |
Other payables and accrued expenses | 130,628 | |
Collateral on securities loaned, at value | 2,246,812 | |
Total liabilities | | 6,476,392 |
| | |
Net Assets | | $ 337,151,168 |
Net Assets consist of: | | |
Paid in capital | | $ 647,993,841 |
Undistributed net investment income | | 4,912,084 |
Accumulated undistributed net realized gain (loss) on investments and foreign currency transactions | | (288,485,740) |
Net unrealized appreciation (depreciation) on investments and assets and liabilities in foreign currencies | | (27,269,017) |
Net Assets | | $ 337,151,168 |
See accompanying notes which are an integral part of the financial statements.
Annual Report
Statement of Assets and Liabilities - continued
| July 31, 2011 |
Calculation of Maximum Offering Price Class A:
Net Asset Value and redemption price per share ($7,046,650 ÷ 764,709 shares) | | $ 9.21 |
| | |
Maximum offering price per share (100/94.25 of $9.21) | | $ 9.77 |
Class T:
Net Asset Value and redemption price per share ($2,496,490 ÷ 272,635 shares) | | $ 9.16 |
| | |
Maximum offering price per share (100/96.50 of $9.16) | | $ 9.49 |
Class B:
Net Asset Value and offering price per share ($570,154 ÷ 62,979 shares) A | | $ 9.05 |
| | |
Class C:
Net Asset Value and offering price per share ($3,207,979 ÷ 355,336 shares) A | | $ 9.03 |
| | |
International Real Estate:
Net Asset Value, offering price and redemption price per share ($322,045,234 ÷ 34,631,945 shares) | | $ 9.30 |
| | |
Institutional Class:
Net Asset Value, offering price and redemption price per share ($1,784,661 ÷ 192,333 shares) | | $ 9.28 |
A Redemption price per share is equal to net asset value less any applicable contingent deferred sales charge.
See accompanying notes which are an integral part of the financial statements.
Annual Report
Financial Statements - continued
Statement of Operations
| Year ended July 31, 2011 |
Investment Income | | |
Dividends | | $ 11,535,462 |
Special dividends | | 7,319,957 |
Interest | | 221 |
Income from Fidelity Central Funds | | 173,783 |
Income before foreign taxes withheld | | 19,029,423 |
Less foreign taxes withheld | | (861,698) |
Total income | | 18,167,725 |
| | |
Expenses | | |
Management fee | $ 2,554,814 | |
Transfer agent fees | 1,087,758 | |
Distribution and service plan fees | 76,402 | |
Accounting and security lending fees | 187,904 | |
Custodian fees and expenses | 220,247 | |
Independent trustees' compensation | 1,930 | |
Registration fees | 81,632 | |
Audit | 81,939 | |
Legal | 1,531 | |
Interest | 134 | |
Miscellaneous | 4,210 | |
Total expenses before reductions | 4,298,501 | |
Expense reductions | (215,862) | 4,082,639 |
Net investment income (loss) | | 14,085,086 |
Realized and Unrealized Gain (Loss) Net realized gain (loss) on: | | |
Investment securities: | | |
Unaffiliated issuers | 38,029,900 | |
Foreign currency transactions | (598,975) | |
Total net realized gain (loss) | | 37,430,925 |
Change in net unrealized appreciation (depreciation) on: Investment securities | 3,872,756 | |
Assets and liabilities in foreign currencies | 3,539 | |
Total change in net unrealized appreciation (depreciation) | | 3,876,295 |
Net gain (loss) | | 41,307,220 |
Net increase (decrease) in net assets resulting from operations | | $ 55,392,306 |
See accompanying notes which are an integral part of the financial statements.
Annual Report
Statement of Changes in Net Assets
| Year ended
July 31, 2011 | Year ended
July 31, 2010 |
Increase (Decrease) in Net Assets | | |
Operations | | |
Net investment income (loss) | $ 14,085,086 | $ 7,955,511 |
Net realized gain (loss) | 37,430,925 | 348,071 |
Change in net unrealized appreciation (depreciation) | 3,876,295 | 9,565,008 |
Net increase (decrease) in net assets resulting
from operations | 55,392,306 | 17,868,590 |
Distributions to shareholders from net investment income | (13,892,744) | (3,235,770) |
Distributions to shareholders from net realized gain | (11,440,782) | (5,017,915) |
Total distributions | (25,333,526) | (8,253,685) |
Share transactions - net increase (decrease) | (26,030,265) | (26,300,777) |
Redemption fees | 74,922 | 80,485 |
Total increase (decrease) in net assets | 4,103,437 | (16,605,387) |
| | |
Net Assets | | |
Beginning of period | 333,047,731 | 349,653,118 |
End of period (including undistributed net investment income of $4,912,084 and undistributed net investment income of $4,719,742, respectively) | $ 337,151,168 | $ 333,047,731 |
See accompanying notes which are an integral part of the financial statements.
Annual Report
Financial Highlights - Class A
Years ended July 31, | 2011 | 2010 | 2009 | 2008 | 2007 I |
Selected Per-Share Data | | | | | |
Net asset value, beginning of period | $ 8.46 | $ 8.24 | $ 10.63 | $ 15.71 | $ 17.46 |
Income from Investment Operations | | | | | |
Net investment income (loss) E | .34 H | .17 | .18 | .20 | .11 |
Net realized and unrealized gain (loss) | 1.04 | .24 | (2.57) | (3.48) | (1.87) |
Total from investment operations | 1.38 | .41 | (2.39) | (3.28) | (1.76) |
Distributions from net investment income | (.33) | (.07) | - | (.31) | - |
Distributions from net realized gain | (.29) | (.12) | - | (1.50) | - |
Total distributions | (.63) L | (.19) | - | (1.81) | - |
Redemption fees added to paid in capital E | - K | - K | - K | .01 | .01 |
Net asset value, end of period | $ 9.21 | $ 8.46 | $ 8.24 | $ 10.63 | $ 15.71 |
Total Return B,C,D | 16.76% | 4.97% | (22.48)% | (23.20)% | (10.02)% |
Ratios to Average Net Assets F,J | | | | | |
Expenses before reductions | 1.42% | 1.44% | 1.45% | 1.38% | 1.37% A |
Expenses net of fee waivers, if any | 1.42% | 1.44% | 1.45% | 1.38% | 1.37% A |
Expenses net of all reductions | 1.36% | 1.39% | 1.42% | 1.35% | 1.26% A |
Net investment income (loss) | 3.67% H | 2.02% | 2.55% | 1.58% | 2.08% A |
Supplemental Data | | | | | |
Net assets, end of period (000 omitted) | $ 7,047 | $ 7,250 | $ 6,745 | $ 9,976 | $ 5,087 |
Portfolio turnover rate G | 131% | 95% | 55% | 63% | 144% |
A Annualized
B Total returns for periods of less than one year are not annualized.
C Total returns would have been lower if certain expenses had not been reduced during the applicable periods shown.
D Total returns do not include the effect of the sales charges.
E Calculated based on average shares outstanding during the period.
F Fees and expenses of any underlying Fidelity Central Funds are not included in the Fund's expense ratio. The Fund indirectly bears its proportionate share of the expenses of any underlying Fidelity Central Funds.
G Amount does not include the portfolio activity of any underlying Fidelity Central Funds.
H Investment income per share reflects special dividends which amounted to $.19 per share. Excluding these special dividends, the ratio of net investment income (loss) to average net assets would have been 1.64%.
I For the period April 4, 2007 (commencement of sale of shares) to July 31, 2007.
J Expense ratios reflect operating expenses of the class. Expenses before reductions do not reflect amounts reimbursed by the investment adviser or reductions from brokerage service arrangements or reductions from other expense offset arrangements and do not represent the amount paid by the class during periods when reimbursements or reductions occur. Expense ratios before reductions for start-up periods may not be representative of longer-term operating periods. Expenses net of fee waivers reflect expenses after reimbursement by the investment adviser but prior to reductions from brokerage service arrangements or other expense offset arrangements. Expenses net of all reductions represent the net expenses paid by the class.
K Amount represents less than $.01 per share.
L Total distributions of $.63 per share is comprised of distributions from net investment income of $.333 and distributions from net realized gain of $.294 per share.
See accompanying notes which are an integral part of the financial statements.
Annual Report
Financial Highlights - Class T
Years ended July 31, | 2011 | 2010 | 2009 | 2008 | 2007 I |
Selected Per-Share Data | | | | | |
Net asset value, beginning of period | $ 8.41 | $ 8.21 | $ 10.62 | $ 15.70 | $ 17.46 |
Income from Investment Operations | | | | | |
Net investment income (loss) E | .31 H | .15 | .17 | .17 | .10 |
Net realized and unrealized gain (loss) | 1.04 | .23 | (2.58) | (3.48) | (1.87) |
Total from investment operations | 1.35 | .38 | (2.41) | (3.31) | (1.77) |
Distributions from net investment income | (.31) | (.06) | - | (.28) | - |
Distributions from net realized gain | (.29) | (.12) | - | (1.50) | - |
Total distributions | (.60) | (.18) | - | (1.78) | - |
Redemption fees added to paid in capital E | - K | - K | - K | .01 | .01 |
Net asset value, end of period | $ 9.16 | $ 8.41 | $ 8.21 | $ 10.62 | $ 15.70 |
Total Return B,C,D | 16.54% | 4.68% | (22.69)% | (23.39)% | (10.08)% |
Ratios to Average Net Assets F,J | | | | | |
Expenses before reductions | 1.69% | 1.70% | 1.71% | 1.64% | 1.61% A |
Expenses net of fee waivers, if any | 1.69% | 1.70% | 1.71% | 1.64% | 1.61% A |
Expenses net of all reductions | 1.63% | 1.65% | 1.68% | 1.60% | 1.51% A |
Net investment income (loss) | 3.41% H | 1.75% | 2.29% | 1.32% | 1.90% A |
Supplemental Data | | | | | |
Net assets, end of period (000 omitted) | $ 2,496 | $ 2,510 | $ 2,080 | $ 7,566 | $ 2,398 |
Portfolio turnover rate G | 131% | 95% | 55% | 63% | 144% |
A Annualized
B Total returns for periods of less than one year are not annualized.
C Total returns would have been lower if certain expenses had not been reduced during the applicable periods shown.
D Total returns do not include the effect of the sales charges.
E Calculated based on average shares outstanding during the period.
F Fees and expenses of any underlying Fidelity Central Funds are not included in the Fund's expense ratio. The Fund indirectly bears its proportionate share of the expenses of any underlying Fidelity Central Funds.
G Amount does not include the portfolio activity of any underlying Fidelity Central Funds.
H Investment income per share reflects special dividends which amounted to $.19 per share. Excluding these special dividends, the ratio of net investment income (loss) to average net assets would have been 1.38%.
I For the period April 4, 2007 (commencement of sale of shares) to July 31, 2007.
J Expense ratios reflect operating expenses of the class. Expenses before reductions do not reflect amounts reimbursed by the investment adviser or reductions from brokerage service arrangements or reductions from other expense offset arrangements and do not represent the amount paid by the class during periods when reimbursements or reductions occur. Expense ratios before reductions for start-up periods may not be representative of longer-term operating periods. Expenses net of fee waivers reflect expenses after reimbursement by the investment adviser but prior to reductions from brokerage service arrangements or other expense offset arrangements. Expenses net of all reductions represent the net expenses paid by the class.
K Amount represents less than $.01 per share.
See accompanying notes which are an integral part of the financial statements.
Annual Report
Financial Highlights - Class B
Years ended July 31, | 2011 | 2010 | 2009 | 2008 | 2007 I |
Selected Per-Share Data | | | | | |
Net asset value, beginning of period | $ 8.32 | $ 8.14 | $ 10.58 | $ 15.67 | $ 17.46 |
Income from Investment Operations | | | | | |
Net investment income (loss) E | .26 H | .11 | .13 | .11 | .07 |
Net realized and unrealized gain (loss) | 1.03 | .23 | (2.57) | (3.48) | (1.87) |
Total from investment operations | 1.29 | .34 | (2.44) | (3.37) | (1.80) |
Distributions from net investment income | (.27) | (.04) | - | (.23) | - |
Distributions from net realized gain | (.29) | (.12) | - | (1.50) | - |
Total distributions | (.56) | (.16) | - | (1.73) | - |
Redemption fees added to paid in capital E | - K | - K | - K | .01 | .01 |
Net asset value, end of period | $ 9.05 | $ 8.32 | $ 8.14 | $ 10.58 | $ 15.67 |
Total Return B,C,D | 15.90% | 4.20% | (23.06)% | (23.80)% | (10.25)% |
Ratios to Average Net Assets F,J | | | | | |
Expenses before reductions | 2.17% | 2.19% | 2.19% | 2.14% | 2.11% A |
Expenses net of fee waivers, if any | 2.17% | 2.19% | 2.19% | 2.14% | 2.11% A |
Expenses net of all reductions | 2.11% | 2.14% | 2.17% | 2.11% | 2.01% A |
Net investment income (loss) | 2.92% H | 1.26% | 1.81% | .82% | 1.38% A |
Supplemental Data | | | | | |
Net assets, end of period (000 omitted) | $ 570 | $ 629 | $ 606 | $ 930 | $ 1,158 |
Portfolio turnover rate G | 131% | 95% | 55% | 63% | 144% |
A Annualized
B Total returns for periods of less than one year are not annualized.
C Total returns would have been lower if certain expenses had not been reduced during the applicable periods shown.
D Total returns do not include the effect of the contingent deferred sales charge.
E Calculated based on average shares outstanding during the period.
F Fees and expenses of any underlying Fidelity Central Funds are not included in the Fund's expense ratio. The Fund indirectly bears its proportionate share of the expenses of any underlying Fidelity Central Funds.
G Amount does not include the portfolio activity of any underlying Fidelity Central Funds.
H Investment income per share reflects special dividends which amounted to $.18 per share. Excluding these special dividends, the ratio of net investment income (loss) to average net assets would have been .90%.
I For the period April 4, 2007 (commencement of sale of shares) to July 31, 2007.
J Expense ratios reflect operating expenses of the class. Expenses before reductions do not reflect amounts reimbursed by the investment adviser or reductions from brokerage service arrangements or reductions from other expense offset arrangements and do not represent the amount paid by the class during periods when reimbursements or reductions occur. Expense ratios before reductions for start-up periods may not be representative of longer-term operating periods. Expenses net of fee waivers reflect expenses after reimbursement by the investment adviser but prior to reductions from brokerage service arrangements or other expense offset arrangements. Expenses net of all reductions represent the net expenses paid by the class.
K Amount represents less than $.01 per share.
See accompanying notes which are an integral part of the financial statements.
Annual Report
Financial Highlights - Class C
Years ended July 31, | 2011 | 2010 | 2009 | 2008 | 2007 I |
Selected Per-Share Data | | | | | |
Net asset value, beginning of period | $ 8.30 | $ 8.13 | $ 10.57 | $ 15.67 | $ 17.46 |
Income from Investment Operations | | | | | |
Net investment income (loss) E | .26 H | .11 | .13 | .11 | .07 |
Net realized and unrealized gain (loss) | 1.04 | .22 | (2.57) | (3.48) | (1.87) |
Total from investment operations | 1.30 | .33 | (2.44) | (3.37) | (1.80) |
Distributions from net investment income | (.28) | (.04) | - | (.24) | - |
Distributions from net realized gain | (.29) | (.12) | - | (1.50) | - |
Total distributions | (.57) | (.16) | - | (1.74) | - |
Redemption fees added to paid in capital E | - K | - K | - K | .01 | .01 |
Net asset value, end of period | $ 9.03 | $ 8.30 | $ 8.13 | $ 10.57 | $ 15.67 |
Total Return B,C,D | 16.07% | 4.10% | (23.08)% | (23.78)% | (10.25)% |
Ratios to Average Net Assets F,J | | | | | |
Expenses before reductions | 2.17% | 2.18% | 2.19% | 2.14% | 2.10% A |
Expenses net of fee waivers, if any | 2.17% | 2.18% | 2.19% | 2.14% | 2.10% A |
Expenses net of all reductions | 2.11% | 2.14% | 2.17% | 2.11% | 2.00% A |
Net investment income (loss) | 2.92% H | 1.27% | 1.81% | .82% | 1.35% A |
Supplemental Data | | | | | |
Net assets, end of period (000 omitted) | $ 3,208 | $ 3,201 | $ 2,496 | $ 3,477 | $ 2,629 |
Portfolio turnover rate G | 131% | 95% | 55% | 63% | 144% |
A Annualized
B Total returns for periods of less than one year are not annualized.
C Total returns would have been lower if certain expenses had not been reduced during the applicable periods shown.
D Total returns do not include the effect of the contingent deferred sales charge.
E Calculated based on average shares outstanding during the period.
F Fees and expenses of any underlying Fidelity Central Funds are not included in the Fund's expense ratio. The Fund indirectly bears its proportionate share of the expenses of any underlying Fidelity Central Funds.
G Amount does not include the portfolio activity of any underlying Fidelity Central Funds.
H Investment income per share reflects special dividends which amounted to $.18 per share. Excluding these special dividends, the ratio of net investment income (loss) to average net assets would have been .89%.
I For the period April 4, 2007 (commencement of sale of shares) to July 31, 2007.
J Expense ratios reflect operating expenses of the class. Expenses before reductions do not reflect amounts reimbursed by the investment adviser or reductions from brokerage service arrangements or reductions from other expense offset arrangements and do not represent the amount paid by the class during periods when reimbursements or reductions occur. Expense ratios before reductions for start-up periods may not be representative of longer-term operating periods. Expenses net of fee waivers reflect expenses after reimbursement by the investment adviser but prior to reductions from brokerage service arrangements or other expense offset arrangements. Expenses net of all reductions represent the net expenses paid by the class.
K Amount represents less than $.01 per share.
See accompanying notes which are an integral part of the financial statements.
Annual Report
Financial Highlights - International Real Estate
Years ended July 31, | 2011 | 2010 | 2009 | 2008 | 2007 |
Selected Per-Share Data | | | | | |
Net asset value, beginning of period | $ 8.53 | $ 8.29 | $ 10.68 | $ 15.73 | $ 14.69 |
Income from Investment Operations | | | | | |
Net investment income (loss) B | .36 E | .19 | .20 | .25 | .31 |
Net realized and unrealized gain (loss) | 1.06 | .25 | (2.59) | (3.50) | 2.35 |
Total from investment operations | 1.42 | .44 | (2.39) | (3.25) | 2.66 |
Distributions from net investment income | (.35) | (.08) | - | (.31) | (.22) |
Distributions from net realized gain | (.29) | (.12) | - | (1.50) | (1.42) |
Total distributions | (.65) H | (.20) | - | (1.81) | (1.64) |
Redemption fees added to paid in capital B | - G | - G | - G | .01 | .02 |
Net asset value, end of period | $ 9.30 | $ 8.53 | $ 8.29 | $ 10.68 | $ 15.73 |
Total Return A | 17.15% | 5.29% | (22.38)% | (22.97)% | 19.01% |
Ratios to Average Net Assets C,F | | | | | |
Expenses before reductions | 1.17% | 1.19% | 1.19% | 1.11% | 1.07% |
Expenses net of fee waivers, if any | 1.17% | 1.19% | 1.19% | 1.10% | 1.06% |
Expenses net of all reductions | 1.11% | 1.14% | 1.16% | 1.07% | .96% |
Net investment income (loss) | 3.92% E | 2.27% | 2.81% | 1.86% | 1.86% |
Supplemental Data | | | | | |
Net assets, end of period (000 omitted) | $ 322,045 | $ 318,032 | $ 336,126 | $ 572,985 | $ 1,032,138 |
Portfolio turnover rate D | 131% | 95% | 55% | 63% | 144% |
A Total returns would have been lower if certain expenses had not been reduced during the applicable periods shown.
B Calculated based on average shares outstanding during the period.
C Fees and expenses of any underlying Fidelity Central Funds are not included in the Fund's expense ratio. The Fund indirectly bears its proportionate share of the expenses of any underlying Fidelity Central Funds.
D Amount does not include the portfolio activity of any underlying Fidelity Central Funds.
E Investment income per share reflects special dividends which amounted to $.19 per share. Excluding these special dividends, the ratio of net investment income (loss) to average net assets would have been 1.90%.
F Expense ratios reflect operating expenses of the class. Expenses before reductions do not reflect amounts reimbursed by the investment adviser or reductions from brokerage service arrangements or reductions from other expense offset arrangements and do not represent the amount paid by the class during periods when reimbursements or reductions occur. Expenses net of fee waivers reflect expenses after reimbursement by the investment adviser but prior to reductions from brokerage service arrangements or other expense offset arrangements. Expenses net of all reductions represent the net expenses paid by the class.
G Amount represents less than $.01 per share.
H Total distributions of $.65 per share is comprised of distributions from net investment income of $.354 and distributions from net realized gain of $.294 per share.
See accompanying notes which are an integral part of the financial statements.
Annual Report
Financial Highlights - Institutional Class
Years ended July 31, | 2011 | 2010 | 2009 | 2008 | 2007 H |
Selected Per-Share Data | | | | | |
Net asset value, beginning of period | $ 8.51 | $ 8.28 | $ 10.66 | $ 15.73 | $ 17.46 |
Income from Investment Operations | | | | | |
Net investment income (loss) D | .36 G | .19 | .20 | .24 | .12 |
Net realized and unrealized gain (loss) | 1.06 | .24 | (2.58) | (3.49) | (1.86) |
Total from investment operations | 1.42 | .43 | (2.38) | (3.25) | (1.74) |
Distributions from net investment income | (.35) | (.08) | - | (.33) | - |
Distributions from net realized gain | (.29) | (.12) | - | (1.50) | - |
Total distributions | (.65) K | (.20) | - | (1.83) | - |
Redemption fees added to paid in capital D | - J | - J | - J | .01 | .01 |
Net asset value, end of period | $ 9.28 | $ 8.51 | $ 8.28 | $ 10.66 | $ 15.73 |
Total Return B,C | 17.18% | 5.18% | (22.33)% | (22.98)% | (9.91)% |
Ratios to Average Net Assets E,I | | | | | |
Expenses before reductions | 1.17% | 1.18% | 1.19% | 1.13% | 1.08% A |
Expenses net of fee waivers, if any | 1.17% | 1.18% | 1.19% | 1.13% | 1.08% A |
Expenses net of all reductions | 1.11% | 1.14% | 1.17% | 1.10% | .97% A |
Net investment income (loss) | 3.92% G | 2.27% | 2.81% | 1.83% | 2.27% A |
Supplemental Data | | | | | |
Net assets, end of period (000 omitted) | $ 1,785 | $ 1,425 | $ 1,600 | $ 3,289 | $ 2,477 |
Portfolio turnover rate F | 131% | 95% | 55% | 63% | 144% |
A Annualized
B Total returns for periods of less than one year are not annualized.
C Total returns would have been lower if certain expenses had not been reduced during the applicable periods shown.
D Calculated based on average shares outstanding during the period.
E Fees and expenses of any underlying Fidelity Central Funds are not included in the Fund's expense ratio. The Fund indirectly bears its proportionate share of the expenses of any underlying Fidelity Central Funds.
F Amount does not include the portfolio activity of any underlying Fidelity Central Funds.
G Investment income per share reflects special dividends which amounted to $.19 per share. Excluding these special dividends, the ratio of net investment income (loss) to average net assets would have been 1.90%.
H For the period April 4, 2007 (commencement of sale of shares) to July 31, 2007.
I Expense ratios reflect operating expenses of the class. Expenses before reductions do not reflect amounts reimbursed by the investment adviser or reductions from brokerage service arrangements or reductions from other expense offset arrangements and do not represent the amount paid by the class during periods when reimbursements or reductions occur. Expense ratios before reductions for start-up periods may not be representative of longer-term operating periods. Expenses net of fee waivers reflect expenses after reimbursement by the investment adviser but prior to reductions from brokerage service arrangements or other expense offset arrangements. Expenses net of all reductions represent the net expenses paid by the class.
J Amount represents less than $.01 per share.
K Total distributions of $.65 per share is comprised of distributions from net investment income of $.354 and distributions from net realized gain of $.294 per share.
See accompanying notes which are an integral part of the financial statements.
Annual Report
Notes to Financial Statements
For the period ended July 31, 2011
1. Organization.
Fidelity International Real Estate Fund (the Fund) is a non-diversified fund of Fidelity Securities Fund (the Trust) and is authorized to issue an unlimited number of shares. The Trust is registered under the Investment Company Act of 1940, as amended (the 1940 Act), as an open-end management investment company organized as a Massachusetts business trust. The Fund offers Class A, Class T, Class C, International Real Estate and Institutional Class shares, each of which, along with Class B shares, has equal rights as to assets and voting privileges. Effective after the close of business on September 1, 2010, Class B shares were closed to new accounts and additional purchases, except for exchanges and reinvestments, by existing shareholders. Each class has exclusive voting rights with respect to matters that affect that class. Class B shares will automatically convert to Class A shares after a holding period of seven years from the initial date of purchase. Investment income, realized and unrealized capital gains and losses, the common expenses of the Fund, and certain fund-level expense reductions, if any, are allocated on a pro-rata basis to each class based on the relative net assets of each class to the total net assets of the Fund. Each class differs with respect to transfer agent and distribution and service plan fees incurred. Certain expense reductions may also differ by class.
2. Investments in Fidelity Central Funds.
The Fund invests in Fidelity Central Funds, which are open-end investment companies available only to other investment companies and accounts managed by Fidelity Management & Research Company (FMR) and its affiliates. The Fund's Schedule of Investments lists each of the Fidelity Central Funds held as of period end, if any, as an investment of the Fund, but does not include the underlying holdings of each Fidelity Central Fund. As an Investing Fund, the Fund indirectly bears its proportionate share of the expenses of the underlying Fidelity Central Funds.
The Money Market Central Funds seek preservation of capital and current income and are managed by Fidelity Investments Money Management, Inc. (FIMM), an affiliate of FMR.
A complete unaudited list of holdings for each Fidelity Central Fund is available upon request or at the Securities and Exchange Commission (the SEC) web site at www.sec.gov. In addition, the financial statements of the Fidelity Central Funds, which are not covered by the Fund's Report of Independent Registered Public Accounting Firm, are available on the SEC web site or upon request.
3. Significant Accounting Policies.
The financial statements have been prepared in conformity with accounting principles generally accepted in the United States of America (GAAP), which require management to make certain estimates and assumptions at the date of the financial statements. Actual results could differ from those estimates. Subsequent events, if any, through the
Annual Report
3. Significant Accounting Policies - continued
date that the financial statements were issued have been evaluated in the preparation of the financial statements. The following summarizes the significant accounting policies of the Fund:
Security Valuation. Investments are valued as of 4:00 p.m. Eastern time on the last calendar day of the period. The Fund uses independent pricing services approved by the Board of Trustees to value its investments. When current market prices or quotations are not readily available or reliable, valuations may be determined in good faith in accordance with procedures adopted by the Board of Trustees. Factors used in determining value may include market or security specific events. The frequency with which these procedures are used cannot be predicted and they may be utilized to a significant extent. The value used for net asset value (NAV) calculation under these procedures may differ from published prices for the same securities.
The Fund categorizes the inputs to valuation techniques used to value its investments into a disclosure hierarchy consisting of three levels as shown below:
Level 1 - quoted prices in active markets for identical investments
Level 2 - other significant observable inputs (including quoted prices for similar investments, interest rates, prepayment speeds, etc.)
Level 3 - unobservable inputs (including the Fund's own assumptions based on the best information available)
Changes in valuation techniques may result in transfers in or out of an assigned level within the disclosure hierarchy. Valuation techniques used to value the Fund's investments by major category are as follows:
Equity securities, including restricted securities, for which market quotations are readily available, are valued at the last reported sale price or official closing price as reported by an independent pricing service on the primary market or exchange on which they are traded and are categorized as Level 1 in the hierarchy. In the event there were no sales during the day or closing prices are not available, securities are valued at the last quoted bid price or may be valued using the last available price and are generally categorized as Level 2 in the hierarchy. For foreign equity securities, when significant market or security specific events arise, comparisons to the valuation of American Depositary Receipts (ADRs), futures contracts, Exchange-traded funds (ETFs) and certain indexes as well as quoted prices for similar securities are used and are categorized as Level 2 in the hierarchy in these circumstances. Utilizing these techniques may result in transfers between Level 1 and Level 2. For restricted equity securities and private placements where observable inputs are limited, assumptions about market activity and risk are used and are categorized as Level 3 in the hierarchy.
Annual Report
Notes to Financial Statements - continued
3. Significant Accounting Policies - continued
Security Valuation - continued
Investments in open-end mutual funds, including the Fidelity Central Funds, are valued at their closing net asset value each business day and are categorized as Level 1 in the hierarchy.
Foreign Currency. The Fund may use foreign currency contracts to facilitate transactions in foreign-denominated securities. Gains and losses from these transactions may arise from changes in the value of the foreign currency or if the counterparties do not perform under the contracts' terms.
Foreign-denominated assets, including investment securities, and liabilities are translated into U.S. dollars at the exchange rate at period end. Purchases and sales of investment securities, income and dividends received and expenses denominated in foreign currencies are translated into U.S. dollars at the exchange rate in effect on the transaction date.
The effects of exchange rate fluctuations on investments are included with the net realized and unrealized gain (loss) on investment securities. Other foreign currency transactions resulting in realized and unrealized gain (loss) are disclosed separately.
Investment Transactions and Income. For financial reporting purposes, the Fund's investment holdings and NAV include trades executed through the end of the last business day of the period. The NAV per share for processing shareholder transactions is calculated as of the close of business of the New York Stock Exchange (NYSE), normally 4:00 p.m. Eastern time and includes trades executed through the end of the prior business day. Gains and losses on securities sold are determined on the basis of identified cost. Dividend income is recorded on the ex-dividend date, except for certain dividends from foreign securities where the ex-dividend date may have passed, which are recorded as soon as the Fund is informed of the ex-dividend date. Non-cash dividends included in dividend income, if any, are recorded at the fair market value of the securities received. Distributions received on securities that represent a return of capital or capital gain are recorded as a reduction of cost of investments and/or as a realized gain. The Fund estimates the components of distributions received that may be considered return of capital distributions or capital gain distributions. Large, non-recurring dividends recognized by the Fund are presented separately on the Statement of Operations as "Special Dividends" and the impact of these dividends is presented in the Financial Highlights. Interest income and distributions from the Fidelity Central Funds are accrued as earned. Interest income includes coupon interest and amortization of premium and accretion of discount on debt securities. Investment income is recorded net of foreign taxes withheld where recovery of such taxes is uncertain.
Annual Report
3. Significant Accounting Policies - continued
Expenses. Expenses directly attributable to a fund are charged to that fund. Expenses attributable to more than one fund are allocated among the respective funds on the basis of relative net assets or other appropriate methods. Expense estimates are accrued in the period to which they relate and adjustments are made when actual amounts are known.
Income Tax Information and Distributions to Shareholders. Each year, the Fund intends to qualify as a regulated investment company, including distributing substantially all of its taxable income and realized gains under Subchapter M of the Internal Revenue Code and filing its U.S. federal tax return. As a result, no provision for income taxes is required. As of July 31, 2011, the Fund did not have any unrecognized tax benefits in the financial statements. A fund's federal tax return is subject to examination by the Internal Revenue Service (IRS) for a period of three years. Foreign taxes are provided for based on the Fund's understanding of the tax rules and rates that exist in the foreign markets in which it invests.
Distributions are declared and recorded on the ex-dividend date. Income dividends and capital gain distributions are declared separately for each class. Income and capital gain distributions are determined in accordance with income tax regulations, which may differ from GAAP.
Capital accounts within the financial statements are adjusted for permanent book-tax differences. These adjustments have no impact on net assets or the results of operations. Temporary book-tax differences will reverse in a subsequent period.
Book-tax differences are primarily due to foreign currency transactions, certain foreign taxes, passive foreign investment companies (PFIC), capital loss carryforwards, losses deferred due to wash sales and excise tax regulations.
The federal tax cost of investment securities and unrealized appreciation (depreciation) as of period end were as follows:
Gross unrealized appreciation | $ 11,905,181 |
Gross unrealized depreciation | (44,000,876) |
Net unrealized appreciation (depreciation) on securities and other investments | $ (32,095,695) |
| |
Tax Cost | $ 366,702,692 |
Annual Report
Notes to Financial Statements - continued
3. Significant Accounting Policies - continued
Income Tax Information and Distributions to Shareholders - continued
The tax-based components of distributable earnings as of period end were as follows:
Undistributed ordinary income | $ 11,180,651 |
Capital loss carryforward | $ (289,916,707) |
Net unrealized appreciation (depreciation) | $ (32,107,863) |
Under the recently enacted Regulated Investment Company Modernization Act of 2010 (the Act), the Fund will be permitted to carry forward capital losses incurred in taxable years beginning after December 22, 2010 for an unlimited period. However, any losses incurred during those future taxable years will be required to be utilized prior to any losses incurred in pre-enactment taxable years, which generally expire after eight years from when they are incurred. Additionally, post-enactment capital losses that are carried forward will retain their character as either short-term or long-term capital losses rather than being considered all short-term as under previous law. The Fund's first fiscal year end subject to the Act will be July 31, 2012.
The tax character of distributions paid was as follows:
| July 31, 2011 | July 31, 2010 |
Ordinary Income | $ 25,333,526 | $ 8,253,685 |
Short-Term Trading (Redemption) Fees. Shares held by investors in the Fund less than 90 days are subject to a redemption fee equal to 1.50% of the net asset value of shares redeemed. All redemption fees, which reduce the proceeds of the shareholder redemption, are retained by the Fund and accounted for as an addition to paid in capital.
New Accounting Pronouncement. In May 2011, the Financial Accounting Standards Board issued Accounting Standard Update No. 2011-04, Fair Value Measurement (Topic 820) - Amendments to Achieve Common Fair Value Measurement and Disclosure Requirements in U.S. GAAP and IFRSs. The update changes the wording used to describe the requirements in GAAP for measuring fair value and for disclosing information about fair value measurements. The update is effective during interim and annual periods beginning after December 15, 2011. Management is currently evaluating the impact of the update's adoption on the Fund's financial statement disclosures.
Annual Report
4. Purchases and Sales of Investments.
Purchases and sales of securities, other than short-term securities, aggregated $463,373,103 and $507,984,129, respectively.
5. Fees and Other Transactions with Affiliates.
Management Fee. FMR and its affiliates provide the Fund with investment management related services for which the Fund pays a monthly management fee. The management fee is the sum of an individual fund fee rate that is based on an annual rate of .45% of the Fund's average net assets and a group fee rate that averaged .26% during the period. The group fee rate is based upon the average net assets of all the mutual funds advised by FMR. The group fee rate decreases as assets under management increase and increases as assets under management decrease. For the period, the total annual management fee rate was .71% of the Fund's average net assets.
Distribution and Service Plan Fees. In accordance with Rule 12b-1 of the 1940 Act, the Fund has adopted separate Distribution and Service Plans for each class of shares. Certain classes pay Fidelity Distributors Corporation (FDC), an affiliate of FMR, separate Distribution and Service Fees, each of which is based on an annual percentage of each class' average net assets. In addition, FDC may pay financial intermediaries for selling shares of the Fund and providing shareholder support services. For the period, the Distribution and Service Fee rates, total fees and amounts retained by FDC were as follows:
| Distribution
Fee | Service
Fee | Total Fees | Retained
by FDC |
Class A | - % | .25% | $ 19,614 | $ 99 |
Class T | .25% | .25% | 13,882 | - |
Class B | .75% | .25% | 6,471 | 4,856 |
Class C | .75% | .25% | 36,435 | 7,855 |
| | | $ 76,402 | $ 12,810 |
Sales Load. FDC may receive a front-end sales charge of up to 5.75% for selling Class A shares, and 3.50% for selling Class T shares, some of which is paid to financial intermediaries for selling shares of the Fund. Depending on the holding period, FDC may receive contingent deferred sales charges levied on Class A, Class T, Class B, and Class C redemptions. The deferred sales charges range from 5% to 1% for Class B, 1% for Class C, 1.00% for certain purchases of Class A shares and .25% for certain purchases of Class T shares.
Annual Report
Notes to Financial Statements - continued
5. Fees and Other Transactions with Affiliates - continued
Sales Load - continued
For the period, sales charge amounts retained by FDC were as follows:
| Retained
by FDC |
Class A | $ 4,021 |
Class T | 1,537 |
Class B* | 1,006 |
Class C* | 54 |
| $ 6,618 |
* When Class B and Class C shares are initially sold, FDC pays commissions from its own resources to financial intermediaries through which the sales are made.
Transfer Agent Fees. Fidelity Investments Institutional Operations Company, Inc. (FIIOC), an affiliate of FMR, is the transfer, dividend disbursing and shareholder servicing agent for each class of the Fund. FIIOC receives account fees and asset-based fees that vary according to the account size and type of account of the shareholders of the respective classes of the Fund. FIIOC pays for typesetting, printing and mailing of shareholder reports, except proxy statements. For the period, transfer agent fees for each class were as follows:
| Amount | % of
Average
Net Assets |
Class A | $ 23,733 | .30 |
Class T | 8,852 | .32 |
Class B | 1,948 | .30 |
Class C | 11,087 | .30 |
International Real Estate | 1,037,153 | .30 |
Institutional Class | 4,985 | .30 |
| $ 1,087,758 | |
Accounting and Security Lending Fees. Fidelity Service Company, Inc. (FSC), an affiliate of FMR, maintains the Fund's accounting records. The accounting fee is based on the level of average net assets for the month. Under a separate contract, FSC administers the security lending program. The security lending fee is based on the number and duration of lending transactions.
Brokerage Commissions. The Fund placed a portion of its portfolio transactions with brokerage firms which are affiliates of the investment adviser. The commissions paid to these affiliated firms were $112 for the period.
Annual Report
5. Fees and Other Transactions with Affiliates - continued
Interfund Lending Program. Pursuant to an Exemptive Order issued by the SEC, the Fund, along with other registered investment companies having management contracts with FMR, may participate in an interfund lending program. This program provides an alternative credit facility allowing the funds to borrow from, or lend money to, other participating affiliated funds. At period end, there were no interfund loans outstanding. The Fund's activity in this program during the period for which loans were outstanding was as follows:
Borrower or Lender | Average Daily
Loan Balance | Weighted Average Interest Rate | Interest Expense |
Borrower | $ 5,492,000 | .44% | $ 134 |
6. Committed Line of Credit.
The Fund participates with other funds managed by FMR or an affiliate in a $4.0 billion credit facility (the "line of credit") to be utilized for temporary or emergency purposes to fund shareholder redemptions or for other short-term liquidity purposes. The Fund has agreed to pay commitment fees on its pro-rata portion of the line of credit, which amounted to $1,218 and is reflected in Miscellaneous expenses on the Statement of Operations. During the period, there were no borrowings on this line of credit.
7. Security Lending.
The Fund lends portfolio securities through a lending agent from time to time in order to earn additional income. The lending agent may loan securities to certain qualified borrowers, including Fidelity Capital Markets (FCM), a broker-dealer affiliated with the Fund. On the settlement date of the loan, the Fund receives collateral (in the form of U.S. Treasury obligations, letters of credit and/or cash) against the loaned securities and maintains collateral in an amount not less than 100% of the market value of the loaned securities during the period of the loan. The market value of the loaned securities is determined at the close of business of the Fund and any additional required collateral is delivered to the Fund on the next business day. If the borrower defaults on its obligation to return the securities loaned because of insolvency or other reasons, a fund could experience delays and costs in recovering the securities loaned or in gaining access to the collateral. Any cash collateral received is invested in the Fidelity Securities Lending Cash Central Fund. The value of loaned securities and cash collateral at period end are disclosed on the Fund's Statement of Assets and Liabilities. Security lending income represents the income earned on investing cash collateral, less rebates paid to borrowers and lending agent fees associated with the loan, plus any premium payments received for lending certain types of securities. Security lending income is presented in the Statement of Operations as a component of income from Fidelity Central Funds. Total security lending income during the period amounted to $168,341 including. During the period, there were no securities loaned to FCM.
Annual Report
Notes to Financial Statements - continued
8. Expense Reductions.
Many of the brokers with whom FMR places trades on behalf of the Fund provided services to the Fund in addition to trade execution. These services included payments of certain expenses on behalf of the Fund totaling $215,862 for the period.
9. Distributions to Shareholders.
Distributions to shareholders of each class were as follows:
Years ended July 31, | 2011 | 2010 |
From net investment income | | |
Class A | $ 287,564 | $ 58,598 |
Class T | 96,278 | 19,755 |
Class B | 19,520 | 3,225 |
Class C | 109,655 | 14,423 |
International Real Estate | 13,319,427 | 3,124,751 |
Institutional Class | 60,300 | 15,018 |
Total | $ 13,892,744 | $ 3,235,770 |
From net realized gain | | |
Class A | $ 250,090 | $ 101,910 |
Class T | 89,657 | 37,040 |
Class B | 21,506 | 9,214 |
Class C | 114,914 | 39,337 |
International Real Estate | 10,916,536 | 4,807,309 |
Institutional Class | 48,079 | 23,105 |
Total | $ 11,440,782 | $ 5,017,915 |
10. Share Transactions.
Transactions for each class of shares were as follows:
| Shares | Dollars |
Years ended July 31, | 2011 | 2010 | 2011 | 2010 |
Class A | | | | |
Shares sold | 213,763 | 365,681 | $ 1,964,473 | $ 3,120,303 |
Reinvestment of distributions | 50,966 | 15,947 | 451,020 | 134,591 |
Shares redeemed | (357,321) | (343,205) | (3,278,956) | (2,901,988) |
Net increase (decrease) | (92,592) | 38,423 | $ (863,463) | $ 352,906 |
Annual Report
10. Share Transactions - continued
| Shares | Dollars |
Years ended July 31, | 2011 | 2010 | 2011 | 2010 |
Class T | | | | |
Shares sold | 73,470 | 132,643 | $ 668,265 | $ 1,140,128 |
Reinvestment of distributions | 20,063 | 6,259 | 176,852 | 52,641 |
Shares redeemed | (119,466) | (93,841) | (1,082,947) | (767,585) |
Net increase (decrease) | (25,933) | 45,061 | $ (237,830) | $ 425,184 |
Class B | | | | |
Shares sold | 4,563 | 20,099 | $ 41,321 | $ 169,130 |
Reinvestment of distributions | 4,289 | 1,355 | 37,454 | 11,297 |
Shares redeemed | (21,555) | (20,259) | (195,000) | (169,049) |
Net increase (decrease) | (12,703) | 1,195 | $ (116,225) | $ 11,378 |
Class C | | | | |
Shares sold | 111,487 | 164,953 | $ 1,002,010 | $ 1,381,947 |
Reinvestment of distributions | 21,061 | 5,842 | 183,176 | 48,663 |
Shares redeemed | (162,778) | (92,347) | (1,467,063) | (761,918) |
Net increase (decrease) | (30,230) | 78,448 | $ (281,877) | $ 668,692 |
International Real Estate | | | | |
Shares sold | 7,219,780 | 9,224,310 | $ 67,747,351 | $ 79,406,931 |
Reinvestment of distributions | 2,559,870 | 875,447 | 22,802,021 | 7,441,303 |
Shares redeemed | (12,440,980) | (13,336,716) | (115,315,484) | (114,385,841) |
Net increase (decrease) | (2,661,330) | (3,236,959) | $ (24,766,112) | $ (27,537,607) |
Institutional Class | | | | |
Shares sold | 99,324 | 40,774 | $ 925,861 | $ 351,025 |
Reinvestment of distributions | 10,892 | 4,247 | 96,908 | 36,016 |
Shares redeemed | (85,350) | (70,819) | (787,527) | (608,371) |
Net increase (decrease) | 24,866 | (25,798) | $ 235,242 | $ (221,330) |
11. Other.
The Fund's organizational documents provide former and current trustees and officers with a limited indemnification against liabilities arising in connection with the performance of their duties to the Fund. In the normal course of business, the Fund may also enter into contracts that provide general indemnifications. The Fund's maximum exposure under these arrangements is unknown as this would be dependent on future claims that may be made against the Fund. The risk of material loss from such claims is considered remote.
At the end of the period, FMR or its affiliates were the owners of record of approximately 12% of the outstanding shares of the Fund.
Annual Report
To the Trustees of Fidelity Securities Fund and the Shareholders of Fidelity International Real Estate Fund:
In our opinion, the accompanying statement of assets and liabilities, including the schedule of investments, and the related statements of operations and of changes in net assets and the financial highlights present fairly, in all material respects, the financial position of Fidelity International Real Estate Fund (a fund of Fidelity Securities Fund) at July 31, 2011, the results of its operations for the year then ended, the changes in its net assets for each of the two years in the period then ended and the financial highlights for each of the periods indicated, in conformity with accounting principles generally accepted in the United States of America. These financial statements and financial highlights (hereafter referred to as "financial statements") are the responsibility of the Fidelity International Real Estate Fund's management. Our responsibility is to express an opinion on these financial statements based on our audits. We conducted our audits of these financial statements in accordance with the standards of the Public Company Accounting Oversight Board (United States). Those standards require that we plan and perform the audit to obtain reasonable assurance about whether the financial statements are free of material misstatement. An audit includes examining, on a test basis, evidence supporting the amounts and disclosures in the financial statements, assessing the accounting principles used and significant estimates made by management, and evaluating the overall financial statement presentation. We believe that our audits, which included confirmation of securities at July 31, 2011 by correspondence with the custodian and brokers, provide a reasonable basis for our opinion.
/s/ PricewaterhouseCoopers LLP
PricewaterhouseCoopers LLP
Boston, Massachusetts
September 13, 2011
Annual Report
The Trustees, Members of the Advisory Board, and executive officers of the trust and fund, as applicable, are listed below. The Board of Trustees governs the fund and is responsible for protecting the interests of shareholders. The Trustees are experienced executives who meet periodically throughout the year to oversee the fund's activities, review contractual arrangements with companies that provide services to the fund, oversee management of the risks associated with such activities and contractual arrangements, and review the fund's performance. Except for James C. Curvey, each of the Trustees oversees 221 funds advised by FMR or an affiliate. Mr. Curvey oversees 419 funds advised by FMR or an affiliate.
The Trustees hold office without limit in time except that (a) any Trustee may resign; (b) any Trustee may be removed by written instrument, signed by at least two-thirds of the number of Trustees prior to such removal; (c) any Trustee who requests to be retired or who has become incapacitated by illness or injury may be retired by written instrument signed by a majority of the other Trustees; and (d) any Trustee may be removed at any special meeting of shareholders by a two-thirds vote of the outstanding voting securities of the trust. Each Trustee who is not an interested person (as defined in the 1940 Act) (Independent Trustee), shall retire not later than the last day of the calendar year in which his or her 75th birthday occurs. The Independent Trustees may waive this mandatory retirement age policy with respect to individual Trustees. The executive officers and Advisory Board Members hold office without limit in time, except that any officer and Advisory Board Member may resign or may be removed by a vote of a majority of the Trustees at any regular meeting or any special meeting of the Trustees. Except as indicated, each individual has held the office shown or other offices in the same company for the past five years.
Experience, Skills, Attributes, and Qualifications of the Fund's Trustees. The Governance and Nominating Committee has adopted a statement of policy that describes the experience, qualifications, attributes, and skills that are necessary and desirable for potential Independent Trustee candidates (Statement of Policy). The Board believes that each Trustee satisfied at the time he or she was initially elected or appointed a Trustee, and continues to satisfy, the standards contemplated by the Statement of Policy. The Governance and Nominating Committee also engages professional search firms to help identify potential Independent Trustee candidates who have the experience, qualifications, attributes, and skills consistent with the Statement of Policy. From time to time, additional criteria based on the composition and skills of the current Independent Trustees, as well as experience or skills that may be appropriate in light of future changes to board composition, business conditions, and regulatory or other developments, have also been considered by the professional search firms and the Governance and Nominating Committee. In addition, the Board takes into account the Trustees' commitment and participation in Board and committee meetings, as well as their leadership of standing and ad hoc committees throughout their tenure.
In determining that a particular Trustee was and continues to be qualified to serve as a Trustee, the Board has considered a variety of criteria, none of which, in isolation, was controlling. The Board believes that, collectively, the Trustees have balanced and diverse experience, qualifications, attributes, and skills, which allow the Board to operate effectively in governing the fund and protecting the interests of shareholders. Information about the specific experience, skills, attributes, and qualifications of each Trustee, which in each case led to the Board's conclusion that the Trustee should serve (or continue to serve) as a trustee of the fund, is provided below.
Annual Report
Board Structure and Oversight Function. James C. Curvey is an interested person (as defined in the 1940 Act) and currently serves as Acting Chairman. The Trustees have determined that an interested Chairman is appropriate and benefits shareholders because an interested Chairman has a personal and professional stake in the quality and continuity of services provided to the fund. Independent Trustees exercise their informed business judgment to appoint an individual of their choosing to serve as Chairman, regardless of whether the Trustee happens to be independent or a member of management. The Independent Trustees have determined that they can act independently and effectively without having an Independent Trustee serve as Chairman and that a key structural component for assuring that they are in a position to do so is for the Independent Trustees to constitute a substantial majority for the Board. The Independent Trustees also regularly meet in executive session. Ned C. Lautenbach serves as Chairman of the Independent Trustees and as such (i) acts as a liaison between the Independent Trustees and management with respect to matters important to the Independent Trustees and (ii) with management prepares agendas for Board meetings.
Fidelity funds are overseen by different Boards of Trustees. The fund's Board oversees Fidelity's equity and high income funds and another Board oversees Fidelity's investment-grade bond, money market, and asset allocation funds. The asset allocation funds may invest in Fidelity funds overseen by the fund's Board. The use of separate Boards, each with its own committee structure, allows the Trustees of each group of Fidelity funds to focus on the unique issues of the funds they oversee, including common research, investment, and operational issues. On occasion, the separate Boards establish joint committees to address issues of overlapping consequences for the Fidelity funds overseen by each Board.
The Trustees operate using a system of committees to facilitate the timely and efficient consideration of all matters of importance to the Trustees, the fund, and fund shareholders and to facilitate compliance with legal and regulatory requirements and oversight of the fund's activities and associated risks. The Board, acting through its committees, has charged FMR and its affiliates with (i) identifying events or circumstances the occurrence of which could have demonstrably adverse effects on the fund's business and/or reputation; (ii) implementing processes and controls to lessen the possibility that such events or circumstances occur or to mitigate the effects of such events or circumstances if they do occur; and (iii) creating and maintaining a system designed to evaluate continuously business and market conditions in order to facilitate the identification and implementation processes described in (i) and (ii) above. Because the day-to-day operations and activities of the fund are carried out by or through FMR, its affiliates and other service providers, the fund's exposure to risks is mitigated but not eliminated by the processes overseen by the Trustees. While each of the Board's committees has responsibility for overseeing different aspects of the fund's activities, oversight is exercised primarily through the Operations, Audit, and Compliance Committees. Appropriate personnel, including but not limited to the fund's Chief Compliance Officer (CCO), FMR's internal auditor, the independent accountants, the fund's Treasurer and portfolio management personnel, make periodic reports to the Board's committees, as appropriate. The responsibilities of each committee, including their oversight responsibilities, are described further under "Standing Committees of the Fund's Trustees."
Annual Report
Trustees and Officers - continued
The fund's Statement of Additional Information (SAI) includes more information about the Trustees. To request a free copy, call Fidelity at 1-800-544-8544.
Interested Trustees*:
Correspondence intended for each Trustee who is an interested person may be sent to Fidelity Investments, 82 Devonshire Street, Boston, Massachusetts 02109.
Name, Age; Principal Occupations and Other Relevant Experience+ |
James C. Curvey (76) |
| Year of Election or Appointment: 2007
Mr. Curvey is Trustee and Acting Chairman of the Board of Trustees of certain Trusts. Mr. Curvey also serves as Trustee (2007-present) of other investment companies advised by FMR. Mr. Curvey is a Director of Fidelity Investments Money Management, Inc. (2009-present), Director of Fidelity Research & Analysis Co. (2009-present) and Director of FMR and FMR Co., Inc. (2007-present). Mr. Curvey is also Vice Chairman (2007-present) and Director of FMR LLC. In addition, Mr. Curvey serves as an Overseer for the Boston Symphony Orchestra and a member of the Trustees of Villanova University. Previously, Mr. Curvey was the Vice Chairman (2006-2007) and Director (2000-2007) of FMR Corp. |
Ronald P. O'Hanley (54) |
| Year of Election or Appointment:2011
Mr. O'Hanley is Director of FMR Co., Inc. (2010-present), Director of Fidelity Investments Money Management, Inc. (2010-present), Director of Fidelity Research & Analysis Company (2010-present), President of Fidelity Asset Management and Corporate Services and a member of Fidelity's Executive Committee (2010-present). Previously, Mr. O'Hanley served as President and Chief Executive Officer of BNY Mellon Asset Management (2007-2010). Mr. O'Hanley also served as Vice Chairman of Bank New York Mellon Corp. and a member of that firm's Executive Committee. Prior to the 2007 merger of The Bank of New York and Mellon Financial Corporation, he was Vice Chairman of Mellon Financial Corporation and President and Chief Executive Officer of Mellon Asset Management. He joined Mellon in February 1997. Mr. O'Hanley currently serves as Chairman of the Boston Public Library Foundation Board of Directors and sits on the Board of Directors of Beth Israel Deaconess Medical Center, the Board of Trustees of the Marine Biological Laboratory and the Advisory Board of the Maxwell School of Citizenship and Public Administration at Syracuse University. Mr. O'Hanley also chairs the Council on Asset Management for the Financial Services Roundtable and is a member of the Board of Directors of Institutional Investor's U.S. Institute. |
* Trustees have been determined to be "Interested Trustees" by virtue of, among other things, their affiliation with the trust or various entities under common control with FMR.
+ The information above includes each Trustee's principal occupation during the last five years and other information relating to the experience, attributes, and skills relevant to each Trustee's qualifications to serve as a Trustee, which led to the conclusion that each Trustee should serve as a Trustee for the fund.
Independent Trustees:
Correspondence intended for each Independent Trustee (that is, the Trustees other than the Interested Trustees) may be sent to Fidelity Investments, P.O. Box 55235, Boston, Massachusetts 02205-5235.
Annual Report
Trustees and Officers - continued
Name, Age; Principal Occupations and Other Relevant Experience+ |
Dennis J. Dirks (63) |
| Year of Election or Appointment: 2005 Prior to his retirement in May 2003, Mr. Dirks was Chief Operating Officer and a member of the Board of The Depository Trust & Clearing Corporation (DTCC). He also served as President, Chief Operating Officer, and Board member of The Depository Trust Company (DTC) and President and Board member of the National Securities Clearing Corporation (NSCC). In addition, Mr. Dirks served as Chief Executive Officer and Board member of the Government Securities Clearing Corporation, Chief Executive Officer and Board member of the Mortgage-Backed Securities Clearing Corporation, as a Trustee and a member of the Finance Committee of Manhattan College (2005-2008), and as a Trustee and a member of the Finance Committee of AHRC of Nassau County (2006-2008). Mr. Dirks is a member of the Independent Directors Council (IDC) Governing Council (2010-Present) and Board of Directors for The Brookville Center for Children's Services, Inc. (2009-present). |
Alan J. Lacy (57) |
| Year of Election or Appointment: 2008 Mr. Lacy serves as Senior Adviser (2007-present) of Oak Hill Capital Partners, L.P. (private equity). Mr. Lacy also served as Chief Executive Officer (2000-2005) and Vice Chairman (2005-2006) of Sears Holdings Corporation and Sears, Roebuck and Co. (retail). In addition, Mr. Lacy serves as a member of the Board of Directors of Dave & Buster's, Inc. (restaurant and entertainment complexes, 2010-present), The Hillman Companies, Inc. (hardware wholesalers, 2010-present), and Bristol-Myers Squibb Company (global pharmaceuticals, 2007-present). Mr. Lacy is a member of the Board of Trustees of The National Parks Conservation Association (2006-Present). Previously, Mr. Lacy served as Chairman of the Board of Trustees of the National Parks Conservation Association (2008-2011) and as a member of the Board of Directors for the Western Union Company (global money transfer, 2006-2011). |
Ned C. Lautenbach (67) |
| Year of Election or Appointment: 2000 Mr. Lautenbach is Chairman of the Independent Trustees of the Equity and High Income Funds (2006-present). Mr. Lautenbach currently serves as the Lead Director of the Eaton Corporation Board of Directors (diversified industrial, 1997-present). Mr. Lautenbach is also a member of the Board of Directors of the Philharmonic Center for the Arts in Naples, Florida (1999-present); a member of the Board of Trustees of Fairfield University (2005-present); and a member of the Council on Foreign Relations (1994-present). Previously, Mr. Lautenbach was a Partner/Advisory Partner at Clayton, Dubilier & Rice, LLC (private equity investment, 1998-2010), as well as a Director of Sony Corporation (2006-2007). |
Joseph Mauriello (66) |
| Year of Election or Appointment: 2008 Prior to his retirement in January 2006, Mr. Mauriello served in numerous senior management positions including Deputy Chairman and Chief Operating Officer (2004-2005), and Vice Chairman of Financial Services (2002-2004) of KPMG LLP US (professional services, 1965-2005). Mr. Mauriello currently serves as a member of the Board of Directors of XL Group plc. (global insurance and re-insurance, 2006-present) and of Arcadia Resources Inc. (health care services and products, 2007-present). Previously, Mr. Mauriello served as a Director of the Hamilton Funds of the Bank of New York (2006-2007). |
Robert W. Selander (60) |
| Year of Election or Appointment: 2011 Previously, Mr. Selander served as a Member of the Advisory Board of Fidelity's Equity and High Income Funds (2011), Executive Vice Chairman (2010), Chief Executive Officer (2009-2010), and President and Chief Executive Officer (1997-2009) of Mastercard, Inc. |
Cornelia M. Small (67) |
| Year of Election or Appointment: 2005 Ms. Small is a member of the Board of Directors of the Teagle Foundation (2009-present). Ms. Small is also a member of the Investment Committee, and Chair (2008-present) and a member of the Board of Trustees of Smith College. In addition, Ms. Small serves on the Investment Committee of the Berkshire Taconic Community Foundation (2008-present). Previously, Ms. Small served as Chairperson of the Investment Committee (2002-2008) of Smith College. In addition, Ms. Small served as Chief Investment Officer, Director of Global Equity Investments, and a member of the Board of Directors of Scudder, Stevens & Clark and Scudder Kemper Investments. |
William S. Stavropoulos (72) |
| Year of Election or Appointment: 2002 Mr. Stavropoulos is Vice Chairman of the Independent Trustees of the Equity and High Income Funds (2006-present). Mr. Stavropoulos serves as President and Founder of the Michigan Baseball Foundation, the Great Lakes Loons (2007-present). Mr. Stavropoulos is Chairman Emeritus of the Board of Directors of The Dow Chemical Company, where he previously served in numerous senior management positions, including President, CEO (1995-2000; 2002-2004), Chairman of the Executive Committee (2000-2006), and as a member of the Board of Directors (1990-2006). Currently, Mr. Stavropoulos is Chairman of Univar (global distributor of commodity and specialty chemicals, 2010-present), a Director of Teradata Corporation (data warehousing and technology solutions, 2008-present), Chemical Financial Corporation, Maersk Inc. (industrial conglomerate), Tyco International, Inc. (multinational manufacturing and services, 2007-present), and a member of the Advisory Board for Metalmark Capital (private equity investment, 2005-present). Mr. Stavropoulos is a special advisor to Clayton, Dubilier & Rice, LLC (private equity investment). In addition, Mr. Stavropoulos is a member of the University of Notre Dame Advisory Council for the College of Science. |
David M. Thomas (62) |
| Year of Election or Appointment: 2008 Previously, Mr. Thomas served as Executive Chairman (2005-2006) and Chairman and Chief Executive Officer (2000-2005) of IMS Health, Inc. (pharmaceutical and healthcare information solutions). In addition, Mr. Thomas serves as a member of the Board of Directors of Fortune Brands, Inc. (consumer products), and Interpublic Group of Companies, Inc. (marketing communication, 2004-present). |
Michael E. Wiley (60) |
| Year of Election or Appointment: 2008 Mr. Wiley also serves as a Director of Asia Pacific Exploration Consolidated (international oil and gas exploration and production, 2008-present). Mr. Wiley serves as a Director of Tesoro Corporation (independent oil refiner and marketer, 2005-present), and a Director of Bill Barrett Corporation (exploration and production, 2005-present). In addition, Mr. Wiley also serves as a Director of Post Oak Bank (privately-held bank, 2004-present). Previously, Mr. Wiley served as a member of the Board of Trustees of the University of Tulsa (2000-2006; 2007-2010), as a Senior Energy Advisor of Katzenbach Partners, LLC (consulting, 2006-2007), as an Advisory Director of Riverstone Holdings (private investment), Chairman, President, and CEO of Baker Hughes, Inc. (oilfield services, 2000-2004), and as Director of Spinnaker Exploration Company (exploration and production, 2001-2005). |
Annual Report
+ The information above includes each Trustee's principal occupation during the last five years and other information relating to the experience, attributes, and skills relevant to each Trustee's qualifications to serve as a Trustee, which led to the conclusion that each Trustee should serve as a Trustee for the fund.
Advisory Board Members and Executive Officers:
Correspondence intended for each executive officer, Edward C. Johnson 3d, and Peter S. Lynch may be sent to Fidelity Investments, 82 Devonshire Street, Boston, Massachusetts 02109.
Name, Age; Principal Occupation |
Edward C. Johnson 3d (81) |
| Year of Election or Appointment: 2011 Member of the Advisory Board of Fidelity's Equity and High Income Funds. Mr. Johnson serves as Chief Executive Officer, Chairman, and a Director of FMR LLC, and also serves as Chairman and Director of FIL Limited. Previously, Mr. Johnson served as a Trustee and Chairman of the Board of certain Fidelity Trusts, Chairman and a Director of FMR, Chairman and a Director of FMR Co., Inc., and President of FMR LLC (2006-2007). |
Peter S. Lynch (67) |
| Year of Election or Appointment: 2003 Member of the Advisory Board of Fidelity's Equity and High Income Funds. Mr. Lynch is Vice Chairman and a Director of FMR and FMR Co., Inc. In addition, Mr. Lynch serves as a Trustee of Boston College and as the Chairman of the Inner-City Scholarship Fund. Previously, Mr. Lynch served on the Special Olympics International Board of Directors (1997-2006). |
Kenneth B. Robins (41) |
| Year of Election or Appointment: 2008 President and Treasurer of Fidelity's Equity and High Income Funds. Mr. Robins also serves as President and Treasurer (2010-present) and Assistant Treasurer (2009-present) of other Fidelity funds and is an employee of Fidelity Investments (2004-present). Previously, Mr. Robins served as Deputy Treasurer of the Fidelity funds (2005-2008) and Treasurer and Chief Financial Officer of The North Carolina Capital Management Trust: Cash and Term Portfolios (2006-2008). |
Brian B. Hogan (46) |
| Year of Election or Appointment: 2009 Vice President of Equity and High Income Funds. Mr. Hogan also serves as President of FMR's Equity Division (2009-present). Previously, Mr. Hogan served as Senior Vice President, Equity Research of FMR (2006-2009) and as a portfolio manager. |
Christopher S. Bartel (39) |
| Year of Election or Appointment: 2009 Vice President of Fidelity's Sector and Real Estate Equity Funds. Mr. Bartel also serves as Senior Vice President of Equity Research (2009-present). Previously, Mr. Bartel served as Managing Director of Research (2006-2009) and an analyst and portfolio manager (2000-2006). |
Scott C. Goebel (43) |
| Year of Election or Appointment: 2008 Secretary and Chief Legal Officer (CLO) of the Fidelity funds. Mr. Goebel also serves as Secretary of Fidelity Investments Money Management, Inc. (FIMM) (2010-present) and Fidelity Research and Analysis Company (FRAC) (2010-present); Secretary and CLO of The North Carolina Capital Management Trust: Cash and Term Portfolios (2008-present); General Counsel, Secretary, and Senior Vice President of FMR (2008-present) and FMR Co., Inc. (2008-present); employed by FMR LLC or an affiliate (2001-present); Chief Legal Officer of Fidelity Management & Research (Hong Kong) Limited (2008-present) and Assistant Secretary of Fidelity Management & Research (Japan) Inc. (2008-present), and Fidelity Management & Research (U.K.) Inc. (2008-present). Previously, Mr. Goebel served as Assistant Secretary of FIMM (2008-2010), FRAC (2008-2010), and the Funds (2007-2008) and as Vice President and Secretary of Fidelity Distributors Corporation (FDC) (2005-2007). |
William C. Coffey (42) |
| Year of Election or Appointment: 2009 Assistant Secretary of Fidelity's Equity and High Income Funds. Mr. Coffey also serves as Senior Vice President and Deputy General Counsel of FMR LLC (2010-present), and is an employee of Fidelity Investments. Previously, Mr. Coffey served as Vice President and Associate General Counsel of FMR LLC (2005-2009). |
Holly C. Laurent (57) |
| Year of Election or Appointment: 2008 Anti-Money Laundering (AML) Officer of the Fidelity funds. Ms. Laurent also serves as AML Officer of The North Carolina Capital Management Trust: Cash and Term Portfolios (2008-present) and is an employee of Fidelity Investments. Previously, Ms. Laurent was Senior Vice President and Head of Legal for Fidelity Business Services India Pvt. Ltd. (2006-2008), and Senior Vice President, Deputy General Counsel and Group Head for FMR LLC (2005-2006). |
Christine Reynolds (52) |
| Year of Election or Appointment: 2008 Chief Financial Officer of the Fidelity funds. Ms. Reynolds became President of Fidelity Pricing and Cash Management Services (FPCMS) in August 2008. Ms. Reynolds served as Chief Operating Officer of FPCMS (2007-2008). Previously, Ms. Reynolds served as President, Treasurer, and Anti-Money Laundering officer of the Fidelity funds (2004-2007). |
Kenneth A. Rathgeber (64) |
| Year of Election or Appointment: 2004 Chief Compliance Officer of Fidelity's Equity and High Income Funds. Mr. Rathgeber is Chief Compliance Officer of Fidelity Management & Research (Hong Kong) Limited (2008-present), Fidelity Management & Research (Japan) Inc. (2008-present), FMR (2005-present), FMR Co., Inc. (2005-present), Fidelity Management & Research (U.K.) Inc. (2005-present), Fidelity Research & Analysis Company (2005-present), Fidelity Investments Money Management, Inc. (2005-present), Pyramis Global Advisors, LLC (2005-present), and Strategic Advisers, Inc. (2005-present). |
Jeffrey S. Christian (49) |
| Year of Election or Appointment: 2009 Deputy Treasurer of the Fidelity funds. Mr. Christian is an employee of Fidelity Investments. Previously, Mr. Christian served as Chief Financial Officer (2008-2009) of certain Fidelity funds and Senior Vice President of Fidelity Pricing and Cash Management Services (FPCMS) (2004-2009). |
Bryan A. Mehrmann (50) |
| Year of Election or Appointment: 2005 Deputy Treasurer of the Fidelity funds. Mr. Mehrmann is an employee of Fidelity Investments. |
Adrien E. Deberghes (43) |
| Year of Election or Appointment: 2008 Deputy Treasurer of Fidelity's Equity and High Income Funds. Mr. Deberghes also serves as Assistant Treasurer of other Fidelity funds (2010-present) and is an employee of Fidelity Investments (2008-present). Previously, Mr. Deberghes served as Senior Vice President of Mutual Fund Administration at State Street Corporation (2007-2008), Senior Director of Mutual Fund Administration at Investors Bank & Trust (2005-2007), and Director of Finance for Dunkin' Brands (2000-2005). |
Stephanie J. Dorsey (42) |
| Year of Election or Appointment: 2010 Assistant Treasurer of Fidelity's Equity and High Income Funds. Ms. Dorsey also serves as Deputy Treasurer of other Fidelity funds (2008-present) and is an employee of Fidelity Investments (2008-present). Previously, Ms. Dorsey served as Treasurer (2004-2008) of the JPMorgan Mutual Funds and Vice President (2004-2008) of JPMorgan Chase Bank. |
John R. Hebble (53) |
| Year of Election or Appointment: 2009 Assistant Treasurer of Fidelity's Equity and High Income Funds. Mr. Hebble also serves as President (2011-present), Treasurer, and Chief Financial Officer of The North Carolina Capital Management Trust: Cash and Term Portfolios (2008-present), President and Treasurer of other Fidelity funds (2008-present) and is an employee of Fidelity Investments. |
Gary W. Ryan (52) |
| Year of Election or Appointment: 2005 Assistant Treasurer of the Fidelity funds. Mr. Ryan is an employee of Fidelity Investments. Previously, Mr. Ryan served as Vice President of Fund Reporting in Fidelity Pricing and Cash Management Services (FPCMS) (1999-2005). |
Jonathan Davis (43) |
| Year of Election or Appointment: 2010 Assistant Treasurer of the Fidelity funds. Mr. Davis is an employee of Fidelity Investments. Previously, Mr. Davis served as Vice President and Associate General Counsel of FMR LLC (2003-2010). |
Annual Report
The Board of Trustees of Fidelity International Real Estate Fund voted to pay on September 12, 2011, to shareholders of record at the opening of business on September 9, 2011, a distribution of $.178 per share derived from capital gains realized from sales of portfolio securities, and a dividend of $.139 per share from net investment income.
International Real Estate designates 22% of the dividends distributed during the fiscal year as amounts which may be taken into account as a dividend for the purposes of the maximum rate under section 1(h)(11) of the Internal Revenue Code.
The amounts per share which represent income derived from sources within, and taxes paid to, foreign countries or possessions of the United States are as follows:
Pay Date | Income | Taxes |
09/09/10 | $.178 | $.0072 |
12/20/10 | $.089 | $.0095 |
12/31/10 | $.042 | $.0000 |
The fund will notify shareholders in January 2012 of amounts for use in preparing 2011 income tax returns.
Annual Report
Board Approval of Investment Advisory Contracts and Management Fees
Fidelity International Real Estate Fund
Each year, the Board of Trustees, including the Independent Trustees (together, the Board), votes on the renewal of the management contract and sub-advisory agreements (together, the Advisory Contracts) for the fund. The Board, assisted by the advice of fund counsel and Independent Trustees' counsel, requests and considers a broad range of information relevant to the renewal of the Advisory Contracts throughout the year.
The Board meets regularly and considers at each of its meetings factors that are relevant to its annual consideration of the renewal of the fund's Advisory Contracts, including the services and support provided to the fund and its shareholders. The Board has established various standing committees, each composed of Independent Trustees with varying backgrounds, to which the Board has assigned specific subject matter responsibilities in order to enhance effective decision-making by the Board. The Board, acting directly and through its Committees, requests and receives information concerning the annual consideration of the renewal of the fund's Advisory Contracts. The Board also meets as needed to consider matters specifically related to the Board's annual consideration of the renewal of Advisory Contracts. Members of the Board may also meet with trustees of other Fidelity funds through ad hoc joint committees to discuss certain matters relevant to the Fidelity funds.
At its July 2011 meeting, the Board of Trustees, including the Independent Trustees, unanimously determined to renew the fund's Advisory Contracts. In reaching its determination, the Board considered all factors it believed relevant, including (i) the nature, extent, and quality of the services to be provided to the fund and its shareholders (including the investment performance of the fund); (ii) the competitiveness of the fund's management fee and total expense ratio; (iii) the total costs of the services to be provided by and the profits to be realized by Fidelity from its relationship with the fund; (iv) the extent to which economies of scale would be realized as the fund grows; and (v) whether fee levels reflect these economies of scale, if any, for the benefit of fund shareholders.
In considering whether to renew the Advisory Contracts for the fund, the Board reached a determination, with the assistance of fund counsel and Independent Trustees' counsel and through the exercise of its business judgment, that the renewal of the Advisory Contracts is in the best interests of the fund and its shareholders and that the compensation payable under the Advisory Contracts is fair and reasonable. The Board's decision to renew the Advisory Contracts was not based on any single factor, but rather was based on a comprehensive consideration of all the information provided to the Board at its meetings throughout the year. The Board, in reaching its determination to renew the Advisory Contracts, is aware that shareholders in the fund have a broad range of investment choices available to them, including a wide choice among mutual funds offered by Fidelity's competitors, and that the fund's shareholders, who have the opportunity to review and weigh the disclosure provided by the fund in its prospectus and other public disclosures, have chosen to invest in this fund, managed by Fidelity.
Annual Report
Nature, Extent, and Quality of Services Provided. The Board considered the staffing within the investment adviser, FMR, and the sub-advisers (together, the Investment Advisers), including the backgrounds of the fund's investment personnel and the fund's investment objective and discipline. The Independent Trustees also had discussions with senior management of Fidelity's investment operations and investment groups. The Board considered the structure of the portfolio manager compensation program and whether this structure provides appropriate incentives to act in the best interests of the fund.
Resources Dedicated to Investment Management and Support Services. The Board and the Fund Oversight and Research Committees reviewed the general qualifications and capabilities of the Investment Advisers' investment staff, including its size, education, experience, and resources, as well as the Investment Advisers' approach to recruiting, training, managing, and compensating investment personnel. The Board also noted that FMR has devoted increased resources to non-U.S. offices. The Board noted that Fidelity's analysts have extensive resources, tools and capabilities which allow them to conduct sophisticated quantitative and fundamental analysis, as well as credit analysis of issuers, counterparties and enhancers. The Board also believes that Fidelity's investment professionals have sufficient access to global information and data so as to provide competitive investment results over time, and that those professionals also have access to sophisticated tools which permit them to assess portfolio construction and risk and performance attribution characteristics continuously, as well as to transmit new information and research conclusions rapidly around the world. Additionally, in their deliberations, the Board considered the Investment Advisers' trading capabilities and resources which are an integral part of the investment management process.
Shareholder and Administrative Services. The Board considered (i) the nature, extent, quality, and cost of advisory, administrative, and shareholder services performed by the Investment Advisers and their affiliates under the Advisory Contracts and under separate agreements covering transfer agency, pricing and bookkeeping, and securities lending services for the fund; (ii) the nature and extent of the investment adviser's supervision of third party service providers, principally custodians and subcustodians; and (iii) the resources devoted to, and the record of compliance with, the fund's compliance policies and procedures. The Board also reviewed the allocation of fund brokerage, including allocations to brokers affiliated with the Investment Advisers, the use of brokerage commissions to pay fund expenses, and the use of "soft" commission dollars to pay for research services.
The Board noted that the growth of fund assets over time across the complex allows Fidelity to reinvest in the development of services designed to enhance the value or convenience of the Fidelity funds as investment vehicles. These services include 24-hour access to account information and market information through telephone representatives and over the Internet, investor education materials and asset allocation tools, and the expanded availability of Fidelity Investor Centers, with 35 new branches opening since 2010.
Annual Report
Board Approval of Investment Advisory Contracts and
Management Fees - continued
Investment in a Large Fund Family. The Board considered the benefits to shareholders of investing in a Fidelity fund, including the benefits of investing in a fund that is part of a large family of funds offering a variety of investment disciplines and providing a large variety of mutual fund investor services. The Board noted that Fidelity had taken, or had made recommendations that resulted in the Fidelity funds taking, a number of actions over the previous year that benefited particular funds, including (i) continuing to dedicate additional resources to investment research and support of the senior management team that oversees asset management; (ii) rationalizing product lines through the mergers of six funds into other funds; (iii) continuing to migrate the Freedom Funds to dedicated lower cost underlying funds; (iv) obtaining shareholder approval to broaden the investment strategies for Fidelity Consumer Finance Portfolio, Fidelity Emerging Asia Fund, and Fidelity Environment and Alternative Energy Portfolio; (v) contractually agreeing to reduce the management fees and impose other expense limitations on Spartan® 500 Index Fund and U.S. Bond Index Fund in connection with launching new institutional classes of these funds; (vi) changing the name, primary and supplemental benchmarks, and investment policies of Fidelity Global Strategies Fund to support the fund's flexible investment mandate and global orientation; and (vii) reducing the transfer agency account fee rates on certain accounts.
Investment Performance. The Board considered whether the fund has operated in accordance with its investment objective, as well as its record of compliance with its investment restrictions. It also reviewed the fund's absolute investment performance for each class, as well as the fund's relative investment performance for each class measured over multiple periods against a broad-based securities market index. The Board noted that FMR does not believe that a meaningful peer group exists against which to compare the fund's performance. The following charts considered by the Board show, over the one-, three-, and five-year periods ended December 31, 2010, as available, the cumulative total returns of the retail class and Class C of the fund and the cumulative total returns of a broad-based securities market index ("benchmark"). The returns of the retail class and Class C show the performance of the highest and lowest performing classes, respectively (based on three-year performance).
Annual Report
Fidelity International Real Estate Fund
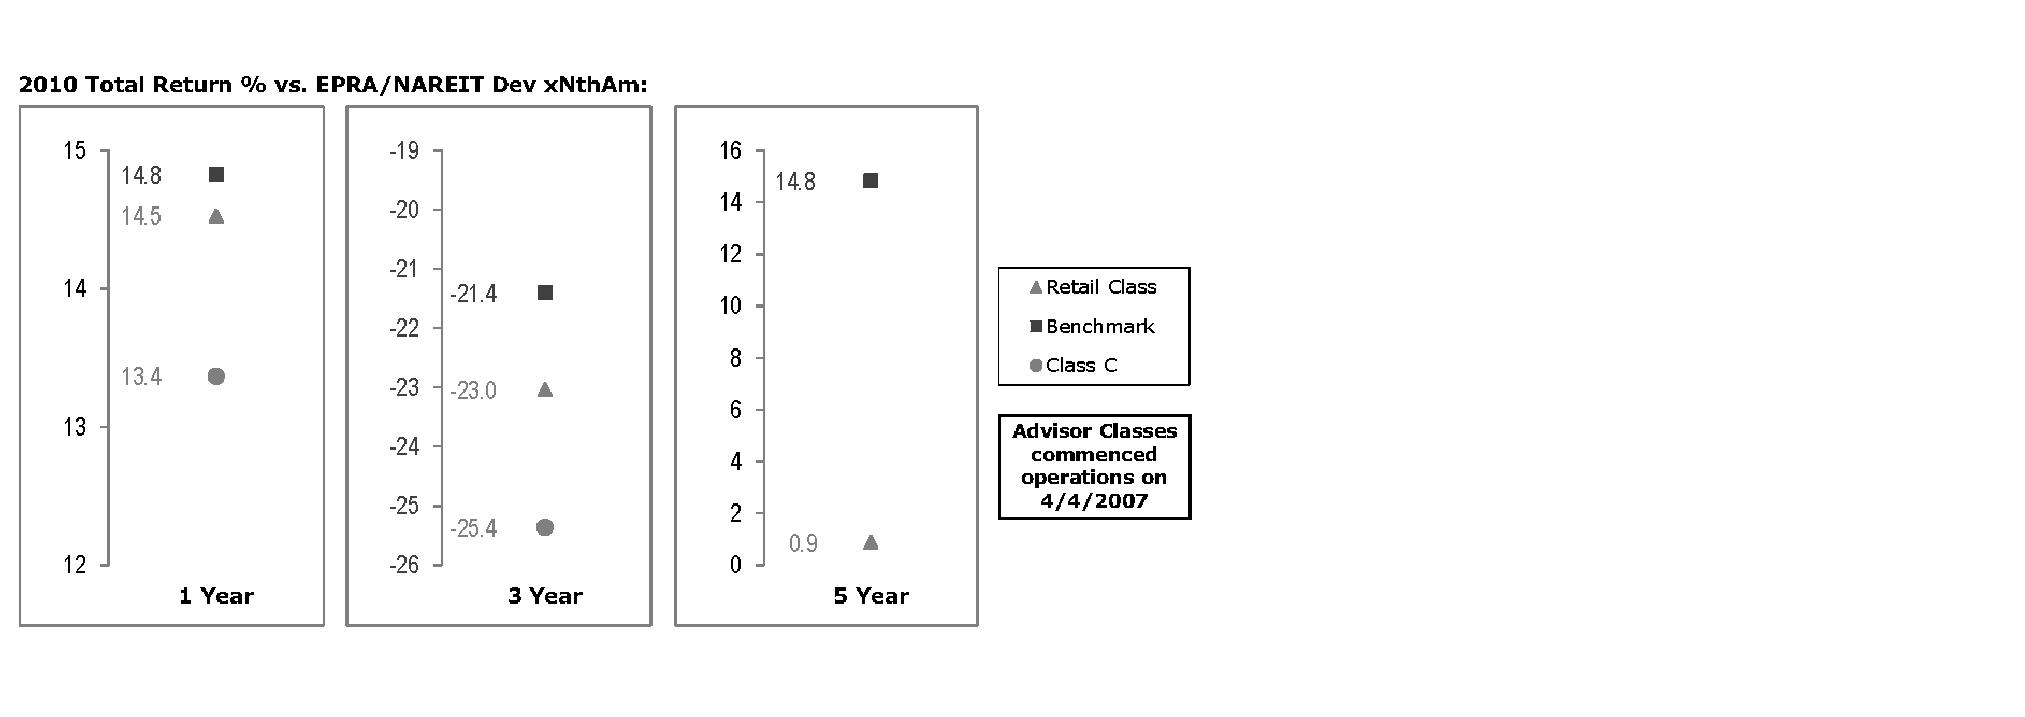
The Board noted that the investment performance of the fund was lower than its benchmark for all the periods shown. The Board considered that the variations in performance among the fund's classes reflect the variations in class expenses, which result in lower performance for higher expense classes. The Board discussed with FMR actions that have been taken by FMR to improve the fund's below-benchmark performance. The Board noted that this fund had underperformed in 2009 and discussed with FMR its disappointment with the continued underperformance of the fund. The Board also reviewed the fund's performance since inception as well as performance in the current year. The Board noted that there was a change in the fund's portfolio manager in April 2010. The Board will continue to closely monitor the performance of the fund in the coming year and discuss with FMR other appropriate actions to address the performance of the fund.
Based on its review, the Board concluded that the nature, extent, and quality of services provided to the fund under the Advisory Contracts should benefit the fund's shareholders.
Competitiveness of Management Fee and Total Expense Ratio. The Board considered the fund's management fee and total expense ratio compared to "mapped groups" of competitive funds and classes. Fidelity creates "mapped groups" by combining similar Lipper investment objective categories that have comparable management fee characteristics. Combining Lipper investment objective categories aids the Board's management fee and total expense ratio comparisons by broadening the competitive group used for comparison and by reducing the number of universes to which various Fidelity funds are compared.
Annual Report
Board Approval of Investment Advisory Contracts and
Management Fees - continued
Management Fee. The Board considered two proprietary management fee comparisons for the 12-month periods shown in the chart below. The group of Lipper funds used by the Board for management fee comparisons is referred to below as the "Total Mapped Group." The Total Mapped Group comparison focuses on a fund's standing relative to the total universe of comparable funds available to investors in terms of gross management fees before expense reimbursements or caps. "TMG %" represents the percentage of funds in the Total Mapped Group that had management fees that were lower than the fund's. For example, a TMG % of 30% means that 70% of the funds in the Total Mapped Group had higher management fees than the fund. The "Asset-Size Peer Group" (ASPG) comparison focuses on a fund's standing relative to non-Fidelity funds similar in size to the fund within the Total Mapped Group. The ASPG represents at least 15% of the funds in the Total Mapped Group with comparable asset size and management fee characteristics, subject to a minimum of 50 funds (or all funds in the Total Mapped Group if fewer than 50). Additional information, such as the ASPG quartile in which the fund's management fee ranked, is also included in the chart and considered by the Board.
Fidelity International Real Estate Fund

The Board noted that the fund's management fee ranked below the median of its Total Mapped Group and below the median of its ASPG for 2010.
Based on its review, the Board concluded that the fund's management fee is fair and reasonable in light of the services that the fund receives and the other factors considered.
Total Expense Ratio. In its review of each class's total expense ratio, the Board considered the fund's management fee as well as other fund or class expenses, as applicable, such as transfer agent fees, pricing and bookkeeping fees, fund-paid 12b-1 fees, and custodial, legal, and audit fees. The Board also noted the effects of any waivers and reimbursements on fees and expenses. As part of its review, the Board also considered the current and historical total expense ratios of each class of the fund compared to competitive fund median expenses. Each class of the fund is compared to those funds and classes in the Total Mapped Group (used by the Board for management fee comparisons) that have a similar sales load structure.
Annual Report
The Board noted that the total expense ratio of each of Class A, Class B, Class C, and the retail class ranked below its competitive median for 2010 and the total expense ratio of each of Class T and Institutional Class ranked above its competitive median for 2010. The Board considered that various factors, including 12b-1 fees, positive or negative performance adjustments, and relatively higher other expenses in the case of small fund size, can affect total expense ratios. The Board noted that the total expense ratio of Class T was above the competitive median primarily because of higher 12b-1 fees on Class T. Class T has a higher 12b-1 fee, but a lower front-end sales charge, than traditionally priced front-end sales charge classes. The Board noted that the fund offers multiple classes, each of which has a different sales load and 12b-1 fee structure, and that the multiple structures are intended to offer a range of pricing options for the intermediary market. The Board also noted that the total expense ratios of the classes vary primarily by the level of their 12b-1 fees, although differences in transfer agent fees may also cause expenses to vary from class to class.
Fees Charged to Other Fidelity Clients. The Board also considered Fidelity fee structures and other information with respect to clients of FMR and its affiliates, such as other mutual funds advised or subadvised by FMR or its affiliates, pension plan clients, and other institutional clients. In March 2010, the Board created an ad hoc joint committee with the board of other Fidelity funds (the Committee) to review and compare Fidelity's institutional investment advisory business with its business of providing services to the Fidelity funds, including the differences in services provided, fees charged, and costs incurred, as well as competition in their respective marketplaces.
Based on its review of total expense ratios and fees charged to other Fidelity clients, the Board concluded that the total expense ratio of each class of the fund was reasonable, although in some cases above the median of the universe presented for comparison, in light of the services that the fund and its shareholders receive and the other factors considered, including the findings of the Committee.
Costs of the Services and Profitability. The Board considered the revenues earned and the expenses incurred by Fidelity in conducting the business of developing, marketing, distributing, managing, administering and servicing the fund and its shareholders. The Board also considered the level of Fidelity's profits in respect of all the Fidelity funds.
Annual Report
Board Approval of Investment Advisory Contracts and
Management Fees - continued
On an annual basis, FMR presents to the Board Fidelity's profitability for the fund. Fidelity calculates the profitability for each fund, as well as aggregate profitability for groups of Fidelity funds and all Fidelity funds, using a series of detailed revenue and cost allocation methodologies which originate with the books and records of Fidelity on which Fidelity's audited financial statements are based. The Audit Committee of the Board reviews any significant changes from the prior year's methodologies.
PricewaterhouseCoopers LLP (PwC), independent registered public accounting firm and auditor to Fidelity and certain Fidelity funds, has been engaged annually by the Board as part of the Board's assessment of Fidelity's profitability analysis. PwC's engagement includes the review and assessment of Fidelity's methodologies used in determining the revenues and expenses attributable to Fidelity's mutual fund business, and completion of agreed-upon procedures surrounding the mathematical accuracy of fund profitability and its conformity to allocation methodologies. After considering PwC's reports issued under the engagement and information provided by Fidelity, the Board concluded that while other allocation methods may also be reasonable, Fidelity's profitability methodologies are reasonable in all material respects.
The Board also reviewed Fidelity's non-fund businesses and fall-out benefits related to the mutual fund business as well as cases where Fidelity's affiliates may benefit from or be related to the fund's business.
The Board considered the costs of the services provided by and the profits realized by Fidelity in connection with the operation of the fund and was satisfied that the profitability was not excessive in the circumstances.
Economies of Scale. The Board considered whether there have been economies of scale in respect of the management of the Fidelity funds, whether the Fidelity funds (including the fund) have appropriately benefited from any such economies of scale, and whether there is potential for realization of any further economies of scale. The Board considered the extent to which the fund will benefit from economies of scale through increased services to the fund, through waivers or reimbursements, or through fee or expense reductions. The Board also noted that in 2009, it and the board of other Fidelity funds created an ad hoc committee (the Economies of Scale Committee) to analyze whether FMR attains economies of scale in respect of the management and servicing of the Fidelity funds, whether the Fidelity funds have appropriately benefited from such economies of scale, and whether there is potential for realization of any further economies of scale.
The Board recognized that the fund's management contract incorporates a "group fee" structure, which provides for lower group fee rates as total fund assets under FMR's management increase, and for higher group fee rates as total fund assets under FMR's management decrease. FMR calculates the group fee rates based on a tiered asset "breakpoint" schedule that varies based on asset class. The Board considered that the group fee is designed to deliver the benefits of economies of scale to fund shareholders when total Fidelity fund assets increase, even if assets of any particular fund are unchanged or have declined, because some portion of Fidelity's costs are attributable to services provided to all Fidelity funds, and all funds benefit if those costs can be allocated among more assets. The Board concluded that, given the group fee structure, fund shareholders will benefit from lower management fees as assets under FMR's management increase at the fund complex level, regardless of whether Fidelity achieves any such economies of scale.
Annual Report
The Board concluded, taking into account the analysis of the Economies of Scale Committee, that any potential economies of scale are being appropriately shared between fund shareholders and Fidelity.
Additional Information Requested by the Board. In order to develop fully the factual basis for consideration of the Fidelity funds' Advisory Contracts, the Board requested and received additional information on certain topics, including (i) fund performance trends, actions to be taken by FMR to improve certain funds' overall performance, and Fidelity's long-term strategies for certain funds; (ii) portfolio manager changes that have occurred during the past year and length of portfolio manager tenure for different categories of funds over time; (iii) Fidelity's compensation structure for portfolio managers and other key personnel and strategies for attracting and retaining non-investment personnel; (iv) the amount of the investment that each portfolio manager has made in the Fidelity fund(s) that he or she manages; (v) historical trends in Fidelity's realization of fall-out benefits; (vi) Fidelity's group fee structures and the rationale for the individual fee rates of certain funds; (vii) fund profitability methodology and the impact of certain factors on fund profitability results; (viii) trends regarding industry use of performance fee structures and Fidelity's compliance practices with respect to performance adjustment calculations; (ix) the fee structures in place for certain other Fidelity clients; and (x) explanations regarding the relative total expense ratios of certain funds and classes, total expense competitive trends, and actions that might be taken by FMR to reduce total expense ratios for certain funds and classes.
Based on its evaluation of all of the conclusions noted above, and after considering all factors it believed relevant, the Board ultimately concluded that the advisory fee structures are fair and reasonable, and that the fund's Advisory Contracts should be renewed.
Annual Report
Investment Adviser
Fidelity Management & Research Company
Boston, MA
Investment Sub-Advisers
FMR Co., Inc.
Fidelity Management & Research
(U.K.) Inc.
FIL Investments (Japan) Limited
FIL Investment Advisers
FIL Investment Advisers (U.K.) Ltd.
Fidelity Management & Research
(Hong Kong) Limited
Fidelity Management & Research
(Japan) Inc.
General Distributor
Fidelity Distributors Corporation
Boston, MA
Transfer and Service Agents
Fidelity Investments Institutional
Operations Company, Inc.
Boston, MA
Fidelity Service Company, Inc.
Boston, MA
Custodian
The Bank of New York Mellon
New York, NY
The Fidelity Telephone Connection
Mutual Fund 24-Hour Service
Exchanges/Redemptions
and Account Assistance 1-800-544-6666
Product Information 1-800-544-6666
Retirement Accounts 1-800-544-4774
(8 a.m. - 9 p.m.)
TDD Service 1-800-544-0118
for the deaf and hearing impaired
(9 a.m. - 9 p.m. Eastern time)
Fidelity Automated Service
Telephone (FAST®) 1-800-544-5555
Automated line for quickest service
IRE-UANN-0911
1.801327.106
(Fidelity Investment logo)(registered trademark)
Fidelity Advisor®
International Real Estate
Fund - Class A, Class T,
Class B, and Class C
Annual Report
July 31, 2011
(2_fidelity_logos) (Registered_Trademark)
Class A, Class T, Class B,
and Class C are classes
of Fidelity® International
Real Estate Fund
Contents
Chairman's Message | <Click Here> | The Chairman's message to shareholders. |
Performance | <Click Here> | How the fund has done over time. |
Management's Discussion of Fund Performance | <Click Here> | The Portfolio Manager's review of fundperformance and strategy. |
Shareholder Expense Example | <Click Here> | An example of shareholder expenses. |
Investment Changes | <Click Here> | A summary of major shifts in the fund's investments over the past six months. |
Investments | <Click Here> | A complete list of the fund's investments with their market values. |
Financial Statements | <Click Here> | Statements of assets and liabilities, operations, and changes in net assets,
as well as financial highlights. |
Notes | <Click Here> | Notes to the financial statements. |
Report of Independent Registered Public Accounting Firm | <Click Here> | |
Trustees and Officers | <Click Here> | |
Distributions | <Click Here> | |
Board Approval of Investment Advisory Contracts and Management Fees | <Click Here> | |
To view a fund's proxy voting guidelines and proxy voting record for the 12-month period ended June 30, visit http://www.fidelity.com/proxyvotingresults or visit the Securities and Exchange Commission's (SEC) web site at http://www.sec.gov. You may also call 1-877-208-0098 to request a free copy of the proxy voting guidelines.
Standard & Poor's, S&P and S&P 500 are registered service marks of The McGraw-Hill Companies, Inc. and have been licensed for use by Fidelity Distributors Corporation.
Other third party marks appearing herein are the property of their respective owners.
All other marks appearing herein are registered or unregistered trademarks or service marks of FMR LLC or an affiliated company.
Annual Report
This report and the financial statements contained herein are submitted for the general information of the shareholders of the fund. This report is not authorized for distribution to prospective investors in the fund unless preceded or accompanied by an effective prospectus.
A fund files its complete schedule of portfolio holdings with the SEC for the first and third quarters of each fiscal year on Form N-Q. Forms N-Q are available on the SEC's web site at http://www.sec.gov. A fund's Forms N-Q may be reviewed and copied at the SEC's Public Reference Room in Washington, DC. Information regarding the operation of the SEC's Public Reference Room may be obtained by calling 1-800-SEC-0330. For a complete list of a fund's portfolio holdings, view the most recent holdings listing, semiannual report, or annual report on Fidelity's web site at http://www.fidelity.com, http://www.advisor.fidelity.com, or http://www.401k.com, as applicable.
NOT FDIC INSURED • MAY LOSE VALUE • NO BANK GUARANTEE
Neither the fund nor Fidelity Distributors Corporation is a bank.
Annual Report
(photo_of_James_C_Curvey)
Dear Shareholder:
The second half of 2011 began with U.S. equities continuing to give back some of the gains achieved earlier in the year. In the days leading up to July 31, markets were shaken by a political stalemate in which Congress struggled to address the debt ceiling issue before an early-August deadline. The resulting uncertainty held back markets in July, the third consecutive monthly decline for equities, effectively reversing the positive momentum seen through the end of April. Financial markets are always unpredictable, of course, but there are several time-tested investment principles that can help put the odds in your favor.
One of the basic tenets is to invest for the long term. Over time, riding out the markets' inevitable ups and downs has proven much more effective than selling into panic or chasing the hottest trend. Even missing only a few of the markets' best days can significantly diminish investor returns. Patience also affords the benefits of compounding - of earning interest on additional income or reinvested dividends and capital gains. There can be tax advantages and cost benefits to consider as well. While staying the course doesn't eliminate risk, it can considerably lessen the effect of short-term declines.
You can further manage your investing risk through diversification. And today, more than ever, geographic diversification should be taken into account. Studies indicate that asset allocation is the single most important determinant of a portfolio's long-term success. The right mix of stocks, bonds and cash - aligned to your particular risk tolerance and investment objective - is very important. Age-appropriate rebalancing is also an essential aspect of asset allocation. For younger investors, an emphasis on equities - which historically have been the best-performing asset class over time - is encouraged. As investors near their specific goal, such as retirement or sending a child to college, consideration may be given to replacing volatile assets (e.g. common stocks) with more-stable fixed investments (bonds or savings plans).
A third principle - investing regularly - can help lower the average cost of your purchases. Investing a certain amount of money each month or quarter helps ensure you won't pay for all your shares at market highs. This strategy - known as dollar cost averaging - also reduces "emotion" from investing, helping shareholders avoid selling weak performers just prior to an upswing, or chasing a hot performer just before a correction.
We invite you to contact us via the Internet, through our Investor Centers or by phone. It is our privilege to provide you the information you need to make the investments that are right for you.
Sincerely,
(The acting chairman's signature appears here.)
James C. Curvey
Acting Chairman
Annual Report
Fidelity Advisor International Real Estate Fund - Class A, T, B, and C
Average annual total return reflects the change in the value of an investment, assuming reinvestment of the class' distributions from dividend income and capital gains (the profits earned upon the sale of securities that have grown in value, if any) and assuming a constant rate of performance each year. The $10,000 table and the fund's returns do not reflect the deduction of taxes that a shareholder would pay on fund distributions or the redemption of fund shares. During periods of reimbursement by Fidelity, a fund's total return will be greater than it would be had the reimbursement not occurred. How a fund did yesterday is no guarantee of how it will do tomorrow.
Average Annual Total Returns
Periods ended July 31, 2011 | Past 1
year | Past 5
years | Life of fund A |
Class A (incl. 5.75% sales charge) B | 10.04% | -3.95% | 3.53% |
Class T (incl. 3.50% sales charge) C | 12.46% | -3.70% | 3.72% |
Class B (incl. contingent deferred sales charge) D | 10.90% | -3.73% | 3.93% |
Class C (incl. contingent deferred sales charge)E | 15.07% | -3.43% | 3.93% |
A From September 8, 2004.
B Class A shares bear a 0.25% 12b-1 fee. The initial offering of Class A shares took place on April 4, 2007. Returns prior to April 4, 2007 are those of Fidelity® International Real Estate Fund, the original class of the fund, which does not bear a 12b-1 fee. Had Class A shares' 12b-1 fee been reflected, returns prior to April 4, 2007 would have been lower.
C Class T shares bear a 0.50% 12b-1 fee. The initial offering of Class T shares took place on April 4, 2007. Returns prior to April 4, 2007 are those of Fidelity® International Real Estate Fund, the original class of the fund, which does not bear a 12b-1 fee. Had Class T shares' 12b-1 fee been reflected, returns prior to April 4, 2007 would have been lower.
D Class B shares bear a 1.00% 12b-1 fee. The initial offering of Class B shares took place on April 4, 2007. Returns prior to April 4, 2007 are those of Fidelity International Real Estate Fund, the original class of the fund, which does not bear a 12b-1 fee. Had Class B shares' 12b-1 fee been reflected, returns prior to April 4, 2007 would have been lower. Class B shares' contingent deferred sales charge included in the past one year, past five years and life of fund total return figures are 5%, 2%, and 0%, respectively.
E Class C shares bear a 1.00% 12b-1 fee. The initial offering of Class C shares took place on April 4, 2007. Returns prior to April 4, 2007 are those of Fidelity International Real Estate Fund, the original class of the fund, which does not bear a 12b-1 fee. Had Class C shares' 12b-1 fee been reflected, returns prior to April 4, 2007 would have been lower. Class C shares' contingent deferred sales charge included in the past one year, past five years and life of fund total return figures are 1%, 0%, and 0%, respectively.
Annual Report
$10,000 Over Life of Fund
Let's say hypothetically that $10,000 was invested in Fidelity Advisor® International Real Estate Fund - Class A on September 8, 2004, when the fund started, and the current 5.75% sales charge was paid. The chart shows how the value of your investment would have changed, and also shows how the MSCI® EAFE® (Europe, Australasia, Far East) Index performed over the same period. The initial offering of Class A took place on April 4, 2007. See the previous page for additional information regarding the performance of Class A.
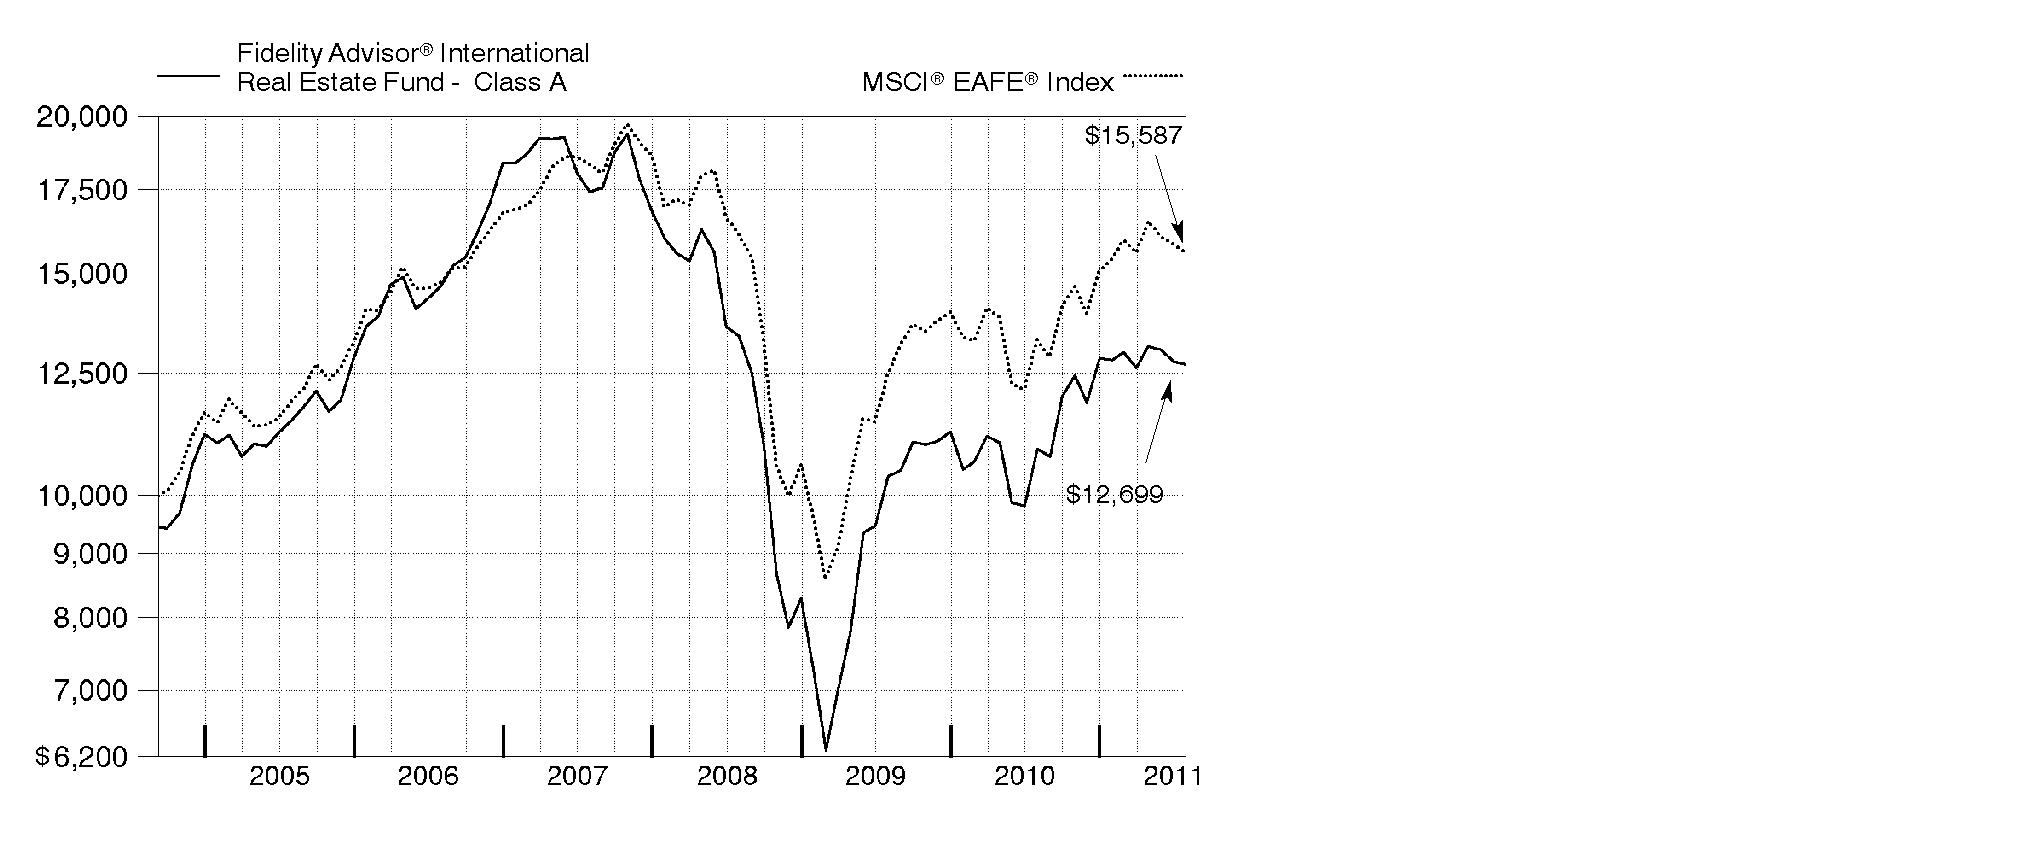
Annual Report
Market Recap: The year ending July 31, 2011, saw tremendous variability in the performance of international real estate securities. Between August 2010 and March 2011, international real estate stocks performed well, led by higher-risk property types. This situation changed abruptly in March with the Japanese earthquake and tsunami and the country's subsequent nuclear disaster. Questions about the impact of these events on global economic growth, along with rising inflation expectations in China and debt crises in Europe and the United States, led investors to favor lower-risk property types over more-speculative opportunities. In this environment, the FTSE® EPRASM/NAREIT® Developed ex North America Index - a proxy for international real estate stocks - returned 20.15%, although more than half of those gains came from a weaker U.S. dollar. In comparison, the U.S. real estate investment trust (REIT) market, as measured by the Dow Jones U.S. Select Real Estate Securities IndexSM, gained 25.23% during the same time span. The MSCI® EAFE® (Europe, Australasia, Far East) Index, which measures the performance of foreign developed-markets equities, rose 17.30%, compared with a return of 19.65% for the U.S. equity benchmark S&P 500® Index.
Comments from Guillermo de las Casas, Portfolio Manager of Fidelity Advisor® International Real Estate Fund: For the year, the fund's Class A, Class T, Class B and Class C shares returned 16.76%, 16.54%, 15.90% and 16.07%, respectively (excluding sales charges), lagging the FTSE® EPRASM/NAREIT® index. Stock picking in Singapore and Hong Kong hurt results, as did poor security selection in the U.K., lacking any exposure to strong-performing Swiss property stocks and a disappointing out-of-benchmark pick in Poland. In contrast, the fund benefited from various non-state-owned Chinese property companies with shares listed in Grand Cayman. Our German holdings also contributed meaningfully. The biggest individual detractor was Westfield Group. This Australia-based global mall developer and operator was hurt by the strength of the Australian dollar. In December 2010, Westfield spun off its Australian retail properties into a new company, a passive investment vehicle called Westfield Retail Trust. I underweighted - and ultimately sold - this latter stock, which proved to be a wise move given its decline. Other detractors of note were Singapore property developers Wing Tai Holdings and CapitaLand, and Hong Kong-based Kerry Properties and New World Development. On the plus side, the fund got a boost from significantly underweighting China Overseas Land & Investment and not owning lagging index constituents Sino Land and Shimao Property Holdings.
Comments from Guillermo de las Casas, Portfolio Manager of Fidelity Advisor® International Real Estate Fund: For the year, the fund's Institutional Class shares returned 17.18%, lagging the FTSE® EPRASM/NAREIT® index. Stock picking in Singapore and Hong Kong hurt results, as did poor security selection in the U.K., lacking any exposure to strong-performing Swiss property stocks and a disappointing out-of-benchmark pick in Poland. In contrast, the fund benefited from various non-state-owned Chinese property companies with shares listed in Grand Cayman. Our German holdings also contributed meaningfully. The biggest individual detractor was Westfield Group. This Australia-based global mall developer and operator was hurt by the strength of the Australian dollar. In December 2010, Westfield spun off its Australian retail properties into a new company, a passive investment vehicle called Westfield Retail Trust. I underweighted - and ultimately sold - this latter stock, which proved to be a wise move given its decline. Other detractors of note were Singapore property developers Wing Tai Holdings and CapitaLand, and Hong Kong-based Kerry Properties and New World Development. On the plus side, the fund got a boost from significantly underweighting China Overseas Land & Investment and not owning lagging index constituents Sino Land and Shimao Property Holdings.
Annual Report
The views expressed above reflect those of the portfolio manager(s) only through the end of the period as stated on the cover of this report and do not necessarily represent the views of Fidelity or any other person in the Fidelity organization. Any such views are subject to change at any time based upon market or other conditions and Fidelity disclaims any responsibility to update such views. These views may not be relied on as investment advice and, because investment decisions for a Fidelity fund are based on numerous factors, may not be relied on as an indication of trading intent on behalf of any Fidelity fund.
Annual Report
Shareholder Expense Example
As a shareholder of the Fund, you incur two types of costs: (1) transaction costs, including sales charges (loads) on purchase payments or redemption proceeds, redemption fees, and (2) ongoing costs, including management fees, distribution and/or service (12b-1) fees and other Fund expenses. This Example is intended to help you understand your ongoing costs (in dollars) of investing in the Fund and to compare these costs with the ongoing costs of investing in other mutual funds.
The Example is based on an investment of $1,000 invested at the beginning of the period and held for the entire period (February 1, 2011 to July 31, 2011).
Actual Expenses
The first line of the accompanying table for each class of the Fund provides information about actual account values and actual expenses. You may use the information in this line, together with the amount you invested, to estimate the expenses that you paid over the period. Simply divide your account value by $1,000.00 (for example, an $8,600 account value divided by $1,000.00 = 8.6), then multiply the result by the number in the first line for a class of the Fund under the heading entitled "Expenses Paid During Period" to estimate the expenses you paid on your account during this period. A small balance maintenance fee of $12.00 that is charged once a year may apply for certain accounts with a value of less than $2,000. This fee is not included in the table below. If it was, the estimate of expenses you paid during the period would be higher, and your ending account value lower, by this amount. In addition, the Fund, as a shareholder in the underlying Fidelity Central Funds, will indirectly bear its pro-rata share of the fees and expenses incurred by the underlying Fidelity Central Funds. These fees and expenses are not included in the Fund's annualized expense ratio used to calculate the expense estimate in the table below.
Hypothetical Example for Comparison Purposes
The second line of the accompanying table for each class of the Fund provides information about hypothetical account values and hypothetical expenses based on a Class' actual expense ratio and an assumed rate of return of 5% per year before expenses, which is not the Class' actual return. The hypothetical account values and expenses may not be used to estimate the actual ending account balance or expenses you paid for the period. You may use this information to compare the ongoing costs of investing in the Fund and other funds. To do so, compare this 5% hypothetical example with the 5% hypothetical examples that appear in the shareholder reports of the other funds. A small balance maintenance fee of $12.00 that is charged once a year may apply for certain accounts with a value of less than $2,000. This fee is not included in the table below. If it was, the estimate of expenses you paid during the period would be higher, and your ending account value lower, by this amount. In addition, the Fund, as a shareholder in the underlying Fidelity Central Funds, will indirectly bear its pro-rata share of the fees and expenses incurred by the underlying Fidelity Central Funds. These fees and expenses are not included in the Fund's annualized expense ratio used to calculate the expense estimate in the table below.
Please note that the expenses shown in the table are meant to highlight your ongoing costs only and do not reflect any transaction costs. Therefore, the second line of the table is useful in comparing ongoing costs only, and will not help you determine the relative total costs of owning different funds. In addition, if these transactional costs were included, your costs would have been higher.
Annual Report
| Annualized Expense Ratio | Beginning
Account Value
February 1, 2011 | Ending
Account Value
July 31, 2011 | Expenses Paid
During Period*
February 1, 2011
to July 31, 2011 |
Class A | 1.42% | | | |
Actual | | $ 1,000.00 | $ 992.50 | $ 7.02 |
Hypothetical A | | $ 1,000.00 | $ 1,017.75 | $ 7.10 |
Class T | 1.69% | | | |
Actual | | $ 1,000.00 | $ 992.40 | $ 8.35 |
Hypothetical A | | $ 1,000.00 | $ 1,016.41 | $ 8.45 |
Class B | 2.17% | | | |
Actual | | $ 1,000.00 | $ 989.10 | $ 10.70 |
Hypothetical A | | $ 1,000.00 | $ 1,014.03 | $ 10.84 |
Class C | 2.18% | | | |
Actual | | $ 1,000.00 | $ 990.10 | $ 10.76 |
Hypothetical A | | $ 1,000.00 | $ 1,013.98 | $ 10.89 |
International Real Estate | 1.17% | | | |
Actual | | $ 1,000.00 | $ 994.70 | $ 5.79 |
Hypothetical A | | $ 1,000.00 | $ 1,018.99 | $ 5.86 |
Institutional Class | 1.17% | | | |
Actual | | $ 1,000.00 | $ 994.60 | $ 5.79 |
Hypothetical A | | $ 1,000.00 | $ 1,018.99 | $ 5.86 |
A 5% return per year before expenses
* Expenses are equal to each Class' annualized expense ratio, multiplied by the average account value over the period, multiplied by 181/365 (to reflect the one-half year period).
Annual Report
Investment Changes (Unaudited)
Top Ten Stocks as of July 31, 2011 |
| % of fund's
net assets | % of fund's net assets
6 months ago |
Mitsui Fudosan Co. Ltd. | 6.3 | 6.7 |
Sun Hung Kai Properties Ltd. | 6.0 | 8.1 |
Westfield Group unit | 5.9 | 5.5 |
Unibail-Rodamco | 5.6 | 4.3 |
Sumitomo Realty & Development Co. Ltd. | 3.9 | 3.3 |
Hang Lung Properties Ltd. | 3.6 | 2.8 |
Hongkong Land Holdings Ltd. | 3.6 | 1.9 |
Land Securities Group PLC | 2.7 | 2.0 |
Kerry Properties Ltd. | 2.5 | 2.6 |
The GPT Group unit | 2.5 | 2.0 |
| 42.6 | |
Top Five Countries as of July 31, 2011 |
(excluding cash equivalents) | % of fund's
net assets | % of fund's net assets
6 months ago |
Hong Kong | 21.4 | 21.8 |
Japan | 18.6 | 19.4 |
Australia | 13.0 | 15.5 |
United Kingdom | 10.3 | 11.9 |
Singapore | 8.8 | 6.3 |
Percentages are adjusted for the effect of open futures contracts, if applicable. |
Top Five REIT Sectors as of July 31, 2011 |
| % of fund's
net assets | % of fund's net assets
6 months ago |
REITs - Management/Investment | 21.2 | 21.5 |
REITs - Office Buildings | 5.9 | 5.8 |
REITs - Industrial Buildings | 3.5 | 2.3 |
REITs - Shopping Centers | 2.3 | 7.3 |
REITs - Health Care Facilities | 0.5 | 0.4 |
Asset Allocation (% of fund's net assets) |
As of July 31, 2011 * | As of January 31, 2011** |
| Stocks 97.5% | | | Stocks 98.8% | |
| Short-Term
Investments and
Net Other Assets 2.5% | | | Short-Term
Investments and
Net Other Assets 1.2% | |
* Foreign investments | 97.5% | | ** Foreign investments | 98.8% | |

Annual Report
Investments July 31, 2011
Showing Percentage of Net Assets
Common Stocks - 97.5% |
| Shares | | Value |
Australia - 13.0% |
Abacus Property Group unit | 1,789,587 | | $ 4,109,211 |
Charter Hall Group unit | 833,740 | | 1,914,416 |
FKP Property Group unit | 6,666,469 | | 4,650,814 |
Goodman Group unit | 6,501,169 | | 4,856,906 |
The GPT Group unit | 2,516,398 | | 8,321,568 |
Westfield Group unit | 2,287,195 | | 20,002,101 |
TOTAL AUSTRALIA | | 43,855,016 |
Bailiwick of Jersey - 0.9% |
Atrium European Real Estate Ltd. | 462,622 | | 2,965,974 |
Belgium - 0.5% |
Warehouses de Pauw | 28,835 | | 1,574,400 |
Bermuda - 2.0% |
Asia Standard International Group | 2,218,000 | | 546,404 |
Csi Properties Ltd. | 37,900,000 | | 1,312,967 |
Great Eagle Holdings Ltd. | 1,485,088 | | 4,897,067 |
TOTAL BERMUDA | | 6,756,438 |
Brazil - 1.8% |
Aliansce Shopping Centers SA | 107,500 | | 931,408 |
BR Malls Participacoes SA | 71,900 | | 837,103 |
Companhia Brasileira de Desenvolvimento Imobiliario Turistico (a) | 129,100 | | 1,690,318 |
Even Construtora e Incorporadora SA | 144,500 | | 707,036 |
Iguatemi Empresa de Shopping Centers SA | 52,800 | | 1,153,894 |
Tecnisa SA | 94,500 | | 723,736 |
TOTAL BRAZIL | | 6,043,495 |
Cayman Islands - 1.6% |
Glorious Property Holdings Ltd. (a) | 5,474,000 | | 1,685,648 |
SOHO China Ltd. | 3,420,500 | | 3,102,843 |
SPG Land (Holdings) Ltd. | 1,876,000 | | 649,901 |
TOTAL CAYMAN ISLANDS | | 5,438,392 |
Chile - 0.3% |
Parque Arauco SA | 512,608 | | 1,064,432 |
France - 7.9% |
Altarea | 22,697 | | 4,434,605 |
Societe de la Tour Eiffel | 22,995 | | 1,981,761 |
Common Stocks - continued |
| Shares | | Value |
France - continued |
Societe Fonciere Lyonnaise SA | 27,600 | | $ 1,514,503 |
Unibail-Rodamco | 83,907 | | 18,735,300 |
TOTAL FRANCE | | 26,666,169 |
Germany - 2.6% |
alstria office REIT-AG | 310,465 | | 4,523,369 |
GSW Immobilien AG | 73,550 | | 2,583,884 |
Hamborner (REIT) AG | 67,347 | | 688,017 |
IVG Immobilien AG (a) | 170,100 | | 1,172,182 |
TOTAL GERMANY | | 8,967,452 |
Hong Kong - 21.4% |
China Overseas Land & Investment Ltd. | 3,418,000 | | 7,674,690 |
China State Construction International Holdings Ltd. | 3,230,539 | | 3,237,254 |
Hang Lung Properties Ltd. | 3,292,000 | | 12,164,746 |
Hongkong Land Holdings Ltd. | 1,798,000 | | 12,082,560 |
Kerry Properties Ltd. | 1,771,000 | | 8,589,366 |
Magnificent Estates Ltd. | 13,844,000 | | 586,174 |
New World Development Co. Ltd. | 3,302,725 | | 4,864,801 |
Shangri-La Asia Ltd. | 658,000 | | 1,696,964 |
Soundwill Holdings Ltd. | 662,000 | | 995,489 |
Sun Hung Kai Properties Ltd. | 1,329,000 | | 20,223,691 |
TOTAL HONG KONG | | 72,115,735 |
Italy - 2.4% |
Beni Stabili SpA SIIQ | 3,753,700 | | 3,349,366 |
Immobiliare Grande Distribuzione SpA | 2,119,605 | | 4,315,551 |
Pirelli & C. Real Estate SpA (a) | 1,176,200 | | 642,716 |
TOTAL ITALY | | 8,307,633 |
Japan - 18.6% |
Goldcrest Co. Ltd. | 57,920 | | 1,361,363 |
Hulic Co. Ltd. | 524,000 | | 5,582,797 |
Japan Retail Fund Investment Corp. | 2,294 | | 3,585,632 |
Kenedix, Inc. (a)(d) | 41,527 | | 8,120,332 |
Mitsubishi Estate Co. Ltd. | 79,000 | | 1,420,594 |
Mitsui Fudosan Co. Ltd. | 1,112,000 | | 21,224,293 |
Nomura Real Estate Holdings, Inc. | 198,500 | | 3,649,419 |
Sumitomo Realty & Development Co. Ltd. | 529,000 | | 13,100,422 |
Tokyo Tatemono Co. Ltd. | 959,000 | | 3,924,966 |
Tosei Corp. (d) | 2,140 | | 653,136 |
TOTAL JAPAN | | 62,622,954 |
Common Stocks - continued |
| Shares | | Value |
Netherlands - 1.3% |
Corio NV | 73,000 | | $ 4,464,645 |
Poland - 0.6% |
Globe Trade Centre SA (a) | 354,000 | | 2,099,267 |
Russia - 0.5% |
LSR Group OJSC GDR (Reg. S) | 216,700 | | 1,636,085 |
Singapore - 8.8% |
CapitaLand Ltd. | 3,044,900 | | 7,333,148 |
Global Logistic Properties Ltd. | 4,420,000 | | 7,414,691 |
Mapletree Industrial (REIT) | 4,443,000 | | 4,519,931 |
Parkway Life REIT | 1,065,000 | | 1,645,061 |
Wing Tai Holdings Ltd. | 5,302,000 | | 6,516,597 |
Yanlord Land Group Ltd. | 2,080,000 | | 2,150,563 |
TOTAL SINGAPORE | | 29,579,991 |
Spain - 0.2% |
Inmobiliaria Colonial SA (a)(d) | 96,025 | | 651,235 |
Sweden - 2.8% |
Castellum AB (d) | 246,000 | | 3,569,666 |
Kungsleden AB | 196,589 | | 1,812,211 |
Wihlborgs Fastigheter AB | 283,700 | | 3,990,472 |
TOTAL SWEDEN | | 9,372,349 |
United Kingdom - 10.3% |
Big Yellow Group PLC | 1,174,700 | | 5,532,544 |
British Land Co. PLC | 799,789 | | 7,680,662 |
Great Portland Estates PLC | 331,554 | | 2,265,289 |
Helical Bar PLC | 905,300 | | 3,633,614 |
Land Securities Group PLC | 648,938 | | 9,108,286 |
Quintain Estates & Development PLC (a) | 2,148,600 | | 2,081,014 |
Safestore Holdings PLC | 621,100 | | 1,233,713 |
St. Modwen Properties PLC | 1,122,000 | | 3,188,286 |
TOTAL UNITED KINGDOM | | 34,723,408 |
TOTAL COMMON STOCKS (Cost $356,163,164) | 328,905,070 |
Money Market Funds - 1.7% |
| Shares | | Value |
Fidelity Cash Central Fund, 0.14% (b) | 3,455,115 | | $ 3,455,115 |
Fidelity Securities Lending Cash Central Fund, 0.15% (b)(c) | 2,246,812 | | 2,246,812 |
TOTAL MONEY MARKET FUNDS (Cost $5,701,927) | 5,701,927 |
TOTAL INVESTMENT PORTFOLIO - 99.2% (Cost $361,865,091) | 334,606,997 |
NET OTHER ASSETS (LIABILITIES) - 0.8% | | 2,544,171 |
NET ASSETS - 100% | $ 337,151,168 |
Legend |
(a) Non-income producing |
(b) Affiliated fund that is available only to investment companies and other accounts managed by Fidelity Investments. The rate quoted is the annualized seven-day yield of the fund at period end. A complete unaudited listing of the fund's holdings as of its most recent quarter end is available upon request. In addition, each Fidelity Central Fund's financial statements, which are not covered by the Fund's Report of Independent Registered Public Accounting Firm, are available on the SEC's website or upon request. |
(c) Investment made with cash collateral received from securities on loan. |
(d) Security or a portion of the security is on loan at period end. |
Affiliated Central Funds |
Information regarding fiscal year to date income earned by the Fund from investments in Fidelity Central Funds is as follows: |
Fund | Income earned |
Fidelity Cash Central Fund | $ 5,442 |
Fidelity Securities Lending Cash Central Fund | 168,341 |
Total | $ 173,783 |
Other Information |
All investments are categorized as Level 1 under the Fair Value Hierarchy. The inputs or methodology used for valuing securities may not be an indication of the risk associated with investing in those securities. For more information on valuation inputs, please refer to the Security Valuation section in the accompanying Notes to Financial Statements. |
Income Tax Information |
At July 31, 2011, the Fund had a capital loss carryforward of approximately $289,916,707 of which $153,317,175 and $136,599,532 will expire in fiscal 2017 and 2018, respectively. Capital loss carryforwards are only available to offset future capital gains of the Fund to the extent provided by regulations and may be limited. |
See accompanying notes which are an integral part of the financial statements.
Annual Report
Statement of Assets and Liabilities
| July 31, 2011 |
Assets | | |
Investment in securities, at value (including securities loaned of $2,134,155) - See accompanying schedule: Unaffiliated issuers (cost $356,163,164) | $ 328,905,070 | |
Fidelity Central Funds (cost $5,701,927) | 5,701,927 | |
Total Investments (cost $361,865,091) | | $ 334,606,997 |
Foreign currency held at value (cost $234,321) | | 235,566 |
Receivable for investments sold | | 7,589,065 |
Receivable for fund shares sold | | 237,833 |
Dividends receivable | | 860,853 |
Distributions receivable from Fidelity Central Funds | | 9,691 |
Other receivables | | 87,555 |
Total assets | | 343,627,560 |
| | |
Liabilities | | |
Payable to custodian bank | $ 168,407 | |
Payable for investments purchased | 3,139,399 | |
Payable for fund shares redeemed | 485,409 | |
Accrued management fee | 200,120 | |
Distribution and service plan fees payable | 5,831 | |
Other affiliated payables | 99,786 | |
Other payables and accrued expenses | 130,628 | |
Collateral on securities loaned, at value | 2,246,812 | |
Total liabilities | | 6,476,392 |
| | |
Net Assets | | $ 337,151,168 |
Net Assets consist of: | | |
Paid in capital | | $ 647,993,841 |
Undistributed net investment income | | 4,912,084 |
Accumulated undistributed net realized gain (loss) on investments and foreign currency transactions | | (288,485,740) |
Net unrealized appreciation (depreciation) on investments and assets and liabilities in foreign currencies | | (27,269,017) |
Net Assets | | $ 337,151,168 |
See accompanying notes which are an integral part of the financial statements.
Annual Report
Statement of Assets and Liabilities - continued
| July 31, 2011 |
Calculation of Maximum Offering Price Class A:
Net Asset Value and redemption price per share ($7,046,650 ÷ 764,709 shares) | | $ 9.21 |
| | |
Maximum offering price per share (100/94.25 of $9.21) | | $ 9.77 |
Class T:
Net Asset Value and redemption price per share ($2,496,490 ÷ 272,635 shares) | | $ 9.16 |
| | |
Maximum offering price per share (100/96.50 of $9.16) | | $ 9.49 |
Class B:
Net Asset Value and offering price per share ($570,154 ÷ 62,979 shares) A | | $ 9.05 |
| | |
Class C:
Net Asset Value and offering price per share ($3,207,979 ÷ 355,336 shares) A | | $ 9.03 |
| | |
International Real Estate:
Net Asset Value, offering price and redemption price per share ($322,045,234 ÷ 34,631,945 shares) | | $ 9.30 |
| | |
Institutional Class:
Net Asset Value, offering price and redemption price per share ($1,784,661 ÷ 192,333 shares) | | $ 9.28 |
A Redemption price per share is equal to net asset value less any applicable contingent deferred sales charge.
See accompanying notes which are an integral part of the financial statements.
Annual Report
Financial Statements - continued
Statement of Operations
| Year ended July 31, 2011 |
Investment Income | | |
Dividends | | $ 11,535,462 |
Special dividends | | 7,319,957 |
Interest | | 221 |
Income from Fidelity Central Funds | | 173,783 |
Income before foreign taxes withheld | | 19,029,423 |
Less foreign taxes withheld | | (861,698) |
Total income | | 18,167,725 |
| | |
Expenses | | |
Management fee | $ 2,554,814 | |
Transfer agent fees | 1,087,758 | |
Distribution and service plan fees | 76,402 | |
Accounting and security lending fees | 187,904 | |
Custodian fees and expenses | 220,247 | |
Independent trustees' compensation | 1,930 | |
Registration fees | 81,632 | |
Audit | 81,939 | |
Legal | 1,531 | |
Interest | 134 | |
Miscellaneous | 4,210 | |
Total expenses before reductions | 4,298,501 | |
Expense reductions | (215,862) | 4,082,639 |
Net investment income (loss) | | 14,085,086 |
Realized and Unrealized Gain (Loss) Net realized gain (loss) on: | | |
Investment securities: | | |
Unaffiliated issuers | 38,029,900 | |
Foreign currency transactions | (598,975) | |
Total net realized gain (loss) | | 37,430,925 |
Change in net unrealized appreciation (depreciation) on: Investment securities | 3,872,756 | |
Assets and liabilities in foreign currencies | 3,539 | |
Total change in net unrealized appreciation (depreciation) | | 3,876,295 |
Net gain (loss) | | 41,307,220 |
Net increase (decrease) in net assets resulting from operations | | $ 55,392,306 |
See accompanying notes which are an integral part of the financial statements.
Annual Report
Statement of Changes in Net Assets
| Year ended
July 31, 2011 | Year ended
July 31, 2010 |
Increase (Decrease) in Net Assets | | |
Operations | | |
Net investment income (loss) | $ 14,085,086 | $ 7,955,511 |
Net realized gain (loss) | 37,430,925 | 348,071 |
Change in net unrealized appreciation (depreciation) | 3,876,295 | 9,565,008 |
Net increase (decrease) in net assets resulting
from operations | 55,392,306 | 17,868,590 |
Distributions to shareholders from net investment income | (13,892,744) | (3,235,770) |
Distributions to shareholders from net realized gain | (11,440,782) | (5,017,915) |
Total distributions | (25,333,526) | (8,253,685) |
Share transactions - net increase (decrease) | (26,030,265) | (26,300,777) |
Redemption fees | 74,922 | 80,485 |
Total increase (decrease) in net assets | 4,103,437 | (16,605,387) |
| | |
Net Assets | | |
Beginning of period | 333,047,731 | 349,653,118 |
End of period (including undistributed net investment income of $4,912,084 and undistributed net investment income of $4,719,742, respectively) | $ 337,151,168 | $ 333,047,731 |
See accompanying notes which are an integral part of the financial statements.
Annual Report
Financial Highlights - Class A
Years ended July 31, | 2011 | 2010 | 2009 | 2008 | 2007 I |
Selected Per-Share Data | | | | | |
Net asset value, beginning of period | $ 8.46 | $ 8.24 | $ 10.63 | $ 15.71 | $ 17.46 |
Income from Investment Operations | | | | | |
Net investment income (loss) E | .34 H | .17 | .18 | .20 | .11 |
Net realized and unrealized gain (loss) | 1.04 | .24 | (2.57) | (3.48) | (1.87) |
Total from investment operations | 1.38 | .41 | (2.39) | (3.28) | (1.76) |
Distributions from net investment income | (.33) | (.07) | - | (.31) | - |
Distributions from net realized gain | (.29) | (.12) | - | (1.50) | - |
Total distributions | (.63) L | (.19) | - | (1.81) | - |
Redemption fees added to paid in capital E | - K | - K | - K | .01 | .01 |
Net asset value, end of period | $ 9.21 | $ 8.46 | $ 8.24 | $ 10.63 | $ 15.71 |
Total Return B,C,D | 16.76% | 4.97% | (22.48)% | (23.20)% | (10.02)% |
Ratios to Average Net Assets F,J | | | | | |
Expenses before reductions | 1.42% | 1.44% | 1.45% | 1.38% | 1.37% A |
Expenses net of fee waivers, if any | 1.42% | 1.44% | 1.45% | 1.38% | 1.37% A |
Expenses net of all reductions | 1.36% | 1.39% | 1.42% | 1.35% | 1.26% A |
Net investment income (loss) | 3.67% H | 2.02% | 2.55% | 1.58% | 2.08% A |
Supplemental Data | | | | | |
Net assets, end of period (000 omitted) | $ 7,047 | $ 7,250 | $ 6,745 | $ 9,976 | $ 5,087 |
Portfolio turnover rate G | 131% | 95% | 55% | 63% | 144% |
A Annualized
B Total returns for periods of less than one year are not annualized.
C Total returns would have been lower if certain expenses had not been reduced during the applicable periods shown.
D Total returns do not include the effect of the sales charges.
E Calculated based on average shares outstanding during the period.
F Fees and expenses of any underlying Fidelity Central Funds are not included in the Fund's expense ratio. The Fund indirectly bears its proportionate share of the expenses of any underlying Fidelity Central Funds.
G Amount does not include the portfolio activity of any underlying Fidelity Central Funds.
H Investment income per share reflects special dividends which amounted to $.19 per share. Excluding these special dividends, the ratio of net investment income (loss) to average net assets would have been 1.64%.
I For the period April 4, 2007 (commencement of sale of shares) to July 31, 2007.
J Expense ratios reflect operating expenses of the class. Expenses before reductions do not reflect amounts reimbursed by the investment adviser or reductions from brokerage service arrangements or reductions from other expense offset arrangements and do not represent the amount paid by the class during periods when reimbursements or reductions occur. Expense ratios before reductions for start-up periods may not be representative of longer-term operating periods. Expenses net of fee waivers reflect expenses after reimbursement by the investment adviser but prior to reductions from brokerage service arrangements or other expense offset arrangements. Expenses net of all reductions represent the net expenses paid by the class.
K Amount represents less than $.01 per share.
L Total distributions of $.63 per share is comprised of distributions from net investment income of $.333 and distributions from net realized gain of $.294 per share.
See accompanying notes which are an integral part of the financial statements.
Annual Report
Financial Highlights - Class T
Years ended July 31, | 2011 | 2010 | 2009 | 2008 | 2007 I |
Selected Per-Share Data | | | | | |
Net asset value, beginning of period | $ 8.41 | $ 8.21 | $ 10.62 | $ 15.70 | $ 17.46 |
Income from Investment Operations | | | | | |
Net investment income (loss) E | .31 H | .15 | .17 | .17 | .10 |
Net realized and unrealized gain (loss) | 1.04 | .23 | (2.58) | (3.48) | (1.87) |
Total from investment operations | 1.35 | .38 | (2.41) | (3.31) | (1.77) |
Distributions from net investment income | (.31) | (.06) | - | (.28) | - |
Distributions from net realized gain | (.29) | (.12) | - | (1.50) | - |
Total distributions | (.60) | (.18) | - | (1.78) | - |
Redemption fees added to paid in capital E | - K | - K | - K | .01 | .01 |
Net asset value, end of period | $ 9.16 | $ 8.41 | $ 8.21 | $ 10.62 | $ 15.70 |
Total Return B,C,D | 16.54% | 4.68% | (22.69)% | (23.39)% | (10.08)% |
Ratios to Average Net Assets F,J | | | | | |
Expenses before reductions | 1.69% | 1.70% | 1.71% | 1.64% | 1.61% A |
Expenses net of fee waivers, if any | 1.69% | 1.70% | 1.71% | 1.64% | 1.61% A |
Expenses net of all reductions | 1.63% | 1.65% | 1.68% | 1.60% | 1.51% A |
Net investment income (loss) | 3.41% H | 1.75% | 2.29% | 1.32% | 1.90% A |
Supplemental Data | | | | | |
Net assets, end of period (000 omitted) | $ 2,496 | $ 2,510 | $ 2,080 | $ 7,566 | $ 2,398 |
Portfolio turnover rate G | 131% | 95% | 55% | 63% | 144% |
A Annualized
B Total returns for periods of less than one year are not annualized.
C Total returns would have been lower if certain expenses had not been reduced during the applicable periods shown.
D Total returns do not include the effect of the sales charges.
E Calculated based on average shares outstanding during the period.
F Fees and expenses of any underlying Fidelity Central Funds are not included in the Fund's expense ratio. The Fund indirectly bears its proportionate share of the expenses of any underlying Fidelity Central Funds.
G Amount does not include the portfolio activity of any underlying Fidelity Central Funds.
H Investment income per share reflects special dividends which amounted to $.19 per share. Excluding these special dividends, the ratio of net investment income (loss) to average net assets would have been 1.38%.
I For the period April 4, 2007 (commencement of sale of shares) to July 31, 2007.
J Expense ratios reflect operating expenses of the class. Expenses before reductions do not reflect amounts reimbursed by the investment adviser or reductions from brokerage service arrangements or reductions from other expense offset arrangements and do not represent the amount paid by the class during periods when reimbursements or reductions occur. Expense ratios before reductions for start-up periods may not be representative of longer-term operating periods. Expenses net of fee waivers reflect expenses after reimbursement by the investment adviser but prior to reductions from brokerage service arrangements or other expense offset arrangements. Expenses net of all reductions represent the net expenses paid by the class.
K Amount represents less than $.01 per share.
See accompanying notes which are an integral part of the financial statements.
Annual Report
Financial Highlights - Class B
Years ended July 31, | 2011 | 2010 | 2009 | 2008 | 2007 I |
Selected Per-Share Data | | | | | |
Net asset value, beginning of period | $ 8.32 | $ 8.14 | $ 10.58 | $ 15.67 | $ 17.46 |
Income from Investment Operations | | | | | |
Net investment income (loss) E | .26 H | .11 | .13 | .11 | .07 |
Net realized and unrealized gain (loss) | 1.03 | .23 | (2.57) | (3.48) | (1.87) |
Total from investment operations | 1.29 | .34 | (2.44) | (3.37) | (1.80) |
Distributions from net investment income | (.27) | (.04) | - | (.23) | - |
Distributions from net realized gain | (.29) | (.12) | - | (1.50) | - |
Total distributions | (.56) | (.16) | - | (1.73) | - |
Redemption fees added to paid in capital E | - K | - K | - K | .01 | .01 |
Net asset value, end of period | $ 9.05 | $ 8.32 | $ 8.14 | $ 10.58 | $ 15.67 |
Total Return B,C,D | 15.90% | 4.20% | (23.06)% | (23.80)% | (10.25)% |
Ratios to Average Net Assets F,J | | | | | |
Expenses before reductions | 2.17% | 2.19% | 2.19% | 2.14% | 2.11% A |
Expenses net of fee waivers, if any | 2.17% | 2.19% | 2.19% | 2.14% | 2.11% A |
Expenses net of all reductions | 2.11% | 2.14% | 2.17% | 2.11% | 2.01% A |
Net investment income (loss) | 2.92% H | 1.26% | 1.81% | .82% | 1.38% A |
Supplemental Data | | | | | |
Net assets, end of period (000 omitted) | $ 570 | $ 629 | $ 606 | $ 930 | $ 1,158 |
Portfolio turnover rate G | 131% | 95% | 55% | 63% | 144% |
A Annualized
B Total returns for periods of less than one year are not annualized.
C Total returns would have been lower if certain expenses had not been reduced during the applicable periods shown.
D Total returns do not include the effect of the contingent deferred sales charge.
E Calculated based on average shares outstanding during the period.
F Fees and expenses of any underlying Fidelity Central Funds are not included in the Fund's expense ratio. The Fund indirectly bears its proportionate share of the expenses of any underlying Fidelity Central Funds.
G Amount does not include the portfolio activity of any underlying Fidelity Central Funds.
H Investment income per share reflects special dividends which amounted to $.18 per share. Excluding these special dividends, the ratio of net investment income (loss) to average net assets would have been .90%.
I For the period April 4, 2007 (commencement of sale of shares) to July 31, 2007.
J Expense ratios reflect operating expenses of the class. Expenses before reductions do not reflect amounts reimbursed by the investment adviser or reductions from brokerage service arrangements or reductions from other expense offset arrangements and do not represent the amount paid by the class during periods when reimbursements or reductions occur. Expense ratios before reductions for start-up periods may not be representative of longer-term operating periods. Expenses net of fee waivers reflect expenses after reimbursement by the investment adviser but prior to reductions from brokerage service arrangements or other expense offset arrangements. Expenses net of all reductions represent the net expenses paid by the class.
K Amount represents less than $.01 per share.
See accompanying notes which are an integral part of the financial statements.
Annual Report
Financial Highlights - Class C
Years ended July 31, | 2011 | 2010 | 2009 | 2008 | 2007 I |
Selected Per-Share Data | | | | | |
Net asset value, beginning of period | $ 8.30 | $ 8.13 | $ 10.57 | $ 15.67 | $ 17.46 |
Income from Investment Operations | | | | | |
Net investment income (loss) E | .26 H | .11 | .13 | .11 | .07 |
Net realized and unrealized gain (loss) | 1.04 | .22 | (2.57) | (3.48) | (1.87) |
Total from investment operations | 1.30 | .33 | (2.44) | (3.37) | (1.80) |
Distributions from net investment income | (.28) | (.04) | - | (.24) | - |
Distributions from net realized gain | (.29) | (.12) | - | (1.50) | - |
Total distributions | (.57) | (.16) | - | (1.74) | - |
Redemption fees added to paid in capital E | - K | - K | - K | .01 | .01 |
Net asset value, end of period | $ 9.03 | $ 8.30 | $ 8.13 | $ 10.57 | $ 15.67 |
Total Return B,C,D | 16.07% | 4.10% | (23.08)% | (23.78)% | (10.25)% |
Ratios to Average Net Assets F,J | | | | | |
Expenses before reductions | 2.17% | 2.18% | 2.19% | 2.14% | 2.10% A |
Expenses net of fee waivers, if any | 2.17% | 2.18% | 2.19% | 2.14% | 2.10% A |
Expenses net of all reductions | 2.11% | 2.14% | 2.17% | 2.11% | 2.00% A |
Net investment income (loss) | 2.92% H | 1.27% | 1.81% | .82% | 1.35% A |
Supplemental Data | | | | | |
Net assets, end of period (000 omitted) | $ 3,208 | $ 3,201 | $ 2,496 | $ 3,477 | $ 2,629 |
Portfolio turnover rate G | 131% | 95% | 55% | 63% | 144% |
A Annualized
B Total returns for periods of less than one year are not annualized.
C Total returns would have been lower if certain expenses had not been reduced during the applicable periods shown.
D Total returns do not include the effect of the contingent deferred sales charge.
E Calculated based on average shares outstanding during the period.
F Fees and expenses of any underlying Fidelity Central Funds are not included in the Fund's expense ratio. The Fund indirectly bears its proportionate share of the expenses of any underlying Fidelity Central Funds.
G Amount does not include the portfolio activity of any underlying Fidelity Central Funds.
H Investment income per share reflects special dividends which amounted to $.18 per share. Excluding these special dividends, the ratio of net investment income (loss) to average net assets would have been .89%.
I For the period April 4, 2007 (commencement of sale of shares) to July 31, 2007.
J Expense ratios reflect operating expenses of the class. Expenses before reductions do not reflect amounts reimbursed by the investment adviser or reductions from brokerage service arrangements or reductions from other expense offset arrangements and do not represent the amount paid by the class during periods when reimbursements or reductions occur. Expense ratios before reductions for start-up periods may not be representative of longer-term operating periods. Expenses net of fee waivers reflect expenses after reimbursement by the investment adviser but prior to reductions from brokerage service arrangements or other expense offset arrangements. Expenses net of all reductions represent the net expenses paid by the class.
K Amount represents less than $.01 per share.
See accompanying notes which are an integral part of the financial statements.
Annual Report
Financial Highlights - International Real Estate
Years ended July 31, | 2011 | 2010 | 2009 | 2008 | 2007 |
Selected Per-Share Data | | | | | |
Net asset value, beginning of period | $ 8.53 | $ 8.29 | $ 10.68 | $ 15.73 | $ 14.69 |
Income from Investment Operations | | | | | |
Net investment income (loss) B | .36 E | .19 | .20 | .25 | .31 |
Net realized and unrealized gain (loss) | 1.06 | .25 | (2.59) | (3.50) | 2.35 |
Total from investment operations | 1.42 | .44 | (2.39) | (3.25) | 2.66 |
Distributions from net investment income | (.35) | (.08) | - | (.31) | (.22) |
Distributions from net realized gain | (.29) | (.12) | - | (1.50) | (1.42) |
Total distributions | (.65) H | (.20) | - | (1.81) | (1.64) |
Redemption fees added to paid in capital B | - G | - G | - G | .01 | .02 |
Net asset value, end of period | $ 9.30 | $ 8.53 | $ 8.29 | $ 10.68 | $ 15.73 |
Total Return A | 17.15% | 5.29% | (22.38)% | (22.97)% | 19.01% |
Ratios to Average Net Assets C,F | | | | | |
Expenses before reductions | 1.17% | 1.19% | 1.19% | 1.11% | 1.07% |
Expenses net of fee waivers, if any | 1.17% | 1.19% | 1.19% | 1.10% | 1.06% |
Expenses net of all reductions | 1.11% | 1.14% | 1.16% | 1.07% | .96% |
Net investment income (loss) | 3.92% E | 2.27% | 2.81% | 1.86% | 1.86% |
Supplemental Data | | | | | |
Net assets, end of period (000 omitted) | $ 322,045 | $ 318,032 | $ 336,126 | $ 572,985 | $ 1,032,138 |
Portfolio turnover rate D | 131% | 95% | 55% | 63% | 144% |
A Total returns would have been lower if certain expenses had not been reduced during the applicable periods shown.
B Calculated based on average shares outstanding during the period.
C Fees and expenses of any underlying Fidelity Central Funds are not included in the Fund's expense ratio. The Fund indirectly bears its proportionate share of the expenses of any underlying Fidelity Central Funds.
D Amount does not include the portfolio activity of any underlying Fidelity Central Funds.
E Investment income per share reflects special dividends which amounted to $.19 per share. Excluding these special dividends, the ratio of net investment income (loss) to average net assets would have been 1.90%.
F Expense ratios reflect operating expenses of the class. Expenses before reductions do not reflect amounts reimbursed by the investment adviser or reductions from brokerage service arrangements or reductions from other expense offset arrangements and do not represent the amount paid by the class during periods when reimbursements or reductions occur. Expenses net of fee waivers reflect expenses after reimbursement by the investment adviser but prior to reductions from brokerage service arrangements or other expense offset arrangements. Expenses net of all reductions represent the net expenses paid by the class.
G Amount represents less than $.01 per share.
H Total distributions of $.65 per share is comprised of distributions from net investment income of $.354 and distributions from net realized gain of $.294 per share.
See accompanying notes which are an integral part of the financial statements.
Annual Report
Financial Highlights - Institutional Class
Years ended July 31, | 2011 | 2010 | 2009 | 2008 | 2007 H |
Selected Per-Share Data | | | | | |
Net asset value, beginning of period | $ 8.51 | $ 8.28 | $ 10.66 | $ 15.73 | $ 17.46 |
Income from Investment Operations | | | | | |
Net investment income (loss) D | .36 G | .19 | .20 | .24 | .12 |
Net realized and unrealized gain (loss) | 1.06 | .24 | (2.58) | (3.49) | (1.86) |
Total from investment operations | 1.42 | .43 | (2.38) | (3.25) | (1.74) |
Distributions from net investment income | (.35) | (.08) | - | (.33) | - |
Distributions from net realized gain | (.29) | (.12) | - | (1.50) | - |
Total distributions | (.65) K | (.20) | - | (1.83) | - |
Redemption fees added to paid in capital D | - J | - J | - J | .01 | .01 |
Net asset value, end of period | $ 9.28 | $ 8.51 | $ 8.28 | $ 10.66 | $ 15.73 |
Total Return B,C | 17.18% | 5.18% | (22.33)% | (22.98)% | (9.91)% |
Ratios to Average Net Assets E,I | | | | | |
Expenses before reductions | 1.17% | 1.18% | 1.19% | 1.13% | 1.08% A |
Expenses net of fee waivers, if any | 1.17% | 1.18% | 1.19% | 1.13% | 1.08% A |
Expenses net of all reductions | 1.11% | 1.14% | 1.17% | 1.10% | .97% A |
Net investment income (loss) | 3.92% G | 2.27% | 2.81% | 1.83% | 2.27% A |
Supplemental Data | | | | | |
Net assets, end of period (000 omitted) | $ 1,785 | $ 1,425 | $ 1,600 | $ 3,289 | $ 2,477 |
Portfolio turnover rate F | 131% | 95% | 55% | 63% | 144% |
A Annualized
B Total returns for periods of less than one year are not annualized.
C Total returns would have been lower if certain expenses had not been reduced during the applicable periods shown.
D Calculated based on average shares outstanding during the period.
E Fees and expenses of any underlying Fidelity Central Funds are not included in the Fund's expense ratio. The Fund indirectly bears its proportionate share of the expenses of any underlying Fidelity Central Funds.
F Amount does not include the portfolio activity of any underlying Fidelity Central Funds.
G Investment income per share reflects special dividends which amounted to $.19 per share. Excluding these special dividends, the ratio of net investment income (loss) to average net assets would have been 1.90%.
H For the period April 4, 2007 (commencement of sale of shares) to July 31, 2007.
I Expense ratios reflect operating expenses of the class. Expenses before reductions do not reflect amounts reimbursed by the investment adviser or reductions from brokerage service arrangements or reductions from other expense offset arrangements and do not represent the amount paid by the class during periods when reimbursements or reductions occur. Expense ratios before reductions for start-up periods may not be representative of longer-term operating periods. Expenses net of fee waivers reflect expenses after reimbursement by the investment adviser but prior to reductions from brokerage service arrangements or other expense offset arrangements. Expenses net of all reductions represent the net expenses paid by the class.
J Amount represents less than $.01 per share.
K Total distributions of $.65 per share is comprised of distributions from net investment income of $.354 and distributions from net realized gain of $.294 per share.
See accompanying notes which are an integral part of the financial statements.
Annual Report
Notes to Financial Statements
For the period ended July 31, 2011
1. Organization.
Fidelity International Real Estate Fund (the Fund) is a non-diversified fund of Fidelity Securities Fund (the Trust) and is authorized to issue an unlimited number of shares. The Trust is registered under the Investment Company Act of 1940, as amended (the 1940 Act), as an open-end management investment company organized as a Massachusetts business trust. The Fund offers Class A, Class T, Class C, International Real Estate and Institutional Class shares, each of which, along with Class B shares, has equal rights as to assets and voting privileges. Effective after the close of business on September 1, 2010, Class B shares were closed to new accounts and additional purchases, except for exchanges and reinvestments, by existing shareholders. Each class has exclusive voting rights with respect to matters that affect that class. Class B shares will automatically convert to Class A shares after a holding period of seven years from the initial date of purchase. Investment income, realized and unrealized capital gains and losses, the common expenses of the Fund, and certain fund-level expense reductions, if any, are allocated on a pro-rata basis to each class based on the relative net assets of each class to the total net assets of the Fund. Each class differs with respect to transfer agent and distribution and service plan fees incurred. Certain expense reductions may also differ by class.
2. Investments in Fidelity Central Funds.
The Fund invests in Fidelity Central Funds, which are open-end investment companies available only to other investment companies and accounts managed by Fidelity Management & Research Company (FMR) and its affiliates. The Fund's Schedule of Investments lists each of the Fidelity Central Funds held as of period end, if any, as an investment of the Fund, but does not include the underlying holdings of each Fidelity Central Fund. As an Investing Fund, the Fund indirectly bears its proportionate share of the expenses of the underlying Fidelity Central Funds.
The Money Market Central Funds seek preservation of capital and current income and are managed by Fidelity Investments Money Management, Inc. (FIMM), an affiliate of FMR.
A complete unaudited list of holdings for each Fidelity Central Fund is available upon request or at the Securities and Exchange Commission (the SEC) web site at www.sec.gov. In addition, the financial statements of the Fidelity Central Funds, which are not covered by the Fund's Report of Independent Registered Public Accounting Firm, are available on the SEC web site or upon request.
3. Significant Accounting Policies.
The financial statements have been prepared in conformity with accounting principles generally accepted in the United States of America (GAAP), which require management to make certain estimates and assumptions at the date of the financial statements. Actual results could differ from those estimates. Subsequent events, if any, through the
Annual Report
3. Significant Accounting Policies - continued
date that the financial statements were issued have been evaluated in the preparation of the financial statements. The following summarizes the significant accounting policies of the Fund:
Security Valuation. Investments are valued as of 4:00 p.m. Eastern time on the last calendar day of the period. The Fund uses independent pricing services approved by the Board of Trustees to value its investments. When current market prices or quotations are not readily available or reliable, valuations may be determined in good faith in accordance with procedures adopted by the Board of Trustees. Factors used in determining value may include market or security specific events. The frequency with which these procedures are used cannot be predicted and they may be utilized to a significant extent. The value used for net asset value (NAV) calculation under these procedures may differ from published prices for the same securities.
The Fund categorizes the inputs to valuation techniques used to value its investments into a disclosure hierarchy consisting of three levels as shown below:
Level 1 - quoted prices in active markets for identical investments
Level 2 - other significant observable inputs (including quoted prices for similar investments, interest rates, prepayment speeds, etc.)
Level 3 - unobservable inputs (including the Fund's own assumptions based on the best information available)
Changes in valuation techniques may result in transfers in or out of an assigned level within the disclosure hierarchy. Valuation techniques used to value the Fund's investments by major category are as follows:
Equity securities, including restricted securities, for which market quotations are readily available, are valued at the last reported sale price or official closing price as reported by an independent pricing service on the primary market or exchange on which they are traded and are categorized as Level 1 in the hierarchy. In the event there were no sales during the day or closing prices are not available, securities are valued at the last quoted bid price or may be valued using the last available price and are generally categorized as Level 2 in the hierarchy. For foreign equity securities, when significant market or security specific events arise, comparisons to the valuation of American Depositary Receipts (ADRs), futures contracts, Exchange-traded funds (ETFs) and certain indexes as well as quoted prices for similar securities are used and are categorized as Level 2 in the hierarchy in these circumstances. Utilizing these techniques may result in transfers between Level 1 and Level 2. For restricted equity securities and private placements where observable inputs are limited, assumptions about market activity and risk are used and are categorized as Level 3 in the hierarchy.
Annual Report
Notes to Financial Statements - continued
3. Significant Accounting Policies - continued
Security Valuation - continued
Investments in open-end mutual funds, including the Fidelity Central Funds, are valued at their closing net asset value each business day and are categorized as Level 1 in the hierarchy.
Foreign Currency. The Fund may use foreign currency contracts to facilitate transactions in foreign-denominated securities. Gains and losses from these transactions may arise from changes in the value of the foreign currency or if the counterparties do not perform under the contracts' terms.
Foreign-denominated assets, including investment securities, and liabilities are translated into U.S. dollars at the exchange rate at period end. Purchases and sales of investment securities, income and dividends received and expenses denominated in foreign currencies are translated into U.S. dollars at the exchange rate in effect on the transaction date.
The effects of exchange rate fluctuations on investments are included with the net realized and unrealized gain (loss) on investment securities. Other foreign currency transactions resulting in realized and unrealized gain (loss) are disclosed separately.
Investment Transactions and Income. For financial reporting purposes, the Fund's investment holdings and NAV include trades executed through the end of the last business day of the period. The NAV per share for processing shareholder transactions is calculated as of the close of business of the New York Stock Exchange (NYSE), normally 4:00 p.m. Eastern time and includes trades executed through the end of the prior business day. Gains and losses on securities sold are determined on the basis of identified cost. Dividend income is recorded on the ex-dividend date, except for certain dividends from foreign securities where the ex-dividend date may have passed, which are recorded as soon as the Fund is informed of the ex-dividend date. Non-cash dividends included in dividend income, if any, are recorded at the fair market value of the securities received. Distributions received on securities that represent a return of capital or capital gain are recorded as a reduction of cost of investments and/or as a realized gain. The Fund estimates the components of distributions received that may be considered return of capital distributions or capital gain distributions. Large, non-recurring dividends recognized by the Fund are presented separately on the Statement of Operations as "Special Dividends" and the impact of these dividends is presented in the Financial Highlights. Interest income and distributions from the Fidelity Central Funds are accrued as earned. Interest income includes coupon interest and amortization of premium and accretion of discount on debt securities. Investment income is recorded net of foreign taxes withheld where recovery of such taxes is uncertain.
Annual Report
3. Significant Accounting Policies - continued
Expenses. Expenses directly attributable to a fund are charged to that fund. Expenses attributable to more than one fund are allocated among the respective funds on the basis of relative net assets or other appropriate methods. Expense estimates are accrued in the period to which they relate and adjustments are made when actual amounts are known.
Income Tax Information and Distributions to Shareholders. Each year, the Fund intends to qualify as a regulated investment company, including distributing substantially all of its taxable income and realized gains under Subchapter M of the Internal Revenue Code and filing its U.S. federal tax return. As a result, no provision for income taxes is required. As of July 31, 2011, the Fund did not have any unrecognized tax benefits in the financial statements. A fund's federal tax return is subject to examination by the Internal Revenue Service (IRS) for a period of three years. Foreign taxes are provided for based on the Fund's understanding of the tax rules and rates that exist in the foreign markets in which it invests.
Distributions are declared and recorded on the ex-dividend date. Income dividends and capital gain distributions are declared separately for each class. Income and capital gain distributions are determined in accordance with income tax regulations, which may differ from GAAP.
Capital accounts within the financial statements are adjusted for permanent book-tax differences. These adjustments have no impact on net assets or the results of operations. Temporary book-tax differences will reverse in a subsequent period.
Book-tax differences are primarily due to foreign currency transactions, certain foreign taxes, passive foreign investment companies (PFIC), capital loss carryforwards, losses deferred due to wash sales and excise tax regulations.
The federal tax cost of investment securities and unrealized appreciation (depreciation) as of period end were as follows:
Gross unrealized appreciation | $ 11,905,181 |
Gross unrealized depreciation | (44,000,876) |
Net unrealized appreciation (depreciation) on securities and other investments | $ (32,095,695) |
| |
Tax Cost | $ 366,702,692 |
Annual Report
Notes to Financial Statements - continued
3. Significant Accounting Policies - continued
Income Tax Information and Distributions to Shareholders - continued
The tax-based components of distributable earnings as of period end were as follows:
Undistributed ordinary income | $ 11,180,651 |
Capital loss carryforward | $ (289,916,707) |
Net unrealized appreciation (depreciation) | $ (32,107,863) |
Under the recently enacted Regulated Investment Company Modernization Act of 2010 (the Act), the Fund will be permitted to carry forward capital losses incurred in taxable years beginning after December 22, 2010 for an unlimited period. However, any losses incurred during those future taxable years will be required to be utilized prior to any losses incurred in pre-enactment taxable years, which generally expire after eight years from when they are incurred. Additionally, post-enactment capital losses that are carried forward will retain their character as either short-term or long-term capital losses rather than being considered all short-term as under previous law. The Fund's first fiscal year end subject to the Act will be July 31, 2012.
The tax character of distributions paid was as follows:
| July 31, 2011 | July 31, 2010 |
Ordinary Income | $ 25,333,526 | $ 8,253,685 |
Short-Term Trading (Redemption) Fees. Shares held by investors in the Fund less than 90 days are subject to a redemption fee equal to 1.50% of the net asset value of shares redeemed. All redemption fees, which reduce the proceeds of the shareholder redemption, are retained by the Fund and accounted for as an addition to paid in capital.
New Accounting Pronouncement. In May 2011, the Financial Accounting Standards Board issued Accounting Standard Update No. 2011-04, Fair Value Measurement (Topic 820) - Amendments to Achieve Common Fair Value Measurement and Disclosure Requirements in U.S. GAAP and IFRSs. The update changes the wording used to describe the requirements in GAAP for measuring fair value and for disclosing information about fair value measurements. The update is effective during interim and annual periods beginning after December 15, 2011. Management is currently evaluating the impact of the update's adoption on the Fund's financial statement disclosures.
Annual Report
4. Purchases and Sales of Investments.
Purchases and sales of securities, other than short-term securities, aggregated $463,373,103 and $507,984,129, respectively.
5. Fees and Other Transactions with Affiliates.
Management Fee. FMR and its affiliates provide the Fund with investment management related services for which the Fund pays a monthly management fee. The management fee is the sum of an individual fund fee rate that is based on an annual rate of .45% of the Fund's average net assets and a group fee rate that averaged .26% during the period. The group fee rate is based upon the average net assets of all the mutual funds advised by FMR. The group fee rate decreases as assets under management increase and increases as assets under management decrease. For the period, the total annual management fee rate was .71% of the Fund's average net assets.
Distribution and Service Plan Fees. In accordance with Rule 12b-1 of the 1940 Act, the Fund has adopted separate Distribution and Service Plans for each class of shares. Certain classes pay Fidelity Distributors Corporation (FDC), an affiliate of FMR, separate Distribution and Service Fees, each of which is based on an annual percentage of each class' average net assets. In addition, FDC may pay financial intermediaries for selling shares of the Fund and providing shareholder support services. For the period, the Distribution and Service Fee rates, total fees and amounts retained by FDC were as follows:
| Distribution
Fee | Service
Fee | Total Fees | Retained
by FDC |
Class A | - % | .25% | $ 19,614 | $ 99 |
Class T | .25% | .25% | 13,882 | - |
Class B | .75% | .25% | 6,471 | 4,856 |
Class C | .75% | .25% | 36,435 | 7,855 |
| | | $ 76,402 | $ 12,810 |
Sales Load. FDC may receive a front-end sales charge of up to 5.75% for selling Class A shares, and 3.50% for selling Class T shares, some of which is paid to financial intermediaries for selling shares of the Fund. Depending on the holding period, FDC may receive contingent deferred sales charges levied on Class A, Class T, Class B, and Class C redemptions. The deferred sales charges range from 5% to 1% for Class B, 1% for Class C, 1.00% for certain purchases of Class A shares and .25% for certain purchases of Class T shares.
Annual Report
Notes to Financial Statements - continued
5. Fees and Other Transactions with Affiliates - continued
Sales Load - continued
For the period, sales charge amounts retained by FDC were as follows:
| Retained
by FDC |
Class A | $ 4,021 |
Class T | 1,537 |
Class B* | 1,006 |
Class C* | 54 |
| $ 6,618 |
* When Class B and Class C shares are initially sold, FDC pays commissions from its own resources to financial intermediaries through which the sales are made.
Transfer Agent Fees. Fidelity Investments Institutional Operations Company, Inc. (FIIOC), an affiliate of FMR, is the transfer, dividend disbursing and shareholder servicing agent for each class of the Fund. FIIOC receives account fees and asset-based fees that vary according to the account size and type of account of the shareholders of the respective classes of the Fund. FIIOC pays for typesetting, printing and mailing of shareholder reports, except proxy statements. For the period, transfer agent fees for each class were as follows:
| Amount | % of
Average
Net Assets |
Class A | $ 23,733 | .30 |
Class T | 8,852 | .32 |
Class B | 1,948 | .30 |
Class C | 11,087 | .30 |
International Real Estate | 1,037,153 | .30 |
Institutional Class | 4,985 | .30 |
| $ 1,087,758 | |
Accounting and Security Lending Fees. Fidelity Service Company, Inc. (FSC), an affiliate of FMR, maintains the Fund's accounting records. The accounting fee is based on the level of average net assets for the month. Under a separate contract, FSC administers the security lending program. The security lending fee is based on the number and duration of lending transactions.
Brokerage Commissions. The Fund placed a portion of its portfolio transactions with brokerage firms which are affiliates of the investment adviser. The commissions paid to these affiliated firms were $112 for the period.
Annual Report
5. Fees and Other Transactions with Affiliates - continued
Interfund Lending Program. Pursuant to an Exemptive Order issued by the SEC, the Fund, along with other registered investment companies having management contracts with FMR, may participate in an interfund lending program. This program provides an alternative credit facility allowing the funds to borrow from, or lend money to, other participating affiliated funds. At period end, there were no interfund loans outstanding. The Fund's activity in this program during the period for which loans were outstanding was as follows:
Borrower or Lender | Average Daily
Loan Balance | Weighted Average Interest Rate | Interest Expense |
Borrower | $ 5,492,000 | .44% | $ 134 |
6. Committed Line of Credit.
The Fund participates with other funds managed by FMR or an affiliate in a $4.0 billion credit facility (the "line of credit") to be utilized for temporary or emergency purposes to fund shareholder redemptions or for other short-term liquidity purposes. The Fund has agreed to pay commitment fees on its pro-rata portion of the line of credit, which amounted to $1,218 and is reflected in Miscellaneous expenses on the Statement of Operations. During the period, there were no borrowings on this line of credit.
7. Security Lending.
The Fund lends portfolio securities through a lending agent from time to time in order to earn additional income. The lending agent may loan securities to certain qualified borrowers, including Fidelity Capital Markets (FCM), a broker-dealer affiliated with the Fund. On the settlement date of the loan, the Fund receives collateral (in the form of U.S. Treasury obligations, letters of credit and/or cash) against the loaned securities and maintains collateral in an amount not less than 100% of the market value of the loaned securities during the period of the loan. The market value of the loaned securities is determined at the close of business of the Fund and any additional required collateral is delivered to the Fund on the next business day. If the borrower defaults on its obligation to return the securities loaned because of insolvency or other reasons, a fund could experience delays and costs in recovering the securities loaned or in gaining access to the collateral. Any cash collateral received is invested in the Fidelity Securities Lending Cash Central Fund. The value of loaned securities and cash collateral at period end are disclosed on the Fund's Statement of Assets and Liabilities. Security lending income represents the income earned on investing cash collateral, less rebates paid to borrowers and lending agent fees associated with the loan, plus any premium payments received for lending certain types of securities. Security lending income is presented in the Statement of Operations as a component of income from Fidelity Central Funds. Total security lending income during the period amounted to $168,341 including. During the period, there were no securities loaned to FCM.
Annual Report
Notes to Financial Statements - continued
8. Expense Reductions.
Many of the brokers with whom FMR places trades on behalf of the Fund provided services to the Fund in addition to trade execution. These services included payments of certain expenses on behalf of the Fund totaling $215,862 for the period.
9. Distributions to Shareholders.
Distributions to shareholders of each class were as follows:
Years ended July 31, | 2011 | 2010 |
From net investment income | | |
Class A | $ 287,564 | $ 58,598 |
Class T | 96,278 | 19,755 |
Class B | 19,520 | 3,225 |
Class C | 109,655 | 14,423 |
International Real Estate | 13,319,427 | 3,124,751 |
Institutional Class | 60,300 | 15,018 |
Total | $ 13,892,744 | $ 3,235,770 |
From net realized gain | | |
Class A | $ 250,090 | $ 101,910 |
Class T | 89,657 | 37,040 |
Class B | 21,506 | 9,214 |
Class C | 114,914 | 39,337 |
International Real Estate | 10,916,536 | 4,807,309 |
Institutional Class | 48,079 | 23,105 |
Total | $ 11,440,782 | $ 5,017,915 |
10. Share Transactions.
Transactions for each class of shares were as follows:
| Shares | Dollars |
Years ended July 31, | 2011 | 2010 | 2011 | 2010 |
Class A | | | | |
Shares sold | 213,763 | 365,681 | $ 1,964,473 | $ 3,120,303 |
Reinvestment of distributions | 50,966 | 15,947 | 451,020 | 134,591 |
Shares redeemed | (357,321) | (343,205) | (3,278,956) | (2,901,988) |
Net increase (decrease) | (92,592) | 38,423 | $ (863,463) | $ 352,906 |
Annual Report
10. Share Transactions - continued
| Shares | Dollars |
Years ended July 31, | 2011 | 2010 | 2011 | 2010 |
Class T | | | | |
Shares sold | 73,470 | 132,643 | $ 668,265 | $ 1,140,128 |
Reinvestment of distributions | 20,063 | 6,259 | 176,852 | 52,641 |
Shares redeemed | (119,466) | (93,841) | (1,082,947) | (767,585) |
Net increase (decrease) | (25,933) | 45,061 | $ (237,830) | $ 425,184 |
Class B | | | | |
Shares sold | 4,563 | 20,099 | $ 41,321 | $ 169,130 |
Reinvestment of distributions | 4,289 | 1,355 | 37,454 | 11,297 |
Shares redeemed | (21,555) | (20,259) | (195,000) | (169,049) |
Net increase (decrease) | (12,703) | 1,195 | $ (116,225) | $ 11,378 |
Class C | | | | |
Shares sold | 111,487 | 164,953 | $ 1,002,010 | $ 1,381,947 |
Reinvestment of distributions | 21,061 | 5,842 | 183,176 | 48,663 |
Shares redeemed | (162,778) | (92,347) | (1,467,063) | (761,918) |
Net increase (decrease) | (30,230) | 78,448 | $ (281,877) | $ 668,692 |
International Real Estate | | | | |
Shares sold | 7,219,780 | 9,224,310 | $ 67,747,351 | $ 79,406,931 |
Reinvestment of distributions | 2,559,870 | 875,447 | 22,802,021 | 7,441,303 |
Shares redeemed | (12,440,980) | (13,336,716) | (115,315,484) | (114,385,841) |
Net increase (decrease) | (2,661,330) | (3,236,959) | $ (24,766,112) | $ (27,537,607) |
Institutional Class | | | | |
Shares sold | 99,324 | 40,774 | $ 925,861 | $ 351,025 |
Reinvestment of distributions | 10,892 | 4,247 | 96,908 | 36,016 |
Shares redeemed | (85,350) | (70,819) | (787,527) | (608,371) |
Net increase (decrease) | 24,866 | (25,798) | $ 235,242 | $ (221,330) |
11. Other.
The Fund's organizational documents provide former and current trustees and officers with a limited indemnification against liabilities arising in connection with the performance of their duties to the Fund. In the normal course of business, the Fund may also enter into contracts that provide general indemnifications. The Fund's maximum exposure under these arrangements is unknown as this would be dependent on future claims that may be made against the Fund. The risk of material loss from such claims is considered remote.
At the end of the period, FMR or its affiliates were the owners of record of approximately 12% of the outstanding shares of the Fund.
Annual Report
To the Trustees of Fidelity Securities Fund and the Shareholders of Fidelity International Real Estate Fund:
In our opinion, the accompanying statement of assets and liabilities, including the schedule of investments, and the related statements of operations and of changes in net assets and the financial highlights present fairly, in all material respects, the financial position of Fidelity International Real Estate Fund (a fund of Fidelity Securities Fund) at July 31, 2011, the results of its operations for the year then ended, the changes in its net assets for each of the two years in the period then ended and the financial highlights for each of the periods indicated, in conformity with accounting principles generally accepted in the United States of America. These financial statements and financial highlights (hereafter referred to as "financial statements") are the responsibility of the Fidelity International Real Estate Fund's management. Our responsibility is to express an opinion on these financial statements based on our audits. We conducted our audits of these financial statements in accordance with the standards of the Public Company Accounting Oversight Board (United States). Those standards require that we plan and perform the audit to obtain reasonable assurance about whether the financial statements are free of material misstatement. An audit includes examining, on a test basis, evidence supporting the amounts and disclosures in the financial statements, assessing the accounting principles used and significant estimates made by management, and evaluating the overall financial statement presentation. We believe that our audits, which included confirmation of securities at July 31, 2011 by correspondence with the custodian and brokers, provide a reasonable basis for our opinion.
/s/ PricewaterhouseCoopers LLP
PricewaterhouseCoopers LLP
Boston, Massachusetts
September 13, 2011
Annual Report
The Trustees, Members of the Advisory Board, and executive officers of the trust and fund, as applicable, are listed below. The Board of Trustees governs the fund and is responsible for protecting the interests of shareholders. The Trustees are experienced executives who meet periodically throughout the year to oversee the fund's activities, review contractual arrangements with companies that provide services to the fund, oversee management of the risks associated with such activities and contractual arrangements, and review the fund's performance. Except for James C. Curvey, each of the Trustees oversees 221 funds advised by FMR or an affiliate. Mr. Curvey oversees 419 funds advised by FMR or an affiliate.
The Trustees hold office without limit in time except that (a) any Trustee may resign; (b) any Trustee may be removed by written instrument, signed by at least two-thirds of the number of Trustees prior to such removal; (c) any Trustee who requests to be retired or who has become incapacitated by illness or injury may be retired by written instrument signed by a majority of the other Trustees; and (d) any Trustee may be removed at any special meeting of shareholders by a two-thirds vote of the outstanding voting securities of the trust. Each Trustee who is not an interested person (as defined in the 1940 Act) (Independent Trustee), shall retire not later than the last day of the calendar year in which his or her 75th birthday occurs. The Independent Trustees may waive this mandatory retirement age policy with respect to individual Trustees. The executive officers and Advisory Board Members hold office without limit in time, except that any officer and Advisory Board Member may resign or may be removed by a vote of a majority of the Trustees at any regular meeting or any special meeting of the Trustees. Except as indicated, each individual has held the office shown or other offices in the same company for the past five years.
Experience, Skills, Attributes, and Qualifications of the Fund's Trustees. The Governance and Nominating Committee has adopted a statement of policy that describes the experience, qualifications, attributes, and skills that are necessary and desirable for potential Independent Trustee candidates (Statement of Policy). The Board believes that each Trustee satisfied at the time he or she was initially elected or appointed a Trustee, and continues to satisfy, the standards contemplated by the Statement of Policy. The Governance and Nominating Committee also engages professional search firms to help identify potential Independent Trustee candidates who have the experience, qualifications, attributes, and skills consistent with the Statement of Policy. From time to time, additional criteria based on the composition and skills of the current Independent Trustees, as well as experience or skills that may be appropriate in light of future changes to board composition, business conditions, and regulatory or other developments, have also been considered by the professional search firms and the Governance and Nominating Committee. In addition, the Board takes into account the Trustees' commitment and participation in Board and committee meetings, as well as their leadership of standing and ad hoc committees throughout their tenure.
In determining that a particular Trustee was and continues to be qualified to serve as a Trustee, the Board has considered a variety of criteria, none of which, in isolation, was controlling. The Board believes that, collectively, the Trustees have balanced and diverse experience, qualifications, attributes, and skills, which allow the Board to operate effectively in governing the fund and protecting the interests of shareholders. Information about the specific experience, skills, attributes, and qualifications of each Trustee, which in each case led to the Board's conclusion that the Trustee should serve (or continue to serve) as a trustee of the fund, is provided below.
Annual Report
Board Structure and Oversight Function. James C. Curvey is an interested person (as defined in the 1940 Act) and currently serves as Acting Chairman. The Trustees have determined that an interested Chairman is appropriate and benefits shareholders because an interested Chairman has a personal and professional stake in the quality and continuity of services provided to the fund. Independent Trustees exercise their informed business judgment to appoint an individual of their choosing to serve as Chairman, regardless of whether the Trustee happens to be independent or a member of management. The Independent Trustees have determined that they can act independently and effectively without having an Independent Trustee serve as Chairman and that a key structural component for assuring that they are in a position to do so is for the Independent Trustees to constitute a substantial majority for the Board. The Independent Trustees also regularly meet in executive session. Ned C. Lautenbach serves as Chairman of the Independent Trustees and as such (i) acts as a liaison between the Independent Trustees and management with respect to matters important to the Independent Trustees and (ii) with management prepares agendas for Board meetings.
Fidelity funds are overseen by different Boards of Trustees. The fund's Board oversees Fidelity's equity and high income funds and another Board oversees Fidelity's investment-grade bond, money market, and asset allocation funds. The asset allocation funds may invest in Fidelity funds overseen by the fund's Board. The use of separate Boards, each with its own committee structure, allows the Trustees of each group of Fidelity funds to focus on the unique issues of the funds they oversee, including common research, investment, and operational issues. On occasion, the separate Boards establish joint committees to address issues of overlapping consequences for the Fidelity funds overseen by each Board.
The Trustees operate using a system of committees to facilitate the timely and efficient consideration of all matters of importance to the Trustees, the fund, and fund shareholders and to facilitate compliance with legal and regulatory requirements and oversight of the fund's activities and associated risks. The Board, acting through its committees, has charged FMR and its affiliates with (i) identifying events or circumstances the occurrence of which could have demonstrably adverse effects on the fund's business and/or reputation; (ii) implementing processes and controls to lessen the possibility that such events or circumstances occur or to mitigate the effects of such events or circumstances if they do occur; and (iii) creating and maintaining a system designed to evaluate continuously business and market conditions in order to facilitate the identification and implementation processes described in (i) and (ii) above. Because the day-to-day operations and activities of the fund are carried out by or through FMR, its affiliates and other service providers, the fund's exposure to risks is mitigated but not eliminated by the processes overseen by the Trustees. While each of the Board's committees has responsibility for overseeing different aspects of the fund's activities, oversight is exercised primarily through the Operations, Audit, and Compliance Committees. Appropriate personnel, including but not limited to the fund's Chief Compliance Officer (CCO), FMR's internal auditor, the independent accountants, the fund's Treasurer and portfolio management personnel, make periodic reports to the Board's committees, as appropriate. The responsibilities of each committee, including their oversight responsibilities, are described further under "Standing Committees of the Fund's Trustees."
Annual Report
Trustees and Officers - continued
The fund's Statement of Additional Information (SAI) includes more information about the Trustees. To request a free copy, call Fidelity at 1-877-208-0098.
Interested Trustees*:
Correspondence intended for each Trustee who is an interested person may be sent to Fidelity Investments, 82 Devonshire Street, Boston, Massachusetts 02109.
Name, Age; Principal Occupations and Other Relevant Experience+ |
James C. Curvey (76) |
| Year of Election or Appointment: 2007 Mr. Curvey is Trustee and Acting Chairman of the Board of Trustees of certain Trusts. Mr. Curvey also serves as Trustee (2007-present) of other investment companies advised by FMR. Mr. Curvey is a Director of Fidelity Investments Money Management, Inc. (2009-present), Director of Fidelity Research & Analysis Co. (2009-present) and Director of FMR and FMR Co., Inc. (2007-present). Mr. Curvey is also Vice Chairman (2007-present) and Director of FMR LLC. In addition, Mr. Curvey serves as an Overseer for the Boston Symphony Orchestra and a member of the Trustees of Villanova University. Previously, Mr. Curvey was the Vice Chairman (2006-2007) and Director (2000-2007) of FMR Corp. |
Ronald P. O'Hanley (54) |
| Year of Election or Appointment: 2011 Mr. O'Hanley is Director of FMR Co., Inc. (2010-present), Director of Fidelity Investments Money Management, Inc. (2010-present), Director of Fidelity Research & Analysis Company (2010-present), President of Fidelity Asset Management and Corporate Services and a member of Fidelity's Executive Committee (2010-present). Previously, Mr. O'Hanley served as President and Chief Executive Officer of BNY Mellon Asset Management (2007-2010). Mr. O'Hanley also served as Vice Chairman of Bank New York Mellon Corp. and a member of that firm's Executive Committee. Prior to the 2007 merger of The Bank of New York and Mellon Financial Corporation, he was Vice Chairman of Mellon Financial Corporation and President and Chief Executive Officer of Mellon Asset Management. He joined Mellon in February 1997. Mr. O'Hanley currently serves as Chairman of the Boston Public Library Foundation Board of Directors and sits on the Board of Directors of Beth Israel Deaconess Medical Center, the Board of Trustees of the Marine Biological Laboratory and the Advisory Board of the Maxwell School of Citizenship and Public Administration at Syracuse University. Mr. O'Hanley also chairs the Council on Asset Management for the Financial Services Roundtable and is a member of the Board of Directors of Institutional Investor's U.S. Institute. |
* Trustees have been determined to be "Interested Trustees" by virtue of, among other things, their affiliation with the trust or various entities under common control with FMR.
+ The information above includes each Trustee's principal occupation during the last five years and other information relating to the experience, attributes, and skills relevant to each Trustee's qualifications to serve as a Trustee, which led to the conclusion that each Trustee should serve as a Trustee for the fund.
Annual Report
Trustees and Officers - continued
Independent Trustees:
Correspondence intended for each Independent Trustee (that is, the Trustees other than the Interested Trustees) may be sent to Fidelity Investments, P.O. Box 55235, Boston, Massachusetts 02205-5235.
Name, Age; Principal Occupations and Other Relevant Experience+ |
Dennis J. Dirks (63) |
| Year of Election or Appointment: 2005 Prior to his retirement in May 2003, Mr. Dirks was Chief Operating Officer and a member of the Board of The Depository Trust & Clearing Corporation (DTCC). He also served as President, Chief Operating Officer, and Board member of The Depository Trust Company (DTC) and President and Board member of the National Securities Clearing Corporation (NSCC). In addition, Mr. Dirks served as Chief Executive Officer and Board member of the Government Securities Clearing Corporation, Chief Executive Officer and Board member of the Mortgage-Backed Securities Clearing Corporation, as a Trustee and a member of the Finance Committee of Manhattan College (2005-2008), and as a Trustee and a member of the Finance Committee of AHRC of Nassau County (2006-2008). Mr. Dirks is a member of the Independent Directors Council (IDC) Governing Council (2010-Present) and Board of Directors for The Brookville Center for Children's Services, Inc. (2009-present). |
Alan J. Lacy (57) |
| Year of Election or Appointment: 2008 Mr. Lacy serves as Senior Adviser (2007-present) of Oak Hill Capital Partners, L.P. (private equity). Mr. Lacy also served as Chief Executive Officer (2000-2005) and Vice Chairman (2005-2006) of Sears Holdings Corporation and Sears, Roebuck and Co. (retail). In addition, Mr. Lacy serves as a member of the Board of Directors of Dave & Buster's, Inc. (restaurant and entertainment complexes, 2010-present), The Hillman Companies, Inc. (hardware wholesalers, 2010-present), and Bristol-Myers Squibb Company (global pharmaceuticals, 2007-present). Mr. Lacy is a member of the Board of Trustees of The National Parks Conservation Association (2006-Present). Previously, Mr. Lacy served as Chairman of the Board of Trustees of the National Parks Conservation Association (2008-2011) and as a member of the Board of Directors for the Western Union Company (global money transfer, 2006-2011). |
Ned C. Lautenbach (67) |
| Year of Election or Appointment: 2000 Mr. Lautenbach is Chairman of the Independent Trustees of the Equity and High Income Funds (2006-present). Mr. Lautenbach currently serves as the Lead Director of the Eaton Corporation Board of Directors (diversified industrial, 1997-present). Mr. Lautenbach is also a member of the Board of Directors of the Philharmonic Center for the Arts in Naples, Florida (1999-present); a member of the Board of Trustees of Fairfield University (2005-present); and a member of the Council on Foreign Relations (1994-present). Previously, Mr. Lautenbach was a Partner/Advisory Partner at Clayton, Dubilier & Rice, LLC (private equity investment, 1998-2010), as well as a Director of Sony Corporation (2006-2007). |
Joseph Mauriello (66) |
| Year of Election or Appointment: 2008 Prior to his retirement in January 2006, Mr. Mauriello served in numerous senior management positions including Deputy Chairman and Chief Operating Officer (2004-2005), and Vice Chairman of Financial Services (2002-2004) of KPMG LLP US (professional services, 1965-2005). Mr. Mauriello currently serves as a member of the Board of Directors of XL Group plc. (global insurance and re-insurance, 2006-present) and of Arcadia Resources Inc. (health care services and products, 2007-present). Previously, Mr. Mauriello served as a Director of the Hamilton Funds of the Bank of New York (2006-2007). |
Robert W. Selander (60) |
| Year of Election or Appointment: 2011 Previously, Mr. Selander served as a Member of the Advisory Board of Fidelity's Equity and High Income Funds (2011), Executive Vice Chairman (2010), Chief Executive Officer (2009-2010), and President and Chief Executive Officer (1997-2009) of Mastercard, Inc. |
Cornelia M. Small (67) |
| Year of Election or Appointment: 2005 Ms. Small is a member of the Board of Directors of the Teagle Foundation (2009-present). Ms. Small is also a member of the Investment Committee, and Chair (2008-present) and a member of the Board of Trustees of Smith College. In addition, Ms. Small serves on the Investment Committee of the Berkshire Taconic Community Foundation (2008-present). Previously, Ms. Small served as Chairperson of the Investment Committee (2002-2008) of Smith College. In addition, Ms. Small served as Chief Investment Officer, Director of Global Equity Investments, and a member of the Board of Directors of Scudder, Stevens & Clark and Scudder Kemper Investments. |
William S. Stavropoulos (72) |
| Year of Election or Appointment: 2002 Mr. Stavropoulos is Vice Chairman of the Independent Trustees of the Equity and High Income Funds (2006-present). Mr. Stavropoulos serves as President and Founder of the Michigan Baseball Foundation, the Great Lakes Loons (2007-present). Mr. Stavropoulos is Chairman Emeritus of the Board of Directors of The Dow Chemical Company, where he previously served in numerous senior management positions, including President, CEO (1995-2000; 2002-2004), Chairman of the Executive Committee (2000-2006), and as a member of the Board of Directors (1990-2006). Currently, Mr. Stavropoulos is Chairman of Univar (global distributor of commodity and specialty chemicals, 2010-present), a Director of Teradata Corporation (data warehousing and technology solutions, 2008-present), Chemical Financial Corporation, Maersk Inc. (industrial conglomerate), Tyco International, Inc. (multinational manufacturing and services, 2007-present), and a member of the Advisory Board for Metalmark Capital (private equity investment, 2005-present). Mr. Stavropoulos is a special advisor to Clayton, Dubilier & Rice, LLC (private equity investment). In addition, Mr. Stavropoulos is a member of the University of Notre Dame Advisory Council for the College of Science. |
David M. Thomas (62) |
| Year of Election or Appointment: 2008 Previously, Mr. Thomas served as Executive Chairman (2005-2006) and Chairman and Chief Executive Officer (2000-2005) of IMS Health, Inc. (pharmaceutical and healthcare information solutions). In addition, Mr. Thomas serves as a member of the Board of Directors of Fortune Brands, Inc. (consumer products), and Interpublic Group of Companies, Inc. (marketing communication, 2004-present). |
Michael E. Wiley (60) |
| Year of Election or Appointment: 2008 Mr. Wiley also serves as a Director of Asia Pacific Exploration Consolidated (international oil and gas exploration and production, 2008-present). Mr. Wiley serves as a Director of Tesoro Corporation (independent oil refiner and marketer, 2005-present), and a Director of Bill Barrett Corporation (exploration and production, 2005-present). In addition, Mr. Wiley also serves as a Director of Post Oak Bank (privately-held bank, 2004-present). Previously, Mr. Wiley served as a member of the Board of Trustees of the University of Tulsa (2000-2006; 2007-2010), as a Senior Energy Advisor of Katzenbach Partners, LLC (consulting, 2006-2007), as an Advisory Director of Riverstone Holdings (private investment), Chairman, President, and CEO of Baker Hughes, Inc. (oilfield services, 2000-2004), and as Director of Spinnaker Exploration Company (exploration and production, 2001-2005). |
Annual Report
+ The information above includes each Trustee's principal occupation during the last five years and other information relating to the experience, attributes, and skills relevant to each Trustee's qualifications to serve as a Trustee, which led to the conclusion that each Trustee should serve as a Trustee for the fund.
Advisory Board Members and Executive Officers:
Correspondence intended for each executive officer, Peter S. Lynch, and Edward C. Johnson 3d may be sent to Fidelity Investments, 82 Devonshire Street, Boston, Massachusetts 02109.
Name, Age; Principal Occupation |
Edward C. Johnson 3d (81) |
| Year of Election or Appointment: 2011 Member of the Advisory Board of Fidelity's Equity and High Income Funds. Mr. Johnson serves as Chief Executive Officer, Chairman, and a Director of FMR LLC, and also serves as Chairman and Director of FIL Limited. Previously, Mr. Johnson served as a Trustee and Chairman of the Board of certain Fidelity Trusts, Chairman and a Director of FMR, Chairman and a Director of FMR Co., Inc., and President of FMR LLC (2006-2007). |
Peter S. Lynch (67) |
| Year of Election or Appointment: 2003 Member of the Advisory Board of Fidelity's Equity and High Income Funds. Mr. Lynch is Vice Chairman and a Director of FMR and FMR Co., Inc. In addition, Mr. Lynch serves as a Trustee of Boston College and as the Chairman of the Inner-City Scholarship Fund. Previously, Mr. Lynch served on the Special Olympics International Board of Directors (1997-2006). |
Kenneth B. Robins (41) |
| Year of Election or Appointment: 2008 President and Treasurer of Fidelity's Equity and High Income Funds. Mr. Robins also serves as President and Treasurer (2010-present) and Assistant Treasurer (2009-present) of other Fidelity funds and is an employee of Fidelity Investments (2004-present). Previously, Mr. Robins served as Deputy Treasurer of the Fidelity funds (2005-2008) and Treasurer and Chief Financial Officer of The North Carolina Capital Management Trust: Cash and Term Portfolios (2006-2008). |
Brian B. Hogan (46) |
| Year of Election or Appointment: 2009 Vice President of Equity and High Income Funds. Mr. Hogan also serves as President of FMR's Equity Division (2009-present). Previously, Mr. Hogan served as Senior Vice President, Equity Research of FMR (2006-2009) and as a portfolio manager. |
Christopher S. Bartel (39) |
| Year of Election or Appointment: 2009 Vice President of Fidelity's Sector and Real Estate Equity Funds. Mr. Bartel also serves as Senior Vice President of Equity Research (2009-present). Previously, Mr. Bartel served as Managing Director of Research (2006-2009) and an analyst and portfolio manager (2000-2006). |
Scott C. Goebel (43) |
| Year of Election or Appointment: 2008 Secretary and Chief Legal Officer (CLO) of the Fidelity funds. Mr. Goebel also serves as Secretary of Fidelity Investments Money Management, Inc. (FIMM) (2010-present) and Fidelity Research and Analysis Company (FRAC) (2010-present); Secretary and CLO of The North Carolina Capital Management Trust: Cash and Term Portfolios (2008-present); General Counsel, Secretary, and Senior Vice President of FMR (2008-present) and FMR Co., Inc. (2008-present); employed by FMR LLC or an affiliate (2001-present); Chief Legal Officer of Fidelity Management & Research (Hong Kong) Limited (2008-present) and Assistant Secretary of Fidelity Management & Research (Japan) Inc. (2008-present), and Fidelity Management & Research (U.K.) Inc. (2008-present). Previously, Mr. Goebel served as Assistant Secretary of FIMM (2008-2010), FRAC (2008-2010), and the Funds (2007-2008) and as Vice President and Secretary of Fidelity Distributors Corporation (FDC) (2005-2007). |
William C. Coffey (42) |
| Year of Election or Appointment: 2009 Assistant Secretary of Fidelity's Equity and High Income Funds. Mr. Coffey also serves as Senior Vice President and Deputy General Counsel of FMR LLC (2010-present), and is an employee of Fidelity Investments. Previously, Mr. Coffey served as Vice President and Associate General Counsel of FMR LLC (2005-2009). |
Holly C. Laurent (57) |
| Year of Election or Appointment: 2008 Anti-Money Laundering (AML) Officer of the Fidelity funds. Ms. Laurent also serves as AML Officer of The North Carolina Capital Management Trust: Cash and Term Portfolios (2008-present) and is an employee of Fidelity Investments. Previously, Ms. Laurent was Senior Vice President and Head of Legal for Fidelity Business Services India Pvt. Ltd. (2006-2008), and Senior Vice President, Deputy General Counsel and Group Head for FMR LLC (2005-2006). |
Christine Reynolds (52) |
| Year of Election or Appointment: 2008 Chief Financial Officer of the Fidelity funds. Ms. Reynolds became President of Fidelity Pricing and Cash Management Services (FPCMS) in August 2008. Ms. Reynolds served as Chief Operating Officer of FPCMS (2007-2008). Previously, Ms. Reynolds served as President, Treasurer, and Anti-Money Laundering officer of the Fidelity funds (2004-2007). |
Kenneth A. Rathgeber (64) |
| Year of Election or Appointment: 2004 Chief Compliance Officer of Fidelity's Equity and High Income Funds. Mr. Rathgeber is Chief Compliance Officer of Fidelity Management & Research (Hong Kong) Limited (2008-present), Fidelity Management & Research (Japan) Inc. (2008-present), FMR (2005-present), FMR Co., Inc. (2005-present), Fidelity Management & Research (U.K.) Inc. (2005-present), Fidelity Research & Analysis Company (2005-present), Fidelity Investments Money Management, Inc. (2005-present), Pyramis Global Advisors, LLC (2005-present), and Strategic Advisers, Inc. (2005-present). |
Jeffrey S. Christian (49) |
| Year of Election or Appointment: 2009 Deputy Treasurer of the Fidelity funds. Mr. Christian is an employee of Fidelity Investments. Previously, Mr. Christian served as Chief Financial Officer (2008-2009) of certain Fidelity funds and Senior Vice President of Fidelity Pricing and Cash Management Services (FPCMS) (2004-2009). |
Bryan A. Mehrmann (50) |
| Year of Election or Appointment: 2005 Deputy Treasurer of the Fidelity funds. Mr. Mehrmann is an employee of Fidelity Investments. |
Adrien E. Deberghes (43) |
| Year of Election or Appointment: 2008 Deputy Treasurer of Fidelity's Equity and High Income Funds. Mr. Deberghes also serves as Assistant Treasurer of other Fidelity funds (2010-present) and is an employee of Fidelity Investments (2008-present). Previously, Mr. Deberghes served as Senior Vice President of Mutual Fund Administration at State Street Corporation (2007-2008), Senior Director of Mutual Fund Administration at Investors Bank & Trust (2005-2007), and Director of Finance for Dunkin' Brands (2000-2005). |
Stephanie J. Dorsey (42) |
| Year of Election or Appointment: 2010 Assistant Treasurer of Fidelity's Equity and High Income Funds. Ms. Dorsey also serves as Deputy Treasurer of other Fidelity funds (2008-present) and is an employee of Fidelity Investments (2008-present). Previously, Ms. Dorsey served as Treasurer (2004-2008) of the JPMorgan Mutual Funds and Vice President (2004-2008) of JPMorgan Chase Bank. |
John R. Hebble (53) |
| Year of Election or Appointment: 2009 Assistant Treasurer of Fidelity's Equity and High Income Funds. Mr. Hebble also serves as President (2011-present), Treasurer and Chief Financial Officer of The North Carolina Capital Management Trust: Cash and Term Portfolios (2008-present), President and Treasurer of other Fidelity funds (2008-present) and is an employee of Fidelity Investments. |
Gary W. Ryan (52) |
| Year of Election or Appointment: 2005 Assistant Treasurer of the Fidelity funds. Mr. Ryan is an employee of Fidelity Investments. Previously, Mr. Ryan served as Vice President of Fund Reporting in Fidelity Pricing and Cash Management Services (FPCMS) (1999-2005). |
Jonathan Davis (43) |
| Year of Election or Appointment: 2010 Assistant Treasurer of the Fidelity funds. Mr. Davis is an employee of Fidelity Investments. Previously, Mr. Davis served as Vice President and Associate General Counsel of FMR LLC (2003-2010). |
Annual Report
The Board of Trustees of Fidelity Advisor International Real Estate Fund voted to pay to shareholders of record at the opening of business on record date, the following distributions per share derived from capital gains realized from sales of portfolio securities, and dividends derived from net investment income:
| Pay Date | Record Date | Dividends | Capital Gains |
Class A | 09/12/11 | 09/09/11 | $.123 | $.178 |
Class T | 09/12/11 | 09/09/11 | $.107 | $.178 |
Class B | 09/12/11 | 09/09/11 | $.074 | $.178 |
Class C | 09/12/11 | 09/09/11 | $.077 | $.178 |
Class A designates 23%, 23% and 22%; Class T designates 24%, 24% and 22%; Class B designates 26%, 26% and 22%; and Class C designates 26%, 26% and 22%; of the dividends distributed on September 8, 2010; December 17, 2010 and December 30, 2010; respectively during the fiscal year as amounts which may be taken into account as a dividend for purposes of the maximum rate under section 1(h)(11) of the Internal Revenue Code.
The amounts per share which represent income derived from sources within, and taxes paid to, foreign countries or possessions of the United States are as follows:
| Pay Date | Income | Taxes |
Class A | 09/09/10 | $.170 | $.0072 |
| 12/20/10 | $.085 | $.0095 |
| 12/31/10 | $.042 | $.0000 |
| Pay Date | Income | Taxes |
Class T | 09/09/10 | $.161 | $.0072 |
| 12/20/10 | $.082 | $.0095 |
| 12/31/10 | $.042 | $.0000 |
| Pay Date | Income | Taxes |
Class B | 09/09/10 | $.147 | $.0072 |
| 12/20/10 | $.076 | $.0095 |
| 12/31/10 | $.042 | $.0000 |
| Pay Date | Income | Taxes |
Class C | 09/09/10 | $.153 | $.0072 |
| 12/20/10 | $.076 | $.0095 |
| 12/31/10 | $.042 | $.0000 |
The fund will notify shareholders in January 2012 of amounts for use in preparing 2011 income tax returns.
Annual Report
Board Approval of Investment Advisory Contracts and Management Fees
Fidelity International Real Estate Fund
Each year, the Board of Trustees, including the Independent Trustees (together, the Board), votes on the renewal of the management contract and sub-advisory agreements (together, the Advisory Contracts) for the fund. The Board, assisted by the advice of fund counsel and Independent Trustees' counsel, requests and considers a broad range of information relevant to the renewal of the Advisory Contracts throughout the year.
The Board meets regularly and considers at each of its meetings factors that are relevant to its annual consideration of the renewal of the fund's Advisory Contracts, including the services and support provided to the fund and its shareholders. The Board has established various standing committees, each composed of Independent Trustees with varying backgrounds, to which the Board has assigned specific subject matter responsibilities in order to enhance effective decision-making by the Board. The Board, acting directly and through its Committees, requests and receives information concerning the annual consideration of the renewal of the fund's Advisory Contracts. The Board also meets as needed to consider matters specifically related to the Board's annual consideration of the renewal of Advisory Contracts. Members of the Board may also meet with trustees of other Fidelity funds through ad hoc joint committees to discuss certain matters relevant to the Fidelity funds.
At its July 2011 meeting, the Board of Trustees, including the Independent Trustees, unanimously determined to renew the fund's Advisory Contracts. In reaching its determination, the Board considered all factors it believed relevant, including (i) the nature, extent, and quality of the services to be provided to the fund and its shareholders (including the investment performance of the fund); (ii) the competitiveness of the fund's management fee and total expense ratio; (iii) the total costs of the services to be provided by and the profits to be realized by Fidelity from its relationship with the fund; (iv) the extent to which economies of scale would be realized as the fund grows; and (v) whether fee levels reflect these economies of scale, if any, for the benefit of fund shareholders.
In considering whether to renew the Advisory Contracts for the fund, the Board reached a determination, with the assistance of fund counsel and Independent Trustees' counsel and through the exercise of its business judgment, that the renewal of the Advisory Contracts is in the best interests of the fund and its shareholders and that the compensation payable under the Advisory Contracts is fair and reasonable. The Board's decision to renew the Advisory Contracts was not based on any single factor, but rather was based on a comprehensive consideration of all the information provided to the Board at its meetings throughout the year. The Board, in reaching its determination to renew the Advisory Contracts, is aware that shareholders in the fund have a broad range of investment choices available to them, including a wide choice among mutual funds offered by Fidelity's competitors, and that the fund's shareholders, who have the opportunity to review and weigh the disclosure provided by the fund in its prospectus and other public disclosures, have chosen to invest in this fund, managed by Fidelity.
Annual Report
Board Approval of Investment Advisory Contracts and
Management Fees - continued
Nature, Extent, and Quality of Services Provided. The Board considered the staffing within the investment adviser, FMR, and the sub-advisers (together, the Investment Advisers), including the backgrounds of the fund's investment personnel and the fund's investment objective and discipline. The Independent Trustees also had discussions with senior management of Fidelity's investment operations and investment groups. The Board considered the structure of the portfolio manager compensation program and whether this structure provides appropriate incentives to act in the best interests of the fund.
Resources Dedicated to Investment Management and Support Services. The Board and the Fund Oversight and Research Committees reviewed the general qualifications and capabilities of the Investment Advisers' investment staff, including its size, education, experience, and resources, as well as the Investment Advisers' approach to recruiting, training, managing, and compensating investment personnel. The Board also noted that FMR has devoted increased resources to non-U.S. offices. The Board noted that Fidelity's analysts have extensive resources, tools and capabilities which allow them to conduct sophisticated quantitative and fundamental analysis, as well as credit analysis of issuers, counterparties and enhancers. The Board also believes that Fidelity's investment professionals have sufficient access to global information and data so as to provide competitive investment results over time, and that those professionals also have access to sophisticated tools which permit them to assess portfolio construction and risk and performance attribution characteristics continuously, as well as to transmit new information and research conclusions rapidly around the world. Additionally, in their deliberations, the Board considered the Investment Advisers' trading capabilities and resources which are an integral part of the investment management process.
Shareholder and Administrative Services. The Board considered (i) the nature, extent, quality, and cost of advisory, administrative, and shareholder services performed by the Investment Advisers and their affiliates under the Advisory Contracts and under separate agreements covering transfer agency, pricing and bookkeeping, and securities lending services for the fund; (ii) the nature and extent of the investment adviser's supervision of third party service providers, principally custodians and subcustodians; and (iii) the resources devoted to, and the record of compliance with, the fund's compliance policies and procedures. The Board also reviewed the allocation of fund brokerage, including allocations to brokers affiliated with the Investment Advisers, the use of brokerage commissions to pay fund expenses, and the use of "soft" commission dollars to pay for research services.
The Board noted that the growth of fund assets over time across the complex allows Fidelity to reinvest in the development of services designed to enhance the value or convenience of the Fidelity funds as investment vehicles. These services include 24-hour access to account information and market information through telephone representatives and over the Internet, investor education materials and asset allocation tools, and the expanded availability of Fidelity Investor Centers, with 35 new branches opening since 2010.
Annual Report
Investment in a Large Fund Family. The Board considered the benefits to shareholders of investing in a Fidelity fund, including the benefits of investing in a fund that is part of a large family of funds offering a variety of investment disciplines and providing a large variety of mutual fund investor services. The Board noted that Fidelity had taken, or had made recommendations that resulted in the Fidelity funds taking, a number of actions over the previous year that benefited particular funds, including (i) continuing to dedicate additional resources to investment research and support of the senior management team that oversees asset management; (ii) rationalizing product lines through the mergers of six funds into other funds; (iii) continuing to migrate the Freedom Funds to dedicated lower cost underlying funds; (iv) obtaining shareholder approval to broaden the investment strategies for Fidelity Consumer Finance Portfolio, Fidelity Emerging Asia Fund, and Fidelity Environment and Alternative Energy Portfolio; (v) contractually agreeing to reduce the management fees and impose other expense limitations on Spartan® 500 Index Fund and U.S. Bond Index Fund in connection with launching new institutional classes of these funds; (vi) changing the name, primary and supplemental benchmarks, and investment policies of Fidelity Global Strategies Fund to support the fund's flexible investment mandate and global orientation; and (vii) reducing the transfer agency account fee rates on certain accounts.
Investment Performance. The Board considered whether the fund has operated in accordance with its investment objective, as well as its record of compliance with its investment restrictions. It also reviewed the fund's absolute investment performance for each class, as well as the fund's relative investment performance for each class measured over multiple periods against a broad-based securities market index. The Board noted that FMR does not believe that a meaningful peer group exists against which to compare the fund's performance. The following charts considered by the Board show, over the one-, three-, and five-year periods ended December 31, 2010, as available, the cumulative total returns of the retail class and Class C of the fund and the cumulative total returns of a broad-based securities market index ("benchmark"). The returns of the retail class and Class C show the performance of the highest and lowest performing classes, respectively (based on three-year performance).
Annual Report
Board Approval of Investment Advisory Contracts and
Management Fees - continued
Fidelity International Real Estate Fund

The Board noted that the investment performance of the fund was lower than its benchmark for all the periods shown. The Board considered that the variations in performance among the fund's classes reflect the variations in class expenses, which result in lower performance for higher expense classes. The Board discussed with FMR actions that have been taken by FMR to improve the fund's below-benchmark performance. The Board noted that this fund had underperformed in 2009 and discussed with FMR its disappointment with the continued underperformance of the fund. The Board also reviewed the fund's performance since inception as well as performance in the current year. The Board noted that there was a change in the fund's portfolio manager in April 2010. The Board will continue to closely monitor the performance of the fund in the coming year and discuss with FMR other appropriate actions to address the performance of the fund.
Based on its review, the Board concluded that the nature, extent, and quality of services provided to the fund under the Advisory Contracts should benefit the fund's shareholders.
Competitiveness of Management Fee and Total Expense Ratio. The Board considered the fund's management fee and total expense ratio compared to "mapped groups" of competitive funds and classes. Fidelity creates "mapped groups" by combining similar Lipper investment objective categories that have comparable management fee characteristics. Combining Lipper investment objective categories aids the Board's management fee and total expense ratio comparisons by broadening the competitive group used for comparison and by reducing the number of universes to which various Fidelity funds are compared.
Annual Report
Management Fee. The Board considered two proprietary management fee comparisons for the 12-month periods shown in the chart below. The group of Lipper funds used by the Board for management fee comparisons is referred to below as the "Total Mapped Group." The Total Mapped Group comparison focuses on a fund's standing relative to the total universe of comparable funds available to investors in terms of gross management fees before expense reimbursements or caps. "TMG %" represents the percentage of funds in the Total Mapped Group that had management fees that were lower than the fund's. For example, a TMG % of 30% means that 70% of the funds in the Total Mapped Group had higher management fees than the fund. The "Asset-Size Peer Group" (ASPG) comparison focuses on a fund's standing relative to non-Fidelity funds similar in size to the fund within the Total Mapped Group. The ASPG represents at least 15% of the funds in the Total Mapped Group with comparable asset size and management fee characteristics, subject to a minimum of 50 funds (or all funds in the Total Mapped Group if fewer than 50). Additional information, such as the ASPG quartile in which the fund's management fee ranked, is also included in the chart and considered by the Board.
Fidelity International Real Estate Fund

The Board noted that the fund's management fee ranked below the median of its Total Mapped Group and below the median of its ASPG for 2010.
Based on its review, the Board concluded that the fund's management fee is fair and reasonable in light of the services that the fund receives and the other factors considered.
Total Expense Ratio. In its review of each class's total expense ratio, the Board considered the fund's management fee as well as other fund or class expenses, as applicable, such as transfer agent fees, pricing and bookkeeping fees, fund-paid 12b-1 fees, and custodial, legal, and audit fees. The Board also noted the effects of any waivers and reimbursements on fees and expenses. As part of its review, the Board also considered the current and historical total expense ratios of each class of the fund compared to competitive fund median expenses. Each class of the fund is compared to those funds and classes in the Total Mapped Group (used by the Board for management fee comparisons) that have a similar sales load structure.
Annual Report
Board Approval of Investment Advisory Contracts and
Management Fees - continued
The Board noted that the total expense ratio of each of Class A, Class B, Class C, and the retail class ranked below its competitive median for 2010 and the total expense ratio of each of Class T and Institutional Class ranked above its competitive median for 2010. The Board considered that various factors, including 12b-1 fees, positive or negative performance adjustments, and relatively higher other expenses in the case of small fund size, can affect total expense ratios. The Board noted that the total expense ratio of Class T was above the competitive median primarily because of higher 12b-1 fees on Class T. Class T has a higher 12b-1 fee, but a lower front-end sales charge, than traditionally priced front-end sales charge classes. The Board noted that the fund offers multiple classes, each of which has a different sales load and 12b-1 fee structure, and that the multiple structures are intended to offer a range of pricing options for the intermediary market. The Board also noted that the total expense ratios of the classes vary primarily by the level of their 12b-1 fees, although differences in transfer agent fees may also cause expenses to vary from class to class.
Fees Charged to Other Fidelity Clients. The Board also considered Fidelity fee structures and other information with respect to clients of FMR and its affiliates, such as other mutual funds advised or subadvised by FMR or its affiliates, pension plan clients, and other institutional clients. In March 2010, the Board created an ad hoc joint committee with the board of other Fidelity funds (the Committee) to review and compare Fidelity's institutional investment advisory business with its business of providing services to the Fidelity funds, including the differences in services provided, fees charged, and costs incurred, as well as competition in their respective marketplaces.
Based on its review of total expense ratios and fees charged to other Fidelity clients, the Board concluded that the total expense ratio of each class of the fund was reasonable, although in some cases above the median of the universe presented for comparison, in light of the services that the fund and its shareholders receive and the other factors considered, including the findings of the Committee.
Costs of the Services and Profitability. The Board considered the revenues earned and the expenses incurred by Fidelity in conducting the business of developing, marketing, distributing, managing, administering and servicing the fund and its shareholders. The Board also considered the level of Fidelity's profits in respect of all the Fidelity funds.
Annual Report
On an annual basis, FMR presents to the Board Fidelity's profitability for the fund. Fidelity calculates the profitability for each fund, as well as aggregate profitability for groups of Fidelity funds and all Fidelity funds, using a series of detailed revenue and cost allocation methodologies which originate with the books and records of Fidelity on which Fidelity's audited financial statements are based. The Audit Committee of the Board reviews any significant changes from the prior year's methodologies.
PricewaterhouseCoopers LLP (PwC), independent registered public accounting firm and auditor to Fidelity and certain Fidelity funds, has been engaged annually by the Board as part of the Board's assessment of Fidelity's profitability analysis. PwC's engagement includes the review and assessment of Fidelity's methodologies used in determining the revenues and expenses attributable to Fidelity's mutual fund business, and completion of agreed-upon procedures surrounding the mathematical accuracy of fund profitability and its conformity to allocation methodologies. After considering PwC's reports issued under the engagement and information provided by Fidelity, the Board concluded that while other allocation methods may also be reasonable, Fidelity's profitability methodologies are reasonable in all material respects.
The Board also reviewed Fidelity's non-fund businesses and fall-out benefits related to the mutual fund business as well as cases where Fidelity's affiliates may benefit from or be related to the fund's business.
The Board considered the costs of the services provided by and the profits realized by Fidelity in connection with the operation of the fund and was satisfied that the profitability was not excessive in the circumstances.
Economies of Scale. The Board considered whether there have been economies of scale in respect of the management of the Fidelity funds, whether the Fidelity funds (including the fund) have appropriately benefited from any such economies of scale, and whether there is potential for realization of any further economies of scale. The Board considered the extent to which the fund will benefit from economies of scale through increased services to the fund, through waivers or reimbursements, or through fee or expense reductions. The Board also noted that in 2009, it and the board of other Fidelity funds created an ad hoc committee (the Economies of Scale Committee) to analyze whether FMR attains economies of scale in respect of the management and servicing of the Fidelity funds, whether the Fidelity funds have appropriately benefited from such economies of scale, and whether there is potential for realization of any further economies of scale.
The Board recognized that the fund's management contract incorporates a "group fee" structure, which provides for lower group fee rates as total fund assets under FMR's management increase, and for higher group fee rates as total fund assets under FMR's management decrease. FMR calculates the group fee rates based on a tiered asset "breakpoint" schedule that varies based on asset class. The Board considered that the group fee is designed to deliver the benefits of economies of scale to fund shareholders when total Fidelity fund assets increase, even if assets of any particular fund are unchanged or have declined, because some portion of Fidelity's costs are attributable to services provided to all Fidelity funds, and all funds benefit if those costs can be allocated among more assets. The Board concluded that, given the group fee structure, fund shareholders will benefit from lower management fees as assets under FMR's management increase at the fund complex level, regardless of whether Fidelity achieves any such economies of scale.
Annual Report
Board Approval of Investment Advisory Contracts and
Management Fees - continued
The Board concluded, taking into account the analysis of the Economies of Scale Committee, that any potential economies of scale are being appropriately shared between fund shareholders and Fidelity.
Additional Information Requested by the Board. In order to develop fully the factual basis for consideration of the Fidelity funds' Advisory Contracts, the Board requested and received additional information on certain topics, including (i) fund performance trends, actions to be taken by FMR to improve certain funds' overall performance, and Fidelity's long-term strategies for certain funds; (ii) portfolio manager changes that have occurred during the past year and length of portfolio manager tenure for different categories of funds over time; (iii) Fidelity's compensation structure for portfolio managers and other key personnel and strategies for attracting and retaining non-investment personnel; (iv) the amount of the investment that each portfolio manager has made in the Fidelity fund(s) that he or she manages; (v) historical trends in Fidelity's realization of fall-out benefits; (vi) Fidelity's group fee structures and the rationale for the individual fee rates of certain funds; (vii) fund profitability methodology and the impact of certain factors on fund profitability results; (viii) trends regarding industry use of performance fee structures and Fidelity's compliance practices with respect to performance adjustment calculations; (ix) the fee structures in place for certain other Fidelity clients; and (x) explanations regarding the relative total expense ratios of certain funds and classes, total expense competitive trends, and actions that might be taken by FMR to reduce total expense ratios for certain funds and classes.
Based on its evaluation of all of the conclusions noted above, and after considering all factors it believed relevant, the Board ultimately concluded that the advisory fee structures are fair and reasonable, and that the fund's Advisory Contracts should be renewed.
Annual Report
Investment Adviser
Fidelity Management & Research Company
Boston, MA
Investment Sub-Advisers
FMR Co., Inc.
Fidelity Management & Research
(U.K.) Inc.
FIL Investments (Japan) Limited
FIL Investment Advisers
FIL Investment Advisers (U.K.) Ltd.
Fidelity Management & Research
(Hong Kong) Limited
Fidelity Management & Research
(Japan) Inc.
General Distributor
Fidelity Distributors Corporation
Boston, MA
Transfer and Service Agents
Fidelity Investments Institutional
Operations Company, Inc.
Boston, MA
Fidelity Service Company, Inc.
Boston, MA
Custodian
The Bank of New York Mellon
New York, NY
AIRE-UANN-0911
1.843178.104
(Fidelity Investment logo)(registered trademark)
Fidelity Advisor®
International Real Estate
Fund - Institutional Class
Annual Report
July 31, 2011
(2_fidelity_logos) (Registered_Trademark)
Institutional Class is a
class of Fidelity®
International Real Estate Fund
Contents
Chairman's Message | <Click Here> | The Chairman's message to shareholders. |
Performance | <Click Here> | How the fund has done over time. |
Management's Discussion of Fund Performance | <Click Here> | The Portfolio Manager's review of fund performance and strategy. |
Shareholder Expense Example | <Click Here> | An example of shareholder expenses. |
Investment Changes | <Click Here> | A summary of major shifts in the fund's investments over the past six months. |
Investments | <Click Here> | A complete list of the fund's investments with their market values. |
Financial Statements | <Click Here> | Statements of assets and liabilities, operations, and changes in net assets,
as well as financial highlights. |
Notes | <Click Here> | Notes to the financial statements. |
Report of Independent Registered Public Accounting Firm | <Click Here> | |
Trustees and Officers | <Click Here> | |
Distributions | <Click Here> | |
Board Approval of Investment Advisory Contracts and Management Fees | <Click Here> | |
To view a fund's proxy voting guidelines and proxy voting record for the 12-month period ended June 30, visit http://www.fidelity.com/proxyvotingresults or visit the Securities and Exchange Commission's (SEC) web site at http://www.sec.gov. You may also call 1-877-208-0098 to request a free copy of the proxy voting guidelines.
Standard & Poor's, S&P and S&P 500 are registered service marks of The McGraw-Hill Companies, Inc. and have been licensed for use by Fidelity Distributors Corporation.
Other third party marks appearing herein are the property of their respective owners.
All other marks appearing herein are registered or unregistered trademarks or service marks of FMR LLC or an affiliated company.
Annual Report
This report and the financial statements contained herein are submitted for the general information of the shareholders of the fund. This report is not authorized for distribution to prospective investors in the fund unless preceded or accompanied by an effective prospectus.
A fund files its complete schedule of portfolio holdings with the SEC for the first and third quarters of each fiscal year on Form N-Q. Forms N-Q are available on the SEC's web site at http://www.sec.gov. A fund's Forms N-Q may be reviewed and copied at the SEC's Public Reference Room in Washington, DC. Information regarding the operation of the SEC's Public Reference Room may be obtained by calling 1-800-SEC-0330. For a complete list of a fund's portfolio holdings, view the most recent holdings listing, semiannual report, or annual report on Fidelity's web site at http://www.fidelity.com, http://www.advisor.fidelity.com, or http://www.401k.com, as applicable.
NOT FDIC INSURED • MAY LOSE VALUE • NO BANK GUARANTEE
Neither the fund nor Fidelity Distributors Corporation is a bank.
Annual Report
(photo_of_James_C_Curvey)
Dear Shareholder:
The second half of 2011 began with U.S. equities continuing to give back some of the gains achieved earlier in the year. In the days leading up to July 31, markets were shaken by a political stalemate in which Congress struggled to address the debt ceiling issue before an early-August deadline. The resulting uncertainty held back markets in July, the third consecutive monthly decline for equities, effectively reversing the positive momentum seen through the end of April. Financial markets are always unpredictable, of course, but there are several time-tested investment principles that can help put the odds in your favor.
One of the basic tenets is to invest for the long term. Over time, riding out the markets' inevitable ups and downs has proven much more effective than selling into panic or chasing the hottest trend. Even missing only a few of the markets' best days can significantly diminish investor returns. Patience also affords the benefits of compounding - of earning interest on additional income or reinvested dividends and capital gains. There can be tax advantages and cost benefits to consider as well. While staying the course doesn't eliminate risk, it can considerably lessen the effect of short-term declines.
You can further manage your investing risk through diversification. And today, more than ever, geographic diversification should be taken into account. Studies indicate that asset allocation is the single most important determinant of a portfolio's long-term success. The right mix of stocks, bonds and cash - aligned to your particular risk tolerance and investment objective - is very important. Age-appropriate rebalancing is also an essential aspect of asset allocation. For younger investors, an emphasis on equities - which historically have been the best-performing asset class over time - is encouraged. As investors near their specific goal, such as retirement or sending a child to college, consideration may be given to replacing volatile assets (e.g. common stocks) with more-stable fixed investments (bonds or savings plans).
A third principle - investing regularly - can help lower the average cost of your purchases. Investing a certain amount of money each month or quarter helps ensure you won't pay for all your shares at market highs. This strategy - known as dollar cost averaging - also reduces "emotion" from investing, helping shareholders avoid selling weak performers just prior to an upswing, or chasing a hot performer just before a correction.
We invite you to contact us via the Internet, through our Investor Centers or by phone. It is our privilege to provide you the information you need to make the investments that are right for you.
Sincerely,
(The acting chairman's signature appears here.)
James C. Curvey
Acting Chairman
Annual Report
Average annual total return reflects the change in the value of an investment, assuming reinvestment of the class' distributions from dividend income and capital gains (the profits earned upon the sale of securities that have grown in value, if any) and assuming a constant rate of performance each year. The $10,000 table and the fund's returns do not reflect the deduction of taxes that a shareholder would pay on fund distributions or the redemption of fund shares. During periods of reimbursement by Fidelity, a fund's total return will be greater than it would be had the reimbursement not occurred. How a fund did yesterday is no guarantee of how it will do tomorrow.
Average Annual Total Returns
Periods ended July 31, 2011 | Past 1
year | Past 5
years | Life of
fund A |
Institutional Class B | 17.18% | -2.58% | 4.60% |
A From September 8, 2004.
B The initial offering of Institutional Class shares took place on April 4, 2007. Returns prior to April 4, 2007 are those of Fidelity® International Real Estate Fund, the original class of the fund.
$10,000 Over Life of Fund
Let's say hypothetically that $10,000 was invested in Fidelity Advisor® International Real Estate Fund - Institutional Class on September 8, 2004, when the fund started. The chart shows how the value of your investment would have changed, and also shows how the MSCI® EAFE® (Europe, Australasia, Far East) Index performed over the same period. The initial offering of Institutional Class took place on April 4, 2007. See above for additional information regarding the performance of Institutional Class.
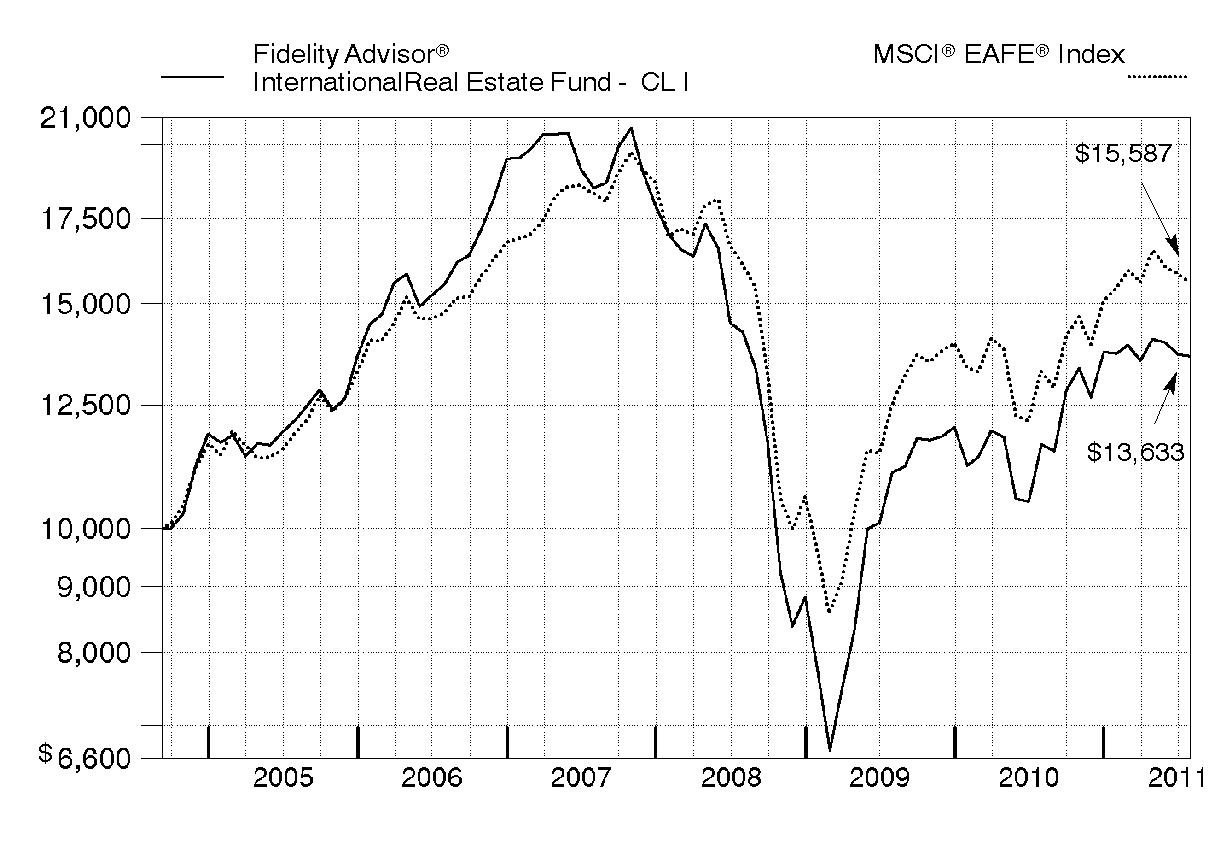
Annual Report
Market Recap: The year ending July 31, 2011, saw tremendous variability in the performance of international real estate securities. Between August 2010 and March 2011, international real estate stocks performed well, led by higher-risk property types. This situation changed abruptly in March with the Japanese earthquake and tsunami and the country's subsequent nuclear disaster. Questions about the impact of these events on global economic growth, along with rising inflation expectations in China and debt crises in Europe and the United States, led investors to favor lower-risk property types over more-speculative opportunities. In this environment, the FTSE® EPRASM/NAREIT® Developed ex North America Index - a proxy for international real estate stocks - returned 20.15%, although more than half of those gains came from a weaker U.S. dollar. In comparison, the U.S. real estate investment trust (REIT) market, as measured by the Dow Jones U.S. Select Real Estate Securities IndexSM, gained 25.23% during the same time span. The MSCI® EAFE® (Europe, Australasia, Far East) Index, which measures the performance of foreign developed-markets equities, rose 17.30%, compared with a return of 19.65% for the U.S. equity benchmark S&P 500® Index.
Comments from Guillermo de las Casas, Portfolio Manager of Fidelity Advisor® International Real Estate Fund: For the year, the fund's Class A, Class T, Class B and Class C shares returned 16.76%, 16.54%, 15.90% and 16.07%, respectively (excluding sales charges), lagging the FTSE® EPRASM/NAREIT® index. Stock picking in Singapore and Hong Kong hurt results, as did poor security selection in the U.K., lacking any exposure to strong-performing Swiss property stocks and a disappointing out-of-benchmark pick in Poland. In contrast, the fund benefited from various non-state-owned Chinese property companies with shares listed in Grand Cayman. Our German holdings also contributed meaningfully. The biggest individual detractor was Westfield Group. This Australia-based global mall developer and operator was hurt by the strength of the Australian dollar. In December 2010, Westfield spun off its Australian retail properties into a new company, a passive investment vehicle called Westfield Retail Trust. I underweighted - and ultimately sold - this latter stock, which proved to be a wise move given its decline. Other detractors of note were Singapore property developers Wing Tai Holdings and CapitaLand, and Hong Kong-based Kerry Properties and New World Development. On the plus side, the fund got a boost from significantly underweighting China Overseas Land & Investment and not owning lagging index constituents Sino Land and Shimao Property Holdings.
Comments from Guillermo de las Casas, Portfolio Manager of Fidelity Advisor® International Real Estate Fund: For the year, the fund's Institutional Class shares returned 17.18%, lagging the FTSE® EPRASM/NAREIT® index. Stock picking in Singapore and Hong Kong hurt results, as did poor security selection in the U.K., lacking any exposure to strong-performing Swiss property stocks and a disappointing out-of-benchmark pick in Poland. In contrast, the fund benefited from various non-state-owned Chinese property companies with shares listed in Grand Cayman. Our German holdings also contributed meaningfully. The biggest individual detractor was Westfield Group. This Australia-based global mall developer and operator was hurt by the strength of the Australian dollar. In December 2010, Westfield spun off its Australian retail properties into a new company, a passive investment vehicle called Westfield Retail Trust. I underweighted - and ultimately sold - this latter stock, which proved to be a wise move given its decline. Other detractors of note were Singapore property developers Wing Tai Holdings and CapitaLand, and Hong Kong-based Kerry Properties and New World Development. On the plus side, the fund got a boost from significantly underweighting China Overseas Land & Investment and not owning lagging index constituents Sino Land and Shimao Property Holdings.
Annual Report
The views expressed above reflect those of the portfolio manager(s) only through the end of the period as stated on the cover of this report and do not necessarily represent the views of Fidelity or any other person in the Fidelity organization. Any such views are subject to change at any time based upon market or other conditions and Fidelity disclaims any responsibility to update such views. These views may not be relied on as investment advice and, because investment decisions for a Fidelity fund are based on numerous factors, may not be relied on as an indication of trading intent on behalf of any Fidelity fund.
Annual Report
Shareholder Expense Example
As a shareholder of the Fund, you incur two types of costs: (1) transaction costs, including sales charges (loads) on purchase payments or redemption proceeds, redemption fees, and (2) ongoing costs, including management fees, distribution and/or service (12b-1) fees and other Fund expenses. This Example is intended to help you understand your ongoing costs (in dollars) of investing in the Fund and to compare these costs with the ongoing costs of investing in other mutual funds.
The Example is based on an investment of $1,000 invested at the beginning of the period and held for the entire period (February 1, 2011 to July 31, 2011).
Actual Expenses
The first line of the accompanying table for each class of the Fund provides information about actual account values and actual expenses. You may use the information in this line, together with the amount you invested, to estimate the expenses that you paid over the period. Simply divide your account value by $1,000.00 (for example, an $8,600 account value divided by $1,000.00 = 8.6), then multiply the result by the number in the first line for a class of the Fund under the heading entitled "Expenses Paid During Period" to estimate the expenses you paid on your account during this period. A small balance maintenance fee of $12.00 that is charged once a year may apply for certain accounts with a value of less than $2,000. This fee is not included in the table below. If it was, the estimate of expenses you paid during the period would be higher, and your ending account value lower, by this amount. In addition, the Fund, as a shareholder in the underlying Fidelity Central Funds, will indirectly bear its pro-rata share of the fees and expenses incurred by the underlying Fidelity Central Funds. These fees and expenses are not included in the Fund's annualized expense ratio used to calculate the expense estimate in the table below.
Hypothetical Example for Comparison Purposes
The second line of the accompanying table for each class of the Fund provides information about hypothetical account values and hypothetical expenses based on a Class' actual expense ratio and an assumed rate of return of 5% per year before expenses, which is not the Class' actual return. The hypothetical account values and expenses may not be used to estimate the actual ending account balance or expenses you paid for the period. You may use this information to compare the ongoing costs of investing in the Fund and other funds. To do so, compare this 5% hypothetical example with the 5% hypothetical examples that appear in the shareholder reports of the other funds. A small balance maintenance fee of $12.00 that is charged once a year may apply for certain accounts with a value of less than $2,000. This fee is not included in the table below. If it was, the estimate of expenses you paid during the period would be higher, and your ending account value lower, by this amount. In addition, the Fund, as a shareholder in the underlying Fidelity Central Funds, will indirectly bear its pro-rata share of the fees and expenses incurred by the underlying Fidelity Central Funds. These fees and expenses are not included in the Fund's annualized expense ratio used to calculate the expense estimate in the table below.
Please note that the expenses shown in the table are meant to highlight your ongoing costs only and do not reflect any transaction costs. Therefore, the second line of the table is useful in comparing ongoing costs only, and will not help you determine the relative total costs of owning different funds. In addition, if these transactional costs were included, your costs would have been higher.
Annual Report
| Annualized Expense Ratio | Beginning
Account Value
February 1, 2011 | Ending
Account Value
July 31, 2011 | Expenses Paid
During Period*
February 1, 2011
to July 31, 2011 |
Class A | 1.42% | | | |
Actual | | $ 1,000.00 | $ 992.50 | $ 7.02 |
Hypothetical A | | $ 1,000.00 | $ 1,017.75 | $ 7.10 |
Class T | 1.69% | | | |
Actual | | $ 1,000.00 | $ 992.40 | $ 8.35 |
Hypothetical A | | $ 1,000.00 | $ 1,016.41 | $ 8.45 |
Class B | 2.17% | | | |
Actual | | $ 1,000.00 | $ 989.10 | $ 10.70 |
Hypothetical A | | $ 1,000.00 | $ 1,014.03 | $ 10.84 |
Class C | 2.18% | | | |
Actual | | $ 1,000.00 | $ 990.10 | $ 10.76 |
Hypothetical A | | $ 1,000.00 | $ 1,013.98 | $ 10.89 |
International Real Estate | 1.17% | | | |
Actual | | $ 1,000.00 | $ 994.70 | $ 5.79 |
Hypothetical A | | $ 1,000.00 | $ 1,018.99 | $ 5.86 |
Institutional Class | 1.17% | | | |
Actual | | $ 1,000.00 | $ 994.60 | $ 5.79 |
Hypothetical A | | $ 1,000.00 | $ 1,018.99 | $ 5.86 |
A 5% return per year before expenses
* Expenses are equal to each Class' annualized expense ratio, multiplied by the average account value over the period, multiplied by 181/365 (to reflect the one-half year period).
Annual Report
Investment Changes (Unaudited)
Top Ten Stocks as of July 31, 2011 |
| % of fund's
net assets | % of fund's net assets
6 months ago |
Mitsui Fudosan Co. Ltd. | 6.3 | 6.7 |
Sun Hung Kai Properties Ltd. | 6.0 | 8.1 |
Westfield Group unit | 5.9 | 5.5 |
Unibail-Rodamco | 5.6 | 4.3 |
Sumitomo Realty & Development Co. Ltd. | 3.9 | 3.3 |
Hang Lung Properties Ltd. | 3.6 | 2.8 |
Hongkong Land Holdings Ltd. | 3.6 | 1.9 |
Land Securities Group PLC | 2.7 | 2.0 |
Kerry Properties Ltd. | 2.5 | 2.6 |
The GPT Group unit | 2.5 | 2.0 |
| 42.6 | |
Top Five Countries as of July 31, 2011 |
(excluding cash equivalents) | % of fund's
net assets | % of fund's net assets
6 months ago |
Hong Kong | 21.4 | 21.8 |
Japan | 18.6 | 19.4 |
Australia | 13.0 | 15.5 |
United Kingdom | 10.3 | 11.9 |
Singapore | 8.8 | 6.3 |
Percentages are adjusted for the effect of open futures contracts, if applicable. |
Top Five REIT Sectors as of July 31, 2011 |
| % of fund's
net assets | % of fund's net assets
6 months ago |
REITs - Management/Investment | 21.2 | 21.5 |
REITs - Office Buildings | 5.9 | 5.8 |
REITs - Industrial Buildings | 3.5 | 2.3 |
REITs - Shopping Centers | 2.3 | 7.3 |
REITs - Health Care Facilities | 0.5 | 0.4 |
Asset Allocation (% of fund's net assets) |
As of July 31, 2011 * | As of January 31, 2011** |
| Stocks 97.5% | | | Stocks 98.8% | |
| Short-Term
Investments and
Net Other Assets 2.5% | | | Short-Term
Investments and
Net Other Assets 1.2% | |
* Foreign investments | 97.5% | | ** Foreign investments | 98.8% | |

Annual Report
Investments July 31, 2011
Showing Percentage of Net Assets
Common Stocks - 97.5% |
| Shares | | Value |
Australia - 13.0% |
Abacus Property Group unit | 1,789,587 | | $ 4,109,211 |
Charter Hall Group unit | 833,740 | | 1,914,416 |
FKP Property Group unit | 6,666,469 | | 4,650,814 |
Goodman Group unit | 6,501,169 | | 4,856,906 |
The GPT Group unit | 2,516,398 | | 8,321,568 |
Westfield Group unit | 2,287,195 | | 20,002,101 |
TOTAL AUSTRALIA | | 43,855,016 |
Bailiwick of Jersey - 0.9% |
Atrium European Real Estate Ltd. | 462,622 | | 2,965,974 |
Belgium - 0.5% |
Warehouses de Pauw | 28,835 | | 1,574,400 |
Bermuda - 2.0% |
Asia Standard International Group | 2,218,000 | | 546,404 |
Csi Properties Ltd. | 37,900,000 | | 1,312,967 |
Great Eagle Holdings Ltd. | 1,485,088 | | 4,897,067 |
TOTAL BERMUDA | | 6,756,438 |
Brazil - 1.8% |
Aliansce Shopping Centers SA | 107,500 | | 931,408 |
BR Malls Participacoes SA | 71,900 | | 837,103 |
Companhia Brasileira de Desenvolvimento Imobiliario Turistico (a) | 129,100 | | 1,690,318 |
Even Construtora e Incorporadora SA | 144,500 | | 707,036 |
Iguatemi Empresa de Shopping Centers SA | 52,800 | | 1,153,894 |
Tecnisa SA | 94,500 | | 723,736 |
TOTAL BRAZIL | | 6,043,495 |
Cayman Islands - 1.6% |
Glorious Property Holdings Ltd. (a) | 5,474,000 | | 1,685,648 |
SOHO China Ltd. | 3,420,500 | | 3,102,843 |
SPG Land (Holdings) Ltd. | 1,876,000 | | 649,901 |
TOTAL CAYMAN ISLANDS | | 5,438,392 |
Chile - 0.3% |
Parque Arauco SA | 512,608 | | 1,064,432 |
France - 7.9% |
Altarea | 22,697 | | 4,434,605 |
Societe de la Tour Eiffel | 22,995 | | 1,981,761 |
Common Stocks - continued |
| Shares | | Value |
France - continued |
Societe Fonciere Lyonnaise SA | 27,600 | | $ 1,514,503 |
Unibail-Rodamco | 83,907 | | 18,735,300 |
TOTAL FRANCE | | 26,666,169 |
Germany - 2.6% |
alstria office REIT-AG | 310,465 | | 4,523,369 |
GSW Immobilien AG | 73,550 | | 2,583,884 |
Hamborner (REIT) AG | 67,347 | | 688,017 |
IVG Immobilien AG (a) | 170,100 | | 1,172,182 |
TOTAL GERMANY | | 8,967,452 |
Hong Kong - 21.4% |
China Overseas Land & Investment Ltd. | 3,418,000 | | 7,674,690 |
China State Construction International Holdings Ltd. | 3,230,539 | | 3,237,254 |
Hang Lung Properties Ltd. | 3,292,000 | | 12,164,746 |
Hongkong Land Holdings Ltd. | 1,798,000 | | 12,082,560 |
Kerry Properties Ltd. | 1,771,000 | | 8,589,366 |
Magnificent Estates Ltd. | 13,844,000 | | 586,174 |
New World Development Co. Ltd. | 3,302,725 | | 4,864,801 |
Shangri-La Asia Ltd. | 658,000 | | 1,696,964 |
Soundwill Holdings Ltd. | 662,000 | | 995,489 |
Sun Hung Kai Properties Ltd. | 1,329,000 | | 20,223,691 |
TOTAL HONG KONG | | 72,115,735 |
Italy - 2.4% |
Beni Stabili SpA SIIQ | 3,753,700 | | 3,349,366 |
Immobiliare Grande Distribuzione SpA | 2,119,605 | | 4,315,551 |
Pirelli & C. Real Estate SpA (a) | 1,176,200 | | 642,716 |
TOTAL ITALY | | 8,307,633 |
Japan - 18.6% |
Goldcrest Co. Ltd. | 57,920 | | 1,361,363 |
Hulic Co. Ltd. | 524,000 | | 5,582,797 |
Japan Retail Fund Investment Corp. | 2,294 | | 3,585,632 |
Kenedix, Inc. (a)(d) | 41,527 | | 8,120,332 |
Mitsubishi Estate Co. Ltd. | 79,000 | | 1,420,594 |
Mitsui Fudosan Co. Ltd. | 1,112,000 | | 21,224,293 |
Nomura Real Estate Holdings, Inc. | 198,500 | | 3,649,419 |
Sumitomo Realty & Development Co. Ltd. | 529,000 | | 13,100,422 |
Tokyo Tatemono Co. Ltd. | 959,000 | | 3,924,966 |
Tosei Corp. (d) | 2,140 | | 653,136 |
TOTAL JAPAN | | 62,622,954 |
Common Stocks - continued |
| Shares | | Value |
Netherlands - 1.3% |
Corio NV | 73,000 | | $ 4,464,645 |
Poland - 0.6% |
Globe Trade Centre SA (a) | 354,000 | | 2,099,267 |
Russia - 0.5% |
LSR Group OJSC GDR (Reg. S) | 216,700 | | 1,636,085 |
Singapore - 8.8% |
CapitaLand Ltd. | 3,044,900 | | 7,333,148 |
Global Logistic Properties Ltd. | 4,420,000 | | 7,414,691 |
Mapletree Industrial (REIT) | 4,443,000 | | 4,519,931 |
Parkway Life REIT | 1,065,000 | | 1,645,061 |
Wing Tai Holdings Ltd. | 5,302,000 | | 6,516,597 |
Yanlord Land Group Ltd. | 2,080,000 | | 2,150,563 |
TOTAL SINGAPORE | | 29,579,991 |
Spain - 0.2% |
Inmobiliaria Colonial SA (a)(d) | 96,025 | | 651,235 |
Sweden - 2.8% |
Castellum AB (d) | 246,000 | | 3,569,666 |
Kungsleden AB | 196,589 | | 1,812,211 |
Wihlborgs Fastigheter AB | 283,700 | | 3,990,472 |
TOTAL SWEDEN | | 9,372,349 |
United Kingdom - 10.3% |
Big Yellow Group PLC | 1,174,700 | | 5,532,544 |
British Land Co. PLC | 799,789 | | 7,680,662 |
Great Portland Estates PLC | 331,554 | | 2,265,289 |
Helical Bar PLC | 905,300 | | 3,633,614 |
Land Securities Group PLC | 648,938 | | 9,108,286 |
Quintain Estates & Development PLC (a) | 2,148,600 | | 2,081,014 |
Safestore Holdings PLC | 621,100 | | 1,233,713 |
St. Modwen Properties PLC | 1,122,000 | | 3,188,286 |
TOTAL UNITED KINGDOM | | 34,723,408 |
TOTAL COMMON STOCKS (Cost $356,163,164) | 328,905,070 |
Money Market Funds - 1.7% |
| Shares | | Value |
Fidelity Cash Central Fund, 0.14% (b) | 3,455,115 | | $ 3,455,115 |
Fidelity Securities Lending Cash Central Fund, 0.15% (b)(c) | 2,246,812 | | 2,246,812 |
TOTAL MONEY MARKET FUNDS (Cost $5,701,927) | 5,701,927 |
TOTAL INVESTMENT PORTFOLIO - 99.2% (Cost $361,865,091) | 334,606,997 |
NET OTHER ASSETS (LIABILITIES) - 0.8% | | 2,544,171 |
NET ASSETS - 100% | $ 337,151,168 |
Legend |
(a) Non-income producing |
(b) Affiliated fund that is available only to investment companies and other accounts managed by Fidelity Investments. The rate quoted is the annualized seven-day yield of the fund at period end. A complete unaudited listing of the fund's holdings as of its most recent quarter end is available upon request. In addition, each Fidelity Central Fund's financial statements, which are not covered by the Fund's Report of Independent Registered Public Accounting Firm, are available on the SEC's website or upon request. |
(c) Investment made with cash collateral received from securities on loan. |
(d) Security or a portion of the security is on loan at period end. |
Affiliated Central Funds |
Information regarding fiscal year to date income earned by the Fund from investments in Fidelity Central Funds is as follows: |
Fund | Income earned |
Fidelity Cash Central Fund | $ 5,442 |
Fidelity Securities Lending Cash Central Fund | 168,341 |
Total | $ 173,783 |
Other Information |
All investments are categorized as Level 1 under the Fair Value Hierarchy. The inputs or methodology used for valuing securities may not be an indication of the risk associated with investing in those securities. For more information on valuation inputs, please refer to the Security Valuation section in the accompanying Notes to Financial Statements. |
Income Tax Information |
At July 31, 2011, the Fund had a capital loss carryforward of approximately $289,916,707 of which $153,317,175 and $136,599,532 will expire in fiscal 2017 and 2018, respectively. Capital loss carryforwards are only available to offset future capital gains of the Fund to the extent provided by regulations and may be limited. |
See accompanying notes which are an integral part of the financial statements.
Annual Report
Statement of Assets and Liabilities
| July 31, 2011 |
Assets | | |
Investment in securities, at value (including securities loaned of $2,134,155) - See accompanying schedule: Unaffiliated issuers (cost $356,163,164) | $ 328,905,070 | |
Fidelity Central Funds (cost $5,701,927) | 5,701,927 | |
Total Investments (cost $361,865,091) | | $ 334,606,997 |
Foreign currency held at value (cost $234,321) | | 235,566 |
Receivable for investments sold | | 7,589,065 |
Receivable for fund shares sold | | 237,833 |
Dividends receivable | | 860,853 |
Distributions receivable from Fidelity Central Funds | | 9,691 |
Other receivables | | 87,555 |
Total assets | | 343,627,560 |
| | |
Liabilities | | |
Payable to custodian bank | $ 168,407 | |
Payable for investments purchased | 3,139,399 | |
Payable for fund shares redeemed | 485,409 | |
Accrued management fee | 200,120 | |
Distribution and service plan fees payable | 5,831 | |
Other affiliated payables | 99,786 | |
Other payables and accrued expenses | 130,628 | |
Collateral on securities loaned, at value | 2,246,812 | |
Total liabilities | | 6,476,392 |
| | |
Net Assets | | $ 337,151,168 |
Net Assets consist of: | | |
Paid in capital | | $ 647,993,841 |
Undistributed net investment income | | 4,912,084 |
Accumulated undistributed net realized gain (loss) on investments and foreign currency transactions | | (288,485,740) |
Net unrealized appreciation (depreciation) on investments and assets and liabilities in foreign currencies | | (27,269,017) |
Net Assets | | $ 337,151,168 |
See accompanying notes which are an integral part of the financial statements.
Annual Report
Statement of Assets and Liabilities - continued
| July 31, 2011 |
Calculation of Maximum Offering Price Class A:
Net Asset Value and redemption price per share ($7,046,650 ÷ 764,709 shares) | | $ 9.21 |
| | |
Maximum offering price per share (100/94.25 of $9.21) | | $ 9.77 |
Class T:
Net Asset Value and redemption price per share ($2,496,490 ÷ 272,635 shares) | | $ 9.16 |
| | |
Maximum offering price per share (100/96.50 of $9.16) | | $ 9.49 |
Class B:
Net Asset Value and offering price per share ($570,154 ÷ 62,979 shares) A | | $ 9.05 |
| | |
Class C:
Net Asset Value and offering price per share ($3,207,979 ÷ 355,336 shares) A | | $ 9.03 |
| | |
International Real Estate:
Net Asset Value, offering price and redemption price per share ($322,045,234 ÷ 34,631,945 shares) | | $ 9.30 |
| | |
Institutional Class:
Net Asset Value, offering price and redemption price per share ($1,784,661 ÷ 192,333 shares) | | $ 9.28 |
A Redemption price per share is equal to net asset value less any applicable contingent deferred sales charge.
See accompanying notes which are an integral part of the financial statements.
Annual Report
Financial Statements - continued
Statement of Operations
| Year ended July 31, 2011 |
Investment Income | | |
Dividends | | $ 11,535,462 |
Special dividends | | 7,319,957 |
Interest | | 221 |
Income from Fidelity Central Funds | | 173,783 |
Income before foreign taxes withheld | | 19,029,423 |
Less foreign taxes withheld | | (861,698) |
Total income | | 18,167,725 |
| | |
Expenses | | |
Management fee | $ 2,554,814 | |
Transfer agent fees | 1,087,758 | |
Distribution and service plan fees | 76,402 | |
Accounting and security lending fees | 187,904 | |
Custodian fees and expenses | 220,247 | |
Independent trustees' compensation | 1,930 | |
Registration fees | 81,632 | |
Audit | 81,939 | |
Legal | 1,531 | |
Interest | 134 | |
Miscellaneous | 4,210 | |
Total expenses before reductions | 4,298,501 | |
Expense reductions | (215,862) | 4,082,639 |
Net investment income (loss) | | 14,085,086 |
Realized and Unrealized Gain (Loss) Net realized gain (loss) on: | | |
Investment securities: | | |
Unaffiliated issuers | 38,029,900 | |
Foreign currency transactions | (598,975) | |
Total net realized gain (loss) | | 37,430,925 |
Change in net unrealized appreciation (depreciation) on: Investment securities | 3,872,756 | |
Assets and liabilities in foreign currencies | 3,539 | |
Total change in net unrealized appreciation (depreciation) | | 3,876,295 |
Net gain (loss) | | 41,307,220 |
Net increase (decrease) in net assets resulting from operations | | $ 55,392,306 |
See accompanying notes which are an integral part of the financial statements.
Annual Report
Statement of Changes in Net Assets
| Year ended
July 31, 2011 | Year ended
July 31, 2010 |
Increase (Decrease) in Net Assets | | |
Operations | | |
Net investment income (loss) | $ 14,085,086 | $ 7,955,511 |
Net realized gain (loss) | 37,430,925 | 348,071 |
Change in net unrealized appreciation (depreciation) | 3,876,295 | 9,565,008 |
Net increase (decrease) in net assets resulting
from operations | 55,392,306 | 17,868,590 |
Distributions to shareholders from net investment income | (13,892,744) | (3,235,770) |
Distributions to shareholders from net realized gain | (11,440,782) | (5,017,915) |
Total distributions | (25,333,526) | (8,253,685) |
Share transactions - net increase (decrease) | (26,030,265) | (26,300,777) |
Redemption fees | 74,922 | 80,485 |
Total increase (decrease) in net assets | 4,103,437 | (16,605,387) |
| | |
Net Assets | | |
Beginning of period | 333,047,731 | 349,653,118 |
End of period (including undistributed net investment income of $4,912,084 and undistributed net investment income of $4,719,742, respectively) | $ 337,151,168 | $ 333,047,731 |
See accompanying notes which are an integral part of the financial statements.
Annual Report
Financial Highlights - Class A
Years ended July 31, | 2011 | 2010 | 2009 | 2008 | 2007 I |
Selected Per-Share Data | | | | | |
Net asset value, beginning of period | $ 8.46 | $ 8.24 | $ 10.63 | $ 15.71 | $ 17.46 |
Income from Investment Operations | | | | | |
Net investment income (loss) E | .34 H | .17 | .18 | .20 | .11 |
Net realized and unrealized gain (loss) | 1.04 | .24 | (2.57) | (3.48) | (1.87) |
Total from investment operations | 1.38 | .41 | (2.39) | (3.28) | (1.76) |
Distributions from net investment income | (.33) | (.07) | - | (.31) | - |
Distributions from net realized gain | (.29) | (.12) | - | (1.50) | - |
Total distributions | (.63) L | (.19) | - | (1.81) | - |
Redemption fees added to paid in capital E | - K | - K | - K | .01 | .01 |
Net asset value, end of period | $ 9.21 | $ 8.46 | $ 8.24 | $ 10.63 | $ 15.71 |
Total Return B,C,D | 16.76% | 4.97% | (22.48)% | (23.20)% | (10.02)% |
Ratios to Average Net Assets F,J | | | | | |
Expenses before reductions | 1.42% | 1.44% | 1.45% | 1.38% | 1.37% A |
Expenses net of fee waivers, if any | 1.42% | 1.44% | 1.45% | 1.38% | 1.37% A |
Expenses net of all reductions | 1.36% | 1.39% | 1.42% | 1.35% | 1.26% A |
Net investment income (loss) | 3.67% H | 2.02% | 2.55% | 1.58% | 2.08% A |
Supplemental Data | | | | | |
Net assets, end of period (000 omitted) | $ 7,047 | $ 7,250 | $ 6,745 | $ 9,976 | $ 5,087 |
Portfolio turnover rate G | 131% | 95% | 55% | 63% | 144% |
A Annualized
B Total returns for periods of less than one year are not annualized.
C Total returns would have been lower if certain expenses had not been reduced during the applicable periods shown.
D Total returns do not include the effect of the sales charges.
E Calculated based on average shares outstanding during the period.
F Fees and expenses of any underlying Fidelity Central Funds are not included in the Fund's expense ratio. The Fund indirectly bears its proportionate share of the expenses of any underlying Fidelity Central Funds.
G Amount does not include the portfolio activity of any underlying Fidelity Central Funds.
H Investment income per share reflects special dividends which amounted to $.19 per share. Excluding these special dividends, the ratio of net investment income (loss) to average net assets would have been 1.64%.
I For the period April 4, 2007 (commencement of sale of shares) to July 31, 2007.
J Expense ratios reflect operating expenses of the class. Expenses before reductions do not reflect amounts reimbursed by the investment adviser or reductions from brokerage service arrangements or reductions from other expense offset arrangements and do not represent the amount paid by the class during periods when reimbursements or reductions occur. Expense ratios before reductions for start-up periods may not be representative of longer-term operating periods. Expenses net of fee waivers reflect expenses after reimbursement by the investment adviser but prior to reductions from brokerage service arrangements or other expense offset arrangements. Expenses net of all reductions represent the net expenses paid by the class.
K Amount represents less than $.01 per share.
L Total distributions of $.63 per share is comprised of distributions from net investment income of $.333 and distributions from net realized gain of $.294 per share.
See accompanying notes which are an integral part of the financial statements.
Annual Report
Financial Highlights - Class T
Years ended July 31, | 2011 | 2010 | 2009 | 2008 | 2007 I |
Selected Per-Share Data | | | | | |
Net asset value, beginning of period | $ 8.41 | $ 8.21 | $ 10.62 | $ 15.70 | $ 17.46 |
Income from Investment Operations | | | | | |
Net investment income (loss) E | .31 H | .15 | .17 | .17 | .10 |
Net realized and unrealized gain (loss) | 1.04 | .23 | (2.58) | (3.48) | (1.87) |
Total from investment operations | 1.35 | .38 | (2.41) | (3.31) | (1.77) |
Distributions from net investment income | (.31) | (.06) | - | (.28) | - |
Distributions from net realized gain | (.29) | (.12) | - | (1.50) | - |
Total distributions | (.60) | (.18) | - | (1.78) | - |
Redemption fees added to paid in capital E | - K | - K | - K | .01 | .01 |
Net asset value, end of period | $ 9.16 | $ 8.41 | $ 8.21 | $ 10.62 | $ 15.70 |
Total Return B,C,D | 16.54% | 4.68% | (22.69)% | (23.39)% | (10.08)% |
Ratios to Average Net Assets F,J | | | | | |
Expenses before reductions | 1.69% | 1.70% | 1.71% | 1.64% | 1.61% A |
Expenses net of fee waivers, if any | 1.69% | 1.70% | 1.71% | 1.64% | 1.61% A |
Expenses net of all reductions | 1.63% | 1.65% | 1.68% | 1.60% | 1.51% A |
Net investment income (loss) | 3.41% H | 1.75% | 2.29% | 1.32% | 1.90% A |
Supplemental Data | | | | | |
Net assets, end of period (000 omitted) | $ 2,496 | $ 2,510 | $ 2,080 | $ 7,566 | $ 2,398 |
Portfolio turnover rate G | 131% | 95% | 55% | 63% | 144% |
A Annualized
B Total returns for periods of less than one year are not annualized.
C Total returns would have been lower if certain expenses had not been reduced during the applicable periods shown.
D Total returns do not include the effect of the sales charges.
E Calculated based on average shares outstanding during the period.
F Fees and expenses of any underlying Fidelity Central Funds are not included in the Fund's expense ratio. The Fund indirectly bears its proportionate share of the expenses of any underlying Fidelity Central Funds.
G Amount does not include the portfolio activity of any underlying Fidelity Central Funds.
H Investment income per share reflects special dividends which amounted to $.19 per share. Excluding these special dividends, the ratio of net investment income (loss) to average net assets would have been 1.38%.
I For the period April 4, 2007 (commencement of sale of shares) to July 31, 2007.
J Expense ratios reflect operating expenses of the class. Expenses before reductions do not reflect amounts reimbursed by the investment adviser or reductions from brokerage service arrangements or reductions from other expense offset arrangements and do not represent the amount paid by the class during periods when reimbursements or reductions occur. Expense ratios before reductions for start-up periods may not be representative of longer-term operating periods. Expenses net of fee waivers reflect expenses after reimbursement by the investment adviser but prior to reductions from brokerage service arrangements or other expense offset arrangements. Expenses net of all reductions represent the net expenses paid by the class.
K Amount represents less than $.01 per share.
See accompanying notes which are an integral part of the financial statements.
Annual Report
Financial Highlights - Class B
Years ended July 31, | 2011 | 2010 | 2009 | 2008 | 2007 I |
Selected Per-Share Data | | | | | |
Net asset value, beginning of period | $ 8.32 | $ 8.14 | $ 10.58 | $ 15.67 | $ 17.46 |
Income from Investment Operations | | | | | |
Net investment income (loss) E | .26 H | .11 | .13 | .11 | .07 |
Net realized and unrealized gain (loss) | 1.03 | .23 | (2.57) | (3.48) | (1.87) |
Total from investment operations | 1.29 | .34 | (2.44) | (3.37) | (1.80) |
Distributions from net investment income | (.27) | (.04) | - | (.23) | - |
Distributions from net realized gain | (.29) | (.12) | - | (1.50) | - |
Total distributions | (.56) | (.16) | - | (1.73) | - |
Redemption fees added to paid in capital E | - K | - K | - K | .01 | .01 |
Net asset value, end of period | $ 9.05 | $ 8.32 | $ 8.14 | $ 10.58 | $ 15.67 |
Total Return B,C,D | 15.90% | 4.20% | (23.06)% | (23.80)% | (10.25)% |
Ratios to Average Net Assets F,J | | | | | |
Expenses before reductions | 2.17% | 2.19% | 2.19% | 2.14% | 2.11% A |
Expenses net of fee waivers, if any | 2.17% | 2.19% | 2.19% | 2.14% | 2.11% A |
Expenses net of all reductions | 2.11% | 2.14% | 2.17% | 2.11% | 2.01% A |
Net investment income (loss) | 2.92% H | 1.26% | 1.81% | .82% | 1.38% A |
Supplemental Data | | | | | |
Net assets, end of period (000 omitted) | $ 570 | $ 629 | $ 606 | $ 930 | $ 1,158 |
Portfolio turnover rate G | 131% | 95% | 55% | 63% | 144% |
A Annualized
B Total returns for periods of less than one year are not annualized.
C Total returns would have been lower if certain expenses had not been reduced during the applicable periods shown.
D Total returns do not include the effect of the contingent deferred sales charge.
E Calculated based on average shares outstanding during the period.
F Fees and expenses of any underlying Fidelity Central Funds are not included in the Fund's expense ratio. The Fund indirectly bears its proportionate share of the expenses of any underlying Fidelity Central Funds.
G Amount does not include the portfolio activity of any underlying Fidelity Central Funds.
H Investment income per share reflects special dividends which amounted to $.18 per share. Excluding these special dividends, the ratio of net investment income (loss) to average net assets would have been .90%.
I For the period April 4, 2007 (commencement of sale of shares) to July 31, 2007.
J Expense ratios reflect operating expenses of the class. Expenses before reductions do not reflect amounts reimbursed by the investment adviser or reductions from brokerage service arrangements or reductions from other expense offset arrangements and do not represent the amount paid by the class during periods when reimbursements or reductions occur. Expense ratios before reductions for start-up periods may not be representative of longer-term operating periods. Expenses net of fee waivers reflect expenses after reimbursement by the investment adviser but prior to reductions from brokerage service arrangements or other expense offset arrangements. Expenses net of all reductions represent the net expenses paid by the class.
K Amount represents less than $.01 per share.
See accompanying notes which are an integral part of the financial statements.
Annual Report
Financial Highlights - Class C
Years ended July 31, | 2011 | 2010 | 2009 | 2008 | 2007 I |
Selected Per-Share Data | | | | | |
Net asset value, beginning of period | $ 8.30 | $ 8.13 | $ 10.57 | $ 15.67 | $ 17.46 |
Income from Investment Operations | | | | | |
Net investment income (loss) E | .26 H | .11 | .13 | .11 | .07 |
Net realized and unrealized gain (loss) | 1.04 | .22 | (2.57) | (3.48) | (1.87) |
Total from investment operations | 1.30 | .33 | (2.44) | (3.37) | (1.80) |
Distributions from net investment income | (.28) | (.04) | - | (.24) | - |
Distributions from net realized gain | (.29) | (.12) | - | (1.50) | - |
Total distributions | (.57) | (.16) | - | (1.74) | - |
Redemption fees added to paid in capital E | - K | - K | - K | .01 | .01 |
Net asset value, end of period | $ 9.03 | $ 8.30 | $ 8.13 | $ 10.57 | $ 15.67 |
Total Return B,C,D | 16.07% | 4.10% | (23.08)% | (23.78)% | (10.25)% |
Ratios to Average Net Assets F,J | | | | | |
Expenses before reductions | 2.17% | 2.18% | 2.19% | 2.14% | 2.10% A |
Expenses net of fee waivers, if any | 2.17% | 2.18% | 2.19% | 2.14% | 2.10% A |
Expenses net of all reductions | 2.11% | 2.14% | 2.17% | 2.11% | 2.00% A |
Net investment income (loss) | 2.92% H | 1.27% | 1.81% | .82% | 1.35% A |
Supplemental Data | | | | | |
Net assets, end of period (000 omitted) | $ 3,208 | $ 3,201 | $ 2,496 | $ 3,477 | $ 2,629 |
Portfolio turnover rate G | 131% | 95% | 55% | 63% | 144% |
A Annualized
B Total returns for periods of less than one year are not annualized.
C Total returns would have been lower if certain expenses had not been reduced during the applicable periods shown.
D Total returns do not include the effect of the contingent deferred sales charge.
E Calculated based on average shares outstanding during the period.
F Fees and expenses of any underlying Fidelity Central Funds are not included in the Fund's expense ratio. The Fund indirectly bears its proportionate share of the expenses of any underlying Fidelity Central Funds.
G Amount does not include the portfolio activity of any underlying Fidelity Central Funds.
H Investment income per share reflects special dividends which amounted to $.18 per share. Excluding these special dividends, the ratio of net investment income (loss) to average net assets would have been .89%.
I For the period April 4, 2007 (commencement of sale of shares) to July 31, 2007.
J Expense ratios reflect operating expenses of the class. Expenses before reductions do not reflect amounts reimbursed by the investment adviser or reductions from brokerage service arrangements or reductions from other expense offset arrangements and do not represent the amount paid by the class during periods when reimbursements or reductions occur. Expense ratios before reductions for start-up periods may not be representative of longer-term operating periods. Expenses net of fee waivers reflect expenses after reimbursement by the investment adviser but prior to reductions from brokerage service arrangements or other expense offset arrangements. Expenses net of all reductions represent the net expenses paid by the class.
K Amount represents less than $.01 per share.
See accompanying notes which are an integral part of the financial statements.
Annual Report
Financial Highlights - International Real Estate
Years ended July 31, | 2011 | 2010 | 2009 | 2008 | 2007 |
Selected Per-Share Data | | | | | |
Net asset value, beginning of period | $ 8.53 | $ 8.29 | $ 10.68 | $ 15.73 | $ 14.69 |
Income from Investment Operations | | | | | |
Net investment income (loss) B | .36 E | .19 | .20 | .25 | .31 |
Net realized and unrealized gain (loss) | 1.06 | .25 | (2.59) | (3.50) | 2.35 |
Total from investment operations | 1.42 | .44 | (2.39) | (3.25) | 2.66 |
Distributions from net investment income | (.35) | (.08) | - | (.31) | (.22) |
Distributions from net realized gain | (.29) | (.12) | - | (1.50) | (1.42) |
Total distributions | (.65) H | (.20) | - | (1.81) | (1.64) |
Redemption fees added to paid in capital B | - G | - G | - G | .01 | .02 |
Net asset value, end of period | $ 9.30 | $ 8.53 | $ 8.29 | $ 10.68 | $ 15.73 |
Total Return A | 17.15% | 5.29% | (22.38)% | (22.97)% | 19.01% |
Ratios to Average Net Assets C,F | | | | | |
Expenses before reductions | 1.17% | 1.19% | 1.19% | 1.11% | 1.07% |
Expenses net of fee waivers, if any | 1.17% | 1.19% | 1.19% | 1.10% | 1.06% |
Expenses net of all reductions | 1.11% | 1.14% | 1.16% | 1.07% | .96% |
Net investment income (loss) | 3.92% E | 2.27% | 2.81% | 1.86% | 1.86% |
Supplemental Data | | | | | |
Net assets, end of period (000 omitted) | $ 322,045 | $ 318,032 | $ 336,126 | $ 572,985 | $ 1,032,138 |
Portfolio turnover rate D | 131% | 95% | 55% | 63% | 144% |
A Total returns would have been lower if certain expenses had not been reduced during the applicable periods shown.
B Calculated based on average shares outstanding during the period.
C Fees and expenses of any underlying Fidelity Central Funds are not included in the Fund's expense ratio. The Fund indirectly bears its proportionate share of the expenses of any underlying Fidelity Central Funds.
D Amount does not include the portfolio activity of any underlying Fidelity Central Funds.
E Investment income per share reflects special dividends which amounted to $.19 per share. Excluding these special dividends, the ratio of net investment income (loss) to average net assets would have been 1.90%.
F Expense ratios reflect operating expenses of the class. Expenses before reductions do not reflect amounts reimbursed by the investment adviser or reductions from brokerage service arrangements or reductions from other expense offset arrangements and do not represent the amount paid by the class during periods when reimbursements or reductions occur. Expenses net of fee waivers reflect expenses after reimbursement by the investment adviser but prior to reductions from brokerage service arrangements or other expense offset arrangements. Expenses net of all reductions represent the net expenses paid by the class.
G Amount represents less than $.01 per share.
H Total distributions of $.65 per share is comprised of distributions from net investment income of $.354 and distributions from net realized gain of $.294 per share.
See accompanying notes which are an integral part of the financial statements.
Annual Report
Financial Highlights - Institutional Class
Years ended July 31, | 2011 | 2010 | 2009 | 2008 | 2007 H |
Selected Per-Share Data | | | | | |
Net asset value, beginning of period | $ 8.51 | $ 8.28 | $ 10.66 | $ 15.73 | $ 17.46 |
Income from Investment Operations | | | | | |
Net investment income (loss) D | .36 G | .19 | .20 | .24 | .12 |
Net realized and unrealized gain (loss) | 1.06 | .24 | (2.58) | (3.49) | (1.86) |
Total from investment operations | 1.42 | .43 | (2.38) | (3.25) | (1.74) |
Distributions from net investment income | (.35) | (.08) | - | (.33) | - |
Distributions from net realized gain | (.29) | (.12) | - | (1.50) | - |
Total distributions | (.65) K | (.20) | - | (1.83) | - |
Redemption fees added to paid in capital D | - J | - J | - J | .01 | .01 |
Net asset value, end of period | $ 9.28 | $ 8.51 | $ 8.28 | $ 10.66 | $ 15.73 |
Total Return B,C | 17.18% | 5.18% | (22.33)% | (22.98)% | (9.91)% |
Ratios to Average Net Assets E,I | | | | | |
Expenses before reductions | 1.17% | 1.18% | 1.19% | 1.13% | 1.08% A |
Expenses net of fee waivers, if any | 1.17% | 1.18% | 1.19% | 1.13% | 1.08% A |
Expenses net of all reductions | 1.11% | 1.14% | 1.17% | 1.10% | .97% A |
Net investment income (loss) | 3.92% G | 2.27% | 2.81% | 1.83% | 2.27% A |
Supplemental Data | | | | | |
Net assets, end of period (000 omitted) | $ 1,785 | $ 1,425 | $ 1,600 | $ 3,289 | $ 2,477 |
Portfolio turnover rate F | 131% | 95% | 55% | 63% | 144% |
A Annualized
B Total returns for periods of less than one year are not annualized.
C Total returns would have been lower if certain expenses had not been reduced during the applicable periods shown.
D Calculated based on average shares outstanding during the period.
E Fees and expenses of any underlying Fidelity Central Funds are not included in the Fund's expense ratio. The Fund indirectly bears its proportionate share of the expenses of any underlying Fidelity Central Funds.
F Amount does not include the portfolio activity of any underlying Fidelity Central Funds.
G Investment income per share reflects special dividends which amounted to $.19 per share. Excluding these special dividends, the ratio of net investment income (loss) to average net assets would have been 1.90%.
H For the period April 4, 2007 (commencement of sale of shares) to July 31, 2007.
I Expense ratios reflect operating expenses of the class. Expenses before reductions do not reflect amounts reimbursed by the investment adviser or reductions from brokerage service arrangements or reductions from other expense offset arrangements and do not represent the amount paid by the class during periods when reimbursements or reductions occur. Expense ratios before reductions for start-up periods may not be representative of longer-term operating periods. Expenses net of fee waivers reflect expenses after reimbursement by the investment adviser but prior to reductions from brokerage service arrangements or other expense offset arrangements. Expenses net of all reductions represent the net expenses paid by the class.
J Amount represents less than $.01 per share.
K Total distributions of $.65 per share is comprised of distributions from net investment income of $.354 and distributions from net realized gain of $.294 per share.
See accompanying notes which are an integral part of the financial statements.
Annual Report
Notes to Financial Statements
For the period ended July 31, 2011
1. Organization.
Fidelity International Real Estate Fund (the Fund) is a non-diversified fund of Fidelity Securities Fund (the Trust) and is authorized to issue an unlimited number of shares. The Trust is registered under the Investment Company Act of 1940, as amended (the 1940 Act), as an open-end management investment company organized as a Massachusetts business trust. The Fund offers Class A, Class T, Class C, International Real Estate and Institutional Class shares, each of which, along with Class B shares, has equal rights as to assets and voting privileges. Effective after the close of business on September 1, 2010, Class B shares were closed to new accounts and additional purchases, except for exchanges and reinvestments, by existing shareholders. Each class has exclusive voting rights with respect to matters that affect that class. Class B shares will automatically convert to Class A shares after a holding period of seven years from the initial date of purchase. Investment income, realized and unrealized capital gains and losses, the common expenses of the Fund, and certain fund-level expense reductions, if any, are allocated on a pro-rata basis to each class based on the relative net assets of each class to the total net assets of the Fund. Each class differs with respect to transfer agent and distribution and service plan fees incurred. Certain expense reductions may also differ by class.
2. Investments in Fidelity Central Funds.
The Fund invests in Fidelity Central Funds, which are open-end investment companies available only to other investment companies and accounts managed by Fidelity Management & Research Company (FMR) and its affiliates. The Fund's Schedule of Investments lists each of the Fidelity Central Funds held as of period end, if any, as an investment of the Fund, but does not include the underlying holdings of each Fidelity Central Fund. As an Investing Fund, the Fund indirectly bears its proportionate share of the expenses of the underlying Fidelity Central Funds.
The Money Market Central Funds seek preservation of capital and current income and are managed by Fidelity Investments Money Management, Inc. (FIMM), an affiliate of FMR.
A complete unaudited list of holdings for each Fidelity Central Fund is available upon request or at the Securities and Exchange Commission (the SEC) web site at www.sec.gov. In addition, the financial statements of the Fidelity Central Funds, which are not covered by the Fund's Report of Independent Registered Public Accounting Firm, are available on the SEC web site or upon request.
3. Significant Accounting Policies.
The financial statements have been prepared in conformity with accounting principles generally accepted in the United States of America (GAAP), which require management to make certain estimates and assumptions at the date of the financial statements. Actual results could differ from those estimates. Subsequent events, if any, through the
Annual Report
3. Significant Accounting Policies - continued
date that the financial statements were issued have been evaluated in the preparation of the financial statements. The following summarizes the significant accounting policies of the Fund:
Security Valuation. Investments are valued as of 4:00 p.m. Eastern time on the last calendar day of the period. The Fund uses independent pricing services approved by the Board of Trustees to value its investments. When current market prices or quotations are not readily available or reliable, valuations may be determined in good faith in accordance with procedures adopted by the Board of Trustees. Factors used in determining value may include market or security specific events. The frequency with which these procedures are used cannot be predicted and they may be utilized to a significant extent. The value used for net asset value (NAV) calculation under these procedures may differ from published prices for the same securities.
The Fund categorizes the inputs to valuation techniques used to value its investments into a disclosure hierarchy consisting of three levels as shown below:
Level 1 - quoted prices in active markets for identical investments
Level 2 - other significant observable inputs (including quoted prices for similar investments, interest rates, prepayment speeds, etc.)
Level 3 - unobservable inputs (including the Fund's own assumptions based on the best information available)
Changes in valuation techniques may result in transfers in or out of an assigned level within the disclosure hierarchy. Valuation techniques used to value the Fund's investments by major category are as follows:
Equity securities, including restricted securities, for which market quotations are readily available, are valued at the last reported sale price or official closing price as reported by an independent pricing service on the primary market or exchange on which they are traded and are categorized as Level 1 in the hierarchy. In the event there were no sales during the day or closing prices are not available, securities are valued at the last quoted bid price or may be valued using the last available price and are generally categorized as Level 2 in the hierarchy. For foreign equity securities, when significant market or security specific events arise, comparisons to the valuation of American Depositary Receipts (ADRs), futures contracts, Exchange-traded funds (ETFs) and certain indexes as well as quoted prices for similar securities are used and are categorized as Level 2 in the hierarchy in these circumstances. Utilizing these techniques may result in transfers between Level 1 and Level 2. For restricted equity securities and private placements where observable inputs are limited, assumptions about market activity and risk are used and are categorized as Level 3 in the hierarchy.
Annual Report
Notes to Financial Statements - continued
3. Significant Accounting Policies - continued
Security Valuation - continued
Investments in open-end mutual funds, including the Fidelity Central Funds, are valued at their closing net asset value each business day and are categorized as Level 1 in the hierarchy.
Foreign Currency. The Fund may use foreign currency contracts to facilitate transactions in foreign-denominated securities. Gains and losses from these transactions may arise from changes in the value of the foreign currency or if the counterparties do not perform under the contracts' terms.
Foreign-denominated assets, including investment securities, and liabilities are translated into U.S. dollars at the exchange rate at period end. Purchases and sales of investment securities, income and dividends received and expenses denominated in foreign currencies are translated into U.S. dollars at the exchange rate in effect on the transaction date.
The effects of exchange rate fluctuations on investments are included with the net realized and unrealized gain (loss) on investment securities. Other foreign currency transactions resulting in realized and unrealized gain (loss) are disclosed separately.
Investment Transactions and Income. For financial reporting purposes, the Fund's investment holdings and NAV include trades executed through the end of the last business day of the period. The NAV per share for processing shareholder transactions is calculated as of the close of business of the New York Stock Exchange (NYSE), normally 4:00 p.m. Eastern time and includes trades executed through the end of the prior business day. Gains and losses on securities sold are determined on the basis of identified cost. Dividend income is recorded on the ex-dividend date, except for certain dividends from foreign securities where the ex-dividend date may have passed, which are recorded as soon as the Fund is informed of the ex-dividend date. Non-cash dividends included in dividend income, if any, are recorded at the fair market value of the securities received. Distributions received on securities that represent a return of capital or capital gain are recorded as a reduction of cost of investments and/or as a realized gain. The Fund estimates the components of distributions received that may be considered return of capital distributions or capital gain distributions. Large, non-recurring dividends recognized by the Fund are presented separately on the Statement of Operations as "Special Dividends" and the impact of these dividends is presented in the Financial Highlights. Interest income and distributions from the Fidelity Central Funds are accrued as earned. Interest income includes coupon interest and amortization of premium and accretion of discount on debt securities. Investment income is recorded net of foreign taxes withheld where recovery of such taxes is uncertain.
Annual Report
3. Significant Accounting Policies - continued
Expenses. Expenses directly attributable to a fund are charged to that fund. Expenses attributable to more than one fund are allocated among the respective funds on the basis of relative net assets or other appropriate methods. Expense estimates are accrued in the period to which they relate and adjustments are made when actual amounts are known.
Income Tax Information and Distributions to Shareholders. Each year, the Fund intends to qualify as a regulated investment company, including distributing substantially all of its taxable income and realized gains under Subchapter M of the Internal Revenue Code and filing its U.S. federal tax return. As a result, no provision for income taxes is required. As of July 31, 2011, the Fund did not have any unrecognized tax benefits in the financial statements. A fund's federal tax return is subject to examination by the Internal Revenue Service (IRS) for a period of three years. Foreign taxes are provided for based on the Fund's understanding of the tax rules and rates that exist in the foreign markets in which it invests.
Distributions are declared and recorded on the ex-dividend date. Income dividends and capital gain distributions are declared separately for each class. Income and capital gain distributions are determined in accordance with income tax regulations, which may differ from GAAP.
Capital accounts within the financial statements are adjusted for permanent book-tax differences. These adjustments have no impact on net assets or the results of operations. Temporary book-tax differences will reverse in a subsequent period.
Book-tax differences are primarily due to foreign currency transactions, certain foreign taxes, passive foreign investment companies (PFIC), capital loss carryforwards, losses deferred due to wash sales and excise tax regulations.
The federal tax cost of investment securities and unrealized appreciation (depreciation) as of period end were as follows:
Gross unrealized appreciation | $ 11,905,181 |
Gross unrealized depreciation | (44,000,876) |
Net unrealized appreciation (depreciation) on securities and other investments | $ (32,095,695) |
| |
Tax Cost | $ 366,702,692 |
Annual Report
Notes to Financial Statements - continued
3. Significant Accounting Policies - continued
Income Tax Information and Distributions to Shareholders - continued
The tax-based components of distributable earnings as of period end were as follows:
Undistributed ordinary income | $ 11,180,651 |
Capital loss carryforward | $ (289,916,707) |
Net unrealized appreciation (depreciation) | $ (32,107,863) |
Under the recently enacted Regulated Investment Company Modernization Act of 2010 (the Act), the Fund will be permitted to carry forward capital losses incurred in taxable years beginning after December 22, 2010 for an unlimited period. However, any losses incurred during those future taxable years will be required to be utilized prior to any losses incurred in pre-enactment taxable years, which generally expire after eight years from when they are incurred. Additionally, post-enactment capital losses that are carried forward will retain their character as either short-term or long-term capital losses rather than being considered all short-term as under previous law. The Fund's first fiscal year end subject to the Act will be July 31, 2012.
The tax character of distributions paid was as follows:
| July 31, 2011 | July 31, 2010 |
Ordinary Income | $ 25,333,526 | $ 8,253,685 |
Short-Term Trading (Redemption) Fees. Shares held by investors in the Fund less than 90 days are subject to a redemption fee equal to 1.50% of the net asset value of shares redeemed. All redemption fees, which reduce the proceeds of the shareholder redemption, are retained by the Fund and accounted for as an addition to paid in capital.
New Accounting Pronouncement. In May 2011, the Financial Accounting Standards Board issued Accounting Standard Update No. 2011-04, Fair Value Measurement (Topic 820) - Amendments to Achieve Common Fair Value Measurement and Disclosure Requirements in U.S. GAAP and IFRSs. The update changes the wording used to describe the requirements in GAAP for measuring fair value and for disclosing information about fair value measurements. The update is effective during interim and annual periods beginning after December 15, 2011. Management is currently evaluating the impact of the update's adoption on the Fund's financial statement disclosures.
Annual Report
4. Purchases and Sales of Investments.
Purchases and sales of securities, other than short-term securities, aggregated $463,373,103 and $507,984,129, respectively.
5. Fees and Other Transactions with Affiliates.
Management Fee. FMR and its affiliates provide the Fund with investment management related services for which the Fund pays a monthly management fee. The management fee is the sum of an individual fund fee rate that is based on an annual rate of .45% of the Fund's average net assets and a group fee rate that averaged .26% during the period. The group fee rate is based upon the average net assets of all the mutual funds advised by FMR. The group fee rate decreases as assets under management increase and increases as assets under management decrease. For the period, the total annual management fee rate was .71% of the Fund's average net assets.
Distribution and Service Plan Fees. In accordance with Rule 12b-1 of the 1940 Act, the Fund has adopted separate Distribution and Service Plans for each class of shares. Certain classes pay Fidelity Distributors Corporation (FDC), an affiliate of FMR, separate Distribution and Service Fees, each of which is based on an annual percentage of each class' average net assets. In addition, FDC may pay financial intermediaries for selling shares of the Fund and providing shareholder support services. For the period, the Distribution and Service Fee rates, total fees and amounts retained by FDC were as follows:
| Distribution
Fee | Service
Fee | Total Fees | Retained
by FDC |
Class A | - % | .25% | $ 19,614 | $ 99 |
Class T | .25% | .25% | 13,882 | - |
Class B | .75% | .25% | 6,471 | 4,856 |
Class C | .75% | .25% | 36,435 | 7,855 |
| | | $ 76,402 | $ 12,810 |
Sales Load. FDC may receive a front-end sales charge of up to 5.75% for selling Class A shares, and 3.50% for selling Class T shares, some of which is paid to financial intermediaries for selling shares of the Fund. Depending on the holding period, FDC may receive contingent deferred sales charges levied on Class A, Class T, Class B, and Class C redemptions. The deferred sales charges range from 5% to 1% for Class B, 1% for Class C, 1.00% for certain purchases of Class A shares and .25% for certain purchases of Class T shares.
Annual Report
Notes to Financial Statements - continued
5. Fees and Other Transactions with Affiliates - continued
Sales Load - continued
For the period, sales charge amounts retained by FDC were as follows:
| Retained
by FDC |
Class A | $ 4,021 |
Class T | 1,537 |
Class B* | 1,006 |
Class C* | 54 |
| $ 6,618 |
* When Class B and Class C shares are initially sold, FDC pays commissions from its own resources to financial intermediaries through which the sales are made.
Transfer Agent Fees. Fidelity Investments Institutional Operations Company, Inc. (FIIOC), an affiliate of FMR, is the transfer, dividend disbursing and shareholder servicing agent for each class of the Fund. FIIOC receives account fees and asset-based fees that vary according to the account size and type of account of the shareholders of the respective classes of the Fund. FIIOC pays for typesetting, printing and mailing of shareholder reports, except proxy statements. For the period, transfer agent fees for each class were as follows:
| Amount | % of
Average
Net Assets |
Class A | $ 23,733 | .30 |
Class T | 8,852 | .32 |
Class B | 1,948 | .30 |
Class C | 11,087 | .30 |
International Real Estate | 1,037,153 | .30 |
Institutional Class | 4,985 | .30 |
| $ 1,087,758 | |
Accounting and Security Lending Fees. Fidelity Service Company, Inc. (FSC), an affiliate of FMR, maintains the Fund's accounting records. The accounting fee is based on the level of average net assets for the month. Under a separate contract, FSC administers the security lending program. The security lending fee is based on the number and duration of lending transactions.
Brokerage Commissions. The Fund placed a portion of its portfolio transactions with brokerage firms which are affiliates of the investment adviser. The commissions paid to these affiliated firms were $112 for the period.
Annual Report
5. Fees and Other Transactions with Affiliates - continued
Interfund Lending Program. Pursuant to an Exemptive Order issued by the SEC, the Fund, along with other registered investment companies having management contracts with FMR, may participate in an interfund lending program. This program provides an alternative credit facility allowing the funds to borrow from, or lend money to, other participating affiliated funds. At period end, there were no interfund loans outstanding. The Fund's activity in this program during the period for which loans were outstanding was as follows:
Borrower or Lender | Average Daily
Loan Balance | Weighted Average Interest Rate | Interest Expense |
Borrower | $ 5,492,000 | .44% | $ 134 |
6. Committed Line of Credit.
The Fund participates with other funds managed by FMR or an affiliate in a $4.0 billion credit facility (the "line of credit") to be utilized for temporary or emergency purposes to fund shareholder redemptions or for other short-term liquidity purposes. The Fund has agreed to pay commitment fees on its pro-rata portion of the line of credit, which amounted to $1,218 and is reflected in Miscellaneous expenses on the Statement of Operations. During the period, there were no borrowings on this line of credit.
7. Security Lending.
The Fund lends portfolio securities through a lending agent from time to time in order to earn additional income. The lending agent may loan securities to certain qualified borrowers, including Fidelity Capital Markets (FCM), a broker-dealer affiliated with the Fund. On the settlement date of the loan, the Fund receives collateral (in the form of U.S. Treasury obligations, letters of credit and/or cash) against the loaned securities and maintains collateral in an amount not less than 100% of the market value of the loaned securities during the period of the loan. The market value of the loaned securities is determined at the close of business of the Fund and any additional required collateral is delivered to the Fund on the next business day. If the borrower defaults on its obligation to return the securities loaned because of insolvency or other reasons, a fund could experience delays and costs in recovering the securities loaned or in gaining access to the collateral. Any cash collateral received is invested in the Fidelity Securities Lending Cash Central Fund. The value of loaned securities and cash collateral at period end are disclosed on the Fund's Statement of Assets and Liabilities. Security lending income represents the income earned on investing cash collateral, less rebates paid to borrowers and lending agent fees associated with the loan, plus any premium payments received for lending certain types of securities. Security lending income is presented in the Statement of Operations as a component of income from Fidelity Central Funds. Total security lending income during the period amounted to $168,341 including. During the period, there were no securities loaned to FCM.
Annual Report
Notes to Financial Statements - continued
8. Expense Reductions.
Many of the brokers with whom FMR places trades on behalf of the Fund provided services to the Fund in addition to trade execution. These services included payments of certain expenses on behalf of the Fund totaling $215,862 for the period.
9. Distributions to Shareholders.
Distributions to shareholders of each class were as follows:
Years ended July 31, | 2011 | 2010 |
From net investment income | | |
Class A | $ 287,564 | $ 58,598 |
Class T | 96,278 | 19,755 |
Class B | 19,520 | 3,225 |
Class C | 109,655 | 14,423 |
International Real Estate | 13,319,427 | 3,124,751 |
Institutional Class | 60,300 | 15,018 |
Total | $ 13,892,744 | $ 3,235,770 |
From net realized gain | | |
Class A | $ 250,090 | $ 101,910 |
Class T | 89,657 | 37,040 |
Class B | 21,506 | 9,214 |
Class C | 114,914 | 39,337 |
International Real Estate | 10,916,536 | 4,807,309 |
Institutional Class | 48,079 | 23,105 |
Total | $ 11,440,782 | $ 5,017,915 |
10. Share Transactions.
Transactions for each class of shares were as follows:
| Shares | Dollars |
Years ended July 31, | 2011 | 2010 | 2011 | 2010 |
Class A | | | | |
Shares sold | 213,763 | 365,681 | $ 1,964,473 | $ 3,120,303 |
Reinvestment of distributions | 50,966 | 15,947 | 451,020 | 134,591 |
Shares redeemed | (357,321) | (343,205) | (3,278,956) | (2,901,988) |
Net increase (decrease) | (92,592) | 38,423 | $ (863,463) | $ 352,906 |
Annual Report
10. Share Transactions - continued
| Shares | Dollars |
Years ended July 31, | 2011 | 2010 | 2011 | 2010 |
Class T | | | | |
Shares sold | 73,470 | 132,643 | $ 668,265 | $ 1,140,128 |
Reinvestment of distributions | 20,063 | 6,259 | 176,852 | 52,641 |
Shares redeemed | (119,466) | (93,841) | (1,082,947) | (767,585) |
Net increase (decrease) | (25,933) | 45,061 | $ (237,830) | $ 425,184 |
Class B | | | | |
Shares sold | 4,563 | 20,099 | $ 41,321 | $ 169,130 |
Reinvestment of distributions | 4,289 | 1,355 | 37,454 | 11,297 |
Shares redeemed | (21,555) | (20,259) | (195,000) | (169,049) |
Net increase (decrease) | (12,703) | 1,195 | $ (116,225) | $ 11,378 |
Class C | | | | |
Shares sold | 111,487 | 164,953 | $ 1,002,010 | $ 1,381,947 |
Reinvestment of distributions | 21,061 | 5,842 | 183,176 | 48,663 |
Shares redeemed | (162,778) | (92,347) | (1,467,063) | (761,918) |
Net increase (decrease) | (30,230) | 78,448 | $ (281,877) | $ 668,692 |
International Real Estate | | | | |
Shares sold | 7,219,780 | 9,224,310 | $ 67,747,351 | $ 79,406,931 |
Reinvestment of distributions | 2,559,870 | 875,447 | 22,802,021 | 7,441,303 |
Shares redeemed | (12,440,980) | (13,336,716) | (115,315,484) | (114,385,841) |
Net increase (decrease) | (2,661,330) | (3,236,959) | $ (24,766,112) | $ (27,537,607) |
Institutional Class | | | | |
Shares sold | 99,324 | 40,774 | $ 925,861 | $ 351,025 |
Reinvestment of distributions | 10,892 | 4,247 | 96,908 | 36,016 |
Shares redeemed | (85,350) | (70,819) | (787,527) | (608,371) |
Net increase (decrease) | 24,866 | (25,798) | $ 235,242 | $ (221,330) |
11. Other.
The Fund's organizational documents provide former and current trustees and officers with a limited indemnification against liabilities arising in connection with the performance of their duties to the Fund. In the normal course of business, the Fund may also enter into contracts that provide general indemnifications. The Fund's maximum exposure under these arrangements is unknown as this would be dependent on future claims that may be made against the Fund. The risk of material loss from such claims is considered remote.
At the end of the period, FMR or its affiliates were the owners of record of approximately 12% of the outstanding shares of the Fund.
Annual Report
Report of Independent Registered Public Accounting Firm
To the Trustees of Fidelity Securities Fund and the Shareholders of Fidelity International Real Estate Fund:
In our opinion, the accompanying statement of assets and liabilities, including the schedule of investments, and the related statements of operations and of changes in net assets and the financial highlights present fairly, in all material respects, the financial position of Fidelity International Real Estate Fund (a fund of Fidelity Securities Fund) at July 31, 2011, the results of its operations for the year then ended, the changes in its net assets for each of the two years in the period then ended and the financial highlights for each of the periods indicated, in conformity with accounting principles generally accepted in the United States of America. These financial statements and financial highlights (hereafter referred to as "financial statements") are the responsibility of the Fidelity International Real Estate Fund's management. Our responsibility is to express an opinion on these financial statements based on our audits. We conducted our audits of these financial statements in accordance with the standards of the Public Company Accounting Oversight Board (United States). Those standards require that we plan and perform the audit to obtain reasonable assurance about whether the financial statements are free of material misstatement. An audit includes examining, on a test basis, evidence supporting the amounts and disclosures in the financial statements, assessing the accounting principles used and significant estimates made by management, and evaluating the overall financial statement presentation. We believe that our audits, which included confirmation of securities at July 31, 2011 by correspondence with the custodian and brokers, provide a reasonable basis for our opinion.
/s/ PricewaterhouseCoopers LLP
PricewaterhouseCoopers LLP
Boston, Massachusetts
September 13, 2011
Annual Report
The Trustees, Members of the Advisory Board, and executive officers of the trust and fund, as applicable, are listed below. The Board of Trustees governs the fund and is responsible for protecting the interests of shareholders. The Trustees are experienced executives who meet periodically throughout the year to oversee the fund's activities, review contractual arrangements with companies that provide services to the fund, oversee management of the risks associated with such activities and contractual arrangements, and review the fund's performance. Except for James C. Curvey, each of the Trustees oversees 221 funds advised by FMR or an affiliate. Mr. Curvey oversees 419 funds advised by FMR or an affiliate.
The Trustees hold office without limit in time except that (a) any Trustee may resign; (b) any Trustee may be removed by written instrument, signed by at least two-thirds of the number of Trustees prior to such removal; (c) any Trustee who requests to be retired or who has become incapacitated by illness or injury may be retired by written instrument signed by a majority of the other Trustees; and (d) any Trustee may be removed at any special meeting of shareholders by a two-thirds vote of the outstanding voting securities of the trust. Each Trustee who is not an interested person (as defined in the 1940 Act) (Independent Trustee), shall retire not later than the last day of the calendar year in which his or her 75th birthday occurs. The Independent Trustees may waive this mandatory retirement age policy with respect to individual Trustees. The executive officers and Advisory Board Members hold office without limit in time, except that any officer and Advisory Board Member may resign or may be removed by a vote of a majority of the Trustees at any regular meeting or any special meeting of the Trustees. Except as indicated, each individual has held the office shown or other offices in the same company for the past five years.
Experience, Skills, Attributes, and Qualifications of the Fund's Trustees. The Governance and Nominating Committee has adopted a statement of policy that describes the experience, qualifications, attributes, and skills that are necessary and desirable for potential Independent Trustee candidates (Statement of Policy). The Board believes that each Trustee satisfied at the time he or she was initially elected or appointed a Trustee, and continues to satisfy, the standards contemplated by the Statement of Policy. The Governance and Nominating Committee also engages professional search firms to help identify potential Independent Trustee candidates who have the experience, qualifications, attributes, and skills consistent with the Statement of Policy. From time to time, additional criteria based on the composition and skills of the current Independent Trustees, as well as experience or skills that may be appropriate in light of future changes to board composition, business conditions, and regulatory or other developments, have also been considered by the professional search firms and the Governance and Nominating Committee. In addition, the Board takes into account the Trustees' commitment and participation in Board and committee meetings, as well as their leadership of standing and ad hoc committees throughout their tenure.
In determining that a particular Trustee was and continues to be qualified to serve as a Trustee, the Board has considered a variety of criteria, none of which, in isolation, was controlling. The Board believes that, collectively, the Trustees have balanced and diverse experience, qualifications, attributes, and skills, which allow the Board to operate effectively in governing the fund and protecting the interests of shareholders. Information about the specific experience, skills, attributes, and qualifications of each Trustee, which in each case led to the Board's conclusion that the Trustee should serve (or continue to serve) as a trustee of the fund, is provided below.
Annual Report
Board Structure and Oversight Function. James C. Curvey is an interested person (as defined in the 1940 Act) and currently serves as Acting Chairman. The Trustees have determined that an interested Chairman is appropriate and benefits shareholders because an interested Chairman has a personal and professional stake in the quality and continuity of services provided to the fund. Independent Trustees exercise their informed business judgment to appoint an individual of their choosing to serve as Chairman, regardless of whether the Trustee happens to be independent or a member of management. The Independent Trustees have determined that they can act independently and effectively without having an Independent Trustee serve as Chairman and that a key structural component for assuring that they are in a position to do so is for the Independent Trustees to constitute a substantial majority for the Board. The Independent Trustees also regularly meet in executive session. Ned C. Lautenbach serves as Chairman of the Independent Trustees and as such (i) acts as a liaison between the Independent Trustees and management with respect to matters important to the Independent Trustees and (ii) with management prepares agendas for Board meetings.
Fidelity funds are overseen by different Boards of Trustees. The fund's Board oversees Fidelity's equity and high income funds and another Board oversees Fidelity's investment-grade bond, money market, and asset allocation funds. The asset allocation funds may invest in Fidelity funds overseen by the fund's Board. The use of separate Boards, each with its own committee structure, allows the Trustees of each group of Fidelity funds to focus on the unique issues of the funds they oversee, including common research, investment, and operational issues. On occasion, the separate Boards establish joint committees to address issues of overlapping consequences for the Fidelity funds overseen by each Board.
The Trustees operate using a system of committees to facilitate the timely and efficient consideration of all matters of importance to the Trustees, the fund, and fund shareholders and to facilitate compliance with legal and regulatory requirements and oversight of the fund's activities and associated risks. The Board, acting through its committees, has charged FMR and its affiliates with (i) identifying events or circumstances the occurrence of which could have demonstrably adverse effects on the fund's business and/or reputation; (ii) implementing processes and controls to lessen the possibility that such events or circumstances occur or to mitigate the effects of such events or circumstances if they do occur; and (iii) creating and maintaining a system designed to evaluate continuously business and market conditions in order to facilitate the identification and implementation processes described in (i) and (ii) above. Because the day-to-day operations and activities of the fund are carried out by or through FMR, its affiliates and other service providers, the fund's exposure to risks is mitigated but not eliminated by the processes overseen by the Trustees. While each of the Board's committees has responsibility for overseeing different aspects of the fund's activities, oversight is exercised primarily through the Operations, Audit, and Compliance Committees. Appropriate personnel, including but not limited to the fund's Chief Compliance Officer (CCO), FMR's internal auditor, the independent accountants, the fund's Treasurer and portfolio management personnel, make periodic reports to the Board's committees, as appropriate. The responsibilities of each committee, including their oversight responsibilities, are described further under "Standing Committees of the Fund's Trustees."
Annual Report
Trustees and Officers - continued
The fund's Statement of Additional Information (SAI) includes more information about the Trustees. To request a free copy, call Fidelity at 1-877-208-0098.
Interested Trustees*:
Correspondence intended for each Trustee who is an interested person may be sent to Fidelity Investments, 82 Devonshire Street, Boston, Massachusetts 02109.
Name, Age; Principal Occupations and Other Relevant Experience+ |
James C. Curvey (76) |
| Year of Election or Appointment: 2007 Mr. Curvey is Trustee and Acting Chairman of the Board of Trustees of certain Trusts. Mr. Curvey also serves as Trustee (2007-present) of other investment companies advised by FMR. Mr. Curvey is a Director of Fidelity Investments Money Management, Inc. (2009-present), Director of Fidelity Research & Analysis Co. (2009-present) and Director of FMR and FMR Co., Inc. (2007-present). Mr. Curvey is also Vice Chairman (2007-present) and Director of FMR LLC. In addition, Mr. Curvey serves as an Overseer for the Boston Symphony Orchestra and a member of the Trustees of Villanova University. Previously, Mr. Curvey was the Vice Chairman (2006-2007) and Director (2000-2007) of FMR Corp. |
Ronald P. O'Hanley (54) |
| Year of Election or Appointment: 2011 Mr. O'Hanley is Director of FMR Co., Inc. (2010-present), Director of Fidelity Investments Money Management, Inc. (2010-present), Director of Fidelity Research & Analysis Company (2010-present), President of Fidelity Asset Management and Corporate Services and a member of Fidelity's Executive Committee (2010-present). Previously, Mr. O'Hanley served as President and Chief Executive Officer of BNY Mellon Asset Management (2007-2010). Mr. O'Hanley also served as Vice Chairman of Bank New York Mellon Corp. and a member of that firm's Executive Committee. Prior to the 2007 merger of The Bank of New York and Mellon Financial Corporation, he was Vice Chairman of Mellon Financial Corporation and President and Chief Executive Officer of Mellon Asset Management. He joined Mellon in February 1997. Mr. O'Hanley currently serves as Chairman of the Boston Public Library Foundation Board of Directors and sits on the Board of Directors of Beth Israel Deaconess Medical Center, the Board of Trustees of the Marine Biological Laboratory and the Advisory Board of the Maxwell School of Citizenship and Public Administration at Syracuse University. Mr. O'Hanley also chairs the Council on Asset Management for the Financial Services Roundtable and is a member of the Board of Directors of Institutional Investor's U.S. Institute. |
* Trustees have been determined to be "Interested Trustees" by virtue of, among other things, their affiliation with the trust or various entities under common control with FMR.
+ The information above includes each Trustee's principal occupation during the last five years and other information relating to the experience, attributes, and skills relevant to each Trustee's qualifications to serve as a Trustee, which led to the conclusion that each Trustee should serve as a Trustee for the fund.
Annual Report
Trustees and Officers - continued
Independent Trustees:
Correspondence intended for each Independent Trustee (that is, the Trustees other than the Interested Trustees) may be sent to Fidelity Investments, P.O. Box 55235, Boston, Massachusetts 02205-5235.
Name, Age; Principal Occupations and Other Relevant Experience+ |
Dennis J. Dirks (63) |
| Year of Election or Appointment: 2005 Prior to his retirement in May 2003, Mr. Dirks was Chief Operating Officer and a member of the Board of The Depository Trust & Clearing Corporation (DTCC). He also served as President, Chief Operating Officer, and Board member of The Depository Trust Company (DTC) and President and Board member of the National Securities Clearing Corporation (NSCC). In addition, Mr. Dirks served as Chief Executive Officer and Board member of the Government Securities Clearing Corporation, Chief Executive Officer and Board member of the Mortgage-Backed Securities Clearing Corporation, as a Trustee and a member of the Finance Committee of Manhattan College (2005-2008), and as a Trustee and a member of the Finance Committee of AHRC of Nassau County (2006-2008). Mr. Dirks is a member of the Independent Directors Council (IDC) Governing Council (2010-Present) and Board of Directors for The Brookville Center for Children's Services, Inc. (2009-present). |
Alan J. Lacy (57) |
| Year of Election or Appointment: 2008 Mr. Lacy serves as Senior Adviser (2007-present) of Oak Hill Capital Partners, L.P. (private equity). Mr. Lacy also served as Chief Executive Officer (2000-2005) and Vice Chairman (2005-2006) of Sears Holdings Corporation and Sears, Roebuck and Co. (retail). In addition, Mr. Lacy serves as a member of the Board of Directors of Dave & Buster's, Inc. (restaurant and entertainment complexes, 2010-present), The Hillman Companies, Inc. (hardware wholesalers, 2010-present), and Bristol-Myers Squibb Company (global pharmaceuticals, 2007-present). Mr. Lacy is a member of the Board of Trustees of The National Parks Conservation Association (2006-Present). Previously, Mr. Lacy served as Chairman of the Board of Trustees of the National Parks Conservation Association (2008-2011) and as a member of the Board of Directors for the Western Union Company (global money transfer, 2006-2011). |
Ned C. Lautenbach (67) |
| Year of Election or Appointment: 2000 Mr. Lautenbach is Chairman of the Independent Trustees of the Equity and High Income Funds (2006-present). Mr. Lautenbach currently serves as the Lead Director of the Eaton Corporation Board of Directors (diversified industrial, 1997-present). Mr. Lautenbach is also a member of the Board of Directors of the Philharmonic Center for the Arts in Naples, Florida (1999-present); a member of the Board of Trustees of Fairfield University (2005-present); and a member of the Council on Foreign Relations (1994-present). Previously, Mr. Lautenbach was a Partner/Advisory Partner at Clayton, Dubilier & Rice, LLC (private equity investment, 1998-2010), as well as a Director of Sony Corporation (2006-2007). |
Joseph Mauriello (66) |
| Year of Election or Appointment: 2008 Prior to his retirement in January 2006, Mr. Mauriello served in numerous senior management positions including Deputy Chairman and Chief Operating Officer (2004-2005), and Vice Chairman of Financial Services (2002-2004) of KPMG LLP US (professional services, 1965-2005). Mr. Mauriello currently serves as a member of the Board of Directors of XL Group plc. (global insurance and re-insurance, 2006-present) and of Arcadia Resources Inc. (health care services and products, 2007-present). Previously, Mr. Mauriello served as a Director of the Hamilton Funds of the Bank of New York (2006-2007). |
Robert W. Selander (60) |
| Year of Election or Appointment: 2011 Previously, Mr. Selander served as a Member of the Advisory Board of Fidelity's Equity and High Income Funds (2011), Executive Vice Chairman (2010), Chief Executive Officer (2009-2010), and President and Chief Executive Officer (1997-2009) of Mastercard, Inc. |
Cornelia M. Small (67) |
| Year of Election or Appointment: 2005 Ms. Small is a member of the Board of Directors of the Teagle Foundation (2009-present). Ms. Small is also a member of the Investment Committee, and Chair (2008-present) and a member of the Board of Trustees of Smith College. In addition, Ms. Small serves on the Investment Committee of the Berkshire Taconic Community Foundation (2008-present). Previously, Ms. Small served as Chairperson of the Investment Committee (2002-2008) of Smith College. In addition, Ms. Small served as Chief Investment Officer, Director of Global Equity Investments, and a member of the Board of Directors of Scudder, Stevens & Clark and Scudder Kemper Investments. |
William S. Stavropoulos (72) |
| Year of Election or Appointment: 2002 Mr. Stavropoulos is Vice Chairman of the Independent Trustees of the Equity and High Income Funds (2006-present). Mr. Stavropoulos serves as President and Founder of the Michigan Baseball Foundation, the Great Lakes Loons (2007-present). Mr. Stavropoulos is Chairman Emeritus of the Board of Directors of The Dow Chemical Company, where he previously served in numerous senior management positions, including President, CEO (1995-2000; 2002-2004), Chairman of the Executive Committee (2000-2006), and as a member of the Board of Directors (1990-2006). Currently, Mr. Stavropoulos is Chairman of Univar (global distributor of commodity and specialty chemicals, 2010-present), a Director of Teradata Corporation (data warehousing and technology solutions, 2008-present), Chemical Financial Corporation, Maersk Inc. (industrial conglomerate), Tyco International, Inc. (multinational manufacturing and services, 2007-present), and a member of the Advisory Board for Metalmark Capital (private equity investment, 2005-present). Mr. Stavropoulos is a special advisor to Clayton, Dubilier & Rice, LLC (private equity investment). In addition, Mr. Stavropoulos is a member of the University of Notre Dame Advisory Council for the College of Science. |
David M. Thomas (62) |
| Year of Election or Appointment: 2008 Previously, Mr. Thomas served as Executive Chairman (2005-2006) and Chairman and Chief Executive Officer (2000-2005) of IMS Health, Inc. (pharmaceutical and healthcare information solutions). In addition, Mr. Thomas serves as a member of the Board of Directors of Fortune Brands, Inc. (consumer products), and Interpublic Group of Companies, Inc. (marketing communication, 2004-present). |
Michael E. Wiley (60) |
| Year of Election or Appointment: 2008 Mr. Wiley also serves as a Director of Asia Pacific Exploration Consolidated (international oil and gas exploration and production, 2008-present). Mr. Wiley serves as a Director of Tesoro Corporation (independent oil refiner and marketer, 2005-present), and a Director of Bill Barrett Corporation (exploration and production, 2005-present). In addition, Mr. Wiley also serves as a Director of Post Oak Bank (privately-held bank, 2004-present). Previously, Mr. Wiley served as a member of the Board of Trustees of the University of Tulsa (2000-2006; 2007-2010), as a Senior Energy Advisor of Katzenbach Partners, LLC (consulting, 2006-2007), as an Advisory Director of Riverstone Holdings (private investment), Chairman, President, and CEO of Baker Hughes, Inc. (oilfield services, 2000-2004), and as Director of Spinnaker Exploration Company (exploration and production, 2001-2005). |
Annual Report
+ The information above includes each Trustee's principal occupation during the last five years and other information relating to the experience, attributes, and skills relevant to each Trustee's qualifications to serve as a Trustee, which led to the conclusion that each Trustee should serve as a Trustee for the fund.
Advisory Board Members and Executive Officers:
Correspondence intended for each executive officer, Peter S. Lynch, and Edward C. Johnson 3d may be sent to Fidelity Investments, 82 Devonshire Street, Boston, Massachusetts 02109.
Name, Age; Principal Occupation |
Edward C. Johnson 3d (81) |
| Year of Election or Appointment: 2011 Member of the Advisory Board of Fidelity's Equity and High Income Funds. Mr. Johnson serves as Chief Executive Officer, Chairman, and a Director of FMR LLC, and also serves as Chairman and Director of FIL Limited. Previously, Mr. Johnson served as a Trustee and Chairman of the Board of certain Fidelity Trusts, Chairman and a Director of FMR, Chairman and a Director of FMR Co., Inc., and President of FMR LLC (2006-2007). |
Peter S. Lynch (67) |
| Year of Election or Appointment: 2003 Member of the Advisory Board of Fidelity's Equity and High Income Funds. Mr. Lynch is Vice Chairman and a Director of FMR and FMR Co., Inc. In addition, Mr. Lynch serves as a Trustee of Boston College and as the Chairman of the Inner-City Scholarship Fund. Previously, Mr. Lynch served on the Special Olympics International Board of Directors (1997-2006). |
Kenneth B. Robins (41) |
| Year of Election or Appointment: 2008 President and Treasurer of Fidelity's Equity and High Income Funds. Mr. Robins also serves as President and Treasurer (2010-present) and Assistant Treasurer (2009-present) of other Fidelity funds and is an employee of Fidelity Investments (2004-present). Previously, Mr. Robins served as Deputy Treasurer of the Fidelity funds (2005-2008) and Treasurer and Chief Financial Officer of The North Carolina Capital Management Trust: Cash and Term Portfolios (2006-2008). |
Brian B. Hogan (46) |
| Year of Election or Appointment: 2009 Vice President of Equity and High Income Funds. Mr. Hogan also serves as President of FMR's Equity Division (2009-present). Previously, Mr. Hogan served as Senior Vice President, Equity Research of FMR (2006-2009) and as a portfolio manager. |
Christopher S. Bartel (39) |
| Year of Election or Appointment: 2009 Vice President of Fidelity's Sector and Real Estate Equity Funds. Mr. Bartel also serves as Senior Vice President of Equity Research (2009-present). Previously, Mr. Bartel served as Managing Director of Research (2006-2009) and an analyst and portfolio manager (2000-2006). |
Scott C. Goebel (43) |
| Year of Election or Appointment: 2008 Secretary and Chief Legal Officer (CLO) of the Fidelity funds. Mr. Goebel also serves as Secretary of Fidelity Investments Money Management, Inc. (FIMM) (2010-present) and Fidelity Research and Analysis Company (FRAC) (2010-present); Secretary and CLO of The North Carolina Capital Management Trust: Cash and Term Portfolios (2008-present); General Counsel, Secretary, and Senior Vice President of FMR (2008-present) and FMR Co., Inc. (2008-present); employed by FMR LLC or an affiliate (2001-present); Chief Legal Officer of Fidelity Management & Research (Hong Kong) Limited (2008-present) and Assistant Secretary of Fidelity Management & Research (Japan) Inc. (2008-present), and Fidelity Management & Research (U.K.) Inc. (2008-present). Previously, Mr. Goebel served as Assistant Secretary of FIMM (2008-2010), FRAC (2008-2010), and the Funds (2007-2008) and as Vice President and Secretary of Fidelity Distributors Corporation (FDC) (2005-2007). |
William C. Coffey (42) |
| Year of Election or Appointment: 2009 Assistant Secretary of Fidelity's Equity and High Income Funds. Mr. Coffey also serves as Senior Vice President and Deputy General Counsel of FMR LLC (2010-present), and is an employee of Fidelity Investments. Previously, Mr. Coffey served as Vice President and Associate General Counsel of FMR LLC (2005-2009). |
Holly C. Laurent (57) |
| Year of Election or Appointment: 2008 Anti-Money Laundering (AML) Officer of the Fidelity funds. Ms. Laurent also serves as AML Officer of The North Carolina Capital Management Trust: Cash and Term Portfolios (2008-present) and is an employee of Fidelity Investments. Previously, Ms. Laurent was Senior Vice President and Head of Legal for Fidelity Business Services India Pvt. Ltd. (2006-2008), and Senior Vice President, Deputy General Counsel and Group Head for FMR LLC (2005-2006). |
Christine Reynolds (52) |
| Year of Election or Appointment: 2008 Chief Financial Officer of the Fidelity funds. Ms. Reynolds became President of Fidelity Pricing and Cash Management Services (FPCMS) in August 2008. Ms. Reynolds served as Chief Operating Officer of FPCMS (2007-2008). Previously, Ms. Reynolds served as President, Treasurer, and Anti-Money Laundering officer of the Fidelity funds (2004-2007). |
Kenneth A. Rathgeber (64) |
| Year of Election or Appointment: 2004 Chief Compliance Officer of Fidelity's Equity and High Income Funds. Mr. Rathgeber is Chief Compliance Officer of Fidelity Management & Research (Hong Kong) Limited (2008-present), Fidelity Management & Research (Japan) Inc. (2008-present), FMR (2005-present), FMR Co., Inc. (2005-present), Fidelity Management & Research (U.K.) Inc. (2005-present), Fidelity Research & Analysis Company (2005-present), Fidelity Investments Money Management, Inc. (2005-present), Pyramis Global Advisors, LLC (2005-present), and Strategic Advisers, Inc. (2005-present). |
Jeffrey S. Christian (49) |
| Year of Election or Appointment: 2009 Deputy Treasurer of the Fidelity funds. Mr. Christian is an employee of Fidelity Investments. Previously, Mr. Christian served as Chief Financial Officer (2008-2009) of certain Fidelity funds and Senior Vice President of Fidelity Pricing and Cash Management Services (FPCMS) (2004-2009). |
Bryan A. Mehrmann (50) |
| Year of Election or Appointment: 2005 Deputy Treasurer of the Fidelity funds. Mr. Mehrmann is an employee of Fidelity Investments. |
Adrien E. Deberghes (43) |
| Year of Election or Appointment: 2008 Deputy Treasurer of Fidelity's Equity and High Income Funds. Mr. Deberghes also serves as Assistant Treasurer of other Fidelity funds (2010-present) and is an employee of Fidelity Investments (2008-present). Previously, Mr. Deberghes served as Senior Vice President of Mutual Fund Administration at State Street Corporation (2007-2008), Senior Director of Mutual Fund Administration at Investors Bank & Trust (2005-2007), and Director of Finance for Dunkin' Brands (2000-2005). |
Stephanie J. Dorsey (42) |
| Year of Election or Appointment: 2010 Assistant Treasurer of Fidelity's Equity and High Income Funds. Ms. Dorsey also serves as Deputy Treasurer of other Fidelity funds (2008-present) and is an employee of Fidelity Investments (2008-present). Previously, Ms. Dorsey served as Treasurer (2004-2008) of the JPMorgan Mutual Funds and Vice President (2004-2008) of JPMorgan Chase Bank. |
John R. Hebble (53) |
| Year of Election or Appointment: 2009 Assistant Treasurer of Fidelity's Equity and High Income Funds. Mr. Hebble also serves as President (2011-present), Treasurer and Chief Financial Officer of The North Carolina Capital Management Trust: Cash and Term Portfolios (2008-present), President and Treasurer of other Fidelity funds (2008-present) and is an employee of Fidelity Investments. |
Gary W. Ryan (52) |
| Year of Election or Appointment: 2005 Assistant Treasurer of the Fidelity funds. Mr. Ryan is an employee of Fidelity Investments. Previously, Mr. Ryan served as Vice President of Fund Reporting in Fidelity Pricing and Cash Management Services (FPCMS) (1999-2005). |
Jonathan Davis (43) |
| Year of Election or Appointment: 2010 Assistant Treasurer of the Fidelity funds. Mr. Davis is an employee of Fidelity Investments. Previously, Mr. Davis served as Vice President and Associate General Counsel of FMR LLC (2003-2010). |
Annual Report
The Board of Trustees of Fidelity Advisor International Real Estate Fund voted to pay on September 12, 2011, to shareholders of record at the opening of business on September 9, 2011, a distribution of $.178 per share derived from capital gains realized from sales of portfolio securities, and a dividend of $.142 per share from net investment income.
Institutional Class designates 22% of the dividends distributed during the fiscal year as amounts which may be taken into account as a dividend for the purposes of the maximum rate under section 1(h)(11) of the Internal Revenue Code.
The amounts per share which represent income derived from sources within, and taxes paid to, foreign countries or possessions of the United States are as follows:
Pay Date | Income | Taxes |
09/09/10 | $.177 | $.0072 |
12/20/10 | $.089 | $.0095 |
12/31/10 | $.042 | $.0000 |
The fund will notify shareholders in January 2012 of amounts for use in preparing 2011 income tax returns.
Annual Report
Board Approval of Investment Advisory Contracts and Management Fees
Fidelity International Real Estate Fund
Each year, the Board of Trustees, including the Independent Trustees (together, the Board), votes on the renewal of the management contract and sub-advisory agreements (together, the Advisory Contracts) for the fund. The Board, assisted by the advice of fund counsel and Independent Trustees' counsel, requests and considers a broad range of information relevant to the renewal of the Advisory Contracts throughout the year.
The Board meets regularly and considers at each of its meetings factors that are relevant to its annual consideration of the renewal of the fund's Advisory Contracts, including the services and support provided to the fund and its shareholders. The Board has established various standing committees, each composed of Independent Trustees with varying backgrounds, to which the Board has assigned specific subject matter responsibilities in order to enhance effective decision-making by the Board. The Board, acting directly and through its Committees, requests and receives information concerning the annual consideration of the renewal of the fund's Advisory Contracts. The Board also meets as needed to consider matters specifically related to the Board's annual consideration of the renewal of Advisory Contracts. Members of the Board may also meet with trustees of other Fidelity funds through ad hoc joint committees to discuss certain matters relevant to the Fidelity funds.
At its July 2011 meeting, the Board of Trustees, including the Independent Trustees, unanimously determined to renew the fund's Advisory Contracts. In reaching its determination, the Board considered all factors it believed relevant, including (i) the nature, extent, and quality of the services to be provided to the fund and its shareholders (including the investment performance of the fund); (ii) the competitiveness of the fund's management fee and total expense ratio; (iii) the total costs of the services to be provided by and the profits to be realized by Fidelity from its relationship with the fund; (iv) the extent to which economies of scale would be realized as the fund grows; and (v) whether fee levels reflect these economies of scale, if any, for the benefit of fund shareholders.
In considering whether to renew the Advisory Contracts for the fund, the Board reached a determination, with the assistance of fund counsel and Independent Trustees' counsel and through the exercise of its business judgment, that the renewal of the Advisory Contracts is in the best interests of the fund and its shareholders and that the compensation payable under the Advisory Contracts is fair and reasonable. The Board's decision to renew the Advisory Contracts was not based on any single factor, but rather was based on a comprehensive consideration of all the information provided to the Board at its meetings throughout the year. The Board, in reaching its determination to renew the Advisory Contracts, is aware that shareholders in the fund have a broad range of investment choices available to them, including a wide choice among mutual funds offered by Fidelity's competitors, and that the fund's shareholders, who have the opportunity to review and weigh the disclosure provided by the fund in its prospectus and other public disclosures, have chosen to invest in this fund, managed by Fidelity.
Annual Report
Nature, Extent, and Quality of Services Provided. The Board considered the staffing within the investment adviser, FMR, and the sub-advisers (together, the Investment Advisers), including the backgrounds of the fund's investment personnel and the fund's investment objective and discipline. The Independent Trustees also had discussions with senior management of Fidelity's investment operations and investment groups. The Board considered the structure of the portfolio manager compensation program and whether this structure provides appropriate incentives to act in the best interests of the fund.
Resources Dedicated to Investment Management and Support Services. The Board and the Fund Oversight and Research Committees reviewed the general qualifications and capabilities of the Investment Advisers' investment staff, including its size, education, experience, and resources, as well as the Investment Advisers' approach to recruiting, training, managing, and compensating investment personnel. The Board also noted that FMR has devoted increased resources to non-U.S. offices. The Board noted that Fidelity's analysts have extensive resources, tools and capabilities which allow them to conduct sophisticated quantitative and fundamental analysis, as well as credit analysis of issuers, counterparties and enhancers. The Board also believes that Fidelity's investment professionals have sufficient access to global information and data so as to provide competitive investment results over time, and that those professionals also have access to sophisticated tools which permit them to assess portfolio construction and risk and performance attribution characteristics continuously, as well as to transmit new information and research conclusions rapidly around the world. Additionally, in their deliberations, the Board considered the Investment Advisers' trading capabilities and resources which are an integral part of the investment management process.
Shareholder and Administrative Services. The Board considered (i) the nature, extent, quality, and cost of advisory, administrative, and shareholder services performed by the Investment Advisers and their affiliates under the Advisory Contracts and under separate agreements covering transfer agency, pricing and bookkeeping, and securities lending services for the fund; (ii) the nature and extent of the investment adviser's supervision of third party service providers, principally custodians and subcustodians; and (iii) the resources devoted to, and the record of compliance with, the fund's compliance policies and procedures. The Board also reviewed the allocation of fund brokerage, including allocations to brokers affiliated with the Investment Advisers, the use of brokerage commissions to pay fund expenses, and the use of "soft" commission dollars to pay for research services.
The Board noted that the growth of fund assets over time across the complex allows Fidelity to reinvest in the development of services designed to enhance the value or convenience of the Fidelity funds as investment vehicles. These services include 24-hour access to account information and market information through telephone representatives and over the Internet, investor education materials and asset allocation tools, and the expanded availability of Fidelity Investor Centers, with 35 new branches opening since 2010.
Annual Report
Board Approval of Investment Advisory Contracts and
Management Fees - continued
Investment in a Large Fund Family. The Board considered the benefits to shareholders of investing in a Fidelity fund, including the benefits of investing in a fund that is part of a large family of funds offering a variety of investment disciplines and providing a large variety of mutual fund investor services. The Board noted that Fidelity had taken, or had made recommendations that resulted in the Fidelity funds taking, a number of actions over the previous year that benefited particular funds, including (i) continuing to dedicate additional resources to investment research and support of the senior management team that oversees asset management; (ii) rationalizing product lines through the mergers of six funds into other funds; (iii) continuing to migrate the Freedom Funds to dedicated lower cost underlying funds; (iv) obtaining shareholder approval to broaden the investment strategies for Fidelity Consumer Finance Portfolio, Fidelity Emerging Asia Fund, and Fidelity Environment and Alternative Energy Portfolio; (v) contractually agreeing to reduce the management fees and impose other expense limitations on Spartan® 500 Index Fund and U.S. Bond Index Fund in connection with launching new institutional classes of these funds; (vi) changing the name, primary and supplemental benchmarks, and investment policies of Fidelity Global Strategies Fund to support the fund's flexible investment mandate and global orientation; and (vii) reducing the transfer agency account fee rates on certain accounts.
Investment Performance. The Board considered whether the fund has operated in accordance with its investment objective, as well as its record of compliance with its investment restrictions. It also reviewed the fund's absolute investment performance for each class, as well as the fund's relative investment performance for each class measured over multiple periods against a broad-based securities market index. The Board noted that FMR does not believe that a meaningful peer group exists against which to compare the fund's performance. The following charts considered by the Board show, over the one-, three-, and five-year periods ended December 31, 2010, as available, the cumulative total returns of the retail class and Class C of the fund and the cumulative total returns of a broad-based securities market index ("benchmark"). The returns of the retail class and Class C show the performance of the highest and lowest performing classes, respectively (based on three-year performance).
Annual Report
Fidelity International Real Estate Fund

The Board noted that the investment performance of the fund was lower than its benchmark for all the periods shown. The Board considered that the variations in performance among the fund's classes reflect the variations in class expenses, which result in lower performance for higher expense classes. The Board discussed with FMR actions that have been taken by FMR to improve the fund's below-benchmark performance. The Board noted that this fund had underperformed in 2009 and discussed with FMR its disappointment with the continued underperformance of the fund. The Board also reviewed the fund's performance since inception as well as performance in the current year. The Board noted that there was a change in the fund's portfolio manager in April 2010. The Board will continue to closely monitor the performance of the fund in the coming year and discuss with FMR other appropriate actions to address the performance of the fund.
Based on its review, the Board concluded that the nature, extent, and quality of services provided to the fund under the Advisory Contracts should benefit the fund's shareholders.
Competitiveness of Management Fee and Total Expense Ratio. The Board considered the fund's management fee and total expense ratio compared to "mapped groups" of competitive funds and classes. Fidelity creates "mapped groups" by combining similar Lipper investment objective categories that have comparable management fee characteristics. Combining Lipper investment objective categories aids the Board's management fee and total expense ratio comparisons by broadening the competitive group used for comparison and by reducing the number of universes to which various Fidelity funds are compared.
Annual Report
Board Approval of Investment Advisory Contracts and
Management Fees - continued
Management Fee. The Board considered two proprietary management fee comparisons for the 12-month periods shown in the chart below. The group of Lipper funds used by the Board for management fee comparisons is referred to below as the "Total Mapped Group." The Total Mapped Group comparison focuses on a fund's standing relative to the total universe of comparable funds available to investors in terms of gross management fees before expense reimbursements or caps. "TMG %" represents the percentage of funds in the Total Mapped Group that had management fees that were lower than the fund's. For example, a TMG % of 30% means that 70% of the funds in the Total Mapped Group had higher management fees than the fund. The "Asset-Size Peer Group" (ASPG) comparison focuses on a fund's standing relative to non-Fidelity funds similar in size to the fund within the Total Mapped Group. The ASPG represents at least 15% of the funds in the Total Mapped Group with comparable asset size and management fee characteristics, subject to a minimum of 50 funds (or all funds in the Total Mapped Group if fewer than 50). Additional information, such as the ASPG quartile in which the fund's management fee ranked, is also included in the chart and considered by the Board.
Fidelity International Real Estate Fund
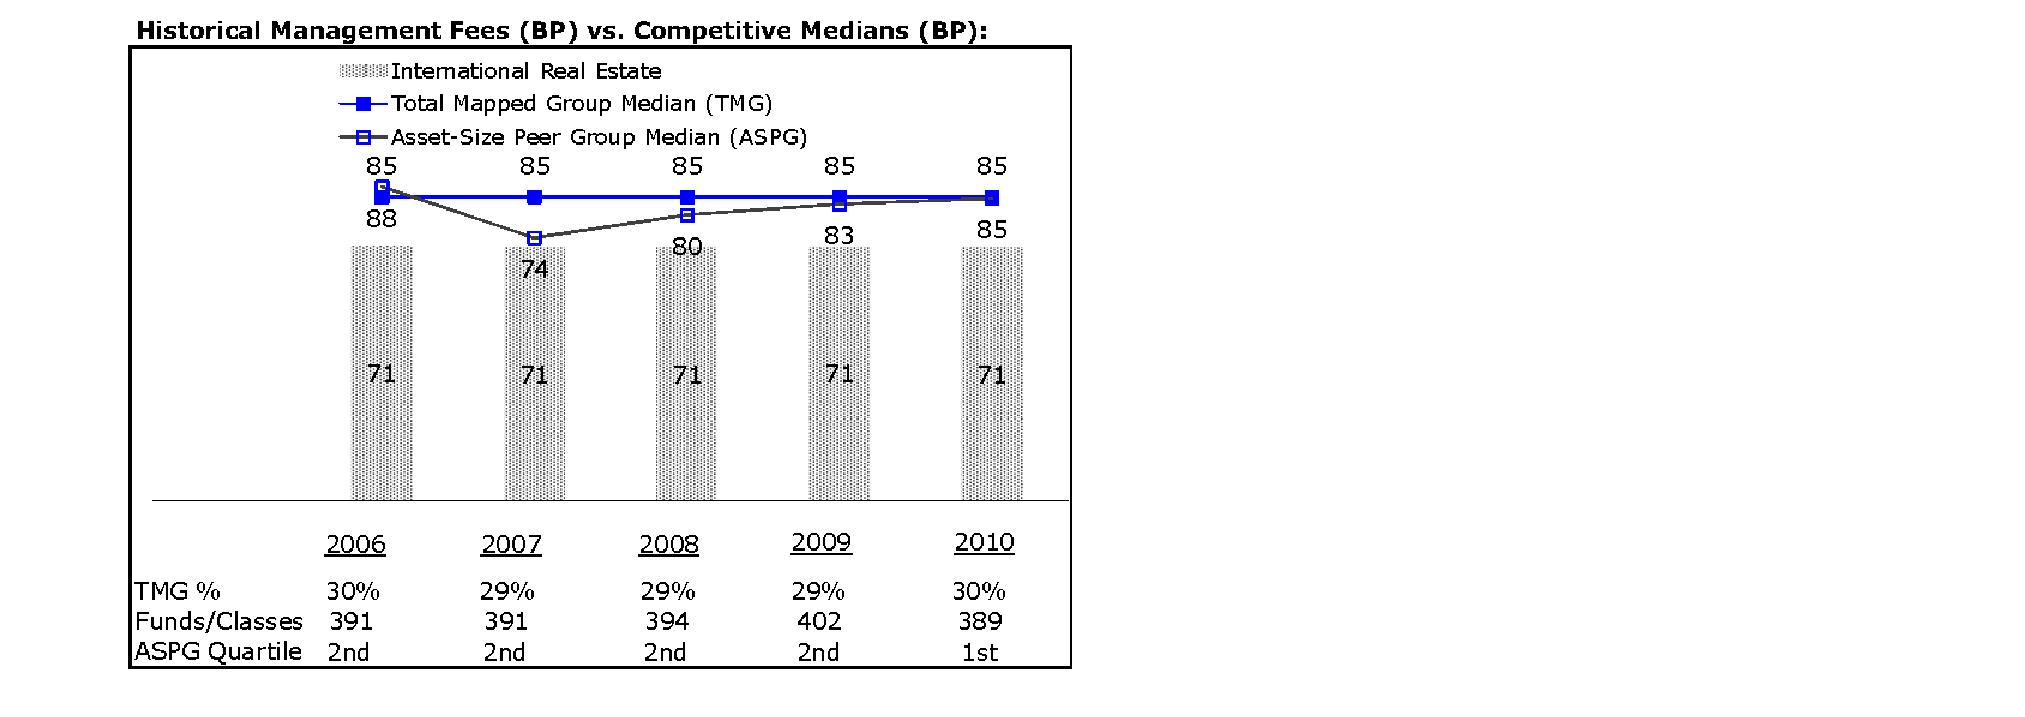
The Board noted that the fund's management fee ranked below the median of its Total Mapped Group and below the median of its ASPG for 2010.
Based on its review, the Board concluded that the fund's management fee is fair and reasonable in light of the services that the fund receives and the other factors considered.
Total Expense Ratio. In its review of each class's total expense ratio, the Board considered the fund's management fee as well as other fund or class expenses, as applicable, such as transfer agent fees, pricing and bookkeeping fees, fund-paid 12b-1 fees, and custodial, legal, and audit fees. The Board also noted the effects of any waivers and reimbursements on fees and expenses. As part of its review, the Board also considered the current and historical total expense ratios of each class of the fund compared to competitive fund median expenses. Each class of the fund is compared to those funds and classes in the Total Mapped Group (used by the Board for management fee comparisons) that have a similar sales load structure.
Annual Report
The Board noted that the total expense ratio of each of Class A, Class B, Class C, and the retail class ranked below its competitive median for 2010 and the total expense ratio of each of Class T and Institutional Class ranked above its competitive median for 2010. The Board considered that various factors, including 12b-1 fees, positive or negative performance adjustments, and relatively higher other expenses in the case of small fund size, can affect total expense ratios. The Board noted that the total expense ratio of Class T was above the competitive median primarily because of higher 12b-1 fees on Class T. Class T has a higher 12b-1 fee, but a lower front-end sales charge, than traditionally priced front-end sales charge classes. The Board noted that the fund offers multiple classes, each of which has a different sales load and 12b-1 fee structure, and that the multiple structures are intended to offer a range of pricing options for the intermediary market. The Board also noted that the total expense ratios of the classes vary primarily by the level of their 12b-1 fees, although differences in transfer agent fees may also cause expenses to vary from class to class.
Fees Charged to Other Fidelity Clients. The Board also considered Fidelity fee structures and other information with respect to clients of FMR and its affiliates, such as other mutual funds advised or subadvised by FMR or its affiliates, pension plan clients, and other institutional clients. In March 2010, the Board created an ad hoc joint committee with the board of other Fidelity funds (the Committee) to review and compare Fidelity's institutional investment advisory business with its business of providing services to the Fidelity funds, including the differences in services provided, fees charged, and costs incurred, as well as competition in their respective marketplaces.
Based on its review of total expense ratios and fees charged to other Fidelity clients, the Board concluded that the total expense ratio of each class of the fund was reasonable, although in some cases above the median of the universe presented for comparison, in light of the services that the fund and its shareholders receive and the other factors considered, including the findings of the Committee.
Costs of the Services and Profitability. The Board considered the revenues earned and the expenses incurred by Fidelity in conducting the business of developing, marketing, distributing, managing, administering and servicing the fund and its shareholders. The Board also considered the level of Fidelity's profits in respect of all the Fidelity funds.
Annual Report
Board Approval of Investment Advisory Contracts and
Management Fees - continued
On an annual basis, FMR presents to the Board Fidelity's profitability for the fund. Fidelity calculates the profitability for each fund, as well as aggregate profitability for groups of Fidelity funds and all Fidelity funds, using a series of detailed revenue and cost allocation methodologies which originate with the books and records of Fidelity on which Fidelity's audited financial statements are based. The Audit Committee of the Board reviews any significant changes from the prior year's methodologies.
PricewaterhouseCoopers LLP (PwC), independent registered public accounting firm and auditor to Fidelity and certain Fidelity funds, has been engaged annually by the Board as part of the Board's assessment of Fidelity's profitability analysis. PwC's engagement includes the review and assessment of Fidelity's methodologies used in determining the revenues and expenses attributable to Fidelity's mutual fund business, and completion of agreed-upon procedures surrounding the mathematical accuracy of fund profitability and its conformity to allocation methodologies. After considering PwC's reports issued under the engagement and information provided by Fidelity, the Board concluded that while other allocation methods may also be reasonable, Fidelity's profitability methodologies are reasonable in all material respects.
The Board also reviewed Fidelity's non-fund businesses and fall-out benefits related to the mutual fund business as well as cases where Fidelity's affiliates may benefit from or be related to the fund's business.
The Board considered the costs of the services provided by and the profits realized by Fidelity in connection with the operation of the fund and was satisfied that the profitability was not excessive in the circumstances.
Economies of Scale. The Board considered whether there have been economies of scale in respect of the management of the Fidelity funds, whether the Fidelity funds (including the fund) have appropriately benefited from any such economies of scale, and whether there is potential for realization of any further economies of scale. The Board considered the extent to which the fund will benefit from economies of scale through increased services to the fund, through waivers or reimbursements, or through fee or expense reductions. The Board also noted that in 2009, it and the board of other Fidelity funds created an ad hoc committee (the Economies of Scale Committee) to analyze whether FMR attains economies of scale in respect of the management and servicing of the Fidelity funds, whether the Fidelity funds have appropriately benefited from such economies of scale, and whether there is potential for realization of any further economies of scale.
The Board recognized that the fund's management contract incorporates a "group fee" structure, which provides for lower group fee rates as total fund assets under FMR's management increase, and for higher group fee rates as total fund assets under FMR's management decrease. FMR calculates the group fee rates based on a tiered asset "breakpoint" schedule that varies based on asset class. The Board considered that the group fee is designed to deliver the benefits of economies of scale to fund shareholders when total Fidelity fund assets increase, even if assets of any particular fund are unchanged or have declined, because some portion of Fidelity's costs are attributable to services provided to all Fidelity funds, and all funds benefit if those costs can be allocated among more assets. The Board concluded that, given the group fee structure, fund shareholders will benefit from lower management fees as assets under FMR's management increase at the fund complex level, regardless of whether Fidelity achieves any such economies of scale.
Annual Report
The Board concluded, taking into account the analysis of the Economies of Scale Committee, that any potential economies of scale are being appropriately shared between fund shareholders and Fidelity.
Additional Information Requested by the Board. In order to develop fully the factual basis for consideration of the Fidelity funds' Advisory Contracts, the Board requested and received additional information on certain topics, including (i) fund performance trends, actions to be taken by FMR to improve certain funds' overall performance, and Fidelity's long-term strategies for certain funds; (ii) portfolio manager changes that have occurred during the past year and length of portfolio manager tenure for different categories of funds over time; (iii) Fidelity's compensation structure for portfolio managers and other key personnel and strategies for attracting and retaining non-investment personnel; (iv) the amount of the investment that each portfolio manager has made in the Fidelity fund(s) that he or she manages; (v) historical trends in Fidelity's realization of fall-out benefits; (vi) Fidelity's group fee structures and the rationale for the individual fee rates of certain funds; (vii) fund profitability methodology and the impact of certain factors on fund profitability results; (viii) trends regarding industry use of performance fee structures and Fidelity's compliance practices with respect to performance adjustment calculations; (ix) the fee structures in place for certain other Fidelity clients; and (x) explanations regarding the relative total expense ratios of certain funds and classes, total expense competitive trends, and actions that might be taken by FMR to reduce total expense ratios for certain funds and classes.
Based on its evaluation of all of the conclusions noted above, and after considering all factors it believed relevant, the Board ultimately concluded that the advisory fee structures are fair and reasonable, and that the fund's Advisory Contracts should be renewed.
Annual Report
Investment Adviser
Fidelity Management & Research Company
Boston, MA
Investment Sub-Advisers
FMR Co., Inc.
Fidelity Management & Research
(U.K.) Inc.
FIL Investments (Japan) Limited
FIL Investment Advisers
FIL Investment Advisers (U.K.) Ltd.
Fidelity Management & Research
(Hong Kong) Limited
Fidelity Management & Research
(Japan) Inc.
General Distributor
Fidelity Distributors Corporation
Boston, MA
Transfer and Service Agents
Fidelity Investments Institutional
Operations Company, Inc.
Boston, MA
Fidelity Service Company, Inc.
Boston, MA
Custodian
The Bank of New York Mellon
New York, NY
AIREI-UANN-0911
1.843171.104
Fidelity®
Leveraged Company Stock
Fund
Annual Report
July 31, 2011
(2_fidelity_logos) (Registered_Trademark)
Contents
Chairman's Message | <Click Here> | The Chairman's message to shareholders. |
Performance | <Click Here> | How the fund has done over time. |
Management's Discussion of Fund Performance | <Click Here> | The Portfolio Manager's review of fundperformance and strategy. |
Shareholder Expense Example | <Click Here> | An example of shareholder expenses. |
Investment Changes | <Click Here> | A summary of major shifts in the fund's investments over the last six months. |
Investments | <Click Here> | A complete list of the fund's investments with their market values. |
Financial Statements | <Click Here> | Statements of assets and liabilities, operations, and changes in net assets, as well as financial highlights. |
Notes | <Click Here> | Notes to the financial statements. |
Report of Independent Registered Public Accounting Firm | <Click Here> | |
Trustees and Officers | <Click Here> | |
Distributions | <Click Here> | |
Board Approval of Investment Advisory Contracts and Management Fees | <Click Here> | |
To view a fund's proxy voting guidelines and proxy voting record for the 12-month period ended June 30, visit http://www.fidelity.com/proxyvotingresults or visit the Securities and Exchange Commission's (SEC) web site at http://www.sec.gov. You may also call 1-800-544-8544 to request a free copy of the proxy voting guidelines.
Standard & Poor's, S&P and S&P 500 are registered service marks of The McGraw-Hill Companies, Inc. and have been licensed for use by Fidelity Distributors Corporation.
Other third party marks appearing herein are the property of their respective owners.
All other marks appearing herein are registered or unregistered trademarks or service marks of FMR LLC or an affiliated company.
Annual Report
This report and the financial statements contained herein are submitted for the general information of the shareholders of the fund. This report is not authorized for distribution to prospective investors in the fund unless preceded or accompanied by an effective prospectus.
A fund files its complete schedule of portfolio holdings with the SEC for the first and third quarters of each fiscal year on Form N-Q. Forms N-Q are available on the SEC's web site at http://www.sec.gov. A fund's Forms N-Q may be reviewed and copied at the SEC's Public Reference Room in Washington, DC. Information regarding the operation of the SEC's Public Reference Room may be obtained by calling 1-800-SEC-0330. For a complete list of a fund's portfolio holdings, view the most recent holdings listing, semiannual report, or annual report on Fidelity's web site at http://www.fidelity.com, http://www.advisor.fidelity.com, or http://www.401k.com, as applicable.
NOT FDIC INSURED • MAY LOSE VALUE • NO BANK GUARANTEE
Neither the fund nor Fidelity Distributors Corporation is a bank.
Annual Report
(photo_of_James_C_Curvey)
Dear Shareholder:
The second half of 2011 began with U.S. equities continuing to give back some of the gains achieved earlier in the year. In the days leading up to July 31, markets were shaken by a political stalemate in which Congress struggled to address the debt ceiling issue before an early-August deadline. The resulting uncertainty held back markets in July, the third consecutive monthly decline for equities, effectively reversing the positive momentum seen through the end of April. Financial markets are always unpredictable, of course, but there are several time-tested investment principles that can help put the odds in your favor.
One of the basic tenets is to invest for the long term. Over time, riding out the markets' inevitable ups and downs has proven much more effective than selling into panic or chasing the hottest trend. Even missing only a few of the markets' best days can significantly diminish investor returns. Patience also affords the benefits of compounding - of earning interest on additional income or reinvested dividends and capital gains. There can be tax advantages and cost benefits to consider as well. While staying the course doesn't eliminate risk, it can considerably lessen the effect of short-term declines.
You can further manage your investing risk through diversification. And today, more than ever, geographic diversification should be taken into account. Studies indicate that asset allocation is the single most important determinant of a portfolio's long-term success. The right mix of stocks, bonds and cash - aligned to your particular risk tolerance and investment objective - is very important. Age-appropriate rebalancing is also an essential aspect of asset allocation. For younger investors, an emphasis on equities - which historically have been the best-performing asset class over time - is encouraged. As investors near their specific goal, such as retirement or sending a child to college, consideration may be given to replacing volatile assets (e.g. common stocks) with more-stable fixed investments (bonds or savings plans).
A third principle - investing regularly - can help lower the average cost of your purchases. Investing a certain amount of money each month or quarter helps ensure you won't pay for all your shares at market highs. This strategy - known as dollar cost averaging - also reduces "emotion" from investing, helping shareholders avoid selling weak performers just prior to an upswing, or chasing a hot performer just before a correction.
We invite you to contact us via the Internet, through our Investor Centers or by phone. It is our privilege to provide you the information you need to make the investments that are right for you.
Sincerely,
(The acting chairman's signature appears here.)
James C. Curvey
Acting Chairman
Annual Report
Average annual total return reflects the change in the value of an investment, assuming reinvestment of the class' distributions from dividend income and capital gains (the profits earned upon the sale of securities that have grown in value, if any) and assuming a constant rate of performance each year. The $10,000 table and the fund's returns do not reflect the deduction of taxes that a shareholder would pay on fund distributions or the redemption of fund shares. During periods of reimbursement by Fidelity, a fund's total return will be greater than it would be had the reimbursement not occurred. How a fund did yesterday is no guarantee of how it will do tomorrow.
Average Annual Total Returns
Periods ended July 31, 2011 | Past 1
year | Past 5
years | Past 10
years |
Fidelity® Leveraged Company Stock Fund | 23.27% | 3.34% | 13.33% |
$10,000 Over 10 Years
Let's say hypothetically that $10,000 was invested in Fidelity® Leveraged Company Stock Fund, a class of the fund, on July 31, 2001. The chart shows how the value of your investment would have changed, and also shows how the S&P 500® Index performed over the same period.
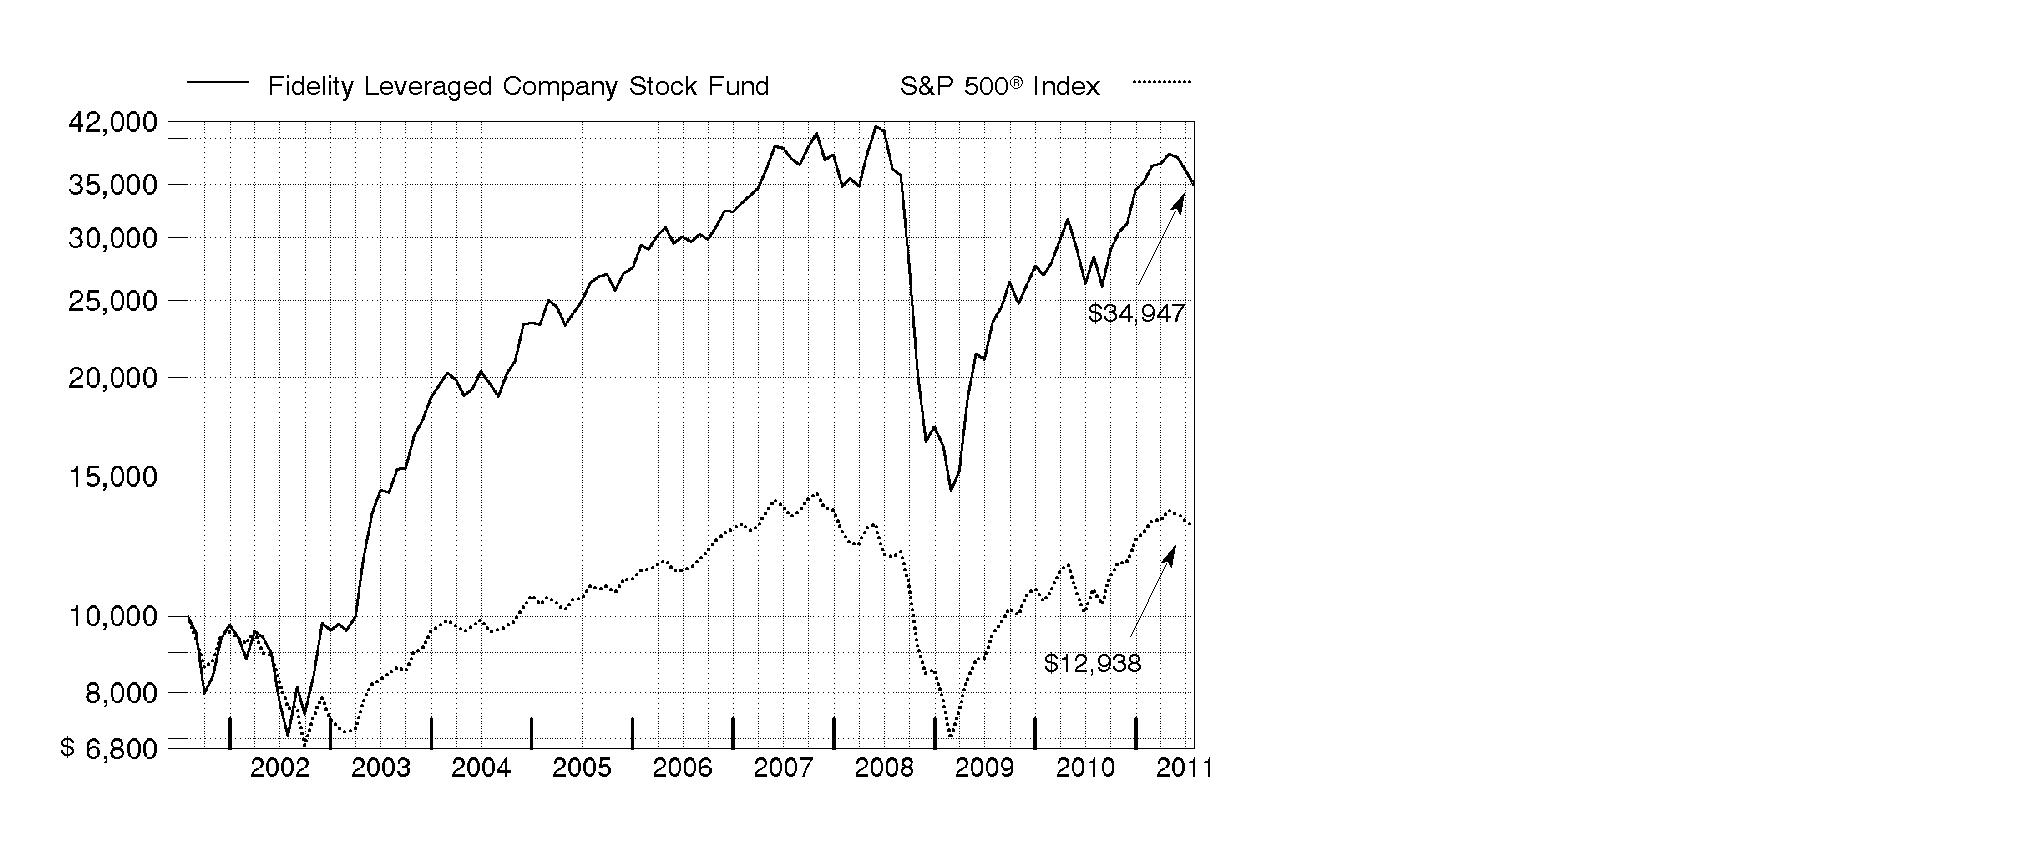
Annual Report
Market Recap: U.S. stocks registered solid double-digit gains for the 12 months ending July 31, 2011, extending a rally that began more than two years earlier. Despite a rough start in August 2010, markets turned positive in September, as increased demand for capital goods and other upbeat indicators trumped investor worry about a U.S. recessionary relapse. The broad market, as measured by the S&P 500® Index, rose 9% that month, its biggest September gain in 71 years. Seven more monthly advances followed, fueled by encouraging corporate earnings and economic activity. However, volatility picked up in the period's latter months, as markets reacted to continued high U.S. unemployment, nagging debt troubles in Europe and looming legislative battles over the federal debt ceiling. May unemployment rose above 9% for the first time in 2011, contributing to a traditional "June swoon" for stocks. Market uncertainty lingered in July, when the S&P 500® posted its second-biggest monthly loss of the period. For the full year, the S&P 500® climbed 19.65%, while the blue-chip-laden Dow Jones Industrial AverageSM rose a comparable 19.09% and the technology-heavy Nasdaq Composite® Index gained 23.40%. On the capitalization spectrum, stocks of mid-cap companies fared best, with the Russell Midcap® Index rising 24.51% and the small-cap Russell 2000® Index adding 23.92%.
Comments from Thomas Soviero, Portfolio Manager of Fidelity® Leveraged Company Stock Fund: For the year ending July 31, 2011, the fund's Retail Class shares returned 23.27%, outperforming the S&P 500® and the 23.17% gain of the Credit Suisse Leveraged Equity Index. Stock picking in materials, consumer discretionary and captial goods contributed the most versus the S&P 500. Underweighting financials also helped, although that benefit was somewhat offset by weak security selection there. Top relative contributors included chemicals companies Celanese, LyondellBassell Industries and W.R. Grace, and investments in energy companies El Paso and Frontier Oil, now part of HollyFrontier. Conversely, unfavorable stock picks in transportation hurt, as did overweighting banks. The fund's high-yield bond position also was a negative. Delta Air Lines and petroleum shipping company Overseas Shipholding Group detracted, as did underweighting computer giant Apple and not owning integrated oil company Exxon Mobil, two index heavyweights that outperformed. Several of the stocks I've mentioned were not part of the benchmark.
The views expressed above reflect those of the portfolio manager(s) only through the end of the period as stated on the cover of this report and do not necessarily represent the views of Fidelity or any other person in the Fidelity organization. Any such views are subject to change at any time based upon market or other conditions and Fidelity disclaims any responsibility to update such views. These views may not be relied on as investment advice and, because investment decisions for a Fidelity fund are based on numerous factors, may not be relied on as an indication of trading intent on behalf of any Fidelity fund.
Annual Report
Shareholder Expense Example
As a shareholder of the Fund, you incur two types of costs: (1) transaction costs, including redemption fees, and (2) ongoing costs, including management fees and other Fund expenses. This Example is intended to help you understand your ongoing costs (in dollars) of investing in the Fund and to compare these costs with the ongoing costs of investing in other mutual funds.
The Example is based on an investment of $1,000 invested at the beginning of the period and held for the entire period (February 1, 2011 to July 31, 2011).
Actual Expenses
The first line of the accompanying table for each class of the Fund provides information about actual account values and actual expenses. You may use the information in this line, together with the amount you invested, to estimate the expenses that you paid over the period. Simply divide your account value by $1,000.00 (for example, an $8,600 account value divided by $1,000.00 = 8.6), then multiply the result by the number in the first line for a class of the Fund under the heading entitled "Expenses Paid During Period" to estimate the expenses you paid on your account during this period. A small balance maintenance fee of $12.00 that is charged once a year may apply for certain accounts with a value of less than $2,000. This fee is not included in the table below. If it was, the estimate of expenses you paid during the period would be higher, and your ending account value lower, by this amount. In addition, the Fund, as a shareholder in the underlying Fidelity Central Funds, will indirectly bear its pro-rata share of the fees and expenses incurred by the underlying Fidelity Central Funds. These fees and expenses are not included in the Fund's annualized expense ratio used to calculate the expense estimate in the table below.
Hypothetical Example for Comparison Purposes
The second line of the accompanying table for each class of the Fund provides information about hypothetical account values and hypothetical expenses based on a Class' actual expense ratio and an assumed rate of return of 5% per year before expenses, which is not the Class' actual return. The hypothetical account values and expenses may not be used to estimate the actual ending account balance or expenses you paid for the period. You may use this information to compare the ongoing costs of investing in the Fund and other funds. To do so, compare this 5% hypothetical example with the 5% hypothetical examples that appear in the shareholder reports of the other funds. A small balance maintenance fee of $12.00 that is charged once a year may apply for certain accounts with a value of less than $2,000. This fee is not included in the table below. If it was, the estimate of expenses you paid during the period would be higher, and your ending account value lower, by this amount. In addition, the Fund, as a shareholder in the underlying Fidelity Central Funds, will indirectly bear its pro-rata share of the fees and expenses incurred by the underlying Fidelity Central Funds. These fees and expenses are not included in the Fund's annualized expense ratio used to calculate the expense estimate in the table below.
Please note that the expenses shown in the table are meant to highlight your ongoing costs only and do not reflect any transaction costs. Therefore, the second line of the table is useful in comparing ongoing costs only, and will not help you determine the relative total costs of owning different funds. In addition, if these transactional costs were included, your costs would have been higher.
Annual Report
Shareholder Expense Example - continued
| Annualized
Expense
Ratio | Beginning
Account Value
February 1, 2011 | Ending
Account Value
July 31, 2011 | Expenses Paid
During Period*
February 1, 2011
to July 31, 2011 |
Leveraged Company Stock | .84% | | | |
Actual | | $ 1,000.00 | $ 989.70 | $ 4.14 |
HypotheticalA | | $ 1,000.00 | $ 1,020.63 | $ 4.21 |
Class K | .69% | | | |
Actual | | $ 1,000.00 | $ 990.40 | $ 3.41 |
HypotheticalA | | $ 1,000.00 | $ 1,021.37 | $ 3.46 |
A 5% return per year before expenses
* Expenses are equal to each Class' annualized expense ratio, multiplied by the average account value over the period, multiplied by 181/365 (to reflect the one-half year period).
Annual Report
Investment Changes (Unaudited)
Top Ten Stocks as of July 31, 2011 |
| % of fund's
net assets | % of fund's net assets
6 months ago |
LyondellBasell Industries NV Class A | 6.0 | 2.1 |
ON Semiconductor Corp. | 4.1 | 5.0 |
Service Corp. International | 3.6 | 2.8 |
El Paso Corp. | 3.3 | 2.8 |
The AES Corp. | 3.0 | 2.8 |
Peabody Energy Corp. | 2.7 | 2.6 |
Tenet Healthcare Corp. | 2.4 | 2.6 |
Comcast Corp. Class A | 2.1 | 1.5 |
Owens Corning | 1.9 | 1.9 |
Celanese Corp. Class A | 1.8 | 2.1 |
| 30.9 | |
Top Five Market Sectors as of July 31, 2011 |
| % of fund's
net assets | % of fund's net assets
6 months ago |
Consumer Discretionary | 18.3 | 17.0 |
Industrials | 16.6 | 17.0 |
Materials | 15.7 | 12.6 |
Energy | 15.3 | 14.1 |
Information Technology | 10.5 | 11.2 |
Asset Allocation (% of fund's net assets) |
As of July 31, 2011* | As of January 31, 2011** |
| Stocks 96.6% | | | Stocks 94.0% | |
 | Bonds 0.1% | | | Bonds 1.0% | |
| Convertible
Securities 0.0% | | | Convertible
Securities 0.3% | |
 | Other Investments 0.1% | | | Other Investments 0.5% | |
| Short-Term
Investments and
Net Other Assets 3.2% | | | Short-Term
Investments and
Net Other Assets 4.2% | |
* Foreign investments | 12.4% | | ** Foreign investments | 8.6% | |

Annual Report
Investments July 31, 2011
Showing Percentage of Net Assets
Common Stocks - 96.3% |
| Shares | | Value (000s) |
CONSUMER DISCRETIONARY - 18.3% |
Auto Components - 1.8% |
Exide Technologies (a) | 3,643,393 | | $ 26,087 |
Johnson Controls, Inc. | 548,300 | | 20,260 |
Tenneco, Inc. (a) | 97,700 | | 3,902 |
The Goodyear Tire & Rubber Co. (a) | 564,063 | | 9,121 |
TRW Automotive Holdings Corp. (a) | 399,400 | | 20,158 |
| | 79,528 |
Automobiles - 1.3% |
Daimler AG (United States) | 209,400 | | 15,108 |
General Motors Co. | 769,284 | | 21,294 |
General Motors Co.: | | | |
warrants 7/10/16 (a) | 437,166 | | 8,232 |
warrants 7/10/19 (a) | 437,166 | | 5,941 |
Toyota Motor Corp. sponsored ADR (e) | 89,500 | | 7,332 |
| | 57,907 |
Diversified Consumer Services - 3.8% |
Service Corp. International (f) | 15,356,618 | | 160,784 |
Stewart Enterprises, Inc. Class A | 1,515,242 | | 10,531 |
| | 171,315 |
Hotels, Restaurants & Leisure - 1.3% |
Ameristar Casinos, Inc. | 110,100 | | 2,444 |
Biglari Holdings, Inc. (a) | 32,970 | | 12,139 |
Domino's Pizza, Inc. (a) | 483,695 | | 12,997 |
O'Charleys, Inc. (a) | 207,849 | | 1,266 |
Penn National Gaming, Inc. (a) | 582,836 | | 24,438 |
Wendy's Co. (a) | 546,800 | | 2,882 |
| | 56,166 |
Household Durables - 1.8% |
Harman International Industries, Inc. | 529,149 | | 22,013 |
Hovnanian Enterprises, Inc. Class A (a)(e) | 1,419,000 | | 2,724 |
Lennar Corp. Class A | 983,400 | | 17,396 |
Newell Rubbermaid, Inc. | 2,516,201 | | 39,051 |
| | 81,184 |
Leisure Equipment & Products - 0.2% |
Callaway Golf Co. | 1,630,035 | | 10,351 |
Media - 3.7% |
AMC Networks, Inc. Class A | 135,331 | | 5,033 |
Belo Corp. Series A | 163,800 | | 1,145 |
Cablevision Systems Corp. - NY Group Class A | 541,324 | | 13,187 |
Cinemark Holdings, Inc. | 1,554,497 | | 30,297 |
Common Stocks - continued |
| Shares | | Value (000s) |
CONSUMER DISCRETIONARY - continued |
Media - continued |
Comcast Corp. Class A | 3,962,898 | | $ 95,189 |
Gray Television, Inc. (a)(f) | 3,766,164 | | 9,152 |
LIN TV Corp. Class A (a) | 818,437 | | 3,356 |
Nexstar Broadcasting Group, Inc. Class A (a)(f) | 1,130,500 | | 9,903 |
| | 167,262 |
Specialty Retail - 1.8% |
Asbury Automotive Group, Inc. (a) | 385,122 | | 8,292 |
Charming Shoppes, Inc. (a) | 3,932,700 | | 16,124 |
GameStop Corp. Class A (a) | 2,149,577 | | 50,687 |
Sally Beauty Holdings, Inc. (a) | 300,000 | | 5,160 |
| | 80,263 |
Textiles, Apparel & Luxury Goods - 2.6% |
Coach, Inc. | 314,020 | | 20,273 |
Deckers Outdoor Corp. (a) | 467,786 | | 46,428 |
Hanesbrands, Inc. (a) | 404,100 | | 12,329 |
PVH Corp. | 548,718 | | 39,261 |
| | 118,291 |
TOTAL CONSUMER DISCRETIONARY | | 822,267 |
CONSUMER STAPLES - 2.8% |
Food & Staples Retailing - 0.6% |
Whole Foods Market, Inc. | 414,669 | | 27,658 |
Food Products - 2.0% |
Darling International, Inc. (a) | 4,479,620 | | 75,616 |
Smithfield Foods, Inc. (a) | 559,606 | | 12,323 |
| | 87,939 |
Personal Products - 0.2% |
Revlon, Inc. (a) | 553,261 | | 9,317 |
TOTAL CONSUMER STAPLES | | 124,914 |
ENERGY - 15.3% |
Energy Equipment & Services - 3.8% |
Baker Hughes, Inc. | 218,000 | | 16,869 |
Ensco International Ltd. ADR | 110,000 | | 5,858 |
Exterran Holdings, Inc. (a) | 1,019,808 | | 18,846 |
Halliburton Co. | 919,493 | | 50,324 |
Noble Corp. | 524,700 | | 19,346 |
Oil States International, Inc. (a) | 270,700 | | 21,845 |
Common Stocks - continued |
| Shares | | Value (000s) |
ENERGY - continued |
Energy Equipment & Services - continued |
Parker Drilling Co. (a) | 1,200,000 | | $ 7,608 |
Rowan Companies, Inc. (a) | 321,100 | | 12,577 |
Schlumberger Ltd. | 109,400 | | 9,886 |
Transocean Ltd. (United States) | 110,000 | | 6,772 |
| | 169,931 |
Oil, Gas & Consumable Fuels - 11.5% |
Alpha Natural Resources, Inc. (a) | 420,891 | | 17,976 |
Arch Coal, Inc. | 327,055 | | 8,373 |
Carrizo Oil & Gas, Inc. (a) | 438,502 | | 16,838 |
Chesapeake Energy Corp. | 1,036,165 | | 35,592 |
ConocoPhillips | 231,500 | | 16,666 |
CONSOL Energy, Inc. | 270,700 | | 14,510 |
El Paso Corp. | 7,302,530 | | 150,067 |
Forest Oil Corp. (a) | 1,314,652 | | 34,181 |
HollyFrontier Corp. | 812,048 | | 61,220 |
Nexen, Inc. | 188,000 | | 4,386 |
Overseas Shipholding Group, Inc. (e) | 494,592 | | 12,038 |
Paladin Energy Ltd. (Australia) (a) | 2,042,400 | | 5,879 |
Peabody Energy Corp. | 2,135,714 | | 122,739 |
Range Resources Corp. | 272,200 | | 17,737 |
| | 518,202 |
TOTAL ENERGY | | 688,133 |
FINANCIALS - 5.5% |
Commercial Banks - 3.3% |
Huntington Bancshares, Inc. | 11,032,080 | | 66,689 |
Regions Financial Corp. | 2,011,695 | | 12,251 |
SunTrust Banks, Inc. | 1,805,500 | | 44,217 |
Wells Fargo & Co. | 894,194 | | 24,984 |
| | 148,141 |
Consumer Finance - 0.6% |
American Express Co. | 501,647 | | 25,102 |
Diversified Financial Services - 0.1% |
Citigroup, Inc. | 163,840 | | 6,282 |
Insurance - 0.6% |
Assured Guaranty Ltd. | 1,249,684 | | 17,683 |
Lincoln National Corp. | 435,700 | | 11,546 |
| | 29,229 |
Common Stocks - continued |
| Shares | | Value (000s) |
FINANCIALS - continued |
Real Estate Investment Trusts - 0.7% |
FelCor Lodging Trust, Inc. (a) | 1,085,852 | | $ 5,581 |
Host Hotels & Resorts, Inc. | 1,016,122 | | 16,106 |
Sabra Health Care REIT, Inc. | 547,507 | | 7,890 |
| | 29,577 |
Thrifts & Mortgage Finance - 0.2% |
First Niagara Financial Group, Inc. | 851,444 | | 10,430 |
TOTAL FINANCIALS | | 248,761 |
HEALTH CARE - 5.5% |
Health Care Equipment & Supplies - 0.3% |
Alere, Inc. (a) | 419,708 | | 12,377 |
Health Care Providers & Services - 4.0% |
Community Health Systems, Inc. (a) | 554,676 | | 14,333 |
DaVita, Inc. (a) | 503,747 | | 42,083 |
HCA Holdings, Inc. | 305,500 | | 8,151 |
Kindred Healthcare, Inc. (a) | 108,330 | | 2,041 |
Sun Healthcare Group, Inc. (a) | 547,507 | | 3,833 |
Tenet Healthcare Corp. (a) | 19,484,059 | | 108,331 |
| | 178,772 |
Pharmaceuticals - 1.2% |
Hospira, Inc. (a) | 630,858 | | 32,249 |
Merck & Co., Inc. | 730,200 | | 24,922 |
| | 57,171 |
TOTAL HEALTH CARE | | 248,320 |
INDUSTRIALS - 16.6% |
Aerospace & Defense - 0.9% |
American Science & Engineering, Inc. | 85,370 | | 6,926 |
Teledyne Technologies, Inc. (a) | 340,694 | | 18,476 |
Textron, Inc. | 602,700 | | 13,940 |
| | 39,342 |
Airlines - 1.6% |
AMR Corp. (a)(e) | 1,140,630 | | 4,836 |
Delta Air Lines, Inc. (a) | 5,499,749 | | 43,393 |
Southwest Airlines Co. | 571,283 | | 5,690 |
Common Stocks - continued |
| Shares | | Value (000s) |
INDUSTRIALS - continued |
Airlines - continued |
United Continental Holdings, Inc. (a) | 370,700 | | $ 6,717 |
US Airways Group, Inc. (a) | 2,034,580 | | 12,696 |
| | 73,332 |
Building Products - 3.2% |
Armstrong World Industries, Inc. | 1,173,030 | | 46,335 |
Masco Corp. | 976,841 | | 10,306 |
Owens Corning (a) | 2,363,301 | | 84,086 |
Owens Corning warrants 10/31/13 (a) | 406,600 | | 1,586 |
| | 142,313 |
Commercial Services & Supplies - 3.0% |
Cenveo, Inc. (a)(f) | 3,658,300 | | 21,182 |
Deluxe Corp. | 1,786,873 | | 42,063 |
R.R. Donnelley & Sons Co. | 450,900 | | 8,481 |
Republic Services, Inc. | 1,317,784 | | 38,255 |
The Brink's Co. | 464,740 | | 13,868 |
Waste Management, Inc. | 340,992 | | 10,738 |
| | 134,587 |
Electrical Equipment - 2.5% |
Belden, Inc. | 1,170,366 | | 43,128 |
Emerson Electric Co. | 163,500 | | 8,026 |
General Cable Corp. (a) | 549,400 | | 21,850 |
Polypore International, Inc. (a) | 548,400 | | 37,291 |
| | 110,295 |
Industrial Conglomerates - 0.9% |
Carlisle Companies, Inc. | 109,910 | | 4,751 |
General Electric Co. | 1,103,883 | | 19,771 |
Tyco International Ltd. | 328,233 | | 14,537 |
| | 39,059 |
Machinery - 2.9% |
Accuride Corp. warrants 2/26/12 (a) | 778,347 | | 54 |
Fiat Industrial SpA (a) | 1,634,423 | | 21,617 |
Ingersoll-Rand Co. Ltd. | 1,346,900 | | 50,401 |
Navistar International Corp. (a) | 69,800 | | 3,581 |
Stanley Black & Decker, Inc. | 349,717 | | 23,001 |
Timken Co. | 464,948 | | 20,304 |
WABCO Holdings, Inc. (a) | 211,533 | | 13,337 |
| | 132,295 |
Common Stocks - continued |
| Shares | | Value (000s) |
INDUSTRIALS - continued |
Marine - 0.2% |
Navios Maritime Holdings, Inc. | 2,162,794 | | $ 9,322 |
Road & Rail - 1.2% |
Avis Budget Group, Inc. (a) | 719,914 | | 10,878 |
CSX Corp. | 328,200 | | 8,064 |
Hertz Global Holdings, Inc. (a) | 2,518,600 | | 35,437 |
| | 54,379 |
Trading Companies & Distributors - 0.2% |
Houston Wire & Cable Co. (e) | 656,176 | | 10,440 |
TOTAL INDUSTRIALS | | 745,364 |
INFORMATION TECHNOLOGY - 10.5% |
Communications Equipment - 0.1% |
JDS Uniphase Corp. (a) | 163,300 | | 2,147 |
Computers & Peripherals - 1.2% |
Apple, Inc. (a) | 139,886 | | 54,623 |
Electronic Equipment & Components - 1.8% |
Avnet, Inc. (a) | 328,000 | | 9,610 |
DDi Corp. | 295,899 | | 2,435 |
Flextronics International Ltd. (a) | 7,305,346 | | 47,119 |
TTM Technologies, Inc. (a) | 724,200 | | 10,030 |
Viasystems Group, Inc. (a) | 540,460 | | 12,128 |
| | 81,322 |
Internet Software & Services - 0.1% |
VeriSign, Inc. | 194,300 | | 6,064 |
IT Services - 0.6% |
Alliance Data Systems Corp. (a)(e) | 114,000 | | 11,211 |
CACI International, Inc. Class A (a) | 248,000 | | 14,652 |
| | 25,863 |
Office Electronics - 0.3% |
Xerox Corp. | 1,215,542 | | 11,341 |
Semiconductors & Semiconductor Equipment - 6.3% |
Amkor Technology, Inc. (a)(e) | 5,242,218 | | 27,941 |
Cypress Semiconductor Corp. | 651,200 | | 13,402 |
Fairchild Semiconductor International, Inc. (a) | 548,500 | | 8,233 |
Freescale Semiconductor Holdings I Ltd. | 365,800 | | 5,974 |
Intel Corp. | 454,981 | | 10,160 |
Intersil Corp. Class A | 1,460,387 | | 17,598 |
Common Stocks - continued |
| Shares | | Value (000s) |
INFORMATION TECHNOLOGY - continued |
Semiconductors & Semiconductor Equipment - continued |
Micron Technology, Inc. (a) | 1,737,600 | | $ 12,806 |
ON Semiconductor Corp. (a) | 21,279,802 | | 184,921 |
| | 281,035 |
Software - 0.1% |
Microsoft Corp. | 108,800 | | 2,981 |
Nuance Communications, Inc. (a) | 163,600 | | 3,274 |
| | 6,255 |
TOTAL INFORMATION TECHNOLOGY | | 468,650 |
MATERIALS - 15.7% |
Chemicals - 13.0% |
Albemarle Corp. | 243,379 | | 16,204 |
Arch Chemicals, Inc. | 344,342 | | 16,225 |
Celanese Corp. Class A | 1,506,819 | | 83,071 |
Dow Chemical Co. | 1,651,894 | | 57,602 |
Ferro Corp. (a) | 617,100 | | 8,035 |
FMC Corp. | 178,600 | | 15,640 |
H.B. Fuller Co. | 988,225 | | 22,591 |
LyondellBasell Industries NV Class A | 6,788,309 | | 267,863 |
OMNOVA Solutions, Inc. (a)(f) | 2,749,107 | | 18,584 |
Phosphate Holdings, Inc. (a) | 307,500 | | 2,891 |
Solutia, Inc. (a) | 657,600 | | 14,099 |
W.R. Grace & Co. (a) | 1,225,761 | | 61,827 |
| | 584,632 |
Containers & Packaging - 0.8% |
Rock-Tenn Co. Class A | 571,323 | | 35,114 |
Metals & Mining - 1.6% |
AngloGold Ashanti Ltd. sponsored ADR | 526,100 | | 22,065 |
Compass Minerals International, Inc. | 258,500 | | 20,354 |
Ormet Corp. (a) | 330,000 | | 2,079 |
Ormet Corp. (a)(h) | 1,075,000 | | 6,773 |
Teck Resources Ltd. Class B (sub. vtg.) | 417,300 | | 20,677 |
| | 71,948 |
Paper & Forest Products - 0.3% |
Neenah Paper, Inc. | 518,300 | | 10,464 |
TOTAL MATERIALS | | 702,158 |
Common Stocks - continued |
| Shares | | Value (000s) |
TELECOMMUNICATION SERVICES - 2.2% |
Diversified Telecommunication Services - 0.9% |
CenturyLink, Inc. | 771,680 | | $ 28,637 |
PAETEC Holding Corp. (a) | 2,166,533 | | 9,576 |
| | 38,213 |
Wireless Telecommunication Services - 1.3% |
Crown Castle International Corp. (a) | 830,591 | | 36,048 |
Sprint Nextel Corp. (a) | 5,692,987 | | 24,081 |
| | 60,129 |
TOTAL TELECOMMUNICATION SERVICES | | 98,342 |
UTILITIES - 3.9% |
Independent Power Producers & Energy Traders - 3.9% |
Calpine Corp. (a) | 2,479,900 | | 40,298 |
The AES Corp. (a) | 10,901,923 | | 134,203 |
| | 174,501 |
TOTAL COMMON STOCKS (Cost $3,692,145) | 4,321,410 |
Nonconvertible Preferred Stocks - 0.3% |
| | | |
CONSUMER STAPLES - 0.1% |
Personal Products - 0.1% |
Revlon, Inc. Series A 12.75% | 639,576 | | 3,671 |
FINANCIALS - 0.2% |
Diversified Financial Services - 0.2% |
GMAC Capital Trust I Series 2, 8.125% | 439,013 | | 11,248 |
TOTAL NONCONVERTIBLE PREFERRED STOCKS (Cost $19,207) | 14,919 |
Nonconvertible Bonds - 0.1% |
| Principal Amount (000s) | | |
CONSUMER DISCRETIONARY - 0.0% |
Automobiles - 0.0% |
General Motors Corp.: | | | | |
6.75% 5/1/28 (d) | | $ 3,075 | | 34 |
7.125% 7/15/13 (d) | | 8,320 | | 91 |
Nonconvertible Bonds - continued |
| Principal Amount (000s) | | Value (000s) |
CONSUMER DISCRETIONARY - continued |
Automobiles - continued |
General Motors Corp.: - continued | | | | |
7.2% 1/15/11 (d) | | $ 22,980 | | $ 250 |
8.25% 7/15/23 (d) | | 25,035 | | 273 |
8.375% 7/15/33 (d) | | 50,210 | | 547 |
8.8% 3/1/21 (d) | | 10,765 | | 117 |
| | 1,312 |
Hotels, Restaurants & Leisure - 0.0% |
Station Casinos, Inc.: | | | | |
6% 4/1/12 (d) | | 8,360 | | 1 |
7.75% 8/15/16 (d) | | 9,380 | | 1 |
| | 2 |
TOTAL CONSUMER DISCRETIONARY | | 1,314 |
FINANCIALS - 0.1% |
Commercial Banks - 0.1% |
Regions Bank 6.45% 6/26/37 | | 5,430 | | 4,724 |
INDUSTRIALS - 0.0% |
Airlines - 0.0% |
Northwest Airlines, Inc. 9.875% 3/15/07 (d) | | 7,000 | | 0 |
TOTAL NONCONVERTIBLE BONDS (Cost $11,655) | 6,038 |
Floating Rate Loans - 0.1% |
|
UTILITIES - 0.1% |
Electric Utilities - 0.1% |
Texas Competitive Electric Holdings Co. LLC/Texas Competitive Electric Holdings Finance, Inc. Tranche B, term loan 4.7282% 10/10/17 (g) (Cost $4,653) | | 5,458 | | 4,086 |
Money Market Funds - 4.4% |
| Shares | | Value (000s) |
Fidelity Cash Central Fund, 0.14% (b) | 139,877,222 | | $ 139,877 |
Fidelity Securities Lending Cash Central Fund, 0.15% (b)(c) | 55,266,648 | | 55,267 |
TOTAL MONEY MARKET FUNDS (Cost $195,144) | 195,144 |
TOTAL INVESTMENT PORTFOLIO - 101.2% (Cost $3,922,804) | | 4,541,597 |
NET OTHER ASSETS (LIABILITIES) - (1.2)% | | (55,438) |
NET ASSETS - 100% | $ 4,486,159 |
Legend |
(a) Non-income producing |
(b) Affiliated fund that is available only to investment companies and other accounts managed by Fidelity Investments. The rate quoted is the annualized seven-day yield of the fund at period end. A complete unaudited listing of the fund's holdings as of its most recent quarter end is available upon request. In addition, each Fidelity Central Fund's financial statements, which are not covered by the Fund's Report of Independent Registered Public Accounting Firm, are available on the SEC's website or upon request. |
(c) Investment made with cash collateral received from securities on loan. |
(d) Non-income producing - Security is in default. |
(e) Security or a portion of the security is on loan at period end. |
(f) Affiliated company |
(g) Coupon rates for floating and adjustable rate securities reflect the rates in effect at period end. |
(h) Restricted securities - Investment in securities not registered under the Securities Act of 1933 (excluding 144A issues). At the end of the period, the value of restricted securities (excluding 144A issues) amounted to $6,773,000 or 0.2% of net assets. |
Additional information on each restricted holding is as follows: |
Security | Acquisition Date | Acquisition Cost (000s) |
Ormet Corp. | 2/27/07 - 4/4/07 | $ 20,556 |
Affiliated Central Funds |
Information regarding fiscal year to date income earned by the Fund from investments in Fidelity Central Funds is as follows: |
Fund | Income earned
(Amounts in thousands) |
Fidelity Cash Central Fund | $ 250 |
Fidelity Securities Lending Cash Central Fund | 526 |
Total | $ 776 |
Other Affiliated Issuers |
An affiliated company is a company in which the Fund has ownership of at least 5% of the voting securities. Fiscal year to date transactions with companies which are or were affiliates are as follows: |
Affiliate
(Amounts in thousands) | Value,
beginning of
period | Purchases | Sales
Proceeds | Dividend Income | Value,
end of
period |
Cenveo, Inc. | $ 23,767 | $ - | $ 1,146 | $ - | $ 21,182 |
Gray Television, Inc. | 7,399 | 1,624 | - | - | 9,152 |
Nexstar Broadcasting Group, Inc. Class A | 6,105 | - | - | - | 9,903 |
OMNOVA Solutions, Inc. | - | 22,300 | - | - | 18,584 |
ON Semiconductor Corp. | 155,780 | - | 20,281 | - | - |
Ormet Corp. | 957 | - | - | - | - |
Ormet Corp. | 3,118 | - | - | - | - |
Service Corp. International | 150,430 | - | 18,657 | 2,859 | 160,784 |
Total | $ 347,556 | $ 23,924 | $ 40,084 | $ 2,859 | $ 219,605 |
Other Information |
The following is a summary of the inputs used, as of July 31, 2011, involving the Fund's assets and liabilities carried at fair value. The inputs or methodology used for valuing securities may not be an indication of the risk associated with investing in those securities. For more information on valuation inputs, and their aggregation into the levels used in the tables below, please refer to the Security Valuation section in the accompanying Notes to Financial Statements. |
Valuation Inputs at Reporting Date: |
Description
(Amounts in thousands) | Total | Level 1 | Level 2 | Level 3 |
Investments in Securities: | | | | |
Equities: | | | | |
Consumer Discretionary | $ 822,267 | $ 822,267 | $ - | $ - |
Consumer Staples | 128,585 | 124,914 | - | 3,671 |
Energy | 688,133 | 688,133 | - | - |
Financials | 260,009 | 260,009 | - | - |
Health Care | 248,320 | 248,320 | - | - |
Industrials | 745,364 | 745,364 | - | - |
Information Technology | 468,650 | 468,650 | - | - |
Materials | 702,158 | 702,158 | - | - |
Telecommunication Services | 98,342 | 98,342 | - | - |
Utilities | 174,501 | 174,501 | - | - |
Corporate Bonds | 6,038 | - | 4,724 | 1,314 |
Floating Rate Loans | 4,086 | - | 4,086 | - |
Money Market Funds | 195,144 | 195,144 | - | - |
Total Investments in Securities: | $ 4,541,597 | $ 4,527,802 | $ 8,810 | $ 4,985 |
The following is a reconciliation of Investments in Securities for which Level 3 inputs were used in determining value: |
(Amounts in thousands) | |
Investments in Securities: | |
Beginning Balance | $ 4,950 |
Total Realized Gain (Loss) | (1) |
Total Unrealized Gain (Loss) | (21,915) |
Cost of Purchases | - |
Proceeds of Sales | (19,680) |
Amortization/Accretion | 264 |
Transfers in to Level 3 | 41,367 |
Transfers out of Level 3 | - |
Ending Balance | $ 4,985 |
The change in unrealized gain (loss) for the period attributable to Level 3 securities held at July 31, 2011 | $ (21,915) |
The information used in the above reconciliation represents fiscal year to date activity for any Investments in Securities identified as using Level 3 inputs at either the beginning or the end of the current fiscal period. Transfers in or out of Level 3 represent the beginning value of any Security or Instrument where a change in the pricing level occurred from the beginning to the end of the period. The cost of purchases and the proceeds of sales may include securities received or delivered through corporate actions or exchanges. Realized and unrealized gains (losses) disclosed in the reconciliation are included in Net Gain (Loss) on the Fund's Statement of Operations. |
Distribution of investments by country of issue, as a percentage of total net assets, is as follows: (Unaudited) |
United States of America | 87.6% |
Netherlands | 6.0% |
Ireland | 1.1% |
Singapore | 1.1% |
Others (Individually Less Than 1%) | 4.2% |
| 100.0% |
Income Tax Information |
At July 31, 2011, the Fund had a capital loss carryforward of approximately $728,972,000 of which $37,148,000 and $691,824,000 will expire in fiscal 2017 and 2018, respectively. Capital loss carryforwards are only available to offset future capital gains of the Fund to the extent provided by regulations and may be limited. |
See accompanying notes which are an integral part of the financial statements.
Annual Report
Statement of Assets and Liabilities
Amounts in thousands (except per-share amounts) | July 31, 2011 |
| | |
Assets | | |
Investment in securities, at value (including securities loaned of $53,743) - See accompanying schedule: Unaffiliated issuers (cost $3,510,832) | $ 4,126,848 | |
Fidelity Central Funds (cost $195,144) | 195,144 | |
Other affiliated issuers (cost $216,828) | 219,605 | |
Total Investments (cost $3,922,804) | | $ 4,541,597 |
Cash | | 1 |
Receivable for investments sold | | 27,147 |
Receivable for fund shares sold | | 2,566 |
Dividends receivable | | 839 |
Interest receivable | | 71 |
Distributions receivable from Fidelity Central Funds | | 45 |
Other receivables | | 63 |
Total assets | | 4,572,329 |
| | |
Liabilities | | |
Payable for investments purchased | $ 13,853 | |
Payable for fund shares redeemed | 13,798 | |
Accrued management fee | 2,388 | |
Other affiliated payables | 814 | |
Other payables and accrued expenses | 50 | |
Collateral on securities loaned, at value | 55,267 | |
Total liabilities | | 86,170 |
| | |
Net Assets | | $ 4,486,159 |
Net Assets consist of: | | |
Paid in capital | | $ 4,610,149 |
Distributions in excess of net investment income | | (1,080) |
Accumulated undistributed net realized gain (loss) on investments and foreign currency transactions | | (741,705) |
Net unrealized appreciation (depreciation) on investments and assets and liabilities in foreign currencies | | 618,795 |
Net Assets | | $ 4,486,159 |
See accompanying notes which are an integral part of the financial statements.
Annual Report
Financial Statements - continued
Statement of Assets and Liabilities - continued
Amounts in thousands (except per-share amounts) | July 31, 2011 |
| | |
Leveraged Company Stock:
Net Asset Value, offering price and redemption price per share ($3,931,252 ÷ 136,261 shares) | | $ 28.85 |
| | |
Class K:
Net Asset Value, offering price and redemption price per share ($554,907 ÷ 19,225 shares) | | $ 28.86 |
See accompanying notes which are an integral part of the financial statements.
Annual Report
Statement of Operations
Amounts in thousands | Year ended July 31, 2011 |
| | |
Investment Income | | |
Dividends (including $2,859 earned from other affiliated issuers) | | $ 34,277 |
Interest | | 4,197 |
Income from Fidelity Central Funds | | 776 |
Total income | | 39,250 |
| | |
Expenses | | |
Management fee | $ 28,332 | |
Transfer agent fees | 9,001 | |
Accounting and security lending fees | 1,090 | |
Custodian fees and expenses | 57 | |
Independent trustees' compensation | 25 | |
Registration fees | 97 | |
Audit | 64 | |
Legal | 45 | |
Miscellaneous | 52 | |
Total expenses before reductions | 38,763 | |
Expense reductions | (204) | 38,559 |
Net investment income (loss) | | 691 |
Realized and Unrealized Gain (Loss) Net realized gain (loss) on: | | |
Investment securities: | | |
Unaffiliated issuers | 249,112 | |
Other affiliated issuers | 16,077 | |
Foreign currency transactions | (13) | |
Total net realized gain (loss) | | 265,176 |
Change in net unrealized appreciation (depreciation) on: Investment securities | 656,092 | |
Assets and liabilities in foreign currencies | 4 | |
Total change in net unrealized appreciation (depreciation) | | 656,096 |
Net gain (loss) | | 921,272 |
Net increase (decrease) in net assets resulting from operations | | $ 921,963 |
See accompanying notes which are an integral part of the financial statements.
Annual Report
Financial Statements - continued
Statement of Changes in Net Assets
Amounts in thousands | Year ended
July 31,
2011 | Year ended
July 31,
2010 |
Increase (Decrease) in Net Assets | | |
Operations | | |
Net investment income (loss) | $ 691 | $ 13,810 |
Net realized gain (loss) | 265,176 | 201,065 |
Change in net unrealized appreciation (depreciation) | 656,096 | 593,648 |
Net increase (decrease) in net assets resulting
from operations | 921,963 | 808,523 |
Distributions to shareholders from net investment income | (19,058) | (23,690) |
Share transactions - net increase (decrease) | (810,250) | (373,729) |
Redemption fees | 558 | 970 |
Total increase (decrease) in net assets | 93,213 | 412,074 |
| | |
Net Assets | | |
Beginning of period | 4,392,946 | 3,980,872 |
End of period (including distributions in excess of net investment income of $1,080 and undistributed net investment income of $10,281, respectively) | $ 4,486,159 | $ 4,392,946 |
See accompanying notes which are an integral part of the financial statements.
Annual Report
Financial Highlights - Leveraged Company Stock
Years ended July 31, | 2011 | 2010 | 2009 | 2008 | 2007 |
Selected Per-Share Data | | | | | |
Net asset value, beginning of period | $ 23.50 | $ 19.55 | $ 31.09 | $ 33.78 | $ 28.07 |
Income from Investment Operations | | | | | |
Net investment income (loss) B | -G | .07 | .21 | .14 | .44 E |
Net realized and unrealized gain (loss) | 5.46 | 3.99 | (11.37) | (1.06) | 6.78 |
Total from investment operations | 5.46 | 4.06 | (11.16) | (.92) | 7.22 |
Distributions from net investment income | (.11) | (.11) | (.14) | (.39) | (.12) |
Distributions from net realized gain | - | - | (.25) | (1.39) | (1.40) |
Total distributions | (.11) | (.11) | (.39) | (1.78) | (1.52) |
Redemption fees added to paid in capital B | - G | - G | .01 | .01 | .01 |
Net asset value, end of period | $ 28.85 | $ 23.50 | $ 19.55 | $ 31.09 | $ 33.78 |
Total Return A | 23.27% | 20.84% | (35.99)% | (2.76)% | 27.08% |
Ratios to Average Net Assets C,F | | | | | |
Expenses before reductions | .85% | .88% | .92% | .83% | .83% |
Expenses net of fee waivers, if any | .85% | .88% | .92% | .83% | .83% |
Expenses net of all reductions | .84% | .88% | .92% | .83% | .83% |
Net investment income (loss) | - H | .29% | 1.17% | .44% | 1.43% E |
Supplemental Data | | | | | |
Net assets, end of period (in millions) | $ 3,931 | $ 3,983 | $ 3,714 | $ 8,032 | $ 7,830 |
Portfolio turnover rate D | 18% | 21% | 34% | 30% | 20% |
A Total returns would have been lower if certain expenses had not been reduced during the applicable periods shown.
B Calculated based on average shares outstanding during the period.
C Fees and expenses of any underlying Fidelity Central Funds are not included in the Fund's expense ratio. The Fund indirectly bears its proportionate share of the expenses of any underlying Fidelity Central Funds.
D Amount does not include the portfolio activity of any underlying Fidelity Central Funds.
E Investment income per share reflects a special dividend which amounted to $.26 per share. Excluding the special dividend, the ratio of net investment income (loss) to average net assets would have been 59%.
F Expense ratios reflect operating expenses of the class. Expenses before reductions do not reflect amounts reimbursed by the investment adviser or reductions from brokerage service arrangements or reductions from other expense offset arrangements and do not represent the amount paid by the class during periods when reimbursements or reductions occur. Expenses net of fee waivers reflect expenses after reimbursement by the investment adviser but prior to reductions from brokerage service arrangements or other expense offset arrangements. Expenses net of all reductions represent the net expenses paid by the class.
G Amount represents less than $.01 per share.
H Amount represents less than .01%
See accompanying notes which are an integral part of the financial statements.
Annual Report
Financial Highlights - Class K
Years ended July 31, | 2011 | 2010 | 2009 | 2008 G |
Selected Per-Share Data | | | | |
Net asset value, beginning of period | $ 23.52 | $ 19.56 | $ 31.11 | $ 34.10 |
Income from Investment Operations | | | | |
Net investment income (loss) D | .04 | .11 | .21 | .05 |
Net realized and unrealized gain (loss) | 5.45 | 4.00 | (11.35) | (3.04) |
Total from investment operations | 5.49 | 4.11 | (11.14) | (2.99) |
Distributions from net investment income | (.15) | (.15) | (.17) | - |
Distributions from net realized gain | - | - | (.25) | - |
Total distributions | (.15) | (.15) | (.42) | - |
Redemption fees added to paid in capital D | - I | - I | .01 | - I |
Net asset value, end of period | $ 28.86 | $ 23.52 | $ 19.56 | $ 31.11 |
Total Return B,C | 23.45% | 21.09% | (35.86)% | (8.77)% |
Ratios to Average Net Assets E,H | | | | |
Expenses before reductions | .69% | .70% | .71% | .70% A |
Expenses net of fee waivers, if any | .69% | .70% | .71% | .70% A |
Expenses net of all reductions | .69% | .69% | .71% | .70% A |
Net investment income (loss) | .16% | .47% | 1.39% | .58% A |
Supplemental Data | | | | |
Net assets, end of period (000 omitted) | $ 554,907 | $ 409,934 | $ 267,351 | $ 91 |
Portfolio turnover rate F | 18% | 21% | 34% | 30% |
A Annualized
B Total returns for periods of less than one year are not annualized.
C Total returns would have been lower if certain expenses had not been reduced during the applicable periods shown.
D Calculated based on average shares outstanding during the period.
E Fees and expenses of any underlying Fidelity Central Funds are not included in the Fund's expense ratio. The Fund indirectly bears its proportionate share of the expenses of any underlying Fidelity Central Funds.
F Amount does not include the portfolio activity of any underlying Fidelity Central Funds.
G For the period May 9, 2008 (commencement of sale of shares) to July 31, 2008.
H Expense ratios reflect operating expenses of the class. Expenses before reductions do not reflect amounts reimbursed by the investment adviser or reductions from brokerage service arrangements or reductions from other expense offset arrangements and do not represent the amount paid by the class during periods when reimbursements or reductions occur. Expense ratios before reductions for start-up periods may not be representative of longer-term operating periods. Expenses net of fee waivers reflect expenses after reimbursement by the investment adviser but prior to reductions from brokerage service arrangements or other expense offset arrangements. Expenses net of all reductions represent the net expenses paid by the class.
I Amount represents less than $.01 per share.
See accompanying notes which are an integral part of the financial statements.
Annual Report
Notes to Financial Statements
For the period ended July 31, 2011
(Amounts in thousands except ratios)
1. Organization.
Fidelity Leveraged Company Stock Fund (the Fund) is a fund of Fidelity Securities Fund (the Trust) and is authorized to issue an unlimited number of shares. The Trust is registered under the Investment Company Act of 1940, as amended (the 1940 Act), as an open-end management investment company organized as a Massachusetts business trust. The Fund offers Leveraged Company Stock and Class K shares, each of which has equal rights as to assets and voting privileges. Each class has exclusive voting rights with respect to matters that affect that class. Investment income, realized and unrealized capital gains and losses, the common expenses of the Fund, and certain fund-level expense reductions, if any, are allocated on a pro-rata basis to each class based on the relative net assets of each class to the total net assets of the Fund. Each class differs with respect to transfer agent fees incurred. Certain expense reductions may also differ by class.
2. Investments in Fidelity Central Funds.
The Fund invests in Fidelity Central Funds, which are open-end investment companies available only to other investment companies and accounts managed by Fidelity Management & Research Company (FMR) and its affiliates. The Fund's Schedule of Investments lists each of the Fidelity Central Funds held as of period end, if any, as an investment of the Fund, but does not include the underlying holdings of each Fidelity Central Fund. As an Investing Fund, the Fund indirectly bears its proportionate share of the expenses of the underlying Fidelity Central Funds.
The Money Market Central Funds seek preservation of capital and current income and are managed by Fidelity Investments Money Management, Inc. (FIMM), an affiliate of FMR.
A complete unaudited list of holdings for each Fidelity Central Fund is available upon request or at the Securities and Exchange Commission (the SEC) web site at www.sec.gov. In addition, the financial statements of the Fidelity Central Funds, which are not covered by the Fund's Report of Independent Registered Public Accounting Firm, are available on the SEC web site or upon request.
3. Significant Accounting Policies.
The financial statements have been prepared in conformity with accounting principles generally accepted in the United States of America (GAAP), which require management to make certain estimates and assumptions at the date of the financial statements. Actual results could differ from those estimates. Subsequent events, if any, through the date that the financial statements were issued have been evaluated in the preparation of the financial statements. The following summarizes the significant accounting policies of the Fund:
Annual Report
3. Significant Accounting Policies - continued
Security Valuation. Investments are valued as of 4:00 p.m. Eastern time on the last calendar day of the period. The Fund uses independent pricing services approved by the Board of Trustees to value its investments. When current market prices or quotations are not readily available or reliable, valuations may be determined in good faith in accordance with procedures adopted by the Board of Trustees. Factors used in determining value may include market or security specific events, changes in interest rates and credit quality. The frequency with which these procedures are used cannot be predicted and they may be utilized to a significant extent. The value used for net asset value (NAV) calculation under these procedures may differ from published prices for the same securities.
The Fund categorizes the inputs to valuation techniques used to value its investments into a disclosure hierarchy consisting of three levels as shown below:
Level 1 - quoted prices in active markets for identical investments
Level 2 - other significant observable inputs (including quoted prices for similar investments, interest rates, prepayment speeds, etc.)
Level 3 - unobservable inputs (including the Fund's own assumptions based on the best information available)
Changes in valuation techniques may result in transfers in or out of an assigned level within the disclosure hierarchy. The aggregate value of investments by input level, as of July 31, 2011, as well as a roll forward of Level 3 securities, is included at the end of the Fund's Schedule of Investments. Valuation techniques used to value the Fund's investments by major category are as follows:
Equity securities, including restricted securities, for which market quotations are readily available, are valued at the last reported sale price or official closing price as reported by an independent pricing service on the primary market or exchange on which they are traded and are categorized as Level 1 in the hierarchy. In the event there were no sales during the day or closing prices are not available, securities are valued at the last quoted bid price or may be valued using the last available price and are generally categorized as Level 2 in the hierarchy. For foreign equity securities, when significant market or security specific events arise, comparisons to the valuation of American Depositary Receipts (ADRs), futures contracts, Exchange-traded funds (ETFs) and certain indexes as well as quoted prices for similar securities are used and are categorized as Level 2 in the hierarchy in these circumstances. Utilizing these techniques may result in transfers between Level 1 and Level 2. For restricted equity securities and private placements where observable inputs are limited, assumptions about market activity and risk are used and are categorized as Level 3 in the hierarchy.
Annual Report
Notes to Financial Statements - continued
(Amounts in thousands except ratios)
3. Significant Accounting Policies - continued
Security Valuation - continued
Debt securities, including restricted securities, are valued based on evaluated prices received from independent pricing services or from dealers who make markets in such securities. For corporate bonds and floating rate loans, pricing services utilize matrix pricing which considers yield or price of bonds of comparable quality, coupon, maturity and type as well as dealer supplied prices and are generally categorized as Level 2 in the hierarchy. When independent prices are unavailable or unreliable, debt securities may be valued utilizing pricing matrices which consider similar factors that would be used by independent pricing services. These are generally categorized as Level 2 in the hierarchy but may be Level 3 depending on the circumstances.
Investments in open-end mutual funds, including the Fidelity Central Funds, are valued at their closing net asset value each business day and are categorized as Level 1 in the hierarchy.
Foreign Currency. The Fund may use foreign currency contracts to facilitate transactions in foreign-denominated securities. Gains and losses from these transactions may arise from changes in the value of the foreign currency or if the counterparties do not perform under the contracts' terms.
Foreign-denominated assets, including investment securities, and liabilities are translated into U.S. dollars at the exchange rate at period end. Purchases and sales of investment securities, income and dividends received and expenses denominated in foreign currencies are translated into U.S. dollars at the exchange rate in effect on the transaction date.
The effects of exchange rate fluctuations on investments are included with the net realized and unrealized gain (loss) on investment securities. Other foreign currency transactions resulting in realized and unrealized gain (loss) are disclosed separately.
Investment Transactions and Income. For financial reporting purposes, the Fund's investment holdings and NAV include trades executed through the end of the last business day of the period. The NAV per share for processing shareholder transactions is calculated as of the close of business of the New York Stock Exchange (NYSE), normally 4:00 p.m. Eastern time and includes trades executed through the end of the prior business day. Gains and losses on securities sold are determined on the basis of identified cost and may include proceeds received from litigation. Dividend income is recorded on the ex-dividend date, except for certain dividends from foreign securities where the ex-dividend date may have passed, which are recorded as soon as the Fund is informed of
Annual Report
3. Significant Accounting Policies - continued
Investment Transactions and Income - continued
the ex-dividend date. Non-cash dividends included in dividend income, if any, are recorded at the fair market value of the securities received. Distributions received on securities that represent a return of capital or capital gain are recorded as a reduction of cost of investments and/or as a realized gain. The Fund estimates the components of distributions received that may be considered return of capital distributions or capital gain distributions. Interest income and distributions from the Fidelity Central Funds are accrued as earned. Interest income includes coupon interest and amortization of premium and accretion of discount on debt securities. Investment income is recorded net of foreign taxes withheld where recovery of such taxes is uncertain. Debt obligations may be placed on non-accrual status and related interest income may be reduced by ceasing current accruals and writing off interest receivables when the collection of all or a portion of interest has become doubtful based on consistently applied procedures. A debt obligation is removed from non-accrual status when the issuer resumes interest payments or when collectability of interest is reasonably assured.
Expenses. Expenses directly attributable to a fund are charged to that fund. Expenses attributable to more than one fund are allocated among the respective funds on the basis of relative net assets or other appropriate methods. Expense estimates are accrued in the period to which they relate and adjustments are made when actual amounts are known.
Income Tax Information and Distributions to Shareholders. Each year, the Fund intends to qualify as a regulated investment company, including distributing substantially all of its taxable income and realized gains under Subchapter M of the Internal Revenue Code and filing its U.S. federal tax return. As a result, no provision for income taxes is required. As of July 31, 2011, the Fund did not have any unrecognized tax benefits in the financial statements. A fund's federal tax return is subject to examination by the Internal Revenue Service (IRS) for a period of three years. Foreign taxes are provided for based on the Fund's understanding of the tax rules and rates that exist in the foreign markets in which it invests.
Distributions are declared and recorded on the ex-dividend date. Income dividends and capital gain distributions are declared separately for each class. Income and capital gain distributions are determined in accordance with income tax regulations, which may differ from GAAP.
Capital accounts within the financial statements are adjusted for permanent book-tax differences. These adjustments have no impact on net assets or the results of operations. Temporary book-tax differences will reverse in a subsequent period.
Annual Report
Notes to Financial Statements - continued
(Amounts in thousands except ratios)
3. Significant Accounting Policies - continued
Income Tax Information and Distributions to Shareholders - continued
Book-tax differences are primarily due to the foreign currency transactions, market discount, equity-debt classifications, partnerships, non-taxable dividends, capital loss carryforwards and losses deferred due to wash sales.
The federal tax cost of investment securities and unrealized appreciation (depreciation) as of period end were as follows:
Gross unrealized appreciation | $ 1,091,369 |
Gross unrealized depreciation | (485,274) |
Net unrealized appreciation (depreciation) on securities and other investments | $ 606,095 |
| |
Tax Cost | $ 3,935,502 |
The tax-based components of distributable earnings as of period end were as follows:
Capital loss carryforward | $ (728,972) |
Net unrealized appreciation (depreciation) | $ 606,097 |
Under the recently enacted Regulated Investment Company Modernization Act of 2010 (the Act), the Fund will be permitted to carry forward capital losses incurred in taxable years beginning after December 22, 2010 for an unlimited period. However, any losses incurred during those future taxable years will be required to be utilized prior to any losses incurred in pre-enactment taxable years, which generally expire after eight years from when they are incurred. Additionally, post-enactment capital losses that are carried forward will retain their character as either short-term or long-term capital losses rather than being considered all short-term as under previous law. The Fund's first fiscal year end subject to the Act will be July 31, 2012.
The tax character of distributions paid was as follows:
| July 31, 2011 | July 31, 2010 |
Ordinary Income | $ 19,058 | $ 23,690 |
Annual Report
3. Significant Accounting Policies - continued
Short-Term Trading (Redemption) Fees. Shares held by investors in the Fund less than 90 days are subject to a redemption fee equal to 1.50% of the net asset value of shares redeemed. All redemption fees, which reduce the proceeds of the shareholder redemption, are retained by the Fund and accounted for as an addition to paid in capital.
New Accounting Pronouncement. In May 2011, the Financial Accounting Standards Board issued Accounting Standard Update No. 2011-04, Fair Value Measurement (Topic 820) - Amendments to Achieve Common Fair Value Measurement and Disclosure Requirements in U.S. GAAP and IFRSs. The update changes the wording used to describe the requirements in GAAP for measuring fair value and for disclosing information about fair value measurements. The update is effective during interim and annual periods beginning after December 15, 2011. Management is currently evaluating the impact of the update's adoption on the Fund's financial statement disclosures.
4. Operating Policies.
Restricted Securities. The Fund may invest in securities that are subject to legal or contractual restrictions on resale. These securities generally may be resold in transactions exempt from registration or to the public if the securities are registered. Disposal of these securities may involve time-consuming negotiations and expense, and prompt sale at an acceptable price may be difficult. Information regarding restricted securities is included at the end of the Fund's Schedule of Investments.
Loans and Other Direct Debt Instruments. The Fund may invest in loans and loan participations, trade claims or other receivables. These investments may include standby financing commitments, including revolving credit facilities, that obligate the Fund to supply additional cash to the borrower on demand. Loan participations involve a risk of insolvency of the lending bank or other financial intermediary. The Fund may be contractually obligated to receive approval from the agent bank and/or borrower prior to the sale of these investments.
5. Purchases and Sales of Investments.
Purchases and sales of securities, other than short-term securities, aggregated $807,901 and $1,685,183, respectively.
Annual Report
Notes to Financial Statements - continued
(Amounts in thousands except ratios)
6. Fees and Other Transactions with Affiliates.
Management Fee. FMR and its affiliates provide the Fund with investment management related services for which the Fund pays a monthly management fee. The management fee is the sum of an individual fund fee rate that is based on an annual rate of .35% of the Fund's average net assets and a group fee rate that averaged .26% during the period. The group fee rate is based upon the average net assets of all the mutual funds advised by FMR. The group fee rate decreases as assets under management increase and increases as assets under management decrease. For the period, the total annual management fee rate was .61% of the Fund's average net assets.
Transfer Agent Fees. Fidelity Investments Institutional Operations Company, Inc. (FIIOC), an affiliate of FMR, is the transfer, dividend disbursing and shareholder servicing agent for each class of the Fund. FIIOC receives account fees and asset-based fees that vary according to the account size and type of account of the shareholders of Leveraged Company Stock. FIIOC receives an asset-based fee of Class K's average net assets. FIIOC pays for typesetting, printing and mailing of shareholder reports, except proxy statements. For the period, transfer agent fees for each class were as follows:
| Amount | % of
Average
Net Assets |
Leveraged Company Stock | $ 8,747 | .21 |
Class K | 254 | .05 |
| $ 9,001 | |
Accounting and Security Lending Fees. Fidelity Service Company, Inc. (FSC), an affiliate of FMR, maintains the Fund's accounting records. The accounting fee is based on the level of average net assets for the month. Under a separate contract, FSC administers the security lending program. The security lending fee is based on the number and duration of lending transactions.
Brokerage Commissions. The Fund placed a portion of its portfolio transactions with brokerage firms which are affiliates of the investment adviser. The commissions paid to these affiliated firms were $45 for the period.
7. Committed Line of Credit.
The Fund participates with other funds managed by FMR or an affiliate in a $4.0 billion credit facility (the "line of credit") to be utilized for temporary or emergency purposes to fund shareholder redemptions or for other short-term liquidity purposes. The Fund has agreed to pay commitment fees on its pro-rata portion of the line of credit, which amounted to $16 and is reflected in Miscellaneous expenses on the Statement of Operations. During the period, there were no borrowings on this line of credit.
Annual Report
8. Security Lending.
The Fund lends portfolio securities through a lending agent from time to time in order to earn additional income. The lending agent may loan securities to certain qualified borrowers, including Fidelity Capital Markets (FCM), a broker-dealer affiliated with the Fund. On the settlement date of the loan, the Fund receives collateral (in the form of U.S. Treasury obligations, letters of credit and/or cash) against the loaned securities and maintains collateral in an amount not less than 100% of the market value of the loaned securities during the period of the loan. The market value of the loaned securities is determined at the close of business of the Fund and any additional required collateral is delivered to the Fund on the next business day. If the borrower defaults on its obligation to return the securities loaned because of insolvency or other reasons, a fund could experience delays and costs in recovering the securities loaned or in gaining access to the collateral. Any cash collateral received is the Fidelity Securities Lending Cash Central Fund. The value of loaned securities and cash collateral at period end are disclosed on the Fund's Statement of Assets and Liabilities. Security lending income represents the income earned on investing cash collateral, less rebates paid to borrowers and lending agent fees associated with the loan, plus any premium payments received for lending certain types of securities. Security lending income is presented in the Statement of Operations as a component of income from Fidelity Central Funds. Total security lending income during the period amounted to $526. During the period, there were no securities loaned to FCM.
9. Expense Reductions.
Many of the brokers with whom FMR places trades on behalf of the Fund provided services to the Fund in addition to trade execution. These services included payments of certain expenses on behalf of the Fund totaling $203 for the period. In addition, through arrangements with the Fund's custodian, credits realized as a result of uninvested cash balances were used to reduce the Fund's expenses. During the period, these credits reduced the Fund's custody expenses by $1.
10. Distributions to Shareholders.
Distributions to shareholders of each class were as follows:
Years ended July 31, | 2011 | 2010 |
From net investment income | | |
Leveraged Company Stock | $ 16,431 | $ 21,247 |
Class K | 2,627 | 2,443 |
Total | $ 19,058 | $ 23,690 |
Annual Report
Notes to Financial Statements - continued
(Amounts in thousands except ratios)
11. Share Transactions.
Transactions for each class of shares were as follows:
| Shares | Dollars |
Years ended July 31, | 2011 | 2010 A | 2011 | 2010 A |
Leveraged Company Stock | | | | |
Shares sold | 21,818 | 36,532 | $ 623,715 | $ 843,196 |
Conversion to Class K | - | (2,316) | - | (48,185) |
Reinvestment of distributions | 608 | 940 | 15,688 | 20,361 |
Shares redeemed | (55,621) | (55,646) | (1,504,254) | (1,272,555) |
Net increase (decrease) | (33,195) | (20,490) | $ (864,851) | $ (457,183) |
Class K | | | | |
Shares sold | 7,678 | 5,965 | $ 217,275 | $ 138,844 |
Conversion from Leveraged Company Stock | - | 2,315 | - | 48,185 |
Reinvestment of distributions | 103 | 113 | 2,627 | 2,443 |
Shares redeemed | (5,983) | (4,631) | (165,301) | (106,018) |
Net increase (decrease) | 1,798 | 3,762 | $ 54,601 | $ 83,454 |
A Conversion transactions for Class K and Leveraged Company Stock are presented for the period August 1, 2009 through August 31, 2009.
12. Other.
The Fund's organizational documents provide former and current trustees and officers with a limited indemnification against liabilities arising in connection with the performance of their duties to the Fund. In the normal course of business, the Fund may also enter into contracts that provide general indemnifications. The Fund's maximum exposure under these arrangements is unknown as this would be dependent on future claims that may be made against the Fund. The risk of material loss from such claims is considered remote.
Annual Report
To the Trustees of Fidelity Securities Fund and the Shareholders of Fidelity Leveraged Company Stock Fund:
In our opinion, the accompanying statement of assets and liabilities, including the schedule of investments, and the related statements of operations and of changes in net assets and the financial highlights present fairly, in all material respects, the financial position of Fidelity Leveraged Company Stock Fund (a fund of Fidelity Securities Fund) at July 31, 2011, the results of its operations for the year then ended, the changes in its net assets for each of the two years in the period then ended and the financial highlights for each of the periods indicated, in conformity with accounting principles generally accepted in the United States of America. These financial statements and financial highlights (hereafter referred to as "financial statements") are the responsibility of the Fidelity Leveraged Company Stock Fund's management. Our responsibility is to express an opinion on these financial statements based on our audits. We conducted our audits of these financial statements in accordance with the standards of the Public Company Accounting Oversight Board (United States). Those standards require that we plan and perform the audit to obtain reasonable assurance about whether the financial statements are free of material misstatement. An audit includes examining, on a test basis, evidence supporting the amounts and disclosures in the financial statements, assessing the accounting principles used and significant estimates made by management, and evaluating the overall financial statement presentation. We believe that our audits, which included confirmation of securities at July 31, 2011 by correspondence with the custodian and brokers, provide a reasonable basis for our opinion.
/s/PricewaterhouseCoopers LLP
PricewaterhouseCoopers LLP
Boston, Massachusetts
September 16, 2011
Annual Report
The Trustees, Members of the Advisory Board, and executive officers of the trusts and funds, as applicable, are listed below. The Board of Trustees governs each fund and is responsible for protecting the interests of shareholders. The Trustees are experienced executives who meet periodically throughout the year to oversee each fund's activities, review contractual arrangements with companies that provide services to each fund, oversee management of the risks associated with such activities and contractual arrangements, and review each fund's performance. Except for James C. Curvey, each of the Trustees oversees 221 funds advised by FMR or an affiliate. Mr. Curvey oversees 419 funds advised by FMR or an affiliate.
The Trustees hold office without limit in time except that (a) any Trustee may resign; (b) any Trustee may be removed by written instrument, signed by at least two-thirds of the number of Trustees prior to such removal; (c) any Trustee who requests to be retired or who has become incapacitated by illness or injury may be retired by written instrument signed by a majority of the other Trustees; and (d) any Trustee may be removed at any special meeting of shareholders by a two-thirds vote of the outstanding voting securities of the trust. Each Trustee who is not an interested person (as defined in the 1940 Act) (Independent Trustee), shall retire not later than the last day of the calendar year in which his or her 75th birthday occurs. The Independent Trustees may waive this mandatory retirement age policy with respect to individual Trustees. The executive officers and Advisory Board Members hold office without limit in time, except that any officer and Advisory Board Member may resign or may be removed by a vote of a majority of the Trustees at any regular meeting or any special meeting of the Trustees. Except as indicated, each individual has held the office shown or other offices in the same company for the past five years.
Experience, Skills, Attributes, and Qualifications of the Funds' Trustees. The Governance and Nominating Committee has adopted a statement of policy that describes the experience, qualifications, attributes, and skills that are necessary and desirable for potential Independent Trustee candidates (Statement of Policy). The Board believes that each Trustee satisfied at the time he or she was initially elected or appointed a Trustee, and continues to satisfy, the standards contemplated by the Statement of Policy. The Governance and Nominating Committee also engages professional search firms to help identify potential Independent Trustee candidates who have the experience, qualifications, attributes, and skills consistent with the Statement of Policy. From time to time, additional criteria based on the composition and skills of the current Independent Trustees, as well as experience or skills that may be appropriate in light of future changes to board composition, business conditions, and regulatory or other developments, have also been considered by the professional search firms and the Governance and Nominating Committee. In addition, the Board takes into account the Trustees' commitment and participation in Board and committee meetings, as well as their leadership of standing and ad hoc committees throughout their tenure.
In determining that a particular Trustee was and continues to be qualified to serve as a Trustee, the Board has considered a variety of criteria, none of which, in isolation, was controlling. The Board believes that, collectively, the Trustees have balanced and diverse experience, qualifications, attributes, and skills, which allow the Board to operate effectively in governing each fund and protecting the interests of shareholders. Information about the specific experience, skills, attributes, and qualifications of each Trustee, which in each case led to the Board's conclusion that the Trustee should serve (or continue to serve) as a trustee of the funds, is provided below.
Annual Report
Trustees and Officers - continued
Board Structure and Oversight Function. James C. Curvey is an interested person (as defined in the 1940 Act) and currently serves as Acting Chairman. The Trustees have determined that an interested Chairman is appropriate and benefits shareholders because an interested Chairman has a personal and professional stake in the quality and continuity of services provided to the funds. Independent Trustees exercise their informed business judgment to appoint an individual of their choosing to serve as Chairman, regardless of whether the Trustee happens to be independent or a member of management. The Independent Trustees have determined that they can act independently and effectively without having an Independent Trustee serve as Chairman and that a key structural component for assuring that they are in a position to do so is for the Independent Trustees to constitute a substantial majority for the Board. The Independent Trustees also regularly meet in executive session. Ned C. Lautenbach serves as Chairman of the Independent Trustees and as such (i) acts as a liaison between the Independent Trustees and management with respect to matters important to the Independent Trustees and (ii) with management prepares agendas for Board meetings.
Fidelity funds are overseen by different Boards of Trustees. The funds' Board oversees Fidelity's equity and high income funds and another Board oversees Fidelity's investment-grade bond, money market, and asset allocation funds. The asset allocation funds may invest in Fidelity funds overseen by the funds' Board. The use of separate Boards, each with its own committee structure, allows the Trustees of each group of Fidelity funds to focus on the unique issues of the funds they oversee, including common research, investment, and operational issues. On occasion, the separate Boards establish joint committees to address issues of overlapping consequences for the Fidelity funds overseen by each Board.
The Trustees operate using a system of committees to facilitate the timely and efficient consideration of all matters of importance to the Trustees, each fund, and fund shareholders and to facilitate compliance with legal and regulatory requirements and oversight of the funds' activities and associated risks. The Board, acting through its committees, has charged FMR and its affiliates with (i) identifying events or circumstances the occurrence of which could have demonstrably adverse effects on the funds' business and/or reputation; (ii) implementing processes and controls to lessen the possibility that such events or circumstances occur or to mitigate the effects of such events or circumstances if they do occur; and (iii) creating and maintaining a system designed to evaluate continuously business and market conditions in order to facilitate the identification and implementation processes described in (i) and (ii) above. Because the day-to-day operations and activities of the funds are carried out by or through FMR, its affiliates and other service providers, the funds' exposure to risks is mitigated but not eliminated by the processes overseen by the Trustees. While each of the Board's committees has responsibility for overseeing different aspects of the funds' activities, oversight is exercised primarily through the Operations, Audit, and Compliance Committees. Appropriate personnel, including but not limited to the funds' Chief Compliance Officer (CCO), FMR's internal auditor, the independent accountants, the funds' Treasurer and portfolio management personnel, make periodic reports to the Board's committees, as appropriate. The responsibilities of each committee, including their oversight responsibilities, are described further under "Standing Committees of the Funds' Trustees."
Annual Report
The fund's Statement of Additional Information (SAI) includes more information about the Trustees. To request a free copy, call Fidelity at 1-800-544-8544.
Interested Trustees*:
Correspondence intended for each Trustee who is an interested person may be sent to Fidelity Investments, 82 Devonshire Street, Boston, Massachusetts 02109.
Name, Age; Principal Occupations and Other Relevant Experience+ |
James C. Curvey (76) |
| Year of Election or Appointment: 2007 Mr. Curvey is Trustee and Acting Chairman of the Board of Trustees of certain Trusts. Mr. Curvey also serves as Trustee (2007-present) of other investment companies advised by FMR. Mr. Curvey is a Director of Fidelity Investments Money Management, Inc. (2009-present), Director of Fidelity Research & Analysis Co. (2009-present) and Director of FMR and FMR Co., Inc. (2007-present). Mr. Curvey is also Vice Chairman (2007-present) and Director of FMR LLC. In addition, Mr. Curvey serves as an Overseer for the Boston Symphony Orchestra and a member of the Trustees of Villanova University. Previously, Mr. Curvey was the Vice Chairman (2006-2007) and Director (2000-2007) of FMR Corp. |
Ronald P. O'Hanley (54) |
| Year of Election or Appointment: 2011 Mr. O'Hanley is Director of FMR Co., Inc. (2010-present), Director of Fidelity Investments Money Management, Inc. (2010-present), Director of Fidelity Research & Analysis Company (2010-present), President of Fidelity Asset Management and Corporate Services and a member of Fidelity's Executive Committee (2010-present). Previously, Mr. O'Hanley served as President and Chief Executive Officer of BNY Mellon Asset Management (2007-2010). Mr. O'Hanley also served as Vice Chairman of Bank New York Mellon Corp. and a member of that firm's Executive Committee. Prior to the 2007 merger of The Bank of New York and Mellon Financial Corporation, he was Vice Chairman of Mellon Financial Corporation and President and Chief Executive Officer of Mellon Asset Management. He joined Mellon in February 1997. Mr. O'Hanley currently serves as Chairman of the Boston Public Library Foundation Board of Directors and sits on the Board of Directors of Beth Israel Deaconess Medical Center, the Board of Trustees of the Marine Biological Laboratory and the Advisory Board of the Maxwell School of Citizenship and Public Administration at Syracuse University. Mr. O'Hanley also chairs the Council on Asset Management for the Financial Services Roundtable and is a member of the Board of Directors of Institutional Investor's U.S. Institute. |
* Trustees have been determined to be "Interested Trustees" by virtue of, among other things, their affiliation with the trusts or various entities under common control with FMR.
+ The information above includes each Trustee's principal occupation during the last five years and other information relating to the experience, attributes, and skills relevant to each Trustee's qualifications to serve as a Trustee, which led to the conclusion that each Trustee should serve as a Trustee for each fund.
Annual Report
Independent Trustees:
Correspondence intended for each Independent Trustee (that is, the Trustees other than the Interested Trustees) may be sent to Fidelity Investments, P.O. Box 55235, Boston, Massachusetts 02205-5235.
Name, Age; Principal Occupations and Other Relevant Experience+ |
Dennis J. Dirks (63) |
| Year of Election or Appointment: 2005 Prior to his retirement in May 2003, Mr. Dirks was Chief Operating Officer and a member of the Board of The Depository Trust & Clearing Corporation (DTCC). He also served as President, Chief Operating Officer, and Board member of The Depository Trust Company (DTC) and President and Board member of the National Securities Clearing Corporation (NSCC). In addition, Mr. Dirks served as Chief Executive Officer and Board member of the Government Securities Clearing Corporation, Chief Executive Officer and Board member of the Mortgage-Backed Securities Clearing Corporation, as a Trustee and a member of the Finance Committee of Manhattan College (2005-2008), and as a Trustee and a member of the Finance Committee of AHRC of Nassau County (2006-2008). Mr. Dirks is a member of the Independent Directors Council (IDC) Governing Council (2010-Present) and Board of Directors for The Brookville Center for Children's Services, Inc. (2009-present). |
Alan J. Lacy (57) |
| Year of Election or Appointment: 2008 Mr. Lacy serves as Senior Adviser (2007-present) of Oak Hill Capital Partners, L.P. (private equity). Mr. Lacy also served as Chief Executive Officer (2000-2005) and Vice Chairman (2005-2006) of Sears Holdings Corporation and Sears, Roebuck and Co. (retail). In addition, Mr. Lacy serves as a member of the Board of Directors of Dave & Buster's, Inc. (restaurant and entertainment complexes, 2010-present), The Hillman Companies, Inc. (hardware wholesalers, 2010-present), and Bristol-Myers Squibb Company (global pharmaceuticals, 2007-present). Mr. Lacy is a member of the Board of Trustees of The National Parks Conservation Association (2006-Present). Previously, Mr. Lacy served as Chairman of the Board of Trustees of the National Parks Conservation Association (2008-2011) and as a member of the Board of Directors for the Western Union Company (global money transfer, 2006-2011). |
Ned C. Lautenbach (67) |
| Year of Election or Appointment: 2000 Mr. Lautenbach is Chairman of the Independent Trustees of the Equity and High Income Funds (2006-present). Mr. Lautenbach currently serves as the Lead Director of the Eaton Corporation Board of Directors (diversified industrial, 1997-present). Mr. Lautenbach is also a member of the Board of Directors of the Philharmonic Center for the Arts in Naples, Florida (1999-present); a member of the Board of Trustees of Fairfield University (2005-present); and a member of the Council on Foreign Relations (1994-present). Previously, Mr. Lautenbach was a Partner/Advisory Partner at Clayton, Dubilier & Rice, LLC (private equity investment, 1998-2010), as well as a Director of Sony Corporation (2006-2007). |
Joseph Mauriello (66) |
| Year of Election or Appointment: 2008 Prior to his retirement in January 2006, Mr. Mauriello served in numerous senior management poitions including Deputy Chairman and Chief Operating Officer (2004-2005), and Vice Chairman of Financial Services (2002-2004) of KPMG LLP US (professional services, 1965-2005). Mr. Mauriello currently serves as a member of the Board of Directors of XL Group plc. (global insurance and re-insurance, 2006-present) and of Arcadia Resources Inc. (health care services and products, 2007-present). Previously, Mr. Mauriello served as a Director of the Hamilton Funds of the Bank of New York (2006-2007). |
Robert W. Selander (60) |
| Year of Election or Appointment: 2011 Previously, Mr. Selander served as a Member of the Advisory Board of Fidelity's Equity and High Income Funds (2011), Executive Vice Chairman (2010), Chief Executive Officer (2009-2010), and President and Chief Executive Officer (1997-2009) of Mastercard, Inc. |
Cornelia M. Small (67) |
| Year of Election or Appointment: 2005 Ms. Small is a member of the Board of Directors of the Teagle Foundation (2009-present). Ms. Small is also a member of the Investment Committee, and Chair (2008-present) and a member of the Board of Trustees of Smith College. In addition, Ms. Small serves on the Investment Committee of the Berkshire Taconic Community Foundation (2008-present). Previously, Ms. Small served as Chairperson of the Investment Committee (2002-2008) of Smith College. In addition, Ms. Small served as Chief Investment Officer, Director of Global Equity Investments, and a member of the Board of Directors of Scudder, Stevens & Clark and Scudder Kemper Investments. |
William S. Stavropoulos (72) |
| Year of Election or Appointment: 2001 or 2002 Trustee of Fidelity Puritan Trust: (2001). Trustee of Fidelity Securities Fund: (2002). Mr. Stavropoulos is Vice Chairman of the Independent Trustees of the Equity and High Income Funds (2006-present). Mr. Stavropoulos serves as President and Founder of the Michigan Baseball Foundation, the Great Lakes Loons (2007-present). Mr. Stavropoulos is Chairman Emeritus of the Board of Directors of The Dow Chemical Company, where he previously served in numerous senior management positions, including President, CEO (1995-2000; 2002-2004), Chairman of the Executive Committee (2000-2006), and as a member of the Board of Directors (1990-2006). Currently, Mr. Stavropoulos is Chairman of Univar (global distributor of commodity and specialty chemicals, 2010-present), a Director of Teradata Corporation (data warehousing and technology solutions, 2008-present), Chemical Financial Corporation, Maersk Inc. (industrial conglomerate), Tyco International, Inc. (multinational manufacturing and services, 2007-present), and a member of the Advisory Board for Metalmark Capital (private equity investment, 2005-present). Mr. Stavropoulos is a special advisor to Clayton, Dubilier & Rice, LLC (private equity investment). In addition, Mr. Stavropoulos is a member of the University of Notre Dame Advisory Council for the College of Science. |
David M. Thomas (62) |
| Year of Election or Appointment: 2008 Previously, Mr. Thomas served as Executive Chairman (2005-2006) and Chairman and Chief Executive Officer (2000-2005) of IMS Health, Inc. (pharmaceutical and healthcare information solutions). In addition, Mr. Thomas serves as a member of the Board of Directors of Fortune Brands, Inc. (consumer products), and Interpublic Group of Companies, Inc. (marketing communication, 2004-present). |
Michael E. Wiley (60) |
| Year of Election or Appointment: 2008 Mr. Wiley also serves as a Director of Asia Pacific Exploration Consolidated (international oil and gas exploration and production, 2008-present). Mr. Wiley serves as a Director of Tesoro Corporation (independent oil refiner and marketer, 2005-present), and a Director of Bill Barrett Corporation (exploration and production, 2005-present). In addition, Mr. Wiley also serves as a Director of Post Oak Bank (privately-held bank, 2004-present). Previously, Mr. Wiley served as a member of the Board of Trustees of the University of Tulsa (2000-2006; 2007-2010), as a Senior Energy Advisor of Katzenbach Partners, LLC (consulting, 2006-2007), as an Advisory Director of Riverstone Holdings (private investment), Chairman, President, and CEO of Baker Hughes, Inc. (oilfield services, 2000-2004), and as Director of Spinnaker Exploration Company (exploration and production, 2001-2005). |
+ The information above includes each Trustee's principal occupation during the last five years and other information relating to the experience, attributes, and skills relevant to each Trustee's qualifications to serve as a Trustee, which led to the conclusion that each Trustee should serve as a Trustee for each fund.
Advisory Board Members and Executive Officers:
Correspondence intended for each executive officer, Edward C. Johnson 3d, and Peter S. Lynch may be sent to Fidelity Investments, 82 Devonshire Street, Boston, Massachusetts 02109.
Name, Age; Principal Occupation |
Edward C. Johnson 3d (81) |
| Year of Election or Appointment: 2011 Member of the Advisory Board of Fidelity's Equity and High Income Funds. Mr. Johnson serves as Chief Executive Officer, Chairman, and a Director of FMR LLC, and also serves as Chairman and Director of FIL Limited. Previously, Mr. Johnson served as a Trustee and Chairman of the Board of certain Fidelity Trusts, Chairman and a Director of FMR, Chairman and a Director of FMR Co., Inc., and President of FMR LLC (2006-2007). |
Peter S. Lynch (67) |
| Year of Election or Appointment: 2003 Member of the Advisory Board of Fidelity's Equity and High Income Funds. Mr. Lynch is Vice Chairman and a Director of FMR and FMR Co., Inc. In addition, Mr. Lynch serves as a Trustee of Boston College and as the Chairman of the Inner-City Scholarship Fund. Previously, Mr. Lynch served on the Special Olympics International Board of Directors (1997-2006). |
Kenneth B. Robins (41) |
| Year of Election or Appointment: 2008 President and Treasurer of Fidelity's Equity and High Income Funds. Mr. Robins also serves as President and Treasurer (2010-present) and Assistant Treasurer (2009-present) of other Fidelity funds and is an employee of Fidelity Investments (2004-present). Previously, Mr. Robins served as Deputy Treasurer of the Fidelity funds (2005-2008) and Treasurer and Chief Financial Officer of The North Carolina Capital Management Trust: Cash and Term Portfolios (2006-2008). |
Thomas C. Hense (47) |
| Year of Election or Appointment: 2008 or 2010 Vice President of Fidelity's High Income (2008), Small Cap (2008), and Value (2010) Funds. Previously, Mr. Hense served as a portfolio manager for Fidelity's Institutional Money Market Management Group (Pyramis) (2003-2008). |
Brian B. Hogan (46) |
| Year of Election or Appointment: 2009 Vice President of Equity and High Income Funds. Mr. Hogan also serves as President of FMR's Equity Division (2009-present). Previously, Mr. Hogan served as Senior Vice President, Equity Research of FMR (2006-2009) and as a portfolio manager. |
Name, Age; Principal Occupation |
Scott C. Goebel (43) |
| Year of Election or Appointment: 2008 Secretary and Chief Legal Officer (CLO) of the Fidelity funds. Mr. Goebel also serves as Secretary of Fidelity Investments Money Management, Inc. (FIMM) (2010-present) and Fidelity Research and Analysis Company (FRAC) (2010-present); Secretary and CLO of The North Carolina Capital Management Trust: Cash and Term Portfolios (2008-present); General Counsel, Secretary, and Senior Vice President of FMR (2008-present) and FMR Co., Inc. (2008-present); employed by FMR LLC or an affiliate (2001-present); Chief Legal Officer of Fidelity Management & Research (Hong Kong) Limited (2008-present) and Assistant Secretary of Fidelity Management & Research (Japan) Inc. (2008-present), and Fidelity Management & Research (U.K.) Inc. (2008-present). Previously, Mr. Goebel served as Assistant Secretary of FIMM (2008-2010), FRAC (2008-2010), and the Funds (2007-2008) and as Vice President and Secretary of Fidelity Distributors Corporation (FDC) (2005-2007). |
William C. Coffey (42) |
| Year of Election or Appointment: 2009 Assistant Secretary of Fidelity's Equity and High Income Funds. Mr. Coffey also serves as Senior Vice President and Deputy General Counsel of FMR LLC (2010-present), and is an employee of Fidelity Investments. Previously, Mr. Coffey served as Vice President and Associate General Counsel of FMR LLC (2005-2009). |
Holly C. Laurent (57) |
| Year of Election or Appointment: 2008 Anti-Money Laundering (AML) Officer of the Fidelity funds. Ms. Laurent also serves as AML Officer of The North Carolina Capital Management Trust: Cash and Term Portfolios (2008-present) and is an employee of Fidelity Investments. Previously, Ms. Laurent was Senior Vice President and Head of Legal for Fidelity Business Services India Pvt. Ltd. (2006-2008), and Senior Vice President, Deputy General Counsel and Group Head for FMR LLC (2005-2006). |
Christine Reynolds (52) |
| Year of Election or Appointment: 2008 Chief Financial Officer of the Fidelity funds. Ms. Reynolds became President of Fidelity Pricing and Cash Management Services (FPCMS) in August 2008. Ms. Reynolds served as Chief Operating Officer of FPCMS (2007-2008). Previously, Ms. Reynolds served as President, Treasurer, and Anti-Money Laundering officer of the Fidelity funds (2004-2007). |
Kenneth A. Rathgeber (64) |
| Year of Election or Appointment: 2004 Chief Compliance Officer of Fidelity's Equity and High Income Funds. Mr. Rathgeber is Chief Compliance Officer of Fidelity Management & Research (Hong Kong) Limited (2008-present), Fidelity Management & Research (Japan) Inc. (2008-present), FMR (2005-present), FMR Co., Inc. (2005-present), Fidelity Management & Research (U.K.) Inc. (2005-present), Fidelity Research & Analysis Company (2005-present), Fidelity Investments Money Management, Inc. (2005-present), Pyramis Global Advisors, LLC (2005-present), and Strategic Advisers, Inc. (2005-present). |
Jeffrey S. Christian (49) |
| Year of Election or Appointment: 2009 Deputy Treasurer of the Fidelity funds. Mr. Christian is an employee of Fidelity Investments. Previously, Mr. Christian served as Chief Financial Officer (2008-2009) of certain Fidelity funds and Senior Vice President of Fidelity Pricing and Cash Management Services (FPCMS) (2004-2009). |
Bryan A. Mehrmann (50) |
| Year of Election or Appointment: 2005 Deputy Treasurer of the Fidelity funds. Mr. Mehrmann is an employee of Fidelity Investments. |
Adrien E. Deberghes (43) |
| Year of Election or Appointment: 2008 Deputy Treasurer of Fidelity's Equity and High Income Funds. Mr. Deberghes also serves as Assistant Treasurer of other Fidelity funds (2010-present) and is an employee of Fidelity Investments (2008-present). Previously, Mr. Deberghes served as Senior Vice President of Mutual Fund Administration at State Street Corporation (2007-2008), Senior Director of Mutual Fund Administration at Investors Bank & Trust (2005-2007), and Director of Finance for Dunkin' Brands (2000-2005). |
Stephanie J. Dorsey (42) |
| Year of Election or Appointment: 2010 Assistant Treasurer of Fidelity's Equity and High Income Funds. Ms. Dorsey also serves as Deputy Treasurer of other Fidelity funds (2008-present) and is an employee of Fidelity Investments (2008-present). Previously, Ms. Dorsey served as Treasurer (2004-2008) of the JPMorgan Mutual Funds and Vice President (2004-2008) of JPMorgan Chase Bank. |
John R. Hebble (53) |
| Year of Election or Appointment: 2009 Assistant Treasurer of Fidelity's Equity and High Income Funds. Mr. Hebble also serves as President (2011-present), Treasurer, and Chief Financial Officer of The North Carolina Capital Management Trust: Cash and Term Portfolios (2008-present), President and Treasurer of other Fidelity funds (2008-present) and is an employee of Fidelity Investments. |
Gary W. Ryan (52) |
| Year of Election or Appointment: 2005 Assistant Treasurer of the Fidelity funds. Mr. Ryan is an employee of Fidelity Investments. Previously, Mr. Ryan served as Vice President of Fund Reporting in Fidelity Pricing and Cash Management Services (FPCMS) (1999-2005). |
Jonathan Davis (43) |
| Year of Election or Appointment: 2010 Assistant Treasurer of the Fidelity funds. Mr. Davis is an employee of Fidelity Investments. Previously, Mr. Davis served as Vice President and Associate General Counsel of FMR LLC (2003-2010). |
Annual Report
Leveraged Company Stock designates 100% of the dividends distributed during the fiscal year as qualifying for the dividends-received deduction for corporate shareholders.
Leveraged Company Stock designates 100% of the dividends distributed during the fiscal year as amounts which may be taken into account as a dividend for the purposes of the maximum rate under section 1(h)(11) of the Internal Revenue Code.
The fund will notify shareholders in January 2012 of amounts for use in preparing 2011 income tax returns.
Annual Report
Board Approval of Investment Advisory Contracts and Management Fees
Fidelity Leveraged Company Stock Fund
Each year, the Board of Trustees, including the Independent Trustees (together, the Board), votes on the renewal of the management contract and sub-advisory agreements (together, the Advisory Contracts) for the fund. The Board, assisted by the advice of fund counsel and Independent Trustees' counsel, requests and considers a broad range of information relevant to the renewal of the Advisory Contracts throughout the year.
The Board meets regularly and considers at each of its meetings factors that are relevant to its annual consideration of the renewal of the fund's Advisory Contracts, including the services and support provided to the fund and its shareholders. The Board has established various standing committees, each composed of Independent Trustees with varying backgrounds, to which the Board has assigned specific subject matter responsibilities in order to enhance effective decision-making by the Board. The Board, acting directly and through its Committees, requests and receives information concerning the annual consideration of the renewal of the fund's Advisory Contracts. The Board also meets as needed to consider matters specifically related to the Board's annual consideration of the renewal of Advisory Contracts. Members of the Board may also meet with trustees of other Fidelity funds through ad hoc joint committees to discuss certain matters relevant to the Fidelity funds.
At its July 2011 meeting, the Board of Trustees, including the Independent Trustees, unanimously determined to renew the fund's Advisory Contracts. In reaching its determination, the Board considered all factors it believed relevant, including (i) the nature, extent, and quality of the services to be provided to the fund and its shareholders (including the investment performance of the fund); (ii) the competitiveness of the fund's management fee and total expense ratio; (iii) the total costs of the services to be provided by and the profits to be realized by Fidelity from its relationship with the fund; (iv) the extent to which economies of scale would be realized as the fund grows; and (v) whether fee levels reflect these economies of scale, if any, for the benefit of fund shareholders.
In considering whether to renew the Advisory Contracts for the fund, the Board reached a determination, with the assistance of fund counsel and Independent Trustees' counsel and through the exercise of its business judgment, that the renewal of the Advisory Contracts is in the best interests of the fund and its shareholders and that the compensation payable under the Advisory Contracts is fair and reasonable. The Board's decision to renew the Advisory Contracts was not based on any single factor, but rather was based on a comprehensive consideration of all the information provided to the Board at its meetings throughout the year. The Board, in reaching its determination to renew the Advisory Contracts, is aware that shareholders in the fund have a broad range of investment choices available to them, including a wide choice among mutual funds offered by Fidelity's competitors, and that the fund's shareholders, who have the opportunity to review and weigh the disclosure provided by the fund in its prospectus and other public disclosures, have chosen to invest in this fund, managed by Fidelity.
Annual Report
Nature, Extent, and Quality of Services Provided. The Board considered the staffing within the investment adviser, FMR, and the sub-advisers (together, the Investment Advisers), including the backgrounds of the fund's investment personnel and the fund's investment objective and discipline. The Independent Trustees also had discussions with senior management of Fidelity's investment operations and investment groups. The Board considered the structure of the portfolio manager compensation program and whether this structure provides appropriate incentives to act in the best interests of the fund.
Resources Dedicated to Investment Management and Support Services. The Board and the Fund Oversight and Research Committees reviewed the general qualifications and capabilities of the Investment Advisers' investment staff, including its size, education, experience, and resources, as well as the Investment Advisers' approach to recruiting, training, managing, and compensating investment personnel. The Board also noted that FMR has devoted increased resources to non-U.S. offices. The Board noted that Fidelity's analysts have extensive resources, tools and capabilities which allow them to conduct sophisticated quantitative and fundamental analysis, as well as credit analysis of issuers, counterparties and enhancers. The Board also believes that Fidelity's investment professionals have sufficient access to global information and data so as to provide competitive investment results over time, and that those professionals also have access to sophisticated tools which permit them to assess portfolio construction and risk and performance attribution characteristics continuously, as well as to transmit new information and research conclusions rapidly around the world. Additionally, in their deliberations, the Board considered the Investment Advisers' trading capabilities and resources which are an integral part of the investment management process.
Shareholder and Administrative Services. The Board considered (i) the nature, extent, quality, and cost of advisory, administrative, and shareholder services performed by the Investment Advisers and their affiliates under the Advisory Contracts and under separate agreements covering transfer agency, pricing and bookkeeping, and securities lending services for the fund; (ii) the nature and extent of the investment adviser's supervision of third party service providers, principally custodians and subcustodians; and (iii) the resources devoted to, and the record of compliance with, the fund's compliance policies and procedures. The Board also reviewed the allocation of fund brokerage, including allocations to brokers affiliated with the Investment Advisers, the use of brokerage commissions to pay fund expenses, and the use of "soft" commission dollars to pay for research services.
The Board noted that the growth of fund assets over time across the complex allows Fidelity to reinvest in the development of services designed to enhance the value or convenience of the Fidelity funds as investment vehicles. These services include 24-hour access to account information and market information through telephone representatives and over the Internet, investor education materials and asset allocation tools, and the expanded availability of Fidelity Investor Centers, with 35 new branches opening since 2010.
Annual Report
Board Approval of Investment Advisory Contracts and
Management Fees - continued
Investment in a Large Fund Family. The Board considered the benefits to shareholders of investing in a Fidelity fund, including the benefits of investing in a fund that is part of a large family of funds offering a variety of investment disciplines and providing a large variety of mutual fund investor services. The Board noted that Fidelity had taken, or had made recommendations that resulted in the Fidelity funds taking, a number of actions over the previous year that benefited particular funds, including (i) continuing to dedicate additional resources to investment research and support of the senior management team that oversees asset management; (ii) rationalizing product lines through the mergers of six funds into other funds; (iii) continuing to migrate the Freedom Funds to dedicated lower cost underlying funds; (iv) obtaining shareholder approval to broaden the investment strategies for Fidelity Consumer Finance Portfolio, Fidelity Emerging Asia Fund, and Fidelity Environment and Alternative Energy Portfolio; (v) contractually agreeing to reduce the management fees and impose other expense limitations on Spartan® 500 Index Fund and U.S. Bond Index Fund in connection with launching new institutional classes of these funds; (vi) changing the name, primary and supplemental benchmarks, and investment policies of Fidelity Global Strategies Fund to support the fund's flexible investment mandate and global orientation; and (vii) reducing the transfer agency account fee rates on certain accounts.
Investment Performance. The Board considered whether the fund has operated in accordance with its investment objective, as well as its record of compliance with its investment restrictions. It also reviewed the fund's absolute investment performance for each class, as well as the fund's relative investment performance for each class measured over multiple periods against (i) a broad-based securities market index, and (ii) a custom peer group of mutual funds deemed appropriate by Fidelity and reviewed by the Board. The following charts considered by the Board show, over the one-, three-, and five-year periods ended December 31, 2010, as available, the cumulative total returns of Class K and the retail class of the fund, the cumulative total returns of a broad-based securities market index ("benchmark"), and a range of cumulative total returns of a custom peer group of mutual funds defined by FMR based on categories assigned by Morningstar, Inc. The box within each chart shows the 25th percentile return (bottom of box) and the 75th percentile return (top of box) of the peer group. Returns shown above the box are in the first quartile and returns shown below the box are in the fourth quartile. The percentage beaten numbers noted below each chart correspond to the percentile box and represent the percentage of funds in the peer group whose performance was equal to or lower than that of the class indicated. The fund's custom peer group, defined by FMR, is a peer group that FMR believes provides a more meaningful performance comparison than the peer group assigned by Morningstar, Inc., which assigns mutual funds to categories based on their investment styles as measured by their underlying portfolio holdings.
Annual Report
Fidelity Leveraged Company Stock Fund

The Board reviewed the fund's relative investment performance against its peer group and noted that the performance of the retail class of the fund (the class with the longer performance record) was in the third quartile for the one-year period, the fourth quartile for the three-year period, and the second quartile for the five-year period. The Board also noted that the investment performance of the retail class of the fund compared favorably to its benchmark for the three- and five-year periods, although the one-year total return of the retail class of the fund was lower than its benchmark. The Board considered that the variations in performance between the fund's classes reflect the variations in class expenses, which result in lower performance for the higher expense class. The Board discussed with FMR actions that have been taken by FMR to improve the fund's disappointing performance relative to its peer group. The Board also reviewed the fund's performance since inception as well as performance in the current year. The Board will continue to closely monitor the performance of the fund in the coming year and discuss with FMR other appropriate actions to address the performance of the fund.
Based on its review, the Board concluded that the nature, extent, and quality of services provided to the fund under the Advisory Contracts should benefit the fund's shareholders.
Competitiveness of Management Fee and Total Expense Ratio. The Board considered the fund's management fee and total expense ratio compared to "mapped groups" of competitive funds and classes. Fidelity creates "mapped groups" by combining similar Lipper investment objective categories that have comparable management fee characteristics. Combining Lipper investment objective categories aids the Board's management fee and total expense ratio comparisons by broadening the competitive group used for comparison and by reducing the number of universes to which various Fidelity funds are compared.
Annual Report
Board Approval of Investment Advisory Contracts and
Management Fees - continued
Management Fee. The Board considered two proprietary management fee comparisons for the 12-month periods shown in the chart below. The group of Lipper funds used by the Board for management fee comparisons is referred to below as the "Total Mapped Group." The Total Mapped Group comparison focuses on a fund's standing relative to the total universe of comparable funds available to investors in terms of gross management fees before expense reimbursements or caps. "TMG %" represents the percentage of funds in the Total Mapped Group that had management fees that were lower than the fund's. For example, a TMG % of 17% means that 83% of the funds in the Total Mapped Group had higher management fees than the fund. The "Asset-Size Peer Group" (ASPG) comparison focuses on a fund's standing relative to non-Fidelity funds similar in size to the fund within the Total Mapped Group. The ASPG represents at least 15% of the funds in the Total Mapped Group with comparable asset size and management fee characteristics, subject to a minimum of 50 funds (or all funds in the Total Mapped Group if fewer than 50). Additional information, such as the ASPG quartile in which the fund's management fee ranked, is also included in the chart and considered by the Board.
Fidelity Leveraged Company Stock Fund

Annual Report
The Board noted that the fund's management fee ranked below the median of its Total Mapped Group and below the median of its ASPG for 2010.
Based on its review, the Board concluded that the fund's management fee is fair and reasonable in light of the services that the fund receives and the other factors considered.
Total Expense Ratio. In its review of each class's total expense ratio, the Board considered the fund's management fee as well as other fund or class expenses, as applicable, such as transfer agent fees, pricing and bookkeeping fees, and custodial, legal, and audit fees. The Board also noted the effects of any waivers and reimbursements on fees and expenses. As part of its review, the Board also considered the current and historical total expense ratios of each class of the fund compared to competitive fund median expenses. Each class of the fund is compared to those funds and classes in the Total Mapped Group (used by the Board for management fee comparisons) that have a similar sales load structure.
The Board noted that the total expense ratio of each class ranked below its competitive median for 2010. The Board considered that various factors, including 12b-1 fees, positive or negative performance adjustments, and relatively higher other expenses in the case of small fund size, can affect total expense ratios.
Fees Charged to Other Fidelity Clients. The Board also considered Fidelity fee structures and other information with respect to clients of FMR and its affiliates, such as other mutual funds advised or subadvised by FMR or its affiliates, pension plan clients, and other institutional clients. In March 2010, the Board created an ad hoc joint committee with the board of other Fidelity funds (the Committee) to review and compare Fidelity's institutional investment advisory business with its business of providing services to the Fidelity funds, including the differences in services provided, fees charged, and costs incurred, as well as competition in their respective marketplaces.
Based on its review of total expense ratios and fees charged to other Fidelity clients, the Board concluded that the total expense ratio of each class of the fund was reasonable in light of the services that the fund and its shareholders receive and the other factors considered, including the findings of the Committee.
Costs of the Services and Profitability. The Board considered the revenues earned and the expenses incurred by Fidelity in conducting the business of developing, marketing, distributing, managing, administering and servicing the fund and its shareholders. The Board also considered the level of Fidelity's profits in respect of all the Fidelity funds.
On an annual basis, FMR presents to the Board Fidelity's profitability for the fund. Fidelity calculates the profitability for each fund, as well as aggregate profitability for groups of Fidelity funds and all Fidelity funds, using a series of detailed revenue and cost allocation methodologies which originate with the books and records of Fidelity on which Fidelity's audited financial statements are based. The Audit Committee of the Board reviews any significant changes from the prior year's methodologies.
Annual Report
Board Approval of Investment Advisory Contracts and
Management Fees - continued
PricewaterhouseCoopers LLP (PwC), independent registered public accounting firm and auditor to Fidelity and certain Fidelity funds, has been engaged annually by the Board as part of the Board's assessment of Fidelity's profitability analysis. PwC's engagement includes the review and assessment of Fidelity's methodologies used in determining the revenues and expenses attributable to Fidelity's mutual fund business, and completion of agreed-upon procedures surrounding the mathematical accuracy of fund profitability and its conformity to allocation methodologies. After considering PwC's reports issued under the engagement and information provided by Fidelity, the Board concluded that while other allocation methods may also be reasonable, Fidelity's profitability methodologies are reasonable in all material respects.
The Board also reviewed Fidelity's non-fund businesses and fall-out benefits related to the mutual fund business as well as cases where Fidelity's affiliates may benefit from or be related to the fund's business.
The Board considered the costs of the services provided by and the profits realized by Fidelity in connection with the operation of the fund and was satisfied that the profitability was not excessive in the circumstances.
Economies of Scale. The Board considered whether there have been economies of scale in respect of the management of the Fidelity funds, whether the Fidelity funds (including the fund) have appropriately benefited from any such economies of scale, and whether there is potential for realization of any further economies of scale. The Board considered the extent to which the fund will benefit from economies of scale through increased services to the fund, through waivers or reimbursements, or through fee or expense reductions. The Board also noted that in 2009, it and the board of other Fidelity funds created an ad hoc committee (the Economies of Scale Committee) to analyze whether FMR attains economies of scale in respect of the management and servicing of the Fidelity funds, whether the Fidelity funds have appropriately benefited from such economies of scale, and whether there is potential for realization of any further economies of scale.
The Board recognized that the fund's management contract incorporates a "group fee" structure, which provides for lower group fee rates as total fund assets under FMR's management increase, and for higher group fee rates as total fund assets under FMR's management decrease. FMR calculates the group fee rates based on a tiered asset "breakpoint" schedule that varies based on asset class. The Board considered that the group fee is designed to deliver the benefits of economies of scale to fund shareholders when total Fidelity fund assets increase, even if assets of any particular fund are unchanged or have declined, because some portion of Fidelity's costs are attributable to services provided to all Fidelity funds, and all funds benefit if those costs can be allocated among more assets. The Board concluded that, given the group fee structure, fund shareholders will benefit from lower management fees as assets under FMR's management increase at the fund complex level, regardless of whether Fidelity achieves any such economies of scale.
Annual Report
The Board concluded, taking into account the analysis of the Economies of Scale Committee, that any potential economies of scale are being appropriately shared between fund shareholders and Fidelity.
Additional Information Requested by the Board. In order to develop fully the factual basis for consideration of the Fidelity funds' Advisory Contracts, the Board requested and received additional information on certain topics, including (i) fund performance trends, actions to be taken by FMR to improve certain funds' overall performance, and Fidelity's long-term strategies for certain funds; (ii) portfolio manager changes that have occurred during the past year and length of portfolio manager tenure for different categories of funds over time; (iii) Fidelity's compensation structure for portfolio managers and other key personnel and strategies for attracting and retaining non-investment personnel; (iv) the amount of the investment that each portfolio manager has made in the Fidelity fund(s) that he or she manages; (v) historical trends in Fidelity's realization of fall-out benefits; (vi) Fidelity's group fee structures and the rationale for the individual fee rates of certain funds; (vii) fund profitability methodology and the impact of certain factors on fund profitability results; (viii) trends regarding industry use of performance fee structures and Fidelity's compliance practices with respect to performance adjustment calculations; (ix) the fee structures in place for certain other Fidelity clients; and (x) explanations regarding the relative total expense ratios of certain funds and classes, total expense competitive trends, and actions that might be taken by FMR to reduce total expense ratios for certain funds and classes.
Based on its evaluation of all of the conclusions noted above, and after considering all factors it believed relevant, the Board ultimately concluded that the advisory fee structures are fair and reasonable, and that the fund's Advisory Contracts should be renewed.
Annual Report
Managing Your Investments
Fidelity offers several ways to conveniently manage your personal investments via your telephone or PC. You can access your account information, conduct trades and research your investments 24 hours a day.
By Phone
Fidelity Automated Service Telephone provides a single toll-free number to access account balances, positions, quotes and trading. It's easy to navigate the service, and on your first call, the system will help you create a personal identification number (PIN) for security.
(phone_graphic)
Fidelity Automated
Service Telephone (FAST®)
1-800-544-5555
Press
For mutual fund and brokerage trading.
For quotes.*
For account balances and holdings.
To review orders and mutual
fund activity.
To change your PIN.
To speak to a Fidelity representative.
By PC
Fidelity's web site on the Internet provides a wide range of information, including daily financial news, fund performance, interactive planning tools and news about Fidelity products and services.
(computer_graphic)
Fidelity's Web Site
www.fidelity.com
* When you call the quotes line, please remember that a fund's yield and return will vary and, except for money market funds, share price will also vary. This means that you may have a gain or loss when you sell your shares. There is no assurance that money market funds will be able to maintain a stable $1 share price; an investment in a money market fund is not insured or guaranteed by the U.S. government. Total returns are historical and include changes in share price, reinvestment of dividends and capital gains distributions, and the effects of any sales charges.
Annual Report
To Write Fidelity
We'll give your correspondence immediate attention and send you written confirmation upon completion of your request.
(letter_graphic)
Making Changes
To Your Account
(such as changing name, address, bank, etc.)
Fidelity Investments
P.O. Box 770001
Cincinnati, OH 45277-0002
(letter_graphic)
For Non-Retirement
Accounts
Buying shares
Fidelity Investments
P.O. Box 770001
Cincinnati, OH 45277-0003
Overnight Express
Fidelity Investments
Attn: Distribution Services
100 Crosby Parkway - KC1H
Covington, KY 41015
Selling shares
Fidelity Investments
P.O. Box 770001
Cincinnati, OH 45277-0035
Overnight Express
Fidelity Investments
Attn: Distribution Services
100 Crosby Parkway - KC1H
Covington, KY 41015
General Correspondence
Fidelity Investments
P.O. Box 500
Merrimack, NH 03054-0500
(letter_graphic)
For Retirement
Accounts
Buying shares
Fidelity Investments
P.O. Box 770001
Cincinnati, OH 45277-0003
Selling shares
Fidelity Investments
P.O. Box 770001
Cincinnati, OH 45277-0035
Overnight Express
Fidelity Investments
Attn: Distribution Services
100 Crosby Parkway - KC1H
Covington, KY 41015
General Correspondence
Fidelity Investments
P.O. Box 500
Merrimack, NH 03054-0500
Annual Report
To Visit Fidelity
For directions and hours,
please call 1-800-544-9797.
Arizona
7001 West Ray Road
Chandler, AZ
15445 N. Scottsdale Road
Scottsdale, AZ
17550 North 75th Avenue
Glendale, AZ
5330 E. Broadway Blvd
Tucson, AZ
California
815 East Birch Street
Brea, CA
1411 Chapin Avenue
Burlingame, CA
851 East Hamilton Avenue
Campbell, CA
601 Larkspur Landing Circle
Larkspur, CA
2000 Avenue of the Stars
Los Angeles, CA
27101 Puerta Real
Mission Viejo, CA
73575 El Paseo
Palm Desert, CA
251 University Avenue
Palo Alto, CA
123 South Lake Avenue
Pasadena, CA
16656 Bernardo Ctr. Drive
Rancho Bernardo, CA
1220 Roseville Parkway
Roseville, CA
1740 Arden Way
Sacramento, CA
7676 Hazard Center Drive
San Diego, CA
11943 El Camino Real
San Diego, CA
8 Montgomery Street
San Francisco, CA
3793 State Street
Santa Barbara, CA
1200 Wilshire Boulevard
Santa Monica, CA
398 West El Camino Real
Sunnyvale, CA
111 South Westlake Blvd
Thousand Oaks, CA
21701 Hawthorne Boulevard
Torrance, CA
2001 North Main Street
Walnut Creek, CA
6326 Canoga Avenue
Woodland Hills, CA
2211 Michelson Drive
Irvine, CA
Colorado
281 East Flatiron Circle
Broomfield, CO
1625 Broadway
Denver, CO
9185 Westview Road
Lone Tree, CO
Connecticut
48 West Putnam Avenue
Greenwich, CT
265 Church Street
New Haven, CT
300 Atlantic Street
Stamford, CT
29 South Main Street
West Hartford, CT
1261 Post Road
Fairfield, CT
Delaware
400 Delaware Avenue
Wilmington, DE
Florida
175 East Altamonte Drive
Altamonte Springs, FL
1400 Glades Road
Boca Raton, FL
121 Alhambra Plaza
Coral Gables, FL
2948 N. Federal Highway
Ft. Lauderdale, FL
4671 Town Center Parkway
Jacksonville, FL
8880 Tamiami Trail, North
Naples, FL
230 Royal Palm Way
Palm Beach, FL
3501 PGA Boulevard
Palm Beach Gardens, FL
3550 Tamiami Trail, South
Sarasota, FL
1502 N. Westshore Blvd.
Tampa, FL
2465 State Road 7
Wellington, FL
Georgia
3242 Peachtree Road
Atlanta, GA
1000 Abernathy Road
Atlanta, GA
Illinois
One North LaSalle Street
Chicago, IL
401 North Michigan Avenue
Chicago, IL
One Skokie Valley Road
Highland Park, IL
1415 West 22nd Street
Oak Brook, IL
15105 S LaGrange Road
Orland Park, IL
1572 East Golf Road
Schaumburg, IL
1823 Freedom Drive
Naperville, IL
Indiana
8480 Keystone Crossing
Indianapolis, IN
Kansas
5400 College Boulevard
Overland Park, KS
Maine
Three Canal Plaza
Portland, ME
Maryland
7315 Wisconsin Avenue
Bethesda, MD
610 York Road
Towson, MD
Massachusetts
801 Boylston Street
Boston, MA
155 Congress Street
Boston, MA
300 Granite Street
Braintree, MA
44 Mall Road
Burlington, MA
238 Main Street
Cambridge, MA
200 Endicott Street
Danvers, MA
Fidelity Brokerage Services, Inc., 100 Summer St., Boston, MA 02110 Member NYSE/SIPC
Annual Report
405 Cochituate Road
Framingham, MA
551 Boston Turnpike
Shrewsbury, MA
Michigan
500 E. Eisenhower Pkwy.
Ann Arbor, MI
280 N. Old Woodward Ave.
Birmingham, MI
30200 Northwestern Hwy.
Farmington Hills, MI
43420 Grand River Avenue
Novi, MI
3480 28th Street
Grand Rapids, MI
2425 S. Linden Road STE E
Flint, MI
Minnesota
7740 France Avenue South
Edina, MN
8342 3rd Street North
Oakdale, MN
Missouri
1524 South Lindbergh Blvd.
St. Louis, MO
Nevada
2225 Village Walk Drive
Henderson, NV
New Jersey
501 Route 73 South
Marlton, NJ
150 Essex Street
Millburn, NJ
35 Morris Street
Morristown, NJ
396 Route 17, North
Paramus, NJ
3518 Route 1 North
Princeton, NJ
530 Broad Street
Shrewsbury, NJ
New Mexico
2261 Q Street NE
Albuquerque, NM
New York
1130 Franklin Avenue
Garden City, NY
37 West Jericho Turnpike
Huntington Station, NY
1271 Avenue of the Americas
New York, NY
980 Madison Avenue
New York, NY
61 Broadway
New York, NY
350 Park Avenue
New York, NY
200 Fifth Avenue
New York, NY
733 Third Avenue
New York, NY
2070 Broadway
New York, NY
1075 Northern Blvd.
Roslyn, NY
799 Central Park Avenue
Scarsdale, NY
3349 Monroe Avenue
Rochester, NY
North Carolina
4611 Sharon Road
Charlotte, NC
7011 Fayetteville Road
Durham, NC
Ohio
3805 Edwards Road
Cincinnati, OH
1324 Polaris Parkway
Columbus, OH
1800 Crocker Road
Westlake, OH
28699 Chagrin Boulevard
Woodmere Village, OH
Oregon
7493 SW Bridgeport Road
Tigard, OR
Pennsylvania
600 West DeKalb Pike
King of Prussia, PA
1735 Market Street
Philadelphia, PA
12001 Perry Highway
Wexford, PA
Rhode Island
10 Memorial Boulevard
Providence, RI
Tennessee
3018 Peoples Street
Johnson City, TN
7628 West Farmington Blvd.
Germantown, TN
2035 Mallory Lane
Franklin, TN
Texas
10000 Research Boulevard
Austin, TX
4001 Northwest Parkway
Dallas, TX
12532 Memorial Drive
Houston, TX
2701 Drexel Drive
Houston, TX
6560 Fannin Street
Houston, TX
1701 Lake Robbins Drive
The Woodlands, TX
6500 N. MacArthur Blvd.
Irving, TX
6005 West Park Boulevard
Plano, TX
1576 East Southlake Blvd.
Southlake, TX
15600 Southwest Freeway
Sugar Land, TX
139 N. Loop 1604 East
San Antonio, TX
Utah
279 West South Temple
Salt Lake City, UT
Virginia
1861 International Drive
McLean, VA
11957 Democracy Drive
Reston, VA
Washington
10500 NE 8th Street
Bellevue, WA
1518 6th Avenue
Seattle, WA
304 Strander Blvd
Tukwila, WA
Washington, DC
1900 K Street, N.W.
Washington, DC
Wisconsin
16020 West Bluemound Road
Brookfield, WI
Annual Report
Investment Adviser
Fidelity Management & Research Company
Boston, MA
Investment Sub-Adviser
FMR Co., Inc.
Fidelity Management & Research
(U.K.) Inc.
Fidelity Management & Research
(Hong Kong) Limited
Fidelity Management & Research
(Japan) Inc.
General Distributor
Fidelity Distributors Corporation
Boston, MA
Transfer and Service Agents
Fidelity Investments Institutional
Operations Company, Inc.
Boston, MA
Fidelity Service Company, Inc.
Boston, MA
Custodian
JPMorgan Chase Bank
New York, NY
The Fidelity Telephone Connection
Mutual Fund 24-Hour Service
Exchanges/Redemptions
and Account Assistance 1-800-544-6666
Product Information 1-800-544-6666
Retirement Accounts 1-800-544-4774
(8 a.m. - 9 p.m.)
TDD Service 1-800-544-0118
for the deaf and hearing impaired
(9 a.m. - 9 p.m. Eastern time)
Fidelity Automated Service
Telephone (FAST®) 1-800-544-5555
Automated line for quickest service
LSF-UANN-0911
1.789248.108
Fidelity®
Leveraged Company Stock
Fund -
Class K
Annual Report
July 31, 2011
(2_fidelity_logos) (Registered_Trademark)
Contents
Chairman's Message | <Click Here> | The Chairman's message to shareholders. |
Performance | <Click Here> | How the fund has done over time. |
Management's Discussion of Fund Performance | <Click Here> | The Portfolio Manager's review of fundperformance and strategy. |
Shareholder Expense Example | <Click Here> | An example of shareholder expenses. |
Investment Changes | <Click Here> | A summary of major shifts in the fund's investments over the last six months. |
Investments | <Click Here> | A complete list of the fund's investments with their market values. |
Financial Statements | <Click Here> | Statements of assets and liabilities, operations, and changes in net assets, as well as financial highlights. |
Notes | <Click Here> | Notes to the financial statements. |
Report of Independent Registered Public Accounting Firm | <Click Here> | |
Trustees and Officers | <Click Here> | |
Distributions | <Click Here> | |
Board Approval of Investment Advisory Contracts and Management Fees | <Click Here> | |
To view a fund's proxy voting guidelines and proxy voting record for the 12-month period ended June 30, visit http://www.fidelity.com/proxyvotingresults or visit the Securities and Exchange Commission's (SEC) web site at http://www.sec.gov. You may also call 1-800-835-5092 to request a free copy of the proxy voting guidelines.
Standard & Poor's, S&P and S&P 500 are registered service marks of The McGraw-Hill Companies, Inc. and have been licensed for use by Fidelity Distributors Corporation.
Other third party marks appearing herein are the property of their respective owners.
All other marks appearing herein are registered or unregistered trademarks or service marks of FMR LLC or an affiliated company.
Annual Report
This report and the financial statements contained herein are submitted for the general information of the shareholders of the fund. This report is not authorized for distribution to prospective investors in the fund unless preceded or accompanied by an effective prospectus.
A fund files its complete schedule of portfolio holdings with the SEC for the first and third quarters of each fiscal year on Form N-Q. Forms N-Q are available on the SEC's web site at http://www.sec.gov. A fund's Forms N-Q may be reviewed and copied at the SEC's Public Reference Room in Washington, DC. Information regarding the operation of the SEC's Public Reference Room may be obtained by calling 1-800-SEC-0330. For a complete list of a fund's portfolio holdings, view the most recent holdings listing, semiannual report, or annual report on Fidelity's web site at http://www.fidelity.com, http://www.advisor.fidelity.com, or http://www.401k.com, as applicable.
NOT FDIC INSURED • MAY LOSE VALUE • NO BANK GUARANTEE
Neither the fund nor Fidelity Distributors Corporation is a bank.
Annual Report
(photo_of_James_C_Curvey)
Dear Shareholder:
The second half of 2011 began with U.S. equities continuing to give back some of the gains achieved earlier in the year. In the days leading up to July 31, markets were shaken by a political stalemate in which Congress struggled to address the debt ceiling issue before an early-August deadline. The resulting uncertainty held back markets in July, the third consecutive monthly decline for equities, effectively reversing the positive momentum seen through the end of April. Financial markets are always unpredictable, of course, but there are several time-tested investment principles that can help put the odds in your favor.
One of the basic tenets is to invest for the long term. Over time, riding out the markets' inevitable ups and downs has proven much more effective than selling into panic or chasing the hottest trend. Even missing only a few of the markets' best days can significantly diminish investor returns. Patience also affords the benefits of compounding - of earning interest on additional income or reinvested dividends and capital gains. There can be tax advantages and cost benefits to consider as well. While staying the course doesn't eliminate risk, it can considerably lessen the effect of short-term declines.
You can further manage your investing risk through diversification. And today, more than ever, geographic diversification should be taken into account. Studies indicate that asset allocation is the single most important determinant of a portfolio's long-term success. The right mix of stocks, bonds and cash - aligned to your particular risk tolerance and investment objective - is very important. Age-appropriate rebalancing is also an essential aspect of asset allocation. For younger investors, an emphasis on equities - which historically have been the best-performing asset class over time - is encouraged. As investors near their specific goal, such as retirement or sending a child to college, consideration may be given to replacing volatile assets (e.g. common stocks) with more-stable fixed investments (bonds or savings plans).
A third principle - investing regularly - can help lower the average cost of your purchases. Investing a certain amount of money each month or quarter helps ensure you won't pay for all your shares at market highs. This strategy - known as dollar cost averaging - also reduces "emotion" from investing, helping shareholders avoid selling weak performers just prior to an upswing, or chasing a hot performer just before a correction.
We invite you to contact us via the Internet, through our Investor Centers or by phone. It is our privilege to provide you the information you need to make the investments that are right for you.
Sincerely,
(The acting chairman's signature appears here.)
James C. Curvey
Acting Chairman
Annual Report
Average annual total return reflects the change in the value of an investment, assuming reinvestment of the class' distributions from dividend income and capital gains (the profits earned upon the sale of securities that have grown in value, if any) and assuming a constant rate of performance each year. The $10,000 table and the fund's returns do not reflect the deduction of taxes that a shareholder would pay on fund distributions or the redemption of fund shares. During periods of reimbursement by Fidelity, a fund's total return will be greater than it would be had the reimbursement not occurred. How a fund did yesterday is no guarantee of how it will do tomorrow.
Average Annual Total Returns
Periods ended July 31, 2011 | Past 1
year | Past 5
years | Past 10
years |
Class K A | 23.45% | 3.46% | 13.40% |
A The initial offering of Class K shares took place on May 9, 2008. Returns prior to May 9, 2008 are those of Fidelity® Leveraged Company Stock Fund, the original class of the fund.
$10,000 Over 10 Years
Let's say hypothetically that $10,000 was invested in Fidelity® Leveraged Company Stock Fund - Class K on July 31, 2001. The chart shows how the value of your investment would have changed, and also shows how the S&P 500® Index performed over the same period. The initial offering of Class K took place on May 9, 2008. See above for additional information regarding the performance of Class K.
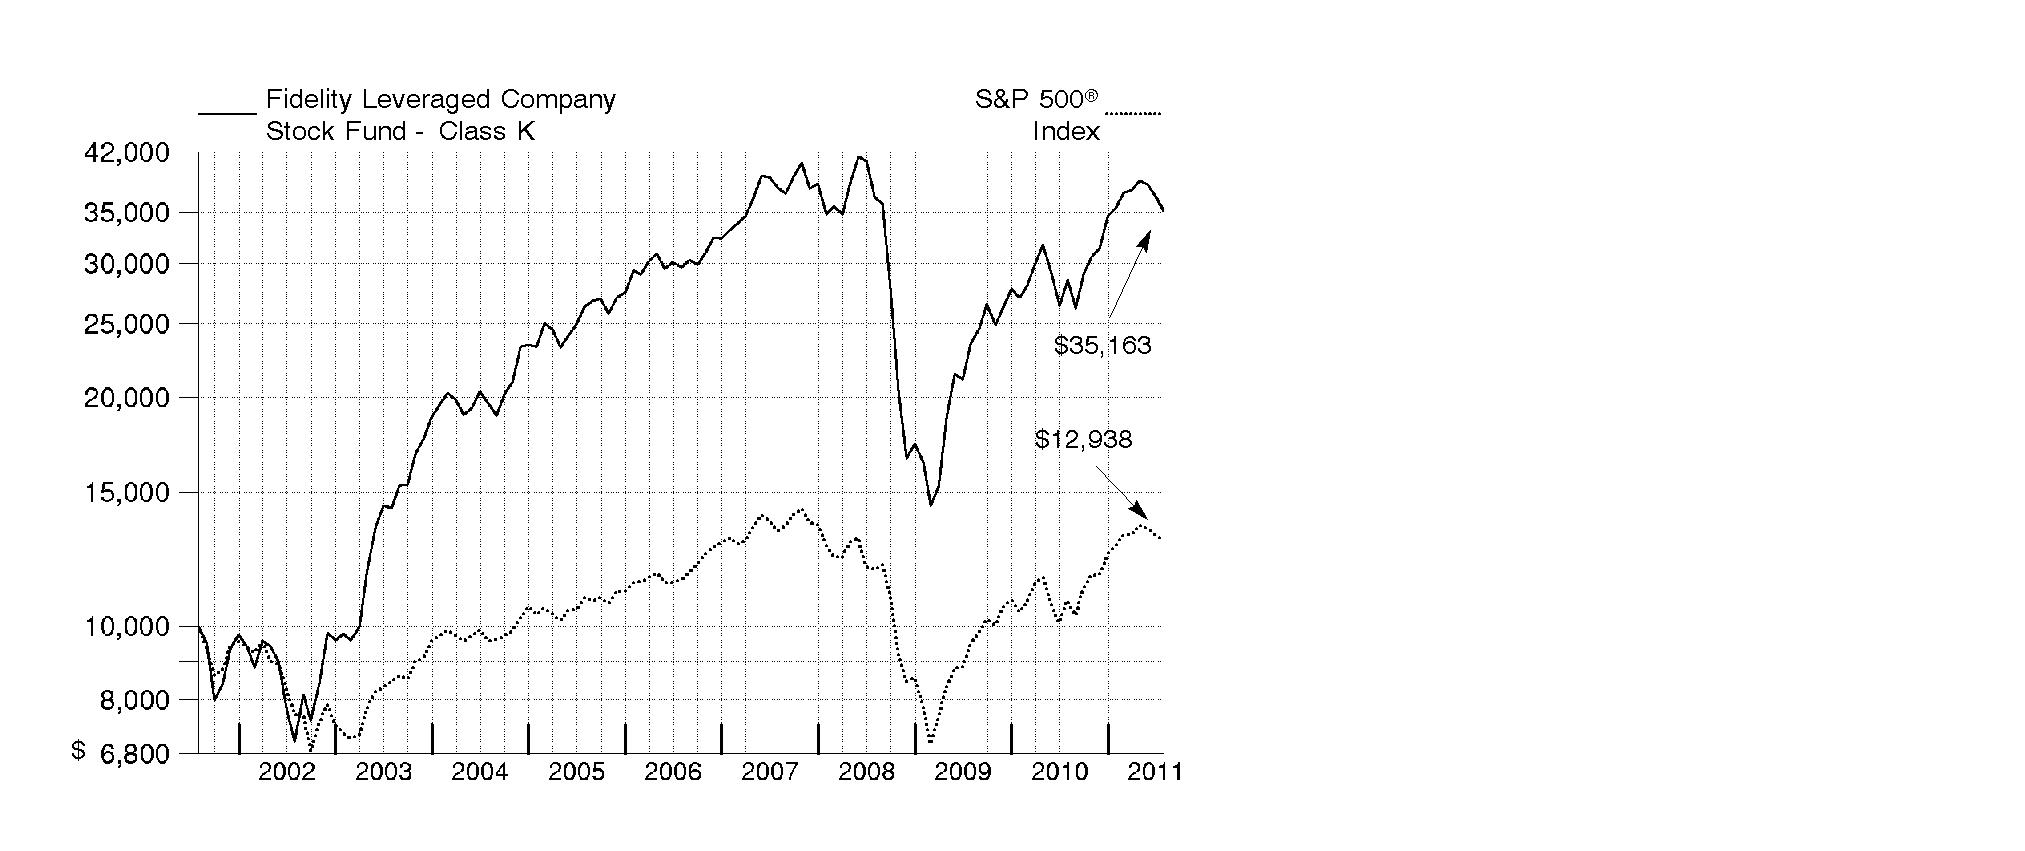
Annual Report
Market Recap: U.S. stocks registered solid double-digit gains for the 12 months ending July 31, 2011, extending a rally that began more than two years earlier. Despite a rough start in August 2010, markets turned positive in September, as increased demand for capital goods and other upbeat indicators trumped investor worry about a U.S. recessionary relapse. The broad market, as measured by the S&P 500® Index, rose 9% that month, its biggest September gain in 71 years. Seven more monthly advances followed, fueled by encouraging corporate earnings and economic activity. However, volatility picked up in the period's latter months, as markets reacted to continued high U.S. unemployment, nagging debt troubles in Europe and looming legislative battles over the federal debt ceiling. May unemployment rose above 9% for the first time in 2011, contributing to a traditional "June swoon" for stocks. Market uncertainty lingered in July, when the S&P 500® posted its second-biggest monthly loss of the period. For the full year, the S&P 500® climbed 19.65%, while the blue-chip-laden Dow Jones Industrial AverageSM rose a comparable 19.09% and the technology-heavy Nasdaq Composite® Index gained 23.40%. On the capitalization spectrum, stocks of mid-cap companies fared best, with the Russell Midcap® Index rising 24.51% and the small-cap Russell 2000® Index adding 23.92%.
Comments from Thomas Soviero, Portfolio Manager of Fidelity® Leveraged Company Stock Fund: For the year ending July 31, 2011, the fund's Class K shares returned 23.45%, outperforming the S&P 500® and the 23.17% gain of the Credit Suisse Leveraged Equity Index. Stock picking in materials, consumer discretionary and capital goods contributed the most versus the S&P 500. Underweighting financials also helped, although that benefit was somewhat offset by weak security selection there. Top relative contributors included chemicals companies Celanese, LyondellBassell Industries and W.R. Grace, and investments in energy companies El Paso and Frontier Oil, now part of HollyFrontier. Conversely, unfavorable stock picks in transportation hurt, as did overweighting banks. The fund's high-yield bond position also was a negative. Delta Air Lines and petroleum shipping company Overseas Shipholding Group detracted, as did underweighting computer giant Apple and not owning integrated oil company Exxon Mobil, two index heavyweights that outperformed. Several of the stocks I've mentioned were not part of the benchmark.
The views expressed above reflect those of the portfolio manager(s) only through the end of the period as stated on the cover of this report and do not necessarily represent the views of Fidelity or any other person in the Fidelity organization. Any such views are subject to change at any time based upon market or other conditions and Fidelity disclaims any responsibility to update such views. These views may not be relied on as investment advice and, because investment decisions for a Fidelity fund are based on numerous factors, may not be relied on as an indication of trading intent on behalf of any Fidelity fund.
Annual Report
Shareholder Expense Example
As a shareholder of the Fund, you incur two types of costs: (1) transaction costs, including redemption fees, and (2) ongoing costs, including management fees and other Fund expenses. This Example is intended to help you understand your ongoing costs (in dollars) of investing in the Fund and to compare these costs with the ongoing costs of investing in other mutual funds.
The Example is based on an investment of $1,000 invested at the beginning of the period and held for the entire period (February 1, 2011 to July 31, 2011).
Actual Expenses
The first line of the accompanying table for each class of the Fund provides information about actual account values and actual expenses. You may use the information in this line, together with the amount you invested, to estimate the expenses that you paid over the period. Simply divide your account value by $1,000.00 (for example, an $8,600 account value divided by $1,000.00 = 8.6), then multiply the result by the number in the first line for a class of the Fund under the heading entitled "Expenses Paid During Period" to estimate the expenses you paid on your account during this period. A small balance maintenance fee of $12.00 that is charged once a year may apply for certain accounts with a value of less than $2,000. This fee is not included in the table below. If it was, the estimate of expenses you paid during the period would be higher, and your ending account value lower, by this amount. In addition, the Fund, as a shareholder in the underlying Fidelity Central Funds, will indirectly bear its pro-rata share of the fees and expenses incurred by the underlying Fidelity Central Funds. These fees and expenses are not included in the Fund's annualized expense ratio used to calculate the expense estimate in the table below.
Hypothetical Example for Comparison Purposes
The second line of the accompanying table for each class of the Fund provides information about hypothetical account values and hypothetical expenses based on a Class' actual expense ratio and an assumed rate of return of 5% per year before expenses, which is not the Class' actual return. The hypothetical account values and expenses may not be used to estimate the actual ending account balance or expenses you paid for the period. You may use this information to compare the ongoing costs of investing in the Fund and other funds. To do so, compare this 5% hypothetical example with the 5% hypothetical examples that appear in the shareholder reports of the other funds. A small balance maintenance fee of $12.00 that is charged once a year may apply for certain accounts with a value of less than $2,000. This fee is not included in the table below. If it was, the estimate of expenses you paid during the period would be higher, and your ending account value lower, by this amount. In addition, the Fund, as a shareholder in the underlying Fidelity Central Funds, will indirectly bear its pro-rata share of the fees and expenses incurred by the underlying Fidelity Central Funds. These fees and expenses are not included in the Fund's annualized expense ratio used to calculate the expense estimate in the table below.
Please note that the expenses shown in the table are meant to highlight your ongoing costs only and do not reflect any transaction costs. Therefore, the second line of the table is useful in comparing ongoing costs only, and will not help you determine the relative total costs of owning different funds. In addition, if these transactional costs were included, your costs would have been higher.
Annual Report
| Annualized
Expense
Ratio | Beginning
Account Value
February 1, 2011 | Ending
Account Value
July 31, 2011 | Expenses Paid
During Period*
February 1, 2011
to July 31, 2011 |
Leveraged Company Stock | .84% | | | |
Actual | | $ 1,000.00 | $ 989.70 | $ 4.14 |
HypotheticalA | | $ 1,000.00 | $ 1,020.63 | $ 4.21 |
Class K | .69% | | | |
Actual | | $ 1,000.00 | $ 990.40 | $ 3.41 |
HypotheticalA | | $ 1,000.00 | $ 1,021.37 | $ 3.46 |
A 5% return per year before expenses
* Expenses are equal to each Class' annualized expense ratio, multiplied by the average account value over the period, multiplied by 181/365 (to reflect the one-half year period).
Annual Report
Investment Changes (Unaudited)
Top Ten Stocks as of July 31, 2011 |
| % of fund's
net assets | % of fund's net assets
6 months ago |
LyondellBasell Industries NV Class A | 6.0 | 2.1 |
ON Semiconductor Corp. | 4.1 | 5.0 |
Service Corp. International | 3.6 | 2.8 |
El Paso Corp. | 3.3 | 2.8 |
The AES Corp. | 3.0 | 2.8 |
Peabody Energy Corp. | 2.7 | 2.6 |
Tenet Healthcare Corp. | 2.4 | 2.6 |
Comcast Corp. Class A | 2.1 | 1.5 |
Owens Corning | 1.9 | 1.9 |
Celanese Corp. Class A | 1.8 | 2.1 |
| 30.9 | |
Top Five Market Sectors as of July 31, 2011 |
| % of fund's
net assets | % of fund's net assets
6 months ago |
Consumer Discretionary | 18.3 | 17.0 |
Industrials | 16.6 | 17.0 |
Materials | 15.7 | 12.6 |
Energy | 15.3 | 14.1 |
Information Technology | 10.5 | 11.2 |
Asset Allocation (% of fund's net assets) |
As of July 31, 2011* | As of January 31, 2011** |
| Stocks 96.6% | | | Stocks 94.0% | |
| Bonds 0.1% | | | Bonds 1.0% | |
| Convertible
Securities 0.0% | | | Convertible
Securities 0.3% | |
| Other Investments 0.1% | | | Other Investments 0.5% | |
| Short-Term
Investments and
Net Other Assets 3.2% | | | Short-Term
Investments and
Net Other Assets 4.2% | |
* Foreign investments | 12.4% | | ** Foreign investments | 8.6% | |

Annual Report
Investments July 31, 2011
Showing Percentage of Net Assets
Common Stocks - 96.3% |
| Shares | | Value (000s) |
CONSUMER DISCRETIONARY - 18.3% |
Auto Components - 1.8% |
Exide Technologies (a) | 3,643,393 | | $ 26,087 |
Johnson Controls, Inc. | 548,300 | | 20,260 |
Tenneco, Inc. (a) | 97,700 | | 3,902 |
The Goodyear Tire & Rubber Co. (a) | 564,063 | | 9,121 |
TRW Automotive Holdings Corp. (a) | 399,400 | | 20,158 |
| | 79,528 |
Automobiles - 1.3% |
Daimler AG (United States) | 209,400 | | 15,108 |
General Motors Co. | 769,284 | | 21,294 |
General Motors Co.: | | | |
warrants 7/10/16 (a) | 437,166 | | 8,232 |
warrants 7/10/19 (a) | 437,166 | | 5,941 |
Toyota Motor Corp. sponsored ADR (e) | 89,500 | | 7,332 |
| | 57,907 |
Diversified Consumer Services - 3.8% |
Service Corp. International (f) | 15,356,618 | | 160,784 |
Stewart Enterprises, Inc. Class A | 1,515,242 | | 10,531 |
| | 171,315 |
Hotels, Restaurants & Leisure - 1.3% |
Ameristar Casinos, Inc. | 110,100 | | 2,444 |
Biglari Holdings, Inc. (a) | 32,970 | | 12,139 |
Domino's Pizza, Inc. (a) | 483,695 | | 12,997 |
O'Charleys, Inc. (a) | 207,849 | | 1,266 |
Penn National Gaming, Inc. (a) | 582,836 | | 24,438 |
Wendy's Co. (a) | 546,800 | | 2,882 |
| | 56,166 |
Household Durables - 1.8% |
Harman International Industries, Inc. | 529,149 | | 22,013 |
Hovnanian Enterprises, Inc. Class A (a)(e) | 1,419,000 | | 2,724 |
Lennar Corp. Class A | 983,400 | | 17,396 |
Newell Rubbermaid, Inc. | 2,516,201 | | 39,051 |
| | 81,184 |
Leisure Equipment & Products - 0.2% |
Callaway Golf Co. | 1,630,035 | | 10,351 |
Media - 3.7% |
AMC Networks, Inc. Class A | 135,331 | | 5,033 |
Belo Corp. Series A | 163,800 | | 1,145 |
Cablevision Systems Corp. - NY Group Class A | 541,324 | | 13,187 |
Cinemark Holdings, Inc. | 1,554,497 | | 30,297 |
Common Stocks - continued |
| Shares | | Value (000s) |
CONSUMER DISCRETIONARY - continued |
Media - continued |
Comcast Corp. Class A | 3,962,898 | | $ 95,189 |
Gray Television, Inc. (a)(f) | 3,766,164 | | 9,152 |
LIN TV Corp. Class A (a) | 818,437 | | 3,356 |
Nexstar Broadcasting Group, Inc. Class A (a)(f) | 1,130,500 | | 9,903 |
| | 167,262 |
Specialty Retail - 1.8% |
Asbury Automotive Group, Inc. (a) | 385,122 | | 8,292 |
Charming Shoppes, Inc. (a) | 3,932,700 | | 16,124 |
GameStop Corp. Class A (a) | 2,149,577 | | 50,687 |
Sally Beauty Holdings, Inc. (a) | 300,000 | | 5,160 |
| | 80,263 |
Textiles, Apparel & Luxury Goods - 2.6% |
Coach, Inc. | 314,020 | | 20,273 |
Deckers Outdoor Corp. (a) | 467,786 | | 46,428 |
Hanesbrands, Inc. (a) | 404,100 | | 12,329 |
PVH Corp. | 548,718 | | 39,261 |
| | 118,291 |
TOTAL CONSUMER DISCRETIONARY | | 822,267 |
CONSUMER STAPLES - 2.8% |
Food & Staples Retailing - 0.6% |
Whole Foods Market, Inc. | 414,669 | | 27,658 |
Food Products - 2.0% |
Darling International, Inc. (a) | 4,479,620 | | 75,616 |
Smithfield Foods, Inc. (a) | 559,606 | | 12,323 |
| | 87,939 |
Personal Products - 0.2% |
Revlon, Inc. (a) | 553,261 | | 9,317 |
TOTAL CONSUMER STAPLES | | 124,914 |
ENERGY - 15.3% |
Energy Equipment & Services - 3.8% |
Baker Hughes, Inc. | 218,000 | | 16,869 |
Ensco International Ltd. ADR | 110,000 | | 5,858 |
Exterran Holdings, Inc. (a) | 1,019,808 | | 18,846 |
Halliburton Co. | 919,493 | | 50,324 |
Noble Corp. | 524,700 | | 19,346 |
Oil States International, Inc. (a) | 270,700 | | 21,845 |
Common Stocks - continued |
| Shares | | Value (000s) |
ENERGY - continued |
Energy Equipment & Services - continued |
Parker Drilling Co. (a) | 1,200,000 | | $ 7,608 |
Rowan Companies, Inc. (a) | 321,100 | | 12,577 |
Schlumberger Ltd. | 109,400 | | 9,886 |
Transocean Ltd. (United States) | 110,000 | | 6,772 |
| | 169,931 |
Oil, Gas & Consumable Fuels - 11.5% |
Alpha Natural Resources, Inc. (a) | 420,891 | | 17,976 |
Arch Coal, Inc. | 327,055 | | 8,373 |
Carrizo Oil & Gas, Inc. (a) | 438,502 | | 16,838 |
Chesapeake Energy Corp. | 1,036,165 | | 35,592 |
ConocoPhillips | 231,500 | | 16,666 |
CONSOL Energy, Inc. | 270,700 | | 14,510 |
El Paso Corp. | 7,302,530 | | 150,067 |
Forest Oil Corp. (a) | 1,314,652 | | 34,181 |
HollyFrontier Corp. | 812,048 | | 61,220 |
Nexen, Inc. | 188,000 | | 4,386 |
Overseas Shipholding Group, Inc. (e) | 494,592 | | 12,038 |
Paladin Energy Ltd. (Australia) (a) | 2,042,400 | | 5,879 |
Peabody Energy Corp. | 2,135,714 | | 122,739 |
Range Resources Corp. | 272,200 | | 17,737 |
| | 518,202 |
TOTAL ENERGY | | 688,133 |
FINANCIALS - 5.5% |
Commercial Banks - 3.3% |
Huntington Bancshares, Inc. | 11,032,080 | | 66,689 |
Regions Financial Corp. | 2,011,695 | | 12,251 |
SunTrust Banks, Inc. | 1,805,500 | | 44,217 |
Wells Fargo & Co. | 894,194 | | 24,984 |
| | 148,141 |
Consumer Finance - 0.6% |
American Express Co. | 501,647 | | 25,102 |
Diversified Financial Services - 0.1% |
Citigroup, Inc. | 163,840 | | 6,282 |
Insurance - 0.6% |
Assured Guaranty Ltd. | 1,249,684 | | 17,683 |
Lincoln National Corp. | 435,700 | | 11,546 |
| | 29,229 |
Common Stocks - continued |
| Shares | | Value (000s) |
FINANCIALS - continued |
Real Estate Investment Trusts - 0.7% |
FelCor Lodging Trust, Inc. (a) | 1,085,852 | | $ 5,581 |
Host Hotels & Resorts, Inc. | 1,016,122 | | 16,106 |
Sabra Health Care REIT, Inc. | 547,507 | | 7,890 |
| | 29,577 |
Thrifts & Mortgage Finance - 0.2% |
First Niagara Financial Group, Inc. | 851,444 | | 10,430 |
TOTAL FINANCIALS | | 248,761 |
HEALTH CARE - 5.5% |
Health Care Equipment & Supplies - 0.3% |
Alere, Inc. (a) | 419,708 | | 12,377 |
Health Care Providers & Services - 4.0% |
Community Health Systems, Inc. (a) | 554,676 | | 14,333 |
DaVita, Inc. (a) | 503,747 | | 42,083 |
HCA Holdings, Inc. | 305,500 | | 8,151 |
Kindred Healthcare, Inc. (a) | 108,330 | | 2,041 |
Sun Healthcare Group, Inc. (a) | 547,507 | | 3,833 |
Tenet Healthcare Corp. (a) | 19,484,059 | | 108,331 |
| | 178,772 |
Pharmaceuticals - 1.2% |
Hospira, Inc. (a) | 630,858 | | 32,249 |
Merck & Co., Inc. | 730,200 | | 24,922 |
| | 57,171 |
TOTAL HEALTH CARE | | 248,320 |
INDUSTRIALS - 16.6% |
Aerospace & Defense - 0.9% |
American Science & Engineering, Inc. | 85,370 | | 6,926 |
Teledyne Technologies, Inc. (a) | 340,694 | | 18,476 |
Textron, Inc. | 602,700 | | 13,940 |
| | 39,342 |
Airlines - 1.6% |
AMR Corp. (a)(e) | 1,140,630 | | 4,836 |
Delta Air Lines, Inc. (a) | 5,499,749 | | 43,393 |
Southwest Airlines Co. | 571,283 | | 5,690 |
Common Stocks - continued |
| Shares | | Value (000s) |
INDUSTRIALS - continued |
Airlines - continued |
United Continental Holdings, Inc. (a) | 370,700 | | $ 6,717 |
US Airways Group, Inc. (a) | 2,034,580 | | 12,696 |
| | 73,332 |
Building Products - 3.2% |
Armstrong World Industries, Inc. | 1,173,030 | | 46,335 |
Masco Corp. | 976,841 | | 10,306 |
Owens Corning (a) | 2,363,301 | | 84,086 |
Owens Corning warrants 10/31/13 (a) | 406,600 | | 1,586 |
| | 142,313 |
Commercial Services & Supplies - 3.0% |
Cenveo, Inc. (a)(f) | 3,658,300 | | 21,182 |
Deluxe Corp. | 1,786,873 | | 42,063 |
R.R. Donnelley & Sons Co. | 450,900 | | 8,481 |
Republic Services, Inc. | 1,317,784 | | 38,255 |
The Brink's Co. | 464,740 | | 13,868 |
Waste Management, Inc. | 340,992 | | 10,738 |
| | 134,587 |
Electrical Equipment - 2.5% |
Belden, Inc. | 1,170,366 | | 43,128 |
Emerson Electric Co. | 163,500 | | 8,026 |
General Cable Corp. (a) | 549,400 | | 21,850 |
Polypore International, Inc. (a) | 548,400 | | 37,291 |
| | 110,295 |
Industrial Conglomerates - 0.9% |
Carlisle Companies, Inc. | 109,910 | | 4,751 |
General Electric Co. | 1,103,883 | | 19,771 |
Tyco International Ltd. | 328,233 | | 14,537 |
| | 39,059 |
Machinery - 2.9% |
Accuride Corp. warrants 2/26/12 (a) | 778,347 | | 54 |
Fiat Industrial SpA (a) | 1,634,423 | | 21,617 |
Ingersoll-Rand Co. Ltd. | 1,346,900 | | 50,401 |
Navistar International Corp. (a) | 69,800 | | 3,581 |
Stanley Black & Decker, Inc. | 349,717 | | 23,001 |
Timken Co. | 464,948 | | 20,304 |
WABCO Holdings, Inc. (a) | 211,533 | | 13,337 |
| | 132,295 |
Common Stocks - continued |
| Shares | | Value (000s) |
INDUSTRIALS - continued |
Marine - 0.2% |
Navios Maritime Holdings, Inc. | 2,162,794 | | $ 9,322 |
Road & Rail - 1.2% |
Avis Budget Group, Inc. (a) | 719,914 | | 10,878 |
CSX Corp. | 328,200 | | 8,064 |
Hertz Global Holdings, Inc. (a) | 2,518,600 | | 35,437 |
| | 54,379 |
Trading Companies & Distributors - 0.2% |
Houston Wire & Cable Co. (e) | 656,176 | | 10,440 |
TOTAL INDUSTRIALS | | 745,364 |
INFORMATION TECHNOLOGY - 10.5% |
Communications Equipment - 0.1% |
JDS Uniphase Corp. (a) | 163,300 | | 2,147 |
Computers & Peripherals - 1.2% |
Apple, Inc. (a) | 139,886 | | 54,623 |
Electronic Equipment & Components - 1.8% |
Avnet, Inc. (a) | 328,000 | | 9,610 |
DDi Corp. | 295,899 | | 2,435 |
Flextronics International Ltd. (a) | 7,305,346 | | 47,119 |
TTM Technologies, Inc. (a) | 724,200 | | 10,030 |
Viasystems Group, Inc. (a) | 540,460 | | 12,128 |
| | 81,322 |
Internet Software & Services - 0.1% |
VeriSign, Inc. | 194,300 | | 6,064 |
IT Services - 0.6% |
Alliance Data Systems Corp. (a)(e) | 114,000 | | 11,211 |
CACI International, Inc. Class A (a) | 248,000 | | 14,652 |
| | 25,863 |
Office Electronics - 0.3% |
Xerox Corp. | 1,215,542 | | 11,341 |
Semiconductors & Semiconductor Equipment - 6.3% |
Amkor Technology, Inc. (a)(e) | 5,242,218 | | 27,941 |
Cypress Semiconductor Corp. | 651,200 | | 13,402 |
Fairchild Semiconductor International, Inc. (a) | 548,500 | | 8,233 |
Freescale Semiconductor Holdings I Ltd. | 365,800 | | 5,974 |
Intel Corp. | 454,981 | | 10,160 |
Intersil Corp. Class A | 1,460,387 | | 17,598 |
Common Stocks - continued |
| Shares | | Value (000s) |
INFORMATION TECHNOLOGY - continued |
Semiconductors & Semiconductor Equipment - continued |
Micron Technology, Inc. (a) | 1,737,600 | | $ 12,806 |
ON Semiconductor Corp. (a) | 21,279,802 | | 184,921 |
| | 281,035 |
Software - 0.1% |
Microsoft Corp. | 108,800 | | 2,981 |
Nuance Communications, Inc. (a) | 163,600 | | 3,274 |
| | 6,255 |
TOTAL INFORMATION TECHNOLOGY | | 468,650 |
MATERIALS - 15.7% |
Chemicals - 13.0% |
Albemarle Corp. | 243,379 | | 16,204 |
Arch Chemicals, Inc. | 344,342 | | 16,225 |
Celanese Corp. Class A | 1,506,819 | | 83,071 |
Dow Chemical Co. | 1,651,894 | | 57,602 |
Ferro Corp. (a) | 617,100 | | 8,035 |
FMC Corp. | 178,600 | | 15,640 |
H.B. Fuller Co. | 988,225 | | 22,591 |
LyondellBasell Industries NV Class A | 6,788,309 | | 267,863 |
OMNOVA Solutions, Inc. (a)(f) | 2,749,107 | | 18,584 |
Phosphate Holdings, Inc. (a) | 307,500 | | 2,891 |
Solutia, Inc. (a) | 657,600 | | 14,099 |
W.R. Grace & Co. (a) | 1,225,761 | | 61,827 |
| | 584,632 |
Containers & Packaging - 0.8% |
Rock-Tenn Co. Class A | 571,323 | | 35,114 |
Metals & Mining - 1.6% |
AngloGold Ashanti Ltd. sponsored ADR | 526,100 | | 22,065 |
Compass Minerals International, Inc. | 258,500 | | 20,354 |
Ormet Corp. (a) | 330,000 | | 2,079 |
Ormet Corp. (a)(h) | 1,075,000 | | 6,773 |
Teck Resources Ltd. Class B (sub. vtg.) | 417,300 | | 20,677 |
| | 71,948 |
Paper & Forest Products - 0.3% |
Neenah Paper, Inc. | 518,300 | | 10,464 |
TOTAL MATERIALS | | 702,158 |
Common Stocks - continued |
| Shares | | Value (000s) |
TELECOMMUNICATION SERVICES - 2.2% |
Diversified Telecommunication Services - 0.9% |
CenturyLink, Inc. | 771,680 | | $ 28,637 |
PAETEC Holding Corp. (a) | 2,166,533 | | 9,576 |
| | 38,213 |
Wireless Telecommunication Services - 1.3% |
Crown Castle International Corp. (a) | 830,591 | | 36,048 |
Sprint Nextel Corp. (a) | 5,692,987 | | 24,081 |
| | 60,129 |
TOTAL TELECOMMUNICATION SERVICES | | 98,342 |
UTILITIES - 3.9% |
Independent Power Producers & Energy Traders - 3.9% |
Calpine Corp. (a) | 2,479,900 | | 40,298 |
The AES Corp. (a) | 10,901,923 | | 134,203 |
| | 174,501 |
TOTAL COMMON STOCKS (Cost $3,692,145) | 4,321,410 |
Nonconvertible Preferred Stocks - 0.3% |
| | | |
CONSUMER STAPLES - 0.1% |
Personal Products - 0.1% |
Revlon, Inc. Series A 12.75% | 639,576 | | 3,671 |
FINANCIALS - 0.2% |
Diversified Financial Services - 0.2% |
GMAC Capital Trust I Series 2, 8.125% | 439,013 | | 11,248 |
TOTAL NONCONVERTIBLE PREFERRED STOCKS (Cost $19,207) | 14,919 |
Nonconvertible Bonds - 0.1% |
| Principal Amount (000s) | | |
CONSUMER DISCRETIONARY - 0.0% |
Automobiles - 0.0% |
General Motors Corp.: | | | | |
6.75% 5/1/28 (d) | | $ 3,075 | | 34 |
7.125% 7/15/13 (d) | | 8,320 | | 91 |
Nonconvertible Bonds - continued |
| Principal Amount (000s) | | Value (000s) |
CONSUMER DISCRETIONARY - continued |
Automobiles - continued |
General Motors Corp.: - continued | | | | |
7.2% 1/15/11 (d) | | $ 22,980 | | $ 250 |
8.25% 7/15/23 (d) | | 25,035 | | 273 |
8.375% 7/15/33 (d) | | 50,210 | | 547 |
8.8% 3/1/21 (d) | | 10,765 | | 117 |
| | 1,312 |
Hotels, Restaurants & Leisure - 0.0% |
Station Casinos, Inc.: | | | | |
6% 4/1/12 (d) | | 8,360 | | 1 |
7.75% 8/15/16 (d) | | 9,380 | | 1 |
| | 2 |
TOTAL CONSUMER DISCRETIONARY | | 1,314 |
FINANCIALS - 0.1% |
Commercial Banks - 0.1% |
Regions Bank 6.45% 6/26/37 | | 5,430 | | 4,724 |
INDUSTRIALS - 0.0% |
Airlines - 0.0% |
Northwest Airlines, Inc. 9.875% 3/15/07 (d) | | 7,000 | | 0 |
TOTAL NONCONVERTIBLE BONDS (Cost $11,655) | 6,038 |
Floating Rate Loans - 0.1% |
|
UTILITIES - 0.1% |
Electric Utilities - 0.1% |
Texas Competitive Electric Holdings Co. LLC/Texas Competitive Electric Holdings Finance, Inc. Tranche B, term loan 4.7282% 10/10/17 (g) (Cost $4,653) | | 5,458 | | 4,086 |
Money Market Funds - 4.4% |
| Shares | | Value (000s) |
Fidelity Cash Central Fund, 0.14% (b) | 139,877,222 | | $ 139,877 |
Fidelity Securities Lending Cash Central Fund, 0.15% (b)(c) | 55,266,648 | | 55,267 |
TOTAL MONEY MARKET FUNDS (Cost $195,144) | 195,144 |
TOTAL INVESTMENT PORTFOLIO - 101.2% (Cost $3,922,804) | | 4,541,597 |
NET OTHER ASSETS (LIABILITIES) - (1.2)% | | (55,438) |
NET ASSETS - 100% | $ 4,486,159 |
Legend |
(a) Non-income producing |
(b) Affiliated fund that is available only to investment companies and other accounts managed by Fidelity Investments. The rate quoted is the annualized seven-day yield of the fund at period end. A complete unaudited listing of the fund's holdings as of its most recent quarter end is available upon request. In addition, each Fidelity Central Fund's financial statements, which are not covered by the Fund's Report of Independent Registered Public Accounting Firm, are available on the SEC's website or upon request. |
(c) Investment made with cash collateral received from securities on loan. |
(d) Non-income producing - Security is in default. |
(e) Security or a portion of the security is on loan at period end. |
(f) Affiliated company |
(g) Coupon rates for floating and adjustable rate securities reflect the rates in effect at period end. |
(h) Restricted securities - Investment in securities not registered under the Securities Act of 1933 (excluding 144A issues). At the end of the period, the value of restricted securities (excluding 144A issues) amounted to $6,773,000 or 0.2% of net assets. |
Additional information on each restricted holding is as follows: |
Security | Acquisition Date | Acquisition Cost (000s) |
Ormet Corp. | 2/27/07 - 4/4/07 | $ 20,556 |
Affiliated Central Funds |
Information regarding fiscal year to date income earned by the Fund from investments in Fidelity Central Funds is as follows: |
Fund | Income earned
(Amounts in thousands) |
Fidelity Cash Central Fund | $ 250 |
Fidelity Securities Lending Cash Central Fund | 526 |
Total | $ 776 |
Other Affiliated Issuers |
An affiliated company is a company in which the Fund has ownership of at least 5% of the voting securities. Fiscal year to date transactions with companies which are or were affiliates are as follows: |
Affiliate
(Amounts in thousands) | Value,
beginning of
period | Purchases | Sales
Proceeds | Dividend Income | Value,
end of
period |
Cenveo, Inc. | $ 23,767 | $ - | $ 1,146 | $ - | $ 21,182 |
Gray Television, Inc. | 7,399 | 1,624 | - | - | 9,152 |
Nexstar Broadcasting Group, Inc. Class A | 6,105 | - | - | - | 9,903 |
OMNOVA Solutions, Inc. | - | 22,300 | - | - | 18,584 |
ON Semiconductor Corp. | 155,780 | - | 20,281 | - | - |
Ormet Corp. | 957 | - | - | - | - |
Ormet Corp. | 3,118 | - | - | - | - |
Service Corp. International | 150,430 | - | 18,657 | 2,859 | 160,784 |
Total | $ 347,556 | $ 23,924 | $ 40,084 | $ 2,859 | $ 219,605 |
Other Information |
The following is a summary of the inputs used, as of July 31, 2011, involving the Fund's assets and liabilities carried at fair value. The inputs or methodology used for valuing securities may not be an indication of the risk associated with investing in those securities. For more information on valuation inputs, and their aggregation into the levels used in the tables below, please refer to the Security Valuation section in the accompanying Notes to Financial Statements. |
Valuation Inputs at Reporting Date: |
Description
(Amounts in thousands) | Total | Level 1 | Level 2 | Level 3 |
Investments in Securities: | | | | |
Equities: | | | | |
Consumer Discretionary | $ 822,267 | $ 822,267 | $ - | $ - |
Consumer Staples | 128,585 | 124,914 | - | 3,671 |
Energy | 688,133 | 688,133 | - | - |
Financials | 260,009 | 260,009 | - | - |
Health Care | 248,320 | 248,320 | - | - |
Industrials | 745,364 | 745,364 | - | - |
Information Technology | 468,650 | 468,650 | - | - |
Materials | 702,158 | 702,158 | - | - |
Telecommunication Services | 98,342 | 98,342 | - | - |
Utilities | 174,501 | 174,501 | - | - |
Corporate Bonds | 6,038 | - | 4,724 | 1,314 |
Floating Rate Loans | 4,086 | - | 4,086 | - |
Money Market Funds | 195,144 | 195,144 | - | - |
Total Investments in Securities: | $ 4,541,597 | $ 4,527,802 | $ 8,810 | $ 4,985 |
The following is a reconciliation of Investments in Securities for which Level 3 inputs were used in determining value: |
(Amounts in thousands) | |
Investments in Securities: | |
Beginning Balance | $ 4,950 |
Total Realized Gain (Loss) | (1) |
Total Unrealized Gain (Loss) | (21,915) |
Cost of Purchases | - |
Proceeds of Sales | (19,680) |
Amortization/Accretion | 264 |
Transfers in to Level 3 | 41,367 |
Transfers out of Level 3 | - |
Ending Balance | $ 4,985 |
The change in unrealized gain (loss) for the period attributable to Level 3 securities held at July 31, 2011 | $ (21,915) |
The information used in the above reconciliation represents fiscal year to date activity for any Investments in Securities identified as using Level 3 inputs at either the beginning or the end of the current fiscal period. Transfers in or out of Level 3 represent the beginning value of any Security or Instrument where a change in the pricing level occurred from the beginning to the end of the period. The cost of purchases and the proceeds of sales may include securities received or delivered through corporate actions or exchanges. Realized and unrealized gains (losses) disclosed in the reconciliation are included in Net Gain (Loss) on the Fund's Statement of Operations. |
Distribution of investments by country of issue, as a percentage of total net assets, is as follows: (Unaudited) |
United States of America | 87.6% |
Netherlands | 6.0% |
Ireland | 1.1% |
Singapore | 1.1% |
Others (Individually Less Than 1%) | 4.2% |
| 100.0% |
Income Tax Information |
At July 31, 2011, the Fund had a capital loss carryforward of approximately $728,972,000 of which $37,148,000 and $691,824,000 will expire in fiscal 2017 and 2018, respectively. Capital loss carryforwards are only available to offset future capital gains of the Fund to the extent provided by regulations and may be limited. |
See accompanying notes which are an integral part of the financial statements.
Annual Report
Statement of Assets and Liabilities
Amounts in thousands (except per-share amounts) | July 31, 2011 |
| | |
Assets | | |
Investment in securities, at value (including securities loaned of $53,743) - See accompanying schedule: Unaffiliated issuers (cost $3,510,832) | $ 4,126,848 | |
Fidelity Central Funds (cost $195,144) | 195,144 | |
Other affiliated issuers (cost $216,828) | 219,605 | |
Total Investments (cost $3,922,804) | | $ 4,541,597 |
Cash | | 1 |
Receivable for investments sold | | 27,147 |
Receivable for fund shares sold | | 2,566 |
Dividends receivable | | 839 |
Interest receivable | | 71 |
Distributions receivable from Fidelity Central Funds | | 45 |
Other receivables | | 63 |
Total assets | | 4,572,329 |
| | |
Liabilities | | |
Payable for investments purchased | $ 13,853 | |
Payable for fund shares redeemed | 13,798 | |
Accrued management fee | 2,388 | |
Other affiliated payables | 814 | |
Other payables and accrued expenses | 50 | |
Collateral on securities loaned, at value | 55,267 | |
Total liabilities | | 86,170 |
| | |
Net Assets | | $ 4,486,159 |
Net Assets consist of: | | |
Paid in capital | | $ 4,610,149 |
Distributions in excess of net investment income | | (1,080) |
Accumulated undistributed net realized gain (loss) on investments and foreign currency transactions | | (741,705) |
Net unrealized appreciation (depreciation) on investments and assets and liabilities in foreign currencies | | 618,795 |
Net Assets | | $ 4,486,159 |
See accompanying notes which are an integral part of the financial statements.
Annual Report
Statement of Assets and Liabilities - continued
Amounts in thousands (except per-share amounts) | July 31, 2011 |
| | |
Leveraged Company Stock:
Net Asset Value, offering price and redemption price per share ($3,931,252 ÷ 136,261 shares) | | $ 28.85 |
| | |
Class K:
Net Asset Value, offering price and redemption price per share ($554,907 ÷ 19,225 shares) | | $ 28.86 |
See accompanying notes which are an integral part of the financial statements.
Annual Report
Financial Statements - continued
Statement of Operations
Amounts in thousands | Year ended July 31, 2011 |
| | |
Investment Income | | |
Dividends (including $2,859 earned from other affiliated issuers) | | $ 34,277 |
Interest | | 4,197 |
Income from Fidelity Central Funds | | 776 |
Total income | | 39,250 |
| | |
Expenses | | |
Management fee | $ 28,332 | |
Transfer agent fees | 9,001 | |
Accounting and security lending fees | 1,090 | |
Custodian fees and expenses | 57 | |
Independent trustees' compensation | 25 | |
Registration fees | 97 | |
Audit | 64 | |
Legal | 45 | |
Miscellaneous | 52 | |
Total expenses before reductions | 38,763 | |
Expense reductions | (204) | 38,559 |
Net investment income (loss) | | 691 |
Realized and Unrealized Gain (Loss) Net realized gain (loss) on: | | |
Investment securities: | | |
Unaffiliated issuers | 249,112 | |
Other affiliated issuers | 16,077 | |
Foreign currency transactions | (13) | |
Total net realized gain (loss) | | 265,176 |
Change in net unrealized appreciation (depreciation) on: Investment securities | 656,092 | |
Assets and liabilities in foreign currencies | 4 | |
Total change in net unrealized appreciation (depreciation) | | 656,096 |
Net gain (loss) | | 921,272 |
Net increase (decrease) in net assets resulting from operations | | $ 921,963 |
See accompanying notes which are an integral part of the financial statements.
Annual Report
Statement of Changes in Net Assets
Amounts in thousands | Year ended
July 31,
2011 | Year ended
July 31,
2010 |
Increase (Decrease) in Net Assets | | |
Operations | | |
Net investment income (loss) | $ 691 | $ 13,810 |
Net realized gain (loss) | 265,176 | 201,065 |
Change in net unrealized appreciation (depreciation) | 656,096 | 593,648 |
Net increase (decrease) in net assets resulting
from operations | 921,963 | 808,523 |
Distributions to shareholders from net investment income | (19,058) | (23,690) |
Share transactions - net increase (decrease) | (810,250) | (373,729) |
Redemption fees | 558 | 970 |
Total increase (decrease) in net assets | 93,213 | 412,074 |
| | |
Net Assets | | |
Beginning of period | 4,392,946 | 3,980,872 |
End of period (including distributions in excess of net investment income of $1,080 and undistributed net investment income of $10,281, respectively) | $ 4,486,159 | $ 4,392,946 |
See accompanying notes which are an integral part of the financial statements.
Annual Report
Financial Highlights - Leveraged Company Stock
Years ended July 31, | 2011 | 2010 | 2009 | 2008 | 2007 |
Selected Per-Share Data | | | | | |
Net asset value, beginning of period | $ 23.50 | $ 19.55 | $ 31.09 | $ 33.78 | $ 28.07 |
Income from Investment Operations | | | | | |
Net investment income (loss) B | -G | .07 | .21 | .14 | .44 E |
Net realized and unrealized gain (loss) | 5.46 | 3.99 | (11.37) | (1.06) | 6.78 |
Total from investment operations | 5.46 | 4.06 | (11.16) | (.92) | 7.22 |
Distributions from net investment income | (.11) | (.11) | (.14) | (.39) | (.12) |
Distributions from net realized gain | - | - | (.25) | (1.39) | (1.40) |
Total distributions | (.11) | (.11) | (.39) | (1.78) | (1.52) |
Redemption fees added to paid in capital B | - G | - G | .01 | .01 | .01 |
Net asset value, end of period | $ 28.85 | $ 23.50 | $ 19.55 | $ 31.09 | $ 33.78 |
Total Return A | 23.27% | 20.84% | (35.99)% | (2.76)% | 27.08% |
Ratios to Average Net Assets C,F | | | | | |
Expenses before reductions | .85% | .88% | .92% | .83% | .83% |
Expenses net of fee waivers, if any | .85% | .88% | .92% | .83% | .83% |
Expenses net of all reductions | .84% | .88% | .92% | .83% | .83% |
Net investment income (loss) | - H | .29% | 1.17% | .44% | 1.43% E |
Supplemental Data | | | | | |
Net assets, end of period (in millions) | $ 3,931 | $ 3,983 | $ 3,714 | $ 8,032 | $ 7,830 |
Portfolio turnover rate D | 18% | 21% | 34% | 30% | 20% |
A Total returns would have been lower if certain expenses had not been reduced during the applicable periods shown.
B Calculated based on average shares outstanding during the period.
C Fees and expenses of any underlying Fidelity Central Funds are not included in the Fund's expense ratio. The Fund indirectly bears its proportionate share of the expenses of any underlying Fidelity Central Funds.
D Amount does not include the portfolio activity of any underlying Fidelity Central Funds.
E Investment income per share reflects a special dividend which amounted to $.26 per share. Excluding the special dividend, the ratio of net investment income (loss) to average net assets would have been 59%.
F Expense ratios reflect operating expenses of the class. Expenses before reductions do not reflect amounts reimbursed by the investment adviser or reductions from brokerage service arrangements or reductions from other expense offset arrangements and do not represent the amount paid by the class during periods when reimbursements or reductions occur. Expenses net of fee waivers reflect expenses after reimbursement by the investment adviser but prior to reductions from brokerage service arrangements or other expense offset arrangements. Expenses net of all reductions represent the net expenses paid by the class.
G Amount represents less than $.01 per share.
H Amount represents less than .01%
See accompanying notes which are an integral part of the financial statements.
Annual Report
Financial Highlights - Class K
Years ended July 31, | 2011 | 2010 | 2009 | 2008 G |
Selected Per-Share Data | | | | |
Net asset value, beginning of period | $ 23.52 | $ 19.56 | $ 31.11 | $ 34.10 |
Income from Investment Operations | | | | |
Net investment income (loss) D | .04 | .11 | .21 | .05 |
Net realized and unrealized gain (loss) | 5.45 | 4.00 | (11.35) | (3.04) |
Total from investment operations | 5.49 | 4.11 | (11.14) | (2.99) |
Distributions from net investment income | (.15) | (.15) | (.17) | - |
Distributions from net realized gain | - | - | (.25) | - |
Total distributions | (.15) | (.15) | (.42) | - |
Redemption fees added to paid in capital D | - I | - I | .01 | - I |
Net asset value, end of period | $ 28.86 | $ 23.52 | $ 19.56 | $ 31.11 |
Total Return B,C | 23.45% | 21.09% | (35.86)% | (8.77)% |
Ratios to Average Net Assets E,H | | | | |
Expenses before reductions | .69% | .70% | .71% | .70% A |
Expenses net of fee waivers, if any | .69% | .70% | .71% | .70% A |
Expenses net of all reductions | .69% | .69% | .71% | .70% A |
Net investment income (loss) | .16% | .47% | 1.39% | .58% A |
Supplemental Data | | | | |
Net assets, end of period (000 omitted) | $ 554,907 | $ 409,934 | $ 267,351 | $ 91 |
Portfolio turnover rate F | 18% | 21% | 34% | 30% |
A Annualized
B Total returns for periods of less than one year are not annualized.
C Total returns would have been lower if certain expenses had not been reduced during the applicable periods shown.
D Calculated based on average shares outstanding during the period.
E Fees and expenses of any underlying Fidelity Central Funds are not included in the Fund's expense ratio. The Fund indirectly bears its proportionate share of the expenses of any underlying Fidelity Central Funds.
F Amount does not include the portfolio activity of any underlying Fidelity Central Funds.
G For the period May 9, 2008 (commencement of sale of shares) to July 31, 2008.
H Expense ratios reflect operating expenses of the class. Expenses before reductions do not reflect amounts reimbursed by the investment adviser or reductions from brokerage service arrangements or reductions from other expense offset arrangements and do not represent the amount paid by the class during periods when reimbursements or reductions occur. Expense ratios before reductions for start-up periods may not be representative of longer-term operating periods. Expenses net of fee waivers reflect expenses after reimbursement by the investment adviser but prior to reductions from brokerage service arrangements or other expense offset arrangements. Expenses net of all reductions represent the net expenses paid by the class.
I Amount represents less than $.01 per share.
See accompanying notes which are an integral part of the financial statements.
Annual Report
Notes to Financial Statements
For the period ended July 31, 2011
(Amounts in thousands except ratios)
1. Organization.
Fidelity Leveraged Company Stock Fund (the Fund) is a fund of Fidelity Securities Fund (the Trust) and is authorized to issue an unlimited number of shares. The Trust is registered under the Investment Company Act of 1940, as amended (the 1940 Act), as an open-end management investment company organized as a Massachusetts business trust. The Fund offers Leveraged Company Stock and Class K shares, each of which has equal rights as to assets and voting privileges. Each class has exclusive voting rights with respect to matters that affect that class. Investment income, realized and unrealized capital gains and losses, the common expenses of the Fund, and certain fund-level expense reductions, if any, are allocated on a pro-rata basis to each class based on the relative net assets of each class to the total net assets of the Fund. Each class differs with respect to transfer agent fees incurred. Certain expense reductions may also differ by class.
2. Investments in Fidelity Central Funds.
The Fund invests in Fidelity Central Funds, which are open-end investment companies available only to other investment companies and accounts managed by Fidelity Management & Research Company (FMR) and its affiliates. The Fund's Schedule of Investments lists each of the Fidelity Central Funds held as of period end, if any, as an investment of the Fund, but does not include the underlying holdings of each Fidelity Central Fund. As an Investing Fund, the Fund indirectly bears its proportionate share of the expenses of the underlying Fidelity Central Funds.
The Money Market Central Funds seek preservation of capital and current income and are managed by Fidelity Investments Money Management, Inc. (FIMM), an affiliate of FMR.
A complete unaudited list of holdings for each Fidelity Central Fund is available upon request or at the Securities and Exchange Commission (the SEC) web site at www.sec.gov. In addition, the financial statements of the Fidelity Central Funds, which are not covered by the Fund's Report of Independent Registered Public Accounting Firm, are available on the SEC web site or upon request.
3. Significant Accounting Policies.
The financial statements have been prepared in conformity with accounting principles generally accepted in the United States of America (GAAP), which require management to make certain estimates and assumptions at the date of the financial statements. Actual results could differ from those estimates. Subsequent events, if any, through the date that the financial statements were issued have been evaluated in the preparation of the financial statements. The following summarizes the significant accounting policies of the Fund:
Annual Report
Notes to Financial Statements - continued
(Amounts in thousands except ratios)
3. Significant Accounting Policies - continued
Security Valuation. Investments are valued as of 4:00 p.m. Eastern time on the last calendar day of the period. The Fund uses independent pricing services approved by the Board of Trustees to value its investments. When current market prices or quotations are not readily available or reliable, valuations may be determined in good faith in accordance with procedures adopted by the Board of Trustees. Factors used in determining value may include market or security specific events, changes in interest rates and credit quality. The frequency with which these procedures are used cannot be predicted and they may be utilized to a significant extent. The value used for net asset value (NAV) calculation under these procedures may differ from published prices for the same securities.
The Fund categorizes the inputs to valuation techniques used to value its investments into a disclosure hierarchy consisting of three levels as shown below:
Level 1 - quoted prices in active markets for identical investments
Level 2 - other significant observable inputs (including quoted prices for similar investments, interest rates, prepayment speeds, etc.)
Level 3 - unobservable inputs (including the Fund's own assumptions based on the best information available)
Changes in valuation techniques may result in transfers in or out of an assigned level within the disclosure hierarchy. The aggregate value of investments by input level, as of July 31, 2011, as well as a roll forward of Level 3 securities, is included at the end of the Fund's Schedule of Investments. Valuation techniques used to value the Fund's investments by major category are as follows:
Equity securities, including restricted securities, for which market quotations are readily available, are valued at the last reported sale price or official closing price as reported by an independent pricing service on the primary market or exchange on which they are traded and are categorized as Level 1 in the hierarchy. In the event there were no sales during the day or closing prices are not available, securities are valued at the last quoted bid price or may be valued using the last available price and are generally categorized as Level 2 in the hierarchy. For foreign equity securities, when significant market or security specific events arise, comparisons to the valuation of American Depositary Receipts (ADRs), futures contracts, Exchange-traded funds (ETFs) and certain indexes as well as quoted prices for similar securities are used and are categorized as Level 2 in the hierarchy in these circumstances. Utilizing these techniques may result in transfers between Level 1 and Level 2. For restricted equity securities and private placements where observable inputs are limited, assumptions about market activity and risk are used and are categorized as Level 3 in the hierarchy.
Annual Report
3. Significant Accounting Policies - continued
Security Valuation - continued
Debt securities, including restricted securities, are valued based on evaluated prices received from independent pricing services or from dealers who make markets in such securities. For corporate bonds and floating rate loans, pricing services utilize matrix pricing which considers yield or price of bonds of comparable quality, coupon, maturity and type as well as dealer supplied prices and are generally categorized as Level 2 in the hierarchy. When independent prices are unavailable or unreliable, debt securities may be valued utilizing pricing matrices which consider similar factors that would be used by independent pricing services. These are generally categorized as Level 2 in the hierarchy but may be Level 3 depending on the circumstances.
Investments in open-end mutual funds, including the Fidelity Central Funds, are valued at their closing net asset value each business day and are categorized as Level 1 in the hierarchy.
Foreign Currency. The Fund may use foreign currency contracts to facilitate transactions in foreign-denominated securities. Gains and losses from these transactions may arise from changes in the value of the foreign currency or if the counterparties do not perform under the contracts' terms.
Foreign-denominated assets, including investment securities, and liabilities are translated into U.S. dollars at the exchange rate at period end. Purchases and sales of investment securities, income and dividends received and expenses denominated in foreign currencies are translated into U.S. dollars at the exchange rate in effect on the transaction date.
The effects of exchange rate fluctuations on investments are included with the net realized and unrealized gain (loss) on investment securities. Other foreign currency transactions resulting in realized and unrealized gain (loss) are disclosed separately.
Investment Transactions and Income. For financial reporting purposes, the Fund's investment holdings and NAV include trades executed through the end of the last business day of the period. The NAV per share for processing shareholder transactions is calculated as of the close of business of the New York Stock Exchange (NYSE), normally 4:00 p.m. Eastern time and includes trades executed through the end of the prior business day. Gains and losses on securities sold are determined on the basis of identified cost and may include proceeds received from litigation. Dividend income is recorded on the ex-dividend date, except for certain dividends from foreign securities where the ex-dividend date may have passed, which are recorded as soon as the Fund is informed of
Annual Report
Notes to Financial Statements - continued
(Amounts in thousands except ratios)
3. Significant Accounting Policies - continued
Investment Transactions and Income - continued
the ex-dividend date. Non-cash dividends included in dividend income, if any, are recorded at the fair market value of the securities received. Distributions received on securities that represent a return of capital or capital gain are recorded as a reduction of cost of investments and/or as a realized gain. The Fund estimates the components of distributions received that may be considered return of capital distributions or capital gain distributions. Interest income and distributions from the Fidelity Central Funds are accrued as earned. Interest income includes coupon interest and amortization of premium and accretion of discount on debt securities. Investment income is recorded net of foreign taxes withheld where recovery of such taxes is uncertain. Debt obligations may be placed on non-accrual status and related interest income may be reduced by ceasing current accruals and writing off interest receivables when the collection of all or a portion of interest has become doubtful based on consistently applied procedures. A debt obligation is removed from non-accrual status when the issuer resumes interest payments or when collectability of interest is reasonably assured.
Expenses. Expenses directly attributable to a fund are charged to that fund. Expenses attributable to more than one fund are allocated among the respective funds on the basis of relative net assets or other appropriate methods. Expense estimates are accrued in the period to which they relate and adjustments are made when actual amounts are known.
Income Tax Information and Distributions to Shareholders. Each year, the Fund intends to qualify as a regulated investment company, including distributing substantially all of its taxable income and realized gains under Subchapter M of the Internal Revenue Code and filing its U.S. federal tax return. As a result, no provision for income taxes is required. As of July 31, 2011, the Fund did not have any unrecognized tax benefits in the financial statements. A fund's federal tax return is subject to examination by the Internal Revenue Service (IRS) for a period of three years. Foreign taxes are provided for based on the Fund's understanding of the tax rules and rates that exist in the foreign markets in which it invests.
Distributions are declared and recorded on the ex-dividend date. Income dividends and capital gain distributions are declared separately for each class. Income and capital gain distributions are determined in accordance with income tax regulations, which may differ from GAAP.
Capital accounts within the financial statements are adjusted for permanent book-tax differences. These adjustments have no impact on net assets or the results of operations. Temporary book-tax differences will reverse in a subsequent period.
Annual Report
3. Significant Accounting Policies - continued
Income Tax Information and Distributions to Shareholders - continued
Book-tax differences are primarily due to the foreign currency transactions, market discount, equity-debt classifications, partnerships, non-taxable dividends, capital loss carryforwards and losses deferred due to wash sales.
The federal tax cost of investment securities and unrealized appreciation (depreciation) as of period end were as follows:
Gross unrealized appreciation | $ 1,091,369 |
Gross unrealized depreciation | (485,274) |
Net unrealized appreciation (depreciation) on securities and other investments | $ 606,095 |
| |
Tax Cost | $ 3,935,502 |
The tax-based components of distributable earnings as of period end were as follows:
Capital loss carryforward | $ (728,972) |
Net unrealized appreciation (depreciation) | $ 606,097 |
Under the recently enacted Regulated Investment Company Modernization Act of 2010 (the Act), the Fund will be permitted to carry forward capital losses incurred in taxable years beginning after December 22, 2010 for an unlimited period. However, any losses incurred during those future taxable years will be required to be utilized prior to any losses incurred in pre-enactment taxable years, which generally expire after eight years from when they are incurred. Additionally, post-enactment capital losses that are carried forward will retain their character as either short-term or long-term capital losses rather than being considered all short-term as under previous law. The Fund's first fiscal year end subject to the Act will be July 31, 2012.
The tax character of distributions paid was as follows:
| July 31, 2011 | July 31, 2010 |
Ordinary Income | $ 19,058 | $ 23,690 |
Annual Report
Notes to Financial Statements - continued
(Amounts in thousands except ratios)
3. Significant Accounting Policies - continued
Short-Term Trading (Redemption) Fees. Shares held by investors in the Fund less than 90 days are subject to a redemption fee equal to 1.50% of the net asset value of shares redeemed. All redemption fees, which reduce the proceeds of the shareholder redemption, are retained by the Fund and accounted for as an addition to paid in capital.
New Accounting Pronouncement. In May 2011, the Financial Accounting Standards Board issued Accounting Standard Update No. 2011-04, Fair Value Measurement (Topic 820) - Amendments to Achieve Common Fair Value Measurement and Disclosure Requirements in U.S. GAAP and IFRSs. The update changes the wording used to describe the requirements in GAAP for measuring fair value and for disclosing information about fair value measurements. The update is effective during interim and annual periods beginning after December 15, 2011. Management is currently evaluating the impact of the update's adoption on the Fund's financial statement disclosures.
4. Operating Policies.
Restricted Securities. The Fund may invest in securities that are subject to legal or contractual restrictions on resale. These securities generally may be resold in transactions exempt from registration or to the public if the securities are registered. Disposal of these securities may involve time-consuming negotiations and expense, and prompt sale at an acceptable price may be difficult. Information regarding restricted securities is included at the end of the Fund's Schedule of Investments.
Loans and Other Direct Debt Instruments. The Fund may invest in loans and loan participations, trade claims or other receivables. These investments may include standby financing commitments, including revolving credit facilities, that obligate the Fund to supply additional cash to the borrower on demand. Loan participations involve a risk of insolvency of the lending bank or other financial intermediary. The Fund may be contractually obligated to receive approval from the agent bank and/or borrower prior to the sale of these investments.
5. Purchases and Sales of Investments.
Purchases and sales of securities, other than short-term securities, aggregated $807,901 and $1,685,183, respectively.
Annual Report
6. Fees and Other Transactions with Affiliates.
Management Fee. FMR and its affiliates provide the Fund with investment management related services for which the Fund pays a monthly management fee. The management fee is the sum of an individual fund fee rate that is based on an annual rate of .35% of the Fund's average net assets and a group fee rate that averaged .26% during the period. The group fee rate is based upon the average net assets of all the mutual funds advised by FMR. The group fee rate decreases as assets under management increase and increases as assets under management decrease. For the period, the total annual management fee rate was .61% of the Fund's average net assets.
Transfer Agent Fees. Fidelity Investments Institutional Operations Company, Inc. (FIIOC), an affiliate of FMR, is the transfer, dividend disbursing and shareholder servicing agent for each class of the Fund. FIIOC receives account fees and asset-based fees that vary according to the account size and type of account of the shareholders of Leveraged Company Stock. FIIOC receives an asset-based fee of Class K's average net assets. FIIOC pays for typesetting, printing and mailing of shareholder reports, except proxy statements. For the period, transfer agent fees for each class were as follows:
| Amount | % of
Average
Net Assets |
Leveraged Company Stock | $ 8,747 | .21 |
Class K | 254 | .05 |
| $ 9,001 | |
Accounting and Security Lending Fees. Fidelity Service Company, Inc. (FSC), an affiliate of FMR, maintains the Fund's accounting records. The accounting fee is based on the level of average net assets for the month. Under a separate contract, FSC administers the security lending program. The security lending fee is based on the number and duration of lending transactions.
Brokerage Commissions. The Fund placed a portion of its portfolio transactions with brokerage firms which are affiliates of the investment adviser. The commissions paid to these affiliated firms were $45 for the period.
7. Committed Line of Credit.
The Fund participates with other funds managed by FMR or an affiliate in a $4.0 billion credit facility (the "line of credit") to be utilized for temporary or emergency purposes to fund shareholder redemptions or for other short-term liquidity purposes. The Fund has agreed to pay commitment fees on its pro-rata portion of the line of credit, which amounted to $16 and is reflected in Miscellaneous expenses on the Statement of Operations. During the period, there were no borrowings on this line of credit.
Annual Report
Notes to Financial Statements - continued
(Amounts in thousands except ratios)
8. Security Lending.
The Fund lends portfolio securities through a lending agent from time to time in order to earn additional income. The lending agent may loan securities to certain qualified borrowers, including Fidelity Capital Markets (FCM), a broker-dealer affiliated with the Fund. On the settlement date of the loan, the Fund receives collateral (in the form of U.S. Treasury obligations, letters of credit and/or cash) against the loaned securities and maintains collateral in an amount not less than 100% of the market value of the loaned securities during the period of the loan. The market value of the loaned securities is determined at the close of business of the Fund and any additional required collateral is delivered to the Fund on the next business day. If the borrower defaults on its obligation to return the securities loaned because of insolvency or other reasons, a fund could experience delays and costs in recovering the securities loaned or in gaining access to the collateral. Any cash collateral received is the Fidelity Securities Lending Cash Central Fund. The value of loaned securities and cash collateral at period end are disclosed on the Fund's Statement of Assets and Liabilities. Security lending income represents the income earned on investing cash collateral, less rebates paid to borrowers and lending agent fees associated with the loan, plus any premium payments received for lending certain types of securities. Security lending income is presented in the Statement of Operations as a component of income from Fidelity Central Funds. Total security lending income during the period amounted to $526. During the period, there were no securities loaned to FCM.
9. Expense Reductions.
Many of the brokers with whom FMR places trades on behalf of the Fund provided services to the Fund in addition to trade execution. These services included payments of certain expenses on behalf of the Fund totaling $203 for the period. In addition, through arrangements with the Fund's custodian, credits realized as a result of uninvested cash balances were used to reduce the Fund's expenses. During the period, these credits reduced the Fund's custody expenses by $1.
10. Distributions to Shareholders.
Distributions to shareholders of each class were as follows:
Years ended July 31, | 2011 | 2010 |
From net investment income | | |
Leveraged Company Stock | $ 16,431 | $ 21,247 |
Class K | 2,627 | 2,443 |
Total | $ 19,058 | $ 23,690 |
Annual Report
11. Share Transactions.
Transactions for each class of shares were as follows:
| Shares | Dollars |
Years ended July 31, | 2011 | 2010 A | 2011 | 2010 A |
Leveraged Company Stock | | | | |
Shares sold | 21,818 | 36,532 | $ 623,715 | $ 843,196 |
Conversion to Class K | - | (2,316) | - | (48,185) |
Reinvestment of distributions | 608 | 940 | 15,688 | 20,361 |
Shares redeemed | (55,621) | (55,646) | (1,504,254) | (1,272,555) |
Net increase (decrease) | (33,195) | (20,490) | $ (864,851) | $ (457,183) |
Class K | | | | |
Shares sold | 7,678 | 5,965 | $ 217,275 | $ 138,844 |
Conversion from Leveraged Company Stock | - | 2,315 | - | 48,185 |
Reinvestment of distributions | 103 | 113 | 2,627 | 2,443 |
Shares redeemed | (5,983) | (4,631) | (165,301) | (106,018) |
Net increase (decrease) | 1,798 | 3,762 | $ 54,601 | $ 83,454 |
A Conversion transactions for Class K and Leveraged Company Stock are presented for the period August 1, 2009 through August 31, 2009.
12. Other.
The Fund's organizational documents provide former and current trustees and officers with a limited indemnification against liabilities arising in connection with the performance of their duties to the Fund. In the normal course of business, the Fund may also enter into contracts that provide general indemnifications. The Fund's maximum exposure under these arrangements is unknown as this would be dependent on future claims that may be made against the Fund. The risk of material loss from such claims is considered remote.
Annual Report
To the Trustees of Fidelity Securities Fund and the Shareholders of Fidelity Leveraged Company Stock Fund:
In our opinion, the accompanying statement of assets and liabilities, including the schedule of investments, and the related statements of operations and of changes in net assets and the financial highlights present fairly, in all material respects, the financial position of Fidelity Leveraged Company Stock Fund (a fund of Fidelity Securities Fund) at July 31, 2011, the results of its operations for the year then ended, the changes in its net assets for each of the two years in the period then ended and the financial highlights for each of the periods indicated, in conformity with accounting principles generally accepted in the United States of America. These financial statements and financial highlights (hereafter referred to as "financial statements") are the responsibility of the Fidelity Leveraged Company Stock Fund's management. Our responsibility is to express an opinion on these financial statements based on our audits. We conducted our audits of these financial statements in accordance with the standards of the Public Company Accounting Oversight Board (United States). Those standards require that we plan and perform the audit to obtain reasonable assurance about whether the financial statements are free of material misstatement. An audit includes examining, on a test basis, evidence supporting the amounts and disclosures in the financial statements, assessing the accounting principles used and significant estimates made by management, and evaluating the overall financial statement presentation. We believe that our audits, which included confirmation of securities at July 31, 2011 by correspondence with the custodian and brokers, provide a reasonable basis for our opinion.
/s/PricewaterhouseCoopers LLP
PricewaterhouseCoopers LLP
Boston, Massachusetts
September 16, 2011
Annual Report
The Trustees, Members of the Advisory Board, and executive officers of the trusts and funds, as applicable, are listed below. The Board of Trustees governs each fund and is responsible for protecting the interests of shareholders. The Trustees are experienced executives who meet periodically throughout the year to oversee each fund's activities, review contractual arrangements with companies that provide services to each fund, oversee management of the risks associated with such activities and contractual arrangements, and review each fund's performance. Except for James C. Curvey, each of the Trustees oversees 221 funds advised by FMR or an affiliate. Mr. Curvey oversees 419 funds advised by FMR or an affiliate.
The Trustees hold office without limit in time except that (a) any Trustee may resign; (b) any Trustee may be removed by written instrument, signed by at least two-thirds of the number of Trustees prior to such removal; (c) any Trustee who requests to be retired or who has become incapacitated by illness or injury may be retired by written instrument signed by a majority of the other Trustees; and (d) any Trustee may be removed at any special meeting of shareholders by a two-thirds vote of the outstanding voting securities of the trust. Each Trustee who is not an interested person (as defined in the 1940 Act) (Independent Trustee), shall retire not later than the last day of the calendar year in which his or her 75th birthday occurs. The Independent Trustees may waive this mandatory retirement age policy with respect to individual Trustees. The executive officers and Advisory Board Members hold office without limit in time, except that any officer and Advisory Board Member may resign or may be removed by a vote of a majority of the Trustees at any regular meeting or any special meeting of the Trustees. Except as indicated, each individual has held the office shown or other offices in the same company for the past five years.
Experience, Skills, Attributes, and Qualifications of the Funds' Trustees. The Governance and Nominating Committee has adopted a statement of policy that describes the experience, qualifications, attributes, and skills that are necessary and desirable for potential Independent Trustee candidates (Statement of Policy). The Board believes that each Trustee satisfied at the time he or she was initially elected or appointed a Trustee, and continues to satisfy, the standards contemplated by the Statement of Policy. The Governance and Nominating Committee also engages professional search firms to help identify potential Independent Trustee candidates who have the experience, qualifications, attributes, and skills consistent with the Statement of Policy. From time to time, additional criteria based on the composition and skills of the current Independent Trustees, as well as experience or skills that may be appropriate in light of future changes to board composition, business conditions, and regulatory or other developments, have also been considered by the professional search firms and the Governance and Nominating Committee. In addition, the Board takes into account the Trustees' commitment and participation in Board and committee meetings, as well as their leadership of standing and ad hoc committees throughout their tenure.
In determining that a particular Trustee was and continues to be qualified to serve as a Trustee, the Board has considered a variety of criteria, none of which, in isolation, was controlling. The Board believes that, collectively, the Trustees have balanced and diverse experience, qualifications, attributes, and skills, which allow the Board to operate effectively in governing each fund and protecting the interests of shareholders. Information about the specific experience, skills, attributes, and qualifications of each Trustee, which in each case led to the Board's conclusion that the Trustee should serve (or continue to serve) as a trustee of the funds, is provided below.
Annual Report
Trustees and Officers - continued
Board Structure and Oversight Function. James C. Curvey is an interested person (as defined in the 1940 Act) and currently serves as Acting Chairman. The Trustees have determined that an interested Chairman is appropriate and benefits shareholders because an interested Chairman has a personal and professional stake in the quality and continuity of services provided to the funds. Independent Trustees exercise their informed business judgment to appoint an individual of their choosing to serve as Chairman, regardless of whether the Trustee happens to be independent or a member of management. The Independent Trustees have determined that they can act independently and effectively without having an Independent Trustee serve as Chairman and that a key structural component for assuring that they are in a position to do so is for the Independent Trustees to constitute a substantial majority for the Board. The Independent Trustees also regularly meet in executive session. Ned C. Lautenbach serves as Chairman of the Independent Trustees and as such (i) acts as a liaison between the Independent Trustees and management with respect to matters important to the Independent Trustees and (ii) with management prepares agendas for Board meetings.
Fidelity funds are overseen by different Boards of Trustees. The funds' Board oversees Fidelity's equity and high income funds and another Board oversees Fidelity's investment-grade bond, money market, and asset allocation funds. The asset allocation funds may invest in Fidelity funds overseen by the funds' Board. The use of separate Boards, each with its own committee structure, allows the Trustees of each group of Fidelity funds to focus on the unique issues of the funds they oversee, including common research, investment, and operational issues. On occasion, the separate Boards establish joint committees to address issues of overlapping consequences for the Fidelity funds overseen by each Board.
The Trustees operate using a system of committees to facilitate the timely and efficient consideration of all matters of importance to the Trustees, each fund, and fund shareholders and to facilitate compliance with legal and regulatory requirements and oversight of the funds' activities and associated risks. The Board, acting through its committees, has charged FMR and its affiliates with (i) identifying events or circumstances the occurrence of which could have demonstrably adverse effects on the funds' business and/or reputation; (ii) implementing processes and controls to lessen the possibility that such events or circumstances occur or to mitigate the effects of such events or circumstances if they do occur; and (iii) creating and maintaining a system designed to evaluate continuously business and market conditions in order to facilitate the identification and implementation processes described in (i) and (ii) above. Because the day-to-day operations and activities of the funds are carried out by or through FMR, its affiliates and other service providers, the funds' exposure to risks is mitigated but not eliminated by the processes overseen by the Trustees. While each of the Board's committees has responsibility for overseeing different aspects of the funds' activities, oversight is exercised primarily through the Operations, Audit, and Compliance Committees. Appropriate personnel, including but not limited to the funds' Chief Compliance Officer (CCO), FMR's internal auditor, the independent accountants, the funds' Treasurer and portfolio management personnel, make periodic reports to the Board's committees, as appropriate. The responsibilities of each committee, including their oversight responsibilities, are described further under "Standing Committees of the Funds' Trustees."
Annual Report
The fund's Statement of Additional Information (SAI) includes more information about the Trustees. To request a free copy, call Fidelity at 1-800-835-5092.
Interested Trustees*:
Correspondence intended for each Trustee who is an interested person may be sent to Fidelity Investments, 82 Devonshire Street, Boston, Massachusetts 02109.
Name, Age; Principal Occupations and Other Relevant Experience+ |
James C. Curvey (76) |
| Year of Election or Appointment: 2007 Mr. Curvey is Trustee and Acting Chairman of the Board of Trustees of certain Trusts. Mr. Curvey also serves as Trustee (2007-present) of other investment companies advised by FMR. Mr. Curvey is a Director of Fidelity Investments Money Management, Inc. (2009-present), Director of Fidelity Research & Analysis Co. (2009-present) and Director of FMR and FMR Co., Inc. (2007-present). Mr. Curvey is also Vice Chairman (2007-present) and Director of FMR LLC. In addition, Mr. Curvey serves as an Overseer for the Boston Symphony Orchestra and a member of the Trustees of Villanova University. Previously, Mr. Curvey was the Vice Chairman (2006-2007) and Director (2000-2007) of FMR Corp. |
Ronald P. O'Hanley (54) |
| Year of Election or Appointment: 2011 Mr. O'Hanley is Director of FMR Co., Inc. (2010-present), Director of Fidelity Investments Money Management, Inc. (2010-present), Director of Fidelity Research & Analysis Company (2010-present), President of Fidelity Asset Management and Corporate Services and a member of Fidelity's Executive Committee (2010-present). Previously, Mr. O'Hanley served as President and Chief Executive Officer of BNY Mellon Asset Management (2007-2010). Mr. O'Hanley also served as Vice Chairman of Bank New York Mellon Corp. and a member of that firm's Executive Committee. Prior to the 2007 merger of The Bank of New York and Mellon Financial Corporation, he was Vice Chairman of Mellon Financial Corporation and President and Chief Executive Officer of Mellon Asset Management. He joined Mellon in February 1997. Mr. O'Hanley currently serves as Chairman of the Boston Public Library Foundation Board of Directors and sits on the Board of Directors of Beth Israel Deaconess Medical Center, the Board of Trustees of the Marine Biological Laboratory and the Advisory Board of the Maxwell School of Citizenship and Public Administration at Syracuse University. Mr. O'Hanley also chairs the Council on Asset Management for the Financial Services Roundtable and is a member of the Board of Directors of Institutional Investor's U.S. Institute. |
* Trustees have been determined to be "Interested Trustees" by virtue of, among other things, their affiliation with the trusts or various entities under common control with FMR.
+ The information above includes each Trustee's principal occupation during the last five years and other information relating to the experience, attributes, and skills relevant to each Trustee's qualifications to serve as a Trustee, which led to the conclusion that each Trustee should serve as a Trustee for each fund.
Annual Report
Independent Trustees:
Correspondence intended for each Independent Trustee (that is, the Trustees other than the Interested Trustees) may be sent to Fidelity Investments, P.O. Box 55235, Boston, Massachusetts 02205-5235.
Name, Age; Principal Occupations and Other Relevant Experience+ |
Dennis J. Dirks (63) |
| Year of Election or Appointment: 2005 Prior to his retirement in May 2003, Mr. Dirks was Chief Operating Officer and a member of the Board of The Depository Trust & Clearing Corporation (DTCC). He also served as President, Chief Operating Officer, and Board member of The Depository Trust Company (DTC) and President and Board member of the National Securities Clearing Corporation (NSCC). In addition, Mr. Dirks served as Chief Executive Officer and Board member of the Government Securities Clearing Corporation, Chief Executive Officer and Board member of the Mortgage-Backed Securities Clearing Corporation, as a Trustee and a member of the Finance Committee of Manhattan College (2005-2008), and as a Trustee and a member of the Finance Committee of AHRC of Nassau County (2006-2008). Mr. Dirks is a member of the Independent Directors Council (IDC) Governing Council (2010-Present) and Board of Directors for The Brookville Center for Children's Services, Inc. (2009-present). |
Alan J. Lacy (57) |
| Year of Election or Appointment: 2008 Mr. Lacy serves as Senior Adviser (2007-present) of Oak Hill Capital Partners, L.P. (private equity). Mr. Lacy also served as Chief Executive Officer (2000-2005) and Vice Chairman (2005-2006) of Sears Holdings Corporation and Sears, Roebuck and Co. (retail). In addition, Mr. Lacy serves as a member of the Board of Directors of Dave & Buster's, Inc. (restaurant and entertainment complexes, 2010-present), The Hillman Companies, Inc. (hardware wholesalers, 2010-present), and Bristol-Myers Squibb Company (global pharmaceuticals, 2007-present). Mr. Lacy is a member of the Board of Trustees of The National Parks Conservation Association (2006-Present). Previously, Mr. Lacy served as Chairman of the Board of Trustees of the National Parks Conservation Association (2008-2011) and as a member of the Board of Directors for the Western Union Company (global money transfer, 2006-2011). |
Ned C. Lautenbach (67) |
| Year of Election or Appointment: 2000 Mr. Lautenbach is Chairman of the Independent Trustees of the Equity and High Income Funds (2006-present). Mr. Lautenbach currently serves as the Lead Director of the Eaton Corporation Board of Directors (diversified industrial, 1997-present). Mr. Lautenbach is also a member of the Board of Directors of the Philharmonic Center for the Arts in Naples, Florida (1999-present); a member of the Board of Trustees of Fairfield University (2005-present); and a member of the Council on Foreign Relations (1994-present). Previously, Mr. Lautenbach was a Partner/Advisory Partner at Clayton, Dubilier & Rice, LLC (private equity investment, 1998-2010), as well as a Director of Sony Corporation (2006-2007). |
Joseph Mauriello (66) |
| Year of Election or Appointment: 2008 Prior to his retirement in January 2006, Mr. Mauriello served in numerous senior management poitions including Deputy Chairman and Chief Operating Officer (2004-2005), and Vice Chairman of Financial Services (2002-2004) of KPMG LLP US (professional services, 1965-2005). Mr. Mauriello currently serves as a member of the Board of Directors of XL Group plc. (global insurance and re-insurance, 2006-present) and of Arcadia Resources Inc. (health care services and products, 2007-present). Previously, Mr. Mauriello served as a Director of the Hamilton Funds of the Bank of New York (2006-2007). |
Robert W. Selander (60) |
| Year of Election or Appointment: 2011 Previously, Mr. Selander served as a Member of the Advisory Board of Fidelity's Equity and High Income Funds (2011), Executive Vice Chairman (2010), Chief Executive Officer (2009-2010), and President and Chief Executive Officer (1997-2009) of Mastercard, Inc. |
Cornelia M. Small (67) |
| Year of Election or Appointment: 2005 Ms. Small is a member of the Board of Directors of the Teagle Foundation (2009-present). Ms. Small is also a member of the Investment Committee, and Chair (2008-present) and a member of the Board of Trustees of Smith College. In addition, Ms. Small serves on the Investment Committee of the Berkshire Taconic Community Foundation (2008-present). Previously, Ms. Small served as Chairperson of the Investment Committee (2002-2008) of Smith College. In addition, Ms. Small served as Chief Investment Officer, Director of Global Equity Investments, and a member of the Board of Directors of Scudder, Stevens & Clark and Scudder Kemper Investments. |
William S. Stavropoulos (72) |
| Year of Election or Appointment: 2001 or 2002 Trustee of Fidelity Puritan Trust: (2001). Trustee of Fidelity Securities Fund: (2002). Mr. Stavropoulos is Vice Chairman of the Independent Trustees of the Equity and High Income Funds (2006-present). Mr. Stavropoulos serves as President and Founder of the Michigan Baseball Foundation, the Great Lakes Loons (2007-present). Mr. Stavropoulos is Chairman Emeritus of the Board of Directors of The Dow Chemical Company, where he previously served in numerous senior management positions, including President, CEO (1995-2000; 2002-2004), Chairman of the Executive Committee (2000-2006), and as a member of the Board of Directors (1990-2006). Currently, Mr. Stavropoulos is Chairman of Univar (global distributor of commodity and specialty chemicals, 2010-present), a Director of Teradata Corporation (data warehousing and technology solutions, 2008-present), Chemical Financial Corporation, Maersk Inc. (industrial conglomerate), Tyco International, Inc. (multinational manufacturing and services, 2007-present), and a member of the Advisory Board for Metalmark Capital (private equity investment, 2005-present). Mr. Stavropoulos is a special advisor to Clayton, Dubilier & Rice, LLC (private equity investment). In addition, Mr. Stavropoulos is a member of the University of Notre Dame Advisory Council for the College of Science. |
David M. Thomas (62) |
| Year of Election or Appointment: 2008 Previously, Mr. Thomas served as Executive Chairman (2005-2006) and Chairman and Chief Executive Officer (2000-2005) of IMS Health, Inc. (pharmaceutical and healthcare information solutions). In addition, Mr. Thomas serves as a member of the Board of Directors of Fortune Brands, Inc. (consumer products), and Interpublic Group of Companies, Inc. (marketing communication, 2004-present). |
Michael E. Wiley (60) |
| Year of Election or Appointment: 2008 Mr. Wiley also serves as a Director of Asia Pacific Exploration Consolidated (international oil and gas exploration and production, 2008-present). Mr. Wiley serves as a Director of Tesoro Corporation (independent oil refiner and marketer, 2005-present), and a Director of Bill Barrett Corporation (exploration and production, 2005-present). In addition, Mr. Wiley also serves as a Director of Post Oak Bank (privately-held bank, 2004-present). Previously, Mr. Wiley served as a member of the Board of Trustees of the University of Tulsa (2000-2006; 2007-2010), as a Senior Energy Advisor of Katzenbach Partners, LLC (consulting, 2006-2007), as an Advisory Director of Riverstone Holdings (private investment), Chairman, President, and CEO of Baker Hughes, Inc. (oilfield services, 2000-2004), and as Director of Spinnaker Exploration Company (exploration and production, 2001-2005). |
+ The information above includes each Trustee's principal occupation during the last five years and other information relating to the experience, attributes, and skills relevant to each Trustee's qualifications to serve as a Trustee, which led to the conclusion that each Trustee should serve as a Trustee for each fund.
Advisory Board Members and Executive Officers:
Correspondence intended for each executive officer, Edward C. Johnson 3d, and Peter S. Lynch may be sent to Fidelity Investments, 82 Devonshire Street, Boston, Massachusetts 02109.
Name, Age; Principal Occupation |
Edward C. Johnson 3d (81) |
| Year of Election or Appointment: 2011 Member of the Advisory Board of Fidelity's Equity and High Income Funds. Mr. Johnson serves as Chief Executive Officer, Chairman, and a Director of FMR LLC, and also serves as Chairman and Director of FIL Limited. Previously, Mr. Johnson served as a Trustee and Chairman of the Board of certain Fidelity Trusts, Chairman and a Director of FMR, Chairman and a Director of FMR Co., Inc., and President of FMR LLC (2006-2007). |
Peter S. Lynch (67) |
| Year of Election or Appointment: 2003 Member of the Advisory Board of Fidelity's Equity and High Income Funds. Mr. Lynch is Vice Chairman and a Director of FMR and FMR Co., Inc. In addition, Mr. Lynch serves as a Trustee of Boston College and as the Chairman of the Inner-City Scholarship Fund. Previously, Mr. Lynch served on the Special Olympics International Board of Directors (1997-2006). |
Kenneth B. Robins (41) |
| Year of Election or Appointment: 2008 President and Treasurer of Fidelity's Equity and High Income Funds. Mr. Robins also serves as President and Treasurer (2010-present) and Assistant Treasurer (2009-present) of other Fidelity funds and is an employee of Fidelity Investments (2004-present). Previously, Mr. Robins served as Deputy Treasurer of the Fidelity funds (2005-2008) and Treasurer and Chief Financial Officer of The North Carolina Capital Management Trust: Cash and Term Portfolios (2006-2008). |
Thomas C. Hense (47) |
| Year of Election or Appointment: 2008 or 2010 Vice President of Fidelity's High Income (2008), Small Cap (2008), and Value (2010) Funds. Previously, Mr. Hense served as a portfolio manager for Fidelity's Institutional Money Market Management Group (Pyramis) (2003-2008). |
Brian B. Hogan (46) |
| Year of Election or Appointment: 2009 Vice President of Equity and High Income Funds. Mr. Hogan also serves as President of FMR's Equity Division (2009-present). Previously, Mr. Hogan served as Senior Vice President, Equity Research of FMR (2006-2009) and as a portfolio manager. |
Scott C. Goebel (43) |
| Year of Election or Appointment: 2008 Secretary and Chief Legal Officer (CLO) of the Fidelity funds. Mr. Goebel also serves as Secretary of Fidelity Investments Money Management, Inc. (FIMM) (2010-present) and Fidelity Research and Analysis Company (FRAC) (2010-present); Secretary and CLO of The North Carolina Capital Management Trust: Cash and Term Portfolios (2008-present); General Counsel, Secretary, and Senior Vice President of FMR (2008-present) and FMR Co., Inc. (2008-present); employed by FMR LLC or an affiliate (2001-present); Chief Legal Officer of Fidelity Management & Research (Hong Kong) Limited (2008-present) and Assistant Secretary of Fidelity Management & Research (Japan) Inc. (2008-present), and Fidelity Management & Research (U.K.) Inc. (2008-present). Previously, Mr. Goebel served as Assistant Secretary of FIMM (2008-2010), FRAC (2008-2010), and the Funds (2007-2008) and as Vice President and Secretary of Fidelity Distributors Corporation (FDC) (2005-2007). |
William C. Coffey (42) |
| Year of Election or Appointment: 2009 Assistant Secretary of Fidelity's Equity and High Income Funds. Mr. Coffey also serves as Senior Vice President and Deputy General Counsel of FMR LLC (2010-present), and is an employee of Fidelity Investments. Previously, Mr. Coffey served as Vice President and Associate General Counsel of FMR LLC (2005-2009). |
Holly C. Laurent (57) |
| Year of Election or Appointment: 2008 Anti-Money Laundering (AML) Officer of the Fidelity funds. Ms. Laurent also serves as AML Officer of The North Carolina Capital Management Trust: Cash and Term Portfolios (2008-present) and is an employee of Fidelity Investments. Previously, Ms. Laurent was Senior Vice President and Head of Legal for Fidelity Business Services India Pvt. Ltd. (2006-2008), and Senior Vice President, Deputy General Counsel and Group Head for FMR LLC (2005-2006). |
Christine Reynolds (52) |
| Year of Election or Appointment: 2008 Chief Financial Officer of the Fidelity funds. Ms. Reynolds became President of Fidelity Pricing and Cash Management Services (FPCMS) in August 2008. Ms. Reynolds served as Chief Operating Officer of FPCMS (2007-2008). Previously, Ms. Reynolds served as President, Treasurer, and Anti-Money Laundering officer of the Fidelity funds (2004-2007). |
Kenneth A. Rathgeber (64) |
| Year of Election or Appointment: 2004 Chief Compliance Officer of Fidelity's Equity and High Income Funds. Mr. Rathgeber is Chief Compliance Officer of Fidelity Management & Research (Hong Kong) Limited (2008-present), Fidelity Management & Research (Japan) Inc. (2008-present), FMR (2005-present), FMR Co., Inc. (2005-present), Fidelity Management & Research (U.K.) Inc. (2005-present), Fidelity Research & Analysis Company (2005-present), Fidelity Investments Money Management, Inc. (2005-present), Pyramis Global Advisors, LLC (2005-present), and Strategic Advisers, Inc. (2005-present). |
Jeffrey S. Christian (49) |
| Year of Election or Appointment: 2009 Deputy Treasurer of the Fidelity funds. Mr. Christian is an employee of Fidelity Investments. Previously, Mr. Christian served as Chief Financial Officer (2008-2009) of certain Fidelity funds and Senior Vice President of Fidelity Pricing and Cash Management Services (FPCMS) (2004-2009). |
Bryan A. Mehrmann (50) |
| Year of Election or Appointment: 2005 Deputy Treasurer of the Fidelity funds. Mr. Mehrmann is an employee of Fidelity Investments. |
Adrien E. Deberghes (43) |
| Year of Election or Appointment: 2008 Deputy Treasurer of Fidelity's Equity and High Income Funds. Mr. Deberghes also serves as Assistant Treasurer of other Fidelity funds (2010-present) and is an employee of Fidelity Investments (2008-present). Previously, Mr. Deberghes served as Senior Vice President of Mutual Fund Administration at State Street Corporation (2007-2008), Senior Director of Mutual Fund Administration at Investors Bank & Trust (2005-2007), and Director of Finance for Dunkin' Brands (2000-2005). |
Stephanie J. Dorsey (42) |
| Year of Election or Appointment: 2010 Assistant Treasurer of Fidelity's Equity and High Income Funds. Ms. Dorsey also serves as Deputy Treasurer of other Fidelity funds (2008-present) and is an employee of Fidelity Investments (2008-present). Previously, Ms. Dorsey served as Treasurer (2004-2008) of the JPMorgan Mutual Funds and Vice President (2004-2008) of JPMorgan Chase Bank. |
John R. Hebble (53) |
| Year of Election or Appointment: 2009 Assistant Treasurer of Fidelity's Equity and High Income Funds. Mr. Hebble also serves as President (2011-present), Treasurer, and Chief Financial Officer of The North Carolina Capital Management Trust: Cash and Term Portfolios (2008-present), President and Treasurer of other Fidelity funds (2008-present) and is an employee of Fidelity Investments. |
Gary W. Ryan (52) |
| Year of Election or Appointment: 2005 Assistant Treasurer of the Fidelity funds. Mr. Ryan is an employee of Fidelity Investments. Previously, Mr. Ryan served as Vice President of Fund Reporting in Fidelity Pricing and Cash Management Services (FPCMS) (1999-2005). |
Jonathan Davis (43) |
| Year of Election or Appointment: 2010 Assistant Treasurer of the Fidelity funds. Mr. Davis is an employee of Fidelity Investments. Previously, Mr. Davis served as Vice President and Associate General Counsel of FMR LLC (2003-2010). |
Annual Report
Class K designates 100% of the dividends distributed during the fiscal year as qualifying for the dividends-received deduction for corporate shareholders.
Class K designates 100% of the dividends distributed during the fiscal year as amounts which may be taken into account as a dividend for the purposes of the maximum rate under section 1(h)(11) of the Internal Revenue Code.
The fund will notify shareholders in January 2012 of amounts for use in preparing 2011 income tax returns.
Annual Report
Board Approval of Investment Advisory Contracts and Management Fees
Fidelity Leveraged Company Stock Fund
Each year, the Board of Trustees, including the Independent Trustees (together, the Board), votes on the renewal of the management contract and sub-advisory agreements (together, the Advisory Contracts) for the fund. The Board, assisted by the advice of fund counsel and Independent Trustees' counsel, requests and considers a broad range of information relevant to the renewal of the Advisory Contracts throughout the year.
The Board meets regularly and considers at each of its meetings factors that are relevant to its annual consideration of the renewal of the fund's Advisory Contracts, including the services and support provided to the fund and its shareholders. The Board has established various standing committees, each composed of Independent Trustees with varying backgrounds, to which the Board has assigned specific subject matter responsibilities in order to enhance effective decision-making by the Board. The Board, acting directly and through its Committees, requests and receives information concerning the annual consideration of the renewal of the fund's Advisory Contracts. The Board also meets as needed to consider matters specifically related to the Board's annual consideration of the renewal of Advisory Contracts. Members of the Board may also meet with trustees of other Fidelity funds through ad hoc joint committees to discuss certain matters relevant to the Fidelity funds.
At its July 2011 meeting, the Board of Trustees, including the Independent Trustees, unanimously determined to renew the fund's Advisory Contracts. In reaching its determination, the Board considered all factors it believed relevant, including (i) the nature, extent, and quality of the services to be provided to the fund and its shareholders (including the investment performance of the fund); (ii) the competitiveness of the fund's management fee and total expense ratio; (iii) the total costs of the services to be provided by and the profits to be realized by Fidelity from its relationship with the fund; (iv) the extent to which economies of scale would be realized as the fund grows; and (v) whether fee levels reflect these economies of scale, if any, for the benefit of fund shareholders.
In considering whether to renew the Advisory Contracts for the fund, the Board reached a determination, with the assistance of fund counsel and Independent Trustees' counsel and through the exercise of its business judgment, that the renewal of the Advisory Contracts is in the best interests of the fund and its shareholders and that the compensation payable under the Advisory Contracts is fair and reasonable. The Board's decision to renew the Advisory Contracts was not based on any single factor, but rather was based on a comprehensive consideration of all the information provided to the Board at its meetings throughout the year. The Board, in reaching its determination to renew the Advisory Contracts, is aware that shareholders in the fund have a broad range of investment choices available to them, including a wide choice among mutual funds offered by Fidelity's competitors, and that the fund's shareholders, who have the opportunity to review and weigh the disclosure provided by the fund in its prospectus and other public disclosures, have chosen to invest in this fund, managed by Fidelity.
Annual Report
Nature, Extent, and Quality of Services Provided. The Board considered the staffing within the investment adviser, FMR, and the sub-advisers (together, the Investment Advisers), including the backgrounds of the fund's investment personnel and the fund's investment objective and discipline. The Independent Trustees also had discussions with senior management of Fidelity's investment operations and investment groups. The Board considered the structure of the portfolio manager compensation program and whether this structure provides appropriate incentives to act in the best interests of the fund.
Resources Dedicated to Investment Management and Support Services. The Board and the Fund Oversight and Research Committees reviewed the general qualifications and capabilities of the Investment Advisers' investment staff, including its size, education, experience, and resources, as well as the Investment Advisers' approach to recruiting, training, managing, and compensating investment personnel. The Board also noted that FMR has devoted increased resources to non-U.S. offices. The Board noted that Fidelity's analysts have extensive resources, tools and capabilities which allow them to conduct sophisticated quantitative and fundamental analysis, as well as credit analysis of issuers, counterparties and enhancers. The Board also believes that Fidelity's investment professionals have sufficient access to global information and data so as to provide competitive investment results over time, and that those professionals also have access to sophisticated tools which permit them to assess portfolio construction and risk and performance attribution characteristics continuously, as well as to transmit new information and research conclusions rapidly around the world. Additionally, in their deliberations, the Board considered the Investment Advisers' trading capabilities and resources which are an integral part of the investment management process.
Shareholder and Administrative Services. The Board considered (i) the nature, extent, quality, and cost of advisory, administrative, and shareholder services performed by the Investment Advisers and their affiliates under the Advisory Contracts and under separate agreements covering transfer agency, pricing and bookkeeping, and securities lending services for the fund; (ii) the nature and extent of the investment adviser's supervision of third party service providers, principally custodians and subcustodians; and (iii) the resources devoted to, and the record of compliance with, the fund's compliance policies and procedures. The Board also reviewed the allocation of fund brokerage, including allocations to brokers affiliated with the Investment Advisers, the use of brokerage commissions to pay fund expenses, and the use of "soft" commission dollars to pay for research services.
The Board noted that the growth of fund assets over time across the complex allows Fidelity to reinvest in the development of services designed to enhance the value or convenience of the Fidelity funds as investment vehicles. These services include 24-hour access to account information and market information through telephone representatives and over the Internet, investor education materials and asset allocation tools, and the expanded availability of Fidelity Investor Centers, with 35 new branches opening since 2010.
Annual Report
Board Approval of Investment Advisory Contracts and
Management Fees - continued
Investment in a Large Fund Family. The Board considered the benefits to shareholders of investing in a Fidelity fund, including the benefits of investing in a fund that is part of a large family of funds offering a variety of investment disciplines and providing a large variety of mutual fund investor services. The Board noted that Fidelity had taken, or had made recommendations that resulted in the Fidelity funds taking, a number of actions over the previous year that benefited particular funds, including (i) continuing to dedicate additional resources to investment research and support of the senior management team that oversees asset management; (ii) rationalizing product lines through the mergers of six funds into other funds; (iii) continuing to migrate the Freedom Funds to dedicated lower cost underlying funds; (iv) obtaining shareholder approval to broaden the investment strategies for Fidelity Consumer Finance Portfolio, Fidelity Emerging Asia Fund, and Fidelity Environment and Alternative Energy Portfolio; (v) contractually agreeing to reduce the management fees and impose other expense limitations on Spartan® 500 Index Fund and U.S. Bond Index Fund in connection with launching new institutional classes of these funds; (vi) changing the name, primary and supplemental benchmarks, and investment policies of Fidelity Global Strategies Fund to support the fund's flexible investment mandate and global orientation; and (vii) reducing the transfer agency account fee rates on certain accounts.
Investment Performance. The Board considered whether the fund has operated in accordance with its investment objective, as well as its record of compliance with its investment restrictions. It also reviewed the fund's absolute investment performance for each class, as well as the fund's relative investment performance for each class measured over multiple periods against (i) a broad-based securities market index, and (ii) a custom peer group of mutual funds deemed appropriate by Fidelity and reviewed by the Board. The following charts considered by the Board show, over the one-, three-, and five-year periods ended December 31, 2010, as available, the cumulative total returns of Class K and the retail class of the fund, the cumulative total returns of a broad-based securities market index ("benchmark"), and a range of cumulative total returns of a custom peer group of mutual funds defined by FMR based on categories assigned by Morningstar, Inc. The box within each chart shows the 25th percentile return (bottom of box) and the 75th percentile return (top of box) of the peer group. Returns shown above the box are in the first quartile and returns shown below the box are in the fourth quartile. The percentage beaten numbers noted below each chart correspond to the percentile box and represent the percentage of funds in the peer group whose performance was equal to or lower than that of the class indicated. The fund's custom peer group, defined by FMR, is a peer group that FMR believes provides a more meaningful performance comparison than the peer group assigned by Morningstar, Inc., which assigns mutual funds to categories based on their investment styles as measured by their underlying portfolio holdings.
Annual Report
Fidelity Leveraged Company Stock Fund
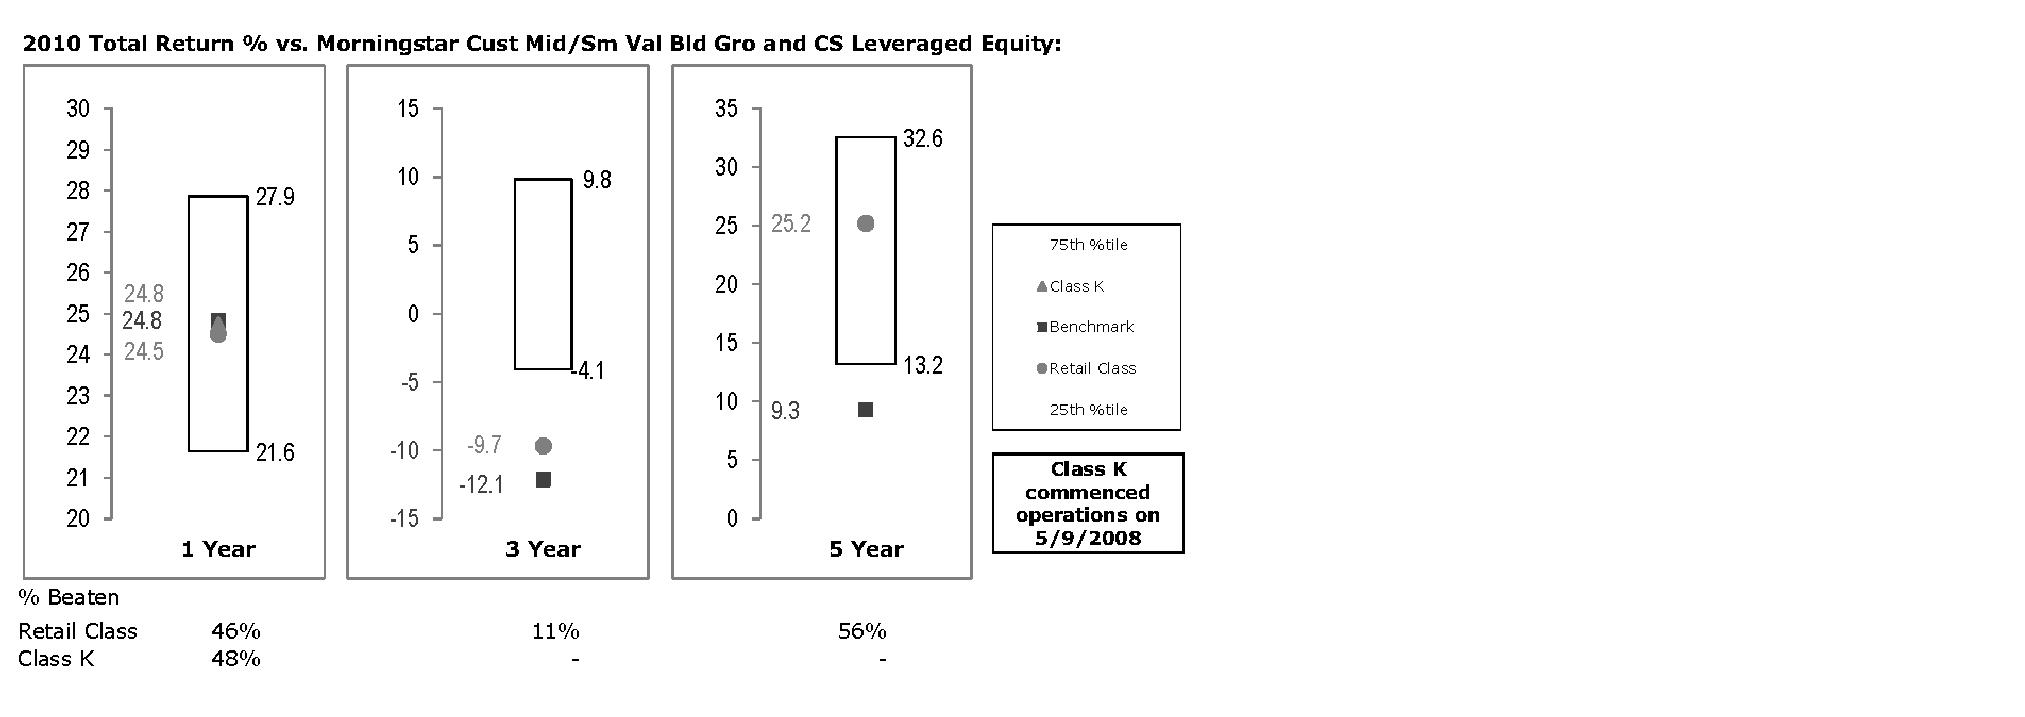
The Board reviewed the fund's relative investment performance against its peer group and noted that the performance of the retail class of the fund (the class with the longer performance record) was in the third quartile for the one-year period, the fourth quartile for the three-year period, and the second quartile for the five-year period. The Board also noted that the investment performance of the retail class of the fund compared favorably to its benchmark for the three- and five-year periods, although the one-year total return of the retail class of the fund was lower than its benchmark. The Board considered that the variations in performance between the fund's classes reflect the variations in class expenses, which result in lower performance for the higher expense class. The Board discussed with FMR actions that have been taken by FMR to improve the fund's disappointing performance relative to its peer group. The Board also reviewed the fund's performance since inception as well as performance in the current year. The Board will continue to closely monitor the performance of the fund in the coming year and discuss with FMR other appropriate actions to address the performance of the fund.
Based on its review, the Board concluded that the nature, extent, and quality of services provided to the fund under the Advisory Contracts should benefit the fund's shareholders.
Competitiveness of Management Fee and Total Expense Ratio. The Board considered the fund's management fee and total expense ratio compared to "mapped groups" of competitive funds and classes. Fidelity creates "mapped groups" by combining similar Lipper investment objective categories that have comparable management fee characteristics. Combining Lipper investment objective categories aids the Board's management fee and total expense ratio comparisons by broadening the competitive group used for comparison and by reducing the number of universes to which various Fidelity funds are compared.
Annual Report
Board Approval of Investment Advisory Contracts and
Management Fees - continued
Management Fee. The Board considered two proprietary management fee comparisons for the 12-month periods shown in the chart below. The group of Lipper funds used by the Board for management fee comparisons is referred to below as the "Total Mapped Group." The Total Mapped Group comparison focuses on a fund's standing relative to the total universe of comparable funds available to investors in terms of gross management fees before expense reimbursements or caps. "TMG %" represents the percentage of funds in the Total Mapped Group that had management fees that were lower than the fund's. For example, a TMG % of 17% means that 83% of the funds in the Total Mapped Group had higher management fees than the fund. The "Asset-Size Peer Group" (ASPG) comparison focuses on a fund's standing relative to non-Fidelity funds similar in size to the fund within the Total Mapped Group. The ASPG represents at least 15% of the funds in the Total Mapped Group with comparable asset size and management fee characteristics, subject to a minimum of 50 funds (or all funds in the Total Mapped Group if fewer than 50). Additional information, such as the ASPG quartile in which the fund's management fee ranked, is also included in the chart and considered by the Board.
Fidelity Leveraged Company Stock Fund
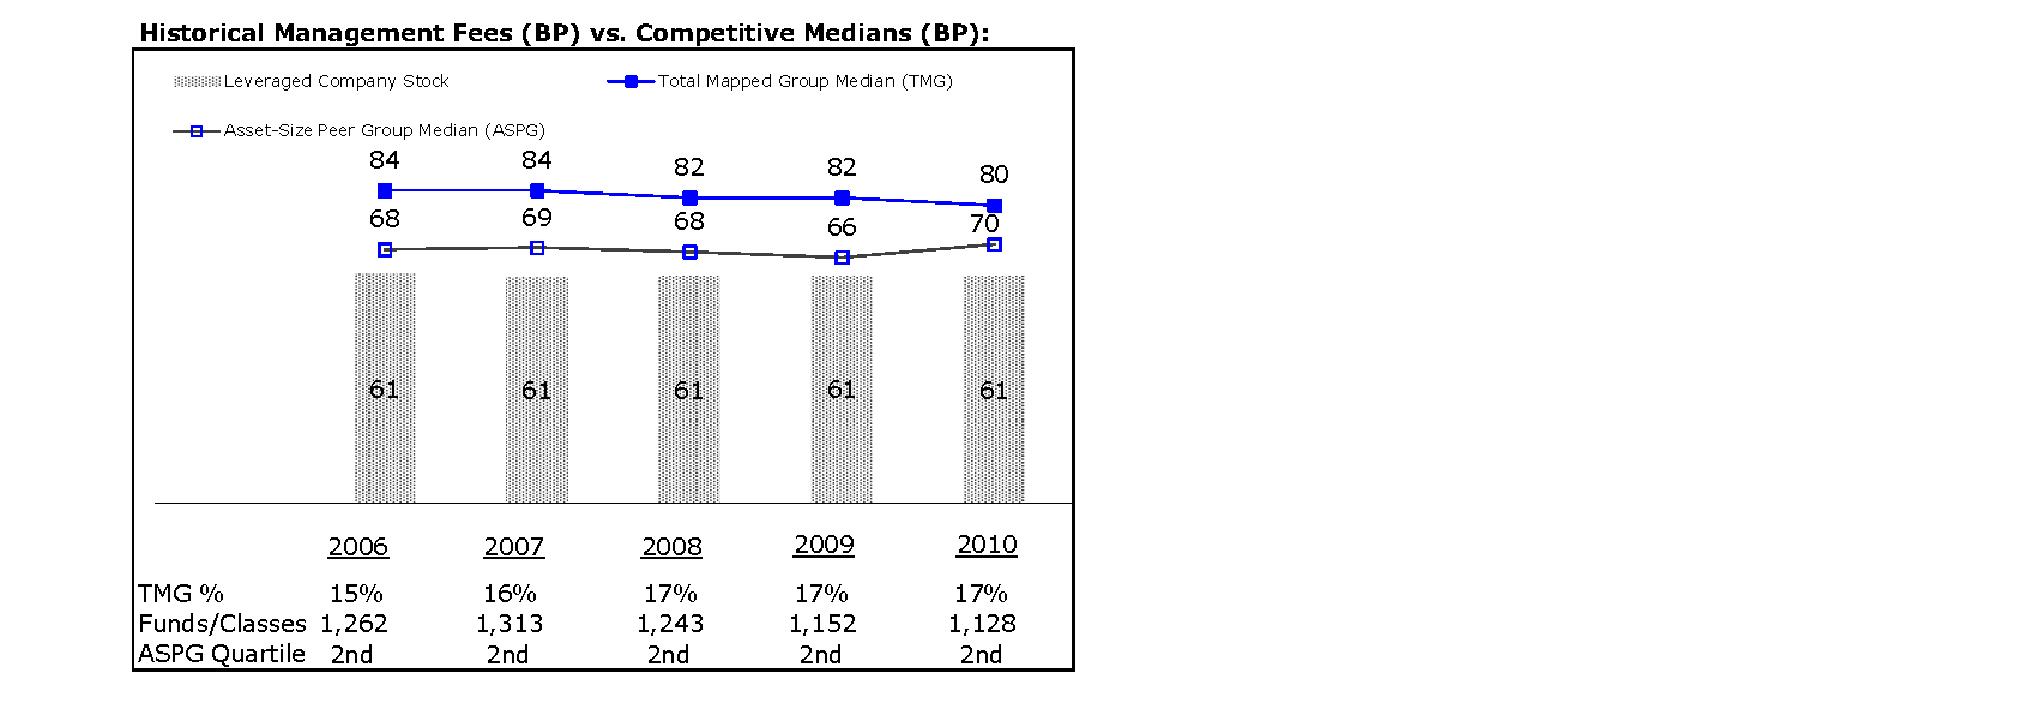
Annual Report
The Board noted that the fund's management fee ranked below the median of its Total Mapped Group and below the median of its ASPG for 2010.
Based on its review, the Board concluded that the fund's management fee is fair and reasonable in light of the services that the fund receives and the other factors considered.
Total Expense Ratio. In its review of each class's total expense ratio, the Board considered the fund's management fee as well as other fund or class expenses, as applicable, such as transfer agent fees, pricing and bookkeeping fees, and custodial, legal, and audit fees. The Board also noted the effects of any waivers and reimbursements on fees and expenses. As part of its review, the Board also considered the current and historical total expense ratios of each class of the fund compared to competitive fund median expenses. Each class of the fund is compared to those funds and classes in the Total Mapped Group (used by the Board for management fee comparisons) that have a similar sales load structure.
The Board noted that the total expense ratio of each class ranked below its competitive median for 2010. The Board considered that various factors, including 12b-1 fees, positive or negative performance adjustments, and relatively higher other expenses in the case of small fund size, can affect total expense ratios.
Fees Charged to Other Fidelity Clients. The Board also considered Fidelity fee structures and other information with respect to clients of FMR and its affiliates, such as other mutual funds advised or subadvised by FMR or its affiliates, pension plan clients, and other institutional clients. In March 2010, the Board created an ad hoc joint committee with the board of other Fidelity funds (the Committee) to review and compare Fidelity's institutional investment advisory business with its business of providing services to the Fidelity funds, including the differences in services provided, fees charged, and costs incurred, as well as competition in their respective marketplaces.
Based on its review of total expense ratios and fees charged to other Fidelity clients, the Board concluded that the total expense ratio of each class of the fund was reasonable in light of the services that the fund and its shareholders receive and the other factors considered, including the findings of the Committee.
Costs of the Services and Profitability. The Board considered the revenues earned and the expenses incurred by Fidelity in conducting the business of developing, marketing, distributing, managing, administering and servicing the fund and its shareholders. The Board also considered the level of Fidelity's profits in respect of all the Fidelity funds.
On an annual basis, FMR presents to the Board Fidelity's profitability for the fund. Fidelity calculates the profitability for each fund, as well as aggregate profitability for groups of Fidelity funds and all Fidelity funds, using a series of detailed revenue and cost allocation methodologies which originate with the books and records of Fidelity on which Fidelity's audited financial statements are based. The Audit Committee of the Board reviews any significant changes from the prior year's methodologies.
Annual Report
Board Approval of Investment Advisory Contracts and
Management Fees - continued
PricewaterhouseCoopers LLP (PwC), independent registered public accounting firm and auditor to Fidelity and certain Fidelity funds, has been engaged annually by the Board as part of the Board's assessment of Fidelity's profitability analysis. PwC's engagement includes the review and assessment of Fidelity's methodologies used in determining the revenues and expenses attributable to Fidelity's mutual fund business, and completion of agreed-upon procedures surrounding the mathematical accuracy of fund profitability and its conformity to allocation methodologies. After considering PwC's reports issued under the engagement and information provided by Fidelity, the Board concluded that while other allocation methods may also be reasonable, Fidelity's profitability methodologies are reasonable in all material respects.
The Board also reviewed Fidelity's non-fund businesses and fall-out benefits related to the mutual fund business as well as cases where Fidelity's affiliates may benefit from or be related to the fund's business.
The Board considered the costs of the services provided by and the profits realized by Fidelity in connection with the operation of the fund and was satisfied that the profitability was not excessive in the circumstances.
Economies of Scale. The Board considered whether there have been economies of scale in respect of the management of the Fidelity funds, whether the Fidelity funds (including the fund) have appropriately benefited from any such economies of scale, and whether there is potential for realization of any further economies of scale. The Board considered the extent to which the fund will benefit from economies of scale through increased services to the fund, through waivers or reimbursements, or through fee or expense reductions. The Board also noted that in 2009, it and the board of other Fidelity funds created an ad hoc committee (the Economies of Scale Committee) to analyze whether FMR attains economies of scale in respect of the management and servicing of the Fidelity funds, whether the Fidelity funds have appropriately benefited from such economies of scale, and whether there is potential for realization of any further economies of scale.
The Board recognized that the fund's management contract incorporates a "group fee" structure, which provides for lower group fee rates as total fund assets under FMR's management increase, and for higher group fee rates as total fund assets under FMR's management decrease. FMR calculates the group fee rates based on a tiered asset "breakpoint" schedule that varies based on asset class. The Board considered that the group fee is designed to deliver the benefits of economies of scale to fund shareholders when total Fidelity fund assets increase, even if assets of any particular fund are unchanged or have declined, because some portion of Fidelity's costs are attributable to services provided to all Fidelity funds, and all funds benefit if those costs can be allocated among more assets. The Board concluded that, given the group fee structure, fund shareholders will benefit from lower management fees as assets under FMR's management increase at the fund complex level, regardless of whether Fidelity achieves any such economies of scale.
Annual Report
The Board concluded, taking into account the analysis of the Economies of Scale Committee, that any potential economies of scale are being appropriately shared between fund shareholders and Fidelity.
Additional Information Requested by the Board. In order to develop fully the factual basis for consideration of the Fidelity funds' Advisory Contracts, the Board requested and received additional information on certain topics, including (i) fund performance trends, actions to be taken by FMR to improve certain funds' overall performance, and Fidelity's long-term strategies for certain funds; (ii) portfolio manager changes that have occurred during the past year and length of portfolio manager tenure for different categories of funds over time; (iii) Fidelity's compensation structure for portfolio managers and other key personnel and strategies for attracting and retaining non-investment personnel; (iv) the amount of the investment that each portfolio manager has made in the Fidelity fund(s) that he or she manages; (v) historical trends in Fidelity's realization of fall-out benefits; (vi) Fidelity's group fee structures and the rationale for the individual fee rates of certain funds; (vii) fund profitability methodology and the impact of certain factors on fund profitability results; (viii) trends regarding industry use of performance fee structures and Fidelity's compliance practices with respect to performance adjustment calculations; (ix) the fee structures in place for certain other Fidelity clients; and (x) explanations regarding the relative total expense ratios of certain funds and classes, total expense competitive trends, and actions that might be taken by FMR to reduce total expense ratios for certain funds and classes.
Based on its evaluation of all of the conclusions noted above, and after considering all factors it believed relevant, the Board ultimately concluded that the advisory fee structures are fair and reasonable, and that the fund's Advisory Contracts should be renewed.
Annual Report
Managing Your Investments
Fidelity offers several ways to conveniently manage your workplace benefits (including your workplace savings plan, investments, and additional services) via your telephone or PC. You can access your plan and account information and research your investments 24 hours a day.
By Phone
Fidelity provides a single toll-free number to access plan information, account balances, positions, and quotes*. It's easy to navigate the service, and on your first call, the system will help you create a personal identification number (PIN) for security.
(phone_graphic)
Fidelity Workplace
Investing
1-800-835-5092
By PC
Fidelity's web site on the Internet provides a wide range of information, including plan information, daily financial news, fund performance, interactive planning tools, and news about Fidelity products and services.
(computer_graphic)
Fidelity's Web Site
www.401k.com
* When you call the quotes line, please remember that a fund's yield and return will vary and, except for money market funds, share price will also vary. This means that you may have a gain or loss when you sell your shares. There is no assurance that money market funds will be able to maintain a stable $1 share price; an investment in a money market fund is not insured or guaranteed by the U.S. government. Total returns are historical and include changes in share price, reinvestment of dividends and capital gains distributions, and the effects of any sales charges.
Annual Report
To Write Fidelity
We'll give your correspondence immediate attention and send you written confirmation upon completion of your request.
(letter_graphic)
For Non-Retirement
Accounts
Buying shares
Fidelity Investments
P.O. Box 770001
Cincinnati, OH 45277-0003
Overnight Express
Fidelity Investments
Attn: Distribution Services
100 Crosby Parkway - KC1H
Covington, KY 41015
Selling shares
Fidelity Investments
P.O. Box 770001
Cincinnati, OH 45277-0035
Overnight Express
Fidelity Investments
Attn: Distribution Services
100 Crosby Parkway - KC1H
Covington, KY 41015
General Correspondence
Fidelity Investments
P.O. Box 500
Merrimack, NH 03054-0500
(letter_graphic)
For Retirement
Accounts
Buying shares
Fidelity Investments
P.O. Box 770001
Cincinnati, OH 45277-0003
Selling shares
Fidelity Investments
P.O. Box 770001
Cincinnati, OH 45277-0035
Overnight Express
Fidelity Investments
Attn: Distribution Services
100 Crosby Parkway - KC1H
Covington, KY 41015
General Correspondence
Fidelity Investments
P.O. Box 500
Merrimack, NH 03054-0500
Annual Report
Investment Adviser
Fidelity Management & Research Company
Boston, MA
Investment Sub-Adviser
FMR Co., Inc.
Fidelity Management & Research
(U.K.) Inc.
Fidelity Management & Research
(Hong Kong) Limited
Fidelity Management & Research
(Japan) Inc.
General Distributor
Fidelity Distributors Corporation
Boston, MA
Transfer and Service Agents
Fidelity Investments Institutional
Operations Company, Inc.
Boston, MA
Fidelity Service Company, Inc.
Boston, MA
Custodian
JPMorgan Chase Bank
New York, NY
LSF-K-UANN-0911
1.863381.102
Fidelity®
OTC
Portfolio
Annual Report
July 31, 2011
(2_fidelity_logos) (Registered_Trademark)
Contents
Chairman's Message | <Click Here> | The Chairman's message to shareholders. |
Performance | <Click Here> | How the fund has done over time. |
Management's Discussion of Fund Performance | <Click Here> | The Portfolio Manager's review of fund
performance and strategy. |
Shareholder Expense Example | <Click Here> | An example of shareholder expenses. |
Investment Changes | <Click Here> | A summary of major shifts in the fund's investments over the past six months. |
Investments | <Click Here> | A complete list of the fund's investments with their market values. |
Financial Statements | <Click Here> | Statements of assets and liabilities, operations, and changes in net assets, as well as financial highlights. |
Notes | <Click Here> | Notes to the financial statements. |
Report of Independent Registered Public Accounting Firm | <Click Here> | |
Trustees and Officers | <Click Here> | |
Board Approval of Investment Advisory Contracts and Management Fees | <Click Here> | |
To view a fund's proxy voting guidelines and proxy voting record for the 12-month period ended June 30, visit http://www.fidelity.com/proxyvotingresults or visit the Securities and Exchange Commission's (SEC) web site at http://www.sec.gov. You may also call 1-800-544-8544 to request a free copy of the proxy voting guidelines.
Standard & Poor's, S&P and S&P 500 are registered service marks of The McGraw-Hill Companies, Inc. and have been licensed for use by Fidelity Distributors Corporation.
Other third party marks appearing herein are the property of their respective owners.
All other marks appearing herein are registered or unregistered trademarks or service marks of FMR LLC or an affiliated company.
Annual Report
This report and the financial statements contained herein are submitted for the general information of the shareholders of the fund. This report is not authorized for distribution to prospective investors in the fund unless preceded or accompanied by an effective prospectus.
A fund files its complete schedule of portfolio holdings with the SEC for the first and third quarters of each fiscal year on Form N-Q. Forms N-Q are available on the SEC's web site at http://www.sec.gov. A fund's Forms N-Q may be reviewed and copied at the SEC's Public Reference Room in Washington, DC. Information regarding the operation of the SEC's Public Reference Room may be obtained by calling 1-800-SEC-0330. For a complete list of a fund's portfolio holdings, view the most recent holdings listing, semiannual report, or annual report on Fidelity's web site at http://www.fidelity.com, http://www.advisor.fidelity.com, or http://www.401k.com, as applicable.
NOT FDIC INSURED • MAY LOSE VALUE • NO BANK GUARANTEE
Neither the fund nor Fidelity Distributors Corporation is a bank.
Annual Report
(photo_of_James_C_Curvey)
Dear Shareholder:
The second half of 2011 began with U.S. equities continuing to give back some of the gains achieved earlier in the year. In the days leading up to July 31, markets were shaken by a political stalemate in which Congress struggled to address the debt ceiling issue before an early-August deadline. The resulting uncertainty held back markets in July, the third consecutive monthly decline for equities, effectively reversing the positive momentum seen through the end of April. Financial markets are always unpredictable, of course, but there are several time-tested investment principles that can help put the odds in your favor.
One of the basic tenets is to invest for the long term. Over time, riding out the markets' inevitable ups and downs has proven much more effective than selling into panic or chasing the hottest trend. Even missing only a few of the markets' best days can significantly diminish investor returns. Patience also affords the benefits of compounding - of earning interest on additional income or reinvested dividends and capital gains. There can be tax advantages and cost benefits to consider as well. While staying the course doesn't eliminate risk, it can considerably lessen the effect of short-term declines.
You can further manage your investing risk through diversification. And today, more than ever, geographic diversification should be taken into account. Studies indicate that asset allocation is the single most important determinant of a portfolio's long-term success. The right mix of stocks, bonds and cash - aligned to your particular risk tolerance and investment objective - is very important. Age-appropriate rebalancing is also an essential aspect of asset allocation. For younger investors, an emphasis on equities - which historically have been the best-performing asset class over time - is encouraged. As investors near their specific goal, such as retirement or sending a child to college, consideration may be given to replacing volatile assets (e.g. common stocks) with more-stable fixed investments (bonds or savings plans).
A third principle - investing regularly - can help lower the average cost of your purchases. Investing a certain amount of money each month or quarter helps ensure you won't pay for all your shares at market highs. This strategy - known as dollar cost averaging - also reduces "emotion" from investing, helping shareholders avoid selling weak performers just prior to an upswing, or chasing a hot performer just before a correction.
We invite you to contact us via the Internet, through our Investor Centers or by phone. It is our privilege to provide you the information you need to make the investments that are right for you.
Sincerely,
(The acting chairman's signature appears here.)
James C. Curvey
Acting Chairman
Annual Report
Average annual total return reflects the change in the value of an investment, assuming reinvestment of the class' distributions from dividend income and capital gains (the profits earned upon the sale of securities that have grown in value, if any) and assuming a constant rate of performance each year. The $10,000 table and the fund's returns do not reflect the deduction of taxes that a shareholder would pay on fund distributions or the redemption of fund shares. During periods of reimbursement by Fidelity, a fund's total return will be greater than it would be had the reimbursement not occurred. How a fund did yesterday is no guarantee of how it will do tomorrow.
Average Annual Total Returns
Periods ended July 31, 2011 | Past 1
year | Past 5
years | Past 10
years |
Fidelity® OTC Portfolio | 31.73% | 11.31% | 6.17% |
$10,000 Over 10 Years
Let's say hypothetically that $10,000 was invested in Fidelity® OTC Portfolio, a class of the fund, on July 31, 2001. The chart shows how the value of your investment would have changed, and also shows how the Nasdaq Composite® Index performed over the same period.

Annual Report
Market Recap: U.S. stocks registered solid double-digit gains for the 12 months ending July 31, 2011, extending a rally that began more than two years earlier. Despite a rough start in August 2010, markets turned positive in September, as increased demand for capital goods and other upbeat indicators trumped investor worry about a U.S. recessionary relapse. The broad market, as measured by the S&P 500® Index, rose 9% that month, its biggest September gain in 71 years. Seven more monthly advances followed, fueled by encouraging corporate earnings and economic activity. However, volatility picked up in the period's latter months, as markets reacted to continued high U.S. unemployment, nagging debt troubles in Europe and looming legislative battles over the federal debt ceiling. May unemployment rose above 9% for the first time in 2011, contributing to a traditional "June swoon" for stocks. Market uncertainty lingered in July, when the S&P 500® posted its second-biggest monthly loss of the period. For the full year, the S&P 500® climbed 19.65%, while the blue-chip-laden Dow Jones Industrial AverageSM rose a comparable 19.09% and the technology-heavy Nasdaq Composite® Index gained 23.53%. On the capitalization spectrum, stocks of mid-cap companies fared best, with the Russell Midcap® Index rising 24.51% and the small-cap Russell 2000® Index adding 23.92%.
Comments from Gavin Baker, Portfolio Manager of Fidelity® OTC Portfolio: During the year, the fund's Retail Class shares returned 31.73%, topping the Nasdaq Composite® Index. Versus the index, stock selection in information technology was a positive factor. Stock picking in health care and consumer discretionary also helped, although the benefits were modestly dampened by unrewarding industry positioning. Rewarding picks and industry selection in industrials further lifted results. The top individual contributor was a large out-of-index position in data center operator Rackspace Hosting, whose stock was buoyed by strong demand for outsourcing corporate technology operations. Other contributors included out-of-benchmark holding Accretive Health, which provides revenue-enhancement services and software for hospitals; graphics chip supplier NVIDIA; women's athletic apparel maker lululemon athletica; and an underweighting in networking equipment provider and weak-performing index component Cisco Systems. Conversely, stock selection in financials hurt. Canadian smartphone maker Research In Motion, the largest individual detractor, lost market share in developed markets and couldn't capitalize on opportunities in emerging markets. Broadband provider Clearwire and for-profit education holding Strayer Education were other notable detractors. I sold Research In Motion and Strayer Education before period end.
The views expressed above reflect those of the portfolio manager(s) only through the end of the period as stated on the cover of this report and do not necessarily represent the views of Fidelity or any other person in the Fidelity organization. Any such views are subject to change at any time based upon market or other conditions and Fidelity disclaims any responsibility to update such views. These views may not be relied on as investment advice and, because investment decisions for a Fidelity fund are based on numerous factors, may not be relied on as an indication of trading intent on behalf of any Fidelity fund.
Annual Report
Shareholder Expense Example
As a shareholder of the Fund, you incur two types of costs: (1) transaction costs, and (2) ongoing costs, including management fees and other Fund expenses. This Example is intended to help you understand your ongoing costs (in dollars) of investing in the Fund and to compare these costs with the ongoing costs of investing in other mutual funds.
The Example is based on an investment of $1,000 invested at the beginning of the period and held for the entire period (February 1, 2011 to July 31, 2011).
Actual Expenses
The first line of the accompanying table for each class of the Fund provides information about actual account values and actual expenses. You may use the information in this line, together with the amount you invested, to estimate the expenses that you paid over the period. Simply divide your account value by $1,000.00 (for example, an $8,600 account value divided by $1,000.00 = 8.6), then multiply the result by the number in the first line for a class of the Fund under the heading entitled "Expenses Paid During Period" to estimate the expenses you paid on your account during this period. A small balance maintenance fee of $12.00 that is charged once a year may apply for certain accounts with a value of less than $2,000. This fee is not included in the table below. If it was, the estimate of expenses you paid during the period would be higher, and your ending account value lower, by this amount. In addition, the Fund, as a shareholder in the underlying Fidelity Central Funds, will indirectly bear its pro-rata share of the fees and expenses incurred by the underlying Fidelity Central Funds. These fees and expenses are not included in the Fund's annualized expense ratio used to calculate the expense estimate in the table below.
Hypothetical Example for Comparison Purposes
The second line of the accompanying table for each class of the Fund provides information about hypothetical account values and hypothetical expenses based on a Class' actual expense ratio and an assumed rate of return of 5% per year before expenses, which is not the Class' actual return. The hypothetical account values and expenses may not be used to estimate the actual ending account balance or expenses you paid for the period. You may use this information to compare the ongoing costs of investing in the Fund and other funds. To do so, compare this 5% hypothetical example with the 5% hypothetical examples that appear in the shareholder reports of the other funds. A small balance maintenance fee of $12.00 that is charged once a year may apply for certain accounts with a value of less than $2,000. This fee is not included in the table below. If it was, the estimate of expenses you paid during the period would be higher, and your ending account value lower, by this amount. In addition, the Fund, as a shareholder in the underlying Fidelity Central Funds, will indirectly bear its pro-rata share of the fees and expenses incurred by the underlying Fidelity Central Funds. These fees and expenses are not included in the Fund's annualized expense ratio used to calculate the expense estimate in the table below.
Please note that the expenses shown in the table are meant to highlight your ongoing costs only and do not reflect any transaction costs. Therefore, the second line of the table is useful in comparing ongoing costs only, and will not help you determine the relative total costs of owning different funds.
Annual Report
Shareholder Expense Example - continued
| Annualized
Expense Ratio | Beginning
Account Value
February 1, 2011 | Ending
Account Value
July 31, 2011 | Expenses Paid
During Period*
February 1, 2011 to
July 31, 2011 |
OTC | .96% | | | |
Actual | | $ 1,000.00 | $ 1,037.60 | $ 4.85 |
HypotheticalA | | $ 1,000.00 | $ 1,020.03 | $ 4.81 |
Class K | .82% | | | |
Actual | | $ 1,000.00 | $ 1,038.30 | $ 4.14 |
HypotheticalA | | $ 1,000.00 | $ 1,020.73 | $ 4.11 |
A 5% return per year before expenses
* Expenses are equal to each Class' annualized expense ratio, multiplied by the average account value over the period, multiplied by 181/365 (to reflect the one-half year period).
Annual Report
Investment Changes (Unaudited)
Top Ten Stocks as of July 31, 2011 |
| % of fund's
net assets | % of fund's net assets
6 months ago |
Apple, Inc. | 11.7 | 9.8 |
Google, Inc. Class A | 8.4 | 7.7 |
Amazon.com, Inc. | 4.2 | 2.2 |
NVIDIA Corp. | 3.6 | 5.0 |
Cognizant Technology Solutions Corp. Class A | 3.5 | 1.5 |
Amgen, Inc. | 3.3 | 1.7 |
Vertex Pharmaceuticals, Inc. | 3.0 | 0.4 |
QUALCOMM, Inc. | 3.0 | 2.2 |
Rackspace Hosting, Inc. | 3.0 | 3.6 |
Accretive Health, Inc. | 2.9 | 1.3 |
| 46.6 | |
Top Five Market Sectors as of July 31, 2011 |
| % of fund's
net assets | % of fund's net assets
6 months ago |
Information Technology | 58.2 | 55.3 |
Consumer Discretionary | 17.8 | 14.5 |
Health Care | 15.3 | 13.2 |
Energy | 2.8 | 2.7 |
Financials | 2.4 | 5.2 |
Asset Allocation (% of fund's net assets) |
As of July 31, 2011* | As of January 31, 2011** |
| Stocks 99.6% | | | Stocks 100.2% | |
| Short-Term
Investments and
Net Other Assets 0.4% | | | Short-Term
Investments and
Net Other Assets (0.2)%† | |
* Foreign investments | 8.6% | | ** Foreign investments | 12.5% | |

† Short-Term Investments and Net Other Assets are not included in the pie chart.
Annual Report
Investments July 31, 2011
Showing Percentage of Net Assets
Common Stocks - 99.4% |
| Shares | | Value (000s) |
CONSUMER DISCRETIONARY - 17.6% |
Auto Components - 0.6% |
Gentex Corp. | 1,498,400 | | $ 42,465 |
Automobiles - 2.2% |
Tesla Motors, Inc. (a)(d) | 5,132,864 | | 144,593 |
Volkswagen AG sponsored ADR | 609,300 | | 22,349 |
| | 166,942 |
Diversified Consumer Services - 0.0% |
Coinstar, Inc. (a) | 14,600 | | 713 |
Global Education & Technology Group Ltd. ADR (a) | 221,261 | | 1,111 |
| | 1,824 |
Hotels, Restaurants & Leisure - 1.9% |
BJ's Restaurants, Inc. (a) | 529,000 | | 24,530 |
Bravo Brio Restaurant Group, Inc. | 661,025 | | 14,774 |
China Lodging Group Ltd. ADR (a)(d) | 188,800 | | 3,236 |
Ctrip.com International Ltd. sponsored ADR (a) | 16,900 | | 779 |
Dunkin' Brands Group, Inc. | 37,400 | | 1,082 |
Las Vegas Sands Corp. (a) | 54,900 | | 2,590 |
Starbucks Corp. | 2,536,800 | | 101,700 |
Wynn Resorts Ltd. | 4,700 | | 722 |
| | 149,413 |
Household Durables - 1.1% |
iRobot Corp. (a)(e) | 1,657,886 | | 57,960 |
Lennar Corp. Class A | 221,900 | | 3,925 |
PulteGroup, Inc. (a) | 98,700 | | 678 |
SodaStream International Ltd. (d) | 327,858 | | 24,048 |
Techtronic Industries Co. Ltd. | 672,500 | | 702 |
| | 87,313 |
Internet & Catalog Retail - 4.8% |
Amazon.com, Inc. (a) | 1,462,986 | | 325,544 |
ASOS PLC (a) | 272,328 | | 10,148 |
E-Commerce China Dangdang, Inc. ADR (d) | 62,900 | | 711 |
Ocado Group PLC (a) | 2,604,632 | | 7,282 |
Priceline.com, Inc. (a) | 28,200 | | 15,162 |
Start Today Co. Ltd. | 559,500 | | 13,899 |
| | 372,746 |
Media - 5.8% |
Comcast Corp. Class A | 9,105,900 | | 218,724 |
Discovery Communications, Inc. (a) | 992,311 | | 39,494 |
DISH Network Corp. Class A (a) | 4,084,200 | | 121,015 |
Focus Media Holding Ltd. ADR (a) | 23,500 | | 773 |
Common Stocks - continued |
| Shares | | Value (000s) |
CONSUMER DISCRETIONARY - continued |
Media - continued |
IMAX Corp. (a) | 318,700 | | $ 6,043 |
Liberty Global, Inc. Class A (a) | 17,400 | | 727 |
Pandora Media, Inc. (d) | 1,306,500 | | 19,715 |
Sirius XM Radio, Inc. (a)(d) | 17,256,800 | | 36,412 |
WPP PLC sponsored ADR | 11,900 | | 673 |
| | 443,576 |
Specialty Retail - 0.0% |
Francescas Holdings Corp. | 9,100 | | 239 |
I.T Ltd. | 722,000 | | 710 |
Teavana Holdings, Inc. | 10,300 | | 290 |
Ulta Salon, Cosmetics & Fragrance, Inc. (a) | 10,400 | | 656 |
| | 1,895 |
Textiles, Apparel & Luxury Goods - 1.2% |
Deckers Outdoor Corp. (a) | 8,000 | | 794 |
lululemon athletica, Inc. (a) | 1,482,546 | | 89,753 |
Polo Ralph Lauren Corp. Class A | 5,100 | | 689 |
Steven Madden Ltd. (a) | 45,550 | | 1,735 |
Trinity Ltd. | 700,000 | | 776 |
| | 93,747 |
TOTAL CONSUMER DISCRETIONARY | | 1,359,921 |
CONSUMER STAPLES - 1.1% |
Beverages - 0.0% |
Hansen Natural Corp. (a) | 8,700 | | 667 |
Food & Staples Retailing - 0.0% |
Droga Raia SA | 37,000 | | 686 |
Whole Foods Market, Inc. | 10,900 | | 727 |
| | 1,413 |
Food Products - 1.1% |
Green Mountain Coffee Roasters, Inc. (a) | 699,500 | | 72,713 |
Tingyi (Cayman Islands) Holding Corp. ADR | 11,100 | | 685 |
Want Want China Holdings Ltd. ADR | 217,500 | | 9,698 |
| | 83,096 |
Personal Products - 0.0% |
USANA Health Sciences, Inc. (a)(d) | 22,500 | | 615 |
TOTAL CONSUMER STAPLES | | 85,791 |
Common Stocks - continued |
| Shares | | Value (000s) |
ENERGY - 2.8% |
Energy Equipment & Services - 1.0% |
ION Geophysical Corp. (a) | 3,015,000 | | $ 30,572 |
Petroleum Geo-Services ASA sponsored ADR (a) | 59,600 | | 969 |
Saipem SpA ADR | 1,035,700 | | 26,990 |
Transocean Ltd. (United States) | 401,800 | | 24,735 |
| | 83,266 |
Oil, Gas & Consumable Fuels - 1.8% |
Amyris, Inc. (d) | 1,014,900 | | 23,495 |
Brigham Exploration Co. (a) | 311,900 | | 9,918 |
Carrizo Oil & Gas, Inc. (a) | 119,200 | | 4,577 |
Georesources, Inc. (a)(d)(e) | 1,869,300 | | 47,705 |
Gulfport Energy Corp. (a) | 83,600 | | 3,048 |
KiOR, Inc. Class A (d) | 122,600 | | 1,772 |
Petroleum Development Corp. (a)(e) | 1,219,551 | | 44,294 |
Solazyme, Inc. | 143,900 | | 3,288 |
| | 138,097 |
TOTAL ENERGY | | 221,363 |
FINANCIALS - 2.4% |
Capital Markets - 0.1% |
Goldman Sachs Group, Inc. | 58,000 | | 7,828 |
Commercial Banks - 0.9% |
Associated Banc-Corp. | 54,700 | | 747 |
Fulton Financial Corp. | 63,700 | | 647 |
HDFC Bank Ltd. sponsored ADR | 1,251,000 | | 43,485 |
Huntington Bancshares, Inc. | 114,900 | | 695 |
National Penn Bancshares, Inc. | 88,300 | | 710 |
Popular, Inc. (a) | 271,600 | | 652 |
Standard Chartered PLC | 26,500 | | 681 |
SVB Financial Group (a) | 19,800 | | 1,208 |
Wells Fargo & Co. | 739,900 | | 20,673 |
Zions Bancorporation | 62,600 | | 1,371 |
| | 70,869 |
Diversified Financial Services - 1.4% |
Citigroup, Inc. | 569,060 | | 21,818 |
CME Group, Inc. | 273,100 | | 78,978 |
Hong Kong Exchanges and Clearing Ltd. | 34,800 | | 718 |
Common Stocks - continued |
| Shares | | Value (000s) |
FINANCIALS - continued |
Diversified Financial Services - continued |
JPMorgan Chase & Co. | 17,700 | | $ 716 |
NBH Holdings Corp. Class A (a)(f) | 110,800 | | 1,994 |
| | 104,224 |
Insurance - 0.0% |
Protective Life Corp. | 30,300 | | 644 |
TOTAL FINANCIALS | | 183,565 |
HEALTH CARE - 15.3% |
Biotechnology - 10.3% |
Achillion Pharmaceuticals, Inc. (a) | 456,472 | | 3,382 |
Alexion Pharmaceuticals, Inc. (a) | 109,920 | | 6,243 |
Alnylam Pharmaceuticals, Inc. (a) | 69,600 | | 653 |
Amarin Corp. PLC ADR (a) | 5,348,961 | | 72,425 |
Amgen, Inc. | 4,592,100 | | 251,188 |
Amylin Pharmaceuticals, Inc. (a) | 976,939 | | 11,635 |
Anthera Pharmaceuticals, Inc. (a) | 1,404,700 | | 11,195 |
ARIAD Pharmaceuticals, Inc. (a) | 83,400 | | 992 |
Biogen Idec, Inc. (a) | 14,200 | | 1,447 |
BioMarin Pharmaceutical, Inc. (a) | 98,800 | | 3,086 |
Celgene Corp. (a) | 539,616 | | 31,999 |
Cepheid, Inc. (a) | 361,600 | | 13,654 |
Dendreon Corp. (a) | 20,836 | | 769 |
Genomic Health, Inc. (a) | 26,320 | | 707 |
Human Genome Sciences, Inc. (a) | 2,237,012 | | 47,000 |
ImmunoGen, Inc. (a) | 297,309 | | 4,023 |
Inhibitex, Inc. (a) | 179,200 | | 742 |
InterMune, Inc. (a) | 666,320 | | 22,242 |
Ironwood Pharmaceuticals, Inc. Class A (a)(d) | 2,084,400 | | 31,162 |
Isis Pharmaceuticals, Inc. (a)(d) | 80,849 | | 699 |
NPS Pharmaceuticals, Inc. (a) | 337,200 | | 3,257 |
Pharmasset, Inc. (a) | 171,300 | | 20,792 |
Seattle Genetics, Inc. (a) | 535,103 | | 9,113 |
Targacept, Inc. (a) | 216,749 | | 4,430 |
Theravance, Inc. (a) | 53,000 | | 1,133 |
Vertex Pharmaceuticals, Inc. (a) | 4,470,688 | | 231,850 |
Vical, Inc. (a) | 2,303,364 | | 11,079 |
| | 796,897 |
Health Care Equipment & Supplies - 0.2% |
Endologix, Inc. (a) | 93,600 | | 850 |
Common Stocks - continued |
| Shares | | Value (000s) |
HEALTH CARE - continued |
Health Care Equipment & Supplies - continued |
Mako Surgical Corp. (a)(d) | 358,863 | | $ 10,339 |
Masimo Corp. | 22,700 | | 631 |
Zoll Medical Corp. (a) | 49,800 | | 3,469 |
| | 15,289 |
Health Care Providers & Services - 3.7% |
Accretive Health, Inc. (a)(d)(e) | 7,504,545 | | 225,437 |
Express Scripts, Inc. (a) | 1,083,300 | | 58,780 |
| | 284,217 |
Health Care Technology - 0.2% |
athenahealth, Inc. (a) | 186,300 | | 10,953 |
SXC Health Solutions Corp. (a) | 12,200 | | 772 |
| | 11,725 |
Life Sciences Tools & Services - 0.4% |
Fluidigm Corp. (a)(d) | 43,083 | | 731 |
Illumina, Inc. (a)(d) | 503,582 | | 31,449 |
| | 32,180 |
Pharmaceuticals - 0.5% |
Endocyte, Inc. | 706,700 | | 9,420 |
Shire PLC sponsored ADR | 316,100 | | 32,874 |
| | 42,294 |
TOTAL HEALTH CARE | | 1,182,602 |
INDUSTRIALS - 0.3% |
Aerospace & Defense - 0.1% |
Bombardier, Inc. | 264,100 | | 1,603 |
Rolls-Royce Group PLC sponsored ADR | 27,400 | | 1,456 |
| | 3,059 |
Air Freight & Logistics - 0.0% |
C.H. Robinson Worldwide, Inc. | 9,500 | | 687 |
Construction & Engineering - 0.0% |
Fluor Corp. | 10,500 | | 667 |
Foster Wheeler AG (a) | 53,984 | | 1,463 |
| | 2,130 |
Electrical Equipment - 0.2% |
Polypore International, Inc. (a) | 182,200 | | 12,390 |
Common Stocks - continued |
| Shares | | Value (000s) |
INDUSTRIALS - continued |
Machinery - 0.0% |
3D Systems Corp. (a)(d) | 33,619 | | $ 720 |
Chart Industries, Inc. (a) | 12,900 | | 684 |
| | 1,404 |
Trading Companies & Distributors - 0.0% |
Rush Enterprises, Inc. Class A (a) | 34,900 | | 698 |
TOTAL INDUSTRIALS | | 20,368 |
INFORMATION TECHNOLOGY - 58.2% |
Communications Equipment - 7.2% |
Acme Packet, Inc. (a) | 11,074 | | 652 |
Alcatel-Lucent SA sponsored ADR (a) | 6,377,600 | | 25,829 |
Aruba Networks, Inc. (a)(d)(e) | 7,814,527 | | 179,343 |
Brocade Communications Systems, Inc. (a) | 5,544,895 | | 30,386 |
Cisco Systems, Inc. | 900 | | 14 |
HTC Corp. | 14,542 | | 432 |
Juniper Networks, Inc. (a) | 149,803 | | 3,504 |
Meru Networks, Inc. (a)(d)(e) | 969,089 | | 8,324 |
Polycom, Inc. (a) | 1,760,700 | | 47,592 |
QUALCOMM, Inc. | 4,196,400 | | 229,879 |
Riverbed Technology, Inc. (a) | 898,102 | | 25,713 |
Sandvine Corp. (a) | 732,366 | | 1,617 |
| | 553,285 |
Computers & Peripherals - 14.7% |
Apple, Inc. (a) | 2,310,000 | | 902,004 |
Dell, Inc. (a) | 6,524,400 | | 105,956 |
Fusion-io, Inc. | 298,124 | | 8,827 |
NetApp, Inc. (a) | 1,278,450 | | 60,752 |
SanDisk Corp. (a) | 757,650 | | 32,223 |
Silicon Graphics International Corp. (a)(d) | 1,144,500 | | 16,332 |
Stratasys, Inc. (a)(d) | 142,205 | | 3,626 |
Synaptics, Inc. (a)(d) | 311,707 | | 7,659 |
| | 1,137,379 |
Electronic Equipment & Components - 0.3% |
E Ink Holdings, Inc. GDR (a)(f) | 35,700 | | 740 |
FLIR Systems, Inc. | 167,000 | | 4,586 |
HLS Systems International Ltd. (a)(d) | 659,100 | | 4,594 |
Common Stocks - continued |
| Shares | | Value (000s) |
INFORMATION TECHNOLOGY - continued |
Electronic Equipment & Components - continued |
IPG Photonics Corp. (a) | 16,258 | | $ 979 |
Maxwell Technologies, Inc. (a) | 827,037 | | 13,952 |
| | 24,851 |
Internet Software & Services - 14.8% |
Active Network, Inc. | 51,200 | | 929 |
Baidu.com, Inc. sponsored ADR (a) | 57,000 | | 8,953 |
Blinkx PLC (a) | 2,725,181 | | 4,887 |
DeNA Co. Ltd. | 306,900 | | 15,332 |
eBay, Inc. (a) | 3,314,094 | | 108,537 |
Facebook, Inc. Class B (a)(g) | 335,669 | | 8,392 |
Google, Inc. Class A (a) | 1,075,022 | | 648,980 |
IntraLinks Holdings, Inc. | 1,221,606 | | 18,666 |
LinkedIn Corp. (a)(d) | 13,300 | | 1,344 |
LogMeIn, Inc. (a)(d) | 881,040 | | 31,321 |
Mail.ru Group Ltd. GDR (a)(f) | 11,300 | | 404 |
OpenTable, Inc. (a)(d) | 836,979 | | 59,308 |
Rackspace Hosting, Inc. (a)(d) | 5,704,134 | | 228,165 |
Renren, Inc. ADR (d) | 131,000 | | 1,419 |
SINA Corp. (a) | 17,500 | | 1,892 |
Travelzoo, Inc. (a)(d) | 11,200 | | 591 |
Velti PLC (a) | 356,351 | | 5,883 |
Yandex NV | 19,800 | | 692 |
| | 1,145,695 |
IT Services - 3.8% |
Cognizant Technology Solutions Corp. Class A (a) | 3,858,645 | | 269,604 |
Echo Global Logistics, Inc. (a)(d) | 118,457 | | 1,772 |
hiSoft Technology International Ltd. ADR (a)(d) | 1,207,280 | | 16,745 |
MasterCard, Inc. Class A | 9,600 | | 2,911 |
ServiceSource International, Inc. | 27,300 | | 509 |
| | 291,541 |
Semiconductors & Semiconductor Equipment - 6.4% |
Avago Technologies Ltd. | 948,735 | | 31,906 |
Cypress Semiconductor Corp. | 32,550 | | 670 |
First Solar, Inc. (a) | 5,636 | | 666 |
Freescale Semiconductor Holdings I Ltd. | 116,200 | | 1,898 |
GT Solar International, Inc. (a)(d) | 116,300 | | 1,586 |
Lam Research Corp. (a) | 571,000 | | 23,342 |
Mellanox Technologies Ltd. (a) | 1,242,951 | | 43,317 |
Micron Technology, Inc. (a) | 91,900 | | 677 |
Netlogic Microsystems, Inc. (a)(d) | 1,409,800 | | 48,709 |
Common Stocks - continued |
| Shares | | Value (000s) |
INFORMATION TECHNOLOGY - continued |
Semiconductors & Semiconductor Equipment - continued |
NVIDIA Corp. (a) | 19,877,412 | | $ 274,905 |
NXP Semiconductors NV | 749,234 | | 14,820 |
Skyworks Solutions, Inc. (a) | 968,300 | | 24,508 |
Standard Microsystems Corp. (a) | 29,100 | | 689 |
Volterra Semiconductor Corp. (a) | 1,206,500 | | 31,092 |
| | 498,785 |
Software - 11.0% |
Ariba, Inc. (a) | 2,120,714 | | 70,132 |
BMC Software, Inc. (a) | 13,600 | | 588 |
BroadSoft, Inc. (a) | 830,880 | | 24,270 |
Check Point Software Technologies Ltd. (a) | 90,282 | | 5,205 |
Citrix Systems, Inc. (a) | 219,200 | | 15,791 |
DemandTec, Inc. (a) | 257,533 | | 1,844 |
Fortinet, Inc. (a) | 33,200 | | 675 |
Gameloft (a)(e) | 7,479,787 | | 51,802 |
Informatica Corp. (a) | 26,700 | | 1,365 |
Kingdee International Software Group Co. Ltd. | 1,288,800 | | 756 |
Magma Design Automation, Inc. (a) | 319,614 | | 2,378 |
Microsoft Corp. | 6,312,565 | | 172,964 |
MicroStrategy, Inc. Class A (a) | 401,600 | | 64,003 |
Oracle Corp. | 5,357,900 | | 163,845 |
Pegasystems, Inc. (d) | 1,268,765 | | 51,207 |
QLIK Technologies, Inc. | 941,600 | | 28,540 |
Rovi Corp. (a) | 841,100 | | 44,553 |
salesforce.com, Inc. (a) | 4,400 | | 637 |
SuccessFactors, Inc. (a) | 1,866,405 | | 50,393 |
Synchronoss Technologies, Inc. (a)(e) | 3,240,027 | | 94,771 |
Taleo Corp. Class A (a) | 261,322 | | 8,650 |
| | 854,369 |
TOTAL INFORMATION TECHNOLOGY | | 4,505,905 |
MATERIALS - 1.3% |
Chemicals - 0.1% |
Celanese Corp. Class A | 13,300 | | 733 |
CF Industries Holdings, Inc. | 50,800 | | 7,890 |
Innophos Holdings, Inc. | 15,056 | | 726 |
| | 9,349 |
Common Stocks - continued |
| Shares | | Value (000s) |
MATERIALS - continued |
Metals & Mining - 1.2% |
Randgold Resources Ltd. sponsored ADR | 986,900 | | $ 89,620 |
Royal Gold, Inc. | 17,500 | | 1,122 |
| | 90,742 |
TOTAL MATERIALS | | 100,091 |
TELECOMMUNICATION SERVICES - 0.4% |
Diversified Telecommunication Services - 0.0% |
Cbeyond, Inc. (a) | 54,190 | | 609 |
Wireless Telecommunication Services - 0.4% |
Clearwire Corp. Class A (a)(d) | 7,718,153 | | 16,748 |
Sprint Nextel Corp. (a) | 2,217,945 | | 9,382 |
Vodafone Group PLC sponsored ADR | 64,400 | | 1,810 |
| | 27,940 |
TOTAL TELECOMMUNICATION SERVICES | | 28,549 |
TOTAL COMMON STOCKS (Cost $6,750,604) | 7,688,155 |
Nonconvertible Preferred Stocks - 0.2% |
| | | |
CONSUMER DISCRETIONARY - 0.2% |
Automobiles - 0.2% |
Porsche Automobil Holding SE (Germany) (Cost $14,198) | 258,075 | | 19,905 |
Money Market Funds - 5.9% |
| Shares | | Value (000s) |
Fidelity Securities Lending Cash Central Fund, 0.15% (b)(c)
(Cost $456,124) | 456,124,068 | | $ 456,124 |
TOTAL INVESTMENT PORTFOLIO - 105.5% (Cost $7,220,926) | | 8,164,184 |
NET OTHER ASSETS (LIABILITIES) - (5.5)% | | (427,008) |
NET ASSETS - 100% | $ 7,737,176 |
Legend |
(a) Non-income producing |
(b) Affiliated fund that is available only to investment companies and other accounts managed by Fidelity Investments. The rate quoted is the annualized seven-day yield of the fund at period end. A complete unaudited listing of the fund's holdings as of its most recent quarter end is available upon request. In addition, each Fidelity Central Fund's financial statements, which are not covered by the Fund's Report of Independent Registered Public Accounting Firm, are available on the SEC's website or upon request. |
(c) Investment made with cash collateral received from securities on loan. |
(d) Security or a portion of the security is on loan at period end. |
(e) Affiliated company |
(f) Security exempt from registration under Rule 144A of the Securities Act of 1933. These securities may be resold in transactions exempt from registration, normally to qualified institutional buyers. At the end of the period, the value of these securities amounted to $3,138,000 or 0.0% of net assets. |
(g) Restricted securities - Investment in securities not registered under the Securities Act of 1933 (excluding 144A issues). At the end of the period, the value of restricted securities (excluding 144A issues) amounted to $8,392,000 or 0.1% of net assets. |
Additional information on each restricted holding is as follows: |
Security | Acquisition Date | Acquisition Cost (000s) |
Facebook, Inc. Class B | 3/31/11 - 5/19/11 | $ 8,394 |
Affiliated Central Funds |
Information regarding fiscal year to date income earned by the Fund from investments in Fidelity Central Funds is as follows: |
Fund | Income earned
(Amounts in thousands) |
Fidelity Cash Central Fund | $ 22 |
Fidelity Securities Lending Cash Central Fund | 6,028 |
Total | $ 6,050 |
Other Affiliated Issuers |
An affiliated company is a company in which the Fund has ownership of at least 5% of the voting securities. Fiscal year to date transactions with companies which are or were affiliates are as follows: |
Affiliate
(Amounts in thousands) | Value,
beginning of
period | Purchases | Sales Proceeds | Dividend Income | Value,
end of
period |
Accretive Health, Inc. | $ 919 | $ 126,603 | $ 3,893 | $ - | $ 225,437 |
Alphatec Holdings, Inc. | 21,863 | 1,075 | 11,983 | - | - |
Aruba Networks, Inc. | - | 217,643 | 31,574 | - | 179,343 |
BroadSoft, Inc. | - | 60,841 | 51,535 | - | - |
Echo Global Logistics, Inc. | 2,905 | 23,108 | 25,413 | - | - |
Gameloft | 36,748 | 267 | - | - | 51,802 |
Georesources, Inc. | - | 70,296 | 19,299 | - | 47,705 |
iRobot Corp. | 34,374 | 3,616 | 3,199 | - | 57,960 |
Meru Networks, Inc. | - | 31,697 | 10,303 | - | 8,324 |
Petroleum Development Corp. | - | 55,914 | 2,927 | - | 44,294 |
Rackspace Hosting, Inc. | 142,387 | 54,802 | 131,408 | - | - |
Synaptics, Inc. | - | 54,115 | 38,400 | - | - |
Synchronoss Technologies, Inc. | - | 86,185 | - | - | 94,771 |
Tesla Motors, Inc. | - | 131,425 | - | - | - |
Total | $ 239,196 | $ 917,587 | $ 329,934 | $ - | $ 709,636 |
Other Information |
The following is a summary of the inputs used, as of July 31, 2011, involving the Fund's assets and liabilities carried at fair value. The inputs or methodology used for valuing securities may not be an indication of the risk associated with investing in those securities. For more information on valuation inputs, and their aggregation into the levels used in the tables below, please refer to the Security Valuation section in the accompanying Notes to Financial Statements. |
Valuation Inputs at Reporting Date: |
Description
(Amounts in thousands) | Total | Level 1 | Level 2 | Level 3 |
Investments in Securities: | | | | |
Equities: | | | | |
Consumer Discretionary | $ 1,379,826 | $ 1,379,826 | $ - | $ - |
Consumer Staples | 85,791 | 85,791 | - | - |
Energy | 221,363 | 221,363 | - | - |
Financials | 183,565 | 181,571 | - | 1,994 |
Health Care | 1,182,602 | 1,182,602 | - | - |
Industrials | 20,368 | 20,368 | - | - |
Information Technology | 4,505,905 | 4,497,513 | - | 8,392 |
Materials | 100,091 | 100,091 | - | - |
Telecommunication Services | 28,549 | 28,549 | - | - |
Money Market Funds | 456,124 | 456,124 | - | - |
Total Investments in Securities: | $ 8,164,184 | $ 8,153,798 | $ - | $ 10,386 |
The following is a reconciliation of Investments in Securities for which Level 3 inputs were used in determining value: |
(Amounts in thousands) | |
Investments in Securities: | |
Beginning Balance | $ 2,161 |
Total Realized Gain (Loss) | - |
Total Unrealized Gain (Loss) | (169) |
Cost of Purchases | 8,394 |
Proceeds of Sales | - |
Amortization/Accretion | - |
Transfers in to Level 3 | - |
Transfers out of Level 3 | - |
Ending Balance | $ 10,386 |
The change in unrealized gain (loss) for the period attributable to Level 3 securities held at July 31, 2011 | $ (169) |
The information used in the above reconciliation represents fiscal year to date activity for any Investments in Securities identified as using Level 3 inputs at either the beginning or the end of the current fiscal period. Transfers in or out of Level 3 represent the beginning value of any Security or Instrument where a change in the pricing level occurred from the beginning to the end of the period. The cost of purchases and the proceeds of sales may include securities received or delivered through corporate actions or exchanges. Realized and unrealized gains (losses) disclosed in the reconciliation are included in Net Gain (Loss) on the Fund's Statement of Operations. |
Income Tax Information |
At July 31, 2011, the Fund had a capital loss carryforward of approximately $401,153,000 all of which will expire in fiscal 2017. Capital loss carryforwards are only available to offset future capital gains of the Fund to the extent provided by regulations and may be limited. |
See accompanying notes which are an integral part of the financial statements.
Annual Report
Statement of Assets and Liabilities
Amounts in thousands (except per-share amounts) | July 31, 2011 |
Assets | | |
Investment in securities, at value (including securities loaned of $441,213) - See accompanying schedule: Unaffiliated issuers (cost $6,184,352) | $ 6,998,424 | |
Fidelity Central Funds (cost $456,124) | 456,124 | |
Other affiliated issuers (cost $580,450) | 709,636 | |
Total Investments (cost $7,220,926) | | $ 8,164,184 |
Receivable for investments sold | | 361,447 |
Receivable for fund shares sold | | 8,694 |
Dividends receivable | | 656 |
Distributions receivable from Fidelity Central Funds | | 1,183 |
Other receivables | | 905 |
Total assets | | 8,537,069 |
| | |
Liabilities | | |
Payable to custodian bank | $ 167 | |
Payable for investments purchased | 304,166 | |
Payable for fund shares redeemed | 16,182 | |
Accrued management fee | 4,986 | |
Notes payable to affiliates | 16,905 | |
Other affiliated payables | 1,158 | |
Other payables and accrued expenses | 205 | |
Collateral on securities loaned, at value | 456,124 | |
Total liabilities | | 799,893 |
| | |
Net Assets | | $ 7,737,176 |
Net Assets consist of: | | |
Paid in capital | | $ 7,264,375 |
Accumulated net investment loss | | (134) |
Accumulated undistributed net realized gain (loss) on investments and foreign currency transactions | | (470,294) |
Net unrealized appreciation (depreciation) on investments and assets and liabilities in foreign currencies | | 943,229 |
Net Assets | | $ 7,737,176 |
See accompanying notes which are an integral part of the financial statements.
Annual Report
Statement of Assets and Liabilities - continued
Amounts in thousands (except per-share amounts) | July 31, 2011 |
OTC:
Net Asset Value, offering price and redemption price per share ($6,373,787 ÷ 107,524 shares) | | $ 59.28 |
| | |
Class K:
Net Asset Value, offering price and redemption price per share ($1,363,389 ÷ 22,872 shares) | | $ 59.61 |
See accompanying notes which are an integral part of the financial statements.
Annual Report
Financial Statements - continued
Statement of Operations
Amounts in thousands | Year ended July 31, 2011 |
Investment Income | | |
Dividends | | $ 24,625 |
Interest | | 5 |
Income from Fidelity Central Funds (including $6,028 from security lending) | | 6,050 |
Total income | | 30,680 |
| | |
Expenses | | |
Management fee
Basic fee | $ 42,763 | |
Performance adjustment | 7,488 | |
Transfer agent fees | 11,850 | |
Accounting and security lending fees | 1,239 | |
Custodian fees and expenses | 388 | |
Independent trustees' compensation | 37 | |
Appreciation in deferred trustee compensation account | 1 | |
Registration fees | 157 | |
Audit | 72 | |
Legal | 32 | |
Interest | 22 | |
Miscellaneous | 74 | |
Total expenses before reductions | 64,123 | |
Expense reductions | (833) | 63,290 |
Net investment income (loss) | | (32,610) |
Realized and Unrealized Gain (Loss) Net realized gain (loss) on: | | |
Investment securities: | | |
Unaffiliated issuers | 816,520 | |
Other affiliated issuers | 76,660 | |
Foreign currency transactions | 137 | |
Total net realized gain (loss) | | 893,317 |
Change in net unrealized appreciation (depreciation) on: Investment securities | 918,181 | |
Assets and liabilities in foreign currencies | 21 | |
Total change in net unrealized appreciation (depreciation) | | 918,202 |
Net gain (loss) | | 1,811,519 |
Net increase (decrease) in net assets resulting from operations | | $ 1,778,909 |
See accompanying notes which are an integral part of the financial statements.
Annual Report
Statement of Changes in Net Assets
Amounts in thousands | Year ended
July 31,
2011 | Year ended
July 31,
2010 |
Increase (Decrease) in Net Assets | | |
Operations | | |
Net investment income (loss) | $ (32,610) | $ (29,657) |
Net realized gain (loss) | 893,317 | 1,053,989 |
Change in net unrealized appreciation (depreciation) | 918,202 | (204,398) |
Net increase (decrease) in net assets resulting
from operations | 1,778,909 | 819,934 |
Share transactions - net increase (decrease) | (58,129) | 30,686 |
Total increase (decrease) in net assets | 1,720,780 | 850,620 |
| | |
Net Assets | | |
Beginning of period | 6,016,396 | 5,165,776 |
End of period (including accumulated net investment loss of $134 and accumulated net investment loss of $112, respectively) | $ 7,737,176 | $ 6,016,396 |
See accompanying notes which are an integral part of the financial statements.
Annual Report
Financial Highlights - OTC
Years ended July 31, | 2011 | 2010 | 2009 | 2008 | 2007 |
Selected Per-Share Data | | | | | |
Net asset value, beginning of period | $ 45.00 | $ 38.73 | $ 44.66 | $ 47.09 | $ 34.70 |
Income from Investment Operations | | | | | |
Net investment income (loss) B | (.27) | (.23) | (.12) | (.20) | (.19) |
Net realized and unrealized gain (loss) | 14.55 | 6.50 | (5.81) | (2.23) | 12.58 |
Total from investment operations | 14.28 | 6.27 | (5.93) | (2.43) | 12.39 |
Net asset value, end of period | $ 59.28 | $ 45.00 | $ 38.73 | $ 44.66 | $ 47.09 |
Total Return A | 31.73% | 16.19% | (13.28)% | (5.16)% | 35.71% |
Ratios to Average Net Assets C, E | | | | | |
Expenses before reductions | .94% | 1.06% | 1.13% | 1.06% | .96% |
Expenses net of fee waivers, if any | .94% | 1.06% | 1.13% | 1.06% | .96% |
Expenses net of all reductions | .92% | 1.04% | 1.13% | 1.05% | .95% |
Net investment income (loss) | (.49)% | (.51)% | (.37)% | (.42)% | (.45)% |
Supplemental Data | | | | | |
Net assets, end of period (in millions) | $ 6,374 | $ 5,080 | $ 4,677 | $ 6,871 | $ 8,778 |
Portfolio turnover rate D | 158% | 163% | 151% | 145% | 121% |
A Total returns would have been lower if certain expenses had not been reduced during the applicable periods shown.
B Calculated based on average shares outstanding during the period.
C Fees and expenses of any underlying Fidelity Central Funds are not included in the Fund's expense ratio. The Fund indirectly bears its proportionate share of the expenses of any underlying Fidelity Central Funds.
D Amount does not include the portfolio activity of any underlying Fidelity Central Funds.
E Expense ratios reflect operating expenses of the class. Expenses before reductions do not reflect amounts reimbursed by the investment adviser or reductions from brokerage service arrangements or reductions from other expense offset arrangements and do not represent the amount paid by the class during periods when reimbursements or reductions occur. Expenses net of fee waivers reflect expenses after reimbursement by the investment adviser but prior to reductions from brokerage service arrangements or other expense offset arrangements. Expenses net of all reductions represent the net expenses paid by the class.
See accompanying notes which are an integral part of the financial statements.
Annual Report
Financial Highlights - Class K
Years ended July 31, | 2011 | 2010 | 2009 | 2008 G |
Selected Per-Share Data | | | | |
Net asset value, beginning of period | $ 45.19 | $ 38.83 | $ 44.68 | $ 47.79 |
Income from Investment Operations | | | | |
Net investment income (loss) D | (.19) | (.16) | (.05) | (.05) |
Net realized and unrealized gain (loss) | 14.61 | 6.52 | (5.80) | (3.06) |
Total from investment operations | 14.42 | 6.36 | (5.85) | (3.11) |
Net asset value, end of period | $ 59.61 | $ 45.19 | $ 38.83 | $ 44.68 |
Total Return B, C | 31.91% | 16.38% | (13.09)% | (6.51)% |
Ratios to Average Net Assets E, H | | | | |
Expenses before reductions | .80% | .90% | .92% | .91% A |
Expenses net of fee waivers, if any | .80% | .90% | .92% | .91% A |
Expenses net of all reductions | .78% | .88% | .92% | .91% A |
Net investment income (loss) | (.35)% | (.35)% | (.17)% | (.47)% A |
Supplemental Data | | | | |
Net assets, end of period (000 omitted) | $ 1,363,389 | $ 936,256 | $ 488,683 | $ 93 |
Portfolio turnover rate F | 158% | 163% | 151% | 145% |
A Annualized
B Total returns for periods of less than one year are not annualized.
C Total returns would have been lower if certain expenses had not been reduced during the applicable periods shown.
D Calculated based on average shares outstanding during the period.
E Fees and expenses of any underlying Fidelity Central Funds are not included in the Fund's expense ratio. The Fund indirectly bears its proportionate share of the expenses of any underlying Fidelity Central Funds.
F Amount does not include the portfolio activity of any underlying Fidelity Central Funds.
G For the period May 9, 2008 (commencement of sale of shares) to July 31, 2008.
H Expense ratios reflect operating expenses of the class. Expenses before reductions do not reflect amounts reimbursed by the investment adviser or reductions from brokerage service arrangements or reductions from other expense offset arrangements and do not represent the amount paid by the class during periods when reimbursements or reductions occur. Expense ratios before reductions for start-up periods may not be representative of longer-term operating periods. Expenses net of fee waivers reflect expenses after reimbursement by the investment adviser but prior to reductions from brokerage service arrangements or other expense offset arrangements. Expenses net of all reductions represent the net expenses paid by the class.
See accompanying notes which are an integral part of the financial statements.
Annual Report
Notes to Financial Statements
For the period ended July 31, 2011
(Amounts in thousands except ratios)
1. Organization.
Fidelity OTC Portfolio (the Fund) is a non-diversified fund of Fidelity Securities Fund (the Trust) and is authorized to issue an unlimited number of shares. The Trust is registered under the Investment Company Act of 1940, as amended (the 1940 Act), as an open-end management investment company organized as a Massachusetts business trust. The Fund offers OTC shares and Class K shares, each of which has equal rights as to assets and voting privileges. Each class has exclusive voting rights with respect to matters that affect that class. Investment income, realized and unrealized capital gains and losses, the common expenses of the Fund, and certain fund-level expense reductions, if any, are allocated on a pro-rata basis to each class based on the relative net assets of each class to the total net assets of the Fund. Each class differs with respect to transfer agent fees incurred. Certain expense reductions may also differ by class.
2. Investments in Fidelity Central Funds.
The Fund invests in Fidelity Central Funds, which are open-end investment companies available only to other investment companies and accounts managed by Fidelity Management & Research Company (FMR) and its affiliates. The Fund's Schedule of Investments lists each of the Fidelity Central Funds held as of period end, if any, as an investment of the Fund, but does not include the underlying holdings of each Fidelity Central Fund. As an Investing Fund, the Fund indirectly bears its proportionate share of the expenses of the underlying Fidelity Central Funds.
The Money Market Central Funds seek preservation of capital and current income and are managed by Fidelity Investments Money Management, Inc. (FIMM), an affiliate of FMR.
A complete unaudited list of holdings for each Fidelity Central Fund is available upon request or at the Securities and Exchange Commission (the SEC) web site at www.sec.gov. In addition, the financial statements of the Fidelity Central Funds, which are not covered by the Fund's Report of Independent Registered Public Accounting Firm, are available on the SEC web site or upon request.
3. Significant Accounting Policies.
The financial statements have been prepared in conformity with accounting principles generally accepted in the United States of America (GAAP), which require management to make certain estimates and assumptions at the date of the financial statements. Actual results could differ from those estimates. Subsequent events, if any, through the date that the financial statements were issued have been evaluated in the preparation of the financial statements. The following summarizes the significant accounting policies of the Fund:
Annual Report
3. Significant Accounting Policies - continued
Security Valuation. Investments are valued as of 4:00 p.m. Eastern time on the last calendar day of the period. The Fund uses independent pricing services approved by the Board of Trustees to value its investments. When current market prices or quotations are not readily available or reliable, valuations may be determined in good faith in accordance with procedures adopted by the Board of Trustees. Factors used in determining value may include market or security specific events. The frequency with which these procedures are used cannot be predicted and they may be utilized to a significant extent. The value used for net asset value (NAV) calculation under these procedures may differ from published prices for the same securities.
The Fund categorizes the inputs to valuation techniques used to value its investments into a disclosure hierarchy consisting of three levels as shown below:
Level 1 - quoted prices in active markets for identical investments
Level 2 - other significant observable inputs (including quoted prices for similar investments, interest rates, prepayment speeds, etc.)
Level 3 - unobservable inputs (including the Fund's own assumptions based on the best information available)
Changes in valuation techniques may result in transfers in or out of an assigned level within the disclosure hierarchy. The aggregate value of investments by input level, as of July 31, 2011, as well as a roll forward of Level 3 securities, is included at the end of the Fund's Schedule of Investments. Valuation techniques used to value the Fund's investments by major category are as follows:
Equity securities, including restricted securities, for which market quotations are readily available, are valued at the last reported sale price or official closing price as reported by an independent pricing service on the primary market or exchange on which they are traded and are categorized as Level 1 in the hierarchy. In the event there were no sales during the day or closing prices are not available, securities are valued at the last quoted bid price or may be valued using the last available price and are generally categorized as Level 2 in the hierarchy. For foreign equity securities, when significant market or security specific events arise, comparisons to the valuation of American Depositary Receipts (ADRs), futures contracts, Exchange-traded funds (ETFs) and certain indexes as well as quoted prices for similar securities are used and are categorized as Level 2 in the hierarchy in these circumstances. Utilizing these techniques may result in transfers between Level 1 and Level 2. For restricted equity securities and private placements where observable inputs are limited, assumptions about market activity and risk are used and are categorized as Level 3 in the hierarchy.
Annual Report
Notes to Financial Statements - continued
(Amounts in thousands except ratios)
3. Significant Accounting Policies - continued
Security Valuation - continued
Investments in open-end mutual funds, including the Fidelity Central Funds, are valued at their closing net asset value each business day and are categorized as Level 1 in the hierarchy.
Foreign Currency. The Fund may use foreign currency contracts to facilitate transactions in foreign-denominated securities. Gains and losses from these transactions may arise from changes in the value of the foreign currency or if the counterparties do not perform under the contracts' terms.
Foreign-denominated assets, including investment securities, and liabilities are translated into U.S. dollars at the exchange rate at period end. Purchases and sales of investment securities, income and dividends received and expenses denominated in foreign currencies are translated into U.S. dollars at the exchange rate in effect on the transaction date.
The effects of exchange rate fluctuations on investments are included with the net realized and unrealized gain (loss) on investment securities. Other foreign currency transactions resulting in realized and unrealized gain (loss) are disclosed separately.
Investment Transactions and Income. For financial reporting purposes, the Fund's investment holdings and NAV include trades executed through the end of the last business day of the period. The NAV per share for processing shareholder transactions is calculated as of the close of business of the New York Stock Exchange (NYSE), normally 4:00 p.m. Eastern time and includes trades executed through the end of the prior business day. Gains and losses on securities sold are determined on the basis of identified cost and may include proceeds received from litigation. Dividend income is recorded on the ex-dividend date, except for certain dividends from foreign securities where the ex-dividend date may have passed, which are recorded as soon as the Fund is informed of the ex-dividend date. Non-cash dividends included in dividend income, if any, are recorded at the fair market value of the securities received. Distributions received on securities that represent a return of capital or capital gain are recorded as a reduction of cost of investments and/or as a realized gain. The Fund estimates the components of distributions received that may be considered return of capital distributions or capital gain distributions. Interest income and distributions from the Fidelity Central Funds are accrued as earned. Interest income includes coupon interest and amortization of premium and accretion of discount on debt securities. Investment income is recorded net of foreign taxes withheld where recovery of such taxes is uncertain.
Expenses. Expenses directly attributable to a fund are charged to that fund. Expenses attributable to more than one fund are allocated among the respective funds on the basis
Annual Report
3. Significant Accounting Policies - continued
Expenses - continued
of relative net assets or other appropriate methods. Expense estimates are accrued in the period to which they relate and adjustments are made when actual amounts are known.
Deferred Trustee Compensation. Under a Deferred Compensation Plan (the Plan), independent Trustees may elect to defer receipt of a portion of their annual compensation. Deferred amounts are invested in a cross-section of Fidelity funds, are marked-to-market and remain in the Fund until distributed in accordance with the Plan. The investment of deferred amounts and the offsetting payable to the Trustees are included in the accompanying Statement of Assets and Liabilities.
Income Tax Information and Distributions to Shareholders. Each year, the Fund intends to qualify as a regulated investment company, including distributing substantially all of its taxable income and realized gains under Subchapter M of the Internal Revenue Code and filing its U.S. federal tax return. As a result, no provision for income taxes is required. As of July 31, 2011, the Fund did not have any unrecognized tax benefits in the financial statements. A fund's federal tax return is subject to examination by the Internal Revenue Service (IRS) for a period of three years. Foreign taxes are provided for based on the Fund's understanding of the tax rules and rates that exist in the foreign markets in which it invests.
Distributions are declared and recorded on the ex-dividend date. Income dividends and capital gain distributions are declared separately for each class. Income and capital gain distributions are determined in accordance with income tax regulations, which may differ from GAAP.
Capital accounts within the financial statements are adjusted for permanent book-tax differences. These adjustments have no impact on net assets or the results of operations. Temporary book-tax differences will reverse in a subsequent period.
Book-tax differences are primarily due to foreign currency transactions, deferred trustees compensation, net operating losses, capital loss carryforwards, expiring capital loss carryforwards, and losses deferred due to wash sales.
The federal tax cost of investment securities and unrealized appreciation (depreciation) as of period end were as follows:
Gross unrealized appreciation | $ 1,274,844 |
Gross unrealized depreciation | (400,727) |
Net unrealized appreciation (depreciation) on securities and other investments | $ 874,117 |
| |
Tax Cost | $ 7,290,067 |
Annual Report
Notes to Financial Statements - continued
(Amounts in thousands except ratios)
3. Significant Accounting Policies - continued
Income Tax Information and Distributions to Shareholders - continued
The tax-based components of distributable earnings as of period end were as follows:
Capital loss carryforward | $ (401,153) |
Net unrealized appreciation (depreciation) | $ 874,089 |
Under the recently enacted Regulated Investment Company Modernization Act of 2010 (the Act), the Fund will be permitted to carry forward capital losses incurred in taxable years beginning after December 22, 2010 for an unlimited period. However, any losses incurred during those future taxable years will be required to be utilized prior to any losses incurred in pre-enactment taxable years, which generally expire after eight years from when they are incurred. Additionally, post-enactment capital losses that are carried forward will retain their character as either short-term or long-term capital losses rather than being considered all short-term as under previous law. The Fund's first fiscal year end subject to the Act will be July 31, 2012.
New Accounting Pronouncement. In May 2011, the Financial Accounting Standards Board issued Accounting Standard Update No. 2011-04, Fair Value Measurement (Topic 820) - Amendments to Achieve Common Fair Value Measurement and Disclosure Requirements in U.S. GAAP and IFRSs. The update changes the wording used to describe the requirements in GAAP for measuring fair value and for disclosing information about fair value measurements. The update is effective during interim and annual periods beginning after December 15, 2011. Management is currently evaluating the impact of the update's adoption on the Fund's financial statement disclosures.
4. Operating Policies.
Restricted Securities. The Fund may invest in securities that are subject to legal or contractual restrictions on resale. These securities generally may be resold in transactions exempt from registration or to the public if the securities are registered. Disposal of these securities may involve time-consuming negotiations and expense, and prompt sale at an acceptable price may be difficult. Information regarding restricted securities is included at the end of the Fund's Schedule of Investments.
5. Purchases and Sales of Investments.
Purchases and sales of securities, other than short-term securities, aggregated $11,063,120 and $11,195,626, respectively.
Annual Report
6. Fees and Other Transactions with Affiliates.
Management Fee. FMR and its affiliates provide the Fund with investment management related services for which the Fund pays a monthly management fee. The management fee is the sum of an individual fund fee rate that is based on an annual rate of .35% of the Fund's average net assets and a group fee rate that averaged .26% during the period. The group fee rate is based upon the average net assets of all the mutual funds advised by FMR. The group fee rate decreases as assets under management increase and increases as assets under management decrease. In addition, the management fee is subject to a performance adjustment (up to a maximum of ± .20% of the Fund's average net assets over a 36 month performance period). The upward or downward adjustment to the management fee is based on the relative investment performance of OTC as compared to an appropriate benchmark index. For the period, the total annual management fee rate, including the performance adjustment, was .71% of the Fund's average net assets.
Transfer Agent Fees. Fidelity Investments Institutional Operations Company, Inc. (FIIOC), an affiliate of FMR, is the transfer, dividend disbursing and shareholder servicing agent for each class of the Fund. FIIOC receives account fees and asset-based fees that vary according to the account size and type of account of the shareholders of OTC. FIIOC receives an asset-based fee of Class K's average net assets. FIIOC pays for typesetting, printing and mailing of shareholder reports, except proxy statements. For the period, transfer agent fees for each class were as follows:
| Amount | % of
Average
Net Assets |
OTC | $ 11,228 | .19 |
Class K | 622 | .05 |
| $ 11,850 | |
Accounting and Security Lending Fees. Fidelity Service Company, Inc. (FSC), an affiliate of FMR, maintains the Fund's accounting records. The accounting fee is based on the level of average net assets for the month. Under a separate contract, FSC administers the security lending program. The security lending fee is based on the number and duration of lending transactions.
Brokerage Commissions. The Fund placed a portion of its portfolio transactions with brokerage firms which are affiliates of the investment adviser. The commissions paid to these affiliated firms were $403 for the period.
Annual Report
Notes to Financial Statements - continued
(Amounts in thousands except ratios)
6. Fees and Other Transactions with Affiliates - continued
Interfund Lending Program. Pursuant to an Exemptive Order issued by the SEC, the Fund, along with other registered investment companies having management contracts with FMR, may participate in an interfund lending program. This program provides an alternative credit facility allowing the funds to borrow from, or lend money to, other participating affiliated funds. Any open loans, including accrued interest, at period end are presented under the caption "Notes Payable to Affiliates" in the Fund's Statement of Assets and Liabilities. The Fund's activity in this program during the period for which loans were outstanding was as follows:
Borrower or Lender | Average Daily
Loan Balance | Weighted Average Interest Rate | Interest
Expense |
Borrower | $ 14,976 | .40% | $ 21 |
7. Committed Line of Credit.
The Fund participates with other funds managed by FMR or an affiliate in a $4.0 billion credit facility (the "line of credit") to be utilized for temporary or emergency purposes to fund shareholder redemptions or for other short-term liquidity purposes. The Fund has agreed to pay commitment fees on its pro-rata portion of the line of credit, which amounted to $23 and is reflected in Miscellaneous expenses on the Statement of Operations. During the period, there were no borrowings on this line of credit.
8. Security Lending.
The Fund lends portfolio securities through a lending agent from time to time in order to earn additional income. The lending agent may loan securities to certain qualified borrowers, including Fidelity Capital Markets (FCM), a broker-dealer affiliated with the Fund. On the settlement date of the loan, the Fund receives collateral (in the form of U.S. Treasury obligations, letters of credit and/or cash) against the loaned securities and maintains collateral in an amount not less than 100% of the market value of the loaned securities during the period of the loan. The market value of the loaned securities is determined at the close of business of the Fund and any additional required collateral is delivered to the Fund on the next business day. If the borrower defaults on its obligation to return the securities loaned because of insolvency or other reasons, a fund could experience delays and costs in recovering the securities loaned or in gaining access to the collateral. Any cash collateral received is invested in the Fidelity Securities Lending Cash Central Fund. The value of loaned securities and cash collateral at period end are disclosed on the Fund's Statement of Assets and Liabilities. The value of securities loaned to FCM at period end was $14,321. Security lending income represents the income earned on investing cash collateral, less rebates paid to borrowers and lending agent fees associated with the loan, plus any premium payments received for lending certain types of securities. Security lending income is presented in the Statement of Operations as a component of income from Fidelity Central Funds, and includes $197 from securities loaned to FCM.
Annual Report
9. Bank Borrowings.
The Fund is permitted to have bank borrowings for temporary or emergency purposes to fund shareholder redemptions or for other short-term liquidity requirements. The Fund has established borrowing arrangements with certain banks. The interest rate on the borrowings is the bank's base rate, as revised from time to time. The average daily loan balance during the period for which loans were outstanding amounted to $19,977. The weighted average interest rate was .69%. The interest expense amounted to $1 under the bank borrowing program. At period end, there were no bank borrowings outstanding.
10. Expense Reductions.
Many of the brokers with whom FMR places trades on behalf of the Fund provided services to the Fund in addition to trade execution. These services included payments of certain expenses on behalf of the Fund totaling $833 for the period.
11. Share Transactions.
Transactions for each class of shares were as follows:
| Shares | Dollars |
Years ended July 31, | 2011 | 2010 A | 2011 | 2010 A |
OTC | | | | |
Shares sold | 24,641 | 27,879 | $ 1,408,789 | $ 1,242,349 |
Conversion to Class K | - | (520) | - | (20,492) |
Shares redeemed | (29,999) | (35,233) | (1,594,260) | (1,562,257) |
Net increase (decrease) | (5,358) | (7,874) | $ (185,471) | $ (340,400) |
Class K | | | | |
Shares sold | 7,657 | 11,838 | $ 426,960 | $ 538,757 |
Conversion from OTC | - | 518 | - | 20,492 |
Shares redeemed | (5,502) | (4,224) | (299,618) | (188,163) |
Net increase (decrease) | 2,155 | 8,132 | $ 127,342 | $ 371,086 |
A Conversion transactions for Class K and OTC are presented for the period August 1, 2009 through August 31, 2009.
12. Other.
The Fund's organizational documents provide former and current trustees and officers with a limited indemnification against liabilities arising in connection with the performance of their duties to the Fund. In the normal course of business, the Fund may also enter into contracts that provide general indemnifications. The Fund's maximum exposure under these arrangements is unknown as this would be dependent on future claims that may be made against the Fund. The risk of material loss from such claims is considered remote.
Annual Report
To the Trustees of Fidelity Securities Fund and Shareholders of Fidelity OTC Portfolio:
We have audited the accompanying statement of assets and liabilities of Fidelity OTC Portfolio (the Fund), a fund of Fidelity Securities Fund, including the schedule of investments, as of July 31, 2011, and the related statement of operations for the year then ended, the statement of changes in net assets for each of the two years in the period then ended, and the financial highlights for the periods presented. These financial statements and financial highlights are the responsibility of the Fund's management. Our responsibility is to express an opinion on these financial statements and financial highlights based on our audits.
We conducted our audits in accordance with the standards of the Public Company Accounting Oversight Board (United States). Those standards require that we plan and perform the audit to obtain reasonable assurance about whether the financial statements and financial highlights are free of material misstatement. The Fund is not required to have, nor were we engaged to perform, an audit of its internal control over financial reporting. Our audits included consideration of internal control over financial reporting as a basis for designing audit procedures that are appropriate in the circumstances, but not for the purpose of expressing an opinion on the effectiveness of the Fund's internal control over financial reporting. Accordingly, we express no such opinion. An audit also includes examining, on a test basis, evidence supporting the amounts and disclosures in the financial statements, assessing the accounting principles used and significant estimates made by management, as well as evaluating the overall financial statement presentation. Our procedures included confirmation of securities owned as of July 31, 2011, by correspondence with the custodians and brokers; where replies were not received from brokers, we performed other auditing procedures. We believe that our audits provide a reasonable basis for our opinion.
In our opinion, the financial statements and financial highlights referred to above present fairly, in all material respects, the financial position of Fidelity OTC Portfolio as of July 31, 2011, the results of its operations for the year then ended, the changes in its net assets for each of the two years in the period then ended, and the financial highlights for the periods presented, in conformity with accounting principles generally accepted in the United States of America.
/s/ Deloitte & Touche LLP
DELOITTE & TOUCHE LLP
Boston, Massachusetts
September 14, 2011
Annual Report
The Trustees, Members of the Advisory Board, and executive officers of the trust and fund, as applicable, are listed below. The Board of Trustees governs the fund and is responsible for protecting the interests of shareholders. The Trustees are experienced executives who meet periodically throughout the year to oversee the fund's activities, review contractual arrangements with companies that provide services to the fund, oversee management of the risks associated with such activities and contractual arrangements, and review the fund's performance. Except for James C. Curvey, each of the Trustees oversees 221 funds advised by FMR or an affiliate. Mr. Curvey oversees 419 funds advised by FMR or an affiliate.
The Trustees hold office without limit in time except that (a) any Trustee may resign; (b) any Trustee may be removed by written instrument, signed by at least two-thirds of the number of Trustees prior to such removal; (c) any Trustee who requests to be retired or who has become incapacitated by illness or injury may be retired by written instrument signed by a majority of the other Trustees; and (d) any Trustee may be removed at any special meeting of shareholders by a two-thirds vote of the outstanding voting securities of the trust. Each Trustee who is not an interested person (as defined in the 1940 Act) (Independent Trustee), shall retire not later than the last day of the calendar year in which his or her 75th birthday occurs. The Independent Trustees may waive this mandatory retirement age policy with respect to individual Trustees. The executive officers and Advisory Board Members hold office without limit in time, except that any officer and Advisory Board Member may resign or may be removed by a vote of a majority of the Trustees at any regular meeting or any special meeting of the Trustees. Except as indicated, each individual has held the office shown or other offices in the same company for the past five years.
Experience, Skills, Attributes, and Qualifications of the Fund's Trustees. The Governance and Nominating Committee has adopted a statement of policy that describes the experience, qualifications, attributes, and skills that are necessary and desirable for potential Independent Trustee candidates (Statement of Policy). The Board believes that each Trustee satisfied at the time he or she was initially elected or appointed a Trustee, and continues to satisfy, the standards contemplated by the Statement of Policy. The Governance and Nominating Committee also engages professional search firms to help identify potential Independent Trustee candidates who have the experience, qualifications, attributes, and skills consistent with the Statement of Policy. From time to time, additional criteria based on the composition and skills of the current Independent Trustees, as well as experience or skills that may be appropriate in light of future changes to board composition, business conditions, and regulatory or other developments, have also been considered by the professional search firms and the Governance and Nominating Committee. In addition, the Board takes into account the Trustees' commitment and participation in Board and committee meetings, as well as their leadership of standing and ad hoc committees throughout their tenure.
In determining that a particular Trustee was and continues to be qualified to serve as a Trustee, the Board has considered a variety of criteria, none of which, in isolation, was controlling. The Board believes that, collectively, the Trustees have balanced and diverse experience, qualifications, attributes, and skills, which allow the Board to operate effectively in governing the fund and protecting the interests of shareholders. Information about the specific experience, skills, attributes, and qualifications of each Trustee, which in each case led to the Board's conclusion that the Trustee should serve (or continue to serve) as a trustee of the fund, is provided below.
Annual Report
Board Structure and Oversight Function. James C. Curvey is an interested person (as defined in the 1940 Act) and currently serves as Acting Chairman. The Trustees have determined that an interested Chairman is appropriate and benefits shareholders because an interested Chairman has a personal and professional stake in the quality and continuity of services provided to the fund. Independent Trustees exercise their informed business judgment to appoint an individual of their choosing to serve as Chairman, regardless of whether the Trustee happens to be independent or a member of management. The Independent Trustees have determined that they can act independently and effectively without having an Independent Trustee serve as Chairman and that a key structural component for assuring that they are in a position to do so is for the Independent Trustees to constitute a substantial majority for the Board. The Independent Trustees also regularly meet in executive session. Ned C. Lautenbach serves as Chairman of the Independent Trustees and as such (i) acts as a liaison between the Independent Trustees and management with respect to matters important to the Independent Trustees and (ii) with management prepares agendas for Board meetings.
Fidelity funds are overseen by different Boards of Trustees. The fund's Board oversees Fidelity's equity and high income funds and another Board oversees Fidelity's investment-grade bond, money market, and asset allocation funds. The asset allocation funds may invest in Fidelity funds overseen by the fund's Board. The use of separate Boards, each with its own committee structure, allows the Trustees of each group of Fidelity funds to focus on the unique issues of the funds they oversee, including common research, investment, and operational issues. On occasion, the separate Boards establish joint committees to address issues of overlapping consequences for the Fidelity funds overseen by each Board.
The Trustees operate using a system of committees to facilitate the timely and efficient consideration of all matters of importance to the Trustees, the fund, and fund shareholders and to facilitate compliance with legal and regulatory requirements and oversight of the fund's activities and associated risks. The Board, acting through its committees, has charged FMR and its affiliates with (i) identifying events or circumstances the occurrence of which could have demonstrably adverse effects on the fund's business and/or reputation; (ii) implementing processes and controls to lessen the possibility that such events or circumstances occur or to mitigate the effects of such events or circumstances if they do occur; and (iii) creating and maintaining a system designed to evaluate continuously business and market conditions in order to facilitate the identification and implementation processes described in (i) and (ii) above. Because the day-to-day operations and activities of the fund are carried out by or through FMR, its affiliates and other service providers, the fund's exposure to risks is mitigated but not eliminated by the processes overseen by the Trustees. While each of the Board's committees has responsibility for overseeing different aspects of the fund's activities, oversight is exercised primarily through the Operations, Audit, and Compliance Committees. Appropriate personnel, including but not limited to the fund's Chief Compliance Officer (CCO), FMR's internal auditor, the independent accountants, the fund's Treasurer and portfolio management personnel, make periodic reports to the Board's committees, as appropriate. The responsibilities of each committee, including their oversight responsibilities, are described further under "Standing Committees of the Fund's Trustees."
Annual Report
Trustees and Officers - continued
The fund's Statement of Additional Information (SAI) includes more information about the Trustees. To request a free copy, call Fidelity at 1-800-544-8544.
Interested Trustees*:
Correspondence intended for each Trustee who is an interested person may be sent to Fidelity Investments, 82 Devonshire Street, Boston, Massachusetts 02109.
Name, Age; Principal Occupations and Other Relevant Experience+ |
James C. Curvey (76) |
| Year of Election or Appointment: 2007 Mr. Curvey is Trustee and Acting Chairman of the Board of Trustees of certain Trusts. Mr. Curvey also serves as Trustee (2007-present) of other investment companies advised by FMR. Mr. Curvey is a Director of Fidelity Investments Money Management, Inc. (2009-present), Director of Fidelity Research & Analysis Co. (2009-present) and Director of FMR and FMR Co., Inc. (2007-present). Mr. Curvey is also Vice Chairman (2007-present) and Director of FMR LLC. In addition, Mr. Curvey serves as an Overseer for the Boston Symphony Orchestra and a member of the Trustees of Villanova University. Previously, Mr. Curvey was the Vice Chairman (2006-2007) and Director (2000-2007) of FMR Corp. |
Ronald P. O'Hanley (54) |
| Year of Election or Appointment: 2011 Mr. O'Hanley is Director of FMR Co., Inc. (2010-present), Director of Fidelity Investments Money Management, Inc. (2010-present), Director of Fidelity Research & Analysis Company (2010-present), President of Fidelity Asset Management and Corporate Services and a member of Fidelity's Executive Committee (2010-present). Previously, Mr. O'Hanley served as President and Chief Executive Officer of BNY Mellon Asset Management (2007-2010). Mr. O'Hanley also served as Vice Chairman of Bank New York Mellon Corp. and a member of that firm's Executive Committee. Prior to the 2007 merger of The Bank of New York and Mellon Financial Corporation, he was Vice Chairman of Mellon Financial Corporation and President and Chief Executive Officer of Mellon Asset Management. He joined Mellon in February 1997. Mr. O'Hanley currently serves as Chairman of the Boston Public Library Foundation Board of Directors and sits on the Board of Directors of Beth Israel Deaconess Medical Center, the Board of Trustees of the Marine Biological Laboratory and the Advisory Board of the Maxwell School of Citizenship and Public Administration at Syracuse University. Mr. O'Hanley also chairs the Council on Asset Management for the Financial Services Roundtable and is a member of the Board of Directors of Institutional Investor's U.S. Institute. |
* Trustees have been determined to be "Interested Trustees" by virtue of, among other things, their affiliation with the trust or various entities under common control with FMR.
+ The information above includes each Trustee's principal occupation during the last five years and other information relating to the experience, attributes, and skills relevant to each Trustee's qualifications to serve as a Trustee, which led to the conclusion that each Trustee should serve as a Trustee for the fund.
Annual Report
Trustees and Officers - continued
Independent Trustees:
Correspondence intended for each Independent Trustee (that is, the Trustees other than the Interested Trustees) may be sent to Fidelity Investments, P.O. Box 55235, Boston, Massachusetts 02205-5235.
Name, Age; Principal Occupations and Other Relevant Experience+ |
Dennis J. Dirks (63) |
| Year of Election or Appointment: 2005 Prior to his retirement in May 2003, Mr. Dirks was Chief Operating Officer and a member of the Board of The Depository Trust & Clearing Corporation (DTCC). He also served as President, Chief Operating Officer, and Board member of The Depository Trust Company (DTC) and President and Board member of the National Securities Clearing Corporation (NSCC). In addition, Mr. Dirks served as Chief Executive Officer and Board member of the Government Securities Clearing Corporation, Chief Executive Officer and Board member of the Mortgage-Backed Securities Clearing Corporation, as a Trustee and a member of the Finance Committee of Manhattan College (2005-2008), and as a Trustee and a member of the Finance Committee of AHRC of Nassau County (2006-2008). Mr. Dirks is a member of the Independent Directors Council (IDC) Governing Council (2010-Present) and Board of Directors for The Brookville Center for Children's Services, Inc. (2009-present). |
Alan J. Lacy (57) |
| Year of Election or Appointment: 2008 Mr. Lacy serves as Senior Adviser (2007-present) of Oak Hill Capital Partners, L.P. (private equity). Mr. Lacy also served as Chief Executive Officer (2000-2005) and Vice Chairman (2005-2006) of Sears Holdings Corporation and Sears, Roebuck and Co. (retail). In addition, Mr. Lacy serves as a member of the Board of Directors of Dave & Buster's, Inc. (restaurant and entertainment complexes, 2010-present), The Hillman Companies, Inc. (hardware wholesalers, 2010-present), and Bristol-Myers Squibb Company (global pharmaceuticals, 2007-present). Mr. Lacy is a member of the Board of Trustees of The National Parks Conservation Association (2006-Present). Previously, Mr. Lacy served as Chairman of the Board of Trustees of the National Parks Conservation Association (2008-2011) and as a member of the Board of Directors for the Western Union Company (global money transfer, 2006-2011). |
Ned C. Lautenbach (67) |
| Year of Election or Appointment: 2000 Mr. Lautenbach is Chairman of the Independent Trustees of the Equity and High Income Funds (2006-present). Mr. Lautenbach currently serves as the Lead Director of the Eaton Corporation Board of Directors (diversified industrial, 1997-present). Mr. Lautenbach is also a member of the Board of Directors of the Philharmonic Center for the Arts in Naples, Florida (1999-present); a member of the Board of Trustees of Fairfield University (2005-present); and a member of the Council on Foreign Relations (1994-present). Previously, Mr. Lautenbach was a Partner/Advisory Partner at Clayton, Dubilier & Rice, LLC (private equity investment, 1998-2010), as well as a Director of Sony Corporation (2006-2007). |
Joseph Mauriello (66) |
| Year of Election or Appointment: 2008 Prior to his retirement in January 2006, Mr. Mauriello served in numerous senior management positions including Deputy Chairman and Chief Operating Officer (2004-2005), and Vice Chairman of Financial Services (2002-2004) of KPMG LLP US (professional services, 1965-2005). Mr. Mauriello currently serves as a member of the Board of Directors of XL Group plc. (global insurance and re-insurance, 2006-present) and of Arcadia Resources Inc. (health care services and products, 2007-present). Previously, Mr. Mauriello served as a Director of the Hamilton Funds of the Bank of New York (2006-2007). |
Robert W. Selander (60) |
| Year of Election or Appointment: 2011 Previously, Mr. Selander served as a Member of the Advisory Board of Fidelity's Equity and High Income Funds (2011), Executive Vice Chairman (2010), Chief Executive Officer (2009-2010), and President and Chief Executive Officer (1997-2009) of Mastercard, Inc. |
Cornelia M. Small (67) |
| Year of Election or Appointment: 2005 Ms. Small is a member of the Board of Directors of the Teagle Foundation (2009-present). Ms. Small is also a member of the Investment Committee, and Chair (2008-present) and a member of the Board of Trustees of Smith College. In addition, Ms. Small serves on the Investment Committee of the Berkshire Taconic Community Foundation (2008-present). Previously, Ms. Small served as Chairperson of the Investment Committee (2002-2008) of Smith College. In addition, Ms. Small served as Chief Investment Officer, Director of Global Equity Investments, and a member of the Board of Directors of Scudder, Stevens & Clark and Scudder Kemper Investments. |
William S. Stavropoulos (72) |
| Year of Election or Appointment: 2002 Mr. Stavropoulos is Vice Chairman of the Independent Trustees of the Equity and High Income Funds (2006-present). Mr. Stavropoulos serves as President and Founder of the Michigan Baseball Foundation, the Great Lakes Loons (2007-present). Mr. Stavropoulos is Chairman Emeritus of the Board of Directors of The Dow Chemical Company, where he previously served in numerous senior management positions, including President, CEO (1995-2000; 2002-2004), Chairman of the Executive Committee (2000-2006), and as a member of the Board of Directors (1990-2006). Currently, Mr. Stavropoulos is Chairman of Univar (global distributor of commodity and specialty chemicals, 2010-present), a Director of Teradata Corporation (data warehousing and technology solutions, 2008-present), Chemical Financial Corporation, Maersk Inc. (industrial conglomerate), Tyco International, Inc. (multinational manufacturing and services, 2007-present), and a member of the Advisory Board for Metalmark Capital (private equity investment, 2005-present). Mr. Stavropoulos is a special advisor to Clayton, Dubilier & Rice, LLC (private equity investment). In addition, Mr. Stavropoulos is a member of the University of Notre Dame Advisory Council for the College of Science. |
David M. Thomas (62) |
| Year of Election or Appointment: 2008 Previously, Mr. Thomas served as Executive Chairman (2005-2006) and Chairman and Chief Executive Officer (2000-2005) of IMS Health, Inc. (pharmaceutical and healthcare information solutions). In addition, Mr. Thomas serves as a member of the Board of Directors of Fortune Brands, Inc. (consumer products), and Interpublic Group of Companies, Inc. (marketing communication, 2004-present). |
Michael E. Wiley (60) |
| Year of Election or Appointment: 2008 Mr. Wiley also serves as a Director of Asia Pacific Exploration Consolidated (international oil and gas exploration and production, 2008-present). Mr. Wiley serves as a Director of Tesoro Corporation (independent oil refiner and marketer, 2005-present), and a Director of Bill Barrett Corporation (exploration and production, 2005-present). In addition, Mr. Wiley also serves as a Director of Post Oak Bank (privately-held bank, 2004-present). Previously, Mr. Wiley served as a member of the Board of Trustees of the University of Tulsa (2000-2006; 2007-2010), as a Senior Energy Advisor of Katzenbach Partners, LLC (consulting, 2006-2007), as an Advisory Director of Riverstone Holdings (private investment), Chairman, President, and CEO of Baker Hughes, Inc. (oilfield services, 2000-2004), and as Director of Spinnaker Exploration Company (exploration and production, 2001-2005). |
Annual Report
+ The information above includes each Trustee's principal occupation during the last five years and other information relating to the experience, attributes, and skills relevant to each Trustee's qualifications to serve as a Trustee, which led to the conclusion that each Trustee should serve as a Trustee for the fund.
Advisory Board Members and Executive Officers:
Correspondence intended for each executive officer, Edward C. Johnson 3d, and Peter S. Lynch may be sent to Fidelity Investments, 82 Devonshire Street, Boston, Massachusetts 02109.
Name, Age; Principal Occupation |
Edward C. Johnson 3d (81) |
| Year of Election or Appointment: 2011 Member of the Advisory Board of Fidelity's Equity and High Income Funds. Mr. Johnson serves as Chief Executive Officer, Chairman, and a Director of FMR LLC, and also serves as Chairman and Director of FIL Limited. Previously, Mr. Johnson served as a Trustee and Chairman of the Board of certain Fidelity Trusts, Chairman and a Director of FMR, Chairman and a Director of FMR Co., Inc., and President of FMR LLC (2006-2007). |
Peter S. Lynch (67) |
| Year of Election or Appointment: 2003 Member of the Advisory Board of Fidelity's Equity and High Income Funds. Mr. Lynch is Vice Chairman and a Director of FMR and FMR Co., Inc. In addition, Mr. Lynch serves as a Trustee of Boston College and as the Chairman of the Inner-City Scholarship Fund. Previously, Mr. Lynch served on the Special Olympics International Board of Directors (1997-2006). |
Kenneth B. Robins (41) |
| Year of Election or Appointment: 2008 President and Treasurer of Fidelity's Equity and High Income Funds. Mr. Robins also serves as President and Treasurer (2010-present) and Assistant Treasurer (2009-present) of other Fidelity funds and is an employee of Fidelity Investments (2004-present). Previously, Mr. Robins served as Deputy Treasurer of the Fidelity funds (2005-2008) and Treasurer and Chief Financial Officer of The North Carolina Capital Management Trust: Cash and Term Portfolios (2006-2008). |
Bruce T. Herring (45) |
| Year of Election or Appointment: 2006 Vice President of certain Equity Funds. Mr. Herring also serves as Chief Investment Officer and Director of Fidelity Management & Research (U.K.) Inc. (2010-present) and Group Chief Investments Officer of FMR. Previously, Mr. Herring served as Vice President (2005-2006) and Senior Vice President (2006-2007) of Fidelity Management & Research Company, Vice President of FMR Co., Inc. (2001-2007) and as a portfolio manager for Fidelity U.S. Equity Funds. |
Brian B. Hogan (46) |
| Year of Election or Appointment: 2009 Vice President of Equity and High Income Funds. Mr. Hogan also serves as President of FMR's Equity Division (2009-present). Previously, Mr. Hogan served as Senior Vice President, Equity Research of FMR (2006-2009) and as a portfolio manager. |
Scott C. Goebel (43) |
| Year of Election or Appointment: 2008 Secretary and Chief Legal Officer (CLO) of the Fidelity funds. Mr. Goebel also serves as Secretary of Fidelity Investments Money Management, Inc. (FIMM) (2010-present) and Fidelity Research and Analysis Company (FRAC) (2010-present); Secretary and CLO of The North Carolina Capital Management Trust: Cash and Term Portfolios (2008-present); General Counsel, Secretary, and Senior Vice President of FMR (2008-present) and FMR Co., Inc. (2008-present); employed by FMR LLC or an affiliate (2001-present); Chief Legal Officer of Fidelity Management & Research (Hong Kong) Limited (2008-present) and Assistant Secretary of Fidelity Management & Research (Japan) Inc. (2008-present), and Fidelity Management & Research (U.K.) Inc. (2008-present). Previously, Mr. Goebel served as Assistant Secretary of FIMM (2008-2010), FRAC (2008-2010), and the Funds (2007-2008) and as Vice President and Secretary of Fidelity Distributors Corporation (FDC) (2005-2007). |
William C. Coffey (42) |
| Year of Election or Appointment: 2009 Assistant Secretary of Fidelity's Equity and High Income Funds. Mr. Coffey also serves as Senior Vice President and Deputy General Counsel of FMR LLC (2010-present), and is an employee of Fidelity Investments. Previously, Mr. Coffey served as Vice President and Associate General Counsel of FMR LLC (2005-2009). |
Holly C. Laurent (57) |
| Year of Election or Appointment: 2008 Anti-Money Laundering (AML) Officer of the Fidelity funds. Ms. Laurent also serves as AML Officer of The North Carolina Capital Management Trust: Cash and Term Portfolios (2008-present) and is an employee of Fidelity Investments. Previously, Ms. Laurent was Senior Vice President and Head of Legal for Fidelity Business Services India Pvt. Ltd. (2006-2008), and Senior Vice President, Deputy General Counsel and Group Head for FMR LLC (2005-2006). |
Christine Reynolds (52) |
| Year of Election or Appointment: 2008 Chief Financial Officer of the Fidelity funds. Ms. Reynolds became President of Fidelity Pricing and Cash Management Services (FPCMS) in August 2008. Ms. Reynolds served as Chief Operating Officer of FPCMS (2007-2008). Previously, Ms. Reynolds served as President, Treasurer, and Anti-Money Laundering officer of the Fidelity funds (2004-2007). |
Kenneth A. Rathgeber (64) |
| Year of Election or Appointment: 2004 Chief Compliance Officer of Fidelity's Equity and High Income Funds. Mr. Rathgeber is Chief Compliance Officer of Fidelity Management & Research (Hong Kong) Limited (2008-present), Fidelity Management & Research (Japan) Inc. (2008-present), FMR (2005-present), FMR Co., Inc. (2005-present), Fidelity Management & Research (U.K.) Inc. (2005-present), Fidelity Research & Analysis Company (2005-present), Fidelity Investments Money Management, Inc. (2005-present), Pyramis Global Advisors, LLC (2005-present), and Strategic Advisers, Inc. (2005-present). |
Jeffrey S. Christian (49) |
| Year of Election or Appointment: 2009 Deputy Treasurer of the Fidelity funds. Mr. Christian is an employee of Fidelity Investments. Previously, Mr. Christian served as Chief Financial Officer (2008-2009) of certain Fidelity funds and Senior Vice President of Fidelity Pricing and Cash Management Services (FPCMS) (2004-2009). |
Bryan A. Mehrmann (50) |
| Year of Election or Appointment: 2005 Deputy Treasurer of the Fidelity funds. Mr. Mehrmann is an employee of Fidelity Investments. |
Adrien E. Deberghes (43) |
| Year of Election or Appointment: 2008 Deputy Treasurer of Fidelity's Equity and High Income Funds. Mr. Deberghes also serves as Assistant Treasurer of other Fidelity funds (2010-present) and is an employee of Fidelity Investments (2008-present). Previously, Mr. Deberghes served as Senior Vice President of Mutual Fund Administration at State Street Corporation (2007-2008), Senior Director of Mutual Fund Administration at Investors Bank & Trust (2005-2007), and Director of Finance for Dunkin' Brands (2000-2005). |
Stephanie J. Dorsey (42) |
| Year of Election or Appointment: 2010 Assistant Treasurer of Fidelity's Equity and High Income Funds. Ms. Dorsey also serves as Deputy Treasurer of other Fidelity funds (2008-present) and is an employee of Fidelity Investments (2008-present). Previously, Ms. Dorsey served as Treasurer (2004-2008) of the JPMorgan Mutual Funds and Vice President (2004-2008) of JPMorgan Chase Bank. |
John R. Hebble (53) |
| Year of Election or Appointment: 2009 Assistant Treasurer of Fidelity's Equity and High Income Funds. Mr. Hebble also serves as Treasurer and Chief Financial Officer of The North Carolina Capital Management Trust: Cash and Term Portfolios (2008-present), President and Treasurer of other Fidelity funds (2008-present) and is an employee of Fidelity Investments. |
Gary W. Ryan (52) |
| Year of Election or Appointment: 2005 Assistant Treasurer of the Fidelity funds. Mr. Ryan is an employee of Fidelity Investments. Previously, Mr. Ryan served as Vice President of Fund Reporting in Fidelity Pricing and Cash Management Services (FPCMS) (1999-2005). |
Jonathan Davis (43) |
| Year of Election or Appointment: 2010 Assistant Treasurer of the Fidelity funds. Mr. Davis is an employee of Fidelity Investments. Previously, Mr. Davis served as Vice President and Associate General Counsel of FMR LLC (2003-2010). |
Annual Report
Board Approval of Investment Advisory Contracts and Management Fees
Fidelity OTC Portfolio
Each year, the Board of Trustees, including the Independent Trustees (together, the Board), votes on the renewal of the management contract and sub-advisory agreements (together, the Advisory Contracts) for the fund. The Board, assisted by the advice of fund counsel and Independent Trustees' counsel, requests and considers a broad range of information relevant to the renewal of the Advisory Contracts throughout the year.
The Board meets regularly and considers at each of its meetings factors that are relevant to its annual consideration of the renewal of the fund's Advisory Contracts, including the services and support provided to the fund and its shareholders. The Board has established various standing committees, each composed of Independent Trustees with varying backgrounds, to which the Board has assigned specific subject matter responsibilities in order to enhance effective decision-making by the Board. The Board, acting directly and through its Committees, requests and receives information concerning the annual consideration of the renewal of the fund's Advisory Contracts. The Board also meets as needed to consider matters specifically related to the Board's annual consideration of the renewal of Advisory Contracts. Members of the Board may also meet with trustees of other Fidelity funds through ad hoc joint committees to discuss certain matters relevant to the Fidelity funds.
At its July 2011 meeting, the Board of Trustees, including the Independent Trustees, unanimously determined to renew the fund's Advisory Contracts. In reaching its determination, the Board considered all factors it believed relevant, including (i) the nature, extent, and quality of the services to be provided to the fund and its shareholders (including the investment performance of the fund); (ii) the competitiveness of the fund's management fee and total expense ratio; (iii) the total costs of the services to be provided by and the profits to be realized by Fidelity from its relationship with the fund; (iv) the extent to which economies of scale would be realized as the fund grows; and (v) whether fee levels reflect these economies of scale, if any, for the benefit of fund shareholders.
In considering whether to renew the Advisory Contracts for the fund, the Board reached a determination, with the assistance of fund counsel and Independent Trustees' counsel and through the exercise of its business judgment, that the renewal of the Advisory Contracts is in the best interests of the fund and its shareholders and that the compensation payable under the Advisory Contracts is fair and reasonable. The Board's decision to renew the Advisory Contracts was not based on any single factor, but rather was based on a comprehensive consideration of all the information provided to the Board at its meetings throughout the year. The Board, in reaching its determination to renew the Advisory Contracts, is aware that shareholders in the fund have a broad range of investment choices available to them, including a wide choice among mutual funds offered by Fidelity's competitors, and that the fund's shareholders, who have the opportunity to review and weigh the disclosure provided by the fund in its prospectus and other public disclosures, have chosen to invest in this fund, managed by Fidelity.
Annual Report
Board Approval of Investment Advisory Contracts and
Management Fees - continued
Nature, Extent, and Quality of Services Provided. The Board considered the staffing within the investment adviser, FMR, and the sub-advisers (together, the Investment Advisers), including the backgrounds of the fund's investment personnel and the fund's investment objective and discipline. The Independent Trustees also had discussions with senior management of Fidelity's investment operations and investment groups. The Board considered the structure of the portfolio manager compensation program and whether this structure provides appropriate incentives to act in the best interests of the fund.
Resources Dedicated to Investment Management and Support Services. The Board and the Fund Oversight and Research Committees reviewed the general qualifications and capabilities of the Investment Advisers' investment staff, including its size, education, experience, and resources, as well as the Investment Advisers' approach to recruiting, training, managing, and compensating investment personnel. The Board also noted that FMR has devoted increased resources to non-U.S. offices. The Board noted that Fidelity's analysts have extensive resources, tools and capabilities which allow them to conduct sophisticated quantitative and fundamental analysis, as well as credit analysis of issuers, counterparties and enhancers. The Board also believes that Fidelity's investment professionals have sufficient access to global information and data so as to provide competitive investment results over time, and that those professionals also have access to sophisticated tools which permit them to assess portfolio construction and risk and performance attribution characteristics continuously, as well as to transmit new information and research conclusions rapidly around the world. Additionally, in their deliberations, the Board considered the Investment Advisers' trading capabilities and resources which are an integral part of the investment management process.
Shareholder and Administrative Services. The Board considered (i) the nature, extent, quality, and cost of advisory, administrative, and shareholder services performed by the Investment Advisers and their affiliates under the Advisory Contracts and under separate agreements covering transfer agency, pricing and bookkeeping, and securities lending services for the fund; (ii) the nature and extent of the investment adviser's supervision of third party service providers, principally custodians and subcustodians; and (iii) the resources devoted to, and the record of compliance with, the fund's compliance policies and procedures. The Board also reviewed the allocation of fund brokerage, including allocations to brokers affiliated with the Investment Advisers, the use of brokerage commissions to pay fund expenses, and the use of "soft" commission dollars to pay for research services.
The Board noted that the growth of fund assets over time across the complex allows Fidelity to reinvest in the development of services designed to enhance the value or convenience of the Fidelity funds as investment vehicles. These services include 24-hour access to account information and market information through telephone representatives and over the Internet, investor education materials and asset allocation tools, and the expanded availability of Fidelity Investor Centers, with 35 new branches opening since 2010.
Annual Report
Investment in a Large Fund Family. The Board considered the benefits to shareholders of investing in a Fidelity fund, including the benefits of investing in a fund that is part of a large family of funds offering a variety of investment disciplines and providing a large variety of mutual fund investor services. The Board noted that Fidelity had taken, or had made recommendations that resulted in the Fidelity funds taking, a number of actions over the previous year that benefited particular funds, including (i) continuing to dedicate additional resources to investment research and support of the senior management team that oversees asset management; (ii) rationalizing product lines through the mergers of six funds into other funds; (iii) continuing to migrate the Freedom Funds to dedicated lower cost underlying funds; (iv) obtaining shareholder approval to broaden the investment strategies for Fidelity Consumer Finance Portfolio, Fidelity Emerging Asia Fund, and Fidelity Environment and Alternative Energy Portfolio; (v) contractually agreeing to reduce the management fees and impose other expense limitations on Spartan® 500 Index Fund and U.S. Bond Index Fund in connection with launching new institutional classes of these funds; (vi) changing the name, primary and supplemental benchmarks, and investment policies of Fidelity Global Strategies Fund to support the fund's flexible investment mandate and global orientation; and (vii) reducing the transfer agency account fee rates on certain accounts.
Investment Performance. The Board considered whether the fund has operated in accordance with its investment objective, as well as its record of compliance with its investment restrictions. It also reviewed the fund's absolute investment performance for each class, as well as the fund's relative investment performance for each class measured over multiple periods against a broad-based securities market index. The Board noted that FMR does not believe that a meaningful peer group exists against which to compare the fund's performance. The following charts considered by the Board show, over the one-, three-, and five-year periods ended December 31, 2010, as available, the cumulative total returns of Class K and the retail class of the fund and the cumulative total returns of a broad-based securities market index ("benchmark").
Annual Report
Board Approval of Investment Advisory Contracts and
Management Fees - continued
Fidelity OTC Portfolio
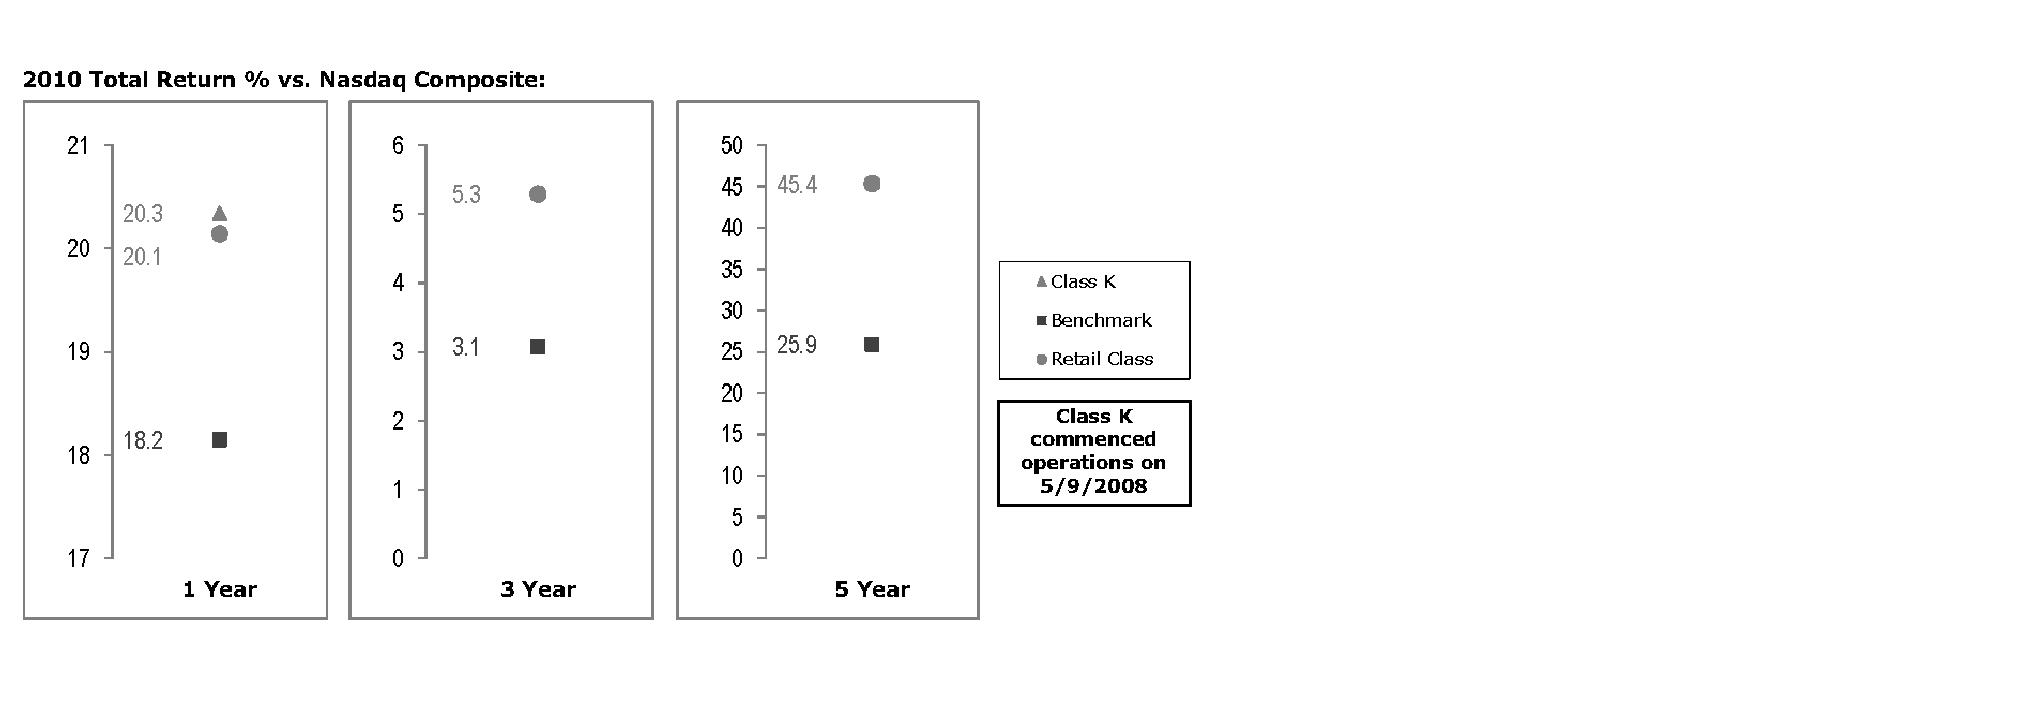
The Board noted that the investment performance of the retail class of the fund (the class with the longer performance record) compared favorably to its benchmark for all the periods shown. The Board considered that the variations in performance between the fund's classes reflect the variation in class expenses, which result in lower performance for the higher expense class. The Board also reviewed the fund's performance since inception as well as performance in the current year.
The Board also considered that the fund's management fee is subject to upward or downward adjustment depending upon whether, and to what extent, the fund's investment performance for the performance period exceeds, or is exceeded by, the record (over the same period) of a Board-approved performance adjustment index. The Board noted that the performance adjustment provides FMR with a strong economic incentive to seek to achieve superior performance for the fund's shareholders and helps to more closely align the interests of FMR and the fund's shareholders.
Based on its review, the Board concluded that the nature, extent, and quality of services provided to the fund under the Advisory Contracts should benefit the fund's shareholders.
Competitiveness of Management Fee and Total Expense Ratio. The Board considered the fund's management fee and total expense ratio compared to "mapped groups" of competitive funds and classes. Fidelity creates "mapped groups" by combining similar Lipper investment objective categories that have comparable management fee characteristics. Combining Lipper investment objective categories aids the Board's management fee and total expense ratio comparisons by broadening the competitive group used for comparison and by reducing the number of universes to which various Fidelity funds are compared.
Annual Report
Management Fee. The Board considered two proprietary management fee comparisons for the 12-month periods shown in the chart below. The group of Lipper funds used by the Board for management fee comparisons is referred to below as the "Total Mapped Group." The Total Mapped Group comparison focuses on a fund's standing relative to the total universe of comparable funds available to investors in terms of gross management fees before expense reimbursements or caps, and without giving effect to the fund's performance adjustment. "TMG %" represents the percentage of funds in the Total Mapped Group that had management fees that were lower than the fund's. For example, a TMG % of 17% means that 83% of the funds in the Total Mapped Group had higher management fees than the fund. The "Asset-Size Peer Group" (ASPG) comparison focuses on a fund's standing relative to non-Fidelity funds similar in size to the fund within the Total Mapped Group. The ASPG represents at least 15% of the funds in the Total Mapped Group with comparable asset size and management fee characteristics, subject to a minimum of 50 funds (or all funds in the Total Mapped Group if fewer than 50). Additional information, such as the ASPG quartile in which the fund's management fee ranked and the impact of the fund's performance adjustment, is also included in the chart and considered by the Board.
Fidelity OTC Portfolio

The Board noted that the fund's management fee ranked below the median of its Total Mapped Group and below the median of its ASPG for 2010. The Board also noted the effect of the fund's positive performance adjustment on the fund's management fee ranking. The Board noted that the performance adjustment for each year represents calculations for performance periods that differ from the periods shown in the performance charts above.
Annual Report
Board Approval of Investment Advisory Contracts and
Management Fees - continued
Based on its review, the Board concluded that the fund's management fee is fair and reasonable in light of the services that the fund receives and the other factors considered.
Total Expense Ratio. In its review of each class's total expense ratio, the Board considered the fund's management fee as well as other fund or class expenses, as applicable, such as transfer agent fees, pricing and bookkeeping fees, and custodial, legal, and audit fees. The Board also noted the effects of any waivers and reimbursements on fees and expenses, as well as the impact of the fund's performance adjustment. As part of its review, the Board also considered the current and historical total expense ratios of each class of the fund compared to competitive fund median expenses. Each class of the fund is compared to those funds and classes in the Total Mapped Group (used by the Board for management fee comparisons) that have a similar sales load structure.
The Board noted that the total expense ratio of each class ranked below its competitive median for 2010. The Board considered that various factors, including 12b-1 fees, positive or negative performance adjustments, and relatively higher other expenses in the case of small fund size, can affect total expense ratios.
Fees Charged to Other Fidelity Clients. The Board also considered Fidelity fee structures and other information with respect to clients of FMR and its affiliates, such as other mutual funds advised or subadvised by FMR or its affiliates, pension plan clients, and other institutional clients. In March 2010, the Board created an ad hoc joint committee with the board of other Fidelity funds (the Committee) to review and compare Fidelity's institutional investment advisory business with its business of providing services to the Fidelity funds, including the differences in services provided, fees charged, and costs incurred, as well as competition in their respective marketplaces.
Based on its review of total expense ratios and fees charged to other Fidelity clients, the Board concluded that the total expense ratio of each class of the fund was reasonable in light of the services that the fund and its shareholders receive and the other factors considered, including the findings of the Committee.
Costs of the Services and Profitability. The Board considered the revenues earned and the expenses incurred by Fidelity in conducting the business of developing, marketing, distributing, managing, administering and servicing the fund and its shareholders. The Board also considered the level of Fidelity's profits in respect of all the Fidelity funds.
On an annual basis, FMR presents to the Board Fidelity's profitability for the fund. Fidelity calculates the profitability for each fund, as well as aggregate profitability for groups of Fidelity funds and all Fidelity funds, using a series of detailed revenue and cost allocation methodologies which originate with the books and records of Fidelity on which Fidelity's audited financial statements are based. The Audit Committee of the Board reviews any significant changes from the prior year's methodologies.
Annual Report
PricewaterhouseCoopers LLP (PwC), independent registered public accounting firm and auditor to Fidelity and certain Fidelity funds, has been engaged annually by the Board as part of the Board's assessment of Fidelity's profitability analysis. PwC's engagement includes the review and assessment of Fidelity's methodologies used in determining the revenues and expenses attributable to Fidelity's mutual fund business, and completion of agreed-upon procedures surrounding the mathematical accuracy of fund profitability and its conformity to allocation methodologies. After considering PwC's reports issued under the engagement and information provided by Fidelity, the Board concluded that while other allocation methods may also be reasonable, Fidelity's profitability methodologies are reasonable in all material respects.
The Board also reviewed Fidelity's non-fund businesses and fall-out benefits related to the mutual fund business as well as cases where Fidelity's affiliates may benefit from or be related to the fund's business.
The Board considered the costs of the services provided by and the profits realized by Fidelity in connection with the operation of the fund and was satisfied that the profitability was not excessive in the circumstances.
Economies of Scale. The Board considered whether there have been economies of scale in respect of the management of the Fidelity funds, whether the Fidelity funds (including the fund) have appropriately benefited from any such economies of scale, and whether there is potential for realization of any further economies of scale. The Board considered the extent to which the fund will benefit from economies of scale through increased services to the fund, through waivers or reimbursements, or through fee or expense reductions. The Board also noted that in 2009, it and the board of other Fidelity funds created an ad hoc committee (the Economies of Scale Committee) to analyze whether FMR attains economies of scale in respect of the management and servicing of the Fidelity funds, whether the Fidelity funds have appropriately benefited from such economies of scale, and whether there is potential for realization of any further economies of scale.
The Board recognized that the fund's management contract incorporates a "group fee" structure, which provides for lower group fee rates as total fund assets under FMR's management increase, and for higher group fee rates as total fund assets under FMR's management decrease. FMR calculates the group fee rates based on a tiered asset "breakpoint" schedule that varies based on asset class. The Board considered that the group fee is designed to deliver the benefits of economies of scale to fund shareholders when total Fidelity fund assets increase, even if assets of any particular fund are unchanged or have declined, because some portion of Fidelity's costs are attributable to services provided to all Fidelity funds, and all funds benefit if those costs can be allocated among more assets. The Board concluded that, given the group fee structure, fund shareholders will benefit from lower management fees as assets under FMR's management increase at the fund complex level, regardless of whether Fidelity achieves any such economies of scale.
Annual Report
Board Approval of Investment Advisory Contracts and
Management Fees - continued
The Board concluded, taking into account the analysis of the Economies of Scale Committee, that any potential economies of scale are being appropriately shared between fund shareholders and Fidelity.
Additional Information Requested by the Board. In order to develop fully the factual basis for consideration of the Fidelity funds' Advisory Contracts, the Board requested and received additional information on certain topics, including (i) fund performance trends, actions to be taken by FMR to improve certain funds' overall performance, and Fidelity's long-term strategies for certain funds; (ii) portfolio manager changes that have occurred during the past year and length of portfolio manager tenure for different categories of funds over time; (iii) Fidelity's compensation structure for portfolio managers and other key personnel and strategies for attracting and retaining non-investment personnel; (iv) the amount of the investment that each portfolio manager has made in the Fidelity fund(s) that he or she manages; (v) historical trends in Fidelity's realization of fall-out benefits; (vi) Fidelity's group fee structures and the rationale for the individual fee rates of certain funds; (vii) fund profitability methodology and the impact of certain factors on fund profitability results; (viii) trends regarding industry use of performance fee structures and Fidelity's compliance practices with respect to performance adjustment calculations; (ix) the fee structures in place for certain other Fidelity clients; and (x) explanations regarding the relative total expense ratios of certain funds and classes, total expense competitive trends, and actions that might be taken by FMR to reduce total expense ratios for certain funds and classes.
Based on its evaluation of all of the conclusions noted above, and after considering all factors it believed relevant, the Board ultimately concluded that the advisory fee structures are fair and reasonable, and that the fund's Advisory Contracts should be renewed.
Annual Report
Managing Your Investments
Fidelity offers several ways to conveniently manage your personal investments via your telephone or PC. You can access your account information, conduct trades and research your investments 24 hours a day.
By Phone
Fidelity Automated Service Telephone provides a single toll-free number to access account balances, positions, quotes and trading. It's easy to navigate the service, and on your first call, the system will help you create a personal identification number (PIN) for security.
(phone_graphic)
Fidelity Automated
Service Telephone (FAST®)
1-800-544-5555
Press
For mutual fund and brokerage trading.
For quotes.*
For account balances and holdings.
To review orders and mutual
fund activity.
To change your PIN.
To speak to a Fidelity representative.
By PC
Fidelity's web site on the Internet provides a wide range of information, including daily financial news, fund performance, interactive planning tools and news about Fidelity products and services.
(computer_graphic)
Fidelity's Web Site
www.fidelity.com
* When you call the quotes line, please remember that a fund's yield and return will vary and, except for money market funds, share price will also vary. This means that you may have a gain or loss when you sell your shares. There is no assurance that money market funds will be able to maintain a stable $1 share price; an investment in a money market fund is not insured or guaranteed by the U.S. government. Total returns are historical and include changes in share price, reinvestment of dividends and capital gains distributions, and the effects of any sales charges.
Annual Report
To Visit Fidelity
For directions and hours,
please call 1-800-544-9797.
Arizona
7001 West Ray Road
Chandler, AZ
15445 N. Scottsdale Road
Scottsdale, AZ
17550 North 75th Avenue
Glendale, AZ
5330 E. Broadway Blvd
Tucson, AZ
California
815 East Birch Street
Brea, CA
1411 Chapin Avenue
Burlingame, CA
851 East Hamilton Avenue
Campbell, CA
601 Larkspur Landing Circle
Larkspur, CA
2000 Avenue of the Stars
Los Angeles, CA
27101 Puerta Real
Mission Viejo, CA
73575 El Paseo
Palm Desert, CA
251 University Avenue
Palo Alto, CA
123 South Lake Avenue
Pasadena, CA
16656 Bernardo Ctr. Drive
Rancho Bernardo, CA
1220 Roseville Parkway
Roseville, CA
1740 Arden Way
Sacramento, CA
7676 Hazard Center Drive
San Diego, CA
11943 El Camino Real
San Diego, CA
8 Montgomery Street
San Francisco, CA
3793 State Street
Santa Barbara, CA
1200 Wilshire Boulevard
Santa Monica, CA
398 West El Camino Real
Sunnyvale, CA
111 South Westlake Blvd
Thousand Oaks, CA
21701 Hawthorne Boulevard
Torrance, CA
2001 North Main Street
Walnut Creek, CA
6326 Canoga Avenue
Woodland Hills, CA
2211 Michelson Drive
Irvine, CA
Colorado
281 East Flatiron Circle
Broomfield, CO
1625 Broadway
Denver, CO
9185 Westview Road
Lone Tree, CO
Connecticut
48 West Putnam Avenue
Greenwich, CT
265 Church Street
New Haven, CT
300 Atlantic Street
Stamford, CT
29 South Main Street
West Hartford, CT
1261 Post Road
Fairfield, CT
Delaware
400 Delaware Avenue
Wilmington, DE
Florida
175 East Altamonte Drive
Altamonte Springs, FL
1400 Glades Road
Boca Raton, FL
121 Alhambra Plaza
Coral Gables, FL
2948 N. Federal Highway
Ft. Lauderdale, FL
4671 Town Center Parkway
Jacksonville, FL
8880 Tamiami Trail, North
Naples, FL
230 Royal Palm Way
Palm Beach, FL
3501 PGA Boulevard
Palm Beach Gardens, FL
3550 Tamiami Trail, South
Sarasota, FL
1502 N. Westshore Blvd.
Tampa, FL
2465 State Road 7
Wellington, FL
Georgia
3242 Peachtree Road
Atlanta, GA
1000 Abernathy Road
Atlanta, GA
Illinois
One North LaSalle Street
Chicago, IL
401 North Michigan Avenue
Chicago, IL
One Skokie Valley Road
Highland Park, IL
1415 West 22nd Street
Oak Brook, IL
15105 S LaGrange Road
Orland Park, IL
1572 East Golf Road
Schaumburg, IL
1823 Freedom Drive
Naperville, IL
Indiana
8480 Keystone Crossing
Indianapolis, IN
Kansas
5400 College Boulevard
Overland Park, KS
Maine
Three Canal Plaza
Portland, ME
Maryland
7315 Wisconsin Avenue
Bethesda, MD
610 York Road
Towson, MD
Massachusetts
801 Boylston Street
Boston, MA
155 Congress Street
Boston, MA
300 Granite Street
Braintree, MA
44 Mall Road
Burlington, MA
238 Main Street
Cambridge, MA
200 Endicott Street
Danvers, MA
Fidelity Brokerage Services, Inc., 100 Summer St., Boston, MA 02110 Member NYSE/SIPC
Annual Report
405 Cochituate Road
Framingham, MA
551 Boston Turnpike
Shrewsbury, MA
Michigan
500 E. Eisenhower Pkwy.
Ann Arbor, MI
280 N. Old Woodward Ave.
Birmingham, MI
30200 Northwestern Hwy.
Farmington Hills, MI
43420 Grand River Avenue
Novi, MI
3480 28th Street
Grand Rapids, MI
2425 S. Linden Road STE E
Flint, MI
Minnesota
7740 France Avenue South
Edina, MN
8342 3rd Street North
Oakdale, MN
Missouri
1524 South Lindbergh Blvd.
St. Louis, MO
Nevada
2225 Village Walk Drive
Henderson, NV
New Jersey
501 Route 73 South
Marlton, NJ
150 Essex Street
Millburn, NJ
35 Morris Street
Morristown, NJ
396 Route 17, North
Paramus, NJ
3518 Route 1 North
Princeton, NJ
530 Broad Street
Shrewsbury, NJ
New Mexico
2261 Q Street NE
Albuquerque, NM
New York
1130 Franklin Avenue
Garden City, NY
37 West Jericho Turnpike
Huntington Station, NY
1271 Avenue of the Americas
New York, NY
980 Madison Avenue
New York, NY
61 Broadway
New York, NY
350 Park Avenue
New York, NY
200 Fifth Avenue
New York, NY
733 Third Avenue
New York, NY
2070 Broadway
New York, NY
1075 Northern Blvd.
Roslyn, NY
799 Central Park Avenue
Scarsdale, NY
3349 Monroe Avenue
Rochester, NY
North Carolina
4611 Sharon Road
Charlotte, NC
7011 Fayetteville Road
Durham, NC
Ohio
3805 Edwards Road
Cincinnati, OH
1324 Polaris Parkway
Columbus, OH
1800 Crocker Road
Westlake, OH
28699 Chagrin Boulevard
Woodmere Village, OH
Oregon
7493 SW Bridgeport Road
Tigard, OR
Pennsylvania
600 West DeKalb Pike
King of Prussia, PA
1735 Market Street
Philadelphia, PA
12001 Perry Highway
Wexford, PA
Rhode Island
10 Memorial Boulevard
Providence, RI
Tennessee
3018 Peoples Street
Johnson City, TN
7628 West Farmington Blvd.
Germantown, TN
2035 Mallory Lane
Franklin, TN
Texas
10000 Research Boulevard
Austin, TX
4001 Northwest Parkway
Dallas, TX
12532 Memorial Drive
Houston, TX
2701 Drexel Drive
Houston, TX
6560 Fannin Street
Houston, TX
1701 Lake Robbins Drive
The Woodlands, TX
6500 N. MacArthur Blvd.
Irving, TX
6005 West Park Boulevard
Plano, TX
1576 East Southlake Blvd.
Southlake, TX
15600 Southwest Freeway
Sugar Land, TX
139 N. Loop 1604 East
San Antonio, TX
Utah
279 West South Temple
Salt Lake City, UT
Virginia
1861 International Drive
McLean, VA
11957 Democracy Drive
Reston, VA
Washington
10500 NE 8th Street
Bellevue, WA
1518 6th Avenue
Seattle, WA
304 Strander Blvd
Tukwila, WA
Washington, DC
1900 K Street, N.W.
Washington, DC
Wisconsin
16020 West Bluemound Road
Brookfield, WI
Annual Report
To Write Fidelity
We'll give your correspondence immediate attention and send you written confirmation upon completion of your request.
(letter_graphic)
Making Changes
To Your Account
(such as changing name, address, bank, etc.)
Fidelity Investments
P.O. Box 770001
Cincinnati, OH 45277-0002
(letter_graphic)
For Non-Retirement
Accounts
Buying shares
Fidelity Investments
P.O. Box 770001
Cincinnati, OH 45277-0003
Overnight Express
Fidelity Investments
Attn: Distribution Services
100 Crosby Parkway - KC1H
Covington, KY 41015
Selling shares
Fidelity Investments
P.O. Box 770001
Cincinnati, OH 45277-0035
Overnight Express
Fidelity Investments
Attn: Distribution Services
100 Crosby Parkway - KC1H
Covington, KY 41015
General Correspondence
Fidelity Investments
P.O. Box 500
Merrimack, NH 03054-0500
(letter_graphic)
For Retirement
Accounts
Buying shares
Fidelity Investments
P.O. Box 770001
Cincinnati, OH 45277-0003
Selling shares
Fidelity Investments
P.O. Box 770001
Cincinnati, OH 45277-0035
Overnight Express
Fidelity Investments
Attn: Distribution Services
100 Crosby Parkway - KC1H
Covington, KY 41015
General Correspondence
Fidelity Investments
P.O. Box 500
Merrimack, NH 03054-0500
Annual Report
Investment Adviser
Fidelity Management & Research Company
Boston, MA
Investment Sub-Advisers
FMR Co., Inc.
Fidelity Management & Research
(U.K.) Inc.
Fidelity Management & Research
(Hong Kong) Limited
Fidelity Management & Research
(Japan) Inc.
General Distributor
Fidelity Distributors Corporation
Boston, MA
Transfer and Service Agents
Fidelity Investments Institutional
Operations Company, Inc.
Boston, MA
Fidelity Service Company, Inc.
Boston, MA
Custodian
The Northern Trust Company
Chicago, IL
The Fidelity Telephone Connection
Mutual Fund 24-Hour Service
Exchanges/Redemptions
and Account Assistance 1-800-544-6666
Product Information 1-800-544-6666
Retirement Accounts 1-800-544-4774
(8 a.m. - 9 p.m.)
TDD Service 1-800-544-0118
for the deaf and hearing impaired
(9 a.m. - 9 p.m. Eastern time)
Fidelity Automated Service
Telephone (FAST®) 1-800-544-5555
Automated line for quickest service
OTC-UANN-0911
1.789250.108
Fidelity®
OTC
Portfolio -
Class K
Annual Report
July 31, 2011
(2_fidelity_logos) (Registered_Trademark)
Contents
Chairman's Message | <Click Here> | The Chairman's message to shareholders. |
Performance | <Click Here> | How the fund has done over time. |
Management's Discussion of Fund Performance | <Click Here> | The Portfolio Manager's review of fund
performance and strategy. |
Shareholder Expense Example | <Click Here> | An example of shareholder expenses. |
Investment Changes | <Click Here> | A summary of major shifts in the fund's investments over the past six months. |
Investments | <Click Here> | A complete list of the fund's investments with their market values. |
Financial Statements | <Click Here> | Statements of assets and liabilities, operations, and changes in net assets, as well as financial highlights. |
Notes | <Click Here> | Notes to the financial statements. |
Report of Independent Registered Public Accounting Firm | <Click Here> | |
Trustees and Officers | <Click Here> | |
Board Approval of Investment Advisory Contracts and Management Fees | <Click Here> | |
To view a fund's proxy voting guidelines and proxy voting record for the 12-month period ended June 30, visit http://www.fidelity.com/proxyvotingresults or visit the Securities and Exchange Commission's (SEC) web site at http://www.sec.gov. You may also call 1-800-835-5092 to request a free copy of the proxy voting guidelines.
Standard & Poor's, S&P and S&P 500 are registered service marks of The McGraw-Hill Companies, Inc. and have been licensed for use by Fidelity Distributors Corporation.
Other third party marks appearing herein are the property of their respective owners.
All other marks appearing herein are registered or unregistered trademarks or service marks of FMR LLC or an affiliated company.
Annual Report
This report and the financial statements contained herein are submitted for the general information of the shareholders of the fund. This report is not authorized for distribution to prospective investors in the fund unless preceded or accompanied by an effective prospectus.
A fund files its complete schedule of portfolio holdings with the SEC for the first and third quarters of each fiscal year on Form N-Q. Forms N-Q are available on the SEC's web site at http://www.sec.gov. A fund's Forms N-Q may be reviewed and copied at the SEC's Public Reference Room in Washington, DC. Information regarding the operation of the SEC's Public Reference Room may be obtained by calling 1-800-SEC-0330. For a complete list of a fund's portfolio holdings, view the most recent holdings listing, semiannual report, or annual report on Fidelity's web site at http://www.fidelity.com, http://www.advisor.fidelity.com, or http://www.401k.com, as applicable.
NOT FDIC INSURED • MAY LOSE VALUE • NO BANK GUARANTEE
Neither the fund nor Fidelity Distributors Corporation is a bank.
Annual Report
(photo_of_James_C_Curvey)
Dear Shareholder:
The second half of 2011 began with U.S. equities continuing to give back some of the gains achieved earlier in the year. In the days leading up to July 31, markets were shaken by a political stalemate in which Congress struggled to address the debt ceiling issue before an early-August deadline. The resulting uncertainty held back markets in July, the third consecutive monthly decline for equities, effectively reversing the positive momentum seen through the end of April. Financial markets are always unpredictable, of course, but there are several time-tested investment principles that can help put the odds in your favor.
One of the basic tenets is to invest for the long term. Over time, riding out the markets' inevitable ups and downs has proven much more effective than selling into panic or chasing the hottest trend. Even missing only a few of the markets' best days can significantly diminish investor returns. Patience also affords the benefits of compounding - of earning interest on additional income or reinvested dividends and capital gains. There can be tax advantages and cost benefits to consider as well. While staying the course doesn't eliminate risk, it can considerably lessen the effect of short-term declines.
You can further manage your investing risk through diversification. And today, more than ever, geographic diversification should be taken into account. Studies indicate that asset allocation is the single most important determinant of a portfolio's long-term success. The right mix of stocks, bonds and cash - aligned to your particular risk tolerance and investment objective - is very important. Age-appropriate rebalancing is also an essential aspect of asset allocation. For younger investors, an emphasis on equities - which historically have been the best-performing asset class over time - is encouraged. As investors near their specific goal, such as retirement or sending a child to college, consideration may be given to replacing volatile assets (e.g. common stocks) with more-stable fixed investments (bonds or savings plans).
A third principle - investing regularly - can help lower the average cost of your purchases. Investing a certain amount of money each month or quarter helps ensure you won't pay for all your shares at market highs. This strategy - known as dollar cost averaging - also reduces "emotion" from investing, helping shareholders avoid selling weak performers just prior to an upswing, or chasing a hot performer just before a correction.
We invite you to contact us via the Internet, through our Investor Centers or by phone. It is our privilege to provide you the information you need to make the investments that are right for you.
Sincerely,
(The acting chairman's signature appears here.)
James C. Curvey
Acting Chairman
Annual Report
Average annual total return reflects the change in the value of an investment, assuming reinvestment of the class' distributions from dividend income and capital gains (the profits earned upon the sale of securities that have grown in value, if any) and assuming a constant rate of performance each year. The $10,000 table and the fund's returns do not reflect the deduction of taxes that a shareholder would pay on fund distributions or the redemption of fund shares. During periods of reimbursement by Fidelity, a fund's total return will be greater than it would be had the reimbursement not occurred. How a fund did yesterday is no guarantee of how it will do tomorrow.
Average Annual Total Returns
Periods ended July 31, 2011 | Past 1
year | Past 5
years | Past 10
years |
Class KA | 31.91% | 11.43% | 6.23% |
A The initial offering of Class K shares took place on May 9, 2008. Returns prior to May 9, 2008, are those of Fidelity® OTC Portfolio, the original class of the fund.
$10,000 Over 10 Years
Let's say hypothetically that $10,000 was invested in Fidelity® OTC Portfolio - Class K on July 31, 2001. The chart shows how the value of your investment would have changed, and also shows how the Nasdaq Composite® Index performed over the same period. The initial offering of Class K took place on May 9, 2008. See above for additional information regarding the performance of Class K.
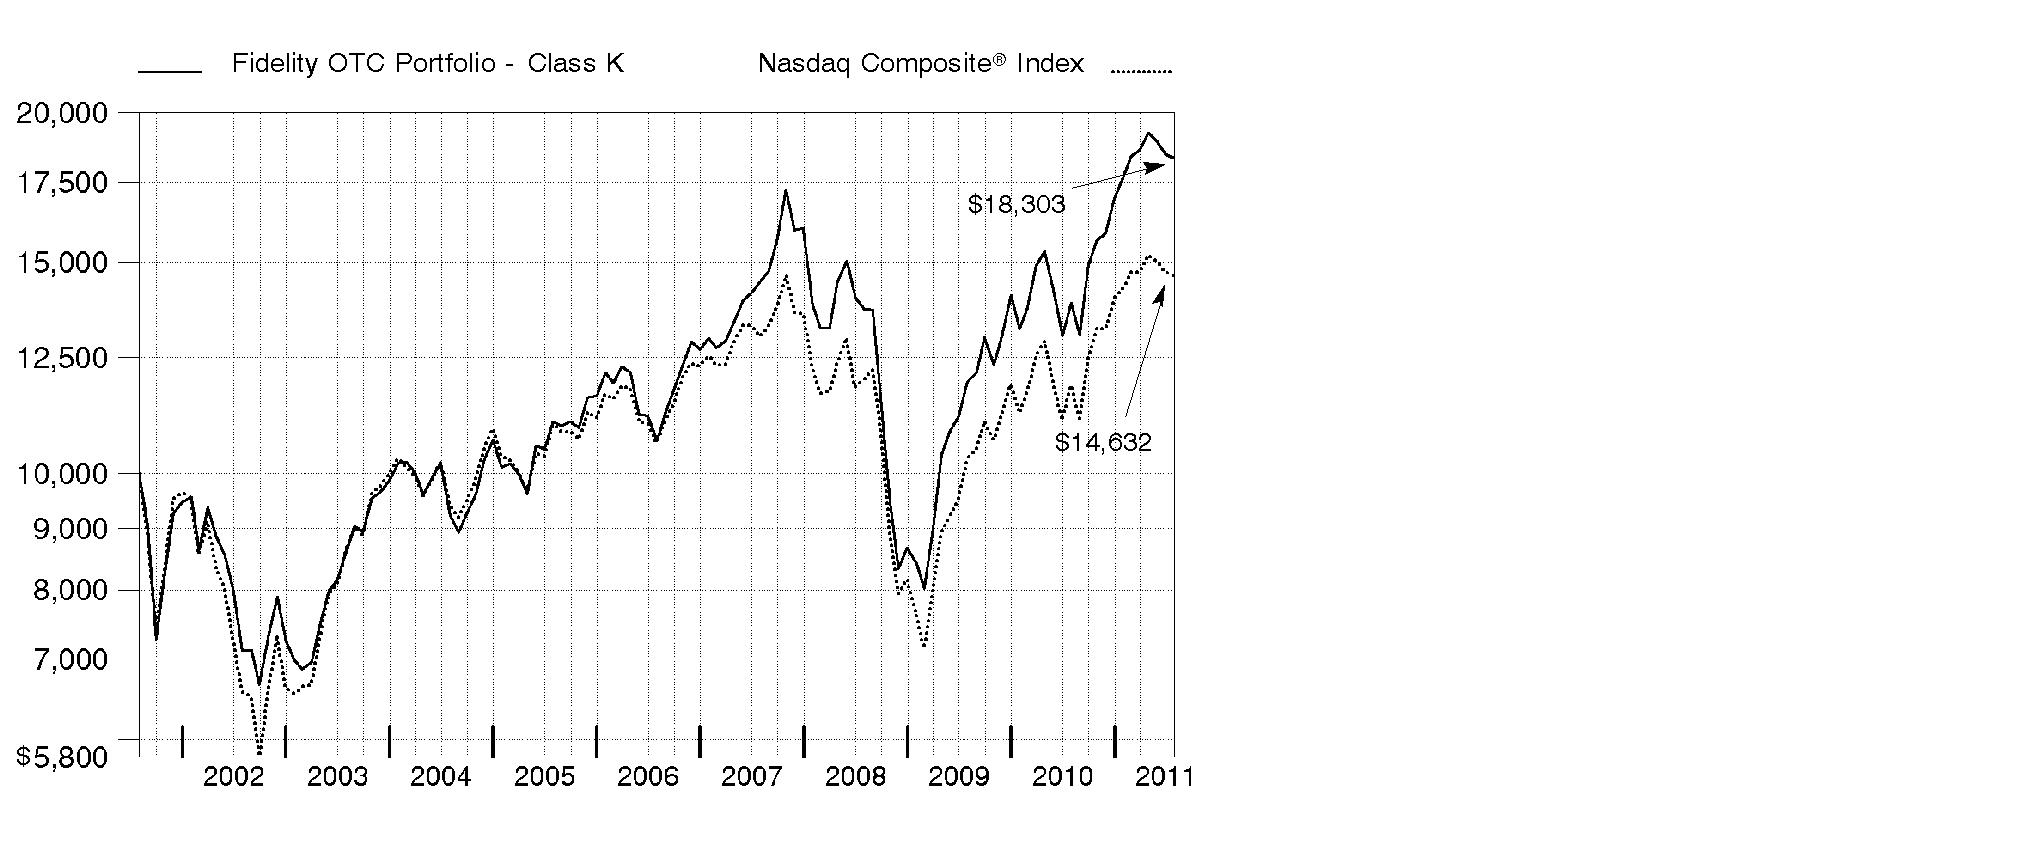
Annual Report
Market Recap: U.S. stocks registered solid double-digit gains for the 12 months ending July 31, 2011, extending a rally that began more than two years earlier. Despite a rough start in August 2010, markets turned positive in September, as increased demand for capital goods and other upbeat indicators trumped investor worry about a U.S. recessionary relapse. The broad market, as measured by the S&P 500® Index, rose 9% that month, its biggest September gain in 71 years. Seven more monthly advances followed, fueled by encouraging corporate earnings and economic activity. However, volatility picked up in the period's latter months, as markets reacted to continued high U.S. unemployment, nagging debt troubles in Europe and looming legislative battles over the federal debt ceiling. May unemployment rose above 9% for the first time in 2011, contributing to a traditional "June swoon" for stocks. Market uncertainty lingered in July, when the S&P 500® posted its second-biggest monthly loss of the period. For the full year, the S&P 500® climbed 19.65%, while the blue-chip-laden Dow Jones Industrial AverageSM rose a comparable 19.09% and the technology-heavy Nasdaq Composite® Index gained 23.53%. On the capitalization spectrum, stocks of mid-cap companies fared best, with the Russell Midcap® Index rising 24.51% and the small-cap Russell 2000® Index adding 23.92%.
Comments from Gavin Baker, Portfolio Manager of Fidelity® OTC Portfolio: During the year, the fund's Class K shares returned 31.91%, topping the Nasdaq Composite® Index. Versus the index, stock selection in information technology was a positive factor. Stock picking in health care and consumer discretionary also helped, although the benefits were modestly dampened by unrewarding industry positioning. Rewarding picks and industry selection in industrials further lifted results. The top individual contributor was a large out-of-index position in data center operator Rackspace Hosting, whose stock was buoyed by strong demand for outsourcing corporate technology operations. Other contributors included out-of-benchmark holding Accretive Health, which provides revenue-enhancement services and software for hospitals; graphics chip supplier NVIDIA; women's athletic apparel maker lululemon athletica; and an underweighting in networking equipment provider and weak-performing index component Cisco Systems. Conversely, stock selection in financials hurt. Canadian smartphone maker Research In Motion, the largest individual detractor, lost market share in developed markets and couldn't capitalize on opportunities in emerging markets. Broadband provider Clearwire and for-profit education holding Strayer Education were other notable detractors. I sold Research In Motion and Strayer Education before period end.
The views expressed above reflect those of the portfolio manager(s) only through the end of the period as stated on the cover of this report and do not necessarily represent the views of Fidelity or any other person in the Fidelity organization. Any such views are subject to change at any time based upon market or other conditions and Fidelity disclaims any responsibility to update such views. These views may not be relied on as investment advice and, because investment decisions for a Fidelity fund are based on numerous factors, may not be relied on as an indication of trading intent on behalf of any Fidelity fund.
Annual Report
Shareholder Expense Example
As a shareholder of the Fund, you incur two types of costs: (1) transaction costs, and (2) ongoing costs, including management fees and other Fund expenses. This Example is intended to help you understand your ongoing costs (in dollars) of investing in the Fund and to compare these costs with the ongoing costs of investing in other mutual funds.
The Example is based on an investment of $1,000 invested at the beginning of the period and held for the entire period (February 1, 2011 to July 31, 2011).
Actual Expenses
The first line of the accompanying table for each class of the Fund provides information about actual account values and actual expenses. You may use the information in this line, together with the amount you invested, to estimate the expenses that you paid over the period. Simply divide your account value by $1,000.00 (for example, an $8,600 account value divided by $1,000.00 = 8.6), then multiply the result by the number in the first line for a class of the Fund under the heading entitled "Expenses Paid During Period" to estimate the expenses you paid on your account during this period. A small balance maintenance fee of $12.00 that is charged once a year may apply for certain accounts with a value of less than $2,000. This fee is not included in the table below. If it was, the estimate of expenses you paid during the period would be higher, and your ending account value lower, by this amount. In addition, the Fund, as a shareholder in the underlying Fidelity Central Funds, will indirectly bear its pro-rata share of the fees and expenses incurred by the underlying Fidelity Central Funds. These fees and expenses are not included in the Fund's annualized expense ratio used to calculate the expense estimate in the table below.
Hypothetical Example for Comparison Purposes
The second line of the accompanying table for each class of the Fund provides information about hypothetical account values and hypothetical expenses based on a Class' actual expense ratio and an assumed rate of return of 5% per year before expenses, which is not the Class' actual return. The hypothetical account values and expenses may not be used to estimate the actual ending account balance or expenses you paid for the period. You may use this information to compare the ongoing costs of investing in the Fund and other funds. To do so, compare this 5% hypothetical example with the 5% hypothetical examples that appear in the shareholder reports of the other funds. A small balance maintenance fee of $12.00 that is charged once a year may apply for certain accounts with a value of less than $2,000. This fee is not included in the table below. If it was, the estimate of expenses you paid during the period would be higher, and your ending account value lower, by this amount. In addition, the Fund, as a shareholder in the underlying Fidelity Central Funds, will indirectly bear its pro-rata share of the fees and expenses incurred by the underlying Fidelity Central Funds. These fees and expenses are not included in the Fund's annualized expense ratio used to calculate the expense estimate in the table below.
Please note that the expenses shown in the table are meant to highlight your ongoing costs only and do not reflect any transaction costs. Therefore, the second line of the table is useful in comparing ongoing costs only, and will not help you determine the relative total costs of owning different funds.
Annual Report
| Annualized
Expense Ratio | Beginning
Account Value
February 1, 2011 | Ending
Account Value
July 31, 2011 | Expenses Paid
During Period*
February 1, 2011 to
July 31, 2011 |
OTC | .96% | | | |
Actual | | $ 1,000.00 | $ 1,037.60 | $ 4.85 |
HypotheticalA | | $ 1,000.00 | $ 1,020.03 | $ 4.81 |
Class K | .82% | | | |
Actual | | $ 1,000.00 | $ 1,038.30 | $ 4.14 |
HypotheticalA | | $ 1,000.00 | $ 1,020.73 | $ 4.11 |
A 5% return per year before expenses
* Expenses are equal to each Class' annualized expense ratio, multiplied by the average account value over the period, multiplied by 181/365 (to reflect the one-half year period).
Annual Report
Investment Changes (Unaudited)
Top Ten Stocks as of July 31, 2011 |
| % of fund's
net assets | % of fund's net assets
6 months ago |
Apple, Inc. | 11.7 | 9.8 |
Google, Inc. Class A | 8.4 | 7.7 |
Amazon.com, Inc. | 4.2 | 2.2 |
NVIDIA Corp. | 3.6 | 5.0 |
Cognizant Technology Solutions Corp. Class A | 3.5 | 1.5 |
Amgen, Inc. | 3.3 | 1.7 |
Vertex Pharmaceuticals, Inc. | 3.0 | 0.4 |
QUALCOMM, Inc. | 3.0 | 2.2 |
Rackspace Hosting, Inc. | 3.0 | 3.6 |
Accretive Health, Inc. | 2.9 | 1.3 |
| 46.6 | |
Top Five Market Sectors as of July 31, 2011 |
| % of fund's
net assets | % of fund's net assets
6 months ago |
Information Technology | 58.2 | 55.3 |
Consumer Discretionary | 17.8 | 14.5 |
Health Care | 15.3 | 13.2 |
Energy | 2.8 | 2.7 |
Financials | 2.4 | 5.2 |
Asset Allocation (% of fund's net assets) |
As of July 31, 2011* | As of January 31, 2011** |
| Stocks 99.6% | | | Stocks 100.2% | |
| Short-Term
Investments and
Net Other Assets 0.4% | | | Short-Term
Investments and
Net Other Assets (0.2)%† | |
* Foreign investments | 8.6% | | ** Foreign investments | 12.5% | |
† Short-Term Investments and Net Other Assets are not included in the pie chart.
Annual Report
Investments July 31, 2011
Showing Percentage of Net Assets
Common Stocks - 99.4% |
| Shares | | Value (000s) |
CONSUMER DISCRETIONARY - 17.6% |
Auto Components - 0.6% |
Gentex Corp. | 1,498,400 | | $ 42,465 |
Automobiles - 2.2% |
Tesla Motors, Inc. (a)(d) | 5,132,864 | | 144,593 |
Volkswagen AG sponsored ADR | 609,300 | | 22,349 |
| | 166,942 |
Diversified Consumer Services - 0.0% |
Coinstar, Inc. (a) | 14,600 | | 713 |
Global Education & Technology Group Ltd. ADR (a) | 221,261 | | 1,111 |
| | 1,824 |
Hotels, Restaurants & Leisure - 1.9% |
BJ's Restaurants, Inc. (a) | 529,000 | | 24,530 |
Bravo Brio Restaurant Group, Inc. | 661,025 | | 14,774 |
China Lodging Group Ltd. ADR (a)(d) | 188,800 | | 3,236 |
Ctrip.com International Ltd. sponsored ADR (a) | 16,900 | | 779 |
Dunkin' Brands Group, Inc. | 37,400 | | 1,082 |
Las Vegas Sands Corp. (a) | 54,900 | | 2,590 |
Starbucks Corp. | 2,536,800 | | 101,700 |
Wynn Resorts Ltd. | 4,700 | | 722 |
| | 149,413 |
Household Durables - 1.1% |
iRobot Corp. (a)(e) | 1,657,886 | | 57,960 |
Lennar Corp. Class A | 221,900 | | 3,925 |
PulteGroup, Inc. (a) | 98,700 | | 678 |
SodaStream International Ltd. (d) | 327,858 | | 24,048 |
Techtronic Industries Co. Ltd. | 672,500 | | 702 |
| | 87,313 |
Internet & Catalog Retail - 4.8% |
Amazon.com, Inc. (a) | 1,462,986 | | 325,544 |
ASOS PLC (a) | 272,328 | | 10,148 |
E-Commerce China Dangdang, Inc. ADR (d) | 62,900 | | 711 |
Ocado Group PLC (a) | 2,604,632 | | 7,282 |
Priceline.com, Inc. (a) | 28,200 | | 15,162 |
Start Today Co. Ltd. | 559,500 | | 13,899 |
| | 372,746 |
Media - 5.8% |
Comcast Corp. Class A | 9,105,900 | | 218,724 |
Discovery Communications, Inc. (a) | 992,311 | | 39,494 |
DISH Network Corp. Class A (a) | 4,084,200 | | 121,015 |
Focus Media Holding Ltd. ADR (a) | 23,500 | | 773 |
Common Stocks - continued |
| Shares | | Value (000s) |
CONSUMER DISCRETIONARY - continued |
Media - continued |
IMAX Corp. (a) | 318,700 | | $ 6,043 |
Liberty Global, Inc. Class A (a) | 17,400 | | 727 |
Pandora Media, Inc. (d) | 1,306,500 | | 19,715 |
Sirius XM Radio, Inc. (a)(d) | 17,256,800 | | 36,412 |
WPP PLC sponsored ADR | 11,900 | | 673 |
| | 443,576 |
Specialty Retail - 0.0% |
Francescas Holdings Corp. | 9,100 | | 239 |
I.T Ltd. | 722,000 | | 710 |
Teavana Holdings, Inc. | 10,300 | | 290 |
Ulta Salon, Cosmetics & Fragrance, Inc. (a) | 10,400 | | 656 |
| | 1,895 |
Textiles, Apparel & Luxury Goods - 1.2% |
Deckers Outdoor Corp. (a) | 8,000 | | 794 |
lululemon athletica, Inc. (a) | 1,482,546 | | 89,753 |
Polo Ralph Lauren Corp. Class A | 5,100 | | 689 |
Steven Madden Ltd. (a) | 45,550 | | 1,735 |
Trinity Ltd. | 700,000 | | 776 |
| | 93,747 |
TOTAL CONSUMER DISCRETIONARY | | 1,359,921 |
CONSUMER STAPLES - 1.1% |
Beverages - 0.0% |
Hansen Natural Corp. (a) | 8,700 | | 667 |
Food & Staples Retailing - 0.0% |
Droga Raia SA | 37,000 | | 686 |
Whole Foods Market, Inc. | 10,900 | | 727 |
| | 1,413 |
Food Products - 1.1% |
Green Mountain Coffee Roasters, Inc. (a) | 699,500 | | 72,713 |
Tingyi (Cayman Islands) Holding Corp. ADR | 11,100 | | 685 |
Want Want China Holdings Ltd. ADR | 217,500 | | 9,698 |
| | 83,096 |
Personal Products - 0.0% |
USANA Health Sciences, Inc. (a)(d) | 22,500 | | 615 |
TOTAL CONSUMER STAPLES | | 85,791 |
Common Stocks - continued |
| Shares | | Value (000s) |
ENERGY - 2.8% |
Energy Equipment & Services - 1.0% |
ION Geophysical Corp. (a) | 3,015,000 | | $ 30,572 |
Petroleum Geo-Services ASA sponsored ADR (a) | 59,600 | | 969 |
Saipem SpA ADR | 1,035,700 | | 26,990 |
Transocean Ltd. (United States) | 401,800 | | 24,735 |
| | 83,266 |
Oil, Gas & Consumable Fuels - 1.8% |
Amyris, Inc. (d) | 1,014,900 | | 23,495 |
Brigham Exploration Co. (a) | 311,900 | | 9,918 |
Carrizo Oil & Gas, Inc. (a) | 119,200 | | 4,577 |
Georesources, Inc. (a)(d)(e) | 1,869,300 | | 47,705 |
Gulfport Energy Corp. (a) | 83,600 | | 3,048 |
KiOR, Inc. Class A (d) | 122,600 | | 1,772 |
Petroleum Development Corp. (a)(e) | 1,219,551 | | 44,294 |
Solazyme, Inc. | 143,900 | | 3,288 |
| | 138,097 |
TOTAL ENERGY | | 221,363 |
FINANCIALS - 2.4% |
Capital Markets - 0.1% |
Goldman Sachs Group, Inc. | 58,000 | | 7,828 |
Commercial Banks - 0.9% |
Associated Banc-Corp. | 54,700 | | 747 |
Fulton Financial Corp. | 63,700 | | 647 |
HDFC Bank Ltd. sponsored ADR | 1,251,000 | | 43,485 |
Huntington Bancshares, Inc. | 114,900 | | 695 |
National Penn Bancshares, Inc. | 88,300 | | 710 |
Popular, Inc. (a) | 271,600 | | 652 |
Standard Chartered PLC | 26,500 | | 681 |
SVB Financial Group (a) | 19,800 | | 1,208 |
Wells Fargo & Co. | 739,900 | | 20,673 |
Zions Bancorporation | 62,600 | | 1,371 |
| | 70,869 |
Diversified Financial Services - 1.4% |
Citigroup, Inc. | 569,060 | | 21,818 |
CME Group, Inc. | 273,100 | | 78,978 |
Hong Kong Exchanges and Clearing Ltd. | 34,800 | | 718 |
Common Stocks - continued |
| Shares | | Value (000s) |
FINANCIALS - continued |
Diversified Financial Services - continued |
JPMorgan Chase & Co. | 17,700 | | $ 716 |
NBH Holdings Corp. Class A (a)(f) | 110,800 | | 1,994 |
| | 104,224 |
Insurance - 0.0% |
Protective Life Corp. | 30,300 | | 644 |
TOTAL FINANCIALS | | 183,565 |
HEALTH CARE - 15.3% |
Biotechnology - 10.3% |
Achillion Pharmaceuticals, Inc. (a) | 456,472 | | 3,382 |
Alexion Pharmaceuticals, Inc. (a) | 109,920 | | 6,243 |
Alnylam Pharmaceuticals, Inc. (a) | 69,600 | | 653 |
Amarin Corp. PLC ADR (a) | 5,348,961 | | 72,425 |
Amgen, Inc. | 4,592,100 | | 251,188 |
Amylin Pharmaceuticals, Inc. (a) | 976,939 | | 11,635 |
Anthera Pharmaceuticals, Inc. (a) | 1,404,700 | | 11,195 |
ARIAD Pharmaceuticals, Inc. (a) | 83,400 | | 992 |
Biogen Idec, Inc. (a) | 14,200 | | 1,447 |
BioMarin Pharmaceutical, Inc. (a) | 98,800 | | 3,086 |
Celgene Corp. (a) | 539,616 | | 31,999 |
Cepheid, Inc. (a) | 361,600 | | 13,654 |
Dendreon Corp. (a) | 20,836 | | 769 |
Genomic Health, Inc. (a) | 26,320 | | 707 |
Human Genome Sciences, Inc. (a) | 2,237,012 | | 47,000 |
ImmunoGen, Inc. (a) | 297,309 | | 4,023 |
Inhibitex, Inc. (a) | 179,200 | | 742 |
InterMune, Inc. (a) | 666,320 | | 22,242 |
Ironwood Pharmaceuticals, Inc. Class A (a)(d) | 2,084,400 | | 31,162 |
Isis Pharmaceuticals, Inc. (a)(d) | 80,849 | | 699 |
NPS Pharmaceuticals, Inc. (a) | 337,200 | | 3,257 |
Pharmasset, Inc. (a) | 171,300 | | 20,792 |
Seattle Genetics, Inc. (a) | 535,103 | | 9,113 |
Targacept, Inc. (a) | 216,749 | | 4,430 |
Theravance, Inc. (a) | 53,000 | | 1,133 |
Vertex Pharmaceuticals, Inc. (a) | 4,470,688 | | 231,850 |
Vical, Inc. (a) | 2,303,364 | | 11,079 |
| | 796,897 |
Health Care Equipment & Supplies - 0.2% |
Endologix, Inc. (a) | 93,600 | | 850 |
Common Stocks - continued |
| Shares | | Value (000s) |
HEALTH CARE - continued |
Health Care Equipment & Supplies - continued |
Mako Surgical Corp. (a)(d) | 358,863 | | $ 10,339 |
Masimo Corp. | 22,700 | | 631 |
Zoll Medical Corp. (a) | 49,800 | | 3,469 |
| | 15,289 |
Health Care Providers & Services - 3.7% |
Accretive Health, Inc. (a)(d)(e) | 7,504,545 | | 225,437 |
Express Scripts, Inc. (a) | 1,083,300 | | 58,780 |
| | 284,217 |
Health Care Technology - 0.2% |
athenahealth, Inc. (a) | 186,300 | | 10,953 |
SXC Health Solutions Corp. (a) | 12,200 | | 772 |
| | 11,725 |
Life Sciences Tools & Services - 0.4% |
Fluidigm Corp. (a)(d) | 43,083 | | 731 |
Illumina, Inc. (a)(d) | 503,582 | | 31,449 |
| | 32,180 |
Pharmaceuticals - 0.5% |
Endocyte, Inc. | 706,700 | | 9,420 |
Shire PLC sponsored ADR | 316,100 | | 32,874 |
| | 42,294 |
TOTAL HEALTH CARE | | 1,182,602 |
INDUSTRIALS - 0.3% |
Aerospace & Defense - 0.1% |
Bombardier, Inc. | 264,100 | | 1,603 |
Rolls-Royce Group PLC sponsored ADR | 27,400 | | 1,456 |
| | 3,059 |
Air Freight & Logistics - 0.0% |
C.H. Robinson Worldwide, Inc. | 9,500 | | 687 |
Construction & Engineering - 0.0% |
Fluor Corp. | 10,500 | | 667 |
Foster Wheeler AG (a) | 53,984 | | 1,463 |
| | 2,130 |
Electrical Equipment - 0.2% |
Polypore International, Inc. (a) | 182,200 | | 12,390 |
Common Stocks - continued |
| Shares | | Value (000s) |
INDUSTRIALS - continued |
Machinery - 0.0% |
3D Systems Corp. (a)(d) | 33,619 | | $ 720 |
Chart Industries, Inc. (a) | 12,900 | | 684 |
| | 1,404 |
Trading Companies & Distributors - 0.0% |
Rush Enterprises, Inc. Class A (a) | 34,900 | | 698 |
TOTAL INDUSTRIALS | | 20,368 |
INFORMATION TECHNOLOGY - 58.2% |
Communications Equipment - 7.2% |
Acme Packet, Inc. (a) | 11,074 | | 652 |
Alcatel-Lucent SA sponsored ADR (a) | 6,377,600 | | 25,829 |
Aruba Networks, Inc. (a)(d)(e) | 7,814,527 | | 179,343 |
Brocade Communications Systems, Inc. (a) | 5,544,895 | | 30,386 |
Cisco Systems, Inc. | 900 | | 14 |
HTC Corp. | 14,542 | | 432 |
Juniper Networks, Inc. (a) | 149,803 | | 3,504 |
Meru Networks, Inc. (a)(d)(e) | 969,089 | | 8,324 |
Polycom, Inc. (a) | 1,760,700 | | 47,592 |
QUALCOMM, Inc. | 4,196,400 | | 229,879 |
Riverbed Technology, Inc. (a) | 898,102 | | 25,713 |
Sandvine Corp. (a) | 732,366 | | 1,617 |
| | 553,285 |
Computers & Peripherals - 14.7% |
Apple, Inc. (a) | 2,310,000 | | 902,004 |
Dell, Inc. (a) | 6,524,400 | | 105,956 |
Fusion-io, Inc. | 298,124 | | 8,827 |
NetApp, Inc. (a) | 1,278,450 | | 60,752 |
SanDisk Corp. (a) | 757,650 | | 32,223 |
Silicon Graphics International Corp. (a)(d) | 1,144,500 | | 16,332 |
Stratasys, Inc. (a)(d) | 142,205 | | 3,626 |
Synaptics, Inc. (a)(d) | 311,707 | | 7,659 |
| | 1,137,379 |
Electronic Equipment & Components - 0.3% |
E Ink Holdings, Inc. GDR (a)(f) | 35,700 | | 740 |
FLIR Systems, Inc. | 167,000 | | 4,586 |
HLS Systems International Ltd. (a)(d) | 659,100 | | 4,594 |
Common Stocks - continued |
| Shares | | Value (000s) |
INFORMATION TECHNOLOGY - continued |
Electronic Equipment & Components - continued |
IPG Photonics Corp. (a) | 16,258 | | $ 979 |
Maxwell Technologies, Inc. (a) | 827,037 | | 13,952 |
| | 24,851 |
Internet Software & Services - 14.8% |
Active Network, Inc. | 51,200 | | 929 |
Baidu.com, Inc. sponsored ADR (a) | 57,000 | | 8,953 |
Blinkx PLC (a) | 2,725,181 | | 4,887 |
DeNA Co. Ltd. | 306,900 | | 15,332 |
eBay, Inc. (a) | 3,314,094 | | 108,537 |
Facebook, Inc. Class B (a)(g) | 335,669 | | 8,392 |
Google, Inc. Class A (a) | 1,075,022 | | 648,980 |
IntraLinks Holdings, Inc. | 1,221,606 | | 18,666 |
LinkedIn Corp. (a)(d) | 13,300 | | 1,344 |
LogMeIn, Inc. (a)(d) | 881,040 | | 31,321 |
Mail.ru Group Ltd. GDR (a)(f) | 11,300 | | 404 |
OpenTable, Inc. (a)(d) | 836,979 | | 59,308 |
Rackspace Hosting, Inc. (a)(d) | 5,704,134 | | 228,165 |
Renren, Inc. ADR (d) | 131,000 | | 1,419 |
SINA Corp. (a) | 17,500 | | 1,892 |
Travelzoo, Inc. (a)(d) | 11,200 | | 591 |
Velti PLC (a) | 356,351 | | 5,883 |
Yandex NV | 19,800 | | 692 |
| | 1,145,695 |
IT Services - 3.8% |
Cognizant Technology Solutions Corp. Class A (a) | 3,858,645 | | 269,604 |
Echo Global Logistics, Inc. (a)(d) | 118,457 | | 1,772 |
hiSoft Technology International Ltd. ADR (a)(d) | 1,207,280 | | 16,745 |
MasterCard, Inc. Class A | 9,600 | | 2,911 |
ServiceSource International, Inc. | 27,300 | | 509 |
| | 291,541 |
Semiconductors & Semiconductor Equipment - 6.4% |
Avago Technologies Ltd. | 948,735 | | 31,906 |
Cypress Semiconductor Corp. | 32,550 | | 670 |
First Solar, Inc. (a) | 5,636 | | 666 |
Freescale Semiconductor Holdings I Ltd. | 116,200 | | 1,898 |
GT Solar International, Inc. (a)(d) | 116,300 | | 1,586 |
Lam Research Corp. (a) | 571,000 | | 23,342 |
Mellanox Technologies Ltd. (a) | 1,242,951 | | 43,317 |
Micron Technology, Inc. (a) | 91,900 | | 677 |
Netlogic Microsystems, Inc. (a)(d) | 1,409,800 | | 48,709 |
Common Stocks - continued |
| Shares | | Value (000s) |
INFORMATION TECHNOLOGY - continued |
Semiconductors & Semiconductor Equipment - continued |
NVIDIA Corp. (a) | 19,877,412 | | $ 274,905 |
NXP Semiconductors NV | 749,234 | | 14,820 |
Skyworks Solutions, Inc. (a) | 968,300 | | 24,508 |
Standard Microsystems Corp. (a) | 29,100 | | 689 |
Volterra Semiconductor Corp. (a) | 1,206,500 | | 31,092 |
| | 498,785 |
Software - 11.0% |
Ariba, Inc. (a) | 2,120,714 | | 70,132 |
BMC Software, Inc. (a) | 13,600 | | 588 |
BroadSoft, Inc. (a) | 830,880 | | 24,270 |
Check Point Software Technologies Ltd. (a) | 90,282 | | 5,205 |
Citrix Systems, Inc. (a) | 219,200 | | 15,791 |
DemandTec, Inc. (a) | 257,533 | | 1,844 |
Fortinet, Inc. (a) | 33,200 | | 675 |
Gameloft (a)(e) | 7,479,787 | | 51,802 |
Informatica Corp. (a) | 26,700 | | 1,365 |
Kingdee International Software Group Co. Ltd. | 1,288,800 | | 756 |
Magma Design Automation, Inc. (a) | 319,614 | | 2,378 |
Microsoft Corp. | 6,312,565 | | 172,964 |
MicroStrategy, Inc. Class A (a) | 401,600 | | 64,003 |
Oracle Corp. | 5,357,900 | | 163,845 |
Pegasystems, Inc. (d) | 1,268,765 | | 51,207 |
QLIK Technologies, Inc. | 941,600 | | 28,540 |
Rovi Corp. (a) | 841,100 | | 44,553 |
salesforce.com, Inc. (a) | 4,400 | | 637 |
SuccessFactors, Inc. (a) | 1,866,405 | | 50,393 |
Synchronoss Technologies, Inc. (a)(e) | 3,240,027 | | 94,771 |
Taleo Corp. Class A (a) | 261,322 | | 8,650 |
| | 854,369 |
TOTAL INFORMATION TECHNOLOGY | | 4,505,905 |
MATERIALS - 1.3% |
Chemicals - 0.1% |
Celanese Corp. Class A | 13,300 | | 733 |
CF Industries Holdings, Inc. | 50,800 | | 7,890 |
Innophos Holdings, Inc. | 15,056 | | 726 |
| | 9,349 |
Common Stocks - continued |
| Shares | | Value (000s) |
MATERIALS - continued |
Metals & Mining - 1.2% |
Randgold Resources Ltd. sponsored ADR | 986,900 | | $ 89,620 |
Royal Gold, Inc. | 17,500 | | 1,122 |
| | 90,742 |
TOTAL MATERIALS | | 100,091 |
TELECOMMUNICATION SERVICES - 0.4% |
Diversified Telecommunication Services - 0.0% |
Cbeyond, Inc. (a) | 54,190 | | 609 |
Wireless Telecommunication Services - 0.4% |
Clearwire Corp. Class A (a)(d) | 7,718,153 | | 16,748 |
Sprint Nextel Corp. (a) | 2,217,945 | | 9,382 |
Vodafone Group PLC sponsored ADR | 64,400 | | 1,810 |
| | 27,940 |
TOTAL TELECOMMUNICATION SERVICES | | 28,549 |
TOTAL COMMON STOCKS (Cost $6,750,604) | 7,688,155 |
Nonconvertible Preferred Stocks - 0.2% |
| | | |
CONSUMER DISCRETIONARY - 0.2% |
Automobiles - 0.2% |
Porsche Automobil Holding SE (Germany) (Cost $14,198) | 258,075 | | 19,905 |
Money Market Funds - 5.9% |
| Shares | | Value (000s) |
Fidelity Securities Lending Cash Central Fund, 0.15% (b)(c)
(Cost $456,124) | 456,124,068 | | $ 456,124 |
TOTAL INVESTMENT PORTFOLIO - 105.5% (Cost $7,220,926) | | 8,164,184 |
NET OTHER ASSETS (LIABILITIES) - (5.5)% | | (427,008) |
NET ASSETS - 100% | $ 7,737,176 |
Legend |
(a) Non-income producing |
(b) Affiliated fund that is available only to investment companies and other accounts managed by Fidelity Investments. The rate quoted is the annualized seven-day yield of the fund at period end. A complete unaudited listing of the fund's holdings as of its most recent quarter end is available upon request. In addition, each Fidelity Central Fund's financial statements, which are not covered by the Fund's Report of Independent Registered Public Accounting Firm, are available on the SEC's website or upon request. |
(c) Investment made with cash collateral received from securities on loan. |
(d) Security or a portion of the security is on loan at period end. |
(e) Affiliated company |
(f) Security exempt from registration under Rule 144A of the Securities Act of 1933. These securities may be resold in transactions exempt from registration, normally to qualified institutional buyers. At the end of the period, the value of these securities amounted to $3,138,000 or 0.0% of net assets. |
(g) Restricted securities - Investment in securities not registered under the Securities Act of 1933 (excluding 144A issues). At the end of the period, the value of restricted securities (excluding 144A issues) amounted to $8,392,000 or 0.1% of net assets. |
Additional information on each restricted holding is as follows: |
Security | Acquisition Date | Acquisition Cost (000s) |
Facebook, Inc. Class B | 3/31/11 - 5/19/11 | $ 8,394 |
Affiliated Central Funds |
Information regarding fiscal year to date income earned by the Fund from investments in Fidelity Central Funds is as follows: |
Fund | Income earned
(Amounts in thousands) |
Fidelity Cash Central Fund | $ 22 |
Fidelity Securities Lending Cash Central Fund | 6,028 |
Total | $ 6,050 |
Other Affiliated Issuers |
An affiliated company is a company in which the Fund has ownership of at least 5% of the voting securities. Fiscal year to date transactions with companies which are or were affiliates are as follows: |
Affiliate
(Amounts in thousands) | Value,
beginning of
period | Purchases | Sales Proceeds | Dividend Income | Value,
end of
period |
Accretive Health, Inc. | $ 919 | $ 126,603 | $ 3,893 | $ - | $ 225,437 |
Alphatec Holdings, Inc. | 21,863 | 1,075 | 11,983 | - | - |
Aruba Networks, Inc. | - | 217,643 | 31,574 | - | 179,343 |
BroadSoft, Inc. | - | 60,841 | 51,535 | - | - |
Echo Global Logistics, Inc. | 2,905 | 23,108 | 25,413 | - | - |
Gameloft | 36,748 | 267 | - | - | 51,802 |
Georesources, Inc. | - | 70,296 | 19,299 | - | 47,705 |
iRobot Corp. | 34,374 | 3,616 | 3,199 | - | 57,960 |
Meru Networks, Inc. | - | 31,697 | 10,303 | - | 8,324 |
Petroleum Development Corp. | - | 55,914 | 2,927 | - | 44,294 |
Rackspace Hosting, Inc. | 142,387 | 54,802 | 131,408 | - | - |
Synaptics, Inc. | - | 54,115 | 38,400 | - | - |
Synchronoss Technologies, Inc. | - | 86,185 | - | - | 94,771 |
Tesla Motors, Inc. | - | 131,425 | - | - | - |
Total | $ 239,196 | $ 917,587 | $ 329,934 | $ - | $ 709,636 |
Other Information |
The following is a summary of the inputs used, as of July 31, 2011, involving the Fund's assets and liabilities carried at fair value. The inputs or methodology used for valuing securities may not be an indication of the risk associated with investing in those securities. For more information on valuation inputs, and their aggregation into the levels used in the tables below, please refer to the Security Valuation section in the accompanying Notes to Financial Statements. |
Valuation Inputs at Reporting Date: |
Description
(Amounts in thousands) | Total | Level 1 | Level 2 | Level 3 |
Investments in Securities: | | | | |
Equities: | | | | |
Consumer Discretionary | $ 1,379,826 | $ 1,379,826 | $ - | $ - |
Consumer Staples | 85,791 | 85,791 | - | - |
Energy | 221,363 | 221,363 | - | - |
Financials | 183,565 | 181,571 | - | 1,994 |
Health Care | 1,182,602 | 1,182,602 | - | - |
Industrials | 20,368 | 20,368 | - | - |
Information Technology | 4,505,905 | 4,497,513 | - | 8,392 |
Materials | 100,091 | 100,091 | - | - |
Telecommunication Services | 28,549 | 28,549 | - | - |
Money Market Funds | 456,124 | 456,124 | - | - |
Total Investments in Securities: | $ 8,164,184 | $ 8,153,798 | $ - | $ 10,386 |
The following is a reconciliation of Investments in Securities for which Level 3 inputs were used in determining value: |
(Amounts in thousands) | |
Investments in Securities: | |
Beginning Balance | $ 2,161 |
Total Realized Gain (Loss) | - |
Total Unrealized Gain (Loss) | (169) |
Cost of Purchases | 8,394 |
Proceeds of Sales | - |
Amortization/Accretion | - |
Transfers in to Level 3 | - |
Transfers out of Level 3 | - |
Ending Balance | $ 10,386 |
The change in unrealized gain (loss) for the period attributable to Level 3 securities held at July 31, 2011 | $ (169) |
The information used in the above reconciliation represents fiscal year to date activity for any Investments in Securities identified as using Level 3 inputs at either the beginning or the end of the current fiscal period. Transfers in or out of Level 3 represent the beginning value of any Security or Instrument where a change in the pricing level occurred from the beginning to the end of the period. The cost of purchases and the proceeds of sales may include securities received or delivered through corporate actions or exchanges. Realized and unrealized gains (losses) disclosed in the reconciliation are included in Net Gain (Loss) on the Fund's Statement of Operations. |
Income Tax Information |
At July 31, 2011, the Fund had a capital loss carryforward of approximately $401,153,000 all of which will expire in fiscal 2017. Capital loss carryforwards are only available to offset future capital gains of the Fund to the extent provided by regulations and may be limited. |
See accompanying notes which are an integral part of the financial statements.
Annual Report
Statement of Assets and Liabilities
Amounts in thousands (except per-share amounts) | July 31, 2011 |
Assets | | |
Investment in securities, at value (including securities loaned of $441,213) - See accompanying schedule: Unaffiliated issuers (cost $6,184,352) | $ 6,998,424 | |
Fidelity Central Funds (cost $456,124) | 456,124 | |
Other affiliated issuers (cost $580,450) | 709,636 | |
Total Investments (cost $7,220,926) | | $ 8,164,184 |
Receivable for investments sold | | 361,447 |
Receivable for fund shares sold | | 8,694 |
Dividends receivable | | 656 |
Distributions receivable from Fidelity Central Funds | | 1,183 |
Other receivables | | 905 |
Total assets | | 8,537,069 |
| | |
Liabilities | | |
Payable to custodian bank | $ 167 | |
Payable for investments purchased | 304,166 | |
Payable for fund shares redeemed | 16,182 | |
Accrued management fee | 4,986 | |
Notes payable to affiliates | 16,905 | |
Other affiliated payables | 1,158 | |
Other payables and accrued expenses | 205 | |
Collateral on securities loaned, at value | 456,124 | |
Total liabilities | | 799,893 |
| | |
Net Assets | | $ 7,737,176 |
Net Assets consist of: | | |
Paid in capital | | $ 7,264,375 |
Accumulated net investment loss | | (134) |
Accumulated undistributed net realized gain (loss) on investments and foreign currency transactions | | (470,294) |
Net unrealized appreciation (depreciation) on investments and assets and liabilities in foreign currencies | | 943,229 |
Net Assets | | $ 7,737,176 |
See accompanying notes which are an integral part of the financial statements.
Annual Report
Financial Statements - continued
Statement of Assets and Liabilities - continued
Amounts in thousands (except per-share amounts) | July 31, 2011 |
OTC:
Net Asset Value, offering price and redemption price per share ($6,373,787 ÷ 107,524 shares) | | $ 59.28 |
| | |
Class K:
Net Asset Value, offering price and redemption price per share ($1,363,389 ÷ 22,872 shares) | | $ 59.61 |
See accompanying notes which are an integral part of the financial statements.
Annual Report
Statement of Operations
Amounts in thousands | Year ended July 31, 2011 |
Investment Income | | |
Dividends | | $ 24,625 |
Interest | | 5 |
Income from Fidelity Central Funds (including $6,028 from security lending) | | 6,050 |
Total income | | 30,680 |
| | |
Expenses | | |
Management fee
Basic fee | $ 42,763 | |
Performance adjustment | 7,488 | |
Transfer agent fees | 11,850 | |
Accounting and security lending fees | 1,239 | |
Custodian fees and expenses | 388 | |
Independent trustees' compensation | 37 | |
Appreciation in deferred trustee compensation account | 1 | |
Registration fees | 157 | |
Audit | 72 | |
Legal | 32 | |
Interest | 22 | |
Miscellaneous | 74 | |
Total expenses before reductions | 64,123 | |
Expense reductions | (833) | 63,290 |
Net investment income (loss) | | (32,610) |
Realized and Unrealized Gain (Loss) Net realized gain (loss) on: | | |
Investment securities: | | |
Unaffiliated issuers | 816,520 | |
Other affiliated issuers | 76,660 | |
Foreign currency transactions | 137 | |
Total net realized gain (loss) | | 893,317 |
Change in net unrealized appreciation (depreciation) on: Investment securities | 918,181 | |
Assets and liabilities in foreign currencies | 21 | |
Total change in net unrealized appreciation (depreciation) | | 918,202 |
Net gain (loss) | | 1,811,519 |
Net increase (decrease) in net assets resulting from operations | | $ 1,778,909 |
See accompanying notes which are an integral part of the financial statements.
Annual Report
Financial Statements - continued
Statement of Changes in Net Assets
Amounts in thousands | Year ended
July 31,
2011 | Year ended
July 31,
2010 |
Increase (Decrease) in Net Assets | | |
Operations | | |
Net investment income (loss) | $ (32,610) | $ (29,657) |
Net realized gain (loss) | 893,317 | 1,053,989 |
Change in net unrealized appreciation (depreciation) | 918,202 | (204,398) |
Net increase (decrease) in net assets resulting
from operations | 1,778,909 | 819,934 |
Share transactions - net increase (decrease) | (58,129) | 30,686 |
Total increase (decrease) in net assets | 1,720,780 | 850,620 |
| | |
Net Assets | | |
Beginning of period | 6,016,396 | 5,165,776 |
End of period (including accumulated net investment loss of $134 and accumulated net investment loss of $112, respectively) | $ 7,737,176 | $ 6,016,396 |
See accompanying notes which are an integral part of the financial statements.
Annual Report
Financial Highlights - OTC
Years ended July 31, | 2011 | 2010 | 2009 | 2008 | 2007 |
Selected Per-Share Data | | | | | |
Net asset value, beginning of period | $ 45.00 | $ 38.73 | $ 44.66 | $ 47.09 | $ 34.70 |
Income from Investment Operations | | | | | |
Net investment income (loss) B | (.27) | (.23) | (.12) | (.20) | (.19) |
Net realized and unrealized gain (loss) | 14.55 | 6.50 | (5.81) | (2.23) | 12.58 |
Total from investment operations | 14.28 | 6.27 | (5.93) | (2.43) | 12.39 |
Net asset value, end of period | $ 59.28 | $ 45.00 | $ 38.73 | $ 44.66 | $ 47.09 |
Total Return A | 31.73% | 16.19% | (13.28)% | (5.16)% | 35.71% |
Ratios to Average Net Assets C, E | | | | | |
Expenses before reductions | .94% | 1.06% | 1.13% | 1.06% | .96% |
Expenses net of fee waivers, if any | .94% | 1.06% | 1.13% | 1.06% | .96% |
Expenses net of all reductions | .92% | 1.04% | 1.13% | 1.05% | .95% |
Net investment income (loss) | (.49)% | (.51)% | (.37)% | (.42)% | (.45)% |
Supplemental Data | | | | | |
Net assets, end of period (in millions) | $ 6,374 | $ 5,080 | $ 4,677 | $ 6,871 | $ 8,778 |
Portfolio turnover rate D | 158% | 163% | 151% | 145% | 121% |
A Total returns would have been lower if certain expenses had not been reduced during the applicable periods shown.
B Calculated based on average shares outstanding during the period.
C Fees and expenses of any underlying Fidelity Central Funds are not included in the Fund's expense ratio. The Fund indirectly bears its proportionate share of the expenses of any underlying Fidelity Central Funds.
D Amount does not include the portfolio activity of any underlying Fidelity Central Funds.
E Expense ratios reflect operating expenses of the class. Expenses before reductions do not reflect amounts reimbursed by the investment adviser or reductions from brokerage service arrangements or reductions from other expense offset arrangements and do not represent the amount paid by the class during periods when reimbursements or reductions occur. Expenses net of fee waivers reflect expenses after reimbursement by the investment adviser but prior to reductions from brokerage service arrangements or other expense offset arrangements. Expenses net of all reductions represent the net expenses paid by the class.
See accompanying notes which are an integral part of the financial statements.
Annual Report
Financial Highlights - Class K
Years ended July 31, | 2011 | 2010 | 2009 | 2008 G |
Selected Per-Share Data | | | | |
Net asset value, beginning of period | $ 45.19 | $ 38.83 | $ 44.68 | $ 47.79 |
Income from Investment Operations | | | | |
Net investment income (loss) D | (.19) | (.16) | (.05) | (.05) |
Net realized and unrealized gain (loss) | 14.61 | 6.52 | (5.80) | (3.06) |
Total from investment operations | 14.42 | 6.36 | (5.85) | (3.11) |
Net asset value, end of period | $ 59.61 | $ 45.19 | $ 38.83 | $ 44.68 |
Total Return B, C | 31.91% | 16.38% | (13.09)% | (6.51)% |
Ratios to Average Net Assets E, H | | | | |
Expenses before reductions | .80% | .90% | .92% | .91% A |
Expenses net of fee waivers, if any | .80% | .90% | .92% | .91% A |
Expenses net of all reductions | .78% | .88% | .92% | .91% A |
Net investment income (loss) | (.35)% | (.35)% | (.17)% | (.47)% A |
Supplemental Data | | | | |
Net assets, end of period (000 omitted) | $ 1,363,389 | $ 936,256 | $ 488,683 | $ 93 |
Portfolio turnover rate F | 158% | 163% | 151% | 145% |
A Annualized
B Total returns for periods of less than one year are not annualized.
C Total returns would have been lower if certain expenses had not been reduced during the applicable periods shown.
D Calculated based on average shares outstanding during the period.
E Fees and expenses of any underlying Fidelity Central Funds are not included in the Fund's expense ratio. The Fund indirectly bears its proportionate share of the expenses of any underlying Fidelity Central Funds.
F Amount does not include the portfolio activity of any underlying Fidelity Central Funds.
G For the period May 9, 2008 (commencement of sale of shares) to July 31, 2008.
H Expense ratios reflect operating expenses of the class. Expenses before reductions do not reflect amounts reimbursed by the investment adviser or reductions from brokerage service arrangements or reductions from other expense offset arrangements and do not represent the amount paid by the class during periods when reimbursements or reductions occur. Expense ratios before reductions for start-up periods may not be representative of longer-term operating periods. Expenses net of fee waivers reflect expenses after reimbursement by the investment adviser but prior to reductions from brokerage service arrangements or other expense offset arrangements. Expenses net of all reductions represent the net expenses paid by the class.
See accompanying notes which are an integral part of the financial statements.
Annual Report
Notes to Financial Statements
For the period ended July 31, 2011
(Amounts in thousands except ratios)
1. Organization.
Fidelity OTC Portfolio (the Fund) is a non-diversified fund of Fidelity Securities Fund (the Trust) and is authorized to issue an unlimited number of shares. The Trust is registered under the Investment Company Act of 1940, as amended (the 1940 Act), as an open-end management investment company organized as a Massachusetts business trust. The Fund offers OTC shares and Class K shares, each of which has equal rights as to assets and voting privileges. Each class has exclusive voting rights with respect to matters that affect that class. Investment income, realized and unrealized capital gains and losses, the common expenses of the Fund, and certain fund-level expense reductions, if any, are allocated on a pro-rata basis to each class based on the relative net assets of each class to the total net assets of the Fund. Each class differs with respect to transfer agent fees incurred. Certain expense reductions may also differ by class.
2. Investments in Fidelity Central Funds.
The Fund invests in Fidelity Central Funds, which are open-end investment companies available only to other investment companies and accounts managed by Fidelity Management & Research Company (FMR) and its affiliates. The Fund's Schedule of Investments lists each of the Fidelity Central Funds held as of period end, if any, as an investment of the Fund, but does not include the underlying holdings of each Fidelity Central Fund. As an Investing Fund, the Fund indirectly bears its proportionate share of the expenses of the underlying Fidelity Central Funds.
The Money Market Central Funds seek preservation of capital and current income and are managed by Fidelity Investments Money Management, Inc. (FIMM), an affiliate of FMR.
A complete unaudited list of holdings for each Fidelity Central Fund is available upon request or at the Securities and Exchange Commission (the SEC) web site at www.sec.gov. In addition, the financial statements of the Fidelity Central Funds, which are not covered by the Fund's Report of Independent Registered Public Accounting Firm, are available on the SEC web site or upon request.
3. Significant Accounting Policies.
The financial statements have been prepared in conformity with accounting principles generally accepted in the United States of America (GAAP), which require management to make certain estimates and assumptions at the date of the financial statements. Actual results could differ from those estimates. Subsequent events, if any, through the date that the financial statements were issued have been evaluated in the preparation of the financial statements. The following summarizes the significant accounting policies of the Fund:
Annual Report
3. Significant Accounting Policies - continued
Security Valuation. Investments are valued as of 4:00 p.m. Eastern time on the last calendar day of the period. The Fund uses independent pricing services approved by the Board of Trustees to value its investments. When current market prices or quotations are not readily available or reliable, valuations may be determined in good faith in accordance with procedures adopted by the Board of Trustees. Factors used in determining value may include market or security specific events. The frequency with which these procedures are used cannot be predicted and they may be utilized to a significant extent. The value used for net asset value (NAV) calculation under these procedures may differ from published prices for the same securities.
The Fund categorizes the inputs to valuation techniques used to value its investments into a disclosure hierarchy consisting of three levels as shown below:
Level 1 - quoted prices in active markets for identical investments
Level 2 - other significant observable inputs (including quoted prices for similar investments, interest rates, prepayment speeds, etc.)
Level 3 - unobservable inputs (including the Fund's own assumptions based on the best information available)
Changes in valuation techniques may result in transfers in or out of an assigned level within the disclosure hierarchy. The aggregate value of investments by input level, as of July 31, 2011, as well as a roll forward of Level 3 securities, is included at the end of the Fund's Schedule of Investments. Valuation techniques used to value the Fund's investments by major category are as follows:
Equity securities, including restricted securities, for which market quotations are readily available, are valued at the last reported sale price or official closing price as reported by an independent pricing service on the primary market or exchange on which they are traded and are categorized as Level 1 in the hierarchy. In the event there were no sales during the day or closing prices are not available, securities are valued at the last quoted bid price or may be valued using the last available price and are generally categorized as Level 2 in the hierarchy. For foreign equity securities, when significant market or security specific events arise, comparisons to the valuation of American Depositary Receipts (ADRs), futures contracts, Exchange-traded funds (ETFs) and certain indexes as well as quoted prices for similar securities are used and are categorized as Level 2 in the hierarchy in these circumstances. Utilizing these techniques may result in transfers between Level 1 and Level 2. For restricted equity securities and private placements where observable inputs are limited, assumptions about market activity and risk are used and are categorized as Level 3 in the hierarchy.
Annual Report
Notes to Financial Statements - continued
(Amounts in thousands except ratios)
3. Significant Accounting Policies - continued
Security Valuation - continued
Investments in open-end mutual funds, including the Fidelity Central Funds, are valued at their closing net asset value each business day and are categorized as Level 1 in the hierarchy.
Foreign Currency. The Fund may use foreign currency contracts to facilitate transactions in foreign-denominated securities. Gains and losses from these transactions may arise from changes in the value of the foreign currency or if the counterparties do not perform under the contracts' terms.
Foreign-denominated assets, including investment securities, and liabilities are translated into U.S. dollars at the exchange rate at period end. Purchases and sales of investment securities, income and dividends received and expenses denominated in foreign currencies are translated into U.S. dollars at the exchange rate in effect on the transaction date.
The effects of exchange rate fluctuations on investments are included with the net realized and unrealized gain (loss) on investment securities. Other foreign currency transactions resulting in realized and unrealized gain (loss) are disclosed separately.
Investment Transactions and Income. For financial reporting purposes, the Fund's investment holdings and NAV include trades executed through the end of the last business day of the period. The NAV per share for processing shareholder transactions is calculated as of the close of business of the New York Stock Exchange (NYSE), normally 4:00 p.m. Eastern time and includes trades executed through the end of the prior business day. Gains and losses on securities sold are determined on the basis of identified cost and may include proceeds received from litigation. Dividend income is recorded on the ex-dividend date, except for certain dividends from foreign securities where the ex-dividend date may have passed, which are recorded as soon as the Fund is informed of the ex-dividend date. Non-cash dividends included in dividend income, if any, are recorded at the fair market value of the securities received. Distributions received on securities that represent a return of capital or capital gain are recorded as a reduction of cost of investments and/or as a realized gain. The Fund estimates the components of distributions received that may be considered return of capital distributions or capital gain distributions. Interest income and distributions from the Fidelity Central Funds are accrued as earned. Interest income includes coupon interest and amortization of premium and accretion of discount on debt securities. Investment income is recorded net of foreign taxes withheld where recovery of such taxes is uncertain.
Expenses. Expenses directly attributable to a fund are charged to that fund. Expenses attributable to more than one fund are allocated among the respective funds on the basis
Annual Report
3. Significant Accounting Policies - continued
Expenses - continued
of relative net assets or other appropriate methods. Expense estimates are accrued in the period to which they relate and adjustments are made when actual amounts are known.
Deferred Trustee Compensation. Under a Deferred Compensation Plan (the Plan), independent Trustees may elect to defer receipt of a portion of their annual compensation. Deferred amounts are invested in a cross-section of Fidelity funds, are marked-to-market and remain in the Fund until distributed in accordance with the Plan. The investment of deferred amounts and the offsetting payable to the Trustees are included in the accompanying Statement of Assets and Liabilities.
Income Tax Information and Distributions to Shareholders. Each year, the Fund intends to qualify as a regulated investment company, including distributing substantially all of its taxable income and realized gains under Subchapter M of the Internal Revenue Code and filing its U.S. federal tax return. As a result, no provision for income taxes is required. As of July 31, 2011, the Fund did not have any unrecognized tax benefits in the financial statements. A fund's federal tax return is subject to examination by the Internal Revenue Service (IRS) for a period of three years. Foreign taxes are provided for based on the Fund's understanding of the tax rules and rates that exist in the foreign markets in which it invests.
Distributions are declared and recorded on the ex-dividend date. Income dividends and capital gain distributions are declared separately for each class. Income and capital gain distributions are determined in accordance with income tax regulations, which may differ from GAAP.
Capital accounts within the financial statements are adjusted for permanent book-tax differences. These adjustments have no impact on net assets or the results of operations. Temporary book-tax differences will reverse in a subsequent period.
Book-tax differences are primarily due to foreign currency transactions, deferred trustees compensation, net operating losses, capital loss carryforwards, expiring capital loss carryforwards, and losses deferred due to wash sales.
The federal tax cost of investment securities and unrealized appreciation (depreciation) as of period end were as follows:
Gross unrealized appreciation | $ 1,274,844 |
Gross unrealized depreciation | (400,727) |
Net unrealized appreciation (depreciation) on securities and other investments | $ 874,117 |
| |
Tax Cost | $ 7,290,067 |
Annual Report
Notes to Financial Statements - continued
(Amounts in thousands except ratios)
3. Significant Accounting Policies - continued
Income Tax Information and Distributions to Shareholders - continued
The tax-based components of distributable earnings as of period end were as follows:
Capital loss carryforward | $ (401,153) |
Net unrealized appreciation (depreciation) | $ 874,089 |
Under the recently enacted Regulated Investment Company Modernization Act of 2010 (the Act), the Fund will be permitted to carry forward capital losses incurred in taxable years beginning after December 22, 2010 for an unlimited period. However, any losses incurred during those future taxable years will be required to be utilized prior to any losses incurred in pre-enactment taxable years, which generally expire after eight years from when they are incurred. Additionally, post-enactment capital losses that are carried forward will retain their character as either short-term or long-term capital losses rather than being considered all short-term as under previous law. The Fund's first fiscal year end subject to the Act will be July 31, 2012.
New Accounting Pronouncement. In May 2011, the Financial Accounting Standards Board issued Accounting Standard Update No. 2011-04, Fair Value Measurement (Topic 820) - Amendments to Achieve Common Fair Value Measurement and Disclosure Requirements in U.S. GAAP and IFRSs. The update changes the wording used to describe the requirements in GAAP for measuring fair value and for disclosing information about fair value measurements. The update is effective during interim and annual periods beginning after December 15, 2011. Management is currently evaluating the impact of the update's adoption on the Fund's financial statement disclosures.
4. Operating Policies.
Restricted Securities. The Fund may invest in securities that are subject to legal or contractual restrictions on resale. These securities generally may be resold in transactions exempt from registration or to the public if the securities are registered. Disposal of these securities may involve time-consuming negotiations and expense, and prompt sale at an acceptable price may be difficult. Information regarding restricted securities is included at the end of the Fund's Schedule of Investments.
5. Purchases and Sales of Investments.
Purchases and sales of securities, other than short-term securities, aggregated $11,063,120 and $11,195,626, respectively.
Annual Report
6. Fees and Other Transactions with Affiliates.
Management Fee. FMR and its affiliates provide the Fund with investment management related services for which the Fund pays a monthly management fee. The management fee is the sum of an individual fund fee rate that is based on an annual rate of .35% of the Fund's average net assets and a group fee rate that averaged .26% during the period. The group fee rate is based upon the average net assets of all the mutual funds advised by FMR. The group fee rate decreases as assets under management increase and increases as assets under management decrease. In addition, the management fee is subject to a performance adjustment (up to a maximum of ± .20% of the Fund's average net assets over a 36 month performance period). The upward or downward adjustment to the management fee is based on the relative investment performance of OTC as compared to an appropriate benchmark index. For the period, the total annual management fee rate, including the performance adjustment, was .71% of the Fund's average net assets.
Transfer Agent Fees. Fidelity Investments Institutional Operations Company, Inc. (FIIOC), an affiliate of FMR, is the transfer, dividend disbursing and shareholder servicing agent for each class of the Fund. FIIOC receives account fees and asset-based fees that vary according to the account size and type of account of the shareholders of OTC. FIIOC receives an asset-based fee of Class K's average net assets. FIIOC pays for typesetting, printing and mailing of shareholder reports, except proxy statements. For the period, transfer agent fees for each class were as follows:
| Amount | % of
Average
Net Assets |
OTC | $ 11,228 | .19 |
Class K | 622 | .05 |
| $ 11,850 | |
Accounting and Security Lending Fees. Fidelity Service Company, Inc. (FSC), an affiliate of FMR, maintains the Fund's accounting records. The accounting fee is based on the level of average net assets for the month. Under a separate contract, FSC administers the security lending program. The security lending fee is based on the number and duration of lending transactions.
Brokerage Commissions. The Fund placed a portion of its portfolio transactions with brokerage firms which are affiliates of the investment adviser. The commissions paid to these affiliated firms were $403 for the period.
Annual Report
Notes to Financial Statements - continued
(Amounts in thousands except ratios)
6. Fees and Other Transactions with Affiliates - continued
Interfund Lending Program. Pursuant to an Exemptive Order issued by the SEC, the Fund, along with other registered investment companies having management contracts with FMR, may participate in an interfund lending program. This program provides an alternative credit facility allowing the funds to borrow from, or lend money to, other participating affiliated funds. Any open loans, including accrued interest, at period end are presented under the caption "Notes Payable to Affiliates" in the Fund's Statement of Assets and Liabilities. The Fund's activity in this program during the period for which loans were outstanding was as follows:
Borrower or Lender | Average Daily
Loan Balance | Weighted Average Interest Rate | Interest
Expense |
Borrower | $ 14,976 | .40% | $ 21 |
7. Committed Line of Credit.
The Fund participates with other funds managed by FMR or an affiliate in a $4.0 billion credit facility (the "line of credit") to be utilized for temporary or emergency purposes to fund shareholder redemptions or for other short-term liquidity purposes. The Fund has agreed to pay commitment fees on its pro-rata portion of the line of credit, which amounted to $23 and is reflected in Miscellaneous expenses on the Statement of Operations. During the period, there were no borrowings on this line of credit.
8. Security Lending.
The Fund lends portfolio securities through a lending agent from time to time in order to earn additional income. The lending agent may loan securities to certain qualified borrowers, including Fidelity Capital Markets (FCM), a broker-dealer affiliated with the Fund. On the settlement date of the loan, the Fund receives collateral (in the form of U.S. Treasury obligations, letters of credit and/or cash) against the loaned securities and maintains collateral in an amount not less than 100% of the market value of the loaned securities during the period of the loan. The market value of the loaned securities is determined at the close of business of the Fund and any additional required collateral is delivered to the Fund on the next business day. If the borrower defaults on its obligation to return the securities loaned because of insolvency or other reasons, a fund could experience delays and costs in recovering the securities loaned or in gaining access to the collateral. Any cash collateral received is invested in the Fidelity Securities Lending Cash Central Fund. The value of loaned securities and cash collateral at period end are disclosed on the Fund's Statement of Assets and Liabilities. The value of securities loaned to FCM at period end was $14,321. Security lending income represents the income earned on investing cash collateral, less rebates paid to borrowers and lending agent fees associated with the loan, plus any premium payments received for lending certain types of securities. Security lending income is presented in the Statement of Operations as a component of income from Fidelity Central Funds, and includes $197 from securities loaned to FCM.
Annual Report
9. Bank Borrowings.
The Fund is permitted to have bank borrowings for temporary or emergency purposes to fund shareholder redemptions or for other short-term liquidity requirements. The Fund has established borrowing arrangements with certain banks. The interest rate on the borrowings is the bank's base rate, as revised from time to time. The average daily loan balance during the period for which loans were outstanding amounted to $19,977. The weighted average interest rate was .69%. The interest expense amounted to $1 under the bank borrowing program. At period end, there were no bank borrowings outstanding.
10. Expense Reductions.
Many of the brokers with whom FMR places trades on behalf of the Fund provided services to the Fund in addition to trade execution. These services included payments of certain expenses on behalf of the Fund totaling $833 for the period.
11. Share Transactions.
Transactions for each class of shares were as follows:
| Shares | Dollars |
Years ended July 31, | 2011 | 2010 A | 2011 | 2010 A |
OTC | | | | |
Shares sold | 24,641 | 27,879 | $ 1,408,789 | $ 1,242,349 |
Conversion to Class K | - | (520) | - | (20,492) |
Shares redeemed | (29,999) | (35,233) | (1,594,260) | (1,562,257) |
Net increase (decrease) | (5,358) | (7,874) | $ (185,471) | $ (340,400) |
Class K | | | | |
Shares sold | 7,657 | 11,838 | $ 426,960 | $ 538,757 |
Conversion from OTC | - | 518 | - | 20,492 |
Shares redeemed | (5,502) | (4,224) | (299,618) | (188,163) |
Net increase (decrease) | 2,155 | 8,132 | $ 127,342 | $ 371,086 |
A Conversion transactions for Class K and OTC are presented for the period August 1, 2009 through August 31, 2009.
12. Other.
The Fund's organizational documents provide former and current trustees and officers with a limited indemnification against liabilities arising in connection with the performance of their duties to the Fund. In the normal course of business, the Fund may also enter into contracts that provide general indemnifications. The Fund's maximum exposure under these arrangements is unknown as this would be dependent on future claims that may be made against the Fund. The risk of material loss from such claims is considered remote.
Annual Report
To the Trustees of Fidelity Securities Fund and Shareholders of Fidelity OTC Portfolio:
We have audited the accompanying statement of assets and liabilities of Fidelity OTC Portfolio (the Fund), a fund of Fidelity Securities Fund, including the schedule of investments, as of July 31, 2011, and the related statement of operations for the year then ended, the statement of changes in net assets for each of the two years in the period then ended, and the financial highlights for the periods presented. These financial statements and financial highlights are the responsibility of the Fund's management. Our responsibility is to express an opinion on these financial statements and financial highlights based on our audits.
We conducted our audits in accordance with the standards of the Public Company Accounting Oversight Board (United States). Those standards require that we plan and perform the audit to obtain reasonable assurance about whether the financial statements and financial highlights are free of material misstatement. The Fund is not required to have, nor were we engaged to perform, an audit of its internal control over financial reporting. Our audits included consideration of internal control over financial reporting as a basis for designing audit procedures that are appropriate in the circumstances, but not for the purpose of expressing an opinion on the effectiveness of the Fund's internal control over financial reporting. Accordingly, we express no such opinion. An audit also includes examining, on a test basis, evidence supporting the amounts and disclosures in the financial statements, assessing the accounting principles used and significant estimates made by management, as well as evaluating the overall financial statement presentation. Our procedures included confirmation of securities owned as of July 31, 2011, by correspondence with the custodians and brokers; where replies were not received from brokers, we performed other auditing procedures. We believe that our audits provide a reasonable basis for our opinion.
In our opinion, the financial statements and financial highlights referred to above present fairly, in all material respects, the financial position of Fidelity OTC Portfolio as of July 31, 2011, the results of its operations for the year then ended, the changes in its net assets for each of the two years in the period then ended, and the financial highlights for the periods presented, in conformity with accounting principles generally accepted in the United States of America.
/s/ Deloitte & Touche LLP
DELOITTE & TOUCHE LLP
Boston, Massachusetts
September 14, 2011
Annual Report
The Trustees, Members of the Advisory Board, and executive officers of the trust and fund, as applicable, are listed below. The Board of Trustees governs the fund and is responsible for protecting the interests of shareholders. The Trustees are experienced executives who meet periodically throughout the year to oversee the fund's activities, review contractual arrangements with companies that provide services to the fund, oversee management of the risks associated with such activities and contractual arrangements, and review the fund's performance. Except for James C. Curvey, each of the Trustees oversees 221 funds advised by FMR or an affiliate. Mr. Curvey oversees 419 funds advised by FMR or an affiliate.
The Trustees hold office without limit in time except that (a) any Trustee may resign; (b) any Trustee may be removed by written instrument, signed by at least two-thirds of the number of Trustees prior to such removal; (c) any Trustee who requests to be retired or who has become incapacitated by illness or injury may be retired by written instrument signed by a majority of the other Trustees; and (d) any Trustee may be removed at any special meeting of shareholders by a two-thirds vote of the outstanding voting securities of the trust. Each Trustee who is not an interested person (as defined in the 1940 Act) (Independent Trustee), shall retire not later than the last day of the calendar year in which his or her 75th birthday occurs. The Independent Trustees may waive this mandatory retirement age policy with respect to individual Trustees. The executive officers and Advisory Board Members hold office without limit in time, except that any officer and Advisory Board Member may resign or may be removed by a vote of a majority of the Trustees at any regular meeting or any special meeting of the Trustees. Except as indicated, each individual has held the office shown or other offices in the same company for the past five years.
Experience, Skills, Attributes, and Qualifications of the Fund's Trustees. The Governance and Nominating Committee has adopted a statement of policy that describes the experience, qualifications, attributes, and skills that are necessary and desirable for potential Independent Trustee candidates (Statement of Policy). The Board believes that each Trustee satisfied at the time he or she was initially elected or appointed a Trustee, and continues to satisfy, the standards contemplated by the Statement of Policy. The Governance and Nominating Committee also engages professional search firms to help identify potential Independent Trustee candidates who have the experience, qualifications, attributes, and skills consistent with the Statement of Policy. From time to time, additional criteria based on the composition and skills of the current Independent Trustees, as well as experience or skills that may be appropriate in light of future changes to board composition, business conditions, and regulatory or other developments, have also been considered by the professional search firms and the Governance and Nominating Committee. In addition, the Board takes into account the Trustees' commitment and participation in Board and committee meetings, as well as their leadership of standing and ad hoc committees throughout their tenure.
In determining that a particular Trustee was and continues to be qualified to serve as a Trustee, the Board has considered a variety of criteria, none of which, in isolation, was controlling. The Board believes that, collectively, the Trustees have balanced and diverse experience, qualifications, attributes, and skills, which allow the Board to operate effectively in governing the fund and protecting the interests of shareholders. Information about the specific experience, skills, attributes, and qualifications of each Trustee, which in each case led to the Board's conclusion that the Trustee should serve (or continue to serve) as a trustee of the fund, is provided below.
Annual Report
Board Structure and Oversight Function. James C. Curvey is an interested person (as defined in the 1940 Act) and currently serves as Acting Chairman. The Trustees have determined that an interested Chairman is appropriate and benefits shareholders because an interested Chairman has a personal and professional stake in the quality and continuity of services provided to the fund. Independent Trustees exercise their informed business judgment to appoint an individual of their choosing to serve as Chairman, regardless of whether the Trustee happens to be independent or a member of management. The Independent Trustees have determined that they can act independently and effectively without having an Independent Trustee serve as Chairman and that a key structural component for assuring that they are in a position to do so is for the Independent Trustees to constitute a substantial majority for the Board. The Independent Trustees also regularly meet in executive session. Ned C. Lautenbach serves as Chairman of the Independent Trustees and as such (i) acts as a liaison between the Independent Trustees and management with respect to matters important to the Independent Trustees and (ii) with management prepares agendas for Board meetings.
Fidelity funds are overseen by different Boards of Trustees. The fund's Board oversees Fidelity's equity and high income funds and another Board oversees Fidelity's investment-grade bond, money market, and asset allocation funds. The asset allocation funds may invest in Fidelity funds overseen by the fund's Board. The use of separate Boards, each with its own committee structure, allows the Trustees of each group of Fidelity funds to focus on the unique issues of the funds they oversee, including common research, investment, and operational issues. On occasion, the separate Boards establish joint committees to address issues of overlapping consequences for the Fidelity funds overseen by each Board.
The Trustees operate using a system of committees to facilitate the timely and efficient consideration of all matters of importance to the Trustees, the fund, and fund shareholders and to facilitate compliance with legal and regulatory requirements and oversight of the fund's activities and associated risks. The Board, acting through its committees, has charged FMR and its affiliates with (i) identifying events or circumstances the occurrence of which could have demonstrably adverse effects on the fund's business and/or reputation; (ii) implementing processes and controls to lessen the possibility that such events or circumstances occur or to mitigate the effects of such events or circumstances if they do occur; and (iii) creating and maintaining a system designed to evaluate continuously business and market conditions in order to facilitate the identification and implementation processes described in (i) and (ii) above. Because the day-to-day operations and activities of the fund are carried out by or through FMR, its affiliates and other service providers, the fund's exposure to risks is mitigated but not eliminated by the processes overseen by the Trustees. While each of the Board's committees has responsibility for overseeing different aspects of the fund's activities, oversight is exercised primarily through the Operations, Audit, and Compliance Committees. Appropriate personnel, including but not limited to the fund's Chief Compliance Officer (CCO), FMR's internal auditor, the independent accountants, the fund's Treasurer and portfolio management personnel, make periodic reports to the Board's committees, as appropriate. The responsibilities of each committee, including their oversight responsibilities, are described further under "Standing Committees of the Fund's Trustees."
Annual Report
Trustees and Officers - continued
The fund's Statement of Additional Information (SAI) includes more information about the Trustees. To request a free copy, call Fidelity at 1-800-835-5092.
Interested Trustees*:
Correspondence intended for each Trustee who is an interested person may be sent to Fidelity Investments, 82 Devonshire Street, Boston, Massachusetts 02109.
Name, Age; Principal Occupations and Other Relevant Experience+ |
James C. Curvey (76) |
| Year of Election or Appointment: 2007 Mr. Curvey is Trustee and Acting Chairman of the Board of Trustees of certain Trusts. Mr. Curvey also serves as Trustee (2007-present) of other investment companies advised by FMR. Mr. Curvey is a Director of Fidelity Investments Money Management, Inc. (2009-present), Director of Fidelity Research & Analysis Co. (2009-present) and Director of FMR and FMR Co., Inc. (2007-present). Mr. Curvey is also Vice Chairman (2007-present) and Director of FMR LLC. In addition, Mr. Curvey serves as an Overseer for the Boston Symphony Orchestra and a member of the Trustees of Villanova University. Previously, Mr. Curvey was the Vice Chairman (2006-2007) and Director (2000-2007) of FMR Corp. |
Ronald P. O'Hanley (54) |
| Year of Election or Appointment: 2011 Mr. O'Hanley is Director of FMR Co., Inc. (2010-present), Director of Fidelity Investments Money Management, Inc. (2010-present), Director of Fidelity Research & Analysis Company (2010-present), President of Fidelity Asset Management and Corporate Services and a member of Fidelity's Executive Committee (2010-present). Previously, Mr. O'Hanley served as President and Chief Executive Officer of BNY Mellon Asset Management (2007-2010). Mr. O'Hanley also served as Vice Chairman of Bank New York Mellon Corp. and a member of that firm's Executive Committee. Prior to the 2007 merger of The Bank of New York and Mellon Financial Corporation, he was Vice Chairman of Mellon Financial Corporation and President and Chief Executive Officer of Mellon Asset Management. He joined Mellon in February 1997. Mr. O'Hanley currently serves as Chairman of the Boston Public Library Foundation Board of Directors and sits on the Board of Directors of Beth Israel Deaconess Medical Center, the Board of Trustees of the Marine Biological Laboratory and the Advisory Board of the Maxwell School of Citizenship and Public Administration at Syracuse University. Mr. O'Hanley also chairs the Council on Asset Management for the Financial Services Roundtable and is a member of the Board of Directors of Institutional Investor's U.S. Institute. |
* Trustees have been determined to be "Interested Trustees" by virtue of, among other things, their affiliation with the trust or various entities under common control with FMR.
+ The information above includes each Trustee's principal occupation during the last five years and other information relating to the experience, attributes, and skills relevant to each Trustee's qualifications to serve as a Trustee, which led to the conclusion that each Trustee should serve as a Trustee for the fund.
Annual Report
Trustees and Officers - continued
Independent Trustees:
Correspondence intended for each Independent Trustee (that is, the Trustees other than the Interested Trustees) may be sent to Fidelity Investments, P.O. Box 55235, Boston, Massachusetts 02205-5235.
Name, Age; Principal Occupations and Other Relevant Experience+ |
Dennis J. Dirks (63) |
| Year of Election or Appointment: 2005 Prior to his retirement in May 2003, Mr. Dirks was Chief Operating Officer and a member of the Board of The Depository Trust & Clearing Corporation (DTCC). He also served as President, Chief Operating Officer, and Board member of The Depository Trust Company (DTC) and President and Board member of the National Securities Clearing Corporation (NSCC). In addition, Mr. Dirks served as Chief Executive Officer and Board member of the Government Securities Clearing Corporation, Chief Executive Officer and Board member of the Mortgage-Backed Securities Clearing Corporation, as a Trustee and a member of the Finance Committee of Manhattan College (2005-2008), and as a Trustee and a member of the Finance Committee of AHRC of Nassau County (2006-2008). Mr. Dirks is a member of the Independent Directors Council (IDC) Governing Council (2010-Present) and Board of Directors for The Brookville Center for Children's Services, Inc. (2009-present). |
Alan J. Lacy (57) |
| Year of Election or Appointment: 2008 Mr. Lacy serves as Senior Adviser (2007-present) of Oak Hill Capital Partners, L.P. (private equity). Mr. Lacy also served as Chief Executive Officer (2000-2005) and Vice Chairman (2005-2006) of Sears Holdings Corporation and Sears, Roebuck and Co. (retail). In addition, Mr. Lacy serves as a member of the Board of Directors of Dave & Buster's, Inc. (restaurant and entertainment complexes, 2010-present), The Hillman Companies, Inc. (hardware wholesalers, 2010-present), and Bristol-Myers Squibb Company (global pharmaceuticals, 2007-present). Mr. Lacy is a member of the Board of Trustees of The National Parks Conservation Association (2006-Present). Previously, Mr. Lacy served as Chairman of the Board of Trustees of the National Parks Conservation Association (2008-2011) and as a member of the Board of Directors for the Western Union Company (global money transfer, 2006-2011). |
Ned C. Lautenbach (67) |
| Year of Election or Appointment: 2000 Mr. Lautenbach is Chairman of the Independent Trustees of the Equity and High Income Funds (2006-present). Mr. Lautenbach currently serves as the Lead Director of the Eaton Corporation Board of Directors (diversified industrial, 1997-present). Mr. Lautenbach is also a member of the Board of Directors of the Philharmonic Center for the Arts in Naples, Florida (1999-present); a member of the Board of Trustees of Fairfield University (2005-present); and a member of the Council on Foreign Relations (1994-present). Previously, Mr. Lautenbach was a Partner/Advisory Partner at Clayton, Dubilier & Rice, LLC (private equity investment, 1998-2010), as well as a Director of Sony Corporation (2006-2007). |
Joseph Mauriello (66) |
| Year of Election or Appointment: 2008 Prior to his retirement in January 2006, Mr. Mauriello served in numerous senior management positions including Deputy Chairman and Chief Operating Officer (2004-2005), and Vice Chairman of Financial Services (2002-2004) of KPMG LLP US (professional services, 1965-2005). Mr. Mauriello currently serves as a member of the Board of Directors of XL Group plc. (global insurance and re-insurance, 2006-present) and of Arcadia Resources Inc. (health care services and products, 2007-present). Previously, Mr. Mauriello served as a Director of the Hamilton Funds of the Bank of New York (2006-2007). |
Robert W. Selander (60) |
| Year of Election or Appointment: 2011 Previously, Mr. Selander served as a Member of the Advisory Board of Fidelity's Equity and High Income Funds (2011), Executive Vice Chairman (2010), Chief Executive Officer (2009-2010), and President and Chief Executive Officer (1997-2009) of Mastercard, Inc. |
Cornelia M. Small (67) |
| Year of Election or Appointment: 2005 Ms. Small is a member of the Board of Directors of the Teagle Foundation (2009-present). Ms. Small is also a member of the Investment Committee, and Chair (2008-present) and a member of the Board of Trustees of Smith College. In addition, Ms. Small serves on the Investment Committee of the Berkshire Taconic Community Foundation (2008-present). Previously, Ms. Small served as Chairperson of the Investment Committee (2002-2008) of Smith College. In addition, Ms. Small served as Chief Investment Officer, Director of Global Equity Investments, and a member of the Board of Directors of Scudder, Stevens & Clark and Scudder Kemper Investments. |
William S. Stavropoulos (72) |
| Year of Election or Appointment: 2002 Mr. Stavropoulos is Vice Chairman of the Independent Trustees of the Equity and High Income Funds (2006-present). Mr. Stavropoulos serves as President and Founder of the Michigan Baseball Foundation, the Great Lakes Loons (2007-present). Mr. Stavropoulos is Chairman Emeritus of the Board of Directors of The Dow Chemical Company, where he previously served in numerous senior management positions, including President, CEO (1995-2000; 2002-2004), Chairman of the Executive Committee (2000-2006), and as a member of the Board of Directors (1990-2006). Currently, Mr. Stavropoulos is Chairman of Univar (global distributor of commodity and specialty chemicals, 2010-present), a Director of Teradata Corporation (data warehousing and technology solutions, 2008-present), Chemical Financial Corporation, Maersk Inc. (industrial conglomerate), Tyco International, Inc. (multinational manufacturing and services, 2007-present), and a member of the Advisory Board for Metalmark Capital (private equity investment, 2005-present). Mr. Stavropoulos is a special advisor to Clayton, Dubilier & Rice, LLC (private equity investment). In addition, Mr. Stavropoulos is a member of the University of Notre Dame Advisory Council for the College of Science. |
David M. Thomas (62) |
| Year of Election or Appointment: 2008 Previously, Mr. Thomas served as Executive Chairman (2005-2006) and Chairman and Chief Executive Officer (2000-2005) of IMS Health, Inc. (pharmaceutical and healthcare information solutions). In addition, Mr. Thomas serves as a member of the Board of Directors of Fortune Brands, Inc. (consumer products), and Interpublic Group of Companies, Inc. (marketing communication, 2004-present). |
Michael E. Wiley (60) |
| Year of Election or Appointment: 2008 Mr. Wiley also serves as a Director of Asia Pacific Exploration Consolidated (international oil and gas exploration and production, 2008-present). Mr. Wiley serves as a Director of Tesoro Corporation (independent oil refiner and marketer, 2005-present), and a Director of Bill Barrett Corporation (exploration and production, 2005-present). In addition, Mr. Wiley also serves as a Director of Post Oak Bank (privately-held bank, 2004-present). Previously, Mr. Wiley served as a member of the Board of Trustees of the University of Tulsa (2000-2006; 2007-2010), as a Senior Energy Advisor of Katzenbach Partners, LLC (consulting, 2006-2007), as an Advisory Director of Riverstone Holdings (private investment), Chairman, President, and CEO of Baker Hughes, Inc. (oilfield services, 2000-2004), and as Director of Spinnaker Exploration Company (exploration and production, 2001-2005). |
Annual Report
+ The information above includes each Trustee's principal occupation during the last five years and other information relating to the experience, attributes, and skills relevant to each Trustee's qualifications to serve as a Trustee, which led to the conclusion that each Trustee should serve as a Trustee for the fund.
Advisory Board Members and Executive Officers:
Correspondence intended for each executive officer, Edward C. Johnson 3d, and Peter S. Lynch may be sent to Fidelity Investments, 82 Devonshire Street, Boston, Massachusetts 02109.
Name, Age; Principal Occupation |
Edward C. Johnson 3d (81) |
| Year of Election or Appointment: 2011 Member of the Advisory Board of Fidelity's Equity and High Income Funds. Mr. Johnson serves as Chief Executive Officer, Chairman, and a Director of FMR LLC, and also serves as Chairman and Director of FIL Limited. Previously, Mr. Johnson served as a Trustee and Chairman of the Board of certain Fidelity Trusts, Chairman and a Director of FMR, Chairman and a Director of FMR Co., Inc., and President of FMR LLC (2006-2007). |
Peter S. Lynch (67) |
| Year of Election or Appointment: 2003 Member of the Advisory Board of Fidelity's Equity and High Income Funds. Mr. Lynch is Vice Chairman and a Director of FMR and FMR Co., Inc. In addition, Mr. Lynch serves as a Trustee of Boston College and as the Chairman of the Inner-City Scholarship Fund. Previously, Mr. Lynch served on the Special Olympics International Board of Directors (1997-2006). |
Kenneth B. Robins (41) |
| Year of Election or Appointment: 2008 President and Treasurer of Fidelity's Equity and High Income Funds. Mr. Robins also serves as President and Treasurer (2010-present) and Assistant Treasurer (2009-present) of other Fidelity funds and is an employee of Fidelity Investments (2004-present). Previously, Mr. Robins served as Deputy Treasurer of the Fidelity funds (2005-2008) and Treasurer and Chief Financial Officer of The North Carolina Capital Management Trust: Cash and Term Portfolios (2006-2008). |
Bruce T. Herring (45) |
| Year of Election or Appointment: 2006 Vice President of certain Equity Funds. Mr. Herring also serves as Chief Investment Officer and Director of Fidelity Management & Research (U.K.) Inc. (2010-present) and Group Chief Investments Officer of FMR. Previously, Mr. Herring served as Vice President (2005-2006) and Senior Vice President (2006-2007) of Fidelity Management & Research Company, Vice President of FMR Co., Inc. (2001-2007) and as a portfolio manager for Fidelity U.S. Equity Funds. |
Brian B. Hogan (46) |
| Year of Election or Appointment: 2009 Vice President of Equity and High Income Funds. Mr. Hogan also serves as President of FMR's Equity Division (2009-present). Previously, Mr. Hogan served as Senior Vice President, Equity Research of FMR (2006-2009) and as a portfolio manager. |
Scott C. Goebel (43) |
| Year of Election or Appointment: 2008 Secretary and Chief Legal Officer (CLO) of the Fidelity funds. Mr. Goebel also serves as Secretary of Fidelity Investments Money Management, Inc. (FIMM) (2010-present) and Fidelity Research and Analysis Company (FRAC) (2010-present); Secretary and CLO of The North Carolina Capital Management Trust: Cash and Term Portfolios (2008-present); General Counsel, Secretary, and Senior Vice President of FMR (2008-present) and FMR Co., Inc. (2008-present); employed by FMR LLC or an affiliate (2001-present); Chief Legal Officer of Fidelity Management & Research (Hong Kong) Limited (2008-present) and Assistant Secretary of Fidelity Management & Research (Japan) Inc. (2008-present), and Fidelity Management & Research (U.K.) Inc. (2008-present). Previously, Mr. Goebel served as Assistant Secretary of FIMM (2008-2010), FRAC (2008-2010), and the Funds (2007-2008) and as Vice President and Secretary of Fidelity Distributors Corporation (FDC) (2005-2007). |
William C. Coffey (42) |
| Year of Election or Appointment: 2009 Assistant Secretary of Fidelity's Equity and High Income Funds. Mr. Coffey also serves as Senior Vice President and Deputy General Counsel of FMR LLC (2010-present), and is an employee of Fidelity Investments. Previously, Mr. Coffey served as Vice President and Associate General Counsel of FMR LLC (2005-2009). |
Holly C. Laurent (57) |
| Year of Election or Appointment: 2008 Anti-Money Laundering (AML) Officer of the Fidelity funds. Ms. Laurent also serves as AML Officer of The North Carolina Capital Management Trust: Cash and Term Portfolios (2008-present) and is an employee of Fidelity Investments. Previously, Ms. Laurent was Senior Vice President and Head of Legal for Fidelity Business Services India Pvt. Ltd. (2006-2008), and Senior Vice President, Deputy General Counsel and Group Head for FMR LLC (2005-2006). |
Christine Reynolds (52) |
| Year of Election or Appointment: 2008 Chief Financial Officer of the Fidelity funds. Ms. Reynolds became President of Fidelity Pricing and Cash Management Services (FPCMS) in August 2008. Ms. Reynolds served as Chief Operating Officer of FPCMS (2007-2008). Previously, Ms. Reynolds served as President, Treasurer, and Anti-Money Laundering officer of the Fidelity funds (2004-2007). |
Kenneth A. Rathgeber (64) |
| Year of Election or Appointment: 2004 Chief Compliance Officer of Fidelity's Equity and High Income Funds. Mr. Rathgeber is Chief Compliance Officer of Fidelity Management & Research (Hong Kong) Limited (2008-present), Fidelity Management & Research (Japan) Inc. (2008-present), FMR (2005-present), FMR Co., Inc. (2005-present), Fidelity Management & Research (U.K.) Inc. (2005-present), Fidelity Research & Analysis Company (2005-present), Fidelity Investments Money Management, Inc. (2005-present), Pyramis Global Advisors, LLC (2005-present), and Strategic Advisers, Inc. (2005-present). |
Jeffrey S. Christian (49) |
| Year of Election or Appointment: 2009 Deputy Treasurer of the Fidelity funds. Mr. Christian is an employee of Fidelity Investments. Previously, Mr. Christian served as Chief Financial Officer (2008-2009) of certain Fidelity funds and Senior Vice President of Fidelity Pricing and Cash Management Services (FPCMS) (2004-2009). |
Bryan A. Mehrmann (50) |
| Year of Election or Appointment: 2005 Deputy Treasurer of the Fidelity funds. Mr. Mehrmann is an employee of Fidelity Investments. |
Adrien E. Deberghes (43) |
| Year of Election or Appointment: 2008 Deputy Treasurer of Fidelity's Equity and High Income Funds. Mr. Deberghes also serves as Assistant Treasurer of other Fidelity funds (2010-present) and is an employee of Fidelity Investments (2008-present). Previously, Mr. Deberghes served as Senior Vice President of Mutual Fund Administration at State Street Corporation (2007-2008), Senior Director of Mutual Fund Administration at Investors Bank & Trust (2005-2007), and Director of Finance for Dunkin' Brands (2000-2005). |
Stephanie J. Dorsey (42) |
| Year of Election or Appointment: 2010 Assistant Treasurer of Fidelity's Equity and High Income Funds. Ms. Dorsey also serves as Deputy Treasurer of other Fidelity funds (2008-present) and is an employee of Fidelity Investments (2008-present). Previously, Ms. Dorsey served as Treasurer (2004-2008) of the JPMorgan Mutual Funds and Vice President (2004-2008) of JPMorgan Chase Bank. |
John R. Hebble (53) |
| Year of Election or Appointment: 2009 Assistant Treasurer of Fidelity's Equity and High Income Funds. Mr. Hebble also serves as Treasurer and Chief Financial Officer of The North Carolina Capital Management Trust: Cash and Term Portfolios (2008-present), President and Treasurer of other Fidelity funds (2008-present) and is an employee of Fidelity Investments. |
Gary W. Ryan (52) |
| Year of Election or Appointment: 2005 Assistant Treasurer of the Fidelity funds. Mr. Ryan is an employee of Fidelity Investments. Previously, Mr. Ryan served as Vice President of Fund Reporting in Fidelity Pricing and Cash Management Services (FPCMS) (1999-2005). |
Jonathan Davis (43) |
| Year of Election or Appointment: 2010 Assistant Treasurer of the Fidelity funds. Mr. Davis is an employee of Fidelity Investments. Previously, Mr. Davis served as Vice President and Associate General Counsel of FMR LLC (2003-2010). |
Annual Report
Board Approval of Investment Advisory Contracts and Management Fees
Fidelity OTC Portfolio
Each year, the Board of Trustees, including the Independent Trustees (together, the Board), votes on the renewal of the management contract and sub-advisory agreements (together, the Advisory Contracts) for the fund. The Board, assisted by the advice of fund counsel and Independent Trustees' counsel, requests and considers a broad range of information relevant to the renewal of the Advisory Contracts throughout the year.
The Board meets regularly and considers at each of its meetings factors that are relevant to its annual consideration of the renewal of the fund's Advisory Contracts, including the services and support provided to the fund and its shareholders. The Board has established various standing committees, each composed of Independent Trustees with varying backgrounds, to which the Board has assigned specific subject matter responsibilities in order to enhance effective decision-making by the Board. The Board, acting directly and through its Committees, requests and receives information concerning the annual consideration of the renewal of the fund's Advisory Contracts. The Board also meets as needed to consider matters specifically related to the Board's annual consideration of the renewal of Advisory Contracts. Members of the Board may also meet with trustees of other Fidelity funds through ad hoc joint committees to discuss certain matters relevant to the Fidelity funds.
At its July 2011 meeting, the Board of Trustees, including the Independent Trustees, unanimously determined to renew the fund's Advisory Contracts. In reaching its determination, the Board considered all factors it believed relevant, including (i) the nature, extent, and quality of the services to be provided to the fund and its shareholders (including the investment performance of the fund); (ii) the competitiveness of the fund's management fee and total expense ratio; (iii) the total costs of the services to be provided by and the profits to be realized by Fidelity from its relationship with the fund; (iv) the extent to which economies of scale would be realized as the fund grows; and (v) whether fee levels reflect these economies of scale, if any, for the benefit of fund shareholders.
In considering whether to renew the Advisory Contracts for the fund, the Board reached a determination, with the assistance of fund counsel and Independent Trustees' counsel and through the exercise of its business judgment, that the renewal of the Advisory Contracts is in the best interests of the fund and its shareholders and that the compensation payable under the Advisory Contracts is fair and reasonable. The Board's decision to renew the Advisory Contracts was not based on any single factor, but rather was based on a comprehensive consideration of all the information provided to the Board at its meetings throughout the year. The Board, in reaching its determination to renew the Advisory Contracts, is aware that shareholders in the fund have a broad range of investment choices available to them, including a wide choice among mutual funds offered by Fidelity's competitors, and that the fund's shareholders, who have the opportunity to review and weigh the disclosure provided by the fund in its prospectus and other public disclosures, have chosen to invest in this fund, managed by Fidelity.
Annual Report
Board Approval of Investment Advisory Contracts and
Management Fees - continued
Nature, Extent, and Quality of Services Provided. The Board considered the staffing within the investment adviser, FMR, and the sub-advisers (together, the Investment Advisers), including the backgrounds of the fund's investment personnel and the fund's investment objective and discipline. The Independent Trustees also had discussions with senior management of Fidelity's investment operations and investment groups. The Board considered the structure of the portfolio manager compensation program and whether this structure provides appropriate incentives to act in the best interests of the fund.
Resources Dedicated to Investment Management and Support Services. The Board and the Fund Oversight and Research Committees reviewed the general qualifications and capabilities of the Investment Advisers' investment staff, including its size, education, experience, and resources, as well as the Investment Advisers' approach to recruiting, training, managing, and compensating investment personnel. The Board also noted that FMR has devoted increased resources to non-U.S. offices. The Board noted that Fidelity's analysts have extensive resources, tools and capabilities which allow them to conduct sophisticated quantitative and fundamental analysis, as well as credit analysis of issuers, counterparties and enhancers. The Board also believes that Fidelity's investment professionals have sufficient access to global information and data so as to provide competitive investment results over time, and that those professionals also have access to sophisticated tools which permit them to assess portfolio construction and risk and performance attribution characteristics continuously, as well as to transmit new information and research conclusions rapidly around the world. Additionally, in their deliberations, the Board considered the Investment Advisers' trading capabilities and resources which are an integral part of the investment management process.
Shareholder and Administrative Services. The Board considered (i) the nature, extent, quality, and cost of advisory, administrative, and shareholder services performed by the Investment Advisers and their affiliates under the Advisory Contracts and under separate agreements covering transfer agency, pricing and bookkeeping, and securities lending services for the fund; (ii) the nature and extent of the investment adviser's supervision of third party service providers, principally custodians and subcustodians; and (iii) the resources devoted to, and the record of compliance with, the fund's compliance policies and procedures. The Board also reviewed the allocation of fund brokerage, including allocations to brokers affiliated with the Investment Advisers, the use of brokerage commissions to pay fund expenses, and the use of "soft" commission dollars to pay for research services.
The Board noted that the growth of fund assets over time across the complex allows Fidelity to reinvest in the development of services designed to enhance the value or convenience of the Fidelity funds as investment vehicles. These services include 24-hour access to account information and market information through telephone representatives and over the Internet, investor education materials and asset allocation tools, and the expanded availability of Fidelity Investor Centers, with 35 new branches opening since 2010.
Annual Report
Investment in a Large Fund Family. The Board considered the benefits to shareholders of investing in a Fidelity fund, including the benefits of investing in a fund that is part of a large family of funds offering a variety of investment disciplines and providing a large variety of mutual fund investor services. The Board noted that Fidelity had taken, or had made recommendations that resulted in the Fidelity funds taking, a number of actions over the previous year that benefited particular funds, including (i) continuing to dedicate additional resources to investment research and support of the senior management team that oversees asset management; (ii) rationalizing product lines through the mergers of six funds into other funds; (iii) continuing to migrate the Freedom Funds to dedicated lower cost underlying funds; (iv) obtaining shareholder approval to broaden the investment strategies for Fidelity Consumer Finance Portfolio, Fidelity Emerging Asia Fund, and Fidelity Environment and Alternative Energy Portfolio; (v) contractually agreeing to reduce the management fees and impose other expense limitations on Spartan® 500 Index Fund and U.S. Bond Index Fund in connection with launching new institutional classes of these funds; (vi) changing the name, primary and supplemental benchmarks, and investment policies of Fidelity Global Strategies Fund to support the fund's flexible investment mandate and global orientation; and (vii) reducing the transfer agency account fee rates on certain accounts.
Investment Performance. The Board considered whether the fund has operated in accordance with its investment objective, as well as its record of compliance with its investment restrictions. It also reviewed the fund's absolute investment performance for each class, as well as the fund's relative investment performance for each class measured over multiple periods against a broad-based securities market index. The Board noted that FMR does not believe that a meaningful peer group exists against which to compare the fund's performance. The following charts considered by the Board show, over the one-, three-, and five-year periods ended December 31, 2010, as available, the cumulative total returns of Class K and the retail class of the fund and the cumulative total returns of a broad-based securities market index ("benchmark").
Annual Report
Board Approval of Investment Advisory Contracts and
Management Fees - continued
Fidelity OTC Portfolio

The Board noted that the investment performance of the retail class of the fund (the class with the longer performance record) compared favorably to its benchmark for all the periods shown. The Board considered that the variations in performance between the fund's classes reflect the variation in class expenses, which result in lower performance for the higher expense class. The Board also reviewed the fund's performance since inception as well as performance in the current year.
The Board also considered that the fund's management fee is subject to upward or downward adjustment depending upon whether, and to what extent, the fund's investment performance for the performance period exceeds, or is exceeded by, the record (over the same period) of a Board-approved performance adjustment index. The Board noted that the performance adjustment provides FMR with a strong economic incentive to seek to achieve superior performance for the fund's shareholders and helps to more closely align the interests of FMR and the fund's shareholders.
Based on its review, the Board concluded that the nature, extent, and quality of services provided to the fund under the Advisory Contracts should benefit the fund's shareholders.
Competitiveness of Management Fee and Total Expense Ratio. The Board considered the fund's management fee and total expense ratio compared to "mapped groups" of competitive funds and classes. Fidelity creates "mapped groups" by combining similar Lipper investment objective categories that have comparable management fee characteristics. Combining Lipper investment objective categories aids the Board's management fee and total expense ratio comparisons by broadening the competitive group used for comparison and by reducing the number of universes to which various Fidelity funds are compared.
Annual Report
Management Fee. The Board considered two proprietary management fee comparisons for the 12-month periods shown in the chart below. The group of Lipper funds used by the Board for management fee comparisons is referred to below as the "Total Mapped Group." The Total Mapped Group comparison focuses on a fund's standing relative to the total universe of comparable funds available to investors in terms of gross management fees before expense reimbursements or caps, and without giving effect to the fund's performance adjustment. "TMG %" represents the percentage of funds in the Total Mapped Group that had management fees that were lower than the fund's. For example, a TMG % of 17% means that 83% of the funds in the Total Mapped Group had higher management fees than the fund. The "Asset-Size Peer Group" (ASPG) comparison focuses on a fund's standing relative to non-Fidelity funds similar in size to the fund within the Total Mapped Group. The ASPG represents at least 15% of the funds in the Total Mapped Group with comparable asset size and management fee characteristics, subject to a minimum of 50 funds (or all funds in the Total Mapped Group if fewer than 50). Additional information, such as the ASPG quartile in which the fund's management fee ranked and the impact of the fund's performance adjustment, is also included in the chart and considered by the Board.
Fidelity OTC Portfolio
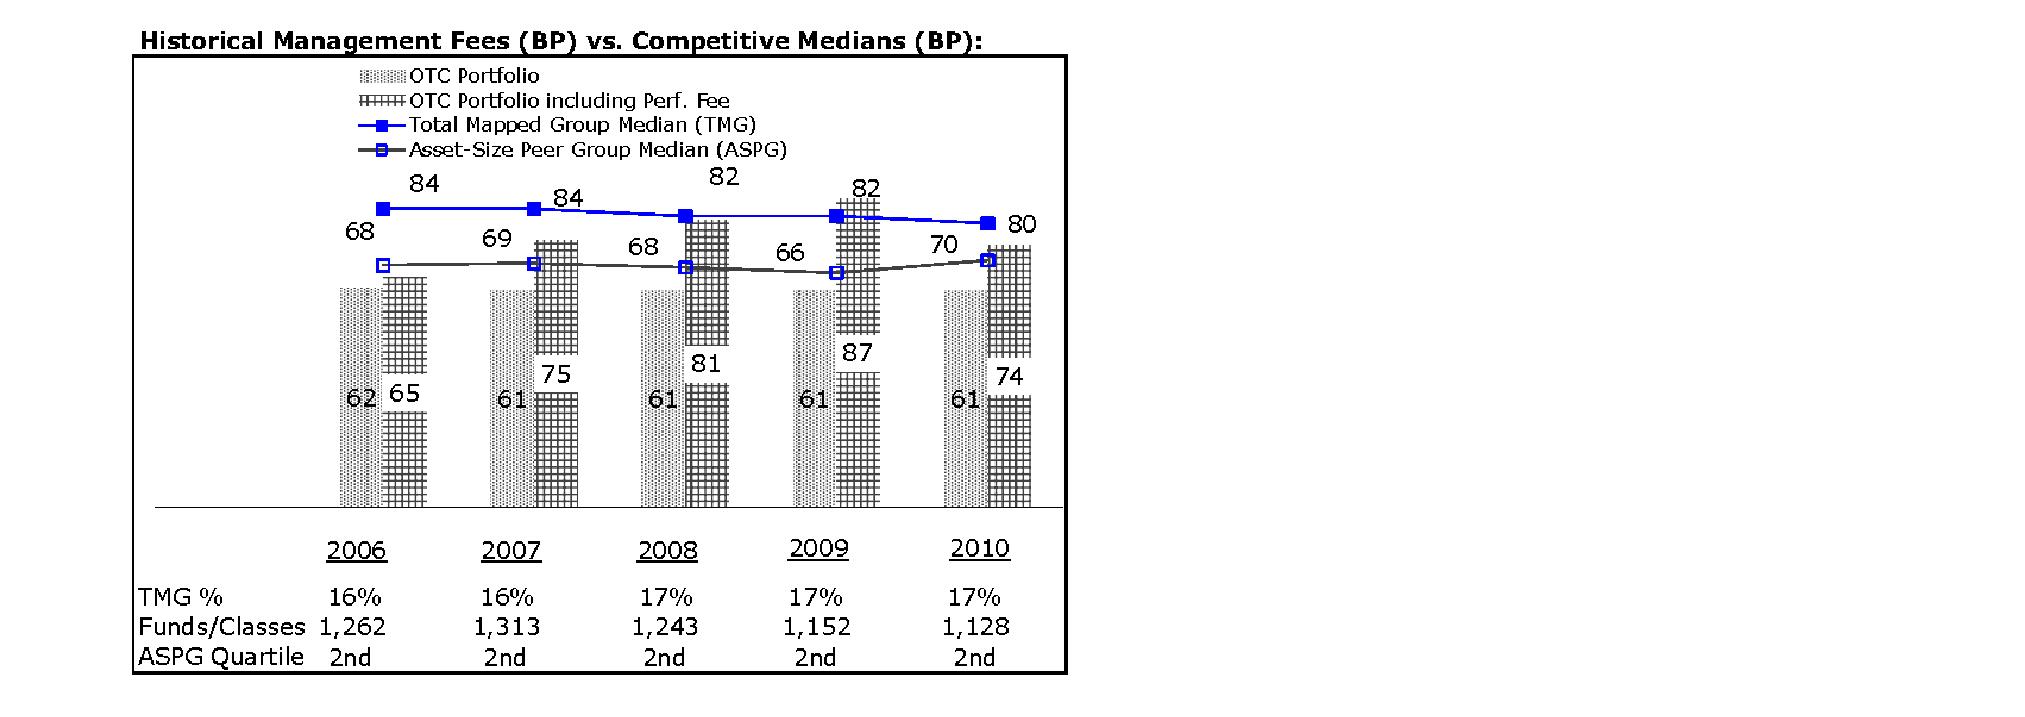
The Board noted that the fund's management fee ranked below the median of its Total Mapped Group and below the median of its ASPG for 2010. The Board also noted the effect of the fund's positive performance adjustment on the fund's management fee ranking. The Board noted that the performance adjustment for each year represents calculations for performance periods that differ from the periods shown in the performance charts above.
Annual Report
Board Approval of Investment Advisory Contracts and
Management Fees - continued
Based on its review, the Board concluded that the fund's management fee is fair and reasonable in light of the services that the fund receives and the other factors considered.
Total Expense Ratio. In its review of each class's total expense ratio, the Board considered the fund's management fee as well as other fund or class expenses, as applicable, such as transfer agent fees, pricing and bookkeeping fees, and custodial, legal, and audit fees. The Board also noted the effects of any waivers and reimbursements on fees and expenses, as well as the impact of the fund's performance adjustment. As part of its review, the Board also considered the current and historical total expense ratios of each class of the fund compared to competitive fund median expenses. Each class of the fund is compared to those funds and classes in the Total Mapped Group (used by the Board for management fee comparisons) that have a similar sales load structure.
The Board noted that the total expense ratio of each class ranked below its competitive median for 2010. The Board considered that various factors, including 12b-1 fees, positive or negative performance adjustments, and relatively higher other expenses in the case of small fund size, can affect total expense ratios.
Fees Charged to Other Fidelity Clients. The Board also considered Fidelity fee structures and other information with respect to clients of FMR and its affiliates, such as other mutual funds advised or subadvised by FMR or its affiliates, pension plan clients, and other institutional clients. In March 2010, the Board created an ad hoc joint committee with the board of other Fidelity funds (the Committee) to review and compare Fidelity's institutional investment advisory business with its business of providing services to the Fidelity funds, including the differences in services provided, fees charged, and costs incurred, as well as competition in their respective marketplaces.
Based on its review of total expense ratios and fees charged to other Fidelity clients, the Board concluded that the total expense ratio of each class of the fund was reasonable in light of the services that the fund and its shareholders receive and the other factors considered, including the findings of the Committee.
Costs of the Services and Profitability. The Board considered the revenues earned and the expenses incurred by Fidelity in conducting the business of developing, marketing, distributing, managing, administering and servicing the fund and its shareholders. The Board also considered the level of Fidelity's profits in respect of all the Fidelity funds.
On an annual basis, FMR presents to the Board Fidelity's profitability for the fund. Fidelity calculates the profitability for each fund, as well as aggregate profitability for groups of Fidelity funds and all Fidelity funds, using a series of detailed revenue and cost allocation methodologies which originate with the books and records of Fidelity on which Fidelity's audited financial statements are based. The Audit Committee of the Board reviews any significant changes from the prior year's methodologies.
Annual Report
PricewaterhouseCoopers LLP (PwC), independent registered public accounting firm and auditor to Fidelity and certain Fidelity funds, has been engaged annually by the Board as part of the Board's assessment of Fidelity's profitability analysis. PwC's engagement includes the review and assessment of Fidelity's methodologies used in determining the revenues and expenses attributable to Fidelity's mutual fund business, and completion of agreed-upon procedures surrounding the mathematical accuracy of fund profitability and its conformity to allocation methodologies. After considering PwC's reports issued under the engagement and information provided by Fidelity, the Board concluded that while other allocation methods may also be reasonable, Fidelity's profitability methodologies are reasonable in all material respects.
The Board also reviewed Fidelity's non-fund businesses and fall-out benefits related to the mutual fund business as well as cases where Fidelity's affiliates may benefit from or be related to the fund's business.
The Board considered the costs of the services provided by and the profits realized by Fidelity in connection with the operation of the fund and was satisfied that the profitability was not excessive in the circumstances.
Economies of Scale. The Board considered whether there have been economies of scale in respect of the management of the Fidelity funds, whether the Fidelity funds (including the fund) have appropriately benefited from any such economies of scale, and whether there is potential for realization of any further economies of scale. The Board considered the extent to which the fund will benefit from economies of scale through increased services to the fund, through waivers or reimbursements, or through fee or expense reductions. The Board also noted that in 2009, it and the board of other Fidelity funds created an ad hoc committee (the Economies of Scale Committee) to analyze whether FMR attains economies of scale in respect of the management and servicing of the Fidelity funds, whether the Fidelity funds have appropriately benefited from such economies of scale, and whether there is potential for realization of any further economies of scale.
The Board recognized that the fund's management contract incorporates a "group fee" structure, which provides for lower group fee rates as total fund assets under FMR's management increase, and for higher group fee rates as total fund assets under FMR's management decrease. FMR calculates the group fee rates based on a tiered asset "breakpoint" schedule that varies based on asset class. The Board considered that the group fee is designed to deliver the benefits of economies of scale to fund shareholders when total Fidelity fund assets increase, even if assets of any particular fund are unchanged or have declined, because some portion of Fidelity's costs are attributable to services provided to all Fidelity funds, and all funds benefit if those costs can be allocated among more assets. The Board concluded that, given the group fee structure, fund shareholders will benefit from lower management fees as assets under FMR's management increase at the fund complex level, regardless of whether Fidelity achieves any such economies of scale.
Annual Report
Board Approval of Investment Advisory Contracts and
Management Fees - continued
The Board concluded, taking into account the analysis of the Economies of Scale Committee, that any potential economies of scale are being appropriately shared between fund shareholders and Fidelity.
Additional Information Requested by the Board. In order to develop fully the factual basis for consideration of the Fidelity funds' Advisory Contracts, the Board requested and received additional information on certain topics, including (i) fund performance trends, actions to be taken by FMR to improve certain funds' overall performance, and Fidelity's long-term strategies for certain funds; (ii) portfolio manager changes that have occurred during the past year and length of portfolio manager tenure for different categories of funds over time; (iii) Fidelity's compensation structure for portfolio managers and other key personnel and strategies for attracting and retaining non-investment personnel; (iv) the amount of the investment that each portfolio manager has made in the Fidelity fund(s) that he or she manages; (v) historical trends in Fidelity's realization of fall-out benefits; (vi) Fidelity's group fee structures and the rationale for the individual fee rates of certain funds; (vii) fund profitability methodology and the impact of certain factors on fund profitability results; (viii) trends regarding industry use of performance fee structures and Fidelity's compliance practices with respect to performance adjustment calculations; (ix) the fee structures in place for certain other Fidelity clients; and (x) explanations regarding the relative total expense ratios of certain funds and classes, total expense competitive trends, and actions that might be taken by FMR to reduce total expense ratios for certain funds and classes.
Based on its evaluation of all of the conclusions noted above, and after considering all factors it believed relevant, the Board ultimately concluded that the advisory fee structures are fair and reasonable, and that the fund's Advisory Contracts should be renewed.
Annual Report
Managing Your Investments
Fidelity offers several ways to conveniently manage your workplace benefits (including your workplace savings plan, investments, and additional services) via your telephone or PC. You can access your plan and account information and research your investments 24 hours a day.
By Phone
Fidelity provides a single toll-free number to access plan information, account balances, positions, and quotes*. It's easy to navigate the service, and on your first call, the system will help you create a personal identification number (PIN) for security.
(phone_graphic)
Fidelity Workplace
Investing
1-800-835-5092
By PC
Fidelity's web site on the Internet provides a wide range of information, including plan information, daily financial news, fund performance, interactive planning tools, and news about Fidelity products and services.
(computer_graphic)
Fidelity's Web Site
www.401k.com
* When you call the quotes line, please remember that a fund's yield and return will vary and, except for money market funds, share price will also vary. This means that you may have a gain or loss when you sell your shares. There is no assurance that money market funds will be able to maintain a stable $1 share price; an investment in a money market fund is not insured or guaranteed by the U.S. government. Total returns are historical and include changes in share price, reinvestment of dividends and capital gains distributions, and the effects of any sales charges.
Annual Report
To Write Fidelity
We'll give your correspondence immediate attention and send you written confirmation upon completion of your request.
(letter_graphic)
For Non-Retirement
Accounts
Buying shares
Fidelity Investments
P.O. Box 770001
Cincinnati, OH 45277-0003
Overnight Express
Fidelity Investments
Attn: Distribution Services
100 Crosby Parkway - KC1H
Covington, KY 41015
Selling shares
Fidelity Investments
P.O. Box 770001
Cincinnati, OH 45277-0035
Overnight Express
Fidelity Investments
Attn: Distribution Services
100 Crosby Parkway - KC1H
Covington, KY 41015
General Correspondence
Fidelity Investments
P.O. Box 500
Merrimack, NH 03054-0500
(letter_graphic)
For Retirement
Accounts
Buying shares
Fidelity Investments
P.O. Box 770001
Cincinnati, OH 45277-0003
Selling shares
Fidelity Investments
P.O. Box 770001
Cincinnati, OH 45277-0035
Overnight Express
Fidelity Investments
Attn: Distribution Services
100 Crosby Parkway - KC1H
Covington, KY 41015
General Correspondence
Fidelity Investments
P.O. Box 500
Merrimack, NH 03054-0500
Annual Report
Investment Adviser
Fidelity Management & Research Company
Boston, MA
Investment Sub-Advisers
FMR Co., Inc.
Fidelity Management & Research
(U.K.) Inc.
Fidelity Management & Research
(Hong Kong) Limited
Fidelity Management & Research
(Japan) Inc.
General Distributor
Fidelity Distributors Corporation
Boston, MA
Transfer and Service Agents
Fidelity Investments Institutional
Operations Company, Inc.
Boston, MA
Fidelity Service Company, Inc.
Boston, MA
Custodian
The Northern Trust Company
Chicago, IL
OTC-K-UANN-0911
1.863303.102
Fidelity®
Real Estate Income
Fund
Annual Report
July 31, 2011
(2_fidelity_logos) (Registered_Trademark)
Contents
Chairman's Message | <Click Here> | The Chairman's message to shareholders. |
Performance | <Click Here> | How the fund has done over time. |
Management's Discussion of Fund Performance | <Click Here> | The Portfolio Manager's review of fund performance and strategy. |
Shareholder Expense Example | <Click Here> | An example of shareholder expenses. |
Investment Changes | <Click Here> | A summary of major shifts in the fund's investments over the past six months. |
Investments | <Click Here> | A complete list of the fund's investments with their market values. |
Financial Statements | <Click Here> | Statements of assets and liabilities, operations, and changes in net assets,
as well as financial highlights. |
Notes | <Click Here> | Notes to the financial statements. |
Report of Independent Registered Public Accounting Firm | <Click Here> | |
Trustees and Officers | <Click Here> | |
Distributions | <Click Here> | |
Board Approval of Investment Advisory Contracts and Management Fees | <Click Here> | |
To view a fund's proxy voting guidelines and proxy voting record for the 12-month period ended June 30, visit http://www.fidelity.com/proxyvotingresults or visit the Securities and Exchange Commission's (SEC) web site at http://www.sec.gov. You may also call 1-800-544-8544 to request a free copy of the proxy voting guidelines.
Standard & Poor's, S&P and S&P 500 are registered service marks of The McGraw-Hill Companies, Inc. and have been licensed for use by Fidelity Distributors Corporation.
Other third party marks appearing herein are the property of their respective owners.
All other marks appearing herein are registered or unregistered trademarks or service marks of FMR LLC or an affiliated company.
Annual Report
This report and the financial statements contained herein are submitted for the general information of the shareholders of the fund. This report is not authorized for distribution to prospective investors in the fund unless preceded or accompanied by an effective prospectus.
A fund files its complete schedule of portfolio holdings with the SEC for the first and third quarters of each fiscal year on Form N-Q. Forms N-Q are available on the SEC's web site at http://www.sec.gov. A fund's Forms N-Q may be reviewed and copied at the SEC's Public Reference Room in Washington, DC. Information regarding the operation of the SEC's Public Reference Room may be obtained by calling 1-800-SEC-0330. For a complete list of a fund's portfolio holdings, view the most recent holdings listing, semiannual report, or annual report on Fidelity's web site at http://www.fidelity.com, http://www.advisor.fidelity.com, or http://www.401k.com, as applicable.
NOT FDIC INSURED • MAY LOSE VALUE • NO BANK GUARANTEE
Neither the fund nor Fidelity Distributors Corporation is a bank.
Annual Report
(photo_of_James_C_Curvey)
Dear Shareholder:
The second half of 2011 began with U.S. equities continuing to give back some of the gains achieved earlier in the year. In the days leading up to July 31, markets were shaken by a political stalemate in which Congress struggled to address the debt ceiling issue before an early-August deadline. The resulting uncertainty held back markets in July, the third consecutive monthly decline for equities, effectively reversing the positive momentum seen through the end of April. Financial markets are always unpredictable, of course, but there are several time-tested investment principles that can help put the odds in your favor.
One of the basic tenets is to invest for the long term. Over time, riding out the markets' inevitable ups and downs has proven much more effective than selling into panic or chasing the hottest trend. Even missing only a few of the markets' best days can significantly diminish investor returns. Patience also affords the benefits of compounding - of earning interest on additional income or reinvested dividends and capital gains. There can be tax advantages and cost benefits to consider as well. While staying the course doesn't eliminate risk, it can considerably lessen the effect of short-term declines.
You can further manage your investing risk through diversification. And today, more than ever, geographic diversification should be taken into account. Studies indicate that asset allocation is the single most important determinant of a portfolio's long-term success. The right mix of stocks, bonds and cash - aligned to your particular risk tolerance and investment objective - is very important. Age-appropriate rebalancing is also an essential aspect of asset allocation. For younger investors, an emphasis on equities - which historically have been the best-performing asset class over time - is encouraged. As investors near their specific goal, such as retirement or sending a child to college, consideration may be given to replacing volatile assets (e.g. common stocks) with more-stable fixed investments (bonds or savings plans).
A third principle - investing regularly - can help lower the average cost of your purchases. Investing a certain amount of money each month or quarter helps ensure you won't pay for all your shares at market highs. This strategy - known as dollar cost averaging - also reduces "emotion" from investing, helping shareholders avoid selling weak performers just prior to an upswing, or chasing a hot performer just before a correction.
We invite you to contact us via the Internet, through our Investor Centers or by phone. It is our privilege to provide you the information you need to make the investments that are right for you.
Sincerely,
(The acting chairman's signature appears here.)
James C. Curvey
Acting Chairman
Annual Report
Average annual total return reflects the change in the value of an investment, assuming reinvestment of the class' distributions from dividend income and capital gains (the profits earned upon the sale of securities that have grown in value, if any) and assuming a constant rate of performance each year. The $10,000 table and the fund's returns do not reflect the deduction of taxes that a shareholder would pay on fund distributions or the redemption of fund shares. During periods of reimbursement by Fidelity, a fund's total return will be greater than it would be had the reimbursement not occurred. How a fund did yesterday is no guarantee of how it will do tomorrow.
Average Annual Total Returns
Periods ended July 31, 2011 | Past 1
year | Past 5
years | Life of
fund A |
Fidelity® Real Estate Income Fund | 13.41% | 4.81% | 7.38% |
A From February 4, 2003.
$10,000 Over Life of Fund
Let's say hypothetically that $10,000 was invested in Fidelity® Real Estate Income Fund, a class of the fund, on February 4, 2003, when the fund started. The chart shows how the value of your investment would have changed, and also shows how the S&P 500® Index performed over the same period.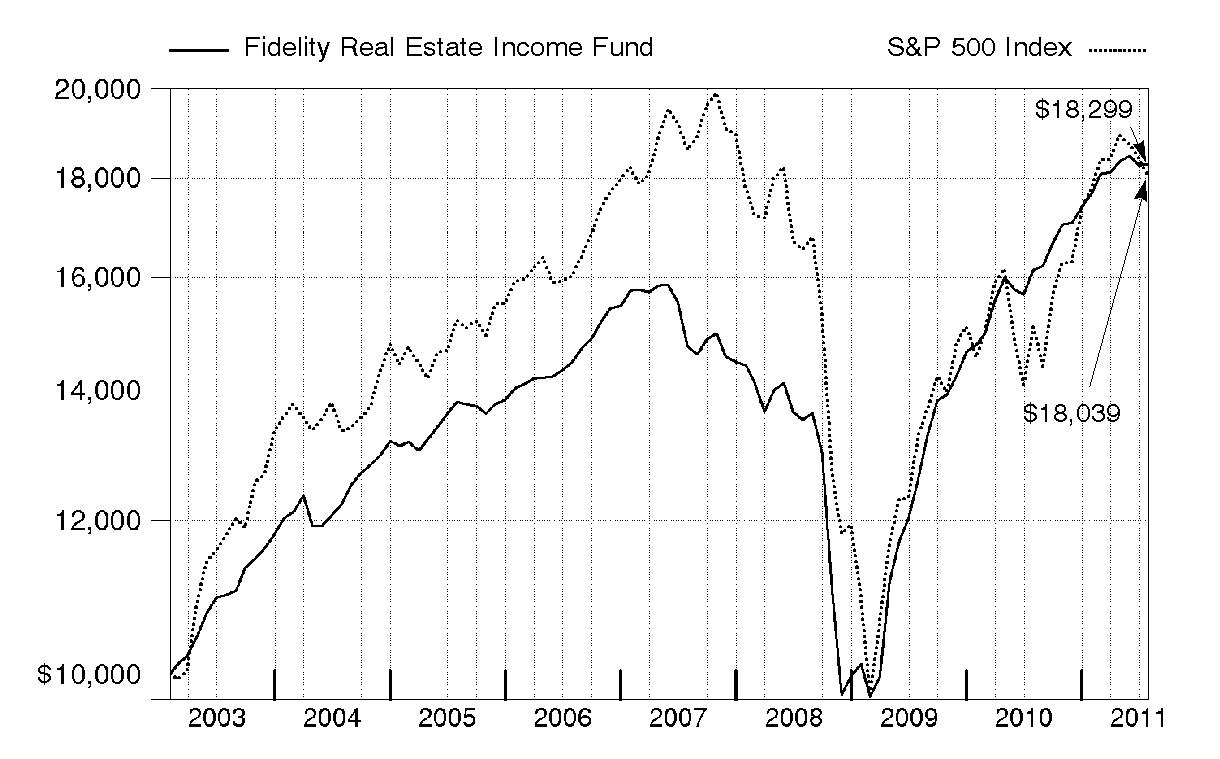
Annual Report
Market Recap: Commercial real estate fundamentals continued to improve throughout the 12-month period ending July 31, 2011, as limited new building activity, good demand and low interest rates helped boost property values. Occupancy levels and rents gradually increased across almost all property types, with the combination helping to push up cash flows. Real estate investment trusts (REITs) that own apartments and retail properties in well-established neighborhoods were well-positioned, as were office companies focused on central business districts, while industrial and suburban office REITs did not enjoy as much upside. Against this backdrop, almost all types of real estate securities generated healthy gains. During the year, real estate common stocks, as measured by the FTSE® NAREIT® All REITs Index, rose 22.37%. Real estate bonds, as measured by The BofA Merrill LynchSM US Real Estate Index - a market-capitalization-weighted measure of the performance of investment-grade public debt of corporate issuers in the domestic real estate sector - rose 10.38%. The MSCI® REIT Preferred Index, which reflects the performance of real estate preferred stocks, rose 12.74%. In comparison, the S&P 500® Index, a proxy for the broad U.S. stock market, gained 19.65%.
Comments from Mark Snyderman, Portfolio Manager of Fidelity® Real Estate Income Fund: The fund's Retail Class shares gained 13.41% for the 12 months ending July 31, 2011. In comparison, the Fidelity Real Estate Income Composite Index - a 40/40/20 blend of the MSCI® REIT Preferred Index, The BofA Merrill LynchSM U.S. Real Estate Index and the FTSE® NAREIT® All REITs Index, respectively - did somewhat better, gaining 13.76%. The fund's real estate common stocks were the best-performing securities, gaining about 21%, modestly trailing the average real estate investment trust (REIT) in the NAREIT index. Real estate bonds generated a roughly 13% return, led by commercial mortgage-backed securities (CMBS), which were up approximately 15%. Real estate preferred stocks - the other major category in which the fund invests - also performed well, rising 13% during the year, slightly above the MSCI index. The only major detractor was the fund's cash position of roughly 8%, on average, which earned almost nothing during the year. A notable detractor was the fund's convertible preferred stock holdings in real estate services provider Grubb & Ellis. On the positive side, net lease REIT Lexington Corporate Properties Trust contributed meaningfully. The fund owned this company's common stock, preferred stock and convertible bonds.
The views expressed above reflect those of the portfolio manager(s) only through the end of the period as stated on the cover of this report and do not necessarily represent the views of Fidelity or any other person in the Fidelity organization. Any such views are subject to change at any time based upon market or other conditions and Fidelity disclaims any responsibility to update such views. These views may not be relied on as investment advice and, because investment decisions for a Fidelity fund are based on numerous factors, may not be relied on as an indication of trading intent on behalf of any Fidelity fund.
Annual Report
Shareholder Expense Example
As a shareholder of the Fund, you incur two types of costs: (1) transaction costs, including sales charges (loads) on purchase payments or redemption proceeds, redemption fees, and (2) ongoing costs, including management fees, distribution and/or service (12b-1) fees and other Fund expenses. This Example is intended to help you understand your ongoing costs (in dollars) of investing in the Fund and to compare these costs with the ongoing costs of investing in other mutual funds.
The Example is based on an investment of $1,000 invested at the beginning of the period and held for the entire period (February 1, 2011 to July 31, 2011).
Actual Expenses
The first line of the accompanying table for each class of the Fund provides information about actual account values and actual expenses. You may use the information in this line, together with the amount you invested, to estimate the expenses that you paid over the period. Simply divide your account value by $1,000.00 (for example, an $8,600 account value divided by $1,000.00 = 8.6), then multiply the result by the number in the first line for a class of the Fund under the heading entitled "Expenses Paid During Period" to estimate the expenses you paid on your account during this period. A small balance maintenance fee of $12.00 that is charged once a year may apply for certain accounts with a value of less than $2,000. This fee is not included in the table below. If it was, the estimate of expenses you paid during the period would be higher, and your ending account value lower, by this amount. In addition, the Fund, as a shareholder in the underlying Fidelity Central Funds, will indirectly bear its pro-rata share of the fees and expenses incurred by the underlying Fidelity Central Funds. These fees and expenses are not included in the Fund's annualized expense ratio used to calculate the expense estimate in the table below.
Hypothetical Example for Comparison Purposes
The second line of the accompanying table for each class of the Fund provides information about hypothetical account values and hypothetical expenses based on a Class' actual expense ratio and an assumed rate of return of 5% per year before expenses, which is not the Class' actual return. The hypothetical account values and expenses may not be used to estimate the actual ending account balance or expenses you paid for the period. You may use this information to compare the ongoing costs of investing in the Fund and other funds. To do so, compare this 5% hypothetical example with the 5% hypothetical examples that appear in the shareholder reports of the other funds. A small balance maintenance fee of $12.00 that is charged once a year may apply for certain accounts with a value of less than $2,000. This fee is not included in the table below. If it was, the estimate of expenses you paid during the period would be higher, and your ending account value lower, by this amount. In addition, the Fund, as a shareholder in the underlying Fidelity Central Funds, will indirectly bear its pro-rata share of the fees and expenses incurred by the underlying Fidelity Central Funds. These fees and expenses are not included in the Fund's annualized expense ratio used to calculate the expense estimate in the table below.
Please note that the expenses shown in the table are meant to highlight your ongoing costs only and do not reflect any transaction costs. Therefore, the second line of the table is useful in comparing ongoing costs only, and will not help you determine the relative total costs of owning different funds. In addition, if these transactional costs were included, your costs would have been higher.
Annual Report
Shareholder Expense Example - continued
| Annualized
Expense Ratio | Beginning
Account Value
February 1, 2011 | Ending
Account Value
July 31, 2011 | Expenses Paid
During Period*
February 1, 2011 to July 31, 2011 |
Class A | 1.12% | | | |
Actual | | $ 1,000.00 | $ 1,035.30 | $ 5.65 |
HypotheticalA | | $ 1,000.00 | $ 1,019.24 | $ 5.61 |
Class T | 1.15% | | | |
Actual | | $ 1,000.00 | $ 1,034.20 | $ 5.80 |
HypotheticalA | | $ 1,000.00 | $ 1,019.09 | $ 5.76 |
Class C | 1.88% | | | |
Actual | | $ 1,000.00 | $ 1,030.00 | $ 9.46 |
HypotheticalA | | $ 1,000.00 | $ 1,015.47 | $ 9.39 |
Real Estate Income | .90% | | | |
Actual | | $ 1,000.00 | $ 1,035.70 | $ 4.54 |
HypotheticalA | | $ 1,000.00 | $ 1,020.33 | $ 4.51 |
Institutional Class | .88% | | | |
Actual | | $ 1,000.00 | $ 1,035.10 | $ 4.44 |
HypotheticalA | | $ 1,000.00 | $ 1,020.43 | $ 4.41 |
A 5% return per year before expenses
* Expenses are equal to each Class' annualized expense ratio, multiplied by the average account value over the period, multiplied by 181/365 (to reflect the one-half year period).
Annual Report
Investment Changes (Unaudited)
Top Five Stocks as of July 31, 2011 |
| % of fund's
net assets | % of fund's net assets
6 months ago |
Ventas, Inc. | 1.9 | 1.7 |
Acadia Realty Trust (SBI) | 1.6 | 1.4 |
MFA Financial, Inc. | 1.5 | 1.6 |
Equity Lifestyle Properties, Inc. | 1.3 | 1.2 |
Prologis, Inc. | 1.2 | 0.0 |
| 7.5 | |
Top 5 Bonds as of July 31, 2011 |
| % of fund's
net assets | % of fund's net assets
6 months ago |
Banc of America Large Loan Trust floater Series 2010-HLTN Class HLTN, 1.937% 11/15/15 | 2.4 | 1.4 |
Wachovia Ltd./Wachovia LLC Series 2006-1A Class A1A, 0.5065% 9/25/26 | 1.0 | 0.1 |
M/I Homes, Inc. 8.625% 11/15/18 | 0.9 | 0.0 |
Lexington Master Ltd. Partnership 5.45% 1/15/27 | 0.8 | 1.0 |
Cbre Realty Finance Cdo 2007-1/LLC 0.4958% 4/7/52 | 0.8 | 0.3 |
| 5.9 | |
Top Five REIT Sectors as of July 31, 2011 |
| % of fund's
net assets | % of fund's net assets
6 months ago |
REITs - Shopping Centers | 6.5 | 9.6 |
REITs - Health Care Facilities | 6.2 | 8.4 |
REITs - Management/Investment | 5.5 | 7.1 |
REITs - Mortgage | 5.5 | 6.8 |
REITs - Industrial Buildings | 3.4 | 5.7 |
Asset Allocation (% of fund's net assets) |
As of July 31, 2011* | As of January 31, 2011** |
| Common Stocks 23.4% | | | Common Stocks 25.9% | |
 | Preferred Stocks 9.7% | | | Preferred Stocks 8.6% | |
 | Bonds 48.0% | | | Bonds 45.8% | |
 | Convertible
Securities 7.1% | | | Convertible
Securities 8.8% | |
 | Other Investments 4.0% | | | Other Investments 2.2% | |
| Short-Term
Investments and
Net Other Assets 7.8% | | | Short-Term
Investments and
Net Other Assets 8.7% | |
* Foreign investments | 6.3% | | ** Foreign investments | 3.3% | |

Annual Report
Investments July 31, 2011
Showing Percentage of Net Assets
Common Stocks - 23.4% |
| Shares | | Value |
CONSUMER DISCRETIONARY - 0.9% |
Hotels, Restaurants & Leisure - 0.3% |
Starwood Hotels & Resorts Worldwide, Inc. | 84,100 | | $ 4,622,136 |
Household Durables - 0.6% |
Standard Pacific Corp. (a)(f) | 2,760,000 | | 7,893,600 |
Stanley Martin Communities LLC Class B (a) | 4,620 | | 3,528,571 |
| | 11,422,171 |
TOTAL CONSUMER DISCRETIONARY | | 16,044,307 |
FINANCIALS - 21.2% |
Capital Markets - 0.4% |
HFF, Inc. (a) | 546,564 | | 8,253,116 |
Real Estate Investment Trusts - 20.7% |
Acadia Realty Trust (SBI) | 1,342,149 | | 28,171,708 |
Alexandria Real Estate Equities, Inc. | 61,100 | | 5,010,200 |
American Campus Communities, Inc. | 258,700 | | 9,628,814 |
American Capital Agency Corp. | 105,300 | | 2,939,976 |
Annaly Capital Management, Inc. | 217,250 | | 3,645,455 |
Anworth Mortgage Asset Corp. | 793,610 | | 5,499,717 |
AvalonBay Communities, Inc. (f) | 39,225 | | 5,263,603 |
Brandywine Realty Trust (SBI) | 295,700 | | 3,545,443 |
Canadian (REIT) | 107,800 | | 3,765,215 |
CapLease, Inc. | 1,239,200 | | 5,514,440 |
CBL & Associates Properties, Inc. | 325,073 | | 5,773,296 |
Cedar Shopping Centers, Inc. | 271,400 | | 1,346,144 |
Chartwell Seniors Housing (REIT) (f) | 394,700 | | 3,247,166 |
Chesapeake Lodging Trust | 203,500 | | 3,357,750 |
CommonWealth REIT | 111,700 | | 2,638,354 |
Coresite Realty Corp. | 177,500 | | 2,989,100 |
Cypress Sharpridge Investments, Inc. (f) | 640,539 | | 7,885,035 |
DCT Industrial Trust, Inc. | 960,000 | | 5,203,200 |
DiamondRock Hospitality Co. | 386,100 | | 3,945,942 |
Duke Realty LP | 388,583 | | 5,455,705 |
Dynex Capital, Inc. | 1,191,386 | | 10,841,613 |
Education Realty Trust, Inc. | 140,600 | | 1,234,468 |
Equity Lifestyle Properties, Inc. | 352,930 | | 22,996,919 |
Equity Residential (SBI) | 94,900 | | 5,866,718 |
Excel Trust, Inc. | 632,228 | | 7,251,655 |
H&R REIT/H&R Finance Trust | 206,500 | | 4,748,592 |
HCP, Inc. | 241,900 | | 8,884,987 |
Healthcare Realty Trust, Inc. | 206,300 | | 4,043,480 |
Common Stocks - continued |
| Shares | | Value |
FINANCIALS - continued |
Real Estate Investment Trusts - continued |
Highwoods Properties, Inc. (SBI) | 64,300 | | $ 2,213,849 |
Hospitality Properties Trust (SBI) | 106,400 | | 2,686,600 |
Lexington Corporate Properties Trust (f) | 837,000 | | 7,030,800 |
LTC Properties, Inc. | 247,313 | | 6,714,548 |
MFA Financial, Inc. | 3,579,381 | | 26,809,564 |
Mid-America Apartment Communities, Inc. | 64,600 | | 4,573,034 |
Monmouth Real Estate Investment Corp. Class A | 455,073 | | 3,749,802 |
National Health Investors, Inc. | 148,006 | | 6,732,793 |
National Retail Properties, Inc. | 234,500 | | 5,883,605 |
Omega Healthcare Investors, Inc. (f) | 214,000 | | 4,202,960 |
Pebblebrook Hotel Trust | 239,182 | | 4,728,628 |
Prologis, Inc. | 594,487 | | 21,181,572 |
Regency Centers Corp. | 55,100 | | 2,475,092 |
RioCan (REIT) | 150,900 | | 4,100,234 |
Senior Housing Properties Trust (SBI) | 151,700 | | 3,631,698 |
Simon Property Group, Inc. | 125,801 | | 15,160,279 |
Stag Industrial, Inc. (f) | 382,692 | | 4,703,285 |
Summit Hotel Properties, Inc. | 579,400 | | 6,535,632 |
Sunstone Hotel Investors, Inc. (a) | 450,000 | | 4,009,500 |
Two Harbors Investment Corp. | 467,980 | | 4,586,204 |
Ventas, Inc. (f) | 637,146 | | 34,488,713 |
Weyerhaeuser Co. | 454,429 | | 9,084,036 |
Whitestone REIT Class B (f) | 379,067 | | 4,776,244 |
| | 370,753,367 |
Real Estate Management & Development - 0.1% |
Brookfield Asset Management, Inc. Class A | 51,000 | | 1,606,762 |
Thrifts & Mortgage Finance - 0.0% |
Wrightwood Capital LLC warrants 7/31/14 (a)(g) | 60,681 | | 607 |
TOTAL FINANCIALS | | 380,613,852 |
HEALTH CARE - 1.3% |
Health Care Providers & Services - 1.3% |
Brookdale Senior Living, Inc. (a) | 541,600 | | 11,584,824 |
Capital Senior Living Corp. (a) | 587,750 | | 5,166,323 |
Emeritus Corp. (a) | 333,693 | | 6,557,067 |
| | 23,308,214 |
TOTAL COMMON STOCKS (Cost $361,094,507) | 419,966,373 |
Preferred Stocks - 11.4% |
| Shares | | Value |
Convertible Preferred Stocks - 1.7% |
FINANCIALS - 1.7% |
Real Estate Investment Trusts - 1.6% |
Alexandria Real Estate Equities, Inc. Series D 7.00% | 95,000 | | $ 2,493,750 |
CommonWealth REIT 6.50% | 150,000 | | 3,268,500 |
Excel Trust, Inc. 7.00% (g) | 248,200 | | 5,879,238 |
Health Care REIT, Inc. Series I, 6.50% | 30,000 | | 1,578,750 |
Lexington Corporate Properties Trust Series C 6.50% | 328,036 | | 14,174,436 |
Ramco-Gershenson Properties Trust (SBI) Series D, 7.25% | 40,000 | | 1,992,400 |
| | 29,387,074 |
Real Estate Management & Development - 0.1% |
Grubb & Ellis Co. 12.00% (g) | 27,500 | | 1,447,875 |
TOTAL FINANCIALS | | 30,834,949 |
Nonconvertible Preferred Stocks - 9.7% |
CONSUMER DISCRETIONARY - 0.1% |
Household Durables - 0.1% |
M/I Homes, Inc. Series A, 9.75% (a) | 38,200 | | 611,200 |
FINANCIALS - 9.6% |
Diversified Financial Services - 0.2% |
DRA CRT Acquisition Corp. Series A, 8.50% | 25,000 | | 475,000 |
Red Lion Hotels Capital Trust 9.50% | 163,225 | | 4,136,122 |
| | 4,611,122 |
Real Estate Investment Trusts - 9.3% |
Alexandria Real Estate Equities, Inc. Series C, 8.375% | 67,000 | | 1,722,570 |
American Home Mortgage Investment Corp.: | | | |
Series A, 9.375% (a) | 120,300 | | 12 |
Series B, 9.25% (a) | 124,100 | | 124 |
Annaly Capital Management, Inc. Series A, 7.875% | 161,300 | | 4,151,862 |
Anworth Mortgage Asset Corp. Series A, 8.625% | 309,630 | | 7,799,580 |
Apartment Investment & Management Co.: | | | |
Series T, 8.00% | 57,500 | | 1,447,275 |
Series U, 7.75% | 150,773 | | 3,790,433 |
Brandywine Realty Trust Series C, 7.50% | 37,615 | | 933,228 |
CapLease, Inc. Series A, 8.125% | 83,400 | | 2,064,150 |
Preferred Stocks - continued |
| Shares | | Value |
Nonconvertible Preferred Stocks - continued |
FINANCIALS - continued |
Real Estate Investment Trusts - continued |
CBL & Associates Properties, Inc.: | | | |
(depositary shares) Series C, 7.75% | 47,962 | | $ 1,196,652 |
7.375% | 165,688 | | 4,069,297 |
Cedar Shopping Centers, Inc. 8.875% | 290,352 | | 7,302,353 |
CenterPoint Properties Trust Series D, 5.377% | 3,575 | | 2,180,750 |
Cogdell Spencer, Inc. 8.50% | 114,300 | | 2,858,643 |
Corporate Office Properties Trust Series H, 7.50% | 5,000 | | 125,300 |
Cousins Properties, Inc. Series A, 7.75% | 93,230 | | 2,313,036 |
Duke Realty LP: | | | |
8.375% | 128,517 | | 3,333,731 |
Series L, 6.60% | 10,666 | | 257,051 |
Eagle Hospitality Properties Trust, Inc. 8.25% (a) | 24,000 | | 150,000 |
Equity Lifestyle Properties, Inc. 8.034% | 790,078 | | 19,917,866 |
Essex Property Trust, Inc. Series H, 7.125% | 40,000 | | 1,014,400 |
First Potomac Realty Trust 7.75% | 80,000 | | 2,032,000 |
Glimcher Realty Trust Series G, 8.125% | 171,111 | | 4,156,286 |
Hersha Hospitality Trust Series B, 8.00% | 80,000 | | 1,936,800 |
HomeBanc Mortgage Corp. Series A (a) | 104,685 | | 1 |
Hospitality Properties Trust: | | | |
Series B, 8.875% | 88,600 | | 2,255,756 |
Series C, 7.00% | 58,500 | | 1,428,570 |
Hudson Pacific Properties, Inc. 8.375% | 263,800 | | 6,769,108 |
Kimco Realty Corp. Series G, 7.75% | 113,026 | | 2,929,634 |
Kite Realty Group Trust 8.25% | 96,100 | | 2,383,280 |
LaSalle Hotel Properties: | | | |
Series E, 8.00% | 50,468 | | 1,268,766 |
Series G, 7.25% | 114,485 | | 2,799,158 |
Series H, 7.50% | 100,000 | | 2,464,000 |
LBA Realty Fund II: | | | |
Series A, 8.75% (a) | 69,000 | | 2,760,000 |
Series B, 7.625% (a) | 31,240 | | 687,280 |
Lexington Corporate Properties Trust Series B, 8.05% | 40,300 | | 1,004,679 |
Lexington Realty Trust 7.55% | 23,800 | | 585,480 |
MFA Financial, Inc. Series A, 8.50% | 471,886 | | 11,938,716 |
Monmouth Real Estate Investment Corp. 7.625% | 80,000 | | 2,002,400 |
Newcastle Investment Corp. Series B, 9.75% | 31,530 | | 785,097 |
Parkway Properties, Inc. Series D, 8.00% | 237,900 | | 5,947,500 |
Pebblebrook Hotel Trust Series A, 7.875% | 350,000 | | 8,837,500 |
Prologis, Inc. Series Q, 8.54% | 94,446 | | 5,398,184 |
Preferred Stocks - continued |
| Shares | | Value |
Nonconvertible Preferred Stocks - continued |
FINANCIALS - continued |
Real Estate Investment Trusts - continued |
PS Business Parks, Inc.: | | | |
(depositary shares) Series H, 7.00% | 13,300 | | $ 333,165 |
6.875% | 50,000 | | 1,253,000 |
7.20% | 83,040 | | 2,095,930 |
7.375% | 100,610 | | 2,510,220 |
Series P, 6.70% | 36,000 | | 900,000 |
Public Storage: | | | |
Series K, 7.25% | 147,639 | | 3,724,932 |
Series N, 7.00% | 4,200 | | 108,822 |
Regency Centers Corp.: | | | |
7.25% | 10,500 | | 262,920 |
Series C 7.45% | 18,000 | | 450,540 |
Saul Centers, Inc.: | | | |
8.00% | 93,700 | | 2,354,681 |
Series B (depositary shares) 9.00% | 118,550 | | 3,173,584 |
Sunstone Hotel Investors, Inc. Series A, 8.00% | 102,200 | | 2,474,262 |
UMH Properties, Inc. Series A, 8.25% | 310,000 | | 8,029,000 |
Vornado Realty Trust 6.75% | 20,000 | | 498,400 |
Weingarten Realty Investors (SBI) Series F, 6.50% | 56,230 | | 1,389,443 |
| | 166,557,407 |
Real Estate Management & Development - 0.1% |
Vornado Realty LP 7.875% | 54,682 | | 1,454,541 |
TOTAL FINANCIALS | | 172,623,070 |
TOTAL NONCONVERTIBLE PREFERRED STOCKS | | 173,234,270 |
TOTAL PREFERRED STOCKS (Cost $206,439,030) | 204,069,219 |
Corporate Bonds - 26.6% |
| Principal Amount (e) | | |
Convertible Bonds - 5.4% |
CONSUMER DISCRETIONARY - 0.0% |
Hotels, Restaurants & Leisure - 0.0% |
Morgans Hotel Group Co. 2.375% 10/15/14 | | $ 1,340,000 | | 1,157,425 |
Corporate Bonds - continued |
| Principal Amount (e) | | Value |
Convertible Bonds - continued |
FINANCIALS - 5.4% |
Real Estate Investment Trusts - 2.8% |
Acadia Realty Trust 3.75% 12/15/26 | | $ 11,505,000 | | $ 11,598,478 |
Annaly Capital Management, Inc. 4% 2/15/15 | | 1,000,000 | | 1,147,500 |
CapLease, Inc. 7.5% 10/1/27 (g) | | 5,180,000 | | 5,231,800 |
Developers Diversified Realty Corp. 1.75% 11/15/40 | | 1,000,000 | | 1,070,700 |
Hospitality Properties Trust 3.8% 3/15/27 | | 6,100,000 | | 6,100,000 |
Inland Real Estate Corp. 4.625% 11/15/26 | | 10,870,000 | | 10,842,825 |
ProLogis LP: | | | | |
1.875% 11/15/37 | | 2,450,000 | | 2,428,563 |
2.625% 5/15/38 | | 1,500,000 | | 1,492,500 |
The Macerich Co. 3.25% 3/15/12 (g) | | 4,800,000 | | 4,809,000 |
United Dominion Realty Trust, Inc. 3.625% 9/15/11 | | 5,500,000 | | 5,555,000 |
| | 50,276,366 |
Real Estate Management & Development - 2.6% |
BioMed Realty LP 4.5% 10/1/26 (g) | | 2,500,000 | | 2,518,750 |
City Center 8.75% 7/1/13 (i) | | 8,000,000 | | 7,984,800 |
Corporate Office Properties LP: | | | | |
3.5% 9/15/26 (g) | | 3,280,000 | | 3,280,000 |
4.25% 4/15/30 (g) | | 2,000,000 | | 1,982,800 |
Duke Realty LP 3.75% 12/1/11 (g) | | 2,650,000 | | 2,676,500 |
First Potomac Realty Investment LP 4% 12/15/11 (g) | | 2,600,000 | | 2,600,000 |
Grubb & Ellis Co. 7.95% 5/1/15 (g) | | 5,500,000 | | 4,662,900 |
Home Properties, Inc. 4.125% 11/1/26 (g) | | 2,100,000 | | 2,118,375 |
Kilroy Realty LP 3.25% 4/15/12 (g) | | 2,185,000 | | 2,191,828 |
Lexington Master Ltd. Partnership 5.45% 1/15/27 (g) | | 14,950,000 | | 15,006,063 |
SL Green Realty Corp. 3% 3/30/27 (g) | | 500,000 | | 500,000 |
| | 45,522,016 |
TOTAL FINANCIALS | | 95,798,382 |
TOTAL CONVERTIBLE BONDS | | 96,955,807 |
Nonconvertible Bonds - 21.2% |
CONSUMER DISCRETIONARY - 6.4% |
Hotels, Restaurants & Leisure - 0.9% |
CityCenter Holdings LLC/CityCenter Finance Corp. 7.625% 1/15/16 (g) | | 1,945,000 | | 2,027,663 |
GWR Operating Partnership LLP/Great Wolf Finance Corp. 10.875% 4/1/17 | | 1,700,000 | | 1,853,000 |
Corporate Bonds - continued |
| Principal Amount (e) | | Value |
Nonconvertible Bonds - continued |
CONSUMER DISCRETIONARY - continued |
Hotels, Restaurants & Leisure - continued |
Landry's Restaurants, Inc.: | | | | |
11.625% 12/1/15 | | $ 1,000,000 | | $ 1,085,000 |
11.625% 12/1/15 (g) | | 325,000 | | 352,625 |
Times Square Hotel Trust 8.528% 8/1/26 (g) | | 8,964,068 | | 10,697,818 |
| | 16,016,106 |
Household Durables - 5.0% |
KB Home: | | | | |
5.75% 2/1/14 | | 510,000 | | 501,075 |
5.875% 1/15/15 | | 5,000,000 | | 4,675,000 |
6.25% 6/15/15 | | 8,500,000 | | 8,011,250 |
7.25% 6/15/18 | | 2,840,000 | | 2,570,200 |
9.1% 9/15/17 | | 9,625,000 | | 9,576,875 |
Lennar Corp.: | | | | |
5.5% 9/1/14 | | 1,000,000 | | 1,010,000 |
5.6% 5/31/15 | | 5,000,000 | | 4,950,000 |
6.5% 4/15/16 | | 4,000,000 | | 4,000,000 |
6.95% 6/1/18 | | 11,000,000 | | 10,780,000 |
M/I Homes, Inc.: | | | | |
6.875% 4/1/12 | | 2,150,000 | | 2,182,250 |
8.625% 11/15/18 | | 16,880,000 | | 16,626,800 |
Meritage Homes Corp.: | | | | |
6.25% 3/15/15 | | 2,500,000 | | 2,484,375 |
7.15% 4/15/20 | | 1,500,000 | | 1,485,000 |
Ryland Group, Inc. 8.4% 5/15/17 | | 745,000 | | 812,050 |
Standard Pacific Corp.: | | | | |
7% 8/15/15 | | 4,000,000 | | 4,150,000 |
8.375% 5/15/18 | | 12,088,000 | | 12,118,220 |
10.75% 9/15/16 | | 3,000,000 | | 3,420,000 |
| | 89,353,095 |
Multiline Retail - 0.4% |
Sears Holdings Corp. 6.625% 10/15/18 (g) | | 7,065,000 | | 6,499,800 |
Specialty Retail - 0.1% |
Toys 'R' Us Property Co. I LLC 10.75% 7/15/17 | | 2,490,000 | | 2,801,250 |
TOTAL CONSUMER DISCRETIONARY | | 114,670,251 |
Corporate Bonds - continued |
| Principal Amount (e) | | Value |
Nonconvertible Bonds - continued |
CONSUMER STAPLES - 0.3% |
Food & Staples Retailing - 0.3% |
Ahold Lease Series 2001 A1 pass thru trust certificates 7.82% 1/2/20 | | $ 1,195,175 | | $ 1,320,669 |
C&S Group Enterprises LLC 8.375% 5/1/17 (g) | | 4,400,000 | | 4,565,000 |
| | 5,885,669 |
FINANCIALS - 13.5% |
Commercial Banks - 0.1% |
CapitalSource, Inc. 12.75% 7/15/14 (g) | | 1,500,000 | | 1,800,000 |
Diversified Financial Services - 0.6% |
Icahn Enterprises LP/Icahn Enterprises Finance Corp. 7.75% 1/15/16 | | 10,820,000 | | 11,225,750 |
Real Estate Investment Trusts - 8.1% |
Camden Property Trust 5% 6/15/15 | | 1,100,000 | | 1,204,126 |
Commercial Net Lease Realty, Inc.: | | | | |
6.15% 12/15/15 | | 2,526,000 | | 2,793,448 |
6.25% 6/15/14 | | 5,005,000 | | 5,474,224 |
Developers Diversified Realty Corp.: | | | | |
5.375% 10/15/12 | | 500,000 | | 514,388 |
5.5% 5/1/15 | | 2,000,000 | | 2,157,226 |
7.5% 4/1/17 | | 6,000,000 | | 6,932,370 |
7.5% 7/15/18 | | 5,271,000 | | 6,013,889 |
7.875% 9/1/20 | | 4,637,000 | | 5,489,072 |
9.625% 3/15/16 | | 3,836,000 | | 4,697,178 |
Equity One, Inc.: | | | | |
5.375% 10/15/15 | | 3,500,000 | | 3,744,608 |
6.25% 12/15/14 | | 4,081,000 | | 4,485,178 |
6.25% 1/15/17 | | 3,000,000 | | 3,298,572 |
HCP, Inc. 3.75% 2/1/16 | | 2,000,000 | | 2,072,860 |
Health Care Property Investors, Inc.: | | | | |
6% 3/1/15 | | 1,000,000 | | 1,107,116 |
6.3% 9/15/16 | | 5,250,000 | | 5,967,182 |
7.072% 6/8/15 | | 1,500,000 | | 1,703,930 |
Health Care REIT, Inc.: | | | | |
6% 11/15/13 | | 1,000,000 | | 1,084,039 |
6.2% 6/1/16 | | 750,000 | | 849,872 |
Healthcare Realty Trust, Inc.: | | | | |
5.125% 4/1/14 | | 3,650,000 | | 3,897,010 |
6.5% 1/17/17 | | 1,875,000 | | 2,130,191 |
HMB Capital Trust V 3.847% 12/15/36 (d)(g)(i) | | 2,530,000 | | 0 |
Corporate Bonds - continued |
| Principal Amount (e) | | Value |
Nonconvertible Bonds - continued |
FINANCIALS - continued |
Real Estate Investment Trusts - continued |
Hospitality Properties Trust: | | | | |
5.625% 3/15/17 | | $ 915,000 | | $ 959,986 |
6.75% 2/15/13 | | 610,000 | | 636,954 |
7.875% 8/15/14 | | 1,000,000 | | 1,134,415 |
HRPT Properties Trust: | | | | |
5.75% 11/1/15 | | 3,600,000 | | 3,894,545 |
6.25% 8/15/16 | | 1,500,000 | | 1,669,115 |
6.5% 1/15/13 | | 200,000 | | 206,863 |
iStar Financial, Inc.: | | | | |
5.875% 3/15/16 | | 3,000,000 | | 2,617,500 |
5.95% 10/15/13 | | 5,330,000 | | 5,010,200 |
6.05% 4/15/15 | | 4,725,000 | | 4,347,000 |
Kimco Realty Corp. 5.783% 3/15/16 | | 450,000 | | 505,254 |
MPT Operating Partnership LP/MPT Finance Corp. 6.875% 5/1/21 (g) | | 2,000,000 | | 1,955,000 |
Nationwide Health Properties, Inc.: | | | | |
6% 5/20/15 | | 3,122,000 | | 3,459,164 |
6.25% 2/1/13 | | 1,000,000 | | 1,065,264 |
8.25% 7/1/12 | | 1,300,000 | | 1,356,306 |
Omega Healthcare Investors, Inc.: | | | | |
6.75% 10/15/22 | | 2,115,000 | | 2,152,013 |
7% 1/15/16 | | 1,295,000 | | 1,340,325 |
7.5% 2/15/20 | | 1,000,000 | | 1,065,000 |
Pan Pacific Retail Properties, Inc. 5.95% 6/1/14 | | 1,750,000 | | 1,935,015 |
Potlatch Corp. 7.5% 11/1/19 | | 1,000,000 | | 1,040,000 |
ProLogis LP: | | | | |
6.25% 3/15/17 | | 4,000,000 | | 4,499,508 |
6.625% 5/15/18 | | 6,480,000 | | 7,350,426 |
7.625% 7/1/17 | | 4,690,000 | | 5,550,939 |
Reckson Operating Partnership LP/SL Green Realty Corp./SL Green Operating Partnership LP 7.75% 3/15/20 | | 2,000,000 | | 2,318,400 |
Senior Housing Properties Trust: | | | | |
4.3% 1/15/16 | | 5,000,000 | | 5,126,080 |
6.75% 4/15/20 | | 2,000,000 | | 2,185,680 |
8.625% 1/15/12 | | 5,900,000 | | 6,069,094 |
UDR, Inc. 5.5% 4/1/14 | | 500,000 | | 537,947 |
United Dominion Realty Trust, Inc.: | | | | |
5.13% 1/15/14 | | 500,000 | | 532,090 |
Corporate Bonds - continued |
| Principal Amount (e) | | Value |
Nonconvertible Bonds - continued |
FINANCIALS - continued |
Real Estate Investment Trusts - continued |
United Dominion Realty Trust, Inc.: - continued | | | | |
5.25% 1/15/15 | | $ 1,000,000 | | $ 1,081,156 |
5.25% 1/15/16 | | 4,000,000 | | 4,295,948 |
Weingarten Realty Investors 4.857% 1/15/14 | | 2,500,000 | | 2,668,495 |
| | 144,182,161 |
Real Estate Management & Development - 4.6% |
AMB Property LP 5.9% 8/15/13 | | 400,000 | | 428,900 |
BioMed Realty LP 3.85% 4/15/16 | | 2,000,000 | | 2,050,064 |
Brandywine Operating Partnership LP: | | | | |
5.4% 11/1/14 | | 6,750,000 | | 7,269,899 |
5.75% 4/1/12 | | 1,000,000 | | 1,026,487 |
7.5% 5/15/15 | | 1,000,000 | | 1,158,969 |
CB Richard Ellis Services, Inc.: | | | | |
6.625% 10/15/20 | | 1,205,000 | | 1,232,113 |
11.625% 6/15/17 | | 1,500,000 | | 1,740,000 |
Colonial Properties Trust: | | | | |
6.15% 4/15/13 | | 1,500,000 | | 1,576,538 |
6.25% 6/15/14 | | 3,094,000 | | 3,333,528 |
6.875% 8/15/12 | | 1,000,000 | | 1,038,582 |
Colonial Realty LP 6.05% 9/1/16 | | 2,500,000 | | 2,658,675 |
Duke Realty LP: | | | | |
6.25% 5/15/13 | | 750,000 | | 806,309 |
7.375% 2/15/15 | | 1,500,000 | | 1,725,500 |
Forest City Enterprises, Inc.: | | | | |
6.5% 2/1/17 | | 15,120,000 | | 14,326,200 |
7.625% 6/1/15 | | 4,180,000 | | 4,159,100 |
Highwoods/Forsyth LP 5.85% 3/15/17 | | 2,800,000 | | 3,102,655 |
Host Hotels & Resorts, Inc.: | | | | |
5.875% 6/15/19 (g) | | 2,725,000 | | 2,779,500 |
6.875% 11/1/14 | | 500,000 | | 511,250 |
9% 5/15/17 | | 750,000 | | 843,750 |
Liberty Property LP 6.375% 8/15/12 | | 2,679,000 | | 2,806,727 |
Post Apartment Homes LP: | | | | |
5.45% 6/1/12 | | 713,000 | | 731,921 |
6.3% 6/1/13 | | 2,000,000 | | 2,140,672 |
Realogy Corp. 7.875% 2/15/19 (g) | | 2,035,000 | | 2,004,475 |
Regency Centers LP: | | | | |
5.25% 8/1/15 | | 4,509,000 | | 4,966,542 |
Corporate Bonds - continued |
| Principal Amount (e) | | Value |
Nonconvertible Bonds - continued |
FINANCIALS - continued |
Real Estate Management & Development - continued |
Regency Centers LP: - continued | | | | |
5.875% 6/15/17 | | $ 400,000 | | $ 451,781 |
Toys 'R' Us Property Co. II LLC 8.5% 12/1/17 | | 1,000,000 | | 1,070,000 |
Ventas Realty LP: | | | | |
Series 1, 6.5% 6/1/16 | | 11,370,000 | | 11,808,825 |
3.125% 11/30/15 | | 1,500,000 | | 1,527,668 |
Wells Operating Partnership II LP 5.875% 4/1/18 (g) | | 3,000,000 | | 3,196,224 |
| | 82,472,854 |
Thrifts & Mortgage Finance - 0.1% |
Wrightwood Capital LLC 9% 6/1/14 (d)(g) | | 4,000,000 | | 1,400,000 |
TOTAL FINANCIALS | | 241,080,765 |
HEALTH CARE - 1.0% |
Health Care Equipment & Supplies - 0.3% |
Aviv Healthcare Properties LP 7.75% 2/15/19 (g) | | 5,290,000 | | 5,382,575 |
Health Care Providers & Services - 0.7% |
Sabra Health Care LP/Sabra Capital Corp. 8.125% 11/1/18 | | 9,245,000 | | 9,383,675 |
Skilled Healthcare Group, Inc. 11% 1/15/14 | | 3,080,000 | | 3,164,700 |
| | 12,548,375 |
TOTAL HEALTH CARE | | 17,930,950 |
TOTAL NONCONVERTIBLE BONDS | | 379,567,635 |
TOTAL CORPORATE BONDS (Cost $448,273,114) | 476,523,442 |
Asset-Backed Securities - 6.0% |
|
Anthracite CDO I Ltd. Series 2002-CIBA Class B, 6.633% 5/24/37 (g) | | 1,384,000 | | 1,356,320 |
Anthracite CDO III Ltd./Anthracite CDO III Corp. Series 2004-1A Class A, 0.5473% 3/23/19 (g)(i) | | 327,274 | | 281,456 |
Capital Trust RE CDO Ltd. Series 2005-1A Class D, 1.6863% 3/20/50 (g)(i) | | 2,250,000 | | 101,250 |
Capital Trust RE CDO Ltd./Capital Trust RE CDO Corp. Series 2005-3A Class A2, 5.16% 6/25/35 (g) | | 6,875,000 | | 6,905,938 |
Asset-Backed Securities - continued |
| Principal Amount (e) | | Value |
CapitalSource Real Estate Loan Trust Series 2006-1A Class A2A, 0.4358% 1/20/37 (g)(i) | | $ 1,397,997 | | $ 1,132,377 |
CapLease CDO Ltd. Series 2005-1A Class A, 4.926% 1/29/40 (g) | | 1,927,285 | | 1,638,192 |
CBRE Realty Finance CDO 2007-1/LLC 0.4958% 4/7/52 (g)(i) | | 24,017,635 | | 14,950,978 |
Conseco Finance Securitizations Corp. Series 2002-2 Class M2, 9.163% 3/1/33 | | 500,000 | | 295,196 |
Crest Clarendon Street Ltd./Crest Clarendon Corp. Series 2002-1A: | | | | |
Class B1, 6.065% 12/28/35 (g) | | 1,570,000 | | 1,193,200 |
Class B2, 1.5963% 12/28/35 (g)(i) | | 1,575,000 | | 996,188 |
Class D, 9% 12/28/35 (g) | | 505,579 | | 126,395 |
Crest Dartmouth Street Ltd./Crest Dartmouth Street Corp. Series 2003-1A: | | | | |
Class B1, 1.7463% 6/28/38 (g)(i) | | 1,230,000 | | 1,112,535 |
Class D, 9% 6/28/38 (g) | | 997,000 | | 697,900 |
Crest Ltd. Series 2002-IGA: | | | | |
Class A, 0.7026% 7/28/17 (g)(i) | | 71,484 | | 70,621 |
Class B, 1.6026% 7/28/35 (g)(i) | | 1,500,000 | | 1,462,500 |
Deutsche Financial Capital Securitization LLC Series 1997-I Class M, 7.275% 9/15/27 | | 9,500,000 | | 8,457,234 |
Fairfield Street Solar Corp. Series 2004-1A Class E1, 3.619% 11/28/39 (g)(i) | | 550,000 | | 16,500 |
Green Tree Financial Corp.: | | | | |
Series 1996-4 Class M1, 7.75% 6/15/27 | | 1,788,179 | | 1,643,693 |
Series 1997-3 Class M1, 7.53% 3/15/28 | | 7,793,391 | | 6,133,445 |
GSR Mortgage Loan Trust Series 2005-HE3 Class B3, 2.6873% 6/25/35 (i)(j) | | 1,259,000 | | 62,777 |
Guggenheim Structured Real Estate Funding Ltd./Guggenheim Structured Real Estate Funding LLC Series 2005-2A: | | | | |
Class D, 1.7373% 8/26/30 (g)(i) | | 761,339 | | 114,201 |
Class E, 2.1873% 8/26/30 (g)(i) | | 1,489,284 | | 48,402 |
Lehman ABS Manufactured Housing Contract Trust Series 2001-B Class M2, 7.17% 3/15/28 | | 1,294,122 | | 519,477 |
Merit Securities Corp. Series 13 Class M1, 7.9245% 12/28/33 (i) | | 1,923,000 | | 1,833,312 |
N-Star Real Estate CDO Ltd. Series 1A Class C1B, 7.696% 8/28/38 (g) | | 883,000 | | 677,349 |
Newcastle Investment Trust Series 2011-MH1 Class A, 2.45% 12/10/33 (g) | | 4,707,451 | | 4,725,104 |
Asset-Backed Securities - continued |
| Principal Amount (e) | | Value |
Prima Capital CDO Ltd./Prima Capital CDO Corp. Series 2005-1A: | | | | |
Class A2, 4.646% 7/24/39 (g) | | $ 809,410 | | $ 807,386 |
Class D, 5.194% 7/24/39 (g) | | 4,590,000 | | 4,406,400 |
Taberna Preferred Funding III Ltd. Series 2005-3A Class D, 2.9223% 2/5/36 (g)(i) | | 3,473,616 | | 347 |
TIAA Real Estate CDO Ltd./TIAA Real Estate CDO Corp. Series 2002-1A Class IIFX, 6.77% 5/22/37 (g) | | 3,165,000 | | 3,172,913 |
Wachovia Ltd./Wachovia LLC: | | | | |
Series 2006-1 Class 1ML, 0% 9/25/26 (g)(i) | | 2,000,000 | | 860,000 |
Series 2006-1A: | | | | |
Class A1A, 0.5065% 9/25/26 (g)(i) | | 20,558,000 | | 17,782,670 |
Class A1B, 0.5765% 9/25/26 (g)(i) | | 6,285,000 | | 5,090,850 |
Class A2A, 0.4665% 9/25/26 (g)(i) | | 9,385,000 | | 8,352,650 |
Wrightwood Capital Real Estate CDO Ltd. Series 2005-1A: | | | | |
Class A1, 0.5785% 11/21/40 (g)(i) | | 10,500,000 | | 9,345,000 |
Class F, 2.2085% 11/21/40 (g)(i) | | 250,000 | | 75,000 |
TOTAL ASSET-BACKED SECURITIES (Cost $112,500,724) | 106,445,756 |
Collateralized Mortgage Obligations - 1.5% |
|
Private Sponsor - 1.5% |
Banc of America Large Loan, Inc. Series 2005-MIB1 Class A2, 0.3965% 3/15/22 (g)(i) | | 502,063 | | 501,392 |
COMM pass-thru certificates Series 2007-FL14 Class AJ, 0.3665% 6/15/22 (g)(i) | | 3,250,000 | | 2,959,813 |
Countrywide Home Loans, Inc.: | | | | |
Series 2002-38 Class B3, 5% 2/25/18 (g) | | 85,893 | | 28,779 |
Series 2002-R2 Class 2B3, 4.1067% 7/25/33 (g)(i) | | 224,890 | | 89,261 |
Series 2003-40 Class B3, 4.5% 10/25/18 (g) | | 131,174 | | 66,343 |
Series 2003-R2 Class B3, 5.5% 5/25/43 (g) | | 157,480 | | 4,506 |
Series 2003-R3: | | | | |
Class B2, 5.5% 11/25/33 (g) | | 1,505,859 | | 334,586 |
Class B3, 5.5% 11/25/33 | | 245,438 | | 18,024 |
Series 2004-R1 Class 1B3, 5.5% 11/25/34 (g)(i) | | 175,868 | | 4,700 |
FREMF Mortgage Trust: | | | | |
Series 2010 K7 Class B, 5.4347% 4/25/20 (g)(i) | | 1,500,000 | | 1,505,811 |
Series 2010-K6 Class B, 5.5324% 12/26/46 (g)(i) | | 4,500,000 | | 4,511,809 |
Merrill Lynch Floating Trust floater Series 2006-1 Class TM, 0.687% 6/15/22 (g)(i) | | 6,222,957 | | 5,974,039 |
Collateralized Mortgage Obligations - continued |
| Principal Amount (e) | | Value |
Private Sponsor - continued |
Merrill Lynch Mortgage Investors Trust Series 1998-C3 Class F, 6% 12/15/30 (g) | | $ 7,120,000 | | $ 7,262,400 |
Merrill Lynch Mortgage Trust Series 2002-MW1 Class E, 6.219% 7/12/34 (g) | | 1,600,000 | | 1,623,527 |
RESI Finance LP/RESI Finance DE Corp. floater: | | | | |
Series 2003-B Class B9, 12.1358% 7/10/35 (g)(i) | | 436,056 | | 364,107 |
Series 2005-A Class B6, 2.1858% 3/10/37 (g)(i) | | 1,602,399 | | 432,648 |
Series 2005-B Class B6, 1.7858% 6/10/37 (g)(i) | | 877,985 | | 70,590 |
Series 2005-D Class B6, 2.4365% 12/15/37 (g)(i) | | 443,739 | | 5,902 |
Residential Funding Securities Corp. Series 2002-RM1 Class BI1, 5.5% 12/25/17 (g) | | 62,752 | | 53,207 |
RESIX Finance Ltd. floater: | | | | |
Series 2003-D Class B8, 6.6858% 12/10/35 (g)(i) | | 408,263 | | 220,462 |
Series 2004-A Class B7, 4.4358% 2/10/36 (g)(i) | | 432,933 | | 243,741 |
Series 2004-B Class B7, 4.1858% 2/10/36 (g)(i) | | 525,206 | | 288,863 |
Series 2005-C Class B7, 3.2858% 9/10/37 (g)(i) | | 1,811,314 | | 45,283 |
TOTAL PRIVATE SPONSOR | | 26,609,793 |
U.S. Government Agency - 0.0% |
Fannie Mae REMIC Trust: | | | | |
Series 2001-W3 subordinate REMIC pass thru certificates, Class B3, 7% 9/25/41 (j) | | 181,629 | | 52,747 |
Series 2002-W1 subordinate REMIC pass thru certificates, Class 3B3, 3.7279% 2/25/42 (g)(i) | | 113,310 | | 48,651 |
Series 2003-W1 subordinate REMIC pass thru certificates, Class B3, 5.75% 12/25/42 (j) | | 258,627 | | 69,440 |
Series 2003-W10 subordinate REMIC pass thru certificates, Class 2B3, 3.7969% 6/25/43 (g)(i) | | 161,769 | | 65,611 |
Series 2003-W4 subordinate REMIC pass thru certificates, Class 2B3, 3.8751% 10/25/42 (g)(i) | | 70,645 | | 26,145 |
TOTAL U.S. GOVERNMENT AGENCY | | 262,594 |
TOTAL COLLATERALIZED MORTGAGE OBLIGATIONS (Cost $31,621,056) | 26,872,387 |
Commercial Mortgage Securities - 19.3% |
|
ACGS Series 2004-1 Class P, 7.4651% 8/1/19 (j) | | 6,369,196 | | 6,128,361 |
Americold LLC Trust Series 2010-ARTA Class D, 7.443% 1/14/29 (g) | | 2,000,000 | | 2,029,557 |
Commercial Mortgage Securities - continued |
| Principal Amount (e) | | Value |
Asset Securitization Corp. Series 1997-D4: | | | | |
Class B1, 7.525% 4/14/29 | | $ 1,565,000 | | $ 1,611,921 |
Class B2, 7.525% 4/14/29 | | 560,000 | | 576,868 |
Banc of America Commercial Mortgage, Inc.: | | | | |
sequential payer Series 2002-2 Class F, 5.487% 7/11/43 | | 4,185,000 | | 4,249,757 |
Series 2005-1 Class CJ, 5.3521% 11/10/42 (i) | | 3,580,000 | | 3,562,197 |
Series 2005-6 Class AJ, 5.1947% 9/10/47 (i) | | 5,000,000 | | 4,768,485 |
Banc of America Large Loan Trust floater Series 2010-HLTN Class HLTN, 1.937% 11/15/15 (g)(i) | | 46,621,689 | | 43,353,492 |
Banc of America Large Loan, Inc. floater Series 2005-MIB1: | | | | |
Class J, 1.2365% 3/15/22 (g)(i) | | 2,000,000 | | 1,780,000 |
Class K, 2.1865% 3/15/22 (g)(i) | | 4,190,000 | | 3,435,800 |
Bear Stearns Commercial Mortgage Securities, Inc. Series 2006-PW11 Class AJ, 5.4525% 3/11/39 (i) | | 5,700,000 | | 5,364,842 |
Bear Stearns Commercial Mortgage Securities Trust Series 2006-T22 Class B, 5.7067% 4/12/38 (g)(i) | | 2,520,000 | | 2,281,977 |
Citigroup/Deutsche Bank Commercial Mortgage Trust Series 2006-CD2 Class VPM2, 5.8052% 1/15/46 (g)(i) | | 3,500,000 | | 3,126,020 |
COMM pass-thru certificates: | | | | |
floater Series 2006-FL12 Class AJ, 0.3165% 12/15/20 (g)(i) | | 8,000,000 | | 7,320,000 |
sequential payer Series 2004-RS1 Class A, 5.648% 3/3/41 (g) | | 9,621,611 | | 9,549,449 |
Series 2001-J1A Class F, 6.8296% 2/16/34 (g)(i) | | 2,600,000 | | 2,618,331 |
Communication Mortgage Trust Series 2011-THL Class F, 4.867% 6/9/28 (g) | | 11,090,000 | | 9,739,096 |
Credit Suisse First Boston Mortgage Securities Corp. Series 1998-C2 Class F, 6.75% 11/11/30 (g) | | 3,000,000 | | 3,250,432 |
CRESI Finance Ltd. Partnership floater Series 2006-A Class E, 1.8373% 3/25/17 (g)(i) | | 2,512,000 | | 2,071,615 |
CRESIX Finance Ltd. Series 2006-AA: | | | | |
Class F, 4.3873% 3/25/17 (g)(i) | | 3,860,000 | | 3,090,413 |
Class G, 7.1873% 3/25/17 (g)(i) | | 3,272,000 | | 2,078,743 |
Crest Ltd. Series 2001-1A Class C, 9% 2/25/34 (g) | | 1,000,000 | | 690,000 |
DBUBS Mortgage Trust Series 2011-LC1A Class E, 5.7285% 11/10/46 (g)(i) | | 2,980,000 | | 2,638,493 |
Deutsche Mortgage & Asset Receiving Corp. Series 1998-C1 Class J, 6.22% 6/15/31 | | 1,200,000 | | 998,835 |
DLJ Commercial Mortgage Corp.: | | | | |
Series 1998-CG1 Class B4, 7.2203% 6/10/31 (g)(i) | | 2,500,000 | | 2,634,334 |
Series 2000-CKP1 Class B3, 7.958% 11/10/33 (i) | | 2,970,000 | | 2,962,457 |
Commercial Mortgage Securities - continued |
| Principal Amount (e) | | Value |
Extended Stay America Trust Series 2010-ESHA, Class C4, 4.8603% 11/5/27 (g) | | $ 5,000,000 | | $ 5,020,515 |
FHLMC Multifamily Structured pass-thru Certificates: | | | | |
Series K013 Class X3, 2.884% 1/25/43 (h)(i) | | 14,360,000 | | 2,472,370 |
Series KAIV Class X2, 3.614% 6/25/41 (h)(i) | | 7,430,000 | | 1,688,096 |
First Union National Bank Commercial Mortgage Trust Series 2001-C4: | | | | |
Class H, 7.036% 12/12/33 (g) | | 2,000,000 | | 2,009,696 |
Class K, 6% 12/12/33 (g) | | 2,000,000 | | 1,992,651 |
Freddie Mac Multi-class participation certificates guaranteed: | | | | |
Series K011 Class X3, 2.5747% 12/25/43 (h)(i) | | 12,206,096 | | 1,957,810 |
Series K012 Class X3, 2.2876% 1/25/41 (h)(i) | | 21,072,888 | | 2,990,454 |
G-Force LLC sequential payer Series 2005-RRA Class A2, 4.83% 8/22/36 (g) | | 12,783,602 | | 12,464,012 |
GE Capital Commercial Mortgage Corp.: | | | | |
Series 2001-3 Class C, 6.51% 6/10/38 | | 820,000 | | 826,315 |
Series 2002-1A Class H, 7.123% 12/10/35 (g)(i) | | 991,000 | | 998,737 |
GMAC Commercial Mortgage Securities, Inc.: | | | | |
Series 1997-C2: | | | | |
Class F, 6.75% 4/15/29 (i) | | 1,738,931 | | 1,808,639 |
Class G, 6.75% 4/15/29 (i) | | 1,250,000 | | 1,393,740 |
Series 1999-C3: | | | | |
Class G, 6.974% 8/15/36 (g) | | 689,776 | | 692,433 |
Class J, 6.974% 8/15/36 | | 1,500,000 | | 1,505,037 |
Series 2000-C1 Class K, 7% 3/15/33 | | 1,100,000 | | 785,170 |
Series 2002-C3 Class D, 5.27% 7/10/39 | | 3,000,000 | | 3,077,433 |
Greenwich Capital Commercial Funding Corp.: | | | | |
sequential payer Series 2003-C1 Class D, 4.29% 7/5/35 (g) | | 2,000,000 | | 2,071,825 |
Series 2002-C1 Class H, 5.903% 1/11/35 (g) | | 880,000 | | 893,762 |
GS Mortgage Securities Corp. II: | | | | |
floater Series 2007-EOP Class L, 6.4193% 3/6/20 (g)(i) | | 1,400,000 | | 1,393,865 |
Series 2010-C1 Class E, 4% 8/10/43 (g) | | 3,000,000 | | 2,140,054 |
GS Mortgage Securities Corp. Trust Series 2011-ALF Class E, 4.953% 2/10/21 (g) | | 5,000,000 | | 4,958,500 |
JP Morgan Chase Commercial Mortgage Securities Corp.: | | | | |
Series 2001-A: | | | | |
Class G, 6% 10/15/32 (g)(i) | | 2,895,000 | | 7,238 |
Class X, 0.9824% 10/15/32 (g)(h)(i) | | 7,141,456 | | 518 |
Series 2009-IWST Class D, 7.4453% 12/5/27 (g)(i) | | 5,000,000 | | 5,508,039 |
Commercial Mortgage Securities - continued |
| Principal Amount (e) | | Value |
JP Morgan Chase Commercial Mortgage Securities Corp.: - continued | | | | |
Series 2010-CNTM Class MZ, 8.5% 8/5/20 (g) | | $ 4,000,000 | | $ 3,896,926 |
Series 2010-CNTR: | | | | |
Class D, 6.1838% 8/5/32 (g)(i) | | 4,500,000 | | 4,100,884 |
Class XB, 0.9305% 8/5/32 (g)(h) | | 32,655,000 | | 1,777,297 |
JP Morgan Chase Commercial Mortgage Securities Trust floater Series 2005-FL1A Class A2, 0.3665% 2/15/19 (g)(i) | | 1,951,254 | | 1,914,134 |
JP Morgan Commercial Mortgage Finance Corp.: | | | | |
Series 1997-C5 Class F, 7.5605% 9/15/29 | | 1,392,544 | | 1,437,258 |
Series 1999-C8: | | | | |
Class G, 6% 7/15/31 (g) | | 1,385,000 | | 1,378,920 |
Class H, 6% 7/15/31 (g) | | 1,305,511 | | 9,139 |
LB Commercial Conduit Mortgage Trust Series 1998-C4 Class G, 5.6% 10/15/35 (g) | | 2,920,000 | | 3,070,380 |
LB-UBS Commercial Mortgage Trust: | | | | |
sequential payer: | | | | |
Series 2004-C2 Class E, 4.487% 3/15/36 | | 2,060,000 | | 2,022,379 |
Series 2005-C7 Class AJ, 5.323% 11/15/40 | | 6,000,000 | | 5,620,226 |
Series 2006-C7 Class AM, 5.378% 11/15/38 | | 2,040,000 | | 2,018,671 |
Series 2005-C2 Class AJ, 5.205% 4/15/30 (i) | | 8,910,000 | | 8,696,821 |
Series 2006-C4: | | | | |
Class AJ, 6.0868% 6/15/38 (i) | | 6,005,000 | | 5,357,749 |
Class AM, 6.0868% 6/15/38 (i) | | 6,700,000 | | 6,911,831 |
Lstar Commercial Mortgage Trust: | | | | |
Series 2011-1 Class D, 5.7457% 6/25/43 (g)(i) | | 4,699,000 | | 3,446,830 |
Series 2011-1 Class B, 5.7457% 6/25/43 (g)(i) | | 5,720,000 | | 5,282,128 |
Merrill Lynch Financial Asset, Inc. Series 2005-CA16: | | | | |
Class F, 4.384% 7/12/37 | CAD | 710,000 | | 505,215 |
Class G, 4.384% 7/12/37 | CAD | 355,000 | | 244,471 |
Class H, 4.384% 7/12/37 | CAD | 236,000 | | 157,324 |
Class J, 4.384% 7/12/37 | CAD | 355,000 | | 229,135 |
Class K, 4.384% 7/12/37 | CAD | 355,000 | | 221,908 |
Class L, 4.384% 7/12/37 | CAD | 236,000 | | 142,901 |
Class M, 4.384% 7/12/37 | CAD | 995,000 | | 457,431 |
Merrill Lynch Mortgage Investors Trust Series 1999-C1 Class G, 6.71% 11/15/31 (g) | | 3,143,926 | | 1,697,720 |
Merrill Lynch Mortgage Trust Series 2006-C1 Class AM, 5.6735% 5/12/39 (i) | | 1,200,000 | | 1,243,122 |
Mezz Capital Commercial Mortgage Trust Series 2004-C1: | | | | |
Class D, 6.988% 1/15/37 (g) | | 750,000 | | 75 |
Commercial Mortgage Securities - continued |
| Principal Amount (e) | | Value |
Mezz Capital Commercial Mortgage Trust Series 2004-C1: - continued | | | | |
Class E, 7.983% 1/15/37 (g) | | $ 1,453,000 | | $ 145 |
Class IO, 8.1746% 1/15/37 (h)(i) | | 5,165,671 | | 309,940 |
Morgan Stanley Capital I Trust: | | | | |
sequential payer: | | | | |
Series 2004-RR2 Class A2, 5.45% 10/28/33 (g) | | 1,718,316 | | 1,683,949 |
Series 2006-HQ10 Class AM, 5.36% 11/12/41 | | 8,200,000 | | 8,263,698 |
Series 1997-RR Class F, 7.4021% 4/30/39 (g)(i) | | 2,151,136 | | 2,097,357 |
Series 1998-CF1 Class G, 7.35% 7/15/32 (g) | | 2,602,314 | | 1,431,273 |
Series 2006-IQ12 Class AMFX, 5.37% 12/15/43 | | 7,500,000 | | 6,975,150 |
Series 2011-C2: | | | | |
Class D, 5.319% 6/15/44 (g)(i) | | 4,610,000 | | 4,161,954 |
Class E, 5.319% 6/15/44 (g)(i) | | 6,600,000 | | 5,676,000 |
Class F, 5.319% 6/15/44 (g)(i) | | 4,440,000 | | 3,352,200 |
Class XB, 0.465% 6/15/44 (g)(h)(i) | | 63,708,222 | | 2,125,306 |
NationsLink Funding Corp. Series 1999-SL Class X, 11/10/30 (h) | | 3,132,059 | | 2,818,853 |
Providence Place Group Ltd. Partnership Series 2000-C1 Class A2, 7.75% 7/20/28 (g) | | 3,375,238 | | 3,746,177 |
RBSCF Trust Series 2010-MB1 Class D, 4.8254% 4/15/24 (g)(i) | | 5,820,000 | | 5,815,344 |
Salomon Brothers Mortgage Securities VII, Inc. Series 2001-MMA: | | | | |
Class E3, 6.5% 2/18/34 (g)(i) | | 3,000,000 | | 3,062,209 |
Class E5, 6.5% 2/18/34 (g)(i) | | 3,000,000 | | 3,079,962 |
Structured Asset Securities Corp. Series 1997-LLI Class F, 7.3% 10/12/34 (g) | | 2,170,000 | | 2,187,578 |
TIAA Seasoned Commercial Mortgage Trust sequential payer Series 2007-C4 Class AJ, 5.9788% 8/15/39 (i) | | 2,080,000 | | 2,054,505 |
TimberStar Trust I Series 2006-1 Class F, 7.5296% 10/15/36 (g) | | 10,630,000 | | 11,161,500 |
UBS Commercial Mortgage Trust Series 2007-FL1 Class F, 0.7615% 7/15/24 (g)(i) | | 1,200,000 | | 481,819 |
Vornado DP LLC Series 2010-VNO Class D, 6.3555% 9/13/28 (g) | | 2,540,000 | | 2,516,273 |
Wachovia Bank Commercial Mortgage Trust: | | | | |
Series 2004-C10 Class E, 4.931% 2/15/41 | | 2,000,000 | | 2,003,088 |
Series 2004-C11: | | | | |
Class D, 5.5477% 1/15/41 (i) | | 5,177,000 | | 5,029,636 |
Class E, 5.5977% 1/15/41 (i) | | 3,785,000 | | 3,352,191 |
Series 2004-C12 Class D, 5.512% 7/15/41 (i) | | 2,750,000 | | 2,623,939 |
Commercial Mortgage Securities - continued |
| Principal Amount (e) | | Value |
Wachovia Bank Commercial Mortgage Trust: - continued | | | | |
Series 2004-C14 Class B, 5.17% 8/15/41 | | $ 3,180,000 | | $ 3,307,999 |
WFDB Commercial Mortgage Trust Series 2011-BXR Class D, 5.914% 7/5/24 (g) | | 4,000,000 | | 3,999,968 |
TOTAL COMMERCIAL MORTGAGE SECURITIES (Cost $342,174,310) | 345,727,272 |
Floating Rate Loans - 4.0% |
|
CONSUMER DISCRETIONARY - 0.7% |
Hotels, Restaurants & Leisure - 0.5% |
Extended Stay America, Inc. term loan 9.75% 11/1/15 | | 9,000,000 | | 9,000,000 |
Media - 0.1% |
PRIMEDIA, Inc. Tranche B, term loan 7.5% 1/13/18 (i) | | 2,850,000 | | 2,736,000 |
Specialty Retail - 0.1% |
The Pep Boys - Manny, Moe & Jack term loan 2.25% 10/27/13 (i) | | 1,981,937 | | 1,979,459 |
TOTAL CONSUMER DISCRETIONARY | | 13,715,459 |
FINANCIALS - 2.0% |
Diversified Financial Services - 0.7% |
Capital Automotive LP term loan 5% 3/11/17 (i) | | 8,399,826 | | 8,399,826 |
Pilot Travel Centers LLC Tranche B, term loan 4.25% 3/30/18 (i) | | 4,000,000 | | 4,005,200 |
| | 12,405,026 |
Real Estate Investment Trusts - 0.1% |
iStar Financial, Inc. Tranche A 1LN, term loan 5% 6/28/13 (i) | | 1,487,111 | | 1,461,086 |
Real Estate Management & Development - 1.2% |
CB Richard Ellis Group, Inc. Tranche B, term loan 3.4358% 11/9/16 (i) | | 1,709,594 | | 1,709,594 |
CB Richard Ellis Services, Inc. Tranche D, term loan 3.6851% 9/4/19 (i) | | 4,000,000 | | 3,955,000 |
Equity Inns Reality LLC: | | | | |
Tranche A, term loan 9% 11/2/12 (i) | | 2,000,000 | | 1,797,500 |
Tranche B 2LN, term loan 6.05% 11/2/12 (i) | | 5,000,000 | | 4,593,750 |
Realogy Corp.: | | | | |
Credit-Linked Deposit 3.1856% 10/10/13 (i) | | 620,304 | | 589,288 |
Credit-Linked Deposit 4.4356% 10/10/16 (i) | | 210,842 | | 191,339 |
term loan 4.5183% 10/10/16 (i) | | 1,249,372 | | 1,133,805 |
Floating Rate Loans - continued |
| Principal Amount (e) | | Value |
FINANCIALS - continued |
Real Estate Management & Development - continued |
Realogy Corp.: - continued | | | | |
Tranche 2LN, term loan 13.5% 10/15/17 | | $ 2,500,000 | | $ 2,637,500 |
Tranche B, term loan 3.2683% 10/10/13 (i) | | 5,234,332 | | 4,972,616 |
| | 21,580,392 |
TOTAL FINANCIALS | | 35,446,504 |
HEALTH CARE - 0.5% |
Health Care Providers & Services - 0.5% |
Community Health Systems, Inc.: | | | | |
Tranche B, term loan 2.504% 7/25/14 (i) | | 2,844,254 | | 2,755,371 |
Tranche DD, term loan 2.504% 7/25/14 (i) | | 146,026 | | 141,463 |
Skilled Healthcare Group, Inc. term loan 5.25% 4/9/16 (i) | | 3,738,937 | | 3,748,284 |
Universal Health Services, Inc. term loan 4% 11/15/16 (i) | | 1,908,343 | | 1,908,343 |
| | 8,553,461 |
INDUSTRIALS - 0.6% |
Construction & Engineering - 0.6% |
Drumm Investors LLC Tranche B, term loan 5% 5/4/18 (i) | | 12,000,000 | | 11,595,000 |
TELECOMMUNICATION SERVICES - 0.2% |
Wireless Telecommunication Services - 0.2% |
TowerCo Finance LLC Tranche B, term loan 5.25% 2/2/17 (i) | | 2,992,500 | | 2,992,500 |
TOTAL FLOATING RATE LOANS (Cost $69,310,921) | 72,302,924 |
Preferred Securities - 0.0% |
| | | |
FINANCIALS - 0.0% |
Diversified Financial Services - 0.0% |
Crest Clarendon Street 2002-1 Ltd. Series 2002-1A Class PS, 12/28/35 (g) | 500,000 | | 15,000 |
Crest Dartmouth Street 2003 1 Ltd. Series 2003-1A Class PS, 6/28/38 (g) | 1,220,000 | | 427,000 |
Preferred Securities - continued |
| Principal Amount (e) | | Value |
FINANCIALS - continued |
Diversified Financial Services - continued |
Harp High Grade CDO I Ltd. Series 2006-1, 7/8/46 (g) | $ 810,000 | | $ 8 |
Ipswich Street CDO Series 2006-1, 6/27/46 (d)(g) | 1,350,000 | | 0 |
| | 442,008 |
TOTAL PREFERRED SECURITIES (Cost $3,377,499) | 442,008 |
Money Market Funds - 9.8% |
| Shares | | |
Fidelity Cash Central Fund, 0.14% (b) | 138,042,360 | | 138,042,360 |
Fidelity Securities Lending Cash Central Fund, 0.15% (b)(c) | 38,026,262 | | 38,026,262 |
TOTAL MONEY MARKET FUNDS (Cost $176,068,622) | 176,068,622 |
TOTAL INVESTMENT PORTFOLIO - 102.0% (Cost $1,750,859,783) | | 1,828,418,003 |
NET OTHER ASSETS (LIABILITIES) - (2.0)% | | (35,608,954) |
NET ASSETS - 100% | $ 1,792,809,049 |
Currency Abbreviations |
CAD | - | Canadian dollar |
Legend |
(a) Non-income producing |
(b) Affiliated fund that is available only to investment companies and other accounts managed by Fidelity Investments. The rate quoted is the annualized seven-day yield of the fund at period end. A complete unaudited listing of the fund's holdings as of its most recent quarter end is available upon request. In addition, each Fidelity Central Fund's financial statements, which are not covered by the Fund's Report of Independent Registered Public Accounting Firm, are available on the SEC's website or upon request. |
(c) Investment made with cash collateral received from securities on loan. |
(d) Non-income producing - Security is in default. |
(e) Principal amount is stated in United States dollars unless otherwise noted. |
(f) Security or a portion of the security is on loan at period end. |
(g) Security exempt from registration under Rule 144A of the Securities Act of 1933. These securities may be resold in transactions exempt from registration, normally to qualified institutional buyers. At the end of the period, the value of these securities amounted to $437,234,266 or 24.4% of net assets. |
(h) Security represents right to receive monthly interest payments on an underlying pool of mortgages or assets. Principal shown is the outstanding par amount of the pool held as of the end of the period. |
(i) Coupon rates for floating and adjustable rate securities reflect the rates in effect at period end. |
(j) Restricted securities - Investment in securities not registered under the Securities Act of 1933 (excluding 144A issues). At the end of the period, the value of restricted securities (excluding 144A issues) amounted to $6,313,325 or 0.4% of net assets. |
Additional information on each restricted holding is as follows: |
Security | Acquisition Date | Acquisition Cost |
ACGS Series 2004-1 Class P, 7.4651% 8/1/19 | 2/17/11 | $ 6,167,702 |
Fannie Mae REMIC Trust Series 2001-W3 subordinate REMIC pass thru certificates, Class B3, 7% 9/25/41 | 5/21/03 | $ 157,393 |
Fannie Mae REMIC Trust Series 2003-W1 subordinate REMIC pass thru certificates, Class B3, 5.75% 12/25/42 | 3/25/03 | $ 194,899 |
GSR Mortgage Loan Trust Series 2005-HE3 Class B3, 2.6873% 6/25/35 | 6/3/05 | $ 1,110,697 |
Affiliated Central Funds |
Information regarding fiscal year to date income earned by the Fund from investments in Fidelity Central Funds is as follows: |
Fund | Income earned |
Fidelity Cash Central Fund | $ 207,012 |
Fidelity Securities Lending Cash Central Fund | 34,762 |
Total | $ 241,774 |
Other Information |
The following is a summary of the inputs used, as of July 31, 2011, involving the Fund's assets and liabilities carried at fair value. The inputs or methodology used for valuing securities may not be an indication of the risk associated with investing in those securities. For more information on valuation inputs, and their aggregation into the levels used in the tables below, please refer to the Security Valuation section in the accompanying Notes to Financial Statements. |
Valuation Inputs at Reporting Date: |
Description | Total | Level 1 | Level 2 | Level 3 |
Investments in Securities: | | | | |
Equities: | | | | |
Consumer Discretionary | $ 16,655,507 | $ 13,126,936 | $ - | $ 3,528,571 |
Financials | 584,071,871 | 559,503,024 | 19,627,477 | 4,941,370 |
Health Care | 23,308,214 | 23,308,214 | - | - |
Corporate Bonds | 476,523,442 | - | 467,138,642 | 9,384,800 |
Asset-Backed Securities | 106,445,756 | - | 27,055,672 | 79,390,084 |
Collateralized Mortgage Obligations | 26,872,387 | - | 26,010,387 | 862,000 |
Commercial Mortgage Securities | 345,727,272 | - | 313,786,639 | 31,940,633 |
Floating Rate Loans | 72,302,924 | - | 63,302,924 | 9,000,000 |
Preferred Securities | 442,008 | - | - | 442,008 |
Money Market Funds | 176,068,622 | 176,068,622 | - | - |
Total Investments in Securities: | $ 1,828,418,003 | $ 772,006,796 | $ 916,921,741 | $ 139,489,466 |
The following is a reconciliation of Investments in Securities for which Level 3 inputs were used in determining value: |
Investments in Securities: | |
Equities - Consumer Discretionary | |
Beginning Balance | $ 3,696,000 |
Total Realized Gain (Loss) | - |
Total Unrealized Gain (Loss) | (167,429) |
Cost of Purchases | - |
Proceeds of Sales | - |
Amortization/Accretion | - |
Transfers in to Level 3 | - |
Transfers out of Level 3 | - |
Ending Balance | $ 3,528,571 |
The change in unrealized gain (loss) for the period attributable to Level 3 securities held at July 31, 2011 | $ (167,429) |
Equities - Financials | |
Beginning Balance | $ 3,922,244 |
Total Realized Gain (Loss) | - |
Total Unrealized Gain (Loss) | 1,019,250 |
Cost of Purchases | - |
Proceeds of Sales | - |
Amortization/Accretion | - |
Transfers in to Level 3 | - |
Transfers out of Level 3 | (124) |
Ending Balance | $ 4,941,370 |
The change in unrealized gain (loss) for the period attributable to Level 3 securities held at July 31, 2011 | $ 1,019,250 |
Corporate Bonds | |
Beginning Balance | $ 1,370,000 |
Total Realized Gain (Loss) | - |
Total Unrealized Gain (Loss) | 32,708 |
Cost of Purchases | 7,982,092 |
Proceeds of Sales | - |
Amortization/Accretion | - |
Transfers in to Level 3 | - |
Transfers out of Level 3 | - |
Ending Balance | $ 9,384,800 |
The change in unrealized gain (loss) for the period attributable to Level 3 securities held at July 31, 2011 | $ 32,708 |
Asset-Backed Securities | |
Beginning Balance | $ 16,886,956 |
Total Realized Gain (Loss) | 682,842 |
Total Unrealized Gain (Loss) | 2,505,703 |
Cost of Purchases | 52,080,640 |
Proceeds of Sales | (9,776,117) |
Amortization/Accretion | 839,401 |
Transfers in to Level 3 | 17,965,015 |
Transfers out of Level 3 | (1,794,356) |
Ending Balance | $ 79,390,084 |
The change in unrealized gain (loss) for the period attributable to Level 3 securities held at July 31, 2011 | $ 1,528,507 |
Collateralized Mortgage Obligations | |
Beginning Balance | $ 994,555 |
Total Realized Gain (Loss) | - |
Total Unrealized Gain (Loss) | 243,838 |
Cost of Purchases | - |
Proceeds of Sales | (340,705) |
Amortization/Accretion | (83,120) |
Transfers in to Level 3 | 47,432 |
Transfers out of Level 3 | - |
Ending Balance | $ 862,000 |
The change in unrealized gain (loss) for the period attributable to Level 3 securities held at July 31, 2011 | $ 243,838 |
Commercial Mortgage Securities | |
Beginning Balance | $ 12,252,746 |
Total Realized Gain (Loss) | (19,472) |
Total Unrealized Gain (Loss) | 1,649,186 |
Cost of Purchases | 23,418,959 |
Proceeds of Sales | (2,739,892) |
Amortization/Accretion | (109,801) |
Transfers in to Level 3 | 4,543,765 |
Transfers out of Level 3 | (7,054,858) |
Ending Balance | $ 31,940,633 |
The change in unrealized gain (loss) for the period attributable to Level 3 securities held at July 31, 2011 | $ 1,516,502 |
Floating Rate Loans | |
Beginning Balance | $ - |
Total Realized Gain (Loss) | - |
Total Unrealized Gain (Loss) | 62,914 |
Cost of Purchases | 8,928,750 |
Proceeds of Sales | - |
Amortization/Accretion | 8,336 |
Transfers in to Level 3 | - |
Transfers out of Level 3 | - |
Ending Balance | $ 9,000,000 |
The change in unrealized gain (loss) for the period attributable to Level 3 securities held at July 31, 2011 | $ 62,914 |
Preferred Securities | |
Beginning Balance | $ 365,608 |
Total Realized Gain (Loss) | (2,306,146) |
Total Unrealized Gain (Loss) | 2,480,412 |
Cost of Purchases | - |
Proceeds of Sales | (99,000) |
Amortization/Accretion | 1,134 |
Transfers in to Level 3 | - |
Transfers out of Level 3 | - |
Ending Balance | $ 442,008 |
The change in unrealized gain (loss) for the period attributable to Level 3 securities held at July 31, 2011 | $ 73,873 |
The information used in the above reconciliation represents fiscal year to date activity for any Investments in Securities identified as using Level 3 inputs at either the beginning or the end of the current fiscal period. Transfers in or out of Level 3 represent the beginning value of any Security or Instrument where a change in the pricing level occurred from the beginning to the end of the period. The cost of purchases and the proceeds of sales may include securities received or delivered through corporate actions or exchanges. Realized and unrealized gains (losses) disclosed in the reconciliation are included in Net Gain (Loss) on the Fund's Statement of Operations. |
The composition of credit quality ratings as a percentage of net assets is as follows (Unaudited): |
U.S. Government and U.S. Government Agency Obligations | 0.5% |
AAA,AA,A | 11.4% |
BBB | 14.5% |
BB | 5.8% |
B | 10.1% |
CCC,CC,C | 3.2% |
D | 0.1% |
Not Rated | 11.8% |
Equities | 34.8% |
Short-Term Investments and Net Other Assets | 7.8% |
| 100.0% |
We have used ratings from Moody's Investors Service, Inc. Where Moody's® ratings are not available, we have used S&P® ratings. All ratings are as of the date indicated and do not reflect subsequent changes. |
See accompanying notes which are an integral part of the financial statements.
Annual Report
Statement of Assets and Liabilities
| July 31, 2011 |
| | |
Assets | | |
Investment in securities, at value (including securities loaned of $35,928,878) - See accompanying schedule: Unaffiliated issuers (cost $1,574,791,161) | $ 1,652,349,381 | |
Fidelity Central Funds (cost $176,068,622) | 176,068,622 | |
Total Investments (cost $1,750,859,783) | | $ 1,828,418,003 |
Cash | | 323,241 |
Receivable for investments sold | | 2,833,712 |
Receivable for fund shares sold | | 3,470,591 |
Dividends receivable | | 901,540 |
Interest receivable | | 9,533,761 |
Distributions receivable from Fidelity Central Funds | | 16,392 |
Other receivables | | 16,716 |
Total assets | | 1,845,513,956 |
| | |
Liabilities | | |
Payable for investments purchased | $ 8,176,436 | |
Payable for fund shares redeemed | 5,093,296 | |
Accrued management fee | 834,868 | |
Distribution and service plan fees payable | 31,194 | |
Other affiliated payables | 466,030 | |
Other payables and accrued expenses | 76,821 | |
Collateral on securities loaned, at value | 38,026,262 | |
Total liabilities | | 52,704,907 |
| | |
Net Assets | | $ 1,792,809,049 |
Net Assets consist of: | | |
Paid in capital | | $ 1,688,797,987 |
Undistributed net investment income | | 20,642,579 |
Accumulated undistributed net realized gain (loss) on investments and foreign currency transactions | | 5,785,289 |
Net unrealized appreciation (depreciation) on investments and assets and liabilities in foreign currencies | | 77,583,194 |
Net Assets | | $ 1,792,809,049 |
See accompanying notes which are an integral part of the financial statements.
Annual Report
Statement of Assets and Liabilities - continued
| July 31, 2011 |
| | |
Calculation of Maximum Offering Price Class A:
Net Asset Value and redemption price per share ($60,282,886 ÷ 5,620,724 shares) | | $ 10.73 |
| | |
Maximum offering price per share (100/96.00 of $10.73) | | $ 11.18 |
Class T:
Net Asset Value and redemption price per share ($7,625,672 ÷ 711,056 shares) | | $ 10.72 |
| | |
Maximum offering price per share (100/96.00 of $10.72) | | $ 11.17 |
Class C:
Net Asset Value and offering price per share ($21,555,207 ÷ 2,019,275 shares)A | | $ 10.67 |
| | |
Real Estate Income:
Net Asset Value, offering price and redemption price per share ($1,660,063,375 ÷ 154,395,428 shares) | | $ 10.75 |
| | |
Institutional Class:
Net Asset Value, offering price and redemption price per share ($43,281,909 ÷ 4,029,852 shares) | | $ 10.74 |
A Redemption price per share is equal to net asset value less any applicable contingent deferred sales charge.
See accompanying notes which are an integral part of the financial statements.
Annual Report
Financial Statements - continued
Statement of Operations
| Year ended July 31, 2011 |
| | |
Investment Income | | |
Dividends | | $ 24,245,563 |
Interest | | 63,966,851 |
Income from Fidelity Central Funds | | 241,774 |
Total income | | 88,454,188 |
| | |
Expenses | | |
Management fee | $ 8,064,128 | |
Transfer agent fees | 4,177,653 | |
Distribution and service plan fees | 177,614 | |
Accounting and security lending fees | 582,960 | |
Custodian fees and expenses | 31,621 | |
Independent trustees' compensation | 7,337 | |
Registration fees | 231,380 | |
Audit | 159,849 | |
Legal | 4,712 | |
Interest | 326 | |
Miscellaneous | 13,078 | |
Total expenses before reductions | 13,450,658 | |
Expense reductions | (42,341) | 13,408,317 |
Net investment income (loss) | | 75,045,871 |
Realized and Unrealized Gain (Loss) Net realized gain (loss) on: | | |
Investment securities: | | |
Unaffiliated issuers | 26,478,722 | |
Foreign currency transactions | (4,405) | |
Total net realized gain (loss) | | 26,474,317 |
Change in net unrealized appreciation (depreciation) on: Investment securities | 63,155,032 | |
Assets and liabilities in foreign currencies | (714) | |
Total change in net unrealized appreciation (depreciation) | | 63,154,318 |
Net gain (loss) | | 89,628,635 |
Net increase (decrease) in net assets resulting from operations | | $ 164,674,506 |
See accompanying notes which are an integral part of the financial statements.
Annual Report
Statement of Changes in Net Assets
| Year ended
July 31,
2011 | Year ended
July 31,
2010 |
Increase (Decrease) in Net Assets | | |
Operations | | |
Net investment income (loss) | $ 75,045,871 | $ 41,516,164 |
Net realized gain (loss) | 26,474,317 | 20,625,469 |
Change in net unrealized appreciation (depreciation) | 63,154,318 | 102,855,727 |
Net increase (decrease) in net assets resulting
from operations | 164,674,506 | 164,997,360 |
Distributions to shareholders from net investment income | (66,688,371) | (40,150,798) |
Share transactions - net increase (decrease) | 655,640,999 | 450,504,667 |
Redemption fees | 331,332 | 230,512 |
Total increase (decrease) in net assets | 753,958,466 | 575,581,741 |
| | |
Net Assets | | |
Beginning of period | 1,038,850,583 | 463,268,842 |
End of period (including undistributed net investment income of $20,642,579 and undistributed net investment income of $11,035,447, respectively) | $ 1,792,809,049 | $ 1,038,850,583 |
See accompanying notes which are an integral part of the financial statements.
Annual Report
Financial Highlights - Class A
Years ended July 31, | 2011 | 2010 H |
Selected Per-Share Data | | |
Net asset value, beginning of period | $ 9.94 | $ 9.95 |
Income from Investment Operations | | |
Net investment income (loss) E | .53 | .18 |
Net realized and unrealized gain (loss) | .76 | (.04) |
Total from investment operations | 1.29 | .14 |
Distributions from net investment income | (.50) | (.15) |
Redemption fees added to paid in capital E, J | - | - |
Net asset value, end of period | $ 10.73 | $ 9.94 |
Total Return B, C, D | 13.27% | 1.46% |
Ratios to Average Net Assets F, I | | |
Expenses before reductions | 1.13% | 1.09% A |
Expenses net of fee waivers, if any | 1.13% | 1.09% A |
Expenses net of all reductions | 1.12% | 1.09% A |
Net investment income (loss) | 5.00% | 6.23% A |
Supplemental Data | | |
Net assets, end of period (000 omitted) | $ 60,283 | $ 3,830 |
Portfolio turnover rate G | 25% | 28% |
A Annualized
B Total returns for periods of less than one year are not annualized.
C Total returns would have been lower if certain expenses had not been reduced during the applicable periods shown.
D Total returns do not include the effect of the sales charges.
E Calculated based on average shares outstanding during the period.
F Fees and expenses of any underlying Fidelity Central Funds are not included in the Fund's expense ratio. The Fund indirectly bears its proportionate share of the expenses of any underlying Fidelity Central Funds.
G Amount does not include the portfolio activity of any underlying Fidelity Central Funds.
H For the period April 14, 2010 (commencement of sale of shares) to July 31, 2010.
I Expense ratios reflect operating expenses of the class. Expenses before reductions do not reflect amounts reimbursed by the investment adviser or reductions from brokerage service arrangements or reductions from other expense offset arrangements and do not represent the amount paid by the class during periods when reimbursements or reductions occur. Expense ratios before reductions for start-up periods may not be representative of longer-term operating periods. Expenses net of fee waivers reflect expenses after reimbursement by the investment adviser but prior to reductions from brokerage service arrangements or other expense offset arrangements. Expenses net of all reductions represent the net expenses paid by the class.
J Amount represents less than $.01 per share.
See accompanying notes which are an integral part of the financial statements.
Annual Report
Financial Highlights - Class T
Years ended July 31, | 2011 | 2010 H |
Selected Per-Share Data | | |
Net asset value, beginning of period | $ 9.94 | $ 9.95 |
Income from Investment Operations | | |
Net investment income (loss) E | .52 | .17 |
Net realized and unrealized gain (loss) | .76 | (.03) |
Total from investment operations | 1.28 | .14 |
Distributions from net investment income | (.50) | (.15) |
Redemption fees added to paid in capital E, J | - | - |
Net asset value, end of period | $ 10.72 | $ 9.94 |
Total Return B, C, D | 13.11% | 1.45% |
Ratios to Average Net Assets F, I | | |
Expenses before reductions | 1.16% | 1.17% A |
Expenses net of fee waivers, if any | 1.16% | 1.17% A |
Expenses net of all reductions | 1.16% | 1.17% A |
Net investment income (loss) | 4.96% | 5.92% A |
Supplemental Data | | |
Net assets, end of period (000 omitted) | $ 7,626 | $ 862 |
Portfolio turnover rate G | 25% | 28% |
A Annualized
B Total returns for periods of less than one year are not annualized.
C Total returns would have been lower if certain expenses had not been reduced during the applicable periods shown.
D Total returns do not include the effect of the sales charges.
E Calculated based on average shares outstanding during the period.
F Fees and expenses of any underlying Fidelity Central Funds are not included in the Fund's expense ratio. The Fund indirectly bears its proportionate share of the expenses of any underlying Fidelity Central Funds.
G Amount does not include the portfolio activity of any underlying Fidelity Central Funds.
H For the period April 14, 2010 (commencement of sale of shares) to July 31, 2010.
I Expense ratios reflect operating expenses of the class. Expenses before reductions do not reflect amounts reimbursed by the investment adviser or reductions from brokerage service arrangements or reductions from other expense offset arrangements and do not represent the amount paid by the class during periods when reimbursements or reductions occur. Expense ratios before reductions for start-up periods may not be representative of longer-term operating periods. Expenses net of fee waivers reflect expenses after reimbursement by the investment adviser but prior to reductions from brokerage service arrangements or other expense offset arrangements. Expenses net of all reductions represent the net expenses paid by the class.
J Amount represents less than $.01 per share.
See accompanying notes which are an integral part of the financial statements.
Annual Report
Financial Highlights - Class C
Years ended July 31, | 2011 | 2010 H |
Selected Per-Share Data | | |
Net asset value, beginning of period | $ 9.93 | $ 9.95 |
Income from Investment Operations | | |
Net investment income (loss) E | .45 | .15 |
Net realized and unrealized gain (loss) | .74 | (.03) |
Total from investment operations | 1.19 | .12 |
Distributions from net investment income | (.45) | (.14) |
Redemption fees added to paid in capital E, J | - | - |
Net asset value, end of period | $ 10.67 | $ 9.93 |
Total Return B, C, D | 12.25% | 1.29% |
Ratios to Average Net Assets F, I | | |
Expenses before reductions | 1.89% | 1.86% A |
Expenses net of fee waivers, if any | 1.89% | 1.86% A |
Expenses net of all reductions | 1.89% | 1.86% A |
Net investment income (loss) | 4.23% | 5.21% A |
Supplemental Data | | |
Net assets, end of period (000 omitted) | $ 21,555 | $ 836 |
Portfolio turnover rate G | 25% | 28% |
A Annualized
B Total returns for periods of less than one year are not annualized.
C Total returns would have been lower if certain expenses had not been reduced during the applicable periods shown.
D Total returns do not include the effect of the contingent deferred sales charge.
E Calculated based on average shares outstanding during the period.
F Fees and expenses of any underlying Fidelity Central Funds are not included in the Fund's expense ratio. The Fund indirectly bears its proportionate share of the expenses of any underlying Fidelity Central Funds.
G Amount does not include the portfolio activity of any underlying Fidelity Central Funds.
H For the period April 14, 2010 (commencement of sale of shares) to July 31, 2010.
I Expense ratios reflect operating expenses of the class. Expenses before reductions do not reflect amounts reimbursed by the investment adviser or reductions from brokerage service arrangements or reductions from other expense offset arrangements and do not represent the amount paid by the class during periods when reimbursements or reductions occur. Expense ratios before reductions for start-up periods may not be representative of longer-term operating periods. Expenses net of fee waivers reflect expenses after reimbursement by the investment adviser but prior to reductions from brokerage service arrangements or other expense offset arrangements. Expenses net of all reductions represent the net expenses paid by the class.
J Amount represents less than $.01 per share.
See accompanying notes which are an integral part of the financial statements.
Annual Report
Financial Highlights - Real Estate Income
Years ended July 31, | 2011 | 2010 | 2009 | 2008 | 2007 |
Selected Per-Share Data | | | | | |
Net asset value, beginning of period | $ 9.95 | $ 8.21 | $ 9.43 | $ 11.22 | $ 11.78 |
Income from Investment Operations | | | | | |
Net investment income (loss) B | .55 | .53 | .54 | .59 | .63 |
Net realized and unrealized gain (loss) | .76 | 1.73 | (1.27) | (1.48) | (.37) |
Total from investment operations | 1.31 | 2.26 | (.73) | (.89) | .26 |
Distributions from net investment income | (.51) | (.52) | (.50) | (.66) | (.58) |
Distributions from net realized gain | - | - | - | (.24) | (.24) |
Total distributions | (.51) | (.52) | (.50) | (.90) | (.82) |
Redemption fees added to paid in capital B | - F | - F | .01 | - F | - F |
Net asset value, end of period | $ 10.75 | $ 9.95 | $ 8.21 | $ 9.43 | $ 11.22 |
Total Return A | 13.41% | 28.29% | (6.92)% | (8.43)% | 2.00% |
Ratios to Average Net Assets C, E | | | | |
Expenses before reductions | .92% | .97% | 1.00% | .94% | .88% |
Expenses net of fee waivers, if any | .92% | .96% | 1.00% | .94% | .88% |
Expenses net of all reductions | .92% | .96% | 1.00% | .94% | .88% |
Net investment income (loss) | 5.21% | 5.60% | 7.15% | 5.77% | 5.30% |
Supplemental Data | | | | | |
Net assets, end of period (000 omitted) | $ 1,660,063 | $ 1,030,393 | $ 463,269 | $ 393,147 | $ 516,268 |
Portfolio turnover rate D | 25% | 28% | 47% | 32% | 45% |
A Total returns would have been lower if certain expenses had not been reduced during the applicable periods shown.
B Calculated based on average shares outstanding during the period.
C Fees and expenses of any underlying Fidelity Central Funds are not included in the Fund's expense ratio. The Fund indirectly bears its proportionate share of the expenses of any underlying Fidelity Central Funds.
D Amount does not include the portfolio activity of any underlying Fidelity Central Funds.
E Expense ratios reflect operating expenses of the class. Expenses before reductions do not reflect amounts reimbursed by the investment adviser or reductions from brokerage service arrangements or reductions from other expense offset arrangements and do not represent the amount paid by the class during periods when reimbursements or reductions occur. Expenses net of fee waivers reflect expenses after reimbursement by the investment adviser but prior to reductions from brokerage service arrangements or other expense offset arrangements. Expenses net of all reductions represent the net expenses paid by the class.
F Amount represents less than $.01 per share.
See accompanying notes which are an integral part of the financial statements.
Annual Report
Financial Highlights - Institutional Class
Years ended July 31, | 2011 | 2010 G |
Selected Per-Share Data | | |
Net asset value, beginning of period | $ 9.95 | $ 9.95 |
Income from Investment Operations | | |
Net investment income (loss) D | .55 | .19 |
Net realized and unrealized gain (loss) | .76 | (.04) |
Total from investment operations | 1.31 | .15 |
Distributions from net investment income | (.52) | (.15) |
Redemption fees added to paid in capital D, I | - | - |
Net asset value, end of period | $ 10.74 | $ 9.95 |
Total Return B, C | 13.44% | 1.58% |
Ratios to Average Net Assets E, H | | |
Expenses before reductions | .89% | .85% A |
Expenses net of fee waivers, if any | .89% | .85% A |
Expenses net of all reductions | .89% | .85% A |
Net investment income (loss) | 5.24% | 6.70% A |
Supplemental Data | | |
Net assets, end of period (000 omitted) | $ 43,282 | $ 2,930 |
Portfolio turnover rate F | 25% | 28% |
A Annualized
B Total returns for periods of less than one year are not annualized.
C Total returns would have been lower if certain expenses had not been reduced during the applicable periods shown.
D Calculated based on average shares outstanding during the period.
E Fees and expenses of any underlying Fidelity Central Funds are not included in the Fund's expense ratio. The Fund indirectly bears its proportionate share of the expenses of any underlying Fidelity Central Funds.
F Amount does not include the portfolio activity of any underlying Fidelity Central Funds.
G For the period April 14, 2010 (commencement of sale of shares) to July 31, 2010.
H Expense ratios reflect operating expenses of the class. Expenses before reductions do not reflect amounts reimbursed by the investment adviser or reductions from brokerage service arrangements or reductions from other expense offset arrangements and do not represent the amount paid by the class during periods when reimbursements or reductions occur. Expense ratios before reductions for start-up periods may not be representative of longer-term operating periods. Expenses net of fee waivers reflect expenses after reimbursement by the investment adviser but prior to reductions from brokerage service arrangements or other expense offset arrangements. Expenses net of all reductions represent the net expenses paid by the class.
I Amount represents less than $.01 per share.
See accompanying notes which are an integral part of the financial statements.
Annual Report
Notes to Financial Statements
For the period ended July 31, 2011
1. Organization.
Fidelity Real Estate Income Fund (the Fund) is a fund of Fidelity Securities Fund (the Trust) and is authorized to issue an unlimited number of shares. The Trust is registered under the Investment Company Act of 1940, as amended (the 1940 Act), as an open-end management investment company organized as a Massachusetts business trust. The Fund offers Class A, Class T, Class C, Real Estate Income and Institutional Class shares, each of has equal rights as to assets and voting privileges. Each class has exclusive voting rights with respect to matters that affect that class. Investment income, realized and unrealized capital gains and losses, the common expenses of the Fund, and certain fund-level expense reductions, if any, are allocated on a pro-rata basis to each class based on the relative net assets of each class to the total net assets of the Fund. Each class differs with respect to transfer agent and distribution and service plan fees incurred. Certain expense reductions may also differ by class.
2. Investments in Fidelity Central Funds.
The Fund invests in Fidelity Central Funds, which are open-end investment companies available only to other investment companies and accounts managed by Fidelity Management & Research Company (FMR) and its affiliates. The Fund's Schedule of Investments lists each of the Fidelity Central Funds held as of period end, if any, as an investment of the Fund, but does not include the underlying holdings of each Fidelity Central Fund. As an Investing Fund, the Fund indirectly bears its proportionate share of the expenses of the underlying Fidelity Central Funds.
The Money Market Central Funds seek preservation of capital and current income and are managed by Fidelity Investments Money Management, Inc. (FIMM), an affiliate of FMR.
A complete unaudited list of holdings for each Fidelity Central Fund is available upon request or at the Securities and Exchange Commission (the SEC) web site at www.sec.gov. In addition, the financial statements of the Fidelity Central Funds, which are not covered by the Fund's Report of Independent Registered Public Accounting Firm, are available on the SEC web site or upon request.
3. Significant Accounting Policies.
The financial statements have been prepared in conformity with accounting principles generally accepted in the United States of America (GAAP), which require management to make certain estimates and assumptions at the date of the financial statements. Actual results could differ from those estimates. Subsequent events, if any, through the date that the financial statements were issued have been evaluated in the preparation of the financial statements. The following summarizes the significant accounting policies of the Fund:
Annual Report
3. Significant Accounting Policies - continued
Security Valuation. Investments are valued as of 4:00 p.m. Eastern time on the last calendar day of the period. The Fund uses independent pricing services approved by the Board of Trustees to value its investments. When current market prices or quotations are not readily available or reliable, valuations may be determined in good faith in accordance with procedures adopted by the Board of Trustees. Factors used in determining value may include market or security specific events, changes in interest rates and credit quality. The frequency with which these procedures are used cannot be predicted and they may be utilized to a significant extent. The value used for net asset value (NAV) calculation under these procedures may differ from published prices for the same securities.
The Fund categorizes the inputs to valuation techniques used to value its investments into a disclosure hierarchy consisting of three levels as shown below:
Level 1 - quoted prices in active markets for identical investments
Level 2 - other significant observable inputs (including quoted prices for similar investments, interest rates, prepayment speeds, etc.)
Level 3 - unobservable inputs (including the Fund's own assumptions based on the best information available)
Changes in valuation techniques may result in transfers in or out of an assigned level within the disclosure hierarchy. The aggregate value of investments by input level, as of July 31, 2011, as well as a roll forward of Level 3 securities, is included at the end of the Fund's Schedule of Investments. Valuation techniques used to value the Fund's investments by major category are as follows:
Equity securities, including restricted securities, for which market quotations are readily available, are valued at the last reported sale price or official closing price as reported by an independent pricing service on the primary market or exchange on which they are traded and are categorized as Level 1 in the hierarchy. In the event there were no sales during the day or closing prices are not available, securities are valued at the last quoted bid price or may be valued using the last available price and are generally categorized as Level 2 in the hierarchy. For foreign equity securities, when significant market or security specific events arise, comparisons to the valuation of American Depositary Receipts (ADRs), futures contracts, Exchange-traded funds (ETFs) and certain indexes as well as quoted prices for similar securities are used and are categorized as Level 2 in the hierarchy in these circumstances. Utilizing these techniques may result in transfers between Level 1 and Level 2. For restricted equity securities and private placements where observable inputs are limited, assumptions about market activity and risk are used and are categorized as Level 3 in the hierarchy.
Annual Report
Notes to Financial Statements - continued
3. Significant Accounting Policies - continued
Security Valuation - continued
Debt securities, including restricted securities, are valued based on evaluated prices received from independent pricing services or from dealers who make markets in such securities. For corporate bonds, floating rate loans and preferred securities, pricing services utilize matrix pricing which considers yield or price of bonds of comparable quality, coupon, maturity and type as well as dealer supplied prices and are generally categorized as Level 2 in the hierarchy. For asset backed securities, collateralized mortgage obligations and commercial mortgage securities, pricing services utilize matrix pricing which considers prepayment speed assumptions, attributes of the collateral, yield or price of bonds of comparable quality, coupon, maturity and type as well as dealer supplied prices and, accordingly, such securities are generally categorized as Level 2 in the hierarchy. When independent prices are unavailable or unreliable, debt securities may be valued utilizing pricing matrices which consider similar factors that would be used by independent pricing services. These are generally categorized as Level 2 in the hierarchy but may be Level 3 depending on the circumstances.
Investments in open-end mutual funds, including the Fidelity Central Funds, are valued at their closing net asset value each business day and are categorized as Level 1 in the hierarchy.
Foreign Currency. The Fund may use foreign currency contracts to facilitate transactions in foreign-denominated securities. Gains and losses from these transactions may arise from changes in the value of the foreign currency or if the counterparties do not perform under the contracts' terms.
Foreign-denominated assets, including investment securities, and liabilities are translated into U.S. dollars at the exchange rate at period end. Purchases and sales of investment securities, income and dividends received and expenses denominated in foreign currencies are translated into U.S. dollars at the exchange rate in effect on the transaction date.
The effects of exchange rate fluctuations on investments are included with the net realized and unrealized gain (loss) on investment securities. Other foreign currency transactions resulting in realized and unrealized gain (loss) are disclosed separately.
Investment Transactions and Income. For financial reporting purposes, the Fund's investment holdings and NAV include trades executed through the end of the last business day of the period. The NAV per share for processing shareholder transactions is calculated as of the close of business of the New York Stock Exchange (NYSE), normally 4:00 p.m. Eastern time and includes trades executed through the end of the prior business day. Gains and losses on securities sold are determined on the basis of identified cost and may include proceeds received from litigation. Dividend income is recorded on
Annual Report
3. Significant Accounting Policies - continued
Investment Transactions and Income - continued
the ex-dividend date, except for certain dividends from foreign securities where the ex-dividend date may have passed, which are recorded as soon as the Fund is informed of the ex-dividend date. Non-cash dividends included in dividend income, if any, are recorded at the fair market value of the securities received. Distributions received on securities that represent a return of capital or capital gain are recorded as a reduction of cost of investments and/or as a realized gain. The Fund estimates the components of distributions received that may be considered return of capital distributions or capital gain distributions. Interest income and distributions from the Fidelity Central Funds are accrued as earned. Interest income includes coupon interest and amortization of premium and accretion of discount on debt securities. For certain lower credit quality securitized assets that have contractual cash flows (for example, asset backed securities, collateralized mortgage obligations and commercial mortgage-backed securities), changes in estimated cash flows are periodically evaluated and the estimated yield is adjusted on a prospective basis over the remaining life of the security, resulting in increases or decreases to Interest Income in the accompanying Statement of Operations. Investment income is recorded net of foreign taxes withheld where recovery of such taxes is uncertain. Debt obligations may be placed on non-accrual status and related interest income may be reduced by ceasing current accruals and writing off interest receivables when the collection of all or a portion of interest has become doubtful based on consistently applied procedures. A debt obligation is removed from non-accrual status when the issuer resumes interest payments or when collectability of interest is reasonably assured.
Expenses. Expenses directly attributable to a fund are charged to that fund. Expenses attributable to more than one fund are allocated among the respective funds on the basis of relative net assets or other appropriate methods. Expense estimates are accrued in the period to which they relate and adjustments are made when actual amounts are known.
Income Tax Information and Distributions to Shareholders. Each year, the Fund intends to qualify as a regulated investment company, including distributing substantially all of its taxable income and realized gains under Subchapter M of the Internal Revenue Code and filing its U.S. federal tax return. As a result, no provision for income taxes is required. As of July 31, 2011, the Fund did not have any unrecognized tax benefits in the financial statements. A fund's federal tax return is subject to examination by the Internal Revenue Service (IRS) for a period of three years. Foreign taxes are provided for based on the Fund's understanding of the tax rules and rates that exist in the foreign markets in which it invests.
Distributions are declared and recorded on the ex-dividend date. Income dividends and capital gain distributions are declared separately for each class. Income and capital gain
Annual Report
Notes to Financial Statements - continued
3. Significant Accounting Policies - continued
Income Tax Information and Distributions to Shareholders - continued
distributions are determined in accordance with income tax regulations, which may differ from GAAP. In addition, the Fund claimed a portion of the payment made to redeeming shareholders as a distribution for income tax purposes.
Capital accounts within the financial statements are adjusted for permanent book-tax differences. These adjustments have no impact on net assets or the results of operations. Temporary book-tax differences will reverse in a subsequent period.
Book-tax differences are primarily due to short-term gain distributions from the Underlying Funds, foreign currency transactions, passive foreign investment companies (PFIC), market discount, equity-debt classifications, partnerships, capital loss carryforwards and losses deferred due to wash sales.
The federal tax cost of investment securities and unrealized appreciation (depreciation) as of period end were as follows:
Gross unrealized appreciation | $ 144,195,864 |
Gross unrealized depreciation | (67,819,922) |
Net unrealized appreciation (depreciation) on securities and other investments | $ 76,375,942 |
| |
Tax Cost | $ 1,752,042,061 |
The tax-based components of distributable earnings as of period end were as follows:
Undistributed ordinary income | $ 19,446,220 |
Undistributed long-term capital gain | $ 8,214,193 |
Net unrealized appreciation (depreciation) | $ 76,400,916 |
Under the recently enacted Regulated Investment Company Modernization Act of 2010 (the Act), the Fund will be permitted to carry forward capital losses incurred in taxable years beginning after December 22, 2010 for an unlimited period. However, any losses incurred during those future taxable years will be required to be utilized prior to any losses incurred in pre-enactment taxable years, which generally expire after eight years from when they are incurred. Additionally, post-enactment capital losses that are carried forward will retain their character as either short-term or long-term capital losses rather than being considered all short-term as under previous law. The Fund's first fiscal year end subject to the Act will be July 31, 2012.
Annual Report
3. Significant Accounting Policies - continued
Income Tax Information and Distributions to Shareholders - continued
The tax character of distributions paid was as follows:
| July 31, 2011 | July 31, 2010 |
Ordinary Income | $ 66,688,371 | $ 40,150,798 |
Short-Term Trading (Redemption) Fees. Shares held by investors in the Fund less than 90 days are subject to a redemption fee equal to .75% of the net asset value of shares redeemed. All redemption fees, which reduce the proceeds of the shareholder redemption, are retained by the Fund and accounted for as an addition to paid in capital.
New Accounting Pronouncement. In May 2011, the Financial Accounting Standards Board issued Accounting Standard Update No. 2011-04, Fair Value Measurement (Topic 820) - Amendments to Achieve Common Fair Value Measurement and Disclosure Requirements in U.S. GAAP and IFRSs. The update changes the wording used to describe the requirements in GAAP for measuring fair value and for disclosing information about fair value measurements. The update is effective during interim and annual periods beginning after December 15, 2011. Management is currently evaluating the impact of the update's adoption on the Fund's financial statement disclosures.
4. Operating Policies.
Restricted Securities. The Fund may invest in securities that are subject to legal or contractual restrictions on resale. These securities generally may be resold in transactions exempt from registration or to the public if the securities are registered. Disposal of these securities may involve time-consuming negotiations and expense, and prompt sale at an acceptable price may be difficult. Information regarding restricted securities is included at the end of the Fund's Schedule of Investments.
Loans and Other Direct Debt Instruments. The Fund may invest in loans and loan participations, trade claims or other receivables. These investments may include standby financing commitments, including revolving credit facilities, that obligate the Fund to supply additional cash to the borrower on demand. Loan participations involve a risk of insolvency of the lending bank or other financial intermediary. The Fund may be contractually obligated to receive approval from the agent bank and/or borrower prior to the sale of these investments.
5. Purchases and Sales of Investments.
Purchases and sales of securities, other than short-term securities and U.S. government securities, aggregated $943,762,957 and $333,450,877, respectively.
Annual Report
Notes to Financial Statements - continued
6. Fees and Other Transactions with Affiliates.
Management Fee. FMR and its affiliates provide the Fund with investment management related services for which the Fund pays a monthly management fee. The management fee is the sum of an individual fund fee rate that is based on an annual rate of .30% of the Fund's average net assets and a group fee rate that averaged .26% during the period. The group fee rate is based upon the average net assets of all the mutual funds advised by FMR. The group fee rate decreases as assets under management increase and increases as assets under management decrease. For the period, the total annual management fee rate was .56% of the Fund's average net assets.
Distribution and Service Plan Fees. In accordance with Rule 12b-1 of the 1940 Act, the Fund has adopted separate Distribution and Service Plans for each class of shares. Certain classes pay Fidelity Distributors Corporation (FDC), an affiliate of FMR, separate Distribution and Service Fees, each of which is based on an annual percentage of each class' average net assets. In addition, FDC may pay financial intermediaries for selling shares of the Fund and providing shareholder support services. For the period, the Distribution and Service Fee rates, total fees and amounts retained by FDC were as follows:
| Distribution
Fee | Service
Fee | Total Fees | Retained
by FDC |
Class A | -% | .25% | $ 69,417 | $ 9,683 |
Class T | -% | .25% | 9,295 | 13 |
Class C | .75% | .25% | 98,902 | 70,558 |
| | | $ 177,614 | $ 80,254 |
Sales Load. FDC may receive a front-end sales charge of up to 4.00% for selling Class A shares, and 4.00% for selling Class T shares, some of which is paid to financial intermediaries for selling shares of the Fund. Depending on the holding period, FDC may receive contingent deferred sales charges levied on Class A, Class T and Class C redemptions. The deferred sales charges range from 1% for Class C, 1.00% for certain purchases of Class A shares and .25% for certain purchases of Class T shares.
For the period, sales charge amounts retained by FDC were as follows:
| Retained
by FDC |
Class A | $ 29,470 |
Class T | 4,886 |
Class C* | 2,608 |
| $ 36,964 |
* When Class C shares are initially sold, FDC pays commissions from its own resources to financial intermediaries through which the sales are made.
Annual Report
6. Fees and Other Transactions with Affiliates - continued
Transfer Agent Fees. Fidelity Investments Institutional Operations Company, Inc. (FIIOC), an affiliate of FMR, is the transfer, dividend disbursing and shareholder servicing agent for each class of the Fund. FIIOC receives account fees and asset-based fees that vary according to the account size and type of account of the shareholders of the respective classes of the Fund. FIIOC pays for typesetting, printing and mailing of shareholder reports, except proxy statements. For the period, transfer agent fees for each class were as follows:
| Amount | % of
Average
Net Assets |
Class A | $ 67,947 | .25 |
Class T | 10,398 | .28 |
Class C | 25,635 | .26 |
Real Estate Income | 4,020,697 | .29 |
Institutional Class | 52,976 | .26 |
| $ 4,177,653 | |
Accounting and Security Lending Fees. Fidelity Service Company, Inc. (FSC), an affiliate of FMR, maintains the Fund's accounting records. The accounting fee is based on the level of average net assets for the month. Under a separate contract, FSC administers the security lending program. The security lending fee is based on the number and duration of lending transactions.
Brokerage Commissions. The Fund placed a portion of its portfolio transactions with brokerage firms which are affiliates of the investment adviser. The commissions paid to these affiliated firms were $16,317 for the period.
7. Committed Line of Credit.
The Fund participates with other funds managed by FMR or an affiliate in a $4.0 billion credit facility (the "line of credit") to be utilized for temporary or emergency purposes to fund shareholder redemptions or for other short-term liquidity purposes. The Fund has agreed to pay commitment fees on its pro-rata portion of the line of credit, which amounted to $4,526 and is reflected in Miscellaneous expenses on the Statement of Operations. During the period, there were no borrowings on this line of credit.
8. Security Lending.
The Fund lends portfolio securities through a lending agent from time to time in order to earn additional income. The lending agent may loan securities to certain qualified borrowers, including Fidelity Capital Markets (FCM), a broker-dealer affiliated with the Fund. On the settlement date of the loan, the Fund receives collateral (in the form of
Annual Report
Notes to Financial Statements - continued
8. Security Lending - continued
U.S. Treasury obligations, letters of credit and/or cash) against the loaned securities and maintains collateral in an amount not less than 100% of the market value of the loaned securities during the period of the loan. The market value of the loaned securities is determined at the close of business of the Fund and any additional required collateral is delivered to the Fund on the next business day. If the borrower defaults on its obligation to return the securities loaned because of insolvency or other reasons, a fund could experience delays and costs in recovering the securities loaned or in gaining access to the collateral. Any cash collateral received is invested in the Fidelity Securities Lending Cash Central Fund. The value of loaned securities and cash collateral at period end are disclosed on the Fund's Statement of Assets and Liabilities. At period end, there were no security loans outstanding with FCM. Security lending income represents the income earned on investing cash collateral, less rebates paid to borrowers and lending agent fees associated with the loan, plus any premium payments received for lending certain types of securities. Security lending income is presented in the Statement of Operations as a component of income from Fidelity Central Funds. Total security lending income during the period amounted to $34,762, including $8,492 from securities loaned to FCM.
9. Bank Borrowings.
The Fund is permitted to have bank borrowings for temporary or emergency purposes to fund shareholder redemptions or for other short-term liquidity requirements. The Fund has established borrowing arrangements with certain banks. The interest rate on the borrowings is the bank's base rate, as revised from time to time. The average daily loan balance during the period for which loans were outstanding amounted to $16,530,000. The weighted average interest rate was .71%. The interest expense amounted to $326 under the bank borrowing program. At period end, there were no bank borrowings outstanding.
10. Expense Reductions.
FMR voluntarily agreed to reimburse a portion of the Fund's operating expenses. During the period, this reimbursement reduced the Real Estate Income Class expenses by $16,722.
Many of the brokers with whom FMR places trades on behalf of the Fund provided services to the Fund in addition to trade execution. These services included payments of certain expenses on behalf of the Fund totaling $24,961 for the period. In addition, through arrangements with the Fund's custodian, credits realized as a result of uninvested cash balances were used to reduce the Fund's expenses. During the period, these credits reduced the Fund's custody expenses by $658.
Annual Report
11. Distributions to Shareholders.
Distributions to shareholders of each class were as follows:
Years ended July 31, | 2011 | 2010 A |
From net investment income | | |
Class A | $ 1,154,662 | $ 23,172 |
Class T | 160,366 | 6,447 |
Class C | 358,357 | 3,705 |
Real Estate Income | 64,149,915 | 40,107,971 |
Institutional Class | 865,071 | 9,503 |
Total | $ 66,688,371 | $ 40,150,798 |
A Distributions for Class A, Class T, Class C and Institutional Class Shares are for the period April 14, 2010 (commencement of sale of shares) to July 31, 2010.
12. Share Transactions.
Transactions for each class of shares were as follows:
| Shares | Dollars |
Years ended July 31, | 2011 | 2010 A | 2011 | 2010 A |
Class A | | | | |
Shares sold | 5,544,292 | 402,260 | $ 58,675,375 | $ 3,960,293 |
Reinvestment of distributions | 75,836 | 1,072 | 799,911 | 10,302 |
Shares redeemed | (384,554) | (18,182) | (4,105,728) | (177,559) |
Net increase (decrease) | 5,235,574 | 385,150 | $ 55,369,558 | $ 3,793,036 |
Class T | | | | |
Shares sold | 662,414 | 85,986 | $ 7,018,853 | $ 847,305 |
Reinvestment of distributions | 12,671 | 671 | 132,964 | 6,447 |
Shares redeemed | (50,669) | (17) | (536,547) | (166) |
Net increase (decrease) | 624,416 | 86,640 | $ 6,615,270 | $ 853,586 |
Class C | | | | |
Shares sold | 2,030,776 | 84,053 | $ 21,411,850 | $ 827,207 |
Reinvestment of distributions | 29,432 | 378 | 309,638 | 3,628 |
Shares redeemed | (125,083) | (281) | (1,328,625) | (2,700) |
Net increase (decrease) | 1,935,125 | 84,150 | $ 20,392,863 | $ 828,135 |
Real Estate Income | | | | |
Shares sold | 89,725,340 | 69,175,263 | $ 943,333,748 | $ 650,744,676 |
Reinvestment of distributions | 5,601,468 | 4,018,182 | 58,273,356 | 36,922,410 |
Shares redeemed | (44,449,757) | (26,105,432) | (467,916,333) | (245,525,556) |
Net increase (decrease) | 50,877,051 | 47,088,013 | $ 533,690,771 | $ 442,141,530 |
Annual Report
Notes to Financial Statements - continued
12. Share Transactions - continued
| Shares | Dollars |
Years ended July 31, | 2011 | 2010 A | 2011 | 2010 A |
Institutional Class | | | | |
Shares sold | 4,361,479 | 294,304 | $ 46,245,871 | $ 2,886,826 |
Reinvestment of distributions | 55,523 | 902 | 583,903 | 8,663 |
Shares redeemed | (681,623) | (733) | (7,257,237) | (7,109) |
Net increase (decrease) | 3,735,379 | 294,473 | $ 39,572,537 | $ 2,888,380 |
A Share transactions for Class A, Class T, Class C and Institutional Class Shares are for the period April 14, 2010 (commencement of sale of shares) to July 31, 2010.
13. Other.
The Fund's organizational documents provide former and current trustees and officers with a limited indemnification against liabilities arising in connection with the performance of their duties to the Fund. In the normal course of business, the Fund may also enter into contracts that provide general indemnifications. The Fund's maximum exposure under these arrangements is unknown as this would be dependent on future claims that may be made against the Fund. The risk of material loss from such claims is considered remote.
Annual Report
To the Trustees of Fidelity Securities Fund and Shareholders of Fidelity Real Estate Income Fund:
We have audited the accompanying statement of assets and liabilities of Fidelity Real Estate Income Fund (the Fund), a fund of Fidelity Securities Fund, including the schedule of investments, as of July 31, 2011, and the related statement of operations for the year then ended, the statement of changes in net assets for each of the two years in the period then ended, and the financial highlights for each of the five years in the period then ended. These financial statements and financial highlights are the responsibility of the Fund's management. Our responsibility is to express an opinion on these financial statements and financial highlights based on our audits.
We conducted our audits in accordance with the standards of the Public Company Accounting Oversight Board (United States). Those standards require that we plan and perform the audit to obtain reasonable assurance about whether the financial statements and financial highlights are free of material misstatement. The Fund is not required to have, nor were we engaged to perform, an audit of its internal control over financial reporting. Our audits included consideration of internal control over financial reporting as a basis for designing audit procedures that are appropriate in the circumstances, but not for the purpose of expressing an opinion on the effectiveness of the Fund's internal control over financial reporting. Accordingly, we express no such opinion. An audit also includes examining, on a test basis, evidence supporting the amounts and disclosures in the financial statements, assessing the accounting principles used and significant estimates made by management, as well as evaluating the overall financial statement presentation. Our procedures included confirmation of securities owned as of July 31, 2011, by correspondence with the custodians and brokers; where replies were not received from brokers, we performed other auditing procedures. We believe that our audits provide a reasonable basis for our opinion.
In our opinion, the financial statements and financial highlights referred to above present fairly, in all material respects, the financial position of Fidelity Real Estate Income Fund as of July 31, 2011, the results of its operations for the year then ended, the changes in its net assets for each of the two years in the period then ended, and the financial highlights for each of the five years in the period then ended, in conformity with accounting principles generally accepted in the United States of America.
/s/ Deloitte & Touche LLP
DELOITTE & TOUCHE LLP
Boston, Massachusetts
September 20, 2011
Annual Report
The Trustees, Members of the Advisory Board, and executive officers of the trust and fund, as applicable, are listed below. The Board of Trustees governs the fund and is responsible for protecting the interests of shareholders. The Trustees are experienced executives who meet periodically throughout the year to oversee the fund's activities, review contractual arrangements with companies that provide services to the fund, oversee management of the risks associated with such activities and contractual arrangements, and review the fund's performance. Except for James C. Curvey, each of the Trustees oversees 221 funds advised by FMR or an affiliate. Mr. Curvey oversees 419 funds advised by FMR or an affiliate.
The Trustees hold office without limit in time except that (a) any Trustee may resign; (b) any Trustee may be removed by written instrument, signed by at least two-thirds of the number of Trustees prior to such removal; (c) any Trustee who requests to be retired or who has become incapacitated by illness or injury may be retired by written instrument signed by a majority of the other Trustees; and (d) any Trustee may be removed at any special meeting of shareholders by a two-thirds vote of the outstanding voting securities of the trust. Each Trustee who is not an interested person (as defined in the 1940 Act) (Independent Trustee), shall retire not later than the last day of the calendar year in which his or her 75th birthday occurs. The Independent Trustees may waive this mandatory retirement age policy with respect to individual Trustees. The executive officers and Advisory Board Members hold office without limit in time, except that any officer and Advisory Board Member may resign or may be removed by a vote of a majority of the Trustees at any regular meeting or any special meeting of the Trustees. Except as indicated, each individual has held the office shown or other offices in the same company for the past five years.
Experience, Skills, Attributes, and Qualifications of the Fund's Trustees. The Governance and Nominating Committee has adopted a statement of policy that describes the experience, qualifications, attributes, and skills that are necessary and desirable for potential Independent Trustee candidates (Statement of Policy). The Board believes that each Trustee satisfied at the time he or she was initially elected or appointed a Trustee, and continues to satisfy, the standards contemplated by the Statement of Policy. The Governance and Nominating Committee also engages professional search firms to help identify potential Independent Trustee candidates who have the experience, qualifications, attributes, and skills consistent with the Statement of Policy. From time to time, additional criteria based on the composition and skills of the current Independent Trustees, as well as experience or skills that may be appropriate in light of future changes to board composition, business conditions, and regulatory or other developments, have also been considered by the professional search firms and the Governance and Nominating Committee. In addition, the Board takes into account the Trustees' commitment and participation in Board and committee meetings, as well as their leadership of standing and ad hoc committees throughout their tenure.
In determining that a particular Trustee was and continues to be qualified to serve as a Trustee, the Board has considered a variety of criteria, none of which, in isolation, was controlling. The Board believes that, collectively, the Trustees have balanced and diverse experience, qualifications, attributes, and skills, which allow the Board to operate effectively in governing the fund and protecting the interests of shareholders. Information about the specific experience, skills, attributes, and qualifications of each Trustee, which in each case led to the Board's conclusion that the Trustee should serve (or continue to serve) as a trustee of the fund, is provided below.
Annual Report
Trustees and Officers - continued
Board Structure and Oversight Function. James C. Curvey is an interested person (as defined in the 1940 Act) and currently serves as Acting Chairman. The Trustees have determined that an interested Chairman is appropriate and benefits shareholders because an interested Chairman has a personal and professional stake in the quality and continuity of services provided to the fund. Independent Trustees exercise their informed business judgment to appoint an individual of their choosing to serve as Chairman, regardless of whether the Trustee happens to be independent or a member of management. The Independent Trustees have determined that they can act independently and effectively without having an Independent Trustee serve as Chairman and that a key structural component for assuring that they are in a position to do so is for the Independent Trustees to constitute a substantial majority for the Board. The Independent Trustees also regularly meet in executive session. Ned C. Lautenbach serves as Chairman of the Independent Trustees and as such (i) acts as a liaison between the Independent Trustees and management with respect to matters important to the Independent Trustees and (ii) with management prepares agendas for Board meetings.
Fidelity funds are overseen by different Boards of Trustees. The fund's Board oversees Fidelity's equity and high income funds and another Board oversees Fidelity's investment-grade bond, money market, and asset allocation funds. The asset allocation funds may invest in Fidelity funds overseen by the fund's Board. The use of separate Boards, each with its own committee structure, allows the Trustees of each group of Fidelity funds to focus on the unique issues of the funds they oversee, including common research, investment, and operational issues. On occasion, the separate Boards establish joint committees to address issues of overlapping consequences for the Fidelity funds overseen by each Board.
The Trustees operate using a system of committees to facilitate the timely and efficient consideration of all matters of importance to the Trustees, the fund, and fund shareholders and to facilitate compliance with legal and regulatory requirements and oversight of the fund's activities and associated risks. The Board, acting through its committees, has charged FMR and its affiliates with (i) identifying events or circumstances the occurrence of which could have demonstrably adverse effects on the fund's business and/or reputation; (ii) implementing processes and controls to lessen the possibility that such events or circumstances occur or to mitigate the effects of such events or circumstances if they do occur; and (iii) creating and maintaining a system designed to evaluate continuously business and market conditions in order to facilitate the identification and implementation processes described in (i) and (ii) above. Because the day-to-day operations and activities of the fund are carried out by or through FMR, its affiliates and other service providers, the fund's exposure to risks is mitigated but not eliminated by the processes overseen by the Trustees. While each of the Board's committees has responsibility for overseeing different aspects of the fund's activities, oversight is exercised primarily through the Operations, Audit, and Compliance Committees. Appropriate personnel, including but not limited to the fund's Chief Compliance Officer (CCO), FMR's internal auditor, the independent accountants, the fund's Treasurer and portfolio management personnel, make periodic reports to the Board's committees, as appropriate. The responsibilities of each committee, including their oversight responsibilities, are described further under "Standing Committees of the Fund's Trustees."
Annual Report
The fund's Statement of Additional Information (SAI) includes more information about the Trustees. To request a free copy, call Fidelity at 1-800-544-8544.
Interested Trustees*:
Correspondence intended for each Trustee who is an interested person may be sent to Fidelity Investments, 82 Devonshire Street, Boston, Massachusetts 02109.
Name, Age; Principal Occupations and Other Relevant Experience+ |
James C. Curvey (76) |
| Year of Election or Appointment: 2007
Mr. Curvey is Trustee and Acting Chairman of the Board of Trustees of certain Trusts. Mr. Curvey also serves as Trustee (2007-present) of other investment companies advised by FMR. Mr. Curvey is a Director of Fidelity Investments Money Management, Inc. (2009-present), Director of Fidelity Research & Analysis Co. (2009-present) and Director of FMR and FMR Co., Inc. (2007-present). Mr. Curvey is also Vice Chairman (2007-present) and Director of FMR LLC. In addition, Mr. Curvey serves as an Overseer for the Boston Symphony Orchestra and a member of the Trustees of Villanova University. Previously, Mr. Curvey was the Vice Chairman (2006-2007) and Director (2000-2007) of FMR Corp. |
Ronald P. O'Hanley (54) |
| Year of Election or Appointment: 2011
Mr. O'Hanley is Director of FMR Co., Inc. (2010-present), Director of Fidelity Investments Money Management, Inc. (2010-present), Director of Fidelity Research & Analysis Company (2010-present), President of Fidelity Asset Management and Corporate Services and a member of Fidelity's Executive Committee (2010-present). Previously, Mr. O'Hanley served as President and Chief Executive Officer of BNY Mellon Asset Management (2007-2010). Mr. O'Hanley also served as Vice Chairman of Bank New York Mellon Corp. and a member of that firm's Executive Committee. Prior to the 2007 merger of The Bank of New York and Mellon Financial Corporation, he was Vice Chairman of Mellon Financial Corporation and President and Chief Executive Officer of Mellon Asset Management. He joined Mellon in February 1997. Mr. O'Hanley currently serves as Chairman of the Boston Public Library Foundation Board of Directors and sits on the Board of Directors of Beth Israel Deaconess Medical Center, the Board of Trustees of the Marine Biological Laboratory and the Advisory Board of the Maxwell School of Citizenship and Public Administration at Syracuse University. Mr. O'Hanley also chairs the Council on Asset Management for the Financial Services Roundtable and is a member of the Board of Directors of Institutional Investor's U.S. Institute. |
* Trustees have been determined to be "Interested Trustees" by virtue of, among other things, their affiliation with the trust or various entities under common control with FMR.
+ The information above includes each Trustee's principal occupation during the last five years and other information relating to the experience, attributes, and skills relevant to each Trustee's qualifications to serve as a Trustee, which led to the conclusion that each Trustee should serve as a Trustee for the fund.
Annual Report
Independent Trustees:
Correspondence intended for each Independent Trustee (that is, the Trustees other than the Interested Trustees) may be sent to Fidelity Investments, P.O. Box 55235, Boston, Massachusetts 02205-5235.
Name, Age; Principal Occupations and Other Relevant Experience+ |
Dennis J. Dirks (63) |
| Year of Election or Appointment: 2005 Prior to his retirement in May 2003, Mr. Dirks was Chief Operating Officer and a member of the Board of The Depository Trust & Clearing Corporation (DTCC). He also served as President, Chief Operating Officer, and Board member of The Depository Trust Company (DTC) and President and Board member of the National Securities Clearing Corporation (NSCC). In addition, Mr. Dirks served as Chief Executive Officer and Board member of the Government Securities Clearing Corporation, Chief Executive Officer and Board member of the Mortgage-Backed Securities Clearing Corporation, as a Trustee and a member of the Finance Committee of Manhattan College (2005-2008), and as a Trustee and a member of the Finance Committee of AHRC of Nassau County (2006-2008). Mr. Dirks is a member of the Independent Directors Council (IDC) Governing Council (2010-Present) and Board of Directors for The Brookville Center for Children's Services, Inc. (2009-present). |
Alan J. Lacy (57) |
| Year of Election or Appointment: 2008 Mr. Lacy serves as Senior Adviser (2007-present) of Oak Hill Capital Partners, L.P. (private equity). Mr. Lacy also served as Chief Executive Officer (2000-2005) and Vice Chairman (2005-2006) of Sears Holdings Corporation and Sears, Roebuck and Co. (retail). In addition, Mr. Lacy serves as a member of the Board of Directors of Dave & Buster's, Inc. (restaurant and entertainment complexes, 2010-present), The Hillman Companies, Inc. (hardware wholesalers, 2010-present), and Bristol-Myers Squibb Company (global pharmaceuticals, 2007-present). Mr. Lacy is a member of the Board of Trustees of The National Parks Conservation Association (2006-Present). Previously, Mr. Lacy served as Chairman of the Board of Trustees of the National Parks Conservation Association (2008-2011) and as a member of the Board of Directors for the Western Union Company (global money transfer, 2006-2011). |
Ned C. Lautenbach (67) |
| Year of Election or Appointment: 2000 Mr. Lautenbach is Chairman of the Independent Trustees of the Equity and High Income Funds (2006-present). Mr. Lautenbach currently serves as the Lead Director of the Eaton Corporation Board of Directors (diversified industrial, 1997-present). Mr. Lautenbach is also a member of the Board of Directors of the Philharmonic Center for the Arts in Naples, Florida (1999-present); a member of the Board of Trustees of Fairfield University (2005-present); and a member of the Council on Foreign Relations (1994-present). Previously, Mr. Lautenbach was a Partner/Advisory Partner at Clayton, Dubilier & Rice, LLC (private equity investment, 1998-2010), as well as a Director of Sony Corporation (2006-2007). |
Robert W. Selander (60) |
| Year of Election or Appointment: 2011 Previously, Mr. Selander served as a Member of the Advisory Board of Fidelity's Equity and High Income Funds (2011), Executive Vice Chairman (2010), Chief Executive Officer (2009-2010), and President and Chief Executive Officer (1997-2009) of Mastercard, Inc. |
Joseph Mauriello (66) |
| Year of Election or Appointment: 2008 Prior to his retirement in January 2006, Mr. Mauriello served in numerous senior management positions including Deputy Chairman and Chief Operating Officer (2004-2005), and Vice Chairman of Financial Services (2002-2004) of KPMG LLP US (professional services, 1965-2005). Mr. Mauriello currently serves as a member of the Board of Directors of XL Group plc. (global insurance and re-insurance, 2006-present) and of Arcadia Resources Inc. (health care services and products, 2007-present). Previously, Mr. Mauriello served as a Director of the Hamilton Funds of the Bank of New York (2006-2007). |
Cornelia M. Small (67) |
| Year of Election or Appointment: 2005 Ms. Small is a member of the Board of Directors of the Teagle Foundation (2009-present). Ms. Small is also a member of the Investment Committee, and Chair (2008-present) and a member of the Board of Trustees of Smith College. In addition, Ms. Small serves on the Investment Committee of the Berkshire Taconic Community Foundation (2008-present). Previously, Ms. Small served as Chairperson of the Investment Committee (2002-2008) of Smith College. In addition, Ms. Small served as Chief Investment Officer, Director of Global Equity Investments, and a member of the Board of Directors of Scudder, Stevens & Clark and Scudder Kemper Investments. |
William S. Stavropoulos (72) |
| Year of Election or Appointment: 2002 Mr. Stavropoulos is Vice Chairman of the Independent Trustees of the Equity and High Income Funds (2006-present). Mr. Stavropoulos serves as President and Founder of the Michigan Baseball Foundation, the Great Lakes Loons (2007-present). Mr. Stavropoulos is Chairman Emeritus of the Board of Directors of The Dow Chemical Company, where he previously served in numerous senior management positions, including President, CEO (1995-2000; 2002-2004), Chairman of the Executive Committee (2000-2006), and as a member of the Board of Directors (1990-2006). Currently, Mr. Stavropoulos is Chairman of Univar (global distributor of commodity and specialty chemicals, 2010-present), a Director of Teradata Corporation (data warehousing and technology solutions, 2008-present), Chemical Financial Corporation, Maersk Inc. (industrial conglomerate), Tyco International, Inc. (multinational manufacturing and services, 2007-present), and a member of the Advisory Board for Metalmark Capital (private equity investment, 2005-present). Mr. Stavropoulos is a special advisor to Clayton, Dubilier & Rice, LLC (private equity investment). In addition, Mr. Stavropoulos is a member of the University of Notre Dame Advisory Council for the College of Science. |
David M. Thomas (62) |
| Year of Election or Appointment: 2008 Previously, Mr. Thomas served as Executive Chairman (2005-2006) and Chairman and Chief Executive Officer (2000-2005) of IMS Health, Inc. (pharmaceutical and healthcare information solutions). In addition, Mr. Thomas serves as a member of the Board of Directors of Fortune Brands, Inc. (consumer products), and Interpublic Group of Companies, Inc. (marketing communication, 2004-present). |
Michael E. Wiley (60) |
| Year of Election or Appointment: 2008 Mr. Wiley also serves as a Director of Asia Pacific Exploration Consolidated (international oil and gas exploration and production, 2008-present). Mr. Wiley serves as a Director of Tesoro Corporation (independent oil refiner and marketer, 2005-present), and a Director of Bill Barrett Corporation (exploration and production, 2005-present). In addition, Mr. Wiley also serves as a Director of Post Oak Bank (privately-held bank, 2004-present). Previously, Mr. Wiley served as a member of the Board of Trustees of the University of Tulsa (2000-2006; 2007-2010), as a Senior Energy Advisor of Katzenbach Partners, LLC (consulting, 2006-2007), as an Advisory Director of Riverstone Holdings (private investment), Chairman, President, and CEO of Baker Hughes, Inc. (oilfield services, 2000-2004), and as Director of Spinnaker Exploration Company (exploration and production, 2001-2005). |
Annual Report
Trustees and Officers - continued
+ The information above includes each Trustee's principal occupation during the last five years and other information relating to the experience, attributes, and skills relevant to each Trustee's qualifications to serve as a Trustee, which led to the conclusion that each Trustee should serve as a Trustee for the fund.
Advisory Board Members and Executive Officers:
Correspondence intended for each executive officer, Edward C. Johnson 3d, and Peter S. Lynch, may be sent to Fidelity Investments, 82 Devonshire Street, Boston, Massachusetts 02109.
Name, Age; Principal Occupation |
Edward C. Johnson 3d (81) |
| Year of Election or Appointment: 2011 Member of the Advisory Board of Fidelity's Equity and High Income Funds. Mr. Johnson serves as Chief Executive Officer, Chairman, and a Director of FMR LLC, and also serves as Chairman and Director of FIL Limited. Previously, Mr. Johnson served as a Trustee and Chairman of the Board of certain Fidelity Trusts, Chairman and a Director of FMR, Chairman and a Director of FMR Co., Inc., and President of FMR LLC (2006-2007). |
Peter S. Lynch (67) |
| Year of Election or Appointment: 2003 Member of the Advisory Board of Fidelity's Equity and High Income Funds. Mr. Lynch is Vice Chairman and a Director of FMR and FMR Co., Inc. In addition, Mr. Lynch serves as a Trustee of Boston College and as the Chairman of the Inner-City Scholarship Fund. Previously, Mr. Lynch served on the Special Olympics International Board of Directors (1997-2006). |
Kenneth B. Robins (41) |
| Year of Election or Appointment: 2008 President and Treasurer of Fidelity's Equity and High Income Funds. Mr. Robins also serves as President and Treasurer (2010-present) and Assistant Treasurer (2009-present) of other Fidelity funds and is an employee of Fidelity Investments (2004-present). Previously, Mr. Robins served as Deputy Treasurer of the Fidelity funds (2005-2008) and Treasurer and Chief Financial Officer of The North Carolina Capital Management Trust: Cash and Term Portfolios (2006-2008). |
Brian B. Hogan (46) |
| Year of Election or Appointment: 2009 Vice President of Equity and High Income Funds. Mr. Hogan also serves as President of FMR's Equity Division (2009-present). Previously, Mr. Hogan served as Senior Vice President, Equity Research of FMR (2006-2009) and as a portfolio manager. |
Christopher S. Bartel (39) |
| Year of Election or Appointment: 2009 Vice President of Fidelity's Sector and Real Estate Equity Funds. Mr. Bartel also serves as Senior Vice President of Equity Research (2009-present). Previously, Mr. Bartel served as Managing Director of Research (2006-2009) and an analyst and portfolio manager (2000-2006). |
Scott C. Goebel (43) |
| Year of Election or Appointment: 2008 Secretary and Chief Legal Officer (CLO) of the Fidelity funds. Mr. Goebel also serves as Secretary of Fidelity Investments Money Management, Inc. (FIMM) (2010-present) and Fidelity Research and Analysis Company (FRAC) (2010-present); Secretary and CLO of The North Carolina Capital Management Trust: Cash and Term Portfolios (2008-present); General Counsel, Secretary, and Senior Vice President of FMR (2008-present) and FMR Co., Inc. (2008-present); employed by FMR LLC or an affiliate (2001-present); Chief Legal Officer of Fidelity Management & Research (Hong Kong) Limited (2008-present) and Assistant Secretary of Fidelity Management & Research (Japan) Inc. (2008-present), and Fidelity Management & Research (U.K.) Inc. (2008-present). Previously, Mr. Goebel served as Assistant Secretary of FIMM (2008-2010), FRAC (2008-2010), and the Funds (2007-2008) and as Vice President and Secretary of Fidelity Distributors Corporation (FDC) (2005-2007). |
William C. Coffey (42) |
| Year of Election or Appointment: 2009 Assistant Secretary of Fidelity's Equity and High Income Funds. Mr. Coffey also serves as Senior Vice President and Deputy General Counsel of FMR LLC (2010-present), and is an employee of Fidelity Investments. Previously, Mr. Coffey served as Vice President and Associate General Counsel of FMR LLC (2005-2009). |
Holly C. Laurent (57) |
| Year of Election or Appointment: 2008 Anti-Money Laundering (AML) Officer of the Fidelity funds. Ms. Laurent also serves as AML Officer of The North Carolina Capital Management Trust: Cash and Term Portfolios (2008-present) and is an employee of Fidelity Investments. Previously, Ms. Laurent was Senior Vice President and Head of Legal for Fidelity Business Services India Pvt. Ltd. (2006-2008), and Senior Vice President, Deputy General Counsel and Group Head for FMR LLC (2005-2006). |
Christine Reynolds (52) |
| Year of Election or Appointment: 2008 Chief Financial Officer of the Fidelity funds. Ms. Reynolds became President of Fidelity Pricing and Cash Management Services (FPCMS) in August 2008. Ms. Reynolds served as Chief Operating Officer of FPCMS (2007-2008). Previously, Ms. Reynolds served as President, Treasurer, and Anti-Money Laundering officer of the Fidelity funds (2004-2007). |
Kenneth A. Rathgeber (64) |
| Year of Election or Appointment: 2004 Chief Compliance Officer of Fidelity's Equity and High Income Funds. Mr. Rathgeber is Chief Compliance Officer of Fidelity Management & Research (Hong Kong) Limited (2008-present), Fidelity Management & Research (Japan) Inc. (2008-present), FMR (2005-present), FMR Co., Inc. (2005-present), Fidelity Management & Research (U.K.) Inc. (2005-present), Fidelity Research & Analysis Company (2005-present), Fidelity Investments Money Management, Inc. (2005-present), Pyramis Global Advisors, LLC (2005-present), and Strategic Advisers, Inc. (2005-present). |
Jeffrey S. Christian (49) |
| Year of Election or Appointment: 2009 Deputy Treasurer of the Fidelity funds. Mr. Christian is an employee of Fidelity Investments. Previously, Mr. Christian served as Chief Financial Officer (2008-2009) of certain Fidelity funds and Senior Vice President of Fidelity Pricing and Cash Management Services (FPCMS) (2004-2009). |
Bryan A. Mehrmann (50) |
| Year of Election or Appointment: 2005 Deputy Treasurer of the Fidelity funds. Mr. Mehrmann is an employee of Fidelity Investments. |
Adrien E. Deberghes (43) |
| Year of Election or Appointment: 2008 Deputy Treasurer of Fidelity's Equity and High Income Funds. Mr. Deberghes also serves as Assistant Treasurer of other Fidelity funds (2010-present) and is an employee of Fidelity Investments (2008-present). Previously, Mr. Deberghes served as Senior Vice President of Mutual Fund Administration at State Street Corporation (2007-2008), Senior Director of Mutual Fund Administration at Investors Bank & Trust (2005-2007), and Director of Finance for Dunkin' Brands (2000-2005). |
Stephanie J. Dorsey (42) |
| Year of Election or Appointment: 2010 Assistant Treasurer of Fidelity's Equity and High Income Funds. Ms. Dorsey also serves as Deputy Treasurer of other Fidelity funds (2008-present) and is an employee of Fidelity Investments (2008-present). Previously, Ms. Dorsey served as Treasurer (2004-2008) of the JPMorgan Mutual Funds and Vice President (2004-2008) of JPMorgan Chase Bank. |
John R. Hebble (53) |
| Year of Election or Appointment: 2009 Assistant Treasurer of Fidelity's Equity and High Income Funds. Mr. Hebble also serves as President (2011-present), Treasurer, and Chief Financial Officer of The North Carolina Capital Management Trust: Cash and Term Portfolios (2008-present), President and Treasurer of other Fidelity funds (2008-present) and is an employee of Fidelity Investments. |
Gary W. Ryan (52) |
| Year of Election or Appointment: 2005 Assistant Treasurer of the Fidelity funds. Mr. Ryan is an employee of Fidelity Investments. Previously, Mr. Ryan served as Vice President of Fund Reporting in Fidelity Pricing and Cash Management Services (FPCMS) (1999-2005). |
Jonathan Davis (43) |
| Year of Election or Appointment: 2010 Assistant Treasurer of the Fidelity funds. Mr. Davis is an employee of Fidelity Investments. Previously, Mr. Davis served as Vice President and Associate General Counsel of FMR LLC (2003-2010). |
Annual Report
The Board of Trustees of Fidelity Real Estate Income Fund voted to pay on September 6, 2011, to shareholders of record at the opening of business on September 2, 2011, a distribution of $0.052 per share derived from capital gains realized from sales of portfolio securities and a dividend of $0.147 per share from net investment income.
The fund hereby designates as a capital gain dividend with respect to the taxable year ended July 31, 2011, $10,590,637, or, if subsequently determined to be different, the net capital gain of such year.
The Retail Class designates 1.00% of the dividends distributed in March and June as amounts which may be taken into account as a dividend for purposes of the maximum rate under section 1(h)(11) of the Internal Revenue Code.
A total of 0.08% of the dividends distributed during the fiscal year was derived from interest on U.S. Government securities which is generally exempt from state income tax.
The fund will notify shareholders in January 2012 of amounts for use in preparing 2011 income tax returns.
Annual Report
Board Approval of Investment Advisory Contracts and Management Fees
Fidelity Real Estate Income Fund
Each year, the Board of Trustees, including the Independent Trustees (together, the Board), votes on the renewal of the management contract and sub-advisory agreements (together, the Advisory Contracts) for the fund. The Board, assisted by the advice of fund counsel and Independent Trustees' counsel, requests and considers a broad range of information relevant to the renewal of the Advisory Contracts throughout the year.
The Board meets regularly and considers at each of its meetings factors that are relevant to its annual consideration of the renewal of the fund's Advisory Contracts, including the services and support provided to the fund and its shareholders. The Board has established various standing committees, each composed of Independent Trustees with varying backgrounds, to which the Board has assigned specific subject matter responsibilities in order to enhance effective decision-making by the Board. The Board, acting directly and through its Committees, requests and receives information concerning the annual consideration of the renewal of the fund's Advisory Contracts. The Board also meets as needed to consider matters specifically related to the Board's annual consideration of the renewal of Advisory Contracts. Members of the Board may also meet with trustees of other Fidelity funds through ad hoc joint committees to discuss certain matters relevant to the Fidelity funds.
At its July 2011 meeting, the Board of Trustees, including the Independent Trustees, unanimously determined to renew the fund's Advisory Contracts. In reaching its determination, the Board considered all factors it believed relevant, including (i) the nature, extent, and quality of the services to be provided to the fund and its shareholders (including the investment performance of the fund); (ii) the competitiveness of the fund's management fee and total expense ratio; (iii) the total costs of the services to be provided by and the profits to be realized by Fidelity from its relationship with the fund; (iv) the extent to which economies of scale would be realized as the fund grows; and (v) whether fee levels reflect these economies of scale, if any, for the benefit of fund shareholders.
In considering whether to renew the Advisory Contracts for the fund, the Board reached a determination, with the assistance of fund counsel and Independent Trustees' counsel and through the exercise of its business judgment, that the renewal of the Advisory Contracts is in the best interests of the fund and its shareholders and that the compensation payable under the Advisory Contracts is fair and reasonable. The Board's decision to renew the Advisory Contracts was not based on any single factor, but rather was based on a comprehensive consideration of all the information provided to the Board at its meetings throughout the year. The Board, in reaching its determination to renew the Advisory Contracts, is aware that shareholders in the fund have a broad range of investment choices available to them, including a wide choice among mutual funds offered by Fidelity's competitors, and that the fund's shareholders, who have the opportunity to review and weigh the disclosure provided by the fund in its prospectus and other public disclosures, have chosen to invest in this fund, managed by Fidelity.
Annual Report
Board Approval of Investment Advisory Contracts and
Management Fees - continued
Nature, Extent, and Quality of Services Provided. The Board considered the staffing within the investment adviser, FMR, and the sub-advisers (together, the Investment Advisers), including the backgrounds of the fund's investment personnel and the fund's investment objective and discipline. The Independent Trustees also had discussions with senior management of Fidelity's investment operations and investment groups. The Board considered the structure of the portfolio manager compensation program and whether this structure provides appropriate incentives to act in the best interests of the fund.
Resources Dedicated to Investment Management and Support Services. The Board and the Fund Oversight and Research Committees reviewed the general qualifications and capabilities of the Investment Advisers' investment staff, including its size, education, experience, and resources, as well as the Investment Advisers' approach to recruiting, training, managing, and compensating investment personnel. The Board also noted that FMR has devoted increased resources to non-U.S. offices. The Board noted that Fidelity's analysts have extensive resources, tools and capabilities which allow them to conduct sophisticated quantitative and fundamental analysis, as well as credit analysis of issuers, counterparties and enhancers. The Board also believes that Fidelity's investment professionals have sufficient access to global information and data so as to provide competitive investment results over time, and that those professionals also have access to sophisticated tools which permit them to assess portfolio construction and risk and performance attribution characteristics continuously, as well as to transmit new information and research conclusions rapidly around the world. Additionally, in their deliberations, the Board considered the Investment Advisers' trading capabilities and resources which are an integral part of the investment management process.
Shareholder and Administrative Services. The Board considered (i) the nature, extent, quality, and cost of advisory, administrative, and shareholder services performed by the Investment Advisers and their affiliates under the Advisory Contracts and under separate agreements covering transfer agency, pricing and bookkeeping, and securities lending services for the fund; (ii) the nature and extent of the investment adviser's supervision of third party service providers, principally custodians and subcustodians; and (iii) the resources devoted to, and the record of compliance with, the fund's compliance policies and procedures. The Board also reviewed the allocation of fund brokerage, including allocations to brokers affiliated with the Investment Advisers, the use of brokerage commissions to pay fund expenses, and the use of "soft" commission dollars to pay for research services.
The Board noted that the growth of fund assets over time across the complex allows Fidelity to reinvest in the development of services designed to enhance the value or convenience of the Fidelity funds as investment vehicles. These services include 24-hour access to account information and market information through telephone representatives and over the Internet, investor education materials and asset allocation tools, and the expanded availability of Fidelity Investor Centers, with 35 new branches opening since 2010.
Annual Report
Investment in a Large Fund Family. The Board considered the benefits to shareholders of investing in a Fidelity fund, including the benefits of investing in a fund that is part of a large family of funds offering a variety of investment disciplines and providing a large variety of mutual fund investor services. The Board noted that Fidelity had taken, or had made recommendations that resulted in the Fidelity funds taking, a number of actions over the previous year that benefited particular funds, including (i) continuing to dedicate additional resources to investment research and support of the senior management team that oversees asset management; (ii) rationalizing product lines through the mergers of six funds into other funds; (iii) continuing to migrate the Freedom Funds to dedicated lower cost underlying funds; (iv) obtaining shareholder approval to broaden the investment strategies for Fidelity Consumer Finance Portfolio, Fidelity Emerging Asia Fund, and Fidelity Environment and Alternative Energy Portfolio; (v) contractually agreeing to reduce the management fees and impose other expense limitations on Spartan® 500 Index Fund and U.S. Bond Index Fund in connection with launching new institutional classes of these funds; (vi) changing the name, primary and supplemental benchmarks, and investment policies of Fidelity Global Strategies Fund to support the fund's flexible investment mandate and global orientation; and (vii) reducing the transfer agency account fee rates on certain accounts.
Investment Performance. The Board considered whether the fund has operated in accordance with its investment objective, as well as its record of compliance with its investment restrictions. It also reviewed the fund's absolute investment performance for the retail class, as well as the fund's relative investment performance for the retail class measured over multiple periods against (i) a proprietary custom index, and (ii) a peer group of mutual funds and reviewed by the Board. The following charts considered by the Board show, over the one-, three-, and five-year periods ended December 31, 2010, the cumulative total returns of the retail class of the fund, the cumulative total returns of a proprietary custom index ("benchmark"), and a range of cumulative total returns of a peer group of mutual funds identified by Lipper Inc. as having an investment objective similar to that of the fund. (The Advisor classes of the fund had less than one year of performance as of December 31, 2010). The box within each chart shows the 25th percentile return (bottom of box) and the 75th percentile return (top of box) of the peer group. Returns shown above the box are in the first quartile and returns shown below the box are in the fourth quartile. The percentage beaten number noted below each chart corresponds to the percentile box and represents the percentage of funds in the peer group whose performance was equal to or lower than that of the retail class of the fund. The fund's proprietary custom index is an index developed by FMR that represents the performance of the fund's unmanaged indexes.
Annual Report
Board Approval of Investment Advisory Contracts and
Management Fees - continued
Fidelity Real Estate Income Fund
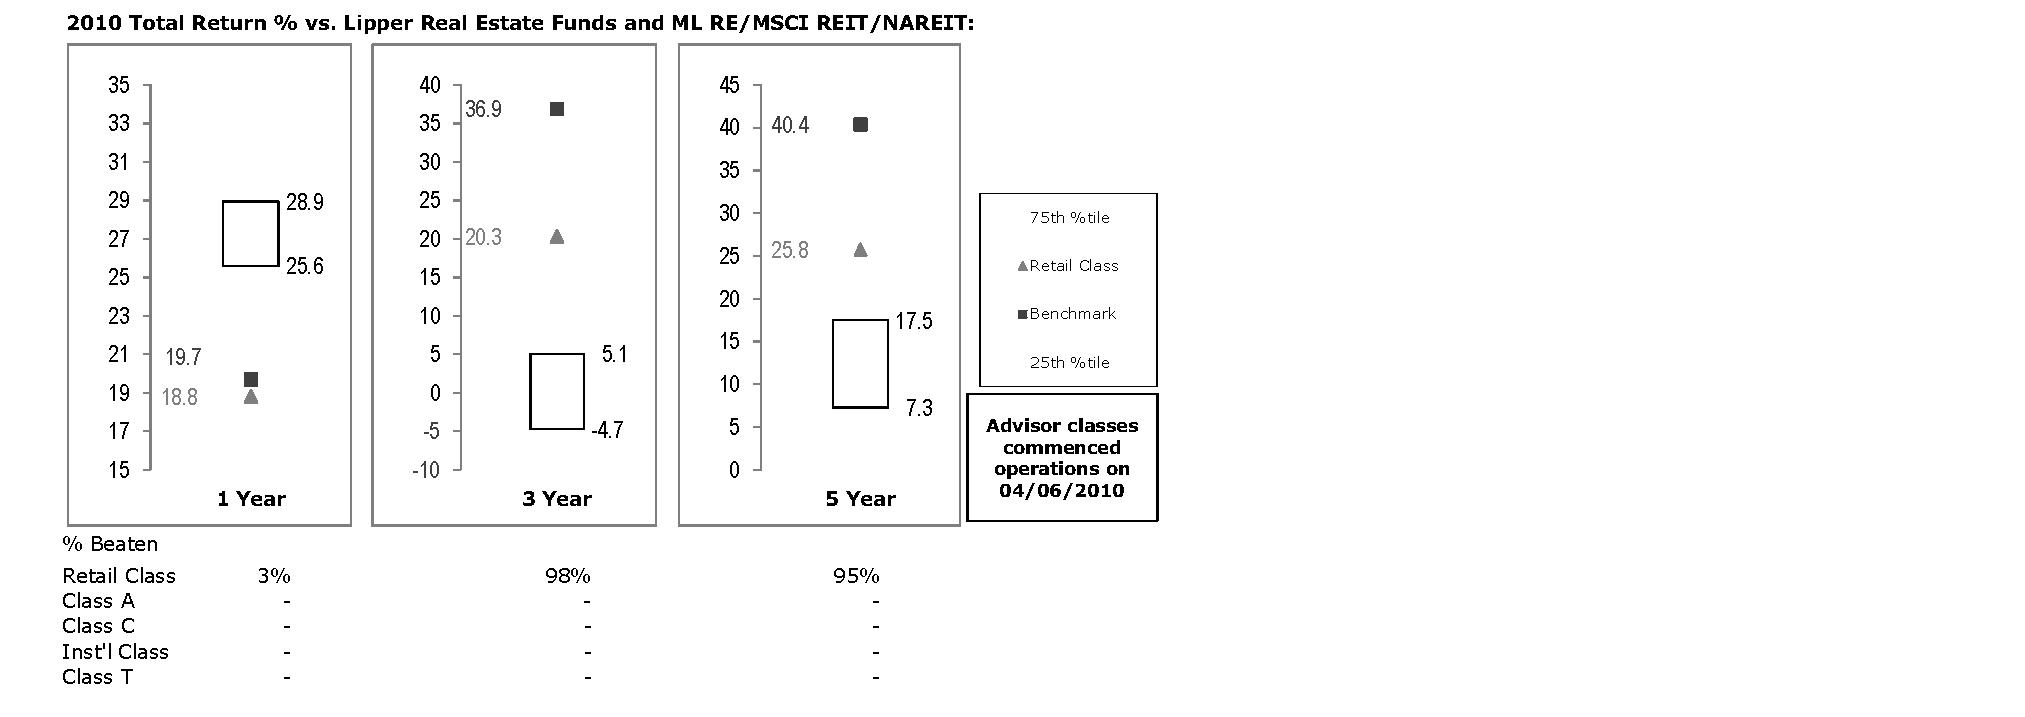
The Board reviewed the fund's relative investment performance against its peer group and noted that the performance of the retail class of the fund was in the fourth quartile for the one-year period and the first quartile for three- and five-year periods. The Board also noted that the investment performance of the fund was lower than its benchmark for all the periods shown. The Board also reviewed the fund's performance since inception as well as performance in the current year.
Based on its review, the Board concluded that the nature, extent, and quality of services provided to the fund under the Advisory Contracts should benefit the fund's shareholders.
Competitiveness of Management Fee and Total Expense Ratio. The Board considered the fund's management fee and total expense ratio compared to "mapped groups" of competitive funds and classes. Fidelity creates "mapped groups" by combining similar Lipper investment objective categories that have comparable management fee characteristics. Combining Lipper investment objective categories aids the Board's management fee and total expense ratio comparisons by broadening the competitive group used for comparison and by reducing the number of universes to which various Fidelity funds are compared.
Management Fee. The Board considered two proprietary management fee comparisons for the 12-month periods shown in the chart below. The group of Lipper funds used by the Board for management fee comparisons is referred to below as the "Total Mapped Group." The Total Mapped Group is broader than the Lipper peer group used by the Board for performance comparisons because the Total Mapped Group combines several Lipper investment objective categories while the Lipper peer group does not. The Total Mapped Group comparison focuses on a fund's standing relative to the total universe of comparable funds available to investors in terms of gross management fees before expense reimbursements or caps. "TMG %" represents the percentage of funds in the Total Mapped Group that had management fees that were lower than the fund's. For example, a TMG % of 6% means that 94% of the funds in the Total Mapped Group had higher management fees than the fund. The "Asset-Size Peer Group" (ASPG) comparison focuses on a fund's standing relative to non-Fidelity funds similar in size to the fund within the Total Mapped Group. The ASPG represents at least 15% of the funds in the Total Mapped Group with comparable asset size and management fee characteristics, subject to a minimum of 50 funds (or all funds in the Total Mapped Group if fewer than 50). Additional information, such as the ASPG quartile in which the fund's management fee ranked, is also included in the chart and considered by the Board.
Annual Report
Fidelity Real Estate Income Fund
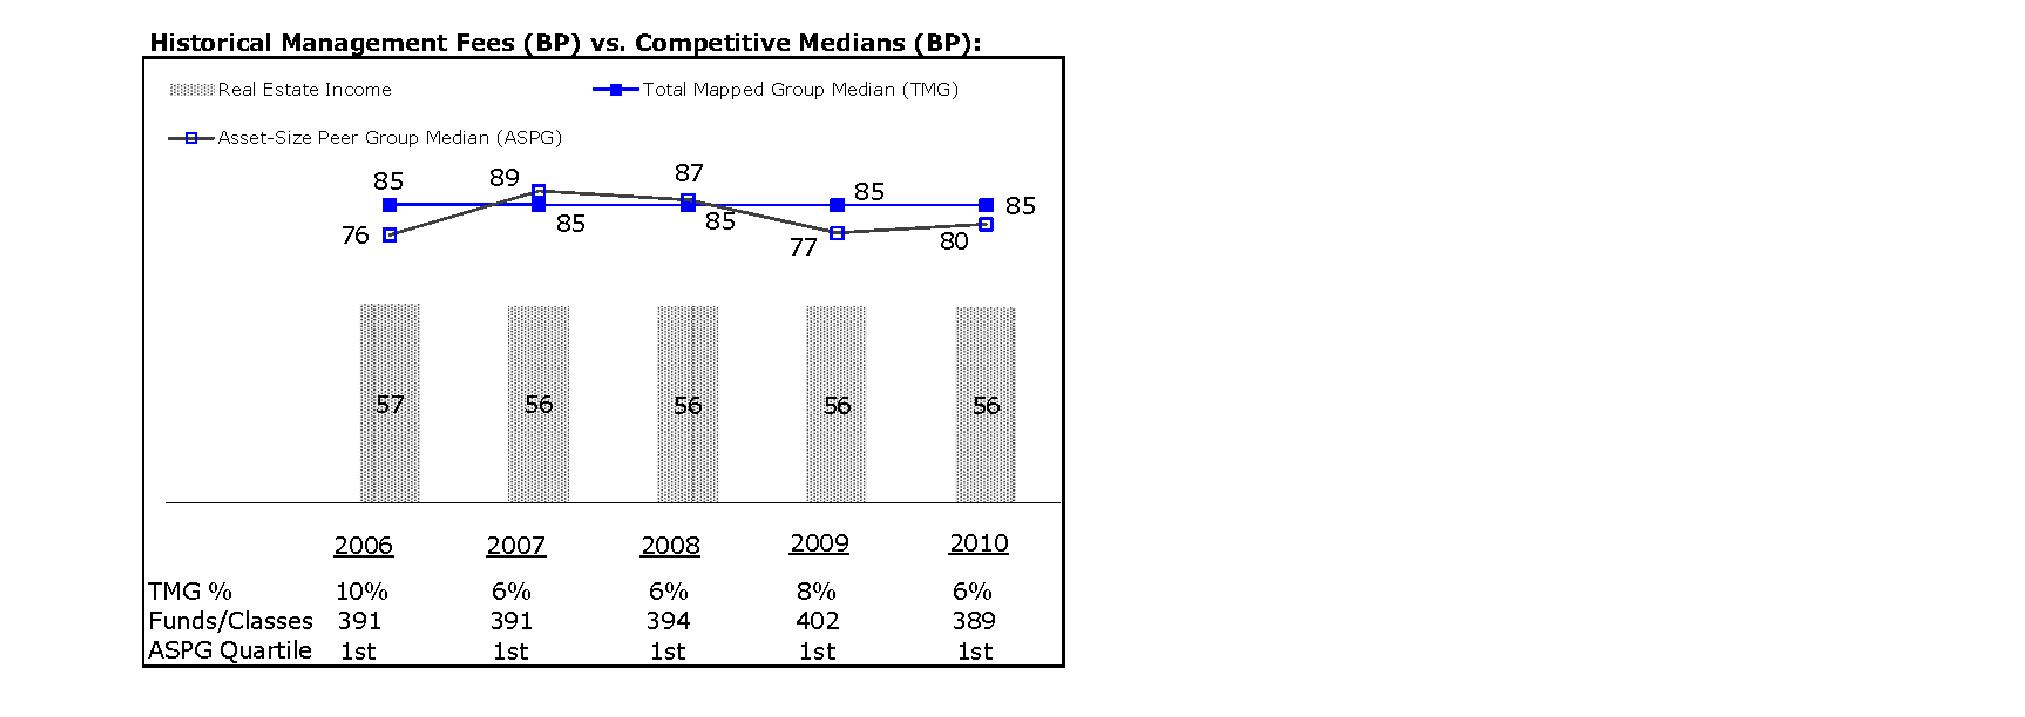
The Board noted that the fund's management fee ranked below the median of its Total Mapped Group and below the median of its ASPG for 2010.
Based on its review, the Board concluded that the fund's management fee is fair and reasonable in light of the services that the fund receives and the other factors considered.
Annual Report
Board Approval of Investment Advisory Contracts and
Management Fees - continued
Total Expense Ratio. In its review of each class's total expense ratio, the Board considered the fund's management fee as well as other fund or class expenses, as applicable, such as transfer agent fees, pricing and bookkeeping fees, fund-paid 12b-1 fees, and custodial, legal, and audit fees. The Board also noted the effects of any waivers and reimbursements on fees and expenses. As part of its review, the Board also considered the current and historical total expense ratios of each class of the fund compared to competitive fund median expenses. Each class of the fund is compared to those funds and classes in the Total Mapped Group (used by the Board for management fee comparisons) that have a similar sales load structure.
The Board noted that the total expense ratio of each class ranked below its competitive median for the period. The Board considered that various factors, including 12b-1 fees, positive or negative performance adjustments, and relatively higher other expenses in the case of small fund size, can affect total expense ratios.
Fees Charged to Other Fidelity Clients. The Board also considered Fidelity fee structures and other information with respect to clients of FMR and its affiliates, such as other mutual funds advised or subadvised by FMR or its affiliates, pension plan clients, and other institutional clients. In March 2010, the Board created an ad hoc joint committee with the board of other Fidelity funds (the Committee) to review and compare Fidelity's institutional investment advisory business with its business of providing services to the Fidelity funds, including the differences in services provided, fees charged, and costs incurred, as well as competition in their respective marketplaces.
Based on its review of total expense ratios and fees charged to other Fidelity clients, the Board concluded that the total expense ratio of each class of the fund was reasonable in light of the services that the fund and its shareholders receive and the other factors considered, including the findings of the Committee.
Costs of the Services and Profitability. The Board considered the revenues earned and the expenses incurred by Fidelity in conducting the business of developing, marketing, distributing, managing, administering and servicing the fund and its shareholders. The Board also considered the level of Fidelity's profits in respect of all the Fidelity funds.
On an annual basis, FMR presents to the Board Fidelity's profitability for the fund. Fidelity calculates the profitability for each fund, as well as aggregate profitability for groups of Fidelity funds and all Fidelity funds, using a series of detailed revenue and cost allocation methodologies which originate with the books and records of Fidelity on which Fidelity's audited financial statements are based. The Audit Committee of the Board reviews any significant changes from the prior year's methodologies.
PricewaterhouseCoopers LLP (PwC), independent registered public accounting firm and auditor to Fidelity and certain Fidelity funds, has been engaged annually by the Board as part of the Board's assessment of Fidelity's profitability analysis. PwC's engagement includes the review and assessment of Fidelity's methodologies used in determining the revenues and expenses attributable to Fidelity's mutual fund business, and completion of agreed-upon procedures surrounding the mathematical accuracy of fund profitability and its conformity to allocation methodologies. After considering PwC's reports issued under the engagement and information provided by Fidelity, the Board concluded that while other allocation methods may also be reasonable, Fidelity's profitability methodologies are reasonable in all material respects.
Annual Report
The Board also reviewed Fidelity's non-fund businesses and fall-out benefits related to the mutual fund business as well as cases where Fidelity's affiliates may benefit from or be related to the fund's business.
The Board considered the costs of the services provided by and the profits realized by Fidelity in connection with the operation of the fund and was satisfied that the profitability was not excessive in the circumstances.
Economies of Scale. The Board considered whether there have been economies of scale in respect of the management of the Fidelity funds, whether the Fidelity funds (including the fund) have appropriately benefited from any such economies of scale, and whether there is potential for realization of any further economies of scale. The Board considered the extent to which the fund will benefit from economies of scale through increased services to the fund, through waivers or reimbursements, or through fee or expense reductions. The Board also noted that in 2009, it and the board of other Fidelity funds created an ad hoc committee (the Economies of Scale Committee) to analyze whether FMR attains economies of scale in respect of the management and servicing of the Fidelity funds, whether the Fidelity funds have appropriately benefited from such economies of scale, and whether there is potential for realization of any further economies of scale.
The Board recognized that the fund's management contract incorporates a "group fee" structure, which provides for lower group fee rates as total fund assets under FMR's management increase, and for higher group fee rates as total fund assets under FMR's management decrease. FMR calculates the group fee rates based on a tiered asset "breakpoint" schedule that varies based on asset class. The Board considered that the group fee is designed to deliver the benefits of economies of scale to fund shareholders when total Fidelity fund assets increase, even if assets of any particular fund are unchanged or have declined, because some portion of Fidelity's costs are attributable to services provided to all Fidelity funds, and all funds benefit if those costs can be allocated among more assets. The Board concluded that, given the group fee structure, fund shareholders will benefit from lower management fees as assets under FMR's management increase at the fund complex level, regardless of whether Fidelity achieves any such economies of scale.
Annual Report
Board Approval of Investment Advisory Contracts and
Management Fees - continued
The Board concluded, taking into account the analysis of the Economies of Scale Committee, that any potential economies of scale are being appropriately shared between fund shareholders and Fidelity.
Additional Information Requested by the Board. In order to develop fully the factual basis for consideration of the Fidelity funds' Advisory Contracts, the Board requested and received additional information on certain topics, including (i) fund performance trends, actions to be taken by FMR to improve certain funds' overall performance, and Fidelity's long-term strategies for certain funds; (ii) portfolio manager changes that have occurred during the past year and length of portfolio manager tenure for different categories of funds over time; (iii) Fidelity's compensation structure for portfolio managers and other key personnel and strategies for attracting and retaining non-investment personnel; (iv) the amount of the investment that each portfolio manager has made in the Fidelity fund(s) that he or she manages; (v) historical trends in Fidelity's realization of fall-out benefits; (vi) Fidelity's group fee structures and the rationale for the individual fee rates of certain funds; (vii) fund profitability methodology and the impact of certain factors on fund profitability results; (viii) trends regarding industry use of performance fee structures and Fidelity's compliance practices with respect to performance adjustment calculations; (ix) the fee structures in place for certain other Fidelity clients; and (x) explanations regarding the relative total expense ratios of certain funds and classes, total expense competitive trends, and actions that might be taken by FMR to reduce total expense ratios for certain funds and classes.
Based on its evaluation of all of the conclusions noted above, and after considering all factors it believed relevant, the Board ultimately concluded that the advisory fee structures are fair and reasonable, and that the fund's Advisory Contracts should be renewed.
Annual Report
Managing Your Investments
Fidelity offers several ways to conveniently manage your personal investments via your telephone or PC. You can access your account information, conduct trades and research your investments 24 hours a day.
By Phone
Fidelity Automated Service Telephone provides a single toll-free number to access account balances, positions, quotes and trading. It's easy to navigate the service, and on your first call, the system will help you create a personal identification number (PIN) for security.
(phone_graphic)
Fidelity Automated
Service Telephone (FAST®)
1-800-544-5555
Press
For mutual fund and brokerage trading.
For quotes.*
For account balances and holdings.
To review orders and mutual
fund activity.
To change your PIN.
To speak to a Fidelity representative.
By PC
Fidelity's web site on the Internet provides a wide range of information, including daily financial news, fund performance, interactive planning tools and news about Fidelity products and services.
(computer_graphic)
Fidelity's Web Site
www.fidelity.com
* When you call the quotes line, please remember that a fund's yield and return will vary and, except for money market funds, share price will also vary. This means that you may have a gain or loss when you sell your shares. There is no assurance that money market funds will be able to maintain a stable $1 share price; an investment in a money market fund is not insured or guaranteed by the U.S. government. Total returns are historical and include changes in share price, reinvestment of dividends and capital gains distributions, and the effects of any sales charges.
Annual Report
To Write Fidelity
We'll give your correspondence immediate attention and send you written confirmation upon completion of your request.
(letter_graphic)Making Changes
To Your Account
(such as changing name, address, bank, etc.)
Fidelity Investments
P.O. Box 770001
Cincinnati, OH 45277-0002
(letter_graphic)
For Non-Retirement
Accounts
Buying shares
Fidelity Investments
P.O. Box 770001
Cincinnati, OH 45277-0003
Overnight Express
Fidelity Investments
Attn: Distribution Services
100 Crosby Parkway - KC1H
Covington, KY 41015
Selling shares
Fidelity Investments
P.O. Box 770001
Cincinnati, OH 45277-0035
Overnight Express
Fidelity Investments
Attn: Distribution Services
100 Crosby Parkway - KC1H
Covington, KY 41015
General Correspondence
Fidelity Investments
P.O. Box 500
Merrimack, NH 03054-0500
(letter_graphic)
For Retirement
Accounts
Buying shares
Fidelity Investments
P.O. Box 770001
Cincinnati, OH 45277-0003
Selling shares
Fidelity Investments
P.O. Box 770001
Cincinnati, OH 45277-0035
Overnight Express
Fidelity Investments
Attn: Distribution Services
100 Crosby Parkway - KC1H
Covington, KY 41015
General Correspondence
Fidelity Investments
P.O. Box 500
Merrimack, NH 03054-0500
Annual Report
Investment Adviser
Fidelity Management & Research Company
Boston, MA
Investment Sub-Advisers
FMR Co., Inc.
Fidelity Management & Research
(U.K.) Inc.
Fidelity Management & Research
(Hong Kong) Limited
Fidelity Management & Research
(Japan) Inc.
General Distributor
Fidelity Distributors Corporation
Boston, MA
Transfer and Service Agents
Fidelity Investments Institutional
Operations Company, Inc.
Boston, MA
Fidelity Service Company, Inc.
Boston, MA
Custodian
Citibank, N.A.
New York, NY
The Fidelity Telephone Connection
Mutual Fund 24-Hour Service
Exchanges/Redemptions
and Account Assistance 1-800-544-6666
Product Information 1-800-544-6666
Retirement Accounts 1-800-544-4774
(8 a.m. - 9 p.m.)
TDD Service 1-800-544-0118
for the deaf and hearing impaired
(9 a.m. - 9 p.m. Eastern time)
Fidelity Automated Service
Telephone (FAST®) 1-800-544-5555
Automated line for quickest service
REI-UANN-0911
1.789710.108
(Fidelity Investment logo)(registered trademark)
Fidelity Advisor®
Real Estate Income
Fund - Class A, Class T, and Class C
Annual Report
July 31, 2011
(2_fidelity_logos) (Registered_Trademark)
Class A , Class T, and
Class C are classes of Fidelity® Real Estate Income Fund
Contents
Chairman's Message | <Click Here> | The Chairman's message to shareholders. |
Performance | <Click Here> | How the fund has done over time. |
Management's Discussion of Fund Performance | <Click Here> | The Portfolio Manager's review of fund performance and strategy. |
Shareholder Expense Example | <Click Here> | An example of shareholder expenses. |
Investment Changes | <Click Here> | A summary of the fund's holdings. |
Investments | <Click Here> | A complete list of the fund's investments with their market values. |
Financial Statements | <Click Here> | Statements of assets and liabilities, operations, and changes in net assets,
as well as financial highlights. |
Notes | <Click Here> | Notes to the financial statements. |
Report of Independent Registered Public Accounting Firm | <Click Here> | |
Trustees and Officers | <Click Here> | |
Distributions | <Click Here> | |
Board Approval of Investment Advisory Contracts and Management Fees | <Click Here> | |
To view a fund's proxy voting guidelines and proxy voting record for the 12-month period ended June 30, visit http://www.fidelity.com/proxyvotingresults or visit the Securities and Exchange Commission's (SEC) web site at http://www.sec.gov. You may also call 1-877-208-0098 to request a free copy of the proxy voting guidelines.
Standard & Poor's, S&P and S&P 500 are registered service marks of The McGraw-Hill Companies, Inc. and have been licensed for use by Fidelity Distributors Corporation.
Other third party marks appearing herein are the property of their respective owners.
All other marks appearing herein are registered or unregistered trademarks or service marks of FMR LLC or an affiliated company.
Annual Report
This report and the financial statements contained herein are submitted for the general information of the shareholders of the fund. This report is not authorized for distribution to prospective investors in the fund unless preceded or accompanied by an effective prospectus.
A fund files its complete schedule of portfolio holdings with the SEC for the first and third quarters of each fiscal year on Form N-Q. Forms N-Q are available on the SEC's web site at http://www.sec.gov. A fund's Forms N-Q may be reviewed and copied at the SEC's Public Reference Room in Washington, DC. Information regarding the operation of the SEC's Public Reference Room may be obtained by calling 1-800-SEC-0330. For a complete list of a fund's portfolio holdings, view the most recent holdings listing, semiannual report, or annual report on Fidelity's web site at http://www.fidelity.com, http://www.advisor.fidelity.com, or http://www.401k.com, as applicable.
NOT FDIC INSURED • MAY LOSE VALUE • NO BANK GUARANTEE
Neither the fund nor Fidelity Distributors Corporation is a bank.
Annual Report
(photo_of_James_C_Curvey)
Dear Shareholder:
The second half of 2011 began with U.S. equities continuing to give back some of the gains achieved earlier in the year. In the days leading up to July 31, markets were shaken by a political stalemate in which Congress struggled to address the debt ceiling issue before an early-August deadline. The resulting uncertainty held back markets in July, the third consecutive monthly decline for equities, effectively reversing the positive momentum seen through the end of April. Financial markets are always unpredictable, of course, but there are several time-tested investment principles that can help put the odds in your favor.
One of the basic tenets is to invest for the long term. Over time, riding out the markets' inevitable ups and downs has proven much more effective than selling into panic or chasing the hottest trend. Even missing only a few of the markets' best days can significantly diminish investor returns. Patience also affords the benefits of compounding - of earning interest on additional income or reinvested dividends and capital gains. There can be tax advantages and cost benefits to consider as well. While staying the course doesn't eliminate risk, it can considerably lessen the effect of short-term declines.
You can further manage your investing risk through diversification. And today, more than ever, geographic diversification should be taken into account. Studies indicate that asset allocation is the single most important determinant of a portfolio's long-term success. The right mix of stocks, bonds and cash - aligned to your particular risk tolerance and investment objective - is very important. Age-appropriate rebalancing is also an essential aspect of asset allocation. For younger investors, an emphasis on equities - which historically have been the best-performing asset class over time - is encouraged. As investors near their specific goal, such as retirement or sending a child to college, consideration may be given to replacing volatile assets (e.g. common stocks) with more-stable fixed investments (bonds or savings plans).
A third principle - investing regularly - can help lower the average cost of your purchases. Investing a certain amount of money each month or quarter helps ensure you won't pay for all your shares at market highs. This strategy - known as dollar cost averaging - also reduces "emotion" from investing, helping shareholders avoid selling weak performers just prior to an upswing, or chasing a hot performer just before a correction.
We invite you to contact us via the Internet, through our Investor Centers or by phone. It is our privilege to provide you the information you need to make the investments that are right for you.
Sincerely,
(The acting chairman's signature appears here.)
James C. Curvey
Acting Chairman
Annual Report
Average annual total return reflects the change in the value of an investment, assuming reinvestment of the class' distributions from dividend income and capital gains (the profits earned upon the sale of securities that have grown in value, if any) and assuming a constant rate of performance each year. The $10,000 table and the fund's returns do not reflect the deduction of taxes that a shareholder would pay on fund distributions or the redemption of fund shares. During periods of reimbursement by Fidelity, a fund's total return will be greater than it would be had the reimbursement not occurred. How a fund did yesterday is no guarantee of how it will do tomorrow.
Average Annual Total Returns
Periods ended July 31, 2011 | Past 1
year | Past 5
years | Life of
fundA |
Class A (incl. 4.00% sales charge) B | 8.74% | 3.92% | 6.83% |
Class T (incl. 4.00% sales charge) C | 8.58% | 3.88% | 6.82% |
Class C (incl. contingent deferred sales charge)D | 11.25% | 4.54% | 7.21% |
A From February 4, 2003.
B The initial offering of Class A shares took place on April 14, 2010. Returns prior to April 14, 2010 are those of Fidelity® Real Estate Income Fund, the original class of the fund, which has no 12b-1 fee. Had Class A's 12b-1 fee been reflected, returns prior to April 14, 2010 would have been lower.
C The initial offering of Class T shares took place on April 14, 2010. Returns prior to April 14, 2010 are those of Fidelity Real Estate Income Fund, the original class of the fund, which has no 12b-1 fee. Had Class T's 12b-1 fee been reflected, returns prior to April 14, 2010 would have been lower.
D The initial offering of Class C shares took place on April 14, 2010. Returns prior to April 14, 2010 are those of Fidelity Real Estate Income Fund, the original class of the fund, which has no 12b-1 fee. Had Class C's 12b-1 fee been reflected, returns prior to April 14, 2010 would have been lower. Class C shares' contingent deferred sales charges included in the past one year, past five years, and life of fund total return figures are 1%, 0%, and 0%, respectively.
Annual Report
$10,000 Over Life of Fund
Let's say hypothetically that $10,000 was invested in Fidelity Advisor® Real Estate Income Fund - Class A on February 4, 2003, when the fund started, and the current 4.00% sales charge was paid. The chart shows how the value of your investment would have changed, and also shows how the S&P 500® Index performed over the same period. The initial offering of Class A took place on April 14, 2010. See the previous page for additional information regarding the performance of Class A.
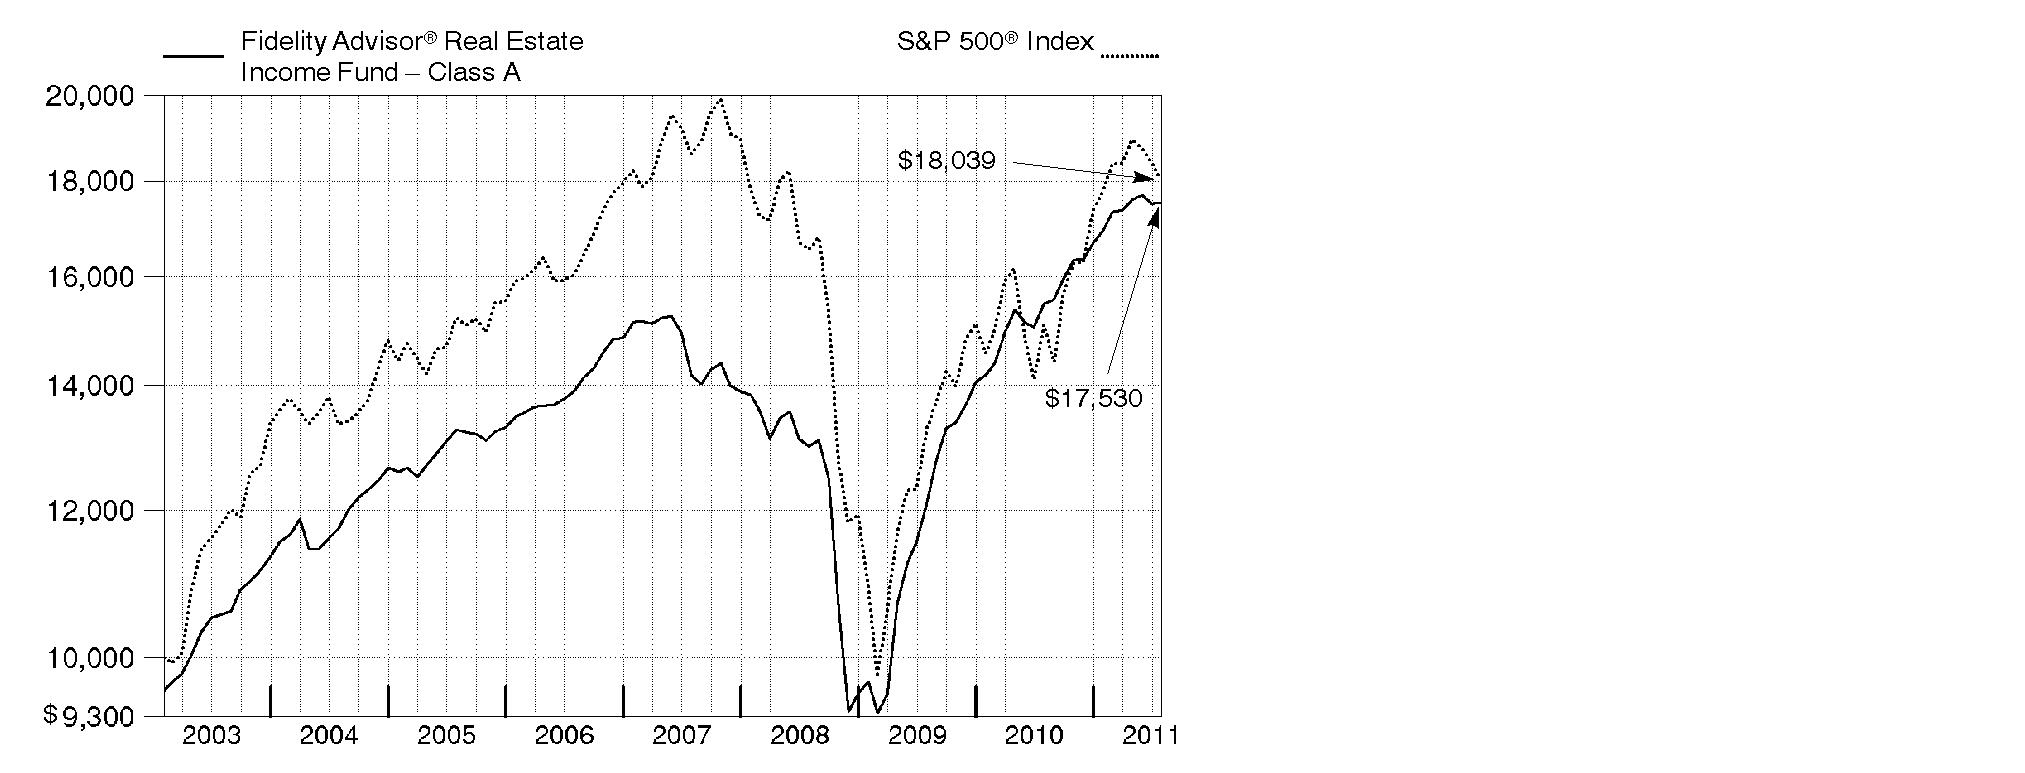
Annual Report
Market Recap: Commercial real estate fundamentals continued to improve throughout the 12-month period ending July 31, 2011, as limited new building activity, good demand and low interest rates helped boost property values. Occupancy levels and rents gradually increased across almost all property types, with the combination helping to push up cash flows. Real estate investment trusts (REITs) that own apartments and retail properties in well-established neighborhoods were well-positioned, as were office companies focused on central business districts, while industrial and suburban office REITs did not enjoy as much upside. Against this backdrop, almost all types of real estate securities generated healthy gains. During the year, real estate common stocks, as measured by the FTSE® NAREIT® All REITs Index, rose 22.37%. Real estate bonds, as measured by The BofA Merrill LynchSM US Real Estate Index - a market-capitalization-weighted measure of the performance of investment-grade public debt of corporate issuers in the domestic real estate sector - rose 10.38%. The MSCI® REIT Preferred Index, which reflects the performance of real estate preferred stocks, rose 12.74%. In comparison, the S&P 500® Index, a proxy for the broad U.S. stock market, gained 19.65%.
Comments from Mark Snyderman, Portfolio Manager of Fidelity Advisor® Real Estate Income Fund: The fund's Class A, Class T and Class C shares gained 13.27%, 13.11% and 12.25%, respectively (excluding sales charges), for the 12 months ending July 31, 2011. In comparison, the Fidelity Real Estate Income Composite Index - a 40/40/20 blend of the MSCI® REIT Preferred Index, The BofA Merrill LynchSM U.S. Real Estate Index and the FTSE® NAREIT® All REITs Index, respectively - did somewhat better, gaining 13.76%. The fund's real estate common stocks were the best-performing securities, gaining about 21%, modestly trailing the average real estate investment trust (REIT) in the NAREIT index. Real estate bonds generated a roughly 13% return, led by commercial mortgage-backed securities (CMBS), which were up approximately 15%. Real estate preferred stocks - the other major category in which the fund invests - also performed well, rising 13% during the year, slightly above the MSCI index. The only major detractor was the fund's cash position of roughly 8%, on average, which earned almost nothing during the year. A notable detractor was the fund's convertible preferred stock holdings in real estate services provider Grubb & Ellis. On the positive side, net lease REIT Lexington Corporate Properties Trust contributed meaningfully. The fund owned this company's common stock, preferred stock and convertible bonds.
The views expressed above reflect those of the portfolio manager(s) only through the end of the period as stated on the cover of this report and do not necessarily represent the views of Fidelity or any other person in the Fidelity organization. Any such views are subject to change at any time based upon market or other conditions and Fidelity disclaims any responsibility to update such views. These views may not be relied on as investment advice and, because investment decisions for a Fidelity fund are based on numerous factors, may not be relied on as an indication of trading intent on behalf of any Fidelity fund.
Annual Report
Shareholder Expense Example
As a shareholder of the Fund, you incur two types of costs: (1) transaction costs, including sales charges (loads) on purchase payments or redemption proceeds, redemption fees, and (2) ongoing costs, including management fees, distribution and/or service (12b-1) fees and other Fund expenses. This Example is intended to help you understand your ongoing costs (in dollars) of investing in the Fund and to compare these costs with the ongoing costs of investing in other mutual funds.
The Example is based on an investment of $1,000 invested at the beginning of the period and held for the entire period (February 1, 2011 to July 31, 2011).
Actual Expenses
The first line of the accompanying table for each class of the Fund provides information about actual account values and actual expenses. You may use the information in this line, together with the amount you invested, to estimate the expenses that you paid over the period. Simply divide your account value by $1,000.00 (for example, an $8,600 account value divided by $1,000.00 = 8.6), then multiply the result by the number in the first line for a class of the Fund under the heading entitled "Expenses Paid During Period" to estimate the expenses you paid on your account during this period. A small balance maintenance fee of $12.00 that is charged once a year may apply for certain accounts with a value of less than $2,000. This fee is not included in the table below. If it was, the estimate of expenses you paid during the period would be higher, and your ending account value lower, by this amount. In addition, the Fund, as a shareholder in the underlying Fidelity Central Funds, will indirectly bear its pro-rata share of the fees and expenses incurred by the underlying Fidelity Central Funds. These fees and expenses are not included in the Fund's annualized expense ratio used to calculate the expense estimate in the table below.
Hypothetical Example for Comparison Purposes
The second line of the accompanying table for each class of the Fund provides information about hypothetical account values and hypothetical expenses based on a Class' actual expense ratio and an assumed rate of return of 5% per year before expenses, which is not the Class' actual return. The hypothetical account values and expenses may not be used to estimate the actual ending account balance or expenses you paid for the period. You may use this information to compare the ongoing costs of investing in the Fund and other funds. To do so, compare this 5% hypothetical example with the 5% hypothetical examples that appear in the shareholder reports of the other funds. A small balance maintenance fee of $12.00 that is charged once a year may apply for certain accounts with a value of less than $2,000. This fee is not included in the table below. If it was, the estimate of expenses you paid during the period would be higher, and your ending account value lower, by this amount. In addition, the Fund, as a shareholder in the underlying Fidelity Central Funds, will indirectly bear its pro-rata share of the fees and expenses incurred by the underlying Fidelity Central Funds. These fees and expenses are not included in the Fund's annualized expense ratio used to calculate the expense estimate in the table below.
Please note that the expenses shown in the table are meant to highlight your ongoing costs only and do not reflect any transaction costs. Therefore, the second line of the table is useful in comparing ongoing costs only, and will not help you determine the relative total costs of owning different funds. In addition, if these transactional costs were included, your costs would have been higher.
Annual Report
| Annualized
Expense Ratio | Beginning
Account Value
February 1, 2011 | Ending
Account Value
July 31, 2011 | Expenses Paid
During Period*
February 1, 2011 to July 31, 2011 |
Class A | 1.12% | | | |
Actual | | $ 1,000.00 | $ 1,035.30 | $ 5.65 |
HypotheticalA | | $ 1,000.00 | $ 1,019.24 | $ 5.61 |
Class T | 1.15% | | | |
Actual | | $ 1,000.00 | $ 1,034.20 | $ 5.80 |
HypotheticalA | | $ 1,000.00 | $ 1,019.09 | $ 5.76 |
Class C | 1.88% | | | |
Actual | | $ 1,000.00 | $ 1,030.00 | $ 9.46 |
HypotheticalA | | $ 1,000.00 | $ 1,015.47 | $ 9.39 |
Real Estate Income | .90% | | | |
Actual | | $ 1,000.00 | $ 1,035.70 | $ 4.54 |
HypotheticalA | | $ 1,000.00 | $ 1,020.33 | $ 4.51 |
Institutional Class | .88% | | | |
Actual | | $ 1,000.00 | $ 1,035.10 | $ 4.44 |
HypotheticalA | | $ 1,000.00 | $ 1,020.43 | $ 4.41 |
A 5% return per year before expenses
* Expenses are equal to each Class' annualized expense ratio, multiplied by the average account value over the period, multiplied by 181/365 (to reflect the one-half year period).
Annual Report
Investment Changes (Unaudited)
Top Five Stocks as of July 31, 2011 |
| % of fund's
net assets | % of fund's net assets
6 months ago |
Ventas, Inc. | 1.9 | 1.7 |
Acadia Realty Trust (SBI) | 1.6 | 1.4 |
MFA Financial, Inc. | 1.5 | 1.6 |
Equity Lifestyle Properties, Inc. | 1.3 | 1.2 |
Prologis, Inc. | 1.2 | 0.0 |
| 7.5 | |
Top 5 Bonds as of July 31, 2011 |
| % of fund's
net assets | % of fund's net assets
6 months ago |
Banc of America Large Loan Trust floater Series 2010-HLTN Class HLTN, 1.937% 11/15/15 | 2.4 | 1.4 |
Wachovia Ltd./Wachovia LLC Series 2006-1A Class A1A, 0.5065% 9/25/26 | 1.0 | 0.1 |
M/I Homes, Inc. 8.625% 11/15/18 | 0.9 | 0.0 |
Lexington Master Ltd. Partnership 5.45% 1/15/27 | 0.8 | 1.0 |
Cbre Realty Finance Cdo 2007-1/LLC 0.4958% 4/7/52 | 0.8 | 0.3 |
| 5.9 | |
Top Five REIT Sectors as of July 31, 2011 |
| % of fund's
net assets | % of fund's net assets
6 months ago |
REITs - Shopping Centers | 6.5 | 9.6 |
REITs - Health Care Facilities | 6.2 | 8.4 |
REITs - Management/Investment | 5.5 | 7.1 |
REITs - Mortgage | 5.5 | 6.8 |
REITs - Industrial Buildings | 3.4 | 5.7 |
Asset Allocation (% of fund's net assets) |
As of July 31, 2011* | As of January 31, 2011** |
| Common Stocks 23.4% | | | Common Stocks 25.9% | |
| Preferred Stocks 9.7% | | | Preferred Stocks 8.6% | |
 | Bonds 48.0% | | | Bonds 45.8% | |
| Convertible
Securities 7.1% | | | Convertible
Securities 8.8% | |
| Other Investments 4.0% | | | Other Investments 2.2% | |
| Short-Term
Investments and
Net Other Assets 7.8% | | | Short-Term
Investments and
Net Other Assets 8.7% | |
* Foreign investments | 6.3% | | ** Foreign investments | 3.3% | |
Annual Report
Investments July 31, 2011
Showing Percentage of Net Assets
Common Stocks - 23.4% |
| Shares | | Value |
CONSUMER DISCRETIONARY - 0.9% |
Hotels, Restaurants & Leisure - 0.3% |
Starwood Hotels & Resorts Worldwide, Inc. | 84,100 | | $ 4,622,136 |
Household Durables - 0.6% |
Standard Pacific Corp. (a)(f) | 2,760,000 | | 7,893,600 |
Stanley Martin Communities LLC Class B (a) | 4,620 | | 3,528,571 |
| | 11,422,171 |
TOTAL CONSUMER DISCRETIONARY | | 16,044,307 |
FINANCIALS - 21.2% |
Capital Markets - 0.4% |
HFF, Inc. (a) | 546,564 | | 8,253,116 |
Real Estate Investment Trusts - 20.7% |
Acadia Realty Trust (SBI) | 1,342,149 | | 28,171,708 |
Alexandria Real Estate Equities, Inc. | 61,100 | | 5,010,200 |
American Campus Communities, Inc. | 258,700 | | 9,628,814 |
American Capital Agency Corp. | 105,300 | | 2,939,976 |
Annaly Capital Management, Inc. | 217,250 | | 3,645,455 |
Anworth Mortgage Asset Corp. | 793,610 | | 5,499,717 |
AvalonBay Communities, Inc. (f) | 39,225 | | 5,263,603 |
Brandywine Realty Trust (SBI) | 295,700 | | 3,545,443 |
Canadian (REIT) | 107,800 | | 3,765,215 |
CapLease, Inc. | 1,239,200 | | 5,514,440 |
CBL & Associates Properties, Inc. | 325,073 | | 5,773,296 |
Cedar Shopping Centers, Inc. | 271,400 | | 1,346,144 |
Chartwell Seniors Housing (REIT) (f) | 394,700 | | 3,247,166 |
Chesapeake Lodging Trust | 203,500 | | 3,357,750 |
CommonWealth REIT | 111,700 | | 2,638,354 |
Coresite Realty Corp. | 177,500 | | 2,989,100 |
Cypress Sharpridge Investments, Inc. (f) | 640,539 | | 7,885,035 |
DCT Industrial Trust, Inc. | 960,000 | | 5,203,200 |
DiamondRock Hospitality Co. | 386,100 | | 3,945,942 |
Duke Realty LP | 388,583 | | 5,455,705 |
Dynex Capital, Inc. | 1,191,386 | | 10,841,613 |
Education Realty Trust, Inc. | 140,600 | | 1,234,468 |
Equity Lifestyle Properties, Inc. | 352,930 | | 22,996,919 |
Equity Residential (SBI) | 94,900 | | 5,866,718 |
Excel Trust, Inc. | 632,228 | | 7,251,655 |
H&R REIT/H&R Finance Trust | 206,500 | | 4,748,592 |
HCP, Inc. | 241,900 | | 8,884,987 |
Healthcare Realty Trust, Inc. | 206,300 | | 4,043,480 |
Common Stocks - continued |
| Shares | | Value |
FINANCIALS - continued |
Real Estate Investment Trusts - continued |
Highwoods Properties, Inc. (SBI) | 64,300 | | $ 2,213,849 |
Hospitality Properties Trust (SBI) | 106,400 | | 2,686,600 |
Lexington Corporate Properties Trust (f) | 837,000 | | 7,030,800 |
LTC Properties, Inc. | 247,313 | | 6,714,548 |
MFA Financial, Inc. | 3,579,381 | | 26,809,564 |
Mid-America Apartment Communities, Inc. | 64,600 | | 4,573,034 |
Monmouth Real Estate Investment Corp. Class A | 455,073 | | 3,749,802 |
National Health Investors, Inc. | 148,006 | | 6,732,793 |
National Retail Properties, Inc. | 234,500 | | 5,883,605 |
Omega Healthcare Investors, Inc. (f) | 214,000 | | 4,202,960 |
Pebblebrook Hotel Trust | 239,182 | | 4,728,628 |
Prologis, Inc. | 594,487 | | 21,181,572 |
Regency Centers Corp. | 55,100 | | 2,475,092 |
RioCan (REIT) | 150,900 | | 4,100,234 |
Senior Housing Properties Trust (SBI) | 151,700 | | 3,631,698 |
Simon Property Group, Inc. | 125,801 | | 15,160,279 |
Stag Industrial, Inc. (f) | 382,692 | | 4,703,285 |
Summit Hotel Properties, Inc. | 579,400 | | 6,535,632 |
Sunstone Hotel Investors, Inc. (a) | 450,000 | | 4,009,500 |
Two Harbors Investment Corp. | 467,980 | | 4,586,204 |
Ventas, Inc. (f) | 637,146 | | 34,488,713 |
Weyerhaeuser Co. | 454,429 | | 9,084,036 |
Whitestone REIT Class B (f) | 379,067 | | 4,776,244 |
| | 370,753,367 |
Real Estate Management & Development - 0.1% |
Brookfield Asset Management, Inc. Class A | 51,000 | | 1,606,762 |
Thrifts & Mortgage Finance - 0.0% |
Wrightwood Capital LLC warrants 7/31/14 (a)(g) | 60,681 | | 607 |
TOTAL FINANCIALS | | 380,613,852 |
HEALTH CARE - 1.3% |
Health Care Providers & Services - 1.3% |
Brookdale Senior Living, Inc. (a) | 541,600 | | 11,584,824 |
Capital Senior Living Corp. (a) | 587,750 | | 5,166,323 |
Emeritus Corp. (a) | 333,693 | | 6,557,067 |
| | 23,308,214 |
TOTAL COMMON STOCKS (Cost $361,094,507) | 419,966,373 |
Preferred Stocks - 11.4% |
| Shares | | Value |
Convertible Preferred Stocks - 1.7% |
FINANCIALS - 1.7% |
Real Estate Investment Trusts - 1.6% |
Alexandria Real Estate Equities, Inc. Series D 7.00% | 95,000 | | $ 2,493,750 |
CommonWealth REIT 6.50% | 150,000 | | 3,268,500 |
Excel Trust, Inc. 7.00% (g) | 248,200 | | 5,879,238 |
Health Care REIT, Inc. Series I, 6.50% | 30,000 | | 1,578,750 |
Lexington Corporate Properties Trust Series C 6.50% | 328,036 | | 14,174,436 |
Ramco-Gershenson Properties Trust (SBI) Series D, 7.25% | 40,000 | | 1,992,400 |
| | 29,387,074 |
Real Estate Management & Development - 0.1% |
Grubb & Ellis Co. 12.00% (g) | 27,500 | | 1,447,875 |
TOTAL FINANCIALS | | 30,834,949 |
Nonconvertible Preferred Stocks - 9.7% |
CONSUMER DISCRETIONARY - 0.1% |
Household Durables - 0.1% |
M/I Homes, Inc. Series A, 9.75% (a) | 38,200 | | 611,200 |
FINANCIALS - 9.6% |
Diversified Financial Services - 0.2% |
DRA CRT Acquisition Corp. Series A, 8.50% | 25,000 | | 475,000 |
Red Lion Hotels Capital Trust 9.50% | 163,225 | | 4,136,122 |
| | 4,611,122 |
Real Estate Investment Trusts - 9.3% |
Alexandria Real Estate Equities, Inc. Series C, 8.375% | 67,000 | | 1,722,570 |
American Home Mortgage Investment Corp.: | | | |
Series A, 9.375% (a) | 120,300 | | 12 |
Series B, 9.25% (a) | 124,100 | | 124 |
Annaly Capital Management, Inc. Series A, 7.875% | 161,300 | | 4,151,862 |
Anworth Mortgage Asset Corp. Series A, 8.625% | 309,630 | | 7,799,580 |
Apartment Investment & Management Co.: | | | |
Series T, 8.00% | 57,500 | | 1,447,275 |
Series U, 7.75% | 150,773 | | 3,790,433 |
Brandywine Realty Trust Series C, 7.50% | 37,615 | | 933,228 |
CapLease, Inc. Series A, 8.125% | 83,400 | | 2,064,150 |
Preferred Stocks - continued |
| Shares | | Value |
Nonconvertible Preferred Stocks - continued |
FINANCIALS - continued |
Real Estate Investment Trusts - continued |
CBL & Associates Properties, Inc.: | | | |
(depositary shares) Series C, 7.75% | 47,962 | | $ 1,196,652 |
7.375% | 165,688 | | 4,069,297 |
Cedar Shopping Centers, Inc. 8.875% | 290,352 | | 7,302,353 |
CenterPoint Properties Trust Series D, 5.377% | 3,575 | | 2,180,750 |
Cogdell Spencer, Inc. 8.50% | 114,300 | | 2,858,643 |
Corporate Office Properties Trust Series H, 7.50% | 5,000 | | 125,300 |
Cousins Properties, Inc. Series A, 7.75% | 93,230 | | 2,313,036 |
Duke Realty LP: | | | |
8.375% | 128,517 | | 3,333,731 |
Series L, 6.60% | 10,666 | | 257,051 |
Eagle Hospitality Properties Trust, Inc. 8.25% (a) | 24,000 | | 150,000 |
Equity Lifestyle Properties, Inc. 8.034% | 790,078 | | 19,917,866 |
Essex Property Trust, Inc. Series H, 7.125% | 40,000 | | 1,014,400 |
First Potomac Realty Trust 7.75% | 80,000 | | 2,032,000 |
Glimcher Realty Trust Series G, 8.125% | 171,111 | | 4,156,286 |
Hersha Hospitality Trust Series B, 8.00% | 80,000 | | 1,936,800 |
HomeBanc Mortgage Corp. Series A (a) | 104,685 | | 1 |
Hospitality Properties Trust: | | | |
Series B, 8.875% | 88,600 | | 2,255,756 |
Series C, 7.00% | 58,500 | | 1,428,570 |
Hudson Pacific Properties, Inc. 8.375% | 263,800 | | 6,769,108 |
Kimco Realty Corp. Series G, 7.75% | 113,026 | | 2,929,634 |
Kite Realty Group Trust 8.25% | 96,100 | | 2,383,280 |
LaSalle Hotel Properties: | | | |
Series E, 8.00% | 50,468 | | 1,268,766 |
Series G, 7.25% | 114,485 | | 2,799,158 |
Series H, 7.50% | 100,000 | | 2,464,000 |
LBA Realty Fund II: | | | |
Series A, 8.75% (a) | 69,000 | | 2,760,000 |
Series B, 7.625% (a) | 31,240 | | 687,280 |
Lexington Corporate Properties Trust Series B, 8.05% | 40,300 | | 1,004,679 |
Lexington Realty Trust 7.55% | 23,800 | | 585,480 |
MFA Financial, Inc. Series A, 8.50% | 471,886 | | 11,938,716 |
Monmouth Real Estate Investment Corp. 7.625% | 80,000 | | 2,002,400 |
Newcastle Investment Corp. Series B, 9.75% | 31,530 | | 785,097 |
Parkway Properties, Inc. Series D, 8.00% | 237,900 | | 5,947,500 |
Pebblebrook Hotel Trust Series A, 7.875% | 350,000 | | 8,837,500 |
Prologis, Inc. Series Q, 8.54% | 94,446 | | 5,398,184 |
Preferred Stocks - continued |
| Shares | | Value |
Nonconvertible Preferred Stocks - continued |
FINANCIALS - continued |
Real Estate Investment Trusts - continued |
PS Business Parks, Inc.: | | | |
(depositary shares) Series H, 7.00% | 13,300 | | $ 333,165 |
6.875% | 50,000 | | 1,253,000 |
7.20% | 83,040 | | 2,095,930 |
7.375% | 100,610 | | 2,510,220 |
Series P, 6.70% | 36,000 | | 900,000 |
Public Storage: | | | |
Series K, 7.25% | 147,639 | | 3,724,932 |
Series N, 7.00% | 4,200 | | 108,822 |
Regency Centers Corp.: | | | |
7.25% | 10,500 | | 262,920 |
Series C 7.45% | 18,000 | | 450,540 |
Saul Centers, Inc.: | | | |
8.00% | 93,700 | | 2,354,681 |
Series B (depositary shares) 9.00% | 118,550 | | 3,173,584 |
Sunstone Hotel Investors, Inc. Series A, 8.00% | 102,200 | | 2,474,262 |
UMH Properties, Inc. Series A, 8.25% | 310,000 | | 8,029,000 |
Vornado Realty Trust 6.75% | 20,000 | | 498,400 |
Weingarten Realty Investors (SBI) Series F, 6.50% | 56,230 | | 1,389,443 |
| | 166,557,407 |
Real Estate Management & Development - 0.1% |
Vornado Realty LP 7.875% | 54,682 | | 1,454,541 |
TOTAL FINANCIALS | | 172,623,070 |
TOTAL NONCONVERTIBLE PREFERRED STOCKS | | 173,234,270 |
TOTAL PREFERRED STOCKS (Cost $206,439,030) | 204,069,219 |
Corporate Bonds - 26.6% |
| Principal Amount (e) | | |
Convertible Bonds - 5.4% |
CONSUMER DISCRETIONARY - 0.0% |
Hotels, Restaurants & Leisure - 0.0% |
Morgans Hotel Group Co. 2.375% 10/15/14 | | $ 1,340,000 | | 1,157,425 |
Corporate Bonds - continued |
| Principal Amount (e) | | Value |
Convertible Bonds - continued |
FINANCIALS - 5.4% |
Real Estate Investment Trusts - 2.8% |
Acadia Realty Trust 3.75% 12/15/26 | | $ 11,505,000 | | $ 11,598,478 |
Annaly Capital Management, Inc. 4% 2/15/15 | | 1,000,000 | | 1,147,500 |
CapLease, Inc. 7.5% 10/1/27 (g) | | 5,180,000 | | 5,231,800 |
Developers Diversified Realty Corp. 1.75% 11/15/40 | | 1,000,000 | | 1,070,700 |
Hospitality Properties Trust 3.8% 3/15/27 | | 6,100,000 | | 6,100,000 |
Inland Real Estate Corp. 4.625% 11/15/26 | | 10,870,000 | | 10,842,825 |
ProLogis LP: | | | | |
1.875% 11/15/37 | | 2,450,000 | | 2,428,563 |
2.625% 5/15/38 | | 1,500,000 | | 1,492,500 |
The Macerich Co. 3.25% 3/15/12 (g) | | 4,800,000 | | 4,809,000 |
United Dominion Realty Trust, Inc. 3.625% 9/15/11 | | 5,500,000 | | 5,555,000 |
| | 50,276,366 |
Real Estate Management & Development - 2.6% |
BioMed Realty LP 4.5% 10/1/26 (g) | | 2,500,000 | | 2,518,750 |
City Center 8.75% 7/1/13 (i) | | 8,000,000 | | 7,984,800 |
Corporate Office Properties LP: | | | | |
3.5% 9/15/26 (g) | | 3,280,000 | | 3,280,000 |
4.25% 4/15/30 (g) | | 2,000,000 | | 1,982,800 |
Duke Realty LP 3.75% 12/1/11 (g) | | 2,650,000 | | 2,676,500 |
First Potomac Realty Investment LP 4% 12/15/11 (g) | | 2,600,000 | | 2,600,000 |
Grubb & Ellis Co. 7.95% 5/1/15 (g) | | 5,500,000 | | 4,662,900 |
Home Properties, Inc. 4.125% 11/1/26 (g) | | 2,100,000 | | 2,118,375 |
Kilroy Realty LP 3.25% 4/15/12 (g) | | 2,185,000 | | 2,191,828 |
Lexington Master Ltd. Partnership 5.45% 1/15/27 (g) | | 14,950,000 | | 15,006,063 |
SL Green Realty Corp. 3% 3/30/27 (g) | | 500,000 | | 500,000 |
| | 45,522,016 |
TOTAL FINANCIALS | | 95,798,382 |
TOTAL CONVERTIBLE BONDS | | 96,955,807 |
Nonconvertible Bonds - 21.2% |
CONSUMER DISCRETIONARY - 6.4% |
Hotels, Restaurants & Leisure - 0.9% |
CityCenter Holdings LLC/CityCenter Finance Corp. 7.625% 1/15/16 (g) | | 1,945,000 | | 2,027,663 |
GWR Operating Partnership LLP/Great Wolf Finance Corp. 10.875% 4/1/17 | | 1,700,000 | | 1,853,000 |
Corporate Bonds - continued |
| Principal Amount (e) | | Value |
Nonconvertible Bonds - continued |
CONSUMER DISCRETIONARY - continued |
Hotels, Restaurants & Leisure - continued |
Landry's Restaurants, Inc.: | | | | |
11.625% 12/1/15 | | $ 1,000,000 | | $ 1,085,000 |
11.625% 12/1/15 (g) | | 325,000 | | 352,625 |
Times Square Hotel Trust 8.528% 8/1/26 (g) | | 8,964,068 | | 10,697,818 |
| | 16,016,106 |
Household Durables - 5.0% |
KB Home: | | | | |
5.75% 2/1/14 | | 510,000 | | 501,075 |
5.875% 1/15/15 | | 5,000,000 | | 4,675,000 |
6.25% 6/15/15 | | 8,500,000 | | 8,011,250 |
7.25% 6/15/18 | | 2,840,000 | | 2,570,200 |
9.1% 9/15/17 | | 9,625,000 | | 9,576,875 |
Lennar Corp.: | | | | |
5.5% 9/1/14 | | 1,000,000 | | 1,010,000 |
5.6% 5/31/15 | | 5,000,000 | | 4,950,000 |
6.5% 4/15/16 | | 4,000,000 | | 4,000,000 |
6.95% 6/1/18 | | 11,000,000 | | 10,780,000 |
M/I Homes, Inc.: | | | | |
6.875% 4/1/12 | | 2,150,000 | | 2,182,250 |
8.625% 11/15/18 | | 16,880,000 | | 16,626,800 |
Meritage Homes Corp.: | | | | |
6.25% 3/15/15 | | 2,500,000 | | 2,484,375 |
7.15% 4/15/20 | | 1,500,000 | | 1,485,000 |
Ryland Group, Inc. 8.4% 5/15/17 | | 745,000 | | 812,050 |
Standard Pacific Corp.: | | | | |
7% 8/15/15 | | 4,000,000 | | 4,150,000 |
8.375% 5/15/18 | | 12,088,000 | | 12,118,220 |
10.75% 9/15/16 | | 3,000,000 | | 3,420,000 |
| | 89,353,095 |
Multiline Retail - 0.4% |
Sears Holdings Corp. 6.625% 10/15/18 (g) | | 7,065,000 | | 6,499,800 |
Specialty Retail - 0.1% |
Toys 'R' Us Property Co. I LLC 10.75% 7/15/17 | | 2,490,000 | | 2,801,250 |
TOTAL CONSUMER DISCRETIONARY | | 114,670,251 |
Corporate Bonds - continued |
| Principal Amount (e) | | Value |
Nonconvertible Bonds - continued |
CONSUMER STAPLES - 0.3% |
Food & Staples Retailing - 0.3% |
Ahold Lease Series 2001 A1 pass thru trust certificates 7.82% 1/2/20 | | $ 1,195,175 | | $ 1,320,669 |
C&S Group Enterprises LLC 8.375% 5/1/17 (g) | | 4,400,000 | | 4,565,000 |
| | 5,885,669 |
FINANCIALS - 13.5% |
Commercial Banks - 0.1% |
CapitalSource, Inc. 12.75% 7/15/14 (g) | | 1,500,000 | | 1,800,000 |
Diversified Financial Services - 0.6% |
Icahn Enterprises LP/Icahn Enterprises Finance Corp. 7.75% 1/15/16 | | 10,820,000 | | 11,225,750 |
Real Estate Investment Trusts - 8.1% |
Camden Property Trust 5% 6/15/15 | | 1,100,000 | | 1,204,126 |
Commercial Net Lease Realty, Inc.: | | | | |
6.15% 12/15/15 | | 2,526,000 | | 2,793,448 |
6.25% 6/15/14 | | 5,005,000 | | 5,474,224 |
Developers Diversified Realty Corp.: | | | | |
5.375% 10/15/12 | | 500,000 | | 514,388 |
5.5% 5/1/15 | | 2,000,000 | | 2,157,226 |
7.5% 4/1/17 | | 6,000,000 | | 6,932,370 |
7.5% 7/15/18 | | 5,271,000 | | 6,013,889 |
7.875% 9/1/20 | | 4,637,000 | | 5,489,072 |
9.625% 3/15/16 | | 3,836,000 | | 4,697,178 |
Equity One, Inc.: | | | | |
5.375% 10/15/15 | | 3,500,000 | | 3,744,608 |
6.25% 12/15/14 | | 4,081,000 | | 4,485,178 |
6.25% 1/15/17 | | 3,000,000 | | 3,298,572 |
HCP, Inc. 3.75% 2/1/16 | | 2,000,000 | | 2,072,860 |
Health Care Property Investors, Inc.: | | | | |
6% 3/1/15 | | 1,000,000 | | 1,107,116 |
6.3% 9/15/16 | | 5,250,000 | | 5,967,182 |
7.072% 6/8/15 | | 1,500,000 | | 1,703,930 |
Health Care REIT, Inc.: | | | | |
6% 11/15/13 | | 1,000,000 | | 1,084,039 |
6.2% 6/1/16 | | 750,000 | | 849,872 |
Healthcare Realty Trust, Inc.: | | | | |
5.125% 4/1/14 | | 3,650,000 | | 3,897,010 |
6.5% 1/17/17 | | 1,875,000 | | 2,130,191 |
HMB Capital Trust V 3.847% 12/15/36 (d)(g)(i) | | 2,530,000 | | 0 |
Corporate Bonds - continued |
| Principal Amount (e) | | Value |
Nonconvertible Bonds - continued |
FINANCIALS - continued |
Real Estate Investment Trusts - continued |
Hospitality Properties Trust: | | | | |
5.625% 3/15/17 | | $ 915,000 | | $ 959,986 |
6.75% 2/15/13 | | 610,000 | | 636,954 |
7.875% 8/15/14 | | 1,000,000 | | 1,134,415 |
HRPT Properties Trust: | | | | |
5.75% 11/1/15 | | 3,600,000 | | 3,894,545 |
6.25% 8/15/16 | | 1,500,000 | | 1,669,115 |
6.5% 1/15/13 | | 200,000 | | 206,863 |
iStar Financial, Inc.: | | | | |
5.875% 3/15/16 | | 3,000,000 | | 2,617,500 |
5.95% 10/15/13 | | 5,330,000 | | 5,010,200 |
6.05% 4/15/15 | | 4,725,000 | | 4,347,000 |
Kimco Realty Corp. 5.783% 3/15/16 | | 450,000 | | 505,254 |
MPT Operating Partnership LP/MPT Finance Corp. 6.875% 5/1/21 (g) | | 2,000,000 | | 1,955,000 |
Nationwide Health Properties, Inc.: | | | | |
6% 5/20/15 | | 3,122,000 | | 3,459,164 |
6.25% 2/1/13 | | 1,000,000 | | 1,065,264 |
8.25% 7/1/12 | | 1,300,000 | | 1,356,306 |
Omega Healthcare Investors, Inc.: | | | | |
6.75% 10/15/22 | | 2,115,000 | | 2,152,013 |
7% 1/15/16 | | 1,295,000 | | 1,340,325 |
7.5% 2/15/20 | | 1,000,000 | | 1,065,000 |
Pan Pacific Retail Properties, Inc. 5.95% 6/1/14 | | 1,750,000 | | 1,935,015 |
Potlatch Corp. 7.5% 11/1/19 | | 1,000,000 | | 1,040,000 |
ProLogis LP: | | | | |
6.25% 3/15/17 | | 4,000,000 | | 4,499,508 |
6.625% 5/15/18 | | 6,480,000 | | 7,350,426 |
7.625% 7/1/17 | | 4,690,000 | | 5,550,939 |
Reckson Operating Partnership LP/SL Green Realty Corp./SL Green Operating Partnership LP 7.75% 3/15/20 | | 2,000,000 | | 2,318,400 |
Senior Housing Properties Trust: | | | | |
4.3% 1/15/16 | | 5,000,000 | | 5,126,080 |
6.75% 4/15/20 | | 2,000,000 | | 2,185,680 |
8.625% 1/15/12 | | 5,900,000 | | 6,069,094 |
UDR, Inc. 5.5% 4/1/14 | | 500,000 | | 537,947 |
United Dominion Realty Trust, Inc.: | | | | |
5.13% 1/15/14 | | 500,000 | | 532,090 |
Corporate Bonds - continued |
| Principal Amount (e) | | Value |
Nonconvertible Bonds - continued |
FINANCIALS - continued |
Real Estate Investment Trusts - continued |
United Dominion Realty Trust, Inc.: - continued | | | | |
5.25% 1/15/15 | | $ 1,000,000 | | $ 1,081,156 |
5.25% 1/15/16 | | 4,000,000 | | 4,295,948 |
Weingarten Realty Investors 4.857% 1/15/14 | | 2,500,000 | | 2,668,495 |
| | 144,182,161 |
Real Estate Management & Development - 4.6% |
AMB Property LP 5.9% 8/15/13 | | 400,000 | | 428,900 |
BioMed Realty LP 3.85% 4/15/16 | | 2,000,000 | | 2,050,064 |
Brandywine Operating Partnership LP: | | | | |
5.4% 11/1/14 | | 6,750,000 | | 7,269,899 |
5.75% 4/1/12 | | 1,000,000 | | 1,026,487 |
7.5% 5/15/15 | | 1,000,000 | | 1,158,969 |
CB Richard Ellis Services, Inc.: | | | | |
6.625% 10/15/20 | | 1,205,000 | | 1,232,113 |
11.625% 6/15/17 | | 1,500,000 | | 1,740,000 |
Colonial Properties Trust: | | | | |
6.15% 4/15/13 | | 1,500,000 | | 1,576,538 |
6.25% 6/15/14 | | 3,094,000 | | 3,333,528 |
6.875% 8/15/12 | | 1,000,000 | | 1,038,582 |
Colonial Realty LP 6.05% 9/1/16 | | 2,500,000 | | 2,658,675 |
Duke Realty LP: | | | | |
6.25% 5/15/13 | | 750,000 | | 806,309 |
7.375% 2/15/15 | | 1,500,000 | | 1,725,500 |
Forest City Enterprises, Inc.: | | | | |
6.5% 2/1/17 | | 15,120,000 | | 14,326,200 |
7.625% 6/1/15 | | 4,180,000 | | 4,159,100 |
Highwoods/Forsyth LP 5.85% 3/15/17 | | 2,800,000 | | 3,102,655 |
Host Hotels & Resorts, Inc.: | | | | |
5.875% 6/15/19 (g) | | 2,725,000 | | 2,779,500 |
6.875% 11/1/14 | | 500,000 | | 511,250 |
9% 5/15/17 | | 750,000 | | 843,750 |
Liberty Property LP 6.375% 8/15/12 | | 2,679,000 | | 2,806,727 |
Post Apartment Homes LP: | | | | |
5.45% 6/1/12 | | 713,000 | | 731,921 |
6.3% 6/1/13 | | 2,000,000 | | 2,140,672 |
Realogy Corp. 7.875% 2/15/19 (g) | | 2,035,000 | | 2,004,475 |
Regency Centers LP: | | | | |
5.25% 8/1/15 | | 4,509,000 | | 4,966,542 |
Corporate Bonds - continued |
| Principal Amount (e) | | Value |
Nonconvertible Bonds - continued |
FINANCIALS - continued |
Real Estate Management & Development - continued |
Regency Centers LP: - continued | | | | |
5.875% 6/15/17 | | $ 400,000 | | $ 451,781 |
Toys 'R' Us Property Co. II LLC 8.5% 12/1/17 | | 1,000,000 | | 1,070,000 |
Ventas Realty LP: | | | | |
Series 1, 6.5% 6/1/16 | | 11,370,000 | | 11,808,825 |
3.125% 11/30/15 | | 1,500,000 | | 1,527,668 |
Wells Operating Partnership II LP 5.875% 4/1/18 (g) | | 3,000,000 | | 3,196,224 |
| | 82,472,854 |
Thrifts & Mortgage Finance - 0.1% |
Wrightwood Capital LLC 9% 6/1/14 (d)(g) | | 4,000,000 | | 1,400,000 |
TOTAL FINANCIALS | | 241,080,765 |
HEALTH CARE - 1.0% |
Health Care Equipment & Supplies - 0.3% |
Aviv Healthcare Properties LP 7.75% 2/15/19 (g) | | 5,290,000 | | 5,382,575 |
Health Care Providers & Services - 0.7% |
Sabra Health Care LP/Sabra Capital Corp. 8.125% 11/1/18 | | 9,245,000 | | 9,383,675 |
Skilled Healthcare Group, Inc. 11% 1/15/14 | | 3,080,000 | | 3,164,700 |
| | 12,548,375 |
TOTAL HEALTH CARE | | 17,930,950 |
TOTAL NONCONVERTIBLE BONDS | | 379,567,635 |
TOTAL CORPORATE BONDS (Cost $448,273,114) | 476,523,442 |
Asset-Backed Securities - 6.0% |
|
Anthracite CDO I Ltd. Series 2002-CIBA Class B, 6.633% 5/24/37 (g) | | 1,384,000 | | 1,356,320 |
Anthracite CDO III Ltd./Anthracite CDO III Corp. Series 2004-1A Class A, 0.5473% 3/23/19 (g)(i) | | 327,274 | | 281,456 |
Capital Trust RE CDO Ltd. Series 2005-1A Class D, 1.6863% 3/20/50 (g)(i) | | 2,250,000 | | 101,250 |
Capital Trust RE CDO Ltd./Capital Trust RE CDO Corp. Series 2005-3A Class A2, 5.16% 6/25/35 (g) | | 6,875,000 | | 6,905,938 |
Asset-Backed Securities - continued |
| Principal Amount (e) | | Value |
CapitalSource Real Estate Loan Trust Series 2006-1A Class A2A, 0.4358% 1/20/37 (g)(i) | | $ 1,397,997 | | $ 1,132,377 |
CapLease CDO Ltd. Series 2005-1A Class A, 4.926% 1/29/40 (g) | | 1,927,285 | | 1,638,192 |
CBRE Realty Finance CDO 2007-1/LLC 0.4958% 4/7/52 (g)(i) | | 24,017,635 | | 14,950,978 |
Conseco Finance Securitizations Corp. Series 2002-2 Class M2, 9.163% 3/1/33 | | 500,000 | | 295,196 |
Crest Clarendon Street Ltd./Crest Clarendon Corp. Series 2002-1A: | | | | |
Class B1, 6.065% 12/28/35 (g) | | 1,570,000 | | 1,193,200 |
Class B2, 1.5963% 12/28/35 (g)(i) | | 1,575,000 | | 996,188 |
Class D, 9% 12/28/35 (g) | | 505,579 | | 126,395 |
Crest Dartmouth Street Ltd./Crest Dartmouth Street Corp. Series 2003-1A: | | | | |
Class B1, 1.7463% 6/28/38 (g)(i) | | 1,230,000 | | 1,112,535 |
Class D, 9% 6/28/38 (g) | | 997,000 | | 697,900 |
Crest Ltd. Series 2002-IGA: | | | | |
Class A, 0.7026% 7/28/17 (g)(i) | | 71,484 | | 70,621 |
Class B, 1.6026% 7/28/35 (g)(i) | | 1,500,000 | | 1,462,500 |
Deutsche Financial Capital Securitization LLC Series 1997-I Class M, 7.275% 9/15/27 | | 9,500,000 | | 8,457,234 |
Fairfield Street Solar Corp. Series 2004-1A Class E1, 3.619% 11/28/39 (g)(i) | | 550,000 | | 16,500 |
Green Tree Financial Corp.: | | | | |
Series 1996-4 Class M1, 7.75% 6/15/27 | | 1,788,179 | | 1,643,693 |
Series 1997-3 Class M1, 7.53% 3/15/28 | | 7,793,391 | | 6,133,445 |
GSR Mortgage Loan Trust Series 2005-HE3 Class B3, 2.6873% 6/25/35 (i)(j) | | 1,259,000 | | 62,777 |
Guggenheim Structured Real Estate Funding Ltd./Guggenheim Structured Real Estate Funding LLC Series 2005-2A: | | | | |
Class D, 1.7373% 8/26/30 (g)(i) | | 761,339 | | 114,201 |
Class E, 2.1873% 8/26/30 (g)(i) | | 1,489,284 | | 48,402 |
Lehman ABS Manufactured Housing Contract Trust Series 2001-B Class M2, 7.17% 3/15/28 | | 1,294,122 | | 519,477 |
Merit Securities Corp. Series 13 Class M1, 7.9245% 12/28/33 (i) | | 1,923,000 | | 1,833,312 |
N-Star Real Estate CDO Ltd. Series 1A Class C1B, 7.696% 8/28/38 (g) | | 883,000 | | 677,349 |
Newcastle Investment Trust Series 2011-MH1 Class A, 2.45% 12/10/33 (g) | | 4,707,451 | | 4,725,104 |
Asset-Backed Securities - continued |
| Principal Amount (e) | | Value |
Prima Capital CDO Ltd./Prima Capital CDO Corp. Series 2005-1A: | | | | |
Class A2, 4.646% 7/24/39 (g) | | $ 809,410 | | $ 807,386 |
Class D, 5.194% 7/24/39 (g) | | 4,590,000 | | 4,406,400 |
Taberna Preferred Funding III Ltd. Series 2005-3A Class D, 2.9223% 2/5/36 (g)(i) | | 3,473,616 | | 347 |
TIAA Real Estate CDO Ltd./TIAA Real Estate CDO Corp. Series 2002-1A Class IIFX, 6.77% 5/22/37 (g) | | 3,165,000 | | 3,172,913 |
Wachovia Ltd./Wachovia LLC: | | | | |
Series 2006-1 Class 1ML, 0% 9/25/26 (g)(i) | | 2,000,000 | | 860,000 |
Series 2006-1A: | | | | |
Class A1A, 0.5065% 9/25/26 (g)(i) | | 20,558,000 | | 17,782,670 |
Class A1B, 0.5765% 9/25/26 (g)(i) | | 6,285,000 | | 5,090,850 |
Class A2A, 0.4665% 9/25/26 (g)(i) | | 9,385,000 | | 8,352,650 |
Wrightwood Capital Real Estate CDO Ltd. Series 2005-1A: | | | | |
Class A1, 0.5785% 11/21/40 (g)(i) | | 10,500,000 | | 9,345,000 |
Class F, 2.2085% 11/21/40 (g)(i) | | 250,000 | | 75,000 |
TOTAL ASSET-BACKED SECURITIES (Cost $112,500,724) | 106,445,756 |
Collateralized Mortgage Obligations - 1.5% |
|
Private Sponsor - 1.5% |
Banc of America Large Loan, Inc. Series 2005-MIB1 Class A2, 0.3965% 3/15/22 (g)(i) | | 502,063 | | 501,392 |
COMM pass-thru certificates Series 2007-FL14 Class AJ, 0.3665% 6/15/22 (g)(i) | | 3,250,000 | | 2,959,813 |
Countrywide Home Loans, Inc.: | | | | |
Series 2002-38 Class B3, 5% 2/25/18 (g) | | 85,893 | | 28,779 |
Series 2002-R2 Class 2B3, 4.1067% 7/25/33 (g)(i) | | 224,890 | | 89,261 |
Series 2003-40 Class B3, 4.5% 10/25/18 (g) | | 131,174 | | 66,343 |
Series 2003-R2 Class B3, 5.5% 5/25/43 (g) | | 157,480 | | 4,506 |
Series 2003-R3: | | | | |
Class B2, 5.5% 11/25/33 (g) | | 1,505,859 | | 334,586 |
Class B3, 5.5% 11/25/33 | | 245,438 | | 18,024 |
Series 2004-R1 Class 1B3, 5.5% 11/25/34 (g)(i) | | 175,868 | | 4,700 |
FREMF Mortgage Trust: | | | | |
Series 2010 K7 Class B, 5.4347% 4/25/20 (g)(i) | | 1,500,000 | | 1,505,811 |
Series 2010-K6 Class B, 5.5324% 12/26/46 (g)(i) | | 4,500,000 | | 4,511,809 |
Merrill Lynch Floating Trust floater Series 2006-1 Class TM, 0.687% 6/15/22 (g)(i) | | 6,222,957 | | 5,974,039 |
Collateralized Mortgage Obligations - continued |
| Principal Amount (e) | | Value |
Private Sponsor - continued |
Merrill Lynch Mortgage Investors Trust Series 1998-C3 Class F, 6% 12/15/30 (g) | | $ 7,120,000 | | $ 7,262,400 |
Merrill Lynch Mortgage Trust Series 2002-MW1 Class E, 6.219% 7/12/34 (g) | | 1,600,000 | | 1,623,527 |
RESI Finance LP/RESI Finance DE Corp. floater: | | | | |
Series 2003-B Class B9, 12.1358% 7/10/35 (g)(i) | | 436,056 | | 364,107 |
Series 2005-A Class B6, 2.1858% 3/10/37 (g)(i) | | 1,602,399 | | 432,648 |
Series 2005-B Class B6, 1.7858% 6/10/37 (g)(i) | | 877,985 | | 70,590 |
Series 2005-D Class B6, 2.4365% 12/15/37 (g)(i) | | 443,739 | | 5,902 |
Residential Funding Securities Corp. Series 2002-RM1 Class BI1, 5.5% 12/25/17 (g) | | 62,752 | | 53,207 |
RESIX Finance Ltd. floater: | | | | |
Series 2003-D Class B8, 6.6858% 12/10/35 (g)(i) | | 408,263 | | 220,462 |
Series 2004-A Class B7, 4.4358% 2/10/36 (g)(i) | | 432,933 | | 243,741 |
Series 2004-B Class B7, 4.1858% 2/10/36 (g)(i) | | 525,206 | | 288,863 |
Series 2005-C Class B7, 3.2858% 9/10/37 (g)(i) | | 1,811,314 | | 45,283 |
TOTAL PRIVATE SPONSOR | | 26,609,793 |
U.S. Government Agency - 0.0% |
Fannie Mae REMIC Trust: | | | | |
Series 2001-W3 subordinate REMIC pass thru certificates, Class B3, 7% 9/25/41 (j) | | 181,629 | | 52,747 |
Series 2002-W1 subordinate REMIC pass thru certificates, Class 3B3, 3.7279% 2/25/42 (g)(i) | | 113,310 | | 48,651 |
Series 2003-W1 subordinate REMIC pass thru certificates, Class B3, 5.75% 12/25/42 (j) | | 258,627 | | 69,440 |
Series 2003-W10 subordinate REMIC pass thru certificates, Class 2B3, 3.7969% 6/25/43 (g)(i) | | 161,769 | | 65,611 |
Series 2003-W4 subordinate REMIC pass thru certificates, Class 2B3, 3.8751% 10/25/42 (g)(i) | | 70,645 | | 26,145 |
TOTAL U.S. GOVERNMENT AGENCY | | 262,594 |
TOTAL COLLATERALIZED MORTGAGE OBLIGATIONS (Cost $31,621,056) | 26,872,387 |
Commercial Mortgage Securities - 19.3% |
|
ACGS Series 2004-1 Class P, 7.4651% 8/1/19 (j) | | 6,369,196 | | 6,128,361 |
Americold LLC Trust Series 2010-ARTA Class D, 7.443% 1/14/29 (g) | | 2,000,000 | | 2,029,557 |
Commercial Mortgage Securities - continued |
| Principal Amount (e) | | Value |
Asset Securitization Corp. Series 1997-D4: | | | | |
Class B1, 7.525% 4/14/29 | | $ 1,565,000 | | $ 1,611,921 |
Class B2, 7.525% 4/14/29 | | 560,000 | | 576,868 |
Banc of America Commercial Mortgage, Inc.: | | | | |
sequential payer Series 2002-2 Class F, 5.487% 7/11/43 | | 4,185,000 | | 4,249,757 |
Series 2005-1 Class CJ, 5.3521% 11/10/42 (i) | | 3,580,000 | | 3,562,197 |
Series 2005-6 Class AJ, 5.1947% 9/10/47 (i) | | 5,000,000 | | 4,768,485 |
Banc of America Large Loan Trust floater Series 2010-HLTN Class HLTN, 1.937% 11/15/15 (g)(i) | | 46,621,689 | | 43,353,492 |
Banc of America Large Loan, Inc. floater Series 2005-MIB1: | | | | |
Class J, 1.2365% 3/15/22 (g)(i) | | 2,000,000 | | 1,780,000 |
Class K, 2.1865% 3/15/22 (g)(i) | | 4,190,000 | | 3,435,800 |
Bear Stearns Commercial Mortgage Securities, Inc. Series 2006-PW11 Class AJ, 5.4525% 3/11/39 (i) | | 5,700,000 | | 5,364,842 |
Bear Stearns Commercial Mortgage Securities Trust Series 2006-T22 Class B, 5.7067% 4/12/38 (g)(i) | | 2,520,000 | | 2,281,977 |
Citigroup/Deutsche Bank Commercial Mortgage Trust Series 2006-CD2 Class VPM2, 5.8052% 1/15/46 (g)(i) | | 3,500,000 | | 3,126,020 |
COMM pass-thru certificates: | | | | |
floater Series 2006-FL12 Class AJ, 0.3165% 12/15/20 (g)(i) | | 8,000,000 | | 7,320,000 |
sequential payer Series 2004-RS1 Class A, 5.648% 3/3/41 (g) | | 9,621,611 | | 9,549,449 |
Series 2001-J1A Class F, 6.8296% 2/16/34 (g)(i) | | 2,600,000 | | 2,618,331 |
Communication Mortgage Trust Series 2011-THL Class F, 4.867% 6/9/28 (g) | | 11,090,000 | | 9,739,096 |
Credit Suisse First Boston Mortgage Securities Corp. Series 1998-C2 Class F, 6.75% 11/11/30 (g) | | 3,000,000 | | 3,250,432 |
CRESI Finance Ltd. Partnership floater Series 2006-A Class E, 1.8373% 3/25/17 (g)(i) | | 2,512,000 | | 2,071,615 |
CRESIX Finance Ltd. Series 2006-AA: | | | | |
Class F, 4.3873% 3/25/17 (g)(i) | | 3,860,000 | | 3,090,413 |
Class G, 7.1873% 3/25/17 (g)(i) | | 3,272,000 | | 2,078,743 |
Crest Ltd. Series 2001-1A Class C, 9% 2/25/34 (g) | | 1,000,000 | | 690,000 |
DBUBS Mortgage Trust Series 2011-LC1A Class E, 5.7285% 11/10/46 (g)(i) | | 2,980,000 | | 2,638,493 |
Deutsche Mortgage & Asset Receiving Corp. Series 1998-C1 Class J, 6.22% 6/15/31 | | 1,200,000 | | 998,835 |
DLJ Commercial Mortgage Corp.: | | | | |
Series 1998-CG1 Class B4, 7.2203% 6/10/31 (g)(i) | | 2,500,000 | | 2,634,334 |
Series 2000-CKP1 Class B3, 7.958% 11/10/33 (i) | | 2,970,000 | | 2,962,457 |
Commercial Mortgage Securities - continued |
| Principal Amount (e) | | Value |
Extended Stay America Trust Series 2010-ESHA, Class C4, 4.8603% 11/5/27 (g) | | $ 5,000,000 | | $ 5,020,515 |
FHLMC Multifamily Structured pass-thru Certificates: | | | | |
Series K013 Class X3, 2.884% 1/25/43 (h)(i) | | 14,360,000 | | 2,472,370 |
Series KAIV Class X2, 3.614% 6/25/41 (h)(i) | | 7,430,000 | | 1,688,096 |
First Union National Bank Commercial Mortgage Trust Series 2001-C4: | | | | |
Class H, 7.036% 12/12/33 (g) | | 2,000,000 | | 2,009,696 |
Class K, 6% 12/12/33 (g) | | 2,000,000 | | 1,992,651 |
Freddie Mac Multi-class participation certificates guaranteed: | | | | |
Series K011 Class X3, 2.5747% 12/25/43 (h)(i) | | 12,206,096 | | 1,957,810 |
Series K012 Class X3, 2.2876% 1/25/41 (h)(i) | | 21,072,888 | | 2,990,454 |
G-Force LLC sequential payer Series 2005-RRA Class A2, 4.83% 8/22/36 (g) | | 12,783,602 | | 12,464,012 |
GE Capital Commercial Mortgage Corp.: | | | | |
Series 2001-3 Class C, 6.51% 6/10/38 | | 820,000 | | 826,315 |
Series 2002-1A Class H, 7.123% 12/10/35 (g)(i) | | 991,000 | | 998,737 |
GMAC Commercial Mortgage Securities, Inc.: | | | | |
Series 1997-C2: | | | | |
Class F, 6.75% 4/15/29 (i) | | 1,738,931 | | 1,808,639 |
Class G, 6.75% 4/15/29 (i) | | 1,250,000 | | 1,393,740 |
Series 1999-C3: | | | | |
Class G, 6.974% 8/15/36 (g) | | 689,776 | | 692,433 |
Class J, 6.974% 8/15/36 | | 1,500,000 | | 1,505,037 |
Series 2000-C1 Class K, 7% 3/15/33 | | 1,100,000 | | 785,170 |
Series 2002-C3 Class D, 5.27% 7/10/39 | | 3,000,000 | | 3,077,433 |
Greenwich Capital Commercial Funding Corp.: | | | | |
sequential payer Series 2003-C1 Class D, 4.29% 7/5/35 (g) | | 2,000,000 | | 2,071,825 |
Series 2002-C1 Class H, 5.903% 1/11/35 (g) | | 880,000 | | 893,762 |
GS Mortgage Securities Corp. II: | | | | |
floater Series 2007-EOP Class L, 6.4193% 3/6/20 (g)(i) | | 1,400,000 | | 1,393,865 |
Series 2010-C1 Class E, 4% 8/10/43 (g) | | 3,000,000 | | 2,140,054 |
GS Mortgage Securities Corp. Trust Series 2011-ALF Class E, 4.953% 2/10/21 (g) | | 5,000,000 | | 4,958,500 |
JP Morgan Chase Commercial Mortgage Securities Corp.: | | | | |
Series 2001-A: | | | | |
Class G, 6% 10/15/32 (g)(i) | | 2,895,000 | | 7,238 |
Class X, 0.9824% 10/15/32 (g)(h)(i) | | 7,141,456 | | 518 |
Series 2009-IWST Class D, 7.4453% 12/5/27 (g)(i) | | 5,000,000 | | 5,508,039 |
Commercial Mortgage Securities - continued |
| Principal Amount (e) | | Value |
JP Morgan Chase Commercial Mortgage Securities Corp.: - continued | | | | |
Series 2010-CNTM Class MZ, 8.5% 8/5/20 (g) | | $ 4,000,000 | | $ 3,896,926 |
Series 2010-CNTR: | | | | |
Class D, 6.1838% 8/5/32 (g)(i) | | 4,500,000 | | 4,100,884 |
Class XB, 0.9305% 8/5/32 (g)(h) | | 32,655,000 | | 1,777,297 |
JP Morgan Chase Commercial Mortgage Securities Trust floater Series 2005-FL1A Class A2, 0.3665% 2/15/19 (g)(i) | | 1,951,254 | | 1,914,134 |
JP Morgan Commercial Mortgage Finance Corp.: | | | | |
Series 1997-C5 Class F, 7.5605% 9/15/29 | | 1,392,544 | | 1,437,258 |
Series 1999-C8: | | | | |
Class G, 6% 7/15/31 (g) | | 1,385,000 | | 1,378,920 |
Class H, 6% 7/15/31 (g) | | 1,305,511 | | 9,139 |
LB Commercial Conduit Mortgage Trust Series 1998-C4 Class G, 5.6% 10/15/35 (g) | | 2,920,000 | | 3,070,380 |
LB-UBS Commercial Mortgage Trust: | | | | |
sequential payer: | | | | |
Series 2004-C2 Class E, 4.487% 3/15/36 | | 2,060,000 | | 2,022,379 |
Series 2005-C7 Class AJ, 5.323% 11/15/40 | | 6,000,000 | | 5,620,226 |
Series 2006-C7 Class AM, 5.378% 11/15/38 | | 2,040,000 | | 2,018,671 |
Series 2005-C2 Class AJ, 5.205% 4/15/30 (i) | | 8,910,000 | | 8,696,821 |
Series 2006-C4: | | | | |
Class AJ, 6.0868% 6/15/38 (i) | | 6,005,000 | | 5,357,749 |
Class AM, 6.0868% 6/15/38 (i) | | 6,700,000 | | 6,911,831 |
Lstar Commercial Mortgage Trust: | | | | |
Series 2011-1 Class D, 5.7457% 6/25/43 (g)(i) | | 4,699,000 | | 3,446,830 |
Series 2011-1 Class B, 5.7457% 6/25/43 (g)(i) | | 5,720,000 | | 5,282,128 |
Merrill Lynch Financial Asset, Inc. Series 2005-CA16: | | | | |
Class F, 4.384% 7/12/37 | CAD | 710,000 | | 505,215 |
Class G, 4.384% 7/12/37 | CAD | 355,000 | | 244,471 |
Class H, 4.384% 7/12/37 | CAD | 236,000 | | 157,324 |
Class J, 4.384% 7/12/37 | CAD | 355,000 | | 229,135 |
Class K, 4.384% 7/12/37 | CAD | 355,000 | | 221,908 |
Class L, 4.384% 7/12/37 | CAD | 236,000 | | 142,901 |
Class M, 4.384% 7/12/37 | CAD | 995,000 | | 457,431 |
Merrill Lynch Mortgage Investors Trust Series 1999-C1 Class G, 6.71% 11/15/31 (g) | | 3,143,926 | | 1,697,720 |
Merrill Lynch Mortgage Trust Series 2006-C1 Class AM, 5.6735% 5/12/39 (i) | | 1,200,000 | | 1,243,122 |
Mezz Capital Commercial Mortgage Trust Series 2004-C1: | | | | |
Class D, 6.988% 1/15/37 (g) | | 750,000 | | 75 |
Commercial Mortgage Securities - continued |
| Principal Amount (e) | | Value |
Mezz Capital Commercial Mortgage Trust Series 2004-C1: - continued | | | | |
Class E, 7.983% 1/15/37 (g) | | $ 1,453,000 | | $ 145 |
Class IO, 8.1746% 1/15/37 (h)(i) | | 5,165,671 | | 309,940 |
Morgan Stanley Capital I Trust: | | | | |
sequential payer: | | | | |
Series 2004-RR2 Class A2, 5.45% 10/28/33 (g) | | 1,718,316 | | 1,683,949 |
Series 2006-HQ10 Class AM, 5.36% 11/12/41 | | 8,200,000 | | 8,263,698 |
Series 1997-RR Class F, 7.4021% 4/30/39 (g)(i) | | 2,151,136 | | 2,097,357 |
Series 1998-CF1 Class G, 7.35% 7/15/32 (g) | | 2,602,314 | | 1,431,273 |
Series 2006-IQ12 Class AMFX, 5.37% 12/15/43 | | 7,500,000 | | 6,975,150 |
Series 2011-C2: | | | | |
Class D, 5.319% 6/15/44 (g)(i) | | 4,610,000 | | 4,161,954 |
Class E, 5.319% 6/15/44 (g)(i) | | 6,600,000 | | 5,676,000 |
Class F, 5.319% 6/15/44 (g)(i) | | 4,440,000 | | 3,352,200 |
Class XB, 0.465% 6/15/44 (g)(h)(i) | | 63,708,222 | | 2,125,306 |
NationsLink Funding Corp. Series 1999-SL Class X, 11/10/30 (h) | | 3,132,059 | | 2,818,853 |
Providence Place Group Ltd. Partnership Series 2000-C1 Class A2, 7.75% 7/20/28 (g) | | 3,375,238 | | 3,746,177 |
RBSCF Trust Series 2010-MB1 Class D, 4.8254% 4/15/24 (g)(i) | | 5,820,000 | | 5,815,344 |
Salomon Brothers Mortgage Securities VII, Inc. Series 2001-MMA: | | | | |
Class E3, 6.5% 2/18/34 (g)(i) | | 3,000,000 | | 3,062,209 |
Class E5, 6.5% 2/18/34 (g)(i) | | 3,000,000 | | 3,079,962 |
Structured Asset Securities Corp. Series 1997-LLI Class F, 7.3% 10/12/34 (g) | | 2,170,000 | | 2,187,578 |
TIAA Seasoned Commercial Mortgage Trust sequential payer Series 2007-C4 Class AJ, 5.9788% 8/15/39 (i) | | 2,080,000 | | 2,054,505 |
TimberStar Trust I Series 2006-1 Class F, 7.5296% 10/15/36 (g) | | 10,630,000 | | 11,161,500 |
UBS Commercial Mortgage Trust Series 2007-FL1 Class F, 0.7615% 7/15/24 (g)(i) | | 1,200,000 | | 481,819 |
Vornado DP LLC Series 2010-VNO Class D, 6.3555% 9/13/28 (g) | | 2,540,000 | | 2,516,273 |
Wachovia Bank Commercial Mortgage Trust: | | | | |
Series 2004-C10 Class E, 4.931% 2/15/41 | | 2,000,000 | | 2,003,088 |
Series 2004-C11: | | | | |
Class D, 5.5477% 1/15/41 (i) | | 5,177,000 | | 5,029,636 |
Class E, 5.5977% 1/15/41 (i) | | 3,785,000 | | 3,352,191 |
Series 2004-C12 Class D, 5.512% 7/15/41 (i) | | 2,750,000 | | 2,623,939 |
Commercial Mortgage Securities - continued |
| Principal Amount (e) | | Value |
Wachovia Bank Commercial Mortgage Trust: - continued | | | | |
Series 2004-C14 Class B, 5.17% 8/15/41 | | $ 3,180,000 | | $ 3,307,999 |
WFDB Commercial Mortgage Trust Series 2011-BXR Class D, 5.914% 7/5/24 (g) | | 4,000,000 | | 3,999,968 |
TOTAL COMMERCIAL MORTGAGE SECURITIES (Cost $342,174,310) | 345,727,272 |
Floating Rate Loans - 4.0% |
|
CONSUMER DISCRETIONARY - 0.7% |
Hotels, Restaurants & Leisure - 0.5% |
Extended Stay America, Inc. term loan 9.75% 11/1/15 | | 9,000,000 | | 9,000,000 |
Media - 0.1% |
PRIMEDIA, Inc. Tranche B, term loan 7.5% 1/13/18 (i) | | 2,850,000 | | 2,736,000 |
Specialty Retail - 0.1% |
The Pep Boys - Manny, Moe & Jack term loan 2.25% 10/27/13 (i) | | 1,981,937 | | 1,979,459 |
TOTAL CONSUMER DISCRETIONARY | | 13,715,459 |
FINANCIALS - 2.0% |
Diversified Financial Services - 0.7% |
Capital Automotive LP term loan 5% 3/11/17 (i) | | 8,399,826 | | 8,399,826 |
Pilot Travel Centers LLC Tranche B, term loan 4.25% 3/30/18 (i) | | 4,000,000 | | 4,005,200 |
| | 12,405,026 |
Real Estate Investment Trusts - 0.1% |
iStar Financial, Inc. Tranche A 1LN, term loan 5% 6/28/13 (i) | | 1,487,111 | | 1,461,086 |
Real Estate Management & Development - 1.2% |
CB Richard Ellis Group, Inc. Tranche B, term loan 3.4358% 11/9/16 (i) | | 1,709,594 | | 1,709,594 |
CB Richard Ellis Services, Inc. Tranche D, term loan 3.6851% 9/4/19 (i) | | 4,000,000 | | 3,955,000 |
Equity Inns Reality LLC: | | | | |
Tranche A, term loan 9% 11/2/12 (i) | | 2,000,000 | | 1,797,500 |
Tranche B 2LN, term loan 6.05% 11/2/12 (i) | | 5,000,000 | | 4,593,750 |
Realogy Corp.: | | | | |
Credit-Linked Deposit 3.1856% 10/10/13 (i) | | 620,304 | | 589,288 |
Credit-Linked Deposit 4.4356% 10/10/16 (i) | | 210,842 | | 191,339 |
term loan 4.5183% 10/10/16 (i) | | 1,249,372 | | 1,133,805 |
Floating Rate Loans - continued |
| Principal Amount (e) | | Value |
FINANCIALS - continued |
Real Estate Management & Development - continued |
Realogy Corp.: - continued | | | | |
Tranche 2LN, term loan 13.5% 10/15/17 | | $ 2,500,000 | | $ 2,637,500 |
Tranche B, term loan 3.2683% 10/10/13 (i) | | 5,234,332 | | 4,972,616 |
| | 21,580,392 |
TOTAL FINANCIALS | | 35,446,504 |
HEALTH CARE - 0.5% |
Health Care Providers & Services - 0.5% |
Community Health Systems, Inc.: | | | | |
Tranche B, term loan 2.504% 7/25/14 (i) | | 2,844,254 | | 2,755,371 |
Tranche DD, term loan 2.504% 7/25/14 (i) | | 146,026 | | 141,463 |
Skilled Healthcare Group, Inc. term loan 5.25% 4/9/16 (i) | | 3,738,937 | | 3,748,284 |
Universal Health Services, Inc. term loan 4% 11/15/16 (i) | | 1,908,343 | | 1,908,343 |
| | 8,553,461 |
INDUSTRIALS - 0.6% |
Construction & Engineering - 0.6% |
Drumm Investors LLC Tranche B, term loan 5% 5/4/18 (i) | | 12,000,000 | | 11,595,000 |
TELECOMMUNICATION SERVICES - 0.2% |
Wireless Telecommunication Services - 0.2% |
TowerCo Finance LLC Tranche B, term loan 5.25% 2/2/17 (i) | | 2,992,500 | | 2,992,500 |
TOTAL FLOATING RATE LOANS (Cost $69,310,921) | 72,302,924 |
Preferred Securities - 0.0% |
| | | |
FINANCIALS - 0.0% |
Diversified Financial Services - 0.0% |
Crest Clarendon Street 2002-1 Ltd. Series 2002-1A Class PS, 12/28/35 (g) | 500,000 | | 15,000 |
Crest Dartmouth Street 2003 1 Ltd. Series 2003-1A Class PS, 6/28/38 (g) | 1,220,000 | | 427,000 |
Preferred Securities - continued |
| Principal Amount (e) | | Value |
FINANCIALS - continued |
Diversified Financial Services - continued |
Harp High Grade CDO I Ltd. Series 2006-1, 7/8/46 (g) | $ 810,000 | | $ 8 |
Ipswich Street CDO Series 2006-1, 6/27/46 (d)(g) | 1,350,000 | | 0 |
| | 442,008 |
TOTAL PREFERRED SECURITIES (Cost $3,377,499) | 442,008 |
Money Market Funds - 9.8% |
| Shares | | |
Fidelity Cash Central Fund, 0.14% (b) | 138,042,360 | | 138,042,360 |
Fidelity Securities Lending Cash Central Fund, 0.15% (b)(c) | 38,026,262 | | 38,026,262 |
TOTAL MONEY MARKET FUNDS (Cost $176,068,622) | 176,068,622 |
TOTAL INVESTMENT PORTFOLIO - 102.0% (Cost $1,750,859,783) | | 1,828,418,003 |
NET OTHER ASSETS (LIABILITIES) - (2.0)% | | (35,608,954) |
NET ASSETS - 100% | $ 1,792,809,049 |
Currency Abbreviations |
CAD | - | Canadian dollar |
Legend |
(a) Non-income producing |
(b) Affiliated fund that is available only to investment companies and other accounts managed by Fidelity Investments. The rate quoted is the annualized seven-day yield of the fund at period end. A complete unaudited listing of the fund's holdings as of its most recent quarter end is available upon request. In addition, each Fidelity Central Fund's financial statements, which are not covered by the Fund's Report of Independent Registered Public Accounting Firm, are available on the SEC's website or upon request. |
(c) Investment made with cash collateral received from securities on loan. |
(d) Non-income producing - Security is in default. |
(e) Principal amount is stated in United States dollars unless otherwise noted. |
(f) Security or a portion of the security is on loan at period end. |
(g) Security exempt from registration under Rule 144A of the Securities Act of 1933. These securities may be resold in transactions exempt from registration, normally to qualified institutional buyers. At the end of the period, the value of these securities amounted to $437,234,266 or 24.4% of net assets. |
(h) Security represents right to receive monthly interest payments on an underlying pool of mortgages or assets. Principal shown is the outstanding par amount of the pool held as of the end of the period. |
(i) Coupon rates for floating and adjustable rate securities reflect the rates in effect at period end. |
(j) Restricted securities - Investment in securities not registered under the Securities Act of 1933 (excluding 144A issues). At the end of the period, the value of restricted securities (excluding 144A issues) amounted to $6,313,325 or 0.4% of net assets. |
Additional information on each restricted holding is as follows: |
Security | Acquisition Date | Acquisition Cost |
ACGS Series 2004-1 Class P, 7.4651% 8/1/19 | 2/17/11 | $ 6,167,702 |
Fannie Mae REMIC Trust Series 2001-W3 subordinate REMIC pass thru certificates, Class B3, 7% 9/25/41 | 5/21/03 | $ 157,393 |
Fannie Mae REMIC Trust Series 2003-W1 subordinate REMIC pass thru certificates, Class B3, 5.75% 12/25/42 | 3/25/03 | $ 194,899 |
GSR Mortgage Loan Trust Series 2005-HE3 Class B3, 2.6873% 6/25/35 | 6/3/05 | $ 1,110,697 |
Affiliated Central Funds |
Information regarding fiscal year to date income earned by the Fund from investments in Fidelity Central Funds is as follows: |
Fund | Income earned |
Fidelity Cash Central Fund | $ 207,012 |
Fidelity Securities Lending Cash Central Fund | 34,762 |
Total | $ 241,774 |
Other Information |
The following is a summary of the inputs used, as of July 31, 2011, involving the Fund's assets and liabilities carried at fair value. The inputs or methodology used for valuing securities may not be an indication of the risk associated with investing in those securities. For more information on valuation inputs, and their aggregation into the levels used in the tables below, please refer to the Security Valuation section in the accompanying Notes to Financial Statements. |
Valuation Inputs at Reporting Date: |
Description | Total | Level 1 | Level 2 | Level 3 |
Investments in Securities: | | | | |
Equities: | | | | |
Consumer Discretionary | $ 16,655,507 | $ 13,126,936 | $ - | $ 3,528,571 |
Financials | 584,071,871 | 559,503,024 | 19,627,477 | 4,941,370 |
Health Care | 23,308,214 | 23,308,214 | - | - |
Corporate Bonds | 476,523,442 | - | 467,138,642 | 9,384,800 |
Asset-Backed Securities | 106,445,756 | - | 27,055,672 | 79,390,084 |
Collateralized Mortgage Obligations | 26,872,387 | - | 26,010,387 | 862,000 |
Commercial Mortgage Securities | 345,727,272 | - | 313,786,639 | 31,940,633 |
Floating Rate Loans | 72,302,924 | - | 63,302,924 | 9,000,000 |
Preferred Securities | 442,008 | - | - | 442,008 |
Money Market Funds | 176,068,622 | 176,068,622 | - | - |
Total Investments in Securities: | $ 1,828,418,003 | $ 772,006,796 | $ 916,921,741 | $ 139,489,466 |
The following is a reconciliation of Investments in Securities for which Level 3 inputs were used in determining value: |
Investments in Securities: | |
Equities - Consumer Discretionary | |
Beginning Balance | $ 3,696,000 |
Total Realized Gain (Loss) | - |
Total Unrealized Gain (Loss) | (167,429) |
Cost of Purchases | - |
Proceeds of Sales | - |
Amortization/Accretion | - |
Transfers in to Level 3 | - |
Transfers out of Level 3 | - |
Ending Balance | $ 3,528,571 |
The change in unrealized gain (loss) for the period attributable to Level 3 securities held at July 31, 2011 | $ (167,429) |
Equities - Financials | |
Beginning Balance | $ 3,922,244 |
Total Realized Gain (Loss) | - |
Total Unrealized Gain (Loss) | 1,019,250 |
Cost of Purchases | - |
Proceeds of Sales | - |
Amortization/Accretion | - |
Transfers in to Level 3 | - |
Transfers out of Level 3 | (124) |
Ending Balance | $ 4,941,370 |
The change in unrealized gain (loss) for the period attributable to Level 3 securities held at July 31, 2011 | $ 1,019,250 |
Corporate Bonds | |
Beginning Balance | $ 1,370,000 |
Total Realized Gain (Loss) | - |
Total Unrealized Gain (Loss) | 32,708 |
Cost of Purchases | 7,982,092 |
Proceeds of Sales | - |
Amortization/Accretion | - |
Transfers in to Level 3 | - |
Transfers out of Level 3 | - |
Ending Balance | $ 9,384,800 |
The change in unrealized gain (loss) for the period attributable to Level 3 securities held at July 31, 2011 | $ 32,708 |
Asset-Backed Securities | |
Beginning Balance | $ 16,886,956 |
Total Realized Gain (Loss) | 682,842 |
Total Unrealized Gain (Loss) | 2,505,703 |
Cost of Purchases | 52,080,640 |
Proceeds of Sales | (9,776,117) |
Amortization/Accretion | 839,401 |
Transfers in to Level 3 | 17,965,015 |
Transfers out of Level 3 | (1,794,356) |
Ending Balance | $ 79,390,084 |
The change in unrealized gain (loss) for the period attributable to Level 3 securities held at July 31, 2011 | $ 1,528,507 |
Collateralized Mortgage Obligations | |
Beginning Balance | $ 994,555 |
Total Realized Gain (Loss) | - |
Total Unrealized Gain (Loss) | 243,838 |
Cost of Purchases | - |
Proceeds of Sales | (340,705) |
Amortization/Accretion | (83,120) |
Transfers in to Level 3 | 47,432 |
Transfers out of Level 3 | - |
Ending Balance | $ 862,000 |
The change in unrealized gain (loss) for the period attributable to Level 3 securities held at July 31, 2011 | $ 243,838 |
Commercial Mortgage Securities | |
Beginning Balance | $ 12,252,746 |
Total Realized Gain (Loss) | (19,472) |
Total Unrealized Gain (Loss) | 1,649,186 |
Cost of Purchases | 23,418,959 |
Proceeds of Sales | (2,739,892) |
Amortization/Accretion | (109,801) |
Transfers in to Level 3 | 4,543,765 |
Transfers out of Level 3 | (7,054,858) |
Ending Balance | $ 31,940,633 |
The change in unrealized gain (loss) for the period attributable to Level 3 securities held at July 31, 2011 | $ 1,516,502 |
Floating Rate Loans | |
Beginning Balance | $ - |
Total Realized Gain (Loss) | - |
Total Unrealized Gain (Loss) | 62,914 |
Cost of Purchases | 8,928,750 |
Proceeds of Sales | - |
Amortization/Accretion | 8,336 |
Transfers in to Level 3 | - |
Transfers out of Level 3 | - |
Ending Balance | $ 9,000,000 |
The change in unrealized gain (loss) for the period attributable to Level 3 securities held at July 31, 2011 | $ 62,914 |
Preferred Securities | |
Beginning Balance | $ 365,608 |
Total Realized Gain (Loss) | (2,306,146) |
Total Unrealized Gain (Loss) | 2,480,412 |
Cost of Purchases | - |
Proceeds of Sales | (99,000) |
Amortization/Accretion | 1,134 |
Transfers in to Level 3 | - |
Transfers out of Level 3 | - |
Ending Balance | $ 442,008 |
The change in unrealized gain (loss) for the period attributable to Level 3 securities held at July 31, 2011 | $ 73,873 |
The information used in the above reconciliation represents fiscal year to date activity for any Investments in Securities identified as using Level 3 inputs at either the beginning or the end of the current fiscal period. Transfers in or out of Level 3 represent the beginning value of any Security or Instrument where a change in the pricing level occurred from the beginning to the end of the period. The cost of purchases and the proceeds of sales may include securities received or delivered through corporate actions or exchanges. Realized and unrealized gains (losses) disclosed in the reconciliation are included in Net Gain (Loss) on the Fund's Statement of Operations. |
The composition of credit quality ratings as a percentage of net assets is as follows (Unaudited): |
U.S. Government and U.S. Government Agency Obligations | 0.5% |
AAA,AA,A | 11.4% |
BBB | 14.5% |
BB | 5.8% |
B | 10.1% |
CCC,CC,C | 3.2% |
D | 0.1% |
Not Rated | 11.8% |
Equities | 34.8% |
Short-Term Investments and Net Other Assets | 7.8% |
| 100.0% |
We have used ratings from Moody's Investors Service, Inc. Where Moody's® ratings are not available, we have used S&P® ratings. All ratings are as of the date indicated and do not reflect subsequent changes. |
See accompanying notes which are an integral part of the financial statements.
Annual Report
Statement of Assets and Liabilities
| July 31, 2011 |
| | |
Assets | | |
Investment in securities, at value (including securities loaned of $35,928,878) - See accompanying schedule: Unaffiliated issuers (cost $1,574,791,161) | $ 1,652,349,381 | |
Fidelity Central Funds (cost $176,068,622) | 176,068,622 | |
Total Investments (cost $1,750,859,783) | | $ 1,828,418,003 |
Cash | | 323,241 |
Receivable for investments sold | | 2,833,712 |
Receivable for fund shares sold | | 3,470,591 |
Dividends receivable | | 901,540 |
Interest receivable | | 9,533,761 |
Distributions receivable from Fidelity Central Funds | | 16,392 |
Other receivables | | 16,716 |
Total assets | | 1,845,513,956 |
| | |
Liabilities | | |
Payable for investments purchased | $ 8,176,436 | |
Payable for fund shares redeemed | 5,093,296 | |
Accrued management fee | 834,868 | |
Distribution and service plan fees payable | 31,194 | |
Other affiliated payables | 466,030 | |
Other payables and accrued expenses | 76,821 | |
Collateral on securities loaned, at value | 38,026,262 | |
Total liabilities | | 52,704,907 |
| | |
Net Assets | | $ 1,792,809,049 |
Net Assets consist of: | | |
Paid in capital | | $ 1,688,797,987 |
Undistributed net investment income | | 20,642,579 |
Accumulated undistributed net realized gain (loss) on investments and foreign currency transactions | | 5,785,289 |
Net unrealized appreciation (depreciation) on investments and assets and liabilities in foreign currencies | | 77,583,194 |
Net Assets | | $ 1,792,809,049 |
See accompanying notes which are an integral part of the financial statements.
Annual Report
Financial Statements - continued
Statement of Assets and Liabilities - continued
| July 31, 2011 |
| | |
Calculation of Maximum Offering Price Class A:
Net Asset Value and redemption price per share ($60,282,886 ÷ 5,620,724 shares) | | $ 10.73 |
| | |
Maximum offering price per share (100/96.00 of $10.73) | | $ 11.18 |
Class T:
Net Asset Value and redemption price per share ($7,625,672 ÷ 711,056 shares) | | $ 10.72 |
| | |
Maximum offering price per share (100/96.00 of $10.72) | | $ 11.17 |
Class C:
Net Asset Value and offering price per share ($21,555,207 ÷ 2,019,275 shares)A | | $ 10.67 |
| | |
Real Estate Income:
Net Asset Value, offering price and redemption price per share ($1,660,063,375 ÷ 154,395,428 shares) | | $ 10.75 |
| | |
Institutional Class:
Net Asset Value, offering price and redemption price per share ($43,281,909 ÷ 4,029,852 shares) | | $ 10.74 |
A Redemption price per share is equal to net asset value less any applicable contingent deferred sales charge.
See accompanying notes which are an integral part of the financial statements.
Annual Report
Statement of Operations
| Year ended July 31, 2011 |
| | |
Investment Income | | |
Dividends | | $ 24,245,563 |
Interest | | 63,966,851 |
Income from Fidelity Central Funds | | 241,774 |
Total income | | 88,454,188 |
| | |
Expenses | | |
Management fee | $ 8,064,128 | |
Transfer agent fees | 4,177,653 | |
Distribution and service plan fees | 177,614 | |
Accounting and security lending fees | 582,960 | |
Custodian fees and expenses | 31,621 | |
Independent trustees' compensation | 7,337 | |
Registration fees | 231,380 | |
Audit | 159,849 | |
Legal | 4,712 | |
Interest | 326 | |
Miscellaneous | 13,078 | |
Total expenses before reductions | 13,450,658 | |
Expense reductions | (42,341) | 13,408,317 |
Net investment income (loss) | | 75,045,871 |
Realized and Unrealized Gain (Loss) Net realized gain (loss) on: | | |
Investment securities: | | |
Unaffiliated issuers | 26,478,722 | |
Foreign currency transactions | (4,405) | |
Total net realized gain (loss) | | 26,474,317 |
Change in net unrealized appreciation (depreciation) on: Investment securities | 63,155,032 | |
Assets and liabilities in foreign currencies | (714) | |
Total change in net unrealized appreciation (depreciation) | | 63,154,318 |
Net gain (loss) | | 89,628,635 |
Net increase (decrease) in net assets resulting from operations | | $ 164,674,506 |
See accompanying notes which are an integral part of the financial statements.
Annual Report
Financial Statements - continued
Statement of Changes in Net Assets
| Year ended
July 31,
2011 | Year ended
July 31,
2010 |
Increase (Decrease) in Net Assets | | |
Operations | | |
Net investment income (loss) | $ 75,045,871 | $ 41,516,164 |
Net realized gain (loss) | 26,474,317 | 20,625,469 |
Change in net unrealized appreciation (depreciation) | 63,154,318 | 102,855,727 |
Net increase (decrease) in net assets resulting
from operations | 164,674,506 | 164,997,360 |
Distributions to shareholders from net investment income | (66,688,371) | (40,150,798) |
Share transactions - net increase (decrease) | 655,640,999 | 450,504,667 |
Redemption fees | 331,332 | 230,512 |
Total increase (decrease) in net assets | 753,958,466 | 575,581,741 |
| | |
Net Assets | | |
Beginning of period | 1,038,850,583 | 463,268,842 |
End of period (including undistributed net investment income of $20,642,579 and undistributed net investment income of $11,035,447, respectively) | $ 1,792,809,049 | $ 1,038,850,583 |
See accompanying notes which are an integral part of the financial statements.
Annual Report
Financial Highlights - Class A
Years ended July 31, | 2011 | 2010 H |
Selected Per-Share Data | | |
Net asset value, beginning of period | $ 9.94 | $ 9.95 |
Income from Investment Operations | | |
Net investment income (loss) E | .53 | .18 |
Net realized and unrealized gain (loss) | .76 | (.04) |
Total from investment operations | 1.29 | .14 |
Distributions from net investment income | (.50) | (.15) |
Redemption fees added to paid in capital E, J | - | - |
Net asset value, end of period | $ 10.73 | $ 9.94 |
Total Return B, C, D | 13.27% | 1.46% |
Ratios to Average Net Assets F, I | | |
Expenses before reductions | 1.13% | 1.09% A |
Expenses net of fee waivers, if any | 1.13% | 1.09% A |
Expenses net of all reductions | 1.12% | 1.09% A |
Net investment income (loss) | 5.00% | 6.23% A |
Supplemental Data | | |
Net assets, end of period (000 omitted) | $ 60,283 | $ 3,830 |
Portfolio turnover rate G | 25% | 28% |
A Annualized
B Total returns for periods of less than one year are not annualized.
C Total returns would have been lower if certain expenses had not been reduced during the applicable periods shown.
D Total returns do not include the effect of the sales charges.
E Calculated based on average shares outstanding during the period.
F Fees and expenses of any underlying Fidelity Central Funds are not included in the Fund's expense ratio. The Fund indirectly bears its proportionate share of the expenses of any underlying Fidelity Central Funds.
G Amount does not include the portfolio activity of any underlying Fidelity Central Funds.
H For the period April 14, 2010 (commencement of sale of shares) to July 31, 2010.
I Expense ratios reflect operating expenses of the class. Expenses before reductions do not reflect amounts reimbursed by the investment adviser or reductions from brokerage service arrangements or reductions from other expense offset arrangements and do not represent the amount paid by the class during periods when reimbursements or reductions occur. Expense ratios before reductions for start-up periods may not be representative of longer-term operating periods. Expenses net of fee waivers reflect expenses after reimbursement by the investment adviser but prior to reductions from brokerage service arrangements or other expense offset arrangements. Expenses net of all reductions represent the net expenses paid by the class.
J Amount represents less than $.01 per share.
See accompanying notes which are an integral part of the financial statements.
Annual Report
Financial Highlights - Class T
Years ended July 31, | 2011 | 2010 H |
Selected Per-Share Data | | |
Net asset value, beginning of period | $ 9.94 | $ 9.95 |
Income from Investment Operations | | |
Net investment income (loss) E | .52 | .17 |
Net realized and unrealized gain (loss) | .76 | (.03) |
Total from investment operations | 1.28 | .14 |
Distributions from net investment income | (.50) | (.15) |
Redemption fees added to paid in capital E, J | - | - |
Net asset value, end of period | $ 10.72 | $ 9.94 |
Total Return B, C, D | 13.11% | 1.45% |
Ratios to Average Net Assets F, I | | |
Expenses before reductions | 1.16% | 1.17% A |
Expenses net of fee waivers, if any | 1.16% | 1.17% A |
Expenses net of all reductions | 1.16% | 1.17% A |
Net investment income (loss) | 4.96% | 5.92% A |
Supplemental Data | | |
Net assets, end of period (000 omitted) | $ 7,626 | $ 862 |
Portfolio turnover rate G | 25% | 28% |
A Annualized
B Total returns for periods of less than one year are not annualized.
C Total returns would have been lower if certain expenses had not been reduced during the applicable periods shown.
D Total returns do not include the effect of the sales charges.
E Calculated based on average shares outstanding during the period.
F Fees and expenses of any underlying Fidelity Central Funds are not included in the Fund's expense ratio. The Fund indirectly bears its proportionate share of the expenses of any underlying Fidelity Central Funds.
G Amount does not include the portfolio activity of any underlying Fidelity Central Funds.
H For the period April 14, 2010 (commencement of sale of shares) to July 31, 2010.
I Expense ratios reflect operating expenses of the class. Expenses before reductions do not reflect amounts reimbursed by the investment adviser or reductions from brokerage service arrangements or reductions from other expense offset arrangements and do not represent the amount paid by the class during periods when reimbursements or reductions occur. Expense ratios before reductions for start-up periods may not be representative of longer-term operating periods. Expenses net of fee waivers reflect expenses after reimbursement by the investment adviser but prior to reductions from brokerage service arrangements or other expense offset arrangements. Expenses net of all reductions represent the net expenses paid by the class.
J Amount represents less than $.01 per share.
See accompanying notes which are an integral part of the financial statements.
Annual Report
Financial Highlights - Class C
Years ended July 31, | 2011 | 2010 H |
Selected Per-Share Data | | |
Net asset value, beginning of period | $ 9.93 | $ 9.95 |
Income from Investment Operations | | |
Net investment income (loss) E | .45 | .15 |
Net realized and unrealized gain (loss) | .74 | (.03) |
Total from investment operations | 1.19 | .12 |
Distributions from net investment income | (.45) | (.14) |
Redemption fees added to paid in capital E, J | - | - |
Net asset value, end of period | $ 10.67 | $ 9.93 |
Total Return B, C, D | 12.25% | 1.29% |
Ratios to Average Net Assets F, I | | |
Expenses before reductions | 1.89% | 1.86% A |
Expenses net of fee waivers, if any | 1.89% | 1.86% A |
Expenses net of all reductions | 1.89% | 1.86% A |
Net investment income (loss) | 4.23% | 5.21% A |
Supplemental Data | | |
Net assets, end of period (000 omitted) | $ 21,555 | $ 836 |
Portfolio turnover rate G | 25% | 28% |
A Annualized
B Total returns for periods of less than one year are not annualized.
C Total returns would have been lower if certain expenses had not been reduced during the applicable periods shown.
D Total returns do not include the effect of the contingent deferred sales charge.
E Calculated based on average shares outstanding during the period.
F Fees and expenses of any underlying Fidelity Central Funds are not included in the Fund's expense ratio. The Fund indirectly bears its proportionate share of the expenses of any underlying Fidelity Central Funds.
G Amount does not include the portfolio activity of any underlying Fidelity Central Funds.
H For the period April 14, 2010 (commencement of sale of shares) to July 31, 2010.
I Expense ratios reflect operating expenses of the class. Expenses before reductions do not reflect amounts reimbursed by the investment adviser or reductions from brokerage service arrangements or reductions from other expense offset arrangements and do not represent the amount paid by the class during periods when reimbursements or reductions occur. Expense ratios before reductions for start-up periods may not be representative of longer-term operating periods. Expenses net of fee waivers reflect expenses after reimbursement by the investment adviser but prior to reductions from brokerage service arrangements or other expense offset arrangements. Expenses net of all reductions represent the net expenses paid by the class.
J Amount represents less than $.01 per share.
See accompanying notes which are an integral part of the financial statements.
Annual Report
Financial Highlights - Real Estate Income
Years ended July 31, | 2011 | 2010 | 2009 | 2008 | 2007 |
Selected Per-Share Data | | | | | |
Net asset value, beginning of period | $ 9.95 | $ 8.21 | $ 9.43 | $ 11.22 | $ 11.78 |
Income from Investment Operations | | | | | |
Net investment income (loss) B | .55 | .53 | .54 | .59 | .63 |
Net realized and unrealized gain (loss) | .76 | 1.73 | (1.27) | (1.48) | (.37) |
Total from investment operations | 1.31 | 2.26 | (.73) | (.89) | .26 |
Distributions from net investment income | (.51) | (.52) | (.50) | (.66) | (.58) |
Distributions from net realized gain | - | - | - | (.24) | (.24) |
Total distributions | (.51) | (.52) | (.50) | (.90) | (.82) |
Redemption fees added to paid in capital B | - F | - F | .01 | - F | - F |
Net asset value, end of period | $ 10.75 | $ 9.95 | $ 8.21 | $ 9.43 | $ 11.22 |
Total Return A | 13.41% | 28.29% | (6.92)% | (8.43)% | 2.00% |
Ratios to Average Net Assets C, E | | | | |
Expenses before reductions | .92% | .97% | 1.00% | .94% | .88% |
Expenses net of fee waivers, if any | .92% | .96% | 1.00% | .94% | .88% |
Expenses net of all reductions | .92% | .96% | 1.00% | .94% | .88% |
Net investment income (loss) | 5.21% | 5.60% | 7.15% | 5.77% | 5.30% |
Supplemental Data | | | | | |
Net assets, end of period (000 omitted) | $ 1,660,063 | $ 1,030,393 | $ 463,269 | $ 393,147 | $ 516,268 |
Portfolio turnover rate D | 25% | 28% | 47% | 32% | 45% |
A Total returns would have been lower if certain expenses had not been reduced during the applicable periods shown.
B Calculated based on average shares outstanding during the period.
C Fees and expenses of any underlying Fidelity Central Funds are not included in the Fund's expense ratio. The Fund indirectly bears its proportionate share of the expenses of any underlying Fidelity Central Funds.
D Amount does not include the portfolio activity of any underlying Fidelity Central Funds.
E Expense ratios reflect operating expenses of the class. Expenses before reductions do not reflect amounts reimbursed by the investment adviser or reductions from brokerage service arrangements or reductions from other expense offset arrangements and do not represent the amount paid by the class during periods when reimbursements or reductions occur. Expenses net of fee waivers reflect expenses after reimbursement by the investment adviser but prior to reductions from brokerage service arrangements or other expense offset arrangements. Expenses net of all reductions represent the net expenses paid by the class.
F Amount represents less than $.01 per share.
See accompanying notes which are an integral part of the financial statements.
Annual Report
Financial Highlights - Institutional Class
Years ended July 31, | 2011 | 2010 G |
Selected Per-Share Data | | |
Net asset value, beginning of period | $ 9.95 | $ 9.95 |
Income from Investment Operations | | |
Net investment income (loss) D | .55 | .19 |
Net realized and unrealized gain (loss) | .76 | (.04) |
Total from investment operations | 1.31 | .15 |
Distributions from net investment income | (.52) | (.15) |
Redemption fees added to paid in capital D, I | - | - |
Net asset value, end of period | $ 10.74 | $ 9.95 |
Total Return B, C | 13.44% | 1.58% |
Ratios to Average Net Assets E, H | | |
Expenses before reductions | .89% | .85% A |
Expenses net of fee waivers, if any | .89% | .85% A |
Expenses net of all reductions | .89% | .85% A |
Net investment income (loss) | 5.24% | 6.70% A |
Supplemental Data | | |
Net assets, end of period (000 omitted) | $ 43,282 | $ 2,930 |
Portfolio turnover rate F | 25% | 28% |
A Annualized
B Total returns for periods of less than one year are not annualized.
C Total returns would have been lower if certain expenses had not been reduced during the applicable periods shown.
D Calculated based on average shares outstanding during the period.
E Fees and expenses of any underlying Fidelity Central Funds are not included in the Fund's expense ratio. The Fund indirectly bears its proportionate share of the expenses of any underlying Fidelity Central Funds.
F Amount does not include the portfolio activity of any underlying Fidelity Central Funds.
G For the period April 14, 2010 (commencement of sale of shares) to July 31, 2010.
H Expense ratios reflect operating expenses of the class. Expenses before reductions do not reflect amounts reimbursed by the investment adviser or reductions from brokerage service arrangements or reductions from other expense offset arrangements and do not represent the amount paid by the class during periods when reimbursements or reductions occur. Expense ratios before reductions for start-up periods may not be representative of longer-term operating periods. Expenses net of fee waivers reflect expenses after reimbursement by the investment adviser but prior to reductions from brokerage service arrangements or other expense offset arrangements. Expenses net of all reductions represent the net expenses paid by the class.
I Amount represents less than $.01 per share.
See accompanying notes which are an integral part of the financial statements.
Annual Report
Notes to Financial Statements
For the period ended July 31, 2011
1. Organization.
Fidelity Real Estate Income Fund (the Fund) is a fund of Fidelity Securities Fund (the Trust) and is authorized to issue an unlimited number of shares. The Trust is registered under the Investment Company Act of 1940, as amended (the 1940 Act), as an open-end management investment company organized as a Massachusetts business trust. The Fund offers Class A, Class T, Class C, Real Estate Income and Institutional Class shares, each of has equal rights as to assets and voting privileges. Each class has exclusive voting rights with respect to matters that affect that class. Investment income, realized and unrealized capital gains and losses, the common expenses of the Fund, and certain fund-level expense reductions, if any, are allocated on a pro-rata basis to each class based on the relative net assets of each class to the total net assets of the Fund. Each class differs with respect to transfer agent and distribution and service plan fees incurred. Certain expense reductions may also differ by class.
2. Investments in Fidelity Central Funds.
The Fund invests in Fidelity Central Funds, which are open-end investment companies available only to other investment companies and accounts managed by Fidelity Management & Research Company (FMR) and its affiliates. The Fund's Schedule of Investments lists each of the Fidelity Central Funds held as of period end, if any, as an investment of the Fund, but does not include the underlying holdings of each Fidelity Central Fund. As an Investing Fund, the Fund indirectly bears its proportionate share of the expenses of the underlying Fidelity Central Funds.
The Money Market Central Funds seek preservation of capital and current income and are managed by Fidelity Investments Money Management, Inc. (FIMM), an affiliate of FMR.
A complete unaudited list of holdings for each Fidelity Central Fund is available upon request or at the Securities and Exchange Commission (the SEC) web site at www.sec.gov. In addition, the financial statements of the Fidelity Central Funds, which are not covered by the Fund's Report of Independent Registered Public Accounting Firm, are available on the SEC web site or upon request.
3. Significant Accounting Policies.
The financial statements have been prepared in conformity with accounting principles generally accepted in the United States of America (GAAP), which require management to make certain estimates and assumptions at the date of the financial statements. Actual results could differ from those estimates. Subsequent events, if any, through the date that the financial statements were issued have been evaluated in the preparation of the financial statements. The following summarizes the significant accounting policies of the Fund:
Annual Report
3. Significant Accounting Policies - continued
Security Valuation. Investments are valued as of 4:00 p.m. Eastern time on the last calendar day of the period. The Fund uses independent pricing services approved by the Board of Trustees to value its investments. When current market prices or quotations are not readily available or reliable, valuations may be determined in good faith in accordance with procedures adopted by the Board of Trustees. Factors used in determining value may include market or security specific events, changes in interest rates and credit quality. The frequency with which these procedures are used cannot be predicted and they may be utilized to a significant extent. The value used for net asset value (NAV) calculation under these procedures may differ from published prices for the same securities.
The Fund categorizes the inputs to valuation techniques used to value its investments into a disclosure hierarchy consisting of three levels as shown below:
Level 1 - quoted prices in active markets for identical investments
Level 2 - other significant observable inputs (including quoted prices for similar investments, interest rates, prepayment speeds, etc.)
Level 3 - unobservable inputs (including the Fund's own assumptions based on the best information available)
Changes in valuation techniques may result in transfers in or out of an assigned level within the disclosure hierarchy. The aggregate value of investments by input level, as of July 31, 2011, as well as a roll forward of Level 3 securities, is included at the end of the Fund's Schedule of Investments. Valuation techniques used to value the Fund's investments by major category are as follows:
Equity securities, including restricted securities, for which market quotations are readily available, are valued at the last reported sale price or official closing price as reported by an independent pricing service on the primary market or exchange on which they are traded and are categorized as Level 1 in the hierarchy. In the event there were no sales during the day or closing prices are not available, securities are valued at the last quoted bid price or may be valued using the last available price and are generally categorized as Level 2 in the hierarchy. For foreign equity securities, when significant market or security specific events arise, comparisons to the valuation of American Depositary Receipts (ADRs), futures contracts, Exchange-traded funds (ETFs) and certain indexes as well as quoted prices for similar securities are used and are categorized as Level 2 in the hierarchy in these circumstances. Utilizing these techniques may result in transfers between Level 1 and Level 2. For restricted equity securities and private placements where observable inputs are limited, assumptions about market activity and risk are used and are categorized as Level 3 in the hierarchy.
Annual Report
Notes to Financial Statements - continued
3. Significant Accounting Policies - continued
Security Valuation - continued
Debt securities, including restricted securities, are valued based on evaluated prices received from independent pricing services or from dealers who make markets in such securities. For corporate bonds, floating rate loans and preferred securities, pricing services utilize matrix pricing which considers yield or price of bonds of comparable quality, coupon, maturity and type as well as dealer supplied prices and are generally categorized as Level 2 in the hierarchy. For asset backed securities, collateralized mortgage obligations and commercial mortgage securities, pricing services utilize matrix pricing which considers prepayment speed assumptions, attributes of the collateral, yield or price of bonds of comparable quality, coupon, maturity and type as well as dealer supplied prices and, accordingly, such securities are generally categorized as Level 2 in the hierarchy. When independent prices are unavailable or unreliable, debt securities may be valued utilizing pricing matrices which consider similar factors that would be used by independent pricing services. These are generally categorized as Level 2 in the hierarchy but may be Level 3 depending on the circumstances.
Investments in open-end mutual funds, including the Fidelity Central Funds, are valued at their closing net asset value each business day and are categorized as Level 1 in the hierarchy.
Foreign Currency. The Fund may use foreign currency contracts to facilitate transactions in foreign-denominated securities. Gains and losses from these transactions may arise from changes in the value of the foreign currency or if the counterparties do not perform under the contracts' terms.
Foreign-denominated assets, including investment securities, and liabilities are translated into U.S. dollars at the exchange rate at period end. Purchases and sales of investment securities, income and dividends received and expenses denominated in foreign currencies are translated into U.S. dollars at the exchange rate in effect on the transaction date.
The effects of exchange rate fluctuations on investments are included with the net realized and unrealized gain (loss) on investment securities. Other foreign currency transactions resulting in realized and unrealized gain (loss) are disclosed separately.
Investment Transactions and Income. For financial reporting purposes, the Fund's investment holdings and NAV include trades executed through the end of the last business day of the period. The NAV per share for processing shareholder transactions is calculated as of the close of business of the New York Stock Exchange (NYSE), normally 4:00 p.m. Eastern time and includes trades executed through the end of the prior business day. Gains and losses on securities sold are determined on the basis of identified cost and may include proceeds received from litigation. Dividend income is recorded on
Annual Report
3. Significant Accounting Policies - continued
Investment Transactions and Income - continued
the ex-dividend date, except for certain dividends from foreign securities where the ex-dividend date may have passed, which are recorded as soon as the Fund is informed of the ex-dividend date. Non-cash dividends included in dividend income, if any, are recorded at the fair market value of the securities received. Distributions received on securities that represent a return of capital or capital gain are recorded as a reduction of cost of investments and/or as a realized gain. The Fund estimates the components of distributions received that may be considered return of capital distributions or capital gain distributions. Interest income and distributions from the Fidelity Central Funds are accrued as earned. Interest income includes coupon interest and amortization of premium and accretion of discount on debt securities. For certain lower credit quality securitized assets that have contractual cash flows (for example, asset backed securities, collateralized mortgage obligations and commercial mortgage-backed securities), changes in estimated cash flows are periodically evaluated and the estimated yield is adjusted on a prospective basis over the remaining life of the security, resulting in increases or decreases to Interest Income in the accompanying Statement of Operations. Investment income is recorded net of foreign taxes withheld where recovery of such taxes is uncertain. Debt obligations may be placed on non-accrual status and related interest income may be reduced by ceasing current accruals and writing off interest receivables when the collection of all or a portion of interest has become doubtful based on consistently applied procedures. A debt obligation is removed from non-accrual status when the issuer resumes interest payments or when collectability of interest is reasonably assured.
Expenses. Expenses directly attributable to a fund are charged to that fund. Expenses attributable to more than one fund are allocated among the respective funds on the basis of relative net assets or other appropriate methods. Expense estimates are accrued in the period to which they relate and adjustments are made when actual amounts are known.
Income Tax Information and Distributions to Shareholders. Each year, the Fund intends to qualify as a regulated investment company, including distributing substantially all of its taxable income and realized gains under Subchapter M of the Internal Revenue Code and filing its U.S. federal tax return. As a result, no provision for income taxes is required. As of July 31, 2011, the Fund did not have any unrecognized tax benefits in the financial statements. A fund's federal tax return is subject to examination by the Internal Revenue Service (IRS) for a period of three years. Foreign taxes are provided for based on the Fund's understanding of the tax rules and rates that exist in the foreign markets in which it invests.
Distributions are declared and recorded on the ex-dividend date. Income dividends and capital gain distributions are declared separately for each class. Income and capital gain
Annual Report
Notes to Financial Statements - continued
3. Significant Accounting Policies - continued
Income Tax Information and Distributions to Shareholders - continued
distributions are determined in accordance with income tax regulations, which may differ from GAAP. In addition, the Fund claimed a portion of the payment made to redeeming shareholders as a distribution for income tax purposes.
Capital accounts within the financial statements are adjusted for permanent book-tax differences. These adjustments have no impact on net assets or the results of operations. Temporary book-tax differences will reverse in a subsequent period.
Book-tax differences are primarily due to short-term gain distributions from the Underlying Funds, foreign currency transactions, passive foreign investment companies (PFIC), market discount, equity-debt classifications, partnerships, capital loss carryforwards and losses deferred due to wash sales.
The federal tax cost of investment securities and unrealized appreciation (depreciation) as of period end were as follows:
Gross unrealized appreciation | $ 144,195,864 |
Gross unrealized depreciation | (67,819,922) |
Net unrealized appreciation (depreciation) on securities and other investments | $ 76,375,942 |
| |
Tax Cost | $ 1,752,042,061 |
The tax-based components of distributable earnings as of period end were as follows:
Undistributed ordinary income | $ 19,446,220 |
Undistributed long-term capital gain | $ 8,214,193 |
Net unrealized appreciation (depreciation) | $ 76,400,916 |
Under the recently enacted Regulated Investment Company Modernization Act of 2010 (the Act), the Fund will be permitted to carry forward capital losses incurred in taxable years beginning after December 22, 2010 for an unlimited period. However, any losses incurred during those future taxable years will be required to be utilized prior to any losses incurred in pre-enactment taxable years, which generally expire after eight years from when they are incurred. Additionally, post-enactment capital losses that are carried forward will retain their character as either short-term or long-term capital losses rather than being considered all short-term as under previous law. The Fund's first fiscal year end subject to the Act will be July 31, 2012.
Annual Report
3. Significant Accounting Policies - continued
Income Tax Information and Distributions to Shareholders - continued
The tax character of distributions paid was as follows:
| July 31, 2011 | July 31, 2010 |
Ordinary Income | $ 66,688,371 | $ 40,150,798 |
Short-Term Trading (Redemption) Fees. Shares held by investors in the Fund less than 90 days are subject to a redemption fee equal to .75% of the net asset value of shares redeemed. All redemption fees, which reduce the proceeds of the shareholder redemption, are retained by the Fund and accounted for as an addition to paid in capital.
New Accounting Pronouncement. In May 2011, the Financial Accounting Standards Board issued Accounting Standard Update No. 2011-04, Fair Value Measurement (Topic 820) - Amendments to Achieve Common Fair Value Measurement and Disclosure Requirements in U.S. GAAP and IFRSs. The update changes the wording used to describe the requirements in GAAP for measuring fair value and for disclosing information about fair value measurements. The update is effective during interim and annual periods beginning after December 15, 2011. Management is currently evaluating the impact of the update's adoption on the Fund's financial statement disclosures.
4. Operating Policies.
Restricted Securities. The Fund may invest in securities that are subject to legal or contractual restrictions on resale. These securities generally may be resold in transactions exempt from registration or to the public if the securities are registered. Disposal of these securities may involve time-consuming negotiations and expense, and prompt sale at an acceptable price may be difficult. Information regarding restricted securities is included at the end of the Fund's Schedule of Investments.
Loans and Other Direct Debt Instruments. The Fund may invest in loans and loan participations, trade claims or other receivables. These investments may include standby financing commitments, including revolving credit facilities, that obligate the Fund to supply additional cash to the borrower on demand. Loan participations involve a risk of insolvency of the lending bank or other financial intermediary. The Fund may be contractually obligated to receive approval from the agent bank and/or borrower prior to the sale of these investments.
5. Purchases and Sales of Investments.
Purchases and sales of securities, other than short-term securities and U.S. government securities, aggregated $943,762,957 and $333,450,877, respectively.
Annual Report
Notes to Financial Statements - continued
6. Fees and Other Transactions with Affiliates.
Management Fee. FMR and its affiliates provide the Fund with investment management related services for which the Fund pays a monthly management fee. The management fee is the sum of an individual fund fee rate that is based on an annual rate of .30% of the Fund's average net assets and a group fee rate that averaged .26% during the period. The group fee rate is based upon the average net assets of all the mutual funds advised by FMR. The group fee rate decreases as assets under management increase and increases as assets under management decrease. For the period, the total annual management fee rate was .56% of the Fund's average net assets.
Distribution and Service Plan Fees. In accordance with Rule 12b-1 of the 1940 Act, the Fund has adopted separate Distribution and Service Plans for each class of shares. Certain classes pay Fidelity Distributors Corporation (FDC), an affiliate of FMR, separate Distribution and Service Fees, each of which is based on an annual percentage of each class' average net assets. In addition, FDC may pay financial intermediaries for selling shares of the Fund and providing shareholder support services. For the period, the Distribution and Service Fee rates, total fees and amounts retained by FDC were as follows:
| Distribution
Fee | Service
Fee | Total Fees | Retained
by FDC |
Class A | -% | .25% | $ 69,417 | $ 9,683 |
Class T | -% | .25% | 9,295 | 13 |
Class C | .75% | .25% | 98,902 | 70,558 |
| | | $ 177,614 | $ 80,254 |
Sales Load. FDC may receive a front-end sales charge of up to 4.00% for selling Class A shares, and 4.00% for selling Class T shares, some of which is paid to financial intermediaries for selling shares of the Fund. Depending on the holding period, FDC may receive contingent deferred sales charges levied on Class A, Class T and Class C redemptions. The deferred sales charges range from 1% for Class C, 1.00% for certain purchases of Class A shares and .25% for certain purchases of Class T shares.
For the period, sales charge amounts retained by FDC were as follows:
| Retained
by FDC |
Class A | $ 29,470 |
Class T | 4,886 |
Class C* | 2,608 |
| $ 36,964 |
* When Class C shares are initially sold, FDC pays commissions from its own resources to financial intermediaries through which the sales are made.
Annual Report
6. Fees and Other Transactions with Affiliates - continued
Transfer Agent Fees. Fidelity Investments Institutional Operations Company, Inc. (FIIOC), an affiliate of FMR, is the transfer, dividend disbursing and shareholder servicing agent for each class of the Fund. FIIOC receives account fees and asset-based fees that vary according to the account size and type of account of the shareholders of the respective classes of the Fund. FIIOC pays for typesetting, printing and mailing of shareholder reports, except proxy statements. For the period, transfer agent fees for each class were as follows:
| Amount | % of
Average
Net Assets |
Class A | $ 67,947 | .25 |
Class T | 10,398 | .28 |
Class C | 25,635 | .26 |
Real Estate Income | 4,020,697 | .29 |
Institutional Class | 52,976 | .26 |
| $ 4,177,653 | |
Accounting and Security Lending Fees. Fidelity Service Company, Inc. (FSC), an affiliate of FMR, maintains the Fund's accounting records. The accounting fee is based on the level of average net assets for the month. Under a separate contract, FSC administers the security lending program. The security lending fee is based on the number and duration of lending transactions.
Brokerage Commissions. The Fund placed a portion of its portfolio transactions with brokerage firms which are affiliates of the investment adviser. The commissions paid to these affiliated firms were $16,317 for the period.
7. Committed Line of Credit.
The Fund participates with other funds managed by FMR or an affiliate in a $4.0 billion credit facility (the "line of credit") to be utilized for temporary or emergency purposes to fund shareholder redemptions or for other short-term liquidity purposes. The Fund has agreed to pay commitment fees on its pro-rata portion of the line of credit, which amounted to $4,526 and is reflected in Miscellaneous expenses on the Statement of Operations. During the period, there were no borrowings on this line of credit.
8. Security Lending.
The Fund lends portfolio securities through a lending agent from time to time in order to earn additional income. The lending agent may loan securities to certain qualified borrowers, including Fidelity Capital Markets (FCM), a broker-dealer affiliated with the Fund. On the settlement date of the loan, the Fund receives collateral (in the form of
Annual Report
Notes to Financial Statements - continued
8. Security Lending - continued
U.S. Treasury obligations, letters of credit and/or cash) against the loaned securities and maintains collateral in an amount not less than 100% of the market value of the loaned securities during the period of the loan. The market value of the loaned securities is determined at the close of business of the Fund and any additional required collateral is delivered to the Fund on the next business day. If the borrower defaults on its obligation to return the securities loaned because of insolvency or other reasons, a fund could experience delays and costs in recovering the securities loaned or in gaining access to the collateral. Any cash collateral received is invested in the Fidelity Securities Lending Cash Central Fund. The value of loaned securities and cash collateral at period end are disclosed on the Fund's Statement of Assets and Liabilities. At period end, there were no security loans outstanding with FCM. Security lending income represents the income earned on investing cash collateral, less rebates paid to borrowers and lending agent fees associated with the loan, plus any premium payments received for lending certain types of securities. Security lending income is presented in the Statement of Operations as a component of income from Fidelity Central Funds. Total security lending income during the period amounted to $34,762, including $8,492 from securities loaned to FCM.
9. Bank Borrowings.
The Fund is permitted to have bank borrowings for temporary or emergency purposes to fund shareholder redemptions or for other short-term liquidity requirements. The Fund has established borrowing arrangements with certain banks. The interest rate on the borrowings is the bank's base rate, as revised from time to time. The average daily loan balance during the period for which loans were outstanding amounted to $16,530,000. The weighted average interest rate was .71%. The interest expense amounted to $326 under the bank borrowing program. At period end, there were no bank borrowings outstanding.
10. Expense Reductions.
FMR voluntarily agreed to reimburse a portion of the Fund's operating expenses. During the period, this reimbursement reduced the Real Estate Income Class expenses by $16,722.
Many of the brokers with whom FMR places trades on behalf of the Fund provided services to the Fund in addition to trade execution. These services included payments of certain expenses on behalf of the Fund totaling $24,961 for the period. In addition, through arrangements with the Fund's custodian, credits realized as a result of uninvested cash balances were used to reduce the Fund's expenses. During the period, these credits reduced the Fund's custody expenses by $658.
Annual Report
11. Distributions to Shareholders.
Distributions to shareholders of each class were as follows:
Years ended July 31, | 2011 | 2010 A |
From net investment income | | |
Class A | $ 1,154,662 | $ 23,172 |
Class T | 160,366 | 6,447 |
Class C | 358,357 | 3,705 |
Real Estate Income | 64,149,915 | 40,107,971 |
Institutional Class | 865,071 | 9,503 |
Total | $ 66,688,371 | $ 40,150,798 |
A Distributions for Class A, Class T, Class C and Institutional Class Shares are for the period April 14, 2010 (commencement of sale of shares) to July 31, 2010.
12. Share Transactions.
Transactions for each class of shares were as follows:
| Shares | Dollars |
Years ended July 31, | 2011 | 2010 A | 2011 | 2010 A |
Class A | | | | |
Shares sold | 5,544,292 | 402,260 | $ 58,675,375 | $ 3,960,293 |
Reinvestment of distributions | 75,836 | 1,072 | 799,911 | 10,302 |
Shares redeemed | (384,554) | (18,182) | (4,105,728) | (177,559) |
Net increase (decrease) | 5,235,574 | 385,150 | $ 55,369,558 | $ 3,793,036 |
Class T | | | | |
Shares sold | 662,414 | 85,986 | $ 7,018,853 | $ 847,305 |
Reinvestment of distributions | 12,671 | 671 | 132,964 | 6,447 |
Shares redeemed | (50,669) | (17) | (536,547) | (166) |
Net increase (decrease) | 624,416 | 86,640 | $ 6,615,270 | $ 853,586 |
Class C | | | | |
Shares sold | 2,030,776 | 84,053 | $ 21,411,850 | $ 827,207 |
Reinvestment of distributions | 29,432 | 378 | 309,638 | 3,628 |
Shares redeemed | (125,083) | (281) | (1,328,625) | (2,700) |
Net increase (decrease) | 1,935,125 | 84,150 | $ 20,392,863 | $ 828,135 |
Real Estate Income | | | | |
Shares sold | 89,725,340 | 69,175,263 | $ 943,333,748 | $ 650,744,676 |
Reinvestment of distributions | 5,601,468 | 4,018,182 | 58,273,356 | 36,922,410 |
Shares redeemed | (44,449,757) | (26,105,432) | (467,916,333) | (245,525,556) |
Net increase (decrease) | 50,877,051 | 47,088,013 | $ 533,690,771 | $ 442,141,530 |
Annual Report
Notes to Financial Statements - continued
12. Share Transactions - continued
| Shares | Dollars |
Years ended July 31, | 2011 | 2010 A | 2011 | 2010 A |
Institutional Class | | | | |
Shares sold | 4,361,479 | 294,304 | $ 46,245,871 | $ 2,886,826 |
Reinvestment of distributions | 55,523 | 902 | 583,903 | 8,663 |
Shares redeemed | (681,623) | (733) | (7,257,237) | (7,109) |
Net increase (decrease) | 3,735,379 | 294,473 | $ 39,572,537 | $ 2,888,380 |
A Share transactions for Class A, Class T, Class C and Institutional Class Shares are for the period April 14, 2010 (commencement of sale of shares) to July 31, 2010.
13. Other.
The Fund's organizational documents provide former and current trustees and officers with a limited indemnification against liabilities arising in connection with the performance of their duties to the Fund. In the normal course of business, the Fund may also enter into contracts that provide general indemnifications. The Fund's maximum exposure under these arrangements is unknown as this would be dependent on future claims that may be made against the Fund. The risk of material loss from such claims is considered remote.
Annual Report
To the Trustees of Fidelity Securities Fund and Shareholders of Fidelity Real Estate Income Fund:
We have audited the accompanying statement of assets and liabilities of Fidelity Real Estate Income Fund (the Fund), a fund of Fidelity Securities Fund, including the schedule of investments, as of July 31, 2011, and the related statement of operations for the year then ended, the statement of changes in net assets for each of the two years in the period then ended, and the financial highlights for each of the five years in the period then ended. These financial statements and financial highlights are the responsibility of the Fund's management. Our responsibility is to express an opinion on these financial statements and financial highlights based on our audits.
We conducted our audits in accordance with the standards of the Public Company Accounting Oversight Board (United States). Those standards require that we plan and perform the audit to obtain reasonable assurance about whether the financial statements and financial highlights are free of material misstatement. The Fund is not required to have, nor were we engaged to perform, an audit of its internal control over financial reporting. Our audits included consideration of internal control over financial reporting as a basis for designing audit procedures that are appropriate in the circumstances, but not for the purpose of expressing an opinion on the effectiveness of the Fund's internal control over financial reporting. Accordingly, we express no such opinion. An audit also includes examining, on a test basis, evidence supporting the amounts and disclosures in the financial statements, assessing the accounting principles used and significant estimates made by management, as well as evaluating the overall financial statement presentation. Our procedures included confirmation of securities owned as of July 31, 2011, by correspondence with the custodians and brokers; where replies were not received from brokers, we performed other auditing procedures. We believe that our audits provide a reasonable basis for our opinion.
In our opinion, the financial statements and financial highlights referred to above present fairly, in all material respects, the financial position of Fidelity Real Estate Income Fund as of July 31, 2011, the results of its operations for the year then ended, the changes in its net assets for each of the two years in the period then ended, and the financial highlights for each of the five years in the period then ended, in conformity with accounting principles generally accepted in the United States of America.
/s/ Deloitte & Touche LLP
DELOITTE & TOUCHE LLP
Boston, Massachusetts
September 20, 2011
Annual Report
The Trustees, Members of the Advisory Board, and executive officers of the trust and fund, as applicable, are listed below. The Board of Trustees governs the fund and is responsible for protecting the interests of shareholders. The Trustees are experienced executives who meet periodically throughout the year to oversee the fund's activities, review contractual arrangements with companies that provide services to the fund, oversee management of the risks associated with such activities and contractual arrangements, and review the fund's performance. Except for James C. Curvey, each of the Trustees oversees 221 funds advised by FMR or an affiliate. Mr. Curvey oversees 419 funds advised by FMR or an affiliate.
The Trustees hold office without limit in time except that (a) any Trustee may resign; (b) any Trustee may be removed by written instrument, signed by at least two-thirds of the number of Trustees prior to such removal; (c) any Trustee who requests to be retired or who has become incapacitated by illness or injury may be retired by written instrument signed by a majority of the other Trustees; and (d) any Trustee may be removed at any special meeting of shareholders by a two-thirds vote of the outstanding voting securities of the trust. Each Trustee who is not an interested person (as defined in the 1940 Act) (Independent Trustee), shall retire not later than the last day of the calendar year in which his or her 75th birthday occurs. The Independent Trustees may waive this mandatory retirement age policy with respect to individual Trustees. The executive officers and Advisory Board Members hold office without limit in time, except that any officer and Advisory Board Member may resign or may be removed by a vote of a majority of the Trustees at any regular meeting or any special meeting of the Trustees. Except as indicated, each individual has held the office shown or other offices in the same company for the past five years.
Experience, Skills, Attributes, and Qualifications of the Fund's Trustees. The Governance and Nominating Committee has adopted a statement of policy that describes the experience, qualifications, attributes, and skills that are necessary and desirable for potential Independent Trustee candidates (Statement of Policy). The Board believes that each Trustee satisfied at the time he or she was initially elected or appointed a Trustee, and continues to satisfy, the standards contemplated by the Statement of Policy. The Governance and Nominating Committee also engages professional search firms to help identify potential Independent Trustee candidates who have the experience, qualifications, attributes, and skills consistent with the Statement of Policy. From time to time, additional criteria based on the composition and skills of the current Independent Trustees, as well as experience or skills that may be appropriate in light of future changes to board composition, business conditions, and regulatory or other developments, have also been considered by the professional search firms and the Governance and Nominating Committee. In addition, the Board takes into account the Trustees' commitment and participation in Board and committee meetings, as well as their leadership of standing and ad hoc committees throughout their tenure.
In determining that a particular Trustee was and continues to be qualified to serve as a Trustee, the Board has considered a variety of criteria, none of which, in isolation, was controlling. The Board believes that, collectively, the Trustees have balanced and diverse experience, qualifications, attributes, and skills, which allow the Board to operate effectively in governing the fund and protecting the interests of shareholders. Information about the specific experience, skills, attributes, and qualifications of each Trustee, which in each case led to the Board's conclusion that the Trustee should serve (or continue to serve) as a trustee of the fund, is provided below.
Annual Report
Trustees and Officers - continued
Board Structure and Oversight Function. James C. Curvey is an interested person (as defined in the 1940 Act) and currently serves as Acting Chairman. The Trustees have determined that an interested Chairman is appropriate and benefits shareholders because an interested Chairman has a personal and professional stake in the quality and continuity of services provided to the fund. Independent Trustees exercise their informed business judgment to appoint an individual of their choosing to serve as Chairman, regardless of whether the Trustee happens to be independent or a member of management. The Independent Trustees have determined that they can act independently and effectively without having an Independent Trustee serve as Chairman and that a key structural component for assuring that they are in a position to do so is for the Independent Trustees to constitute a substantial majority for the Board. The Independent Trustees also regularly meet in executive session. Ned C. Lautenbach serves as Chairman of the Independent Trustees and as such (i) acts as a liaison between the Independent Trustees and management with respect to matters important to the Independent Trustees and (ii) with management prepares agendas for Board meetings.
Fidelity funds are overseen by different Boards of Trustees. The fund's Board oversees Fidelity's equity and high income funds and another Board oversees Fidelity's investment-grade bond, money market, and asset allocation funds. The asset allocation funds may invest in Fidelity funds overseen by the fund's Board. The use of separate Boards, each with its own committee structure, allows the Trustees of each group of Fidelity funds to focus on the unique issues of the funds they oversee, including common research, investment, and operational issues. On occasion, the separate Boards establish joint committees to address issues of overlapping consequences for the Fidelity funds overseen by each Board.
The Trustees operate using a system of committees to facilitate the timely and efficient consideration of all matters of importance to the Trustees, the fund, and fund shareholders and to facilitate compliance with legal and regulatory requirements and oversight of the fund's activities and associated risks. The Board, acting through its committees, has charged FMR and its affiliates with (i) identifying events or circumstances the occurrence of which could have demonstrably adverse effects on the fund's business and/or reputation; (ii) implementing processes and controls to lessen the possibility that such events or circumstances occur or to mitigate the effects of such events or circumstances if they do occur; and (iii) creating and maintaining a system designed to evaluate continuously business and market conditions in order to facilitate the identification and implementation processes described in (i) and (ii) above. Because the day-to-day operations and activities of the fund are carried out by or through FMR, its affiliates and other service providers, the fund's exposure to risks is mitigated but not eliminated by the processes overseen by the Trustees. While each of the Board's committees has responsibility for overseeing different aspects of the fund's activities, oversight is exercised primarily through the Operations, Audit, and Compliance Committees. Appropriate personnel, including but not limited to the fund's Chief Compliance Officer (CCO), FMR's internal auditor, the independent accountants, the fund's Treasurer and portfolio management personnel, make periodic reports to the Board's committees, as appropriate. The responsibilities of each committee, including their oversight responsibilities, are described further under "Standing Committees of the Fund's Trustees."
Annual Report
The fund's Statement of Additional Information (SAI) includes more information about the Trustees. To request a free copy, call Fidelity at 1-877-208-0098.
Interested Trustees*:
Correspondence intended for each Trustee who is an interested person may be sent to Fidelity Investments, 82 Devonshire Street, Boston, Massachusetts 02109.
Name, Age; Principal Occupations and Other Relevant Experience+ |
James C. Curvey (76) |
| Year of Election or Appointment: 2007
Mr. Curvey is Trustee and Acting Chairman of the Board of Trustees of certain Trusts. Mr. Curvey also serves as Trustee (2007-present) of other investment companies advised by FMR. Mr. Curvey is a Director of Fidelity Investments Money Management, Inc. (2009-present), Director of Fidelity Research & Analysis Co. (2009-present) and Director of FMR and FMR Co., Inc. (2007-present). Mr. Curvey is also Vice Chairman (2007-present) and Director of FMR LLC. In addition, Mr. Curvey serves as an Overseer for the Boston Symphony Orchestra and a member of the Trustees of Villanova University. Previously, Mr. Curvey was the Vice Chairman (2006-2007) and Director (2000-2007) of FMR Corp. |
Ronald P. O'Hanley (54) |
| Year of Election or Appointment: 2011
Mr. O'Hanley is Director of FMR Co., Inc. (2010-present), Director of Fidelity Investments Money Management, Inc. (2010-present), Director of Fidelity Research & Analysis Company (2010-present), President of Fidelity Asset Management and Corporate Services and a member of Fidelity's Executive Committee (2010-present). Previously, Mr. O'Hanley served as President and Chief Executive Officer of BNY Mellon Asset Management (2007-2010). Mr. O'Hanley also served as Vice Chairman of Bank New York Mellon Corp. and a member of that firm's Executive Committee. Prior to the 2007 merger of The Bank of New York and Mellon Financial Corporation, he was Vice Chairman of Mellon Financial Corporation and President and Chief Executive Officer of Mellon Asset Management. He joined Mellon in February 1997. Mr. O'Hanley currently serves as Chairman of the Boston Public Library Foundation Board of Directors and sits on the Board of Directors of Beth Israel Deaconess Medical Center, the Board of Trustees of the Marine Biological Laboratory and the Advisory Board of the Maxwell School of Citizenship and Public Administration at Syracuse University. Mr. O'Hanley also chairs the Council on Asset Management for the Financial Services Roundtable and is a member of the Board of Directors of Institutional Investor's U.S. Institute. |
* Trustees have been determined to be "Interested Trustees" by virtue of, among other things, their affiliation with the trust or various entities under common control with FMR.
+ The information above includes each Trustee's principal occupation during the last five years and other information relating to the experience, attributes, and skills relevant to each Trustee's qualifications to serve as a Trustee, which led to the conclusion that each Trustee should serve as a Trustee for the fund.
Annual Report
Independent Trustees:
Correspondence intended for each Independent Trustee (that is, the Trustees other than the Interested Trustees) may be sent to Fidelity Investments, P.O. Box 55235, Boston, Massachusetts 02205-5235.
Name, Age; Principal Occupations and Other Relevant Experience+ |
Dennis J. Dirks (63) |
| Year of Election or Appointment: 2005 Prior to his retirement in May 2003, Mr. Dirks was Chief Operating Officer and a member of the Board of The Depository Trust & Clearing Corporation (DTCC). He also served as President, Chief Operating Officer, and Board member of The Depository Trust Company (DTC) and President and Board member of the National Securities Clearing Corporation (NSCC). In addition, Mr. Dirks served as Chief Executive Officer and Board member of the Government Securities Clearing Corporation, Chief Executive Officer and Board member of the Mortgage-Backed Securities Clearing Corporation, as a Trustee and a member of the Finance Committee of Manhattan College (2005-2008), and as a Trustee and a member of the Finance Committee of AHRC of Nassau County (2006-2008). Mr. Dirks is a member of the Independent Directors Council (IDC) Governing Council (2010-Present) and Board of Directors for The Brookville Center for Children's Services, Inc. (2009-present). |
Alan J. Lacy (57) |
| Year of Election or Appointment: 2008 Mr. Lacy serves as Senior Adviser (2007-present) of Oak Hill Capital Partners, L.P. (private equity). Mr. Lacy also served as Chief Executive Officer (2000-2005) and Vice Chairman (2005-2006) of Sears Holdings Corporation and Sears, Roebuck and Co. (retail). In addition, Mr. Lacy serves as a member of the Board of Directors of Dave & Buster's, Inc. (restaurant and entertainment complexes, 2010-present), The Hillman Companies, Inc. (hardware wholesalers, 2010-present), and Bristol-Myers Squibb Company (global pharmaceuticals, 2007-present). Mr. Lacy is a member of the Board of Trustees of The National Parks Conservation Association (2006-Present). Previously, Mr. Lacy served as Chairman of the Board of Trustees of the National Parks Conservation Association (2008-2011) and as a member of the Board of Directors for the Western Union Company (global money transfer, 2006-2011). |
Ned C. Lautenbach (67) |
| Year of Election or Appointment: 2000 Mr. Lautenbach is Chairman of the Independent Trustees of the Equity and High Income Funds (2006-present). Mr. Lautenbach currently serves as the Lead Director of the Eaton Corporation Board of Directors (diversified industrial, 1997-present). Mr. Lautenbach is also a member of the Board of Directors of the Philharmonic Center for the Arts in Naples, Florida (1999-present); a member of the Board of Trustees of Fairfield University (2005-present); and a member of the Council on Foreign Relations (1994-present). Previously, Mr. Lautenbach was a Partner/Advisory Partner at Clayton, Dubilier & Rice, LLC (private equity investment, 1998-2010), as well as a Director of Sony Corporation (2006-2007). |
Joseph Mauriello (66) |
| Year of Election or Appointment: 2008 Prior to his retirement in January 2006, Mr. Mauriello served in numerous senior management positions including Deputy Chairman and Chief Operating Officer (2004-2005), and Vice Chairman of Financial Services (2002-2004) of KPMG LLP US (professional services, 1965-2005). Mr. Mauriello currently serves as a member of the Board of Directors of XL Group plc. (global insurance and re-insurance, 2006-present) and of Arcadia Resources Inc. (health care services and products, 2007-present). Previously, Mr. Mauriello served as a Director of the Hamilton Funds of the Bank of New York (2006-2007). |
Robert W. Selander (60) |
| Year of Election or Appointment: 2011
Previously, Mr. Selander served as a Member of the Advisory Board of Fidelity's Equity and High Income Funds (2011), Executive Vice Chairman (2010), Chief Executive Officer (2009-2010), and President and Chief Executive Officer (1997-2009) of Mastercard, Inc. |
Cornelia M. Small (67) |
| Year of Election or Appointment: 2005 Ms. Small is a member of the Board of Directors of the Teagle Foundation (2009-present). Ms. Small is also a member of the Investment Committee, and Chair (2008-present) and a member of the Board of Trustees of Smith College. In addition, Ms. Small serves on the Investment Committee of the Berkshire Taconic Community Foundation (2008-present). Previously, Ms. Small served as Chairperson of the Investment Committee (2002-2008) of Smith College. In addition, Ms. Small served as Chief Investment Officer, Director of Global Equity Investments, and a member of the Board of Directors of Scudder, Stevens & Clark and Scudder Kemper Investments. |
William S. Stavropoulos (72) |
| Year of Election or Appointment: 2002 Mr. Stavropoulos is Vice Chairman of the Independent Trustees of the Equity and High Income Funds (2006-present). Mr. Stavropoulos serves as President and Founder of the Michigan Baseball Foundation, the Great Lakes Loons (2007-present). Mr. Stavropoulos is Chairman Emeritus of the Board of Directors of The Dow Chemical Company, where he previously served in numerous senior management positions, including President, CEO (1995-2000; 2002-2004), Chairman of the Executive Committee (2000-2006), and as a member of the Board of Directors (1990-2006). Currently, Mr. Stavropoulos is Chairman of Univar (global distributor of commodity and specialty chemicals, 2010-present), a Director of Teradata Corporation (data warehousing and technology solutions, 2008-present), Chemical Financial Corporation, Maersk Inc. (industrial conglomerate), Tyco International, Inc. (multinational manufacturing and services, 2007-present), and a member of the Advisory Board for Metalmark Capital (private equity investment, 2005-present). Mr. Stavropoulos is a special advisor to Clayton, Dubilier & Rice, LLC (private equity investment). In addition, Mr. Stavropoulos is a member of the University of Notre Dame Advisory Council for the College of Science. |
David M. Thomas (62) |
| Year of Election or Appointment: 2008 Previously, Mr. Thomas served as Executive Chairman (2005-2006) and Chairman and Chief Executive Officer (2000-2005) of IMS Health, Inc. (pharmaceutical and healthcare information solutions). In addition, Mr. Thomas serves as a member of the Board of Directors of Fortune Brands, Inc. (consumer products), and Interpublic Group of Companies, Inc. (marketing communication, 2004-present). |
Michael E. Wiley (60) |
| Year of Election or Appointment: 2008 Mr. Wiley also serves as a Director of Asia Pacific Exploration Consolidated (international oil and gas exploration and production, 2008-present). Mr. Wiley serves as a Director of Tesoro Corporation (independent oil refiner and marketer, 2005-present), and a Director of Bill Barrett Corporation (exploration and production, 2005-present). In addition, Mr. Wiley also serves as a Director of Post Oak Bank (privately-held bank, 2004-present). Previously, Mr. Wiley served as a member of the Board of Trustees of the University of Tulsa (2000-2006; 2007-2010), as a Senior Energy Advisor of Katzenbach Partners, LLC (consulting, 2006-2007), as an Advisory Director of Riverstone Holdings (private investment), Chairman, President, and CEO of Baker Hughes, Inc. (oilfield services, 2000-2004), and as Director of Spinnaker Exploration Company (exploration and production, 2001-2005). |
Annual Report
Trustees and Officers - continued
+ The information above includes each Trustee's principal occupation during the last five years and other information relating to the experience, attributes, and skills relevant to each Trustee's qualifications to serve as a Trustee, which led to the conclusion that each Trustee should serve as a Trustee for the fund.
Advisory Board Members and Executive Officers:
Correspondence intended for each executive officer, Edward C. Johnson 3d, and Peter S. Lynch may be sent to Fidelity Investments, 82 Devonshire Street, Boston, Massachusetts 02109.
Name, Age; Principal Occupation |
Edward C. Johnson 3d (81) |
| Year of Election or Appointment: 2011 Member of the Advisory Board of Fidelity's Equity and High Income Funds. Mr. Johnson serves as Chief Executive Officer, Chairman, and a Director of FMR LLC, and also serves as Chairman and Director of FIL Limited. Previously, Mr. Johnson served as a Trustee and Chairman of the Board of certain Fidelity Trusts, Chairman and a Director of FMR, Chairman and a Director of FMR Co., Inc., and President of FMR LLC (2006-2007). |
Peter S. Lynch (67) |
| Year of Election or Appointment: 2003 Member of the Advisory Board of Fidelity's Equity and High Income Funds. Mr. Lynch is Vice Chairman and a Director of FMR and FMR Co., Inc. In addition, Mr. Lynch serves as a Trustee of Boston College and as the Chairman of the Inner-City Scholarship Fund. Previously, Mr. Lynch served on the Special Olympics International Board of Directors (1997-2006). |
Kenneth B. Robins (41) |
| Year of Election or Appointment: 2008 President and Treasurer of Fidelity's Equity and High Income Funds. Mr. Robins also serves as President and Treasurer (2010-present) and Assistant Treasurer (2009-present) of other Fidelity funds and is an employee of Fidelity Investments (2004-present). Previously, Mr. Robins served as Deputy Treasurer of the Fidelity funds (2005-2008) and Treasurer and Chief Financial Officer of The North Carolina Capital Management Trust: Cash and Term Portfolios (2006-2008). |
Brian B. Hogan (46) |
| Year of Election or Appointment: 2009 Vice President of Equity and High Income Funds. Mr. Hogan also serves as President of FMR's Equity Division (2009-present). Previously, Mr. Hogan served as Senior Vice President, Equity Research of FMR (2006-2009) and as a portfolio manager. |
Christopher S. Bartel (39) |
| Year of Election or Appointment: 2009 Vice President of Fidelity's Sector and Real Estate Equity Funds. Mr. Bartel also serves as Senior Vice President of Equity Research (2009-present). Previously, Mr. Bartel served as Managing Director of Research (2006-2009) and an analyst and portfolio manager (2000-2006). |
Scott C. Goebel (43) |
| Year of Election or Appointment: 2008
Secretary and Chief Legal Officer (CLO) of the Fidelity funds. Mr. Goebel also serves as Secretary of Fidelity Investments Money Management, Inc. (FIMM) (2010-present) and Fidelity Research and Analysis Company (FRAC) (2010-present); Secretary and CLO of The North Carolina Capital Management Trust: Cash and Term Portfolios (2008-present); General Counsel, Secretary, and Senior Vice President of FMR (2008-present) and FMR Co., Inc. (2008-present); employed by FMR LLC or an affiliate (2001-present); Chief Legal Officer of Fidelity Management & Research (Hong Kong) Limited (2008-present) and Assistant Secretary of Fidelity Management & Research (Japan) Inc. (2008-present), and Fidelity Management & Research (U.K.) Inc. (2008-present). Previously, Mr. Goebel served as Assistant Secretary of FIMM (2008-2010), FRAC (2008-2010), and the Funds (2007-2008) and as Vice President and Secretary of Fidelity Distributors Corporation (FDC) (2005-2007). |
William C. Coffey (42) |
| Year of Election or Appointment: 2009 Assistant Secretary of Fidelity's Equity and High Income Funds. Mr. Coffey also serves as Senior Vice President and Deputy General Counsel of FMR LLC (2010-present), and is an employee of Fidelity Investments. Previously, Mr. Coffey served as Vice President and Associate General Counsel of FMR LLC (2005-2009). |
Holly C. Laurent (57) |
| Year of Election or Appointment: 2008 Anti-Money Laundering (AML) Officer of the Fidelity funds. Ms. Laurent also serves as AML Officer of The North Carolina Capital Management Trust: Cash and Term Portfolios (2008-present) and is an employee of Fidelity Investments. Previously, Ms. Laurent was Senior Vice President and Head of Legal for Fidelity Business Services India Pvt. Ltd. (2006-2008), and Senior Vice President, Deputy General Counsel and Group Head for FMR LLC (2005-2006). |
Christine Reynolds (52) |
| Year of Election or Appointment: 2008 Chief Financial Officer of the Fidelity funds. Ms. Reynolds became President of Fidelity Pricing and Cash Management Services (FPCMS) in August 2008. Ms. Reynolds served as Chief Operating Officer of FPCMS (2007-2008). Previously, Ms. Reynolds served as President, Treasurer, and Anti-Money Laundering officer of the Fidelity funds (2004-2007). |
Kenneth A. Rathgeber (64) |
| Year of Election or Appointment: 2004 Chief Compliance Officer of Fidelity's Equity and High Income Funds. Mr. Rathgeber is Chief Compliance Officer of Fidelity Management & Research (Hong Kong) Limited (2008-present), Fidelity Management & Research (Japan) Inc. (2008-present), FMR (2005-present), FMR Co., Inc. (2005-present), Fidelity Management & Research (U.K.) Inc. (2005-present), Fidelity Research & Analysis Company (2005-present), Fidelity Investments Money Management, Inc. (2005-present), Pyramis Global Advisors, LLC (2005-present), and Strategic Advisers, Inc. (2005-present). |
Jeffrey S. Christian (49) |
| Year of Election or Appointment: 2009 Deputy Treasurer of the Fidelity funds. Mr. Christian is an employee of Fidelity Investments. Previously, Mr. Christian served as Chief Financial Officer (2008-2009) of certain Fidelity funds and Senior Vice President of Fidelity Pricing and Cash Management Services (FPCMS) (2004-2009). |
Bryan A. Mehrmann (50) |
| Year of Election or Appointment: 2005 Deputy Treasurer of the Fidelity funds. Mr. Mehrmann is an employee of Fidelity Investments. |
Adrien E. Deberghes (43) |
| Year of Election or Appointment: 2008 Deputy Treasurer of Fidelity's Equity and High Income Funds. Mr. Deberghes also serves as Assistant Treasurer of other Fidelity funds (2010-present) and is an employee of Fidelity Investments (2008-present). Previously, Mr. Deberghes served as Senior Vice President of Mutual Fund Administration at State Street Corporation (2007-2008), Senior Director of Mutual Fund Administration at Investors Bank & Trust (2005-2007), and Director of Finance for Dunkin' Brands (2000-2005). |
Stephanie J. Dorsey (42) |
| Year of Election or Appointment: 2010 Assistant Treasurer of Fidelity's Equity and High Income Funds. Ms. Dorsey also serves as Deputy Treasurer of other Fidelity funds (2008-present) and is an employee of Fidelity Investments (2008-present). Previously, Ms. Dorsey served as Treasurer (2004-2008) of the JPMorgan Mutual Funds and Vice President (2004-2008) of JPMorgan Chase Bank. |
John R. Hebble (53) |
| Year of Election or Appointment: 2009 Assistant Treasurer of Fidelity's Equity and High Income Funds. Mr. Hebble also serves as President (2011-present), Treasurer, and Chief Financial Officer of The North Carolina Capital Management Trust: Cash and Term Portfolios (2008-present), President and Treasurer of other Fidelity funds (2008-present) and is an employee of Fidelity Investments. |
Gary W. Ryan (52) |
| Year of Election or Appointment: 2005 Assistant Treasurer of the Fidelity funds. Mr. Ryan is an employee of Fidelity Investments. Previously, Mr. Ryan served as Vice President of Fund Reporting in Fidelity Pricing and Cash Management Services (FPCMS) (1999-2005). |
Jonathan Davis (43) |
| Year of Election or Appointment: 2010 Assistant Treasurer of the Fidelity funds. Mr. Davis is an employee of Fidelity Investments. Previously, Mr. Davis served as Vice President and Associate General Counsel of FMR LLC (2003-2010). |
Annual Report
The Board of Trustees of Fidelity Real Estate Income Fund voted to pay to shareholders of record at the opening of business, the following distributions per share derived from capital gains realized from sales of portfolio securities, and dividends derived from net investment income:
| Pay Date | Record Date | Dividends | Capital Gains |
Class A | 09/06/11 | 09/02/11 | $0.143 | $0.052 |
Class T | 09/06/11 | 09/02/11 | $0.143 | $0.052 |
Class C | 09/06/11 | 09/02/11 | $0.124 | $0.052 |
The fund hereby designates as a capital gain dividend with respect to the taxable year ended July 31, 2011, $10,590,637, or, if subsequently determined to be different, the net capital gain of such year.
Class A, Class T, and Class C designates 1.00% of the dividends distributed in March and June as amounts which may be taken into account as a dividend for purposes of the maximum rate under section 1(h)(11) of the Internal Revenue Code.
A total of 0.08% of the dividends distributed during the fiscal year was derived from interest on U.S. Government securities which is generally exempt from state income tax.
The fund will notify shareholders in January 2012 of amounts for use in preparing 2011 income tax returns.
Annual Report
Board Approval of Investment Advisory Contracts and Management Fees
Fidelity Real Estate Income Fund
Each year, the Board of Trustees, including the Independent Trustees (together, the Board), votes on the renewal of the management contract and sub-advisory agreements (together, the Advisory Contracts) for the fund. The Board, assisted by the advice of fund counsel and Independent Trustees' counsel, requests and considers a broad range of information relevant to the renewal of the Advisory Contracts throughout the year.
The Board meets regularly and considers at each of its meetings factors that are relevant to its annual consideration of the renewal of the fund's Advisory Contracts, including the services and support provided to the fund and its shareholders. The Board has established various standing committees, each composed of Independent Trustees with varying backgrounds, to which the Board has assigned specific subject matter responsibilities in order to enhance effective decision-making by the Board. The Board, acting directly and through its Committees, requests and receives information concerning the annual consideration of the renewal of the fund's Advisory Contracts. The Board also meets as needed to consider matters specifically related to the Board's annual consideration of the renewal of Advisory Contracts. Members of the Board may also meet with trustees of other Fidelity funds through ad hoc joint committees to discuss certain matters relevant to the Fidelity funds.
At its July 2011 meeting, the Board of Trustees, including the Independent Trustees, unanimously determined to renew the fund's Advisory Contracts. In reaching its determination, the Board considered all factors it believed relevant, including (i) the nature, extent, and quality of the services to be provided to the fund and its shareholders (including the investment performance of the fund); (ii) the competitiveness of the fund's management fee and total expense ratio; (iii) the total costs of the services to be provided by and the profits to be realized by Fidelity from its relationship with the fund; (iv) the extent to which economies of scale would be realized as the fund grows; and (v) whether fee levels reflect these economies of scale, if any, for the benefit of fund shareholders.
In considering whether to renew the Advisory Contracts for the fund, the Board reached a determination, with the assistance of fund counsel and Independent Trustees' counsel and through the exercise of its business judgment, that the renewal of the Advisory Contracts is in the best interests of the fund and its shareholders and that the compensation payable under the Advisory Contracts is fair and reasonable. The Board's decision to renew the Advisory Contracts was not based on any single factor, but rather was based on a comprehensive consideration of all the information provided to the Board at its meetings throughout the year. The Board, in reaching its determination to renew the Advisory Contracts, is aware that shareholders in the fund have a broad range of investment choices available to them, including a wide choice among mutual funds offered by Fidelity's competitors, and that the fund's shareholders, who have the opportunity to review and weigh the disclosure provided by the fund in its prospectus and other public disclosures, have chosen to invest in this fund, managed by Fidelity.
Annual Report
Board Approval of Investment Advisory Contracts and
Management Fees - continued
Nature, Extent, and Quality of Services Provided. The Board considered the staffing within the investment adviser, FMR, and the sub-advisers (together, the Investment Advisers), including the backgrounds of the fund's investment personnel and the fund's investment objective and discipline. The Independent Trustees also had discussions with senior management of Fidelity's investment operations and investment groups. The Board considered the structure of the portfolio manager compensation program and whether this structure provides appropriate incentives to act in the best interests of the fund.
Resources Dedicated to Investment Management and Support Services. The Board and the Fund Oversight and Research Committees reviewed the general qualifications and capabilities of the Investment Advisers' investment staff, including its size, education, experience, and resources, as well as the Investment Advisers' approach to recruiting, training, managing, and compensating investment personnel. The Board also noted that FMR has devoted increased resources to non-U.S. offices. The Board noted that Fidelity's analysts have extensive resources, tools and capabilities which allow them to conduct sophisticated quantitative and fundamental analysis, as well as credit analysis of issuers, counterparties and enhancers. The Board also believes that Fidelity's investment professionals have sufficient access to global information and data so as to provide competitive investment results over time, and that those professionals also have access to sophisticated tools which permit them to assess portfolio construction and risk and performance attribution characteristics continuously, as well as to transmit new information and research conclusions rapidly around the world. Additionally, in their deliberations, the Board considered the Investment Advisers' trading capabilities and resources which are an integral part of the investment management process.
Shareholder and Administrative Services. The Board considered (i) the nature, extent, quality, and cost of advisory, administrative, and shareholder services performed by the Investment Advisers and their affiliates under the Advisory Contracts and under separate agreements covering transfer agency, pricing and bookkeeping, and securities lending services for the fund; (ii) the nature and extent of the investment adviser's supervision of third party service providers, principally custodians and subcustodians; and (iii) the resources devoted to, and the record of compliance with, the fund's compliance policies and procedures. The Board also reviewed the allocation of fund brokerage, including allocations to brokers affiliated with the Investment Advisers, the use of brokerage commissions to pay fund expenses, and the use of "soft" commission dollars to pay for research services.
The Board noted that the growth of fund assets over time across the complex allows Fidelity to reinvest in the development of services designed to enhance the value or convenience of the Fidelity funds as investment vehicles. These services include 24-hour access to account information and market information through telephone representatives and over the Internet, investor education materials and asset allocation tools, and the expanded availability of Fidelity Investor Centers, with 35 new branches opening since 2010.
Annual Report
Investment in a Large Fund Family. The Board considered the benefits to shareholders of investing in a Fidelity fund, including the benefits of investing in a fund that is part of a large family of funds offering a variety of investment disciplines and providing a large variety of mutual fund investor services. The Board noted that Fidelity had taken, or had made recommendations that resulted in the Fidelity funds taking, a number of actions over the previous year that benefited particular funds, including (i) continuing to dedicate additional resources to investment research and support of the senior management team that oversees asset management; (ii) rationalizing product lines through the mergers of six funds into other funds; (iii) continuing to migrate the Freedom Funds to dedicated lower cost underlying funds; (iv) obtaining shareholder approval to broaden the investment strategies for Fidelity Consumer Finance Portfolio, Fidelity Emerging Asia Fund, and Fidelity Environment and Alternative Energy Portfolio; (v) contractually agreeing to reduce the management fees and impose other expense limitations on Spartan® 500 Index Fund and U.S. Bond Index Fund in connection with launching new institutional classes of these funds; (vi) changing the name, primary and supplemental benchmarks, and investment policies of Fidelity Global Strategies Fund to support the fund's flexible investment mandate and global orientation; and (vii) reducing the transfer agency account fee rates on certain accounts.
Investment Performance. The Board considered whether the fund has operated in accordance with its investment objective, as well as its record of compliance with its investment restrictions. It also reviewed the fund's absolute investment performance for the retail class, as well as the fund's relative investment performance for the retail class measured over multiple periods against (i) a proprietary custom index, and (ii) a peer group of mutual funds and reviewed by the Board. The following charts considered by the Board show, over the one-, three-, and five-year periods ended December 31, 2010, the cumulative total returns of the retail class of the fund, the cumulative total returns of a proprietary custom index ("benchmark"), and a range of cumulative total returns of a peer group of mutual funds identified by Lipper Inc. as having an investment objective similar to that of the fund. (The Advisor classes of the fund had less than one year of performance as of December 31, 2010). The box within each chart shows the 25th percentile return (bottom of box) and the 75th percentile return (top of box) of the peer group. Returns shown above the box are in the first quartile and returns shown below the box are in the fourth quartile. The percentage beaten number noted below each chart corresponds to the percentile box and represents the percentage of funds in the peer group whose performance was equal to or lower than that of the retail class of the fund. The fund's proprietary custom index is an index developed by FMR that represents the performance of the fund's unmanaged indexes.
Annual Report
Board Approval of Investment Advisory Contracts and
Management Fees - continued
Fidelity Real Estate Income Fund
The Board reviewed the fund's relative investment performance against its peer group and noted that the performance of the retail class of the fund was in the fourth quartile for the one-year period and the first quartile for three- and five-year periods. The Board also noted that the investment performance of the fund was lower than its benchmark for all the periods shown. The Board also reviewed the fund's performance since inception as well as performance in the current year.
Based on its review, the Board concluded that the nature, extent, and quality of services provided to the fund under the Advisory Contracts should benefit the fund's shareholders.
Competitiveness of Management Fee and Total Expense Ratio. The Board considered the fund's management fee and total expense ratio compared to "mapped groups" of competitive funds and classes. Fidelity creates "mapped groups" by combining similar Lipper investment objective categories that have comparable management fee characteristics. Combining Lipper investment objective categories aids the Board's management fee and total expense ratio comparisons by broadening the competitive group used for comparison and by reducing the number of universes to which various Fidelity funds are compared.
Management Fee. The Board considered two proprietary management fee comparisons for the 12-month periods shown in the chart below. The group of Lipper funds used by the Board for management fee comparisons is referred to below as the "Total Mapped Group." The Total Mapped Group is broader than the Lipper peer group used by the Board for performance comparisons because the Total Mapped Group combines several Lipper investment objective categories while the Lipper peer group does not. The Total Mapped Group comparison focuses on a fund's standing relative to the total universe of comparable funds available to investors in terms of gross management fees before expense reimbursements or caps. "TMG %" represents the percentage of funds in the Total Mapped Group that had management fees that were lower than the fund's. For example, a TMG % of 6% means that 94% of the funds in the Total Mapped Group had higher management fees than the fund. The "Asset-Size Peer Group" (ASPG) comparison focuses on a fund's standing relative to non-Fidelity funds similar in size to the fund within the Total Mapped Group. The ASPG represents at least 15% of the funds in the Total Mapped Group with comparable asset size and management fee characteristics, subject to a minimum of 50 funds (or all funds in the Total Mapped Group if fewer than 50). Additional information, such as the ASPG quartile in which the fund's management fee ranked, is also included in the chart and considered by the Board.
Annual Report
Fidelity Real Estate Income Fund
The Board noted that the fund's management fee ranked below the median of its Total Mapped Group and below the median of its ASPG for 2010.
Based on its review, the Board concluded that the fund's management fee is fair and reasonable in light of the services that the fund receives and the other factors considered.
Annual Report
Board Approval of Investment Advisory Contracts and
Management Fees - continued
Total Expense Ratio. In its review of each class's total expense ratio, the Board considered the fund's management fee as well as other fund or class expenses, as applicable, such as transfer agent fees, pricing and bookkeeping fees, fund-paid 12b-1 fees, and custodial, legal, and audit fees. The Board also noted the effects of any waivers and reimbursements on fees and expenses. As part of its review, the Board also considered the current and historical total expense ratios of each class of the fund compared to competitive fund median expenses. Each class of the fund is compared to those funds and classes in the Total Mapped Group (used by the Board for management fee comparisons) that have a similar sales load structure.
The Board noted that the total expense ratio of each class ranked below its competitive median for the period. The Board considered that various factors, including 12b-1 fees, positive or negative performance adjustments, and relatively higher other expenses in the case of small fund size, can affect total expense ratios.
Fees Charged to Other Fidelity Clients. The Board also considered Fidelity fee structures and other information with respect to clients of FMR and its affiliates, such as other mutual funds advised or subadvised by FMR or its affiliates, pension plan clients, and other institutional clients. In March 2010, the Board created an ad hoc joint committee with the board of other Fidelity funds (the Committee) to review and compare Fidelity's institutional investment advisory business with its business of providing services to the Fidelity funds, including the differences in services provided, fees charged, and costs incurred, as well as competition in their respective marketplaces.
Based on its review of total expense ratios and fees charged to other Fidelity clients, the Board concluded that the total expense ratio of each class of the fund was reasonable in light of the services that the fund and its shareholders receive and the other factors considered, including the findings of the Committee.
Costs of the Services and Profitability. The Board considered the revenues earned and the expenses incurred by Fidelity in conducting the business of developing, marketing, distributing, managing, administering and servicing the fund and its shareholders. The Board also considered the level of Fidelity's profits in respect of all the Fidelity funds.
On an annual basis, FMR presents to the Board Fidelity's profitability for the fund. Fidelity calculates the profitability for each fund, as well as aggregate profitability for groups of Fidelity funds and all Fidelity funds, using a series of detailed revenue and cost allocation methodologies which originate with the books and records of Fidelity on which Fidelity's audited financial statements are based. The Audit Committee of the Board reviews any significant changes from the prior year's methodologies.
PricewaterhouseCoopers LLP (PwC), independent registered public accounting firm and auditor to Fidelity and certain Fidelity funds, has been engaged annually by the Board as part of the Board's assessment of Fidelity's profitability analysis. PwC's engagement includes the review and assessment of Fidelity's methodologies used in determining the revenues and expenses attributable to Fidelity's mutual fund business, and completion of agreed-upon procedures surrounding the mathematical accuracy of fund profitability and its conformity to allocation methodologies. After considering PwC's reports issued under the engagement and information provided by Fidelity, the Board concluded that while other allocation methods may also be reasonable, Fidelity's profitability methodologies are reasonable in all material respects.
Annual Report
The Board also reviewed Fidelity's non-fund businesses and fall-out benefits related to the mutual fund business as well as cases where Fidelity's affiliates may benefit from or be related to the fund's business.
The Board considered the costs of the services provided by and the profits realized by Fidelity in connection with the operation of the fund and was satisfied that the profitability was not excessive in the circumstances.
Economies of Scale. The Board considered whether there have been economies of scale in respect of the management of the Fidelity funds, whether the Fidelity funds (including the fund) have appropriately benefited from any such economies of scale, and whether there is potential for realization of any further economies of scale. The Board considered the extent to which the fund will benefit from economies of scale through increased services to the fund, through waivers or reimbursements, or through fee or expense reductions. The Board also noted that in 2009, it and the board of other Fidelity funds created an ad hoc committee (the Economies of Scale Committee) to analyze whether FMR attains economies of scale in respect of the management and servicing of the Fidelity funds, whether the Fidelity funds have appropriately benefited from such economies of scale, and whether there is potential for realization of any further economies of scale.
The Board recognized that the fund's management contract incorporates a "group fee" structure, which provides for lower group fee rates as total fund assets under FMR's management increase, and for higher group fee rates as total fund assets under FMR's management decrease. FMR calculates the group fee rates based on a tiered asset "breakpoint" schedule that varies based on asset class. The Board considered that the group fee is designed to deliver the benefits of economies of scale to fund shareholders when total Fidelity fund assets increase, even if assets of any particular fund are unchanged or have declined, because some portion of Fidelity's costs are attributable to services provided to all Fidelity funds, and all funds benefit if those costs can be allocated among more assets. The Board concluded that, given the group fee structure, fund shareholders will benefit from lower management fees as assets under FMR's management increase at the fund complex level, regardless of whether Fidelity achieves any such economies of scale.
Annual Report
Board Approval of Investment Advisory Contracts and
Management Fees - continued
The Board concluded, taking into account the analysis of the Economies of Scale Committee, that any potential economies of scale are being appropriately shared between fund shareholders and Fidelity.
Additional Information Requested by the Board. In order to develop fully the factual basis for consideration of the Fidelity funds' Advisory Contracts, the Board requested and received additional information on certain topics, including (i) fund performance trends, actions to be taken by FMR to improve certain funds' overall performance, and Fidelity's long-term strategies for certain funds; (ii) portfolio manager changes that have occurred during the past year and length of portfolio manager tenure for different categories of funds over time; (iii) Fidelity's compensation structure for portfolio managers and other key personnel and strategies for attracting and retaining non-investment personnel; (iv) the amount of the investment that each portfolio manager has made in the Fidelity fund(s) that he or she manages; (v) historical trends in Fidelity's realization of fall-out benefits; (vi) Fidelity's group fee structures and the rationale for the individual fee rates of certain funds; (vii) fund profitability methodology and the impact of certain factors on fund profitability results; (viii) trends regarding industry use of performance fee structures and Fidelity's compliance practices with respect to performance adjustment calculations; (ix) the fee structures in place for certain other Fidelity clients; and (x) explanations regarding the relative total expense ratios of certain funds and classes, total expense competitive trends, and actions that might be taken by FMR to reduce total expense ratios for certain funds and classes.
Based on its evaluation of all of the conclusions noted above, and after considering all factors it believed relevant, the Board ultimately concluded that the advisory fee structures are fair and reasonable, and that the fund's Advisory Contracts should be renewed.
Annual Report
Investment Adviser
Fidelity Management & Research Company
Boston, MA
Investment Sub-Advisers
FMR Co., Inc.
Fidelity Management & Research
(Hong Kong) Limited
Fidelity Management & Research
(Japan) Inc.
Fidelity Management & Research
(U.K.) Inc.
General Distributor
Fidelity Distributors Corporation
Boston, MA
Transfer and Service Agents
Fidelity Investments Institutional Operations Company, Inc.
Boston, MA
Fidelity Service Company, Inc.
Boston, MA
Custodian
Citibank, N.A.
New York, NY
REIA-UANN-0911
1.907548.101

(Fidelity Investment logo)(registered trademark)
Fidelity Advisor®
Real Estate Income
Fund - Institutional Class
Annual Report
July 31, 2011
(2_fidelity_logos) (Registered_Trademark)
Institutional Class
is a class of Fidelity®
Real Estate Income Fund
Contents
Chairman's Message | <Click Here> | The Chairman's message to shareholders. |
Performance | <Click Here> | How the fund has done over time. |
Management's Discussion of Fund Performance | <Click Here> | The Portfolio Manager's review of fund performance and strategy. |
Shareholder Expense Example | <Click Here> | An example of shareholder expenses. |
Investment Changes | <Click Here> | A summary of the fund's holdings. |
Investments | <Click Here> | A complete list of the fund's investments with their market values. |
Financial Statements | <Click Here> | Statements of assets and liabilities, operations, and changes in net assets,
as well as financial highlights. |
Notes | <Click Here> | Notes to the financial statements. |
Report of Independent Registered Public Accounting Firm | <Click Here> | |
Trustees and Officers | <Click Here> | |
Distributions | <Click Here> | |
Board Approval of Investment Advisory Contracts and Management Fees | <Click Here> | |
To view a fund's proxy voting guidelines and proxy voting record for the 12-month period ended June 30, visit http://www.fidelity.com/proxyvotingresults or visit the Securities and Exchange Commission's (SEC) web site at http://www.sec.gov. You may also call 1-877-208-0098 to request a free copy of the proxy voting guidelines.
Standard & Poor's, S&P and S&P 500 are registered service marks of The McGraw-Hill Companies, Inc. and have been licensed for use by Fidelity Distributors Corporation.
Other third party marks appearing herein are the property of their respective owners.
All other marks appearing herein are registered or unregistered trademarks or service marks of FMR LLC or an affiliated company.
Annual Report
This report and the financial statements contained herein are submitted for the general information of the shareholders of the fund. This report is not authorized for distribution to prospective investors in the fund unless preceded or accompanied by an effective prospectus.
A fund files its complete schedule of portfolio holdings with the SEC for the first and third quarters of each fiscal year on Form N-Q. Forms N-Q are available on the SEC's web site at http://www.sec.gov. A fund's Forms N-Q may be reviewed and copied at the SEC's Public Reference Room in Washington, DC. Information regarding the operation of the SEC's Public Reference Room may be obtained by calling 1-800-SEC-0330. For a complete list of a fund's portfolio holdings, view the most recent holdings listing, semiannual report, or annual report on Fidelity's web site at http://www.fidelity.com, http://www.advisor.fidelity.com, or http://www.401k.com, as applicable.
NOT FDIC INSURED • MAY LOSE VALUE • NO BANK GUARANTEE
Neither the fund nor Fidelity Distributors Corporation is a bank.
Annual Report
(photo_of_James_C_Curvey)
Dear Shareholder:
The second half of 2011 began with U.S. equities continuing to give back some of the gains achieved earlier in the year. In the days leading up to July 31, markets were shaken by a political stalemate in which Congress struggled to address the debt ceiling issue before an early-August deadline. The resulting uncertainty held back markets in July, the third consecutive monthly decline for equities, effectively reversing the positive momentum seen through the end of April. Financial markets are always unpredictable, of course, but there are several time-tested investment principles that can help put the odds in your favor.
One of the basic tenets is to invest for the long term. Over time, riding out the markets' inevitable ups and downs has proven much more effective than selling into panic or chasing the hottest trend. Even missing only a few of the markets' best days can significantly diminish investor returns. Patience also affords the benefits of compounding - of earning interest on additional income or reinvested dividends and capital gains. There can be tax advantages and cost benefits to consider as well. While staying the course doesn't eliminate risk, it can considerably lessen the effect of short-term declines.
You can further manage your investing risk through diversification. And today, more than ever, geographic diversification should be taken into account. Studies indicate that asset allocation is the single most important determinant of a portfolio's long-term success. The right mix of stocks, bonds and cash - aligned to your particular risk tolerance and investment objective - is very important. Age-appropriate rebalancing is also an essential aspect of asset allocation. For younger investors, an emphasis on equities - which historically have been the best-performing asset class over time - is encouraged. As investors near their specific goal, such as retirement or sending a child to college, consideration may be given to replacing volatile assets (e.g. common stocks) with more-stable fixed investments (bonds or savings plans).
A third principle - investing regularly - can help lower the average cost of your purchases. Investing a certain amount of money each month or quarter helps ensure you won't pay for all your shares at market highs. This strategy - known as dollar cost averaging - also reduces "emotion" from investing, helping shareholders avoid selling weak performers just prior to an upswing, or chasing a hot performer just before a correction.
We invite you to contact us via the Internet, through our Investor Centers or by phone. It is our privilege to provide you the information you need to make the investments that are right for you.
Sincerely,
(The acting chairman's signature appears here.)
James C. Curvey
Acting Chairman
Annual Report
Average annual total return reflects the change in the value of an investment, assuming reinvestment of the class' distributions from dividend income and capital gains (the profits earned upon the sale of securities that have grown in value, if any) and assuming a constant rate of performance each year. The $10,000 table and the fund's returns do not reflect the deduction of taxes that a shareholder would pay on fund distributions or the redemption of fund shares. During periods of reimbursement by Fidelity, a fund's total return will be greater than it would be had the reimbursement not occurred. How a fund did yesterday is no guarantee of how it will do tomorrow.
Average Annual Total Returns
Periods ended July 31, 2011 | Past 1
year | Past 5
years | Life of
fund A |
Institutional ClassB | 13.44% | 4.83% | 7.38% |
A From February 4, 2003.
B The initial offering of Institutional Class shares took place on April 14, 2010. Returns prior to April 14, 2010 are those of Fidelity® Real Estate Income Fund, the original class of the fund.
$10,000 Over Life of Fund
Let's say hypothetically that $10,000 was invested in Fidelity Advisor® Real Estate Income Fund - Institutional Class on February 4, 2003, when the fund started. The chart shows how the value of your investment would have changed, and also shows how the S&P 500® Index performed over the same period. The initial offering of Institutional Class took place on April 14, 2010. See above for additional information regarding the performance of Institutional Class.
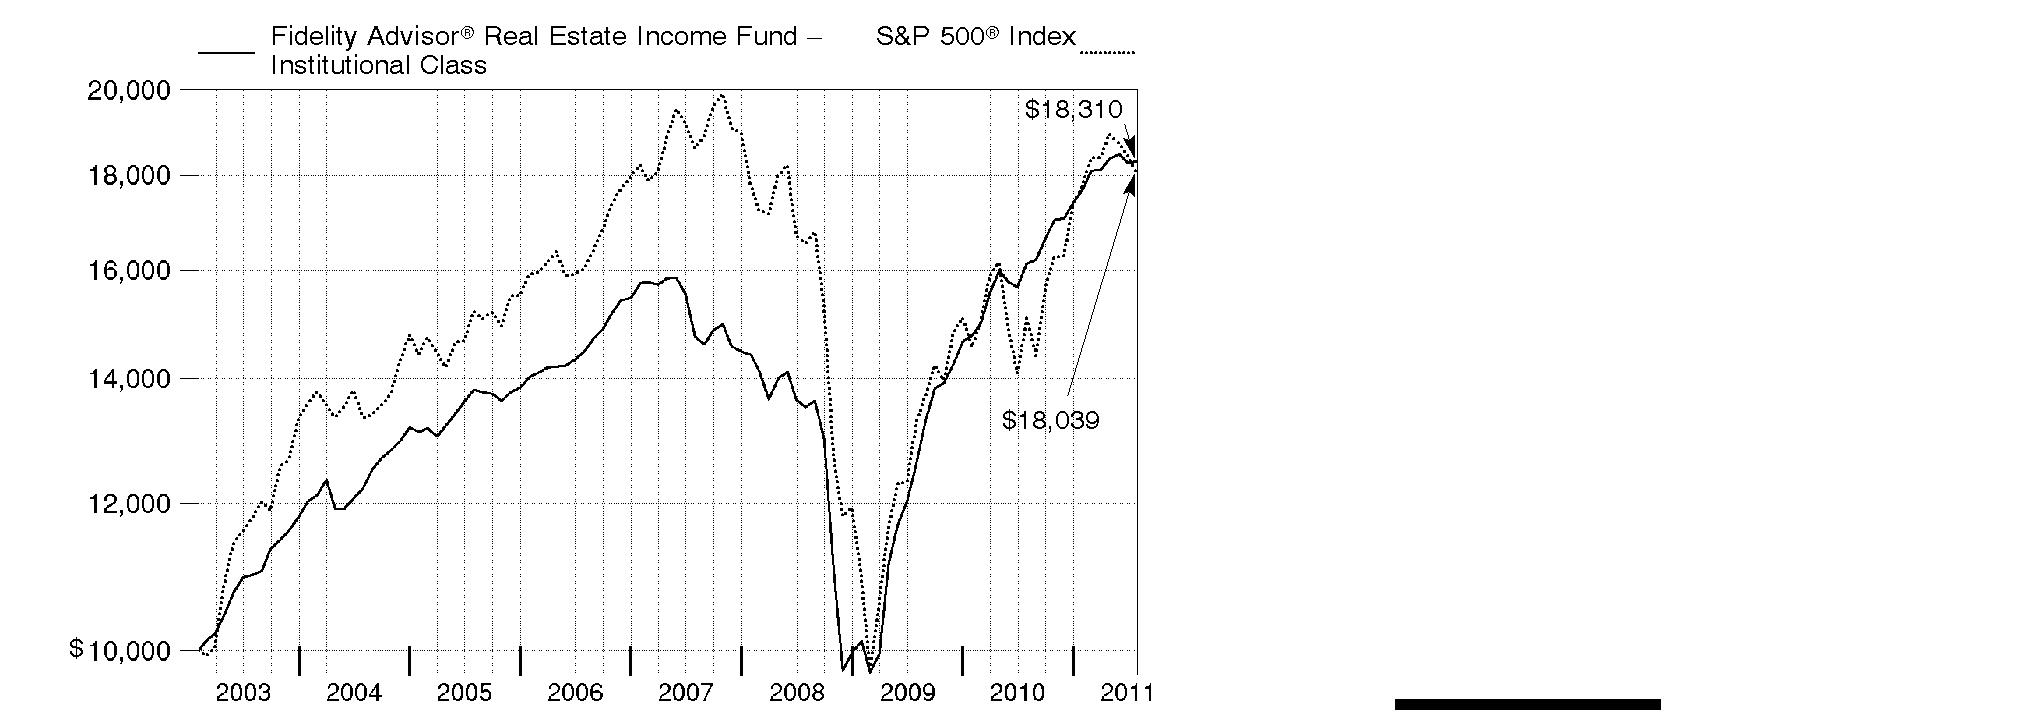
Annual Report
Market Recap: Commercial real estate fundamentals continued to improve throughout the 12-month period ending July 31, 2011, as limited new building activity, good demand and low interest rates helped boost property values. Occupancy levels and rents gradually increased across almost all property types, with the combination helping to push up cash flows. Real estate investment trusts (REITs) that own apartments and retail properties in well-established neighborhoods were well-positioned, as were office companies focused on central business districts, while industrial and suburban office REITs did not enjoy as much upside. Against this backdrop, almost all types of real estate securities generated healthy gains. During the year, real estate common stocks, as measured by the FTSE® NAREIT® All REITs Index, rose 22.37%. Real estate bonds, as measured by The BofA Merrill LynchSM US Real Estate Index - a market-capitalization-weighted measure of the performance of investment-grade public debt of corporate issuers in the domestic real estate sector - rose 10.38%. The MSCI® REIT Preferred Index, which reflects the performance of real estate preferred stocks, rose 12.74%. In comparison, the S&P 500® Index, a proxy for the broad U.S. stock market, gained 19.65%.
Comments from Mark Snyderman, Portfolio Manager of Fidelity Advisor® Real Estate Income Fund: The fund's Institutional Class shares gained 13.44% for the 12 months ending July 31, 2011. In comparison, the Fidelity Real Estate Income Composite Index - a 40/40/20 blend of the MSCI® REIT Preferred Index, The BofA Merrill LynchSM U.S. Real Estate Index and the FTSE® NAREIT® All REITs Index, respectively - did somewhat better, gaining 13.76%. The fund's real estate common stocks were the best-performing securities, gaining about 21%, modestly trailing the average real estate investment trust (REIT) in the NAREIT index. Real estate bonds generated a roughly 13% return, led by commercial mortgage-backed securities (CMBS), which were up approximately 15%. Real estate preferred stocks - the other major category in which the fund invests - also performed well, rising 13% during the year, slightly above the MSCI index. The only major detractor was the fund's cash position of roughly 8%, on average, which earned almost nothing during the year. A notable detractor was the fund's convertible preferred stock holdings in real estate services provider Grubb & Ellis. On the positive side, net lease REIT Lexington Corporate Properties Trust contributed meaningfully. The fund owned this company's common stock, preferred stock and convertible bonds.
The views expressed above reflect those of the portfolio manager(s) only through the end of the period as stated on the cover of this report and do not necessarily represent the views of Fidelity or any other person in the Fidelity organization. Any such views are subject to change at any time based upon market or other conditions and Fidelity disclaims any responsibility to update such views. These views may not be relied on as investment advice and, because investment decisions for a Fidelity fund are based on numerous factors, may not be relied on as an indication of trading intent on behalf of any Fidelity fund.
Annual Report
Shareholder Expense Example
As a shareholder of the Fund, you incur two types of costs: (1) transaction costs, including sales charges (loads) on purchase payments or redemption proceeds, redemption fees, and (2) ongoing costs, including management fees, distribution and/or service (12b-1) fees and other Fund expenses. This Example is intended to help you understand your ongoing costs (in dollars) of investing in the Fund and to compare these costs with the ongoing costs of investing in other mutual funds.
The Example is based on an investment of $1,000 invested at the beginning of the period and held for the entire period (February 1, 2011 to July 31, 2011).
Actual Expenses
The first line of the accompanying table for each class of the Fund provides information about actual account values and actual expenses. You may use the information in this line, together with the amount you invested, to estimate the expenses that you paid over the period. Simply divide your account value by $1,000.00 (for example, an $8,600 account value divided by $1,000.00 = 8.6), then multiply the result by the number in the first line for a class of the Fund under the heading entitled "Expenses Paid During Period" to estimate the expenses you paid on your account during this period. A small balance maintenance fee of $12.00 that is charged once a year may apply for certain accounts with a value of less than $2,000. This fee is not included in the table below. If it was, the estimate of expenses you paid during the period would be higher, and your ending account value lower, by this amount. In addition, the Fund, as a shareholder in the underlying Fidelity Central Funds, will indirectly bear its pro-rata share of the fees and expenses incurred by the underlying Fidelity Central Funds. These fees and expenses are not included in the Fund's annualized expense ratio used to calculate the expense estimate in the table below.
Hypothetical Example for Comparison Purposes
The second line of the accompanying table for each class of the Fund provides information about hypothetical account values and hypothetical expenses based on a Class' actual expense ratio and an assumed rate of return of 5% per year before expenses, which is not the Class' actual return. The hypothetical account values and expenses may not be used to estimate the actual ending account balance or expenses you paid for the period. You may use this information to compare the ongoing costs of investing in the Fund and other funds. To do so, compare this 5% hypothetical example with the 5% hypothetical examples that appear in the shareholder reports of the other funds. A small balance maintenance fee of $12.00 that is charged once a year may apply for certain accounts with a value of less than $2,000. This fee is not included in the table below. If it was, the estimate of expenses you paid during the period would be higher, and your ending account value lower, by this amount. In addition, the Fund, as a shareholder in the underlying Fidelity Central Funds, will indirectly bear its pro-rata share of the fees and expenses incurred by the underlying Fidelity Central Funds. These fees and expenses are not included in the Fund's annualized expense ratio used to calculate the expense estimate in the table below.
Please note that the expenses shown in the table are meant to highlight your ongoing costs only and do not reflect any transaction costs. Therefore, the second line of the table is useful in comparing ongoing costs only, and will not help you determine the relative total costs of owning different funds. In addition, if these transactional costs were included, your costs would have been higher.
Annual Report
| Annualized
Expense Ratio | Beginning
Account Value
February 1, 2011 | Ending
Account Value
July 31, 2011 | Expenses Paid
During Period*
February 1, 2011 to July 31, 2011 |
Class A | 1.12% | | | |
Actual | | $ 1,000.00 | $ 1,035.30 | $ 5.65 |
HypotheticalA | | $ 1,000.00 | $ 1,019.24 | $ 5.61 |
Class T | 1.15% | | | |
Actual | | $ 1,000.00 | $ 1,034.20 | $ 5.80 |
HypotheticalA | | $ 1,000.00 | $ 1,019.09 | $ 5.76 |
Class C | 1.88% | | | |
Actual | | $ 1,000.00 | $ 1,030.00 | $ 9.46 |
HypotheticalA | | $ 1,000.00 | $ 1,015.47 | $ 9.39 |
Real Estate Income | .90% | | | |
Actual | | $ 1,000.00 | $ 1,035.70 | $ 4.54 |
HypotheticalA | | $ 1,000.00 | $ 1,020.33 | $ 4.51 |
Institutional Class | .88% | | | |
Actual | | $ 1,000.00 | $ 1,035.10 | $ 4.44 |
HypotheticalA | | $ 1,000.00 | $ 1,020.43 | $ 4.41 |
A 5% return per year before expenses
* Expenses are equal to each Class' annualized expense ratio, multiplied by the average account value over the period, multiplied by 181/365 (to reflect the one-half year period).
Annual Report
Investment Changes (Unaudited)
Top Five Stocks as of July 31, 2011 |
| % of fund's
net assets | % of fund's net assets
6 months ago |
Ventas, Inc. | 1.9 | 1.7 |
Acadia Realty Trust (SBI) | 1.6 | 1.4 |
MFA Financial, Inc. | 1.5 | 1.6 |
Equity Lifestyle Properties, Inc. | 1.3 | 1.2 |
Prologis, Inc. | 1.2 | 0.0 |
| 7.5 | |
Top 5 Bonds as of July 31, 2011 |
| % of fund's
net assets | % of fund's net assets
6 months ago |
Banc of America Large Loan Trust floater Series 2010-HLTN Class HLTN, 1.937% 11/15/15 | 2.4 | 1.4 |
Wachovia Ltd./Wachovia LLC Series 2006-1A Class A1A, 0.5065% 9/25/26 | 1.0 | 0.1 |
M/I Homes, Inc. 8.625% 11/15/18 | 0.9 | 0.0 |
Lexington Master Ltd. Partnership 5.45% 1/15/27 | 0.8 | 1.0 |
Cbre Realty Finance Cdo 2007-1/LLC 0.4958% 4/7/52 | 0.8 | 0.3 |
| 5.9 | |
Top Five REIT Sectors as of July 31, 2011 |
| % of fund's
net assets | % of fund's net assets
6 months ago |
REITs - Shopping Centers | 6.5 | 9.6 |
REITs - Health Care Facilities | 6.2 | 8.4 |
REITs - Management/Investment | 5.5 | 7.1 |
REITs - Mortgage | 5.5 | 6.8 |
REITs - Industrial Buildings | 3.4 | 5.7 |
Asset Allocation (% of fund's net assets) |
As of July 31, 2011* | As of January 31, 2011** |
| Common Stocks 23.4% | | | Common Stocks 25.9% | |
| Preferred Stocks 9.7% | | | Preferred Stocks 8.6% | |
| Bonds 48.0% | | | Bonds 45.8% | |
| Convertible
Securities 7.1% | | | Convertible
Securities 8.8% | |
| Other Investments 4.0% | | | Other Investments 2.2% | |
| Short-Term
Investments and
Net Other Assets 7.8% | | | Short-Term
Investments and
Net Other Assets 8.7% | |
* Foreign investments | 6.3% | | ** Foreign investments | 3.3% | |
Annual Report
Investments July 31, 2011
Showing Percentage of Net Assets
Common Stocks - 23.4% |
| Shares | | Value |
CONSUMER DISCRETIONARY - 0.9% |
Hotels, Restaurants & Leisure - 0.3% |
Starwood Hotels & Resorts Worldwide, Inc. | 84,100 | | $ 4,622,136 |
Household Durables - 0.6% |
Standard Pacific Corp. (a)(f) | 2,760,000 | | 7,893,600 |
Stanley Martin Communities LLC Class B (a) | 4,620 | | 3,528,571 |
| | 11,422,171 |
TOTAL CONSUMER DISCRETIONARY | | 16,044,307 |
FINANCIALS - 21.2% |
Capital Markets - 0.4% |
HFF, Inc. (a) | 546,564 | | 8,253,116 |
Real Estate Investment Trusts - 20.7% |
Acadia Realty Trust (SBI) | 1,342,149 | | 28,171,708 |
Alexandria Real Estate Equities, Inc. | 61,100 | | 5,010,200 |
American Campus Communities, Inc. | 258,700 | | 9,628,814 |
American Capital Agency Corp. | 105,300 | | 2,939,976 |
Annaly Capital Management, Inc. | 217,250 | | 3,645,455 |
Anworth Mortgage Asset Corp. | 793,610 | | 5,499,717 |
AvalonBay Communities, Inc. (f) | 39,225 | | 5,263,603 |
Brandywine Realty Trust (SBI) | 295,700 | | 3,545,443 |
Canadian (REIT) | 107,800 | | 3,765,215 |
CapLease, Inc. | 1,239,200 | | 5,514,440 |
CBL & Associates Properties, Inc. | 325,073 | | 5,773,296 |
Cedar Shopping Centers, Inc. | 271,400 | | 1,346,144 |
Chartwell Seniors Housing (REIT) (f) | 394,700 | | 3,247,166 |
Chesapeake Lodging Trust | 203,500 | | 3,357,750 |
CommonWealth REIT | 111,700 | | 2,638,354 |
Coresite Realty Corp. | 177,500 | | 2,989,100 |
Cypress Sharpridge Investments, Inc. (f) | 640,539 | | 7,885,035 |
DCT Industrial Trust, Inc. | 960,000 | | 5,203,200 |
DiamondRock Hospitality Co. | 386,100 | | 3,945,942 |
Duke Realty LP | 388,583 | | 5,455,705 |
Dynex Capital, Inc. | 1,191,386 | | 10,841,613 |
Education Realty Trust, Inc. | 140,600 | | 1,234,468 |
Equity Lifestyle Properties, Inc. | 352,930 | | 22,996,919 |
Equity Residential (SBI) | 94,900 | | 5,866,718 |
Excel Trust, Inc. | 632,228 | | 7,251,655 |
H&R REIT/H&R Finance Trust | 206,500 | | 4,748,592 |
HCP, Inc. | 241,900 | | 8,884,987 |
Healthcare Realty Trust, Inc. | 206,300 | | 4,043,480 |
Common Stocks - continued |
| Shares | | Value |
FINANCIALS - continued |
Real Estate Investment Trusts - continued |
Highwoods Properties, Inc. (SBI) | 64,300 | | $ 2,213,849 |
Hospitality Properties Trust (SBI) | 106,400 | | 2,686,600 |
Lexington Corporate Properties Trust (f) | 837,000 | | 7,030,800 |
LTC Properties, Inc. | 247,313 | | 6,714,548 |
MFA Financial, Inc. | 3,579,381 | | 26,809,564 |
Mid-America Apartment Communities, Inc. | 64,600 | | 4,573,034 |
Monmouth Real Estate Investment Corp. Class A | 455,073 | | 3,749,802 |
National Health Investors, Inc. | 148,006 | | 6,732,793 |
National Retail Properties, Inc. | 234,500 | | 5,883,605 |
Omega Healthcare Investors, Inc. (f) | 214,000 | | 4,202,960 |
Pebblebrook Hotel Trust | 239,182 | | 4,728,628 |
Prologis, Inc. | 594,487 | | 21,181,572 |
Regency Centers Corp. | 55,100 | | 2,475,092 |
RioCan (REIT) | 150,900 | | 4,100,234 |
Senior Housing Properties Trust (SBI) | 151,700 | | 3,631,698 |
Simon Property Group, Inc. | 125,801 | | 15,160,279 |
Stag Industrial, Inc. (f) | 382,692 | | 4,703,285 |
Summit Hotel Properties, Inc. | 579,400 | | 6,535,632 |
Sunstone Hotel Investors, Inc. (a) | 450,000 | | 4,009,500 |
Two Harbors Investment Corp. | 467,980 | | 4,586,204 |
Ventas, Inc. (f) | 637,146 | | 34,488,713 |
Weyerhaeuser Co. | 454,429 | | 9,084,036 |
Whitestone REIT Class B (f) | 379,067 | | 4,776,244 |
| | 370,753,367 |
Real Estate Management & Development - 0.1% |
Brookfield Asset Management, Inc. Class A | 51,000 | | 1,606,762 |
Thrifts & Mortgage Finance - 0.0% |
Wrightwood Capital LLC warrants 7/31/14 (a)(g) | 60,681 | | 607 |
TOTAL FINANCIALS | | 380,613,852 |
HEALTH CARE - 1.3% |
Health Care Providers & Services - 1.3% |
Brookdale Senior Living, Inc. (a) | 541,600 | | 11,584,824 |
Capital Senior Living Corp. (a) | 587,750 | | 5,166,323 |
Emeritus Corp. (a) | 333,693 | | 6,557,067 |
| | 23,308,214 |
TOTAL COMMON STOCKS (Cost $361,094,507) | 419,966,373 |
Preferred Stocks - 11.4% |
| Shares | | Value |
Convertible Preferred Stocks - 1.7% |
FINANCIALS - 1.7% |
Real Estate Investment Trusts - 1.6% |
Alexandria Real Estate Equities, Inc. Series D 7.00% | 95,000 | | $ 2,493,750 |
CommonWealth REIT 6.50% | 150,000 | | 3,268,500 |
Excel Trust, Inc. 7.00% (g) | 248,200 | | 5,879,238 |
Health Care REIT, Inc. Series I, 6.50% | 30,000 | | 1,578,750 |
Lexington Corporate Properties Trust Series C 6.50% | 328,036 | | 14,174,436 |
Ramco-Gershenson Properties Trust (SBI) Series D, 7.25% | 40,000 | | 1,992,400 |
| | 29,387,074 |
Real Estate Management & Development - 0.1% |
Grubb & Ellis Co. 12.00% (g) | 27,500 | | 1,447,875 |
TOTAL FINANCIALS | | 30,834,949 |
Nonconvertible Preferred Stocks - 9.7% |
CONSUMER DISCRETIONARY - 0.1% |
Household Durables - 0.1% |
M/I Homes, Inc. Series A, 9.75% (a) | 38,200 | | 611,200 |
FINANCIALS - 9.6% |
Diversified Financial Services - 0.2% |
DRA CRT Acquisition Corp. Series A, 8.50% | 25,000 | | 475,000 |
Red Lion Hotels Capital Trust 9.50% | 163,225 | | 4,136,122 |
| | 4,611,122 |
Real Estate Investment Trusts - 9.3% |
Alexandria Real Estate Equities, Inc. Series C, 8.375% | 67,000 | | 1,722,570 |
American Home Mortgage Investment Corp.: | | | |
Series A, 9.375% (a) | 120,300 | | 12 |
Series B, 9.25% (a) | 124,100 | | 124 |
Annaly Capital Management, Inc. Series A, 7.875% | 161,300 | | 4,151,862 |
Anworth Mortgage Asset Corp. Series A, 8.625% | 309,630 | | 7,799,580 |
Apartment Investment & Management Co.: | | | |
Series T, 8.00% | 57,500 | | 1,447,275 |
Series U, 7.75% | 150,773 | | 3,790,433 |
Brandywine Realty Trust Series C, 7.50% | 37,615 | | 933,228 |
CapLease, Inc. Series A, 8.125% | 83,400 | | 2,064,150 |
Preferred Stocks - continued |
| Shares | | Value |
Nonconvertible Preferred Stocks - continued |
FINANCIALS - continued |
Real Estate Investment Trusts - continued |
CBL & Associates Properties, Inc.: | | | |
(depositary shares) Series C, 7.75% | 47,962 | | $ 1,196,652 |
7.375% | 165,688 | | 4,069,297 |
Cedar Shopping Centers, Inc. 8.875% | 290,352 | | 7,302,353 |
CenterPoint Properties Trust Series D, 5.377% | 3,575 | | 2,180,750 |
Cogdell Spencer, Inc. 8.50% | 114,300 | | 2,858,643 |
Corporate Office Properties Trust Series H, 7.50% | 5,000 | | 125,300 |
Cousins Properties, Inc. Series A, 7.75% | 93,230 | | 2,313,036 |
Duke Realty LP: | | | |
8.375% | 128,517 | | 3,333,731 |
Series L, 6.60% | 10,666 | | 257,051 |
Eagle Hospitality Properties Trust, Inc. 8.25% (a) | 24,000 | | 150,000 |
Equity Lifestyle Properties, Inc. 8.034% | 790,078 | | 19,917,866 |
Essex Property Trust, Inc. Series H, 7.125% | 40,000 | | 1,014,400 |
First Potomac Realty Trust 7.75% | 80,000 | | 2,032,000 |
Glimcher Realty Trust Series G, 8.125% | 171,111 | | 4,156,286 |
Hersha Hospitality Trust Series B, 8.00% | 80,000 | | 1,936,800 |
HomeBanc Mortgage Corp. Series A (a) | 104,685 | | 1 |
Hospitality Properties Trust: | | | |
Series B, 8.875% | 88,600 | | 2,255,756 |
Series C, 7.00% | 58,500 | | 1,428,570 |
Hudson Pacific Properties, Inc. 8.375% | 263,800 | | 6,769,108 |
Kimco Realty Corp. Series G, 7.75% | 113,026 | | 2,929,634 |
Kite Realty Group Trust 8.25% | 96,100 | | 2,383,280 |
LaSalle Hotel Properties: | | | |
Series E, 8.00% | 50,468 | | 1,268,766 |
Series G, 7.25% | 114,485 | | 2,799,158 |
Series H, 7.50% | 100,000 | | 2,464,000 |
LBA Realty Fund II: | | | |
Series A, 8.75% (a) | 69,000 | | 2,760,000 |
Series B, 7.625% (a) | 31,240 | | 687,280 |
Lexington Corporate Properties Trust Series B, 8.05% | 40,300 | | 1,004,679 |
Lexington Realty Trust 7.55% | 23,800 | | 585,480 |
MFA Financial, Inc. Series A, 8.50% | 471,886 | | 11,938,716 |
Monmouth Real Estate Investment Corp. 7.625% | 80,000 | | 2,002,400 |
Newcastle Investment Corp. Series B, 9.75% | 31,530 | | 785,097 |
Parkway Properties, Inc. Series D, 8.00% | 237,900 | | 5,947,500 |
Pebblebrook Hotel Trust Series A, 7.875% | 350,000 | | 8,837,500 |
Prologis, Inc. Series Q, 8.54% | 94,446 | | 5,398,184 |
Preferred Stocks - continued |
| Shares | | Value |
Nonconvertible Preferred Stocks - continued |
FINANCIALS - continued |
Real Estate Investment Trusts - continued |
PS Business Parks, Inc.: | | | |
(depositary shares) Series H, 7.00% | 13,300 | | $ 333,165 |
6.875% | 50,000 | | 1,253,000 |
7.20% | 83,040 | | 2,095,930 |
7.375% | 100,610 | | 2,510,220 |
Series P, 6.70% | 36,000 | | 900,000 |
Public Storage: | | | |
Series K, 7.25% | 147,639 | | 3,724,932 |
Series N, 7.00% | 4,200 | | 108,822 |
Regency Centers Corp.: | | | |
7.25% | 10,500 | | 262,920 |
Series C 7.45% | 18,000 | | 450,540 |
Saul Centers, Inc.: | | | |
8.00% | 93,700 | | 2,354,681 |
Series B (depositary shares) 9.00% | 118,550 | | 3,173,584 |
Sunstone Hotel Investors, Inc. Series A, 8.00% | 102,200 | | 2,474,262 |
UMH Properties, Inc. Series A, 8.25% | 310,000 | | 8,029,000 |
Vornado Realty Trust 6.75% | 20,000 | | 498,400 |
Weingarten Realty Investors (SBI) Series F, 6.50% | 56,230 | | 1,389,443 |
| | 166,557,407 |
Real Estate Management & Development - 0.1% |
Vornado Realty LP 7.875% | 54,682 | | 1,454,541 |
TOTAL FINANCIALS | | 172,623,070 |
TOTAL NONCONVERTIBLE PREFERRED STOCKS | | 173,234,270 |
TOTAL PREFERRED STOCKS (Cost $206,439,030) | 204,069,219 |
Corporate Bonds - 26.6% |
| Principal Amount (e) | | |
Convertible Bonds - 5.4% |
CONSUMER DISCRETIONARY - 0.0% |
Hotels, Restaurants & Leisure - 0.0% |
Morgans Hotel Group Co. 2.375% 10/15/14 | | $ 1,340,000 | | 1,157,425 |
Corporate Bonds - continued |
| Principal Amount (e) | | Value |
Convertible Bonds - continued |
FINANCIALS - 5.4% |
Real Estate Investment Trusts - 2.8% |
Acadia Realty Trust 3.75% 12/15/26 | | $ 11,505,000 | | $ 11,598,478 |
Annaly Capital Management, Inc. 4% 2/15/15 | | 1,000,000 | | 1,147,500 |
CapLease, Inc. 7.5% 10/1/27 (g) | | 5,180,000 | | 5,231,800 |
Developers Diversified Realty Corp. 1.75% 11/15/40 | | 1,000,000 | | 1,070,700 |
Hospitality Properties Trust 3.8% 3/15/27 | | 6,100,000 | | 6,100,000 |
Inland Real Estate Corp. 4.625% 11/15/26 | | 10,870,000 | | 10,842,825 |
ProLogis LP: | | | | |
1.875% 11/15/37 | | 2,450,000 | | 2,428,563 |
2.625% 5/15/38 | | 1,500,000 | | 1,492,500 |
The Macerich Co. 3.25% 3/15/12 (g) | | 4,800,000 | | 4,809,000 |
United Dominion Realty Trust, Inc. 3.625% 9/15/11 | | 5,500,000 | | 5,555,000 |
| | 50,276,366 |
Real Estate Management & Development - 2.6% |
BioMed Realty LP 4.5% 10/1/26 (g) | | 2,500,000 | | 2,518,750 |
City Center 8.75% 7/1/13 (i) | | 8,000,000 | | 7,984,800 |
Corporate Office Properties LP: | | | | |
3.5% 9/15/26 (g) | | 3,280,000 | | 3,280,000 |
4.25% 4/15/30 (g) | | 2,000,000 | | 1,982,800 |
Duke Realty LP 3.75% 12/1/11 (g) | | 2,650,000 | | 2,676,500 |
First Potomac Realty Investment LP 4% 12/15/11 (g) | | 2,600,000 | | 2,600,000 |
Grubb & Ellis Co. 7.95% 5/1/15 (g) | | 5,500,000 | | 4,662,900 |
Home Properties, Inc. 4.125% 11/1/26 (g) | | 2,100,000 | | 2,118,375 |
Kilroy Realty LP 3.25% 4/15/12 (g) | | 2,185,000 | | 2,191,828 |
Lexington Master Ltd. Partnership 5.45% 1/15/27 (g) | | 14,950,000 | | 15,006,063 |
SL Green Realty Corp. 3% 3/30/27 (g) | | 500,000 | | 500,000 |
| | 45,522,016 |
TOTAL FINANCIALS | | 95,798,382 |
TOTAL CONVERTIBLE BONDS | | 96,955,807 |
Nonconvertible Bonds - 21.2% |
CONSUMER DISCRETIONARY - 6.4% |
Hotels, Restaurants & Leisure - 0.9% |
CityCenter Holdings LLC/CityCenter Finance Corp. 7.625% 1/15/16 (g) | | 1,945,000 | | 2,027,663 |
GWR Operating Partnership LLP/Great Wolf Finance Corp. 10.875% 4/1/17 | | 1,700,000 | | 1,853,000 |
Corporate Bonds - continued |
| Principal Amount (e) | | Value |
Nonconvertible Bonds - continued |
CONSUMER DISCRETIONARY - continued |
Hotels, Restaurants & Leisure - continued |
Landry's Restaurants, Inc.: | | | | |
11.625% 12/1/15 | | $ 1,000,000 | | $ 1,085,000 |
11.625% 12/1/15 (g) | | 325,000 | | 352,625 |
Times Square Hotel Trust 8.528% 8/1/26 (g) | | 8,964,068 | | 10,697,818 |
| | 16,016,106 |
Household Durables - 5.0% |
KB Home: | | | | |
5.75% 2/1/14 | | 510,000 | | 501,075 |
5.875% 1/15/15 | | 5,000,000 | | 4,675,000 |
6.25% 6/15/15 | | 8,500,000 | | 8,011,250 |
7.25% 6/15/18 | | 2,840,000 | | 2,570,200 |
9.1% 9/15/17 | | 9,625,000 | | 9,576,875 |
Lennar Corp.: | | | | |
5.5% 9/1/14 | | 1,000,000 | | 1,010,000 |
5.6% 5/31/15 | | 5,000,000 | | 4,950,000 |
6.5% 4/15/16 | | 4,000,000 | | 4,000,000 |
6.95% 6/1/18 | | 11,000,000 | | 10,780,000 |
M/I Homes, Inc.: | | | | |
6.875% 4/1/12 | | 2,150,000 | | 2,182,250 |
8.625% 11/15/18 | | 16,880,000 | | 16,626,800 |
Meritage Homes Corp.: | | | | |
6.25% 3/15/15 | | 2,500,000 | | 2,484,375 |
7.15% 4/15/20 | | 1,500,000 | | 1,485,000 |
Ryland Group, Inc. 8.4% 5/15/17 | | 745,000 | | 812,050 |
Standard Pacific Corp.: | | | | |
7% 8/15/15 | | 4,000,000 | | 4,150,000 |
8.375% 5/15/18 | | 12,088,000 | | 12,118,220 |
10.75% 9/15/16 | | 3,000,000 | | 3,420,000 |
| | 89,353,095 |
Multiline Retail - 0.4% |
Sears Holdings Corp. 6.625% 10/15/18 (g) | | 7,065,000 | | 6,499,800 |
Specialty Retail - 0.1% |
Toys 'R' Us Property Co. I LLC 10.75% 7/15/17 | | 2,490,000 | | 2,801,250 |
TOTAL CONSUMER DISCRETIONARY | | 114,670,251 |
Corporate Bonds - continued |
| Principal Amount (e) | | Value |
Nonconvertible Bonds - continued |
CONSUMER STAPLES - 0.3% |
Food & Staples Retailing - 0.3% |
Ahold Lease Series 2001 A1 pass thru trust certificates 7.82% 1/2/20 | | $ 1,195,175 | | $ 1,320,669 |
C&S Group Enterprises LLC 8.375% 5/1/17 (g) | | 4,400,000 | | 4,565,000 |
| | 5,885,669 |
FINANCIALS - 13.5% |
Commercial Banks - 0.1% |
CapitalSource, Inc. 12.75% 7/15/14 (g) | | 1,500,000 | | 1,800,000 |
Diversified Financial Services - 0.6% |
Icahn Enterprises LP/Icahn Enterprises Finance Corp. 7.75% 1/15/16 | | 10,820,000 | | 11,225,750 |
Real Estate Investment Trusts - 8.1% |
Camden Property Trust 5% 6/15/15 | | 1,100,000 | | 1,204,126 |
Commercial Net Lease Realty, Inc.: | | | | |
6.15% 12/15/15 | | 2,526,000 | | 2,793,448 |
6.25% 6/15/14 | | 5,005,000 | | 5,474,224 |
Developers Diversified Realty Corp.: | | | | |
5.375% 10/15/12 | | 500,000 | | 514,388 |
5.5% 5/1/15 | | 2,000,000 | | 2,157,226 |
7.5% 4/1/17 | | 6,000,000 | | 6,932,370 |
7.5% 7/15/18 | | 5,271,000 | | 6,013,889 |
7.875% 9/1/20 | | 4,637,000 | | 5,489,072 |
9.625% 3/15/16 | | 3,836,000 | | 4,697,178 |
Equity One, Inc.: | | | | |
5.375% 10/15/15 | | 3,500,000 | | 3,744,608 |
6.25% 12/15/14 | | 4,081,000 | | 4,485,178 |
6.25% 1/15/17 | | 3,000,000 | | 3,298,572 |
HCP, Inc. 3.75% 2/1/16 | | 2,000,000 | | 2,072,860 |
Health Care Property Investors, Inc.: | | | | |
6% 3/1/15 | | 1,000,000 | | 1,107,116 |
6.3% 9/15/16 | | 5,250,000 | | 5,967,182 |
7.072% 6/8/15 | | 1,500,000 | | 1,703,930 |
Health Care REIT, Inc.: | | | | |
6% 11/15/13 | | 1,000,000 | | 1,084,039 |
6.2% 6/1/16 | | 750,000 | | 849,872 |
Healthcare Realty Trust, Inc.: | | | | |
5.125% 4/1/14 | | 3,650,000 | | 3,897,010 |
6.5% 1/17/17 | | 1,875,000 | | 2,130,191 |
HMB Capital Trust V 3.847% 12/15/36 (d)(g)(i) | | 2,530,000 | | 0 |
Corporate Bonds - continued |
| Principal Amount (e) | | Value |
Nonconvertible Bonds - continued |
FINANCIALS - continued |
Real Estate Investment Trusts - continued |
Hospitality Properties Trust: | | | | |
5.625% 3/15/17 | | $ 915,000 | | $ 959,986 |
6.75% 2/15/13 | | 610,000 | | 636,954 |
7.875% 8/15/14 | | 1,000,000 | | 1,134,415 |
HRPT Properties Trust: | | | | |
5.75% 11/1/15 | | 3,600,000 | | 3,894,545 |
6.25% 8/15/16 | | 1,500,000 | | 1,669,115 |
6.5% 1/15/13 | | 200,000 | | 206,863 |
iStar Financial, Inc.: | | | | |
5.875% 3/15/16 | | 3,000,000 | | 2,617,500 |
5.95% 10/15/13 | | 5,330,000 | | 5,010,200 |
6.05% 4/15/15 | | 4,725,000 | | 4,347,000 |
Kimco Realty Corp. 5.783% 3/15/16 | | 450,000 | | 505,254 |
MPT Operating Partnership LP/MPT Finance Corp. 6.875% 5/1/21 (g) | | 2,000,000 | | 1,955,000 |
Nationwide Health Properties, Inc.: | | | | |
6% 5/20/15 | | 3,122,000 | | 3,459,164 |
6.25% 2/1/13 | | 1,000,000 | | 1,065,264 |
8.25% 7/1/12 | | 1,300,000 | | 1,356,306 |
Omega Healthcare Investors, Inc.: | | | | |
6.75% 10/15/22 | | 2,115,000 | | 2,152,013 |
7% 1/15/16 | | 1,295,000 | | 1,340,325 |
7.5% 2/15/20 | | 1,000,000 | | 1,065,000 |
Pan Pacific Retail Properties, Inc. 5.95% 6/1/14 | | 1,750,000 | | 1,935,015 |
Potlatch Corp. 7.5% 11/1/19 | | 1,000,000 | | 1,040,000 |
ProLogis LP: | | | | |
6.25% 3/15/17 | | 4,000,000 | | 4,499,508 |
6.625% 5/15/18 | | 6,480,000 | | 7,350,426 |
7.625% 7/1/17 | | 4,690,000 | | 5,550,939 |
Reckson Operating Partnership LP/SL Green Realty Corp./SL Green Operating Partnership LP 7.75% 3/15/20 | | 2,000,000 | | 2,318,400 |
Senior Housing Properties Trust: | | | | |
4.3% 1/15/16 | | 5,000,000 | | 5,126,080 |
6.75% 4/15/20 | | 2,000,000 | | 2,185,680 |
8.625% 1/15/12 | | 5,900,000 | | 6,069,094 |
UDR, Inc. 5.5% 4/1/14 | | 500,000 | | 537,947 |
United Dominion Realty Trust, Inc.: | | | | |
5.13% 1/15/14 | | 500,000 | | 532,090 |
Corporate Bonds - continued |
| Principal Amount (e) | | Value |
Nonconvertible Bonds - continued |
FINANCIALS - continued |
Real Estate Investment Trusts - continued |
United Dominion Realty Trust, Inc.: - continued | | | | |
5.25% 1/15/15 | | $ 1,000,000 | | $ 1,081,156 |
5.25% 1/15/16 | | 4,000,000 | | 4,295,948 |
Weingarten Realty Investors 4.857% 1/15/14 | | 2,500,000 | | 2,668,495 |
| | 144,182,161 |
Real Estate Management & Development - 4.6% |
AMB Property LP 5.9% 8/15/13 | | 400,000 | | 428,900 |
BioMed Realty LP 3.85% 4/15/16 | | 2,000,000 | | 2,050,064 |
Brandywine Operating Partnership LP: | | | | |
5.4% 11/1/14 | | 6,750,000 | | 7,269,899 |
5.75% 4/1/12 | | 1,000,000 | | 1,026,487 |
7.5% 5/15/15 | | 1,000,000 | | 1,158,969 |
CB Richard Ellis Services, Inc.: | | | | |
6.625% 10/15/20 | | 1,205,000 | | 1,232,113 |
11.625% 6/15/17 | | 1,500,000 | | 1,740,000 |
Colonial Properties Trust: | | | | |
6.15% 4/15/13 | | 1,500,000 | | 1,576,538 |
6.25% 6/15/14 | | 3,094,000 | | 3,333,528 |
6.875% 8/15/12 | | 1,000,000 | | 1,038,582 |
Colonial Realty LP 6.05% 9/1/16 | | 2,500,000 | | 2,658,675 |
Duke Realty LP: | | | | |
6.25% 5/15/13 | | 750,000 | | 806,309 |
7.375% 2/15/15 | | 1,500,000 | | 1,725,500 |
Forest City Enterprises, Inc.: | | | | |
6.5% 2/1/17 | | 15,120,000 | | 14,326,200 |
7.625% 6/1/15 | | 4,180,000 | | 4,159,100 |
Highwoods/Forsyth LP 5.85% 3/15/17 | | 2,800,000 | | 3,102,655 |
Host Hotels & Resorts, Inc.: | | | | |
5.875% 6/15/19 (g) | | 2,725,000 | | 2,779,500 |
6.875% 11/1/14 | | 500,000 | | 511,250 |
9% 5/15/17 | | 750,000 | | 843,750 |
Liberty Property LP 6.375% 8/15/12 | | 2,679,000 | | 2,806,727 |
Post Apartment Homes LP: | | | | |
5.45% 6/1/12 | | 713,000 | | 731,921 |
6.3% 6/1/13 | | 2,000,000 | | 2,140,672 |
Realogy Corp. 7.875% 2/15/19 (g) | | 2,035,000 | | 2,004,475 |
Regency Centers LP: | | | | |
5.25% 8/1/15 | | 4,509,000 | | 4,966,542 |
Corporate Bonds - continued |
| Principal Amount (e) | | Value |
Nonconvertible Bonds - continued |
FINANCIALS - continued |
Real Estate Management & Development - continued |
Regency Centers LP: - continued | | | | |
5.875% 6/15/17 | | $ 400,000 | | $ 451,781 |
Toys 'R' Us Property Co. II LLC 8.5% 12/1/17 | | 1,000,000 | | 1,070,000 |
Ventas Realty LP: | | | | |
Series 1, 6.5% 6/1/16 | | 11,370,000 | | 11,808,825 |
3.125% 11/30/15 | | 1,500,000 | | 1,527,668 |
Wells Operating Partnership II LP 5.875% 4/1/18 (g) | | 3,000,000 | | 3,196,224 |
| | 82,472,854 |
Thrifts & Mortgage Finance - 0.1% |
Wrightwood Capital LLC 9% 6/1/14 (d)(g) | | 4,000,000 | | 1,400,000 |
TOTAL FINANCIALS | | 241,080,765 |
HEALTH CARE - 1.0% |
Health Care Equipment & Supplies - 0.3% |
Aviv Healthcare Properties LP 7.75% 2/15/19 (g) | | 5,290,000 | | 5,382,575 |
Health Care Providers & Services - 0.7% |
Sabra Health Care LP/Sabra Capital Corp. 8.125% 11/1/18 | | 9,245,000 | | 9,383,675 |
Skilled Healthcare Group, Inc. 11% 1/15/14 | | 3,080,000 | | 3,164,700 |
| | 12,548,375 |
TOTAL HEALTH CARE | | 17,930,950 |
TOTAL NONCONVERTIBLE BONDS | | 379,567,635 |
TOTAL CORPORATE BONDS (Cost $448,273,114) | 476,523,442 |
Asset-Backed Securities - 6.0% |
|
Anthracite CDO I Ltd. Series 2002-CIBA Class B, 6.633% 5/24/37 (g) | | 1,384,000 | | 1,356,320 |
Anthracite CDO III Ltd./Anthracite CDO III Corp. Series 2004-1A Class A, 0.5473% 3/23/19 (g)(i) | | 327,274 | | 281,456 |
Capital Trust RE CDO Ltd. Series 2005-1A Class D, 1.6863% 3/20/50 (g)(i) | | 2,250,000 | | 101,250 |
Capital Trust RE CDO Ltd./Capital Trust RE CDO Corp. Series 2005-3A Class A2, 5.16% 6/25/35 (g) | | 6,875,000 | | 6,905,938 |
Asset-Backed Securities - continued |
| Principal Amount (e) | | Value |
CapitalSource Real Estate Loan Trust Series 2006-1A Class A2A, 0.4358% 1/20/37 (g)(i) | | $ 1,397,997 | | $ 1,132,377 |
CapLease CDO Ltd. Series 2005-1A Class A, 4.926% 1/29/40 (g) | | 1,927,285 | | 1,638,192 |
CBRE Realty Finance CDO 2007-1/LLC 0.4958% 4/7/52 (g)(i) | | 24,017,635 | | 14,950,978 |
Conseco Finance Securitizations Corp. Series 2002-2 Class M2, 9.163% 3/1/33 | | 500,000 | | 295,196 |
Crest Clarendon Street Ltd./Crest Clarendon Corp. Series 2002-1A: | | | | |
Class B1, 6.065% 12/28/35 (g) | | 1,570,000 | | 1,193,200 |
Class B2, 1.5963% 12/28/35 (g)(i) | | 1,575,000 | | 996,188 |
Class D, 9% 12/28/35 (g) | | 505,579 | | 126,395 |
Crest Dartmouth Street Ltd./Crest Dartmouth Street Corp. Series 2003-1A: | | | | |
Class B1, 1.7463% 6/28/38 (g)(i) | | 1,230,000 | | 1,112,535 |
Class D, 9% 6/28/38 (g) | | 997,000 | | 697,900 |
Crest Ltd. Series 2002-IGA: | | | | |
Class A, 0.7026% 7/28/17 (g)(i) | | 71,484 | | 70,621 |
Class B, 1.6026% 7/28/35 (g)(i) | | 1,500,000 | | 1,462,500 |
Deutsche Financial Capital Securitization LLC Series 1997-I Class M, 7.275% 9/15/27 | | 9,500,000 | | 8,457,234 |
Fairfield Street Solar Corp. Series 2004-1A Class E1, 3.619% 11/28/39 (g)(i) | | 550,000 | | 16,500 |
Green Tree Financial Corp.: | | | | |
Series 1996-4 Class M1, 7.75% 6/15/27 | | 1,788,179 | | 1,643,693 |
Series 1997-3 Class M1, 7.53% 3/15/28 | | 7,793,391 | | 6,133,445 |
GSR Mortgage Loan Trust Series 2005-HE3 Class B3, 2.6873% 6/25/35 (i)(j) | | 1,259,000 | | 62,777 |
Guggenheim Structured Real Estate Funding Ltd./Guggenheim Structured Real Estate Funding LLC Series 2005-2A: | | | | |
Class D, 1.7373% 8/26/30 (g)(i) | | 761,339 | | 114,201 |
Class E, 2.1873% 8/26/30 (g)(i) | | 1,489,284 | | 48,402 |
Lehman ABS Manufactured Housing Contract Trust Series 2001-B Class M2, 7.17% 3/15/28 | | 1,294,122 | | 519,477 |
Merit Securities Corp. Series 13 Class M1, 7.9245% 12/28/33 (i) | | 1,923,000 | | 1,833,312 |
N-Star Real Estate CDO Ltd. Series 1A Class C1B, 7.696% 8/28/38 (g) | | 883,000 | | 677,349 |
Newcastle Investment Trust Series 2011-MH1 Class A, 2.45% 12/10/33 (g) | | 4,707,451 | | 4,725,104 |
Asset-Backed Securities - continued |
| Principal Amount (e) | | Value |
Prima Capital CDO Ltd./Prima Capital CDO Corp. Series 2005-1A: | | | | |
Class A2, 4.646% 7/24/39 (g) | | $ 809,410 | | $ 807,386 |
Class D, 5.194% 7/24/39 (g) | | 4,590,000 | | 4,406,400 |
Taberna Preferred Funding III Ltd. Series 2005-3A Class D, 2.9223% 2/5/36 (g)(i) | | 3,473,616 | | 347 |
TIAA Real Estate CDO Ltd./TIAA Real Estate CDO Corp. Series 2002-1A Class IIFX, 6.77% 5/22/37 (g) | | 3,165,000 | | 3,172,913 |
Wachovia Ltd./Wachovia LLC: | | | | |
Series 2006-1 Class 1ML, 0% 9/25/26 (g)(i) | | 2,000,000 | | 860,000 |
Series 2006-1A: | | | | |
Class A1A, 0.5065% 9/25/26 (g)(i) | | 20,558,000 | | 17,782,670 |
Class A1B, 0.5765% 9/25/26 (g)(i) | | 6,285,000 | | 5,090,850 |
Class A2A, 0.4665% 9/25/26 (g)(i) | | 9,385,000 | | 8,352,650 |
Wrightwood Capital Real Estate CDO Ltd. Series 2005-1A: | | | | |
Class A1, 0.5785% 11/21/40 (g)(i) | | 10,500,000 | | 9,345,000 |
Class F, 2.2085% 11/21/40 (g)(i) | | 250,000 | | 75,000 |
TOTAL ASSET-BACKED SECURITIES (Cost $112,500,724) | 106,445,756 |
Collateralized Mortgage Obligations - 1.5% |
|
Private Sponsor - 1.5% |
Banc of America Large Loan, Inc. Series 2005-MIB1 Class A2, 0.3965% 3/15/22 (g)(i) | | 502,063 | | 501,392 |
COMM pass-thru certificates Series 2007-FL14 Class AJ, 0.3665% 6/15/22 (g)(i) | | 3,250,000 | | 2,959,813 |
Countrywide Home Loans, Inc.: | | | | |
Series 2002-38 Class B3, 5% 2/25/18 (g) | | 85,893 | | 28,779 |
Series 2002-R2 Class 2B3, 4.1067% 7/25/33 (g)(i) | | 224,890 | | 89,261 |
Series 2003-40 Class B3, 4.5% 10/25/18 (g) | | 131,174 | | 66,343 |
Series 2003-R2 Class B3, 5.5% 5/25/43 (g) | | 157,480 | | 4,506 |
Series 2003-R3: | | | | |
Class B2, 5.5% 11/25/33 (g) | | 1,505,859 | | 334,586 |
Class B3, 5.5% 11/25/33 | | 245,438 | | 18,024 |
Series 2004-R1 Class 1B3, 5.5% 11/25/34 (g)(i) | | 175,868 | | 4,700 |
FREMF Mortgage Trust: | | | | |
Series 2010 K7 Class B, 5.4347% 4/25/20 (g)(i) | | 1,500,000 | | 1,505,811 |
Series 2010-K6 Class B, 5.5324% 12/26/46 (g)(i) | | 4,500,000 | | 4,511,809 |
Merrill Lynch Floating Trust floater Series 2006-1 Class TM, 0.687% 6/15/22 (g)(i) | | 6,222,957 | | 5,974,039 |
Collateralized Mortgage Obligations - continued |
| Principal Amount (e) | | Value |
Private Sponsor - continued |
Merrill Lynch Mortgage Investors Trust Series 1998-C3 Class F, 6% 12/15/30 (g) | | $ 7,120,000 | | $ 7,262,400 |
Merrill Lynch Mortgage Trust Series 2002-MW1 Class E, 6.219% 7/12/34 (g) | | 1,600,000 | | 1,623,527 |
RESI Finance LP/RESI Finance DE Corp. floater: | | | | |
Series 2003-B Class B9, 12.1358% 7/10/35 (g)(i) | | 436,056 | | 364,107 |
Series 2005-A Class B6, 2.1858% 3/10/37 (g)(i) | | 1,602,399 | | 432,648 |
Series 2005-B Class B6, 1.7858% 6/10/37 (g)(i) | | 877,985 | | 70,590 |
Series 2005-D Class B6, 2.4365% 12/15/37 (g)(i) | | 443,739 | | 5,902 |
Residential Funding Securities Corp. Series 2002-RM1 Class BI1, 5.5% 12/25/17 (g) | | 62,752 | | 53,207 |
RESIX Finance Ltd. floater: | | | | |
Series 2003-D Class B8, 6.6858% 12/10/35 (g)(i) | | 408,263 | | 220,462 |
Series 2004-A Class B7, 4.4358% 2/10/36 (g)(i) | | 432,933 | | 243,741 |
Series 2004-B Class B7, 4.1858% 2/10/36 (g)(i) | | 525,206 | | 288,863 |
Series 2005-C Class B7, 3.2858% 9/10/37 (g)(i) | | 1,811,314 | | 45,283 |
TOTAL PRIVATE SPONSOR | | 26,609,793 |
U.S. Government Agency - 0.0% |
Fannie Mae REMIC Trust: | | | | |
Series 2001-W3 subordinate REMIC pass thru certificates, Class B3, 7% 9/25/41 (j) | | 181,629 | | 52,747 |
Series 2002-W1 subordinate REMIC pass thru certificates, Class 3B3, 3.7279% 2/25/42 (g)(i) | | 113,310 | | 48,651 |
Series 2003-W1 subordinate REMIC pass thru certificates, Class B3, 5.75% 12/25/42 (j) | | 258,627 | | 69,440 |
Series 2003-W10 subordinate REMIC pass thru certificates, Class 2B3, 3.7969% 6/25/43 (g)(i) | | 161,769 | | 65,611 |
Series 2003-W4 subordinate REMIC pass thru certificates, Class 2B3, 3.8751% 10/25/42 (g)(i) | | 70,645 | | 26,145 |
TOTAL U.S. GOVERNMENT AGENCY | | 262,594 |
TOTAL COLLATERALIZED MORTGAGE OBLIGATIONS (Cost $31,621,056) | 26,872,387 |
Commercial Mortgage Securities - 19.3% |
|
ACGS Series 2004-1 Class P, 7.4651% 8/1/19 (j) | | 6,369,196 | | 6,128,361 |
Americold LLC Trust Series 2010-ARTA Class D, 7.443% 1/14/29 (g) | | 2,000,000 | | 2,029,557 |
Commercial Mortgage Securities - continued |
| Principal Amount (e) | | Value |
Asset Securitization Corp. Series 1997-D4: | | | | |
Class B1, 7.525% 4/14/29 | | $ 1,565,000 | | $ 1,611,921 |
Class B2, 7.525% 4/14/29 | | 560,000 | | 576,868 |
Banc of America Commercial Mortgage, Inc.: | | | | |
sequential payer Series 2002-2 Class F, 5.487% 7/11/43 | | 4,185,000 | | 4,249,757 |
Series 2005-1 Class CJ, 5.3521% 11/10/42 (i) | | 3,580,000 | | 3,562,197 |
Series 2005-6 Class AJ, 5.1947% 9/10/47 (i) | | 5,000,000 | | 4,768,485 |
Banc of America Large Loan Trust floater Series 2010-HLTN Class HLTN, 1.937% 11/15/15 (g)(i) | | 46,621,689 | | 43,353,492 |
Banc of America Large Loan, Inc. floater Series 2005-MIB1: | | | | |
Class J, 1.2365% 3/15/22 (g)(i) | | 2,000,000 | | 1,780,000 |
Class K, 2.1865% 3/15/22 (g)(i) | | 4,190,000 | | 3,435,800 |
Bear Stearns Commercial Mortgage Securities, Inc. Series 2006-PW11 Class AJ, 5.4525% 3/11/39 (i) | | 5,700,000 | | 5,364,842 |
Bear Stearns Commercial Mortgage Securities Trust Series 2006-T22 Class B, 5.7067% 4/12/38 (g)(i) | | 2,520,000 | | 2,281,977 |
Citigroup/Deutsche Bank Commercial Mortgage Trust Series 2006-CD2 Class VPM2, 5.8052% 1/15/46 (g)(i) | | 3,500,000 | | 3,126,020 |
COMM pass-thru certificates: | | | | |
floater Series 2006-FL12 Class AJ, 0.3165% 12/15/20 (g)(i) | | 8,000,000 | | 7,320,000 |
sequential payer Series 2004-RS1 Class A, 5.648% 3/3/41 (g) | | 9,621,611 | | 9,549,449 |
Series 2001-J1A Class F, 6.8296% 2/16/34 (g)(i) | | 2,600,000 | | 2,618,331 |
Communication Mortgage Trust Series 2011-THL Class F, 4.867% 6/9/28 (g) | | 11,090,000 | | 9,739,096 |
Credit Suisse First Boston Mortgage Securities Corp. Series 1998-C2 Class F, 6.75% 11/11/30 (g) | | 3,000,000 | | 3,250,432 |
CRESI Finance Ltd. Partnership floater Series 2006-A Class E, 1.8373% 3/25/17 (g)(i) | | 2,512,000 | | 2,071,615 |
CRESIX Finance Ltd. Series 2006-AA: | | | | |
Class F, 4.3873% 3/25/17 (g)(i) | | 3,860,000 | | 3,090,413 |
Class G, 7.1873% 3/25/17 (g)(i) | | 3,272,000 | | 2,078,743 |
Crest Ltd. Series 2001-1A Class C, 9% 2/25/34 (g) | | 1,000,000 | | 690,000 |
DBUBS Mortgage Trust Series 2011-LC1A Class E, 5.7285% 11/10/46 (g)(i) | | 2,980,000 | | 2,638,493 |
Deutsche Mortgage & Asset Receiving Corp. Series 1998-C1 Class J, 6.22% 6/15/31 | | 1,200,000 | | 998,835 |
DLJ Commercial Mortgage Corp.: | | | | |
Series 1998-CG1 Class B4, 7.2203% 6/10/31 (g)(i) | | 2,500,000 | | 2,634,334 |
Series 2000-CKP1 Class B3, 7.958% 11/10/33 (i) | | 2,970,000 | | 2,962,457 |
Commercial Mortgage Securities - continued |
| Principal Amount (e) | | Value |
Extended Stay America Trust Series 2010-ESHA, Class C4, 4.8603% 11/5/27 (g) | | $ 5,000,000 | | $ 5,020,515 |
FHLMC Multifamily Structured pass-thru Certificates: | | | | |
Series K013 Class X3, 2.884% 1/25/43 (h)(i) | | 14,360,000 | | 2,472,370 |
Series KAIV Class X2, 3.614% 6/25/41 (h)(i) | | 7,430,000 | | 1,688,096 |
First Union National Bank Commercial Mortgage Trust Series 2001-C4: | | | | |
Class H, 7.036% 12/12/33 (g) | | 2,000,000 | | 2,009,696 |
Class K, 6% 12/12/33 (g) | | 2,000,000 | | 1,992,651 |
Freddie Mac Multi-class participation certificates guaranteed: | | | | |
Series K011 Class X3, 2.5747% 12/25/43 (h)(i) | | 12,206,096 | | 1,957,810 |
Series K012 Class X3, 2.2876% 1/25/41 (h)(i) | | 21,072,888 | | 2,990,454 |
G-Force LLC sequential payer Series 2005-RRA Class A2, 4.83% 8/22/36 (g) | | 12,783,602 | | 12,464,012 |
GE Capital Commercial Mortgage Corp.: | | | | |
Series 2001-3 Class C, 6.51% 6/10/38 | | 820,000 | | 826,315 |
Series 2002-1A Class H, 7.123% 12/10/35 (g)(i) | | 991,000 | | 998,737 |
GMAC Commercial Mortgage Securities, Inc.: | | | | |
Series 1997-C2: | | | | |
Class F, 6.75% 4/15/29 (i) | | 1,738,931 | | 1,808,639 |
Class G, 6.75% 4/15/29 (i) | | 1,250,000 | | 1,393,740 |
Series 1999-C3: | | | | |
Class G, 6.974% 8/15/36 (g) | | 689,776 | | 692,433 |
Class J, 6.974% 8/15/36 | | 1,500,000 | | 1,505,037 |
Series 2000-C1 Class K, 7% 3/15/33 | | 1,100,000 | | 785,170 |
Series 2002-C3 Class D, 5.27% 7/10/39 | | 3,000,000 | | 3,077,433 |
Greenwich Capital Commercial Funding Corp.: | | | | |
sequential payer Series 2003-C1 Class D, 4.29% 7/5/35 (g) | | 2,000,000 | | 2,071,825 |
Series 2002-C1 Class H, 5.903% 1/11/35 (g) | | 880,000 | | 893,762 |
GS Mortgage Securities Corp. II: | | | | |
floater Series 2007-EOP Class L, 6.4193% 3/6/20 (g)(i) | | 1,400,000 | | 1,393,865 |
Series 2010-C1 Class E, 4% 8/10/43 (g) | | 3,000,000 | | 2,140,054 |
GS Mortgage Securities Corp. Trust Series 2011-ALF Class E, 4.953% 2/10/21 (g) | | 5,000,000 | | 4,958,500 |
JP Morgan Chase Commercial Mortgage Securities Corp.: | | | | |
Series 2001-A: | | | | |
Class G, 6% 10/15/32 (g)(i) | | 2,895,000 | | 7,238 |
Class X, 0.9824% 10/15/32 (g)(h)(i) | | 7,141,456 | | 518 |
Series 2009-IWST Class D, 7.4453% 12/5/27 (g)(i) | | 5,000,000 | | 5,508,039 |
Commercial Mortgage Securities - continued |
| Principal Amount (e) | | Value |
JP Morgan Chase Commercial Mortgage Securities Corp.: - continued | | | | |
Series 2010-CNTM Class MZ, 8.5% 8/5/20 (g) | | $ 4,000,000 | | $ 3,896,926 |
Series 2010-CNTR: | | | | |
Class D, 6.1838% 8/5/32 (g)(i) | | 4,500,000 | | 4,100,884 |
Class XB, 0.9305% 8/5/32 (g)(h) | | 32,655,000 | | 1,777,297 |
JP Morgan Chase Commercial Mortgage Securities Trust floater Series 2005-FL1A Class A2, 0.3665% 2/15/19 (g)(i) | | 1,951,254 | | 1,914,134 |
JP Morgan Commercial Mortgage Finance Corp.: | | | | |
Series 1997-C5 Class F, 7.5605% 9/15/29 | | 1,392,544 | | 1,437,258 |
Series 1999-C8: | | | | |
Class G, 6% 7/15/31 (g) | | 1,385,000 | | 1,378,920 |
Class H, 6% 7/15/31 (g) | | 1,305,511 | | 9,139 |
LB Commercial Conduit Mortgage Trust Series 1998-C4 Class G, 5.6% 10/15/35 (g) | | 2,920,000 | | 3,070,380 |
LB-UBS Commercial Mortgage Trust: | | | | |
sequential payer: | | | | |
Series 2004-C2 Class E, 4.487% 3/15/36 | | 2,060,000 | | 2,022,379 |
Series 2005-C7 Class AJ, 5.323% 11/15/40 | | 6,000,000 | | 5,620,226 |
Series 2006-C7 Class AM, 5.378% 11/15/38 | | 2,040,000 | | 2,018,671 |
Series 2005-C2 Class AJ, 5.205% 4/15/30 (i) | | 8,910,000 | | 8,696,821 |
Series 2006-C4: | | | | |
Class AJ, 6.0868% 6/15/38 (i) | | 6,005,000 | | 5,357,749 |
Class AM, 6.0868% 6/15/38 (i) | | 6,700,000 | | 6,911,831 |
Lstar Commercial Mortgage Trust: | | | | |
Series 2011-1 Class D, 5.7457% 6/25/43 (g)(i) | | 4,699,000 | | 3,446,830 |
Series 2011-1 Class B, 5.7457% 6/25/43 (g)(i) | | 5,720,000 | | 5,282,128 |
Merrill Lynch Financial Asset, Inc. Series 2005-CA16: | | | | |
Class F, 4.384% 7/12/37 | CAD | 710,000 | | 505,215 |
Class G, 4.384% 7/12/37 | CAD | 355,000 | | 244,471 |
Class H, 4.384% 7/12/37 | CAD | 236,000 | | 157,324 |
Class J, 4.384% 7/12/37 | CAD | 355,000 | | 229,135 |
Class K, 4.384% 7/12/37 | CAD | 355,000 | | 221,908 |
Class L, 4.384% 7/12/37 | CAD | 236,000 | | 142,901 |
Class M, 4.384% 7/12/37 | CAD | 995,000 | | 457,431 |
Merrill Lynch Mortgage Investors Trust Series 1999-C1 Class G, 6.71% 11/15/31 (g) | | 3,143,926 | | 1,697,720 |
Merrill Lynch Mortgage Trust Series 2006-C1 Class AM, 5.6735% 5/12/39 (i) | | 1,200,000 | | 1,243,122 |
Mezz Capital Commercial Mortgage Trust Series 2004-C1: | | | | |
Class D, 6.988% 1/15/37 (g) | | 750,000 | | 75 |
Commercial Mortgage Securities - continued |
| Principal Amount (e) | | Value |
Mezz Capital Commercial Mortgage Trust Series 2004-C1: - continued | | | | |
Class E, 7.983% 1/15/37 (g) | | $ 1,453,000 | | $ 145 |
Class IO, 8.1746% 1/15/37 (h)(i) | | 5,165,671 | | 309,940 |
Morgan Stanley Capital I Trust: | | | | |
sequential payer: | | | | |
Series 2004-RR2 Class A2, 5.45% 10/28/33 (g) | | 1,718,316 | | 1,683,949 |
Series 2006-HQ10 Class AM, 5.36% 11/12/41 | | 8,200,000 | | 8,263,698 |
Series 1997-RR Class F, 7.4021% 4/30/39 (g)(i) | | 2,151,136 | | 2,097,357 |
Series 1998-CF1 Class G, 7.35% 7/15/32 (g) | | 2,602,314 | | 1,431,273 |
Series 2006-IQ12 Class AMFX, 5.37% 12/15/43 | | 7,500,000 | | 6,975,150 |
Series 2011-C2: | | | | |
Class D, 5.319% 6/15/44 (g)(i) | | 4,610,000 | | 4,161,954 |
Class E, 5.319% 6/15/44 (g)(i) | | 6,600,000 | | 5,676,000 |
Class F, 5.319% 6/15/44 (g)(i) | | 4,440,000 | | 3,352,200 |
Class XB, 0.465% 6/15/44 (g)(h)(i) | | 63,708,222 | | 2,125,306 |
NationsLink Funding Corp. Series 1999-SL Class X, 11/10/30 (h) | | 3,132,059 | | 2,818,853 |
Providence Place Group Ltd. Partnership Series 2000-C1 Class A2, 7.75% 7/20/28 (g) | | 3,375,238 | | 3,746,177 |
RBSCF Trust Series 2010-MB1 Class D, 4.8254% 4/15/24 (g)(i) | | 5,820,000 | | 5,815,344 |
Salomon Brothers Mortgage Securities VII, Inc. Series 2001-MMA: | | | | |
Class E3, 6.5% 2/18/34 (g)(i) | | 3,000,000 | | 3,062,209 |
Class E5, 6.5% 2/18/34 (g)(i) | | 3,000,000 | | 3,079,962 |
Structured Asset Securities Corp. Series 1997-LLI Class F, 7.3% 10/12/34 (g) | | 2,170,000 | | 2,187,578 |
TIAA Seasoned Commercial Mortgage Trust sequential payer Series 2007-C4 Class AJ, 5.9788% 8/15/39 (i) | | 2,080,000 | | 2,054,505 |
TimberStar Trust I Series 2006-1 Class F, 7.5296% 10/15/36 (g) | | 10,630,000 | | 11,161,500 |
UBS Commercial Mortgage Trust Series 2007-FL1 Class F, 0.7615% 7/15/24 (g)(i) | | 1,200,000 | | 481,819 |
Vornado DP LLC Series 2010-VNO Class D, 6.3555% 9/13/28 (g) | | 2,540,000 | | 2,516,273 |
Wachovia Bank Commercial Mortgage Trust: | | | | |
Series 2004-C10 Class E, 4.931% 2/15/41 | | 2,000,000 | | 2,003,088 |
Series 2004-C11: | | | | |
Class D, 5.5477% 1/15/41 (i) | | 5,177,000 | | 5,029,636 |
Class E, 5.5977% 1/15/41 (i) | | 3,785,000 | | 3,352,191 |
Series 2004-C12 Class D, 5.512% 7/15/41 (i) | | 2,750,000 | | 2,623,939 |
Commercial Mortgage Securities - continued |
| Principal Amount (e) | | Value |
Wachovia Bank Commercial Mortgage Trust: - continued | | | | |
Series 2004-C14 Class B, 5.17% 8/15/41 | | $ 3,180,000 | | $ 3,307,999 |
WFDB Commercial Mortgage Trust Series 2011-BXR Class D, 5.914% 7/5/24 (g) | | 4,000,000 | | 3,999,968 |
TOTAL COMMERCIAL MORTGAGE SECURITIES (Cost $342,174,310) | 345,727,272 |
Floating Rate Loans - 4.0% |
|
CONSUMER DISCRETIONARY - 0.7% |
Hotels, Restaurants & Leisure - 0.5% |
Extended Stay America, Inc. term loan 9.75% 11/1/15 | | 9,000,000 | | 9,000,000 |
Media - 0.1% |
PRIMEDIA, Inc. Tranche B, term loan 7.5% 1/13/18 (i) | | 2,850,000 | | 2,736,000 |
Specialty Retail - 0.1% |
The Pep Boys - Manny, Moe & Jack term loan 2.25% 10/27/13 (i) | | 1,981,937 | | 1,979,459 |
TOTAL CONSUMER DISCRETIONARY | | 13,715,459 |
FINANCIALS - 2.0% |
Diversified Financial Services - 0.7% |
Capital Automotive LP term loan 5% 3/11/17 (i) | | 8,399,826 | | 8,399,826 |
Pilot Travel Centers LLC Tranche B, term loan 4.25% 3/30/18 (i) | | 4,000,000 | | 4,005,200 |
| | 12,405,026 |
Real Estate Investment Trusts - 0.1% |
iStar Financial, Inc. Tranche A 1LN, term loan 5% 6/28/13 (i) | | 1,487,111 | | 1,461,086 |
Real Estate Management & Development - 1.2% |
CB Richard Ellis Group, Inc. Tranche B, term loan 3.4358% 11/9/16 (i) | | 1,709,594 | | 1,709,594 |
CB Richard Ellis Services, Inc. Tranche D, term loan 3.6851% 9/4/19 (i) | | 4,000,000 | | 3,955,000 |
Equity Inns Reality LLC: | | | | |
Tranche A, term loan 9% 11/2/12 (i) | | 2,000,000 | | 1,797,500 |
Tranche B 2LN, term loan 6.05% 11/2/12 (i) | | 5,000,000 | | 4,593,750 |
Realogy Corp.: | | | | |
Credit-Linked Deposit 3.1856% 10/10/13 (i) | | 620,304 | | 589,288 |
Credit-Linked Deposit 4.4356% 10/10/16 (i) | | 210,842 | | 191,339 |
term loan 4.5183% 10/10/16 (i) | | 1,249,372 | | 1,133,805 |
Floating Rate Loans - continued |
| Principal Amount (e) | | Value |
FINANCIALS - continued |
Real Estate Management & Development - continued |
Realogy Corp.: - continued | | | | |
Tranche 2LN, term loan 13.5% 10/15/17 | | $ 2,500,000 | | $ 2,637,500 |
Tranche B, term loan 3.2683% 10/10/13 (i) | | 5,234,332 | | 4,972,616 |
| | 21,580,392 |
TOTAL FINANCIALS | | 35,446,504 |
HEALTH CARE - 0.5% |
Health Care Providers & Services - 0.5% |
Community Health Systems, Inc.: | | | | |
Tranche B, term loan 2.504% 7/25/14 (i) | | 2,844,254 | | 2,755,371 |
Tranche DD, term loan 2.504% 7/25/14 (i) | | 146,026 | | 141,463 |
Skilled Healthcare Group, Inc. term loan 5.25% 4/9/16 (i) | | 3,738,937 | | 3,748,284 |
Universal Health Services, Inc. term loan 4% 11/15/16 (i) | | 1,908,343 | | 1,908,343 |
| | 8,553,461 |
INDUSTRIALS - 0.6% |
Construction & Engineering - 0.6% |
Drumm Investors LLC Tranche B, term loan 5% 5/4/18 (i) | | 12,000,000 | | 11,595,000 |
TELECOMMUNICATION SERVICES - 0.2% |
Wireless Telecommunication Services - 0.2% |
TowerCo Finance LLC Tranche B, term loan 5.25% 2/2/17 (i) | | 2,992,500 | | 2,992,500 |
TOTAL FLOATING RATE LOANS (Cost $69,310,921) | 72,302,924 |
Preferred Securities - 0.0% |
| | | |
FINANCIALS - 0.0% |
Diversified Financial Services - 0.0% |
Crest Clarendon Street 2002-1 Ltd. Series 2002-1A Class PS, 12/28/35 (g) | 500,000 | | 15,000 |
Crest Dartmouth Street 2003 1 Ltd. Series 2003-1A Class PS, 6/28/38 (g) | 1,220,000 | | 427,000 |
Preferred Securities - continued |
| Principal Amount (e) | | Value |
FINANCIALS - continued |
Diversified Financial Services - continued |
Harp High Grade CDO I Ltd. Series 2006-1, 7/8/46 (g) | $ 810,000 | | $ 8 |
Ipswich Street CDO Series 2006-1, 6/27/46 (d)(g) | 1,350,000 | | 0 |
| | 442,008 |
TOTAL PREFERRED SECURITIES (Cost $3,377,499) | 442,008 |
Money Market Funds - 9.8% |
| Shares | | |
Fidelity Cash Central Fund, 0.14% (b) | 138,042,360 | | 138,042,360 |
Fidelity Securities Lending Cash Central Fund, 0.15% (b)(c) | 38,026,262 | | 38,026,262 |
TOTAL MONEY MARKET FUNDS (Cost $176,068,622) | 176,068,622 |
TOTAL INVESTMENT PORTFOLIO - 102.0% (Cost $1,750,859,783) | | 1,828,418,003 |
NET OTHER ASSETS (LIABILITIES) - (2.0)% | | (35,608,954) |
NET ASSETS - 100% | $ 1,792,809,049 |
Currency Abbreviations |
CAD | - | Canadian dollar |
Legend |
(a) Non-income producing |
(b) Affiliated fund that is available only to investment companies and other accounts managed by Fidelity Investments. The rate quoted is the annualized seven-day yield of the fund at period end. A complete unaudited listing of the fund's holdings as of its most recent quarter end is available upon request. In addition, each Fidelity Central Fund's financial statements, which are not covered by the Fund's Report of Independent Registered Public Accounting Firm, are available on the SEC's website or upon request. |
(c) Investment made with cash collateral received from securities on loan. |
(d) Non-income producing - Security is in default. |
(e) Principal amount is stated in United States dollars unless otherwise noted. |
(f) Security or a portion of the security is on loan at period end. |
(g) Security exempt from registration under Rule 144A of the Securities Act of 1933. These securities may be resold in transactions exempt from registration, normally to qualified institutional buyers. At the end of the period, the value of these securities amounted to $437,234,266 or 24.4% of net assets. |
(h) Security represents right to receive monthly interest payments on an underlying pool of mortgages or assets. Principal shown is the outstanding par amount of the pool held as of the end of the period. |
(i) Coupon rates for floating and adjustable rate securities reflect the rates in effect at period end. |
(j) Restricted securities - Investment in securities not registered under the Securities Act of 1933 (excluding 144A issues). At the end of the period, the value of restricted securities (excluding 144A issues) amounted to $6,313,325 or 0.4% of net assets. |
Additional information on each restricted holding is as follows: |
Security | Acquisition Date | Acquisition Cost |
ACGS Series 2004-1 Class P, 7.4651% 8/1/19 | 2/17/11 | $ 6,167,702 |
Fannie Mae REMIC Trust Series 2001-W3 subordinate REMIC pass thru certificates, Class B3, 7% 9/25/41 | 5/21/03 | $ 157,393 |
Fannie Mae REMIC Trust Series 2003-W1 subordinate REMIC pass thru certificates, Class B3, 5.75% 12/25/42 | 3/25/03 | $ 194,899 |
GSR Mortgage Loan Trust Series 2005-HE3 Class B3, 2.6873% 6/25/35 | 6/3/05 | $ 1,110,697 |
Affiliated Central Funds |
Information regarding fiscal year to date income earned by the Fund from investments in Fidelity Central Funds is as follows: |
Fund | Income earned |
Fidelity Cash Central Fund | $ 207,012 |
Fidelity Securities Lending Cash Central Fund | 34,762 |
Total | $ 241,774 |
Other Information |
The following is a summary of the inputs used, as of July 31, 2011, involving the Fund's assets and liabilities carried at fair value. The inputs or methodology used for valuing securities may not be an indication of the risk associated with investing in those securities. For more information on valuation inputs, and their aggregation into the levels used in the tables below, please refer to the Security Valuation section in the accompanying Notes to Financial Statements. |
Valuation Inputs at Reporting Date: |
Description | Total | Level 1 | Level 2 | Level 3 |
Investments in Securities: | | | | |
Equities: | | | | |
Consumer Discretionary | $ 16,655,507 | $ 13,126,936 | $ - | $ 3,528,571 |
Financials | 584,071,871 | 559,503,024 | 19,627,477 | 4,941,370 |
Health Care | 23,308,214 | 23,308,214 | - | - |
Corporate Bonds | 476,523,442 | - | 467,138,642 | 9,384,800 |
Asset-Backed Securities | 106,445,756 | - | 27,055,672 | 79,390,084 |
Collateralized Mortgage Obligations | 26,872,387 | - | 26,010,387 | 862,000 |
Commercial Mortgage Securities | 345,727,272 | - | 313,786,639 | 31,940,633 |
Floating Rate Loans | 72,302,924 | - | 63,302,924 | 9,000,000 |
Preferred Securities | 442,008 | - | - | 442,008 |
Money Market Funds | 176,068,622 | 176,068,622 | - | - |
Total Investments in Securities: | $ 1,828,418,003 | $ 772,006,796 | $ 916,921,741 | $ 139,489,466 |
The following is a reconciliation of Investments in Securities for which Level 3 inputs were used in determining value: |
Investments in Securities: | |
Equities - Consumer Discretionary | |
Beginning Balance | $ 3,696,000 |
Total Realized Gain (Loss) | - |
Total Unrealized Gain (Loss) | (167,429) |
Cost of Purchases | - |
Proceeds of Sales | - |
Amortization/Accretion | - |
Transfers in to Level 3 | - |
Transfers out of Level 3 | - |
Ending Balance | $ 3,528,571 |
The change in unrealized gain (loss) for the period attributable to Level 3 securities held at July 31, 2011 | $ (167,429) |
Equities - Financials | |
Beginning Balance | $ 3,922,244 |
Total Realized Gain (Loss) | - |
Total Unrealized Gain (Loss) | 1,019,250 |
Cost of Purchases | - |
Proceeds of Sales | - |
Amortization/Accretion | - |
Transfers in to Level 3 | - |
Transfers out of Level 3 | (124) |
Ending Balance | $ 4,941,370 |
The change in unrealized gain (loss) for the period attributable to Level 3 securities held at July 31, 2011 | $ 1,019,250 |
Corporate Bonds | |
Beginning Balance | $ 1,370,000 |
Total Realized Gain (Loss) | - |
Total Unrealized Gain (Loss) | 32,708 |
Cost of Purchases | 7,982,092 |
Proceeds of Sales | - |
Amortization/Accretion | - |
Transfers in to Level 3 | - |
Transfers out of Level 3 | - |
Ending Balance | $ 9,384,800 |
The change in unrealized gain (loss) for the period attributable to Level 3 securities held at July 31, 2011 | $ 32,708 |
Asset-Backed Securities | |
Beginning Balance | $ 16,886,956 |
Total Realized Gain (Loss) | 682,842 |
Total Unrealized Gain (Loss) | 2,505,703 |
Cost of Purchases | 52,080,640 |
Proceeds of Sales | (9,776,117) |
Amortization/Accretion | 839,401 |
Transfers in to Level 3 | 17,965,015 |
Transfers out of Level 3 | (1,794,356) |
Ending Balance | $ 79,390,084 |
The change in unrealized gain (loss) for the period attributable to Level 3 securities held at July 31, 2011 | $ 1,528,507 |
Collateralized Mortgage Obligations | |
Beginning Balance | $ 994,555 |
Total Realized Gain (Loss) | - |
Total Unrealized Gain (Loss) | 243,838 |
Cost of Purchases | - |
Proceeds of Sales | (340,705) |
Amortization/Accretion | (83,120) |
Transfers in to Level 3 | 47,432 |
Transfers out of Level 3 | - |
Ending Balance | $ 862,000 |
The change in unrealized gain (loss) for the period attributable to Level 3 securities held at July 31, 2011 | $ 243,838 |
Commercial Mortgage Securities | |
Beginning Balance | $ 12,252,746 |
Total Realized Gain (Loss) | (19,472) |
Total Unrealized Gain (Loss) | 1,649,186 |
Cost of Purchases | 23,418,959 |
Proceeds of Sales | (2,739,892) |
Amortization/Accretion | (109,801) |
Transfers in to Level 3 | 4,543,765 |
Transfers out of Level 3 | (7,054,858) |
Ending Balance | $ 31,940,633 |
The change in unrealized gain (loss) for the period attributable to Level 3 securities held at July 31, 2011 | $ 1,516,502 |
Floating Rate Loans | |
Beginning Balance | $ - |
Total Realized Gain (Loss) | - |
Total Unrealized Gain (Loss) | 62,914 |
Cost of Purchases | 8,928,750 |
Proceeds of Sales | - |
Amortization/Accretion | 8,336 |
Transfers in to Level 3 | - |
Transfers out of Level 3 | - |
Ending Balance | $ 9,000,000 |
The change in unrealized gain (loss) for the period attributable to Level 3 securities held at July 31, 2011 | $ 62,914 |
Preferred Securities | |
Beginning Balance | $ 365,608 |
Total Realized Gain (Loss) | (2,306,146) |
Total Unrealized Gain (Loss) | 2,480,412 |
Cost of Purchases | - |
Proceeds of Sales | (99,000) |
Amortization/Accretion | 1,134 |
Transfers in to Level 3 | - |
Transfers out of Level 3 | - |
Ending Balance | $ 442,008 |
The change in unrealized gain (loss) for the period attributable to Level 3 securities held at July 31, 2011 | $ 73,873 |
The information used in the above reconciliation represents fiscal year to date activity for any Investments in Securities identified as using Level 3 inputs at either the beginning or the end of the current fiscal period. Transfers in or out of Level 3 represent the beginning value of any Security or Instrument where a change in the pricing level occurred from the beginning to the end of the period. The cost of purchases and the proceeds of sales may include securities received or delivered through corporate actions or exchanges. Realized and unrealized gains (losses) disclosed in the reconciliation are included in Net Gain (Loss) on the Fund's Statement of Operations. |
The composition of credit quality ratings as a percentage of net assets is as follows (Unaudited): |
U.S. Government and U.S. Government Agency Obligations | 0.5% |
AAA,AA,A | 11.4% |
BBB | 14.5% |
BB | 5.8% |
B | 10.1% |
CCC,CC,C | 3.2% |
D | 0.1% |
Not Rated | 11.8% |
Equities | 34.8% |
Short-Term Investments and Net Other Assets | 7.8% |
| 100.0% |
We have used ratings from Moody's Investors Service, Inc. Where Moody's® ratings are not available, we have used S&P® ratings. All ratings are as of the date indicated and do not reflect subsequent changes. |
See accompanying notes which are an integral part of the financial statements.
Annual Report
Statement of Assets and Liabilities
| July 31, 2011 |
| | |
Assets | | |
Investment in securities, at value (including securities loaned of $35,928,878) - See accompanying schedule: Unaffiliated issuers (cost $1,574,791,161) | $ 1,652,349,381 | |
Fidelity Central Funds (cost $176,068,622) | 176,068,622 | |
Total Investments (cost $1,750,859,783) | | $ 1,828,418,003 |
Cash | | 323,241 |
Receivable for investments sold | | 2,833,712 |
Receivable for fund shares sold | | 3,470,591 |
Dividends receivable | | 901,540 |
Interest receivable | | 9,533,761 |
Distributions receivable from Fidelity Central Funds | | 16,392 |
Other receivables | | 16,716 |
Total assets | | 1,845,513,956 |
| | |
Liabilities | | |
Payable for investments purchased | $ 8,176,436 | |
Payable for fund shares redeemed | 5,093,296 | |
Accrued management fee | 834,868 | |
Distribution and service plan fees payable | 31,194 | |
Other affiliated payables | 466,030 | |
Other payables and accrued expenses | 76,821 | |
Collateral on securities loaned, at value | 38,026,262 | |
Total liabilities | | 52,704,907 |
| | |
Net Assets | | $ 1,792,809,049 |
Net Assets consist of: | | |
Paid in capital | | $ 1,688,797,987 |
Undistributed net investment income | | 20,642,579 |
Accumulated undistributed net realized gain (loss) on investments and foreign currency transactions | | 5,785,289 |
Net unrealized appreciation (depreciation) on investments and assets and liabilities in foreign currencies | | 77,583,194 |
Net Assets | | $ 1,792,809,049 |
See accompanying notes which are an integral part of the financial statements.
Annual Report
Financial Statements - continued
Statement of Assets and Liabilities - continued
| July 31, 2011 |
| | |
Calculation of Maximum Offering Price Class A:
Net Asset Value and redemption price per share ($60,282,886 ÷ 5,620,724 shares) | | $ 10.73 |
| | |
Maximum offering price per share (100/96.00 of $10.73) | | $ 11.18 |
Class T:
Net Asset Value and redemption price per share ($7,625,672 ÷ 711,056 shares) | | $ 10.72 |
| | |
Maximum offering price per share (100/96.00 of $10.72) | | $ 11.17 |
Class C:
Net Asset Value and offering price per share ($21,555,207 ÷ 2,019,275 shares)A | | $ 10.67 |
| | |
Real Estate Income:
Net Asset Value, offering price and redemption price per share ($1,660,063,375 ÷ 154,395,428 shares) | | $ 10.75 |
| | |
Institutional Class:
Net Asset Value, offering price and redemption price per share ($43,281,909 ÷ 4,029,852 shares) | | $ 10.74 |
A Redemption price per share is equal to net asset value less any applicable contingent deferred sales charge.
See accompanying notes which are an integral part of the financial statements.
Annual Report
Statement of Operations
| Year ended July 31, 2011 |
| | |
Investment Income | | |
Dividends | | $ 24,245,563 |
Interest | | 63,966,851 |
Income from Fidelity Central Funds | | 241,774 |
Total income | | 88,454,188 |
| | |
Expenses | | |
Management fee | $ 8,064,128 | |
Transfer agent fees | 4,177,653 | |
Distribution and service plan fees | 177,614 | |
Accounting and security lending fees | 582,960 | |
Custodian fees and expenses | 31,621 | |
Independent trustees' compensation | 7,337 | |
Registration fees | 231,380 | |
Audit | 159,849 | |
Legal | 4,712 | |
Interest | 326 | |
Miscellaneous | 13,078 | |
Total expenses before reductions | 13,450,658 | |
Expense reductions | (42,341) | 13,408,317 |
Net investment income (loss) | | 75,045,871 |
Realized and Unrealized Gain (Loss) Net realized gain (loss) on: | | |
Investment securities: | | |
Unaffiliated issuers | 26,478,722 | |
Foreign currency transactions | (4,405) | |
Total net realized gain (loss) | | 26,474,317 |
Change in net unrealized appreciation (depreciation) on: Investment securities | 63,155,032 | |
Assets and liabilities in foreign currencies | (714) | |
Total change in net unrealized appreciation (depreciation) | | 63,154,318 |
Net gain (loss) | | 89,628,635 |
Net increase (decrease) in net assets resulting from operations | | $ 164,674,506 |
See accompanying notes which are an integral part of the financial statements.
Annual Report
Financial Statements - continued
Statement of Changes in Net Assets
| Year ended
July 31,
2011 | Year ended
July 31,
2010 |
Increase (Decrease) in Net Assets | | |
Operations | | |
Net investment income (loss) | $ 75,045,871 | $ 41,516,164 |
Net realized gain (loss) | 26,474,317 | 20,625,469 |
Change in net unrealized appreciation (depreciation) | 63,154,318 | 102,855,727 |
Net increase (decrease) in net assets resulting
from operations | 164,674,506 | 164,997,360 |
Distributions to shareholders from net investment income | (66,688,371) | (40,150,798) |
Share transactions - net increase (decrease) | 655,640,999 | 450,504,667 |
Redemption fees | 331,332 | 230,512 |
Total increase (decrease) in net assets | 753,958,466 | 575,581,741 |
| | |
Net Assets | | |
Beginning of period | 1,038,850,583 | 463,268,842 |
End of period (including undistributed net investment income of $20,642,579 and undistributed net investment income of $11,035,447, respectively) | $ 1,792,809,049 | $ 1,038,850,583 |
See accompanying notes which are an integral part of the financial statements.
Annual Report
Financial Highlights - Class A
Years ended July 31, | 2011 | 2010 H |
Selected Per-Share Data | | |
Net asset value, beginning of period | $ 9.94 | $ 9.95 |
Income from Investment Operations | | |
Net investment income (loss) E | .53 | .18 |
Net realized and unrealized gain (loss) | .76 | (.04) |
Total from investment operations | 1.29 | .14 |
Distributions from net investment income | (.50) | (.15) |
Redemption fees added to paid in capital E, J | - | - |
Net asset value, end of period | $ 10.73 | $ 9.94 |
Total Return B, C, D | 13.27% | 1.46% |
Ratios to Average Net Assets F, I | | |
Expenses before reductions | 1.13% | 1.09% A |
Expenses net of fee waivers, if any | 1.13% | 1.09% A |
Expenses net of all reductions | 1.12% | 1.09% A |
Net investment income (loss) | 5.00% | 6.23% A |
Supplemental Data | | |
Net assets, end of period (000 omitted) | $ 60,283 | $ 3,830 |
Portfolio turnover rate G | 25% | 28% |
A Annualized
B Total returns for periods of less than one year are not annualized.
C Total returns would have been lower if certain expenses had not been reduced during the applicable periods shown.
D Total returns do not include the effect of the sales charges.
E Calculated based on average shares outstanding during the period.
F Fees and expenses of any underlying Fidelity Central Funds are not included in the Fund's expense ratio. The Fund indirectly bears its proportionate share of the expenses of any underlying Fidelity Central Funds.
G Amount does not include the portfolio activity of any underlying Fidelity Central Funds.
H For the period April 14, 2010 (commencement of sale of shares) to July 31, 2010.
I Expense ratios reflect operating expenses of the class. Expenses before reductions do not reflect amounts reimbursed by the investment adviser or reductions from brokerage service arrangements or reductions from other expense offset arrangements and do not represent the amount paid by the class during periods when reimbursements or reductions occur. Expense ratios before reductions for start-up periods may not be representative of longer-term operating periods. Expenses net of fee waivers reflect expenses after reimbursement by the investment adviser but prior to reductions from brokerage service arrangements or other expense offset arrangements. Expenses net of all reductions represent the net expenses paid by the class.
J Amount represents less than $.01 per share.
See accompanying notes which are an integral part of the financial statements.
Annual Report
Financial Highlights - Class T
Years ended July 31, | 2011 | 2010 H |
Selected Per-Share Data | | |
Net asset value, beginning of period | $ 9.94 | $ 9.95 |
Income from Investment Operations | | |
Net investment income (loss) E | .52 | .17 |
Net realized and unrealized gain (loss) | .76 | (.03) |
Total from investment operations | 1.28 | .14 |
Distributions from net investment income | (.50) | (.15) |
Redemption fees added to paid in capital E, J | - | - |
Net asset value, end of period | $ 10.72 | $ 9.94 |
Total Return B, C, D | 13.11% | 1.45% |
Ratios to Average Net Assets F, I | | |
Expenses before reductions | 1.16% | 1.17% A |
Expenses net of fee waivers, if any | 1.16% | 1.17% A |
Expenses net of all reductions | 1.16% | 1.17% A |
Net investment income (loss) | 4.96% | 5.92% A |
Supplemental Data | | |
Net assets, end of period (000 omitted) | $ 7,626 | $ 862 |
Portfolio turnover rate G | 25% | 28% |
A Annualized
B Total returns for periods of less than one year are not annualized.
C Total returns would have been lower if certain expenses had not been reduced during the applicable periods shown.
D Total returns do not include the effect of the sales charges.
E Calculated based on average shares outstanding during the period.
F Fees and expenses of any underlying Fidelity Central Funds are not included in the Fund's expense ratio. The Fund indirectly bears its proportionate share of the expenses of any underlying Fidelity Central Funds.
G Amount does not include the portfolio activity of any underlying Fidelity Central Funds.
H For the period April 14, 2010 (commencement of sale of shares) to July 31, 2010.
I Expense ratios reflect operating expenses of the class. Expenses before reductions do not reflect amounts reimbursed by the investment adviser or reductions from brokerage service arrangements or reductions from other expense offset arrangements and do not represent the amount paid by the class during periods when reimbursements or reductions occur. Expense ratios before reductions for start-up periods may not be representative of longer-term operating periods. Expenses net of fee waivers reflect expenses after reimbursement by the investment adviser but prior to reductions from brokerage service arrangements or other expense offset arrangements. Expenses net of all reductions represent the net expenses paid by the class.
J Amount represents less than $.01 per share.
See accompanying notes which are an integral part of the financial statements.
Annual Report
Financial Highlights - Class C
Years ended July 31, | 2011 | 2010 H |
Selected Per-Share Data | | |
Net asset value, beginning of period | $ 9.93 | $ 9.95 |
Income from Investment Operations | | |
Net investment income (loss) E | .45 | .15 |
Net realized and unrealized gain (loss) | .74 | (.03) |
Total from investment operations | 1.19 | .12 |
Distributions from net investment income | (.45) | (.14) |
Redemption fees added to paid in capital E, J | - | - |
Net asset value, end of period | $ 10.67 | $ 9.93 |
Total Return B, C, D | 12.25% | 1.29% |
Ratios to Average Net Assets F, I | | |
Expenses before reductions | 1.89% | 1.86% A |
Expenses net of fee waivers, if any | 1.89% | 1.86% A |
Expenses net of all reductions | 1.89% | 1.86% A |
Net investment income (loss) | 4.23% | 5.21% A |
Supplemental Data | | |
Net assets, end of period (000 omitted) | $ 21,555 | $ 836 |
Portfolio turnover rate G | 25% | 28% |
A Annualized
B Total returns for periods of less than one year are not annualized.
C Total returns would have been lower if certain expenses had not been reduced during the applicable periods shown.
D Total returns do not include the effect of the contingent deferred sales charge.
E Calculated based on average shares outstanding during the period.
F Fees and expenses of any underlying Fidelity Central Funds are not included in the Fund's expense ratio. The Fund indirectly bears its proportionate share of the expenses of any underlying Fidelity Central Funds.
G Amount does not include the portfolio activity of any underlying Fidelity Central Funds.
H For the period April 14, 2010 (commencement of sale of shares) to July 31, 2010.
I Expense ratios reflect operating expenses of the class. Expenses before reductions do not reflect amounts reimbursed by the investment adviser or reductions from brokerage service arrangements or reductions from other expense offset arrangements and do not represent the amount paid by the class during periods when reimbursements or reductions occur. Expense ratios before reductions for start-up periods may not be representative of longer-term operating periods. Expenses net of fee waivers reflect expenses after reimbursement by the investment adviser but prior to reductions from brokerage service arrangements or other expense offset arrangements. Expenses net of all reductions represent the net expenses paid by the class.
J Amount represents less than $.01 per share.
See accompanying notes which are an integral part of the financial statements.
Annual Report
Financial Highlights - Real Estate Income
Years ended July 31, | 2011 | 2010 | 2009 | 2008 | 2007 |
Selected Per-Share Data | | | | | |
Net asset value, beginning of period | $ 9.95 | $ 8.21 | $ 9.43 | $ 11.22 | $ 11.78 |
Income from Investment Operations | | | | | |
Net investment income (loss) B | .55 | .53 | .54 | .59 | .63 |
Net realized and unrealized gain (loss) | .76 | 1.73 | (1.27) | (1.48) | (.37) |
Total from investment operations | 1.31 | 2.26 | (.73) | (.89) | .26 |
Distributions from net investment income | (.51) | (.52) | (.50) | (.66) | (.58) |
Distributions from net realized gain | - | - | - | (.24) | (.24) |
Total distributions | (.51) | (.52) | (.50) | (.90) | (.82) |
Redemption fees added to paid in capital B | - F | - F | .01 | - F | - F |
Net asset value, end of period | $ 10.75 | $ 9.95 | $ 8.21 | $ 9.43 | $ 11.22 |
Total Return A | 13.41% | 28.29% | (6.92)% | (8.43)% | 2.00% |
Ratios to Average Net Assets C, E | | | | |
Expenses before reductions | .92% | .97% | 1.00% | .94% | .88% |
Expenses net of fee waivers, if any | .92% | .96% | 1.00% | .94% | .88% |
Expenses net of all reductions | .92% | .96% | 1.00% | .94% | .88% |
Net investment income (loss) | 5.21% | 5.60% | 7.15% | 5.77% | 5.30% |
Supplemental Data | | | | | |
Net assets, end of period (000 omitted) | $ 1,660,063 | $ 1,030,393 | $ 463,269 | $ 393,147 | $ 516,268 |
Portfolio turnover rate D | 25% | 28% | 47% | 32% | 45% |
A Total returns would have been lower if certain expenses had not been reduced during the applicable periods shown.
B Calculated based on average shares outstanding during the period.
C Fees and expenses of any underlying Fidelity Central Funds are not included in the Fund's expense ratio. The Fund indirectly bears its proportionate share of the expenses of any underlying Fidelity Central Funds.
D Amount does not include the portfolio activity of any underlying Fidelity Central Funds.
E Expense ratios reflect operating expenses of the class. Expenses before reductions do not reflect amounts reimbursed by the investment adviser or reductions from brokerage service arrangements or reductions from other expense offset arrangements and do not represent the amount paid by the class during periods when reimbursements or reductions occur. Expenses net of fee waivers reflect expenses after reimbursement by the investment adviser but prior to reductions from brokerage service arrangements or other expense offset arrangements. Expenses net of all reductions represent the net expenses paid by the class.
F Amount represents less than $.01 per share.
See accompanying notes which are an integral part of the financial statements.
Annual Report
Financial Highlights - Institutional Class
Years ended July 31, | 2011 | 2010 G |
Selected Per-Share Data | | |
Net asset value, beginning of period | $ 9.95 | $ 9.95 |
Income from Investment Operations | | |
Net investment income (loss) D | .55 | .19 |
Net realized and unrealized gain (loss) | .76 | (.04) |
Total from investment operations | 1.31 | .15 |
Distributions from net investment income | (.52) | (.15) |
Redemption fees added to paid in capital D, I | - | - |
Net asset value, end of period | $ 10.74 | $ 9.95 |
Total Return B, C | 13.44% | 1.58% |
Ratios to Average Net Assets E, H | | |
Expenses before reductions | .89% | .85% A |
Expenses net of fee waivers, if any | .89% | .85% A |
Expenses net of all reductions | .89% | .85% A |
Net investment income (loss) | 5.24% | 6.70% A |
Supplemental Data | | |
Net assets, end of period (000 omitted) | $ 43,282 | $ 2,930 |
Portfolio turnover rate F | 25% | 28% |
A Annualized
B Total returns for periods of less than one year are not annualized.
C Total returns would have been lower if certain expenses had not been reduced during the applicable periods shown.
D Calculated based on average shares outstanding during the period.
E Fees and expenses of any underlying Fidelity Central Funds are not included in the Fund's expense ratio. The Fund indirectly bears its proportionate share of the expenses of any underlying Fidelity Central Funds.
F Amount does not include the portfolio activity of any underlying Fidelity Central Funds.
G For the period April 14, 2010 (commencement of sale of shares) to July 31, 2010.
H Expense ratios reflect operating expenses of the class. Expenses before reductions do not reflect amounts reimbursed by the investment adviser or reductions from brokerage service arrangements or reductions from other expense offset arrangements and do not represent the amount paid by the class during periods when reimbursements or reductions occur. Expense ratios before reductions for start-up periods may not be representative of longer-term operating periods. Expenses net of fee waivers reflect expenses after reimbursement by the investment adviser but prior to reductions from brokerage service arrangements or other expense offset arrangements. Expenses net of all reductions represent the net expenses paid by the class.
I Amount represents less than $.01 per share.
See accompanying notes which are an integral part of the financial statements.
Annual Report
Notes to Financial Statements
For the period ended July 31, 2011
1. Organization.
Fidelity Real Estate Income Fund (the Fund) is a fund of Fidelity Securities Fund (the Trust) and is authorized to issue an unlimited number of shares. The Trust is registered under the Investment Company Act of 1940, as amended (the 1940 Act), as an open-end management investment company organized as a Massachusetts business trust. The Fund offers Class A, Class T, Class C, Real Estate Income and Institutional Class shares, each of has equal rights as to assets and voting privileges. Each class has exclusive voting rights with respect to matters that affect that class. Investment income, realized and unrealized capital gains and losses, the common expenses of the Fund, and certain fund-level expense reductions, if any, are allocated on a pro-rata basis to each class based on the relative net assets of each class to the total net assets of the Fund. Each class differs with respect to transfer agent and distribution and service plan fees incurred. Certain expense reductions may also differ by class.
2. Investments in Fidelity Central Funds.
The Fund invests in Fidelity Central Funds, which are open-end investment companies available only to other investment companies and accounts managed by Fidelity Management & Research Company (FMR) and its affiliates. The Fund's Schedule of Investments lists each of the Fidelity Central Funds held as of period end, if any, as an investment of the Fund, but does not include the underlying holdings of each Fidelity Central Fund. As an Investing Fund, the Fund indirectly bears its proportionate share of the expenses of the underlying Fidelity Central Funds.
The Money Market Central Funds seek preservation of capital and current income and are managed by Fidelity Investments Money Management, Inc. (FIMM), an affiliate of FMR.
A complete unaudited list of holdings for each Fidelity Central Fund is available upon request or at the Securities and Exchange Commission (the SEC) web site at www.sec.gov. In addition, the financial statements of the Fidelity Central Funds, which are not covered by the Fund's Report of Independent Registered Public Accounting Firm, are available on the SEC web site or upon request.
3. Significant Accounting Policies.
The financial statements have been prepared in conformity with accounting principles generally accepted in the United States of America (GAAP), which require management to make certain estimates and assumptions at the date of the financial statements. Actual results could differ from those estimates. Subsequent events, if any, through the date that the financial statements were issued have been evaluated in the preparation of the financial statements. The following summarizes the significant accounting policies of the Fund:
Annual Report
3. Significant Accounting Policies - continued
Security Valuation. Investments are valued as of 4:00 p.m. Eastern time on the last calendar day of the period. The Fund uses independent pricing services approved by the Board of Trustees to value its investments. When current market prices or quotations are not readily available or reliable, valuations may be determined in good faith in accordance with procedures adopted by the Board of Trustees. Factors used in determining value may include market or security specific events, changes in interest rates and credit quality. The frequency with which these procedures are used cannot be predicted and they may be utilized to a significant extent. The value used for net asset value (NAV) calculation under these procedures may differ from published prices for the same securities.
The Fund categorizes the inputs to valuation techniques used to value its investments into a disclosure hierarchy consisting of three levels as shown below:
Level 1 - quoted prices in active markets for identical investments
Level 2 - other significant observable inputs (including quoted prices for similar investments, interest rates, prepayment speeds, etc.)
Level 3 - unobservable inputs (including the Fund's own assumptions based on the best information available)
Changes in valuation techniques may result in transfers in or out of an assigned level within the disclosure hierarchy. The aggregate value of investments by input level, as of July 31, 2011, as well as a roll forward of Level 3 securities, is included at the end of the Fund's Schedule of Investments. Valuation techniques used to value the Fund's investments by major category are as follows:
Equity securities, including restricted securities, for which market quotations are readily available, are valued at the last reported sale price or official closing price as reported by an independent pricing service on the primary market or exchange on which they are traded and are categorized as Level 1 in the hierarchy. In the event there were no sales during the day or closing prices are not available, securities are valued at the last quoted bid price or may be valued using the last available price and are generally categorized as Level 2 in the hierarchy. For foreign equity securities, when significant market or security specific events arise, comparisons to the valuation of American Depositary Receipts (ADRs), futures contracts, Exchange-traded funds (ETFs) and certain indexes as well as quoted prices for similar securities are used and are categorized as Level 2 in the hierarchy in these circumstances. Utilizing these techniques may result in transfers between Level 1 and Level 2. For restricted equity securities and private placements where observable inputs are limited, assumptions about market activity and risk are used and are categorized as Level 3 in the hierarchy.
Annual Report
Notes to Financial Statements - continued
3. Significant Accounting Policies - continued
Security Valuation - continued
Debt securities, including restricted securities, are valued based on evaluated prices received from independent pricing services or from dealers who make markets in such securities. For corporate bonds, floating rate loans and preferred securities, pricing services utilize matrix pricing which considers yield or price of bonds of comparable quality, coupon, maturity and type as well as dealer supplied prices and are generally categorized as Level 2 in the hierarchy. For asset backed securities, collateralized mortgage obligations and commercial mortgage securities, pricing services utilize matrix pricing which considers prepayment speed assumptions, attributes of the collateral, yield or price of bonds of comparable quality, coupon, maturity and type as well as dealer supplied prices and, accordingly, such securities are generally categorized as Level 2 in the hierarchy. When independent prices are unavailable or unreliable, debt securities may be valued utilizing pricing matrices which consider similar factors that would be used by independent pricing services. These are generally categorized as Level 2 in the hierarchy but may be Level 3 depending on the circumstances.
Investments in open-end mutual funds, including the Fidelity Central Funds, are valued at their closing net asset value each business day and are categorized as Level 1 in the hierarchy.
Foreign Currency. The Fund may use foreign currency contracts to facilitate transactions in foreign-denominated securities. Gains and losses from these transactions may arise from changes in the value of the foreign currency or if the counterparties do not perform under the contracts' terms.
Foreign-denominated assets, including investment securities, and liabilities are translated into U.S. dollars at the exchange rate at period end. Purchases and sales of investment securities, income and dividends received and expenses denominated in foreign currencies are translated into U.S. dollars at the exchange rate in effect on the transaction date.
The effects of exchange rate fluctuations on investments are included with the net realized and unrealized gain (loss) on investment securities. Other foreign currency transactions resulting in realized and unrealized gain (loss) are disclosed separately.
Investment Transactions and Income. For financial reporting purposes, the Fund's investment holdings and NAV include trades executed through the end of the last business day of the period. The NAV per share for processing shareholder transactions is calculated as of the close of business of the New York Stock Exchange (NYSE), normally 4:00 p.m. Eastern time and includes trades executed through the end of the prior business day. Gains and losses on securities sold are determined on the basis of identified cost and may include proceeds received from litigation. Dividend income is recorded on
Annual Report
3. Significant Accounting Policies - continued
Investment Transactions and Income - continued
the ex-dividend date, except for certain dividends from foreign securities where the ex-dividend date may have passed, which are recorded as soon as the Fund is informed of the ex-dividend date. Non-cash dividends included in dividend income, if any, are recorded at the fair market value of the securities received. Distributions received on securities that represent a return of capital or capital gain are recorded as a reduction of cost of investments and/or as a realized gain. The Fund estimates the components of distributions received that may be considered return of capital distributions or capital gain distributions. Interest income and distributions from the Fidelity Central Funds are accrued as earned. Interest income includes coupon interest and amortization of premium and accretion of discount on debt securities. For certain lower credit quality securitized assets that have contractual cash flows (for example, asset backed securities, collateralized mortgage obligations and commercial mortgage-backed securities), changes in estimated cash flows are periodically evaluated and the estimated yield is adjusted on a prospective basis over the remaining life of the security, resulting in increases or decreases to Interest Income in the accompanying Statement of Operations. Investment income is recorded net of foreign taxes withheld where recovery of such taxes is uncertain. Debt obligations may be placed on non-accrual status and related interest income may be reduced by ceasing current accruals and writing off interest receivables when the collection of all or a portion of interest has become doubtful based on consistently applied procedures. A debt obligation is removed from non-accrual status when the issuer resumes interest payments or when collectability of interest is reasonably assured.
Expenses. Expenses directly attributable to a fund are charged to that fund. Expenses attributable to more than one fund are allocated among the respective funds on the basis of relative net assets or other appropriate methods. Expense estimates are accrued in the period to which they relate and adjustments are made when actual amounts are known.
Income Tax Information and Distributions to Shareholders. Each year, the Fund intends to qualify as a regulated investment company, including distributing substantially all of its taxable income and realized gains under Subchapter M of the Internal Revenue Code and filing its U.S. federal tax return. As a result, no provision for income taxes is required. As of July 31, 2011, the Fund did not have any unrecognized tax benefits in the financial statements. A fund's federal tax return is subject to examination by the Internal Revenue Service (IRS) for a period of three years. Foreign taxes are provided for based on the Fund's understanding of the tax rules and rates that exist in the foreign markets in which it invests.
Distributions are declared and recorded on the ex-dividend date. Income dividends and capital gain distributions are declared separately for each class. Income and capital gain
Annual Report
Notes to Financial Statements - continued
3. Significant Accounting Policies - continued
Income Tax Information and Distributions to Shareholders - continued
distributions are determined in accordance with income tax regulations, which may differ from GAAP. In addition, the Fund claimed a portion of the payment made to redeeming shareholders as a distribution for income tax purposes.
Capital accounts within the financial statements are adjusted for permanent book-tax differences. These adjustments have no impact on net assets or the results of operations. Temporary book-tax differences will reverse in a subsequent period.
Book-tax differences are primarily due to short-term gain distributions from the Underlying Funds, foreign currency transactions, passive foreign investment companies (PFIC), market discount, equity-debt classifications, partnerships, capital loss carryforwards and losses deferred due to wash sales.
The federal tax cost of investment securities and unrealized appreciation (depreciation) as of period end were as follows:
Gross unrealized appreciation | $ 144,195,864 |
Gross unrealized depreciation | (67,819,922) |
Net unrealized appreciation (depreciation) on securities and other investments | $ 76,375,942 |
| |
Tax Cost | $ 1,752,042,061 |
The tax-based components of distributable earnings as of period end were as follows:
Undistributed ordinary income | $ 19,446,220 |
Undistributed long-term capital gain | $ 8,214,193 |
Net unrealized appreciation (depreciation) | $ 76,400,916 |
Under the recently enacted Regulated Investment Company Modernization Act of 2010 (the Act), the Fund will be permitted to carry forward capital losses incurred in taxable years beginning after December 22, 2010 for an unlimited period. However, any losses incurred during those future taxable years will be required to be utilized prior to any losses incurred in pre-enactment taxable years, which generally expire after eight years from when they are incurred. Additionally, post-enactment capital losses that are carried forward will retain their character as either short-term or long-term capital losses rather than being considered all short-term as under previous law. The Fund's first fiscal year end subject to the Act will be July 31, 2012.
Annual Report
3. Significant Accounting Policies - continued
Income Tax Information and Distributions to Shareholders - continued
The tax character of distributions paid was as follows:
| July 31, 2011 | July 31, 2010 |
Ordinary Income | $ 66,688,371 | $ 40,150,798 |
Short-Term Trading (Redemption) Fees. Shares held by investors in the Fund less than 90 days are subject to a redemption fee equal to .75% of the net asset value of shares redeemed. All redemption fees, which reduce the proceeds of the shareholder redemption, are retained by the Fund and accounted for as an addition to paid in capital.
New Accounting Pronouncement. In May 2011, the Financial Accounting Standards Board issued Accounting Standard Update No. 2011-04, Fair Value Measurement (Topic 820) - Amendments to Achieve Common Fair Value Measurement and Disclosure Requirements in U.S. GAAP and IFRSs. The update changes the wording used to describe the requirements in GAAP for measuring fair value and for disclosing information about fair value measurements. The update is effective during interim and annual periods beginning after December 15, 2011. Management is currently evaluating the impact of the update's adoption on the Fund's financial statement disclosures.
4. Operating Policies.
Restricted Securities. The Fund may invest in securities that are subject to legal or contractual restrictions on resale. These securities generally may be resold in transactions exempt from registration or to the public if the securities are registered. Disposal of these securities may involve time-consuming negotiations and expense, and prompt sale at an acceptable price may be difficult. Information regarding restricted securities is included at the end of the Fund's Schedule of Investments.
Loans and Other Direct Debt Instruments. The Fund may invest in loans and loan participations, trade claims or other receivables. These investments may include standby financing commitments, including revolving credit facilities, that obligate the Fund to supply additional cash to the borrower on demand. Loan participations involve a risk of insolvency of the lending bank or other financial intermediary. The Fund may be contractually obligated to receive approval from the agent bank and/or borrower prior to the sale of these investments.
5. Purchases and Sales of Investments.
Purchases and sales of securities, other than short-term securities and U.S. government securities, aggregated $943,762,957 and $333,450,877, respectively.
Annual Report
Notes to Financial Statements - continued
6. Fees and Other Transactions with Affiliates.
Management Fee. FMR and its affiliates provide the Fund with investment management related services for which the Fund pays a monthly management fee. The management fee is the sum of an individual fund fee rate that is based on an annual rate of .30% of the Fund's average net assets and a group fee rate that averaged .26% during the period. The group fee rate is based upon the average net assets of all the mutual funds advised by FMR. The group fee rate decreases as assets under management increase and increases as assets under management decrease. For the period, the total annual management fee rate was .56% of the Fund's average net assets.
Distribution and Service Plan Fees. In accordance with Rule 12b-1 of the 1940 Act, the Fund has adopted separate Distribution and Service Plans for each class of shares. Certain classes pay Fidelity Distributors Corporation (FDC), an affiliate of FMR, separate Distribution and Service Fees, each of which is based on an annual percentage of each class' average net assets. In addition, FDC may pay financial intermediaries for selling shares of the Fund and providing shareholder support services. For the period, the Distribution and Service Fee rates, total fees and amounts retained by FDC were as follows:
| Distribution
Fee | Service
Fee | Total Fees | Retained
by FDC |
Class A | -% | .25% | $ 69,417 | $ 9,683 |
Class T | -% | .25% | 9,295 | 13 |
Class C | .75% | .25% | 98,902 | 70,558 |
| | | $ 177,614 | $ 80,254 |
Sales Load. FDC may receive a front-end sales charge of up to 4.00% for selling Class A shares, and 4.00% for selling Class T shares, some of which is paid to financial intermediaries for selling shares of the Fund. Depending on the holding period, FDC may receive contingent deferred sales charges levied on Class A, Class T and Class C redemptions. The deferred sales charges range from 1% for Class C, 1.00% for certain purchases of Class A shares and .25% for certain purchases of Class T shares.
For the period, sales charge amounts retained by FDC were as follows:
| Retained
by FDC |
Class A | $ 29,470 |
Class T | 4,886 |
Class C* | 2,608 |
| $ 36,964 |
* When Class C shares are initially sold, FDC pays commissions from its own resources to financial intermediaries through which the sales are made.
Annual Report
6. Fees and Other Transactions with Affiliates - continued
Transfer Agent Fees. Fidelity Investments Institutional Operations Company, Inc. (FIIOC), an affiliate of FMR, is the transfer, dividend disbursing and shareholder servicing agent for each class of the Fund. FIIOC receives account fees and asset-based fees that vary according to the account size and type of account of the shareholders of the respective classes of the Fund. FIIOC pays for typesetting, printing and mailing of shareholder reports, except proxy statements. For the period, transfer agent fees for each class were as follows:
| Amount | % of
Average
Net Assets |
Class A | $ 67,947 | .25 |
Class T | 10,398 | .28 |
Class C | 25,635 | .26 |
Real Estate Income | 4,020,697 | .29 |
Institutional Class | 52,976 | .26 |
| $ 4,177,653 | |
Accounting and Security Lending Fees. Fidelity Service Company, Inc. (FSC), an affiliate of FMR, maintains the Fund's accounting records. The accounting fee is based on the level of average net assets for the month. Under a separate contract, FSC administers the security lending program. The security lending fee is based on the number and duration of lending transactions.
Brokerage Commissions. The Fund placed a portion of its portfolio transactions with brokerage firms which are affiliates of the investment adviser. The commissions paid to these affiliated firms were $16,317 for the period.
7. Committed Line of Credit.
The Fund participates with other funds managed by FMR or an affiliate in a $4.0 billion credit facility (the "line of credit") to be utilized for temporary or emergency purposes to fund shareholder redemptions or for other short-term liquidity purposes. The Fund has agreed to pay commitment fees on its pro-rata portion of the line of credit, which amounted to $4,526 and is reflected in Miscellaneous expenses on the Statement of Operations. During the period, there were no borrowings on this line of credit.
8. Security Lending.
The Fund lends portfolio securities through a lending agent from time to time in order to earn additional income. The lending agent may loan securities to certain qualified borrowers, including Fidelity Capital Markets (FCM), a broker-dealer affiliated with the Fund. On the settlement date of the loan, the Fund receives collateral (in the form of
Annual Report
Notes to Financial Statements - continued
8. Security Lending - continued
U.S. Treasury obligations, letters of credit and/or cash) against the loaned securities and maintains collateral in an amount not less than 100% of the market value of the loaned securities during the period of the loan. The market value of the loaned securities is determined at the close of business of the Fund and any additional required collateral is delivered to the Fund on the next business day. If the borrower defaults on its obligation to return the securities loaned because of insolvency or other reasons, a fund could experience delays and costs in recovering the securities loaned or in gaining access to the collateral. Any cash collateral received is invested in the Fidelity Securities Lending Cash Central Fund. The value of loaned securities and cash collateral at period end are disclosed on the Fund's Statement of Assets and Liabilities. At period end, there were no security loans outstanding with FCM. Security lending income represents the income earned on investing cash collateral, less rebates paid to borrowers and lending agent fees associated with the loan, plus any premium payments received for lending certain types of securities. Security lending income is presented in the Statement of Operations as a component of income from Fidelity Central Funds. Total security lending income during the period amounted to $34,762, including $8,492 from securities loaned to FCM.
9. Bank Borrowings.
The Fund is permitted to have bank borrowings for temporary or emergency purposes to fund shareholder redemptions or for other short-term liquidity requirements. The Fund has established borrowing arrangements with certain banks. The interest rate on the borrowings is the bank's base rate, as revised from time to time. The average daily loan balance during the period for which loans were outstanding amounted to $16,530,000. The weighted average interest rate was .71%. The interest expense amounted to $326 under the bank borrowing program. At period end, there were no bank borrowings outstanding.
10. Expense Reductions.
FMR voluntarily agreed to reimburse a portion of the Fund's operating expenses. During the period, this reimbursement reduced the Real Estate Income Class expenses by $16,722.
Many of the brokers with whom FMR places trades on behalf of the Fund provided services to the Fund in addition to trade execution. These services included payments of certain expenses on behalf of the Fund totaling $24,961 for the period. In addition, through arrangements with the Fund's custodian, credits realized as a result of uninvested cash balances were used to reduce the Fund's expenses. During the period, these credits reduced the Fund's custody expenses by $658.
Annual Report
11. Distributions to Shareholders.
Distributions to shareholders of each class were as follows:
Years ended July 31, | 2011 | 2010 A |
From net investment income | | |
Class A | $ 1,154,662 | $ 23,172 |
Class T | 160,366 | 6,447 |
Class C | 358,357 | 3,705 |
Real Estate Income | 64,149,915 | 40,107,971 |
Institutional Class | 865,071 | 9,503 |
Total | $ 66,688,371 | $ 40,150,798 |
A Distributions for Class A, Class T, Class C and Institutional Class Shares are for the period April 14, 2010 (commencement of sale of shares) to July 31, 2010.
12. Share Transactions.
Transactions for each class of shares were as follows:
| Shares | Dollars |
Years ended July 31, | 2011 | 2010 A | 2011 | 2010 A |
Class A | | | | |
Shares sold | 5,544,292 | 402,260 | $ 58,675,375 | $ 3,960,293 |
Reinvestment of distributions | 75,836 | 1,072 | 799,911 | 10,302 |
Shares redeemed | (384,554) | (18,182) | (4,105,728) | (177,559) |
Net increase (decrease) | 5,235,574 | 385,150 | $ 55,369,558 | $ 3,793,036 |
Class T | | | | |
Shares sold | 662,414 | 85,986 | $ 7,018,853 | $ 847,305 |
Reinvestment of distributions | 12,671 | 671 | 132,964 | 6,447 |
Shares redeemed | (50,669) | (17) | (536,547) | (166) |
Net increase (decrease) | 624,416 | 86,640 | $ 6,615,270 | $ 853,586 |
Class C | | | | |
Shares sold | 2,030,776 | 84,053 | $ 21,411,850 | $ 827,207 |
Reinvestment of distributions | 29,432 | 378 | 309,638 | 3,628 |
Shares redeemed | (125,083) | (281) | (1,328,625) | (2,700) |
Net increase (decrease) | 1,935,125 | 84,150 | $ 20,392,863 | $ 828,135 |
Real Estate Income | | | | |
Shares sold | 89,725,340 | 69,175,263 | $ 943,333,748 | $ 650,744,676 |
Reinvestment of distributions | 5,601,468 | 4,018,182 | 58,273,356 | 36,922,410 |
Shares redeemed | (44,449,757) | (26,105,432) | (467,916,333) | (245,525,556) |
Net increase (decrease) | 50,877,051 | 47,088,013 | $ 533,690,771 | $ 442,141,530 |
Annual Report
Notes to Financial Statements - continued
12. Share Transactions - continued
| Shares | Dollars |
Years ended July 31, | 2011 | 2010 A | 2011 | 2010 A |
Institutional Class | | | | |
Shares sold | 4,361,479 | 294,304 | $ 46,245,871 | $ 2,886,826 |
Reinvestment of distributions | 55,523 | 902 | 583,903 | 8,663 |
Shares redeemed | (681,623) | (733) | (7,257,237) | (7,109) |
Net increase (decrease) | 3,735,379 | 294,473 | $ 39,572,537 | $ 2,888,380 |
A Share transactions for Class A, Class T, Class C and Institutional Class Shares are for the period April 14, 2010 (commencement of sale of shares) to July 31, 2010.
13. Other.
The Fund's organizational documents provide former and current trustees and officers with a limited indemnification against liabilities arising in connection with the performance of their duties to the Fund. In the normal course of business, the Fund may also enter into contracts that provide general indemnifications. The Fund's maximum exposure under these arrangements is unknown as this would be dependent on future claims that may be made against the Fund. The risk of material loss from such claims is considered remote.
Annual Report
To the Trustees of Fidelity Securities Fund and Shareholders of Fidelity Real Estate Income Fund:
We have audited the accompanying statement of assets and liabilities of Fidelity Real Estate Income Fund (the Fund), a fund of Fidelity Securities Fund, including the schedule of investments, as of July 31, 2011, and the related statement of operations for the year then ended, the statement of changes in net assets for each of the two years in the period then ended, and the financial highlights for each of the five years in the period then ended. These financial statements and financial highlights are the responsibility of the Fund's management. Our responsibility is to express an opinion on these financial statements and financial highlights based on our audits.
We conducted our audits in accordance with the standards of the Public Company Accounting Oversight Board (United States). Those standards require that we plan and perform the audit to obtain reasonable assurance about whether the financial statements and financial highlights are free of material misstatement. The Fund is not required to have, nor were we engaged to perform, an audit of its internal control over financial reporting. Our audits included consideration of internal control over financial reporting as a basis for designing audit procedures that are appropriate in the circumstances, but not for the purpose of expressing an opinion on the effectiveness of the Fund's internal control over financial reporting. Accordingly, we express no such opinion. An audit also includes examining, on a test basis, evidence supporting the amounts and disclosures in the financial statements, assessing the accounting principles used and significant estimates made by management, as well as evaluating the overall financial statement presentation. Our procedures included confirmation of securities owned as of July 31, 2011, by correspondence with the custodians and brokers; where replies were not received from brokers, we performed other auditing procedures. We believe that our audits provide a reasonable basis for our opinion.
In our opinion, the financial statements and financial highlights referred to above present fairly, in all material respects, the financial position of Fidelity Real Estate Income Fund as of July 31, 2011, the results of its operations for the year then ended, the changes in its net assets for each of the two years in the period then ended, and the financial highlights for each of the five years in the period then ended, in conformity with accounting principles generally accepted in the United States of America.
/s/ Deloitte & Touche LLP
DELOITTE & TOUCHE LLP
Boston, Massachusetts
September 20, 2011
Annual Report
The Trustees, Members of the Advisory Board, and executive officers of the trust and fund, as applicable, are listed below. The Board of Trustees governs the fund and is responsible for protecting the interests of shareholders. The Trustees are experienced executives who meet periodically throughout the year to oversee the fund's activities, review contractual arrangements with companies that provide services to the fund, oversee management of the risks associated with such activities and contractual arrangements, and review the fund's performance. Except for James C. Curvey, each of the Trustees oversees 221 funds advised by FMR or an affiliate. Mr. Curvey oversees 419 funds advised by FMR or an affiliate.
The Trustees hold office without limit in time except that (a) any Trustee may resign; (b) any Trustee may be removed by written instrument, signed by at least two-thirds of the number of Trustees prior to such removal; (c) any Trustee who requests to be retired or who has become incapacitated by illness or injury may be retired by written instrument signed by a majority of the other Trustees; and (d) any Trustee may be removed at any special meeting of shareholders by a two-thirds vote of the outstanding voting securities of the trust. Each Trustee who is not an interested person (as defined in the 1940 Act) (Independent Trustee), shall retire not later than the last day of the calendar year in which his or her 75th birthday occurs. The Independent Trustees may waive this mandatory retirement age policy with respect to individual Trustees. The executive officers and Advisory Board Members hold office without limit in time, except that any officer and Advisory Board Member may resign or may be removed by a vote of a majority of the Trustees at any regular meeting or any special meeting of the Trustees. Except as indicated, each individual has held the office shown or other offices in the same company for the past five years.
Experience, Skills, Attributes, and Qualifications of the Fund's Trustees. The Governance and Nominating Committee has adopted a statement of policy that describes the experience, qualifications, attributes, and skills that are necessary and desirable for potential Independent Trustee candidates (Statement of Policy). The Board believes that each Trustee satisfied at the time he or she was initially elected or appointed a Trustee, and continues to satisfy, the standards contemplated by the Statement of Policy. The Governance and Nominating Committee also engages professional search firms to help identify potential Independent Trustee candidates who have the experience, qualifications, attributes, and skills consistent with the Statement of Policy. From time to time, additional criteria based on the composition and skills of the current Independent Trustees, as well as experience or skills that may be appropriate in light of future changes to board composition, business conditions, and regulatory or other developments, have also been considered by the professional search firms and the Governance and Nominating Committee. In addition, the Board takes into account the Trustees' commitment and participation in Board and committee meetings, as well as their leadership of standing and ad hoc committees throughout their tenure.
In determining that a particular Trustee was and continues to be qualified to serve as a Trustee, the Board has considered a variety of criteria, none of which, in isolation, was controlling. The Board believes that, collectively, the Trustees have balanced and diverse experience, qualifications, attributes, and skills, which allow the Board to operate effectively in governing the fund and protecting the interests of shareholders. Information about the specific experience, skills, attributes, and qualifications of each Trustee, which in each case led to the Board's conclusion that the Trustee should serve (or continue to serve) as a trustee of the fund, is provided below.
Annual Report
Trustees and Officers - continued
Board Structure and Oversight Function. James C. Curvey is an interested person (as defined in the 1940 Act) and currently serves as Acting Chairman. The Trustees have determined that an interested Chairman is appropriate and benefits shareholders because an interested Chairman has a personal and professional stake in the quality and continuity of services provided to the fund. Independent Trustees exercise their informed business judgment to appoint an individual of their choosing to serve as Chairman, regardless of whether the Trustee happens to be independent or a member of management. The Independent Trustees have determined that they can act independently and effectively without having an Independent Trustee serve as Chairman and that a key structural component for assuring that they are in a position to do so is for the Independent Trustees to constitute a substantial majority for the Board. The Independent Trustees also regularly meet in executive session. Ned C. Lautenbach serves as Chairman of the Independent Trustees and as such (i) acts as a liaison between the Independent Trustees and management with respect to matters important to the Independent Trustees and (ii) with management prepares agendas for Board meetings.
Fidelity funds are overseen by different Boards of Trustees. The fund's Board oversees Fidelity's equity and high income funds and another Board oversees Fidelity's investment-grade bond, money market, and asset allocation funds. The asset allocation funds may invest in Fidelity funds overseen by the fund's Board. The use of separate Boards, each with its own committee structure, allows the Trustees of each group of Fidelity funds to focus on the unique issues of the funds they oversee, including common research, investment, and operational issues. On occasion, the separate Boards establish joint committees to address issues of overlapping consequences for the Fidelity funds overseen by each Board.
The Trustees operate using a system of committees to facilitate the timely and efficient consideration of all matters of importance to the Trustees, the fund, and fund shareholders and to facilitate compliance with legal and regulatory requirements and oversight of the fund's activities and associated risks. The Board, acting through its committees, has charged FMR and its affiliates with (i) identifying events or circumstances the occurrence of which could have demonstrably adverse effects on the fund's business and/or reputation; (ii) implementing processes and controls to lessen the possibility that such events or circumstances occur or to mitigate the effects of such events or circumstances if they do occur; and (iii) creating and maintaining a system designed to evaluate continuously business and market conditions in order to facilitate the identification and implementation processes described in (i) and (ii) above. Because the day-to-day operations and activities of the fund are carried out by or through FMR, its affiliates and other service providers, the fund's exposure to risks is mitigated but not eliminated by the processes overseen by the Trustees. While each of the Board's committees has responsibility for overseeing different aspects of the fund's activities, oversight is exercised primarily through the Operations, Audit, and Compliance Committees. Appropriate personnel, including but not limited to the fund's Chief Compliance Officer (CCO), FMR's internal auditor, the independent accountants, the fund's Treasurer and portfolio management personnel, make periodic reports to the Board's committees, as appropriate. The responsibilities of each committee, including their oversight responsibilities, are described further under "Standing Committees of the Fund's Trustees."
Annual Report
The fund's Statement of Additional Information (SAI) includes more information about the Trustees. To request a free copy, call Fidelity at 1-877-208-0098.
Interested Trustees*:
Correspondence intended for each Trustee who is an interested person may be sent to Fidelity Investments, 82 Devonshire Street, Boston, Massachusetts 02109.
Name, Age; Principal Occupations and Other Relevant Experience+ |
James C. Curvey (76) |
| Year of Election or Appointment: 2007
Mr. Curvey is Trustee and Acting Chairman of the Board of Trustees of certain Trusts. Mr. Curvey also serves as Trustee (2007-present) of other investment companies advised by FMR. Mr. Curvey is a Director of Fidelity Investments Money Management, Inc. (2009-present), Director of Fidelity Research & Analysis Co. (2009-present) and Director of FMR and FMR Co., Inc. (2007-present). Mr. Curvey is also Vice Chairman (2007-present) and Director of FMR LLC. In addition, Mr. Curvey serves as an Overseer for the Boston Symphony Orchestra and a member of the Trustees of Villanova University. Previously, Mr. Curvey was the Vice Chairman (2006-2007) and Director (2000-2007) of FMR Corp. |
Ronald P. O'Hanley (54) |
| Year of Election or Appointment: 2011
Mr. O'Hanley is Director of FMR Co., Inc. (2010-present), Director of Fidelity Investments Money Management, Inc. (2010-present), Director of Fidelity Research & Analysis Company (2010-present), President of Fidelity Asset Management and Corporate Services and a member of Fidelity's Executive Committee (2010-present). Previously, Mr. O'Hanley served as President and Chief Executive Officer of BNY Mellon Asset Management (2007-2010). Mr. O'Hanley also served as Vice Chairman of Bank New York Mellon Corp. and a member of that firm's Executive Committee. Prior to the 2007 merger of The Bank of New York and Mellon Financial Corporation, he was Vice Chairman of Mellon Financial Corporation and President and Chief Executive Officer of Mellon Asset Management. He joined Mellon in February 1997. Mr. O'Hanley currently serves as Chairman of the Boston Public Library Foundation Board of Directors and sits on the Board of Directors of Beth Israel Deaconess Medical Center, the Board of Trustees of the Marine Biological Laboratory and the Advisory Board of the Maxwell School of Citizenship and Public Administration at Syracuse University. Mr. O'Hanley also chairs the Council on Asset Management for the Financial Services Roundtable and is a member of the Board of Directors of Institutional Investor's U.S. Institute. |
* Trustees have been determined to be "Interested Trustees" by virtue of, among other things, their affiliation with the trust or various entities under common control with FMR.
+ The information above includes each Trustee's principal occupation during the last five years and other information relating to the experience, attributes, and skills relevant to each Trustee's qualifications to serve as a Trustee, which led to the conclusion that each Trustee should serve as a Trustee for the fund.
Annual Report
Independent Trustees:
Correspondence intended for each Independent Trustee (that is, the Trustees other than the Interested Trustees) may be sent to Fidelity Investments, P.O. Box 55235, Boston, Massachusetts 02205-5235.
Name, Age; Principal Occupations and Other Relevant Experience+ |
Dennis J. Dirks (63) |
| Year of Election or Appointment: 2005 Prior to his retirement in May 2003, Mr. Dirks was Chief Operating Officer and a member of the Board of The Depository Trust & Clearing Corporation (DTCC). He also served as President, Chief Operating Officer, and Board member of The Depository Trust Company (DTC) and President and Board member of the National Securities Clearing Corporation (NSCC). In addition, Mr. Dirks served as Chief Executive Officer and Board member of the Government Securities Clearing Corporation, Chief Executive Officer and Board member of the Mortgage-Backed Securities Clearing Corporation, as a Trustee and a member of the Finance Committee of Manhattan College (2005-2008), and as a Trustee and a member of the Finance Committee of AHRC of Nassau County (2006-2008). Mr. Dirks is a member of the Independent Directors Council (IDC) Governing Council (2010-Present) and Board of Directors for The Brookville Center for Children's Services, Inc. (2009-present). |
Alan J. Lacy (57) |
| Year of Election or Appointment: 2008 Mr. Lacy serves as Senior Adviser (2007-present) of Oak Hill Capital Partners, L.P. (private equity). Mr. Lacy also served as Chief Executive Officer (2000-2005) and Vice Chairman (2005-2006) of Sears Holdings Corporation and Sears, Roebuck and Co. (retail). In addition, Mr. Lacy serves as a member of the Board of Directors of Dave & Buster's, Inc. (restaurant and entertainment complexes, 2010-present), The Hillman Companies, Inc. (hardware wholesalers, 2010-present), and Bristol-Myers Squibb Company (global pharmaceuticals, 2007-present). Mr. Lacy is a member of the Board of Trustees of The National Parks Conservation Association (2006-Present). Previously, Mr. Lacy served as Chairman of the Board of Trustees of the National Parks Conservation Association (2008-2011) and as a member of the Board of Directors for the Western Union Company (global money transfer, 2006-2011). |
Ned C. Lautenbach (67) |
| Year of Election or Appointment: 2000 Mr. Lautenbach is Chairman of the Independent Trustees of the Equity and High Income Funds (2006-present). Mr. Lautenbach currently serves as the Lead Director of the Eaton Corporation Board of Directors (diversified industrial, 1997-present). Mr. Lautenbach is also a member of the Board of Directors of the Philharmonic Center for the Arts in Naples, Florida (1999-present); a member of the Board of Trustees of Fairfield University (2005-present); and a member of the Council on Foreign Relations (1994-present). Previously, Mr. Lautenbach was a Partner/Advisory Partner at Clayton, Dubilier & Rice, LLC (private equity investment, 1998-2010), as well as a Director of Sony Corporation (2006-2007). |
Joseph Mauriello (66) |
| Year of Election or Appointment: 2008 Prior to his retirement in January 2006, Mr. Mauriello served in numerous senior management positions including Deputy Chairman and Chief Operating Officer (2004-2005), and Vice Chairman of Financial Services (2002-2004) of KPMG LLP US (professional services, 1965-2005). Mr. Mauriello currently serves as a member of the Board of Directors of XL Group plc. (global insurance and re-insurance, 2006-present) and of Arcadia Resources Inc. (health care services and products, 2007-present). Previously, Mr. Mauriello served as a Director of the Hamilton Funds of the Bank of New York (2006-2007). |
Robert W. Selander (60) |
| Year of Election or Appointment: 2011
Previously, Mr. Selander served as a Member of the Advisory Board of Fidelity's Equity and High Income Funds (2011), Executive Vice Chairman (2010), Chief Executive Officer (2009-2010), and President and Chief Executive Officer (1997-2009) of Mastercard, Inc. |
Cornelia M. Small (67) |
| Year of Election or Appointment: 2005 Ms. Small is a member of the Board of Directors of the Teagle Foundation (2009-present). Ms. Small is also a member of the Investment Committee, and Chair (2008-present) and a member of the Board of Trustees of Smith College. In addition, Ms. Small serves on the Investment Committee of the Berkshire Taconic Community Foundation (2008-present). Previously, Ms. Small served as Chairperson of the Investment Committee (2002-2008) of Smith College. In addition, Ms. Small served as Chief Investment Officer, Director of Global Equity Investments, and a member of the Board of Directors of Scudder, Stevens & Clark and Scudder Kemper Investments. |
William S. Stavropoulos (72) |
| Year of Election or Appointment: 2002 Mr. Stavropoulos is Vice Chairman of the Independent Trustees of the Equity and High Income Funds (2006-present). Mr. Stavropoulos serves as President and Founder of the Michigan Baseball Foundation, the Great Lakes Loons (2007-present). Mr. Stavropoulos is Chairman Emeritus of the Board of Directors of The Dow Chemical Company, where he previously served in numerous senior management positions, including President, CEO (1995-2000; 2002-2004), Chairman of the Executive Committee (2000-2006), and as a member of the Board of Directors (1990-2006). Currently, Mr. Stavropoulos is Chairman of Univar (global distributor of commodity and specialty chemicals, 2010-present), a Director of Teradata Corporation (data warehousing and technology solutions, 2008-present), Chemical Financial Corporation, Maersk Inc. (industrial conglomerate), Tyco International, Inc. (multinational manufacturing and services, 2007-present), and a member of the Advisory Board for Metalmark Capital (private equity investment, 2005-present). Mr. Stavropoulos is a special advisor to Clayton, Dubilier & Rice, LLC (private equity investment). In addition, Mr. Stavropoulos is a member of the University of Notre Dame Advisory Council for the College of Science. |
David M. Thomas (62) |
| Year of Election or Appointment: 2008 Previously, Mr. Thomas served as Executive Chairman (2005-2006) and Chairman and Chief Executive Officer (2000-2005) of IMS Health, Inc. (pharmaceutical and healthcare information solutions). In addition, Mr. Thomas serves as a member of the Board of Directors of Fortune Brands, Inc. (consumer products), and Interpublic Group of Companies, Inc. (marketing communication, 2004-present). |
Michael E. Wiley (60) |
| Year of Election or Appointment: 2008 Mr. Wiley also serves as a Director of Asia Pacific Exploration Consolidated (international oil and gas exploration and production, 2008-present). Mr. Wiley serves as a Director of Tesoro Corporation (independent oil refiner and marketer, 2005-present), and a Director of Bill Barrett Corporation (exploration and production, 2005-present). In addition, Mr. Wiley also serves as a Director of Post Oak Bank (privately-held bank, 2004-present). Previously, Mr. Wiley served as a member of the Board of Trustees of the University of Tulsa (2000-2006; 2007-2010), as a Senior Energy Advisor of Katzenbach Partners, LLC (consulting, 2006-2007), as an Advisory Director of Riverstone Holdings (private investment), Chairman, President, and CEO of Baker Hughes, Inc. (oilfield services, 2000-2004), and as Director of Spinnaker Exploration Company (exploration and production, 2001-2005). |
Annual Report
Trustees and Officers - continued
+ The information above includes each Trustee's principal occupation during the last five years and other information relating to the experience, attributes, and skills relevant to each Trustee's qualifications to serve as a Trustee, which led to the conclusion that each Trustee should serve as a Trustee for the fund.
Advisory Board Members and Executive Officers:
Correspondence intended for each executive officer, Edward C. Johnson 3d, and Peter S. Lynch may be sent to Fidelity Investments, 82 Devonshire Street, Boston, Massachusetts 02109.
Name, Age; Principal Occupation |
Edward C. Johnson 3d (81) |
| Year of Election or Appointment: 2011 Member of the Advisory Board of Fidelity's Equity and High Income Funds. Mr. Johnson serves as Chief Executive Officer, Chairman, and a Director of FMR LLC, and also serves as Chairman and Director of FIL Limited. Previously, Mr. Johnson served as a Trustee and Chairman of the Board of certain Fidelity Trusts, Chairman and a Director of FMR, Chairman and a Director of FMR Co., Inc., and President of FMR LLC (2006-2007). |
Peter S. Lynch (67) |
| Year of Election or Appointment: 2003 Member of the Advisory Board of Fidelity's Equity and High Income Funds. Mr. Lynch is Vice Chairman and a Director of FMR and FMR Co., Inc. In addition, Mr. Lynch serves as a Trustee of Boston College and as the Chairman of the Inner-City Scholarship Fund. Previously, Mr. Lynch served on the Special Olympics International Board of Directors (1997-2006). |
Kenneth B. Robins (41) |
| Year of Election or Appointment: 2008 President and Treasurer of Fidelity's Equity and High Income Funds. Mr. Robins also serves as President and Treasurer (2010-present) and Assistant Treasurer (2009-present) of other Fidelity funds and is an employee of Fidelity Investments (2004-present). Previously, Mr. Robins served as Deputy Treasurer of the Fidelity funds (2005-2008) and Treasurer and Chief Financial Officer of The North Carolina Capital Management Trust: Cash and Term Portfolios (2006-2008). |
Brian B. Hogan (46) |
| Year of Election or Appointment: 2009 Vice President of Equity and High Income Funds. Mr. Hogan also serves as President of FMR's Equity Division (2009-present). Previously, Mr. Hogan served as Senior Vice President, Equity Research of FMR (2006-2009) and as a portfolio manager. |
Christopher S. Bartel (39) |
| Year of Election or Appointment: 2009 Vice President of Fidelity's Sector and Real Estate Equity Funds. Mr. Bartel also serves as Senior Vice President of Equity Research (2009-present). Previously, Mr. Bartel served as Managing Director of Research (2006-2009) and an analyst and portfolio manager (2000-2006). |
Scott C. Goebel (43) |
| Year of Election or Appointment: 2008
Secretary and Chief Legal Officer (CLO) of the Fidelity funds. Mr. Goebel also serves as Secretary of Fidelity Investments Money Management, Inc. (FIMM) (2010-present) and Fidelity Research and Analysis Company (FRAC) (2010-present); Secretary and CLO of The North Carolina Capital Management Trust: Cash and Term Portfolios (2008-present); General Counsel, Secretary, and Senior Vice President of FMR (2008-present) and FMR Co., Inc. (2008-present); employed by FMR LLC or an affiliate (2001-present); Chief Legal Officer of Fidelity Management & Research (Hong Kong) Limited (2008-present) and Assistant Secretary of Fidelity Management & Research (Japan) Inc. (2008-present), and Fidelity Management & Research (U.K.) Inc. (2008-present). Previously, Mr. Goebel served as Assistant Secretary of FIMM (2008-2010), FRAC (2008-2010), and the Funds (2007-2008) and as Vice President and Secretary of Fidelity Distributors Corporation (FDC) (2005-2007). |
William C. Coffey (42) |
| Year of Election or Appointment: 2009 Assistant Secretary of Fidelity's Equity and High Income Funds. Mr. Coffey also serves as Senior Vice President and Deputy General Counsel of FMR LLC (2010-present), and is an employee of Fidelity Investments. Previously, Mr. Coffey served as Vice President and Associate General Counsel of FMR LLC (2005-2009). |
Holly C. Laurent (57) |
| Year of Election or Appointment: 2008 Anti-Money Laundering (AML) Officer of the Fidelity funds. Ms. Laurent also serves as AML Officer of The North Carolina Capital Management Trust: Cash and Term Portfolios (2008-present) and is an employee of Fidelity Investments. Previously, Ms. Laurent was Senior Vice President and Head of Legal for Fidelity Business Services India Pvt. Ltd. (2006-2008), and Senior Vice President, Deputy General Counsel and Group Head for FMR LLC (2005-2006). |
Christine Reynolds (52) |
| Year of Election or Appointment: 2008 Chief Financial Officer of the Fidelity funds. Ms. Reynolds became President of Fidelity Pricing and Cash Management Services (FPCMS) in August 2008. Ms. Reynolds served as Chief Operating Officer of FPCMS (2007-2008). Previously, Ms. Reynolds served as President, Treasurer, and Anti-Money Laundering officer of the Fidelity funds (2004-2007). |
Kenneth A. Rathgeber (64) |
| Year of Election or Appointment: 2004 Chief Compliance Officer of Fidelity's Equity and High Income Funds. Mr. Rathgeber is Chief Compliance Officer of Fidelity Management & Research (Hong Kong) Limited (2008-present), Fidelity Management & Research (Japan) Inc. (2008-present), FMR (2005-present), FMR Co., Inc. (2005-present), Fidelity Management & Research (U.K.) Inc. (2005-present), Fidelity Research & Analysis Company (2005-present), Fidelity Investments Money Management, Inc. (2005-present), Pyramis Global Advisors, LLC (2005-present), and Strategic Advisers, Inc. (2005-present). |
Jeffrey S. Christian (49) |
| Year of Election or Appointment: 2009 Deputy Treasurer of the Fidelity funds. Mr. Christian is an employee of Fidelity Investments. Previously, Mr. Christian served as Chief Financial Officer (2008-2009) of certain Fidelity funds and Senior Vice President of Fidelity Pricing and Cash Management Services (FPCMS) (2004-2009). |
Bryan A. Mehrmann (50) |
| Year of Election or Appointment: 2005 Deputy Treasurer of the Fidelity funds. Mr. Mehrmann is an employee of Fidelity Investments. |
Adrien E. Deberghes (43) |
| Year of Election or Appointment: 2008 Deputy Treasurer of Fidelity's Equity and High Income Funds. Mr. Deberghes also serves as Assistant Treasurer of other Fidelity funds (2010-present) and is an employee of Fidelity Investments (2008-present). Previously, Mr. Deberghes served as Senior Vice President of Mutual Fund Administration at State Street Corporation (2007-2008), Senior Director of Mutual Fund Administration at Investors Bank & Trust (2005-2007), and Director of Finance for Dunkin' Brands (2000-2005). |
Stephanie J. Dorsey (42) |
| Year of Election or Appointment: 2010 Assistant Treasurer of Fidelity's Equity and High Income Funds. Ms. Dorsey also serves as Deputy Treasurer of other Fidelity funds (2008-present) and is an employee of Fidelity Investments (2008-present). Previously, Ms. Dorsey served as Treasurer (2004-2008) of the JPMorgan Mutual Funds and Vice President (2004-2008) of JPMorgan Chase Bank. |
John R. Hebble (53) |
| Year of Election or Appointment: 2009 Assistant Treasurer of Fidelity's Equity and High Income Funds. Mr. Hebble also serves as President (2011-present), Treasurer, and Chief Financial Officer of The North Carolina Capital Management Trust: Cash and Term Portfolios (2008-present), President and Treasurer of other Fidelity funds (2008-present) and is an employee of Fidelity Investments. |
Gary W. Ryan (52) |
| Year of Election or Appointment: 2005 Assistant Treasurer of the Fidelity funds. Mr. Ryan is an employee of Fidelity Investments. Previously, Mr. Ryan served as Vice President of Fund Reporting in Fidelity Pricing and Cash Management Services (FPCMS) (1999-2005). |
Jonathan Davis (43) |
| Year of Election or Appointment: 2010 Assistant Treasurer of the Fidelity funds. Mr. Davis is an employee of Fidelity Investments. Previously, Mr. Davis served as Vice President and Associate General Counsel of FMR LLC (2003-2010). |
Annual Report
The Board of Trustees of Fidelity Real Estate Income Fund voted to pay on September 6, 2011, to shareholders of record at the opening of business on September 2, 2011, a distribution of $0.052 per share derived from capital gains realized from sales of portfolio securities and a dividend of $0.15 per share from net investment income.
The fund hereby designates as a capital gain dividend with respect to the taxable year ended July 31, 2011, $10,590,637, or, if subsequently determined to be different, the net capital gain of such year.
The Institutional Class designates 1.00% of the dividends distributed in March and June as amounts which may be taken into account as a dividend for purposes of the maximum rate under section 1(h)(11) of the Internal Revenue Code.
A total of 0.08% of the dividends distributed during the fiscal year was derived from interest on U.S. Government securities which is generally exempt from state income tax.
The fund will notify shareholders in January 2012 of amounts for use in preparing 2011 income tax returns.
Annual Report
Board Approval of Investment Advisory Contracts and Management Fees
Fidelity Real Estate Income Fund
Each year, the Board of Trustees, including the Independent Trustees (together, the Board), votes on the renewal of the management contract and sub-advisory agreements (together, the Advisory Contracts) for the fund. The Board, assisted by the advice of fund counsel and Independent Trustees' counsel, requests and considers a broad range of information relevant to the renewal of the Advisory Contracts throughout the year.
The Board meets regularly and considers at each of its meetings factors that are relevant to its annual consideration of the renewal of the fund's Advisory Contracts, including the services and support provided to the fund and its shareholders. The Board has established various standing committees, each composed of Independent Trustees with varying backgrounds, to which the Board has assigned specific subject matter responsibilities in order to enhance effective decision-making by the Board. The Board, acting directly and through its Committees, requests and receives information concerning the annual consideration of the renewal of the fund's Advisory Contracts. The Board also meets as needed to consider matters specifically related to the Board's annual consideration of the renewal of Advisory Contracts. Members of the Board may also meet with trustees of other Fidelity funds through ad hoc joint committees to discuss certain matters relevant to the Fidelity funds.
At its July 2011 meeting, the Board of Trustees, including the Independent Trustees, unanimously determined to renew the fund's Advisory Contracts. In reaching its determination, the Board considered all factors it believed relevant, including (i) the nature, extent, and quality of the services to be provided to the fund and its shareholders (including the investment performance of the fund); (ii) the competitiveness of the fund's management fee and total expense ratio; (iii) the total costs of the services to be provided by and the profits to be realized by Fidelity from its relationship with the fund; (iv) the extent to which economies of scale would be realized as the fund grows; and (v) whether fee levels reflect these economies of scale, if any, for the benefit of fund shareholders.
In considering whether to renew the Advisory Contracts for the fund, the Board reached a determination, with the assistance of fund counsel and Independent Trustees' counsel and through the exercise of its business judgment, that the renewal of the Advisory Contracts is in the best interests of the fund and its shareholders and that the compensation payable under the Advisory Contracts is fair and reasonable. The Board's decision to renew the Advisory Contracts was not based on any single factor, but rather was based on a comprehensive consideration of all the information provided to the Board at its meetings throughout the year. The Board, in reaching its determination to renew the Advisory Contracts, is aware that shareholders in the fund have a broad range of investment choices available to them, including a wide choice among mutual funds offered by Fidelity's competitors, and that the fund's shareholders, who have the opportunity to review and weigh the disclosure provided by the fund in its prospectus and other public disclosures, have chosen to invest in this fund, managed by Fidelity.
Annual Report
Board Approval of Investment Advisory Contracts and
Management Fees - continued
Nature, Extent, and Quality of Services Provided. The Board considered the staffing within the investment adviser, FMR, and the sub-advisers (together, the Investment Advisers), including the backgrounds of the fund's investment personnel and the fund's investment objective and discipline. The Independent Trustees also had discussions with senior management of Fidelity's investment operations and investment groups. The Board considered the structure of the portfolio manager compensation program and whether this structure provides appropriate incentives to act in the best interests of the fund.
Resources Dedicated to Investment Management and Support Services. The Board and the Fund Oversight and Research Committees reviewed the general qualifications and capabilities of the Investment Advisers' investment staff, including its size, education, experience, and resources, as well as the Investment Advisers' approach to recruiting, training, managing, and compensating investment personnel. The Board also noted that FMR has devoted increased resources to non-U.S. offices. The Board noted that Fidelity's analysts have extensive resources, tools and capabilities which allow them to conduct sophisticated quantitative and fundamental analysis, as well as credit analysis of issuers, counterparties and enhancers. The Board also believes that Fidelity's investment professionals have sufficient access to global information and data so as to provide competitive investment results over time, and that those professionals also have access to sophisticated tools which permit them to assess portfolio construction and risk and performance attribution characteristics continuously, as well as to transmit new information and research conclusions rapidly around the world. Additionally, in their deliberations, the Board considered the Investment Advisers' trading capabilities and resources which are an integral part of the investment management process.
Shareholder and Administrative Services. The Board considered (i) the nature, extent, quality, and cost of advisory, administrative, and shareholder services performed by the Investment Advisers and their affiliates under the Advisory Contracts and under separate agreements covering transfer agency, pricing and bookkeeping, and securities lending services for the fund; (ii) the nature and extent of the investment adviser's supervision of third party service providers, principally custodians and subcustodians; and (iii) the resources devoted to, and the record of compliance with, the fund's compliance policies and procedures. The Board also reviewed the allocation of fund brokerage, including allocations to brokers affiliated with the Investment Advisers, the use of brokerage commissions to pay fund expenses, and the use of "soft" commission dollars to pay for research services.
The Board noted that the growth of fund assets over time across the complex allows Fidelity to reinvest in the development of services designed to enhance the value or convenience of the Fidelity funds as investment vehicles. These services include 24-hour access to account information and market information through telephone representatives and over the Internet, investor education materials and asset allocation tools, and the expanded availability of Fidelity Investor Centers, with 35 new branches opening since 2010.
Annual Report
Investment in a Large Fund Family. The Board considered the benefits to shareholders of investing in a Fidelity fund, including the benefits of investing in a fund that is part of a large family of funds offering a variety of investment disciplines and providing a large variety of mutual fund investor services. The Board noted that Fidelity had taken, or had made recommendations that resulted in the Fidelity funds taking, a number of actions over the previous year that benefited particular funds, including (i) continuing to dedicate additional resources to investment research and support of the senior management team that oversees asset management; (ii) rationalizing product lines through the mergers of six funds into other funds; (iii) continuing to migrate the Freedom Funds to dedicated lower cost underlying funds; (iv) obtaining shareholder approval to broaden the investment strategies for Fidelity Consumer Finance Portfolio, Fidelity Emerging Asia Fund, and Fidelity Environment and Alternative Energy Portfolio; (v) contractually agreeing to reduce the management fees and impose other expense limitations on Spartan® 500 Index Fund and U.S. Bond Index Fund in connection with launching new institutional classes of these funds; (vi) changing the name, primary and supplemental benchmarks, and investment policies of Fidelity Global Strategies Fund to support the fund's flexible investment mandate and global orientation; and (vii) reducing the transfer agency account fee rates on certain accounts.
Investment Performance. The Board considered whether the fund has operated in accordance with its investment objective, as well as its record of compliance with its investment restrictions. It also reviewed the fund's absolute investment performance for the retail class, as well as the fund's relative investment performance for the retail class measured over multiple periods against (i) a proprietary custom index, and (ii) a peer group of mutual funds and reviewed by the Board. The following charts considered by the Board show, over the one-, three-, and five-year periods ended December 31, 2010, the cumulative total returns of the retail class of the fund, the cumulative total returns of a proprietary custom index ("benchmark"), and a range of cumulative total returns of a peer group of mutual funds identified by Lipper Inc. as having an investment objective similar to that of the fund. (The Advisor classes of the fund had less than one year of performance as of December 31, 2010). The box within each chart shows the 25th percentile return (bottom of box) and the 75th percentile return (top of box) of the peer group. Returns shown above the box are in the first quartile and returns shown below the box are in the fourth quartile. The percentage beaten number noted below each chart corresponds to the percentile box and represents the percentage of funds in the peer group whose performance was equal to or lower than that of the retail class of the fund. The fund's proprietary custom index is an index developed by FMR that represents the performance of the fund's unmanaged indexes.
Annual Report
Board Approval of Investment Advisory Contracts and
Management Fees - continued
Fidelity Real Estate Income Fund
The Board reviewed the fund's relative investment performance against its peer group and noted that the performance of the retail class of the fund was in the fourth quartile for the one-year period and the first quartile for three- and five-year periods. The Board also noted that the investment performance of the fund was lower than its benchmark for all the periods shown. The Board also reviewed the fund's performance since inception as well as performance in the current year.
Based on its review, the Board concluded that the nature, extent, and quality of services provided to the fund under the Advisory Contracts should benefit the fund's shareholders.
Competitiveness of Management Fee and Total Expense Ratio. The Board considered the fund's management fee and total expense ratio compared to "mapped groups" of competitive funds and classes. Fidelity creates "mapped groups" by combining similar Lipper investment objective categories that have comparable management fee characteristics. Combining Lipper investment objective categories aids the Board's management fee and total expense ratio comparisons by broadening the competitive group used for comparison and by reducing the number of universes to which various Fidelity funds are compared.
Management Fee. The Board considered two proprietary management fee comparisons for the 12-month periods shown in the chart below. The group of Lipper funds used by the Board for management fee comparisons is referred to below as the "Total Mapped Group." The Total Mapped Group is broader than the Lipper peer group used by the Board for performance comparisons because the Total Mapped Group combines several Lipper investment objective categories while the Lipper peer group does not. The Total Mapped Group comparison focuses on a fund's standing relative to the total universe of comparable funds available to investors in terms of gross management fees before expense reimbursements or caps. "TMG %" represents the percentage of funds in the Total Mapped Group that had management fees that were lower than the fund's. For example, a TMG % of 6% means that 94% of the funds in the Total Mapped Group had higher management fees than the fund. The "Asset-Size Peer Group" (ASPG) comparison focuses on a fund's standing relative to non-Fidelity funds similar in size to the fund within the Total Mapped Group. The ASPG represents at least 15% of the funds in the Total Mapped Group with comparable asset size and management fee characteristics, subject to a minimum of 50 funds (or all funds in the Total Mapped Group if fewer than 50). Additional information, such as the ASPG quartile in which the fund's management fee ranked, is also included in the chart and considered by the Board.
Annual Report
Fidelity Real Estate Income Fund
The Board noted that the fund's management fee ranked below the median of its Total Mapped Group and below the median of its ASPG for 2010.
Based on its review, the Board concluded that the fund's management fee is fair and reasonable in light of the services that the fund receives and the other factors considered.
Annual Report
Board Approval of Investment Advisory Contracts and
Management Fees - continued
Total Expense Ratio. In its review of each class's total expense ratio, the Board considered the fund's management fee as well as other fund or class expenses, as applicable, such as transfer agent fees, pricing and bookkeeping fees, fund-paid 12b-1 fees, and custodial, legal, and audit fees. The Board also noted the effects of any waivers and reimbursements on fees and expenses. As part of its review, the Board also considered the current and historical total expense ratios of each class of the fund compared to competitive fund median expenses. Each class of the fund is compared to those funds and classes in the Total Mapped Group (used by the Board for management fee comparisons) that have a similar sales load structure.
The Board noted that the total expense ratio of each class ranked below its competitive median for the period. The Board considered that various factors, including 12b-1 fees, positive or negative performance adjustments, and relatively higher other expenses in the case of small fund size, can affect total expense ratios.
Fees Charged to Other Fidelity Clients. The Board also considered Fidelity fee structures and other information with respect to clients of FMR and its affiliates, such as other mutual funds advised or subadvised by FMR or its affiliates, pension plan clients, and other institutional clients. In March 2010, the Board created an ad hoc joint committee with the board of other Fidelity funds (the Committee) to review and compare Fidelity's institutional investment advisory business with its business of providing services to the Fidelity funds, including the differences in services provided, fees charged, and costs incurred, as well as competition in their respective marketplaces.
Based on its review of total expense ratios and fees charged to other Fidelity clients, the Board concluded that the total expense ratio of each class of the fund was reasonable in light of the services that the fund and its shareholders receive and the other factors considered, including the findings of the Committee.
Costs of the Services and Profitability. The Board considered the revenues earned and the expenses incurred by Fidelity in conducting the business of developing, marketing, distributing, managing, administering and servicing the fund and its shareholders. The Board also considered the level of Fidelity's profits in respect of all the Fidelity funds.
On an annual basis, FMR presents to the Board Fidelity's profitability for the fund. Fidelity calculates the profitability for each fund, as well as aggregate profitability for groups of Fidelity funds and all Fidelity funds, using a series of detailed revenue and cost allocation methodologies which originate with the books and records of Fidelity on which Fidelity's audited financial statements are based. The Audit Committee of the Board reviews any significant changes from the prior year's methodologies.
PricewaterhouseCoopers LLP (PwC), independent registered public accounting firm and auditor to Fidelity and certain Fidelity funds, has been engaged annually by the Board as part of the Board's assessment of Fidelity's profitability analysis. PwC's engagement includes the review and assessment of Fidelity's methodologies used in determining the revenues and expenses attributable to Fidelity's mutual fund business, and completion of agreed-upon procedures surrounding the mathematical accuracy of fund profitability and its conformity to allocation methodologies. After considering PwC's reports issued under the engagement and information provided by Fidelity, the Board concluded that while other allocation methods may also be reasonable, Fidelity's profitability methodologies are reasonable in all material respects.
Annual Report
The Board also reviewed Fidelity's non-fund businesses and fall-out benefits related to the mutual fund business as well as cases where Fidelity's affiliates may benefit from or be related to the fund's business.
The Board considered the costs of the services provided by and the profits realized by Fidelity in connection with the operation of the fund and was satisfied that the profitability was not excessive in the circumstances.
Economies of Scale. The Board considered whether there have been economies of scale in respect of the management of the Fidelity funds, whether the Fidelity funds (including the fund) have appropriately benefited from any such economies of scale, and whether there is potential for realization of any further economies of scale. The Board considered the extent to which the fund will benefit from economies of scale through increased services to the fund, through waivers or reimbursements, or through fee or expense reductions. The Board also noted that in 2009, it and the board of other Fidelity funds created an ad hoc committee (the Economies of Scale Committee) to analyze whether FMR attains economies of scale in respect of the management and servicing of the Fidelity funds, whether the Fidelity funds have appropriately benefited from such economies of scale, and whether there is potential for realization of any further economies of scale.
The Board recognized that the fund's management contract incorporates a "group fee" structure, which provides for lower group fee rates as total fund assets under FMR's management increase, and for higher group fee rates as total fund assets under FMR's management decrease. FMR calculates the group fee rates based on a tiered asset "breakpoint" schedule that varies based on asset class. The Board considered that the group fee is designed to deliver the benefits of economies of scale to fund shareholders when total Fidelity fund assets increase, even if assets of any particular fund are unchanged or have declined, because some portion of Fidelity's costs are attributable to services provided to all Fidelity funds, and all funds benefit if those costs can be allocated among more assets. The Board concluded that, given the group fee structure, fund shareholders will benefit from lower management fees as assets under FMR's management increase at the fund complex level, regardless of whether Fidelity achieves any such economies of scale.
Annual Report
Board Approval of Investment Advisory Contracts and
Management Fees - continued
The Board concluded, taking into account the analysis of the Economies of Scale Committee, that any potential economies of scale are being appropriately shared between fund shareholders and Fidelity.
Additional Information Requested by the Board. In order to develop fully the factual basis for consideration of the Fidelity funds' Advisory Contracts, the Board requested and received additional information on certain topics, including (i) fund performance trends, actions to be taken by FMR to improve certain funds' overall performance, and Fidelity's long-term strategies for certain funds; (ii) portfolio manager changes that have occurred during the past year and length of portfolio manager tenure for different categories of funds over time; (iii) Fidelity's compensation structure for portfolio managers and other key personnel and strategies for attracting and retaining non-investment personnel; (iv) the amount of the investment that each portfolio manager has made in the Fidelity fund(s) that he or she manages; (v) historical trends in Fidelity's realization of fall-out benefits; (vi) Fidelity's group fee structures and the rationale for the individual fee rates of certain funds; (vii) fund profitability methodology and the impact of certain factors on fund profitability results; (viii) trends regarding industry use of performance fee structures and Fidelity's compliance practices with respect to performance adjustment calculations; (ix) the fee structures in place for certain other Fidelity clients; and (x) explanations regarding the relative total expense ratios of certain funds and classes, total expense competitive trends, and actions that might be taken by FMR to reduce total expense ratios for certain funds and classes.
Based on its evaluation of all of the conclusions noted above, and after considering all factors it believed relevant, the Board ultimately concluded that the advisory fee structures are fair and reasonable, and that the fund's Advisory Contracts should be renewed.
Annual Report
Investment Adviser
Fidelity Management & Research Company
Boston, MA
Investment Sub-Advisers
FMR Co., Inc.
Fidelity Management & Research
(Hong Kong) Limited
Fidelity Management & Research
(Japan) Inc.
Fidelity Management & Research
(U.K.) Inc.
General Distributor
Fidelity Distributors Corporation
Boston, MA
Transfer and Service Agents
Fidelity Investments Institutional
Operations Company, Inc.
Boston, MA
Fidelity Service Company, Inc.
Boston, MA
Custodian
Citibank, N.A.
New York, NY
REII-UANN-0911
1.907540.101
Fidelity®
Series Small Cap Opportunities
Fund
Fidelity Series Small Cap Opportunities Fund
Class F
Annual Report
July 31, 2011
(2_fidelity_logos) (Registered_Trademark)
Contents
Performance | <Click Here> | How the fund has done over time. |
Management's Discussion of Fund Performance | <Click Here> | The Portfolio Manager's review of fundperformance and strategy. |
Shareholder Expense Example | <Click Here> | An example of shareholder expenses. |
Investment Changes | <Click Here> | A summary of major shifts in the fund's investments over the past six months. |
Investments | <Click Here> | A complete list of the fund's investments with their market values. |
Financial Statements | <Click Here> | Statements of assets and liabilities, operations, and changes in net assets,
as well as financial highlights. |
Notes | <Click Here> | Notes to the financial statements. |
Report of Independent Registered Public Accounting Firm | <Click Here> | |
Trustees and Officers | <Click Here> | |
Distributions | <Click Here> | |
Board Approval of Investment Advisory Contracts and Management Fees | <Click Here> | |
To view a fund's proxy voting guidelines and proxy voting record for the 12-month period ended June 30, visit http://www.fidelity.com/proxyvotingresults or visit the Securities and Exchange Commission's (SEC) web site at http://www.sec.gov. You may also call 1-800-544-8544 for Fidelity Series Small Cap Opportunities Fund or 1-800-835-5092 for Class F to request a free copy of the proxy voting guidelines.
Standard & Poor's, S&P and S&P 500 are registered service marks of The McGraw-Hill Companies, Inc. and have been licensed for use by Fidelity Distributors Corporation.
Other third party marks appearing herein are the property of their respective owners.
All other marks appearing herein are registered or unregistered trademarks or service marks of FMR LLC or an affiliated company.
Annual Report
This report and the financial statements contained herein are submitted for the general information of the shareholders of the fund. This report is not authorized for distribution to prospective investors in the fund unless preceded or accompanied by an effective prospectus.
A fund files its complete schedule of portfolio holdings with the SEC for the first and third quarters of each fiscal year on Form N-Q. Forms N-Q are available on the SEC's web site at http://www.sec.gov. A fund's Forms N-Q may be reviewed and copied at the SEC's Public Reference Room in Washington, DC. Information regarding the operation of the SEC's Public Reference Room may be obtained by calling 1-800-SEC-0330. For a complete list of a fund's portfolio holdings, view the most recent holdings listing, semiannual report, or annual report on Fidelity's web site at http://www.fidelity.com, http://www.advisor.fidelity.com, or http://www.401k.com, as applicable.
NOT FDIC INSURED • MAY LOSE VALUE • NO BANK GUARANTEE
Neither the fund nor Fidelity Distributors Corporation is a bank.
Annual Report
Average annual total return reflects the change in the value of an investment, assuming reinvestment of the class' distributions from dividend income and capital gains (the profits earned upon the sale of securities that have grown in value, if any) and assuming a constant rate of performance each year. The $10,000 table and the fund's returns do not reflect the deduction of taxes that a shareholder would pay on fund distributions or the redemption of fund shares. During periods of reimbursement by Fidelity, a fund's total return will be greater than it would be had the reimbursement not occurred. How a fund did yesterday is no guarantee of how it will do tomorrow.
Average Annual Total Returns
Periods ended July 31, 2011 | Past 1
year | Life of
fund A |
Fidelity ® Series Small Cap Opportunities Fund | 28.50% | 3.00% |
Class F B | 28.74% | 3.12% |
A From March 22, 2007.
B The initial offering of Class F shares took place on June 26, 2009. Returns prior to June 26, 2009 are those of Fidelity Small Cap Opportunities Fund, the original class of the fund.
$10,000 Over Life of Fund
Let's say hypothetically that $10,000 was invested in Fidelity ® Series Small Cap Opportunities Fund, a class of the fund, on March 22, 2007, when the fund started. The chart shows how the value of your investment would have changed, and also shows how the Russell 2000® Index performed over the same period.
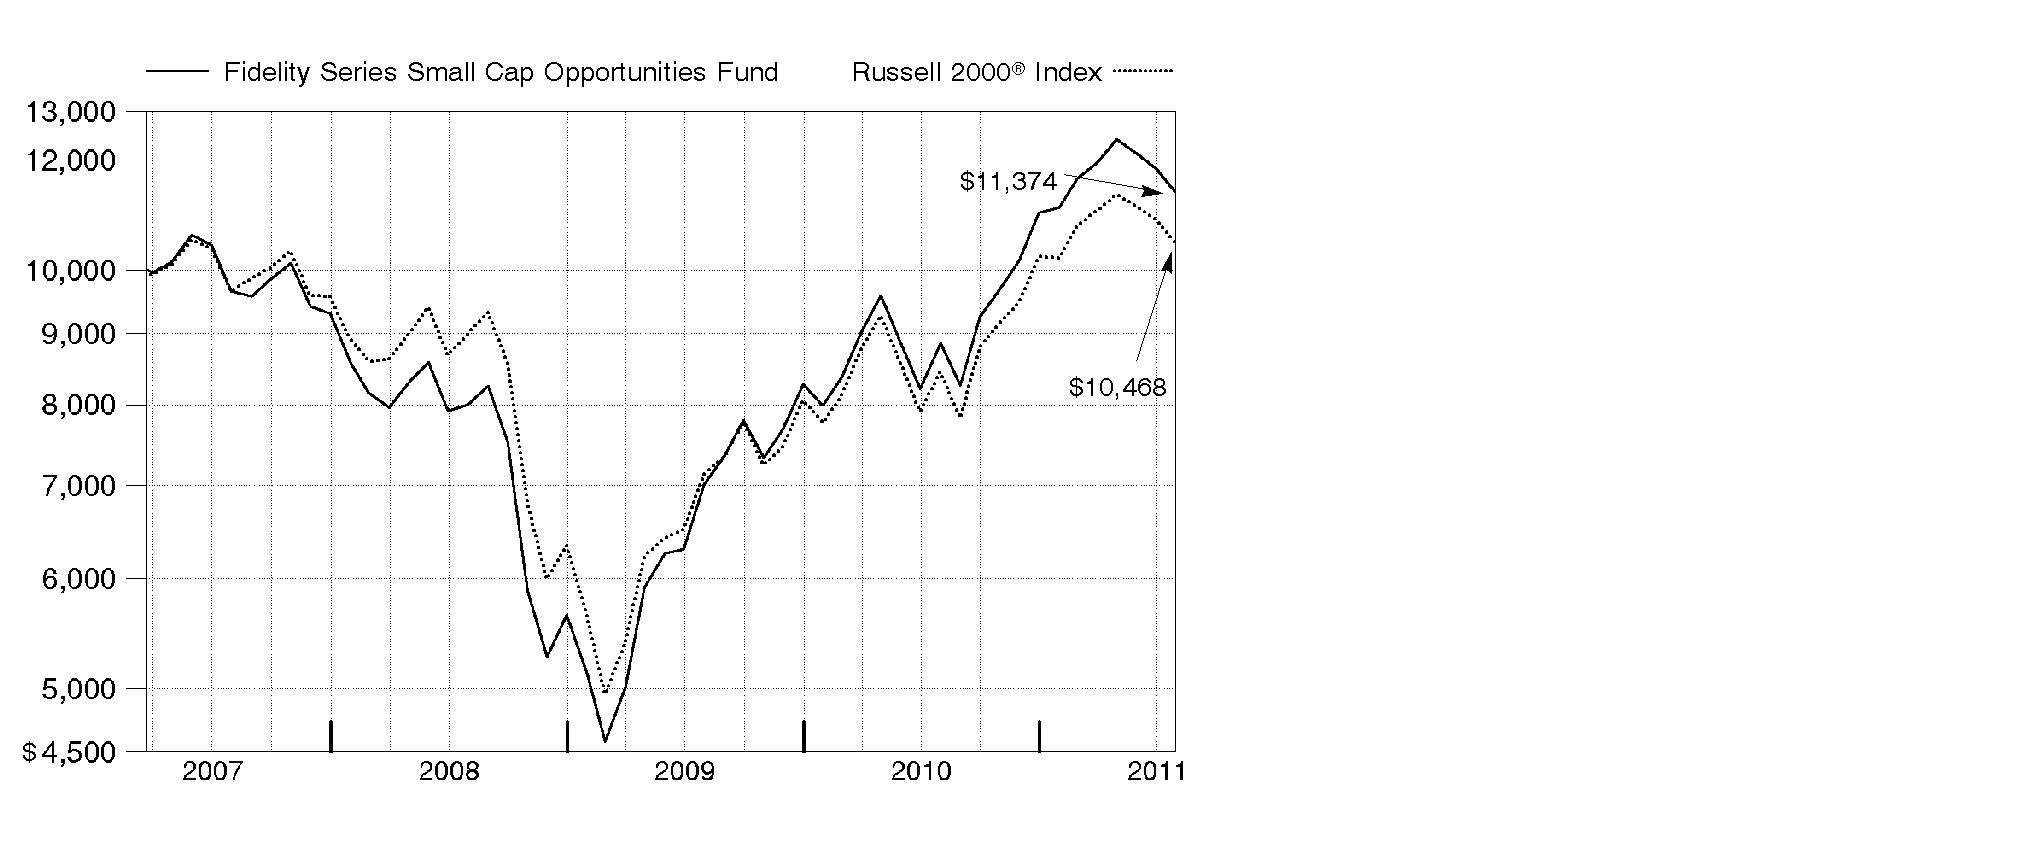
Annual Report
Market Recap: U.S. stocks registered solid double-digit gains for the 12 months ending July 31, 2011, extending a rally that began more than two years earlier. Despite a rough start in August 2010, markets turned positive in September, as increased demand for capital goods and other upbeat indicators trumped investor worry about a U.S. recessionary relapse. The broad market, as measured by the S&P 500® Index, rose 9% that month, its biggest September gain in 71 years. Seven more monthly advances followed, fueled by encouraging corporate earnings and economic activity. However, volatility picked up in the period's latter months, as markets reacted to continued high U.S. unemployment, nagging debt troubles in Europe and looming legislative battles over the federal debt ceiling. May unemployment rose above 9% for the first time in 2011, contributing to a traditional "June swoon" for stocks. Market uncertainty lingered in July, when the S&P 500® posted its second-biggest monthly loss of the period. For the full year, the S&P 500® climbed 19.65%, while the blue-chip-laden Dow Jones Industrial AverageSM rose a comparable 19.09% and the technology-heavy Nasdaq Composite® Index gained 23.40%. On the capitalization spectrum, stocks of mid-cap companies fared best, with the Russell Midcap® Index rising 24.51% and the small-cap Russell 2000® Index adding 23.92%.
Comments from Richard Thompson, Co-Portfolio Manager of Fidelity® Series Small Cap Opportunities Fund: For the year ending July 31, 2011, the fund's Series Small Cap Opportunities and Class F shares returned 28.50% and 28.74%, respectively, solidly outpacing the Russell 2000®. Security selection was the main driver of the fund's outperformance, with the largest relative gains coming from health care, consumer discretionary, consumer staples, software/services and materials. On the other hand, picks in technology hardware/equipment and positioning in energy - by far the benchmark's strongest-performing sector - and financials, mainly banks, detracted. The fund's modest cash position also hampered returns. In terms of individual securities, two out-of-index names helped the most. Green Mountain Coffee Roasters, a leader in specialty coffee and coffee makers, provided the biggest boost, while premium bedding manufacturer Tempur-Pedic International also lifted results. Holdings in Terremark Worldwide, a global provider of managed IT infrastructure services, and global specialty chemicals producer Rockwood Holdings also worked in our favor. Conversely, Platinum Underwriters Holdings, a reinsurance company, and data-storage products manufacturer Quantum held back performance. At period end, the fund did not own Terremark and Platinum Underwriters.
The views expressed above reflect those of the portfolio manager(s) only through the end of the period as stated on the cover of this report and do not necessarily represent the views of Fidelity or any other person in the Fidelity organization. Any such views are subject to change at any time based upon market or other conditions and Fidelity disclaims any responsibility to update such views. These views may not be relied on as investment advice and, because investment decisions for a Fidelity fund are based on numerous factors, may not be relied on as an indication of trading intent on behalf of any Fidelity fund.
Annual Report
Shareholder Expense Example
As a shareholder of the Fund, you incur two types of costs: (1) transaction costs, including redemption fees, and (2) ongoing costs, including management fees and other Fund expenses. This Example is intended to help you understand your ongoing costs (in dollars) of investing in the Fund and to compare these costs with the ongoing costs of investing in other mutual funds.
The Example is based on an investment of $1,000 invested at the beginning of the period and held for the entire period (February 1, 2011 to July 31, 2011).
Actual Expenses
The first line of the accompanying table for each class of the Fund provides information about actual account values and actual expenses. You may use the information in this line, together with the amount you invested, to estimate the expenses that you paid over the period. Simply divide your account value by $1,000.00 (for example, an $8,600 account value divided by $1,000.00 = 8.6), then multiply the result by the number in the first line for a class of the Fund under the heading entitled "Expenses Paid During Period" to estimate the expenses you paid on your account during this period. In addition, the Fund, as a shareholder in the underlying Fidelity Central Funds, will indirectly bear its pro-rata share of the fees and expenses incurred by the underlying Fidelity Central Funds. These fees and expenses are not included in the Fund's annualized expense ratio used to calculate the expense estimate in the table below.
Hypothetical Example for Comparison Purposes
The second line of the accompanying table for each class of the Fund provides information about hypothetical account values and hypothetical expenses based on a Class' actual expense ratio and an assumed rate of return of 5% per year before expenses, which is not the Class' actual return. The hypothetical account values and expenses may not be used to estimate the actual ending account balance or expenses you paid for the period. You may use this information to compare the ongoing costs of investing in the Fund and other funds. To do so, compare this 5% hypothetical example with the 5% hypothetical examples that appear in the shareholder reports of the other funds. In addition, the Fund, as a shareholder in the underlying Fidelity Central Funds, will indirectly bear its pro-rata share of the fees and expenses incurred by the underlying Fidelity Central Funds. These fees and expenses are not included in the Fund's annualized expense ratio used to calculate the expense estimate in the table below.
Please note that the expenses shown in the table are meant to highlight your ongoing costs only and do not reflect any transaction costs. Therefore, the second line of the table is useful in comparing ongoing costs only, and will not help you determine the relative total costs of owning different funds. In addition, if these transactional costs were included, your costs would have been higher.
Annual Report
| Annualized
Expense Ratio | Beginning
Account Value
February 1, 2011 | Ending
Account Value
July 31, 2011 | Expenses Paid
During Period*
February 1, 2011 to
July 31, 2011 |
Series Small Cap Opportunities | 1.09% | | | |
Actual | | $ 1,000.00 | $ 1,025.60 | $ 5.47 |
HypotheticalA | | $ 1,000.00 | $ 1,019.39 | $ 5.46 |
Class F | .89% | | | |
Actual | | $ 1,000.00 | $ 1,027.30 | $ 4.47 |
HypotheticalA | | $ 1,000.00 | $ 1,020.38 | $ 4.46 |
A 5% return per year before expenses
* Expenses are equal to each Class' annualized expense ratio, multiplied by the average account value over the period, multiplied by 181/365 (to reflect the one-half year period).
Annual Report
Investment Changes (Unaudited)
Top Ten Stocks as of July 31, 2011 |
| % of fund's
net assets | % of fund's net assets
6 months ago |
Home Properties, Inc. | 1.3 | 0.7 |
National Penn Bancshares, Inc. | 1.2 | 1.2 |
Waddell & Reed Financial, Inc. Class A | 1.1 | 1.1 |
Tempur-Pedic International, Inc. | 1.1 | 0.9 |
National Retail Properties, Inc. | 1.1 | 0.6 |
CapitalSource, Inc. | 1.1 | 1.2 |
Teledyne Technologies, Inc. | 1.1 | 0.6 |
Ramco-Gershenson Properties Trust (SBI) | 1.0 | 0.8 |
Forestar Group, Inc. | 1.0 | 1.1 |
ProAssurance Corp. | 1.0 | 0.0 |
| 11.0 | |
Top Five Market Sectors as of July 31, 2011 |
| % of fund's
net assets | % of fund's net assets
6 months ago |
Financials | 21.1 | 20.0 |
Information Technology | 16.5 | 19.0 |
Industrials | 14.5 | 15.7 |
Consumer Discretionary | 13.6 | 13.4 |
Health Care | 11.7 | 11.3 |
Asset Allocation (% of fund's net assets) |
As of July 31, 2011* | As of January 31, 2011** |
| Stocks and
Equity Futures 96.7% | | | Stocks and
Equity Futures 98.6% | |
| Convertible Securities 0.1% | | | Convertible Securities 0.0% | |
| Short-Term
Investments and
Net Other Assets 3.2% | | | Short-Term
Investments and
Net Other Assets 1.4% | |
* Foreign investments | 7.0% | | ** Foreign investments | 7.6% | |

Annual Report
Investments July 31, 2011
Showing Percentage of Net Assets
Common Stocks - 96.7% |
| Shares | | Value |
CONSUMER DISCRETIONARY - 13.6% |
Auto Components - 0.8% |
Tenneco, Inc. (a) | 394,286 | | $ 15,747,783 |
Hotels, Restaurants & Leisure - 1.7% |
Cracker Barrel Old Country Store, Inc. | 159,812 | | 7,209,119 |
Vail Resorts, Inc. (d) | 193,259 | | 8,841,599 |
WMS Industries, Inc. (a) | 161,400 | | 4,449,798 |
Wyndham Worldwide Corp. | 327,100 | | 11,314,389 |
| | 31,814,905 |
Household Durables - 2.8% |
iRobot Corp. (a) | 332,383 | | 11,620,110 |
La-Z-Boy, Inc. (a) | 574,390 | | 5,037,400 |
Meritage Homes Corp. (a) | 429,600 | | 9,386,760 |
Mohawk Industries, Inc. (a) | 121,800 | | 6,337,254 |
Tempur-Pedic International, Inc. (a) | 290,806 | | 20,940,940 |
| | 53,322,464 |
Media - 0.5% |
MDC Partners, Inc. Class A (sub. vtg.) | 472,600 | | 9,437,823 |
Multiline Retail - 0.4% |
Dollarama, Inc. | 243,066 | | 8,131,033 |
Specialty Retail - 5.4% |
Ascena Retail Group, Inc. (a) | 407,880 | | 13,182,682 |
Cabela's, Inc. Class A (a) | 545,238 | | 14,917,712 |
DSW, Inc. Class A (a) | 296,358 | | 15,701,047 |
Fourlis Holdings SA (a) | 543,800 | | 3,187,945 |
GameStop Corp. Class A (a) | 429,700 | | 10,132,326 |
Shoe Carnival, Inc. (a) | 485,814 | | 15,346,864 |
Signet Jewelers Ltd. (a) | 309,300 | | 13,250,412 |
Ulta Salon, Cosmetics & Fragrance, Inc. (a) | 247,308 | | 15,587,823 |
| | 101,306,811 |
Textiles, Apparel & Luxury Goods - 2.0% |
Deckers Outdoor Corp. (a) | 96,933 | | 9,620,600 |
G-III Apparel Group Ltd. (a) | 485,300 | | 14,981,211 |
PVH Corp. | 185,000 | | 13,236,750 |
| | 37,838,561 |
TOTAL CONSUMER DISCRETIONARY | | 257,599,380 |
Common Stocks - continued |
| Shares | | Value |
CONSUMER STAPLES - 3.0% |
Beverages - 0.7% |
Hansen Natural Corp. (a) | 89,400 | | $ 6,849,828 |
Primo Water Corp. | 444,900 | | 6,406,560 |
| | 13,256,388 |
Food & Staples Retailing - 0.6% |
Casey's General Stores, Inc. | 129,229 | | 5,815,305 |
United Natural Foods, Inc. (a) | 122,955 | | 5,133,371 |
| | 10,948,676 |
Food Products - 1.2% |
Chiquita Brands International, Inc. (a) | 300,830 | | 3,561,827 |
Diamond Foods, Inc. (d) | 52,200 | | 3,736,998 |
Green Mountain Coffee Roasters, Inc. (a) | 144,500 | | 15,020,775 |
| | 22,319,600 |
Personal Products - 0.5% |
Elizabeth Arden, Inc. (a) | 292,984 | | 9,439,944 |
Nutraceutical International Corp. (a) | 95,073 | | 1,407,080 |
| | 10,847,024 |
TOTAL CONSUMER STAPLES | | 57,371,688 |
ENERGY - 7.4% |
Energy Equipment & Services - 1.9% |
Newpark Resources, Inc. (a) | 1,099,328 | | 10,212,757 |
Superior Energy Services, Inc. (a) | 344,300 | | 14,285,007 |
Willbros Group, Inc. (a) | 1,146,818 | | 10,550,726 |
| | 35,048,490 |
Oil, Gas & Consumable Fuels - 5.5% |
Atlas Pipeline Partners, LP | 402,329 | | 13,763,675 |
Berry Petroleum Co. Class A | 317,200 | | 18,191,420 |
Cloud Peak Energy, Inc. (a) | 611,800 | | 13,643,140 |
Energen Corp. | 68,238 | | 4,013,077 |
Petroleum Development Corp. (a) | 402,429 | | 14,616,221 |
SM Energy Co. | 232,207 | | 17,496,797 |
Targa Resources Corp. | 301,200 | | 10,168,512 |
Whiting Petroleum Corp. (a) | 220,470 | | 12,919,542 |
| | 104,812,384 |
TOTAL ENERGY | | 139,860,874 |
Common Stocks - continued |
| Shares | | Value |
FINANCIALS - 21.1% |
Capital Markets - 2.7% |
Affiliated Managers Group, Inc. (a) | 177,000 | | $ 18,466,410 |
Duff & Phelps Corp. Class A | 993,177 | | 11,312,286 |
Waddell & Reed Financial, Inc. Class A | 580,300 | | 21,297,010 |
| | 51,075,706 |
Commercial Banks - 5.2% |
Associated Banc-Corp. | 1,106,728 | | 15,106,837 |
CapitalSource, Inc. | 3,106,100 | | 20,065,406 |
Cathay General Bancorp | 607,724 | | 8,423,055 |
City National Corp. | 309,400 | | 16,608,592 |
National Penn Bancshares, Inc. | 2,861,700 | | 23,008,068 |
PacWest Bancorp | 618,000 | | 12,267,300 |
Western Liberty Bancorp (a)(e) | 1,000,000 | | 3,020,000 |
| | 98,499,258 |
Diversified Financial Services - 0.0% |
57th Street General Acquisition Corp. (a) | 64,600 | | 849,490 |
Insurance - 3.4% |
Alterra Capital Holdings Ltd. | 706,811 | | 15,401,412 |
Amerisafe, Inc. (a) | 818,100 | | 17,597,331 |
Endurance Specialty Holdings Ltd. | 319,300 | | 13,008,282 |
ProAssurance Corp. (a) | 274,376 | | 19,110,288 |
| | 65,117,313 |
Real Estate Investment Trusts - 6.7% |
American Assets Trust, Inc. | 852,600 | | 18,748,674 |
Franklin Street Properties Corp. | 1,474,900 | | 18,598,489 |
Glimcher Realty Trust | 744,500 | | 7,333,325 |
Highwoods Properties, Inc. (SBI) | 472,500 | | 16,268,175 |
Home Properties, Inc. | 391,549 | | 25,654,291 |
National Retail Properties, Inc. | 800,700 | | 20,089,563 |
Ramco-Gershenson Properties Trust (SBI) | 1,599,150 | | 19,621,571 |
| | 126,314,088 |
Real Estate Management & Development - 1.0% |
Forestar Group, Inc. (a) | 1,200,300 | | 19,564,890 |
Thrifts & Mortgage Finance - 2.1% |
Astoria Financial Corp. | 1,074,300 | | 12,515,595 |
Washington Federal, Inc. | 1,039,500 | | 17,577,945 |
WSFS Financial Corp. | 218,759 | | 8,686,920 |
| | 38,780,460 |
TOTAL FINANCIALS | | 400,201,205 |
Common Stocks - continued |
| Shares | | Value |
HEALTH CARE - 11.6% |
Biotechnology - 2.6% |
Achillion Pharmaceuticals, Inc. (a) | 588,816 | | $ 4,363,127 |
Ardea Biosciences, Inc. (a) | 194,301 | | 4,546,643 |
ARIAD Pharmaceuticals, Inc. (a) | 562,623 | | 6,689,587 |
ArQule, Inc. (a) | 492,442 | | 2,757,675 |
BioMarin Pharmaceutical, Inc. (a) | 132,994 | | 4,153,403 |
Chelsea Therapeutics International Ltd. (a) | 698,599 | | 3,506,967 |
Dynavax Technologies Corp. (a) | 1,663,159 | | 4,656,845 |
Infinity Pharmaceuticals, Inc. (a) | 184,643 | | 1,661,787 |
Pharmasset, Inc. (a) | 33,133 | | 4,021,684 |
SIGA Technologies, Inc. (a)(d) | 130,330 | | 991,811 |
Targacept, Inc. (a) | 154,378 | | 3,155,486 |
Telik, Inc. (a) | 1,198,957 | | 611,468 |
Theravance, Inc. (a) | 194,319 | | 4,154,540 |
ZIOPHARM Oncology, Inc. (a)(d) | 611,219 | | 3,325,031 |
| | 48,596,054 |
Health Care Equipment & Supplies - 1.7% |
Analogic Corp. | 184,887 | | 9,945,072 |
Endologix, Inc. (a) | 660,603 | | 5,998,275 |
Sirona Dental Systems, Inc. (a) | 216,800 | | 10,965,744 |
Uroplasty, Inc. (a)(d) | 734,391 | | 5,001,203 |
| | 31,910,294 |
Health Care Providers & Services - 5.4% |
Accretive Health, Inc. (a)(d) | 302,992 | | 9,101,880 |
Air Methods Corp. (a) | 136,577 | | 9,574,048 |
Catalyst Health Solutions, Inc. (a) | 121,799 | | 7,981,488 |
Centene Corp. (a) | 148,547 | | 4,873,827 |
Corvel Corp. (a) | 143,734 | | 6,633,324 |
Health Management Associates, Inc. Class A (a) | 648,662 | | 6,162,289 |
HealthSpring, Inc. (a) | 258,100 | | 10,592,424 |
Humana, Inc. | 110,172 | | 8,216,628 |
MEDNAX, Inc. (a) | 141,825 | | 9,666,792 |
Omnicare, Inc. | 169,093 | | 5,157,337 |
PSS World Medical, Inc. (a) | 449,869 | | 10,765,365 |
Universal Health Services, Inc. Class B | 152,500 | | 7,570,100 |
Wellcare Health Plans, Inc. (a) | 140,375 | | 6,155,444 |
| | 102,450,946 |
Common Stocks - continued |
| Shares | | Value |
HEALTH CARE - continued |
Health Care Technology - 0.6% |
Epocrates, Inc. (a) | 400,785 | | $ 6,588,905 |
Omnicell, Inc. (a) | 343,444 | | 5,876,327 |
| | 12,465,232 |
Life Sciences Tools & Services - 0.3% |
eResearchTechnology, Inc. (a) | 858,769 | | 5,470,359 |
Sequenom, Inc. (a) | 18,319 | | 129,332 |
| | 5,599,691 |
Pharmaceuticals - 1.0% |
Cardiome Pharma Corp. (a) | 424,143 | | 2,108,729 |
Columbia Laboratories, Inc. (a)(d) | 730,232 | | 2,088,464 |
Endocyte, Inc. (d) | 186,900 | | 2,491,377 |
Questcor Pharmaceuticals, Inc. (a) | 253,262 | | 7,863,785 |
XenoPort, Inc. (a) | 552,700 | | 3,918,643 |
| | 18,470,998 |
TOTAL HEALTH CARE | | 219,493,215 |
INDUSTRIALS - 14.5% |
Aerospace & Defense - 1.1% |
Teledyne Technologies, Inc. (a) | 367,549 | | 19,932,182 |
Air Freight & Logistics - 0.4% |
UTI Worldwide, Inc. | 525,800 | | 8,502,186 |
Building Products - 1.9% |
A.O. Smith Corp. | 344,561 | | 14,288,945 |
AAON, Inc. | 488,850 | | 11,087,118 |
Armstrong World Industries, Inc. | 262,174 | | 10,355,873 |
| | 35,731,936 |
Commercial Services & Supplies - 1.5% |
Swisher Hygiene, Inc. (g) | 961,491 | | 3,911,345 |
Sykes Enterprises, Inc. (a) | 600,998 | | 11,599,261 |
United Stationers, Inc. | 398,800 | | 12,797,492 |
| | 28,308,098 |
Construction & Engineering - 0.8% |
Foster Wheeler AG (a) | 349,228 | | 9,464,079 |
Shaw Group, Inc. (a) | 224,513 | | 5,810,396 |
| | 15,274,475 |
Electrical Equipment - 2.1% |
General Cable Corp. (a) | 424,185 | | 16,869,837 |
Common Stocks - continued |
| Shares | | Value |
INDUSTRIALS - continued |
Electrical Equipment - continued |
GrafTech International Ltd. (a) | 661,603 | | $ 12,742,474 |
Regal-Beloit Corp. | 161,500 | | 9,791,745 |
| | 39,404,056 |
Industrial Conglomerates - 0.5% |
Carlisle Companies, Inc. | 225,200 | | 9,735,396 |
Machinery - 3.9% |
Accuride Corp. (a) | 639,565 | | 7,323,019 |
Actuant Corp. Class A | 472,431 | | 11,673,770 |
Altra Holdings, Inc. (a) | 415,723 | | 9,245,680 |
CLARCOR, Inc. | 290,186 | | 12,785,595 |
Greenbrier Companies, Inc. (a) | 332,370 | | 6,687,284 |
John Bean Technologies Corp. | 382,981 | | 6,763,444 |
TriMas Corp. (a) | 350,008 | | 8,389,692 |
Wabtec Corp. | 160,454 | | 10,352,492 |
| | 73,220,976 |
Professional Services - 0.5% |
Advisory Board Co. (a) | 191,495 | | 10,252,642 |
Road & Rail - 0.5% |
Kansas City Southern (a) | 157,700 | | 9,359,495 |
Trading Companies & Distributors - 1.3% |
Interline Brands, Inc. (a) | 570,893 | | 9,551,040 |
Watsco, Inc. | 252,077 | | 14,917,917 |
| | 24,468,957 |
TOTAL INDUSTRIALS | | 274,190,399 |
INFORMATION TECHNOLOGY - 16.5% |
Communications Equipment - 2.9% |
Anaren, Inc. (a) | 199,505 | | 3,992,095 |
Aruba Networks, Inc. (a) | 146,410 | | 3,360,110 |
Brocade Communications Systems, Inc. (a) | 1,713,090 | | 9,387,733 |
Comtech Telecommunications Corp. | 343,053 | | 9,245,278 |
DG FastChannel, Inc. (a) | 336,615 | | 9,512,740 |
Ixia (a) | 1,009,808 | | 10,098,080 |
NETGEAR, Inc. (a) | 152,763 | | 5,027,430 |
Oclaro, Inc. (a)(d) | 953,643 | | 4,482,122 |
| | 55,105,588 |
Computers & Peripherals - 3.3% |
Lexmark International, Inc. Class A (a) | 240,600 | | 8,076,942 |
Common Stocks - continued |
| Shares | | Value |
INFORMATION TECHNOLOGY - continued |
Computers & Peripherals - continued |
NCR Corp. (a) | 500,100 | | $ 9,976,995 |
Quantum Corp. (a) | 5,895,546 | | 15,505,286 |
STEC, Inc. (a)(d) | 378,146 | | 3,845,745 |
Super Micro Computer, Inc. (a) | 769,380 | | 10,840,564 |
Synaptics, Inc. (a)(d) | 588,777 | | 14,466,251 |
| | 62,711,783 |
Electronic Equipment & Components - 0.5% |
Fabrinet (a) | 541,946 | | 8,345,968 |
Internet Software & Services - 3.0% |
Constant Contact, Inc. (a)(d) | 313,789 | | 5,940,026 |
InfoSpace, Inc. (a) | 587,289 | | 5,596,864 |
Rackspace Hosting, Inc. (a) | 232,299 | | 9,291,960 |
Travelzoo, Inc. (a)(d) | 196,776 | | 10,389,773 |
VeriSign, Inc. | 501,709 | | 15,658,338 |
Web.com, Inc. (a)(d) | 1,213,417 | | 10,544,594 |
| | 57,421,555 |
IT Services - 1.0% |
Camelot Information Systems, Inc. ADR (d) | 423,915 | | 4,981,001 |
hiSoft Technology International Ltd. ADR (a)(d) | 369,224 | | 5,121,137 |
Syntel, Inc. | 170,005 | | 9,345,175 |
| | 19,447,313 |
Semiconductors & Semiconductor Equipment - 1.3% |
Marvell Technology Group Ltd. (a) | 539,456 | | 7,994,738 |
Micron Technology, Inc. (a) | 782,288 | | 5,765,463 |
Semtech Corp. (a) | 236,151 | | 5,502,318 |
TriQuint Semiconductor, Inc. (a) | 762,306 | | 5,732,541 |
| | 24,995,060 |
Software - 4.5% |
Aspen Technology, Inc. (a) | 543,950 | | 8,431,225 |
AutoNavi Holdings Ltd. ADR | 369,600 | | 6,120,576 |
BroadSoft, Inc. (a)(d) | 197,496 | | 5,768,858 |
JDA Software Group, Inc. (a) | 330,553 | | 9,242,262 |
Kenexa Corp. (a) | 309,745 | | 7,920,180 |
Micro Focus International PLC | 1,918,807 | | 9,134,749 |
Nuance Communications, Inc. (a) | 387,700 | | 7,757,877 |
Parametric Technology Corp. (a) | 689,530 | | 14,335,329 |
Common Stocks - continued |
| Shares | | Value |
INFORMATION TECHNOLOGY - continued |
Software - continued |
SolarWinds, Inc. (a) | 275,365 | | $ 5,923,101 |
Synchronoss Technologies, Inc. (a) | 340,144 | | 9,949,212 |
| | 84,583,369 |
TOTAL INFORMATION TECHNOLOGY | | 312,610,636 |
MATERIALS - 5.3% |
Chemicals - 2.2% |
Cabot Corp. | 318,000 | | 12,433,800 |
Rockwood Holdings, Inc. (a) | 275,250 | | 16,644,368 |
Solutia, Inc. (a) | 618,610 | | 13,262,998 |
| | 42,341,166 |
Containers & Packaging - 0.6% |
Rock-Tenn Co. Class A | 178,500 | | 10,970,610 |
Metals & Mining - 2.5% |
Carpenter Technology Corp. | 281,387 | | 16,162,869 |
Coeur d'Alene Mines Corp. (a) | 396,700 | | 10,825,943 |
Compass Minerals International, Inc. | 149,500 | | 11,771,630 |
HudBay Minerals, Inc. | 568,900 | | 7,830,265 |
| | 46,590,707 |
TOTAL MATERIALS | | 99,902,483 |
TELECOMMUNICATION SERVICES - 0.8% |
Diversified Telecommunication Services - 0.5% |
AboveNet, Inc. | 74,114 | | 4,512,801 |
PAETEC Holding Corp. (a) | 1,023,457 | | 4,523,680 |
VocalTec Communications Ltd. (a)(d) | 41,000 | | 901,590 |
| | 9,938,071 |
Wireless Telecommunication Services - 0.3% |
Clearwire Corp. Class A (a)(d) | 914,000 | | 1,983,380 |
NII Holdings, Inc. (a) | 85,157 | | 3,606,399 |
| | 5,589,779 |
TOTAL TELECOMMUNICATION SERVICES | | 15,527,850 |
UTILITIES - 2.9% |
Electric Utilities - 1.6% |
Cleco Corp. | 280,400 | | 9,735,488 |
Common Stocks - continued |
| Shares | | Value |
UTILITIES - continued |
Electric Utilities - continued |
Great Plains Energy, Inc. | 330,700 | | $ 6,670,219 |
IDACORP, Inc. | 212,593 | | 8,335,772 |
Westar Energy, Inc. | 245,900 | | 6,346,679 |
| | 31,088,158 |
Gas Utilities - 0.8% |
Northwest Natural Gas Co. | 144,570 | | 6,449,268 |
Southwest Gas Corp. | 232,362 | | 8,664,779 |
| | 15,114,047 |
Multi-Utilities - 0.5% |
NorthWestern Energy Corp. | 270,600 | | 8,664,613 |
TOTAL UTILITIES | | 54,866,818 |
TOTAL COMMON STOCKS (Cost $1,523,735,245) | 1,831,624,548 |
Convertible Preferred Stocks - 0.1% |
| | | |
HEALTH CARE - 0.1% |
Pharmaceuticals - 0.1% |
Merrimack Pharmaceuticals, Inc. Series G (g) (Cost $2,665,600) | 380,800 | | 2,665,600 |
U.S. Treasury Obligations - 0.1% |
| Principal Amount | | |
U.S. Treasury Bills, yield at date of purchase 0.03% to 0.05% 9/8/11 to 9/15/11 (f)
(Cost $1,074,945) | | $ 1,075,000 | | 1,074,887 |
Money Market Funds - 5.6% |
| Shares | | Value |
Fidelity Cash Central Fund, 0.14% (b) | 74,195,462 | | $ 74,195,462 |
Fidelity Securities Lending Cash Central Fund, 0.15% (b)(c) | 31,263,683 | | 31,263,683 |
TOTAL MONEY MARKET FUNDS (Cost $105,459,145) | 105,459,145 |
TOTAL INVESTMENT PORTFOLIO - 102.5% (Cost $1,632,934,935) | | 1,940,824,180 |
NET OTHER ASSETS (LIABILITIES) - (2.5)% | | (46,433,109) |
NET ASSETS - 100% | $ 1,894,391,071 |
Futures Contracts |
| Expiration Date | | Underlying Face Amount at Value | | Unrealized Appreciation/
(Depreciation) |
Purchased |
Equity Index Contracts |
4 NYFE Russell Mini Index Contracts | Sept. 2011 | | $ 318,200 | | $ 8,026 |
|
The face value of futures purchased as a percentage of net assets is 0% |
Legend |
(a) Non-income producing |
(b) Affiliated fund that is available only to investment companies and other accounts managed by Fidelity Investments. The rate quoted is the annualized seven-day yield of the fund at period end. A complete unaudited listing of the fund's holdings as of its most recent quarter end is available upon request. In addition, each Fidelity Central Fund's financial statements, which are not covered by the Fund's Report of Independent Registered Public Accounting Firm, are available on the SEC's website or upon request. |
(c) Investment made with cash collateral received from securities on loan. |
(d) Security or a portion of the security is on loan at period end. |
(e) Affiliated company |
(f) Security or a portion of the security was pledged to cover margin requirements for futures contracts. At the period end, the value of securities pledged amounted to $1,074,887. |
(g) Restricted securities - Investment in securities not registered under the Securities Act of 1933 (excluding 144A issues). At the end of the period, the value of restricted securities (excluding 144A issues) amounted to $6,576,945 or 0.3% of net assets. |
Additional information on each restricted holding is as follows: |
Security | Acquisition Date | Acquisition Cost |
Merrimack Pharmaceuticals, Inc. Series G | 3/31/11 | $ 2,665,600 |
Swisher Hygiene, Inc. | 4/15/11 | $ 7,403,481 |
Affiliated Central Funds |
Information regarding fiscal year to date income earned by the Fund from investments in Fidelity Central Funds is as follows: |
Fund | Income earned |
Fidelity Cash Central Fund | $ 76,795 |
Fidelity Securities Lending Cash Central Fund | 472,365 |
Total | $ 549,160 |
Other Affiliated Issuers |
An affiliated company is a company in which the Fund has ownership of at least 5% of the voting securities. Fiscal year to date transactions with companies which are or were affiliates are as follows: |
Affiliate | Value, beginning of period | Purchases | Sales Proceeds | Dividend Income | Value,
end of
period |
Western Liberty Bancorp | $ 6,240,000 | $ - | $ - | $ - | $ 3,020,000 |
Other Information |
The following is a summary of the inputs used, as of July 31, 2011, involving the Fund's assets and liabilities carried at fair value. The inputs or methodology used for valuing securities may not be an indication of the risk associated with investing in those securities. For more information on valuation inputs, and their aggregation into the levels used in the tables below, please refer to the Security Valuation section in the accompanying Notes to Financial Statements. |
Valuation Inputs at Reporting Date: |
Description | Total | Level 1 | Level 2 | Level 3 |
Investments in Securities: | | | | |
Equities: | | | | |
Consumer Discretionary | $ 257,599,380 | $ 257,599,380 | $ - | $ - |
Consumer Staples | 57,371,688 | 57,371,688 | - | - |
Energy | 139,860,874 | 139,860,874 | - | - |
Financials | 400,201,205 | 400,201,205 | - | - |
Health Care | 222,158,815 | 219,493,215 | - | 2,665,600 |
Industrials | 274,190,399 | 270,279,054 | 3,911,345 | - |
Information Technology | 312,610,636 | 312,610,636 | - | - |
Materials | 99,902,483 | 99,902,483 | - | - |
Telecommunication Services | 15,527,850 | 15,527,850 | - | - |
Utilities | 54,866,818 | 54,866,818 | - | - |
U.S. Government and Government Agency Obligations | 1,074,887 | - | 1,074,887 | - |
Money Market Funds | 105,459,145 | 105,459,145 | - | - |
Total Investments in Securities: | $ 1,940,824,180 | $ 1,933,172,348 | $ 4,986,232 | $ 2,665,600 |
Derivative Instruments: | | | | |
Assets | | | | |
Futures Contracts | $ 8,026 | $ 8,026 | $ - | $ - |
The following is a reconciliation of Investments in Securities for which Level 3 inputs were used in determining value: |
Investments in Securities: | |
Beginning Balance | $ - |
Total Realized Gain (Loss) | - |
Total Unrealized Gain (Loss) | - |
Cost of Purchases | 2,665,600 |
Proceeds of Sales | - |
Amortization/Accretion | - |
Transfers in to Level 3 | - |
Transfers out of Level 3 | - |
Ending Balance | $ 2,665,600 |
The change in unrealized gain (loss) for the period attributable to Level 3 securities held at July 31, 2011 | $ - |
The information used in the above reconciliation represents fiscal year to date activity for any Investments in Securities identified as using Level 3 inputs at either the beginning or the end of the current fiscal period. Transfers in or out of Level 3 represent the beginning value of any Security or Instrument where a change in the pricing level occurred from the beginning to the end of the period. The cost of purchases and the proceeds of sales may include securities received or delivered through corporate actions or exchanges. Realized and unrealized gains (losses) disclosed in the reconciliation are included in Net Gain (Loss) on the Fund's Statement of Operations. |
Value of Derivative Instruments |
The following table is a summary of the Fund's value of derivative instruments by risk exposure as of July 31, 2011. For additional information on derivative instruments, please refer to the Derivative Instruments section in the accompanying Notes to Financial Statements. |
Risk Exposure /
Derivative Type | Value |
| Asset | Liability |
Equity Risk | | |
Futures Contracts (a) | $ 8,026 | $ - |
Total Value of Derivatives | $ 8,026 | $ - |
(a) Reflects cumulative appreciation/(depreciation) on futures contracts as disclosed on the Schedule of Investments. Only the period end variation margin is separately disclosed on the Statement of Assets and Liabilities. |
See accompanying notes which are an integral part of the financial statements.
Annual Report
Statement of Assets and Liabilities
| July 31, 2011 |
| | |
Assets | | |
Investment in securities, at value (including securities loaned of $28,760,809) - See accompanying schedule: Unaffiliated issuers (cost $1,517,815,304) | $ 1,832,345,035 | |
Fidelity Central Funds (cost $105,459,145) | 105,459,145 | |
Other affiliated issuers (cost $9,660,486) | 3,020,000 | |
Total Investments (cost $1,632,934,935) | | $ 1,940,824,180 |
Cash | | 294,597 |
Receivable for investments sold | | 9,752,874 |
Receivable for fund shares sold | | 361,575 |
Dividends receivable | | 1,080,118 |
Distributions receivable from Fidelity Central Funds | | 77,268 |
Other receivables | | 99,404 |
Total assets | | 1,952,490,016 |
| | |
Liabilities | | |
Payable for investments purchased | $ 11,498,091 | |
Payable for fund shares redeemed | 13,544,668 | |
Accrued management fee | 1,408,404 | |
Payable for daily variation margin on futures contracts | 30,221 | |
Other affiliated payables | 298,941 | |
Other payables and accrued expenses | 54,937 | |
Collateral on securities loaned, at value | 31,263,683 | |
Total liabilities | | 58,098,945 |
| | |
Net Assets | | $ 1,894,391,071 |
Net Assets consist of: | | |
Paid in capital | | $ 1,573,231,155 |
Accumulated undistributed net realized gain (loss) on investments and foreign currency transactions | | 13,258,189 |
Net unrealized appreciation (depreciation) on investments and assets and liabilities in foreign currencies | | 307,901,727 |
Net Assets | | $ 1,894,391,071 |
See accompanying notes which are an integral part of the financial statements.
Annual Report
Statement of Assets and Liabilities - continued
| July 31, 2011 |
| | |
Series Small Cap Opportunities:
Net Asset Value, offering price and redemption price per share ($1,415,569,964 ÷ 126,151,966 shares) | | $ 11.22 |
| | |
Class F:
Net Asset Value, offering price and redemption price per share ($478,821,107 ÷ 42,495,047 shares) | | $ 11.27 |
See accompanying notes which are an integral part of the financial statements.
Annual Report
Financial Statements - continued
Statement of Operations
| Year ended July 31, 2011 |
| | |
Investment Income | | |
Dividends | | $ 14,209,721 |
Special dividends | | 4,242,609 |
Interest | | 1,804 |
Income from Fidelity Central Funds | | 549,160 |
Total income | | 19,003,294 |
| | |
Expenses | | |
Management fee
Basic fee | $ 12,783,591 | |
Performance adjustment | 2,486,396 | |
Transfer agent fees | 3,075,444 | |
Accounting and security lending fees | 564,948 | |
Custodian fees and expenses | 71,380 | |
Independent trustees' compensation | 9,449 | |
Audit | 62,128 | |
Legal | 11,704 | |
Interest | 594 | |
Miscellaneous | 19,231 | |
Total expenses before reductions | 19,084,865 | |
Expense reductions | (113,867) | 18,970,998 |
Net investment income (loss) | | 32,296 |
Realized and Unrealized Gain (Loss) Net realized gain (loss) on: | | |
Investment securities: | | |
Unaffiliated issuers | 318,830,605 | |
Foreign currency transactions | 50,742 | |
Futures contracts | 2,656,632 | |
Total net realized gain (loss) | | 321,537,979 |
Change in net unrealized appreciation (depreciation) on: Investment securities | 104,042,652 | |
Assets and liabilities in foreign currencies | (3,861) | |
Futures contracts | 61,794 | |
Total change in net unrealized appreciation (depreciation) | | 104,100,585 |
Net gain (loss) | | 425,638,564 |
Net increase (decrease) in net assets resulting from operations | | $ 425,670,860 |
See accompanying notes which are an integral part of the financial statements.
Annual Report
Statement of Changes in Net Assets
| Year ended
July 31,
2011 | Year ended
July 31,
2010 |
Increase (Decrease) in Net Assets | | |
Operations | | |
Net investment income (loss) | $ 32,296 | $ (828,847) |
Net realized gain (loss) | 321,537,979 | 289,207,936 |
Change in net unrealized appreciation (depreciation) | 104,100,585 | 50,277,887 |
Net increase (decrease) in net assets resulting
from operations | 425,670,860 | 338,656,976 |
Distributions to shareholders from net realized gain | (6,204,046) | - |
Share transactions - net increase (decrease) | (63,505,361) | (84,503,551) |
Total increase (decrease) in net assets | 355,961,453 | 254,153,425 |
| | |
Net Assets | | |
Beginning of period | 1,538,429,618 | 1,284,276,193 |
End of period (including undistributed net investment income of $0 and accumulated net investment loss of $47,686, respectively) | $ 1,894,391,071 | $ 1,538,429,618 |
See accompanying notes which are an integral part of the financial statements.
Annual Report
Financial Highlights - Series Small Cap Opportunities
Years ended July 31, | 2011 | 2010 | 2009 | 2008 | 2007 H |
Selected Per-Share Data | | | | | |
Net asset value, beginning of period | $ 8.76 | $ 6.94 | $ 7.97 | $ 9.65 | $ 10.00 |
Income from Investment Operations | | | | |
Net investment income (loss) D | (-) G, K | (.01) | .03 | .02 | .01 |
Net realized and unrealized gain (loss) | 2.50 | 1.83 | (1.02) | (1.66) | (.36) |
Total from investment operations | 2.50 | 1.82 | (.99) | (1.64) | (.35) |
Distributions from net investment income | - L | - | (.04) | (.02) | - |
Distributions from net realized gain | (.04) L | - | - | (.02) | - |
Total distributions | (.04) | - | (.04) | (.04) | - |
Redemption fees added to paid in capital J | - | - | - | -D, K | -D,K |
Net asset value, end of period | $ 11.22 | $ 8.76 | $ 6.94 | $ 7.97 | $ 9.65 |
Total Return B, C | 28.50% | 26.22% | (12.34)% | (17.10)% | (3.50)% |
Ratios to Average Net Assets E, I | | | | |
Expenses before reductions | 1.10% | 1.02% | .93% | .93% | 1.00% A |
Expenses net of fee waivers, if any | 1.10% | 1.02% | .93% | .93% | 1.00% A |
Expenses net of all reductions | 1.09% | 1.01% | .93% | .92% | .98% A |
Net investment income (loss) | (.04)% G | (.07)% | .49% | .20% | .20% A |
Supplemental Data | | | | | |
Net assets, end of period (000 omitted) | $ 1,415,570 | $ 1,363,646 | $ 1,284,079 | $ 1,348,258 | $ 984,470 |
Portfolio turnover rate F | 73% | 104% | 167% | 179% | 176% A |
A Annualized
B Total returns for periods of less than one year are not annualized.
C Total returns would have been lower if certain expenses had not been reduced during the applicable periods shown.
D Calculated based on average shares outstanding during the period.
E Fees and expenses of any underlying Fidelity Central Funds are not included in the Fund's expense ratio. The Fund indirectly bears its proportionate share of the expenses of any underlying Fidelity Central Funds.
F Amount does not include the portfolio activity of any underlying Fidelity Central Funds.
G Investment income per share reflects a special dividend which amounted to $.02 per share. Excluding the special dividend, the ratio of net investment income (loss) to average net assets would have been (.27)%.
H For the period March 22, 2007 (commencement of sale of shares) to July 31, 2007.
I Expense ratios reflect operating expenses of the class. Expenses before reductions do not reflect amounts reimbursed by the investment adviser or reductions from brokerage service arrangements or reductions from other expense offset arrangements and do not represent the amount paid by the class during periods when reimbursements or reductions occur. Expense ratios before reductions for start-up periods may not be representative of longer-term operating periods. Expenses net of fee waivers reflect expenses after reimbursement by the investment adviser but prior to reductions from brokerage service arrangements or other expense offset arrangements. Expenses net of all reductions represent the net expenses paid by the class.
J The redemption fee was eliminated during the year ended July 31, 2009.
K Amount represents less than $.01 per share.
L The amount shown reflects certain reclassifications related to book to tax differences.
See accompanying notes which are an integral part of the financial statements.
Annual Report
Financial Highlights - Class F
Years ended July 31, | 2011 | 2010 | 2009H |
Selected Per-Share Data | | | |
Net asset value, beginning of period | $ 8.79 | $ 6.94 | $ 6.24 |
Income from Investment Operations | | | |
Net investment income (loss)D | .02G | .01 | -J |
Net realized and unrealized gain (loss) | 2.50 | 1.84 | .70 |
Total from investment operations | 2.52 | 1.85 | .70 |
Distributions from net realized gain | (.04) K | - | - |
Net asset value, end of period | $ 11.27 | $ 8.79 | $ 6.94 |
Total ReturnB, C | 28.74% | 26.66% | 11.22% |
Ratios to Average Net AssetsE, I | | | |
Expenses before reductions | .89% | .78% | .68% A |
Expenses net of fee waivers, if any | .89% | .78% | .68% A |
Expenses net of all reductions | .88% | .77% | .68% A |
Net investment income (loss) | .17% G | .17% | .11% A |
Supplemental Data | | | |
Net assets, end of period (000 omitted) | $ 478,821 | $ 174,783 | $ 197 |
Portfolio turnover rateF | 73% | 104% | 167% |
A Annualized
B Total returns for periods of less than one year are not annualized.
C Total returns would have been lower if certain expenses had not been reduced during the applicable periods shown.
D Calculated based on average shares outstanding during the period.
E Fees and expenses of any underlying Fidelity Central Funds are not included in the Fund's expense ratio. The Fund indirectly bears its proportionate share of the expenses of any underlying Fidelity Central Funds.
F Amount does not include the portfolio activity of any underlying Fidelity Central Funds.
G Investment income per share reflects a special dividend which amounted to $.02 per share. Excluding the special dividend, the ratio of net investment income (loss) to average net assets would have been (.06)%.
H For the period June 26, 2009 (commencement of sale of shares) to July 31, 2009.
I Expense ratios reflect operating expenses of the class. Expenses before reductions do not reflect amounts reimbursed by the investment adviser or reductions from brokerage service arrangements or reductions from other expense offset arrangements and do not represent the amount paid by the class during periods when reimbursements or reductions occur. Expense ratios before reductions for start-up periods may not be representative of longer-term operating periods. Expenses net of fee waivers reflect expenses after reimbursement by the investment adviser but prior to reductions from brokerage service arrangements or other expense offset arrangements. Expenses net of all reductions represent the net expenses paid by the class.
J Amount represents less than $.01 per share.
K The amount shown reflects certain reclassifications related to book to tax differences.
See accompanying notes which are an integral part of the financial statements.
Annual Report
Notes to Financial Statements
For the period ended July 31, 2011
1. Organization.
Fidelity Series Small Cap Opportunities Fund (the Fund) is a fund of Fidelity Securities Fund (the Trust) and is authorized to issue an unlimited number of shares. Shares of the Fund are only available for purchase by mutual funds for which Fidelity Management & Research Company (FMR) or an affiliate serves as an investment manager and, for shares of Series Small Cap Opportunities, FMR investment professionals. The Trust is registered under the Investment Company Act of 1940, as amended (the 1940 Act), as an open-end management investment company organized as a Massachusetts business trust. The Fund offers Series Small Cap Opportunities shares and Class F shares, each of which has equal rights as to assets and voting privileges. Each class has exclusive voting rights with respect to matters that affect that class. Investment income, realized and unrealized capital gains and losses, the common expenses of the Fund, and certain fund-level expense reductions, if any, are allocated on a pro-rata basis to each class based on the relative net assets of each class to the total net assets of the Fund. Each class differs with respect to transfer agent fees incurred. Certain expense reductions may also differ by class.
2. Investments in Fidelity Central Funds.
The Fund invests in Fidelity Central Funds, which are open-end investment companies available only to other investment companies and accounts managed by FMR and its affiliates. The Fund's Schedule of Investments lists each of the Fidelity Central Funds held as of period end, if any, as an investment of the Fund, but does not include the underlying holdings of each Fidelity Central Fund. As an Investing Fund, the Fund indirectly bears its proportionate share of the expenses of the underlying Fidelity Central Funds.
The Money Market Central Funds seek preservation of capital and current income and are managed by Fidelity Investments Money Management, Inc. (FIMM), an affiliate of FMR.
A complete unaudited list of holdings for each Fidelity Central Fund is available upon request or at the Securities and Exchange Commission (the SEC) web site at www.sec.gov. In addition, the financial statements of the Fidelity Central Funds, which are not covered by the Fund's Report of Independent Registered Public Accounting Firm, are available on the SEC web site or upon request.
3. Significant Accounting Policies.
The financial statements have been prepared in conformity with accounting principles generally accepted in the United States of America (GAAP), which require management to make certain estimates and assumptions at the date of the financial statements. Actual results could differ from those estimates. Subsequent events, if any, through the
Annual Report
Notes to Financial Statements - continued
3. Significant Accounting Policies - continued
date that the financial statements were issued have been evaluated in the preparation of the financial statements. The following summarizes the significant accounting policies of the Fund:
Security Valuation. Investments are valued as of 4:00 p.m. Eastern time on the last calendar day of the period. The Fund uses independent pricing services approved by the Board of Trustees to value its investments. When current market prices or quotations are not readily available or reliable, valuations may be determined in good faith in accordance with procedures adopted by the Board of Trustees. Factors used in determining value may include market or security specific events. The frequency with which these procedures are used cannot be predicted and they may be utilized to a significant extent. The value used for net asset value (NAV) calculation under these procedures may differ from published prices for the same securities.
The Fund categorizes the inputs to valuation techniques used to value its investments into a disclosure hierarchy consisting of three levels as shown below:
Level 1 - quoted prices in active markets for identical investments
Level 2 - other significant observable inputs (including quoted prices for similar investments, interest rates, prepayment speeds, etc.)
Level 3 - unobservable inputs (including the Fund's own assumptions based on the best information available)
Changes in valuation techniques may result in transfers in or out of an assigned level within the disclosure hierarchy. The aggregate value of investments by input level, as of July 31, 2011, as well as a roll forward of Level 3 securities, is included at the end of the Fund's Schedule of Investments. Valuation techniques used to value the Fund's investments by major category are as follows:
Equity securities, including restricted securities, for which market quotations are readily available, are valued at the last reported sale price or official closing price as reported by an independent pricing service on the primary market or exchange on which they are traded and are categorized as Level 1 in the hierarchy. In the event there were no sales during the day or closing prices are not available, securities are valued at the last quoted bid price or may be valued using the last available price and are generally categorized as Level 2 in the hierarchy. For foreign equity securities, when significant market or security specific events arise, comparisons to the valuation of American Depositary Receipts (ADRs), futures contracts, Exchange-traded funds (ETFs) and certain indexes as well as quoted prices for similar securities are used and are categorized as Level 2 in the hierarchy in these circumstances. Utilizing these techniques may result in transfers between Level 1 and Level 2. For restricted equity securities and private placements where
Annual Report
3. Significant Accounting Policies - continued
Security Valuation - continued
observable inputs are limited, assumptions about market activity and risk are used and are categorized as Level 3 in the hierarchy.
Futures contracts are valued at the settlement price established each day by the board of trade or exchange on which they are traded and are categorized as Level 1 in the hierarchy. Investments in open-end mutual funds, including the Fidelity Central Funds, are valued at their closing net asset value each business day and are categorized as Level 1 in the hierarchy. Short-term securities with remaining maturities of sixty days or less may be valued at amortized cost, which approximates fair value, and are categorized as Level 2 in the hierarchy.
Foreign Currency. The Fund may use foreign currency contracts to facilitate transactions in foreign-denominated securities. Gains and losses from these transactions may arise from changes in the value of the foreign currency or if the counterparties do not perform under the contracts' terms.
Foreign-denominated assets, including investment securities, and liabilities are translated into U.S. dollars at the exchange rate at period end. Purchases and sales of investment securities, income and dividends received and expenses denominated in foreign currencies are translated into U.S. dollars at the exchange rate in effect on the transaction date.
The effects of exchange rate fluctuations on investments are included with the net realized and unrealized gain (loss) on investment securities. Other foreign currency transactions resulting in realized and unrealized gain (loss) are disclosed separately.
Investment Transactions and Income. For financial reporting purposes, the Fund's investment holdings and NAV include trades executed through the end of the last business day of the period. The NAV per share for processing shareholder transactions is calculated as of the close of business of the New York Stock Exchange (NYSE), normally 4:00 p.m. Eastern time and includes trades executed through the end of the prior business day. Gains and losses on securities sold are determined on the basis of identified cost and may include proceeds received from litigation. Dividend income is recorded on the ex-dividend date, except for certain dividends from foreign securities where the ex-dividend date may have passed, which are recorded as soon as the Fund is informed of the ex-dividend date. Non-cash dividends included in dividend income, if any, are recorded at the fair market value of the securities received. Distributions received on securities that represent a return of capital or capital gain are recorded as a reduction of cost of investments and/or as a realized gain. The Fund estimates the components of distributions received that may be considered return of capital distributions or capital gain distributions. Large, non-recurring dividends recognized by the Fund are presented
Annual Report
Notes to Financial Statements - continued
3. Significant Accounting Policies - continued
Investment Transactions and Income - continued
separately on the Statement of Operations as "Special Dividends" and the impact of these dividends is presented in the Financial Highlights. Interest income and distributions from the Fidelity Central Funds are accrued as earned. Interest income includes coupon interest and amortization of premium and accretion of discount on debt securities. Investment income is recorded net of foreign taxes withheld where recovery of such taxes is uncertain.
Expenses. Expenses directly attributable to a fund are charged to that fund. Expenses attributable to more than one fund are allocated among the respective funds on the basis of relative net assets or other appropriate methods. Expense estimates are accrued in the period to which they relate and adjustments are made when actual amounts are known.
Income Tax Information and Distributions to Shareholders. Each year, the Fund intends to qualify as a regulated investment company, including distributing substantially all of its taxable income and realized gains under Subchapter M of the Internal Revenue Code and filing its U.S. federal tax return. As a result, no provision for income taxes is required. As of July 31, 2011, the Fund did not have any unrecognized tax benefits in the financial statements. A fund's federal tax return is subject to examination by the Internal Revenue Service (IRS) for a period of three years. Foreign taxes are provided for based on the Fund's understanding of the tax rules and rates that exist in the foreign markets in which it invests.
Distributions are declared and recorded on the ex-dividend date. Income dividends and capital gain distributions are declared separately for each class. Income and capital gain distributions are determined in accordance with income tax regulations, which may differ from GAAP. These differences resulted in distribution reclasses. In addition, the fund claimed a portion of the payment made to redeeming shareholders as a distribution for income tax purposes.
Capital accounts within the financial statements are adjusted for permanent book-tax differences. These adjustments have no impact on net assets or the results of operations. Temporary book-tax differences will reverse in a subsequent period.
Book-tax differences are primarily due to futures transactions, foreign currency transactions, market discount, partnerships, net operating losses, capital loss carryforwards, and losses deferred due to wash sales and excise tax regulations.
Annual Report
3. Significant Accounting Policies - continued
Income Tax Information and Distributions to Shareholders - continued
The federal tax cost of investment securities and unrealized appreciation (depreciation) as of period end were as follows:
Gross unrealized appreciation | $ 408,545,958 |
Gross unrealized depreciation | (104,238,893) |
Net unrealized appreciation (depreciation) on securities and other investments | $ 304,307,065 |
| |
Tax Cost | $ 1,636,517,115 |
The tax-based components of distributable earnings as of period end were as follows:
Undistributed long-term capital gain | $ 16,848,398 |
Net unrealized appreciation (depreciation) | $ 304,311,521 |
Under the recently enacted Regulated Investment Company Modernization Act of 2010 (the Act), the Fund will be permitted to carry forward capital losses incurred in taxable years beginning after December 22, 2010 for an unlimited period. However, any losses incurred during those future taxable years will be required to be utilized prior to any losses incurred in pre-enactment taxable years, which generally expire after eight years from when they are incurred. Additionally, post-enactment capital losses that are carried forward will retain their character as either short-term or long-term capital losses rather than being considered all short-term as under previous law. The Fund's first fiscal year end subject to the Act will be July 31, 2012.
The tax character of distributions paid was as follows:
| July 31, 2011 | July 31, 2010 |
Long-term Capital Gains | $ 6,204,046 | $ - |
New Accounting Pronouncement. In May 2011, the Financial Accounting Standards Board issued Accounting Standard Update No. 2011-04, Fair Value Measurement (Topic 820) - Amendments to Achieve Common Fair Value Measurement and Disclosure Requirements in U.S. GAAP and IFRSs. The update changes the wording used to describe the requirements in GAAP for measuring fair value and for disclosing information about fair value measurements. The update is effective during interim and annual periods beginning after December 15, 2011. Management is currently evaluating the impact of the update's adoption on the Fund's financial statement disclosures.
Annual Report
Notes to Financial Statements - continued
4. Operating Policies.
Restricted Securities. The Fund may invest in securities that are subject to legal or contractual restrictions on resale. These securities generally may be resold in transactions exempt from registration or to the public if the securities are registered. Disposal of these securities may involve time-consuming negotiations and expense, and prompt sale at an acceptable price may be difficult. Information regarding restricted securities is included at the end of the Fund's Schedule of Investments.
5. Derivative Instruments.
Risk Exposures and the Use of Derivative Instruments. The Fund used derivative instruments (derivatives), including futures contracts, in order to meet its investment objectives. The strategy is to use derivatives to increase returns and to manage exposure to certain risks as defined below. The success of any strategy involving derivatives depends on analysis of numerous economic factors, and if the strategies for investment do not work as intended, the Fund may not achieve its objectives.
The Fund's use of derivatives increased or decreased its exposure to the following risk:
Equity Risk | Equity risk relates to the fluctuations in the value of financial instruments as a result of changes in market prices (other than those arising from interest rate risk or foreign exchange risk), whether caused by factors specific to an individual investment, its issuer, or all factors affecting all instruments traded in a market or market segment. |
The Fund is also exposed to additional risks from investing in derivatives, such as liquidity risk and counterparty credit risk. Liquidity risk is the risk that the Fund will be unable to sell the derivative in the open market in a timely manner. Counterparty credit risk is the risk that the counterparty will not be able to fulfill its obligation to the Fund. The Fund's maximum risk of loss from counterparty credit risk is generally the aggregate unrealized appreciation and unpaid counterparty payments in excess of any collateral pledged by the counterparty to the Fund. Counterparty risk related to exchange-traded futures contracts is minimal because of the protection provided by the exchange on which they trade. Derivatives involve, to varying degrees, risk of loss in excess of the amounts recognized in the Statement of Assets and Liabilities.
Futures Contracts. A futures contract is an agreement between two parties to buy or sell a specified underlying instrument for a fixed price at a specified future date. The Fund used futures contracts to manage its exposure to the stock markets.
Upon entering into a futures contract, a fund is required to deposit either cash or securities (initial margin) with a clearing broker in an amount equal to a certain percentage of the face value of the contract. Futures contracts are marked-to-market daily and subsequent payments (variation margin) are made or received by a fund depending on the
Annual Report
5. Derivative Instruments - continued
Futures Contracts - continued
daily fluctuations in the value of the futures contracts and are recorded as unrealized appreciation or (depreciation). This receivable and/or payable is included in daily variation margin on futures contracts in the Statement of Assets and Liabilities. Realized gain or (loss) is recorded upon the expiration or closing of a futures contract.
The underlying face amount at value of open futures contracts at period end is shown in the Schedule of Investments under the caption "Futures Contracts." This amount reflects each contract's exposure to the underlying instrument at period end and is representative of activity for the period. Securities deposited to meet initial margin requirements are identified in the Schedule of Investments.
Certain risks arise upon entering into futures contracts, including the risk that an illiquid market limits the ability to close out a futures contract prior to settlement date.
During the period the Fund recognized net realized gain (loss) of $2,656,632 and a change in net unrealized appreciation (depreciation) of $61,794 related to its investment in futures contracts. These amounts are included in the Statement of Operations.
6. Purchases and Sales of Investments.
Purchases and sales of securities, other than short-term securities, aggregated $1,273,721,749 and $1,370,454,593, respectively.
7. Fees and Other Transactions with Affiliates.
Management Fee. FMR and its affiliates provide the Fund with investment management related services for which the Fund pays a monthly management fee. The management fee is the sum of an individual fund fee rate that is based on an annual rate of .45% of the Fund's average net assets and a group fee rate that averaged .26% during the period. The group fee rate is based upon the average net assets of all the mutual funds advised by FMR. The group fee rate decreases as assets under management increase and increases as assets under management decrease. In addition, the management fee is subject to a performance adjustment (up to a maximum of ± .20% of the Fund's average net assets over a 36 month performance period). The upward or downward adjustment to the management fee is based on the relative investment performance of Series Small Cap Opportunities as compared to an appropriate benchmark index. For the period, the total annual management fee rate, including the performance adjustment, was .85% of the Fund's average net assets.
Transfer Agent Fees. Fidelity Investments Institutional Operations Company, Inc. (FIIOC), an affiliate of FMR, is the transfer, dividend disbursing and shareholder
Annual Report
Notes to Financial Statements - continued
7. Fees and Other Transactions with Affiliates - continued
Transfer Agent Fees - continued
servicing agent for each class of the Fund. FIIOC receives account fees and asset-based fees that vary according to the account size and type of account of the shareholders of Series Small Cap Opportunities. FIIOC receives no fees for providing transfer agency services to Class F. FIIOC pays for typesetting, printing and mailing of shareholder reports, except proxy statements.
For the period, transfer agent fees for each class were as follows:
| Amount | % of
Average
Net Assets |
Series Small Cap Opportunities | $ 3,075,444 | .21 |
Accounting and Security Lending Fees. Fidelity Service Company, Inc. (FSC), an affiliate of FMR, maintains the Fund's accounting records. The accounting fee is based on the level of average net assets for the month. Under a separate contract, FSC administers the security lending program. The security lending fee is based on the number and duration of lending transactions.
Brokerage Commissions. The Fund placed a portion of its portfolio transactions with brokerage firms which are affiliates of the investment adviser. The commissions paid to these affiliated firms were $66,015 for the period.
Interfund Lending Program. Pursuant to an Exemptive Order issued by the SEC, the Fund, along with other registered investment companies having management contracts with FMR, may participate in an interfund lending program. This program provides an alternative credit facility allowing the funds to borrow from, or lend money to, other participating affiliated funds. At period end, there were no interfund loans outstanding. The Fund's activity in this program during the period for which loans were outstanding was as follows:
Borrower or Lender | Average Daily
Loan Balance | Weighted Average
Interest Rate | Interest
Expense |
Borrower | $ 17,416,000 | .41% | $ 594 |
8. Committed Line of Credit.
The Fund participates with other funds managed by FMR or an affiliate in a $4.0 billion credit facility (the "line of credit") to be utilized for temporary or emergency purposes to fund shareholder redemptions or for other short-term liquidity purposes. The Fund has agreed to pay commitment fees on its pro-rata portion of the line of credit, which
Annual Report
8. Committed Line of Credit - continued
amounted to $5,897 and is reflected in Miscellaneous expenses on the Statement of Operations. During the period, there were no borrowings on this line of credit.
9. Security Lending.
The Fund lends portfolio securities through a lending agent from time to time in order to earn additional income. The lending agent may loan securities to certain qualified borrowers, including Fidelity Capital Markets (FCM), a broker-dealer affiliated with the Fund. On the settlement date of the loan, the Fund receives collateral (in the form of U.S. Treasury obligations, letters of credit and/or cash) against the loaned securities and maintains collateral in an amount not less than 100% of the market value of the loaned securities during the period of the loan. The market value of the loaned securities is determined at the close of business of the Fund and any additional required collateral is delivered to the Fund on the next business day. If the borrower defaults on its obligation to return the securities loaned because of insolvency or other reasons, a fund could experience delays and costs in recovering the securities loaned or in gaining access to the collateral. Any cash collateral received is invested in the Fidelity Securities Lending Cash Central Fund. The value of loaned securities and cash collateral at period end are disclosed on the Fund's Statement of Assets and Liabilities. Security lending income represents the income earned on investing cash collateral, less rebates paid to borrowers and lending agent fees associated with the loan, plus any premium payments received for lending certain types of securities. Security lending income is presented in the Statement of Operations as a component of income from Fidelity Central Funds. Total security lending income during the period amounted to $472,365. During the period, there were no securities loaned to FCM.
10. Expense Reductions.
Many of the brokers with whom FMR places trades on behalf of the Fund provided services to the Fund in addition to trade execution. These services included payments of certain expenses on behalf of the Fund totaling $113,867 for the period.
11. Distributions to Shareholders.
Distributions to shareholders of each class were as follows:
Years ended July 31, | 2011 | 2010 |
From net realized gain | | |
Series Small Cap Opportunities | $ 4,912,757 | $ - |
Class F | 1,291,289 | - |
Total | $ 6,204,046 | $ - |
Annual Report
Notes to Financial Statements - continued
12. Share Transactions.
Transactions for each class of shares were as follows:
| Shares | Dollars |
Years ended July 31, | 2011 | 2010 | 2011 | 2010 |
Series Small Cap Opportunities | | | | |
Shares sold | 16,351,707 | 23,783,608 | $ 173,441,686 | $ 194,753,795 |
Reinvestment of distributions | 455,386 | - | 4,912,757 | - |
Shares redeemed | (46,302,549) | (53,284,371) | (481,366,419) | (444,895,516) |
Net increase (decrease) | (29,495,456) | (29,500,763) | $ (303,011,976) | $ (250,141,721) |
Class F | | | | |
Shares sold | 27,247,978 | 21,585,308 | $ 289,602,420 | $ 180,598,380 |
Reinvestment of distributions | 119,471 | - | 1,291,289 | - |
Shares redeemed | (4,765,328) | (1,720,780) | (51,387,094) | (14,960,210) |
Net increase (decrease) | 22,602,121 | 19,864,528 | $ 239,506,615 | $ 165,638,170 |
13. Other.
The Fund's organizational documents provide former and current trustees and officers with a limited indemnification against liabilities arising in connection with the performance of their duties to the Fund. In the normal course of business, the Fund may also enter into contracts that provide general indemnifications. The Fund's maximum exposure under these arrangements is unknown as this would be dependent on future claims that may be made against the Fund. The risk of material loss from such claims is considered remote.
At period end, mutual funds managed by FMR or an affiliate were owners of record of substantially all of the outstanding shares of the Fund.
Annual Report
To the Trustees of Fidelity Securities Fund and Shareholders of Fidelity Series Small Cap Opportunities Fund:
We have audited the accompanying statement of assets and liabilities of Fidelity Series Small Cap Opportunities Fund (the Fund), a fund of Fidelity Securities Fund, including the schedule of investments, as of July 31, 2011, and the related statement of operations for the year then ended, the statement of changes in net assets for each of the two years in the period then ended, and the financial highlights for the periods presented. These financial statements and financial highlights are the responsibility of the Fund's management. Our responsibility is to express an opinion on these financial statements and financial highlights based on our audits.
We conducted our audits in accordance with the standards of the Public Company Accounting Oversight Board (United States). Those standards require that we plan and perform the audit to obtain reasonable assurance about whether the financial statements and financial highlights are free of material misstatement. The Fund is not required to have, nor were we engaged to perform, an audit of its internal control over financial reporting. Our audits included consideration of internal control over financial reporting as a basis for designing audit procedures that are appropriate in the circumstances, but not for the purpose of expressing an opinion on the effectiveness of the Fund's internal control over financial reporting. Accordingly, we express no such opinion. An audit also includes examining, on a test basis, evidence supporting the amounts and disclosures in the financial statements, assessing the accounting principles used and significant estimates made by management, as well as evaluating the overall financial statement presentation. Our procedures included confirmation of securities owned as of July 31, 2011, by correspondence with the custodians and brokers; where replies were not received from brokers, we performed other auditing procedures. We believe that our audits provide a reasonable basis for our opinion.
In our opinion, the financial statements and financial highlights referred to above present fairly, in all material respects, the financial position of Fidelity Series Small Cap Opportunities Fund as of July 31, 2011, the results of its operations for the year then ended, the changes in its net assets for each of the two years in the period then ended, and the financial highlights for the periods presented, in conformity with accounting principles generally accepted in the United States of America.
/s/ Deloitte & Touche LLP
DELOITTE & TOUCHE LLP
Boston, Massachusetts
September 16, 2011
Annual Report
The Trustees, Members of the Advisory Board, and executive officers of the trust and fund, as applicable, are listed below. The Board of Trustees governs the fund and is responsible for protecting the interests of shareholders. The Trustees are experienced executives who meet periodically throughout the year to oversee the fund's activities, review contractual arrangements with companies that provide services to the fund, oversee management of the risks associated with such activities and contractual arrangements, and review the fund's performance. Except for James C. Curvey, each of the Trustees oversees 221 funds advised by FMR or an affiliate. Mr. Curvey oversees 419 funds advised by FMR or an affiliate.
The Trustees hold office without limit in time except that (a) any Trustee may resign; (b) any Trustee may be removed by written instrument, signed by at least two-thirds of the number of Trustees prior to such removal; (c) any Trustee who requests to be retired or who has become incapacitated by illness or injury may be retired by written instrument signed by a majority of the other Trustees; and (d) any Trustee may be removed at any special meeting of shareholders by a two-thirds vote of the outstanding voting securities of the trust. Each Trustee who is not an interested person (as defined in the 1940 Act) (Independent Trustee), shall retire not later than the last day of the calendar year in which his or her 75th birthday occurs. The Independent Trustees may waive this mandatory retirement age policy with respect to individual Trustees. The executive officers and Advisory Board Members hold office without limit in time, except that any officer and Advisory Board Member may resign or may be removed by a vote of a majority of the Trustees at any regular meeting or any special meeting of the Trustees. Except as indicated, each individual has held the office shown or other offices in the same company for the past five years.
Experience, Skills, Attributes, and Qualifications of the Fund's Trustees. The Governance and Nominating Committee has adopted a statement of policy that describes the experience, qualifications, attributes, and skills that are necessary and desirable for potential Independent Trustee candidates (Statement of Policy). The Board believes that each Trustee satisfied at the time he or she was initially elected or appointed a Trustee, and continues to satisfy, the standards contemplated by the Statement of Policy. The Governance and Nominating Committee also engages professional search firms to help identify potential Independent Trustee candidates who have the experience, qualifications, attributes, and skills consistent with the Statement of Policy. From time to time, additional criteria based on the composition and skills of the current Independent Trustees, as well as experience or skills that may be appropriate in light of future changes to board composition, business conditions, and regulatory or other developments, have also been considered by the professional search firms and the Governance and Nominating Committee. In addition, the Board takes into account the Trustees' commitment and participation in Board and committee meetings, as well as their leadership of standing and ad hoc committees throughout their tenure.
In determining that a particular Trustee was and continues to be qualified to serve as a Trustee, the Board has considered a variety of criteria, none of which, in isolation, was controlling. The Board believes that, collectively, the Trustees have balanced and diverse experience, qualifications, attributes, and skills, which allow the Board to operate effectively in governing the fund and protecting the interests of shareholders. Information about the specific experience, skills, attributes, and qualifications of each Trustee, which in each case led to the Board's conclusion that the Trustee should serve (or continue to serve) as a trustee of the fund, is provided below.
Annual Report
Trustees and Officers - continued
Board Structure and Oversight Function. James C. Curvey is an interested person (as defined in the 1940 Act) and currently serves as Acting Chairman. The Trustees have determined that an interested Chairman is appropriate and benefits shareholders because an interested Chairman has a personal and professional stake in the quality and continuity of services provided to the fund. Independent Trustees exercise their informed business judgment to appoint an individual of their choosing to serve as Chairman, regardless of whether the Trustee happens to be independent or a member of management. The Independent Trustees have determined that they can act independently and effectively without having an Independent Trustee serve as Chairman and that a key structural component for assuring that they are in a position to do so is for the Independent Trustees to constitute a substantial majority for the Board. The Independent Trustees also regularly meet in executive session. Ned C. Lautenbach serves as Chairman of the Independent Trustees and as such (i) acts as a liaison between the Independent Trustees and management with respect to matters important to the Independent Trustees and (ii) with management prepares agendas for Board meetings.
Fidelity funds are overseen by different Boards of Trustees. The fund's Board oversees Fidelity's equity and high income funds and another Board oversees Fidelity's investment-grade bond, money market, and asset allocation funds. The asset allocation funds may invest in Fidelity funds overseen by the fund's Board. The use of separate Boards, each with its own committee structure, allows the Trustees of each group of Fidelity funds to focus on the unique issues of the funds they oversee, including common research, investment, and operational issues. On occasion, the separate Boards establish joint committees to address issues of overlapping consequences for the Fidelity funds overseen by each Board.
The Trustees operate using a system of committees to facilitate the timely and efficient consideration of all matters of importance to the Trustees, the fund, and fund shareholders and to facilitate compliance with legal and regulatory requirements and oversight of the fund's activities and associated risks. The Board, acting through its committees, has charged FMR and its affiliates with (i) identifying events or circumstances the occurrence of which could have demonstrably adverse effects on the fund's business and/or reputation; (ii) implementing processes and controls to lessen the possibility that such events or circumstances occur or to mitigate the effects of such events or circumstances if they do occur; and (iii) creating and maintaining a system designed to evaluate continuously business and market conditions in order to facilitate the identification and implementation processes described in (i) and (ii) above. Because the day-to-day operations and activities of the fund are carried out by or through FMR, its affiliates and other service providers, the fund's exposure to risks is mitigated but not eliminated by the processes overseen by the Trustees. While each of the Board's committees has responsibility for overseeing different aspects of the fund's activities, oversight is exercised primarily through the Operations, Audit, and Compliance Committees. Appropriate personnel, including but not limited to the fund's Chief Compliance Officer (CCO), FMR's internal auditor, the independent accountants, the fund's Treasurer and portfolio management personnel, make periodic reports to the Board's committees, as appropriate. The responsibilities of each committee, including their oversight responsibilities, are described further under "Standing Committees of the Fund's Trustees."
Annual Report
The fund's Statement of Additional Information (SAI) includes more information about the Trustees. To request a free copy, call Fidelity at 1-800-544-8544 for Fidelity Series Small Cap Opportunities Fund or 1-800-835-5092 for Class F.
Interested Trustees*:
Correspondence intended for each Trustee who is an interested person may be sent to Fidelity Investments, 82 Devonshire Street, Boston, Massachusetts 02109.
Name, Age; Principal Occupations and Other Relevant Experience+ |
James C. Curvey (76) |
| Year of Election or Appointment: 2007 Mr. Curvey is Trustee and Acting Chairman of the Board of Trustees of certain Trusts. Mr. Curvey also serves as Trustee (2007-present) of other investment companies advised by FMR. Mr. Curvey is a Director of Fidelity Investments Money Management, Inc. (2009-present), Director of Fidelity Research & Analysis Co. (2009-present) and Director of FMR and FMR Co., Inc. (2007-present). Mr. Curvey is also Vice Chairman (2007-present) and Director of FMR LLC. In addition, Mr. Curvey serves as an Overseer for the Boston Symphony Orchestra and a member of the Trustees of Villanova University. Previously, Mr. Curvey was the Vice Chairman (2006-2007) and Director (2000-2007) of FMR Corp. |
Ronald P. O'Hanley (54) |
| Year of Election or Appointment: 2011 Mr. O'Hanley is Director of FMR Co., Inc. (2010-present), Director of Fidelity Investments Money Management, Inc. (2010-present), Director of Fidelity Research & Analysis Company (2010-present), President of Fidelity Asset Management and Corporate Services and a member of Fidelity's Executive Committee (2010-present). Previously, Mr. O'Hanley served as President and Chief Executive Officer of BNY Mellon Asset Management (2007-2010). Mr. O'Hanley also served as Vice Chairman of Bank New York Mellon Corp. and a member of that firm's Executive Committee. Prior to the 2007 merger of The Bank of New York and Mellon Financial Corporation, he was Vice Chairman of Mellon Financial Corporation and President and Chief Executive Officer of Mellon Asset Management. He joined Mellon in February 1997. Mr. O'Hanley currently serves as Chairman of the Boston Public Library Foundation Board of Directors and sits on the Board of Directors of Beth Israel Deaconess Medical Center, the Board of Trustees of the Marine Biological Laboratory and the Advisory Board of the Maxwell School of Citizenship and Public Administration at Syracuse University. Mr. O'Hanley also chairs the Council on Asset Management for the Financial Services Roundtable and is a member of the Board of Directors of Institutional Investor's U.S. Institute. |
* Trustees have been determined to be "Interested Trustees" by virtue of, among other things, their affiliation with the trust or various entities under common control with FMR.
+ The information above includes each Trustee's principal occupation during the last five years and other information relating to the experience, attributes, and skills relevant to each Trustee's qualifications to serve as a Trustee, which led to the conclusion that each Trustee should serve as a Trustee for the fund.
Annual Report
Independent Trustees:
Correspondence intended for each Independent Trustee (that is, the Trustees other than the Interested Trustees) may be sent to Fidelity Investments, P.O. Box 55235, Boston, Massachusetts 02205-5235.
Name, Age; Principal Occupations and Other Relevant Experience+ |
Dennis J. Dirks (63) |
| Year of Election or Appointment: 2005 Prior to his retirement in May 2003, Mr. Dirks was Chief Operating Officer and a member of the Board of The Depository Trust & Clearing Corporation (DTCC). He also served as President, Chief Operating Officer, and Board member of The Depository Trust Company (DTC) and President and Board member of the National Securities Clearing Corporation (NSCC). In addition, Mr. Dirks served as Chief Executive Officer and Board member of the Government Securities Clearing Corporation, Chief Executive Officer and Board member of the Mortgage-Backed Securities Clearing Corporation, as a Trustee and a member of the Finance Committee of Manhattan College (2005-2008), and as a Trustee and a member of the Finance Committee of AHRC of Nassau County (2006-2008). Mr. Dirks is a member of the Independent Directors Council (IDC) Governing Council (2010-Present) and Board of Directors for The Brookville Center for Children's Services, Inc. (2009-present). |
Alan J. Lacy (57) |
| Year of Election or Appointment: 2008 Mr. Lacy serves as Senior Adviser (2007-present) of Oak Hill Capital Partners, L.P. (private equity). Mr. Lacy also served as Chief Executive Officer (2000-2005) and Vice Chairman (2005-2006) of Sears Holdings Corporation and Sears, Roebuck and Co. (retail). In addition, Mr. Lacy serves as a member of the Board of Directors of Dave & Buster's, Inc. (restaurant and entertainment complexes, 2010-present), The Hillman Companies, Inc. (hardware wholesalers, 2010-present), and Bristol-Myers Squibb Company (global pharmaceuticals, 2007-present). Mr. Lacy is a member of the Board of Trustees of The National Parks Conservation Association (2006-Present). Previously, Mr. Lacy served as Chairman of the Board of Trustees of the National Parks Conservation Association (2008-2011) and as a member of the Board of Directors for the Western Union Company (global money transfer, 2006-2011). |
Ned C. Lautenbach (67) |
| Year of Election or Appointment: 2000 Mr. Lautenbach is Chairman of the Independent Trustees of the Equity and High Income Funds (2006-present). Mr. Lautenbach currently serves as the Lead Director of the Eaton Corporation Board of Directors (diversified industrial, 1997-present). Mr. Lautenbach is also a member of the Board of Directors of the Philharmonic Center for the Arts in Naples, Florida (1999-present); a member of the Board of Trustees of Fairfield University (2005-present); and a member of the Council on Foreign Relations (1994-present). Previously, Mr. Lautenbach was a Partner/Advisory Partner at Clayton, Dubilier & Rice, LLC (private equity investment, 1998-2010), as well as a Director of Sony Corporation (2006-2007). |
Joseph Mauriello (66) |
| Year of Election or Appointment: 2008 Prior to his retirement in January 2006, Mr. Mauriello served in numerous senior management positions including Deputy Chairman and Chief Operating Officer (2004-2005), and Vice Chairman of Financial Services (2002-2004) of KPMG LLP US (professional services, 1965-2005). Mr. Mauriello currently serves as a member of the Board of Directors of XL Group plc. (global insurance and re-insurance, 2006-present) and of Arcadia Resources Inc. (health care services and products, 2007-present). Previously, Mr. Mauriello served as a Director of the Hamilton Funds of the Bank of New York (2006-2007). |
Robert W. Selander (60) |
| Year of Election or Appointment: 2011 Previously, Mr. Selander served as a Member of the Advisory Board of Fidelity's Equity and High Income Funds (2011), Executive Vice Chairman (2010), Chief Executive Officer (2009-2010), and President and Chief Executive Officer (1997-2009) of Mastercard, Inc. |
Cornelia M. Small (67) |
| Year of Election or Appointment: 2005 Ms. Small is a member of the Board of Directors of the Teagle Foundation (2009-present). Ms. Small is also a member of the Investment Committee, and Chair (2008-present) and a member of the Board of Trustees of Smith College. In addition, Ms. Small serves on the Investment Committee of the Berkshire Taconic Community Foundation (2008-present). Previously, Ms. Small served as Chairperson of the Investment Committee (2002-2008) of Smith College. In addition, Ms. Small served as Chief Investment Officer, Director of Global Equity Investments, and a member of the Board of Directors of Scudder, Stevens & Clark and Scudder Kemper Investments. |
William S. Stavropoulos (72) |
| Year of Election or Appointment: 2002 Mr. Stavropoulos is Vice Chairman of the Independent Trustees of the Equity and High Income Funds (2006-present). Mr. Stavropoulos serves as President and Founder of the Michigan Baseball Foundation, the Great Lakes Loons (2007-present). Mr. Stavropoulos is Chairman Emeritus of the Board of Directors of The Dow Chemical Company, where he previously served in numerous senior management positions, including President, CEO (1995-2000; 2002-2004), Chairman of the Executive Committee (2000-2006), and as a member of the Board of Directors (1990-2006). Currently, Mr. Stavropoulos is Chairman of Univar (global distributor of commodity and specialty chemicals, 2010-present), a Director of Teradata Corporation (data warehousing and technology solutions, 2008-present), Chemical Financial Corporation, Maersk Inc. (industrial conglomerate), Tyco International, Inc. (multinational manufacturing and services, 2007-present), and a member of the Advisory Board for Metalmark Capital (private equity investment, 2005-present). Mr. Stavropoulos is a special advisor to Clayton, Dubilier & Rice, LLC (private equity investment). In addition, Mr. Stavropoulos is a member of the University of Notre Dame Advisory Council for the College of Science. |
David M. Thomas (62) |
| Year of Election or Appointment: 2008 Previously, Mr. Thomas served as Executive Chairman (2005-2006) and Chairman and Chief Executive Officer (2000-2005) of IMS Health, Inc. (pharmaceutical and healthcare information solutions). In addition, Mr. Thomas serves as a member of the Board of Directors of Fortune Brands, Inc. (consumer products), and Interpublic Group of Companies, Inc. (marketing communication, 2004-present). |
Michael E. Wiley (60) |
| Year of Election or Appointment: 2008 Mr. Wiley also serves as a Director of Asia Pacific Exploration Consolidated (international oil and gas exploration and production, 2008-present). Mr. Wiley serves as a Director of Tesoro Corporation (independent oil refiner and marketer, 2005-present), and a Director of Bill Barrett Corporation (exploration and production, 2005-present). In addition, Mr. Wiley also serves as a Director of Post Oak Bank (privately-held bank, 2004-present). Previously, Mr. Wiley served as a member of the Board of Trustees of the University of Tulsa (2000-2006; 2007-2010), as a Senior Energy Advisor of Katzenbach Partners, LLC (consulting, 2006-2007), as an Advisory Director of Riverstone Holdings (private investment), Chairman, President, and CEO of Baker Hughes, Inc. (oilfield services, 2000-2004), and as Director of Spinnaker Exploration Company (exploration and production, 2001-2005). |
Annual Report
Trustees and Officers - continued
+ The information above includes each Trustee's principal occupation during the last five years and other information relating to the experience, attributes, and skills relevant to each Trustee's qualifications to serve as a Trustee, which led to the conclusion that each Trustee should serve as a Trustee for the fund.
Advisory Board Members and Executive Officers:
Correspondence intended for each executive officer, Edward C. Johnson 3d, and Peter S. Lynch may be sent to Fidelity Investments, 82 Devonshire Street, Boston, Massachusetts 02109.
Name, Age; Principal Occupation |
Edward C. Johnson 3d (81) |
| Year of Election or Appointment: 2011 Member of the Advisory Board of Fidelity's Equity and High Income Funds. Mr. Johnson serves as Chief Executive Officer, Chairman, and a Director of FMR LLC, and also serves as Chairman and Director of FIL Limited. Previously, Mr. Johnson served as a Trustee and Chairman of the Board of certain Fidelity Trusts, Chairman and a Director of FMR, Chairman and a Director of FMR Co., Inc., and President of FMR LLC (2006-2007). |
Peter S. Lynch (67) |
| Year of Election or Appointment: 2003 Member of the Advisory Board of Fidelity's Equity and High Income Funds. Mr. Lynch is Vice Chairman and a Director of FMR and FMR Co., Inc. In addition, Mr. Lynch serves as a Trustee of Boston College and as the Chairman of the Inner-City Scholarship Fund. Previously, Mr. Lynch served on the Special Olympics International Board of Directors (1997-2006). |
Kenneth B. Robins (41) |
| Year of Election or Appointment: 2008 President and Treasurer of Fidelity's Equity and High Income Funds. Mr. Robins also serves as President and Treasurer (2010-present) and Assistant Treasurer (2009-present) of other Fidelity funds and is an employee of Fidelity Investments (2004-present). Previously, Mr. Robins served as Deputy Treasurer of the Fidelity funds (2005-2008) and Treasurer and Chief Financial Officer of The North Carolina Capital Management Trust: Cash and Term Portfolios (2006-2008). |
Brian B. Hogan (46) |
| Year of Election or Appointment: 2009 Vice President of Equity and High Income Funds. Mr. Hogan also serves as President of FMR's Equity Division (2009-present). Previously, Mr. Hogan served as Senior Vice President, Equity Research of FMR (2006-2009) and as a portfolio manager. |
Thomas C. Hense (47) |
| Year of Election or Appointment: 2008 or 2010 Vice President of Fidelity's High Income (2008), Small Cap (2008), and Value (2010) Funds. Previously, Mr. Hense served as a portfolio manager for Fidelity's Institutional Money Management Group (Pyramis) (2003-2008). |
Scott C. Goebel (43) |
| Year of Election or Appointment: 2008 Secretary and Chief Legal Officer (CLO) of the Fidelity funds. Mr. Goebel also serves as Secretary of Fidelity Investments Money Management, Inc. (FIMM) (2010-present) and Fidelity Research and Analyis Company (FRAC) (2010-present); Secretary and CLO of The North Carolina Capital Management Trust: Cash and Term Portfolios (2008-present); General Counsel, Secretary, and Senior Vice President of FMR (2008-present) and FMR Co., Inc. (2008-present); employed by FMR LLC or an affiliate (2001-present); Chief Legal Officer of Fidelity Management & Research (Hong Kong) Limited (2008-present) and Assistant Secretary of Fidelity Management & Research (Japan) Inc. (2008-present), and Fidelity Management & Research (U.K.) Inc. (2008-present). Previously, Mr. Goebel served as Assistant Secretary of FIMM (2008-2010), FRAC (2008-2010), and the Funds (2007-2008) and as Vice President and Secretary of Fidelity Distributors Corporation (FDC) (2005-2007). |
William C. Coffey (42) |
| Year of Election or Appointment: 2009 Assistant Secretary of Fidelity's Equity and High Income Funds. Mr. Coffey also serves as Senior Vice President and Deputy General Counsel of FMR LLC (2010-present), and is an employee of Fidelity Investments. Previously, Mr. Coffey served as Vice President and Associate General Counsel of FMR LLC (2005-2009). |
Holly C. Laurent (57) |
| Year of Election or Appointment: 2008 Anti-Money Laundering (AML) Officer of the Fidelity funds. Ms. Laurent also serves as AML Officer of The North Carolina Capital Management Trust: Cash and Term Portfolios (2008-present) and is an employee of Fidelity Investments. Previously, Ms. Laurent was Senior Vice President and Head of Legal for Fidelity Business Services India Pvt. Ltd. (2006-2008), and Senior Vice President, Deputy General Counsel and Group Head for FMR LLC (2005-2006). |
Christine Reynolds (52) |
| Year of Election or Appointment: 2008 Chief Financial Officer of the Fidelity funds. Ms. Reynolds became President of Fidelity Pricing and Cash Management Services (FPCMS) in August 2008. Ms. Reynolds served as Chief Operating Officer of FPCMS (2007-2008). Previously, Ms. Reynolds served as President, Treasurer, and Anti-Money Laundering officer of the Fidelity funds (2004-2007). |
Kenneth A. Rathgeber (64) |
| Year of Election or Appointment: 2004 Chief Compliance Officer of Fidelity's Equity and High Income Funds. Mr. Rathgeber is Chief Compliance Officer of Fidelity Management & Research (Hong Kong) Limited (2008-present), Fidelity Management & Research (Japan) Inc. (2008-present), FMR (2005-present), FMR Co., Inc. (2005-present), Fidelity Management & Research (U.K.) Inc. (2005-present), Fidelity Research & Analysis Company (2005-present), Fidelity Investments Money Management, Inc. (2005-present), Pyramis Global Advisors, LLC (2005-present), and Strategic Advisers, Inc. (2005-present). |
Jeffrey S. Christian (49) |
| Year of Election or Appointment: 2009 Deputy Treasurer of the Fidelity funds. Mr. Christian is an employee of Fidelity Investments. Previously, Mr. Christian served as Chief Financial Officer (2008-2009) of certain Fidelity funds and Senior Vice President of Fidelity Pricing and Cash Management Services (FPCMS) (2004-2009). |
Bryan A. Mehrmann (50) |
| Year of Election or Appointment: 2005 Deputy Treasurer of the Fidelity funds. Mr. Mehrmann is an employee of Fidelity Investments. |
Adrien E. Deberghes (43) |
| Year of Election or Appointment: 2008 Deputy Treasurer of Fidelity's Equity and High Income Funds. Mr. Deberghes also serves as Assistant Treasurer of other Fidelity funds (2010-present) and is an employee of Fidelity Investments (2008-present). Previously, Mr. Deberghes served as Senior Vice President of Mutual Fund Administration at State Street Corporation (2007-2008), Senior Director of Mutual Fund Administration at Investors Bank & Trust (2005-2007), and Director of Finance for Dunkin' Brands (2000-2005). |
Stephanie J. Dorsey (42) |
| Year of Election or Appointment: 2010 Assistant Treasurer of Fidelity's Equity and High Income Funds. Ms. Dorsey also serves as Deputy Treasurer of other Fidelity funds (2008-present) and is an employee of Fidelity Investments (2008-present). Previously, Ms. Dorsey served as Treasurer (2004-2008) of the JPMorgan Mutual Funds and Vice President (2004-2008) of JPMorgan Chase Bank. |
John R. Hebble (53) |
| Year of Election or Appointment: 2009 Assistant Treasurer of Fidelity's Equity and High Income Funds. Mr. Hebble also serves as President (2011-present), Treasurer, and Chief Financial Officer of The North Carolina Capital Management Trust: Cash and Term Portfolios (2008-present), President and Treasurer of other Fidelity funds (2008-present) and is an employee of Fidelity Investments. |
Gary W. Ryan (52) |
| Year of Election or Appointment: 2005 Assistant Treasurer of the Fidelity funds. Mr. Ryan is an employee of Fidelity Investments. Previously, Mr. Ryan served as Vice President of Fund Reporting in Fidelity Pricing and Cash Management Services (FPCMS) (1999-2005). |
Jonathan Davis (43) |
| Year of Election or Appointment: 2010 Assistant Treasurer of the Fidelity funds. Mr. Davis is an employee of Fidelity Investments. Previously, Mr. Davis served as Vice President and Associate General Counsel of FMR LLC (2003-2010). |
Annual Report
The Board of Trustees of Fidelity Series Small Cap Opportunities Fund voted to pay to shareholders of record at the opening of business on record date, the following distributions per share derived from capital gains realized from sales of portfolio securities:
| Pay Date | Record Date | Capital Gains |
Fidelity Series Small Cap Opportunities | 09/12/2011 | 09/09/2011 | $.10 |
Class F | 09/12/2011 | 09/09/2011 | $.10 |
The fund hereby designates as a capital gain dividend with respect to the taxable year ended July 31, 2011, $23,204,995, or, if subsequently determined to be different, the net capital gain of such year.
The fund designates 100% of the dividends distributed during the fiscal year as qualifying for the dividends-received deduction for corporate shareholders.
The fund designates 100% of the dividends distributed during the fiscal year as amounts which may be taken into account as a dividend for the purposes of the maximum rate under section 1(h)(11) of the Internal Revenue Code.
The fund will notify shareholders in January 2012 of amounts for use in preparing 2011 income tax returns.
Annual Report
Board Approval of Investment Advisory Contracts and Management Fees
Fidelity Series Small Cap Opportunities Fund
Each year, the Board of Trustees, including the Independent Trustees (together, the Board), votes on the renewal of the management contract and sub-advisory agreements (together, the Advisory Contracts) for the fund. The Board, assisted by the advice of fund counsel and Independent Trustees' counsel, requests and considers a broad range of information relevant to the renewal of the Advisory Contracts throughout the year.
The Board meets regularly and considers at each of its meetings factors that are relevant to its annual consideration of the renewal of the fund's Advisory Contracts, including the services and support provided to the fund and its shareholders. The Board has established various standing committees, each composed of Independent Trustees with varying backgrounds, to which the Board has assigned specific subject matter responsibilities in order to enhance effective decision-making by the Board. The Board, acting directly and through its Committees, requests and receives information concerning the annual consideration of the renewal of the fund's Advisory Contracts. The Board also meets as needed to consider matters specifically related to the Board's annual consideration of the renewal of Advisory Contracts. Members of the Board may also meet with trustees of other Fidelity funds through ad hoc joint committees to discuss certain matters relevant to the Fidelity funds.
At its July 2011 meeting, the Board of Trustees, including the Independent Trustees, unanimously determined to renew the fund's Advisory Contracts. In reaching its determination, the Board considered all factors it believed relevant, including (i) the nature, extent, and quality of the services to be provided to the fund and its shareholders (including the investment performance of the fund); (ii) the competitiveness of the fund's management fee and total expense ratio; (iii) the total costs of the services to be provided by and the profits to be realized by Fidelity from its relationship with the fund; (iv) the extent to which economies of scale would be realized as the fund grows; and (v) whether fee levels reflect these economies of scale, if any, for the benefit of fund shareholders.
In considering whether to renew the Advisory Contracts for the fund, the Board reached a determination, with the assistance of fund counsel and Independent Trustees' counsel and through the exercise of its business judgment, that the renewal of the Advisory Contracts is in the best interests of the fund and its shareholders and that the compensation payable under the Advisory Contracts is fair and reasonable. The Board's decision to renew the Advisory Contracts was not based on any single factor, but rather was based on a comprehensive consideration of all the information provided to the Board at its meetings throughout the year. The Board, in reaching its determination to renew the Advisory Contracts, is aware that shareholders in the fund have a broad range of investment choices available to them, including a wide choice among mutual funds offered by Fidelity's competitors, and that the fund's shareholders, who have the opportunity to review and weigh the disclosure provided by the fund in its prospectus and other public disclosures, have chosen to invest in this fund, managed by Fidelity.
Annual Report
Board Approval of Investment Advisory Contracts and
Management Fees - continued
Nature, Extent, and Quality of Services Provided. The Board considered the staffing within the investment adviser, FMR, and the sub-advisers (together, the Investment Advisers), including the backgrounds of the fund's investment personnel and the fund's investment objective and discipline. The Independent Trustees also had discussions with senior management of Fidelity's investment operations and investment groups. The Board considered the structure of the portfolio manager compensation program and whether this structure provides appropriate incentives to act in the best interests of the fund.
Resources Dedicated to Investment Management and Support Services. The Board and the Fund Oversight and Research Committees reviewed the general qualifications and capabilities of the Investment Advisers' investment staff, including its size, education, experience, and resources, as well as the Investment Advisers' approach to recruiting, training, managing, and compensating investment personnel. The Board also noted that FMR has devoted increased resources to non-U.S. offices. The Board noted that Fidelity's analysts have extensive resources, tools and capabilities which allow them to conduct sophisticated quantitative and fundamental analysis, as well as credit analysis of issuers, counterparties and enhancers. The Board also believes that Fidelity's investment professionals have sufficient access to global information and data so as to provide competitive investment results over time, and that those professionals also have access to sophisticated tools which permit them to assess portfolio construction and risk and performance attribution characteristics continuously, as well as to transmit new information and research conclusions rapidly around the world. Additionally, in their deliberations, the Board considered the Investment Advisers' trading capabilities and resources which are an integral part of the investment management process.
Shareholder and Administrative Services. The Board considered (i) the nature, extent, quality, and cost of advisory, administrative, and shareholder services performed by the Investment Advisers and their affiliates under the Advisory Contracts and under separate agreements covering transfer agency, pricing and bookkeeping, and securities lending services for the fund; (ii) the nature and extent of the investment adviser's supervision of third party service providers, principally custodians and subcustodians; and (iii) the resources devoted to, and the record of compliance with, the fund's compliance policies and procedures. The Board also reviewed the allocation of fund brokerage, including allocations to brokers affiliated with the Investment Advisers, the use of brokerage commissions to pay fund expenses, and the use of "soft" commission dollars to pay for research services.
The Board noted that the growth of fund assets over time across the complex allows Fidelity to reinvest in the development of services designed to enhance the value or convenience of the Fidelity funds as investment vehicles. These services include 24-hour access to account information and market information through telephone representatives and over the Internet, investor education materials and asset allocation tools, and the expanded availability of Fidelity Investor Centers, with 35 new branches opening since 2010.
Annual Report
Investment in a Large Fund Family. The Board considered the benefits to shareholders of investing in a Fidelity fund, including the benefits of investing in a fund that is part of a large family of funds offering a variety of investment disciplines and providing a large variety of mutual fund investor services. The Board noted that Fidelity had taken, or had made recommendations that resulted in the Fidelity funds taking, a number of actions over the previous year that benefited particular funds, including (i) continuing to dedicate additional resources to investment research and support of the senior management team that oversees asset management; (ii) rationalizing product lines through the mergers of six funds into other funds; (iii) continuing to migrate the Freedom Funds to dedicated lower cost underlying funds; (iv) obtaining shareholder approval to broaden the investment strategies for Fidelity Consumer Finance Portfolio, Fidelity Emerging Asia Fund, and Fidelity Environment and Alternative Energy Portfolio; (v) contractually agreeing to reduce the management fees and impose other expense limitations on Spartan® 500 Index Fund and U.S. Bond Index Fund in connection with launching new institutional classes of these funds; (vi) changing the name, primary and supplemental benchmarks, and investment policies of Fidelity Global Strategies Fund to support the fund's flexible investment mandate and global orientation; and (vii) reducing the transfer agency account fee rates on certain accounts.
Investment Performance. The Board considered whether the fund has operated in accordance with its investment objective, as well as its record of compliance with its investment restrictions. It also reviewed the fund's absolute investment performance for each class, as well as the fund's relative investment performance for each class measured against (i) a broad-based securities market index, and (ii) a peer group of mutual funds deemed appropriate by Fidelity and reviewed by the Board. Because the fund had been in existence less than five calendar years, the following charts considered by the Board show, over the one- and three-year periods ended December 31, 2010, as available, the cumulative total returns of Class F and the retail class of the fund, the cumulative total returns of a broad-based securities market index ("benchmark"), and a range of cumulative total returns of a peer group of mutual funds identified by Morningstar, Inc. as having an investment style similar to that of the fund based on underlying portfolio holdings. The box within each chart shows the 25th percentile return (bottom of box) and the 75th percentile return (top of box) of the peer group. Returns shown above the box are in the first quartile and returns shown below the box are in the fourth quartile. The percentage beaten numbers noted below each chart correspond to the percentile box and represent the percentage of funds in the peer group whose performance was equal to or lower than that of the class indicated.
Annual Report
Board Approval of Investment Advisory Contracts and
Management Fees - continued
Fidelity Series Small Cap Opportunities Fund
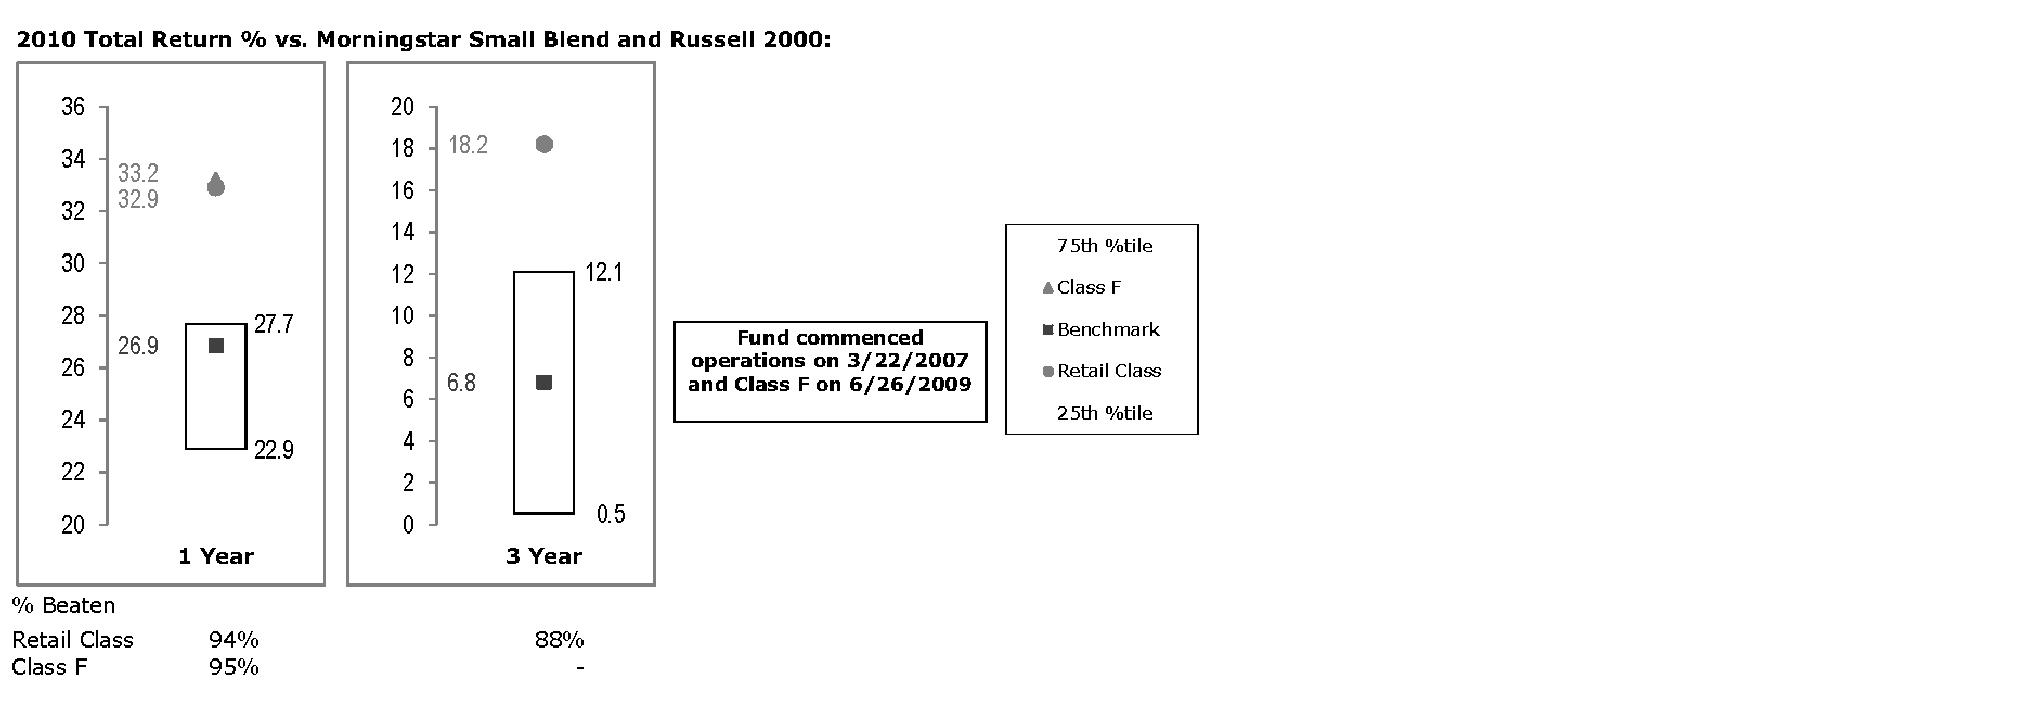
The Board reviewed the fund's relative investment performance against its peer group and noted that the performance of the retail class of the fund (the class with the longer performance record) was in the first quartile for all the periods shown. The Board also noted that the investment performance of the retail class of the fund compared favorably to its benchmark for all the periods shown. The Board considered that the variations in performance between the fund's classes reflect the variations in class expenses, which result in lower performance for the higher expense class. The Board also reviewed the fund's performance since inception as well as performance in the current year.
The Board also considered that the fund's management fee is subject to upward or downward adjustment depending upon whether, and to what extent, the fund's investment performance for the performance period exceeds, or is exceeded by, the record (over the same period) of a Board-approved performance adjustment index. The Board noted that the performance adjustment provides FMR with a strong economic incentive to seek to achieve superior performance for the fund's shareholders and helps to more closely align the interests of FMR and the fund's shareholders.
Based on its review, the Board concluded that the nature, extent, and quality of services provided to the fund under the Advisory Contracts should benefit the fund's shareholders.
Annual Report
Competitiveness of Management Fee and Total Expense Ratio. The Board considered the fund's management fee and total expense ratio compared to "mapped groups" of competitive funds and classes. Fidelity creates "mapped groups" by combining similar Lipper investment objective categories that have comparable management fee characteristics. Combining Lipper investment objective categories aids the Board's management fee and total expense ratio comparisons by broadening the competitive group used for comparison and by reducing the number of universes to which various Fidelity funds are compared.
Management Fee. The Board considered two proprietary management fee comparisons for the 12-month (or shorter) periods shown in the chart below. The group of Lipper funds used by the Board for management fee comparisons is referred to below as the "Total Mapped Group." The Total Mapped Group comparison focuses on a fund's standing relative to the total universe of comparable funds available to investors in terms of gross management fees before expense reimbursements or caps, and without giving effect to the fund's performance adjustment. "TMG %" represents the percentage of funds in the Total Mapped Group that had management fees that were lower than the fund's. For example, a TMG % of 14% means that 86% of the funds in the Total Mapped Group had higher management fees than the fund. The "Asset-Size Peer Group" (ASPG) comparison focuses on a fund's standing relative to non-Fidelity funds similar in size to the fund within the Total Mapped Group. The ASPG represents at least 15% of the funds in the Total Mapped Group with comparable asset size and management fee characteristics, subject to a minimum of 50 funds (or all funds in the Total Mapped Group if fewer than 50). Additional information, such as the ASPG quartile in which the fund's management fee ranked and the impact of the fund's performance adjustment, is also included in the chart and considered by the Board.
Annual Report
Board Approval of Investment Advisory Contracts and
Management Fees - continued
Fidelity Series Small Cap Opportunities Fund
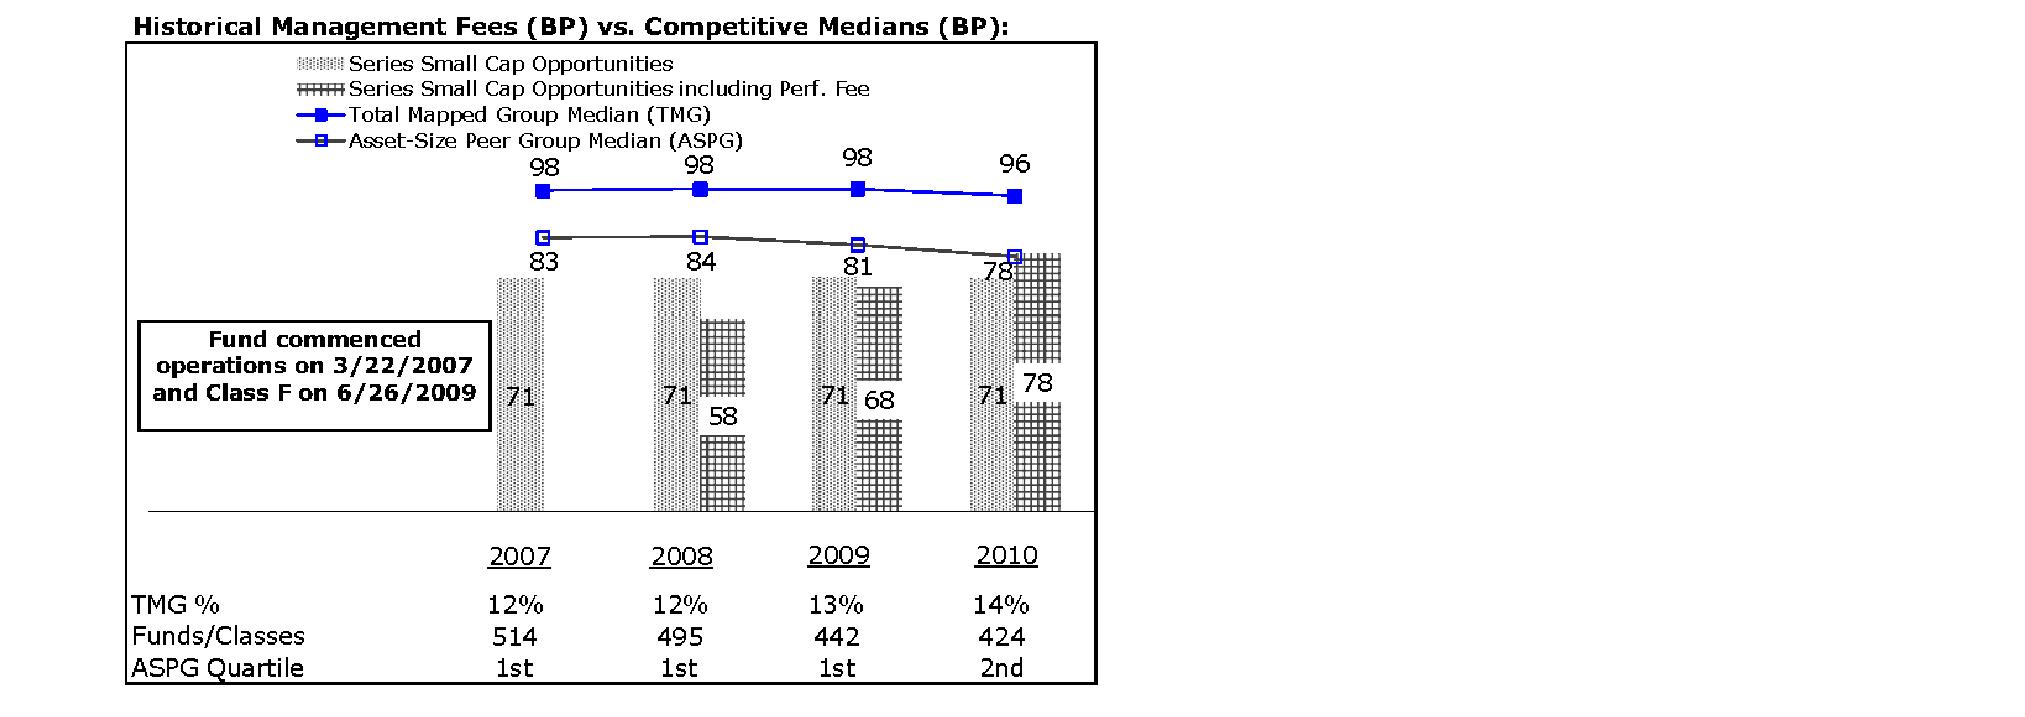
The Board noted that the fund's management fee ranked below the median of its Total Mapped Group and below the median of its ASPG for 2010. The Board also noted the effect of the fund's positive performance adjustment on the fund's management fee ranking. The Board noted that the performance adjustment for each year represents calculations for performance periods that differ from the period shown in the performance chart above.
Based on its review, the Board concluded that the fund's management fee is fair and reasonable in light of the services that the fund receives and the other factors considered.
Total Expense Ratio. In its review of each class's total expense ratio, the Board considered the fund's management fee as well as other fund or class expenses, as applicable, such as transfer agent fees, pricing and bookkeeping fees, and custodial, legal, and audit fees. The Board also noted the effects of any waivers and reimbursements on fees and expenses, as well as the impact of the fund's performance adjustment. As part of its review, the Board also considered the current and historical total expense ratios of each class of the fund compared to competitive fund median expenses. Each class of the fund is compared to those funds and classes in the Total Mapped Group (used by the Board for management fee comparisons) that have a similar sales load structure.
The Board noted that the total expense ratio of each class ranked below its competitive median for 2010. The Board considered that various factors, including 12b-1 fees, positive or negative performance adjustments, and relatively higher other expenses in the case of small fund size, can affect total expense ratios.
Annual Report
Fees Charged to Other Fidelity Clients. The Board also considered Fidelity fee structures and other information with respect to clients of FMR and its affiliates, such as other mutual funds advised or subadvised by FMR or its affiliates, pension plan clients, and other institutional clients. In March 2010, the Board created an ad hoc joint committee with the board of other Fidelity funds (the Committee) to review and compare Fidelity's institutional investment advisory business with its business of providing services to the Fidelity funds, including the differences in services provided, fees charged, and costs incurred, as well as competition in their respective marketplaces.
Based on its review of total expense ratios and fees charged to other Fidelity clients, the Board concluded that the total expense ratio of each class of the fund was reasonable in light of the services that the fund and its shareholders receive and the other factors considered, including the findings of the Committee.
Costs of the Services and Profitability. The Board considered the revenues earned and the expenses incurred by Fidelity in conducting the business of developing, marketing, distributing, managing, administering and servicing the fund and its shareholders. The Board also considered the level of Fidelity's profits in respect of all the Fidelity funds.
On an annual basis, FMR presents to the Board Fidelity's profitability for the fund. Fidelity calculates the profitability for each fund, as well as aggregate profitability for groups of Fidelity funds and all Fidelity funds, using a series of detailed revenue and cost allocation methodologies which originate with the books and records of Fidelity on which Fidelity's audited financial statements are based. The Audit Committee of the Board reviews any significant changes from the prior year's methodologies.
PricewaterhouseCoopers LLP (PwC), independent registered public accounting firm and auditor to Fidelity and certain Fidelity funds, has been engaged annually by the Board as part of the Board's assessment of Fidelity's profitability analysis. PwC's engagement includes the review and assessment of Fidelity's methodologies used in determining the revenues and expenses attributable to Fidelity's mutual fund business, and completion of agreed-upon procedures surrounding the mathematical accuracy of fund profitability and its conformity to allocation methodologies. After considering PwC's reports issued under the engagement and information provided by Fidelity, the Board concluded that while other allocation methods may also be reasonable, Fidelity's profitability methodologies are reasonable in all material respects.
The Board also reviewed Fidelity's non-fund businesses and fall-out benefits related to the mutual fund business as well as cases where Fidelity's affiliates may benefit from or be related to the fund's business.
Annual Report
Board Approval of Investment Advisory Contracts and
Management Fees - continued
The Board considered the costs of the services provided by and the profits realized by Fidelity in connection with the operation of the fund and was satisfied that the profitability was not excessive in the circumstances.
Economies of Scale. The Board considered whether there have been economies of scale in respect of the management of the Fidelity funds, whether the Fidelity funds (including the fund) have appropriately benefited from any such economies of scale, and whether there is potential for realization of any further economies of scale. The Board considered the extent to which the fund will benefit from economies of scale through increased services to the fund, through waivers or reimbursements, or through fee or expense reductions. The Board also noted that in 2009, it and the board of other Fidelity funds created an ad hoc committee (the Economies of Scale Committee) to analyze whether FMR attains economies of scale in respect of the management and servicing of the Fidelity funds, whether the Fidelity funds have appropriately benefited from such economies of scale, and whether there is potential for realization of any further economies of scale.
The Board recognized that the fund's management contract incorporates a "group fee" structure, which provides for lower group fee rates as total fund assets under FMR's management increase, and for higher group fee rates as total fund assets under FMR's management decrease. FMR calculates the group fee rates based on a tiered asset "breakpoint" schedule that varies based on asset class. The Board considered that the group fee is designed to deliver the benefits of economies of scale to fund shareholders when total Fidelity fund assets increase, even if assets of any particular fund are unchanged or have declined, because some portion of Fidelity's costs are attributable to services provided to all Fidelity funds, and all funds benefit if those costs can be allocated among more assets. The Board also considered that although the fund is offered only to other funds advised by FMR or an affiliate, it continues to incur management expenses. The Board further noted that the fund may continue to realize benefits from the group fee structure, even though assets may not be expected to grow significantly at the fund level. The Board concluded that, given the group fee structure, fund shareholders will benefit from lower management fees as assets under FMR's management increase at the fund complex level, regardless of whether Fidelity achieves any such economies of scale.
The Board concluded, taking into account the analysis of the Economies of Scale Committee, that any potential economies of scale are being appropriately shared between fund shareholders and Fidelity.
Additional Information Requested by the Board. In order to develop fully the factual basis for consideration of the Fidelity funds' Advisory Contracts, the Board requested and received additional information on certain topics, including (i) fund performance trends, actions to be taken by FMR to improve certain funds' overall performance, and Fidelity's long-term strategies for certain funds; (ii) portfolio manager changes that have occurred during the past year and length of portfolio manager tenure for different categories of funds over time; (iii) Fidelity's compensation structure for portfolio managers and other key personnel and strategies for attracting and retaining non-investment personnel; (iv) the amount of the investment that each portfolio manager has made in the Fidelity fund(s) that he or she manages; (v) historical trends in Fidelity's realization of fall-out benefits; (vi) Fidelity's group fee structures and the rationale for the individual fee rates of certain funds; (vii) fund profitability methodology and the impact of certain factors on fund profitability results; (viii) trends regarding industry use of performance fee structures and Fidelity's compliance practices with respect to performance adjustment calculations; (ix) the fee structures in place for certain other Fidelity clients; and (x) explanations regarding the relative total expense ratios of certain funds and classes, total expense competitive trends, and actions that might be taken by FMR to reduce total expense ratios for certain funds and classes.
Annual Report
Based on its evaluation of all of the conclusions noted above, and after considering all factors it believed relevant, the Board ultimately concluded that the advisory fee structures are fair and reasonable, and that the fund's Advisory Contracts should be renewed.
Annual Report
Managing Your Investments
Fidelity offers several ways to conveniently manage your workplace benefits (including your workplace savings plan, investments, and additional services) via your telephone or PC. You can access your plan and account information and research your investments 24 hours a day.
By Phone
Fidelity provides a single toll-free number to access plan information, account balances, positions, and quotes*. It's easy to navigate the service, and on your first call, the system will help you create a personal identification number (PIN) for security.
(phone_graphic)
Fidelity Workplace
Investing
1-800-835-5092
By PC
Fidelity's web site on the Internet provides a wide range of information, including plan information, daily financial news, fund performance, interactive planning tools, and news about Fidelity products and services.
(computer_graphic)
Fidelity's Web Site
www.401k.com
* When you call the quotes line, please remember that a fund's yield and return will vary and, except for money market funds, share price will also vary. This means that you may have a gain or loss when you sell your shares. There is no assurance that money market funds will be able to maintain a stable $1 share price; an investment in a money market fund is not insured or guaranteed by the U.S. government. Total returns are historical and include changes in share price, reinvestment of dividends and capital gains distributions, and the effects of any sales charges.
Annual Report
To Write Fidelity
We'll give your correspondence immediate attention and send you written confirmation upon completion of your request.
(letter_graphic)
For Non-Retirement
Accounts
Buying shares
Fidelity Investments
P.O. Box 770001
Cincinnati, OH 45277-0003
Overnight Express
Fidelity Investments
Attn: Distribution Services
100 Crosby Parkway - KC1H
Covington, KY 41015
Selling shares
Fidelity Investments
P.O. Box 770001
Cincinnati, OH 45277-0035
Overnight Express
Fidelity Investments
Attn: Distribution Services
100 Crosby Parkway - KC1H
Covington, KY 41015
General Correspondence
Fidelity Investments
P.O. Box 500
Merrimack, NH 03054-0500
(letter_graphic)
For Retirement
Accounts
Buying shares
Fidelity Investments
P.O. Box 770001
Cincinnati, OH 45277-0003
Selling shares
Fidelity Investments
P.O. Box 770001
Cincinnati, OH 45277-0035
Overnight Express
Fidelity Investments
Attn: Distribution Services
100 Crosby Parkway - KC1H
Covington, KY 41015
General Correspondence
Fidelity Investments
P.O. Box 500
Merrimack, NH 03054-0500
Annual Report
Investment Adviser
Fidelity Management & Research Company
Boston, MA
Investment Sub-Advisers
FMR Co., Inc.
Fidelity Management & Research (U.K.) Inc.
FIL Investments (Japan) Limited
FIL Investment Advisors
FIL Investment Advisors (U.K.) Ltd.
Fidelity Management & Research
(Hong Kong) Limited
Fidelity Management & Research
(Japan) Inc.
General Distributor
Fidelity Distributors Corporation
Boston, MA
Transfer and Service Agents
Fidelity Investments Institutional Operations Company, Inc.
Boston, MA
Fidelity Service Company, Inc.
Boston, MA
Custodian
Citibank, N.A.
New York, NY
SMO-ANN-0911
1.839807.104

Fidelity®
Small Cap Growth
Fund
Annual Report
July 31, 2011
(2_fidelity_logos) (Registered_Trademark)
Contents
Chairman's Message | <Click Here> | The Chairman's message to shareholders. |
Performance | <Click Here> | How the fund has done over time. |
Management's Discussion of Fund Performance | <Click Here> | The Portfolio Manager's review of fundperformance and strategy. |
Shareholder Expense Example | <Click Here> | An example of shareholder expenses. |
Investment Changes | <Click Here> | A summary of major shifts in the fund's investments over the past six months. |
Investments | <Click Here> | A complete list of the fund's investments with their market values. |
Financial Statements | <Click Here> | Statements of assets and liabilities, operations, and changes in net assets,
as well as financial highlights. |
Notes | <Click Here> | Notes to the financial statements. |
Report of Independent Registered Public Accounting Firm | <Click Here> | |
Trustees and Officers | <Click Here> | |
Distributions | <Click Here> | |
Board Approval of Investment Advisory Contracts and Management Fees | <Click Here> | |
To view a fund's proxy voting guidelines and proxy voting record for the 12-month period ended June 30, visit http://www.fidelity.com/proxyvotingresults or visit the Securities and Exchange Commission's (SEC) web site at http://www.sec.gov. You may also call 1-800-544-8544 to request a free copy of the proxy voting guidelines.
Standard & Poor's, S&P and S&P 500 are registered service marks of The McGraw-Hill Companies, Inc. and have been licensed for use by Fidelity Distributors Corporation.
Other third party marks appearing herein are the property of their respective owners.
All other marks appearing herein are registered or unregistered trademarks or service marks of FMR LLC or an affiliated company.
Annual Report
This report and the financial statements contained herein are submitted for the general information of the shareholders of the fund. This report is not authorized for distribution to prospective investors in the fund unless preceded or accompanied by an effective prospectus.
A fund files its complete schedule of portfolio holdings with the SEC for the first and third quarters of each fiscal year on Form N-Q. Forms N-Q are available on the SEC's web site at http://www.sec.gov. A fund's Forms N-Q may be reviewed and copied at the SEC's Public Reference Room in Washington, DC. Information regarding the operation of the SEC's Public Reference Room may be obtained by calling 1-800-SEC-0330. For a complete list of a fund's portfolio holdings, view the fund's most recent holdings listing, semiannual report, or annual report on Fidelity's web site at http://www.fidelity.com, http://www.advisor.fidelity.com, or http://www.401k.com, as applicable.
NOT FDIC INSURED • MAY LOSE VALUE • NO BANK GUARANTEE
Neither the fund nor Fidelity Distributors Corporation is a bank.
Annual Report
(photo_of_James_C_Curvey)
Dear Shareholder:
The second half of 2011 began with U.S. equities continuing to give back some of the gains achieved earlier in the year. In the days leading up to July 31, markets were shaken by a political stalemate in which Congress struggled to address the debt ceiling issue before an early-August deadline. The resulting uncertainty held back markets in July, the third consecutive monthly decline for equities, effectively reversing the positive momentum seen through the end of April. Financial markets are always unpredictable, of course, but there are several time-tested investment principles that can help put the odds in your favor.
One of the basic tenets is to invest for the long term. Over time, riding out the markets' inevitable ups and downs has proven much more effective than selling into panic or chasing the hottest trend. Even missing only a few of the markets' best days can significantly diminish investor returns. Patience also affords the benefits of compounding - of earning interest on additional income or reinvested dividends and capital gains. There can be tax advantages and cost benefits to consider as well. While staying the course doesn't eliminate risk, it can considerably lessen the effect of short-term declines.
You can further manage your investing risk through diversification. And today, more than ever, geographic diversification should be taken into account. Studies indicate that asset allocation is the single most important determinant of a portfolio's long-term success. The right mix of stocks, bonds and cash - aligned to your particular risk tolerance and investment objective - is very important. Age-appropriate rebalancing is also an essential aspect of asset allocation. For younger investors, an emphasis on equities - which historically have been the best-performing asset class over time - is encouraged. As investors near their specific goal, such as retirement or sending a child to college, consideration may be given to replacing volatile assets (e.g. common stocks) with more-stable fixed investments (bonds or savings plans).
A third principle - investing regularly - can help lower the average cost of your purchases. Investing a certain amount of money each month or quarter helps ensure you won't pay for all your shares at market highs. This strategy - known as dollar cost averaging - also reduces "emotion" from investing, helping shareholders avoid selling weak performers just prior to an upswing, or chasing a hot performer just before a correction.
We invite you to contact us via the Internet, through our Investor Centers or by phone. It is our privilege to provide you the information you need to make the investments that are right for you.
Sincerely,
(The acting chairman's signature appears here.)
James C. Curvey
Acting Chairman
Annual Report
Average annual total return reflects the change in the value of an investment, assuming reinvestment of the class' distributions from dividend income and capital gains (the profits earned upon the sale of securities that have grown in value, if any) and assuming a constant rate of performance each year. The $10,000 table and the fund's returns do not reflect the deduction of taxes that a shareholder would pay on fund distributions or the redemption of fund shares. During periods of reimbursement by Fidelity, a fund's total return will be greater than it would be had the reimbursement not occurred. How a fund did yesterday is no guarantee of how it will do tomorrow.
Average Annual Total Returns
Periods ended July 31, 2011 | Past 1
year | Past 5
years | Life of
fund A |
Fidelity® Small Cap Growth Fund | 30.20% | 6.81% | 9.31% |
A From November 3, 2004.
$10,000 Over Life of Fund
Let's say hypothetically that $10,000 was invested in Fidelity® Small Cap Growth Fund, a class of the fund, on November 3, 2004, when the fund started. The chart shows how the value of your investment would have changed, and also shows how the Russell 2000® Growth Index performed over the same period.
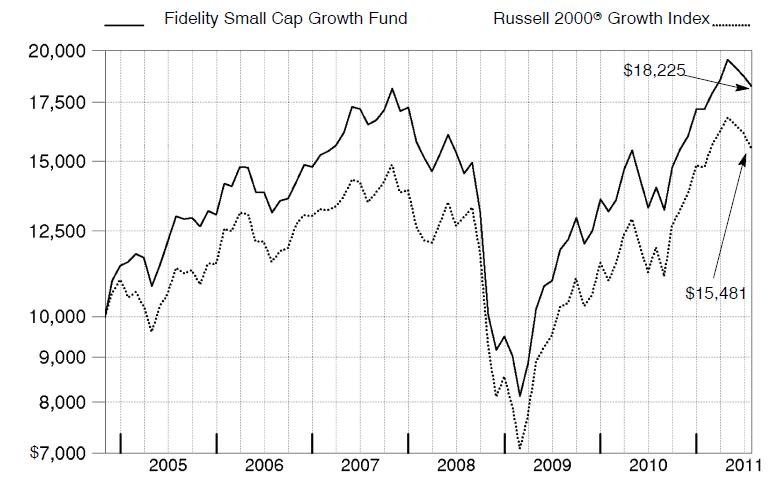
Annual Report
Market Recap: U.S. stocks registered solid double-digit gains for the 12 months ending July 31, 2011, extending a rally that began more than two years earlier. Despite a rough start in August 2010, markets turned positive in September, as increased demand for capital goods and other upbeat indicators trumped investor worry about a U.S. recessionary relapse. The broad market, as measured by the S&P 500® Index, rose 9% that month, its biggest September gain in 71 years. Seven more monthly advances followed, fueled by encouraging corporate earnings and economic activity. However, volatility picked up in the period's latter months, as markets reacted to continued high U.S. unemployment, nagging debt troubles in Europe and looming legislative battles over the federal debt ceiling. May unemployment rose above 9% for the first time in 2011, contributing to a traditional "June swoon" for stocks. Market uncertainty lingered in July, when the S&P 500® posted its second-biggest monthly loss of the period. For the full year, the S&P 500® climbed 19.65%, while the blue-chip-laden Dow Jones Industrial AverageSM rose a comparable 19.09% and the technology-heavy Nasdaq Composite® Index gained 23.40%. On the capitalization spectrum, stocks of mid-cap companies fared best, with the Russell Midcap® Index rising 24.51% and the small-cap Russell 2000® Index adding 23.92%.
Comments from Lionel Harris, Portfolio Manager of Fidelity® Small Cap Growth Fund: For the year, the fund's Retail Class shares rose 30.20%, outpacing the 29.32% return of the Russell 2000® Growth Index. The fund's positioning in consumer discretionary helped, led by stock picking in retailing. Security selection in materials also contributed, as did positioning within technology. In contrast, my choices in energy hurt, as did weak stock selection in banks; a modest cash position in a rising market; and the fund's non-U.S. holdings, despite a weaker U.S. dollar. Individually, Fossil did extremely well, and I sold the stock after it reached my target price. Tempur-Pedic International, a maker of premium foam mattresses and pillows, also helped. In health care, drugmaker Questcor Pharmaceuticals contributed, thanks to the strength of its primary product, Achtar®. Shoe retailer DSW also contributed. Of these stocks, only Questcor and DSW were in the benchmark. On the negative side, the stock of Digital River, which builds and operates electronic storefronts, did poorly. Touch-screen manufacturer Synaptics and urban-oriented retailer Citi Trends, the latter of which the fund no longer held at period end, also disappointed.
The views expressed above reflect those of the portfolio manager(s) only through the end of the period as stated on the cover of this report and do not necessarily represent the views of Fidelity or any other person in the Fidelity organization. Any such views are subject to change at any time based upon market or other conditions and Fidelity disclaims any responsibility to update such views. These views may not be relied on as investment advice and, because investment decisions for a Fidelity fund are based on numerous factors, may not be relied on as an indication of trading intent on behalf of any Fidelity fund.
Annual Report
Shareholder Expense Example
As a shareholder of the Fund, you incur two types of costs: (1) transaction costs, including sales charges (loads) on purchase payments or redemption proceeds, redemption fees, and (2) ongoing costs, including management fees, distribution and/or service (12b-1) fees and other Fund expenses. This Example is intended to help you understand your ongoing costs (in dollars) of investing in the Fund and to compare these costs with the ongoing costs of investing in other mutual funds.
The Example is based on an investment of $1,000 invested at the beginning of the period and held for the entire period (February 1, 2011 to July 31, 2011).
Actual Expenses
The first line of the accompanying table for each class of the Fund provides information about actual account values and actual expenses. You may use the information in this line, together with the amount you invested, to estimate the expenses that you paid over the period. Simply divide your account value by $1,000.00 (for example, an $8,600 account value divided by $1,000.00 = 8.6), then multiply the result by the number in the first line for a class of the Fund under the heading entitled "Expenses Paid During Period" to estimate the expenses you paid on your account during this period. A small balance maintenance fee of $12.00 that is charged once a year may apply for certain accounts with a value of less than $2,000. This fee is not included in the table below. If it was, the estimate of expenses you paid during the period would be higher, and your ending account value lower, by this amount. In addition, the Fund, as a shareholder in the underlying Fidelity Central Funds, will indirectly bear its pro-rata share of the fees and expenses incurred by the underlying Fidelity Central Funds. These fees and expenses are not included in the Fund's annualized expense ratio used to calculate the expense estimate in the table below.
Hypothetical Example for Comparison Purposes
The second line of the accompanying table for each class of the Fund provides information about hypothetical account values and hypothetical expenses based on a Class' actual expense ratio and an assumed rate of return of 5% per year before expenses, which is not the Class' actual return. The hypothetical account values and expenses may not be used to estimate the actual ending account balance or expenses you paid for the period. You may use this information to compare the ongoing costs of investing in the Fund and other funds. To do so, compare this 5% hypothetical example with the 5% hypothetical examples that appear in the shareholder reports of the other funds. A small balance maintenance fee of $12.00 that is charged once a year may apply for certain accounts with a value of less than $2,000. This fee is not included in the table below. If it was, the estimate of expenses you paid during the period would be higher, and your ending account value lower, by this amount. In addition, the Fund, as a shareholder in the underlying Fidelity Central Funds, will indirectly bear its pro-rata share of the fees and expenses incurred by the underlying Fidelity Central Funds. These fees and expenses are not included in the Fund's annualized expense ratio used to calculate the expense estimate in the table below.
Please note that the expenses shown in the table are meant to highlight your ongoing costs only and do not reflect any transaction costs. Therefore, the second line of the table is useful in comparing ongoing costs only, and will not help you determine the relative total costs of owning different funds. In addition, if these transactional costs were included, your costs would have been higher.
Annual Report
| Annualized
Expense Ratio | Beginning
Account Value
February 1, 2011 | Ending
Account Value
July 31, 2011 | Expenses Paid
During Period*
February 1, 2011 to
July 31, 2011 |
Class A | 1.25% | | | |
Actual | | $ 1,000.00 | $ 1,058.70 | $ 6.38 |
HypotheticalA | | $ 1,000.00 | $ 1,018.60 | $ 6.26 |
Class T | 1.50% | | | |
Actual | | $ 1,000.00 | $ 1,057.90 | $ 7.65 |
HypotheticalA | | $ 1,000.00 | $ 1,017.36 | $ 7.50 |
Class B | 2.00% | | | |
Actual | | $ 1,000.00 | $ 1,055.20 | $ 10.19 |
HypotheticalA | | $ 1,000.00 | $ 1,014.88 | $ 9.99 |
Class C | 2.00% | | | |
Actual | | $ 1,000.00 | $ 1,055.30 | $ 10.19 |
HypotheticalA | | $ 1,000.00 | $ 1,014.88 | $ 9.99 |
Small Cap Growth | .93% | | | |
Actual | | $ 1,000.00 | $ 1,060.50 | $ 4.75 |
HypotheticalA | | $ 1,000.00 | $ 1,020.18 | $ 4.66 |
Class F | .70% | | | |
Actual | | $ 1,000.00 | $ 1,061.50 | $ 3.58 |
HypotheticalA | | $ 1,000.00 | $ 1,021.32 | $ 3.51 |
Institutional Class | .95% | | | |
Actual | | $ 1,000.00 | $ 1,060.40 | $ 4.85 |
HypotheticalA | | $ 1,000.00 | $ 1,020.08 | $ 4.76 |
A 5% return per year before expenses
* Expenses are equal to each Class' annualized expense ratio, multiplied by the average account value over the period, multiplied by 181/365 (to reflect the one-half year period).
Annual Report
Investment Changes (Unaudited)
Top Ten Stocks as of July 31, 2011 |
| % of fund's
net assets | % of fund's net assets
6 months ago |
Esterline Technologies Corp. | 1.4 | 1.3 |
Rockwood Holdings, Inc. | 1.4 | 0.0 |
DSW, Inc. Class A | 1.3 | 1.0 |
Solera Holdings, Inc. | 1.3 | 1.1 |
Steven Madden Ltd. | 1.3 | 0.9 |
Catalyst Health Solutions, Inc. | 1.2 | 0.5 |
Carpenter Technology Corp. | 1.2 | 0.8 |
The Cooper Companies, Inc. | 1.2 | 1.0 |
Rowan Companies, Inc. | 1.2 | 1.1 |
Sally Beauty Holdings, Inc. | 1.2 | 0.7 |
| 12.7 | |
Top Five Market Sectors as of July 31, 2011 |
| % of fund's
net assets | % of fund's net assets
6 months ago |
Information Technology | 26.8 | 30.3 |
Industrials | 20.1 | 20.9 |
Health Care | 17.5 | 17.8 |
Consumer Discretionary | 17.0 | 16.1 |
Energy | 6.2 | 3.8 |
Asset Allocation (% of fund's net assets) |
As of July 31, 2011 * | As of January 31, 2011 ** |
| Stocks 98.7% | | | Stocks 97.5% | |
| Short-Term
Investments and
Net Other Assets 1.3% | | | Short-Term
Investments and
Net Other Assets 2.5% | |
* Foreign investments | 13.7% | | ** Foreign investments | 13.8% | |

Annual Report
Investments July 31, 2011
Showing Percentage of Net Assets
Common Stocks - 98.7% |
| Shares | | Value |
CONSUMER DISCRETIONARY - 17.0% |
Auto Components - 1.7% |
Modine Manufacturing Co. (a) | 769,000 | | $ 11,465,791 |
Tenneco, Inc. (a) | 508,000 | | 20,289,520 |
| | 31,755,311 |
Diversified Consumer Services - 0.7% |
Steiner Leisure Ltd. (a) | 278,000 | | 13,516,360 |
Household Durables - 1.0% |
Tempur-Pedic International, Inc. (a) | 242,000 | | 17,426,420 |
Internet & Catalog Retail - 0.7% |
Start Today Co. Ltd. | 540,000 | | 13,414,929 |
Multiline Retail - 1.4% |
Dollarama, Inc. | 415,000 | | 13,882,562 |
Marisa Lojas SA | 856,600 | | 12,038,345 |
| | 25,920,907 |
Specialty Retail - 7.0% |
Delticom AG | 111,910 | | 11,694,830 |
DSW, Inc. Class A (a)(d) | 442,000 | | 23,417,160 |
Jos. A. Bank Clothiers, Inc. (a)(d) | 213,900 | | 10,975,209 |
Sally Beauty Holdings, Inc. (a) | 1,242,000 | | 21,362,400 |
Signet Jewelers Ltd. (a) | 466,400 | | 19,980,576 |
SuperGroup PLC (a)(d) | 560,000 | | 9,790,502 |
Tom Tailor Holding AG (a) | 721,621 | | 15,397,388 |
Tractor Supply Co. | 240,000 | | 15,820,800 |
| | 128,438,865 |
Textiles, Apparel & Luxury Goods - 4.5% |
G-III Apparel Group Ltd. (a) | 250,300 | | 7,726,761 |
PVH Corp. | 257,559 | | 18,428,346 |
Steven Madden Ltd. (a) | 602,500 | | 22,955,250 |
Ted Baker PLC | 1,371,073 | | 18,073,550 |
Warnaco Group, Inc. (a) | 273,000 | | 14,550,900 |
| | 81,734,807 |
TOTAL CONSUMER DISCRETIONARY | | 312,207,599 |
CONSUMER STAPLES - 2.6% |
Food & Staples Retailing - 0.7% |
Fresh Market, Inc. (d) | 356,600 | | 12,669,998 |
Food Products - 0.9% |
Calavo Growers, Inc. (d)(e) | 814,046 | | 16,826,331 |
Common Stocks - continued |
| Shares | | Value |
CONSUMER STAPLES - continued |
Personal Products - 1.0% |
Inter Parfums, Inc. | 897,000 | | $ 17,975,880 |
TOTAL CONSUMER STAPLES | | 47,472,209 |
ENERGY - 6.2% |
Energy Equipment & Services - 3.3% |
ION Geophysical Corp. (a) | 2,055,000 | | 20,837,700 |
Newpark Resources, Inc. (a) | 1,928,900 | | 17,919,481 |
Rowan Companies, Inc. (a) | 556,000 | | 21,778,520 |
| | 60,535,701 |
Oil, Gas & Consumable Fuels - 2.9% |
Gulfport Energy Corp. (a) | 495,000 | | 18,047,700 |
Petroleum Development Corp. (a) | 547,200 | | 19,874,304 |
Targa Resources Corp. (d) | 474,500 | | 16,019,120 |
| | 53,941,124 |
TOTAL ENERGY | | 114,476,825 |
FINANCIALS - 3.9% |
Capital Markets - 0.6% |
Financial Engines, Inc. (a) | 510,000 | | 12,117,600 |
Commercial Banks - 1.5% |
Banco Pine SA | 1,860,300 | | 12,412,394 |
CapitalSource, Inc. | 2,385,000 | | 15,407,100 |
| | 27,819,494 |
Real Estate Investment Trusts - 0.8% |
CBL & Associates Properties, Inc. | 797,000 | | 14,154,720 |
Real Estate Management & Development - 1.0% |
Jones Lang LaSalle, Inc. | 216,900 | | 18,462,528 |
TOTAL FINANCIALS | | 72,554,342 |
HEALTH CARE - 17.5% |
Biotechnology - 2.1% |
Acadia Pharmaceuticals, Inc. (a) | 68,900 | | 112,307 |
Acorda Therapeutics, Inc. (a) | 1,000 | | 28,400 |
Affymax, Inc. (a) | 15,100 | | 99,811 |
Alnylam Pharmaceuticals, Inc. (a) | 5,400 | | 50,652 |
AMAG Pharmaceuticals, Inc. (a) | 12,700 | | 188,087 |
Ardea Biosciences, Inc. (a) | 249,263 | | 5,832,754 |
Common Stocks - continued |
| Shares | | Value |
HEALTH CARE - continued |
Biotechnology - continued |
BioMarin Pharmaceutical, Inc. (a) | 295,000 | | $ 9,212,850 |
BioMimetic Therapeutics, Inc. (a) | 52,500 | | 202,650 |
Dyax Corp. (a) | 2,300 | | 3,772 |
Emergent BioSolutions, Inc. (a) | 7,800 | | 161,070 |
Enzon Pharmaceuticals, Inc. (a) | 7,800 | | 75,816 |
Horizon Pharma, Inc. | 550,000 | | 4,972,000 |
Maxygen, Inc. | 38,400 | | 208,512 |
Momenta Pharmaceuticals, Inc. (a) | 5,700 | | 100,662 |
Myrexis, Inc. (a) | 36,900 | | 125,091 |
Myriad Genetics, Inc. (a) | 7,700 | | 163,779 |
Omeros Corp. (a) | 5,500 | | 22,330 |
PDL BioPharma, Inc. (d) | 1,560,000 | | 9,656,400 |
Repligen Corp. (a) | 19,000 | | 67,070 |
SuperGen, Inc. (a) | 73,600 | | 225,216 |
Theravance, Inc. (a)(d) | 299,000 | | 6,392,620 |
Vanda Pharmaceuticals, Inc. (a) | 29,303 | | 210,396 |
| | 38,112,245 |
Health Care Equipment & Supplies - 4.1% |
Cyberonics, Inc. (a) | 415,000 | | 11,263,100 |
Integra LifeSciences Holdings Corp. (a) | 317,400 | | 14,305,218 |
Sirona Dental Systems, Inc. (a) | 255,000 | | 12,897,900 |
The Cooper Companies, Inc. | 286,000 | | 21,876,140 |
Wright Medical Group, Inc. (a) | 1,020,000 | | 15,952,800 |
| | 76,295,158 |
Health Care Providers & Services - 6.9% |
Accretive Health, Inc. (a)(d) | 355,000 | | 10,664,200 |
Air Methods Corp. (a) | 280,000 | | 19,628,000 |
Catalyst Health Solutions, Inc. (a) | 343,000 | | 22,476,790 |
Corvel Corp. (a) | 400,000 | | 18,460,000 |
IPC The Hospitalist Co., Inc. (a) | 310,000 | | 14,021,300 |
MWI Veterinary Supply, Inc. (a) | 180,000 | | 16,030,800 |
PSS World Medical, Inc. (a) | 610,000 | | 14,597,300 |
Synergy Health PLC | 695,411 | | 10,845,074 |
| | 126,723,464 |
Life Sciences Tools & Services - 2.8% |
Bruker BioSciences Corp. (a) | 1,059,000 | | 18,235,980 |
PerkinElmer, Inc. | 704,800 | | 17,239,408 |
QIAGEN NV (a)(d) | 966,000 | | 16,364,040 |
| | 51,839,428 |
Common Stocks - continued |
| Shares | | Value |
HEALTH CARE - continued |
Pharmaceuticals - 1.6% |
Cadence Pharmaceuticals, Inc. (a)(d) | 767,693 | | $ 6,640,544 |
Cardiome Pharma Corp. (a) | 1,025,000 | | 5,096,033 |
Hikma Pharmaceuticals PLC | 262,838 | | 2,946,973 |
Questcor Pharmaceuticals, Inc. (a) | 495,000 | | 15,369,750 |
| | 30,053,300 |
TOTAL HEALTH CARE | | 323,023,595 |
INDUSTRIALS - 20.1% |
Aerospace & Defense - 4.1% |
Esterline Technologies Corp. (a) | 332,000 | | 25,354,840 |
Teledyne Technologies, Inc. (a) | 387,000 | | 20,987,010 |
TransDigm Group, Inc. (a) | 164,000 | | 14,771,480 |
Triumph Group, Inc. (d) | 258,000 | | 13,890,720 |
| | 75,004,050 |
Building Products - 1.5% |
A.O. Smith Corp. | 242,000 | | 10,035,740 |
Armstrong World Industries, Inc. | 449,000 | | 17,735,500 |
| | 27,771,240 |
Commercial Services & Supplies - 2.3% |
Higher One Holdings, Inc. (a)(d) | 695,000 | | 13,795,750 |
Sykes Enterprises, Inc. (a) | 472,621 | | 9,121,585 |
Waste Connections, Inc. | 626,500 | | 20,198,360 |
| | 43,115,695 |
Construction & Engineering - 2.5% |
Foster Wheeler AG (a) | 484,000 | | 13,116,400 |
KBR, Inc. | 595,980 | | 21,246,687 |
Outotec OYJ | 245,000 | | 12,085,130 |
| | 46,448,217 |
Electrical Equipment - 3.6% |
Acuity Brands, Inc. | 320,500 | | 15,605,145 |
GrafTech International Ltd. (a) | 705,000 | | 13,578,300 |
Regal-Beloit Corp. | 302,000 | | 18,310,260 |
Zumtobel AG | 755,596 | | 17,756,266 |
| | 65,249,971 |
Machinery - 2.1% |
Blount International, Inc. (a) | 744,000 | | 12,372,720 |
Common Stocks - continued |
| Shares | | Value |
INDUSTRIALS - continued |
Machinery - continued |
Nordson Corp. | 263,000 | | $ 13,420,890 |
Wabtec Corp. | 195,000 | | 12,581,400 |
| | 38,375,010 |
Professional Services - 0.6% |
Advisory Board Co. (a) | 205,000 | | 10,975,700 |
Road & Rail - 0.5% |
Contrans Group, Inc. Class A (d) | 1,106,800 | | 9,846,975 |
Trading Companies & Distributors - 2.9% |
Interline Brands, Inc. (a) | 127,442 | | 2,132,105 |
Rush Enterprises, Inc. Class A (a) | 928,254 | | 18,555,797 |
Watsco, Inc. | 224,000 | | 13,256,320 |
WESCO International, Inc. (a) | 382,000 | | 19,363,580 |
| | 53,307,802 |
TOTAL INDUSTRIALS | | 370,094,660 |
INFORMATION TECHNOLOGY - 26.8% |
Communications Equipment - 2.4% |
Anaren, Inc. (a) | 571,774 | | 11,441,198 |
DG FastChannel, Inc. (a) | 527,329 | | 14,902,318 |
Polycom, Inc. (a) | 699,000 | | 18,893,970 |
| | 45,237,486 |
Computers & Peripherals - 1.6% |
Super Micro Computer, Inc. (a) | 834,923 | | 11,764,065 |
Synaptics, Inc. (a)(d) | 726,000 | | 17,837,820 |
| | 29,601,885 |
Electronic Equipment & Components - 3.7% |
Fabrinet (a) | 505,000 | | 7,777,000 |
Insight Enterprises, Inc. (a) | 837,400 | | 14,093,442 |
Jabil Circuit, Inc. | 1,163,000 | | 21,294,530 |
OSI Systems, Inc. (a) | 329,000 | | 13,584,410 |
SYNNEX Corp. (a) | 432,800 | | 12,256,896 |
| | 69,006,278 |
Internet Software & Services - 6.2% |
Demand Media, Inc. (d) | 960,000 | | 9,734,400 |
Digital River, Inc. (a) | 501,000 | | 12,775,500 |
LivePerson, Inc. (a)(d) | 1,080,000 | | 13,294,800 |
Open Text Corp. (a) | 190,000 | | 12,825,099 |
Perficient, Inc. (a)(e) | 1,718,502 | | 17,202,205 |
Common Stocks - continued |
| Shares | | Value |
INFORMATION TECHNOLOGY - continued |
Internet Software & Services - continued |
Rackspace Hosting, Inc. (a)(d) | 525,000 | | $ 21,000,000 |
Sohu.com, Inc. (a) | 182,000 | | 16,398,200 |
Travelzoo, Inc. (a)(d) | 198,000 | | 10,454,400 |
| | 113,684,604 |
IT Services - 2.4% |
Virtusa Corp. (a) | 900,000 | | 17,694,000 |
WNS Holdings Ltd. sponsored ADR (a) | 613,457 | | 6,134,570 |
Wright Express Corp. (a) | 420,000 | | 20,664,000 |
| | 44,492,570 |
Semiconductors & Semiconductor Equipment - 5.1% |
Ceva, Inc. (a) | 396,700 | | 11,988,274 |
Cymer, Inc. (a) | 306,901 | | 13,512,851 |
Entegris, Inc. (a) | 2,321,500 | | 19,895,255 |
Hittite Microwave Corp. (a) | 183,821 | | 10,292,138 |
International Rectifier Corp. (a) | 533,000 | | 13,692,770 |
Semtech Corp. (a) | 461,744 | | 10,758,635 |
Standard Microsystems Corp. (a) | 557,185 | | 13,182,997 |
| | 93,322,920 |
Software - 5.4% |
Aspen Technology, Inc. (a) | 600,000 | | 9,300,000 |
BroadSoft, Inc. (a) | 344,591 | | 10,065,503 |
ebix.com, Inc. (a)(d) | 717,510 | | 14,127,772 |
Informatica Corp. (a) | 274,000 | | 14,009,620 |
Kenexa Corp. (a) | 450,000 | | 11,506,500 |
Solera Holdings, Inc. | 417,000 | | 23,301,960 |
TIBCO Software, Inc. (a) | 638,000 | | 16,613,520 |
| | 98,924,875 |
TOTAL INFORMATION TECHNOLOGY | | 494,270,618 |
MATERIALS - 4.6% |
Chemicals - 2.3% |
Rockwood Holdings, Inc. (a) | 418,000 | | 25,276,460 |
Solutia, Inc. (a) | 797,000 | | 17,087,680 |
| | 42,364,140 |
Common Stocks - continued |
| Shares | | Value |
MATERIALS - continued |
Metals & Mining - 2.3% |
Carpenter Technology Corp. | 382,000 | | $ 21,942,080 |
Royal Gold, Inc. | 323,000 | | 20,704,300 |
| | 42,646,380 |
TOTAL MATERIALS | | 85,010,520 |
TOTAL COMMON STOCKS (Cost $1,533,825,944) | 1,819,110,368 |
Money Market Funds - 8.7% |
| | | |
Fidelity Cash Central Fund, 0.14% (b) | 45,332,402 | | 45,332,402 |
Fidelity Securities Lending Cash Central Fund, 0.15% (b)(c) | 115,743,521 | | 115,743,521 |
TOTAL MONEY MARKET FUNDS (Cost $161,075,923) | 161,075,923 |
TOTAL INVESTMENT PORTFOLIO - 107.4% (Cost $1,694,901,867) | | 1,980,186,291 |
NET OTHER ASSETS (LIABILITIES) - (7.4)% | | (137,048,070) |
NET ASSETS - 100% | $ 1,843,138,221 |
Legend |
(a) Non-income producing |
(b) Affiliated fund that is available only to investment companies and other accounts managed by Fidelity Investments. The rate quoted is the annualized seven-day yield of the fund at period end. A complete unaudited listing of the fund's holdings as of its most recent quarter end is available upon request. In addition, each Fidelity Central Fund's financial statements, which are not covered by the Fund's Report of Independent Registered Public Accounting Firm, are available on the SEC's website or upon request. |
(c) Investment made with cash collateral received from securities on loan. |
(d) Security or a portion of the security is on loan at period end. |
(e) Affiliated company |
Affiliated Central Funds |
Information regarding fiscal year to date income earned by the Fund from investments in Fidelity Central Funds is as follows: |
Fund | Income earned |
Fidelity Cash Central Fund | $ 90,582 |
Fidelity Securities Lending Cash Central Fund | 1,308,812 |
Total | $ 1,399,394 |
Other Affiliated Issuers |
An affiliated company is a company in which the Fund has ownership of at least 5% of the voting securities. Fiscal year to date transactions with companies which are or were affiliates are as follows: |
Affiliate | Value,
beginning of
period | Purchases | Sales
Proceeds | Dividend
Income | Value,
end of
period |
Calavo Growers, Inc. | $ 12,651,852 | $ 4,843,498 | $ - | $ 351,475 | $ 16,826,331 |
Online Resources Corp. | 7,777,946 | 567,018 | 12,586,965 | - | - |
Perficient, Inc. | 13,394,542 | 1,718,096 | - | - | 17,202,205 |
Total | $ 33,824,340 | $ 7,128,612 | $ 12,586,965 | $ 351,475 | $ 34,028,536 |
Other Information |
All investments are categorized as Level 1 under the Fair Value Hierarchy. The inputs or methodology used for valuing securities may not be an indication of the risk associated with investing in those securities. For more information on valuation inputs, please refer to the Security Valuation section in the accompanying Notes to Financial Statements. |
Distribution of investments by country of issue, as a percentage of total net assets, is as follows: (Unaudited) |
United States of America | 86.3% |
Canada | 2.3% |
United Kingdom | 2.2% |
Germany | 1.4% |
Brazil | 1.3% |
Bermuda | 1.1% |
Austria | 1.0% |
Others (Individually Less Than 1%) | 4.4% |
| 100.0% |
Income Tax Information |
The Fund intends to elect to defer to its fiscal year ending July 31, 2012 approximately $848,304 of currency losses recognized during the period November 1, 2010 to July 31, 2011. |
See accompanying notes which are an integral part of the financial statements.
Annual Report
Statement of Assets and Liabilities
| July 31, 2011 |
| | |
Assets | | |
Investment in securities, at value (including securities loaned of $112,721,987) - See accompanying schedule: Unaffiliated issuers (cost $1,500,388,101) | $ 1,785,081,832 | |
Fidelity Central Funds (cost $161,075,923) | 161,075,923 | |
Other affiliated issuers (cost $33,437,843) | 34,028,536 | |
Total Investments (cost $1,694,901,867) | | $ 1,980,186,291 |
Cash | | 1,964,053 |
Receivable for investments sold | | 19,020,388 |
Receivable for fund shares sold | | 1,316,311 |
Dividends receivable | | 824,348 |
Distributions receivable from Fidelity Central Funds | | 197,247 |
Other receivables | | 74,114 |
Total assets | | 2,003,582,752 |
| | |
Liabilities | | |
Payable for investments purchased | $ 30,247,562 | |
Payable for fund shares redeemed | 12,682,146 | |
Accrued management fee | 1,278,818 | |
Distribution and service plan fees payable | 54,160 | |
Other affiliated payables | 363,790 | |
Other payables and accrued expenses | 74,534 | |
Collateral on securities loaned, at value | 115,743,521 | |
Total liabilities | | 160,444,531 |
| | |
Net Assets | | $ 1,843,138,221 |
Net Assets consist of: | | |
Paid in capital | | $ 1,539,978,386 |
Accumulated net investment loss | | (848,304) |
Accumulated undistributed net realized gain (loss) on investments and foreign currency transactions | | 18,720,049 |
Net unrealized appreciation (depreciation) on investments and assets and liabilities in foreign currencies | | 285,288,090 |
Net Assets | | $ 1,843,138,221 |
See accompanying notes which are an integral part of the financial statements.
Annual Report
Statement of Assets and Liabilities - continued
| July 31, 2011 |
| | |
Calculation of Maximum Offering Price Class A:
Net Asset Value and redemption price per share ($67,272,316 ÷ 4,096,233 shares) | | $ 16.42 |
| | |
Maximum offering price per share (100/94.25 of $16.42) | | $ 17.42 |
Class T:
Net Asset Value and redemption price per share ($30,763,609 ÷ 1,890,561 shares) | | $ 16.27 |
| | |
Maximum offering price per share (100/96.50 of $16.27) | | $ 16.86 |
Class B:
Net Asset Value and offering price per share ($5,295,068 ÷ 333,961 shares)A | | $ 15.86 |
| | |
Class C:
Net Asset Value and offering price per share ($24,913,614 ÷ 1,574,146 shares)A | | $ 15.83 |
| | |
Small Cap Growth:
Net Asset Value, offering price and redemption price per share ($1,382,688,082 ÷ 83,048,741 shares) | | $ 16.65 |
| | |
Class F:
Net Asset Value, offering price and redemption price per share ($290,765,137 ÷ 17,378,109 shares) | | $ 16.73 |
| | |
Institutional Class:
Net Asset Value, offering price and redemption price per share ($41,440,395 ÷ 2,484,480 shares) | | $ 16.68 |
A Redemption price per share is equal to net asset value less any applicable contingent deferred sales charge.
See accompanying notes which are an integral part of the financial statements.
Annual Report
Financial Statements - continued
Statement of Operations
| Year ended July 31, 2011 |
| | |
Investment Income | | |
Dividends (including $351,475 earned from other affiliated issuers) | | $ 9,421,086 |
Special dividends | | 2,295,657 |
Interest | | 70 |
Income from Fidelity Central Funds (including $1,308,812 from security lending) | | 1,399,394 |
Total income | | 13,116,207 |
| | |
Expenses | | |
Management fee
Basic fee | $ 12,213,765 | |
Performance adjustment | (1,097,151) | |
Transfer agent fees | 3,857,683 | |
Distribution and service plan fees | 581,456 | |
Accounting and security lending fees | 552,489 | |
Custodian fees and expenses | 119,815 | |
Independent trustees' compensation | 9,001 | |
Registration fees | 106,385 | |
Audit | 57,065 | |
Legal | 6,456 | |
Miscellaneous | 17,324 | |
Total expenses before reductions | 16,424,288 | |
Expense reductions | (205,467) | 16,218,821 |
Net investment income (loss) | | (3,102,614) |
Realized and Unrealized Gain (Loss) Net realized gain (loss) on: | | |
Investment securities: | | |
Unaffiliated issuers | 220,513,485 | |
Other affiliated issuers | 1,387,149 | |
Foreign currency transactions | (835,104) | |
Total net realized gain (loss) | | 221,065,530 |
Change in net unrealized appreciation (depreciation) on: Investment securities | 210,248,116 | |
Assets and liabilities in foreign currencies | 5,252 | |
Total change in net unrealized appreciation (depreciation) | | 210,253,368 |
Net gain (loss) | | 431,318,898 |
Net increase (decrease) in net assets resulting from operations | | $ 428,216,284 |
See accompanying notes which are an integral part of the financial statements.
Annual Report
Statement of Changes in Net Assets
| Year ended
July 31,
2011 | Year ended
July 31,
2010 |
Increase (Decrease) in Net Assets | | |
Operations | | |
Net investment income (loss) | $ (3,102,614) | $ (4,269,128) |
Net realized gain (loss) | 221,065,530 | 242,038,859 |
Change in net unrealized appreciation (depreciation) | 210,253,368 | (34,116,702) |
Net increase (decrease) in net assets resulting
from operations | 428,216,284 | 203,653,029 |
Distributions to shareholders from net realized gain | (3,013,255) | - |
Share transactions - net increase (decrease) | (17,486,495) | 46,578,163 |
Redemption fees | 229,000 | 232,258 |
Total increase (decrease) in net assets | 407,945,534 | 250,463,450 |
| | |
Net Assets | | |
Beginning of period | 1,435,192,687 | 1,184,729,237 |
End of period (including accumulated net investment loss of $848,304 and undistributed net investment income of $0, respectively) | $ 1,843,138,221 | $ 1,435,192,687 |
See accompanying notes which are an integral part of the financial statements.
Annual Report
Financial Highlights - Class A
Years ended July 31, | 2011 | 2010 | 2009 | 2008 | 2007 |
Selected Per-Share Data | | | | | |
Net asset value, beginning of period | $ 12.66 | $ 10.79 | $ 13.20 | $ 16.06 | $ 12.88 |
Income from Investment Operations | | | | | |
Net investment income (loss) C | (.07) F | (.07) G | (.06) | (.11) | (.12) H |
Net realized and unrealized gain (loss) | 3.84 | 1.94 | (2.35) | (1.73) | 3.39 |
Total from investment operations | 3.77 | 1.87 | (2.41) | (1.84) | 3.27 |
Distributions from net realized gain | (.01) K | - | - | (1.02) | (.09) |
Redemption fees added to paid in capital C,J | - | - | - | - | - |
Net asset value, end of period | $ 16.42 | $ 12.66 | $ 10.79 | $ 13.20 | $ 16.06 |
Total Return A,B | 29.78% | 17.33% | (18.26)% | (12.26)% | 25.52% |
Ratios to Average Net Assets D,I | | | | | |
Expenses before reductions | 1.25% | 1.35% | 1.33% | 1.40% | 1.44% |
Expenses net of fee waivers, if any | 1.25% | 1.35% | 1.33% | 1.40% | 1.40% |
Expenses net of all reductions | 1.23% | 1.34% | 1.33% | 1.39% | 1.39% |
Net investment income (loss) | (.47)% F | (.56)% G | (.64)% | (.74)% | (.80)% H |
Supplemental Data | | | | | |
Net assets, end of period (000 omitted) | $ 67,272 | $ 50,620 | $ 40,211 | $ 42,187 | $ 33,588 |
Portfolio turnover rate E | 106% | 105% | 150% | 113% | 91% |
A Total returns would have been lower if certain expenses had not been reduced during the applicable periods shown.
B Total returns do not include the effect of the sales charges.
C Calculated based on average shares outstanding during the period.
D Fees and expenses of any underlying Fidelity Central Funds are not included in the Fund's expense ratio. The Fund indirectly bears its proportionate share of the expenses of any underlying Fidelity Central Funds.
E Amount does not include the portfolio activity of any underlying Fidelity Central Funds.
F Investment income per share reflects a special dividend which amounted to $.02 per share. Excluding the special dividend, the ratio of net investment income (loss) to average net assets would have been (.61)%.
G Investment income per share reflects a special dividend which amounted to $.01 per share. Excluding the special dividend, the ratio of net investment income (loss) to average net assets would have been (.67)%.
H Investment income per share reflects a special dividend which amounted to $.01 per share. Excluding the special dividend, the ratio of net investment income (loss) to average net assets would have been (.84)%.
I Expense ratios reflect operating expenses of the class. Expenses before reductions do not reflect amounts reimbursed by the investment adviser or reductions from brokerage service arrangements or reductions from other expense offset arrangements and do not represent the amount paid by the class during periods when reimbursements or reductions occur. Expenses net of fee waivers reflect expenses after reimbursement by the investment adviser but prior to reductions from brokerage service arrangements or other expense offset arrangements. Expenses net of all reductions represent the net expenses paid by the class.
J Amount represents less than $.01 per share.
K The amount shown reflects certain reclassifications related to book to tax differences.
See accompanying notes which are an integral part of the financial statements.
Annual Report
Financial Highlights - Class T
Years ended July 31, | 2011 | 2010 | 2009 | 2008 | 2007 |
Selected Per-Share Data | | | | | |
Net asset value, beginning of period | $ 12.57 | $ 10.74 | $ 13.17 | $ 16.01 | $ 12.86 |
Income from Investment Operations | | | | | |
Net investment income (loss) C | (.11) F | (.10) G | (.09) | (.15) | (.16) H |
Net realized and unrealized gain (loss) | 3.81 | 1.93 | (2.34) | (1.73) | 3.38 |
Total from investment operations | 3.70 | 1.83 | (2.43) | (1.88) | 3.22 |
Distributions from net realized gain | - | - | - | (.96) | (.07) |
Redemption fees added to paid in capital C,J | - | - | - | - | - |
Net asset value, end of period | $ 16.27 | $ 12.57 | $ 10.74 | $ 13.17 | $ 16.01 |
Total Return A,B | 29.44% | 17.04% | (18.45)% | (12.50)% | 25.18% |
Ratios to Average Net Assets D,I | | | | | |
Expenses before reductions | 1.50% | 1.61% | 1.60% | 1.65% | 1.67% |
Expenses net of fee waivers, if any | 1.50% | 1.61% | 1.60% | 1.65% | 1.65% |
Expenses net of all reductions | 1.49% | 1.60% | 1.59% | 1.65% | 1.65% |
Net investment income (loss) | (.73)% F | (.82)% G | (.91)% | (.99)% | (1.05)% H |
Supplemental Data | | | | | |
Net assets, end of period (000 omitted) | $ 30,764 | $ 23,930 | $ 21,533 | $ 21,754 | $ 26,419 |
Portfolio turnover rate E | 106% | 105% | 150% | 113% | 91% |
A Total returns would have been lower if certain expenses had not been reduced during the applicable periods shown.
B Total returns do not include the effect of the sales charges.
C Calculated based on average shares outstanding during the period.
D Fees and expenses of any underlying Fidelity Central Funds are not included in the Fund's expense ratio. The Fund indirectly bears its proportionate share of the expenses of any underlying Fidelity Central Funds.
E Amount does not include the portfolio activity of any underlying Fidelity Central Funds.
F Investment income per share reflects a special dividend which amounted to $.02 per share. Excluding the special dividend, the ratio of net investment income (loss) to average net assets would have been (.86)%.
G Investment income per share reflects a special dividend which amounted to $.01 per share. Excluding the special dividend, the ratio of net investment income (loss) to average net assets would have been (.93)%.
H Investment income per share reflects a special dividend which amounted to $.01 per share. Excluding the special dividend, the ratio of net investment income (loss) to average net assets would have been (1.09)%.
I Expense ratios reflect operating expenses of the class. Expenses before reductions do not reflect amounts reimbursed by the investment adviser or reductions from brokerage service arrangements or reductions from other expense offset arrangements and do not represent the amount paid by the class during periods when reimbursements or reductions occur. Expenses net of fee waivers reflect expenses after reimbursement by the investment adviser but prior to reductions from brokerage service arrangements or other expense offset arrangements. Expenses net of all reductions represent the net expenses paid by the class.
J Amount represents less than $.01 per share.
See accompanying notes which are an integral part of the financial statements.
Annual Report
Financial Highlights - Class B
Years ended July 31, | 2011 | 2010 | 2009 | 2008 | 2007 |
Selected Per-Share Data | | | | | |
Net asset value, beginning of period | $ 12.30 | $ 10.57 | $ 13.03 | $ 15.85 | $ 12.78 |
Income from Investment Operations | | | | | |
Net investment income (loss) C | (.18) F | (.16) G | (.13) | (.22) | (.23) H |
Net realized and unrealized gain (loss) | 3.74 | 1.89 | (2.33) | (1.71) | 3.36 |
Total from investment operations | 3.56 | 1.73 | (2.46) | (1.93) | 3.13 |
Distributions from net realized gain | - | - | - | (.89) | (.06) |
Redemption fees added to paid in capital C,J | - | - | - | - | - |
Net asset value, end of period | $ 15.86 | $ 12.30 | $ 10.57 | $ 13.03 | $ 15.85 |
Total Return A,B | 28.94% | 16.37% | (18.88)% | (12.92)% | 24.57% |
Ratios to Average Net Assets D,I | | | | | |
Expenses before reductions | 2.00% | 2.11% | 2.08% | 2.15% | 2.20% |
Expenses net of fee waivers, if any | 2.00% | 2.11% | 2.08% | 2.15% | 2.15% |
Expenses net of all reductions | 1.98% | 2.09% | 2.08% | 2.15% | 2.15% |
Net investment income (loss) | (1.22)% F | (1.32)% G | (1.39)% | (1.49)% | (1.55)% H |
Supplemental Data | | | | | |
Net assets, end of period (000 omitted) | $ 5,295 | $ 5,142 | $ 4,171 | $ 5,517 | $ 6,242 |
Portfolio turnover rate E | 106% | 105% | 150% | 113% | 91% |
A Total returns would have been lower if certain expenses had not been reduced during the applicable periods shown.
B Total returns do not include the effect of the contingent deferred sales charge.
C Calculated based on average shares outstanding during the period.
D Fees and expenses of any underlying Fidelity Central Funds are not included in the Fund's expense ratio. The Fund indirectly bears its proportionate share of the expenses of any underlying Fidelity Central Funds.
E Amount does not include the portfolio activity of any underlying Fidelity Central Funds.
F Investment income per share reflects a special dividend which amounted to $.02 per share. Excluding the special dividend, the ratio of net investment income (loss) to average net assets would have been (1.36)%.
G Investment income per share reflects a special dividend which amounted to $.01 per share. Excluding the special dividend, the ratio of net investment income (loss) to average net assets would have been (1.42)%.
H Investment income per share reflects a special dividend which amounted to $.01 per share. Excluding the special dividend, the ratio of net investment income (loss) to average net assets would have been (1.59)%.
I Expense ratios reflect operating expenses of the class. Expenses before reductions do not reflect amounts reimbursed by the investment adviser or reductions from brokerage service arrangements or reductions from other expense offset arrangements and do not represent the amount paid by the class during periods when reimbursements or reductions occur. Expenses net of fee waivers reflect expenses after reimbursement by the investment adviser but prior to reductions from brokerage service arrangements or other expense offset arrangements. Expenses net of all reductions represent the net expenses paid by the class.
J Amount represents less than $.01 per share.
See accompanying notes which are an integral part of the financial statements.
Annual Report
Financial Highlights - Class C
Years ended July 31, | 2011 | 2010 | 2009 | 2008 | 2007 |
Selected Per-Share Data | | | | | |
Net asset value, beginning of period | $ 12.28 | $ 10.55 | $ 13.00 | $ 15.84 | $ 12.77 |
Income from Investment Operations | | | | | |
Net investment income (loss) C | (.18) F | (.16) G | (.13) | (.22) | (.23) H |
Net realized and unrealized gain (loss) | 3.73 | 1.89 | (2.32) | (1.71) | 3.36 |
Total from investment operations | 3.55 | 1.73 | (2.45) | (1.93) | 3.13 |
Distributions from net realized gain | - | - | - | (.91) | (.06) |
Redemption fees added to paid in capital C,J | - | - | - | - | - |
Net asset value, end of period | $ 15.83 | $ 12.28 | $ 10.55 | $ 13.00 | $ 15.84 |
Total Return A,B | 28.91% | 16.40% | (18.85)% | (12.94)% | 24.59% |
Ratios to Average Net Assets D,I | | | | | |
Expenses before reductions | 2.00% | 2.11% | 2.08% | 2.15% | 2.20% |
Expenses net of fee waivers, if any | 2.00% | 2.11% | 2.08% | 2.15% | 2.15% |
Expenses net of all reductions | 1.98% | 2.09% | 2.07% | 2.14% | 2.14% |
Net investment income (loss) | (1.22)% F | (1.32)% G | (1.39)% | (1.49)% | (1.55)% H |
Supplemental Data | | | | | |
Net assets, end of period (000 omitted) | $ 24,914 | $ 18,091 | $ 14,267 | $ 15,946 | $ 22,348 |
Portfolio turnover rate E | 106% | 105% | 150% | 113% | 91% |
A Total returns would have been lower if certain expenses had not been reduced during the applicable periods shown.
B Total returns do not include the effect of the contingent deferred sales charge.
C Calculated based on average shares outstanding during the period.
D Fees and expenses of any underlying Fidelity Central Funds are not included in the Fund's expense ratio. The Fund indirectly bears its proportionate share of the expenses of any underlying Fidelity Central Funds.
E Amount does not include the portfolio activity of any underlying Fidelity Central Funds.
F Investment income per share reflects a special dividend which amounted to $.02 per share. Excluding the special dividend, the ratio of net investment income (loss) to average net assets would have been (1.36)%.
G Investment income per share reflects a special dividend which amounted to $.01 per share. Excluding the special dividend, the ratio of net investment income (loss) to average net assets would have been (1.42)%.
H Investment income per share reflects a special dividend which amounted to $.01 per share. Excluding the special dividend, the ratio of net investment income (loss) to average net assets would have been (1.59)%.
I Expense ratios reflect operating expenses of the class. Expenses before reductions do not reflect amounts reimbursed by the investment adviser or reductions from brokerage service arrangements or reductions from other expense offset arrangements and do not represent the amount paid by the class during periods when reimbursements or reductions occur. Expenses net of fee waivers reflect expenses after reimbursement by the investment adviser but prior to reductions from brokerage service arrangements or other expense offset arrangements. Expenses net of all reductions represent the net expenses paid by the class.
J Amount represents less than $.01 per share.
See accompanying notes which are an integral part of the financial statements.
Annual Report
Financial Highlights - Small Cap Growth
Years ended July 31, | 2011 | 2010 | 2009 | 2008 | 2007 |
Selected Per-Share Data | | | | | |
Net asset value, beginning of period | $ 12.81 | $ 10.89 | $ 13.29 | $ 16.15 | $ 12.93 |
Income from Investment Operations | | | | | |
Net investment income (loss) B | (.03) E | (.04) F | (.04) | (.07) | (.08) G |
Net realized and unrealized gain (loss) | 3.90 | 1.96 | (2.36) | (1.74) | 3.40 |
Total from investment operations | 3.87 | 1.92 | (2.40) | (1.81) | 3.32 |
Distributions from net realized gain | (.03) J | - | - | (1.05) | (.10) |
Redemption fees added to paid in capital B,I | - | - | - | - | - |
Net asset value, end of period | $ 16.65 | $ 12.81 | $ 10.89 | $ 13.29 | $ 16.15 |
Total Return A | 30.20% | 17.63% | (18.06)% | (11.98)% | 25.84% |
Ratios to Average Net Assets C,H | | | | |
Expenses before reductions | .95% | 1.08% | 1.08% | 1.11% | 1.10% |
Expenses net of fee waivers, if any | .95% | 1.08% | 1.08% | 1.11% | 1.10% |
Expenses net of all reductions | .93% | 1.07% | 1.08% | 1.10% | 1.09% |
Net investment income (loss) | (.17)% E | (.29)% F | (.39)% | (.45)% | (.50)% G |
Supplemental Data | | | | | |
Net assets, end of period (000 omitted) | $ 1,382,688 | $ 1,204,818 | $ 1,085,184 | $ 1,217,520 | $ 1,149,809 |
Portfolio turnover rate D | 106% | 105% | 150% | 113% | 91% |
A Total returns would have been lower if certain expenses had not been reduced during the applicable periods shown.
B Calculated based on average shares outstanding during the period.
C Fees and expenses of any underlying Fidelity Central Funds are not included in the Fund's expense ratio. The Fund indirectly bears its proportionate share of the expenses of any underlying Fidelity Central Funds.
D Amount does not include the portfolio activity of any underlying Fidelity Central Funds.
E Investment income per share reflects a special dividend which amounted to $.02 per share. Excluding the special dividend, the ratio of net investment income (loss) to average net assets would have been (.31)%.
F Investment income per share reflects a special dividend which amounted to $.01 per share. Excluding the special dividend, the ratio of net investment income (loss) to average net assets would have been (.39)%.
G Investment income per share reflects a special dividend which amounted to $.01 per share. Excluding the special dividend, the ratio of net investment income (loss) to average net assets would have been (.54)%.
H Expense ratios reflect operating expenses of the class. Expenses before reductions do not reflect amounts reimbursed by the investment adviser or reductions from brokerage service arrangements or reductions from other expense offset arrangements and do not represent the amount paid by the class during periods when reimbursements or reductions occur. Expenses net of fee waivers reflect expenses after reimbursement by the investment adviser but prior to reductions from brokerage service arrangements or other expense offset arrangements. Expenses net of all reductions represent the net expenses paid by the class.
I Amount represents less than $.01 per share.
J The amount shown reflects certain reclassifications related to book to tax differences.
See accompanying notes which are an integral part of the financial statements.
Annual Report
Financial Highlights - Class F
Years ended July 31, | 2011 | 2010 | 2009 J |
Selected Per-Share Data | | | |
Net asset value, beginning of period | $ 12.85 | $ 10.90 | $ 10.03 |
Income from Investment Operations | | | |
Net investment income (loss) D | .01 H | - I,L | (.01) |
Net realized and unrealized gain (loss) | 3.91 | 1.95 | .88 |
Total from investment operations | 3.92 | 1.95 | .87 |
Distributions from net realized gain | (.04) M | - | - |
Redemption fees added to paid in capital D,L | - | - | - |
Net asset value, end of period | $ 16.73 | $ 12.85 | $ 10.90 |
Total Return B,C | 30.56% | 17.89% | 8.67% |
Ratios to Average Net Assets E,K | | | |
Expenses before reductions | .70% | .78% | .74% A |
Expenses net of fee waivers, if any | .70% | .78% | .74% A |
Expenses net of all reductions | .68% | .77% | .73% A |
Net investment income (loss) | .08% H | -% G,I | (.54)% A |
Supplemental Data | | | |
Net assets, end of period (000 omitted) | $ 290,765 | $ 106,941 | $ 159 |
Portfolio turnover rate F | 106% | 105% | 150% |
A Annualized
B Total returns for periods of less than one year are not annualized.
C Total returns would have been lower if certain expenses had not been reduced during the applicable periods shown.
D Calculated based on average shares outstanding during the period.
E Fees and expenses of any underlying Fidelity Central Funds are not included in the Fund's expense ratio. The Fund indirectly bears its proportionate share of the expenses of any underlying Fidelity Central Funds.
F Amount does not include the portfolio activity of any underlying Fidelity Central Funds.
G Amount represents less than .01%.
H Investment income per share reflects a special dividend which amounted to $.02 per share. Excluding the special dividend, the ratio of net investment income (loss) to average net assets would have been (.06)%.
I Investment income per share reflects a special dividend which amounted to $.01 per share. Excluding the special dividend, the ratio of net investment income (loss) to average net assets would have been (.10)%.
J For the period June 26, 2009 (commencement of sale of shares) to July 31, 2009.
K Expense ratios reflect operating expenses of the class. Expenses before reductions do not reflect amounts reimbursed by the investment adviser or reductions from brokerage service arrangements or reductions from other expense offset arrangements and do not represent the amount paid by the class during periods when reimbursements or reductions occur. Expense ratios before reductions for start-up periods may not be representative of longer-term operating periods. Expenses net of fee waivers reflect expenses after reimbursement by the investment adviser but prior to reductions from brokerage service arrangements or other expense offset arrangements. Expenses net of all reductions represent the net expenses paid by the class.
L Amount represents less than $.01 per share.
M The amount shown reflects certain reclassifications related to book to tax differences.
See accompanying notes which are an integral part of the financial statements.
Annual Report
Financial Highlights - Institutional Class
Years ended July 31, | 2011 | 2010 | 2009 | 2008 | 2007 |
Selected Per-Share Data | | | | | |
Net asset value, beginning of period | $ 12.83 | $ 10.91 | $ 13.30 | $ 16.15 | $ 12.92 |
Income from Investment Operations | | | | | |
Net investment income (loss) B | (.03) E | (.03) F | (.03) | (.06) | (.07) G |
Net realized and unrealized gain (loss) | 3.91 | 1.95 | (2.36) | (1.74) | 3.41 |
Total from investment operations | 3.88 | 1.92 | (2.39) | (1.80) | 3.34 |
Distributions from net realized gain | (.03) J | - | - | (1.05) | (.11) |
Redemption fees added to paid in capital B,I | - | - | - | - | - |
Net asset value, end of period | $ 16.68 | $ 12.83 | $ 10.91 | $ 13.30 | $ 16.15 |
Total Return A | 30.24% | 17.60% | (17.97)% | (11.93)% | 25.99% |
Ratios to Average Net Assets C,H | | | | |
Expenses before reductions | .94% | 1.03% | 1.05% | 1.04% | 1.05% |
Expenses net of fee waivers, if any | .94% | 1.03% | 1.05% | 1.04% | 1.05% |
Expenses net of all reductions | .93% | 1.02% | 1.04% | 1.03% | 1.05% |
Net investment income (loss) | (.17)% E | (.24)% F | (.36)% | (.38)% | (.46)% G |
Supplemental Data | | | | | |
Net assets, end of period (000 omitted) | $ 41,440 | $ 25,650 | $ 19,204 | $ 22,444 | $ 18,671 |
Portfolio turnover rate D | 106% | 105% | 150% | 113% | 91% |
A Total returns would have been lower if certain expenses had not been reduced during the applicable periods shown.
B Calculated based on average shares outstanding during the period.
C Fees and expenses of any underlying Fidelity Central Funds are not included in the Fund's expense ratio. The Fund indirectly bears its proportionate share of the expenses of any underlying Fidelity Central Funds.
D Amount does not include the portfolio activity of any underlying Fidelity Central Funds.
E Investment income per share reflects a special dividend which amounted to $.02 per share. Excluding the special dividend, the ratio of net investment income (loss) to average net assets would have been (.30)%.
F Investment income per share reflects a special dividend which amounted to $.01 per share. Excluding the special dividend, the ratio of net investment income (loss) to average net assets would have been (.34)%.
G Investment income per share reflects a special dividend which amounted to $.01 per share. Excluding the special dividend, the ratio of net investment income (loss) to average net assets would have been (.50)%.
H Expense ratios reflect operating expenses of the class. Expenses before reductions do not reflect amounts reimbursed by the investment adviser or reductions from brokerage service arrangements or reductions from other expense offset arrangements and do not represent the amount paid by the class during periods when reimbursements or reductions occur. Expenses net of fee waivers reflect expenses after reimbursement by the investment adviser but prior to reductions from brokerage service arrangements or other expense offset arrangements. Expenses net of all reductions represent the net expenses paid by the class.
I Amount represents less than $.01 per share.
J The amount shown reflects certain reclassifications related to book to tax differences.
See accompanying notes which are an integral part of the financial statements.
Annual Report
Notes to Financial Statements
For the period ended July 31, 2011
1. Organization.
Fidelity Small Cap Growth Fund (the Fund) is a fund of Fidelity Securities Fund (the Trust) and is authorized to issue an unlimited number of shares. The Trust is registered under the Investment Company Act of 1940, as amended (the 1940 Act), as an open-end management investment company organized as a Massachusetts business trust. The Fund offers Class A, Class T, Class C, Small Cap Growth, Class F, and Institutional Class shares, each of which, along with Class B shares, has equal rights as to assets and voting privileges. Effective after the close of business on September 1, 2010, Class B shares were closed to new accounts and additional purchases, except for exchanges and reinvestments, by existing shareholders. Each class has exclusive voting rights with respect to matters that affect that class. Class F shares of the Fund are only available for purchase by mutual funds for which Fidelity Management & Research Company (FMR) or an affiliate serves as investment manager. Class B shares will automatically convert to Class A shares after a holding period of seven years from the initial date of purchase. Investment income, realized and unrealized capital gains and losses, the common expenses of the Fund, and certain fund-level expense reductions, if any, are allocated on a pro-rata basis to each class based on the relative net assets of each class to the total net assets of the Fund. Each class differs with respect to transfer agent and distribution and service plan fees incurred. Certain expense reductions may also differ by class.
2. Investments in Fidelity Central Funds.
The Fund invests in Fidelity Central Funds, which are open-end investment companies available only to other investment companies and accounts managed by FMR and its affiliates. The Fund's Schedule of Investments lists each of the Fidelity Central Funds held as of period end, if any, as an investment of the Fund, but does not include the underlying holdings of each Fidelity Central Fund. As an Investing Fund, the Fund indirectly bears its proportionate share of the expenses of the underlying Fidelity Central Funds.
The Money Market Central Funds seek preservation of capital and current income and are managed by Fidelity Investments Money Management, Inc. (FIMM), an affiliate of FMR.
A complete unaudited list of holdings for each Fidelity Central Fund is available upon request or at the Securities and Exchange Commission (the SEC) web site at www.sec.gov. In addition, the financial statements of the Fidelity Central Funds, which are not covered by the Fund's Report of Independent Registered Public Accounting Firm, are available on the SEC web site or upon request.
Annual Report
Notes to Financial Statements - continued
3. Significant Accounting Policies.
The financial statements have been prepared in conformity with accounting principles generally accepted in the United States of America (GAAP), which require management to make certain estimates and assumptions at the date of the financial statements. Actual results could differ from those estimates. Subsequent events, if any, through the date that the financial statements were issued have been evaluated in the preparation of the financial statements. The following summarizes the significant accounting policies of the Fund:
Security Valuation. Investments are valued as of 4:00 p.m. Eastern time on the last calendar day of the period. The Fund uses independent pricing services approved by the Board of Trustees to value its investments. When current market prices or quotations are not readily available or reliable, valuations may be determined in good faith in accordance with procedures adopted by the Board of Trustees. Factors used in determining value may include market or security specific events. The frequency with which these procedures are used cannot be predicted and they may be utilized to a significant extent. The value used for net asset value (NAV) calculation under these procedures may differ from published prices for the same securities.
The Fund categorizes the inputs to valuation techniques used to value its investments into a disclosure hierarchy consisting of three levels as shown below:
Level 1 - quoted prices in active markets for identical investments
Level 2 - other significant observable inputs (including quoted prices for similar investments, interest rates, prepayment speeds, etc.)
Level 3 - unobservable inputs (including the Fund's own assumptions based on the best information available)
Changes in valuation techniques may result in transfers in or out of an assigned level within the disclosure hierarchy. Valuation techniques used to value the Fund's investments by major category are as follows:
Equity securities, including restricted securities, for which market quotations are readily available, are valued at the last reported sale price or official closing price as reported by an independent pricing service on the primary market or exchange on which they are traded and are categorized as Level 1 in the hierarchy. In the event there were no sales during the day or closing prices are not available, securities are valued at the last quoted bid price or may be valued using the last available price and are generally categorized as Level 2 in the hierarchy. For foreign equity securities, when significant market or security specific events arise, comparisons to the valuation of American Depositary Receipts (ADRs), futures contracts, Exchange-traded funds (ETFs) and certain indexes as well as
Annual Report
3. Significant Accounting Policies - continued
Security Valuation - continued
quoted prices for similar securities are used and are categorized as Level 2 in the hierarchy in these circumstances. Utilizing these techniques may result in transfers between Level 1 and Level 2. For restricted equity securities and private placements where observable inputs are limited, assumptions about market activity and risk are used and are categorized as Level 3 in the hierarchy.
Investments in open-end mutual funds, including the Fidelity Central Funds, are valued at their closing net asset value each business day and are categorized as Level 1 in the hierarchy.
Foreign Currency. The Fund may use foreign currency contracts to facilitate transactions in foreign-denominated securities. Gains and losses from these transactions may arise from changes in the value of the foreign currency or if the counterparties do not perform under the contracts' terms.
Foreign-denominated assets, including investment securities, and liabilities are translated into U.S. dollars at the exchange rate at period end. Purchases and sales of investment securities, income and dividends received and expenses denominated in foreign currencies are translated into U.S. dollars at the exchange rate in effect on the transaction date.
The effects of exchange rate fluctuations on investments are included with the net realized and unrealized gain (loss) on investment securities. Other foreign currency transactions resulting in realized and unrealized gain (loss) are disclosed separately.
Investment Transactions and Income. For financial reporting purposes, the Fund's investment holdings and NAV include trades executed through the end of the last business day of the period. The NAV per share for processing shareholder transactions is calculated as of the close of business of the New York Stock Exchange (NYSE), normally 4:00 p.m. Eastern time and includes trades executed through the end of the prior business day. Gains and losses on securities sold are determined on the basis of identified cost and may include proceeds received from litigation. Dividend income is recorded on the ex-dividend date, except for certain dividends from foreign securities where the ex-dividend date may have passed, which are recorded as soon as the Fund is informed of the ex-dividend date. Non-cash dividends included in dividend income, if any, are recorded at the fair market value of the securities received. Distributions received on securities that represent a return of capital or capital gain are recorded as a reduction of cost of investments and/or as a realized gain. The Fund estimates the components of distributions received that may be considered return of capital distributions or capital
Annual Report
Notes to Financial Statements - continued
3. Significant Accounting Policies - continued
Investment Transactions and Income - continued
gain distributions. Large, non-recurring dividends recognized by the Fund are presented separately on the Statement of Operations as "Special Dividends" and the impact of these dividends is presented in the Financial Highlights. Interest income and distributions from the Fidelity Central Funds are accrued as earned. Interest income includes coupon interest and amortization of premium and accretion of discount on debt securities. Investment income is recorded net of foreign taxes withheld where recovery of such taxes is uncertain.
Expenses. Expenses directly attributable to a fund are charged to that fund. Expenses attributable to more than one fund are allocated among the respective funds on the basis of relative net assets or other appropriate methods. Expense estimates are accrued in the period to which they relate and adjustments are made when actual amounts are known.
Income Tax Information and Distributions to Shareholders. Each year, the Fund intends to qualify as a regulated investment company, including distributing substantially all of its taxable income and realized gains under Subchapter M of the Internal Revenue Code and filing its U.S. federal tax return. As a result, no provision for income taxes is required. As of July 31, 2011, the Fund did not have any unrecognized tax benefits in the financial statements. A fund's federal tax return is subject to examination by the Internal Revenue Service (IRS) for a period of three years. Foreign taxes are provided for based on the Fund's understanding of the tax rules and rates that exist in the foreign markets in which it invests.
Distributions are declared and recorded on the ex-dividend date. Income dividends and capital gain distributions are declared separately for each class. Income and capital gain distributions are determined in accordance with income tax regulations, which may differ from GAAP. These differences resulted in distribution reclasses.
Capital accounts within the financial statements are adjusted for permanent book-tax differences. These adjustments have no impact on net assets or the results of operations. Temporary book-tax differences will reverse in a subsequent period.
Book-tax differences are primarily due to foreign currency transactions, net operating losses, capital loss carryforwards, and losses deferred due to wash sales and excise tax regulations.
Annual Report
3. Significant Accounting Policies - continued
Income Tax Information and Distributions to Shareholders - continued
The federal tax cost of investment securities and unrealized appreciation (depreciation) as of period end were as follows:
Gross unrealized appreciation | $ 354,172,386 |
Gross unrealized depreciation | (75,667,186) |
Net unrealized appreciation (depreciation) on securities and other investments | $ 278,505,200 |
| |
Tax Cost | $ 1,701,681,091 |
The tax-based components of distributable earnings as of period end were as follows:
Undistributed long-term capital gain | $ 25,499,273 |
Net unrealized appreciation (depreciation) | $ 278,508,866 |
Under the recently enacted Regulated Investment Company Modernization Act of 2010 (the Act), the Fund will be permitted to carry forward capital losses incurred in taxable years beginning after December 22, 2010 for an unlimited period. However, any losses incurred during those future taxable years will be required to be utilized prior to any losses incurred in pre-enactment taxable years, which generally expire after eight years from when they are incurred. Additionally, post-enactment capital losses that are carried forward will retain their character as either short-term or long-term capital losses rather than being considered all short-term as under previous law. The Fund's first fiscal year end subject to the Act will be July 31, 2012.
The tax character of distributions paid was as follows:
| July 31, 2011 | July 31, 2010 |
Long-term Capital Gains | $ 3,013,255 | $ - |
Short-Term Trading (Redemption) Fees. Shares held by investors in the Fund less than 90 days are subject to a redemption fee equal to 1.50% of the net asset value of shares redeemed. All redemption fees, which reduce the proceeds of the shareholder redemption, are retained by the Fund and accounted for as an addition to paid in capital.
New Accounting Pronouncement. In May 2011, the Financial Accounting Standards Board issued Accounting Standard Update No. 2011-04, Fair Value Measurement (Topic 820) - Amendments to Achieve Common Fair Value Measurement and Disclosure Requirements in U.S. GAAP and IFRSs. The update changes the wording used to describe the requirements in GAAP for measuring fair value and for disclosing information about fair value measurements. The update is effective during interim and annual periods beginning after December 15, 2011. Management is currently evaluating the impact of the update's adoption on the Fund's financial statement disclosures.
Annual Report
Notes to Financial Statements - continued
4. Purchases and Sales of Investments.
Purchases and sales of securities, other than short-term securities, aggregated $1,788,943,155 and $1,761,314,998, respectively.
5. Fees and Other Transactions with Affiliates.
Management Fee. FMR and its affiliates provide the Fund with investment management related services for which the Fund pays a monthly management fee. The management fee is the sum of an individual fund fee rate that is based on an annual rate of .45% of the Fund's average net assets and a group fee rate that averaged .26% during the period. The group fee rate is based upon the average net assets of all the mutual funds advised by FMR. The group fee rate decreases as assets under management increase and increases as assets under management decrease. In addition, the management fee is subject to a performance adjustment (up to a maximum of ± .20% of the Fund's average net assets over a 36 month performance period). The upward or downward adjustment to the management fee is based on the relative investment performance of Small Cap Growth, as compared to an appropriate benchmark index. For the period, the total annual management fee rate, including the performance adjustment, was .64% of the Fund's average net assets.
Distribution and Service Plan Fees. In accordance with Rule 12b-1 of the 1940 Act, the Fund has adopted separate Distribution and Service Plans for each class of shares. Certain classes pay Fidelity Distributors Corporation (FDC), an affiliate of FMR, separate Distribution and Service Fees, each of which is based on an annual percentage of each class' average net assets. In addition, FDC may pay financial intermediaries for selling shares of the Fund and providing shareholder support services. For the period, the Distribution and Service Fee rates, total fees and amounts retained by FDC were as follows:
| Distribution
Fee | Service
Fee | Total
Fees | Retained
by FDC |
Class A | -% | .25% | $ 156,403 | $ 4,810 |
Class T | .25% | .25% | 145,496 | - |
Class B | .75% | .25% | 55,389 | 41,618 |
Class C | .75% | .25% | 224,168 | 46,361 |
| | | $ 581,456 | $ 92,789 |
Sales Load. FDC may receive a front-end sales charge of up to 5.75% for selling Class A shares, and 3.50% for selling Class T shares, some of which is paid to financial intermediaries for selling shares of the Fund. Depending on the holding period, FDC may receive contingent deferred sales charges levied on Class A, Class T, Class B, and Class C redemptions. The deferred sales charges range from 5% to 1% for Class B, 1% for Class C, 1.00% for certain purchases of Class A shares and .25% for certain purchases of Class T shares.
Annual Report
5. Fees and Other Transactions with Affiliates - continued
Sales Load - continued
For the period, sales charge amounts retained by FDC were as follows:
| Retained
by FDC |
Class A | $ 29,915 |
Class T | 6,692 |
Class B* | 11,257 |
Class C* | 2,120 |
| $ 49,984 |
* When Class B and Class C shares are initially sold, FDC pays commissions from its own resources to financial intermediaries through which the sales are made.
Transfer Agent Fees. Fidelity Investments Institutional Operations Company, Inc. (FIIOC), an affiliate of FMR, is the transfer, dividend disbursing and shareholder servicing agent for each class of the Fund. FIIOC receives account fees and asset-based fees that vary according to the account size and type of account of the shareholders of the respective classes of the Fund. FIIOC receives no fees for providing transfer agency services to Class F. FIIOC pays for typesetting, printing and mailing of shareholder reports, except proxy statements. For the period, transfer agent fees for each class were as follows:
| Amount | % of
Average
Net Assets |
Class A | $ 187,257 | .30 |
Class T | 88,193 | .30 |
Class B | 16,587 | .30 |
Class C | 67,033 | .30 |
Small Cap Growth | 3,412,823 | .25 |
Institutional Class | 85,790 | .24 |
| $ 3,857,683 | |
Accounting and Security Lending Fees. Fidelity Service Company, Inc. (FSC), an affiliate of FMR, maintains the Fund's accounting records. The accounting fee is based on the level of average net assets for the month. Under a separate contract, FSC administers the security lending program. The security lending fee is based on the number and duration of lending transactions.
Brokerage Commissions. The Fund placed a portion of its portfolio transactions with brokerage firms which are affiliates of the investment adviser. The commissions paid to these affiliated firms were $71,765 for the period.
Annual Report
Notes to Financial Statements - continued
6. Committed Line of Credit.
The Fund participates with other funds managed by FMR or an affiliate in a $4.0 billion credit facility (the "line of credit") to be utilized for temporary or emergency purposes to fund shareholder redemptions or for other short-term liquidity purposes. The Fund has agreed to pay commitment fees on its pro-rata portion of the line of credit, which amounted to $5,614 and is reflected in Miscellaneous expenses on the Statement of Operations. During the period, there were no borrowings on this line of credit.
7. Security Lending.
The Fund lends portfolio securities through a lending agent from time to time in order to earn additional income. The lending agent may loan securities to certain qualified borrowers, including Fidelity Capital Markets (FCM), a broker-dealer affiliated with the Fund. On the settlement date of the loan, the Fund receives collateral (in the form of U.S. Treasury obligations, letters of credit and/or cash) against the loaned securities and maintains collateral in an amount not less than 100% of the market value of the loaned securities during the period of the loan. The market value of the loaned securities is determined at the close of business of the Fund and any additional required collateral is delivered to the Fund on the next business day. If the borrower defaults on its obligation to return the securities loaned because of insolvency or other reasons, a fund could experience delays and costs in recovering the securities loaned or in gaining access to the collateral. Any cash collateral received is invested in the Fidelity Securities Lending Cash Central Fund. The value of loaned securities and cash collateral at period end are disclosed on the Fund's Statement of Assets and Liabilities. The value of securities loaned to FCM at period end was $2,457,312. Security lending income represents the income earned on investing cash collateral, less rebates paid to borrowers and lending agent fees associated with the loan, plus any premium payments received for lending certain types of securities. Security lending income is presented in the Statement of Operations as a component of income from Fidelity Central Funds, and includes $19,296 from securities loaned to FCM.
8. Expense Reductions.
Many of the brokers with whom FMR places trades on behalf of the Fund provided services to the Fund in addition to trade execution. These services included payments of certain expenses on behalf of the Fund totaling $205,159 for the period. In addition, through arrangements with the Fund's custodian, credits realized as a result of uninvested cash balances were used to reduce the Fund's expenses. During the period, these credits reduced the Fund's custody expenses by $308.
Annual Report
9. Distributions to Shareholders.
Distributions to shareholders of each class were as follows:
Years ended July 31, | 2011 | 2010 |
From net realized gain | | |
Class A | $ 40,130 | $ - |
Small Cap Growth | 2,420,020 | - |
Class F | 492,928 | - |
Institutional Class | 60,177 | - |
Total | $ 3,013,255 | $ - |
10. Share Transactions.
Transactions for each class of shares were as follows:
| Shares | Dollars |
Years ended July 31, | 2011 | 2010 | 2011 | 2010 |
Class A | | | | |
Shares sold | 1,459,436 | 1,755,238 | $ 22,640,692 | $ 21,749,463 |
Reinvestment of distributions | 2,323 | - | 36,172 | - |
Shares redeemed | (1,364,690) | (1,481,231) | (20,977,078) | (17,861,442) |
Net increase (decrease) | 97,069 | 274,007 | $ 1,699,786 | $ 3,888,021 |
Class T | | | | |
Shares sold | 420,613 | 492,575 | $ 6,491,294 | $ 6,056,365 |
Shares redeemed | (434,512) | (592,408) | (6,714,256) | (7,232,100) |
Net increase (decrease) | (13,899) | (99,833) | $ (222,962) | $ (1,175,735) |
Class B | | | | |
Shares sold | 25,204 | 117,304 | $ 366,276 | $ 1,414,923 |
Shares redeemed | (109,118) | (93,928) | (1,597,390) | (1,126,513) |
Net increase (decrease) | (83,914) | 23,376 | $ (1,231,114) | $ 288,410 |
Class C | | | | |
Shares sold | 469,568 | 479,633 | $ 7,154,653 | $ 5,791,649 |
Shares redeemed | (368,398) | (358,550) | (5,494,248) | (4,319,904) |
Net increase (decrease) | 101,170 | 121,083 | $ 1,660,405 | $ 1,471,745 |
Small Cap Growth | | | | |
Shares sold | 19,971,507 | 22,893,960 | $ 315,167,556 | $ 285,679,819 |
Reinvestment of distributions | 153,921 | - | 2,384,001 | - |
Shares redeemed | (31,144,660) | (28,450,958) | (483,710,319) | (351,525,118) |
Net increase (decrease) | (11,019,232) | (5,556,998) | $ (166,158,762) | $ (65,845,299) |
Annual Report
Notes to Financial Statements - continued
10. Share Transactions - continued
| Shares | Dollars |
Years ended July 31, | 2011 | 2010 | 2011 | 2010 |
Class F | | | | |
Shares sold | 11,382,202 | 8,663,528 | $ 176,012,143 | $ 109,176,128 |
Reinvestment of distributions | 31,816 | - | 492,928 | - |
Shares redeemed | (2,356,621) | (357,394) | (37,493,486) | (4,690,130) |
Net increase (decrease) | 9,057,397 | 8,306,134 | $ 139,011,585 | $ 104,485,998 |
Institutional Class | | | | |
Shares sold | 1,038,111 | 1,109,901 | $ 16,415,657 | $ 14,013,757 |
Reinvestment of distributions | 2,532 | - | 39,301 | - |
Shares redeemed | (555,221) | (871,545) | (8,700,391) | (10,548,734) |
Net increase (decrease) | 485,422 | 238,356 | $ 7,754,567 | $ 3,465,023 |
11. Other.
The Fund's organizational documents provide former and current trustees and officers with a limited indemnification against liabilities arising in connection with the performance of their duties to the Fund. In the normal course of business, the Fund may also enter into contracts that provide general indemnifications. The Fund's maximum exposure under these arrangements is unknown as this would be dependent on future claims that may be made against the Fund. The risk of material loss from such claims is considered remote.
The Fidelity Freedom Funds were the owners of record, in the aggregate, of approximately 37% of the total outstanding shares of the Fund.
Annual Report
To the Trustees of Fidelity Securities Fund and the Shareholders of Fidelity Small Cap Growth Fund:
In our opinion, the accompanying statement of assets and liabilities, including the schedule of investments, and the related statements of operations and of changes in net assets and the financial highlights present fairly, in all material respects, the financial position of Fidelity Small Cap Growth Fund (a fund of Fidelity Securities Fund) at July 31, 2011, the results of its operations for the year then ended, the changes in its net assets for each of the two years in the period then ended and the financial highlights for each of the periods indicated, in conformity with accounting principles generally accepted in the United States of America. These financial statements and financial highlights (hereafter referred to as "financial statements") are the responsibility of the Fidelity Small Cap Growth Fund's management. Our responsibility is to express an opinion on these financial statements based on our audits. We conducted our audits of these financial statements in accordance with the standards of the Public Company Accounting Oversight Board (United States). Those standards require that we plan and perform the audit to obtain reasonable assurance about whether the financial statements are free of material misstatement. An audit includes examining, on a test basis, evidence supporting the amounts and disclosures in the financial statements, assessing the accounting principles used and significant estimates made by management, and evaluating the overall financial statement presentation. We believe that our audits, which included confirmation of securities at July 31, 2011 by correspondence with the custodian and brokers, provide a reasonable basis for our opinion.
/s/PricewaterhouseCoopers LLP
PricewaterhouseCoopers LLP
Boston, Massachusetts
September 14, 2011
Annual Report
The Trustees, Members of the Advisory Board, and executive officers of the trust and fund, as applicable, are listed below. The Board of Trustees governs the fund and is responsible for protecting the interests of shareholders. The Trustees are experienced executives who meet periodically throughout the year to oversee the fund's activities, review contractual arrangements with companies that provide services to the fund, oversee management of the risks associated with such activities and contractual arrangements, and review the fund's performance. Except for James C. Curvey, each of the Trustees oversees 221 funds advised by FMR or an affiliate. Mr. Curvey oversees 419 funds advised by FMR or an affiliate.
The Trustees hold office without limit in time except that (a) any Trustee may resign; (b) any Trustee may be removed by written instrument, signed by at least two-thirds of the number of Trustees prior to such removal; (c) any Trustee who requests to be retired or who has become incapacitated by illness or injury may be retired by written instrument signed by a majority of the other Trustees; and (d) any Trustee may be removed at any special meeting of shareholders by a two-thirds vote of the outstanding voting securities of the trust. Each Trustee who is not an interested person (as defined in the 1940 Act) (Independent Trustee), shall retire not later than the last day of the calendar year in which his or her 75th birthday occurs. The Independent Trustees may waive this mandatory retirement age policy with respect to individual Trustees. The executive officers and Advisory Board Members hold office without limit in time, except that any officer and Advisory Board Member may resign or may be removed by a vote of a majority of the Trustees at any regular meeting or any special meeting of the Trustees. Except as indicated, each individual has held the office shown or other offices in the same company for the past five years.
Experience, Skills, Attributes, and Qualifications of the Fund's Trustees. The Governance and Nominating Committee has adopted a statement of policy that describes the experience, qualifications, attributes, and skills that are necessary and desirable for potential Independent Trustee candidates (Statement of Policy). The Board believes that each Trustee satisfied at the time he or she was initially elected or appointed a Trustee, and continues to satisfy, the standards contemplated by the Statement of Policy. The Governance and Nominating Committee also engages professional search firms to help identify potential Independent Trustee candidates who have the experience, qualifications, attributes, and skills consistent with the Statement of Policy. From time to time, additional criteria based on the composition and skills of the current Independent Trustees, as well as experience or skills that may be appropriate in light of future changes to board composition, business conditions, and regulatory or other developments, have also been considered by the professional search firms and the Governance and Nominating Committee. In addition, the Board takes into account the Trustees' commitment and participation in Board and committee meetings, as well as their leadership of standing and ad hoc committees throughout their tenure.
In determining that a particular Trustee was and continues to be qualified to serve as a Trustee, the Board has considered a variety of criteria, none of which, in isolation, was controlling. The Board believes that, collectively, the Trustees have balanced and diverse experience, qualifications, attributes, and skills, which allow the Board to operate effectively in governing the fund and protecting the interests of shareholders. Information about the specific experience, skills, attributes, and qualifications of each Trustee, which in each case led to the Board's conclusion that the Trustee should serve (or continue to serve) as a trustee of the fund, is provided below.
Annual Report
Trustees and Officers - continued
Board Structure and Oversight Function. James C. Curvey is an interested person (as defined in the 1940 Act) and currently serves as Acting Chairman. The Trustees have determined that an interested Chairman is appropriate and benefits shareholders because an interested Chairman has a personal and professional stake in the quality and continuity of services provided to the fund. Independent Trustees exercise their informed business judgment to appoint an individual of their choosing to serve as Chairman, regardless of whether the Trustee happens to be independent or a member of management. The Independent Trustees have determined that they can act independently and effectively without having an Independent Trustee serve as Chairman and that a key structural component for assuring that they are in a position to do so is for the Independent Trustees to constitute a substantial majority for the Board. The Independent Trustees also regularly meet in executive session. Ned C. Lautenbach serves as Chairman of the Independent Trustees and as such (i) acts as a liaison between the Independent Trustees and management with respect to matters important to the Independent Trustees and (ii) with management prepares agendas for Board meetings.
Fidelity funds are overseen by different Boards of Trustees. The fund's Board oversees Fidelity's equity and high income funds and another Board oversees Fidelity's investment-grade bond, money market, and asset allocation funds. The asset allocation funds may invest in Fidelity funds overseen by the fund's Board. The use of separate Boards, each with its own committee structure, allows the Trustees of each group of Fidelity funds to focus on the unique issues of the funds they oversee, including common research, investment, and operational issues. On occasion, the separate Boards establish joint committees to address issues of overlapping consequences for the Fidelity funds overseen by each Board.
The Trustees operate using a system of committees to facilitate the timely and efficient consideration of all matters of importance to the Trustees, the fund, and fund shareholders and to facilitate compliance with legal and regulatory requirements and oversight of the fund's activities and associated risks. The Board, acting through its committees, has charged FMR and its affiliates with (i) identifying events or circumstances the occurrence of which could have demonstrably adverse effects on the fund's business and/or reputation; (ii) implementing processes and controls to lessen the possibility that such events or circumstances occur or to mitigate the effects of such events or circumstances if they do occur; and (iii) creating and maintaining a system designed to evaluate continuously business and market conditions in order to facilitate the identification and implementation processes described in (i) and (ii) above. Because the day-to-day operations and activities of the fund are carried out by or through FMR, its affiliates and other service providers, the fund's exposure to risks is mitigated but not eliminated by the processes overseen by the Trustees. While each of the Board's committees has responsibility for overseeing different aspects of the fund's activities, oversight is exercised primarily through the Operations, Audit, and Compliance Committees. Appropriate personnel, including but not limited to the fund's Chief Compliance Officer (CCO), FMR's internal auditor, the independent accountants, the fund's Treasurer and portfolio management personnel, make periodic reports to the Board's committees, as appropriate. The responsibilities of each committee, including their oversight responsibilities, are described further under "Standing Committees of the Fund's Trustees."
Annual Report
The fund's Statement of Additional Information (SAI) includes more information about the Trustees. To request a free copy, call Fidelity at 1-800-544-8544.
Interested Trustees*:
Correspondence intended for each Trustee who is an interested person may be sent to Fidelity Investments, 82 Devonshire Street, Boston, Massachusetts 02109.
Name, Age; Principal Occupations and Other Relevant Experience+ |
James C. Curvey (76) |
| Year of Election or Appointment: 2007 Mr. Curvey is Trustee and Acting Chairman of the Board of Trustees of certain Trusts. Mr. Curvey also serves as Trustee (2007-present) of other investment companies advised by FMR. Mr. Curvey is a Director of Fidelity Investments Money Management, Inc. (2009-present), Director of Fidelity Research & Analysis Co. (2009-present) and Director of FMR and FMR Co., Inc. (2007-present). Mr. Curvey is also Vice Chairman (2007-present) and Director of FMR LLC. In addition, Mr. Curvey serves as an Overseer for the Boston Symphony Orchestra and a member of the Trustees of Villanova University. Previously, Mr. Curvey was the Vice Chairman (2006-2007) and Director (2000-2007) of FMR Corp. |
Ronald P. O'Hanley (54) |
| Year of Election or Appointment: 2011 Mr. O'Hanley is Director of FMR Co., Inc. (2010-present), Director of Fidelity Investments Money Management, Inc. (2010-present), Director of Fidelity Research & Analysis Company (2010-present), President of Fidelity Asset Management and Corporate Services and a member of Fidelity's Executive Committee (2010-present). Previously, Mr. O'Hanley served as President and Chief Executive Officer of BNY Mellon Asset Management (2007-2010). Mr. O'Hanley also served as Vice Chairman of Bank New York Mellon Corp. and a member of that firm's Executive Committee. Prior to the 2007 merger of The Bank of New York and Mellon Financial Corporation, he was Vice Chairman of Mellon Financial Corporation and President and Chief Executive Officer of Mellon Asset Management. He joined Mellon in February 1997. Mr. O'Hanley currently serves as Chairman of the Boston Public Library Foundation Board of Directors and sits on the Board of Directors of Beth Israel Deaconess Medical Center, the Board of Trustees of the Marine Biological Laboratory and the Advisory Board of the Maxwell School of Citizenship and Public Administration at Syracuse University. Mr. O'Hanley also chairs the Council on Asset Management for the Financial Services Roundtable and is a member of the Board of Directors of Institutional Investor's U.S. Institute. |
* Trustees have been determined to be "Interested Trustees" by virtue of, among other things, their affiliation with the trust or various entities under common control with FMR.
+ The information above includes each Trustee's principal occupation during the last five years and other information relating to the experience, attributes, and skills relevant to each Trustee's qualifications to serve as a Trustee, which led to the conclusion that each Trustee should serve as a Trustee for the fund.
Annual Report
Independent Trustees:
Correspondence intended for each Independent Trustee (that is, the Trustees other than the Interested Trustees) may be sent to Fidelity Investments, P.O. Box 55235, Boston, Massachusetts 02205-5235.
Name, Age; Principal Occupations and Other Relevant Experience+ |
Dennis J. Dirks (63) |
| Year of Election or Appointment: 2005 Prior to his retirement in May 2003, Mr. Dirks was Chief Operating Officer and a member of the Board of The Depository Trust & Clearing Corporation (DTCC). He also served as President, Chief Operating Officer, and Board member of The Depository Trust Company (DTC) and President and Board member of the National Securities Clearing Corporation (NSCC). In addition, Mr. Dirks served as Chief Executive Officer and Board member of the Government Securities Clearing Corporation, Chief Executive Officer and Board member of the Mortgage-Backed Securities Clearing Corporation, as a Trustee and a member of the Finance Committee of Manhattan College (2005-2008), and as a Trustee and a member of the Finance Committee of AHRC of Nassau County (2006-2008). Mr. Dirks is a member of the Independent Directors Council (IDC) Governing Council (2010-Present) and Board of Directors for The Brookville Center for Children's Services, Inc. (2009-present). |
Alan J. Lacy (57) |
| Year of Election or Appointment: 2008 Mr. Lacy serves as Senior Adviser (2007-present) of Oak Hill Capital Partners, L.P. (private equity). Mr. Lacy also served as Chief Executive Officer (2000-2005) and Vice Chairman (2005-2006) of Sears Holdings Corporation and Sears, Roebuck and Co. (retail). In addition, Mr. Lacy serves as a member of the Board of Directors of Dave & Buster's, Inc. (restaurant and entertainment complexes, 2010-present), The Hillman Companies, Inc. (hardware wholesalers, 2010-present), and Bristol-Myers Squibb Company (global pharmaceuticals, 2007-present). Mr. Lacy is a member of the Board of Trustees of The National Parks Conservation Association (2006-Present). Previously, Mr. Lacy served as Chairman of the Board of Trustees of the National Parks Conservation Association (2008-2011) and as a member of the Board of Directors for the Western Union Company (global money transfer, 2006-2011). |
Ned C. Lautenbach (67) |
| Year of Election or Appointment: 2000 Mr. Lautenbach is Chairman of the Independent Trustees of the Equity and High Income Funds (2006-present). Mr. Lautenbach currently serves as the Lead Director of the Eaton Corporation Board of Directors (diversified industrial, 1997-present). Mr. Lautenbach is also a member of the Board of Directors of the Philharmonic Center for the Arts in Naples, Florida (1999-present); a member of the Board of Trustees of Fairfield University (2005-present); and a member of the Council on Foreign Relations (1994-present). Previously, Mr. Lautenbach was a Partner/Advisory Partner at Clayton, Dubilier & Rice, LLC (private equity investment, 1998-2010), as well as a Director of Sony Corporation (2006-2007). |
Joseph Mauriello (66) |
| Year of Election or Appointment: 2008 Prior to his retirement in January 2006, Mr. Mauriello served in numerous senior management positions including Deputy Chairman and Chief Operating Officer (2004-2005), and Vice Chairman of Financial Services (2002-2004) of KPMG LLP US (professional services, 1965-2005). Mr. Mauriello currently serves as a member of the Board of Directors of XL Group plc. (global insurance and re-insurance, 2006-present) and of Arcadia Resources Inc. (health care services and products, 2007-present). Previously, Mr. Mauriello served as a Director of the Hamilton Funds of the Bank of New York (2006-2007). |
Robert W. Selander (60) |
| Year of Election or Appointment: 2011 Previously, Mr. Selander served as a Member of the Advisory Board of Fidelity's Equity and High Income Funds (2011), Executive Vice Chairman (2010), Chief Executive Officer (2009-2010), and President and Chief Executive Officer (1997-2009) of Mastercard, Inc. |
Cornelia M. Small (67) |
| Year of Election or Appointment: 2005 Ms. Small is a member of the Board of Directors of the Teagle Foundation (2009-present). Ms. Small is also a member of the Investment Committee, and Chair (2008-present) and a member of the Board of Trustees of Smith College. In addition, Ms. Small serves on the Investment Committee of the Berkshire Taconic Community Foundation (2008-present). Previously, Ms. Small served as Chairperson of the Investment Committee (2002-2008) of Smith College. In addition, Ms. Small served as Chief Investment Officer, Director of Global Equity Investments, and a member of the Board of Directors of Scudder, Stevens & Clark and Scudder Kemper Investments. |
William S. Stavropoulos (72) |
| Year of Election or Appointment: 2002 Mr. Stavropoulos is Vice Chairman of the Independent Trustees of the Equity and High Income Funds (2006-present). Mr. Stavropoulos serves as President and Founder of the Michigan Baseball Foundation, the Great Lakes Loons (2007-present). Mr. Stavropoulos is Chairman Emeritus of the Board of Directors of The Dow Chemical Company, where he previously served in numerous senior management positions, including President, CEO (1995-2000; 2002-2004), Chairman of the Executive Committee (2000-2006), and as a member of the Board of Directors (1990-2006). Currently, Mr. Stavropoulos is Chairman of Univar (global distributor of commodity and specialty chemicals, 2010-present), a Director of Teradata Corporation (data warehousing and technology solutions, 2008-present), Chemical Financial Corporation, Maersk Inc. (industrial conglomerate), Tyco International, Inc. (multinational manufacturing and services, 2007-present), and a member of the Advisory Board for Metalmark Capital (private equity investment, 2005-present). Mr. Stavropoulos is a special advisor to Clayton, Dubilier & Rice, LLC (private equity investment). In addition, Mr. Stavropoulos is a member of the University of Notre Dame Advisory Council for the College of Science. |
David M. Thomas (62) |
| Year of Election or Appointment: 2008 Previously, Mr. Thomas served as Executive Chairman (2005-2006) and Chairman and Chief Executive Officer (2000-2005) of IMS Health, Inc. (pharmaceutical and healthcare information solutions). In addition, Mr. Thomas serves as a member of the Board of Directors of Fortune Brands, Inc. (consumer products), and Interpublic Group of Companies, Inc. (marketing communication, 2004-present). |
Michael E. Wiley (60) |
| Year of Election or Appointment: 2008 Mr. Wiley also serves as a Director of Asia Pacific Exploration Consolidated (international oil and gas exploration and production, 2008-present). Mr. Wiley serves as a Director of Tesoro Corporation (independent oil refiner and marketer, 2005-present), and a Director of Bill Barrett Corporation (exploration and production, 2005-present). In addition, Mr. Wiley also serves as a Director of Post Oak Bank (privately-held bank, 2004-present). Previously, Mr. Wiley served as a member of the Board of Trustees of the University of Tulsa (2000-2006; 2007-2010), as a Senior Energy Advisor of Katzenbach Partners, LLC (consulting, 2006-2007), as an Advisory Director of Riverstone Holdings (private investment), Chairman, President, and CEO of Baker Hughes, Inc. (oilfield services, 2000-2004), and as Director of Spinnaker Exploration Company (exploration and production, 2001-2005). |
Annual Report
Trustees and Officers - continued
+ The information above includes each Trustee's principal occupation during the last five years and other information relating to the experience, attributes, and skills relevant to each Trustee's qualifications to serve as a Trustee, which led to the conclusion that each Trustee should serve as a Trustee for the fund.
Advisory Board Members and Executive Officers:
Correspondence intended for each executive officer, Edward C. Johnson 3d, and Peter S. Lynch may be sent to Fidelity Investments, 82 Devonshire Street, Boston, Massachusetts 02109.
Name, Age; Principal Occupation |
Edward C. Johnson 3d (81) |
| Year of Election or Appointment: 2011 Member of the Advisory Board of Fidelity's Equity and High Income Funds. Mr. Johnson serves as Chief Executive Officer, Chairman, and a Director of FMR LLC, and also serves as Chairman and Director of FIL Limited. Previously, Mr. Johnson served as a Trustee and Chairman of the Board of certain Fidelity Trusts, Chairman and a Director of FMR, Chairman and a Director of FMR Co., Inc., and President of FMR LLC (2006-2007). |
Peter S. Lynch (67) |
| Year of Election or Appointment: 2003 Member of the Advisory Board of Fidelity's Equity and High Income Funds. Mr. Lynch is Vice Chairman and a Director of FMR and FMR Co., Inc. In addition, Mr. Lynch serves as a Trustee of Boston College and as the Chairman of the Inner-City Scholarship Fund. Previously, Mr. Lynch served on the Special Olympics International Board of Directors (1997-2006). |
Kenneth B. Robins (41) |
| Year of Election or Appointment: 2008 President and Treasurer of Fidelity's Equity and High Income Funds. Mr. Robins also serves as President and Treasurer (2010-present) and Assistant Treasurer (2009-present) of other Fidelity funds and is an employee of Fidelity Investments (2004-present). Previously, Mr. Robins served as Deputy Treasurer of the Fidelity funds (2005-2008) and Treasurer and Chief Financial Officer of The North Carolina Capital Management Trust: Cash and Term Portfolios (2006-2008). |
Brian B. Hogan (46) |
| Year of Election or Appointment: 2009 Vice President of Equity and High Income Funds. Mr. Hogan also serves as President of FMR's Equity Division (2009-present). Previously, Mr. Hogan served as Senior Vice President, Equity Research of FMR (2006-2009) and as a portfolio manager. |
Thomas C. Hense (47) |
| Year of Election or Appointment: 2008 or 2010 Vice President of Fidelity's High Income (2008), Small Cap (2008), and Value (2010) Funds. Previously, Mr. Hense served as a portfolio manager for Fidelity's Institutional Money Management Group (Pyramis) (2003-2008). |
Scott C. Goebel (43) |
| Year of Election or Appointment: 2008 Secretary and Chief Legal Officer (CLO) of the Fidelity funds. Mr. Goebel also serves as Secretary of Fidelity Investments Money Management, Inc. (FIMM) (2010-present) and Fidelity Research and Analysis Company (FRAC) (2010-present); Secretary and CLO of The North Carolina Capital Management Trust: Cash and Term Portfolios (2008-present); General Counsel, Secretary, and Senior Vice President of FMR (2008-present) and FMR Co., Inc. (2008-present); employed by FMR LLC or an affiliate (2001-present); Chief Legal Officer of Fidelity Management & Research (Hong Kong) Limited (2008-present) and Assistant Secretary of Fidelity Management & Research (Japan) Inc. (2008-present), and Fidelity Management & Research (U.K.) Inc. (2008-present). Previously, Mr. Goebel served as Assistant Secretary of FIMM (2008-2010), FRAC (2008-2010), and the Funds (2007-2008) and as Vice President and Secretary of Fidelity Distributors Corporation (FDC) (2005-2007). |
William C. Coffey (42) |
| Year of Election or Appointment: 2009 Assistant Secretary of Fidelity's Equity and High Income Funds. Mr. Coffey also serves as Senior Vice President and Deputy General Counsel of FMR LLC (2010-present), and is an employee of Fidelity Investments. Previously, Mr. Coffey served as Vice President and Associate General Counsel of FMR LLC (2005-2009). |
Holly C. Laurent (57) |
| Year of Election or Appointment: 2008 Anti-Money Laundering (AML) Officer of the Fidelity funds. Ms. Laurent also serves as AML Officer of The North Carolina Capital Management Trust: Cash and Term Portfolios (2008-present) and is an employee of Fidelity Investments. Previously, Ms. Laurent was Senior Vice President and Head of Legal for Fidelity Business Services India Pvt. Ltd. (2006-2008), and Senior Vice President, Deputy General Counsel and Group Head for FMR LLC (2005-2006). |
Christine Reynolds (52) |
| Year of Election or Appointment: 2008 Chief Financial Officer of the Fidelity funds. Ms. Reynolds became President of Fidelity Pricing and Cash Management Services (FPCMS) in August 2008. Ms. Reynolds served as Chief Operating Officer of FPCMS (2007-2008). Previously, Ms. Reynolds served as President, Treasurer, and Anti-Money Laundering officer of the Fidelity funds (2004-2007). |
Kenneth A. Rathgeber (64) |
| Year of Election or Appointment: 2004 Chief Compliance Officer of Fidelity's Equity and High Income Funds. Mr. Rathgeber is Chief Compliance Officer of Fidelity Management & Research (Hong Kong) Limited (2008-present), Fidelity Management & Research (Japan) Inc. (2008-present), FMR (2005-present), FMR Co., Inc. (2005-present), Fidelity Management & Research (U.K.) Inc. (2005-present), Fidelity Research & Analysis Company (2005-present), Fidelity Investments Money Management, Inc. (2005-present), Pyramis Global Advisors, LLC (2005-present), and Strategic Advisers, Inc. (2005-present). |
Jeffrey S. Christian (49) |
| Year of Election or Appointment: 2009 Deputy Treasurer of the Fidelity funds. Mr. Christian is an employee of Fidelity Investments. Previously, Mr. Christian served as Chief Financial Officer (2008-2009) of certain Fidelity funds and Senior Vice President of Fidelity Pricing and Cash Management Services (FPCMS) (2004-2009). |
Bryan A. Mehrmann (50) |
| Year of Election or Appointment: 2005 Deputy Treasurer of the Fidelity funds. Mr. Mehrmann is an employee of Fidelity Investments. |
Adrien E. Deberghes (43) |
| Year of Election or Appointment: 2008 Deputy Treasurer of Fidelity's Equity and High Income Funds. Mr. Deberghes also serves as Assistant Treasurer of other Fidelity funds (2010-present) and is an employee of Fidelity Investments (2008-present). Previously, Mr. Deberghes served as Senior Vice President of Mutual Fund Administration at State Street Corporation (2007-2008), Senior Director of Mutual Fund Administration at Investors Bank & Trust (2005-2007), and Director of Finance for Dunkin' Brands (2000-2005). |
Stephanie J. Dorsey (42) |
| Year of Election or Appointment: 2010 Assistant Treasurer of Fidelity's Equity and High Income Funds. Ms. Dorsey also serves as Deputy Treasurer of other Fidelity funds (2008-present) and is an employee of Fidelity Investments (2008-present). Previously, Ms. Dorsey served as Treasurer (2004-2008) of the JPMorgan Mutual Funds and Vice President (2004-2008) of JPMorgan Chase Bank. |
John R. Hebble (53) |
| Year of Election or Appointment: 2009 Assistant Treasurer of Fidelity's Equity and High Income Funds. Mr. Hebble also serves as President (2011-present), Treasurer, and Chief Financial Officer of The North Carolina Capital Management Trust: Cash and Term Portfolios (2008-present), President and Treasurer of other Fidelity funds (2008-present) and is an employee of Fidelity Investments. |
Gary W. Ryan (52) |
| Year of Election or Appointment: 2005 Assistant Treasurer of the Fidelity funds. Mr. Ryan is an employee of Fidelity Investments. Previously, Mr. Ryan served as Vice President of Fund Reporting in Fidelity Pricing and Cash Management Services (FPCMS) (1999-2005). |
Jonathan Davis (43) |
| Year of Election or Appointment: 2010 Assistant Treasurer of the Fidelity funds. Mr. Davis is an employee of Fidelity Investments. Previously, Mr. Davis served as Vice President and Associate General Counsel of FMR LLC (2003-2010). |
Annual Report
The Board of Trustees of Fidelity Small Cap Growth Fund voted to pay on September 12, 2011, to shareholders of record at the opening of business on September 9, 2011, a distribution of $0.234 per share derived from capital gains realized from sales of portfolio securities.
The Retail Class designates 100% of the dividends distributed during the fiscal year as qualifying for the dividends-received deduction for corporate shareholders.
The Retail Class designates 100% of the dividends distributed during the fiscal year as amounts which may be taken into account as a dividend for purposes of the maximum rate under section 1(h)(11) of the Internal Revenue Code.
The fund hereby designates as a capital gain dividend with respect to the taxable year ended July 31, 2011, $28,512,528, or, if subsequently determined to be different, the net capital gain of such year.
The fund will notify shareholders in January 2012 of amounts for use in preparing 2011 income tax returns.
Annual Report
Board Approval of Investment Advisory Contracts and Management Fees
Fidelity Small Cap Growth Fund
Each year, the Board of Trustees, including the Independent Trustees (together, the Board), votes on the renewal of the management contract and sub-advisory agreements (together, the Advisory Contracts) for the fund. The Board, assisted by the advice of fund counsel and Independent Trustees' counsel, requests and considers a broad range of information relevant to the renewal of the Advisory Contracts throughout the year.
The Board meets regularly and considers at each of its meetings factors that are relevant to its annual consideration of the renewal of the fund's Advisory Contracts, including the services and support provided to the fund and its shareholders. The Board has established various standing committees, each composed of Independent Trustees with varying backgrounds, to which the Board has assigned specific subject matter responsibilities in order to enhance effective decision-making by the Board. The Board, acting directly and through its Committees, requests and receives information concerning the annual consideration of the renewal of the fund's Advisory Contracts. The Board also meets as needed to consider matters specifically related to the Board's annual consideration of the renewal of Advisory Contracts. Members of the Board may also meet with trustees of other Fidelity funds through ad hoc joint committees to discuss certain matters relevant to the Fidelity funds.
At its July 2011 meeting, the Board of Trustees, including the Independent Trustees, unanimously determined to renew the fund's Advisory Contracts. In reaching its determination, the Board considered all factors it believed relevant, including (i) the nature, extent, and quality of the services to be provided to the fund and its shareholders (including the investment performance of the fund); (ii) the competitiveness of the fund's management fee and total expense ratio; (iii) the total costs of the services to be provided by and the profits to be realized by Fidelity from its relationship with the fund; (iv) the extent to which economies of scale would be realized as the fund grows; and (v) whether fee levels reflect these economies of scale, if any, for the benefit of fund shareholders.
In considering whether to renew the Advisory Contracts for the fund, the Board reached a determination, with the assistance of fund counsel and Independent Trustees' counsel and through the exercise of its business judgment, that the renewal of the Advisory Contracts is in the best interests of the fund and its shareholders and that the compensation payable under the Advisory Contracts is fair and reasonable. The Board's decision to renew the Advisory Contracts was not based on any single factor, but rather was based on a comprehensive consideration of all the information provided to the Board at its meetings throughout the year. The Board, in reaching its determination to renew the Advisory Contracts, is aware that shareholders in the fund have a broad range of investment choices available to them, including a wide choice among mutual funds offered by Fidelity's competitors, and that the fund's shareholders, who have the opportunity to review and weigh the disclosure provided by the fund in its prospectus and other public disclosures, have chosen to invest in this fund, managed by Fidelity.
Annual Report
Board Approval of Investment Advisory Contracts and
Management Fees - continued
Nature, Extent, and Quality of Services Provided. The Board considered the staffing within the investment adviser, FMR, and the sub-advisers (together, the Investment Advisers), including the backgrounds of the fund's investment personnel and the fund's investment objective and discipline. The Independent Trustees also had discussions with senior management of Fidelity's investment operations and investment groups. The Board considered the structure of the portfolio manager compensation program and whether this structure provides appropriate incentives to act in the best interests of the fund.
Resources Dedicated to Investment Management and Support Services. The Board and the Fund Oversight and Research Committees reviewed the general qualifications and capabilities of the Investment Advisers' investment staff, including its size, education, experience, and resources, as well as the Investment Advisers' approach to recruiting, training, managing, and compensating investment personnel. The Board also noted that FMR has devoted increased resources to non-U.S. offices. The Board noted that Fidelity's analysts have extensive resources, tools and capabilities which allow them to conduct sophisticated quantitative and fundamental analysis, as well as credit analysis of issuers, counterparties and enhancers. The Board also believes that Fidelity's investment professionals have sufficient access to global information and data so as to provide competitive investment results over time, and that those professionals also have access to sophisticated tools which permit them to assess portfolio construction and risk and performance attribution characteristics continuously, as well as to transmit new information and research conclusions rapidly around the world. Additionally, in their deliberations, the Board considered the Investment Advisers' trading capabilities and resources which are an integral part of the investment management process.
Shareholder and Administrative Services. The Board considered (i) the nature, extent, quality, and cost of advisory, administrative, and shareholder services performed by the Investment Advisers and their affiliates under the Advisory Contracts and under separate agreements covering transfer agency, pricing and bookkeeping, and securities lending services for the fund; (ii) the nature and extent of the investment adviser's supervision of third party service providers, principally custodians and subcustodians; and (iii) the resources devoted to, and the record of compliance with, the fund's compliance policies and procedures. The Board also reviewed the allocation of fund brokerage, including allocations to brokers affiliated with the Investment Advisers, the use of brokerage commissions to pay fund expenses, and the use of "soft" commission dollars to pay for research services.
The Board noted that the growth of fund assets over time across the complex allows Fidelity to reinvest in the development of services designed to enhance the value or convenience of the Fidelity funds as investment vehicles. These services include 24-hour access to account information and market information through telephone representatives and over the Internet, investor education materials and asset allocation tools, and the expanded availability of Fidelity Investor Centers, with 35 new branches opening since 2010.
Annual Report
Investment in a Large Fund Family. The Board considered the benefits to shareholders of investing in a Fidelity fund, including the benefits of investing in a fund that is part of a large family of funds offering a variety of investment disciplines and providing a large variety of mutual fund investor services. The Board noted that Fidelity had taken, or had made recommendations that resulted in the Fidelity funds taking, a number of actions over the previous year that benefited particular funds, including (i) continuing to dedicate additional resources to investment research and support of the senior management team that oversees asset management; (ii) rationalizing product lines through the mergers of six funds into other funds; (iii) continuing to migrate the Freedom Funds to dedicated lower cost underlying funds; (iv) obtaining shareholder approval to broaden the investment strategies for Fidelity Consumer Finance Portfolio, Fidelity Emerging Asia Fund, and Fidelity Environment and Alternative Energy Portfolio; (v) contractually agreeing to reduce the management fees and impose other expense limitations on Spartan® 500 Index Fund and U.S. Bond Index Fund in connection with launching new institutional classes of these funds; (vi) changing the name, primary and supplemental benchmarks, and investment policies of Fidelity Global Strategies Fund to support the fund's flexible investment mandate and global orientation; and (vii) reducing the transfer agency account fee rates on certain accounts.
Investment Performance. The Board considered whether the fund has operated in accordance with its investment objective, as well as its record of compliance with its investment restrictions. It also reviewed the fund's absolute investment performance for each class, as well as the fund's relative investment performance for each class measured over multiple periods against (i) a broad-based securities market index, and (ii) a peer group of mutual funds deemed appropriate by Fidelity and reviewed by the Board. The following charts considered by the Board show, over the one-, three-, and five-year periods ended December 31, 2010, the cumulative total returns of Institutional Class (Class I) and Class B of the fund, the cumulative total returns of a broad-based securities market index ("benchmark"), and a range of cumulative total returns of a peer group of mutual funds identified by Morningstar, Inc. as having an investment style similar to that of the fund based on underlying portfolio holdings. The returns of Institutional Class (Class I) and Class B show the performance of the highest and lowest performing classes, respectively (based on five-year performance). The box within each chart shows the 25th percentile return (bottom of box) and the 75th percentile return (top of box) of the peer group. Returns shown above the box are in the first quartile and returns shown below the box are in the fourth quartile. The percentage beaten numbers noted below each chart correspond to the percentile box and represent the percentage of funds in the peer group whose performance was equal to or lower than that of the class indicated.
Annual Report
Board Approval of Investment Advisory Contracts and
Management Fees - continued
Fidelity Small Cap Growth Fund
The Board reviewed the fund's relative investment performance against its peer group and noted that the performance of Institutional Class (Class I) of the fund was in the third quartile for the one- and three-year periods and the second quartile for the five-year period. The Board also noted that the investment performance of the fund was lower than its benchmark for the one- and three-year periods, although the five-year cumulative total return of Institutional Class (Class I) compared favorably to its benchmark. The Board considered that the variations in performance among the fund's classes reflect the variations in class expenses, which result in lower performance for higher expense classes. The Board discussed with FMR actions that have been taken by FMR to improve the fund's disappointing performance relative to its peer group and benchmark. The Board also reviewed the fund's performance since inception as well as performance in the current year. The Board will continue to closely monitor the performance of the fund in the coming year and discuss with FMR other appropriate actions to address the performance of the fund.
The Board also considered that the fund's management fee is subject to upward or downward adjustment depending upon whether, and to what extent, the fund's investment performance for the performance period exceeds, or is exceeded by, the record (over the same period) of a Board-approved performance adjustment index. The Board noted that the performance adjustment provides FMR with a strong economic incentive to seek to achieve superior performance for the fund's shareholders and helps to more closely align the interests of FMR and the fund's shareholders.
Annual Report
Based on its review, the Board concluded that the nature, extent, and quality of services provided to the fund under the Advisory Contracts should benefit the fund's shareholders.
Competitiveness of Management Fee and Total Expense Ratio. The Board considered the fund's management fee and total expense ratio compared to "mapped groups" of competitive funds and classes. Fidelity creates "mapped groups" by combining similar Lipper investment objective categories that have comparable management fee characteristics. Combining Lipper investment objective categories aids the Board's management fee and total expense ratio comparisons by broadening the competitive group used for comparison and by reducing the number of universes to which various Fidelity funds are compared.
Management Fee. The Board considered two proprietary management fee comparisons for the 12-month periods shown in the chart below. The group of Lipper funds used by the Board for management fee comparisons is referred to below as the "Total Mapped Group." The Total Mapped Group comparison focuses on a fund's standing relative to the total universe of comparable funds available to investors in terms of gross management fees before expense reimbursements or caps, and without giving effect to the fund's performance adjustment. "TMG %" represents the percentage of funds in the Total Mapped Group that had management fees that were lower than the fund's. For example, a TMG % of 14% means that 86% of the funds in the Total Mapped Group had higher management fees than the fund. The "Asset-Size Peer Group" (ASPG) comparison focuses on a fund's standing relative to non-Fidelity funds similar in size to the fund within the Total Mapped Group. The ASPG represents at least 15% of the funds in the Total Mapped Group with comparable asset size and management fee characteristics, subject to a minimum of 50 funds (or all funds in the Total Mapped Group if fewer than 50). Additional information, such as the ASPG quartile in which the fund's management fee ranked and the impact of the fund's performance adjustment, is also included in the chart and considered by the Board.
Annual Report
Board Approval of Investment Advisory Contracts and
Management Fees - continued
Fidelity Small Cap Growth Fund
The Board noted that the fund's management fee ranked below the median of its Total Mapped Group and below the median of its ASPG for 2010. The Board also noted the effect of the fund's negative performance adjustment on the fund's management fee ranking. The Board noted that the performance adjustment for each year represents calculations for performance periods that differ from the periods shown in the performance charts above.
Based on its review, the Board concluded that the fund's management fee is fair and reasonable in light of the services that the fund receives and the other factors considered.
Total Expense Ratio. In its review of each class's total expense ratio, the Board considered the fund's management fee as well as other fund or class expenses, as applicable, such as transfer agent fees, pricing and bookkeeping fees, fund-paid 12b-1 fees, and custodial, legal, and audit fees. The Board also noted the effects of any waivers and reimbursements on fees and expenses, as well as the impact of the fund's performance adjustment. As part of its review, the Board also considered the current and historical total expense ratios of each class of the fund compared to competitive fund median expenses. Each class of the fund is compared to those funds and classes in the Total Mapped Group (used by the Board for management fee comparisons) that have a similar sales load structure.
The Board noted that the total expense ratio of each of Class A, Class B, Class C, Institutional Class, the retail class, and Class F ranked below its competitive median for 2010 and the total expense ratio of Class T ranked above its competitive median for 2010. The Board considered that various factors, including 12b-1 fees, positive or negative performance adjustments, and relatively higher other expenses in the case of small fund size, can affect total expense ratios. The Board noted that the total expense ratio of Class T was above the competitive median primarily because of higher 12b-1 fees on Class T. Class T has a higher 12b-1 fee, but a lower front-end sales charge, than traditionally priced front-end sales charge classes. The Board noted that the fund offers multiple classes, each of which has a different sales load and 12b-1 fee structure, and that the multiple structures are intended to offer a range of pricing options for the intermediary market. The Board also noted that the total expense ratios of the classes vary primarily by the level of their 12b-1 fees, although differences in transfer agent fees may also cause expenses to vary from class to class.
Annual Report
Fees Charged to Other Fidelity Clients. The Board also considered Fidelity fee structures and other information with respect to clients of FMR and its affiliates, such as other mutual funds advised or subadvised by FMR or its affiliates, pension plan clients, and other institutional clients. In March 2010, the Board created an ad hoc joint committee with the board of other Fidelity funds (the Committee) to review and compare Fidelity's institutional investment advisory business with its business of providing services to the Fidelity funds, including the differences in services provided, fees charged, and costs incurred, as well as competition in their respective marketplaces.
Based on its review of total expense ratios and fees charged to other Fidelity clients, the Board concluded that the total expense ratio of each class of the fund was reasonable, although Class T was above the median of the universe presented for comparison, in light of the services that the fund and its shareholders receive and the other factors considered, including the findings of the Committee.
Costs of the Services and Profitability. The Board considered the revenues earned and the expenses incurred by Fidelity in conducting the business of developing, marketing, distributing, managing, administering and servicing the fund and its shareholders. The Board also considered the level of Fidelity's profits in respect of all the Fidelity funds.
On an annual basis, FMR presents to the Board Fidelity's profitability for the fund. Fidelity calculates the profitability for each fund, as well as aggregate profitability for groups of Fidelity funds and all Fidelity funds, using a series of detailed revenue and cost allocation methodologies which originate with the books and records of Fidelity on which Fidelity's audited financial statements are based. The Audit Committee of the Board reviews any significant changes from the prior year's methodologies.
PricewaterhouseCoopers LLP (PwC), independent registered public accounting firm and auditor to Fidelity and certain Fidelity funds, has been engaged annually by the Board as part of the Board's assessment of Fidelity's profitability analysis. PwC's engagement includes the review and assessment of Fidelity's methodologies used in determining the revenues and expenses attributable to Fidelity's mutual fund business, and completion of agreed-upon procedures surrounding the mathematical accuracy of fund profitability and its conformity to allocation methodologies. After considering PwC's reports issued under the engagement and information provided by Fidelity, the Board concluded that while other allocation methods may also be reasonable, Fidelity's profitability methodologies are reasonable in all material respects.
Annual Report
Board Approval of Investment Advisory Contracts and
Management Fees - continued
The Board also reviewed Fidelity's non-fund businesses and fall-out benefits related to the mutual fund business as well as cases where Fidelity's affiliates may benefit from or be related to the fund's business.
The Board considered the costs of the services provided by and the profits realized by Fidelity in connection with the operation of the fund and was satisfied that the profitability was not excessive in the circumstances.
Economies of Scale. The Board considered whether there have been economies of scale in respect of the management of the Fidelity funds, whether the Fidelity funds (including the fund) have appropriately benefited from any such economies of scale, and whether there is potential for realization of any further economies of scale. The Board considered the extent to which the fund will benefit from economies of scale through increased services to the fund, through waivers or reimbursements, or through fee or expense reductions. The Board also noted that in 2009, it and the board of other Fidelity funds created an ad hoc committee (the Economies of Scale Committee) to analyze whether FMR attains economies of scale in respect of the management and servicing of the Fidelity funds, whether the Fidelity funds have appropriately benefited from such economies of scale, and whether there is potential for realization of any further economies of scale.
The Board recognized that the fund's management contract incorporates a "group fee" structure, which provides for lower group fee rates as total fund assets under FMR's management increase, and for higher group fee rates as total fund assets under FMR's management decrease. FMR calculates the group fee rates based on a tiered asset "breakpoint" schedule that varies based on asset class. The Board considered that the group fee is designed to deliver the benefits of economies of scale to fund shareholders when total Fidelity fund assets increase, even if assets of any particular fund are unchanged or have declined, because some portion of Fidelity's costs are attributable to services provided to all Fidelity funds, and all funds benefit if those costs can be allocated among more assets. The Board concluded that, given the group fee structure, fund shareholders will benefit from lower management fees as assets under FMR's management increase at the fund complex level, regardless of whether Fidelity achieves any such economies of scale.
Annual Report
The Board concluded, taking into account the analysis of the Economies of Scale Committee, that any potential economies of scale are being appropriately shared between fund shareholders and Fidelity.
Additional Information Requested by the Board. In order to develop fully the factual basis for consideration of the Fidelity funds' Advisory Contracts, the Board requested and received additional information on certain topics, including (i) fund performance trends, actions to be taken by FMR to improve certain funds' overall performance, and Fidelity's long-term strategies for certain funds; (ii) portfolio manager changes that have occurred during the past year and length of portfolio manager tenure for different categories of funds over time; (iii) Fidelity's compensation structure for portfolio managers and other key personnel and strategies for attracting and retaining non-investment personnel; (iv) the amount of the investment that each portfolio manager has made in the Fidelity fund(s) that he or she manages; (v) historical trends in Fidelity's realization of fall-out benefits; (vi) Fidelity's group fee structures and the rationale for the individual fee rates of certain funds; (vii) fund profitability methodology and the impact of certain factors on fund profitability results; (viii) trends regarding industry use of performance fee structures and Fidelity's compliance practices with respect to performance adjustment calculations; (ix) the fee structures in place for certain other Fidelity clients; and (x) explanations regarding the relative total expense ratios of certain funds and classes, total expense competitive trends, and actions that might be taken by FMR to reduce total expense ratios for certain funds and classes.
Based on its evaluation of all of the conclusions noted above, and after considering all factors it believed relevant, the Board ultimately concluded that the advisory fee structures are fair and reasonable, and that the fund's Advisory Contracts should be renewed.
Annual Report
Managing Your Investments
Fidelity offers several ways to conveniently manage your personal investments via your telephone or PC. You can access your account information, conduct trades and research your investments 24 hours a day.
By Phone
Fidelity Automated Service Telephone provides a single toll-free number to access account balances, positions, quotes and trading. It's easy to navigate the service, and on your first call, the system will help you create a personal identification number (PIN) for security.
(phone_graphic)
Fidelity Automated
Service Telephone (FAST®)
1-800-544-5555
Press
For mutual fund and brokerage trading.
For quotes.*
For account balances and holdings.
To review orders and mutual
fund activity.
To change your PIN.
To speak to a Fidelity representative.
By PC
Fidelity's web site on the Internet provides a wide range of information, including daily financial news, fund performance, interactive planning tools and news about Fidelity products and services.
(computer_graphic)
Fidelity's Web Site
www.fidelity.com
* When you call the quotes line, please remember that a fund's yield and return will vary and, except for money market funds, share price will also vary. This means that you may have a gain or loss when you sell your shares. There is no assurance that money market funds will be able to maintain a stable $1 share price; an investment in a money market fund is not insured or guaranteed by the U.S. government. Total returns are historical and include changes in share price, reinvestment of dividends and capital gains distributions, and the effects of any sales charges.
Annual Report
To Visit Fidelity
For directions and hours,
please call 1-800-544-9797.
Arizona
7001 West Ray Road
Chandler, AZ
15445 N. Scottsdale Road
Scottsdale, AZ
17550 North 75th Avenue
Glendale, AZ
5330 E. Broadway Blvd
Tucson, AZ
California
815 East Birch Street
Brea, CA
1411 Chapin Avenue
Burlingame, CA
851 East Hamilton Avenue
Campbell, CA
601 Larkspur Landing Circle
Larkspur, CA
2000 Avenue of the Stars
Los Angeles, CA
27101 Puerta Real
Mission Viejo, CA
73575 El Paseo
Palm Desert, CA
251 University Avenue
Palo Alto, CA
123 South Lake Avenue
Pasadena, CA
16656 Bernardo Ctr. Drive
Rancho Bernardo, CA
1220 Roseville Parkway
Roseville, CA
1740 Arden Way
Sacramento, CA
7676 Hazard Center Drive
San Diego, CA
11943 El Camino Real
San Diego, CA
8 Montgomery Street
San Francisco, CA
3793 State Street
Santa Barbara, CA
1200 Wilshire Boulevard
Santa Monica, CA
398 West El Camino Real
Sunnyvale, CA
111 South Westlake Blvd
Thousand Oaks, CA
21701 Hawthorne Boulevard
Torrance, CA
2001 North Main Street
Walnut Creek, CA
6326 Canoga Avenue
Woodland Hills, CA
2211 Michelson Drive
Irvine, CA
Colorado
281 East Flatiron Circle
Broomfield, CO
1625 Broadway
Denver, CO
9185 Westview Road
Lone Tree, CO
Connecticut
48 West Putnam Avenue
Greenwich, CT
265 Church Street
New Haven, CT
300 Atlantic Street
Stamford, CT
29 South Main Street
West Hartford, CT
1261 Post Road
Fairfield, CT
Delaware
400 Delaware Avenue
Wilmington, DE
Florida
175 East Altamonte Drive
Altamonte Springs, FL
1400 Glades Road
Boca Raton, FL
121 Alhambra Plaza
Coral Gables, FL
2948 N. Federal Highway
Ft. Lauderdale, FL
4671 Town Center Parkway
Jacksonville, FL
8880 Tamiami Trail, North
Naples, FL
230 Royal Palm Way
Palm Beach, FL
3501 PGA Boulevard
Palm Beach Gardens, FL
3550 Tamiami Trail, South
Sarasota, FL
1502 N. Westshore Blvd.
Tampa, FL
2465 State Road 7
Wellington, FL
Georgia
3242 Peachtree Road
Atlanta, GA
1000 Abernathy Road
Atlanta, GA
Illinois
One North LaSalle Street
Chicago, IL
401 North Michigan Avenue
Chicago, IL
One Skokie Valley Road
Highland Park, IL
1415 West 22nd Street
Oak Brook, IL
15105 S LaGrange Road
Orland Park, IL
1572 East Golf Road
Schaumburg, IL
1823 Freedom Drive
Naperville, IL
Indiana
8480 Keystone Crossing
Indianapolis, IN
Kansas
5400 College Boulevard
Overland Park, KS
Maine
Three Canal Plaza
Portland, ME
Maryland
7315 Wisconsin Avenue
Bethesda, MD
610 York Road
Towson, MD
Massachusetts
801 Boylston Street
Boston, MA
155 Congress Street
Boston, MA
300 Granite Street
Braintree, MA
44 Mall Road
Burlington, MA
238 Main Street
Cambridge, MA
200 Endicott Street
Danvers, MA
Annual Report
405 Cochituate Road
Framingham, MA
551 Boston Turnpike
Shrewsbury, MA
Michigan
500 E. Eisenhower Pkwy.
Ann Arbor, MI
280 N. Old Woodward Ave.
Birmingham, MI
30200 Northwestern Hwy.
Farmington Hills, MI
43420 Grand River Avenue
Novi, MI
3480 28th Street
Grand Rapids, MI
2425 S. Linden Road STE E
Flint, MI
Minnesota
7740 France Avenue South
Edina, MN
8342 3rd Street North
Oakdale, MN
Missouri
1524 South Lindbergh Blvd.
St. Louis, MO
Nevada
2225 Village Walk Drive
Henderson, NV
New Jersey
501 Route 73 South
Marlton, NJ
150 Essex Street
Millburn, NJ
35 Morris Street
Morristown, NJ
396 Route 17, North
Paramus, NJ
3518 Route 1 North
Princeton, NJ
530 Broad Street
Shrewsbury, NJ
New Mexico
2261 Q Street NE
Albuquerque, NM
New York
1130 Franklin Avenue
Garden City, NY
37 West Jericho Turnpike
Huntington Station, NY
1271 Avenue of the Americas
New York, NY
980 Madison Avenue
New York, NY
61 Broadway
New York, NY
350 Park Avenue
New York, NY
200 Fifth Avenue
New York, NY
733 Third Avenue
New York, NY
2070 Broadway
New York, NY
1075 Northern Blvd.
Roslyn, NY
799 Central Park Avenue
Scarsdale, NY
3349 Monroe Avenue
Rochester, NY
North Carolina
4611 Sharon Road
Charlotte, NC
7011 Fayetteville Road
Durham, NC
Ohio
3805 Edwards Road
Cincinnati, OH
1324 Polaris Parkway
Columbus, OH
1800 Crocker Road
Westlake, OH
28699 Chagrin Boulevard
Woodmere Village, OH
Oregon
7493 SW Bridgeport Road
Tigard, OR
Pennsylvania
600 West DeKalb Pike
King of Prussia, PA
1735 Market Street
Philadelphia, PA
12001 Perry Highway
Wexford, PA
Rhode Island
10 Memorial Boulevard
Providence, RI
Tennessee
3018 Peoples Street
Johnson City, TN
7628 West Farmington Blvd.
Germantown, TN
2035 Mallory Lane
Franklin, TN
Texas
10000 Research Boulevard
Austin, TX
4001 Northwest Parkway
Dallas, TX
12532 Memorial Drive
Houston, TX
2701 Drexel Drive
Houston, TX
6560 Fannin Street
Houston, TX
1701 Lake Robbins Drive
The Woodlands, TX
6500 N. MacArthur Blvd.
Irving, TX
6005 West Park Boulevard
Plano, TX
1576 East Southlake Blvd.
Southlake, TX
15600 Southwest Freeway
Sugar Land, TX
139 N. Loop 1604 East
San Antonio, TX
Utah
279 West South Temple
Salt Lake City, UT
Virginia
1861 International Drive
McLean, VA
11957 Democracy Drive
Reston, VA
Washington
10500 NE 8th Street
Bellevue, WA
1518 6th Avenue
Seattle, WA
304 Strander Blvd
Tukwila, WA
Washington, DC
1900 K Street, N.W.
Washington, DC
Wisconsin
16020 West Bluemound Road
Brookfield, WI
Fidelity Brokerage Services, Inc., 100 Summer St., Boston, MA 02110 Member NYSE/SIPC
Annual Report
Investment Adviser
Fidelity Management & Research Company
Boston, MA
Investment Sub-Advisers
FMR Co., Inc.
Fidelity Management & Research
(U.K.) Inc.
Fidelity Management & Research
(Hong Kong) Limited
Fidelity Management & Research
(Japan) Inc.
General Distributor
Fidelity Distributors Corporation
Boston, MA
Transfer and Service Agents
Fidelity Investments Institutional
Operating Company, Inc.
Boston, MA
Fidelity Service Company, Inc.
Boston, MA
Custodian
Citibank, N.A.
New York, NY
The Fidelity Telephone Connection
Mutual Fund 24-Hour Service
Exchanges/Redemptions
and Account Assistance 1-800-544-6666
Product Information 1-800-544-6666
Retirement Accounts 1-800-544-4774
(8 a.m. - 9 p.m.)
TDD Service 1-800-544-0118
for the deaf and hearing impaired
(9 a.m. - 9 p.m. Eastern time)
Fidelity Automated Service
Telephone (FAST®) 1-800-544-5555
Automated line for quickest service
SCP-UANN-0911
1.803694.106
Fidelity®
Small Cap Growth
Fund
Class F
Annual Report
July 31, 2011
(2_fidelity_logos) (Registered_Trademark)
Contents
Performance | <Click Here> | How the fund has done over time. |
Management's Discussion of Fund Performance | <Click Here> | The Portfolio Manager's review of fundperformance and strategy. |
Shareholder Expense Example | <Click Here> | An example of shareholder expenses. |
Investment Changes | <Click Here> | A summary of major shifts in the fund's investments over the past six months. |
Investments | <Click Here> | A complete list of the fund's investments with their market values. |
Financial Statements | <Click Here> | Statements of assets and liabilities, operations, and changes in net assets,
as well as financial highlights. |
Notes | <Click Here> | Notes to the financial statements. |
Report of Independent Registered Public Accounting Firm | <Click Here> | |
Trustees and Officers | <Click Here> | |
Distributions | <Click Here> | |
Board Approval of Investment Advisory Contracts and Management Fees | <Click Here> | |
To view a fund's proxy voting guidelines and proxy voting record for the 12-month period ended June 30, visit http://www.fidelity.com/proxyvotingresults or visit the Securities and Exchange Commission's (SEC) web site at http://www.sec.gov. You may also call 1-800-835-5092 to request a free copy of the proxy voting guidelines.
Standard & Poor's, S&P and S&P 500 are registered service marks of The McGraw-Hill Companies, Inc. and have been licensed for use by Fidelity Distributors Corporation.
Other third party marks appearing herein are the property of their respective owners.
All other marks appearing herein are registered or unregistered trademarks or service marks of FMR LLC or an affiliated company.
Annual Report
p20
This report and the financial statements contained herein are submitted for the general information of the shareholders of the fund. This report is not authorized for distribution to prospective investors in the fund unless preceded or accompanied by an effective prospectus.
A fund files its complete schedule of portfolio holdings with the SEC for the first and third quarters of each fiscal year on Form N-Q. Forms N-Q are available on the SEC's web site at http://www.sec.gov. A fund's Forms N-Q may be reviewed and copied at the SEC's Public Reference Room in Washington, DC. Information regarding the operation of the SEC's Public Reference Room may be obtained by calling 1-800-SEC-0330. For a complete list of a fund's portfolio holdings, view the fund's most recent holdings listing, semiannual report, or annual report on Fidelity's web site at http://www.fidelity.com, http://www.advisor.fidelity.com, or http://www.401k.com, as applicable.
NOT FDIC INSURED • MAY LOSE VALUE • NO BANK GUARANTEE
Neither the fund nor Fidelity Distributors Corporation is a bank.
Annual Report
Average annual total return reflects the change in the value of an investment, assuming reinvestment of the class' distributions from dividend income and capital gains (the profits earned upon the sale of securities that have grown in value, if any) and assuming a constant rate of performance each year. The $10,000 table and the fund's returns do not reflect the deduction of taxes that a shareholder would pay on fund distributions or the redemption of fund shares. During periods of reimbursement by Fidelity, a fund's total return will be greater than it would be had the reimbursement not occurred. How a fund did yesterday is no guarantee of how it will do tomorrow.
Average Annual Total Returns
Periods ended July 31, 2011 | | Past 1
year | Past 5
years | Life of
fund A |
Class F B | | 30.56% | 6.93% | 9.41% |
A From November 3, 2004.
B The initial offering of Class F shares took place on June 26, 2009. Returns prior to June 26, 2009 are those of Fidelity® Small Cap Growth Fund, the original class of the fund.
$10,000 Over Life of Fund
Let's say hypothetically that $10,000 was invested in Fidelity® Small Cap Growth Fund - Class F on November 3, 2004, when the fund started. The chart shows how the value of your investment would have changed, and also shows how the Russell 2000® Growth Index performed over the same period. The initial offering of Class F took place on June 26, 2009. See above for additional information regarding the performance of Class F.
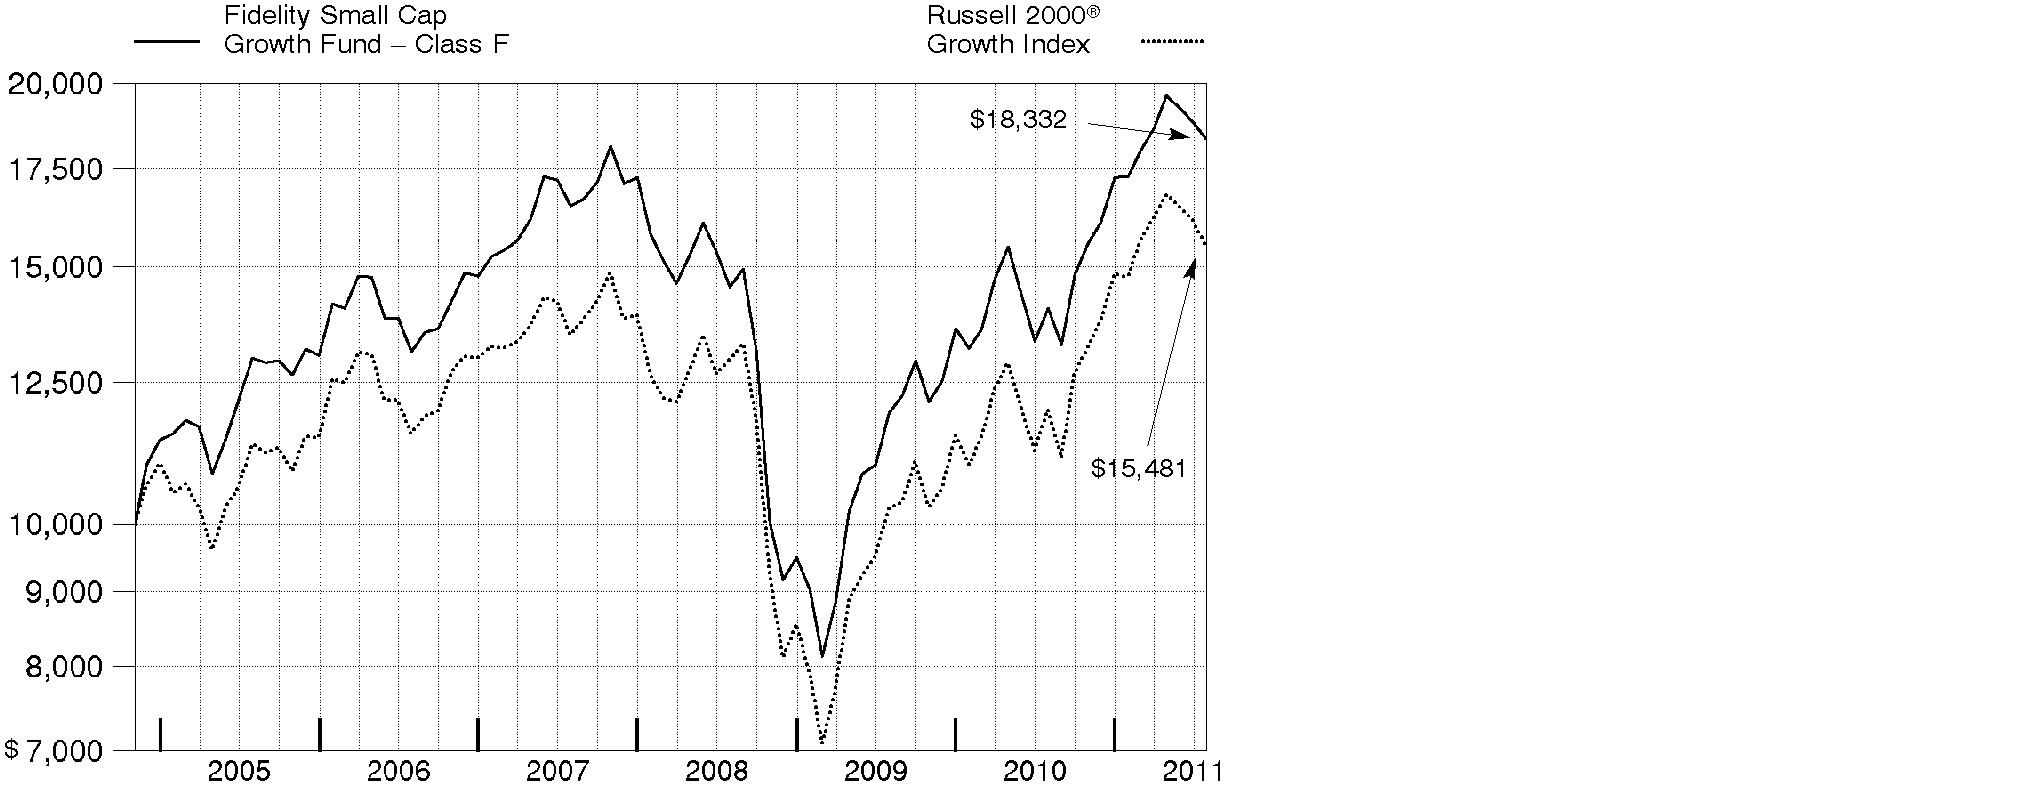
Annual Report
Market Recap: U.S. stocks registered solid double-digit gains for the 12 months ending July 31, 2011, extending a rally that began more than two years earlier. Despite a rough start in August 2010, markets turned positive in September, as increased demand for capital goods and other upbeat indicators trumped investor worry about a U.S. recessionary relapse. The broad market, as measured by the S&P 500® Index, rose 9% that month, its biggest September gain in 71 years. Seven more monthly advances followed, fueled by encouraging corporate earnings and economic activity. However, volatility picked up in the period's latter months, as markets reacted to continued high U.S. unemployment, nagging debt troubles in Europe and looming legislative battles over the federal debt ceiling. May unemployment rose above 9% for the first time in 2011, contributing to a traditional "June swoon" for stocks. Market uncertainty lingered in July, when the S&P 500® posted its second-biggest monthly loss of the period. For the full year, the S&P 500® climbed 19.65%, while the blue-chip-laden Dow Jones Industrial AverageSM rose a comparable 19.09% and the technology-heavy Nasdaq Composite® Index gained 23.40%. On the capitalization spectrum, stocks of mid-cap companies fared best, with the Russell Midcap® Index rising 24.51% and the small-cap Russell 2000® Index adding 23.92%.
Comments from Lionel Harris, Portfolio Manager of Fidelity® Small Cap Growth Fund: For the year, the fund's Class F shares rose 30.56%, outpacing the 29.32% return of the Russell 2000® Growth Index. The fund's positioning in consumer discretionary helped, led by stock picking in retailing. Security selection in materials also contributed, as did positioning within technology. In contrast, my choices in energy hurt, as did weak stock selection in banks; a modest cash position in a rising market; and the fund's non-U.S. holdings, despite a weaker U.S. dollar. Individually, Fossil did extremely well, and I sold the stock after it reached my target price. Tempur-Pedic International, a maker of premium foam mattresses and pillows, also helped. In health care, drugmaker Questcor Pharmaceuticals contributed, thanks to the strength of its primary product, Achtar®. Shoe retailer DSW also contributed. Of these stocks, only Questcor and DSW were in the benchmark. On the negative side, the stock of Digital River, which builds and operates electronic storefronts, did poorly. Touch-screen manufacturer Synaptics and urban-oriented retailer Citi Trends, the latter of which the fund no longer held at period end, also disappointed.
The views expressed above reflect those of the portfolio manager(s) only through the end of the period as stated on the cover of this report and do not necessarily represent the views of Fidelity or any other person in the Fidelity organization. Any such views are subject to change at any time based upon market or other conditions and Fidelity disclaims any responsibility to update such views. These views may not be relied on as investment advice and, because investment decisions for a Fidelity fund are based on numerous factors, may not be relied on as an indication of trading intent on behalf of any Fidelity fund.
Annual Report
Shareholder Expense Example
As a shareholder of the Fund, you incur two types of costs: (1) transaction costs, including sales charges (loads) on purchase payments or redemption proceeds, redemption fees, and (2) ongoing costs, including management fees, distribution and/or service (12b-1) fees and other Fund expenses. This Example is intended to help you understand your ongoing costs (in dollars) of investing in the Fund and to compare these costs with the ongoing costs of investing in other mutual funds.
The Example is based on an investment of $1,000 invested at the beginning of the period and held for the entire period (February 1, 2011 to July 31, 2011).
Actual Expenses
The first line of the accompanying table for each class of the Fund provides information about actual account values and actual expenses. You may use the information in this line, together with the amount you invested, to estimate the expenses that you paid over the period. Simply divide your account value by $1,000.00 (for example, an $8,600 account value divided by $1,000.00 = 8.6), then multiply the result by the number in the first line for a class of the Fund under the heading entitled "Expenses Paid During Period" to estimate the expenses you paid on your account during this period. A small balance maintenance fee of $12.00 that is charged once a year may apply for certain accounts with a value of less than $2,000. This fee is not included in the table below. If it was, the estimate of expenses you paid during the period would be higher, and your ending account value lower, by this amount. In addition, the Fund, as a shareholder in the underlying Fidelity Central Funds, will indirectly bear its pro-rata share of the fees and expenses incurred by the underlying Fidelity Central Funds. These fees and expenses are not included in the Fund's annualized expense ratio used to calculate the expense estimate in the table below.
Hypothetical Example for Comparison Purposes
The second line of the accompanying table for each class of the Fund provides information about hypothetical account values and hypothetical expenses based on a Class' actual expense ratio and an assumed rate of return of 5% per year before expenses, which is not the Class' actual return. The hypothetical account values and expenses may not be used to estimate the actual ending account balance or expenses you paid for the period. You may use this information to compare the ongoing costs of investing in the Fund and other funds. To do so, compare this 5% hypothetical example with the 5% hypothetical examples that appear in the shareholder reports of the other funds. A small balance maintenance fee of $12.00 that is charged once a year may apply for certain accounts with a value of less than $2,000. This fee is not included in the table below. If it was, the estimate of expenses you paid during the period would be higher, and your ending account value lower, by this amount. In addition, the Fund, as a shareholder in the underlying Fidelity Central Funds, will indirectly bear its pro-rata share of the fees and expenses incurred by the underlying Fidelity Central Funds. These fees and expenses are not included in the Fund's annualized expense ratio used to calculate the expense estimate in the table below.
Please note that the expenses shown in the table are meant to highlight your ongoing costs only and do not reflect any transaction costs. Therefore, the second line of the table is useful in comparing ongoing costs only, and will not help you determine the relative total costs of owning different funds. In addition, if these transactional costs were included, your costs would have been higher.
Annual Report
| Annualized
Expense Ratio | Beginning
Account Value
February 1, 2011 | Ending
Account Value
July 31, 2011 | Expenses Paid
During Period*
February 1, 2011 to
July 31, 2011 |
Class A | 1.25% | | | |
Actual | | $ 1,000.00 | $ 1,058.70 | $ 6.38 |
HypotheticalA | | $ 1,000.00 | $ 1,018.60 | $ 6.26 |
Class T | 1.50% | | | |
Actual | | $ 1,000.00 | $ 1,057.90 | $ 7.65 |
HypotheticalA | | $ 1,000.00 | $ 1,017.36 | $ 7.50 |
Class B | 2.00% | | | |
Actual | | $ 1,000.00 | $ 1,055.20 | $ 10.19 |
HypotheticalA | | $ 1,000.00 | $ 1,014.88 | $ 9.99 |
Class C | 2.00% | | | |
Actual | | $ 1,000.00 | $ 1,055.30 | $ 10.19 |
HypotheticalA | | $ 1,000.00 | $ 1,014.88 | $ 9.99 |
Small Cap Growth | .93% | | | |
Actual | | $ 1,000.00 | $ 1,060.50 | $ 4.75 |
HypotheticalA | | $ 1,000.00 | $ 1,020.18 | $ 4.66 |
Class F | .70% | | | |
Actual | | $ 1,000.00 | $ 1,061.50 | $ 3.58 |
HypotheticalA | | $ 1,000.00 | $ 1,021.32 | $ 3.51 |
Institutional Class | .95% | | | |
Actual | | $ 1,000.00 | $ 1,060.40 | $ 4.85 |
HypotheticalA | | $ 1,000.00 | $ 1,020.08 | $ 4.76 |
A 5% return per year before expenses
* Expenses are equal to each Class' annualized expense ratio, multiplied by the average account value over the period, multiplied by 181/365 (to reflect the one-half year period).
Annual Report
Investment Changes (Unaudited)
Top Ten Stocks as of July 31, 2011 |
| % of fund's
net assets | % of fund's net assets
6 months ago |
Esterline Technologies Corp. | 1.4 | 1.3 |
Rockwood Holdings, Inc. | 1.4 | 0.0 |
DSW, Inc. Class A | 1.3 | 1.0 |
Solera Holdings, Inc. | 1.3 | 1.1 |
Steven Madden Ltd. | 1.3 | 0.9 |
Catalyst Health Solutions, Inc. | 1.2 | 0.5 |
Carpenter Technology Corp. | 1.2 | 0.8 |
The Cooper Companies, Inc. | 1.2 | 1.0 |
Rowan Companies, Inc. | 1.2 | 1.1 |
Sally Beauty Holdings, Inc. | 1.2 | 0.7 |
| 12.7 | |
Top Five Market Sectors as of July 31, 2011 |
| % of fund's
net assets | % of fund's net assets
6 months ago |
Information Technology | 26.8 | 30.3 |
Industrials | 20.1 | 20.9 |
Health Care | 17.5 | 17.8 |
Consumer Discretionary | 17.0 | 16.1 |
Energy | 6.2 | 3.8 |
Asset Allocation (% of fund's net assets) |
As of July 31, 2011 * | As of January 31, 2011 ** |
| Stocks 98.7% | | | Stocks 97.5% | |
| Short-Term
Investments and
Net Other Assets 1.3% | | | Short-Term
Investments and
Net Other Assets 2.5% | |
* Foreign investments | 13.7% | | ** Foreign investments | 13.8% | |

Annual Report
Investments July 31, 2011
Showing Percentage of Net Assets
Common Stocks - 98.7% |
| Shares | | Value |
CONSUMER DISCRETIONARY - 17.0% |
Auto Components - 1.7% |
Modine Manufacturing Co. (a) | 769,000 | | $ 11,465,791 |
Tenneco, Inc. (a) | 508,000 | | 20,289,520 |
| | 31,755,311 |
Diversified Consumer Services - 0.7% |
Steiner Leisure Ltd. (a) | 278,000 | | 13,516,360 |
Household Durables - 1.0% |
Tempur-Pedic International, Inc. (a) | 242,000 | | 17,426,420 |
Internet & Catalog Retail - 0.7% |
Start Today Co. Ltd. | 540,000 | | 13,414,929 |
Multiline Retail - 1.4% |
Dollarama, Inc. | 415,000 | | 13,882,562 |
Marisa Lojas SA | 856,600 | | 12,038,345 |
| | 25,920,907 |
Specialty Retail - 7.0% |
Delticom AG | 111,910 | | 11,694,830 |
DSW, Inc. Class A (a)(d) | 442,000 | | 23,417,160 |
Jos. A. Bank Clothiers, Inc. (a)(d) | 213,900 | | 10,975,209 |
Sally Beauty Holdings, Inc. (a) | 1,242,000 | | 21,362,400 |
Signet Jewelers Ltd. (a) | 466,400 | | 19,980,576 |
SuperGroup PLC (a)(d) | 560,000 | | 9,790,502 |
Tom Tailor Holding AG (a) | 721,621 | | 15,397,388 |
Tractor Supply Co. | 240,000 | | 15,820,800 |
| | 128,438,865 |
Textiles, Apparel & Luxury Goods - 4.5% |
G-III Apparel Group Ltd. (a) | 250,300 | | 7,726,761 |
PVH Corp. | 257,559 | | 18,428,346 |
Steven Madden Ltd. (a) | 602,500 | | 22,955,250 |
Ted Baker PLC | 1,371,073 | | 18,073,550 |
Warnaco Group, Inc. (a) | 273,000 | | 14,550,900 |
| | 81,734,807 |
TOTAL CONSUMER DISCRETIONARY | | 312,207,599 |
CONSUMER STAPLES - 2.6% |
Food & Staples Retailing - 0.7% |
Fresh Market, Inc. (d) | 356,600 | | 12,669,998 |
Food Products - 0.9% |
Calavo Growers, Inc. (d)(e) | 814,046 | | 16,826,331 |
Common Stocks - continued |
| Shares | | Value |
CONSUMER STAPLES - continued |
Personal Products - 1.0% |
Inter Parfums, Inc. | 897,000 | | $ 17,975,880 |
TOTAL CONSUMER STAPLES | | 47,472,209 |
ENERGY - 6.2% |
Energy Equipment & Services - 3.3% |
ION Geophysical Corp. (a) | 2,055,000 | | 20,837,700 |
Newpark Resources, Inc. (a) | 1,928,900 | | 17,919,481 |
Rowan Companies, Inc. (a) | 556,000 | | 21,778,520 |
| | 60,535,701 |
Oil, Gas & Consumable Fuels - 2.9% |
Gulfport Energy Corp. (a) | 495,000 | | 18,047,700 |
Petroleum Development Corp. (a) | 547,200 | | 19,874,304 |
Targa Resources Corp. (d) | 474,500 | | 16,019,120 |
| | 53,941,124 |
TOTAL ENERGY | | 114,476,825 |
FINANCIALS - 3.9% |
Capital Markets - 0.6% |
Financial Engines, Inc. (a) | 510,000 | | 12,117,600 |
Commercial Banks - 1.5% |
Banco Pine SA | 1,860,300 | | 12,412,394 |
CapitalSource, Inc. | 2,385,000 | | 15,407,100 |
| | 27,819,494 |
Real Estate Investment Trusts - 0.8% |
CBL & Associates Properties, Inc. | 797,000 | | 14,154,720 |
Real Estate Management & Development - 1.0% |
Jones Lang LaSalle, Inc. | 216,900 | | 18,462,528 |
TOTAL FINANCIALS | | 72,554,342 |
HEALTH CARE - 17.5% |
Biotechnology - 2.1% |
Acadia Pharmaceuticals, Inc. (a) | 68,900 | | 112,307 |
Acorda Therapeutics, Inc. (a) | 1,000 | | 28,400 |
Affymax, Inc. (a) | 15,100 | | 99,811 |
Alnylam Pharmaceuticals, Inc. (a) | 5,400 | | 50,652 |
AMAG Pharmaceuticals, Inc. (a) | 12,700 | | 188,087 |
Ardea Biosciences, Inc. (a) | 249,263 | | 5,832,754 |
Common Stocks - continued |
| Shares | | Value |
HEALTH CARE - continued |
Biotechnology - continued |
BioMarin Pharmaceutical, Inc. (a) | 295,000 | | $ 9,212,850 |
BioMimetic Therapeutics, Inc. (a) | 52,500 | | 202,650 |
Dyax Corp. (a) | 2,300 | | 3,772 |
Emergent BioSolutions, Inc. (a) | 7,800 | | 161,070 |
Enzon Pharmaceuticals, Inc. (a) | 7,800 | | 75,816 |
Horizon Pharma, Inc. | 550,000 | | 4,972,000 |
Maxygen, Inc. | 38,400 | | 208,512 |
Momenta Pharmaceuticals, Inc. (a) | 5,700 | | 100,662 |
Myrexis, Inc. (a) | 36,900 | | 125,091 |
Myriad Genetics, Inc. (a) | 7,700 | | 163,779 |
Omeros Corp. (a) | 5,500 | | 22,330 |
PDL BioPharma, Inc. (d) | 1,560,000 | | 9,656,400 |
Repligen Corp. (a) | 19,000 | | 67,070 |
SuperGen, Inc. (a) | 73,600 | | 225,216 |
Theravance, Inc. (a)(d) | 299,000 | | 6,392,620 |
Vanda Pharmaceuticals, Inc. (a) | 29,303 | | 210,396 |
| | 38,112,245 |
Health Care Equipment & Supplies - 4.1% |
Cyberonics, Inc. (a) | 415,000 | | 11,263,100 |
Integra LifeSciences Holdings Corp. (a) | 317,400 | | 14,305,218 |
Sirona Dental Systems, Inc. (a) | 255,000 | | 12,897,900 |
The Cooper Companies, Inc. | 286,000 | | 21,876,140 |
Wright Medical Group, Inc. (a) | 1,020,000 | | 15,952,800 |
| | 76,295,158 |
Health Care Providers & Services - 6.9% |
Accretive Health, Inc. (a)(d) | 355,000 | | 10,664,200 |
Air Methods Corp. (a) | 280,000 | | 19,628,000 |
Catalyst Health Solutions, Inc. (a) | 343,000 | | 22,476,790 |
Corvel Corp. (a) | 400,000 | | 18,460,000 |
IPC The Hospitalist Co., Inc. (a) | 310,000 | | 14,021,300 |
MWI Veterinary Supply, Inc. (a) | 180,000 | | 16,030,800 |
PSS World Medical, Inc. (a) | 610,000 | | 14,597,300 |
Synergy Health PLC | 695,411 | | 10,845,074 |
| | 126,723,464 |
Life Sciences Tools & Services - 2.8% |
Bruker BioSciences Corp. (a) | 1,059,000 | | 18,235,980 |
PerkinElmer, Inc. | 704,800 | | 17,239,408 |
QIAGEN NV (a)(d) | 966,000 | | 16,364,040 |
| | 51,839,428 |
Common Stocks - continued |
| Shares | | Value |
HEALTH CARE - continued |
Pharmaceuticals - 1.6% |
Cadence Pharmaceuticals, Inc. (a)(d) | 767,693 | | $ 6,640,544 |
Cardiome Pharma Corp. (a) | 1,025,000 | | 5,096,033 |
Hikma Pharmaceuticals PLC | 262,838 | | 2,946,973 |
Questcor Pharmaceuticals, Inc. (a) | 495,000 | | 15,369,750 |
| | 30,053,300 |
TOTAL HEALTH CARE | | 323,023,595 |
INDUSTRIALS - 20.1% |
Aerospace & Defense - 4.1% |
Esterline Technologies Corp. (a) | 332,000 | | 25,354,840 |
Teledyne Technologies, Inc. (a) | 387,000 | | 20,987,010 |
TransDigm Group, Inc. (a) | 164,000 | | 14,771,480 |
Triumph Group, Inc. (d) | 258,000 | | 13,890,720 |
| | 75,004,050 |
Building Products - 1.5% |
A.O. Smith Corp. | 242,000 | | 10,035,740 |
Armstrong World Industries, Inc. | 449,000 | | 17,735,500 |
| | 27,771,240 |
Commercial Services & Supplies - 2.3% |
Higher One Holdings, Inc. (a)(d) | 695,000 | | 13,795,750 |
Sykes Enterprises, Inc. (a) | 472,621 | | 9,121,585 |
Waste Connections, Inc. | 626,500 | | 20,198,360 |
| | 43,115,695 |
Construction & Engineering - 2.5% |
Foster Wheeler AG (a) | 484,000 | | 13,116,400 |
KBR, Inc. | 595,980 | | 21,246,687 |
Outotec OYJ | 245,000 | | 12,085,130 |
| | 46,448,217 |
Electrical Equipment - 3.6% |
Acuity Brands, Inc. | 320,500 | | 15,605,145 |
GrafTech International Ltd. (a) | 705,000 | | 13,578,300 |
Regal-Beloit Corp. | 302,000 | | 18,310,260 |
Zumtobel AG | 755,596 | | 17,756,266 |
| | 65,249,971 |
Machinery - 2.1% |
Blount International, Inc. (a) | 744,000 | | 12,372,720 |
Common Stocks - continued |
| Shares | | Value |
INDUSTRIALS - continued |
Machinery - continued |
Nordson Corp. | 263,000 | | $ 13,420,890 |
Wabtec Corp. | 195,000 | | 12,581,400 |
| | 38,375,010 |
Professional Services - 0.6% |
Advisory Board Co. (a) | 205,000 | | 10,975,700 |
Road & Rail - 0.5% |
Contrans Group, Inc. Class A (d) | 1,106,800 | | 9,846,975 |
Trading Companies & Distributors - 2.9% |
Interline Brands, Inc. (a) | 127,442 | | 2,132,105 |
Rush Enterprises, Inc. Class A (a) | 928,254 | | 18,555,797 |
Watsco, Inc. | 224,000 | | 13,256,320 |
WESCO International, Inc. (a) | 382,000 | | 19,363,580 |
| | 53,307,802 |
TOTAL INDUSTRIALS | | 370,094,660 |
INFORMATION TECHNOLOGY - 26.8% |
Communications Equipment - 2.4% |
Anaren, Inc. (a) | 571,774 | | 11,441,198 |
DG FastChannel, Inc. (a) | 527,329 | | 14,902,318 |
Polycom, Inc. (a) | 699,000 | | 18,893,970 |
| | 45,237,486 |
Computers & Peripherals - 1.6% |
Super Micro Computer, Inc. (a) | 834,923 | | 11,764,065 |
Synaptics, Inc. (a)(d) | 726,000 | | 17,837,820 |
| | 29,601,885 |
Electronic Equipment & Components - 3.7% |
Fabrinet (a) | 505,000 | | 7,777,000 |
Insight Enterprises, Inc. (a) | 837,400 | | 14,093,442 |
Jabil Circuit, Inc. | 1,163,000 | | 21,294,530 |
OSI Systems, Inc. (a) | 329,000 | | 13,584,410 |
SYNNEX Corp. (a) | 432,800 | | 12,256,896 |
| | 69,006,278 |
Internet Software & Services - 6.2% |
Demand Media, Inc. (d) | 960,000 | | 9,734,400 |
Digital River, Inc. (a) | 501,000 | | 12,775,500 |
LivePerson, Inc. (a)(d) | 1,080,000 | | 13,294,800 |
Open Text Corp. (a) | 190,000 | | 12,825,099 |
Perficient, Inc. (a)(e) | 1,718,502 | | 17,202,205 |
Common Stocks - continued |
| Shares | | Value |
INFORMATION TECHNOLOGY - continued |
Internet Software & Services - continued |
Rackspace Hosting, Inc. (a)(d) | 525,000 | | $ 21,000,000 |
Sohu.com, Inc. (a) | 182,000 | | 16,398,200 |
Travelzoo, Inc. (a)(d) | 198,000 | | 10,454,400 |
| | 113,684,604 |
IT Services - 2.4% |
Virtusa Corp. (a) | 900,000 | | 17,694,000 |
WNS Holdings Ltd. sponsored ADR (a) | 613,457 | | 6,134,570 |
Wright Express Corp. (a) | 420,000 | | 20,664,000 |
| | 44,492,570 |
Semiconductors & Semiconductor Equipment - 5.1% |
Ceva, Inc. (a) | 396,700 | | 11,988,274 |
Cymer, Inc. (a) | 306,901 | | 13,512,851 |
Entegris, Inc. (a) | 2,321,500 | | 19,895,255 |
Hittite Microwave Corp. (a) | 183,821 | | 10,292,138 |
International Rectifier Corp. (a) | 533,000 | | 13,692,770 |
Semtech Corp. (a) | 461,744 | | 10,758,635 |
Standard Microsystems Corp. (a) | 557,185 | | 13,182,997 |
| | 93,322,920 |
Software - 5.4% |
Aspen Technology, Inc. (a) | 600,000 | | 9,300,000 |
BroadSoft, Inc. (a) | 344,591 | | 10,065,503 |
ebix.com, Inc. (a)(d) | 717,510 | | 14,127,772 |
Informatica Corp. (a) | 274,000 | | 14,009,620 |
Kenexa Corp. (a) | 450,000 | | 11,506,500 |
Solera Holdings, Inc. | 417,000 | | 23,301,960 |
TIBCO Software, Inc. (a) | 638,000 | | 16,613,520 |
| | 98,924,875 |
TOTAL INFORMATION TECHNOLOGY | | 494,270,618 |
MATERIALS - 4.6% |
Chemicals - 2.3% |
Rockwood Holdings, Inc. (a) | 418,000 | | 25,276,460 |
Solutia, Inc. (a) | 797,000 | | 17,087,680 |
| | 42,364,140 |
Common Stocks - continued |
| Shares | | Value |
MATERIALS - continued |
Metals & Mining - 2.3% |
Carpenter Technology Corp. | 382,000 | | $ 21,942,080 |
Royal Gold, Inc. | 323,000 | | 20,704,300 |
| | 42,646,380 |
TOTAL MATERIALS | | 85,010,520 |
TOTAL COMMON STOCKS (Cost $1,533,825,944) | 1,819,110,368 |
Money Market Funds - 8.7% |
| | | |
Fidelity Cash Central Fund, 0.14% (b) | 45,332,402 | | 45,332,402 |
Fidelity Securities Lending Cash Central Fund, 0.15% (b)(c) | 115,743,521 | | 115,743,521 |
TOTAL MONEY MARKET FUNDS (Cost $161,075,923) | 161,075,923 |
TOTAL INVESTMENT PORTFOLIO - 107.4% (Cost $1,694,901,867) | | 1,980,186,291 |
NET OTHER ASSETS (LIABILITIES) - (7.4)% | | (137,048,070) |
NET ASSETS - 100% | $ 1,843,138,221 |
Legend |
(a) Non-income producing |
(b) Affiliated fund that is available only to investment companies and other accounts managed by Fidelity Investments. The rate quoted is the annualized seven-day yield of the fund at period end. A complete unaudited listing of the fund's holdings as of its most recent quarter end is available upon request. In addition, each Fidelity Central Fund's financial statements, which are not covered by the Fund's Report of Independent Registered Public Accounting Firm, are available on the SEC's website or upon request. |
(c) Investment made with cash collateral received from securities on loan. |
(d) Security or a portion of the security is on loan at period end. |
(e) Affiliated company |
Affiliated Central Funds |
Information regarding fiscal year to date income earned by the Fund from investments in Fidelity Central Funds is as follows: |
Fund | Income earned |
Fidelity Cash Central Fund | $ 90,582 |
Fidelity Securities Lending Cash Central Fund | 1,308,812 |
Total | $ 1,399,394 |
Other Affiliated Issuers |
An affiliated company is a company in which the Fund has ownership of at least 5% of the voting securities. Fiscal year to date transactions with companies which are or were affiliates are as follows: |
Affiliate | Value,
beginning of
period | Purchases | Sales
Proceeds | Dividend
Income | Value,
end of
period |
Calavo Growers, Inc. | $ 12,651,852 | $ 4,843,498 | $ - | $ 351,475 | $ 16,826,331 |
Online Resources Corp. | 7,777,946 | 567,018 | 12,586,965 | - | - |
Perficient, Inc. | 13,394,542 | 1,718,096 | - | - | 17,202,205 |
Total | $ 33,824,340 | $ 7,128,612 | $ 12,586,965 | $ 351,475 | $ 34,028,536 |
Other Information |
All investments are categorized as Level 1 under the Fair Value Hierarchy. The inputs or methodology used for valuing securities may not be an indication of the risk associated with investing in those securities. For more information on valuation inputs, please refer to the Security Valuation section in the accompanying Notes to Financial Statements. |
Distribution of investments by country of issue, as a percentage of total net assets, is as follows: (Unaudited) |
United States of America | 86.3% |
Canada | 2.3% |
United Kingdom | 2.2% |
Germany | 1.4% |
Brazil | 1.3% |
Bermuda | 1.1% |
Austria | 1.0% |
Others (Individually Less Than 1%) | 4.4% |
| 100.0% |
Income Tax Information |
The Fund intends to elect to defer to its fiscal year ending July 31, 2012 approximately $848,304 of currency losses recognized during the period November 1, 2010 to July 31, 2011. |
See accompanying notes which are an integral part of the financial statements.
Annual Report
Statement of Assets and Liabilities
| July 31, 2011 |
| | |
Assets | | |
Investment in securities, at value (including securities loaned of $112,721,987) - See accompanying schedule: Unaffiliated issuers (cost $1,500,388,101) | $ 1,785,081,832 | |
Fidelity Central Funds (cost $161,075,923) | 161,075,923 | |
Other affiliated issuers (cost $33,437,843) | 34,028,536 | |
Total Investments (cost $1,694,901,867) | | $ 1,980,186,291 |
Cash | | 1,964,053 |
Receivable for investments sold | | 19,020,388 |
Receivable for fund shares sold | | 1,316,311 |
Dividends receivable | | 824,348 |
Distributions receivable from Fidelity Central Funds | | 197,247 |
Other receivables | | 74,114 |
Total assets | | 2,003,582,752 |
| | |
Liabilities | | |
Payable for investments purchased | $ 30,247,562 | |
Payable for fund shares redeemed | 12,682,146 | |
Accrued management fee | 1,278,818 | |
Distribution and service plan fees payable | 54,160 | |
Other affiliated payables | 363,790 | |
Other payables and accrued expenses | 74,534 | |
Collateral on securities loaned, at value | 115,743,521 | |
Total liabilities | | 160,444,531 |
| | |
Net Assets | | $ 1,843,138,221 |
Net Assets consist of: | | |
Paid in capital | | $ 1,539,978,386 |
Accumulated net investment loss | | (848,304) |
Accumulated undistributed net realized gain (loss) on investments and foreign currency transactions | | 18,720,049 |
Net unrealized appreciation (depreciation) on investments and assets and liabilities in foreign currencies | | 285,288,090 |
Net Assets | | $ 1,843,138,221 |
See accompanying notes which are an integral part of the financial statements.
Annual Report
Statement of Assets and Liabilities - continued
| July 31, 2011 |
| | |
Calculation of Maximum Offering Price Class A:
Net Asset Value and redemption price per share ($67,272,316 ÷ 4,096,233 shares) | | $ 16.42 |
| | |
Maximum offering price per share (100/94.25 of $16.42) | | $ 17.42 |
Class T:
Net Asset Value and redemption price per share ($30,763,609 ÷ 1,890,561 shares) | | $ 16.27 |
| | |
Maximum offering price per share (100/96.50 of $16.27) | | $ 16.86 |
Class B:
Net Asset Value and offering price per share ($5,295,068 ÷ 333,961 shares)A | | $ 15.86 |
| | |
Class C:
Net Asset Value and offering price per share ($24,913,614 ÷ 1,574,146 shares)A | | $ 15.83 |
| | |
Small Cap Growth:
Net Asset Value, offering price and redemption price per share ($1,382,688,082 ÷ 83,048,741 shares) | | $ 16.65 |
| | |
Class F:
Net Asset Value, offering price and redemption price per share ($290,765,137 ÷ 17,378,109 shares) | | $ 16.73 |
| | |
Institutional Class:
Net Asset Value, offering price and redemption price per share ($41,440,395 ÷ 2,484,480 shares) | | $ 16.68 |
A Redemption price per share is equal to net asset value less any applicable contingent deferred sales charge.
See accompanying notes which are an integral part of the financial statements.
Annual Report
Financial Statements - continued
Statement of Operations
| Year ended July 31, 2011 |
| | |
Investment Income | | |
Dividends (including $351,475 earned from other affiliated issuers) | | $ 9,421,086 |
Special dividends | | 2,295,657 |
Interest | | 70 |
Income from Fidelity Central Funds (including $1,308,812 from security lending) | | 1,399,394 |
Total income | | 13,116,207 |
| | |
Expenses | | |
Management fee
Basic fee | $ 12,213,765 | |
Performance adjustment | (1,097,151) | |
Transfer agent fees | 3,857,683 | |
Distribution and service plan fees | 581,456 | |
Accounting and security lending fees | 552,489 | |
Custodian fees and expenses | 119,815 | |
Independent trustees' compensation | 9,001 | |
Registration fees | 106,385 | |
Audit | 57,065 | |
Legal | 6,456 | |
Miscellaneous | 17,324 | |
Total expenses before reductions | 16,424,288 | |
Expense reductions | (205,467) | 16,218,821 |
Net investment income (loss) | | (3,102,614) |
Realized and Unrealized Gain (Loss) Net realized gain (loss) on: | | |
Investment securities: | | |
Unaffiliated issuers | 220,513,485 | |
Other affiliated issuers | 1,387,149 | |
Foreign currency transactions | (835,104) | |
Total net realized gain (loss) | | 221,065,530 |
Change in net unrealized appreciation (depreciation) on: Investment securities | 210,248,116 | |
Assets and liabilities in foreign currencies | 5,252 | |
Total change in net unrealized appreciation (depreciation) | | 210,253,368 |
Net gain (loss) | | 431,318,898 |
Net increase (decrease) in net assets resulting from operations | | $ 428,216,284 |
See accompanying notes which are an integral part of the financial statements.
Annual Report
Statement of Changes in Net Assets
| Year ended
July 31,
2011 | Year ended
July 31,
2010 |
Increase (Decrease) in Net Assets | | |
Operations | | |
Net investment income (loss) | $ (3,102,614) | $ (4,269,128) |
Net realized gain (loss) | 221,065,530 | 242,038,859 |
Change in net unrealized appreciation (depreciation) | 210,253,368 | (34,116,702) |
Net increase (decrease) in net assets resulting
from operations | 428,216,284 | 203,653,029 |
Distributions to shareholders from net realized gain | (3,013,255) | - |
Share transactions - net increase (decrease) | (17,486,495) | 46,578,163 |
Redemption fees | 229,000 | 232,258 |
Total increase (decrease) in net assets | 407,945,534 | 250,463,450 |
| | |
Net Assets | | |
Beginning of period | 1,435,192,687 | 1,184,729,237 |
End of period (including accumulated net investment loss of $848,304 and undistributed net investment income of $0, respectively) | $ 1,843,138,221 | $ 1,435,192,687 |
See accompanying notes which are an integral part of the financial statements.
Annual Report
Financial Highlights - Class A
Years ended July 31, | 2011 | 2010 | 2009 | 2008 | 2007 |
Selected Per-Share Data | | | | | |
Net asset value, beginning of period | $ 12.66 | $ 10.79 | $ 13.20 | $ 16.06 | $ 12.88 |
Income from Investment Operations | | | | | |
Net investment income (loss) C | (.07) F | (.07) G | (.06) | (.11) | (.12) H |
Net realized and unrealized gain (loss) | 3.84 | 1.94 | (2.35) | (1.73) | 3.39 |
Total from investment operations | 3.77 | 1.87 | (2.41) | (1.84) | 3.27 |
Distributions from net realized gain | (.01) K | - | - | (1.02) | (.09) |
Redemption fees added to paid in capital C,J | - | - | - | - | - |
Net asset value, end of period | $ 16.42 | $ 12.66 | $ 10.79 | $ 13.20 | $ 16.06 |
Total Return A,B | 29.78% | 17.33% | (18.26)% | (12.26)% | 25.52% |
Ratios to Average Net Assets D,I | | | | | |
Expenses before reductions | 1.25% | 1.35% | 1.33% | 1.40% | 1.44% |
Expenses net of fee waivers, if any | 1.25% | 1.35% | 1.33% | 1.40% | 1.40% |
Expenses net of all reductions | 1.23% | 1.34% | 1.33% | 1.39% | 1.39% |
Net investment income (loss) | (.47)% F | (.56)% G | (.64)% | (.74)% | (.80)% H |
Supplemental Data | | | | | |
Net assets, end of period (000 omitted) | $ 67,272 | $ 50,620 | $ 40,211 | $ 42,187 | $ 33,588 |
Portfolio turnover rate E | 106% | 105% | 150% | 113% | 91% |
A Total returns would have been lower if certain expenses had not been reduced during the applicable periods shown.
B Total returns do not include the effect of the sales charges.
C Calculated based on average shares outstanding during the period.
D Fees and expenses of any underlying Fidelity Central Funds are not included in the Fund's expense ratio. The Fund indirectly bears its proportionate share of the expenses of any underlying Fidelity Central Funds.
E Amount does not include the portfolio activity of any underlying Fidelity Central Funds.
F Investment income per share reflects a special dividend which amounted to $.02 per share. Excluding the special dividend, the ratio of net investment income (loss) to average net assets would have been (.61)%.
G Investment income per share reflects a special dividend which amounted to $.01 per share. Excluding the special dividend, the ratio of net investment income (loss) to average net assets would have been (.67)%.
H Investment income per share reflects a special dividend which amounted to $.01 per share. Excluding the special dividend, the ratio of net investment income (loss) to average net assets would have been (.84)%.
I Expense ratios reflect operating expenses of the class. Expenses before reductions do not reflect amounts reimbursed by the investment adviser or reductions from brokerage service arrangements or reductions from other expense offset arrangements and do not represent the amount paid by the class during periods when reimbursements or reductions occur. Expenses net of fee waivers reflect expenses after reimbursement by the investment adviser but prior to reductions from brokerage service arrangements or other expense offset arrangements. Expenses net of all reductions represent the net expenses paid by the class.
J Amount represents less than $.01 per share.
K The amount shown reflects certain reclassifications related to book to tax differences.
See accompanying notes which are an integral part of the financial statements.
Annual Report
Financial Highlights - Class T
Years ended July 31, | 2011 | 2010 | 2009 | 2008 | 2007 |
Selected Per-Share Data | | | | | |
Net asset value, beginning of period | $ 12.57 | $ 10.74 | $ 13.17 | $ 16.01 | $ 12.86 |
Income from Investment Operations | | | | | |
Net investment income (loss) C | (.11) F | (.10) G | (.09) | (.15) | (.16) H |
Net realized and unrealized gain (loss) | 3.81 | 1.93 | (2.34) | (1.73) | 3.38 |
Total from investment operations | 3.70 | 1.83 | (2.43) | (1.88) | 3.22 |
Distributions from net realized gain | - | - | - | (.96) | (.07) |
Redemption fees added to paid in capital C,J | - | - | - | - | - |
Net asset value, end of period | $ 16.27 | $ 12.57 | $ 10.74 | $ 13.17 | $ 16.01 |
Total Return A,B | 29.44% | 17.04% | (18.45)% | (12.50)% | 25.18% |
Ratios to Average Net Assets D,I | | | | | |
Expenses before reductions | 1.50% | 1.61% | 1.60% | 1.65% | 1.67% |
Expenses net of fee waivers, if any | 1.50% | 1.61% | 1.60% | 1.65% | 1.65% |
Expenses net of all reductions | 1.49% | 1.60% | 1.59% | 1.65% | 1.65% |
Net investment income (loss) | (.73)% F | (.82)% G | (.91)% | (.99)% | (1.05)% H |
Supplemental Data | | | | | |
Net assets, end of period (000 omitted) | $ 30,764 | $ 23,930 | $ 21,533 | $ 21,754 | $ 26,419 |
Portfolio turnover rate E | 106% | 105% | 150% | 113% | 91% |
A Total returns would have been lower if certain expenses had not been reduced during the applicable periods shown.
B Total returns do not include the effect of the sales charges.
C Calculated based on average shares outstanding during the period.
D Fees and expenses of any underlying Fidelity Central Funds are not included in the Fund's expense ratio. The Fund indirectly bears its proportionate share of the expenses of any underlying Fidelity Central Funds.
E Amount does not include the portfolio activity of any underlying Fidelity Central Funds.
F Investment income per share reflects a special dividend which amounted to $.02 per share. Excluding the special dividend, the ratio of net investment income (loss) to average net assets would have been (.86)%.
G Investment income per share reflects a special dividend which amounted to $.01 per share. Excluding the special dividend, the ratio of net investment income (loss) to average net assets would have been (.93)%.
H Investment income per share reflects a special dividend which amounted to $.01 per share. Excluding the special dividend, the ratio of net investment income (loss) to average net assets would have been (1.09)%.
I Expense ratios reflect operating expenses of the class. Expenses before reductions do not reflect amounts reimbursed by the investment adviser or reductions from brokerage service arrangements or reductions from other expense offset arrangements and do not represent the amount paid by the class during periods when reimbursements or reductions occur. Expenses net of fee waivers reflect expenses after reimbursement by the investment adviser but prior to reductions from brokerage service arrangements or other expense offset arrangements. Expenses net of all reductions represent the net expenses paid by the class.
J Amount represents less than $.01 per share.
See accompanying notes which are an integral part of the financial statements.
Annual Report
Financial Highlights - Class B
Years ended July 31, | 2011 | 2010 | 2009 | 2008 | 2007 |
Selected Per-Share Data | | | | | |
Net asset value, beginning of period | $ 12.30 | $ 10.57 | $ 13.03 | $ 15.85 | $ 12.78 |
Income from Investment Operations | | | | | |
Net investment income (loss) C | (.18) F | (.16) G | (.13) | (.22) | (.23) H |
Net realized and unrealized gain (loss) | 3.74 | 1.89 | (2.33) | (1.71) | 3.36 |
Total from investment operations | 3.56 | 1.73 | (2.46) | (1.93) | 3.13 |
Distributions from net realized gain | - | - | - | (.89) | (.06) |
Redemption fees added to paid in capital C,J | - | - | - | - | - |
Net asset value, end of period | $ 15.86 | $ 12.30 | $ 10.57 | $ 13.03 | $ 15.85 |
Total Return A,B | 28.94% | 16.37% | (18.88)% | (12.92)% | 24.57% |
Ratios to Average Net Assets D,I | | | | | |
Expenses before reductions | 2.00% | 2.11% | 2.08% | 2.15% | 2.20% |
Expenses net of fee waivers, if any | 2.00% | 2.11% | 2.08% | 2.15% | 2.15% |
Expenses net of all reductions | 1.98% | 2.09% | 2.08% | 2.15% | 2.15% |
Net investment income (loss) | (1.22)% F | (1.32)% G | (1.39)% | (1.49)% | (1.55)% H |
Supplemental Data | | | | | |
Net assets, end of period (000 omitted) | $ 5,295 | $ 5,142 | $ 4,171 | $ 5,517 | $ 6,242 |
Portfolio turnover rate E | 106% | 105% | 150% | 113% | 91% |
A Total returns would have been lower if certain expenses had not been reduced during the applicable periods shown.
B Total returns do not include the effect of the contingent deferred sales charge.
C Calculated based on average shares outstanding during the period.
D Fees and expenses of any underlying Fidelity Central Funds are not included in the Fund's expense ratio. The Fund indirectly bears its proportionate share of the expenses of any underlying Fidelity Central Funds.
E Amount does not include the portfolio activity of any underlying Fidelity Central Funds.
F Investment income per share reflects a special dividend which amounted to $.02 per share. Excluding the special dividend, the ratio of net investment income (loss) to average net assets would have been (1.36)%.
G Investment income per share reflects a special dividend which amounted to $.01 per share. Excluding the special dividend, the ratio of net investment income (loss) to average net assets would have been (1.42)%.
H Investment income per share reflects a special dividend which amounted to $.01 per share. Excluding the special dividend, the ratio of net investment income (loss) to average net assets would have been (1.59)%.
I Expense ratios reflect operating expenses of the class. Expenses before reductions do not reflect amounts reimbursed by the investment adviser or reductions from brokerage service arrangements or reductions from other expense offset arrangements and do not represent the amount paid by the class during periods when reimbursements or reductions occur. Expenses net of fee waivers reflect expenses after reimbursement by the investment adviser but prior to reductions from brokerage service arrangements or other expense offset arrangements. Expenses net of all reductions represent the net expenses paid by the class.
J Amount represents less than $.01 per share.
See accompanying notes which are an integral part of the financial statements.
Annual Report
Financial Highlights - Class C
Years ended July 31, | 2011 | 2010 | 2009 | 2008 | 2007 |
Selected Per-Share Data | | | | | |
Net asset value, beginning of period | $ 12.28 | $ 10.55 | $ 13.00 | $ 15.84 | $ 12.77 |
Income from Investment Operations | | | | | |
Net investment income (loss) C | (.18) F | (.16) G | (.13) | (.22) | (.23) H |
Net realized and unrealized gain (loss) | 3.73 | 1.89 | (2.32) | (1.71) | 3.36 |
Total from investment operations | 3.55 | 1.73 | (2.45) | (1.93) | 3.13 |
Distributions from net realized gain | - | - | - | (.91) | (.06) |
Redemption fees added to paid in capital C,J | - | - | - | - | - |
Net asset value, end of period | $ 15.83 | $ 12.28 | $ 10.55 | $ 13.00 | $ 15.84 |
Total Return A,B | 28.91% | 16.40% | (18.85)% | (12.94)% | 24.59% |
Ratios to Average Net Assets D,I | | | | | |
Expenses before reductions | 2.00% | 2.11% | 2.08% | 2.15% | 2.20% |
Expenses net of fee waivers, if any | 2.00% | 2.11% | 2.08% | 2.15% | 2.15% |
Expenses net of all reductions | 1.98% | 2.09% | 2.07% | 2.14% | 2.14% |
Net investment income (loss) | (1.22)% F | (1.32)% G | (1.39)% | (1.49)% | (1.55)% H |
Supplemental Data | | | | | |
Net assets, end of period (000 omitted) | $ 24,914 | $ 18,091 | $ 14,267 | $ 15,946 | $ 22,348 |
Portfolio turnover rate E | 106% | 105% | 150% | 113% | 91% |
A Total returns would have been lower if certain expenses had not been reduced during the applicable periods shown.
B Total returns do not include the effect of the contingent deferred sales charge.
C Calculated based on average shares outstanding during the period.
D Fees and expenses of any underlying Fidelity Central Funds are not included in the Fund's expense ratio. The Fund indirectly bears its proportionate share of the expenses of any underlying Fidelity Central Funds.
E Amount does not include the portfolio activity of any underlying Fidelity Central Funds.
F Investment income per share reflects a special dividend which amounted to $.02 per share. Excluding the special dividend, the ratio of net investment income (loss) to average net assets would have been (1.36)%.
G Investment income per share reflects a special dividend which amounted to $.01 per share. Excluding the special dividend, the ratio of net investment income (loss) to average net assets would have been (1.42)%.
H Investment income per share reflects a special dividend which amounted to $.01 per share. Excluding the special dividend, the ratio of net investment income (loss) to average net assets would have been (1.59)%.
I Expense ratios reflect operating expenses of the class. Expenses before reductions do not reflect amounts reimbursed by the investment adviser or reductions from brokerage service arrangements or reductions from other expense offset arrangements and do not represent the amount paid by the class during periods when reimbursements or reductions occur. Expenses net of fee waivers reflect expenses after reimbursement by the investment adviser but prior to reductions from brokerage service arrangements or other expense offset arrangements. Expenses net of all reductions represent the net expenses paid by the class.
J Amount represents less than $.01 per share.
See accompanying notes which are an integral part of the financial statements.
Annual Report
Financial Highlights - Small Cap Growth
Years ended July 31, | 2011 | 2010 | 2009 | 2008 | 2007 |
Selected Per-Share Data | | | | | |
Net asset value, beginning of period | $ 12.81 | $ 10.89 | $ 13.29 | $ 16.15 | $ 12.93 |
Income from Investment Operations | | | | | |
Net investment income (loss) B | (.03) E | (.04) F | (.04) | (.07) | (.08) G |
Net realized and unrealized gain (loss) | 3.90 | 1.96 | (2.36) | (1.74) | 3.40 |
Total from investment operations | 3.87 | 1.92 | (2.40) | (1.81) | 3.32 |
Distributions from net realized gain | (.03) J | - | - | (1.05) | (.10) |
Redemption fees added to paid in capital B,I | - | - | - | - | - |
Net asset value, end of period | $ 16.65 | $ 12.81 | $ 10.89 | $ 13.29 | $ 16.15 |
Total Return A | 30.20% | 17.63% | (18.06)% | (11.98)% | 25.84% |
Ratios to Average Net Assets C,H | | | | |
Expenses before reductions | .95% | 1.08% | 1.08% | 1.11% | 1.10% |
Expenses net of fee waivers, if any | .95% | 1.08% | 1.08% | 1.11% | 1.10% |
Expenses net of all reductions | .93% | 1.07% | 1.08% | 1.10% | 1.09% |
Net investment income (loss) | (.17)% E | (.29)% F | (.39)% | (.45)% | (.50)% G |
Supplemental Data | | | | | |
Net assets, end of period (000 omitted) | $ 1,382,688 | $ 1,204,818 | $ 1,085,184 | $ 1,217,520 | $ 1,149,809 |
Portfolio turnover rate D | 106% | 105% | 150% | 113% | 91% |
A Total returns would have been lower if certain expenses had not been reduced during the applicable periods shown.
B Calculated based on average shares outstanding during the period.
C Fees and expenses of any underlying Fidelity Central Funds are not included in the Fund's expense ratio. The Fund indirectly bears its proportionate share of the expenses of any underlying Fidelity Central Funds.
D Amount does not include the portfolio activity of any underlying Fidelity Central Funds.
E Investment income per share reflects a special dividend which amounted to $.02 per share. Excluding the special dividend, the ratio of net investment income (loss) to average net assets would have been (.31)%.
F Investment income per share reflects a special dividend which amounted to $.01 per share. Excluding the special dividend, the ratio of net investment income (loss) to average net assets would have been (.39)%.
G Investment income per share reflects a special dividend which amounted to $.01 per share. Excluding the special dividend, the ratio of net investment income (loss) to average net assets would have been (.54)%.
H Expense ratios reflect operating expenses of the class. Expenses before reductions do not reflect amounts reimbursed by the investment adviser or reductions from brokerage service arrangements or reductions from other expense offset arrangements and do not represent the amount paid by the class during periods when reimbursements or reductions occur. Expenses net of fee waivers reflect expenses after reimbursement by the investment adviser but prior to reductions from brokerage service arrangements or other expense offset arrangements. Expenses net of all reductions represent the net expenses paid by the class.
I Amount represents less than $.01 per share.
J The amount shown reflects certain reclassifications related to book to tax differences.
See accompanying notes which are an integral part of the financial statements.
Annual Report
Financial Highlights - Class F
Years ended July 31, | 2011 | 2010 | 2009 J |
Selected Per-Share Data | | | |
Net asset value, beginning of period | $ 12.85 | $ 10.90 | $ 10.03 |
Income from Investment Operations | | | |
Net investment income (loss) D | .01 H | - I,L | (.01) |
Net realized and unrealized gain (loss) | 3.91 | 1.95 | .88 |
Total from investment operations | 3.92 | 1.95 | .87 |
Distributions from net realized gain | (.04) M | - | - |
Redemption fees added to paid in capital D,L | - | - | - |
Net asset value, end of period | $ 16.73 | $ 12.85 | $ 10.90 |
Total Return B,C | 30.56% | 17.89% | 8.67% |
Ratios to Average Net Assets E,K | | | |
Expenses before reductions | .70% | .78% | .74% A |
Expenses net of fee waivers, if any | .70% | .78% | .74% A |
Expenses net of all reductions | .68% | .77% | .73% A |
Net investment income (loss) | .08% H | -% G,I | (.54)% A |
Supplemental Data | | | |
Net assets, end of period (000 omitted) | $ 290,765 | $ 106,941 | $ 159 |
Portfolio turnover rate F | 106% | 105% | 150% |
A Annualized
B Total returns for periods of less than one year are not annualized.
C Total returns would have been lower if certain expenses had not been reduced during the applicable periods shown.
D Calculated based on average shares outstanding during the period.
E Fees and expenses of any underlying Fidelity Central Funds are not included in the Fund's expense ratio. The Fund indirectly bears its proportionate share of the expenses of any underlying Fidelity Central Funds.
F Amount does not include the portfolio activity of any underlying Fidelity Central Funds.
G Amount represents less than .01%.
H Investment income per share reflects a special dividend which amounted to $.02 per share. Excluding the special dividend, the ratio of net investment income (loss) to average net assets would have been (.06)%.
I Investment income per share reflects a special dividend which amounted to $.01 per share. Excluding the special dividend, the ratio of net investment income (loss) to average net assets would have been (.10)%.
J For the period June 26, 2009 (commencement of sale of shares) to July 31, 2009.
K Expense ratios reflect operating expenses of the class. Expenses before reductions do not reflect amounts reimbursed by the investment adviser or reductions from brokerage service arrangements or reductions from other expense offset arrangements and do not represent the amount paid by the class during periods when reimbursements or reductions occur. Expense ratios before reductions for start-up periods may not be representative of longer-term operating periods. Expenses net of fee waivers reflect expenses after reimbursement by the investment adviser but prior to reductions from brokerage service arrangements or other expense offset arrangements. Expenses net of all reductions represent the net expenses paid by the class.
L Amount represents less than $.01 per share.
M The amount shown reflects certain reclassifications related to book to tax differences.
See accompanying notes which are an integral part of the financial statements.
Annual Report
Financial Highlights - Institutional Class
Years ended July 31, | 2011 | 2010 | 2009 | 2008 | 2007 |
Selected Per-Share Data | | | | | |
Net asset value, beginning of period | $ 12.83 | $ 10.91 | $ 13.30 | $ 16.15 | $ 12.92 |
Income from Investment Operations | | | | | |
Net investment income (loss) B | (.03) E | (.03) F | (.03) | (.06) | (.07) G |
Net realized and unrealized gain (loss) | 3.91 | 1.95 | (2.36) | (1.74) | 3.41 |
Total from investment operations | 3.88 | 1.92 | (2.39) | (1.80) | 3.34 |
Distributions from net realized gain | (.03) J | - | - | (1.05) | (.11) |
Redemption fees added to paid in capital B,I | - | - | - | - | - |
Net asset value, end of period | $ 16.68 | $ 12.83 | $ 10.91 | $ 13.30 | $ 16.15 |
Total Return A | 30.24% | 17.60% | (17.97)% | (11.93)% | 25.99% |
Ratios to Average Net Assets C,H | | | | |
Expenses before reductions | .94% | 1.03% | 1.05% | 1.04% | 1.05% |
Expenses net of fee waivers, if any | .94% | 1.03% | 1.05% | 1.04% | 1.05% |
Expenses net of all reductions | .93% | 1.02% | 1.04% | 1.03% | 1.05% |
Net investment income (loss) | (.17)% E | (.24)% F | (.36)% | (.38)% | (.46)% G |
Supplemental Data | | | | | |
Net assets, end of period (000 omitted) | $ 41,440 | $ 25,650 | $ 19,204 | $ 22,444 | $ 18,671 |
Portfolio turnover rate D | 106% | 105% | 150% | 113% | 91% |
A Total returns would have been lower if certain expenses had not been reduced during the applicable periods shown.
B Calculated based on average shares outstanding during the period.
C Fees and expenses of any underlying Fidelity Central Funds are not included in the Fund's expense ratio. The Fund indirectly bears its proportionate share of the expenses of any underlying Fidelity Central Funds.
D Amount does not include the portfolio activity of any underlying Fidelity Central Funds.
E Investment income per share reflects a special dividend which amounted to $.02 per share. Excluding the special dividend, the ratio of net investment income (loss) to average net assets would have been (.30)%.
F Investment income per share reflects a special dividend which amounted to $.01 per share. Excluding the special dividend, the ratio of net investment income (loss) to average net assets would have been (.34)%.
G Investment income per share reflects a special dividend which amounted to $.01 per share. Excluding the special dividend, the ratio of net investment income (loss) to average net assets would have been (.50)%.
H Expense ratios reflect operating expenses of the class. Expenses before reductions do not reflect amounts reimbursed by the investment adviser or reductions from brokerage service arrangements or reductions from other expense offset arrangements and do not represent the amount paid by the class during periods when reimbursements or reductions occur. Expenses net of fee waivers reflect expenses after reimbursement by the investment adviser but prior to reductions from brokerage service arrangements or other expense offset arrangements. Expenses net of all reductions represent the net expenses paid by the class.
I Amount represents less than $.01 per share.
J The amount shown reflects certain reclassifications related to book to tax differences.
See accompanying notes which are an integral part of the financial statements.
Annual Report
Notes to Financial Statements
For the period ended July 31, 2011
1. Organization.
Fidelity Small Cap Growth Fund (the Fund) is a fund of Fidelity Securities Fund (the Trust) and is authorized to issue an unlimited number of shares. The Trust is registered under the Investment Company Act of 1940, as amended (the 1940 Act), as an open-end management investment company organized as a Massachusetts business trust. The Fund offers Class A, Class T, Class C, Small Cap Growth, Class F, and Institutional Class shares, each of which, along with Class B shares, has equal rights as to assets and voting privileges. Effective after the close of business on September 1, 2010, Class B shares were closed to new accounts and additional purchases, except for exchanges and reinvestments, by existing shareholders. Each class has exclusive voting rights with respect to matters that affect that class. Class F shares of the Fund are only available for purchase by mutual funds for which Fidelity Management & Research Company (FMR) or an affiliate serves as investment manager. Class B shares will automatically convert to Class A shares after a holding period of seven years from the initial date of purchase. Investment income, realized and unrealized capital gains and losses, the common expenses of the Fund, and certain fund-level expense reductions, if any, are allocated on a pro-rata basis to each class based on the relative net assets of each class to the total net assets of the Fund. Each class differs with respect to transfer agent and distribution and service plan fees incurred. Certain expense reductions may also differ by class.
2. Investments in Fidelity Central Funds.
The Fund invests in Fidelity Central Funds, which are open-end investment companies available only to other investment companies and accounts managed by FMR and its affiliates. The Fund's Schedule of Investments lists each of the Fidelity Central Funds held as of period end, if any, as an investment of the Fund, but does not include the underlying holdings of each Fidelity Central Fund. As an Investing Fund, the Fund indirectly bears its proportionate share of the expenses of the underlying Fidelity Central Funds.
The Money Market Central Funds seek preservation of capital and current income and are managed by Fidelity Investments Money Management, Inc. (FIMM), an affiliate of FMR.
A complete unaudited list of holdings for each Fidelity Central Fund is available upon request or at the Securities and Exchange Commission (the SEC) web site at www.sec.gov. In addition, the financial statements of the Fidelity Central Funds, which are not covered by the Fund's Report of Independent Registered Public Accounting Firm, are available on the SEC web site or upon request.
Annual Report
Notes to Financial Statements - continued
3. Significant Accounting Policies.
The financial statements have been prepared in conformity with accounting principles generally accepted in the United States of America (GAAP), which require management to make certain estimates and assumptions at the date of the financial statements. Actual results could differ from those estimates. Subsequent events, if any, through the date that the financial statements were issued have been evaluated in the preparation of the financial statements. The following summarizes the significant accounting policies of the Fund:
Security Valuation. Investments are valued as of 4:00 p.m. Eastern time on the last calendar day of the period. The Fund uses independent pricing services approved by the Board of Trustees to value its investments. When current market prices or quotations are not readily available or reliable, valuations may be determined in good faith in accordance with procedures adopted by the Board of Trustees. Factors used in determining value may include market or security specific events. The frequency with which these procedures are used cannot be predicted and they may be utilized to a significant extent. The value used for net asset value (NAV) calculation under these procedures may differ from published prices for the same securities.
The Fund categorizes the inputs to valuation techniques used to value its investments into a disclosure hierarchy consisting of three levels as shown below:
Level 1 - quoted prices in active markets for identical investments
Level 2 - other significant observable inputs (including quoted prices for similar investments, interest rates, prepayment speeds, etc.)
Level 3 - unobservable inputs (including the Fund's own assumptions based on the best information available)
Changes in valuation techniques may result in transfers in or out of an assigned level within the disclosure hierarchy. Valuation techniques used to value the Fund's investments by major category are as follows:
Equity securities, including restricted securities, for which market quotations are readily available, are valued at the last reported sale price or official closing price as reported by an independent pricing service on the primary market or exchange on which they are traded and are categorized as Level 1 in the hierarchy. In the event there were no sales during the day or closing prices are not available, securities are valued at the last quoted bid price or may be valued using the last available price and are generally categorized as Level 2 in the hierarchy. For foreign equity securities, when significant market or security specific events arise, comparisons to the valuation of American Depositary Receipts (ADRs), futures contracts, Exchange-traded funds (ETFs) and certain indexes as well as
Annual Report
3. Significant Accounting Policies - continued
Security Valuation - continued
quoted prices for similar securities are used and are categorized as Level 2 in the hierarchy in these circumstances. Utilizing these techniques may result in transfers between Level 1 and Level 2. For restricted equity securities and private placements where observable inputs are limited, assumptions about market activity and risk are used and are categorized as Level 3 in the hierarchy.
Investments in open-end mutual funds, including the Fidelity Central Funds, are valued at their closing net asset value each business day and are categorized as Level 1 in the hierarchy.
Foreign Currency. The Fund may use foreign currency contracts to facilitate transactions in foreign-denominated securities. Gains and losses from these transactions may arise from changes in the value of the foreign currency or if the counterparties do not perform under the contracts' terms.
Foreign-denominated assets, including investment securities, and liabilities are translated into U.S. dollars at the exchange rate at period end. Purchases and sales of investment securities, income and dividends received and expenses denominated in foreign currencies are translated into U.S. dollars at the exchange rate in effect on the transaction date.
The effects of exchange rate fluctuations on investments are included with the net realized and unrealized gain (loss) on investment securities. Other foreign currency transactions resulting in realized and unrealized gain (loss) are disclosed separately.
Investment Transactions and Income. For financial reporting purposes, the Fund's investment holdings and NAV include trades executed through the end of the last business day of the period. The NAV per share for processing shareholder transactions is calculated as of the close of business of the New York Stock Exchange (NYSE), normally 4:00 p.m. Eastern time and includes trades executed through the end of the prior business day. Gains and losses on securities sold are determined on the basis of identified cost and may include proceeds received from litigation. Dividend income is recorded on the ex-dividend date, except for certain dividends from foreign securities where the ex-dividend date may have passed, which are recorded as soon as the Fund is informed of the ex-dividend date. Non-cash dividends included in dividend income, if any, are recorded at the fair market value of the securities received. Distributions received on securities that represent a return of capital or capital gain are recorded as a reduction of cost of investments and/or as a realized gain. The Fund estimates the components of distributions received that may be considered return of capital distributions or capital
Annual Report
Notes to Financial Statements - continued
3. Significant Accounting Policies - continued
Investment Transactions and Income - continued
gain distributions. Large, non-recurring dividends recognized by the Fund are presented separately on the Statement of Operations as "Special Dividends" and the impact of these dividends is presented in the Financial Highlights. Interest income and distributions from the Fidelity Central Funds are accrued as earned. Interest income includes coupon interest and amortization of premium and accretion of discount on debt securities. Investment income is recorded net of foreign taxes withheld where recovery of such taxes is uncertain.
Expenses. Expenses directly attributable to a fund are charged to that fund. Expenses attributable to more than one fund are allocated among the respective funds on the basis of relative net assets or other appropriate methods. Expense estimates are accrued in the period to which they relate and adjustments are made when actual amounts are known.
Income Tax Information and Distributions to Shareholders. Each year, the Fund intends to qualify as a regulated investment company, including distributing substantially all of its taxable income and realized gains under Subchapter M of the Internal Revenue Code and filing its U.S. federal tax return. As a result, no provision for income taxes is required. As of July 31, 2011, the Fund did not have any unrecognized tax benefits in the financial statements. A fund's federal tax return is subject to examination by the Internal Revenue Service (IRS) for a period of three years. Foreign taxes are provided for based on the Fund's understanding of the tax rules and rates that exist in the foreign markets in which it invests.
Distributions are declared and recorded on the ex-dividend date. Income dividends and capital gain distributions are declared separately for each class. Income and capital gain distributions are determined in accordance with income tax regulations, which may differ from GAAP. These differences resulted in distribution reclasses.
Capital accounts within the financial statements are adjusted for permanent book-tax differences. These adjustments have no impact on net assets or the results of operations. Temporary book-tax differences will reverse in a subsequent period.
Book-tax differences are primarily due to foreign currency transactions, net operating losses, capital loss carryforwards, and losses deferred due to wash sales and excise tax regulations.
Annual Report
3. Significant Accounting Policies - continued
Income Tax Information and Distributions to Shareholders - continued
The federal tax cost of investment securities and unrealized appreciation (depreciation) as of period end were as follows:
Gross unrealized appreciation | $ 354,172,386 |
Gross unrealized depreciation | (75,667,186) |
Net unrealized appreciation (depreciation) on securities and other investments | $ 278,505,200 |
| |
Tax Cost | $ 1,701,681,091 |
The tax-based components of distributable earnings as of period end were as follows:
Undistributed long-term capital gain | $ 25,499,273 |
Net unrealized appreciation (depreciation) | $ 278,508,866 |
Under the recently enacted Regulated Investment Company Modernization Act of 2010 (the Act), the Fund will be permitted to carry forward capital losses incurred in taxable years beginning after December 22, 2010 for an unlimited period. However, any losses incurred during those future taxable years will be required to be utilized prior to any losses incurred in pre-enactment taxable years, which generally expire after eight years from when they are incurred. Additionally, post-enactment capital losses that are carried forward will retain their character as either short-term or long-term capital losses rather than being considered all short-term as under previous law. The Fund's first fiscal year end subject to the Act will be July 31, 2012.
The tax character of distributions paid was as follows:
| July 31, 2011 | July 31, 2010 |
Long-term Capital Gains | $ 3,013,255 | $ - |
Short-Term Trading (Redemption) Fees. Shares held by investors in the Fund less than 90 days are subject to a redemption fee equal to 1.50% of the net asset value of shares redeemed. All redemption fees, which reduce the proceeds of the shareholder redemption, are retained by the Fund and accounted for as an addition to paid in capital.
New Accounting Pronouncement. In May 2011, the Financial Accounting Standards Board issued Accounting Standard Update No. 2011-04, Fair Value Measurement (Topic 820) - Amendments to Achieve Common Fair Value Measurement and Disclosure Requirements in U.S. GAAP and IFRSs. The update changes the wording used to describe the requirements in GAAP for measuring fair value and for disclosing information about fair value measurements. The update is effective during interim and annual periods beginning after December 15, 2011. Management is currently evaluating the impact of the update's adoption on the Fund's financial statement disclosures.
Annual Report
Notes to Financial Statements - continued
4. Purchases and Sales of Investments.
Purchases and sales of securities, other than short-term securities, aggregated $1,788,943,155 and $1,761,314,998, respectively.
5. Fees and Other Transactions with Affiliates.
Management Fee. FMR and its affiliates provide the Fund with investment management related services for which the Fund pays a monthly management fee. The management fee is the sum of an individual fund fee rate that is based on an annual rate of .45% of the Fund's average net assets and a group fee rate that averaged .26% during the period. The group fee rate is based upon the average net assets of all the mutual funds advised by FMR. The group fee rate decreases as assets under management increase and increases as assets under management decrease. In addition, the management fee is subject to a performance adjustment (up to a maximum of ± .20% of the Fund's average net assets over a 36 month performance period). The upward or downward adjustment to the management fee is based on the relative investment performance of Small Cap Growth, as compared to an appropriate benchmark index. For the period, the total annual management fee rate, including the performance adjustment, was .64% of the Fund's average net assets.
Distribution and Service Plan Fees. In accordance with Rule 12b-1 of the 1940 Act, the Fund has adopted separate Distribution and Service Plans for each class of shares. Certain classes pay Fidelity Distributors Corporation (FDC), an affiliate of FMR, separate Distribution and Service Fees, each of which is based on an annual percentage of each class' average net assets. In addition, FDC may pay financial intermediaries for selling shares of the Fund and providing shareholder support services. For the period, the Distribution and Service Fee rates, total fees and amounts retained by FDC were as follows:
| Distribution
Fee | Service
Fee | Total
Fees | Retained
by FDC |
Class A | -% | .25% | $ 156,403 | $ 4,810 |
Class T | .25% | .25% | 145,496 | - |
Class B | .75% | .25% | 55,389 | 41,618 |
Class C | .75% | .25% | 224,168 | 46,361 |
| | | $ 581,456 | $ 92,789 |
Sales Load. FDC may receive a front-end sales charge of up to 5.75% for selling Class A shares, and 3.50% for selling Class T shares, some of which is paid to financial intermediaries for selling shares of the Fund. Depending on the holding period, FDC may receive contingent deferred sales charges levied on Class A, Class T, Class B, and Class C redemptions. The deferred sales charges range from 5% to 1% for Class B, 1% for Class C, 1.00% for certain purchases of Class A shares and .25% for certain purchases of Class T shares.
Annual Report
5. Fees and Other Transactions with Affiliates - continued
Sales Load - continued
For the period, sales charge amounts retained by FDC were as follows:
| Retained
by FDC |
Class A | $ 29,915 |
Class T | 6,692 |
Class B* | 11,257 |
Class C* | 2,120 |
| $ 49,984 |
* When Class B and Class C shares are initially sold, FDC pays commissions from its own resources to financial intermediaries through which the sales are made.
Transfer Agent Fees. Fidelity Investments Institutional Operations Company, Inc. (FIIOC), an affiliate of FMR, is the transfer, dividend disbursing and shareholder servicing agent for each class of the Fund. FIIOC receives account fees and asset-based fees that vary according to the account size and type of account of the shareholders of the respective classes of the Fund. FIIOC receives no fees for providing transfer agency services to Class F. FIIOC pays for typesetting, printing and mailing of shareholder reports, except proxy statements. For the period, transfer agent fees for each class were as follows:
| Amount | % of
Average
Net Assets |
Class A | $ 187,257 | .30 |
Class T | 88,193 | .30 |
Class B | 16,587 | .30 |
Class C | 67,033 | .30 |
Small Cap Growth | 3,412,823 | .25 |
Institutional Class | 85,790 | .24 |
| $ 3,857,683 | |
Accounting and Security Lending Fees. Fidelity Service Company, Inc. (FSC), an affiliate of FMR, maintains the Fund's accounting records. The accounting fee is based on the level of average net assets for the month. Under a separate contract, FSC administers the security lending program. The security lending fee is based on the number and duration of lending transactions.
Brokerage Commissions. The Fund placed a portion of its portfolio transactions with brokerage firms which are affiliates of the investment adviser. The commissions paid to these affiliated firms were $71,765 for the period.
Annual Report
Notes to Financial Statements - continued
6. Committed Line of Credit.
The Fund participates with other funds managed by FMR or an affiliate in a $4.0 billion credit facility (the "line of credit") to be utilized for temporary or emergency purposes to fund shareholder redemptions or for other short-term liquidity purposes. The Fund has agreed to pay commitment fees on its pro-rata portion of the line of credit, which amounted to $5,614 and is reflected in Miscellaneous expenses on the Statement of Operations. During the period, there were no borrowings on this line of credit.
7. Security Lending.
The Fund lends portfolio securities through a lending agent from time to time in order to earn additional income. The lending agent may loan securities to certain qualified borrowers, including Fidelity Capital Markets (FCM), a broker-dealer affiliated with the Fund. On the settlement date of the loan, the Fund receives collateral (in the form of U.S. Treasury obligations, letters of credit and/or cash) against the loaned securities and maintains collateral in an amount not less than 100% of the market value of the loaned securities during the period of the loan. The market value of the loaned securities is determined at the close of business of the Fund and any additional required collateral is delivered to the Fund on the next business day. If the borrower defaults on its obligation to return the securities loaned because of insolvency or other reasons, a fund could experience delays and costs in recovering the securities loaned or in gaining access to the collateral. Any cash collateral received is invested in the Fidelity Securities Lending Cash Central Fund. The value of loaned securities and cash collateral at period end are disclosed on the Fund's Statement of Assets and Liabilities. The value of securities loaned to FCM at period end was $2,457,312. Security lending income represents the income earned on investing cash collateral, less rebates paid to borrowers and lending agent fees associated with the loan, plus any premium payments received for lending certain types of securities. Security lending income is presented in the Statement of Operations as a component of income from Fidelity Central Funds, and includes $19,296 from securities loaned to FCM.
8. Expense Reductions.
Many of the brokers with whom FMR places trades on behalf of the Fund provided services to the Fund in addition to trade execution. These services included payments of certain expenses on behalf of the Fund totaling $205,159 for the period. In addition, through arrangements with the Fund's custodian, credits realized as a result of uninvested cash balances were used to reduce the Fund's expenses. During the period, these credits reduced the Fund's custody expenses by $308.
Annual Report
9. Distributions to Shareholders.
Distributions to shareholders of each class were as follows:
Years ended July 31, | 2011 | 2010 |
From net realized gain | | |
Class A | $ 40,130 | $ - |
Small Cap Growth | 2,420,020 | - |
Class F | 492,928 | - |
Institutional Class | 60,177 | - |
Total | $ 3,013,255 | $ - |
10. Share Transactions.
Transactions for each class of shares were as follows:
| Shares | Dollars |
Years ended July 31, | 2011 | 2010 | 2011 | 2010 |
Class A | | | | |
Shares sold | 1,459,436 | 1,755,238 | $ 22,640,692 | $ 21,749,463 |
Reinvestment of distributions | 2,323 | - | 36,172 | - |
Shares redeemed | (1,364,690) | (1,481,231) | (20,977,078) | (17,861,442) |
Net increase (decrease) | 97,069 | 274,007 | $ 1,699,786 | $ 3,888,021 |
Class T | | | | |
Shares sold | 420,613 | 492,575 | $ 6,491,294 | $ 6,056,365 |
Shares redeemed | (434,512) | (592,408) | (6,714,256) | (7,232,100) |
Net increase (decrease) | (13,899) | (99,833) | $ (222,962) | $ (1,175,735) |
Class B | | | | |
Shares sold | 25,204 | 117,304 | $ 366,276 | $ 1,414,923 |
Shares redeemed | (109,118) | (93,928) | (1,597,390) | (1,126,513) |
Net increase (decrease) | (83,914) | 23,376 | $ (1,231,114) | $ 288,410 |
Class C | | | | |
Shares sold | 469,568 | 479,633 | $ 7,154,653 | $ 5,791,649 |
Shares redeemed | (368,398) | (358,550) | (5,494,248) | (4,319,904) |
Net increase (decrease) | 101,170 | 121,083 | $ 1,660,405 | $ 1,471,745 |
Small Cap Growth | | | | |
Shares sold | 19,971,507 | 22,893,960 | $ 315,167,556 | $ 285,679,819 |
Reinvestment of distributions | 153,921 | - | 2,384,001 | - |
Shares redeemed | (31,144,660) | (28,450,958) | (483,710,319) | (351,525,118) |
Net increase (decrease) | (11,019,232) | (5,556,998) | $ (166,158,762) | $ (65,845,299) |
Annual Report
Notes to Financial Statements - continued
10. Share Transactions - continued
| Shares | Dollars |
Years ended July 31, | 2011 | 2010 | 2011 | 2010 |
Class F | | | | |
Shares sold | 11,382,202 | 8,663,528 | $ 176,012,143 | $ 109,176,128 |
Reinvestment of distributions | 31,816 | - | 492,928 | - |
Shares redeemed | (2,356,621) | (357,394) | (37,493,486) | (4,690,130) |
Net increase (decrease) | 9,057,397 | 8,306,134 | $ 139,011,585 | $ 104,485,998 |
Institutional Class | | | | |
Shares sold | 1,038,111 | 1,109,901 | $ 16,415,657 | $ 14,013,757 |
Reinvestment of distributions | 2,532 | - | 39,301 | - |
Shares redeemed | (555,221) | (871,545) | (8,700,391) | (10,548,734) |
Net increase (decrease) | 485,422 | 238,356 | $ 7,754,567 | $ 3,465,023 |
11. Other.
The Fund's organizational documents provide former and current trustees and officers with a limited indemnification against liabilities arising in connection with the performance of their duties to the Fund. In the normal course of business, the Fund may also enter into contracts that provide general indemnifications. The Fund's maximum exposure under these arrangements is unknown as this would be dependent on future claims that may be made against the Fund. The risk of material loss from such claims is considered remote.
The Fidelity Freedom Funds were the owners of record, in the aggregate, of approximately 37% of the total outstanding shares of the Fund.
Annual Report
To the Trustees of Fidelity Securities Fund and the Shareholders of Fidelity Small Cap Growth Fund:
In our opinion, the accompanying statement of assets and liabilities, including the schedule of investments, and the related statements of operations and of changes in net assets and the financial highlights present fairly, in all material respects, the financial position of Fidelity Small Cap Growth Fund (a fund of Fidelity Securities Fund) at July 31, 2011, the results of its operations for the year then ended, the changes in its net assets for each of the two years in the period then ended and the financial highlights for each of the periods indicated, in conformity with accounting principles generally accepted in the United States of America. These financial statements and financial highlights (hereafter referred to as "financial statements") are the responsibility of the Fidelity Small Cap Growth Fund's management. Our responsibility is to express an opinion on these financial statements based on our audits. We conducted our audits of these financial statements in accordance with the standards of the Public Company Accounting Oversight Board (United States). Those standards require that we plan and perform the audit to obtain reasonable assurance about whether the financial statements are free of material misstatement. An audit includes examining, on a test basis, evidence supporting the amounts and disclosures in the financial statements, assessing the accounting principles used and significant estimates made by management, and evaluating the overall financial statement presentation. We believe that our audits, which included confirmation of securities at July 31, 2011 by correspondence with the custodian and brokers, provide a reasonable basis for our opinion.
/s/PricewaterhouseCoopers LLP
PricewaterhouseCoopers LLP
Boston, Massachusetts
September 14, 2011
Annual Report
The Trustees, Members of the Advisory Board, and executive officers of the trust and fund, as applicable, are listed below. The Board of Trustees governs the fund and is responsible for protecting the interests of shareholders. The Trustees are experienced executives who meet periodically throughout the year to oversee the fund's activities, review contractual arrangements with companies that provide services to the fund, oversee management of the risks associated with such activities and contractual arrangements, and review the fund's performance. Except for James C. Curvey, each of the Trustees oversees 221 funds advised by FMR or an affiliate. Mr. Curvey oversees 419 funds advised by FMR or an affiliate.
The Trustees hold office without limit in time except that (a) any Trustee may resign; (b) any Trustee may be removed by written instrument, signed by at least two-thirds of the number of Trustees prior to such removal; (c) any Trustee who requests to be retired or who has become incapacitated by illness or injury may be retired by written instrument signed by a majority of the other Trustees; and (d) any Trustee may be removed at any special meeting of shareholders by a two-thirds vote of the outstanding voting securities of the trust. Each Trustee who is not an interested person (as defined in the 1940 Act) (Independent Trustee), shall retire not later than the last day of the calendar year in which his or her 75th birthday occurs. The Independent Trustees may waive this mandatory retirement age policy with respect to individual Trustees. The executive officers and Advisory Board Members hold office without limit in time, except that any officer and Advisory Board Member may resign or may be removed by a vote of a majority of the Trustees at any regular meeting or any special meeting of the Trustees. Except as indicated, each individual has held the office shown or other offices in the same company for the past five years.
Experience, Skills, Attributes, and Qualifications of the Fund's Trustees. The Governance and Nominating Committee has adopted a statement of policy that describes the experience, qualifications, attributes, and skills that are necessary and desirable for potential Independent Trustee candidates (Statement of Policy). The Board believes that each Trustee satisfied at the time he or she was initially elected or appointed a Trustee, and continues to satisfy, the standards contemplated by the Statement of Policy. The Governance and Nominating Committee also engages professional search firms to help identify potential Independent Trustee candidates who have the experience, qualifications, attributes, and skills consistent with the Statement of Policy. From time to time, additional criteria based on the composition and skills of the current Independent Trustees, as well as experience or skills that may be appropriate in light of future changes to board composition, business conditions, and regulatory or other developments, have also been considered by the professional search firms and the Governance and Nominating Committee. In addition, the Board takes into account the Trustees' commitment and participation in Board and committee meetings, as well as their leadership of standing and ad hoc committees throughout their tenure.
In determining that a particular Trustee was and continues to be qualified to serve as a Trustee, the Board has considered a variety of criteria, none of which, in isolation, was controlling. The Board believes that, collectively, the Trustees have balanced and diverse experience, qualifications, attributes, and skills, which allow the Board to operate effectively in governing the fund and protecting the interests of shareholders. Information about the specific experience, skills, attributes, and qualifications of each Trustee, which in each case led to the Board's conclusion that the Trustee should serve (or continue to serve) as a trustee of the fund, is provided below.
Annual Report
Trustees and Officers - continued
Board Structure and Oversight Function. James C. Curvey is an interested person (as defined in the 1940 Act) and currently serves as Acting Chairman. The Trustees have determined that an interested Chairman is appropriate and benefits shareholders because an interested Chairman has a personal and professional stake in the quality and continuity of services provided to the fund. Independent Trustees exercise their informed business judgment to appoint an individual of their choosing to serve as Chairman, regardless of whether the Trustee happens to be independent or a member of management. The Independent Trustees have determined that they can act independently and effectively without having an Independent Trustee serve as Chairman and that a key structural component for assuring that they are in a position to do so is for the Independent Trustees to constitute a substantial majority for the Board. The Independent Trustees also regularly meet in executive session. Ned C. Lautenbach serves as Chairman of the Independent Trustees and as such (i) acts as a liaison between the Independent Trustees and management with respect to matters important to the Independent Trustees and (ii) with management prepares agendas for Board meetings.
Fidelity funds are overseen by different Boards of Trustees. The fund's Board oversees Fidelity's equity and high income funds and another Board oversees Fidelity's investment-grade bond, money market, and asset allocation funds. The asset allocation funds may invest in Fidelity funds overseen by the fund's Board. The use of separate Boards, each with its own committee structure, allows the Trustees of each group of Fidelity funds to focus on the unique issues of the funds they oversee, including common research, investment, and operational issues. On occasion, the separate Boards establish joint committees to address issues of overlapping consequences for the Fidelity funds overseen by each Board.
The Trustees operate using a system of committees to facilitate the timely and efficient consideration of all matters of importance to the Trustees, the fund, and fund shareholders and to facilitate compliance with legal and regulatory requirements and oversight of the fund's activities and associated risks. The Board, acting through its committees, has charged FMR and its affiliates with (i) identifying events or circumstances the occurrence of which could have demonstrably adverse effects on the fund's business and/or reputation; (ii) implementing processes and controls to lessen the possibility that such events or circumstances occur or to mitigate the effects of such events or circumstances if they do occur; and (iii) creating and maintaining a system designed to evaluate continuously business and market conditions in order to facilitate the identification and implementation processes described in (i) and (ii) above. Because the day-to-day operations and activities of the fund are carried out by or through FMR, its affiliates and other service providers, the fund's exposure to risks is mitigated but not eliminated by the processes overseen by the Trustees. While each of the Board's committees has responsibility for overseeing different aspects of the fund's activities, oversight is exercised primarily through the Operations, Audit, and Compliance Committees. Appropriate personnel, including but not limited to the fund's Chief Compliance Officer (CCO), FMR's internal auditor, the independent accountants, the fund's Treasurer and portfolio management personnel, make periodic reports to the Board's committees, as appropriate. The responsibilities of each committee, including their oversight responsibilities, are described further under "Standing Committees of the Fund's Trustees."
Annual Report
The fund's Statement of Additional Information (SAI) includes more information about the Trustees. To request a free copy, call Fidelity at 1-800-835-5092.
Interested Trustees*:
Correspondence intended for each Trustee who is an interested person may be sent to Fidelity Investments, 82 Devonshire Street, Boston, Massachusetts 02109.
Name, Age; Principal Occupations and Other Relevant Experience+ |
James C. Curvey (76) |
| Year of Election or Appointment: 2007 Mr. Curvey is Trustee and Acting Chairman of the Board of Trustees of certain Trusts. Mr. Curvey also serves as Trustee (2007-present) of other investment companies advised by FMR. Mr. Curvey is a Director of Fidelity Investments Money Management, Inc. (2009-present), Director of Fidelity Research & Analysis Co. (2009-present) and Director of FMR and FMR Co., Inc. (2007-present). Mr. Curvey is also Vice Chairman (2007-present) and Director of FMR LLC. In addition, Mr. Curvey serves as an Overseer for the Boston Symphony Orchestra and a member of the Trustees of Villanova University. Previously, Mr. Curvey was the Vice Chairman (2006-2007) and Director (2000-2007) of FMR Corp. |
Ronald P. O'Hanley (54) |
| Year of Election or Appointment: 2011 Mr. O'Hanley is Director of FMR Co., Inc. (2010-present), Director of Fidelity Investments Money Management, Inc. (2010-present), Director of Fidelity Research & Analysis Company (2010-present), President of Fidelity Asset Management and Corporate Services and a member of Fidelity's Executive Committee (2010-present). Previously, Mr. O'Hanley served as President and Chief Executive Officer of BNY Mellon Asset Management (2007-2010). Mr. O'Hanley also served as Vice Chairman of Bank New York Mellon Corp. and a member of that firm's Executive Committee. Prior to the 2007 merger of The Bank of New York and Mellon Financial Corporation, he was Vice Chairman of Mellon Financial Corporation and President and Chief Executive Officer of Mellon Asset Management. He joined Mellon in February 1997. Mr. O'Hanley currently serves as Chairman of the Boston Public Library Foundation Board of Directors and sits on the Board of Directors of Beth Israel Deaconess Medical Center, the Board of Trustees of the Marine Biological Laboratory and the Advisory Board of the Maxwell School of Citizenship and Public Administration at Syracuse University. Mr. O'Hanley also chairs the Council on Asset Management for the Financial Services Roundtable and is a member of the Board of Directors of Institutional Investor's U.S. Institute. |
* Trustees have been determined to be "Interested Trustees" by virtue of, among other things, their affiliation with the trust or various entities under common control with FMR.
+ The information above includes each Trustee's principal occupation during the last five years and other information relating to the experience, attributes, and skills relevant to each Trustee's qualifications to serve as a Trustee, which led to the conclusion that each Trustee should serve as a Trustee for the fund.
Annual Report
Independent Trustees:
Correspondence intended for each Independent Trustee (that is, the Trustees other than the Interested Trustees) may be sent to Fidelity Investments, P.O. Box 55235, Boston, Massachusetts 02205-5235.
Name, Age; Principal Occupations and Other Relevant Experience+ |
Dennis J. Dirks (63) |
| Year of Election or Appointment: 2005 Prior to his retirement in May 2003, Mr. Dirks was Chief Operating Officer and a member of the Board of The Depository Trust & Clearing Corporation (DTCC). He also served as President, Chief Operating Officer, and Board member of The Depository Trust Company (DTC) and President and Board member of the National Securities Clearing Corporation (NSCC). In addition, Mr. Dirks served as Chief Executive Officer and Board member of the Government Securities Clearing Corporation, Chief Executive Officer and Board member of the Mortgage-Backed Securities Clearing Corporation, as a Trustee and a member of the Finance Committee of Manhattan College (2005-2008), and as a Trustee and a member of the Finance Committee of AHRC of Nassau County (2006-2008). Mr. Dirks is a member of the Independent Directors Council (IDC) Governing Council (2010-Present) and Board of Directors for The Brookville Center for Children's Services, Inc. (2009-present). |
Alan J. Lacy (57) |
| Year of Election or Appointment: 2008 Mr. Lacy serves as Senior Adviser (2007-present) of Oak Hill Capital Partners, L.P. (private equity). Mr. Lacy also served as Chief Executive Officer (2000-2005) and Vice Chairman (2005-2006) of Sears Holdings Corporation and Sears, Roebuck and Co. (retail). In addition, Mr. Lacy serves as a member of the Board of Directors of Dave & Buster's, Inc. (restaurant and entertainment complexes, 2010-present), The Hillman Companies, Inc. (hardware wholesalers, 2010-present), and Bristol-Myers Squibb Company (global pharmaceuticals, 2007-present). Mr. Lacy is a member of the Board of Trustees of The National Parks Conservation Association (2006-Present). Previously, Mr. Lacy served as Chairman of the Board of Trustees of the National Parks Conservation Association (2008-2011) and as a member of the Board of Directors for the Western Union Company (global money transfer, 2006-2011). |
Ned C. Lautenbach (67) |
| Year of Election or Appointment: 2000 Mr. Lautenbach is Chairman of the Independent Trustees of the Equity and High Income Funds (2006-present). Mr. Lautenbach currently serves as the Lead Director of the Eaton Corporation Board of Directors (diversified industrial, 1997-present). Mr. Lautenbach is also a member of the Board of Directors of the Philharmonic Center for the Arts in Naples, Florida (1999-present); a member of the Board of Trustees of Fairfield University (2005-present); and a member of the Council on Foreign Relations (1994-present). Previously, Mr. Lautenbach was a Partner/Advisory Partner at Clayton, Dubilier & Rice, LLC (private equity investment, 1998-2010), as well as a Director of Sony Corporation (2006-2007). |
Joseph Mauriello (66) |
| Year of Election or Appointment: 2008 Prior to his retirement in January 2006, Mr. Mauriello served in numerous senior management positions including Deputy Chairman and Chief Operating Officer (2004-2005), and Vice Chairman of Financial Services (2002-2004) of KPMG LLP US (professional services, 1965-2005). Mr. Mauriello currently serves as a member of the Board of Directors of XL Group plc. (global insurance and re-insurance, 2006-present) and of Arcadia Resources Inc. (health care services and products, 2007-present). Previously, Mr. Mauriello served as a Director of the Hamilton Funds of the Bank of New York (2006-2007). |
Robert W. Selander (60) |
| Year of Election or Appointment: 2011 Previously, Mr. Selander served as a Member of the Advisory Board of Fidelity's Equity and High Income Funds (2011), Executive Vice Chairman (2010), Chief Executive Officer (2009-2010), and President and Chief Executive Officer (1997-2009) of Mastercard, Inc. |
Cornelia M. Small (67) |
| Year of Election or Appointment: 2005 Ms. Small is a member of the Board of Directors of the Teagle Foundation (2009-present). Ms. Small is also a member of the Investment Committee, and Chair (2008-present) and a member of the Board of Trustees of Smith College. In addition, Ms. Small serves on the Investment Committee of the Berkshire Taconic Community Foundation (2008-present). Previously, Ms. Small served as Chairperson of the Investment Committee (2002-2008) of Smith College. In addition, Ms. Small served as Chief Investment Officer, Director of Global Equity Investments, and a member of the Board of Directors of Scudder, Stevens & Clark and Scudder Kemper Investments. |
William S. Stavropoulos (72) |
| Year of Election or Appointment: 2002 Mr. Stavropoulos is Vice Chairman of the Independent Trustees of the Equity and High Income Funds (2006-present). Mr. Stavropoulos serves as President and Founder of the Michigan Baseball Foundation, the Great Lakes Loons (2007-present). Mr. Stavropoulos is Chairman Emeritus of the Board of Directors of The Dow Chemical Company, where he previously served in numerous senior management positions, including President, CEO (1995-2000; 2002-2004), Chairman of the Executive Committee (2000-2006), and as a member of the Board of Directors (1990-2006). Currently, Mr. Stavropoulos is Chairman of Univar (global distributor of commodity and specialty chemicals, 2010-present), a Director of Teradata Corporation (data warehousing and technology solutions, 2008-present), Chemical Financial Corporation, Maersk Inc. (industrial conglomerate), Tyco International, Inc. (multinational manufacturing and services, 2007-present), and a member of the Advisory Board for Metalmark Capital (private equity investment, 2005-present). Mr. Stavropoulos is a special advisor to Clayton, Dubilier & Rice, LLC (private equity investment). In addition, Mr. Stavropoulos is a member of the University of Notre Dame Advisory Council for the College of Science. |
David M. Thomas (62) |
| Year of Election or Appointment: 2008 Previously, Mr. Thomas served as Executive Chairman (2005-2006) and Chairman and Chief Executive Officer (2000-2005) of IMS Health, Inc. (pharmaceutical and healthcare information solutions). In addition, Mr. Thomas serves as a member of the Board of Directors of Fortune Brands, Inc. (consumer products), and Interpublic Group of Companies, Inc. (marketing communication, 2004-present). |
Michael E. Wiley (60) |
| Year of Election or Appointment: 2008 Mr. Wiley also serves as a Director of Asia Pacific Exploration Consolidated (international oil and gas exploration and production, 2008-present). Mr. Wiley serves as a Director of Tesoro Corporation (independent oil refiner and marketer, 2005-present), and a Director of Bill Barrett Corporation (exploration and production, 2005-present). In addition, Mr. Wiley also serves as a Director of Post Oak Bank (privately-held bank, 2004-present). Previously, Mr. Wiley served as a member of the Board of Trustees of the University of Tulsa (2000-2006; 2007-2010), as a Senior Energy Advisor of Katzenbach Partners, LLC (consulting, 2006-2007), as an Advisory Director of Riverstone Holdings (private investment), Chairman, President, and CEO of Baker Hughes, Inc. (oilfield services, 2000-2004), and as Director of Spinnaker Exploration Company (exploration and production, 2001-2005). |
Annual Report
Trustees and Officers - continued
+ The information above includes each Trustee's principal occupation during the last five years and other information relating to the experience, attributes, and skills relevant to each Trustee's qualifications to serve as a Trustee, which led to the conclusion that each Trustee should serve as a Trustee for the fund.
Advisory Board Members and Executive Officers:
Correspondence intended for each executive officer, Edward C. Johnson 3d, and Peter S. Lynch may be sent to Fidelity Investments, 82 Devonshire Street, Boston, Massachusetts 02109.
Name, Age; Principal Occupation |
Edward C. Johnson 3d (81) |
| Year of Election or Appointment: 2011 Member of the Advisory Board of Fidelity's Equity and High Income Funds. Mr. Johnson serves as Chief Executive Officer, Chairman, and a Director of FMR LLC, and also serves as Chairman and Director of FIL Limited. Previously, Mr. Johnson served as a Trustee and Chairman of the Board of certain Fidelity Trusts, Chairman and a Director of FMR, Chairman and a Director of FMR Co., Inc., and President of FMR LLC (2006-2007). |
Peter S. Lynch (67) |
| Year of Election or Appointment: 2003 Member of the Advisory Board of Fidelity's Equity and High Income Funds. Mr. Lynch is Vice Chairman and a Director of FMR and FMR Co., Inc. In addition, Mr. Lynch serves as a Trustee of Boston College and as the Chairman of the Inner-City Scholarship Fund. Previously, Mr. Lynch served on the Special Olympics International Board of Directors (1997-2006). |
Kenneth B. Robins (41) |
| Year of Election or Appointment: 2008 President and Treasurer of Fidelity's Equity and High Income Funds. Mr. Robins also serves as President and Treasurer (2010-present) and Assistant Treasurer (2009-present) of other Fidelity funds and is an employee of Fidelity Investments (2004-present). Previously, Mr. Robins served as Deputy Treasurer of the Fidelity funds (2005-2008) and Treasurer and Chief Financial Officer of The North Carolina Capital Management Trust: Cash and Term Portfolios (2006-2008). |
Brian B. Hogan (46) |
| Year of Election or Appointment: 2009 Vice President of Equity and High Income Funds. Mr. Hogan also serves as President of FMR's Equity Division (2009-present). Previously, Mr. Hogan served as Senior Vice President, Equity Research of FMR (2006-2009) and as a portfolio manager. |
Thomas C. Hense (47) |
| Year of Election or Appointment: 2008 or 2010 Vice President of Fidelity's High Income (2008), Small Cap (2008), and Value (2010) Funds. Previously, Mr. Hense served as a portfolio manager for Fidelity's Institutional Money Management Group (Pyramis) (2003-2008). |
Scott C. Goebel (43) |
| Year of Election or Appointment: 2008 Secretary and Chief Legal Officer (CLO) of the Fidelity funds. Mr. Goebel also serves as Secretary of Fidelity Investments Money Management, Inc. (FIMM) (2010-present) and Fidelity Research and Analysis Company (FRAC) (2010-present); Secretary and CLO of The North Carolina Capital Management Trust: Cash and Term Portfolios (2008-present); General Counsel, Secretary, and Senior Vice President of FMR (2008-present) and FMR Co., Inc. (2008-present); employed by FMR LLC or an affiliate (2001-present); Chief Legal Officer of Fidelity Management & Research (Hong Kong) Limited (2008-present) and Assistant Secretary of Fidelity Management & Research (Japan) Inc. (2008-present), and Fidelity Management & Research (U.K.) Inc. (2008-present). Previously, Mr. Goebel served as Assistant Secretary of FIMM (2008-2010), FRAC (2008-2010), and the Funds (2007-2008) and as Vice President and Secretary of Fidelity Distributors Corporation (FDC) (2005-2007). |
William C. Coffey (42) |
| Year of Election or Appointment: 2009 Assistant Secretary of Fidelity's Equity and High Income Funds. Mr. Coffey also serves as Senior Vice President and Deputy General Counsel of FMR LLC (2010-present), and is an employee of Fidelity Investments. Previously, Mr. Coffey served as Vice President and Associate General Counsel of FMR LLC (2005-2009). |
Holly C. Laurent (57) |
| Year of Election or Appointment: 2008 Anti-Money Laundering (AML) Officer of the Fidelity funds. Ms. Laurent also serves as AML Officer of The North Carolina Capital Management Trust: Cash and Term Portfolios (2008-present) and is an employee of Fidelity Investments. Previously, Ms. Laurent was Senior Vice President and Head of Legal for Fidelity Business Services India Pvt. Ltd. (2006-2008), and Senior Vice President, Deputy General Counsel and Group Head for FMR LLC (2005-2006). |
Christine Reynolds (52) |
| Year of Election or Appointment: 2008 Chief Financial Officer of the Fidelity funds. Ms. Reynolds became President of Fidelity Pricing and Cash Management Services (FPCMS) in August 2008. Ms. Reynolds served as Chief Operating Officer of FPCMS (2007-2008). Previously, Ms. Reynolds served as President, Treasurer, and Anti-Money Laundering officer of the Fidelity funds (2004-2007). |
Kenneth A. Rathgeber (64) |
| Year of Election or Appointment: 2004 Chief Compliance Officer of Fidelity's Equity and High Income Funds. Mr. Rathgeber is Chief Compliance Officer of Fidelity Management & Research (Hong Kong) Limited (2008-present), Fidelity Management & Research (Japan) Inc. (2008-present), FMR (2005-present), FMR Co., Inc. (2005-present), Fidelity Management & Research (U.K.) Inc. (2005-present), Fidelity Research & Analysis Company (2005-present), Fidelity Investments Money Management, Inc. (2005-present), Pyramis Global Advisors, LLC (2005-present), and Strategic Advisers, Inc. (2005-present). |
Jeffrey S. Christian (49) |
| Year of Election or Appointment: 2009 Deputy Treasurer of the Fidelity funds. Mr. Christian is an employee of Fidelity Investments. Previously, Mr. Christian served as Chief Financial Officer (2008-2009) of certain Fidelity funds and Senior Vice President of Fidelity Pricing and Cash Management Services (FPCMS) (2004-2009). |
Bryan A. Mehrmann (50) |
| Year of Election or Appointment: 2005 Deputy Treasurer of the Fidelity funds. Mr. Mehrmann is an employee of Fidelity Investments. |
Adrien E. Deberghes (43) |
| Year of Election or Appointment: 2008 Deputy Treasurer of Fidelity's Equity and High Income Funds. Mr. Deberghes also serves as Assistant Treasurer of other Fidelity funds (2010-present) and is an employee of Fidelity Investments (2008-present). Previously, Mr. Deberghes served as Senior Vice President of Mutual Fund Administration at State Street Corporation (2007-2008), Senior Director of Mutual Fund Administration at Investors Bank & Trust (2005-2007), and Director of Finance for Dunkin' Brands (2000-2005). |
Stephanie J. Dorsey (42) |
| Year of Election or Appointment: 2010 Assistant Treasurer of Fidelity's Equity and High Income Funds. Ms. Dorsey also serves as Deputy Treasurer of other Fidelity funds (2008-present) and is an employee of Fidelity Investments (2008-present). Previously, Ms. Dorsey served as Treasurer (2004-2008) of the JPMorgan Mutual Funds and Vice President (2004-2008) of JPMorgan Chase Bank. |
John R. Hebble (53) |
| Year of Election or Appointment: 2009 Assistant Treasurer of Fidelity's Equity and High Income Funds. Mr. Hebble also serves as President (2011-present), Treasurer, and Chief Financial Officer of The North Carolina Capital Management Trust: Cash and Term Portfolios (2008-present), President and Treasurer of other Fidelity funds (2008-present) and is an employee of Fidelity Investments. |
Gary W. Ryan (52) |
| Year of Election or Appointment: 2005 Assistant Treasurer of the Fidelity funds. Mr. Ryan is an employee of Fidelity Investments. Previously, Mr. Ryan served as Vice President of Fund Reporting in Fidelity Pricing and Cash Management Services (FPCMS) (1999-2005). |
Jonathan Davis (43) |
| Year of Election or Appointment: 2010 Assistant Treasurer of the Fidelity funds. Mr. Davis is an employee of Fidelity Investments. Previously, Mr. Davis served as Vice President and Associate General Counsel of FMR LLC (2003-2010). |
Annual Report
The Board of Trustees of Fidelity Small Cap Growth Fund voted to pay to shareholders of record at the opening of business on record date, the following distributions per share derived from capital gains realized from sales of portfolio securities:
| Pay Date | Record Date | Capital Gains |
Class F | 9/12/11 | 9/09/11 | $0.234 |
Class F designates 100% of the dividends distributed during the fiscal year as qualifying for the dividends-received deduction for corporate shareholders.
Class F designates 100% of the dividends distributed during the fiscal year as amounts which may be taken into account as a dividend for purposes of the maximum rate under section 1(h)(11) of the Internal Revenue Code.
The fund hereby designates as a capital gain dividend with respect to the taxable year ended July 31, 2011, $28,512,528, or, if subsequently determined to be different, the net capital gain of such year.
The fund will notify shareholders in January 2012 of amounts for use in preparing 2011 income tax returns.
Annual Report
Board Approval of Investment Advisory Contracts and Management Fees
Fidelity Small Cap Growth Fund
Each year, the Board of Trustees, including the Independent Trustees (together, the Board), votes on the renewal of the management contract and sub-advisory agreements (together, the Advisory Contracts) for the fund. The Board, assisted by the advice of fund counsel and Independent Trustees' counsel, requests and considers a broad range of information relevant to the renewal of the Advisory Contracts throughout the year.
The Board meets regularly and considers at each of its meetings factors that are relevant to its annual consideration of the renewal of the fund's Advisory Contracts, including the services and support provided to the fund and its shareholders. The Board has established various standing committees, each composed of Independent Trustees with varying backgrounds, to which the Board has assigned specific subject matter responsibilities in order to enhance effective decision-making by the Board. The Board, acting directly and through its Committees, requests and receives information concerning the annual consideration of the renewal of the fund's Advisory Contracts. The Board also meets as needed to consider matters specifically related to the Board's annual consideration of the renewal of Advisory Contracts. Members of the Board may also meet with trustees of other Fidelity funds through ad hoc joint committees to discuss certain matters relevant to the Fidelity funds.
At its July 2011 meeting, the Board of Trustees, including the Independent Trustees, unanimously determined to renew the fund's Advisory Contracts. In reaching its determination, the Board considered all factors it believed relevant, including (i) the nature, extent, and quality of the services to be provided to the fund and its shareholders (including the investment performance of the fund); (ii) the competitiveness of the fund's management fee and total expense ratio; (iii) the total costs of the services to be provided by and the profits to be realized by Fidelity from its relationship with the fund; (iv) the extent to which economies of scale would be realized as the fund grows; and (v) whether fee levels reflect these economies of scale, if any, for the benefit of fund shareholders.
In considering whether to renew the Advisory Contracts for the fund, the Board reached a determination, with the assistance of fund counsel and Independent Trustees' counsel and through the exercise of its business judgment, that the renewal of the Advisory Contracts is in the best interests of the fund and its shareholders and that the compensation payable under the Advisory Contracts is fair and reasonable. The Board's decision to renew the Advisory Contracts was not based on any single factor, but rather was based on a comprehensive consideration of all the information provided to the Board at its meetings throughout the year. The Board, in reaching its determination to renew the Advisory Contracts, is aware that shareholders in the fund have a broad range of investment choices available to them, including a wide choice among mutual funds offered by Fidelity's competitors, and that the fund's shareholders, who have the opportunity to review and weigh the disclosure provided by the fund in its prospectus and other public disclosures, have chosen to invest in this fund, managed by Fidelity.
Annual Report
Board Approval of Investment Advisory Contracts and
Management Fees - continued
Nature, Extent, and Quality of Services Provided. The Board considered the staffing within the investment adviser, FMR, and the sub-advisers (together, the Investment Advisers), including the backgrounds of the fund's investment personnel and the fund's investment objective and discipline. The Independent Trustees also had discussions with senior management of Fidelity's investment operations and investment groups. The Board considered the structure of the portfolio manager compensation program and whether this structure provides appropriate incentives to act in the best interests of the fund.
Resources Dedicated to Investment Management and Support Services. The Board and the Fund Oversight and Research Committees reviewed the general qualifications and capabilities of the Investment Advisers' investment staff, including its size, education, experience, and resources, as well as the Investment Advisers' approach to recruiting, training, managing, and compensating investment personnel. The Board also noted that FMR has devoted increased resources to non-U.S. offices. The Board noted that Fidelity's analysts have extensive resources, tools and capabilities which allow them to conduct sophisticated quantitative and fundamental analysis, as well as credit analysis of issuers, counterparties and enhancers. The Board also believes that Fidelity's investment professionals have sufficient access to global information and data so as to provide competitive investment results over time, and that those professionals also have access to sophisticated tools which permit them to assess portfolio construction and risk and performance attribution characteristics continuously, as well as to transmit new information and research conclusions rapidly around the world. Additionally, in their deliberations, the Board considered the Investment Advisers' trading capabilities and resources which are an integral part of the investment management process.
Shareholder and Administrative Services. The Board considered (i) the nature, extent, quality, and cost of advisory, administrative, and shareholder services performed by the Investment Advisers and their affiliates under the Advisory Contracts and under separate agreements covering transfer agency, pricing and bookkeeping, and securities lending services for the fund; (ii) the nature and extent of the investment adviser's supervision of third party service providers, principally custodians and subcustodians; and (iii) the resources devoted to, and the record of compliance with, the fund's compliance policies and procedures. The Board also reviewed the allocation of fund brokerage, including allocations to brokers affiliated with the Investment Advisers, the use of brokerage commissions to pay fund expenses, and the use of "soft" commission dollars to pay for research services.
The Board noted that the growth of fund assets over time across the complex allows Fidelity to reinvest in the development of services designed to enhance the value or convenience of the Fidelity funds as investment vehicles. These services include 24-hour access to account information and market information through telephone representatives and over the Internet, investor education materials and asset allocation tools, and the expanded availability of Fidelity Investor Centers, with 35 new branches opening since 2010.
Annual Report
Investment in a Large Fund Family. The Board considered the benefits to shareholders of investing in a Fidelity fund, including the benefits of investing in a fund that is part of a large family of funds offering a variety of investment disciplines and providing a large variety of mutual fund investor services. The Board noted that Fidelity had taken, or had made recommendations that resulted in the Fidelity funds taking, a number of actions over the previous year that benefited particular funds, including (i) continuing to dedicate additional resources to investment research and support of the senior management team that oversees asset management; (ii) rationalizing product lines through the mergers of six funds into other funds; (iii) continuing to migrate the Freedom Funds to dedicated lower cost underlying funds; (iv) obtaining shareholder approval to broaden the investment strategies for Fidelity Consumer Finance Portfolio, Fidelity Emerging Asia Fund, and Fidelity Environment and Alternative Energy Portfolio; (v) contractually agreeing to reduce the management fees and impose other expense limitations on Spartan® 500 Index Fund and U.S. Bond Index Fund in connection with launching new institutional classes of these funds; (vi) changing the name, primary and supplemental benchmarks, and investment policies of Fidelity Global Strategies Fund to support the fund's flexible investment mandate and global orientation; and (vii) reducing the transfer agency account fee rates on certain accounts.
Investment Performance. The Board considered whether the fund has operated in accordance with its investment objective, as well as its record of compliance with its investment restrictions. It also reviewed the fund's absolute investment performance for each class, as well as the fund's relative investment performance for each class measured over multiple periods against (i) a broad-based securities market index, and (ii) a peer group of mutual funds deemed appropriate by Fidelity and reviewed by the Board. The following charts considered by the Board show, over the one-, three-, and five-year periods ended December 31, 2010, the cumulative total returns of Institutional Class (Class I) and Class B of the fund, the cumulative total returns of a broad-based securities market index ("benchmark"), and a range of cumulative total returns of a peer group of mutual funds identified by Morningstar, Inc. as having an investment style similar to that of the fund based on underlying portfolio holdings. The returns of Institutional Class (Class I) and Class B show the performance of the highest and lowest performing classes, respectively (based on five-year performance). The box within each chart shows the 25th percentile return (bottom of box) and the 75th percentile return (top of box) of the peer group. Returns shown above the box are in the first quartile and returns shown below the box are in the fourth quartile. The percentage beaten numbers noted below each chart correspond to the percentile box and represent the percentage of funds in the peer group whose performance was equal to or lower than that of the class indicated.
Annual Report
Board Approval of Investment Advisory Contracts and
Management Fees - continued
Fidelity Small Cap Growth Fund
The Board reviewed the fund's relative investment performance against its peer group and noted that the performance of Institutional Class (Class I) of the fund was in the third quartile for the one- and three-year periods and the second quartile for the five-year period. The Board also noted that the investment performance of the fund was lower than its benchmark for the one- and three-year periods, although the five-year cumulative total return of Institutional Class (Class I) compared favorably to its benchmark. The Board considered that the variations in performance among the fund's classes reflect the variations in class expenses, which result in lower performance for higher expense classes. The Board discussed with FMR actions that have been taken by FMR to improve the fund's disappointing performance relative to its peer group and benchmark. The Board also reviewed the fund's performance since inception as well as performance in the current year. The Board will continue to closely monitor the performance of the fund in the coming year and discuss with FMR other appropriate actions to address the performance of the fund.
The Board also considered that the fund's management fee is subject to upward or downward adjustment depending upon whether, and to what extent, the fund's investment performance for the performance period exceeds, or is exceeded by, the record (over the same period) of a Board-approved performance adjustment index. The Board noted that the performance adjustment provides FMR with a strong economic incentive to seek to achieve superior performance for the fund's shareholders and helps to more closely align the interests of FMR and the fund's shareholders.
Annual Report
Based on its review, the Board concluded that the nature, extent, and quality of services provided to the fund under the Advisory Contracts should benefit the fund's shareholders.
Competitiveness of Management Fee and Total Expense Ratio. The Board considered the fund's management fee and total expense ratio compared to "mapped groups" of competitive funds and classes. Fidelity creates "mapped groups" by combining similar Lipper investment objective categories that have comparable management fee characteristics. Combining Lipper investment objective categories aids the Board's management fee and total expense ratio comparisons by broadening the competitive group used for comparison and by reducing the number of universes to which various Fidelity funds are compared.
Management Fee. The Board considered two proprietary management fee comparisons for the 12-month periods shown in the chart below. The group of Lipper funds used by the Board for management fee comparisons is referred to below as the "Total Mapped Group." The Total Mapped Group comparison focuses on a fund's standing relative to the total universe of comparable funds available to investors in terms of gross management fees before expense reimbursements or caps, and without giving effect to the fund's performance adjustment. "TMG %" represents the percentage of funds in the Total Mapped Group that had management fees that were lower than the fund's. For example, a TMG % of 14% means that 86% of the funds in the Total Mapped Group had higher management fees than the fund. The "Asset-Size Peer Group" (ASPG) comparison focuses on a fund's standing relative to non-Fidelity funds similar in size to the fund within the Total Mapped Group. The ASPG represents at least 15% of the funds in the Total Mapped Group with comparable asset size and management fee characteristics, subject to a minimum of 50 funds (or all funds in the Total Mapped Group if fewer than 50). Additional information, such as the ASPG quartile in which the fund's management fee ranked and the impact of the fund's performance adjustment, is also included in the chart and considered by the Board.
Annual Report
Board Approval of Investment Advisory Contracts and
Management Fees - continued
Fidelity Small Cap Growth Fund
The Board noted that the fund's management fee ranked below the median of its Total Mapped Group and below the median of its ASPG for 2010. The Board also noted the effect of the fund's negative performance adjustment on the fund's management fee ranking. The Board noted that the performance adjustment for each year represents calculations for performance periods that differ from the periods shown in the performance charts above.
Based on its review, the Board concluded that the fund's management fee is fair and reasonable in light of the services that the fund receives and the other factors considered.
Total Expense Ratio. In its review of each class's total expense ratio, the Board considered the fund's management fee as well as other fund or class expenses, as applicable, such as transfer agent fees, pricing and bookkeeping fees, fund-paid 12b-1 fees, and custodial, legal, and audit fees. The Board also noted the effects of any waivers and reimbursements on fees and expenses, as well as the impact of the fund's performance adjustment. As part of its review, the Board also considered the current and historical total expense ratios of each class of the fund compared to competitive fund median expenses. Each class of the fund is compared to those funds and classes in the Total Mapped Group (used by the Board for management fee comparisons) that have a similar sales load structure.
The Board noted that the total expense ratio of each of Class A, Class B, Class C, Institutional Class, the retail class, and Class F ranked below its competitive median for 2010 and the total expense ratio of Class T ranked above its competitive median for 2010. The Board considered that various factors, including 12b-1 fees, positive or negative performance adjustments, and relatively higher other expenses in the case of small fund size, can affect total expense ratios. The Board noted that the total expense ratio of Class T was above the competitive median primarily because of higher 12b-1 fees on Class T. Class T has a higher 12b-1 fee, but a lower front-end sales charge, than traditionally priced front-end sales charge classes. The Board noted that the fund offers multiple classes, each of which has a different sales load and 12b-1 fee structure, and that the multiple structures are intended to offer a range of pricing options for the intermediary market. The Board also noted that the total expense ratios of the classes vary primarily by the level of their 12b-1 fees, although differences in transfer agent fees may also cause expenses to vary from class to class.
Annual Report
Fees Charged to Other Fidelity Clients. The Board also considered Fidelity fee structures and other information with respect to clients of FMR and its affiliates, such as other mutual funds advised or subadvised by FMR or its affiliates, pension plan clients, and other institutional clients. In March 2010, the Board created an ad hoc joint committee with the board of other Fidelity funds (the Committee) to review and compare Fidelity's institutional investment advisory business with its business of providing services to the Fidelity funds, including the differences in services provided, fees charged, and costs incurred, as well as competition in their respective marketplaces.
Based on its review of total expense ratios and fees charged to other Fidelity clients, the Board concluded that the total expense ratio of each class of the fund was reasonable, although Class T was above the median of the universe presented for comparison, in light of the services that the fund and its shareholders receive and the other factors considered, including the findings of the Committee.
Costs of the Services and Profitability. The Board considered the revenues earned and the expenses incurred by Fidelity in conducting the business of developing, marketing, distributing, managing, administering and servicing the fund and its shareholders. The Board also considered the level of Fidelity's profits in respect of all the Fidelity funds.
On an annual basis, FMR presents to the Board Fidelity's profitability for the fund. Fidelity calculates the profitability for each fund, as well as aggregate profitability for groups of Fidelity funds and all Fidelity funds, using a series of detailed revenue and cost allocation methodologies which originate with the books and records of Fidelity on which Fidelity's audited financial statements are based. The Audit Committee of the Board reviews any significant changes from the prior year's methodologies.
PricewaterhouseCoopers LLP (PwC), independent registered public accounting firm and auditor to Fidelity and certain Fidelity funds, has been engaged annually by the Board as part of the Board's assessment of Fidelity's profitability analysis. PwC's engagement includes the review and assessment of Fidelity's methodologies used in determining the revenues and expenses attributable to Fidelity's mutual fund business, and completion of agreed-upon procedures surrounding the mathematical accuracy of fund profitability and its conformity to allocation methodologies. After considering PwC's reports issued under the engagement and information provided by Fidelity, the Board concluded that while other allocation methods may also be reasonable, Fidelity's profitability methodologies are reasonable in all material respects.
Annual Report
Board Approval of Investment Advisory Contracts and
Management Fees - continued
The Board also reviewed Fidelity's non-fund businesses and fall-out benefits related to the mutual fund business as well as cases where Fidelity's affiliates may benefit from or be related to the fund's business.
The Board considered the costs of the services provided by and the profits realized by Fidelity in connection with the operation of the fund and was satisfied that the profitability was not excessive in the circumstances.
Economies of Scale. The Board considered whether there have been economies of scale in respect of the management of the Fidelity funds, whether the Fidelity funds (including the fund) have appropriately benefited from any such economies of scale, and whether there is potential for realization of any further economies of scale. The Board considered the extent to which the fund will benefit from economies of scale through increased services to the fund, through waivers or reimbursements, or through fee or expense reductions. The Board also noted that in 2009, it and the board of other Fidelity funds created an ad hoc committee (the Economies of Scale Committee) to analyze whether FMR attains economies of scale in respect of the management and servicing of the Fidelity funds, whether the Fidelity funds have appropriately benefited from such economies of scale, and whether there is potential for realization of any further economies of scale.
The Board recognized that the fund's management contract incorporates a "group fee" structure, which provides for lower group fee rates as total fund assets under FMR's management increase, and for higher group fee rates as total fund assets under FMR's management decrease. FMR calculates the group fee rates based on a tiered asset "breakpoint" schedule that varies based on asset class. The Board considered that the group fee is designed to deliver the benefits of economies of scale to fund shareholders when total Fidelity fund assets increase, even if assets of any particular fund are unchanged or have declined, because some portion of Fidelity's costs are attributable to services provided to all Fidelity funds, and all funds benefit if those costs can be allocated among more assets. The Board concluded that, given the group fee structure, fund shareholders will benefit from lower management fees as assets under FMR's management increase at the fund complex level, regardless of whether Fidelity achieves any such economies of scale.
Annual Report
The Board concluded, taking into account the analysis of the Economies of Scale Committee, that any potential economies of scale are being appropriately shared between fund shareholders and Fidelity.
Additional Information Requested by the Board. In order to develop fully the factual basis for consideration of the Fidelity funds' Advisory Contracts, the Board requested and received additional information on certain topics, including (i) fund performance trends, actions to be taken by FMR to improve certain funds' overall performance, and Fidelity's long-term strategies for certain funds; (ii) portfolio manager changes that have occurred during the past year and length of portfolio manager tenure for different categories of funds over time; (iii) Fidelity's compensation structure for portfolio managers and other key personnel and strategies for attracting and retaining non-investment personnel; (iv) the amount of the investment that each portfolio manager has made in the Fidelity fund(s) that he or she manages; (v) historical trends in Fidelity's realization of fall-out benefits; (vi) Fidelity's group fee structures and the rationale for the individual fee rates of certain funds; (vii) fund profitability methodology and the impact of certain factors on fund profitability results; (viii) trends regarding industry use of performance fee structures and Fidelity's compliance practices with respect to performance adjustment calculations; (ix) the fee structures in place for certain other Fidelity clients; and (x) explanations regarding the relative total expense ratios of certain funds and classes, total expense competitive trends, and actions that might be taken by FMR to reduce total expense ratios for certain funds and classes.
Based on its evaluation of all of the conclusions noted above, and after considering all factors it believed relevant, the Board ultimately concluded that the advisory fee structures are fair and reasonable, and that the fund's Advisory Contracts should be renewed.
Annual Report
Managing Your Investments
Fidelity offers several ways to conveniently manage your workplace benefits (including your workplace savings plan, investments, and additional services) via your telephone or PC. You can access your plan and account information and research your investments 24 hours a day.
By Phone
Fidelity provides a single toll-free number to access plan information, account balances, positions, and quotes*. It's easy to navigate the service, and on your first call, the system will help you create a personal identification number (PIN) for security.
(phone_graphic)
Fidelity Workplace
Investing
1-800-835-5092
By PC
Fidelity's web site on the Internet provides a wide range of information, including plan information, daily financial news, fund performance, interactive planning tools, and news about Fidelity products and services.
(computer_graphic)
Fidelity's Web Site
www.401k.com
* When you call the quotes line, please remember that a fund's yield and return will vary and, except for money market funds, share price will also vary. This means that you may have a gain or loss when you sell your shares. There is no assurance that money market funds will be able to maintain a stable $1 share price; an investment in a money market fund is not insured or guaranteed by the U.S. government. Total returns are historical and include changes in share price, reinvestment of dividends and capital gains distributions, and the effects of any sales charges.
Annual Report
To Write Fidelity
We'll give your correspondence immediate attention and send you written confirmation upon completion of your request.
(letter_graphic)
For Non-Retirement
Accounts
Buying shares
Fidelity Investments
P.O. Box 770001
Cincinnati, OH 45277-0003
Overnight Express
Fidelity Investments
Attn: Distribution Services
100 Crosby Parkway - KC1H
Covington, KY 41015
Selling shares
Fidelity Investments
P.O. Box 770001
Cincinnati, OH 45277-0035
Overnight Express
Fidelity Investments
Attn: Distribution Services
100 Crosby Parkway - KC1H
Covington, KY 41015
General Correspondence
Fidelity Investments
P.O. Box 500
Merrimack, NH 03054-0500
(letter_graphic)
For Retirement
Accounts
Buying shares
Fidelity Investments
P.O. Box 770001
Cincinnati, OH 45277-0003
Selling shares
Fidelity Investments
P.O. Box 770001
Cincinnati, OH 45277-0035
Overnight Express
Fidelity Investments
Attn: Distribution Services
100 Crosby Parkway - KC1H
Covington, KY 41015
General Correspondence
Fidelity Investments
P.O. Box 500
Merrimack, NH 03054-0500
Annual Report
Investment Adviser
Fidelity Management & Research Company
Boston, MA
Investment Sub-Advisers
FMR Co., Inc.
Fidelity Management & Research
(U.K.) Inc.
Fidelity Management & Research
(Hong Kong) Limited
Fidelity Management & Research
(Japan) Inc.
General Distributor
Fidelity Distributors Corporation
Boston, MA
Transfer and Service Agents
Fidelity Investments Institutional
Operating Company, Inc.
Boston, MA
Fidelity Service Company, Inc.
Boston, MA
Custodian
Citibank, N.A.
New York, NY
SCP-F-ANN-0911
1.891906.102
(Fidelity Investment logo)(registered trademark)
Fidelity Advisor®
Small Cap Growth
Fund - Class A, Class T,
Class B and Class C
Annual Report
July 31, 2011
(2_fidelity_logos) (Registered_Trademark)
Class A, Class T, Class B,
and Class C are classes
of Fidelity® Small Cap
Growth Fund
Contents
Chairman's Message | <Click Here> | The Chairman's message to shareholders. |
Performance | <Click Here> | How the fund has done over time. |
Management's Discussion of Fund Performance | <Click Here> | The Portfolio Manager's review of fundperformance and strategy. |
Shareholder Expense Example | <Click Here> | An example of shareholder expenses. |
Investment Changes | <Click Here> | A summary of major shifts in the fund's investments over the past six months. |
Investments | <Click Here> | A complete list of the fund's investments with their market values. |
Financial Statements | <Click Here> | Statements of assets and liabilities, operations, and changes in net assets,
as well as financial highlights. |
Notes | <Click Here> | Notes to the financial statements. |
Report of Independent Registered Public Accounting Firm | <Click Here> | |
Trustees and Officers | <Click Here> | |
Distributions | <Click Here> | |
Board Approval of Investment Advisory Contracts and Management Fees | <Click Here> | |
To view a fund's proxy voting guidelines and proxy voting record for the 12-month period ended June 30, visit http://www.fidelity.com/proxyvotingresults or visit the Securities and Exchange Commission's (SEC) web site at http://www.sec.gov. You may also call 1-877-208-0098 to request a free copy of the proxy voting guidelines.
Standard & Poor's, S&P and S&P 500 are registered service marks of The McGraw-Hill Companies, Inc. and have been licensed for use by Fidelity Distributors Corporation.
Other third party marks appearing herein are the property of their respective owners.
All other marks appearing herein are registered or unregistered trademarks or service marks of FMR LLC or an affiliated company.
Annual Report
This report and the financial statements contained herein are submitted for the general information of the shareholders of the fund. This report is not authorized for distribution to prospective investors in the fund unless preceded or accompanied by an effective prospectus.
A fund files its complete schedule of portfolio holdings with the SEC for the first and third quarters of each fiscal year on Form N-Q. Forms N-Q are available on the SEC's web site at http://www.sec.gov. A fund's Forms N-Q may be reviewed and copied at the SEC's Public Reference Room in Washington, DC. Information regarding the operation of the SEC's Public Reference Room may be obtained by calling 1-800-SEC-0330. For a complete list of a fund's portfolio holdings, view the most recent holdings listing, semiannual report, or annual report on Fidelity's web site at http://www.fidelity.com, http://www.advisor.fidelity.com, or http://www.401k.com, as applicable.
NOT FDIC INSURED • MAY LOSE VALUE • NO BANK GUARANTEE
Neither the fund nor Fidelity Distributors Corporation is a bank.
Annual Report
(photo_of_James_C_Curvey)
Dear Shareholder:
The second half of 2011 began with U.S. equities continuing to give back some of the gains achieved earlier in the year. In the days leading up to July 31, markets were shaken by a political stalemate in which Congress struggled to address the debt ceiling issue before an early-August deadline. The resulting uncertainty held back markets in July, the third consecutive monthly decline for equities, effectively reversing the positive momentum seen through the end of April. Financial markets are always unpredictable, of course, but there are several time-tested investment principles that can help put the odds in your favor.
One of the basic tenets is to invest for the long term. Over time, riding out the markets' inevitable ups and downs has proven much more effective than selling into panic or chasing the hottest trend. Even missing only a few of the markets' best days can significantly diminish investor returns. Patience also affords the benefits of compounding - of earning interest on additional income or reinvested dividends and capital gains. There can be tax advantages and cost benefits to consider as well. While staying the course doesn't eliminate risk, it can considerably lessen the effect of short-term declines.
You can further manage your investing risk through diversification. And today, more than ever, geographic diversification should be taken into account. Studies indicate that asset allocation is the single most important determinant of a portfolio's long-term success. The right mix of stocks, bonds and cash - aligned to your particular risk tolerance and investment objective - is very important. Age-appropriate rebalancing is also an essential aspect of asset allocation. For younger investors, an emphasis on equities - which historically have been the best-performing asset class over time - is encouraged. As investors near their specific goal, such as retirement or sending a child to college, consideration may be given to replacing volatile assets (e.g. common stocks) with more-stable fixed investments (bonds or savings plans).
A third principle - investing regularly - can help lower the average cost of your purchases. Investing a certain amount of money each month or quarter helps ensure you won't pay for all your shares at market highs. This strategy - known as dollar cost averaging - also reduces "emotion" from investing, helping shareholders avoid selling weak performers just prior to an upswing, or chasing a hot performer just before a correction.
We invite you to contact us via the Internet, through our Investor Centers or by phone. It is our privilege to provide you the information you need to make the investments that are right for you.
Sincerely,
(The acting chairman's signature appears here.)
James C. Curvey
Acting Chairman
Annual Report
Average annual total return reflects the change in the value of an investment, assuming reinvestment of the class' distributions from dividend income and capital gains (the profits earned upon the sale of securities that have grown in value, if any) and assuming a constant rate of performance each year. The $10,000 table and the fund's returns do not reflect the deduction of taxes that a shareholder would pay on fund distributions or the redemption of fund shares. During periods of reimbursement by Fidelity, a fund's total return will be greater than it would be had the reimbursement not occurred. How a fund did yesterday is no guarantee of how it will do tomorrow.
Average Annual Total Returns
Periods ended July 31, 2011 | Past 1
year | Past 5
years | Life of
fundA |
Class A (incl. 5.75% sales charge) | 22.32% | 5.26% | 8.05% |
Class T (incl. 3.50% sales charge) | 24.90% | 5.48% | 8.16% |
Class B (incl. contingent deferred sales charge) B | 23.94% | 5.39% | 8.18% |
Class C (incl. contingent deferred sales charge) C | 27.91% | 5.72% | 8.19% |
A From November 3, 2004.
B Class B shares' contingent deferred sales charges included in the past one year, past five years, and life of fund total return figures are 5%, 2%, and 1%, respectively.
C Class C shares' contingent deferred sales charges included in the past one year, past five years, and life of fund total return figures are 1%, 0%, and 0%, respectively.
Annual Report
$10,000 Over Life of Fund
Let's say hypothetically that $10,000 was invested in Fidelity Advisor® Small Cap Growth Fund - Class A on November 3, 2004, when the fund started, and the current 5.75% sales charge was paid. The chart shows how the value of your investment would have changed, and also shows how the Russell 2000® Growth Index performed over the same period.
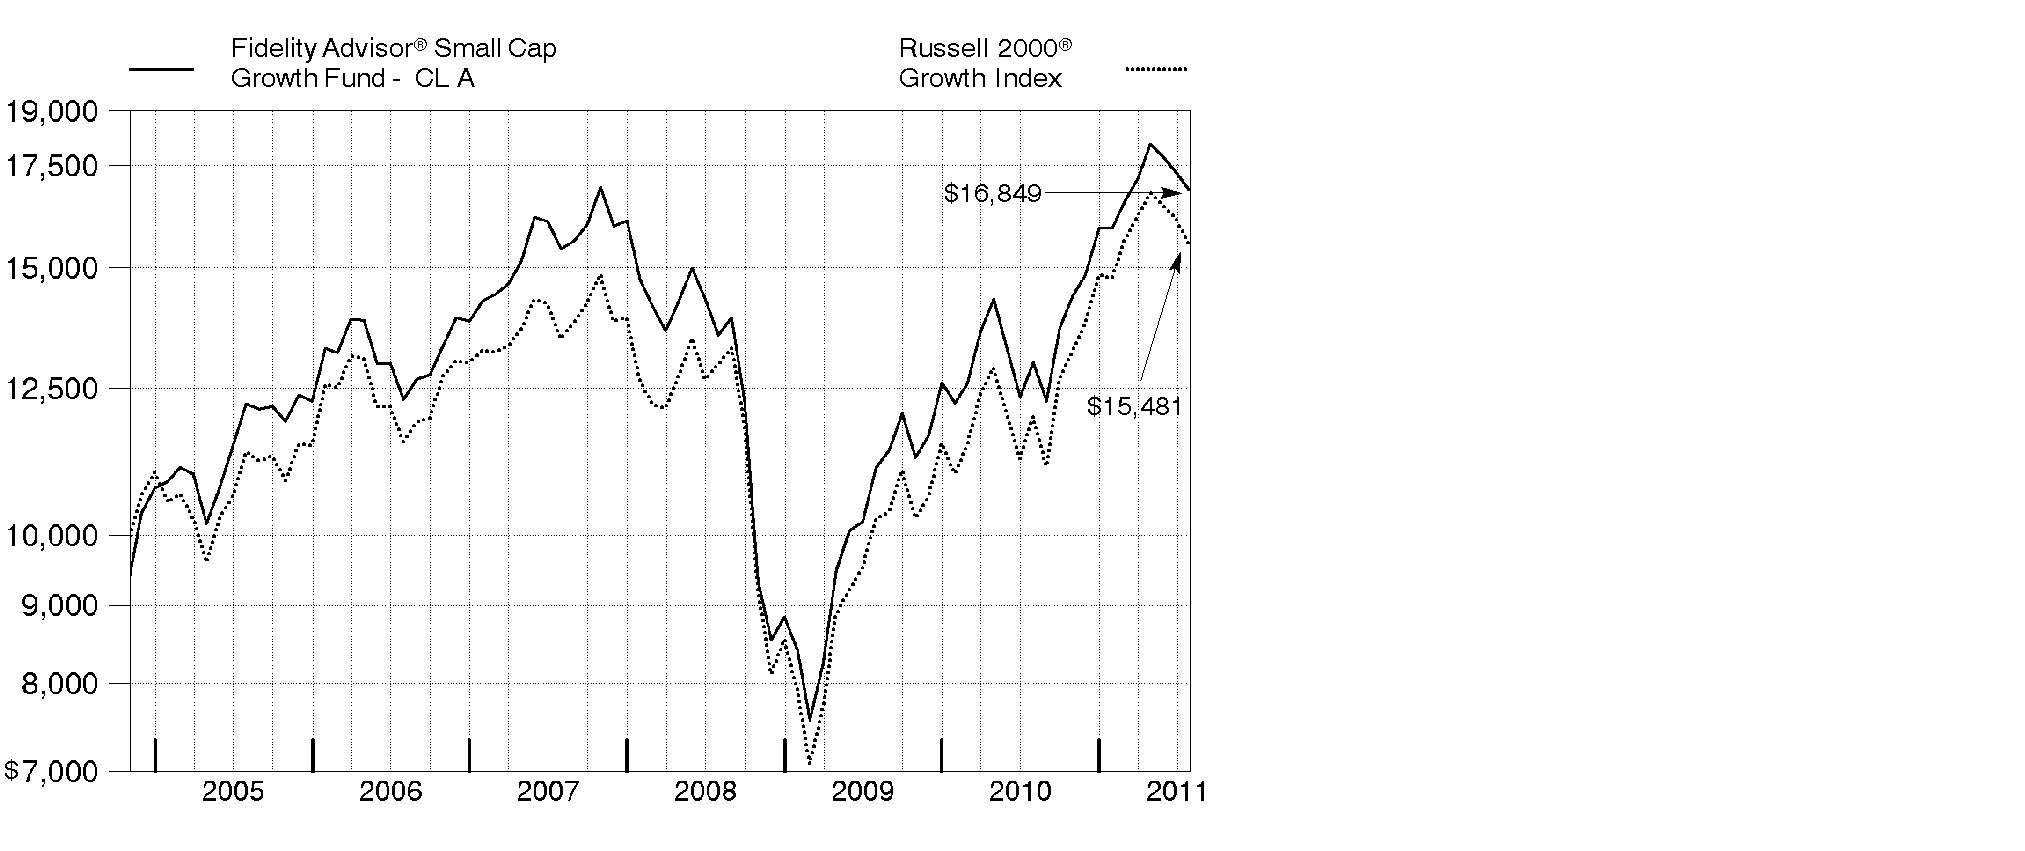
Annual Report
Market Recap: U.S. stocks registered solid double-digit gains for the 12 months ending July 31, 2011, extending a rally that began more than two years earlier. Despite a rough start in August 2010, markets turned positive in September, as increased demand for capital goods and other upbeat indicators trumped investor worry about a U.S. recessionary relapse. The broad market, as measured by the S&P 500® Index, rose 9% that month, its biggest September gain in 71 years. Seven more monthly advances followed, fueled by encouraging corporate earnings and economic activity. However, volatility picked up in the period's latter months, as markets reacted to continued high U.S. unemployment, nagging debt troubles in Europe and looming legislative battles over the federal debt ceiling. May unemployment rose above 9% for the first time in 2011, contributing to a traditional "June swoon" for stocks. Market uncertainty lingered in July, when the S&P 500® posted its second-biggest monthly loss of the period. For the full year, the S&P 500® climbed 19.65%, while the blue-chip-laden Dow Jones Industrial AverageSM rose a comparable 19.09% and the technology-heavy Nasdaq Composite® Index gained 23.40%. On the capitalization spectrum, stocks of mid-cap companies fared best, with the Russell Midcap® Index rising 24.51% and the small-cap Russell 2000® Index adding 23.92%.
Comments from Lionel Harris, Portfolio Manager of Fidelity Advisor® Small Cap Growth Fund: For the year, the fund's Class A, Class T, Class B and Class C shares returned 29.78%, 29.44%, 28.94% and 28.91%, respectively (excluding sales charges), versus 29.32% for the Russell 2000® Growth Index. The fund's positioning in consumer discretionary helped, led by stock picking in retailing. Security selection in materials also contributed, as did positioning within technology. In contrast, my choices in energy hurt, as did weak stock selection in banks; a modest cash position in a rising market; and the fund's non-U.S. holdings, despite a weaker U.S. dollar. Individually, Fossil did extremely well, and I sold the stock after it reached my target price. Tempur-Pedic International, a maker of premium foam mattresses and pillows, also helped. In health care, drugmaker Questcor Pharmaceuticals contributed, thanks to the strength of its primary product, Achtar®. Shoe retailer DSW also contributed. Of these stocks, only Questcor and DSW were in the benchmark. On the negative side, the stock of Digital River, which builds and operates electronic storefronts, did poorly. Touch-screen manufacturer Synaptics and urban-oriented retailer Citi Trends, the latter of which the fund no longer held at period end, also disappointed.
Comments from Lionel Harris, Portfolio Manager of Fidelity Advisor® Small Cap Growth Fund: For the year, the fund's Institutional Class shares returned 30.24%, outpacing the 29.32% return of the Russell 2000® Growth Index. The fund's positioning in consumer discretionary helped, led by stock picking in retail. Security selection in materials also contributed. In contrast, positioning in energy hurt, as did weak stock selection in banks; a modest cash position in a rising market; and the fund's non-U.S. holdings, despite a weaker U.S. dollar. Individually, Fossil did extremely well, and I sold the stock after it reached my target price. Tempur-Pedic International, a maker of premium foam mattresses and pillows, also helped. In health care, drugmaker Questcor Pharmaceuticals contributed, thanks to the strength of its primary product, Achtar®. Shoe retailer DSW also contributed. Of these stocks, only Questcor and DSW were in the benchmark. On the negative side, Digital River, which builds and operates electronic storefronts, did poorly. Touchscreen manufacturer Synaptics and urban-oriented retailer Citi Trends, the latter of which the fund no longer held at period end, also disappointed.
Annual Report
The views expressed above reflect those of the portfolio manager(s) only through the end of the period as stated on the cover of this report and do not necessarily represent the views of Fidelity or any other person in the Fidelity organization. Any such views are subject to change at any time based upon market or other conditions and Fidelity disclaims any responsibility to update such views. These views may not be relied on as investment advice and, because investment decisions for a Fidelity fund are based on numerous factors, may not be relied on as an indication of trading intent on behalf of any Fidelity fund.
Annual Report
Shareholder Expense Example
As a shareholder of the Fund, you incur two types of costs: (1) transaction costs, including sales charges (loads) on purchase payments or redemption proceeds, redemption fees, and (2) ongoing costs, including management fees, distribution and/or service (12b-1) fees and other Fund expenses. This Example is intended to help you understand your ongoing costs (in dollars) of investing in the Fund and to compare these costs with the ongoing costs of investing in other mutual funds.
The Example is based on an investment of $1,000 invested at the beginning of the period and held for the entire period (February 1, 2011 to July 31, 2011).
Actual Expenses
The first line of the accompanying table for each class of the Fund provides information about actual account values and actual expenses. You may use the information in this line, together with the amount you invested, to estimate the expenses that you paid over the period. Simply divide your account value by $1,000.00 (for example, an $8,600 account value divided by $1,000.00 = 8.6), then multiply the result by the number in the first line for a class of the Fund under the heading entitled "Expenses Paid During Period" to estimate the expenses you paid on your account during this period. A small balance maintenance fee of $12.00 that is charged once a year may apply for certain accounts with a value of less than $2,000. This fee is not included in the table below. If it was, the estimate of expenses you paid during the period would be higher, and your ending account value lower, by this amount. In addition, the Fund, as a shareholder in the underlying Fidelity Central Funds, will indirectly bear its pro-rata share of the fees and expenses incurred by the underlying Fidelity Central Funds. These fees and expenses are not included in the Fund's annualized expense ratio used to calculate the expense estimate in the table below.
Hypothetical Example for Comparison Purposes
The second line of the accompanying table for each class of the Fund provides information about hypothetical account values and hypothetical expenses based on a Class' actual expense ratio and an assumed rate of return of 5% per year before expenses, which is not the Class' actual return. The hypothetical account values and expenses may not be used to estimate the actual ending account balance or expenses you paid for the period. You may use this information to compare the ongoing costs of investing in the Fund and other funds. To do so, compare this 5% hypothetical example with the 5% hypothetical examples that appear in the shareholder reports of the other funds. A small balance maintenance fee of $12.00 that is charged once a year may apply for certain accounts with a value of less than $2,000. This fee is not included in the table below. If it was, the estimate of expenses you paid during the period would be higher, and your ending account value lower, by this amount. In addition, the Fund, as a shareholder in the underlying Fidelity Central Funds, will indirectly bear its pro-rata share of the fees and expenses incurred by the underlying Fidelity Central Funds. These fees and expenses are not included in the Fund's annualized expense ratio used to calculate the expense estimate in the table below.
Please note that the expenses shown in the table are meant to highlight your ongoing costs only and do not reflect any transaction costs. Therefore, the second line of the table is useful in comparing ongoing costs only, and will not help you determine the relative total costs of owning different funds. In addition, if these transactional costs were included, your costs would have been higher.
Annual Report
| Annualized
Expense Ratio | Beginning
Account Value
February 1, 2011 | Ending
Account Value
July 31, 2011 | Expenses Paid
During Period*
February 1, 2011 to
July 31, 2011 |
Class A | 1.25% | | | |
Actual | | $ 1,000.00 | $ 1,058.70 | $ 6.38 |
HypotheticalA | | $ 1,000.00 | $ 1,018.60 | $ 6.26 |
Class T | 1.50% | | | |
Actual | | $ 1,000.00 | $ 1,057.90 | $ 7.65 |
HypotheticalA | | $ 1,000.00 | $ 1,017.36 | $ 7.50 |
Class B | 2.00% | | | |
Actual | | $ 1,000.00 | $ 1,055.20 | $ 10.19 |
HypotheticalA | | $ 1,000.00 | $ 1,014.88 | $ 9.99 |
Class C | 2.00% | | | |
Actual | | $ 1,000.00 | $ 1,055.30 | $ 10.19 |
HypotheticalA | | $ 1,000.00 | $ 1,014.88 | $ 9.99 |
Small Cap Growth | .93% | | | |
Actual | | $ 1,000.00 | $ 1,060.50 | $ 4.75 |
HypotheticalA | | $ 1,000.00 | $ 1,020.18 | $ 4.66 |
Class F | .70% | | | |
Actual | | $ 1,000.00 | $ 1,061.50 | $ 3.58 |
HypotheticalA | | $ 1,000.00 | $ 1,021.32 | $ 3.51 |
Institutional Class | .95% | | | |
Actual | | $ 1,000.00 | $ 1,060.40 | $ 4.85 |
HypotheticalA | | $ 1,000.00 | $ 1,020.08 | $ 4.76 |
A 5% return per year before expenses
* Expenses are equal to each Class' annualized expense ratio, multiplied by the average account value over the period, multiplied by 181/365 (to reflect the one-half year period).
Annual Report
Investment Changes (Unaudited)
Top Ten Stocks as of July 31, 2011 |
| % of fund's
net assets | % of fund's net assets
6 months ago |
Esterline Technologies Corp. | 1.4 | 1.3 |
Rockwood Holdings, Inc. | 1.4 | 0.0 |
DSW, Inc. Class A | 1.3 | 1.0 |
Solera Holdings, Inc. | 1.3 | 1.1 |
Steven Madden Ltd. | 1.3 | 0.9 |
Catalyst Health Solutions, Inc. | 1.2 | 0.5 |
Carpenter Technology Corp. | 1.2 | 0.8 |
The Cooper Companies, Inc. | 1.2 | 1.0 |
Rowan Companies, Inc. | 1.2 | 1.1 |
Sally Beauty Holdings, Inc. | 1.2 | 0.7 |
| 12.7 | |
Top Five Market Sectors as of July 31, 2011 |
| % of fund's
net assets | % of fund's net assets
6 months ago |
Information Technology | 26.8 | 30.3 |
Industrials | 20.1 | 20.9 |
Health Care | 17.5 | 17.8 |
Consumer Discretionary | 17.0 | 16.1 |
Energy | 6.2 | 3.8 |
Asset Allocation (% of fund's net assets) |
As of July 31, 2011 * | As of January 31, 2011 ** |
| Stocks 98.7% | | | Stocks 97.5% | |
| Short-Term
Investments and
Net Other Assets 1.3% | | | Short-Term
Investments and
Net Other Assets 2.5% | |
* Foreign investments | 13.7% | | ** Foreign investments | 13.8% | |

Annual Report
Investments July 31, 2011
Showing Percentage of Net Assets
Common Stocks - 98.7% |
| Shares | | Value |
CONSUMER DISCRETIONARY - 17.0% |
Auto Components - 1.7% |
Modine Manufacturing Co. (a) | 769,000 | | $ 11,465,791 |
Tenneco, Inc. (a) | 508,000 | | 20,289,520 |
| | 31,755,311 |
Diversified Consumer Services - 0.7% |
Steiner Leisure Ltd. (a) | 278,000 | | 13,516,360 |
Household Durables - 1.0% |
Tempur-Pedic International, Inc. (a) | 242,000 | | 17,426,420 |
Internet & Catalog Retail - 0.7% |
Start Today Co. Ltd. | 540,000 | | 13,414,929 |
Multiline Retail - 1.4% |
Dollarama, Inc. | 415,000 | | 13,882,562 |
Marisa Lojas SA | 856,600 | | 12,038,345 |
| | 25,920,907 |
Specialty Retail - 7.0% |
Delticom AG | 111,910 | | 11,694,830 |
DSW, Inc. Class A (a)(d) | 442,000 | | 23,417,160 |
Jos. A. Bank Clothiers, Inc. (a)(d) | 213,900 | | 10,975,209 |
Sally Beauty Holdings, Inc. (a) | 1,242,000 | | 21,362,400 |
Signet Jewelers Ltd. (a) | 466,400 | | 19,980,576 |
SuperGroup PLC (a)(d) | 560,000 | | 9,790,502 |
Tom Tailor Holding AG (a) | 721,621 | | 15,397,388 |
Tractor Supply Co. | 240,000 | | 15,820,800 |
| | 128,438,865 |
Textiles, Apparel & Luxury Goods - 4.5% |
G-III Apparel Group Ltd. (a) | 250,300 | | 7,726,761 |
PVH Corp. | 257,559 | | 18,428,346 |
Steven Madden Ltd. (a) | 602,500 | | 22,955,250 |
Ted Baker PLC | 1,371,073 | | 18,073,550 |
Warnaco Group, Inc. (a) | 273,000 | | 14,550,900 |
| | 81,734,807 |
TOTAL CONSUMER DISCRETIONARY | | 312,207,599 |
CONSUMER STAPLES - 2.6% |
Food & Staples Retailing - 0.7% |
Fresh Market, Inc. (d) | 356,600 | | 12,669,998 |
Food Products - 0.9% |
Calavo Growers, Inc. (d)(e) | 814,046 | | 16,826,331 |
Common Stocks - continued |
| Shares | | Value |
CONSUMER STAPLES - continued |
Personal Products - 1.0% |
Inter Parfums, Inc. | 897,000 | | $ 17,975,880 |
TOTAL CONSUMER STAPLES | | 47,472,209 |
ENERGY - 6.2% |
Energy Equipment & Services - 3.3% |
ION Geophysical Corp. (a) | 2,055,000 | | 20,837,700 |
Newpark Resources, Inc. (a) | 1,928,900 | | 17,919,481 |
Rowan Companies, Inc. (a) | 556,000 | | 21,778,520 |
| | 60,535,701 |
Oil, Gas & Consumable Fuels - 2.9% |
Gulfport Energy Corp. (a) | 495,000 | | 18,047,700 |
Petroleum Development Corp. (a) | 547,200 | | 19,874,304 |
Targa Resources Corp. (d) | 474,500 | | 16,019,120 |
| | 53,941,124 |
TOTAL ENERGY | | 114,476,825 |
FINANCIALS - 3.9% |
Capital Markets - 0.6% |
Financial Engines, Inc. (a) | 510,000 | | 12,117,600 |
Commercial Banks - 1.5% |
Banco Pine SA | 1,860,300 | | 12,412,394 |
CapitalSource, Inc. | 2,385,000 | | 15,407,100 |
| | 27,819,494 |
Real Estate Investment Trusts - 0.8% |
CBL & Associates Properties, Inc. | 797,000 | | 14,154,720 |
Real Estate Management & Development - 1.0% |
Jones Lang LaSalle, Inc. | 216,900 | | 18,462,528 |
TOTAL FINANCIALS | | 72,554,342 |
HEALTH CARE - 17.5% |
Biotechnology - 2.1% |
Acadia Pharmaceuticals, Inc. (a) | 68,900 | | 112,307 |
Acorda Therapeutics, Inc. (a) | 1,000 | | 28,400 |
Affymax, Inc. (a) | 15,100 | | 99,811 |
Alnylam Pharmaceuticals, Inc. (a) | 5,400 | | 50,652 |
AMAG Pharmaceuticals, Inc. (a) | 12,700 | | 188,087 |
Ardea Biosciences, Inc. (a) | 249,263 | | 5,832,754 |
Common Stocks - continued |
| Shares | | Value |
HEALTH CARE - continued |
Biotechnology - continued |
BioMarin Pharmaceutical, Inc. (a) | 295,000 | | $ 9,212,850 |
BioMimetic Therapeutics, Inc. (a) | 52,500 | | 202,650 |
Dyax Corp. (a) | 2,300 | | 3,772 |
Emergent BioSolutions, Inc. (a) | 7,800 | | 161,070 |
Enzon Pharmaceuticals, Inc. (a) | 7,800 | | 75,816 |
Horizon Pharma, Inc. | 550,000 | | 4,972,000 |
Maxygen, Inc. | 38,400 | | 208,512 |
Momenta Pharmaceuticals, Inc. (a) | 5,700 | | 100,662 |
Myrexis, Inc. (a) | 36,900 | | 125,091 |
Myriad Genetics, Inc. (a) | 7,700 | | 163,779 |
Omeros Corp. (a) | 5,500 | | 22,330 |
PDL BioPharma, Inc. (d) | 1,560,000 | | 9,656,400 |
Repligen Corp. (a) | 19,000 | | 67,070 |
SuperGen, Inc. (a) | 73,600 | | 225,216 |
Theravance, Inc. (a)(d) | 299,000 | | 6,392,620 |
Vanda Pharmaceuticals, Inc. (a) | 29,303 | | 210,396 |
| | 38,112,245 |
Health Care Equipment & Supplies - 4.1% |
Cyberonics, Inc. (a) | 415,000 | | 11,263,100 |
Integra LifeSciences Holdings Corp. (a) | 317,400 | | 14,305,218 |
Sirona Dental Systems, Inc. (a) | 255,000 | | 12,897,900 |
The Cooper Companies, Inc. | 286,000 | | 21,876,140 |
Wright Medical Group, Inc. (a) | 1,020,000 | | 15,952,800 |
| | 76,295,158 |
Health Care Providers & Services - 6.9% |
Accretive Health, Inc. (a)(d) | 355,000 | | 10,664,200 |
Air Methods Corp. (a) | 280,000 | | 19,628,000 |
Catalyst Health Solutions, Inc. (a) | 343,000 | | 22,476,790 |
Corvel Corp. (a) | 400,000 | | 18,460,000 |
IPC The Hospitalist Co., Inc. (a) | 310,000 | | 14,021,300 |
MWI Veterinary Supply, Inc. (a) | 180,000 | | 16,030,800 |
PSS World Medical, Inc. (a) | 610,000 | | 14,597,300 |
Synergy Health PLC | 695,411 | | 10,845,074 |
| | 126,723,464 |
Life Sciences Tools & Services - 2.8% |
Bruker BioSciences Corp. (a) | 1,059,000 | | 18,235,980 |
PerkinElmer, Inc. | 704,800 | | 17,239,408 |
QIAGEN NV (a)(d) | 966,000 | | 16,364,040 |
| | 51,839,428 |
Common Stocks - continued |
| Shares | | Value |
HEALTH CARE - continued |
Pharmaceuticals - 1.6% |
Cadence Pharmaceuticals, Inc. (a)(d) | 767,693 | | $ 6,640,544 |
Cardiome Pharma Corp. (a) | 1,025,000 | | 5,096,033 |
Hikma Pharmaceuticals PLC | 262,838 | | 2,946,973 |
Questcor Pharmaceuticals, Inc. (a) | 495,000 | | 15,369,750 |
| | 30,053,300 |
TOTAL HEALTH CARE | | 323,023,595 |
INDUSTRIALS - 20.1% |
Aerospace & Defense - 4.1% |
Esterline Technologies Corp. (a) | 332,000 | | 25,354,840 |
Teledyne Technologies, Inc. (a) | 387,000 | | 20,987,010 |
TransDigm Group, Inc. (a) | 164,000 | | 14,771,480 |
Triumph Group, Inc. (d) | 258,000 | | 13,890,720 |
| | 75,004,050 |
Building Products - 1.5% |
A.O. Smith Corp. | 242,000 | | 10,035,740 |
Armstrong World Industries, Inc. | 449,000 | | 17,735,500 |
| | 27,771,240 |
Commercial Services & Supplies - 2.3% |
Higher One Holdings, Inc. (a)(d) | 695,000 | | 13,795,750 |
Sykes Enterprises, Inc. (a) | 472,621 | | 9,121,585 |
Waste Connections, Inc. | 626,500 | | 20,198,360 |
| | 43,115,695 |
Construction & Engineering - 2.5% |
Foster Wheeler AG (a) | 484,000 | | 13,116,400 |
KBR, Inc. | 595,980 | | 21,246,687 |
Outotec OYJ | 245,000 | | 12,085,130 |
| | 46,448,217 |
Electrical Equipment - 3.6% |
Acuity Brands, Inc. | 320,500 | | 15,605,145 |
GrafTech International Ltd. (a) | 705,000 | | 13,578,300 |
Regal-Beloit Corp. | 302,000 | | 18,310,260 |
Zumtobel AG | 755,596 | | 17,756,266 |
| | 65,249,971 |
Machinery - 2.1% |
Blount International, Inc. (a) | 744,000 | | 12,372,720 |
Common Stocks - continued |
| Shares | | Value |
INDUSTRIALS - continued |
Machinery - continued |
Nordson Corp. | 263,000 | | $ 13,420,890 |
Wabtec Corp. | 195,000 | | 12,581,400 |
| | 38,375,010 |
Professional Services - 0.6% |
Advisory Board Co. (a) | 205,000 | | 10,975,700 |
Road & Rail - 0.5% |
Contrans Group, Inc. Class A (d) | 1,106,800 | | 9,846,975 |
Trading Companies & Distributors - 2.9% |
Interline Brands, Inc. (a) | 127,442 | | 2,132,105 |
Rush Enterprises, Inc. Class A (a) | 928,254 | | 18,555,797 |
Watsco, Inc. | 224,000 | | 13,256,320 |
WESCO International, Inc. (a) | 382,000 | | 19,363,580 |
| | 53,307,802 |
TOTAL INDUSTRIALS | | 370,094,660 |
INFORMATION TECHNOLOGY - 26.8% |
Communications Equipment - 2.4% |
Anaren, Inc. (a) | 571,774 | | 11,441,198 |
DG FastChannel, Inc. (a) | 527,329 | | 14,902,318 |
Polycom, Inc. (a) | 699,000 | | 18,893,970 |
| | 45,237,486 |
Computers & Peripherals - 1.6% |
Super Micro Computer, Inc. (a) | 834,923 | | 11,764,065 |
Synaptics, Inc. (a)(d) | 726,000 | | 17,837,820 |
| | 29,601,885 |
Electronic Equipment & Components - 3.7% |
Fabrinet (a) | 505,000 | | 7,777,000 |
Insight Enterprises, Inc. (a) | 837,400 | | 14,093,442 |
Jabil Circuit, Inc. | 1,163,000 | | 21,294,530 |
OSI Systems, Inc. (a) | 329,000 | | 13,584,410 |
SYNNEX Corp. (a) | 432,800 | | 12,256,896 |
| | 69,006,278 |
Internet Software & Services - 6.2% |
Demand Media, Inc. (d) | 960,000 | | 9,734,400 |
Digital River, Inc. (a) | 501,000 | | 12,775,500 |
LivePerson, Inc. (a)(d) | 1,080,000 | | 13,294,800 |
Open Text Corp. (a) | 190,000 | | 12,825,099 |
Perficient, Inc. (a)(e) | 1,718,502 | | 17,202,205 |
Common Stocks - continued |
| Shares | | Value |
INFORMATION TECHNOLOGY - continued |
Internet Software & Services - continued |
Rackspace Hosting, Inc. (a)(d) | 525,000 | | $ 21,000,000 |
Sohu.com, Inc. (a) | 182,000 | | 16,398,200 |
Travelzoo, Inc. (a)(d) | 198,000 | | 10,454,400 |
| | 113,684,604 |
IT Services - 2.4% |
Virtusa Corp. (a) | 900,000 | | 17,694,000 |
WNS Holdings Ltd. sponsored ADR (a) | 613,457 | | 6,134,570 |
Wright Express Corp. (a) | 420,000 | | 20,664,000 |
| | 44,492,570 |
Semiconductors & Semiconductor Equipment - 5.1% |
Ceva, Inc. (a) | 396,700 | | 11,988,274 |
Cymer, Inc. (a) | 306,901 | | 13,512,851 |
Entegris, Inc. (a) | 2,321,500 | | 19,895,255 |
Hittite Microwave Corp. (a) | 183,821 | | 10,292,138 |
International Rectifier Corp. (a) | 533,000 | | 13,692,770 |
Semtech Corp. (a) | 461,744 | | 10,758,635 |
Standard Microsystems Corp. (a) | 557,185 | | 13,182,997 |
| | 93,322,920 |
Software - 5.4% |
Aspen Technology, Inc. (a) | 600,000 | | 9,300,000 |
BroadSoft, Inc. (a) | 344,591 | | 10,065,503 |
ebix.com, Inc. (a)(d) | 717,510 | | 14,127,772 |
Informatica Corp. (a) | 274,000 | | 14,009,620 |
Kenexa Corp. (a) | 450,000 | | 11,506,500 |
Solera Holdings, Inc. | 417,000 | | 23,301,960 |
TIBCO Software, Inc. (a) | 638,000 | | 16,613,520 |
| | 98,924,875 |
TOTAL INFORMATION TECHNOLOGY | | 494,270,618 |
MATERIALS - 4.6% |
Chemicals - 2.3% |
Rockwood Holdings, Inc. (a) | 418,000 | | 25,276,460 |
Solutia, Inc. (a) | 797,000 | | 17,087,680 |
| | 42,364,140 |
Common Stocks - continued |
| Shares | | Value |
MATERIALS - continued |
Metals & Mining - 2.3% |
Carpenter Technology Corp. | 382,000 | | $ 21,942,080 |
Royal Gold, Inc. | 323,000 | | 20,704,300 |
| | 42,646,380 |
TOTAL MATERIALS | | 85,010,520 |
TOTAL COMMON STOCKS (Cost $1,533,825,944) | 1,819,110,368 |
Money Market Funds - 8.7% |
| | | |
Fidelity Cash Central Fund, 0.14% (b) | 45,332,402 | | 45,332,402 |
Fidelity Securities Lending Cash Central Fund, 0.15% (b)(c) | 115,743,521 | | 115,743,521 |
TOTAL MONEY MARKET FUNDS (Cost $161,075,923) | 161,075,923 |
TOTAL INVESTMENT PORTFOLIO - 107.4% (Cost $1,694,901,867) | | 1,980,186,291 |
NET OTHER ASSETS (LIABILITIES) - (7.4)% | | (137,048,070) |
NET ASSETS - 100% | $ 1,843,138,221 |
Legend |
(a) Non-income producing |
(b) Affiliated fund that is available only to investment companies and other accounts managed by Fidelity Investments. The rate quoted is the annualized seven-day yield of the fund at period end. A complete unaudited listing of the fund's holdings as of its most recent quarter end is available upon request. In addition, each Fidelity Central Fund's financial statements, which are not covered by the Fund's Report of Independent Registered Public Accounting Firm, are available on the SEC's website or upon request. |
(c) Investment made with cash collateral received from securities on loan. |
(d) Security or a portion of the security is on loan at period end. |
(e) Affiliated company |
Affiliated Central Funds |
Information regarding fiscal year to date income earned by the Fund from investments in Fidelity Central Funds is as follows: |
Fund | Income earned |
Fidelity Cash Central Fund | $ 90,582 |
Fidelity Securities Lending Cash Central Fund | 1,308,812 |
Total | $ 1,399,394 |
Other Affiliated Issuers |
An affiliated company is a company in which the Fund has ownership of at least 5% of the voting securities. Fiscal year to date transactions with companies which are or were affiliates are as follows: |
Affiliate | Value,
beginning of
period | Purchases | Sales
Proceeds | Dividend
Income | Value,
end of
period |
Calavo Growers, Inc. | $ 12,651,852 | $ 4,843,498 | $ - | $ 351,475 | $ 16,826,331 |
Online Resources Corp. | 7,777,946 | 567,018 | 12,586,965 | - | - |
Perficient, Inc. | 13,394,542 | 1,718,096 | - | - | 17,202,205 |
Total | $ 33,824,340 | $ 7,128,612 | $ 12,586,965 | $ 351,475 | $ 34,028,536 |
Other Information |
All investments are categorized as Level 1 under the Fair Value Hierarchy. The inputs or methodology used for valuing securities may not be an indication of the risk associated with investing in those securities. For more information on valuation inputs, please refer to the Security Valuation section in the accompanying Notes to Financial Statements. |
Distribution of investments by country of issue, as a percentage of total net assets, is as follows: (Unaudited) |
United States of America | 86.3% |
Canada | 2.3% |
United Kingdom | 2.2% |
Germany | 1.4% |
Brazil | 1.3% |
Bermuda | 1.1% |
Austria | 1.0% |
Others (Individually Less Than 1%) | 4.4% |
| 100.0% |
Income Tax Information |
The Fund intends to elect to defer to its fiscal year ending July 31, 2012 approximately $848,304 of currency losses recognized during the period November 1, 2010 to July 31, 2011. |
See accompanying notes which are an integral part of the financial statements.
Annual Report
Statement of Assets and Liabilities
| July 31, 2011 |
| | |
Assets | | |
Investment in securities, at value (including securities loaned of $112,721,987) - See accompanying schedule: Unaffiliated issuers (cost $1,500,388,101) | $ 1,785,081,832 | |
Fidelity Central Funds (cost $161,075,923) | 161,075,923 | |
Other affiliated issuers (cost $33,437,843) | 34,028,536 | |
Total Investments (cost $1,694,901,867) | | $ 1,980,186,291 |
Cash | | 1,964,053 |
Receivable for investments sold | | 19,020,388 |
Receivable for fund shares sold | | 1,316,311 |
Dividends receivable | | 824,348 |
Distributions receivable from Fidelity Central Funds | | 197,247 |
Other receivables | | 74,114 |
Total assets | | 2,003,582,752 |
| | |
Liabilities | | |
Payable for investments purchased | $ 30,247,562 | |
Payable for fund shares redeemed | 12,682,146 | |
Accrued management fee | 1,278,818 | |
Distribution and service plan fees payable | 54,160 | |
Other affiliated payables | 363,790 | |
Other payables and accrued expenses | 74,534 | |
Collateral on securities loaned, at value | 115,743,521 | |
Total liabilities | | 160,444,531 |
| | |
Net Assets | | $ 1,843,138,221 |
Net Assets consist of: | | |
Paid in capital | | $ 1,539,978,386 |
Accumulated net investment loss | | (848,304) |
Accumulated undistributed net realized gain (loss) on investments and foreign currency transactions | | 18,720,049 |
Net unrealized appreciation (depreciation) on investments and assets and liabilities in foreign currencies | | 285,288,090 |
Net Assets | | $ 1,843,138,221 |
See accompanying notes which are an integral part of the financial statements.
Annual Report
Statement of Assets and Liabilities - continued
| July 31, 2011 |
| | |
Calculation of Maximum Offering Price Class A:
Net Asset Value and redemption price per share ($67,272,316 ÷ 4,096,233 shares) | | $ 16.42 |
| | |
Maximum offering price per share (100/94.25 of $16.42) | | $ 17.42 |
Class T:
Net Asset Value and redemption price per share ($30,763,609 ÷ 1,890,561 shares) | | $ 16.27 |
| | |
Maximum offering price per share (100/96.50 of $16.27) | | $ 16.86 |
Class B:
Net Asset Value and offering price per share ($5,295,068 ÷ 333,961 shares)A | | $ 15.86 |
| | |
Class C:
Net Asset Value and offering price per share ($24,913,614 ÷ 1,574,146 shares)A | | $ 15.83 |
| | |
Small Cap Growth:
Net Asset Value, offering price and redemption price per share ($1,382,688,082 ÷ 83,048,741 shares) | | $ 16.65 |
| | |
Class F:
Net Asset Value, offering price and redemption price per share ($290,765,137 ÷ 17,378,109 shares) | | $ 16.73 |
| | |
Institutional Class:
Net Asset Value, offering price and redemption price per share ($41,440,395 ÷ 2,484,480 shares) | | $ 16.68 |
A Redemption price per share is equal to net asset value less any applicable contingent deferred sales charge.
See accompanying notes which are an integral part of the financial statements.
Annual Report
Financial Statements - continued
Statement of Operations
| Year ended July 31, 2011 |
| | |
Investment Income | | |
Dividends (including $351,475 earned from other affiliated issuers) | | $ 9,421,086 |
Special dividends | | 2,295,657 |
Interest | | 70 |
Income from Fidelity Central Funds (including $1,308,812 from security lending) | | 1,399,394 |
Total income | | 13,116,207 |
| | |
Expenses | | |
Management fee
Basic fee | $ 12,213,765 | |
Performance adjustment | (1,097,151) | |
Transfer agent fees | 3,857,683 | |
Distribution and service plan fees | 581,456 | |
Accounting and security lending fees | 552,489 | |
Custodian fees and expenses | 119,815 | |
Independent trustees' compensation | 9,001 | |
Registration fees | 106,385 | |
Audit | 57,065 | |
Legal | 6,456 | |
Miscellaneous | 17,324 | |
Total expenses before reductions | 16,424,288 | |
Expense reductions | (205,467) | 16,218,821 |
Net investment income (loss) | | (3,102,614) |
Realized and Unrealized Gain (Loss) Net realized gain (loss) on: | | |
Investment securities: | | |
Unaffiliated issuers | 220,513,485 | |
Other affiliated issuers | 1,387,149 | |
Foreign currency transactions | (835,104) | |
Total net realized gain (loss) | | 221,065,530 |
Change in net unrealized appreciation (depreciation) on: Investment securities | 210,248,116 | |
Assets and liabilities in foreign currencies | 5,252 | |
Total change in net unrealized appreciation (depreciation) | | 210,253,368 |
Net gain (loss) | | 431,318,898 |
Net increase (decrease) in net assets resulting from operations | | $ 428,216,284 |
See accompanying notes which are an integral part of the financial statements.
Annual Report
Statement of Changes in Net Assets
| Year ended
July 31,
2011 | Year ended
July 31,
2010 |
Increase (Decrease) in Net Assets | | |
Operations | | |
Net investment income (loss) | $ (3,102,614) | $ (4,269,128) |
Net realized gain (loss) | 221,065,530 | 242,038,859 |
Change in net unrealized appreciation (depreciation) | 210,253,368 | (34,116,702) |
Net increase (decrease) in net assets resulting
from operations | 428,216,284 | 203,653,029 |
Distributions to shareholders from net realized gain | (3,013,255) | - |
Share transactions - net increase (decrease) | (17,486,495) | 46,578,163 |
Redemption fees | 229,000 | 232,258 |
Total increase (decrease) in net assets | 407,945,534 | 250,463,450 |
| | |
Net Assets | | |
Beginning of period | 1,435,192,687 | 1,184,729,237 |
End of period (including accumulated net investment loss of $848,304 and undistributed net investment income of $0, respectively) | $ 1,843,138,221 | $ 1,435,192,687 |
See accompanying notes which are an integral part of the financial statements.
Annual Report
Financial Highlights - Class A
Years ended July 31, | 2011 | 2010 | 2009 | 2008 | 2007 |
Selected Per-Share Data | | | | | |
Net asset value, beginning of period | $ 12.66 | $ 10.79 | $ 13.20 | $ 16.06 | $ 12.88 |
Income from Investment Operations | | | | | |
Net investment income (loss) C | (.07) F | (.07) G | (.06) | (.11) | (.12) H |
Net realized and unrealized gain (loss) | 3.84 | 1.94 | (2.35) | (1.73) | 3.39 |
Total from investment operations | 3.77 | 1.87 | (2.41) | (1.84) | 3.27 |
Distributions from net realized gain | (.01) K | - | - | (1.02) | (.09) |
Redemption fees added to paid in capital C,J | - | - | - | - | - |
Net asset value, end of period | $ 16.42 | $ 12.66 | $ 10.79 | $ 13.20 | $ 16.06 |
Total Return A,B | 29.78% | 17.33% | (18.26)% | (12.26)% | 25.52% |
Ratios to Average Net Assets D,I | | | | | |
Expenses before reductions | 1.25% | 1.35% | 1.33% | 1.40% | 1.44% |
Expenses net of fee waivers, if any | 1.25% | 1.35% | 1.33% | 1.40% | 1.40% |
Expenses net of all reductions | 1.23% | 1.34% | 1.33% | 1.39% | 1.39% |
Net investment income (loss) | (.47)% F | (.56)% G | (.64)% | (.74)% | (.80)% H |
Supplemental Data | | | | | |
Net assets, end of period (000 omitted) | $ 67,272 | $ 50,620 | $ 40,211 | $ 42,187 | $ 33,588 |
Portfolio turnover rate E | 106% | 105% | 150% | 113% | 91% |
A Total returns would have been lower if certain expenses had not been reduced during the applicable periods shown.
B Total returns do not include the effect of the sales charges.
C Calculated based on average shares outstanding during the period.
D Fees and expenses of any underlying Fidelity Central Funds are not included in the Fund's expense ratio. The Fund indirectly bears its proportionate share of the expenses of any underlying Fidelity Central Funds.
E Amount does not include the portfolio activity of any underlying Fidelity Central Funds.
F Investment income per share reflects a special dividend which amounted to $.02 per share. Excluding the special dividend, the ratio of net investment income (loss) to average net assets would have been (.61)%.
G Investment income per share reflects a special dividend which amounted to $.01 per share. Excluding the special dividend, the ratio of net investment income (loss) to average net assets would have been (.67)%.
H Investment income per share reflects a special dividend which amounted to $.01 per share. Excluding the special dividend, the ratio of net investment income (loss) to average net assets would have been (.84)%.
I Expense ratios reflect operating expenses of the class. Expenses before reductions do not reflect amounts reimbursed by the investment adviser or reductions from brokerage service arrangements or reductions from other expense offset arrangements and do not represent the amount paid by the class during periods when reimbursements or reductions occur. Expenses net of fee waivers reflect expenses after reimbursement by the investment adviser but prior to reductions from brokerage service arrangements or other expense offset arrangements. Expenses net of all reductions represent the net expenses paid by the class.
J Amount represents less than $.01 per share.
K The amount shown reflects certain reclassifications related to book to tax differences.
See accompanying notes which are an integral part of the financial statements.
Annual Report
Financial Highlights - Class T
Years ended July 31, | 2011 | 2010 | 2009 | 2008 | 2007 |
Selected Per-Share Data | | | | | |
Net asset value, beginning of period | $ 12.57 | $ 10.74 | $ 13.17 | $ 16.01 | $ 12.86 |
Income from Investment Operations | | | | | |
Net investment income (loss) C | (.11) F | (.10) G | (.09) | (.15) | (.16) H |
Net realized and unrealized gain (loss) | 3.81 | 1.93 | (2.34) | (1.73) | 3.38 |
Total from investment operations | 3.70 | 1.83 | (2.43) | (1.88) | 3.22 |
Distributions from net realized gain | - | - | - | (.96) | (.07) |
Redemption fees added to paid in capital C,J | - | - | - | - | - |
Net asset value, end of period | $ 16.27 | $ 12.57 | $ 10.74 | $ 13.17 | $ 16.01 |
Total Return A,B | 29.44% | 17.04% | (18.45)% | (12.50)% | 25.18% |
Ratios to Average Net Assets D,I | | | | | |
Expenses before reductions | 1.50% | 1.61% | 1.60% | 1.65% | 1.67% |
Expenses net of fee waivers, if any | 1.50% | 1.61% | 1.60% | 1.65% | 1.65% |
Expenses net of all reductions | 1.49% | 1.60% | 1.59% | 1.65% | 1.65% |
Net investment income (loss) | (.73)% F | (.82)% G | (.91)% | (.99)% | (1.05)% H |
Supplemental Data | | | | | |
Net assets, end of period (000 omitted) | $ 30,764 | $ 23,930 | $ 21,533 | $ 21,754 | $ 26,419 |
Portfolio turnover rate E | 106% | 105% | 150% | 113% | 91% |
A Total returns would have been lower if certain expenses had not been reduced during the applicable periods shown.
B Total returns do not include the effect of the sales charges.
C Calculated based on average shares outstanding during the period.
D Fees and expenses of any underlying Fidelity Central Funds are not included in the Fund's expense ratio. The Fund indirectly bears its proportionate share of the expenses of any underlying Fidelity Central Funds.
E Amount does not include the portfolio activity of any underlying Fidelity Central Funds.
F Investment income per share reflects a special dividend which amounted to $.02 per share. Excluding the special dividend, the ratio of net investment income (loss) to average net assets would have been (.86)%.
G Investment income per share reflects a special dividend which amounted to $.01 per share. Excluding the special dividend, the ratio of net investment income (loss) to average net assets would have been (.93)%.
H Investment income per share reflects a special dividend which amounted to $.01 per share. Excluding the special dividend, the ratio of net investment income (loss) to average net assets would have been (1.09)%.
I Expense ratios reflect operating expenses of the class. Expenses before reductions do not reflect amounts reimbursed by the investment adviser or reductions from brokerage service arrangements or reductions from other expense offset arrangements and do not represent the amount paid by the class during periods when reimbursements or reductions occur. Expenses net of fee waivers reflect expenses after reimbursement by the investment adviser but prior to reductions from brokerage service arrangements or other expense offset arrangements. Expenses net of all reductions represent the net expenses paid by the class.
J Amount represents less than $.01 per share.
See accompanying notes which are an integral part of the financial statements.
Annual Report
Financial Highlights - Class B
Years ended July 31, | 2011 | 2010 | 2009 | 2008 | 2007 |
Selected Per-Share Data | | | | | |
Net asset value, beginning of period | $ 12.30 | $ 10.57 | $ 13.03 | $ 15.85 | $ 12.78 |
Income from Investment Operations | | | | | |
Net investment income (loss) C | (.18) F | (.16) G | (.13) | (.22) | (.23) H |
Net realized and unrealized gain (loss) | 3.74 | 1.89 | (2.33) | (1.71) | 3.36 |
Total from investment operations | 3.56 | 1.73 | (2.46) | (1.93) | 3.13 |
Distributions from net realized gain | - | - | - | (.89) | (.06) |
Redemption fees added to paid in capital C,J | - | - | - | - | - |
Net asset value, end of period | $ 15.86 | $ 12.30 | $ 10.57 | $ 13.03 | $ 15.85 |
Total Return A,B | 28.94% | 16.37% | (18.88)% | (12.92)% | 24.57% |
Ratios to Average Net Assets D,I | | | | | |
Expenses before reductions | 2.00% | 2.11% | 2.08% | 2.15% | 2.20% |
Expenses net of fee waivers, if any | 2.00% | 2.11% | 2.08% | 2.15% | 2.15% |
Expenses net of all reductions | 1.98% | 2.09% | 2.08% | 2.15% | 2.15% |
Net investment income (loss) | (1.22)% F | (1.32)% G | (1.39)% | (1.49)% | (1.55)% H |
Supplemental Data | | | | | |
Net assets, end of period (000 omitted) | $ 5,295 | $ 5,142 | $ 4,171 | $ 5,517 | $ 6,242 |
Portfolio turnover rate E | 106% | 105% | 150% | 113% | 91% |
A Total returns would have been lower if certain expenses had not been reduced during the applicable periods shown.
B Total returns do not include the effect of the contingent deferred sales charge.
C Calculated based on average shares outstanding during the period.
D Fees and expenses of any underlying Fidelity Central Funds are not included in the Fund's expense ratio. The Fund indirectly bears its proportionate share of the expenses of any underlying Fidelity Central Funds.
E Amount does not include the portfolio activity of any underlying Fidelity Central Funds.
F Investment income per share reflects a special dividend which amounted to $.02 per share. Excluding the special dividend, the ratio of net investment income (loss) to average net assets would have been (1.36)%.
G Investment income per share reflects a special dividend which amounted to $.01 per share. Excluding the special dividend, the ratio of net investment income (loss) to average net assets would have been (1.42)%.
H Investment income per share reflects a special dividend which amounted to $.01 per share. Excluding the special dividend, the ratio of net investment income (loss) to average net assets would have been (1.59)%.
I Expense ratios reflect operating expenses of the class. Expenses before reductions do not reflect amounts reimbursed by the investment adviser or reductions from brokerage service arrangements or reductions from other expense offset arrangements and do not represent the amount paid by the class during periods when reimbursements or reductions occur. Expenses net of fee waivers reflect expenses after reimbursement by the investment adviser but prior to reductions from brokerage service arrangements or other expense offset arrangements. Expenses net of all reductions represent the net expenses paid by the class.
J Amount represents less than $.01 per share.
See accompanying notes which are an integral part of the financial statements.
Annual Report
Financial Highlights - Class C
Years ended July 31, | 2011 | 2010 | 2009 | 2008 | 2007 |
Selected Per-Share Data | | | | | |
Net asset value, beginning of period | $ 12.28 | $ 10.55 | $ 13.00 | $ 15.84 | $ 12.77 |
Income from Investment Operations | | | | | |
Net investment income (loss) C | (.18) F | (.16) G | (.13) | (.22) | (.23) H |
Net realized and unrealized gain (loss) | 3.73 | 1.89 | (2.32) | (1.71) | 3.36 |
Total from investment operations | 3.55 | 1.73 | (2.45) | (1.93) | 3.13 |
Distributions from net realized gain | - | - | - | (.91) | (.06) |
Redemption fees added to paid in capital C,J | - | - | - | - | - |
Net asset value, end of period | $ 15.83 | $ 12.28 | $ 10.55 | $ 13.00 | $ 15.84 |
Total Return A,B | 28.91% | 16.40% | (18.85)% | (12.94)% | 24.59% |
Ratios to Average Net Assets D,I | | | | | |
Expenses before reductions | 2.00% | 2.11% | 2.08% | 2.15% | 2.20% |
Expenses net of fee waivers, if any | 2.00% | 2.11% | 2.08% | 2.15% | 2.15% |
Expenses net of all reductions | 1.98% | 2.09% | 2.07% | 2.14% | 2.14% |
Net investment income (loss) | (1.22)% F | (1.32)% G | (1.39)% | (1.49)% | (1.55)% H |
Supplemental Data | | | | | |
Net assets, end of period (000 omitted) | $ 24,914 | $ 18,091 | $ 14,267 | $ 15,946 | $ 22,348 |
Portfolio turnover rate E | 106% | 105% | 150% | 113% | 91% |
A Total returns would have been lower if certain expenses had not been reduced during the applicable periods shown.
B Total returns do not include the effect of the contingent deferred sales charge.
C Calculated based on average shares outstanding during the period.
D Fees and expenses of any underlying Fidelity Central Funds are not included in the Fund's expense ratio. The Fund indirectly bears its proportionate share of the expenses of any underlying Fidelity Central Funds.
E Amount does not include the portfolio activity of any underlying Fidelity Central Funds.
F Investment income per share reflects a special dividend which amounted to $.02 per share. Excluding the special dividend, the ratio of net investment income (loss) to average net assets would have been (1.36)%.
G Investment income per share reflects a special dividend which amounted to $.01 per share. Excluding the special dividend, the ratio of net investment income (loss) to average net assets would have been (1.42)%.
H Investment income per share reflects a special dividend which amounted to $.01 per share. Excluding the special dividend, the ratio of net investment income (loss) to average net assets would have been (1.59)%.
I Expense ratios reflect operating expenses of the class. Expenses before reductions do not reflect amounts reimbursed by the investment adviser or reductions from brokerage service arrangements or reductions from other expense offset arrangements and do not represent the amount paid by the class during periods when reimbursements or reductions occur. Expenses net of fee waivers reflect expenses after reimbursement by the investment adviser but prior to reductions from brokerage service arrangements or other expense offset arrangements. Expenses net of all reductions represent the net expenses paid by the class.
J Amount represents less than $.01 per share.
See accompanying notes which are an integral part of the financial statements.
Annual Report
Financial Highlights - Small Cap Growth
Years ended July 31, | 2011 | 2010 | 2009 | 2008 | 2007 |
Selected Per-Share Data | | | | | |
Net asset value, beginning of period | $ 12.81 | $ 10.89 | $ 13.29 | $ 16.15 | $ 12.93 |
Income from Investment Operations | | | | | |
Net investment income (loss) B | (.03) E | (.04) F | (.04) | (.07) | (.08) G |
Net realized and unrealized gain (loss) | 3.90 | 1.96 | (2.36) | (1.74) | 3.40 |
Total from investment operations | 3.87 | 1.92 | (2.40) | (1.81) | 3.32 |
Distributions from net realized gain | (.03) J | - | - | (1.05) | (.10) |
Redemption fees added to paid in capital B,I | - | - | - | - | - |
Net asset value, end of period | $ 16.65 | $ 12.81 | $ 10.89 | $ 13.29 | $ 16.15 |
Total Return A | 30.20% | 17.63% | (18.06)% | (11.98)% | 25.84% |
Ratios to Average Net Assets C,H | | | | |
Expenses before reductions | .95% | 1.08% | 1.08% | 1.11% | 1.10% |
Expenses net of fee waivers, if any | .95% | 1.08% | 1.08% | 1.11% | 1.10% |
Expenses net of all reductions | .93% | 1.07% | 1.08% | 1.10% | 1.09% |
Net investment income (loss) | (.17)% E | (.29)% F | (.39)% | (.45)% | (.50)% G |
Supplemental Data | | | | | |
Net assets, end of period (000 omitted) | $ 1,382,688 | $ 1,204,818 | $ 1,085,184 | $ 1,217,520 | $ 1,149,809 |
Portfolio turnover rate D | 106% | 105% | 150% | 113% | 91% |
A Total returns would have been lower if certain expenses had not been reduced during the applicable periods shown.
B Calculated based on average shares outstanding during the period.
C Fees and expenses of any underlying Fidelity Central Funds are not included in the Fund's expense ratio. The Fund indirectly bears its proportionate share of the expenses of any underlying Fidelity Central Funds.
D Amount does not include the portfolio activity of any underlying Fidelity Central Funds.
E Investment income per share reflects a special dividend which amounted to $.02 per share. Excluding the special dividend, the ratio of net investment income (loss) to average net assets would have been (.31)%.
F Investment income per share reflects a special dividend which amounted to $.01 per share. Excluding the special dividend, the ratio of net investment income (loss) to average net assets would have been (.39)%.
G Investment income per share reflects a special dividend which amounted to $.01 per share. Excluding the special dividend, the ratio of net investment income (loss) to average net assets would have been (.54)%.
H Expense ratios reflect operating expenses of the class. Expenses before reductions do not reflect amounts reimbursed by the investment adviser or reductions from brokerage service arrangements or reductions from other expense offset arrangements and do not represent the amount paid by the class during periods when reimbursements or reductions occur. Expenses net of fee waivers reflect expenses after reimbursement by the investment adviser but prior to reductions from brokerage service arrangements or other expense offset arrangements. Expenses net of all reductions represent the net expenses paid by the class.
I Amount represents less than $.01 per share.
J The amount shown reflects certain reclassifications related to book to tax differences.
See accompanying notes which are an integral part of the financial statements.
Annual Report
Financial Highlights - Class F
Years ended July 31, | 2011 | 2010 | 2009 J |
Selected Per-Share Data | | | |
Net asset value, beginning of period | $ 12.85 | $ 10.90 | $ 10.03 |
Income from Investment Operations | | | |
Net investment income (loss) D | .01 H | - I,L | (.01) |
Net realized and unrealized gain (loss) | 3.91 | 1.95 | .88 |
Total from investment operations | 3.92 | 1.95 | .87 |
Distributions from net realized gain | (.04) M | - | - |
Redemption fees added to paid in capital D,L | - | - | - |
Net asset value, end of period | $ 16.73 | $ 12.85 | $ 10.90 |
Total Return B,C | 30.56% | 17.89% | 8.67% |
Ratios to Average Net Assets E,K | | | |
Expenses before reductions | .70% | .78% | .74% A |
Expenses net of fee waivers, if any | .70% | .78% | .74% A |
Expenses net of all reductions | .68% | .77% | .73% A |
Net investment income (loss) | .08% H | -% G,I | (.54)% A |
Supplemental Data | | | |
Net assets, end of period (000 omitted) | $ 290,765 | $ 106,941 | $ 159 |
Portfolio turnover rate F | 106% | 105% | 150% |
A Annualized
B Total returns for periods of less than one year are not annualized.
C Total returns would have been lower if certain expenses had not been reduced during the applicable periods shown.
D Calculated based on average shares outstanding during the period.
E Fees and expenses of any underlying Fidelity Central Funds are not included in the Fund's expense ratio. The Fund indirectly bears its proportionate share of the expenses of any underlying Fidelity Central Funds.
F Amount does not include the portfolio activity of any underlying Fidelity Central Funds.
G Amount represents less than .01%.
H Investment income per share reflects a special dividend which amounted to $.02 per share. Excluding the special dividend, the ratio of net investment income (loss) to average net assets would have been (.06)%.
I Investment income per share reflects a special dividend which amounted to $.01 per share. Excluding the special dividend, the ratio of net investment income (loss) to average net assets would have been (.10)%.
J For the period June 26, 2009 (commencement of sale of shares) to July 31, 2009.
K Expense ratios reflect operating expenses of the class. Expenses before reductions do not reflect amounts reimbursed by the investment adviser or reductions from brokerage service arrangements or reductions from other expense offset arrangements and do not represent the amount paid by the class during periods when reimbursements or reductions occur. Expense ratios before reductions for start-up periods may not be representative of longer-term operating periods. Expenses net of fee waivers reflect expenses after reimbursement by the investment adviser but prior to reductions from brokerage service arrangements or other expense offset arrangements. Expenses net of all reductions represent the net expenses paid by the class.
L Amount represents less than $.01 per share.
M The amount shown reflects certain reclassifications related to book to tax differences.
See accompanying notes which are an integral part of the financial statements.
Annual Report
Financial Highlights - Institutional Class
Years ended July 31, | 2011 | 2010 | 2009 | 2008 | 2007 |
Selected Per-Share Data | | | | | |
Net asset value, beginning of period | $ 12.83 | $ 10.91 | $ 13.30 | $ 16.15 | $ 12.92 |
Income from Investment Operations | | | | | |
Net investment income (loss) B | (.03) E | (.03) F | (.03) | (.06) | (.07) G |
Net realized and unrealized gain (loss) | 3.91 | 1.95 | (2.36) | (1.74) | 3.41 |
Total from investment operations | 3.88 | 1.92 | (2.39) | (1.80) | 3.34 |
Distributions from net realized gain | (.03) J | - | - | (1.05) | (.11) |
Redemption fees added to paid in capital B,I | - | - | - | - | - |
Net asset value, end of period | $ 16.68 | $ 12.83 | $ 10.91 | $ 13.30 | $ 16.15 |
Total Return A | 30.24% | 17.60% | (17.97)% | (11.93)% | 25.99% |
Ratios to Average Net Assets C,H | | | | |
Expenses before reductions | .94% | 1.03% | 1.05% | 1.04% | 1.05% |
Expenses net of fee waivers, if any | .94% | 1.03% | 1.05% | 1.04% | 1.05% |
Expenses net of all reductions | .93% | 1.02% | 1.04% | 1.03% | 1.05% |
Net investment income (loss) | (.17)% E | (.24)% F | (.36)% | (.38)% | (.46)% G |
Supplemental Data | | | | | |
Net assets, end of period (000 omitted) | $ 41,440 | $ 25,650 | $ 19,204 | $ 22,444 | $ 18,671 |
Portfolio turnover rate D | 106% | 105% | 150% | 113% | 91% |
A Total returns would have been lower if certain expenses had not been reduced during the applicable periods shown.
B Calculated based on average shares outstanding during the period.
C Fees and expenses of any underlying Fidelity Central Funds are not included in the Fund's expense ratio. The Fund indirectly bears its proportionate share of the expenses of any underlying Fidelity Central Funds.
D Amount does not include the portfolio activity of any underlying Fidelity Central Funds.
E Investment income per share reflects a special dividend which amounted to $.02 per share. Excluding the special dividend, the ratio of net investment income (loss) to average net assets would have been (.30)%.
F Investment income per share reflects a special dividend which amounted to $.01 per share. Excluding the special dividend, the ratio of net investment income (loss) to average net assets would have been (.34)%.
G Investment income per share reflects a special dividend which amounted to $.01 per share. Excluding the special dividend, the ratio of net investment income (loss) to average net assets would have been (.50)%.
H Expense ratios reflect operating expenses of the class. Expenses before reductions do not reflect amounts reimbursed by the investment adviser or reductions from brokerage service arrangements or reductions from other expense offset arrangements and do not represent the amount paid by the class during periods when reimbursements or reductions occur. Expenses net of fee waivers reflect expenses after reimbursement by the investment adviser but prior to reductions from brokerage service arrangements or other expense offset arrangements. Expenses net of all reductions represent the net expenses paid by the class.
I Amount represents less than $.01 per share.
J The amount shown reflects certain reclassifications related to book to tax differences.
See accompanying notes which are an integral part of the financial statements.
Annual Report
Notes to Financial Statements
For the period ended July 31, 2011
1. Organization.
Fidelity Small Cap Growth Fund (the Fund) is a fund of Fidelity Securities Fund (the Trust) and is authorized to issue an unlimited number of shares. The Trust is registered under the Investment Company Act of 1940, as amended (the 1940 Act), as an open-end management investment company organized as a Massachusetts business trust. The Fund offers Class A, Class T, Class C, Small Cap Growth, Class F, and Institutional Class shares, each of which, along with Class B shares, has equal rights as to assets and voting privileges. Effective after the close of business on September 1, 2010, Class B shares were closed to new accounts and additional purchases, except for exchanges and reinvestments, by existing shareholders. Each class has exclusive voting rights with respect to matters that affect that class. Class F shares of the Fund are only available for purchase by mutual funds for which Fidelity Management & Research Company (FMR) or an affiliate serves as investment manager. Class B shares will automatically convert to Class A shares after a holding period of seven years from the initial date of purchase. Investment income, realized and unrealized capital gains and losses, the common expenses of the Fund, and certain fund-level expense reductions, if any, are allocated on a pro-rata basis to each class based on the relative net assets of each class to the total net assets of the Fund. Each class differs with respect to transfer agent and distribution and service plan fees incurred. Certain expense reductions may also differ by class.
2. Investments in Fidelity Central Funds.
The Fund invests in Fidelity Central Funds, which are open-end investment companies available only to other investment companies and accounts managed by FMR and its affiliates. The Fund's Schedule of Investments lists each of the Fidelity Central Funds held as of period end, if any, as an investment of the Fund, but does not include the underlying holdings of each Fidelity Central Fund. As an Investing Fund, the Fund indirectly bears its proportionate share of the expenses of the underlying Fidelity Central Funds.
The Money Market Central Funds seek preservation of capital and current income and are managed by Fidelity Investments Money Management, Inc. (FIMM), an affiliate of FMR.
A complete unaudited list of holdings for each Fidelity Central Fund is available upon request or at the Securities and Exchange Commission (the SEC) web site at www.sec.gov. In addition, the financial statements of the Fidelity Central Funds, which are not covered by the Fund's Report of Independent Registered Public Accounting Firm, are available on the SEC web site or upon request.
Annual Report
Notes to Financial Statements - continued
3. Significant Accounting Policies.
The financial statements have been prepared in conformity with accounting principles generally accepted in the United States of America (GAAP), which require management to make certain estimates and assumptions at the date of the financial statements. Actual results could differ from those estimates. Subsequent events, if any, through the date that the financial statements were issued have been evaluated in the preparation of the financial statements. The following summarizes the significant accounting policies of the Fund:
Security Valuation. Investments are valued as of 4:00 p.m. Eastern time on the last calendar day of the period. The Fund uses independent pricing services approved by the Board of Trustees to value its investments. When current market prices or quotations are not readily available or reliable, valuations may be determined in good faith in accordance with procedures adopted by the Board of Trustees. Factors used in determining value may include market or security specific events. The frequency with which these procedures are used cannot be predicted and they may be utilized to a significant extent. The value used for net asset value (NAV) calculation under these procedures may differ from published prices for the same securities.
The Fund categorizes the inputs to valuation techniques used to value its investments into a disclosure hierarchy consisting of three levels as shown below:
Level 1 - quoted prices in active markets for identical investments
Level 2 - other significant observable inputs (including quoted prices for similar investments, interest rates, prepayment speeds, etc.)
Level 3 - unobservable inputs (including the Fund's own assumptions based on the best information available)
Changes in valuation techniques may result in transfers in or out of an assigned level within the disclosure hierarchy. Valuation techniques used to value the Fund's investments by major category are as follows:
Equity securities, including restricted securities, for which market quotations are readily available, are valued at the last reported sale price or official closing price as reported by an independent pricing service on the primary market or exchange on which they are traded and are categorized as Level 1 in the hierarchy. In the event there were no sales during the day or closing prices are not available, securities are valued at the last quoted bid price or may be valued using the last available price and are generally categorized as Level 2 in the hierarchy. For foreign equity securities, when significant market or security specific events arise, comparisons to the valuation of American Depositary Receipts (ADRs), futures contracts, Exchange-traded funds (ETFs) and certain indexes as well as
Annual Report
3. Significant Accounting Policies - continued
Security Valuation - continued
quoted prices for similar securities are used and are categorized as Level 2 in the hierarchy in these circumstances. Utilizing these techniques may result in transfers between Level 1 and Level 2. For restricted equity securities and private placements where observable inputs are limited, assumptions about market activity and risk are used and are categorized as Level 3 in the hierarchy.
Investments in open-end mutual funds, including the Fidelity Central Funds, are valued at their closing net asset value each business day and are categorized as Level 1 in the hierarchy.
Foreign Currency. The Fund may use foreign currency contracts to facilitate transactions in foreign-denominated securities. Gains and losses from these transactions may arise from changes in the value of the foreign currency or if the counterparties do not perform under the contracts' terms.
Foreign-denominated assets, including investment securities, and liabilities are translated into U.S. dollars at the exchange rate at period end. Purchases and sales of investment securities, income and dividends received and expenses denominated in foreign currencies are translated into U.S. dollars at the exchange rate in effect on the transaction date.
The effects of exchange rate fluctuations on investments are included with the net realized and unrealized gain (loss) on investment securities. Other foreign currency transactions resulting in realized and unrealized gain (loss) are disclosed separately.
Investment Transactions and Income. For financial reporting purposes, the Fund's investment holdings and NAV include trades executed through the end of the last business day of the period. The NAV per share for processing shareholder transactions is calculated as of the close of business of the New York Stock Exchange (NYSE), normally 4:00 p.m. Eastern time and includes trades executed through the end of the prior business day. Gains and losses on securities sold are determined on the basis of identified cost and may include proceeds received from litigation. Dividend income is recorded on the ex-dividend date, except for certain dividends from foreign securities where the ex-dividend date may have passed, which are recorded as soon as the Fund is informed of the ex-dividend date. Non-cash dividends included in dividend income, if any, are recorded at the fair market value of the securities received. Distributions received on securities that represent a return of capital or capital gain are recorded as a reduction of cost of investments and/or as a realized gain. The Fund estimates the components of distributions received that may be considered return of capital distributions or capital
Annual Report
Notes to Financial Statements - continued
3. Significant Accounting Policies - continued
Investment Transactions and Income - continued
gain distributions. Large, non-recurring dividends recognized by the Fund are presented separately on the Statement of Operations as "Special Dividends" and the impact of these dividends is presented in the Financial Highlights. Interest income and distributions from the Fidelity Central Funds are accrued as earned. Interest income includes coupon interest and amortization of premium and accretion of discount on debt securities. Investment income is recorded net of foreign taxes withheld where recovery of such taxes is uncertain.
Expenses. Expenses directly attributable to a fund are charged to that fund. Expenses attributable to more than one fund are allocated among the respective funds on the basis of relative net assets or other appropriate methods. Expense estimates are accrued in the period to which they relate and adjustments are made when actual amounts are known.
Income Tax Information and Distributions to Shareholders. Each year, the Fund intends to qualify as a regulated investment company, including distributing substantially all of its taxable income and realized gains under Subchapter M of the Internal Revenue Code and filing its U.S. federal tax return. As a result, no provision for income taxes is required. As of July 31, 2011, the Fund did not have any unrecognized tax benefits in the financial statements. A fund's federal tax return is subject to examination by the Internal Revenue Service (IRS) for a period of three years. Foreign taxes are provided for based on the Fund's understanding of the tax rules and rates that exist in the foreign markets in which it invests.
Distributions are declared and recorded on the ex-dividend date. Income dividends and capital gain distributions are declared separately for each class. Income and capital gain distributions are determined in accordance with income tax regulations, which may differ from GAAP. These differences resulted in distribution reclasses.
Capital accounts within the financial statements are adjusted for permanent book-tax differences. These adjustments have no impact on net assets or the results of operations. Temporary book-tax differences will reverse in a subsequent period.
Book-tax differences are primarily due to foreign currency transactions, net operating losses, capital loss carryforwards, and losses deferred due to wash sales and excise tax regulations.
Annual Report
3. Significant Accounting Policies - continued
Income Tax Information and Distributions to Shareholders - continued
The federal tax cost of investment securities and unrealized appreciation (depreciation) as of period end were as follows:
Gross unrealized appreciation | $ 354,172,386 |
Gross unrealized depreciation | (75,667,186) |
Net unrealized appreciation (depreciation) on securities and other investments | $ 278,505,200 |
| |
Tax Cost | $ 1,701,681,091 |
The tax-based components of distributable earnings as of period end were as follows:
Undistributed long-term capital gain | $ 25,499,273 |
Net unrealized appreciation (depreciation) | $ 278,508,866 |
Under the recently enacted Regulated Investment Company Modernization Act of 2010 (the Act), the Fund will be permitted to carry forward capital losses incurred in taxable years beginning after December 22, 2010 for an unlimited period. However, any losses incurred during those future taxable years will be required to be utilized prior to any losses incurred in pre-enactment taxable years, which generally expire after eight years from when they are incurred. Additionally, post-enactment capital losses that are carried forward will retain their character as either short-term or long-term capital losses rather than being considered all short-term as under previous law. The Fund's first fiscal year end subject to the Act will be July 31, 2012.
The tax character of distributions paid was as follows:
| July 31, 2011 | July 31, 2010 |
Long-term Capital Gains | $ 3,013,255 | $ - |
Short-Term Trading (Redemption) Fees. Shares held by investors in the Fund less than 90 days are subject to a redemption fee equal to 1.50% of the net asset value of shares redeemed. All redemption fees, which reduce the proceeds of the shareholder redemption, are retained by the Fund and accounted for as an addition to paid in capital.
New Accounting Pronouncement. In May 2011, the Financial Accounting Standards Board issued Accounting Standard Update No. 2011-04, Fair Value Measurement (Topic 820) - Amendments to Achieve Common Fair Value Measurement and Disclosure Requirements in U.S. GAAP and IFRSs. The update changes the wording used to describe the requirements in GAAP for measuring fair value and for disclosing information about fair value measurements. The update is effective during interim and annual periods beginning after December 15, 2011. Management is currently evaluating the impact of the update's adoption on the Fund's financial statement disclosures.
Annual Report
Notes to Financial Statements - continued
4. Purchases and Sales of Investments.
Purchases and sales of securities, other than short-term securities, aggregated $1,788,943,155 and $1,761,314,998, respectively.
5. Fees and Other Transactions with Affiliates.
Management Fee. FMR and its affiliates provide the Fund with investment management related services for which the Fund pays a monthly management fee. The management fee is the sum of an individual fund fee rate that is based on an annual rate of .45% of the Fund's average net assets and a group fee rate that averaged .26% during the period. The group fee rate is based upon the average net assets of all the mutual funds advised by FMR. The group fee rate decreases as assets under management increase and increases as assets under management decrease. In addition, the management fee is subject to a performance adjustment (up to a maximum of ± .20% of the Fund's average net assets over a 36 month performance period). The upward or downward adjustment to the management fee is based on the relative investment performance of Small Cap Growth, as compared to an appropriate benchmark index. For the period, the total annual management fee rate, including the performance adjustment, was .64% of the Fund's average net assets.
Distribution and Service Plan Fees. In accordance with Rule 12b-1 of the 1940 Act, the Fund has adopted separate Distribution and Service Plans for each class of shares. Certain classes pay Fidelity Distributors Corporation (FDC), an affiliate of FMR, separate Distribution and Service Fees, each of which is based on an annual percentage of each class' average net assets. In addition, FDC may pay financial intermediaries for selling shares of the Fund and providing shareholder support services. For the period, the Distribution and Service Fee rates, total fees and amounts retained by FDC were as follows:
| Distribution
Fee | Service
Fee | Total
Fees | Retained
by FDC |
Class A | -% | .25% | $ 156,403 | $ 4,810 |
Class T | .25% | .25% | 145,496 | - |
Class B | .75% | .25% | 55,389 | 41,618 |
Class C | .75% | .25% | 224,168 | 46,361 |
| | | $ 581,456 | $ 92,789 |
Sales Load. FDC may receive a front-end sales charge of up to 5.75% for selling Class A shares, and 3.50% for selling Class T shares, some of which is paid to financial intermediaries for selling shares of the Fund. Depending on the holding period, FDC may receive contingent deferred sales charges levied on Class A, Class T, Class B, and Class C redemptions. The deferred sales charges range from 5% to 1% for Class B, 1% for Class C, 1.00% for certain purchases of Class A shares and .25% for certain purchases of Class T shares.
Annual Report
5. Fees and Other Transactions with Affiliates - continued
Sales Load - continued
For the period, sales charge amounts retained by FDC were as follows:
| Retained
by FDC |
Class A | $ 29,915 |
Class T | 6,692 |
Class B* | 11,257 |
Class C* | 2,120 |
| $ 49,984 |
* When Class B and Class C shares are initially sold, FDC pays commissions from its own resources to financial intermediaries through which the sales are made.
Transfer Agent Fees. Fidelity Investments Institutional Operations Company, Inc. (FIIOC), an affiliate of FMR, is the transfer, dividend disbursing and shareholder servicing agent for each class of the Fund. FIIOC receives account fees and asset-based fees that vary according to the account size and type of account of the shareholders of the respective classes of the Fund. FIIOC receives no fees for providing transfer agency services to Class F. FIIOC pays for typesetting, printing and mailing of shareholder reports, except proxy statements. For the period, transfer agent fees for each class were as follows:
| Amount | % of
Average
Net Assets |
Class A | $ 187,257 | .30 |
Class T | 88,193 | .30 |
Class B | 16,587 | .30 |
Class C | 67,033 | .30 |
Small Cap Growth | 3,412,823 | .25 |
Institutional Class | 85,790 | .24 |
| $ 3,857,683 | |
Accounting and Security Lending Fees. Fidelity Service Company, Inc. (FSC), an affiliate of FMR, maintains the Fund's accounting records. The accounting fee is based on the level of average net assets for the month. Under a separate contract, FSC administers the security lending program. The security lending fee is based on the number and duration of lending transactions.
Brokerage Commissions. The Fund placed a portion of its portfolio transactions with brokerage firms which are affiliates of the investment adviser. The commissions paid to these affiliated firms were $71,765 for the period.
Annual Report
Notes to Financial Statements - continued
6. Committed Line of Credit.
The Fund participates with other funds managed by FMR or an affiliate in a $4.0 billion credit facility (the "line of credit") to be utilized for temporary or emergency purposes to fund shareholder redemptions or for other short-term liquidity purposes. The Fund has agreed to pay commitment fees on its pro-rata portion of the line of credit, which amounted to $5,614 and is reflected in Miscellaneous expenses on the Statement of Operations. During the period, there were no borrowings on this line of credit.
7. Security Lending.
The Fund lends portfolio securities through a lending agent from time to time in order to earn additional income. The lending agent may loan securities to certain qualified borrowers, including Fidelity Capital Markets (FCM), a broker-dealer affiliated with the Fund. On the settlement date of the loan, the Fund receives collateral (in the form of U.S. Treasury obligations, letters of credit and/or cash) against the loaned securities and maintains collateral in an amount not less than 100% of the market value of the loaned securities during the period of the loan. The market value of the loaned securities is determined at the close of business of the Fund and any additional required collateral is delivered to the Fund on the next business day. If the borrower defaults on its obligation to return the securities loaned because of insolvency or other reasons, a fund could experience delays and costs in recovering the securities loaned or in gaining access to the collateral. Any cash collateral received is invested in the Fidelity Securities Lending Cash Central Fund. The value of loaned securities and cash collateral at period end are disclosed on the Fund's Statement of Assets and Liabilities. The value of securities loaned to FCM at period end was $2,457,312. Security lending income represents the income earned on investing cash collateral, less rebates paid to borrowers and lending agent fees associated with the loan, plus any premium payments received for lending certain types of securities. Security lending income is presented in the Statement of Operations as a component of income from Fidelity Central Funds, and includes $19,296 from securities loaned to FCM.
8. Expense Reductions.
Many of the brokers with whom FMR places trades on behalf of the Fund provided services to the Fund in addition to trade execution. These services included payments of certain expenses on behalf of the Fund totaling $205,159 for the period. In addition, through arrangements with the Fund's custodian, credits realized as a result of uninvested cash balances were used to reduce the Fund's expenses. During the period, these credits reduced the Fund's custody expenses by $308.
Annual Report
9. Distributions to Shareholders.
Distributions to shareholders of each class were as follows:
Years ended July 31, | 2011 | 2010 |
From net realized gain | | |
Class A | $ 40,130 | $ - |
Small Cap Growth | 2,420,020 | - |
Class F | 492,928 | - |
Institutional Class | 60,177 | - |
Total | $ 3,013,255 | $ - |
10. Share Transactions.
Transactions for each class of shares were as follows:
| Shares | Dollars |
Years ended July 31, | 2011 | 2010 | 2011 | 2010 |
Class A | | | | |
Shares sold | 1,459,436 | 1,755,238 | $ 22,640,692 | $ 21,749,463 |
Reinvestment of distributions | 2,323 | - | 36,172 | - |
Shares redeemed | (1,364,690) | (1,481,231) | (20,977,078) | (17,861,442) |
Net increase (decrease) | 97,069 | 274,007 | $ 1,699,786 | $ 3,888,021 |
Class T | | | | |
Shares sold | 420,613 | 492,575 | $ 6,491,294 | $ 6,056,365 |
Shares redeemed | (434,512) | (592,408) | (6,714,256) | (7,232,100) |
Net increase (decrease) | (13,899) | (99,833) | $ (222,962) | $ (1,175,735) |
Class B | | | | |
Shares sold | 25,204 | 117,304 | $ 366,276 | $ 1,414,923 |
Shares redeemed | (109,118) | (93,928) | (1,597,390) | (1,126,513) |
Net increase (decrease) | (83,914) | 23,376 | $ (1,231,114) | $ 288,410 |
Class C | | | | |
Shares sold | 469,568 | 479,633 | $ 7,154,653 | $ 5,791,649 |
Shares redeemed | (368,398) | (358,550) | (5,494,248) | (4,319,904) |
Net increase (decrease) | 101,170 | 121,083 | $ 1,660,405 | $ 1,471,745 |
Small Cap Growth | | | | |
Shares sold | 19,971,507 | 22,893,960 | $ 315,167,556 | $ 285,679,819 |
Reinvestment of distributions | 153,921 | - | 2,384,001 | - |
Shares redeemed | (31,144,660) | (28,450,958) | (483,710,319) | (351,525,118) |
Net increase (decrease) | (11,019,232) | (5,556,998) | $ (166,158,762) | $ (65,845,299) |
Annual Report
Notes to Financial Statements - continued
10. Share Transactions - continued
| Shares | Dollars |
Years ended July 31, | 2011 | 2010 | 2011 | 2010 |
Class F | | | | |
Shares sold | 11,382,202 | 8,663,528 | $ 176,012,143 | $ 109,176,128 |
Reinvestment of distributions | 31,816 | - | 492,928 | - |
Shares redeemed | (2,356,621) | (357,394) | (37,493,486) | (4,690,130) |
Net increase (decrease) | 9,057,397 | 8,306,134 | $ 139,011,585 | $ 104,485,998 |
Institutional Class | | | | |
Shares sold | 1,038,111 | 1,109,901 | $ 16,415,657 | $ 14,013,757 |
Reinvestment of distributions | 2,532 | - | 39,301 | - |
Shares redeemed | (555,221) | (871,545) | (8,700,391) | (10,548,734) |
Net increase (decrease) | 485,422 | 238,356 | $ 7,754,567 | $ 3,465,023 |
11. Other.
The Fund's organizational documents provide former and current trustees and officers with a limited indemnification against liabilities arising in connection with the performance of their duties to the Fund. In the normal course of business, the Fund may also enter into contracts that provide general indemnifications. The Fund's maximum exposure under these arrangements is unknown as this would be dependent on future claims that may be made against the Fund. The risk of material loss from such claims is considered remote.
The Fidelity Freedom Funds were the owners of record, in the aggregate, of approximately 37% of the total outstanding shares of the Fund.
Annual Report
To the Trustees of Fidelity Securities Fund and the Shareholders of Fidelity Small Cap Growth Fund:
In our opinion, the accompanying statement of assets and liabilities, including the schedule of investments, and the related statements of operations and of changes in net assets and the financial highlights present fairly, in all material respects, the financial position of Fidelity Small Cap Growth Fund (a fund of Fidelity Securities Fund) at July 31, 2011, the results of its operations for the year then ended, the changes in its net assets for each of the two years in the period then ended and the financial highlights for each of the periods indicated, in conformity with accounting principles generally accepted in the United States of America. These financial statements and financial highlights (hereafter referred to as "financial statements") are the responsibility of the Fidelity Small Cap Growth Fund's management. Our responsibility is to express an opinion on these financial statements based on our audits. We conducted our audits of these financial statements in accordance with the standards of the Public Company Accounting Oversight Board (United States). Those standards require that we plan and perform the audit to obtain reasonable assurance about whether the financial statements are free of material misstatement. An audit includes examining, on a test basis, evidence supporting the amounts and disclosures in the financial statements, assessing the accounting principles used and significant estimates made by management, and evaluating the overall financial statement presentation. We believe that our audits, which included confirmation of securities at July 31, 2011 by correspondence with the custodian and brokers, provide a reasonable basis for our opinion.
/s/PricewaterhouseCoopers LLP
PricewaterhouseCoopers LLP
Boston, Massachusetts
September 14, 2011
Annual Report
The Trustees, Members of the Advisory Board, and executive officers of the trust and fund, as applicable, are listed below. The Board of Trustees governs the fund and is responsible for protecting the interests of shareholders. The Trustees are experienced executives who meet periodically throughout the year to oversee the fund's activities, review contractual arrangements with companies that provide services to the fund, oversee management of the risks associated with such activities and contractual arrangements, and review the fund's performance.
Except for James C. Curvey, each of the Trustees oversees 221 funds advised by FMR or an affiliate. Mr. Curvey oversees 419 funds advised by FMR or an affiliate. The Trustees hold office without limit in time except that (a) any Trustee may resign; (b) any Trustee may be removed by written instrument, signed by at least two-thirds of the number of Trustees prior to such removal; (c) any Trustee who requests to be retired or who has become incapacitated by illness or injury may be retired by written instrument signed by a majority of the other Trustees; and (d) any Trustee may be removed at any special meeting of shareholders by a two-thirds vote of the outstanding voting securities of the trust. Each Trustee who is not an interested person (as defined in the 1940 Act) (Independent Trustee), shall retire not later than the last day of the calendar year in which his or her 75th birthday occurs. The Independent Trustees may waive this mandatory retirement age policy with respect to individual Trustees. The executive officers and Advisory Board Members hold office without limit in time, except that any officer and Advisory Board Member may resign or may be removed by a vote of a majority of the Trustees at any regular meeting or any special meeting of the Trustees. Except as indicated, each individual has held the office shown or other offices in the same company for the past five years.
Experience, Skills, Attributes, and Qualifications of the Fund's Trustees. The Governance and Nominating Committee has adopted a statement of policy that describes the experience, qualifications, attributes, and skills that are necessary and desirable for potential Independent Trustee candidates (Statement of Policy). The Board believes that each Trustee satisfied at the time he or she was initially elected or appointed a Trustee, and continues to satisfy, the standards contemplated by the Statement of Policy. The Governance and Nominating Committee also engages professional search firms to help identify potential Independent Trustee candidates who have the experience, qualifications, attributes, and skills consistent with the Statement of Policy. From time to time, additional criteria based on the composition and skills of the current Independent Trustees, as well as experience or skills that may be appropriate in light of future changes to board composition, business conditions, and regulatory or other developments, have also been considered by the professional search firms and the Governance and Nominating Committee. In addition, the Board takes into account the Trustees' commitment and participation in Board and committee meetings, as well as their leadership of standing and ad hoc committees throughout their tenure.
In determining that a particular Trustee was and continues to be qualified to serve as a Trustee, the Board has considered a variety of criteria, none of which, in isolation, was controlling. The Board believes that, collectively, the Trustees have balanced and diverse experience, qualifications, attributes, and skills, which allow the Board to operate effectively in governing the fund and protecting the interests of shareholders. Information about the specific experience, skills, attributes, and qualifications of each Trustee, which in each case led to the Board's conclusion that the Trustee should serve (or continue to serve) as a trustee of the fund, is provided below.
Annual Report
Trustees and Officers - continued
Board Structure and Oversight Function. James C. Curvey is an interested person (as defined in the 1940 Act) and currently serves as Acting Chairman. The Trustees have determined that an interested Chairman is appropriate and benefits shareholders because an interested Chairman has a personal and professional stake in the quality and continuity of services provided to the fund. Independent Trustees exercise their informed business judgment to appoint an individual of their choosing to serve as Chairman, regardless of whether the Trustee happens to be independent or a member of management. The Independent Trustees have determined that they can act independently and effectively without having an Independent Trustee serve as Chairman and that a key structural component for assuring that they are in a position to do so is for the Independent Trustees to constitute a substantial majority for the Board. The Independent Trustees also regularly meet in executive session. Ned C. Lautenbach serves as Chairman of the Independent Trustees and as such (i) acts as a liaison between the Independent Trustees and management with respect to matters important to the Independent Trustees and (ii) with management prepares agendas for Board meetings.
Fidelity funds are overseen by different Boards of Trustees. The fund's Board oversees Fidelity's equity and high income funds and another Board oversees Fidelity's investment-grade bond, money market, and asset allocation funds. The asset allocation funds may invest in Fidelity funds overseen by the fund's Board. The use of separate Boards, each with its own committee structure, allows the Trustees of each group of Fidelity funds to focus on the unique issues of the funds they oversee, including common research, investment, and operational issues. On occasion, the separate Boards establish joint committees to address issues of overlapping consequences for the Fidelity funds overseen by each Board.
The Trustees operate using a system of committees to facilitate the timely and efficient consideration of all matters of importance to the Trustees, the fund, and fund shareholders and to facilitate compliance with legal and regulatory requirements and oversight of the fund's activities and associated risks. The Board, acting through its committees, has charged FMR and its affiliates with (i) identifying events or circumstances the occurrence of which could have demonstrably adverse effects on the fund's business and/or reputation; (ii) implementing processes and controls to lessen the possibility that such events or circumstances occur or to mitigate the effects of such events or circumstances if they do occur; and (iii) creating and maintaining a system designed to evaluate continuously business and market conditions in order to facilitate the identification and implementation processes described in (i) and (ii) above. Because the day-to-day operations and activities of the fund are carried out by or through FMR, its affiliates and other service providers, the fund's exposure to risks is mitigated but not eliminated by the processes overseen by the Trustees. While each of the Board's committees has responsibility for overseeing different aspects of the fund's activities, oversight is exercised primarily through the Operations, Audit, and Compliance Committees. Appropriate personnel, including but not limited to the fund's Chief Compliance Officer (CCO), FMR's internal auditor, the independent accountants, the fund's Treasurer and portfolio management personnel, make periodic reports to the Board's committees, as appropriate. The responsibilities of each committee, including their oversight responsibilities, are described further under "Standing Committees of the Fund's Trustees."
Annual Report
The fund's Statement of Additional Information (SAI) includes more information about the Trustees. To request a free copy, call Fidelity at 1-877-208-0098.
Interested Trustees*:
Correspondence intended for each Trustee who is an interested person may be sent to Fidelity Investments, 82 Devonshire Street, Boston, Massachusetts 02109.
Name, Age; Principal Occupations and Other Relevant Experience+ |
James C. Curvey (76) |
| Year of Election or Appointment: 2007 Mr. Curvey is Trustee and Acting Chairman of the Board of Trustees of certain Trusts. Mr. Curvey also serves as Trustee (2007-present) of other investment companies advised by FMR. Mr. Curvey is a Director of Fidelity Investments Money Management, Inc. (2009-present), Director of Fidelity Research & Analysis Co. (2009-present) and Director of FMR and FMR Co., Inc. (2007-present). Mr. Curvey is also Vice Chairman (2007-present) and Director of FMR LLC. In addition, Mr. Curvey serves as an Overseer for the Boston Symphony Orchestra and a member of the Trustees of Villanova University. Previously, Mr. Curvey was the Vice Chairman (2006-2007) and Director (2000-2007) of FMR Corp. |
Ronald P. O'Hanley (54) |
| Year of Election or Appointment: 2011 Mr. O'Hanley is Director of FMR Co., Inc. (2010-present), Director of Fidelity Investments Money Management, Inc. (2010-present), Director of Fidelity Research & Analysis Company (2010-present), President of Fidelity Asset Management and Corporate Services and a member of Fidelity's Executive Committee (2010-present). Previously, Mr. O'Hanley served as President and Chief Executive Officer of BNY Mellon Asset Management (2007-2010). Mr. O'Hanley also served as Vice Chairman of Bank New York Mellon Corp. and a member of that firm's Executive Committee. Prior to the 2007 merger of The Bank of New York and Mellon Financial Corporation, he was Vice Chairman of Mellon Financial Corporation and President and Chief Executive Officer of Mellon Asset Management. He joined Mellon in February 1997. Mr. O'Hanley currently serves as Chairman of the Boston Public Library Foundation Board of Directors and sits on the Board of Directors of Beth Israel Deaconess Medical Center, the Board of Trustees of the Marine Biological Laboratory and the Advisory Board of the Maxwell School of Citizenship and Public Administration at Syracuse University. Mr. O'Hanley also chairs the Council on Asset Management for the Financial Services Roundtable and is a member of the Board of Directors of Institutional Investor's U.S. Institute. |
* Trustees have been determined to be "Interested Trustees" by virtue of, among other things, their affiliation with the trust or various entities under common control with FMR.
+ The information above includes each Trustee's principal occupation during the last five years and other information relating to the experience, attributes, and skills relevant to each Trustee's qualifications to serve as a Trustee, which led to the conclusion that each Trustee should serve as a Trustee for the fund.
Annual Report
Independent Trustees:
Correspondence intended for each Independent Trustee (that is, the Trustees other than the Interested Trustees) may be sent to Fidelity Investments, P.O. Box 55235, Boston, Massachusetts 02205-5235.
Name, Age; Principal Occupations and Other Relevant Experience+ |
Dennis J. Dirks (63) |
| Year of Election or Appointment: 2005 Prior to his retirement in May 2003, Mr. Dirks was Chief Operating Officer and a member of the Board of The Depository Trust & Clearing Corporation (DTCC). He also served as President, Chief Operating Officer, and Board member of The Depository Trust Company (DTC) and President and Board member of the National Securities Clearing Corporation (NSCC). In addition, Mr. Dirks served as Chief Executive Officer and Board member of the Government Securities Clearing Corporation, Chief Executive Officer and Board member of the Mortgage-Backed Securities Clearing Corporation, as a Trustee and a member of the Finance Committee of Manhattan College (2005-2008), and as a Trustee and a member of the Finance Committee of AHRC of Nassau County (2006-2008). Mr. Dirks is a member of the Independent Directors Council (IDC) Governing Council (2010-Present) and Board of Directors for The Brookville Center for Children's Services, Inc. (2009-present). |
Alan J. Lacy (57) |
| Year of Election or Appointment: 2008 Mr. Lacy serves as Senior Adviser (2007-present) of Oak Hill Capital Partners, L.P. (private equity). Mr. Lacy also served as Chief Executive Officer (2000-2005) and Vice Chairman (2005-2006) of Sears Holdings Corporation and Sears, Roebuck and Co. (retail). In addition, Mr. Lacy serves as a member of the Board of Directors of Dave & Buster's, Inc. (restaurant and entertainment complexes, 2010-present), The Hillman Companies, Inc. (hardware wholesalers, 2010-present), and Bristol-Myers Squibb Company (global pharmaceuticals, 2007-present). Mr. Lacy is a member of the Board of Trustees of The National Parks Conservation Association (2006-Present). Previously, Mr. Lacy served as Chairman of the Board of Trustees of the National Parks Conservation Association (2008-2011) and as a member of the Board of Directors for the Western Union Company (global money transfer, 2006-2011). |
Ned C. Lautenbach (67) |
| Year of Election or Appointment: 2000 Mr. Lautenbach is Chairman of the Independent Trustees of the Equity and High Income Funds (2006-present). Mr. Lautenbach currently serves as the Lead Director of the Eaton Corporation Board of Directors (diversified industrial, 1997-present). Mr. Lautenbach is also a member of the Board of Directors of the Philharmonic Center for the Arts in Naples, Florida (1999-present); a member of the Board of Trustees of Fairfield University (2005-present); and a member of the Council on Foreign Relations (1994-present). Previously, Mr. Lautenbach was a Partner/Advisory Partner at Clayton, Dubilier & Rice, LLC (private equity investment, 1998-2010), as well as a Director of Sony Corporation (2006-2007). |
Joseph Mauriello (66) |
| Year of Election or Appointment: 2008 Prior to his retirement in January 2006, Mr. Mauriello served in numerous senior management positions including Deputy Chairman and Chief Operating Officer (2004-2005), and Vice Chairman of Financial Services (2002-2004) of KPMG LLP US (professional services, 1965-2005). Mr. Mauriello currently serves as a member of the Board of Directors of XL Group plc. (global insurance and re-insurance, 2006-present) and of Arcadia Resources Inc. (health care services and products, 2007-present). Previously, Mr. Mauriello served as a Director of the Hamilton Funds of the Bank of New York (2006-2007). |
Robert W. Selander (60) |
| Year of Election or Appointment:2011 Previously, Mr. Selander served as a Member of the Advisory Board of Fidelity's Equity and High Income Funds (2011), Executive Vice Chairman (2010), Chief Executive Officer (2009-2010), and President and Chief Executive Officer (1997-2009) of Mastercard, Inc. |
Cornelia M. Small (67) |
| Year of Election or Appointment: 2005 Ms. Small is a member of the Board of Directors of the Teagle Foundation (2009-present). Ms. Small is also a member of the Investment Committee, and Chair (2008-present) and a member of the Board of Trustees of Smith College. In addition, Ms. Small serves on the Investment Committee of the Berkshire Taconic Community Foundation (2008-present). Previously, Ms. Small served as Chairperson of the Investment Committee (2002-2008) of Smith College. In addition, Ms. Small served as Chief Investment Officer, Director of Global Equity Investments, and a member of the Board of Directors of Scudder, Stevens & Clark and Scudder Kemper Investments. |
William S. Stavropoulos (72) |
| Year of Election or Appointment: 2002 Mr. Stavropoulos is Vice Chairman of the Independent Trustees of the Equity and High Income Funds (2006-present). Mr. Stavropoulos serves as President and Founder of the Michigan Baseball Foundation, the Great Lakes Loons (2007-present). Mr. Stavropoulos is Chairman Emeritus of the Board of Directors of The Dow Chemical Company, where he previously served in numerous senior management positions, including President, CEO (1995-2000; 2002-2004), Chairman of the Executive Committee (2000-2006), and as a member of the Board of Directors (1990-2006). Currently, Mr. Stavropoulos is Chairman of Univar (global distributor of commodity and specialty chemicals, 2010-present), a Director of Teradata Corporation (data warehousing and technology solutions, 2008-present), Chemical Financial Corporation, Maersk Inc. (industrial conglomerate), Tyco International, Inc. (multinational manufacturing and services, 2007-present), and a member of the Advisory Board for Metalmark Capital (private equity investment, 2005-present). Mr. Stavropoulos is a special advisor to Clayton, Dubilier & Rice, LLC (private equity investment). In addition, Mr. Stavropoulos is a member of the University of Notre Dame Advisory Council for the College of Science. |
David M. Thomas (62) |
| Year of Election or Appointment: 2008 Previously, Mr. Thomas served as Executive Chairman (2005-2006) and Chairman and Chief Executive Officer (2000-2005) of IMS Health, Inc. (pharmaceutical and healthcare information solutions). In addition, Mr. Thomas serves as a member of the Board of Directors of Fortune Brands, Inc. (consumer products), and Interpublic Group of Companies, Inc. (marketing communication, 2004-present). |
Michael E. Wiley (60) |
| Year of Election or Appointment: 2008 Mr. Wiley also serves as a Director of Asia Pacific Exploration Consolidated (international oil and gas exploration and production, 2008-present). Mr. Wiley serves as a Director of Tesoro Corporation (independent oil refiner and marketer, 2005-present), and a Director of Bill Barrett Corporation (exploration and production, 2005-present). In addition, Mr. Wiley also serves as a Director of Post Oak Bank (privately-held bank, 2004-present). Previously, Mr. Wiley served as a member of the Board of Trustees of the University of Tulsa (2000-2006; 2007-2010), as a Senior Energy Advisor of Katzenbach Partners, LLC (consulting, 2006-2007), as an Advisory Director of Riverstone Holdings (private investment), Chairman, President, and CEO of Baker Hughes, Inc. (oilfield services, 2000-2004), and as Director of Spinnaker Exploration Company (exploration and production, 2001-2005). |
Annual Report
Trustees and Officers - continued
+ The information above includes each Trustee's principal occupation during the last five years and other information relating to the experience, attributes, and skills relevant to each Trustee's qualifications to serve as a Trustee, which led to the conclusion that each Trustee should serve as a Trustee for the fund.
Advisory Board Members and Executive Officers:
Correspondence intended for each executive officer, Edward C. Johnson 3d, and Peter S. Lynch may be sent to Fidelity Investments, 82 Devonshire Street, Boston, Massachusetts 02109.
Name, Age; Principal Occupation |
Edward C. Johnson 3d (81) |
| Year of Election or Appointment: 2011 Member of the Advisory Board of Fidelity's Equity and High Income Funds. Mr. Johnson serves as Chief Executive Officer, Chairman, and a Director of FMR LLC, and also serves as Chairman and Director of FIL Limited. Previously, Mr. Johnson served as a Trustee and Chairman of the Board of certain Fidelity Trusts, Chairman and a Director of FMR, Chairman and a Director of FMR Co., Inc., and President of FMR LLC (2006-2007). |
Peter S. Lynch (67) |
| Year of Election or Appointment: 2003 Member of the Advisory Board of Fidelity's Equity and High Income Funds. Mr. Lynch is Vice Chairman and a Director of FMR and FMR Co., Inc. In addition, Mr. Lynch serves as a Trustee of Boston College and as the Chairman of the Inner-City Scholarship Fund. Previously, Mr. Lynch served on the Special Olympics International Board of Directors (1997-2006). |
Kenneth B. Robins (41) |
| Year of Election or Appointment: 2008 President and Treasurer of Fidelity's Equity and High Income Funds. Mr. Robins also serves as President and Treasurer (2010-present) and Assistant Treasurer (2009-present) of other Fidelity funds and is an employee of Fidelity Investments (2004-present). Previously, Mr. Robins served as Deputy Treasurer of the Fidelity funds (2005-2008) and Treasurer and Chief Financial Officer of The North Carolina Capital Management Trust: Cash and Term Portfolios (2006-2008). |
Brian B. Hogan (46) |
| Year of Election or Appointment: 2009 Vice President of Equity and High Income Funds. Mr. Hogan also serves as President of FMR's Equity Division (2009-present). Previously, Mr. Hogan served as Senior Vice President, Equity Research of FMR (2006-2009) and as a portfolio manager. |
Thomas C. Hense (47) |
| Year of Election or Appointment: 2008 or 2010 Vice President of Fidelity's High Income (2008), Small Cap (2008), and Value (2010) Funds. Previously, Mr. Hense served as a portfolio manager for Fidelity's Institutional Money Management Group (Pyramis) (2003-2008). |
Scott C. Goebel (43) |
| Year of Election or Appointment: 2008 Secretary and Chief Legal Officer (CLO) of the Fidelity funds. Mr. Goebel also serves as Secretary of Fidelity Investments Money Management, Inc. (FIMM) (2010-present) and Fidelity Research and Analysis Company (FRAC) (2010-present); Secretary and CLO of The North Carolina Capital Management Trust: Cash and Term Portfolios (2008-present); General Counsel, Secretary, and Senior Vice President of FMR (2008-present) and FMR Co., Inc. (2008-present); employed by FMR LLC or an affiliate (2001-present); Chief Legal Officer of Fidelity Management & Research (Hong Kong) Limited (2008-present) and Assistant Secretary of Fidelity Management & Research (Japan) Inc. (2008-present), and Fidelity Management & Research (U.K.) Inc. (2008-present). Previously, Mr. Goebel served as Assistant Secretary of FIMM (2008-2010), FRAC (2008-2010), and the Funds (2007-2008) and as Vice President and Secretary of Fidelity Distributors Corporation (FDC) (2005-2007). |
William C. Coffey (42) |
| Year of Election or Appointment: 2009 Assistant Secretary of Fidelity's Equity and High Income Funds. Mr. Coffey also serves as Senior Vice President and Deputy General Counsel of FMR LLC (2010-present), and is an employee of Fidelity Investments. Previously, Mr. Coffey served as Vice President and Associate General Counsel of FMR LLC (2005-2009). |
Holly C. Laurent (57) |
| Year of Election or Appointment: 2008 Anti-Money Laundering (AML) Officer of the Fidelity funds. Ms. Laurent also serves as AML Officer of The North Carolina Capital Management Trust: Cash and Term Portfolios (2008-present) and is an employee of Fidelity Investments. Previously, Ms. Laurent was Senior Vice President and Head of Legal for Fidelity Business Services India Pvt. Ltd. (2006-2008), and Senior Vice President, Deputy General Counsel and Group Head for FMR LLC (2005-2006). |
Christine Reynolds (52) |
| Year of Election or Appointment: 2008 Chief Financial Officer of the Fidelity funds. Ms. Reynolds became President of Fidelity Pricing and Cash Management Services (FPCMS) in August 2008. Ms. Reynolds served as Chief Operating Officer of FPCMS (2007-2008). Previously, Ms. Reynolds served as President, Treasurer, and Anti-Money Laundering officer of the Fidelity funds (2004-2007). |
Kenneth A. Rathgeber (64) |
| Year of Election or Appointment: 2004 Chief Compliance Officer of Fidelity's Equity and High Income Funds. Mr. Rathgeber is Chief Compliance Officer of Fidelity Management & Research (Hong Kong) Limited (2008-present), Fidelity Management & Research (Japan) Inc. (2008-present), FMR (2005-present), FMR Co., Inc. (2005-present), Fidelity Management & Research (U.K.) Inc. (2005-present), Fidelity Research & Analysis Company (2005-present), Fidelity Investments Money Management, Inc. (2005-present), Pyramis Global Advisors, LLC (2005-present), and Strategic Advisers, Inc. (2005-present). |
Jeffrey S. Christian (49) |
| Year of Election or Appointment: 2009 Deputy Treasurer of the Fidelity funds. Mr. Christian is an employee of Fidelity Investments. Previously, Mr. Christian served as Chief Financial Officer (2008-2009) of certain Fidelity funds and Senior Vice President of Fidelity Pricing and Cash Management Services (FPCMS) (2004-2009). |
Bryan A. Mehrmann (50) |
| Year of Election or Appointment: 2005 Deputy Treasurer of the Fidelity funds. Mr. Mehrmann is an employee of Fidelity Investments. |
Adrien E. Deberghes (43) |
| Year of Election or Appointment: 2008 Deputy Treasurer of Fidelity's Equity and High Income Funds. Mr. Deberghes also serves as Assistant Treasurer of other Fidelity funds (2010-present) and is an employee of Fidelity Investments (2008-present). Previously, Mr. Deberghes served as Senior Vice President of Mutual Fund Administration at State Street Corporation (2007-2008), Senior Director of Mutual Fund Administration at Investors Bank & Trust (2005-2007), and Director of Finance for Dunkin' Brands (2000-2005). |
Stephanie J. Dorsey (42) |
| Year of Election or Appointment: 2010 Assistant Treasurer of Fidelity's Equity and High Income Funds. Ms. Dorsey also serves as Deputy Treasurer of other Fidelity funds (2008-present) and is an employee of Fidelity Investments (2008-present). Previously, Ms. Dorsey served as Treasurer (2004-2008) of the JPMorgan Mutual Funds and Vice President (2004-2008) of JPMorgan Chase Bank. |
John R. Hebble (53) |
| Year of Election or Appointment: 2009 Assistant Treasurer of Fidelity's Equity and High Income Funds. Mr. Hebble also serves as Treasurer and Chief Financial Officer of The North Carolina Capital Management Trust: Cash and Term Portfolios (2008-present), President and Treasurer of other Fidelity funds (2008-present) and is an employee of Fidelity Investments. |
Gary W. Ryan (52) |
| Year of Election or Appointment: 2005 Assistant Treasurer of the Fidelity funds. Mr. Ryan is an employee of Fidelity Investments. Previously, Mr. Ryan served as Vice President of Fund Reporting in Fidelity Pricing and Cash Management Services (FPCMS) (1999-2005). |
Jonathan Davis (43) |
| Year of Election or Appointment: 2010 Assistant Treasurer of the Fidelity funds. Mr. Davis is an employee of Fidelity Investments. Previously, Mr. Davis served as Vice President and Associate General Counsel of FMR LLC (2003-2010). |
Annual Report
The Board of Trustees of Fidelity Small Cap Growth Fund voted to pay to shareholders of record at the opening of business on record date, the following distributions per share derived from capital gains realized from sales of portfolio securities:
| Pay Date | Record Date | Capital Gains |
Class A | 9/12/11 | 9/09/11 | $0.234 |
Class T | 9/12/11 | 9/09/11 | $0.234 |
Class B | 9/12/11 | 9/09/11 | $0.234 |
Class C | 9/12/11 | 9/09/11 | $0.234 |
Class A designates 100% of the dividends distributed during the fiscal year as qualifying for the dividends-received deduction for corporate shareholders.
Class A designates 100% of the dividends distributed during the fiscal year as amounts which may be taken into account as a dividend for purposes of the maximum rate under section 1(h)(11) of the Internal Revenue Code.
The fund hereby designates as a capital gain dividend with respect to the taxable year ended July 31, 2011, $28,512,528, or, if subsequently determined to be different, the net capital gain of such year.
The fund will notify shareholders in January 2012 of amounts for use in preparing 2011 income tax returns.
Annual Report
Board Approval of Investment Advisory Contracts and Management Fees
Fidelity Small Cap Growth Fund
Each year, the Board of Trustees, including the Independent Trustees (together, the Board), votes on the renewal of the management contract and sub-advisory agreements (together, the Advisory Contracts) for the fund. The Board, assisted by the advice of fund counsel and Independent Trustees' counsel, requests and considers a broad range of information relevant to the renewal of the Advisory Contracts throughout the year.
The Board meets regularly and considers at each of its meetings factors that are relevant to its annual consideration of the renewal of the fund's Advisory Contracts, including the services and support provided to the fund and its shareholders. The Board has established various standing committees, each composed of Independent Trustees with varying backgrounds, to which the Board has assigned specific subject matter responsibilities in order to enhance effective decision-making by the Board. The Board, acting directly and through its Committees, requests and receives information concerning the annual consideration of the renewal of the fund's Advisory Contracts. The Board also meets as needed to consider matters specifically related to the Board's annual consideration of the renewal of Advisory Contracts. Members of the Board may also meet with trustees of other Fidelity funds through ad hoc joint committees to discuss certain matters relevant to the Fidelity funds.
At its July 2011 meeting, the Board of Trustees, including the Independent Trustees, unanimously determined to renew the fund's Advisory Contracts. In reaching its determination, the Board considered all factors it believed relevant, including (i) the nature, extent, and quality of the services to be provided to the fund and its shareholders (including the investment performance of the fund); (ii) the competitiveness of the fund's management fee and total expense ratio; (iii) the total costs of the services to be provided by and the profits to be realized by Fidelity from its relationship with the fund; (iv) the extent to which economies of scale would be realized as the fund grows; and (v) whether fee levels reflect these economies of scale, if any, for the benefit of fund shareholders.
In considering whether to renew the Advisory Contracts for the fund, the Board reached a determination, with the assistance of fund counsel and Independent Trustees' counsel and through the exercise of its business judgment, that the renewal of the Advisory Contracts is in the best interests of the fund and its shareholders and that the compensation payable under the Advisory Contracts is fair and reasonable. The Board's decision to renew the Advisory Contracts was not based on any single factor, but rather was based on a comprehensive consideration of all the information provided to the Board at its meetings throughout the year. The Board, in reaching its determination to renew the Advisory Contracts, is aware that shareholders in the fund have a broad range of investment choices available to them, including a wide choice among mutual funds offered by Fidelity's competitors, and that the fund's shareholders, who have the opportunity to review and weigh the disclosure provided by the fund in its prospectus and other public disclosures, have chosen to invest in this fund, managed by Fidelity.
Annual Report
Board Approval of Investment Advisory Contracts and
Management Fees - continued
Nature, Extent, and Quality of Services Provided. The Board considered the staffing within the investment adviser, FMR, and the sub-advisers (together, the Investment Advisers), including the backgrounds of the fund's investment personnel and the fund's investment objective and discipline. The Independent Trustees also had discussions with senior management of Fidelity's investment operations and investment groups. The Board considered the structure of the portfolio manager compensation program and whether this structure provides appropriate incentives to act in the best interests of the fund.
Resources Dedicated to Investment Management and Support Services. The Board and the Fund Oversight and Research Committees reviewed the general qualifications and capabilities of the Investment Advisers' investment staff, including its size, education, experience, and resources, as well as the Investment Advisers' approach to recruiting, training, managing, and compensating investment personnel. The Board also noted that FMR has devoted increased resources to non-U.S. offices. The Board noted that Fidelity's analysts have extensive resources, tools and capabilities which allow them to conduct sophisticated quantitative and fundamental analysis, as well as credit analysis of issuers, counterparties and enhancers. The Board also believes that Fidelity's investment professionals have sufficient access to global information and data so as to provide competitive investment results over time, and that those professionals also have access to sophisticated tools which permit them to assess portfolio construction and risk and performance attribution characteristics continuously, as well as to transmit new information and research conclusions rapidly around the world. Additionally, in their deliberations, the Board considered the Investment Advisers' trading capabilities and resources which are an integral part of the investment management process.
Shareholder and Administrative Services. The Board considered (i) the nature, extent, quality, and cost of advisory, administrative, and shareholder services performed by the Investment Advisers and their affiliates under the Advisory Contracts and under separate agreements covering transfer agency, pricing and bookkeeping, and securities lending services for the fund; (ii) the nature and extent of the investment adviser's supervision of third party service providers, principally custodians and subcustodians; and (iii) the resources devoted to, and the record of compliance with, the fund's compliance policies and procedures. The Board also reviewed the allocation of fund brokerage, including allocations to brokers affiliated with the Investment Advisers, the use of brokerage commissions to pay fund expenses, and the use of "soft" commission dollars to pay for research services.
The Board noted that the growth of fund assets over time across the complex allows Fidelity to reinvest in the development of services designed to enhance the value or convenience of the Fidelity funds as investment vehicles. These services include 24-hour access to account information and market information through telephone representatives and over the Internet, investor education materials and asset allocation tools, and the expanded availability of Fidelity Investor Centers, with 35 new branches opening since 2010.
Annual Report
Investment in a Large Fund Family. The Board considered the benefits to shareholders of investing in a Fidelity fund, including the benefits of investing in a fund that is part of a large family of funds offering a variety of investment disciplines and providing a large variety of mutual fund investor services. The Board noted that Fidelity had taken, or had made recommendations that resulted in the Fidelity funds taking, a number of actions over the previous year that benefited particular funds, including (i) continuing to dedicate additional resources to investment research and support of the senior management team that oversees asset management; (ii) rationalizing product lines through the mergers of six funds into other funds; (iii) continuing to migrate the Freedom Funds to dedicated lower cost underlying funds; (iv) obtaining shareholder approval to broaden the investment strategies for Fidelity Consumer Finance Portfolio, Fidelity Emerging Asia Fund, and Fidelity Environment and Alternative Energy Portfolio; (v) contractually agreeing to reduce the management fees and impose other expense limitations on Spartan® 500 Index Fund and U.S. Bond Index Fund in connection with launching new institutional classes of these funds; (vi) changing the name, primary and supplemental benchmarks, and investment policies of Fidelity Global Strategies Fund to support the fund's flexible investment mandate and global orientation; and (vii) reducing the transfer agency account fee rates on certain accounts.
Investment Performance. The Board considered whether the fund has operated in accordance with its investment objective, as well as its record of compliance with its investment restrictions. It also reviewed the fund's absolute investment performance for each class, as well as the fund's relative investment performance for each class measured over multiple periods against (i) a broad-based securities market index, and (ii) a peer group of mutual funds deemed appropriate by Fidelity and reviewed by the Board. The following charts considered by the Board show, over the one-, three-, and five-year periods ended December 31, 2010, the cumulative total returns of Institutional Class (Class I) and Class B of the fund, the cumulative total returns of a broad-based securities market index ("benchmark"), and a range of cumulative total returns of a peer group of mutual funds identified by Morningstar, Inc. as having an investment style similar to that of the fund based on underlying portfolio holdings. The returns of Institutional Class (Class I) and Class B show the performance of the highest and lowest performing classes, respectively (based on five-year performance). The box within each chart shows the 25th percentile return (bottom of box) and the 75th percentile return (top of box) of the peer group. Returns shown above the box are in the first quartile and returns shown below the box are in the fourth quartile. The percentage beaten numbers noted below each chart correspond to the percentile box and represent the percentage of funds in the peer group whose performance was equal to or lower than that of the class indicated.
Annual Report
Board Approval of Investment Advisory Contracts and
Management Fees - continued
Fidelity Small Cap Growth Fund
The Board reviewed the fund's relative investment performance against its peer group and noted that the performance of Institutional Class (Class I) of the fund was in the third quartile for the one- and three-year periods and the second quartile for the five-year period. The Board also noted that the investment performance of the fund was lower than its benchmark for the one- and three-year periods, although the five-year cumulative total return of Institutional Class (Class I) compared favorably to its benchmark. The Board considered that the variations in performance among the fund's classes reflect the variations in class expenses, which result in lower performance for higher expense classes. The Board discussed with FMR actions that have been taken by FMR to improve the fund's disappointing performance relative to its peer group and benchmark. The Board also reviewed the fund's performance since inception as well as performance in the current year. The Board will continue to closely monitor the performance of the fund in the coming year and discuss with FMR other appropriate actions to address the performance of the fund.
The Board also considered that the fund's management fee is subject to upward or downward adjustment depending upon whether, and to what extent, the fund's investment performance for the performance period exceeds, or is exceeded by, the record (over the same period) of a Board-approved performance adjustment index. The Board noted that the performance adjustment provides FMR with a strong economic incentive to seek to achieve superior performance for the fund's shareholders and helps to more closely align the interests of FMR and the fund's shareholders.
Annual Report
Based on its review, the Board concluded that the nature, extent, and quality of services provided to the fund under the Advisory Contracts should benefit the fund's shareholders.
Competitiveness of Management Fee and Total Expense Ratio. The Board considered the fund's management fee and total expense ratio compared to "mapped groups" of competitive funds and classes. Fidelity creates "mapped groups" by combining similar Lipper investment objective categories that have comparable management fee characteristics. Combining Lipper investment objective categories aids the Board's management fee and total expense ratio comparisons by broadening the competitive group used for comparison and by reducing the number of universes to which various Fidelity funds are compared.
Management Fee. The Board considered two proprietary management fee comparisons for the 12-month periods shown in the chart below. The group of Lipper funds used by the Board for management fee comparisons is referred to below as the "Total Mapped Group." The Total Mapped Group comparison focuses on a fund's standing relative to the total universe of comparable funds available to investors in terms of gross management fees before expense reimbursements or caps, and without giving effect to the fund's performance adjustment. "TMG %" represents the percentage of funds in the Total Mapped Group that had management fees that were lower than the fund's. For example, a TMG % of 14% means that 86% of the funds in the Total Mapped Group had higher management fees than the fund. The "Asset-Size Peer Group" (ASPG) comparison focuses on a fund's standing relative to non-Fidelity funds similar in size to the fund within the Total Mapped Group. The ASPG represents at least 15% of the funds in the Total Mapped Group with comparable asset size and management fee characteristics, subject to a minimum of 50 funds (or all funds in the Total Mapped Group if fewer than 50). Additional information, such as the ASPG quartile in which the fund's management fee ranked and the impact of the fund's performance adjustment, is also included in the chart and considered by the Board.
Annual Report
Board Approval of Investment Advisory Contracts and
Management Fees - continued
Fidelity Small Cap Growth Fund
The Board noted that the fund's management fee ranked below the median of its Total Mapped Group and below the median of its ASPG for 2010. The Board also noted the effect of the fund's negative performance adjustment on the fund's management fee ranking. The Board noted that the performance adjustment for each year represents calculations for performance periods that differ from the periods shown in the performance charts above.
Based on its review, the Board concluded that the fund's management fee is fair and reasonable in light of the services that the fund receives and the other factors considered.
Total Expense Ratio. In its review of each class's total expense ratio, the Board considered the fund's management fee as well as other fund or class expenses, as applicable, such as transfer agent fees, pricing and bookkeeping fees, fund-paid 12b-1 fees, and custodial, legal, and audit fees. The Board also noted the effects of any waivers and reimbursements on fees and expenses, as well as the impact of the fund's performance adjustment. As part of its review, the Board also considered the current and historical total expense ratios of each class of the fund compared to competitive fund median expenses. Each class of the fund is compared to those funds and classes in the Total Mapped Group (used by the Board for management fee comparisons) that have a similar sales load structure.
The Board noted that the total expense ratio of each of Class A, Class B, Class C, Institutional Class, the retail class, and Class F ranked below its competitive median for 2010 and the total expense ratio of Class T ranked above its competitive median for 2010. The Board considered that various factors, including 12b-1 fees, positive or negative performance adjustments, and relatively higher other expenses in the case of small fund size, can affect total expense ratios. The Board noted that the total expense ratio of Class T was above the competitive median primarily because of higher 12b-1 fees on Class T. Class T has a higher 12b-1 fee, but a lower front-end sales charge, than traditionally priced front-end sales charge classes. The Board noted that the fund offers multiple classes, each of which has a different sales load and 12b-1 fee structure, and that the multiple structures are intended to offer a range of pricing options for the intermediary market. The Board also noted that the total expense ratios of the classes vary primarily by the level of their 12b-1 fees, although differences in transfer agent fees may also cause expenses to vary from class to class.
Annual Report
Fees Charged to Other Fidelity Clients. The Board also considered Fidelity fee structures and other information with respect to clients of FMR and its affiliates, such as other mutual funds advised or subadvised by FMR or its affiliates, pension plan clients, and other institutional clients. In March 2010, the Board created an ad hoc joint committee with the board of other Fidelity funds (the Committee) to review and compare Fidelity's institutional investment advisory business with its business of providing services to the Fidelity funds, including the differences in services provided, fees charged, and costs incurred, as well as competition in their respective marketplaces.
Based on its review of total expense ratios and fees charged to other Fidelity clients, the Board concluded that the total expense ratio of each class of the fund was reasonable, although Class T was above the median of the universe presented for comparison, in light of the services that the fund and its shareholders receive and the other factors considered, including the findings of the Committee.
Costs of the Services and Profitability. The Board considered the revenues earned and the expenses incurred by Fidelity in conducting the business of developing, marketing, distributing, managing, administering and servicing the fund and its shareholders. The Board also considered the level of Fidelity's profits in respect of all the Fidelity funds.
On an annual basis, FMR presents to the Board Fidelity's profitability for the fund. Fidelity calculates the profitability for each fund, as well as aggregate profitability for groups of Fidelity funds and all Fidelity funds, using a series of detailed revenue and cost allocation methodologies which originate with the books and records of Fidelity on which Fidelity's audited financial statements are based. The Audit Committee of the Board reviews any significant changes from the prior year's methodologies.
PricewaterhouseCoopers LLP (PwC), independent registered public accounting firm and auditor to Fidelity and certain Fidelity funds, has been engaged annually by the Board as part of the Board's assessment of Fidelity's profitability analysis. PwC's engagement includes the review and assessment of Fidelity's methodologies used in determining the revenues and expenses attributable to Fidelity's mutual fund business, and completion of agreed-upon procedures surrounding the mathematical accuracy of fund profitability and its conformity to allocation methodologies. After considering PwC's reports issued under the engagement and information provided by Fidelity, the Board concluded that while other allocation methods may also be reasonable, Fidelity's profitability methodologies are reasonable in all material respects.
Annual Report
Board Approval of Investment Advisory Contracts and
Management Fees - continued
The Board also reviewed Fidelity's non-fund businesses and fall-out benefits related to the mutual fund business as well as cases where Fidelity's affiliates may benefit from or be related to the fund's business.
The Board considered the costs of the services provided by and the profits realized by Fidelity in connection with the operation of the fund and was satisfied that the profitability was not excessive in the circumstances.
Economies of Scale. The Board considered whether there have been economies of scale in respect of the management of the Fidelity funds, whether the Fidelity funds (including the fund) have appropriately benefited from any such economies of scale, and whether there is potential for realization of any further economies of scale. The Board considered the extent to which the fund will benefit from economies of scale through increased services to the fund, through waivers or reimbursements, or through fee or expense reductions. The Board also noted that in 2009, it and the board of other Fidelity funds created an ad hoc committee (the Economies of Scale Committee) to analyze whether FMR attains economies of scale in respect of the management and servicing of the Fidelity funds, whether the Fidelity funds have appropriately benefited from such economies of scale, and whether there is potential for realization of any further economies of scale.
The Board recognized that the fund's management contract incorporates a "group fee" structure, which provides for lower group fee rates as total fund assets under FMR's management increase, and for higher group fee rates as total fund assets under FMR's management decrease. FMR calculates the group fee rates based on a tiered asset "breakpoint" schedule that varies based on asset class. The Board considered that the group fee is designed to deliver the benefits of economies of scale to fund shareholders when total Fidelity fund assets increase, even if assets of any particular fund are unchanged or have declined, because some portion of Fidelity's costs are attributable to services provided to all Fidelity funds, and all funds benefit if those costs can be allocated among more assets. The Board concluded that, given the group fee structure, fund shareholders will benefit from lower management fees as assets under FMR's management increase at the fund complex level, regardless of whether Fidelity achieves any such economies of scale.
Annual Report
The Board concluded, taking into account the analysis of the Economies of Scale Committee, that any potential economies of scale are being appropriately shared between fund shareholders and Fidelity.
Additional Information Requested by the Board. In order to develop fully the factual basis for consideration of the Fidelity funds' Advisory Contracts, the Board requested and received additional information on certain topics, including (i) fund performance trends, actions to be taken by FMR to improve certain funds' overall performance, and Fidelity's long-term strategies for certain funds; (ii) portfolio manager changes that have occurred during the past year and length of portfolio manager tenure for different categories of funds over time; (iii) Fidelity's compensation structure for portfolio managers and other key personnel and strategies for attracting and retaining non-investment personnel; (iv) the amount of the investment that each portfolio manager has made in the Fidelity fund(s) that he or she manages; (v) historical trends in Fidelity's realization of fall-out benefits; (vi) Fidelity's group fee structures and the rationale for the individual fee rates of certain funds; (vii) fund profitability methodology and the impact of certain factors on fund profitability results; (viii) trends regarding industry use of performance fee structures and Fidelity's compliance practices with respect to performance adjustment calculations; (ix) the fee structures in place for certain other Fidelity clients; and (x) explanations regarding the relative total expense ratios of certain funds and classes, total expense competitive trends, and actions that might be taken by FMR to reduce total expense ratios for certain funds and classes.
Based on its evaluation of all of the conclusions noted above, and after considering all factors it believed relevant, the Board ultimately concluded that the advisory fee structures are fair and reasonable, and that the fund's Advisory Contracts should be renewed.
Annual Report
Investment Adviser
Fidelity Management & Research Company
Boston, MA
Investment Sub-Advisers
FMR Co., Inc.
Fidelity Management & Research
(U.K.) Inc.
Fidelity Management & Research
(Hong Kong) Limited
Fidelity Management & Research
(Japan) Inc.
General Distributor
Fidelity Distributors Corporation
Boston, MA
Transfer and Service Agents
Fidelity Investments Institutional
Operations Company, Inc.
Boston, MA
Fidelity Service Company, Inc.
Boston, MA
Custodian
Citibank, N.A.
New York, NY
ASCP-UANN-0911
1.803713.106
(Fidelity Investment logo)(registered trademark)
Fidelity Advisor®
Small Cap Growth
Fund - Institutional Class
Annual Report
July 31, 2011
(2_fidelity_logos) (Registered_Trademark)
Institutional Class
is a class of Fidelity®
Small Cap Growth
Fund
Contents
Chairman's Message | <Click Here> | The Chairman's message to shareholders. |
Performance | <Click Here> | How the fund has done over time. |
Management's Discussion of Fund Performance | <Click Here> | The Portfolio Manager's review of fundperformance and strategy. |
Shareholder Expense Example | <Click Here> | An example of shareholder expenses. |
Investment Changes | <Click Here> | A summary of major shifts in the fund's investments over the past six months. |
Investments | <Click Here> | A complete list of the fund's investments with their market values. |
Financial Statements | <Click Here> | Statements of assets and liabilities, operations, and changes in net assets,
as well as financial highlights. |
Notes | <Click Here> | Notes to the financial statements. |
Report of Independent Registered Public Accounting Firm | <Click Here> | |
Trustees and Officers | <Click Here> | |
Distributions | <Click Here> | |
Board Approval of Investment Advisory Contracts and Management Fees | <Click Here> | |
To view a fund's proxy voting guidelines and proxy voting record for the 12-month period ended June 30, visit http://www.fidelity.com/proxyvotingresults or visit the Securities and Exchange Commission's (SEC) web site at http://www.sec.gov. You may also call 1-877-208-0098 to request a free copy of the proxy voting guidelines.
Standard & Poor's, S&P and S&P 500 are registered service marks of The McGraw-Hill Companies, Inc. and have been licensed for use by Fidelity Distributors Corporation.
Other third party marks appearing herein are the property of their respective owners.
All other marks appearing herein are registered or unregistered trademarks or service marks of FMR LLC or an affiliated company.
Annual Report
This report and the financial statements contained herein are submitted for the general information of the shareholders of the fund. This report is not authorized for distribution to prospective investors in the fund unless preceded or accompanied by an effective prospectus.
A fund files its complete schedule of portfolio holdings with the SEC for the first and third quarters of each fiscal year on Form N-Q. Forms N-Q are available on the SEC's web site at http://www.sec.gov. A fund's Forms N-Q may be reviewed and copied at the SEC's Public Reference Room in Washington, DC. Information regarding the operation of the SEC's Public Reference Room may be obtained by calling 1-800-SEC-0330. For a complete list of a fund's portfolio holdings, view the most recent holdings listing, semiannual report, or annual report on Fidelity's web site at http://www.fidelity.com, http://www.advisor.fidelity.com, or http://www.401k.com, as applicable.
NOT FDIC INSURED • MAY LOSE VALUE • NO BANK GUARANTEE
Neither the fund nor Fidelity Distributors Corporation is a bank.
Annual Report
(photo_of_James_C_Curvey)
Dear Shareholder:
The second half of 2011 began with U.S. equities continuing to give back some of the gains achieved earlier in the year. In the days leading up to July 31, markets were shaken by a political stalemate in which Congress struggled to address the debt ceiling issue before an early-August deadline. The resulting uncertainty held back markets in July, the third consecutive monthly decline for equities, effectively reversing the positive momentum seen through the end of April. Financial markets are always unpredictable, of course, but there are several time-tested investment principles that can help put the odds in your favor.
One of the basic tenets is to invest for the long term. Over time, riding out the markets' inevitable ups and downs has proven much more effective than selling into panic or chasing the hottest trend. Even missing only a few of the markets' best days can significantly diminish investor returns. Patience also affords the benefits of compounding - of earning interest on additional income or reinvested dividends and capital gains. There can be tax advantages and cost benefits to consider as well. While staying the course doesn't eliminate risk, it can considerably lessen the effect of short-term declines.
You can further manage your investing risk through diversification. And today, more than ever, geographic diversification should be taken into account. Studies indicate that asset allocation is the single most important determinant of a portfolio's long-term success. The right mix of stocks, bonds and cash - aligned to your particular risk tolerance and investment objective - is very important. Age-appropriate rebalancing is also an essential aspect of asset allocation. For younger investors, an emphasis on equities - which historically have been the best-performing asset class over time - is encouraged. As investors near their specific goal, such as retirement or sending a child to college, consideration may be given to replacing volatile assets (e.g. common stocks) with more-stable fixed investments (bonds or savings plans).
A third principle - investing regularly - can help lower the average cost of your purchases. Investing a certain amount of money each month or quarter helps ensure you won't pay for all your shares at market highs. This strategy - known as dollar cost averaging - also reduces "emotion" from investing, helping shareholders avoid selling weak performers just prior to an upswing, or chasing a hot performer just before a correction.
We invite you to contact us via the Internet, through our Investor Centers or by phone. It is our privilege to provide you the information you need to make the investments that are right for you.
Sincerely,
(The acting chairman's signature appears here.)
James C. Curvey
Acting Chairman
Annual Report
Performance: The Bottom Line
Average annual total return reflects the change in the value of an investment, assuming reinvestment of the class' distributions from dividend income and capital gains (the profits earned upon the sale of securities that have grown in value, if any) and assuming a constant rate of performance each year. The $10,000 table and the fund's returns do not reflect the deduction of taxes that a shareholder would pay on fund distributions or the redemption of fund shares. During periods of reimbursement by Fidelity, a fund's total return will be greater than it would be had the reimbursement not occurred. How a fund did yesterday is no guarantee of how it will do tomorrow.
Average Annual Total Returns
Periods ended July 31, 2011 | Past 1
year | Past 5
years | Life of
fund A |
Institutional Class | 30.24% | 6.87% | 9.34% |
A From November 3, 2004.
$10,000 Over Life of Fund
Let's say hypothetically that $10,000 was invested in Fidelity Advisor® Small Cap Growth Fund - Institutional Class on November 3, 2004, when the fund started. The chart shows how the value of your investment would have changed, and also shows how the Russell 2000® Growth Index performed over the same period.
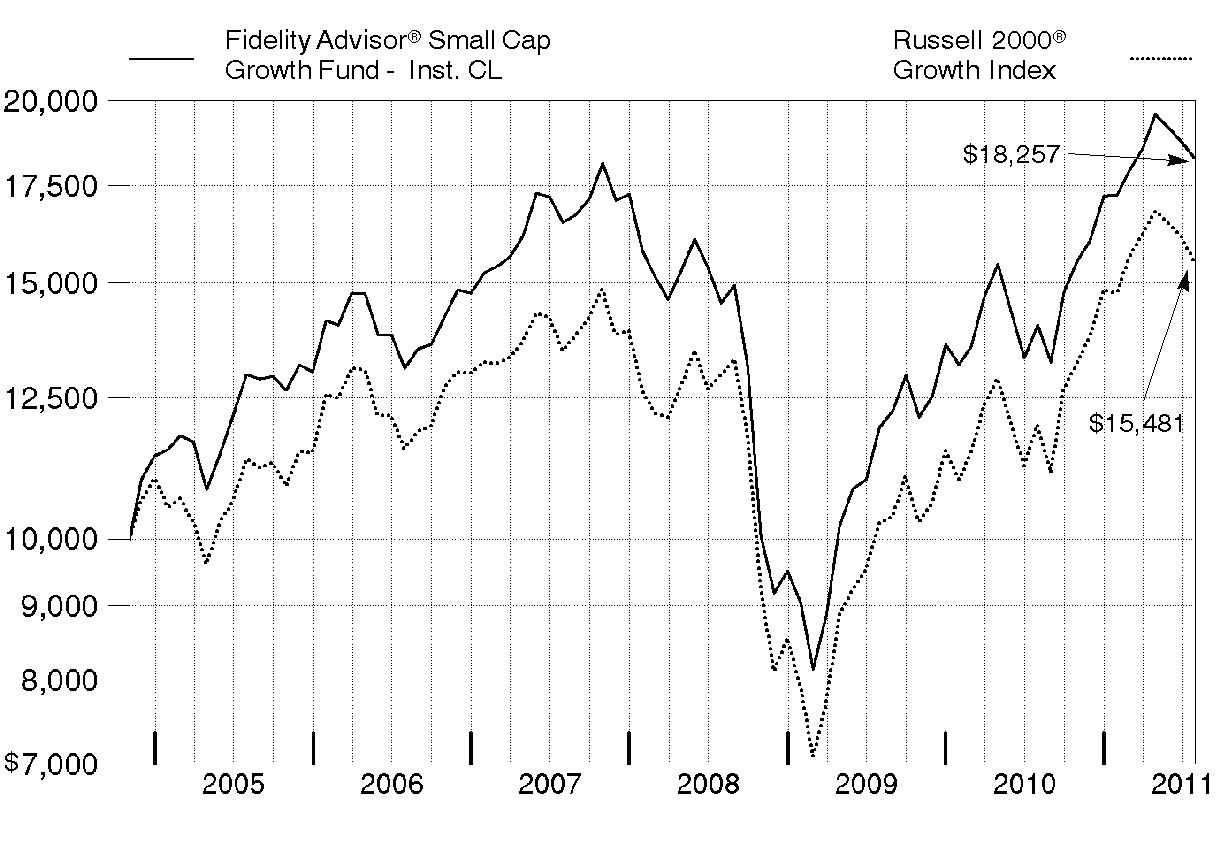
Annual Report
Market Recap: U.S. stocks registered solid double-digit gains for the 12 months ending July 31, 2011, extending a rally that began more than two years earlier. Despite a rough start in August 2010, markets turned positive in September, as increased demand for capital goods and other upbeat indicators trumped investor worry about a U.S. recessionary relapse. The broad market, as measured by the S&P 500® Index, rose 9% that month, its biggest September gain in 71 years. Seven more monthly advances followed, fueled by encouraging corporate earnings and economic activity. However, volatility picked up in the period's latter months, as markets reacted to continued high U.S. unemployment, nagging debt troubles in Europe and looming legislative battles over the federal debt ceiling. May unemployment rose above 9% for the first time in 2011, contributing to a traditional "June swoon" for stocks. Market uncertainty lingered in July, when the S&P 500® posted its second-biggest monthly loss of the period. For the full year, the S&P 500® climbed 19.65%, while the blue-chip-laden Dow Jones Industrial AverageSM rose a comparable 19.09% and the technology-heavy Nasdaq Composite® Index gained 23.40%. On the capitalization spectrum, stocks of mid-cap companies fared best, with the Russell Midcap® Index rising 24.51% and the small-cap Russell 2000® Index adding 23.92%.
Comments from Lionel Harris, Portfolio Manager of Fidelity Advisor® Small Cap Growth Fund: For the year, the fund's Class A, Class T, Class B and Class C shares returned 29.78%, 29.44%, 28.94% and 28.91%, respectively (excluding sales charges), versus 29.32% for the Russell 2000® Growth Index. The fund's positioning in consumer discretionary helped, led by stock picking in retailing. Security selection in materials also contributed, as did positioning within technology. In contrast, my choices in energy hurt, as did weak stock selection in banks; a modest cash position in a rising market; and the fund's non-U.S. holdings, despite a weaker U.S. dollar. Individually, Fossil did extremely well, and I sold the stock after it reached my target price. Tempur-Pedic International, a maker of premium foam mattresses and pillows, also helped. In health care, drugmaker Questcor Pharmaceuticals contributed, thanks to the strength of its primary product, Achtar®. Shoe retailer DSW also contributed. Of these stocks, only Questcor and DSW were in the benchmark. On the negative side, the stock of Digital River, which builds and operates electronic storefronts, did poorly. Touch-screen manufacturer Synaptics and urban-oriented retailer Citi Trends, the latter of which the fund no longer held at period end, also disappointed.
Comments from Lionel Harris, Portfolio Manager of Fidelity Advisor® Small Cap Growth Fund: For the year, the fund's Institutional Class shares returned 30.24%, outpacing the 29.32% return of the Russell 2000® Growth Index. The fund's positioning in consumer discretionary helped, led by stock picking in retail. Security selection in materials also contributed. In contrast, positioning in energy hurt, as did weak stock selection in banks; a modest cash position in a rising market; and the fund's non-U.S. holdings, despite a weaker U.S. dollar. Individually, Fossil did extremely well, and I sold the stock after it reached my target price. Tempur-Pedic International, a maker of premium foam mattresses and pillows, also helped. In health care, drugmaker Questcor Pharmaceuticals contributed, thanks to the strength of its primary product, Achtar®. Shoe retailer DSW also contributed. Of these stocks, only Questcor and DSW were in the benchmark. On the negative side, Digital River, which builds and operates electronic storefronts, did poorly. Touchscreen manufacturer Synaptics and urban-oriented retailer Citi Trends, the latter of which the fund no longer held at period end, also disappointed.
Annual Report
The views expressed above reflect those of the portfolio manager(s) only through the end of the period as stated on the cover of this report and do not necessarily represent the views of Fidelity or any other person in the Fidelity organization. Any such views are subject to change at any time based upon market or other conditions and Fidelity disclaims any responsibility to update such views. These views may not be relied on as investment advice and, because investment decisions for a Fidelity fund are based on numerous factors, may not be relied on as an indication of trading intent on behalf of any Fidelity fund.
Annual Report
Shareholder Expense Example
As a shareholder of the Fund, you incur two types of costs: (1) transaction costs, including sales charges (loads) on purchase payments or redemption proceeds, redemption fees, and (2) ongoing costs, including management fees, distribution and/or service (12b-1) fees and other Fund expenses. This Example is intended to help you understand your ongoing costs (in dollars) of investing in the Fund and to compare these costs with the ongoing costs of investing in other mutual funds.
The Example is based on an investment of $1,000 invested at the beginning of the period and held for the entire period (February 1, 2011 to July 31, 2011).
Actual Expenses
The first line of the accompanying table for each class of the Fund provides information about actual account values and actual expenses. You may use the information in this line, together with the amount you invested, to estimate the expenses that you paid over the period. Simply divide your account value by $1,000.00 (for example, an $8,600 account value divided by $1,000.00 = 8.6), then multiply the result by the number in the first line for a class of the Fund under the heading entitled "Expenses Paid During Period" to estimate the expenses you paid on your account during this period. A small balance maintenance fee of $12.00 that is charged once a year may apply for certain accounts with a value of less than $2,000. This fee is not included in the table below. If it was, the estimate of expenses you paid during the period would be higher, and your ending account value lower, by this amount. In addition, the Fund, as a shareholder in the underlying Fidelity Central Funds, will indirectly bear its pro-rata share of the fees and expenses incurred by the underlying Fidelity Central Funds. These fees and expenses are not included in the Fund's annualized expense ratio used to calculate the expense estimate in the table below.
Hypothetical Example for Comparison Purposes
The second line of the accompanying table for each class of the Fund provides information about hypothetical account values and hypothetical expenses based on a Class' actual expense ratio and an assumed rate of return of 5% per year before expenses, which is not the Class' actual return. The hypothetical account values and expenses may not be used to estimate the actual ending account balance or expenses you paid for the period. You may use this information to compare the ongoing costs of investing in the Fund and other funds. To do so, compare this 5% hypothetical example with the 5% hypothetical examples that appear in the shareholder reports of the other funds. A small balance maintenance fee of $12.00 that is charged once a year may apply for certain accounts with a value of less than $2,000. This fee is not included in the table below. If it was, the estimate of expenses you paid during the period would be higher, and your ending account value lower, by this amount. In addition, the Fund, as a shareholder in the underlying Fidelity Central Funds, will indirectly bear its pro-rata share of the fees and expenses incurred by the underlying Fidelity Central Funds. These fees and expenses are not included in the Fund's annualized expense ratio used to calculate the expense estimate in the table below.
Please note that the expenses shown in the table are meant to highlight your ongoing costs only and do not reflect any transaction costs. Therefore, the second line of the table is useful in comparing ongoing costs only, and will not help you determine the relative total costs of owning different funds. In addition, if these transactional costs were included, your costs would have been higher.
Annual Report
| Annualized
Expense Ratio | Beginning
Account Value
February 1, 2011 | Ending
Account Value
July 31, 2011 | Expenses Paid
During Period*
February 1, 2011 to
July 31, 2011 |
Class A | 1.25% | | | |
Actual | | $ 1,000.00 | $ 1,058.70 | $ 6.38 |
HypotheticalA | | $ 1,000.00 | $ 1,018.60 | $ 6.26 |
Class T | 1.50% | | | |
Actual | | $ 1,000.00 | $ 1,057.90 | $ 7.65 |
HypotheticalA | | $ 1,000.00 | $ 1,017.36 | $ 7.50 |
Class B | 2.00% | | | |
Actual | | $ 1,000.00 | $ 1,055.20 | $ 10.19 |
HypotheticalA | | $ 1,000.00 | $ 1,014.88 | $ 9.99 |
Class C | 2.00% | | | |
Actual | | $ 1,000.00 | $ 1,055.30 | $ 10.19 |
HypotheticalA | | $ 1,000.00 | $ 1,014.88 | $ 9.99 |
Small Cap Growth | .93% | | | |
Actual | | $ 1,000.00 | $ 1,060.50 | $ 4.75 |
HypotheticalA | | $ 1,000.00 | $ 1,020.18 | $ 4.66 |
Class F | .70% | | | |
Actual | | $ 1,000.00 | $ 1,061.50 | $ 3.58 |
HypotheticalA | | $ 1,000.00 | $ 1,021.32 | $ 3.51 |
Institutional Class | .95% | | | |
Actual | | $ 1,000.00 | $ 1,060.40 | $ 4.85 |
HypotheticalA | | $ 1,000.00 | $ 1,020.08 | $ 4.76 |
A 5% return per year before expenses
* Expenses are equal to each Class' annualized expense ratio, multiplied by the average account value over the period, multiplied by 181/365 (to reflect the one-half year period).
Annual Report
Investment Changes (Unaudited)
Top Ten Stocks as of July 31, 2011 |
| % of fund's
net assets | % of fund's net assets
6 months ago |
Esterline Technologies Corp. | 1.4 | 1.3 |
Rockwood Holdings, Inc. | 1.4 | 0.0 |
DSW, Inc. Class A | 1.3 | 1.0 |
Solera Holdings, Inc. | 1.3 | 1.1 |
Steven Madden Ltd. | 1.3 | 0.9 |
Catalyst Health Solutions, Inc. | 1.2 | 0.5 |
Carpenter Technology Corp. | 1.2 | 0.8 |
The Cooper Companies, Inc. | 1.2 | 1.0 |
Rowan Companies, Inc. | 1.2 | 1.1 |
Sally Beauty Holdings, Inc. | 1.2 | 0.7 |
| 12.7 | |
Top Five Market Sectors as of July 31, 2011 |
| % of fund's
net assets | % of fund's net assets
6 months ago |
Information Technology | 26.8 | 30.3 |
Industrials | 20.1 | 20.9 |
Health Care | 17.5 | 17.8 |
Consumer Discretionary | 17.0 | 16.1 |
Energy | 6.2 | 3.8 |
Asset Allocation (% of fund's net assets) |
As of July 31, 2011 * | As of January 31, 2011 ** |
| Stocks 98.7% | | | Stocks 97.5% | |
| Short-Term
Investments and
Net Other Assets 1.3% | | | Short-Term
Investments and
Net Other Assets 2.5% | |
* Foreign investments | 13.7% | | ** Foreign investments | 13.8% | |

Annual Report
Investments July 31, 2011
Showing Percentage of Net Assets
Common Stocks - 98.7% |
| Shares | | Value |
CONSUMER DISCRETIONARY - 17.0% |
Auto Components - 1.7% |
Modine Manufacturing Co. (a) | 769,000 | | $ 11,465,791 |
Tenneco, Inc. (a) | 508,000 | | 20,289,520 |
| | 31,755,311 |
Diversified Consumer Services - 0.7% |
Steiner Leisure Ltd. (a) | 278,000 | | 13,516,360 |
Household Durables - 1.0% |
Tempur-Pedic International, Inc. (a) | 242,000 | | 17,426,420 |
Internet & Catalog Retail - 0.7% |
Start Today Co. Ltd. | 540,000 | | 13,414,929 |
Multiline Retail - 1.4% |
Dollarama, Inc. | 415,000 | | 13,882,562 |
Marisa Lojas SA | 856,600 | | 12,038,345 |
| | 25,920,907 |
Specialty Retail - 7.0% |
Delticom AG | 111,910 | | 11,694,830 |
DSW, Inc. Class A (a)(d) | 442,000 | | 23,417,160 |
Jos. A. Bank Clothiers, Inc. (a)(d) | 213,900 | | 10,975,209 |
Sally Beauty Holdings, Inc. (a) | 1,242,000 | | 21,362,400 |
Signet Jewelers Ltd. (a) | 466,400 | | 19,980,576 |
SuperGroup PLC (a)(d) | 560,000 | | 9,790,502 |
Tom Tailor Holding AG (a) | 721,621 | | 15,397,388 |
Tractor Supply Co. | 240,000 | | 15,820,800 |
| | 128,438,865 |
Textiles, Apparel & Luxury Goods - 4.5% |
G-III Apparel Group Ltd. (a) | 250,300 | | 7,726,761 |
PVH Corp. | 257,559 | | 18,428,346 |
Steven Madden Ltd. (a) | 602,500 | | 22,955,250 |
Ted Baker PLC | 1,371,073 | | 18,073,550 |
Warnaco Group, Inc. (a) | 273,000 | | 14,550,900 |
| | 81,734,807 |
TOTAL CONSUMER DISCRETIONARY | | 312,207,599 |
CONSUMER STAPLES - 2.6% |
Food & Staples Retailing - 0.7% |
Fresh Market, Inc. (d) | 356,600 | | 12,669,998 |
Food Products - 0.9% |
Calavo Growers, Inc. (d)(e) | 814,046 | | 16,826,331 |
Common Stocks - continued |
| Shares | | Value |
CONSUMER STAPLES - continued |
Personal Products - 1.0% |
Inter Parfums, Inc. | 897,000 | | $ 17,975,880 |
TOTAL CONSUMER STAPLES | | 47,472,209 |
ENERGY - 6.2% |
Energy Equipment & Services - 3.3% |
ION Geophysical Corp. (a) | 2,055,000 | | 20,837,700 |
Newpark Resources, Inc. (a) | 1,928,900 | | 17,919,481 |
Rowan Companies, Inc. (a) | 556,000 | | 21,778,520 |
| | 60,535,701 |
Oil, Gas & Consumable Fuels - 2.9% |
Gulfport Energy Corp. (a) | 495,000 | | 18,047,700 |
Petroleum Development Corp. (a) | 547,200 | | 19,874,304 |
Targa Resources Corp. (d) | 474,500 | | 16,019,120 |
| | 53,941,124 |
TOTAL ENERGY | | 114,476,825 |
FINANCIALS - 3.9% |
Capital Markets - 0.6% |
Financial Engines, Inc. (a) | 510,000 | | 12,117,600 |
Commercial Banks - 1.5% |
Banco Pine SA | 1,860,300 | | 12,412,394 |
CapitalSource, Inc. | 2,385,000 | | 15,407,100 |
| | 27,819,494 |
Real Estate Investment Trusts - 0.8% |
CBL & Associates Properties, Inc. | 797,000 | | 14,154,720 |
Real Estate Management & Development - 1.0% |
Jones Lang LaSalle, Inc. | 216,900 | | 18,462,528 |
TOTAL FINANCIALS | | 72,554,342 |
HEALTH CARE - 17.5% |
Biotechnology - 2.1% |
Acadia Pharmaceuticals, Inc. (a) | 68,900 | | 112,307 |
Acorda Therapeutics, Inc. (a) | 1,000 | | 28,400 |
Affymax, Inc. (a) | 15,100 | | 99,811 |
Alnylam Pharmaceuticals, Inc. (a) | 5,400 | | 50,652 |
AMAG Pharmaceuticals, Inc. (a) | 12,700 | | 188,087 |
Ardea Biosciences, Inc. (a) | 249,263 | | 5,832,754 |
Common Stocks - continued |
| Shares | | Value |
HEALTH CARE - continued |
Biotechnology - continued |
BioMarin Pharmaceutical, Inc. (a) | 295,000 | | $ 9,212,850 |
BioMimetic Therapeutics, Inc. (a) | 52,500 | | 202,650 |
Dyax Corp. (a) | 2,300 | | 3,772 |
Emergent BioSolutions, Inc. (a) | 7,800 | | 161,070 |
Enzon Pharmaceuticals, Inc. (a) | 7,800 | | 75,816 |
Horizon Pharma, Inc. | 550,000 | | 4,972,000 |
Maxygen, Inc. | 38,400 | | 208,512 |
Momenta Pharmaceuticals, Inc. (a) | 5,700 | | 100,662 |
Myrexis, Inc. (a) | 36,900 | | 125,091 |
Myriad Genetics, Inc. (a) | 7,700 | | 163,779 |
Omeros Corp. (a) | 5,500 | | 22,330 |
PDL BioPharma, Inc. (d) | 1,560,000 | | 9,656,400 |
Repligen Corp. (a) | 19,000 | | 67,070 |
SuperGen, Inc. (a) | 73,600 | | 225,216 |
Theravance, Inc. (a)(d) | 299,000 | | 6,392,620 |
Vanda Pharmaceuticals, Inc. (a) | 29,303 | | 210,396 |
| | 38,112,245 |
Health Care Equipment & Supplies - 4.1% |
Cyberonics, Inc. (a) | 415,000 | | 11,263,100 |
Integra LifeSciences Holdings Corp. (a) | 317,400 | | 14,305,218 |
Sirona Dental Systems, Inc. (a) | 255,000 | | 12,897,900 |
The Cooper Companies, Inc. | 286,000 | | 21,876,140 |
Wright Medical Group, Inc. (a) | 1,020,000 | | 15,952,800 |
| | 76,295,158 |
Health Care Providers & Services - 6.9% |
Accretive Health, Inc. (a)(d) | 355,000 | | 10,664,200 |
Air Methods Corp. (a) | 280,000 | | 19,628,000 |
Catalyst Health Solutions, Inc. (a) | 343,000 | | 22,476,790 |
Corvel Corp. (a) | 400,000 | | 18,460,000 |
IPC The Hospitalist Co., Inc. (a) | 310,000 | | 14,021,300 |
MWI Veterinary Supply, Inc. (a) | 180,000 | | 16,030,800 |
PSS World Medical, Inc. (a) | 610,000 | | 14,597,300 |
Synergy Health PLC | 695,411 | | 10,845,074 |
| | 126,723,464 |
Life Sciences Tools & Services - 2.8% |
Bruker BioSciences Corp. (a) | 1,059,000 | | 18,235,980 |
PerkinElmer, Inc. | 704,800 | | 17,239,408 |
QIAGEN NV (a)(d) | 966,000 | | 16,364,040 |
| | 51,839,428 |
Common Stocks - continued |
| Shares | | Value |
HEALTH CARE - continued |
Pharmaceuticals - 1.6% |
Cadence Pharmaceuticals, Inc. (a)(d) | 767,693 | | $ 6,640,544 |
Cardiome Pharma Corp. (a) | 1,025,000 | | 5,096,033 |
Hikma Pharmaceuticals PLC | 262,838 | | 2,946,973 |
Questcor Pharmaceuticals, Inc. (a) | 495,000 | | 15,369,750 |
| | 30,053,300 |
TOTAL HEALTH CARE | | 323,023,595 |
INDUSTRIALS - 20.1% |
Aerospace & Defense - 4.1% |
Esterline Technologies Corp. (a) | 332,000 | | 25,354,840 |
Teledyne Technologies, Inc. (a) | 387,000 | | 20,987,010 |
TransDigm Group, Inc. (a) | 164,000 | | 14,771,480 |
Triumph Group, Inc. (d) | 258,000 | | 13,890,720 |
| | 75,004,050 |
Building Products - 1.5% |
A.O. Smith Corp. | 242,000 | | 10,035,740 |
Armstrong World Industries, Inc. | 449,000 | | 17,735,500 |
| | 27,771,240 |
Commercial Services & Supplies - 2.3% |
Higher One Holdings, Inc. (a)(d) | 695,000 | | 13,795,750 |
Sykes Enterprises, Inc. (a) | 472,621 | | 9,121,585 |
Waste Connections, Inc. | 626,500 | | 20,198,360 |
| | 43,115,695 |
Construction & Engineering - 2.5% |
Foster Wheeler AG (a) | 484,000 | | 13,116,400 |
KBR, Inc. | 595,980 | | 21,246,687 |
Outotec OYJ | 245,000 | | 12,085,130 |
| | 46,448,217 |
Electrical Equipment - 3.6% |
Acuity Brands, Inc. | 320,500 | | 15,605,145 |
GrafTech International Ltd. (a) | 705,000 | | 13,578,300 |
Regal-Beloit Corp. | 302,000 | | 18,310,260 |
Zumtobel AG | 755,596 | | 17,756,266 |
| | 65,249,971 |
Machinery - 2.1% |
Blount International, Inc. (a) | 744,000 | | 12,372,720 |
Common Stocks - continued |
| Shares | | Value |
INDUSTRIALS - continued |
Machinery - continued |
Nordson Corp. | 263,000 | | $ 13,420,890 |
Wabtec Corp. | 195,000 | | 12,581,400 |
| | 38,375,010 |
Professional Services - 0.6% |
Advisory Board Co. (a) | 205,000 | | 10,975,700 |
Road & Rail - 0.5% |
Contrans Group, Inc. Class A (d) | 1,106,800 | | 9,846,975 |
Trading Companies & Distributors - 2.9% |
Interline Brands, Inc. (a) | 127,442 | | 2,132,105 |
Rush Enterprises, Inc. Class A (a) | 928,254 | | 18,555,797 |
Watsco, Inc. | 224,000 | | 13,256,320 |
WESCO International, Inc. (a) | 382,000 | | 19,363,580 |
| | 53,307,802 |
TOTAL INDUSTRIALS | | 370,094,660 |
INFORMATION TECHNOLOGY - 26.8% |
Communications Equipment - 2.4% |
Anaren, Inc. (a) | 571,774 | | 11,441,198 |
DG FastChannel, Inc. (a) | 527,329 | | 14,902,318 |
Polycom, Inc. (a) | 699,000 | | 18,893,970 |
| | 45,237,486 |
Computers & Peripherals - 1.6% |
Super Micro Computer, Inc. (a) | 834,923 | | 11,764,065 |
Synaptics, Inc. (a)(d) | 726,000 | | 17,837,820 |
| | 29,601,885 |
Electronic Equipment & Components - 3.7% |
Fabrinet (a) | 505,000 | | 7,777,000 |
Insight Enterprises, Inc. (a) | 837,400 | | 14,093,442 |
Jabil Circuit, Inc. | 1,163,000 | | 21,294,530 |
OSI Systems, Inc. (a) | 329,000 | | 13,584,410 |
SYNNEX Corp. (a) | 432,800 | | 12,256,896 |
| | 69,006,278 |
Internet Software & Services - 6.2% |
Demand Media, Inc. (d) | 960,000 | | 9,734,400 |
Digital River, Inc. (a) | 501,000 | | 12,775,500 |
LivePerson, Inc. (a)(d) | 1,080,000 | | 13,294,800 |
Open Text Corp. (a) | 190,000 | | 12,825,099 |
Perficient, Inc. (a)(e) | 1,718,502 | | 17,202,205 |
Common Stocks - continued |
| Shares | | Value |
INFORMATION TECHNOLOGY - continued |
Internet Software & Services - continued |
Rackspace Hosting, Inc. (a)(d) | 525,000 | | $ 21,000,000 |
Sohu.com, Inc. (a) | 182,000 | | 16,398,200 |
Travelzoo, Inc. (a)(d) | 198,000 | | 10,454,400 |
| | 113,684,604 |
IT Services - 2.4% |
Virtusa Corp. (a) | 900,000 | | 17,694,000 |
WNS Holdings Ltd. sponsored ADR (a) | 613,457 | | 6,134,570 |
Wright Express Corp. (a) | 420,000 | | 20,664,000 |
| | 44,492,570 |
Semiconductors & Semiconductor Equipment - 5.1% |
Ceva, Inc. (a) | 396,700 | | 11,988,274 |
Cymer, Inc. (a) | 306,901 | | 13,512,851 |
Entegris, Inc. (a) | 2,321,500 | | 19,895,255 |
Hittite Microwave Corp. (a) | 183,821 | | 10,292,138 |
International Rectifier Corp. (a) | 533,000 | | 13,692,770 |
Semtech Corp. (a) | 461,744 | | 10,758,635 |
Standard Microsystems Corp. (a) | 557,185 | | 13,182,997 |
| | 93,322,920 |
Software - 5.4% |
Aspen Technology, Inc. (a) | 600,000 | | 9,300,000 |
BroadSoft, Inc. (a) | 344,591 | | 10,065,503 |
ebix.com, Inc. (a)(d) | 717,510 | | 14,127,772 |
Informatica Corp. (a) | 274,000 | | 14,009,620 |
Kenexa Corp. (a) | 450,000 | | 11,506,500 |
Solera Holdings, Inc. | 417,000 | | 23,301,960 |
TIBCO Software, Inc. (a) | 638,000 | | 16,613,520 |
| | 98,924,875 |
TOTAL INFORMATION TECHNOLOGY | | 494,270,618 |
MATERIALS - 4.6% |
Chemicals - 2.3% |
Rockwood Holdings, Inc. (a) | 418,000 | | 25,276,460 |
Solutia, Inc. (a) | 797,000 | | 17,087,680 |
| | 42,364,140 |
Common Stocks - continued |
| Shares | | Value |
MATERIALS - continued |
Metals & Mining - 2.3% |
Carpenter Technology Corp. | 382,000 | | $ 21,942,080 |
Royal Gold, Inc. | 323,000 | | 20,704,300 |
| | 42,646,380 |
TOTAL MATERIALS | | 85,010,520 |
TOTAL COMMON STOCKS (Cost $1,533,825,944) | 1,819,110,368 |
Money Market Funds - 8.7% |
| | | |
Fidelity Cash Central Fund, 0.14% (b) | 45,332,402 | | 45,332,402 |
Fidelity Securities Lending Cash Central Fund, 0.15% (b)(c) | 115,743,521 | | 115,743,521 |
TOTAL MONEY MARKET FUNDS (Cost $161,075,923) | 161,075,923 |
TOTAL INVESTMENT PORTFOLIO - 107.4% (Cost $1,694,901,867) | | 1,980,186,291 |
NET OTHER ASSETS (LIABILITIES) - (7.4)% | | (137,048,070) |
NET ASSETS - 100% | $ 1,843,138,221 |
Legend |
(a) Non-income producing |
(b) Affiliated fund that is available only to investment companies and other accounts managed by Fidelity Investments. The rate quoted is the annualized seven-day yield of the fund at period end. A complete unaudited listing of the fund's holdings as of its most recent quarter end is available upon request. In addition, each Fidelity Central Fund's financial statements, which are not covered by the Fund's Report of Independent Registered Public Accounting Firm, are available on the SEC's website or upon request. |
(c) Investment made with cash collateral received from securities on loan. |
(d) Security or a portion of the security is on loan at period end. |
(e) Affiliated company |
Affiliated Central Funds |
Information regarding fiscal year to date income earned by the Fund from investments in Fidelity Central Funds is as follows: |
Fund | Income earned |
Fidelity Cash Central Fund | $ 90,582 |
Fidelity Securities Lending Cash Central Fund | 1,308,812 |
Total | $ 1,399,394 |
Other Affiliated Issuers |
An affiliated company is a company in which the Fund has ownership of at least 5% of the voting securities. Fiscal year to date transactions with companies which are or were affiliates are as follows: |
Affiliate | Value,
beginning of
period | Purchases | Sales
Proceeds | Dividend
Income | Value,
end of
period |
Calavo Growers, Inc. | $ 12,651,852 | $ 4,843,498 | $ - | $ 351,475 | $ 16,826,331 |
Online Resources Corp. | 7,777,946 | 567,018 | 12,586,965 | - | - |
Perficient, Inc. | 13,394,542 | 1,718,096 | - | - | 17,202,205 |
Total | $ 33,824,340 | $ 7,128,612 | $ 12,586,965 | $ 351,475 | $ 34,028,536 |
Other Information |
All investments are categorized as Level 1 under the Fair Value Hierarchy. The inputs or methodology used for valuing securities may not be an indication of the risk associated with investing in those securities. For more information on valuation inputs, please refer to the Security Valuation section in the accompanying Notes to Financial Statements. |
Distribution of investments by country of issue, as a percentage of total net assets, is as follows: (Unaudited) |
United States of America | 86.3% |
Canada | 2.3% |
United Kingdom | 2.2% |
Germany | 1.4% |
Brazil | 1.3% |
Bermuda | 1.1% |
Austria | 1.0% |
Others (Individually Less Than 1%) | 4.4% |
| 100.0% |
Income Tax Information |
The Fund intends to elect to defer to its fiscal year ending July 31, 2012 approximately $848,304 of currency losses recognized during the period November 1, 2010 to July 31, 2011. |
See accompanying notes which are an integral part of the financial statements.
Annual Report
Statement of Assets and Liabilities
| July 31, 2011 |
| | |
Assets | | |
Investment in securities, at value (including securities loaned of $112,721,987) - See accompanying schedule: Unaffiliated issuers (cost $1,500,388,101) | $ 1,785,081,832 | |
Fidelity Central Funds (cost $161,075,923) | 161,075,923 | |
Other affiliated issuers (cost $33,437,843) | 34,028,536 | |
Total Investments (cost $1,694,901,867) | | $ 1,980,186,291 |
Cash | | 1,964,053 |
Receivable for investments sold | | 19,020,388 |
Receivable for fund shares sold | | 1,316,311 |
Dividends receivable | | 824,348 |
Distributions receivable from Fidelity Central Funds | | 197,247 |
Other receivables | | 74,114 |
Total assets | | 2,003,582,752 |
| | |
Liabilities | | |
Payable for investments purchased | $ 30,247,562 | |
Payable for fund shares redeemed | 12,682,146 | |
Accrued management fee | 1,278,818 | |
Distribution and service plan fees payable | 54,160 | |
Other affiliated payables | 363,790 | |
Other payables and accrued expenses | 74,534 | |
Collateral on securities loaned, at value | 115,743,521 | |
Total liabilities | | 160,444,531 |
| | |
Net Assets | | $ 1,843,138,221 |
Net Assets consist of: | | |
Paid in capital | | $ 1,539,978,386 |
Accumulated net investment loss | | (848,304) |
Accumulated undistributed net realized gain (loss) on investments and foreign currency transactions | | 18,720,049 |
Net unrealized appreciation (depreciation) on investments and assets and liabilities in foreign currencies | | 285,288,090 |
Net Assets | | $ 1,843,138,221 |
See accompanying notes which are an integral part of the financial statements.
Annual Report
Statement of Assets and Liabilities - continued
| July 31, 2011 |
| | |
Calculation of Maximum Offering Price Class A:
Net Asset Value and redemption price per share ($67,272,316 ÷ 4,096,233 shares) | | $ 16.42 |
| | |
Maximum offering price per share (100/94.25 of $16.42) | | $ 17.42 |
Class T:
Net Asset Value and redemption price per share ($30,763,609 ÷ 1,890,561 shares) | | $ 16.27 |
| | |
Maximum offering price per share (100/96.50 of $16.27) | | $ 16.86 |
Class B:
Net Asset Value and offering price per share ($5,295,068 ÷ 333,961 shares)A | | $ 15.86 |
| | |
Class C:
Net Asset Value and offering price per share ($24,913,614 ÷ 1,574,146 shares)A | | $ 15.83 |
| | |
Small Cap Growth:
Net Asset Value, offering price and redemption price per share ($1,382,688,082 ÷ 83,048,741 shares) | | $ 16.65 |
| | |
Class F:
Net Asset Value, offering price and redemption price per share ($290,765,137 ÷ 17,378,109 shares) | | $ 16.73 |
| | |
Institutional Class:
Net Asset Value, offering price and redemption price per share ($41,440,395 ÷ 2,484,480 shares) | | $ 16.68 |
A Redemption price per share is equal to net asset value less any applicable contingent deferred sales charge.
See accompanying notes which are an integral part of the financial statements.
Annual Report
Financial Statements - continued
Statement of Operations
| Year ended July 31, 2011 |
| | |
Investment Income | | |
Dividends (including $351,475 earned from other affiliated issuers) | | $ 9,421,086 |
Special dividends | | 2,295,657 |
Interest | | 70 |
Income from Fidelity Central Funds (including $1,308,812 from security lending) | | 1,399,394 |
Total income | | 13,116,207 |
| | |
Expenses | | |
Management fee
Basic fee | $ 12,213,765 | |
Performance adjustment | (1,097,151) | |
Transfer agent fees | 3,857,683 | |
Distribution and service plan fees | 581,456 | |
Accounting and security lending fees | 552,489 | |
Custodian fees and expenses | 119,815 | |
Independent trustees' compensation | 9,001 | |
Registration fees | 106,385 | |
Audit | 57,065 | |
Legal | 6,456 | |
Miscellaneous | 17,324 | |
Total expenses before reductions | 16,424,288 | |
Expense reductions | (205,467) | 16,218,821 |
Net investment income (loss) | | (3,102,614) |
Realized and Unrealized Gain (Loss) Net realized gain (loss) on: | | |
Investment securities: | | |
Unaffiliated issuers | 220,513,485 | |
Other affiliated issuers | 1,387,149 | |
Foreign currency transactions | (835,104) | |
Total net realized gain (loss) | | 221,065,530 |
Change in net unrealized appreciation (depreciation) on: Investment securities | 210,248,116 | |
Assets and liabilities in foreign currencies | 5,252 | |
Total change in net unrealized appreciation (depreciation) | | 210,253,368 |
Net gain (loss) | | 431,318,898 |
Net increase (decrease) in net assets resulting from operations | | $ 428,216,284 |
See accompanying notes which are an integral part of the financial statements.
Annual Report
Statement of Changes in Net Assets
| Year ended
July 31,
2011 | Year ended
July 31,
2010 |
Increase (Decrease) in Net Assets | | |
Operations | | |
Net investment income (loss) | $ (3,102,614) | $ (4,269,128) |
Net realized gain (loss) | 221,065,530 | 242,038,859 |
Change in net unrealized appreciation (depreciation) | 210,253,368 | (34,116,702) |
Net increase (decrease) in net assets resulting
from operations | 428,216,284 | 203,653,029 |
Distributions to shareholders from net realized gain | (3,013,255) | - |
Share transactions - net increase (decrease) | (17,486,495) | 46,578,163 |
Redemption fees | 229,000 | 232,258 |
Total increase (decrease) in net assets | 407,945,534 | 250,463,450 |
| | |
Net Assets | | |
Beginning of period | 1,435,192,687 | 1,184,729,237 |
End of period (including accumulated net investment loss of $848,304 and undistributed net investment income of $0, respectively) | $ 1,843,138,221 | $ 1,435,192,687 |
See accompanying notes which are an integral part of the financial statements.
Annual Report
Financial Highlights - Class A
Years ended July 31, | 2011 | 2010 | 2009 | 2008 | 2007 |
Selected Per-Share Data | | | | | |
Net asset value, beginning of period | $ 12.66 | $ 10.79 | $ 13.20 | $ 16.06 | $ 12.88 |
Income from Investment Operations | | | | | |
Net investment income (loss) C | (.07) F | (.07) G | (.06) | (.11) | (.12) H |
Net realized and unrealized gain (loss) | 3.84 | 1.94 | (2.35) | (1.73) | 3.39 |
Total from investment operations | 3.77 | 1.87 | (2.41) | (1.84) | 3.27 |
Distributions from net realized gain | (.01) K | - | - | (1.02) | (.09) |
Redemption fees added to paid in capital C,J | - | - | - | - | - |
Net asset value, end of period | $ 16.42 | $ 12.66 | $ 10.79 | $ 13.20 | $ 16.06 |
Total Return A,B | 29.78% | 17.33% | (18.26)% | (12.26)% | 25.52% |
Ratios to Average Net Assets D,I | | | | | |
Expenses before reductions | 1.25% | 1.35% | 1.33% | 1.40% | 1.44% |
Expenses net of fee waivers, if any | 1.25% | 1.35% | 1.33% | 1.40% | 1.40% |
Expenses net of all reductions | 1.23% | 1.34% | 1.33% | 1.39% | 1.39% |
Net investment income (loss) | (.47)% F | (.56)% G | (.64)% | (.74)% | (.80)% H |
Supplemental Data | | | | | |
Net assets, end of period (000 omitted) | $ 67,272 | $ 50,620 | $ 40,211 | $ 42,187 | $ 33,588 |
Portfolio turnover rate E | 106% | 105% | 150% | 113% | 91% |
A Total returns would have been lower if certain expenses had not been reduced during the applicable periods shown.
B Total returns do not include the effect of the sales charges.
C Calculated based on average shares outstanding during the period.
D Fees and expenses of any underlying Fidelity Central Funds are not included in the Fund's expense ratio. The Fund indirectly bears its proportionate share of the expenses of any underlying Fidelity Central Funds.
E Amount does not include the portfolio activity of any underlying Fidelity Central Funds.
F Investment income per share reflects a special dividend which amounted to $.02 per share. Excluding the special dividend, the ratio of net investment income (loss) to average net assets would have been (.61)%.
G Investment income per share reflects a special dividend which amounted to $.01 per share. Excluding the special dividend, the ratio of net investment income (loss) to average net assets would have been (.67)%.
H Investment income per share reflects a special dividend which amounted to $.01 per share. Excluding the special dividend, the ratio of net investment income (loss) to average net assets would have been (.84)%.
I Expense ratios reflect operating expenses of the class. Expenses before reductions do not reflect amounts reimbursed by the investment adviser or reductions from brokerage service arrangements or reductions from other expense offset arrangements and do not represent the amount paid by the class during periods when reimbursements or reductions occur. Expenses net of fee waivers reflect expenses after reimbursement by the investment adviser but prior to reductions from brokerage service arrangements or other expense offset arrangements. Expenses net of all reductions represent the net expenses paid by the class.
J Amount represents less than $.01 per share.
K The amount shown reflects certain reclassifications related to book to tax differences.
See accompanying notes which are an integral part of the financial statements.
Annual Report
Financial Highlights - Class T
Years ended July 31, | 2011 | 2010 | 2009 | 2008 | 2007 |
Selected Per-Share Data | | | | | |
Net asset value, beginning of period | $ 12.57 | $ 10.74 | $ 13.17 | $ 16.01 | $ 12.86 |
Income from Investment Operations | | | | | |
Net investment income (loss) C | (.11) F | (.10) G | (.09) | (.15) | (.16) H |
Net realized and unrealized gain (loss) | 3.81 | 1.93 | (2.34) | (1.73) | 3.38 |
Total from investment operations | 3.70 | 1.83 | (2.43) | (1.88) | 3.22 |
Distributions from net realized gain | - | - | - | (.96) | (.07) |
Redemption fees added to paid in capital C,J | - | - | - | - | - |
Net asset value, end of period | $ 16.27 | $ 12.57 | $ 10.74 | $ 13.17 | $ 16.01 |
Total Return A,B | 29.44% | 17.04% | (18.45)% | (12.50)% | 25.18% |
Ratios to Average Net Assets D,I | | | | | |
Expenses before reductions | 1.50% | 1.61% | 1.60% | 1.65% | 1.67% |
Expenses net of fee waivers, if any | 1.50% | 1.61% | 1.60% | 1.65% | 1.65% |
Expenses net of all reductions | 1.49% | 1.60% | 1.59% | 1.65% | 1.65% |
Net investment income (loss) | (.73)% F | (.82)% G | (.91)% | (.99)% | (1.05)% H |
Supplemental Data | | | | | |
Net assets, end of period (000 omitted) | $ 30,764 | $ 23,930 | $ 21,533 | $ 21,754 | $ 26,419 |
Portfolio turnover rate E | 106% | 105% | 150% | 113% | 91% |
A Total returns would have been lower if certain expenses had not been reduced during the applicable periods shown.
B Total returns do not include the effect of the sales charges.
C Calculated based on average shares outstanding during the period.
D Fees and expenses of any underlying Fidelity Central Funds are not included in the Fund's expense ratio. The Fund indirectly bears its proportionate share of the expenses of any underlying Fidelity Central Funds.
E Amount does not include the portfolio activity of any underlying Fidelity Central Funds.
F Investment income per share reflects a special dividend which amounted to $.02 per share. Excluding the special dividend, the ratio of net investment income (loss) to average net assets would have been (.86)%.
G Investment income per share reflects a special dividend which amounted to $.01 per share. Excluding the special dividend, the ratio of net investment income (loss) to average net assets would have been (.93)%.
H Investment income per share reflects a special dividend which amounted to $.01 per share. Excluding the special dividend, the ratio of net investment income (loss) to average net assets would have been (1.09)%.
I Expense ratios reflect operating expenses of the class. Expenses before reductions do not reflect amounts reimbursed by the investment adviser or reductions from brokerage service arrangements or reductions from other expense offset arrangements and do not represent the amount paid by the class during periods when reimbursements or reductions occur. Expenses net of fee waivers reflect expenses after reimbursement by the investment adviser but prior to reductions from brokerage service arrangements or other expense offset arrangements. Expenses net of all reductions represent the net expenses paid by the class.
J Amount represents less than $.01 per share.
See accompanying notes which are an integral part of the financial statements.
Annual Report
Financial Highlights - Class B
Years ended July 31, | 2011 | 2010 | 2009 | 2008 | 2007 |
Selected Per-Share Data | | | | | |
Net asset value, beginning of period | $ 12.30 | $ 10.57 | $ 13.03 | $ 15.85 | $ 12.78 |
Income from Investment Operations | | | | | |
Net investment income (loss) C | (.18) F | (.16) G | (.13) | (.22) | (.23) H |
Net realized and unrealized gain (loss) | 3.74 | 1.89 | (2.33) | (1.71) | 3.36 |
Total from investment operations | 3.56 | 1.73 | (2.46) | (1.93) | 3.13 |
Distributions from net realized gain | - | - | - | (.89) | (.06) |
Redemption fees added to paid in capital C,J | - | - | - | - | - |
Net asset value, end of period | $ 15.86 | $ 12.30 | $ 10.57 | $ 13.03 | $ 15.85 |
Total Return A,B | 28.94% | 16.37% | (18.88)% | (12.92)% | 24.57% |
Ratios to Average Net Assets D,I | | | | | |
Expenses before reductions | 2.00% | 2.11% | 2.08% | 2.15% | 2.20% |
Expenses net of fee waivers, if any | 2.00% | 2.11% | 2.08% | 2.15% | 2.15% |
Expenses net of all reductions | 1.98% | 2.09% | 2.08% | 2.15% | 2.15% |
Net investment income (loss) | (1.22)% F | (1.32)% G | (1.39)% | (1.49)% | (1.55)% H |
Supplemental Data | | | | | |
Net assets, end of period (000 omitted) | $ 5,295 | $ 5,142 | $ 4,171 | $ 5,517 | $ 6,242 |
Portfolio turnover rate E | 106% | 105% | 150% | 113% | 91% |
A Total returns would have been lower if certain expenses had not been reduced during the applicable periods shown.
B Total returns do not include the effect of the contingent deferred sales charge.
C Calculated based on average shares outstanding during the period.
D Fees and expenses of any underlying Fidelity Central Funds are not included in the Fund's expense ratio. The Fund indirectly bears its proportionate share of the expenses of any underlying Fidelity Central Funds.
E Amount does not include the portfolio activity of any underlying Fidelity Central Funds.
F Investment income per share reflects a special dividend which amounted to $.02 per share. Excluding the special dividend, the ratio of net investment income (loss) to average net assets would have been (1.36)%.
G Investment income per share reflects a special dividend which amounted to $.01 per share. Excluding the special dividend, the ratio of net investment income (loss) to average net assets would have been (1.42)%.
H Investment income per share reflects a special dividend which amounted to $.01 per share. Excluding the special dividend, the ratio of net investment income (loss) to average net assets would have been (1.59)%.
I Expense ratios reflect operating expenses of the class. Expenses before reductions do not reflect amounts reimbursed by the investment adviser or reductions from brokerage service arrangements or reductions from other expense offset arrangements and do not represent the amount paid by the class during periods when reimbursements or reductions occur. Expenses net of fee waivers reflect expenses after reimbursement by the investment adviser but prior to reductions from brokerage service arrangements or other expense offset arrangements. Expenses net of all reductions represent the net expenses paid by the class.
J Amount represents less than $.01 per share.
See accompanying notes which are an integral part of the financial statements.
Annual Report
Financial Highlights - Class C
Years ended July 31, | 2011 | 2010 | 2009 | 2008 | 2007 |
Selected Per-Share Data | | | | | |
Net asset value, beginning of period | $ 12.28 | $ 10.55 | $ 13.00 | $ 15.84 | $ 12.77 |
Income from Investment Operations | | | | | |
Net investment income (loss) C | (.18) F | (.16) G | (.13) | (.22) | (.23) H |
Net realized and unrealized gain (loss) | 3.73 | 1.89 | (2.32) | (1.71) | 3.36 |
Total from investment operations | 3.55 | 1.73 | (2.45) | (1.93) | 3.13 |
Distributions from net realized gain | - | - | - | (.91) | (.06) |
Redemption fees added to paid in capital C,J | - | - | - | - | - |
Net asset value, end of period | $ 15.83 | $ 12.28 | $ 10.55 | $ 13.00 | $ 15.84 |
Total Return A,B | 28.91% | 16.40% | (18.85)% | (12.94)% | 24.59% |
Ratios to Average Net Assets D,I | | | | | |
Expenses before reductions | 2.00% | 2.11% | 2.08% | 2.15% | 2.20% |
Expenses net of fee waivers, if any | 2.00% | 2.11% | 2.08% | 2.15% | 2.15% |
Expenses net of all reductions | 1.98% | 2.09% | 2.07% | 2.14% | 2.14% |
Net investment income (loss) | (1.22)% F | (1.32)% G | (1.39)% | (1.49)% | (1.55)% H |
Supplemental Data | | | | | |
Net assets, end of period (000 omitted) | $ 24,914 | $ 18,091 | $ 14,267 | $ 15,946 | $ 22,348 |
Portfolio turnover rate E | 106% | 105% | 150% | 113% | 91% |
A Total returns would have been lower if certain expenses had not been reduced during the applicable periods shown.
B Total returns do not include the effect of the contingent deferred sales charge.
C Calculated based on average shares outstanding during the period.
D Fees and expenses of any underlying Fidelity Central Funds are not included in the Fund's expense ratio. The Fund indirectly bears its proportionate share of the expenses of any underlying Fidelity Central Funds.
E Amount does not include the portfolio activity of any underlying Fidelity Central Funds.
F Investment income per share reflects a special dividend which amounted to $.02 per share. Excluding the special dividend, the ratio of net investment income (loss) to average net assets would have been (1.36)%.
G Investment income per share reflects a special dividend which amounted to $.01 per share. Excluding the special dividend, the ratio of net investment income (loss) to average net assets would have been (1.42)%.
H Investment income per share reflects a special dividend which amounted to $.01 per share. Excluding the special dividend, the ratio of net investment income (loss) to average net assets would have been (1.59)%.
I Expense ratios reflect operating expenses of the class. Expenses before reductions do not reflect amounts reimbursed by the investment adviser or reductions from brokerage service arrangements or reductions from other expense offset arrangements and do not represent the amount paid by the class during periods when reimbursements or reductions occur. Expenses net of fee waivers reflect expenses after reimbursement by the investment adviser but prior to reductions from brokerage service arrangements or other expense offset arrangements. Expenses net of all reductions represent the net expenses paid by the class.
J Amount represents less than $.01 per share.
See accompanying notes which are an integral part of the financial statements.
Annual Report
Financial Highlights - Small Cap Growth
Years ended July 31, | 2011 | 2010 | 2009 | 2008 | 2007 |
Selected Per-Share Data | | | | | |
Net asset value, beginning of period | $ 12.81 | $ 10.89 | $ 13.29 | $ 16.15 | $ 12.93 |
Income from Investment Operations | | | | | |
Net investment income (loss) B | (.03) E | (.04) F | (.04) | (.07) | (.08) G |
Net realized and unrealized gain (loss) | 3.90 | 1.96 | (2.36) | (1.74) | 3.40 |
Total from investment operations | 3.87 | 1.92 | (2.40) | (1.81) | 3.32 |
Distributions from net realized gain | (.03) J | - | - | (1.05) | (.10) |
Redemption fees added to paid in capital B,I | - | - | - | - | - |
Net asset value, end of period | $ 16.65 | $ 12.81 | $ 10.89 | $ 13.29 | $ 16.15 |
Total Return A | 30.20% | 17.63% | (18.06)% | (11.98)% | 25.84% |
Ratios to Average Net Assets C,H | | | | |
Expenses before reductions | .95% | 1.08% | 1.08% | 1.11% | 1.10% |
Expenses net of fee waivers, if any | .95% | 1.08% | 1.08% | 1.11% | 1.10% |
Expenses net of all reductions | .93% | 1.07% | 1.08% | 1.10% | 1.09% |
Net investment income (loss) | (.17)% E | (.29)% F | (.39)% | (.45)% | (.50)% G |
Supplemental Data | | | | | |
Net assets, end of period (000 omitted) | $ 1,382,688 | $ 1,204,818 | $ 1,085,184 | $ 1,217,520 | $ 1,149,809 |
Portfolio turnover rate D | 106% | 105% | 150% | 113% | 91% |
A Total returns would have been lower if certain expenses had not been reduced during the applicable periods shown.
B Calculated based on average shares outstanding during the period.
C Fees and expenses of any underlying Fidelity Central Funds are not included in the Fund's expense ratio. The Fund indirectly bears its proportionate share of the expenses of any underlying Fidelity Central Funds.
D Amount does not include the portfolio activity of any underlying Fidelity Central Funds.
E Investment income per share reflects a special dividend which amounted to $.02 per share. Excluding the special dividend, the ratio of net investment income (loss) to average net assets would have been (.31)%.
F Investment income per share reflects a special dividend which amounted to $.01 per share. Excluding the special dividend, the ratio of net investment income (loss) to average net assets would have been (.39)%.
G Investment income per share reflects a special dividend which amounted to $.01 per share. Excluding the special dividend, the ratio of net investment income (loss) to average net assets would have been (.54)%.
H Expense ratios reflect operating expenses of the class. Expenses before reductions do not reflect amounts reimbursed by the investment adviser or reductions from brokerage service arrangements or reductions from other expense offset arrangements and do not represent the amount paid by the class during periods when reimbursements or reductions occur. Expenses net of fee waivers reflect expenses after reimbursement by the investment adviser but prior to reductions from brokerage service arrangements or other expense offset arrangements. Expenses net of all reductions represent the net expenses paid by the class.
I Amount represents less than $.01 per share.
J The amount shown reflects certain reclassifications related to book to tax differences.
See accompanying notes which are an integral part of the financial statements.
Annual Report
Financial Highlights - Class F
Years ended July 31, | 2011 | 2010 | 2009 J |
Selected Per-Share Data | | | |
Net asset value, beginning of period | $ 12.85 | $ 10.90 | $ 10.03 |
Income from Investment Operations | | | |
Net investment income (loss) D | .01 H | - I,L | (.01) |
Net realized and unrealized gain (loss) | 3.91 | 1.95 | .88 |
Total from investment operations | 3.92 | 1.95 | .87 |
Distributions from net realized gain | (.04) M | - | - |
Redemption fees added to paid in capital D,L | - | - | - |
Net asset value, end of period | $ 16.73 | $ 12.85 | $ 10.90 |
Total Return B,C | 30.56% | 17.89% | 8.67% |
Ratios to Average Net Assets E,K | | | |
Expenses before reductions | .70% | .78% | .74% A |
Expenses net of fee waivers, if any | .70% | .78% | .74% A |
Expenses net of all reductions | .68% | .77% | .73% A |
Net investment income (loss) | .08% H | -% G,I | (.54)% A |
Supplemental Data | | | |
Net assets, end of period (000 omitted) | $ 290,765 | $ 106,941 | $ 159 |
Portfolio turnover rate F | 106% | 105% | 150% |
A Annualized
B Total returns for periods of less than one year are not annualized.
C Total returns would have been lower if certain expenses had not been reduced during the applicable periods shown.
D Calculated based on average shares outstanding during the period.
E Fees and expenses of any underlying Fidelity Central Funds are not included in the Fund's expense ratio. The Fund indirectly bears its proportionate share of the expenses of any underlying Fidelity Central Funds.
F Amount does not include the portfolio activity of any underlying Fidelity Central Funds.
G Amount represents less than .01%.
H Investment income per share reflects a special dividend which amounted to $.02 per share. Excluding the special dividend, the ratio of net investment income (loss) to average net assets would have been (.06)%.
I Investment income per share reflects a special dividend which amounted to $.01 per share. Excluding the special dividend, the ratio of net investment income (loss) to average net assets would have been (.10)%.
J For the period June 26, 2009 (commencement of sale of shares) to July 31, 2009.
K Expense ratios reflect operating expenses of the class. Expenses before reductions do not reflect amounts reimbursed by the investment adviser or reductions from brokerage service arrangements or reductions from other expense offset arrangements and do not represent the amount paid by the class during periods when reimbursements or reductions occur. Expense ratios before reductions for start-up periods may not be representative of longer-term operating periods. Expenses net of fee waivers reflect expenses after reimbursement by the investment adviser but prior to reductions from brokerage service arrangements or other expense offset arrangements. Expenses net of all reductions represent the net expenses paid by the class.
L Amount represents less than $.01 per share.
M The amount shown reflects certain reclassifications related to book to tax differences.
See accompanying notes which are an integral part of the financial statements.
Annual Report
Financial Highlights - Institutional Class
Years ended July 31, | 2011 | 2010 | 2009 | 2008 | 2007 |
Selected Per-Share Data | | | | | |
Net asset value, beginning of period | $ 12.83 | $ 10.91 | $ 13.30 | $ 16.15 | $ 12.92 |
Income from Investment Operations | | | | | |
Net investment income (loss) B | (.03) E | (.03) F | (.03) | (.06) | (.07) G |
Net realized and unrealized gain (loss) | 3.91 | 1.95 | (2.36) | (1.74) | 3.41 |
Total from investment operations | 3.88 | 1.92 | (2.39) | (1.80) | 3.34 |
Distributions from net realized gain | (.03) J | - | - | (1.05) | (.11) |
Redemption fees added to paid in capital B,I | - | - | - | - | - |
Net asset value, end of period | $ 16.68 | $ 12.83 | $ 10.91 | $ 13.30 | $ 16.15 |
Total Return A | 30.24% | 17.60% | (17.97)% | (11.93)% | 25.99% |
Ratios to Average Net Assets C,H | | | | |
Expenses before reductions | .94% | 1.03% | 1.05% | 1.04% | 1.05% |
Expenses net of fee waivers, if any | .94% | 1.03% | 1.05% | 1.04% | 1.05% |
Expenses net of all reductions | .93% | 1.02% | 1.04% | 1.03% | 1.05% |
Net investment income (loss) | (.17)% E | (.24)% F | (.36)% | (.38)% | (.46)% G |
Supplemental Data | | | | | |
Net assets, end of period (000 omitted) | $ 41,440 | $ 25,650 | $ 19,204 | $ 22,444 | $ 18,671 |
Portfolio turnover rate D | 106% | 105% | 150% | 113% | 91% |
A Total returns would have been lower if certain expenses had not been reduced during the applicable periods shown.
B Calculated based on average shares outstanding during the period.
C Fees and expenses of any underlying Fidelity Central Funds are not included in the Fund's expense ratio. The Fund indirectly bears its proportionate share of the expenses of any underlying Fidelity Central Funds.
D Amount does not include the portfolio activity of any underlying Fidelity Central Funds.
E Investment income per share reflects a special dividend which amounted to $.02 per share. Excluding the special dividend, the ratio of net investment income (loss) to average net assets would have been (.30)%.
F Investment income per share reflects a special dividend which amounted to $.01 per share. Excluding the special dividend, the ratio of net investment income (loss) to average net assets would have been (.34)%.
G Investment income per share reflects a special dividend which amounted to $.01 per share. Excluding the special dividend, the ratio of net investment income (loss) to average net assets would have been (.50)%.
H Expense ratios reflect operating expenses of the class. Expenses before reductions do not reflect amounts reimbursed by the investment adviser or reductions from brokerage service arrangements or reductions from other expense offset arrangements and do not represent the amount paid by the class during periods when reimbursements or reductions occur. Expenses net of fee waivers reflect expenses after reimbursement by the investment adviser but prior to reductions from brokerage service arrangements or other expense offset arrangements. Expenses net of all reductions represent the net expenses paid by the class.
I Amount represents less than $.01 per share.
J The amount shown reflects certain reclassifications related to book to tax differences.
See accompanying notes which are an integral part of the financial statements.
Annual Report
Notes to Financial Statements
For the period ended July 31, 2011
1. Organization.
Fidelity Small Cap Growth Fund (the Fund) is a fund of Fidelity Securities Fund (the Trust) and is authorized to issue an unlimited number of shares. The Trust is registered under the Investment Company Act of 1940, as amended (the 1940 Act), as an open-end management investment company organized as a Massachusetts business trust. The Fund offers Class A, Class T, Class C, Small Cap Growth, Class F, and Institutional Class shares, each of which, along with Class B shares, has equal rights as to assets and voting privileges. Effective after the close of business on September 1, 2010, Class B shares were closed to new accounts and additional purchases, except for exchanges and reinvestments, by existing shareholders. Each class has exclusive voting rights with respect to matters that affect that class. Class F shares of the Fund are only available for purchase by mutual funds for which Fidelity Management & Research Company (FMR) or an affiliate serves as investment manager. Class B shares will automatically convert to Class A shares after a holding period of seven years from the initial date of purchase. Investment income, realized and unrealized capital gains and losses, the common expenses of the Fund, and certain fund-level expense reductions, if any, are allocated on a pro-rata basis to each class based on the relative net assets of each class to the total net assets of the Fund. Each class differs with respect to transfer agent and distribution and service plan fees incurred. Certain expense reductions may also differ by class.
2. Investments in Fidelity Central Funds.
The Fund invests in Fidelity Central Funds, which are open-end investment companies available only to other investment companies and accounts managed by FMR and its affiliates. The Fund's Schedule of Investments lists each of the Fidelity Central Funds held as of period end, if any, as an investment of the Fund, but does not include the underlying holdings of each Fidelity Central Fund. As an Investing Fund, the Fund indirectly bears its proportionate share of the expenses of the underlying Fidelity Central Funds.
The Money Market Central Funds seek preservation of capital and current income and are managed by Fidelity Investments Money Management, Inc. (FIMM), an affiliate of FMR.
A complete unaudited list of holdings for each Fidelity Central Fund is available upon request or at the Securities and Exchange Commission (the SEC) web site at www.sec.gov. In addition, the financial statements of the Fidelity Central Funds, which are not covered by the Fund's Report of Independent Registered Public Accounting Firm, are available on the SEC web site or upon request.
Annual Report
Notes to Financial Statements - continued
3. Significant Accounting Policies.
The financial statements have been prepared in conformity with accounting principles generally accepted in the United States of America (GAAP), which require management to make certain estimates and assumptions at the date of the financial statements. Actual results could differ from those estimates. Subsequent events, if any, through the date that the financial statements were issued have been evaluated in the preparation of the financial statements. The following summarizes the significant accounting policies of the Fund:
Security Valuation. Investments are valued as of 4:00 p.m. Eastern time on the last calendar day of the period. The Fund uses independent pricing services approved by the Board of Trustees to value its investments. When current market prices or quotations are not readily available or reliable, valuations may be determined in good faith in accordance with procedures adopted by the Board of Trustees. Factors used in determining value may include market or security specific events. The frequency with which these procedures are used cannot be predicted and they may be utilized to a significant extent. The value used for net asset value (NAV) calculation under these procedures may differ from published prices for the same securities.
The Fund categorizes the inputs to valuation techniques used to value its investments into a disclosure hierarchy consisting of three levels as shown below:
Level 1 - quoted prices in active markets for identical investments
Level 2 - other significant observable inputs (including quoted prices for similar investments, interest rates, prepayment speeds, etc.)
Level 3 - unobservable inputs (including the Fund's own assumptions based on the best information available)
Changes in valuation techniques may result in transfers in or out of an assigned level within the disclosure hierarchy. Valuation techniques used to value the Fund's investments by major category are as follows:
Equity securities, including restricted securities, for which market quotations are readily available, are valued at the last reported sale price or official closing price as reported by an independent pricing service on the primary market or exchange on which they are traded and are categorized as Level 1 in the hierarchy. In the event there were no sales during the day or closing prices are not available, securities are valued at the last quoted bid price or may be valued using the last available price and are generally categorized as Level 2 in the hierarchy. For foreign equity securities, when significant market or security specific events arise, comparisons to the valuation of American Depositary Receipts (ADRs), futures contracts, Exchange-traded funds (ETFs) and certain indexes as well as
Annual Report
3. Significant Accounting Policies - continued
Security Valuation - continued
quoted prices for similar securities are used and are categorized as Level 2 in the hierarchy in these circumstances. Utilizing these techniques may result in transfers between Level 1 and Level 2. For restricted equity securities and private placements where observable inputs are limited, assumptions about market activity and risk are used and are categorized as Level 3 in the hierarchy.
Investments in open-end mutual funds, including the Fidelity Central Funds, are valued at their closing net asset value each business day and are categorized as Level 1 in the hierarchy.
Foreign Currency. The Fund may use foreign currency contracts to facilitate transactions in foreign-denominated securities. Gains and losses from these transactions may arise from changes in the value of the foreign currency or if the counterparties do not perform under the contracts' terms.
Foreign-denominated assets, including investment securities, and liabilities are translated into U.S. dollars at the exchange rate at period end. Purchases and sales of investment securities, income and dividends received and expenses denominated in foreign currencies are translated into U.S. dollars at the exchange rate in effect on the transaction date.
The effects of exchange rate fluctuations on investments are included with the net realized and unrealized gain (loss) on investment securities. Other foreign currency transactions resulting in realized and unrealized gain (loss) are disclosed separately.
Investment Transactions and Income. For financial reporting purposes, the Fund's investment holdings and NAV include trades executed through the end of the last business day of the period. The NAV per share for processing shareholder transactions is calculated as of the close of business of the New York Stock Exchange (NYSE), normally 4:00 p.m. Eastern time and includes trades executed through the end of the prior business day. Gains and losses on securities sold are determined on the basis of identified cost and may include proceeds received from litigation. Dividend income is recorded on the ex-dividend date, except for certain dividends from foreign securities where the ex-dividend date may have passed, which are recorded as soon as the Fund is informed of the ex-dividend date. Non-cash dividends included in dividend income, if any, are recorded at the fair market value of the securities received. Distributions received on securities that represent a return of capital or capital gain are recorded as a reduction of cost of investments and/or as a realized gain. The Fund estimates the components of distributions received that may be considered return of capital distributions or capital
Annual Report
Notes to Financial Statements - continued
3. Significant Accounting Policies - continued
Investment Transactions and Income - continued
gain distributions. Large, non-recurring dividends recognized by the Fund are presented separately on the Statement of Operations as "Special Dividends" and the impact of these dividends is presented in the Financial Highlights. Interest income and distributions from the Fidelity Central Funds are accrued as earned. Interest income includes coupon interest and amortization of premium and accretion of discount on debt securities. Investment income is recorded net of foreign taxes withheld where recovery of such taxes is uncertain.
Expenses. Expenses directly attributable to a fund are charged to that fund. Expenses attributable to more than one fund are allocated among the respective funds on the basis of relative net assets or other appropriate methods. Expense estimates are accrued in the period to which they relate and adjustments are made when actual amounts are known.
Income Tax Information and Distributions to Shareholders. Each year, the Fund intends to qualify as a regulated investment company, including distributing substantially all of its taxable income and realized gains under Subchapter M of the Internal Revenue Code and filing its U.S. federal tax return. As a result, no provision for income taxes is required. As of July 31, 2011, the Fund did not have any unrecognized tax benefits in the financial statements. A fund's federal tax return is subject to examination by the Internal Revenue Service (IRS) for a period of three years. Foreign taxes are provided for based on the Fund's understanding of the tax rules and rates that exist in the foreign markets in which it invests.
Distributions are declared and recorded on the ex-dividend date. Income dividends and capital gain distributions are declared separately for each class. Income and capital gain distributions are determined in accordance with income tax regulations, which may differ from GAAP. These differences resulted in distribution reclasses.
Capital accounts within the financial statements are adjusted for permanent book-tax differences. These adjustments have no impact on net assets or the results of operations. Temporary book-tax differences will reverse in a subsequent period.
Book-tax differences are primarily due to foreign currency transactions, net operating losses, capital loss carryforwards, and losses deferred due to wash sales and excise tax regulations.
Annual Report
3. Significant Accounting Policies - continued
Income Tax Information and Distributions to Shareholders - continued
The federal tax cost of investment securities and unrealized appreciation (depreciation) as of period end were as follows:
Gross unrealized appreciation | $ 354,172,386 |
Gross unrealized depreciation | (75,667,186) |
Net unrealized appreciation (depreciation) on securities and other investments | $ 278,505,200 |
| |
Tax Cost | $ 1,701,681,091 |
The tax-based components of distributable earnings as of period end were as follows:
Undistributed long-term capital gain | $ 25,499,273 |
Net unrealized appreciation (depreciation) | $ 278,508,866 |
Under the recently enacted Regulated Investment Company Modernization Act of 2010 (the Act), the Fund will be permitted to carry forward capital losses incurred in taxable years beginning after December 22, 2010 for an unlimited period. However, any losses incurred during those future taxable years will be required to be utilized prior to any losses incurred in pre-enactment taxable years, which generally expire after eight years from when they are incurred. Additionally, post-enactment capital losses that are carried forward will retain their character as either short-term or long-term capital losses rather than being considered all short-term as under previous law. The Fund's first fiscal year end subject to the Act will be July 31, 2012.
The tax character of distributions paid was as follows:
| July 31, 2011 | July 31, 2010 |
Long-term Capital Gains | $ 3,013,255 | $ - |
Short-Term Trading (Redemption) Fees. Shares held by investors in the Fund less than 90 days are subject to a redemption fee equal to 1.50% of the net asset value of shares redeemed. All redemption fees, which reduce the proceeds of the shareholder redemption, are retained by the Fund and accounted for as an addition to paid in capital.
New Accounting Pronouncement. In May 2011, the Financial Accounting Standards Board issued Accounting Standard Update No. 2011-04, Fair Value Measurement (Topic 820) - Amendments to Achieve Common Fair Value Measurement and Disclosure Requirements in U.S. GAAP and IFRSs. The update changes the wording used to describe the requirements in GAAP for measuring fair value and for disclosing information about fair value measurements. The update is effective during interim and annual periods beginning after December 15, 2011. Management is currently evaluating the impact of the update's adoption on the Fund's financial statement disclosures.
Annual Report
Notes to Financial Statements - continued
4. Purchases and Sales of Investments.
Purchases and sales of securities, other than short-term securities, aggregated $1,788,943,155 and $1,761,314,998, respectively.
5. Fees and Other Transactions with Affiliates.
Management Fee. FMR and its affiliates provide the Fund with investment management related services for which the Fund pays a monthly management fee. The management fee is the sum of an individual fund fee rate that is based on an annual rate of .45% of the Fund's average net assets and a group fee rate that averaged .26% during the period. The group fee rate is based upon the average net assets of all the mutual funds advised by FMR. The group fee rate decreases as assets under management increase and increases as assets under management decrease. In addition, the management fee is subject to a performance adjustment (up to a maximum of ± .20% of the Fund's average net assets over a 36 month performance period). The upward or downward adjustment to the management fee is based on the relative investment performance of Small Cap Growth, as compared to an appropriate benchmark index. For the period, the total annual management fee rate, including the performance adjustment, was .64% of the Fund's average net assets.
Distribution and Service Plan Fees. In accordance with Rule 12b-1 of the 1940 Act, the Fund has adopted separate Distribution and Service Plans for each class of shares. Certain classes pay Fidelity Distributors Corporation (FDC), an affiliate of FMR, separate Distribution and Service Fees, each of which is based on an annual percentage of each class' average net assets. In addition, FDC may pay financial intermediaries for selling shares of the Fund and providing shareholder support services. For the period, the Distribution and Service Fee rates, total fees and amounts retained by FDC were as follows:
| Distribution
Fee | Service
Fee | Total
Fees | Retained
by FDC |
Class A | -% | .25% | $ 156,403 | $ 4,810 |
Class T | .25% | .25% | 145,496 | - |
Class B | .75% | .25% | 55,389 | 41,618 |
Class C | .75% | .25% | 224,168 | 46,361 |
| | | $ 581,456 | $ 92,789 |
Sales Load. FDC may receive a front-end sales charge of up to 5.75% for selling Class A shares, and 3.50% for selling Class T shares, some of which is paid to financial intermediaries for selling shares of the Fund. Depending on the holding period, FDC may receive contingent deferred sales charges levied on Class A, Class T, Class B, and Class C redemptions. The deferred sales charges range from 5% to 1% for Class B, 1% for Class C, 1.00% for certain purchases of Class A shares and .25% for certain purchases of Class T shares.
Annual Report
5. Fees and Other Transactions with Affiliates - continued
Sales Load - continued
For the period, sales charge amounts retained by FDC were as follows:
| Retained
by FDC |
Class A | $ 29,915 |
Class T | 6,692 |
Class B* | 11,257 |
Class C* | 2,120 |
| $ 49,984 |
* When Class B and Class C shares are initially sold, FDC pays commissions from its own resources to financial intermediaries through which the sales are made.
Transfer Agent Fees. Fidelity Investments Institutional Operations Company, Inc. (FIIOC), an affiliate of FMR, is the transfer, dividend disbursing and shareholder servicing agent for each class of the Fund. FIIOC receives account fees and asset-based fees that vary according to the account size and type of account of the shareholders of the respective classes of the Fund. FIIOC receives no fees for providing transfer agency services to Class F. FIIOC pays for typesetting, printing and mailing of shareholder reports, except proxy statements. For the period, transfer agent fees for each class were as follows:
| Amount | % of
Average
Net Assets |
Class A | $ 187,257 | .30 |
Class T | 88,193 | .30 |
Class B | 16,587 | .30 |
Class C | 67,033 | .30 |
Small Cap Growth | 3,412,823 | .25 |
Institutional Class | 85,790 | .24 |
| $ 3,857,683 | |
Accounting and Security Lending Fees. Fidelity Service Company, Inc. (FSC), an affiliate of FMR, maintains the Fund's accounting records. The accounting fee is based on the level of average net assets for the month. Under a separate contract, FSC administers the security lending program. The security lending fee is based on the number and duration of lending transactions.
Brokerage Commissions. The Fund placed a portion of its portfolio transactions with brokerage firms which are affiliates of the investment adviser. The commissions paid to these affiliated firms were $71,765 for the period.
Annual Report
Notes to Financial Statements - continued
6. Committed Line of Credit.
The Fund participates with other funds managed by FMR or an affiliate in a $4.0 billion credit facility (the "line of credit") to be utilized for temporary or emergency purposes to fund shareholder redemptions or for other short-term liquidity purposes. The Fund has agreed to pay commitment fees on its pro-rata portion of the line of credit, which amounted to $5,614 and is reflected in Miscellaneous expenses on the Statement of Operations. During the period, there were no borrowings on this line of credit.
7. Security Lending.
The Fund lends portfolio securities through a lending agent from time to time in order to earn additional income. The lending agent may loan securities to certain qualified borrowers, including Fidelity Capital Markets (FCM), a broker-dealer affiliated with the Fund. On the settlement date of the loan, the Fund receives collateral (in the form of U.S. Treasury obligations, letters of credit and/or cash) against the loaned securities and maintains collateral in an amount not less than 100% of the market value of the loaned securities during the period of the loan. The market value of the loaned securities is determined at the close of business of the Fund and any additional required collateral is delivered to the Fund on the next business day. If the borrower defaults on its obligation to return the securities loaned because of insolvency or other reasons, a fund could experience delays and costs in recovering the securities loaned or in gaining access to the collateral. Any cash collateral received is invested in the Fidelity Securities Lending Cash Central Fund. The value of loaned securities and cash collateral at period end are disclosed on the Fund's Statement of Assets and Liabilities. The value of securities loaned to FCM at period end was $2,457,312. Security lending income represents the income earned on investing cash collateral, less rebates paid to borrowers and lending agent fees associated with the loan, plus any premium payments received for lending certain types of securities. Security lending income is presented in the Statement of Operations as a component of income from Fidelity Central Funds, and includes $19,296 from securities loaned to FCM.
8. Expense Reductions.
Many of the brokers with whom FMR places trades on behalf of the Fund provided services to the Fund in addition to trade execution. These services included payments of certain expenses on behalf of the Fund totaling $205,159 for the period. In addition, through arrangements with the Fund's custodian, credits realized as a result of uninvested cash balances were used to reduce the Fund's expenses. During the period, these credits reduced the Fund's custody expenses by $308.
Annual Report
9. Distributions to Shareholders.
Distributions to shareholders of each class were as follows:
Years ended July 31, | 2011 | 2010 |
From net realized gain | | |
Class A | $ 40,130 | $ - |
Small Cap Growth | 2,420,020 | - |
Class F | 492,928 | - |
Institutional Class | 60,177 | - |
Total | $ 3,013,255 | $ - |
10. Share Transactions.
Transactions for each class of shares were as follows:
| Shares | Dollars |
Years ended July 31, | 2011 | 2010 | 2011 | 2010 |
Class A | | | | |
Shares sold | 1,459,436 | 1,755,238 | $ 22,640,692 | $ 21,749,463 |
Reinvestment of distributions | 2,323 | - | 36,172 | - |
Shares redeemed | (1,364,690) | (1,481,231) | (20,977,078) | (17,861,442) |
Net increase (decrease) | 97,069 | 274,007 | $ 1,699,786 | $ 3,888,021 |
Class T | | | | |
Shares sold | 420,613 | 492,575 | $ 6,491,294 | $ 6,056,365 |
Shares redeemed | (434,512) | (592,408) | (6,714,256) | (7,232,100) |
Net increase (decrease) | (13,899) | (99,833) | $ (222,962) | $ (1,175,735) |
Class B | | | | |
Shares sold | 25,204 | 117,304 | $ 366,276 | $ 1,414,923 |
Shares redeemed | (109,118) | (93,928) | (1,597,390) | (1,126,513) |
Net increase (decrease) | (83,914) | 23,376 | $ (1,231,114) | $ 288,410 |
Class C | | | | |
Shares sold | 469,568 | 479,633 | $ 7,154,653 | $ 5,791,649 |
Shares redeemed | (368,398) | (358,550) | (5,494,248) | (4,319,904) |
Net increase (decrease) | 101,170 | 121,083 | $ 1,660,405 | $ 1,471,745 |
Small Cap Growth | | | | |
Shares sold | 19,971,507 | 22,893,960 | $ 315,167,556 | $ 285,679,819 |
Reinvestment of distributions | 153,921 | - | 2,384,001 | - |
Shares redeemed | (31,144,660) | (28,450,958) | (483,710,319) | (351,525,118) |
Net increase (decrease) | (11,019,232) | (5,556,998) | $ (166,158,762) | $ (65,845,299) |
Annual Report
Notes to Financial Statements - continued
10. Share Transactions - continued
| Shares | Dollars |
Years ended July 31, | 2011 | 2010 | 2011 | 2010 |
Class F | | | | |
Shares sold | 11,382,202 | 8,663,528 | $ 176,012,143 | $ 109,176,128 |
Reinvestment of distributions | 31,816 | - | 492,928 | - |
Shares redeemed | (2,356,621) | (357,394) | (37,493,486) | (4,690,130) |
Net increase (decrease) | 9,057,397 | 8,306,134 | $ 139,011,585 | $ 104,485,998 |
Institutional Class | | | | |
Shares sold | 1,038,111 | 1,109,901 | $ 16,415,657 | $ 14,013,757 |
Reinvestment of distributions | 2,532 | - | 39,301 | - |
Shares redeemed | (555,221) | (871,545) | (8,700,391) | (10,548,734) |
Net increase (decrease) | 485,422 | 238,356 | $ 7,754,567 | $ 3,465,023 |
11. Other.
The Fund's organizational documents provide former and current trustees and officers with a limited indemnification against liabilities arising in connection with the performance of their duties to the Fund. In the normal course of business, the Fund may also enter into contracts that provide general indemnifications. The Fund's maximum exposure under these arrangements is unknown as this would be dependent on future claims that may be made against the Fund. The risk of material loss from such claims is considered remote.
The Fidelity Freedom Funds were the owners of record, in the aggregate, of approximately 37% of the total outstanding shares of the Fund.
Annual Report
To the Trustees of Fidelity Securities Fund and the Shareholders of Fidelity Small Cap Growth Fund:
In our opinion, the accompanying statement of assets and liabilities, including the schedule of investments, and the related statements of operations and of changes in net assets and the financial highlights present fairly, in all material respects, the financial position of Fidelity Small Cap Growth Fund (a fund of Fidelity Securities Fund) at July 31, 2011, the results of its operations for the year then ended, the changes in its net assets for each of the two years in the period then ended and the financial highlights for each of the periods indicated, in conformity with accounting principles generally accepted in the United States of America. These financial statements and financial highlights (hereafter referred to as "financial statements") are the responsibility of the Fidelity Small Cap Growth Fund's management. Our responsibility is to express an opinion on these financial statements based on our audits. We conducted our audits of these financial statements in accordance with the standards of the Public Company Accounting Oversight Board (United States). Those standards require that we plan and perform the audit to obtain reasonable assurance about whether the financial statements are free of material misstatement. An audit includes examining, on a test basis, evidence supporting the amounts and disclosures in the financial statements, assessing the accounting principles used and significant estimates made by management, and evaluating the overall financial statement presentation. We believe that our audits, which included confirmation of securities at July 31, 2011 by correspondence with the custodian and brokers, provide a reasonable basis for our opinion.
/s/PricewaterhouseCoopers LLP
PricewaterhouseCoopers LLP
Boston, Massachusetts
September 14, 2011
Annual Report
The Trustees, Members of the Advisory Board, and executive officers of the trust and fund, as applicable, are listed below. The Board of Trustees governs the fund and is responsible for protecting the interests of shareholders. The Trustees are experienced executives who meet periodically throughout the year to oversee the fund's activities, review contractual arrangements with companies that provide services to the fund, oversee management of the risks associated with such activities and contractual arrangements, and review the fund's performance.
Except for James C. Curvey, each of the Trustees oversees 221 funds advised by FMR or an affiliate. Mr. Curvey oversees 419 funds advised by FMR or an affiliate. The Trustees hold office without limit in time except that (a) any Trustee may resign; (b) any Trustee may be removed by written instrument, signed by at least two-thirds of the number of Trustees prior to such removal; (c) any Trustee who requests to be retired or who has become incapacitated by illness or injury may be retired by written instrument signed by a majority of the other Trustees; and (d) any Trustee may be removed at any special meeting of shareholders by a two-thirds vote of the outstanding voting securities of the trust. Each Trustee who is not an interested person (as defined in the 1940 Act) (Independent Trustee), shall retire not later than the last day of the calendar year in which his or her 75th birthday occurs. The Independent Trustees may waive this mandatory retirement age policy with respect to individual Trustees. The executive officers and Advisory Board Members hold office without limit in time, except that any officer and Advisory Board Member may resign or may be removed by a vote of a majority of the Trustees at any regular meeting or any special meeting of the Trustees. Except as indicated, each individual has held the office shown or other offices in the same company for the past five years.
Experience, Skills, Attributes, and Qualifications of the Fund's Trustees. The Governance and Nominating Committee has adopted a statement of policy that describes the experience, qualifications, attributes, and skills that are necessary and desirable for potential Independent Trustee candidates (Statement of Policy). The Board believes that each Trustee satisfied at the time he or she was initially elected or appointed a Trustee, and continues to satisfy, the standards contemplated by the Statement of Policy. The Governance and Nominating Committee also engages professional search firms to help identify potential Independent Trustee candidates who have the experience, qualifications, attributes, and skills consistent with the Statement of Policy. From time to time, additional criteria based on the composition and skills of the current Independent Trustees, as well as experience or skills that may be appropriate in light of future changes to board composition, business conditions, and regulatory or other developments, have also been considered by the professional search firms and the Governance and Nominating Committee. In addition, the Board takes into account the Trustees' commitment and participation in Board and committee meetings, as well as their leadership of standing and ad hoc committees throughout their tenure.
In determining that a particular Trustee was and continues to be qualified to serve as a Trustee, the Board has considered a variety of criteria, none of which, in isolation, was controlling. The Board believes that, collectively, the Trustees have balanced and diverse experience, qualifications, attributes, and skills, which allow the Board to operate effectively in governing the fund and protecting the interests of shareholders. Information about the specific experience, skills, attributes, and qualifications of each Trustee, which in each case led to the Board's conclusion that the Trustee should serve (or continue to serve) as a trustee of the fund, is provided below.
Annual Report
Trustees and Officers - continued
Board Structure and Oversight Function. James C. Curvey is an interested person (as defined in the 1940 Act) and currently serves as Acting Chairman. The Trustees have determined that an interested Chairman is appropriate and benefits shareholders because an interested Chairman has a personal and professional stake in the quality and continuity of services provided to the fund. Independent Trustees exercise their informed business judgment to appoint an individual of their choosing to serve as Chairman, regardless of whether the Trustee happens to be independent or a member of management. The Independent Trustees have determined that they can act independently and effectively without having an Independent Trustee serve as Chairman and that a key structural component for assuring that they are in a position to do so is for the Independent Trustees to constitute a substantial majority for the Board. The Independent Trustees also regularly meet in executive session. Ned C. Lautenbach serves as Chairman of the Independent Trustees and as such (i) acts as a liaison between the Independent Trustees and management with respect to matters important to the Independent Trustees and (ii) with management prepares agendas for Board meetings.
Fidelity funds are overseen by different Boards of Trustees. The fund's Board oversees Fidelity's equity and high income funds and another Board oversees Fidelity's investment-grade bond, money market, and asset allocation funds. The asset allocation funds may invest in Fidelity funds overseen by the fund's Board. The use of separate Boards, each with its own committee structure, allows the Trustees of each group of Fidelity funds to focus on the unique issues of the funds they oversee, including common research, investment, and operational issues. On occasion, the separate Boards establish joint committees to address issues of overlapping consequences for the Fidelity funds overseen by each Board.
The Trustees operate using a system of committees to facilitate the timely and efficient consideration of all matters of importance to the Trustees, the fund, and fund shareholders and to facilitate compliance with legal and regulatory requirements and oversight of the fund's activities and associated risks. The Board, acting through its committees, has charged FMR and its affiliates with (i) identifying events or circumstances the occurrence of which could have demonstrably adverse effects on the fund's business and/or reputation; (ii) implementing processes and controls to lessen the possibility that such events or circumstances occur or to mitigate the effects of such events or circumstances if they do occur; and (iii) creating and maintaining a system designed to evaluate continuously business and market conditions in order to facilitate the identification and implementation processes described in (i) and (ii) above. Because the day-to-day operations and activities of the fund are carried out by or through FMR, its affiliates and other service providers, the fund's exposure to risks is mitigated but not eliminated by the processes overseen by the Trustees. While each of the Board's committees has responsibility for overseeing different aspects of the fund's activities, oversight is exercised primarily through the Operations, Audit, and Compliance Committees. Appropriate personnel, including but not limited to the fund's Chief Compliance Officer (CCO), FMR's internal auditor, the independent accountants, the fund's Treasurer and portfolio management personnel, make periodic reports to the Board's committees, as appropriate. The responsibilities of each committee, including their oversight responsibilities, are described further under "Standing Committees of the Fund's Trustees."
Annual Report
The fund's Statement of Additional Information (SAI) includes more information about the Trustees. To request a free copy, call Fidelity at 1-877-208-0098.
Interested Trustees*:
Correspondence intended for each Trustee who is an interested person may be sent to Fidelity Investments, 82 Devonshire Street, Boston, Massachusetts 02109.
Name, Age; Principal Occupations and Other Relevant Experience+ |
James C. Curvey (76) |
| Year of Election or Appointment: 2007 Mr. Curvey is Trustee and Acting Chairman of the Board of Trustees of certain Trusts. Mr. Curvey also serves as Trustee (2007-present) of other investment companies advised by FMR. Mr. Curvey is a Director of Fidelity Investments Money Management, Inc. (2009-present), Director of Fidelity Research & Analysis Co. (2009-present) and Director of FMR and FMR Co., Inc. (2007-present). Mr. Curvey is also Vice Chairman (2007-present) and Director of FMR LLC. In addition, Mr. Curvey serves as an Overseer for the Boston Symphony Orchestra and a member of the Trustees of Villanova University. Previously, Mr. Curvey was the Vice Chairman (2006-2007) and Director (2000-2007) of FMR Corp. |
Ronald P. O'Hanley (54) |
| Year of Election or Appointment: 2011 Mr. O'Hanley is Director of FMR Co., Inc. (2010-present), Director of Fidelity Investments Money Management, Inc. (2010-present), Director of Fidelity Research & Analysis Company (2010-present), President of Fidelity Asset Management and Corporate Services and a member of Fidelity's Executive Committee (2010-present). Previously, Mr. O'Hanley served as President and Chief Executive Officer of BNY Mellon Asset Management (2007-2010). Mr. O'Hanley also served as Vice Chairman of Bank New York Mellon Corp. and a member of that firm's Executive Committee. Prior to the 2007 merger of The Bank of New York and Mellon Financial Corporation, he was Vice Chairman of Mellon Financial Corporation and President and Chief Executive Officer of Mellon Asset Management. He joined Mellon in February 1997. Mr. O'Hanley currently serves as Chairman of the Boston Public Library Foundation Board of Directors and sits on the Board of Directors of Beth Israel Deaconess Medical Center, the Board of Trustees of the Marine Biological Laboratory and the Advisory Board of the Maxwell School of Citizenship and Public Administration at Syracuse University. Mr. O'Hanley also chairs the Council on Asset Management for the Financial Services Roundtable and is a member of the Board of Directors of Institutional Investor's U.S. Institute. |
* Trustees have been determined to be "Interested Trustees" by virtue of, among other things, their affiliation with the trust or various entities under common control with FMR.
+ The information above includes each Trustee's principal occupation during the last five years and other information relating to the experience, attributes, and skills relevant to each Trustee's qualifications to serve as a Trustee, which led to the conclusion that each Trustee should serve as a Trustee for the fund.
Annual Report
Independent Trustees:
Correspondence intended for each Independent Trustee (that is, the Trustees other than the Interested Trustees) may be sent to Fidelity Investments, P.O. Box 55235, Boston, Massachusetts 02205-5235.
Name, Age; Principal Occupations and Other Relevant Experience+ |
Dennis J. Dirks (63) |
| Year of Election or Appointment: 2005 Prior to his retirement in May 2003, Mr. Dirks was Chief Operating Officer and a member of the Board of The Depository Trust & Clearing Corporation (DTCC). He also served as President, Chief Operating Officer, and Board member of The Depository Trust Company (DTC) and President and Board member of the National Securities Clearing Corporation (NSCC). In addition, Mr. Dirks served as Chief Executive Officer and Board member of the Government Securities Clearing Corporation, Chief Executive Officer and Board member of the Mortgage-Backed Securities Clearing Corporation, as a Trustee and a member of the Finance Committee of Manhattan College (2005-2008), and as a Trustee and a member of the Finance Committee of AHRC of Nassau County (2006-2008). Mr. Dirks is a member of the Independent Directors Council (IDC) Governing Council (2010-Present) and Board of Directors for The Brookville Center for Children's Services, Inc. (2009-present). |
Alan J. Lacy (57) |
| Year of Election or Appointment: 2008 Mr. Lacy serves as Senior Adviser (2007-present) of Oak Hill Capital Partners, L.P. (private equity). Mr. Lacy also served as Chief Executive Officer (2000-2005) and Vice Chairman (2005-2006) of Sears Holdings Corporation and Sears, Roebuck and Co. (retail). In addition, Mr. Lacy serves as a member of the Board of Directors of Dave & Buster's, Inc. (restaurant and entertainment complexes, 2010-present), The Hillman Companies, Inc. (hardware wholesalers, 2010-present), and Bristol-Myers Squibb Company (global pharmaceuticals, 2007-present). Mr. Lacy is a member of the Board of Trustees of The National Parks Conservation Association (2006-Present). Previously, Mr. Lacy served as Chairman of the Board of Trustees of the National Parks Conservation Association (2008-2011) and as a member of the Board of Directors for the Western Union Company (global money transfer, 2006-2011). |
Ned C. Lautenbach (67) |
| Year of Election or Appointment: 2000 Mr. Lautenbach is Chairman of the Independent Trustees of the Equity and High Income Funds (2006-present). Mr. Lautenbach currently serves as the Lead Director of the Eaton Corporation Board of Directors (diversified industrial, 1997-present). Mr. Lautenbach is also a member of the Board of Directors of the Philharmonic Center for the Arts in Naples, Florida (1999-present); a member of the Board of Trustees of Fairfield University (2005-present); and a member of the Council on Foreign Relations (1994-present). Previously, Mr. Lautenbach was a Partner/Advisory Partner at Clayton, Dubilier & Rice, LLC (private equity investment, 1998-2010), as well as a Director of Sony Corporation (2006-2007). |
Joseph Mauriello (66) |
| Year of Election or Appointment: 2008 Prior to his retirement in January 2006, Mr. Mauriello served in numerous senior management positions including Deputy Chairman and Chief Operating Officer (2004-2005), and Vice Chairman of Financial Services (2002-2004) of KPMG LLP US (professional services, 1965-2005). Mr. Mauriello currently serves as a member of the Board of Directors of XL Group plc. (global insurance and re-insurance, 2006-present) and of Arcadia Resources Inc. (health care services and products, 2007-present). Previously, Mr. Mauriello served as a Director of the Hamilton Funds of the Bank of New York (2006-2007). |
Robert W. Selander (60) |
| Year of Election or Appointment:2011 Previously, Mr. Selander served as a Member of the Advisory Board of Fidelity's Equity and High Income Funds (2011), Executive Vice Chairman (2010), Chief Executive Officer (2009-2010), and President and Chief Executive Officer (1997-2009) of Mastercard, Inc. |
Cornelia M. Small (67) |
| Year of Election or Appointment: 2005 Ms. Small is a member of the Board of Directors of the Teagle Foundation (2009-present). Ms. Small is also a member of the Investment Committee, and Chair (2008-present) and a member of the Board of Trustees of Smith College. In addition, Ms. Small serves on the Investment Committee of the Berkshire Taconic Community Foundation (2008-present). Previously, Ms. Small served as Chairperson of the Investment Committee (2002-2008) of Smith College. In addition, Ms. Small served as Chief Investment Officer, Director of Global Equity Investments, and a member of the Board of Directors of Scudder, Stevens & Clark and Scudder Kemper Investments. |
William S. Stavropoulos (72) |
| Year of Election or Appointment: 2002 Mr. Stavropoulos is Vice Chairman of the Independent Trustees of the Equity and High Income Funds (2006-present). Mr. Stavropoulos serves as President and Founder of the Michigan Baseball Foundation, the Great Lakes Loons (2007-present). Mr. Stavropoulos is Chairman Emeritus of the Board of Directors of The Dow Chemical Company, where he previously served in numerous senior management positions, including President, CEO (1995-2000; 2002-2004), Chairman of the Executive Committee (2000-2006), and as a member of the Board of Directors (1990-2006). Currently, Mr. Stavropoulos is Chairman of Univar (global distributor of commodity and specialty chemicals, 2010-present), a Director of Teradata Corporation (data warehousing and technology solutions, 2008-present), Chemical Financial Corporation, Maersk Inc. (industrial conglomerate), Tyco International, Inc. (multinational manufacturing and services, 2007-present), and a member of the Advisory Board for Metalmark Capital (private equity investment, 2005-present). Mr. Stavropoulos is a special advisor to Clayton, Dubilier & Rice, LLC (private equity investment). In addition, Mr. Stavropoulos is a member of the University of Notre Dame Advisory Council for the College of Science. |
David M. Thomas (62) |
| Year of Election or Appointment: 2008 Previously, Mr. Thomas served as Executive Chairman (2005-2006) and Chairman and Chief Executive Officer (2000-2005) of IMS Health, Inc. (pharmaceutical and healthcare information solutions). In addition, Mr. Thomas serves as a member of the Board of Directors of Fortune Brands, Inc. (consumer products), and Interpublic Group of Companies, Inc. (marketing communication, 2004-present). |
Michael E. Wiley (60) |
| Year of Election or Appointment: 2008 Mr. Wiley also serves as a Director of Asia Pacific Exploration Consolidated (international oil and gas exploration and production, 2008-present). Mr. Wiley serves as a Director of Tesoro Corporation (independent oil refiner and marketer, 2005-present), and a Director of Bill Barrett Corporation (exploration and production, 2005-present). In addition, Mr. Wiley also serves as a Director of Post Oak Bank (privately-held bank, 2004-present). Previously, Mr. Wiley served as a member of the Board of Trustees of the University of Tulsa (2000-2006; 2007-2010), as a Senior Energy Advisor of Katzenbach Partners, LLC (consulting, 2006-2007), as an Advisory Director of Riverstone Holdings (private investment), Chairman, President, and CEO of Baker Hughes, Inc. (oilfield services, 2000-2004), and as Director of Spinnaker Exploration Company (exploration and production, 2001-2005). |
Annual Report
Trustees and Officers - continued
+ The information above includes each Trustee's principal occupation during the last five years and other information relating to the experience, attributes, and skills relevant to each Trustee's qualifications to serve as a Trustee, which led to the conclusion that each Trustee should serve as a Trustee for the fund.
Advisory Board Members and Executive Officers:
Correspondence intended for each executive officer, Edward C. Johnson 3d, and Peter S. Lynch may be sent to Fidelity Investments, 82 Devonshire Street, Boston, Massachusetts 02109.
Name, Age; Principal Occupation |
Edward C. Johnson 3d (81) |
| Year of Election or Appointment: 2011 Member of the Advisory Board of Fidelity's Equity and High Income Funds. Mr. Johnson serves as Chief Executive Officer, Chairman, and a Director of FMR LLC, and also serves as Chairman and Director of FIL Limited. Previously, Mr. Johnson served as a Trustee and Chairman of the Board of certain Fidelity Trusts, Chairman and a Director of FMR, Chairman and a Director of FMR Co., Inc., and President of FMR LLC (2006-2007). |
Peter S. Lynch (67) |
| Year of Election or Appointment: 2003 Member of the Advisory Board of Fidelity's Equity and High Income Funds. Mr. Lynch is Vice Chairman and a Director of FMR and FMR Co., Inc. In addition, Mr. Lynch serves as a Trustee of Boston College and as the Chairman of the Inner-City Scholarship Fund. Previously, Mr. Lynch served on the Special Olympics International Board of Directors (1997-2006). |
Kenneth B. Robins (41) |
| Year of Election or Appointment: 2008 President and Treasurer of Fidelity's Equity and High Income Funds. Mr. Robins also serves as President and Treasurer (2010-present) and Assistant Treasurer (2009-present) of other Fidelity funds and is an employee of Fidelity Investments (2004-present). Previously, Mr. Robins served as Deputy Treasurer of the Fidelity funds (2005-2008) and Treasurer and Chief Financial Officer of The North Carolina Capital Management Trust: Cash and Term Portfolios (2006-2008). |
Brian B. Hogan (46) |
| Year of Election or Appointment: 2009 Vice President of Equity and High Income Funds. Mr. Hogan also serves as President of FMR's Equity Division (2009-present). Previously, Mr. Hogan served as Senior Vice President, Equity Research of FMR (2006-2009) and as a portfolio manager. |
Thomas C. Hense (47) |
| Year of Election or Appointment: 2008 or 2010 Vice President of Fidelity's High Income (2008), Small Cap (2008), and Value (2010) Funds. Previously, Mr. Hense served as a portfolio manager for Fidelity's Institutional Money Management Group (Pyramis) (2003-2008). |
Scott C. Goebel (43) |
| Year of Election or Appointment: 2008 Secretary and Chief Legal Officer (CLO) of the Fidelity funds. Mr. Goebel also serves as Secretary of Fidelity Investments Money Management, Inc. (FIMM) (2010-present) and Fidelity Research and Analysis Company (FRAC) (2010-present); Secretary and CLO of The North Carolina Capital Management Trust: Cash and Term Portfolios (2008-present); General Counsel, Secretary, and Senior Vice President of FMR (2008-present) and FMR Co., Inc. (2008-present); employed by FMR LLC or an affiliate (2001-present); Chief Legal Officer of Fidelity Management & Research (Hong Kong) Limited (2008-present) and Assistant Secretary of Fidelity Management & Research (Japan) Inc. (2008-present), and Fidelity Management & Research (U.K.) Inc. (2008-present). Previously, Mr. Goebel served as Assistant Secretary of FIMM (2008-2010), FRAC (2008-2010), and the Funds (2007-2008) and as Vice President and Secretary of Fidelity Distributors Corporation (FDC) (2005-2007). |
William C. Coffey (42) |
| Year of Election or Appointment: 2009 Assistant Secretary of Fidelity's Equity and High Income Funds. Mr. Coffey also serves as Senior Vice President and Deputy General Counsel of FMR LLC (2010-present), and is an employee of Fidelity Investments. Previously, Mr. Coffey served as Vice President and Associate General Counsel of FMR LLC (2005-2009). |
Holly C. Laurent (57) |
| Year of Election or Appointment: 2008 Anti-Money Laundering (AML) Officer of the Fidelity funds. Ms. Laurent also serves as AML Officer of The North Carolina Capital Management Trust: Cash and Term Portfolios (2008-present) and is an employee of Fidelity Investments. Previously, Ms. Laurent was Senior Vice President and Head of Legal for Fidelity Business Services India Pvt. Ltd. (2006-2008), and Senior Vice President, Deputy General Counsel and Group Head for FMR LLC (2005-2006). |
Christine Reynolds (52) |
| Year of Election or Appointment: 2008 Chief Financial Officer of the Fidelity funds. Ms. Reynolds became President of Fidelity Pricing and Cash Management Services (FPCMS) in August 2008. Ms. Reynolds served as Chief Operating Officer of FPCMS (2007-2008). Previously, Ms. Reynolds served as President, Treasurer, and Anti-Money Laundering officer of the Fidelity funds (2004-2007). |
Kenneth A. Rathgeber (64) |
| Year of Election or Appointment: 2004 Chief Compliance Officer of Fidelity's Equity and High Income Funds. Mr. Rathgeber is Chief Compliance Officer of Fidelity Management & Research (Hong Kong) Limited (2008-present), Fidelity Management & Research (Japan) Inc. (2008-present), FMR (2005-present), FMR Co., Inc. (2005-present), Fidelity Management & Research (U.K.) Inc. (2005-present), Fidelity Research & Analysis Company (2005-present), Fidelity Investments Money Management, Inc. (2005-present), Pyramis Global Advisors, LLC (2005-present), and Strategic Advisers, Inc. (2005-present). |
Jeffrey S. Christian (49) |
| Year of Election or Appointment: 2009 Deputy Treasurer of the Fidelity funds. Mr. Christian is an employee of Fidelity Investments. Previously, Mr. Christian served as Chief Financial Officer (2008-2009) of certain Fidelity funds and Senior Vice President of Fidelity Pricing and Cash Management Services (FPCMS) (2004-2009). |
Bryan A. Mehrmann (50) |
| Year of Election or Appointment: 2005 Deputy Treasurer of the Fidelity funds. Mr. Mehrmann is an employee of Fidelity Investments. |
Adrien E. Deberghes (43) |
| Year of Election or Appointment: 2008 Deputy Treasurer of Fidelity's Equity and High Income Funds. Mr. Deberghes also serves as Assistant Treasurer of other Fidelity funds (2010-present) and is an employee of Fidelity Investments (2008-present). Previously, Mr. Deberghes served as Senior Vice President of Mutual Fund Administration at State Street Corporation (2007-2008), Senior Director of Mutual Fund Administration at Investors Bank & Trust (2005-2007), and Director of Finance for Dunkin' Brands (2000-2005). |
Stephanie J. Dorsey (42) |
| Year of Election or Appointment: 2010 Assistant Treasurer of Fidelity's Equity and High Income Funds. Ms. Dorsey also serves as Deputy Treasurer of other Fidelity funds (2008-present) and is an employee of Fidelity Investments (2008-present). Previously, Ms. Dorsey served as Treasurer (2004-2008) of the JPMorgan Mutual Funds and Vice President (2004-2008) of JPMorgan Chase Bank. |
John R. Hebble (53) |
| Year of Election or Appointment: 2009 Assistant Treasurer of Fidelity's Equity and High Income Funds. Mr. Hebble also serves as Treasurer and Chief Financial Officer of The North Carolina Capital Management Trust: Cash and Term Portfolios (2008-present), President and Treasurer of other Fidelity funds (2008-present) and is an employee of Fidelity Investments. |
Gary W. Ryan (52) |
| Year of Election or Appointment: 2005 Assistant Treasurer of the Fidelity funds. Mr. Ryan is an employee of Fidelity Investments. Previously, Mr. Ryan served as Vice President of Fund Reporting in Fidelity Pricing and Cash Management Services (FPCMS) (1999-2005). |
Jonathan Davis (43) |
| Year of Election or Appointment: 2010 Assistant Treasurer of the Fidelity funds. Mr. Davis is an employee of Fidelity Investments. Previously, Mr. Davis served as Vice President and Associate General Counsel of FMR LLC (2003-2010). |
Annual Report
The Board of Trustees of Fidelity Small Cap Growth Fund voted to pay to shareholders of record at the opening of business on record date, the following distributions per share derived from capital gains realized from sales of portfolio securities:
| Pay Date | Record Date | Capital Gains |
Institutional Class | 9/12/11 | 9/09/11 | $0.234 |
The Institutional Class designates 100% of the dividends distributed during the fiscal year as qualifying for the dividends-received deduction for corporate shareholders.
The Institutional Class designates 100% of the dividends distributed during the fiscal year as amounts which may be taken into account as a dividend for purposes of the maximum rate under section 1(h)(11) of the Internal Revenue Code.
The fund hereby designates as a capital gain dividend with respect to the taxable year ended July 31, 2011, $28,512,528, or, if subsequently determined to be different, the net capital gain of such year.
The fund will notify shareholders in January 2012 of amounts for use in preparing 2011 income tax returns.
Annual Report
Board Approval of Investment Advisory Contracts and Management Fees
Fidelity Small Cap Growth Fund
Each year, the Board of Trustees, including the Independent Trustees (together, the Board), votes on the renewal of the management contract and sub-advisory agreements (together, the Advisory Contracts) for the fund. The Board, assisted by the advice of fund counsel and Independent Trustees' counsel, requests and considers a broad range of information relevant to the renewal of the Advisory Contracts throughout the year.
The Board meets regularly and considers at each of its meetings factors that are relevant to its annual consideration of the renewal of the fund's Advisory Contracts, including the services and support provided to the fund and its shareholders. The Board has established various standing committees, each composed of Independent Trustees with varying backgrounds, to which the Board has assigned specific subject matter responsibilities in order to enhance effective decision-making by the Board. The Board, acting directly and through its Committees, requests and receives information concerning the annual consideration of the renewal of the fund's Advisory Contracts. The Board also meets as needed to consider matters specifically related to the Board's annual consideration of the renewal of Advisory Contracts. Members of the Board may also meet with trustees of other Fidelity funds through ad hoc joint committees to discuss certain matters relevant to the Fidelity funds.
At its July 2011 meeting, the Board of Trustees, including the Independent Trustees, unanimously determined to renew the fund's Advisory Contracts. In reaching its determination, the Board considered all factors it believed relevant, including (i) the nature, extent, and quality of the services to be provided to the fund and its shareholders (including the investment performance of the fund); (ii) the competitiveness of the fund's management fee and total expense ratio; (iii) the total costs of the services to be provided by and the profits to be realized by Fidelity from its relationship with the fund; (iv) the extent to which economies of scale would be realized as the fund grows; and (v) whether fee levels reflect these economies of scale, if any, for the benefit of fund shareholders.
In considering whether to renew the Advisory Contracts for the fund, the Board reached a determination, with the assistance of fund counsel and Independent Trustees' counsel and through the exercise of its business judgment, that the renewal of the Advisory Contracts is in the best interests of the fund and its shareholders and that the compensation payable under the Advisory Contracts is fair and reasonable. The Board's decision to renew the Advisory Contracts was not based on any single factor, but rather was based on a comprehensive consideration of all the information provided to the Board at its meetings throughout the year. The Board, in reaching its determination to renew the Advisory Contracts, is aware that shareholders in the fund have a broad range of investment choices available to them, including a wide choice among mutual funds offered by Fidelity's competitors, and that the fund's shareholders, who have the opportunity to review and weigh the disclosure provided by the fund in its prospectus and other public disclosures, have chosen to invest in this fund, managed by Fidelity.
Annual Report
Board Approval of Investment Advisory Contracts and
Management Fees - continued
Nature, Extent, and Quality of Services Provided. The Board considered the staffing within the investment adviser, FMR, and the sub-advisers (together, the Investment Advisers), including the backgrounds of the fund's investment personnel and the fund's investment objective and discipline. The Independent Trustees also had discussions with senior management of Fidelity's investment operations and investment groups. The Board considered the structure of the portfolio manager compensation program and whether this structure provides appropriate incentives to act in the best interests of the fund.
Resources Dedicated to Investment Management and Support Services. The Board and the Fund Oversight and Research Committees reviewed the general qualifications and capabilities of the Investment Advisers' investment staff, including its size, education, experience, and resources, as well as the Investment Advisers' approach to recruiting, training, managing, and compensating investment personnel. The Board also noted that FMR has devoted increased resources to non-U.S. offices. The Board noted that Fidelity's analysts have extensive resources, tools and capabilities which allow them to conduct sophisticated quantitative and fundamental analysis, as well as credit analysis of issuers, counterparties and enhancers. The Board also believes that Fidelity's investment professionals have sufficient access to global information and data so as to provide competitive investment results over time, and that those professionals also have access to sophisticated tools which permit them to assess portfolio construction and risk and performance attribution characteristics continuously, as well as to transmit new information and research conclusions rapidly around the world. Additionally, in their deliberations, the Board considered the Investment Advisers' trading capabilities and resources which are an integral part of the investment management process.
Shareholder and Administrative Services. The Board considered (i) the nature, extent, quality, and cost of advisory, administrative, and shareholder services performed by the Investment Advisers and their affiliates under the Advisory Contracts and under separate agreements covering transfer agency, pricing and bookkeeping, and securities lending services for the fund; (ii) the nature and extent of the investment adviser's supervision of third party service providers, principally custodians and subcustodians; and (iii) the resources devoted to, and the record of compliance with, the fund's compliance policies and procedures. The Board also reviewed the allocation of fund brokerage, including allocations to brokers affiliated with the Investment Advisers, the use of brokerage commissions to pay fund expenses, and the use of "soft" commission dollars to pay for research services.
The Board noted that the growth of fund assets over time across the complex allows Fidelity to reinvest in the development of services designed to enhance the value or convenience of the Fidelity funds as investment vehicles. These services include 24-hour access to account information and market information through telephone representatives and over the Internet, investor education materials and asset allocation tools, and the expanded availability of Fidelity Investor Centers, with 35 new branches opening since 2010.
Annual Report
Investment in a Large Fund Family. The Board considered the benefits to shareholders of investing in a Fidelity fund, including the benefits of investing in a fund that is part of a large family of funds offering a variety of investment disciplines and providing a large variety of mutual fund investor services. The Board noted that Fidelity had taken, or had made recommendations that resulted in the Fidelity funds taking, a number of actions over the previous year that benefited particular funds, including (i) continuing to dedicate additional resources to investment research and support of the senior management team that oversees asset management; (ii) rationalizing product lines through the mergers of six funds into other funds; (iii) continuing to migrate the Freedom Funds to dedicated lower cost underlying funds; (iv) obtaining shareholder approval to broaden the investment strategies for Fidelity Consumer Finance Portfolio, Fidelity Emerging Asia Fund, and Fidelity Environment and Alternative Energy Portfolio; (v) contractually agreeing to reduce the management fees and impose other expense limitations on Spartan® 500 Index Fund and U.S. Bond Index Fund in connection with launching new institutional classes of these funds; (vi) changing the name, primary and supplemental benchmarks, and investment policies of Fidelity Global Strategies Fund to support the fund's flexible investment mandate and global orientation; and (vii) reducing the transfer agency account fee rates on certain accounts.
Investment Performance. The Board considered whether the fund has operated in accordance with its investment objective, as well as its record of compliance with its investment restrictions. It also reviewed the fund's absolute investment performance for each class, as well as the fund's relative investment performance for each class measured over multiple periods against (i) a broad-based securities market index, and (ii) a peer group of mutual funds deemed appropriate by Fidelity and reviewed by the Board. The following charts considered by the Board show, over the one-, three-, and five-year periods ended December 31, 2010, the cumulative total returns of Institutional Class (Class I) and Class B of the fund, the cumulative total returns of a broad-based securities market index ("benchmark"), and a range of cumulative total returns of a peer group of mutual funds identified by Morningstar, Inc. as having an investment style similar to that of the fund based on underlying portfolio holdings. The returns of Institutional Class (Class I) and Class B show the performance of the highest and lowest performing classes, respectively (based on five-year performance). The box within each chart shows the 25th percentile return (bottom of box) and the 75th percentile return (top of box) of the peer group. Returns shown above the box are in the first quartile and returns shown below the box are in the fourth quartile. The percentage beaten numbers noted below each chart correspond to the percentile box and represent the percentage of funds in the peer group whose performance was equal to or lower than that of the class indicated.
Annual Report
Board Approval of Investment Advisory Contracts and
Management Fees - continued
Fidelity Small Cap Growth Fund
The Board reviewed the fund's relative investment performance against its peer group and noted that the performance of Institutional Class (Class I) of the fund was in the third quartile for the one- and three-year periods and the second quartile for the five-year period. The Board also noted that the investment performance of the fund was lower than its benchmark for the one- and three-year periods, although the five-year cumulative total return of Institutional Class (Class I) compared favorably to its benchmark. The Board considered that the variations in performance among the fund's classes reflect the variations in class expenses, which result in lower performance for higher expense classes. The Board discussed with FMR actions that have been taken by FMR to improve the fund's disappointing performance relative to its peer group and benchmark. The Board also reviewed the fund's performance since inception as well as performance in the current year. The Board will continue to closely monitor the performance of the fund in the coming year and discuss with FMR other appropriate actions to address the performance of the fund.
The Board also considered that the fund's management fee is subject to upward or downward adjustment depending upon whether, and to what extent, the fund's investment performance for the performance period exceeds, or is exceeded by, the record (over the same period) of a Board-approved performance adjustment index. The Board noted that the performance adjustment provides FMR with a strong economic incentive to seek to achieve superior performance for the fund's shareholders and helps to more closely align the interests of FMR and the fund's shareholders.
Annual Report
Based on its review, the Board concluded that the nature, extent, and quality of services provided to the fund under the Advisory Contracts should benefit the fund's shareholders.
Competitiveness of Management Fee and Total Expense Ratio. The Board considered the fund's management fee and total expense ratio compared to "mapped groups" of competitive funds and classes. Fidelity creates "mapped groups" by combining similar Lipper investment objective categories that have comparable management fee characteristics. Combining Lipper investment objective categories aids the Board's management fee and total expense ratio comparisons by broadening the competitive group used for comparison and by reducing the number of universes to which various Fidelity funds are compared.
Management Fee. The Board considered two proprietary management fee comparisons for the 12-month periods shown in the chart below. The group of Lipper funds used by the Board for management fee comparisons is referred to below as the "Total Mapped Group." The Total Mapped Group comparison focuses on a fund's standing relative to the total universe of comparable funds available to investors in terms of gross management fees before expense reimbursements or caps, and without giving effect to the fund's performance adjustment. "TMG %" represents the percentage of funds in the Total Mapped Group that had management fees that were lower than the fund's. For example, a TMG % of 14% means that 86% of the funds in the Total Mapped Group had higher management fees than the fund. The "Asset-Size Peer Group" (ASPG) comparison focuses on a fund's standing relative to non-Fidelity funds similar in size to the fund within the Total Mapped Group. The ASPG represents at least 15% of the funds in the Total Mapped Group with comparable asset size and management fee characteristics, subject to a minimum of 50 funds (or all funds in the Total Mapped Group if fewer than 50). Additional information, such as the ASPG quartile in which the fund's management fee ranked and the impact of the fund's performance adjustment, is also included in the chart and considered by the Board.
Annual Report
Board Approval of Investment Advisory Contracts and
Management Fees - continued
Fidelity Small Cap Growth Fund
The Board noted that the fund's management fee ranked below the median of its Total Mapped Group and below the median of its ASPG for 2010. The Board also noted the effect of the fund's negative performance adjustment on the fund's management fee ranking. The Board noted that the performance adjustment for each year represents calculations for performance periods that differ from the periods shown in the performance charts above.
Based on its review, the Board concluded that the fund's management fee is fair and reasonable in light of the services that the fund receives and the other factors considered.
Total Expense Ratio. In its review of each class's total expense ratio, the Board considered the fund's management fee as well as other fund or class expenses, as applicable, such as transfer agent fees, pricing and bookkeeping fees, fund-paid 12b-1 fees, and custodial, legal, and audit fees. The Board also noted the effects of any waivers and reimbursements on fees and expenses, as well as the impact of the fund's performance adjustment. As part of its review, the Board also considered the current and historical total expense ratios of each class of the fund compared to competitive fund median expenses. Each class of the fund is compared to those funds and classes in the Total Mapped Group (used by the Board for management fee comparisons) that have a similar sales load structure.
The Board noted that the total expense ratio of each of Class A, Class B, Class C, Institutional Class, the retail class, and Class F ranked below its competitive median for 2010 and the total expense ratio of Class T ranked above its competitive median for 2010. The Board considered that various factors, including 12b-1 fees, positive or negative performance adjustments, and relatively higher other expenses in the case of small fund size, can affect total expense ratios. The Board noted that the total expense ratio of Class T was above the competitive median primarily because of higher 12b-1 fees on Class T. Class T has a higher 12b-1 fee, but a lower front-end sales charge, than traditionally priced front-end sales charge classes. The Board noted that the fund offers multiple classes, each of which has a different sales load and 12b-1 fee structure, and that the multiple structures are intended to offer a range of pricing options for the intermediary market. The Board also noted that the total expense ratios of the classes vary primarily by the level of their 12b-1 fees, although differences in transfer agent fees may also cause expenses to vary from class to class.
Annual Report
Fees Charged to Other Fidelity Clients. The Board also considered Fidelity fee structures and other information with respect to clients of FMR and its affiliates, such as other mutual funds advised or subadvised by FMR or its affiliates, pension plan clients, and other institutional clients. In March 2010, the Board created an ad hoc joint committee with the board of other Fidelity funds (the Committee) to review and compare Fidelity's institutional investment advisory business with its business of providing services to the Fidelity funds, including the differences in services provided, fees charged, and costs incurred, as well as competition in their respective marketplaces.
Based on its review of total expense ratios and fees charged to other Fidelity clients, the Board concluded that the total expense ratio of each class of the fund was reasonable, although Class T was above the median of the universe presented for comparison, in light of the services that the fund and its shareholders receive and the other factors considered, including the findings of the Committee.
Costs of the Services and Profitability. The Board considered the revenues earned and the expenses incurred by Fidelity in conducting the business of developing, marketing, distributing, managing, administering and servicing the fund and its shareholders. The Board also considered the level of Fidelity's profits in respect of all the Fidelity funds.
On an annual basis, FMR presents to the Board Fidelity's profitability for the fund. Fidelity calculates the profitability for each fund, as well as aggregate profitability for groups of Fidelity funds and all Fidelity funds, using a series of detailed revenue and cost allocation methodologies which originate with the books and records of Fidelity on which Fidelity's audited financial statements are based. The Audit Committee of the Board reviews any significant changes from the prior year's methodologies.
PricewaterhouseCoopers LLP (PwC), independent registered public accounting firm and auditor to Fidelity and certain Fidelity funds, has been engaged annually by the Board as part of the Board's assessment of Fidelity's profitability analysis. PwC's engagement includes the review and assessment of Fidelity's methodologies used in determining the revenues and expenses attributable to Fidelity's mutual fund business, and completion of agreed-upon procedures surrounding the mathematical accuracy of fund profitability and its conformity to allocation methodologies. After considering PwC's reports issued under the engagement and information provided by Fidelity, the Board concluded that while other allocation methods may also be reasonable, Fidelity's profitability methodologies are reasonable in all material respects.
Annual Report
Board Approval of Investment Advisory Contracts and
Management Fees - continued
The Board also reviewed Fidelity's non-fund businesses and fall-out benefits related to the mutual fund business as well as cases where Fidelity's affiliates may benefit from or be related to the fund's business.
The Board considered the costs of the services provided by and the profits realized by Fidelity in connection with the operation of the fund and was satisfied that the profitability was not excessive in the circumstances.
Economies of Scale. The Board considered whether there have been economies of scale in respect of the management of the Fidelity funds, whether the Fidelity funds (including the fund) have appropriately benefited from any such economies of scale, and whether there is potential for realization of any further economies of scale. The Board considered the extent to which the fund will benefit from economies of scale through increased services to the fund, through waivers or reimbursements, or through fee or expense reductions. The Board also noted that in 2009, it and the board of other Fidelity funds created an ad hoc committee (the Economies of Scale Committee) to analyze whether FMR attains economies of scale in respect of the management and servicing of the Fidelity funds, whether the Fidelity funds have appropriately benefited from such economies of scale, and whether there is potential for realization of any further economies of scale.
The Board recognized that the fund's management contract incorporates a "group fee" structure, which provides for lower group fee rates as total fund assets under FMR's management increase, and for higher group fee rates as total fund assets under FMR's management decrease. FMR calculates the group fee rates based on a tiered asset "breakpoint" schedule that varies based on asset class. The Board considered that the group fee is designed to deliver the benefits of economies of scale to fund shareholders when total Fidelity fund assets increase, even if assets of any particular fund are unchanged or have declined, because some portion of Fidelity's costs are attributable to services provided to all Fidelity funds, and all funds benefit if those costs can be allocated among more assets. The Board concluded that, given the group fee structure, fund shareholders will benefit from lower management fees as assets under FMR's management increase at the fund complex level, regardless of whether Fidelity achieves any such economies of scale.
Annual Report
The Board concluded, taking into account the analysis of the Economies of Scale Committee, that any potential economies of scale are being appropriately shared between fund shareholders and Fidelity.
Additional Information Requested by the Board. In order to develop fully the factual basis for consideration of the Fidelity funds' Advisory Contracts, the Board requested and received additional information on certain topics, including (i) fund performance trends, actions to be taken by FMR to improve certain funds' overall performance, and Fidelity's long-term strategies for certain funds; (ii) portfolio manager changes that have occurred during the past year and length of portfolio manager tenure for different categories of funds over time; (iii) Fidelity's compensation structure for portfolio managers and other key personnel and strategies for attracting and retaining non-investment personnel; (iv) the amount of the investment that each portfolio manager has made in the Fidelity fund(s) that he or she manages; (v) historical trends in Fidelity's realization of fall-out benefits; (vi) Fidelity's group fee structures and the rationale for the individual fee rates of certain funds; (vii) fund profitability methodology and the impact of certain factors on fund profitability results; (viii) trends regarding industry use of performance fee structures and Fidelity's compliance practices with respect to performance adjustment calculations; (ix) the fee structures in place for certain other Fidelity clients; and (x) explanations regarding the relative total expense ratios of certain funds and classes, total expense competitive trends, and actions that might be taken by FMR to reduce total expense ratios for certain funds and classes.
Based on its evaluation of all of the conclusions noted above, and after considering all factors it believed relevant, the Board ultimately concluded that the advisory fee structures are fair and reasonable, and that the fund's Advisory Contracts should be renewed.
Annual Report
Investment Adviser
Fidelity Management & Research Company
Boston, MA
Investment Sub-Advisers
FMR Co., Inc.
Fidelity Management & Research
(U.K.) Inc.
Fidelity Management & Research
(Hong Kong) Limited
Fidelity Management & Research
(Japan) Inc.
General Distributor
Fidelity Distributors Corporation
Boston, MA
Transfer and Service Agents
Fidelity Investments Institutional
Operations Company, Inc.
Boston, MA
Fidelity Service Company, Inc.
Boston, MA
Custodian
Citibank, N.A.
New York, NY
ASCPI-UANN-0911
1.803721.106
Fidelity®
Small Cap Value
Fund
Annual Report
July 31, 2011
(2_fidelity_logos) (Registered_Trademark)
Contents
Chairman's Message | <Click Here> | The Chairman's message to shareholders. |
Performance | <Click Here> | How the fund has done over time. |
Management's Discussion of Fund Performance | <Click Here> | The Portfolio Manager's review of fund performance and strategy. |
Shareholder Expense Example | <Click Here> | An example of shareholder expenses. |
Investment Changes | <Click Here> | A summary of major shifts in the fund's investments over the past six months. |
Investments | <Click Here> | A complete list of the fund's investments with their market values. |
Financial Statements | <Click Here> | Statements of assets and liabilities, operations, and changes in net assets,
as well as financial highlights. |
Notes | <Click Here> | Notes to the financial statements. |
Report of Independent Registered Public Accounting Firm | <Click Here> | |
Trustees and Officers | <Click Here> | |
Distributions | <Click Here> | |
Board Approval of Investment Advisory Contracts and Management Fees | <Click Here> | |
To view a fund's proxy voting guidelines and proxy voting record for the 12-month period ended June 30, visit http://www.fidelity.com/proxyvotingresults or visit the Securities and Exchange Commission's (SEC) web site at http://www.sec.gov. You may also call 1-800-544-8544 to request a free copy of the proxy voting guidelines.
Standard & Poor's, S&P and S&P 500 are registered service marks of The McGraw-Hill Companies, Inc. and have been licensed for use by Fidelity Distributors Corporation.
Other third party marks appearing herein are the property of their respective owners.
All other marks appearing herein are registered or unregistered trademarks or service marks of FMR LLC or an affiliated company.
Annual Report
This report and the financial statements contained herein are submitted for the general information of the shareholders of the fund. This report is not authorized for distribution to prospective investors in the fund unless preceded or accompanied by an effective prospectus.
A fund files its complete schedule of portfolio holdings with the SEC for the first and third quarters of each fiscal year on Form N-Q. Forms N-Q are available on the SEC's web site at http://www.sec.gov. A fund's Forms N-Q may be reviewed and copied at the SEC's Public Reference Room in Washington, DC. Information regarding the operation of the SEC's Public Reference Room may be obtained by calling 1-800-SEC-0330. For a complete list of a fund's portfolio holdings, view the most recent holdings listing, semiannual report, or annual report on Fidelity's web site at http://www.fidelity.com, http://www.advisor.fidelity.com, or http://www.401k.com, as applicable.
NOT FDIC INSURED • MAY LOSE VALUE • NO BANK GUARANTEE
Neither the fund nor Fidelity Distributors Corporation is a bank.
Annual Report
(photo_of_James_C_Curvey)
Dear Shareholder:
The second half of 2011 began with U.S. equities continuing to give back some of the gains achieved earlier in the year. In the days leading up to July 31, markets were shaken by a political stalemate in which Congress struggled to address the debt ceiling issue before an early-August deadline. The resulting uncertainty held back markets in July, the third consecutive monthly decline for equities, effectively reversing the positive momentum seen through the end of April. Financial markets are always unpredictable, of course, but there are several time-tested investment principles that can help put the odds in your favor.
One of the basic tenets is to invest for the long term. Over time, riding out the markets' inevitable ups and downs has proven much more effective than selling into panic or chasing the hottest trend. Even missing only a few of the markets' best days can significantly diminish investor returns. Patience also affords the benefits of compounding - of earning interest on additional income or reinvested dividends and capital gains. There can be tax advantages and cost benefits to consider as well. While staying the course doesn't eliminate risk, it can considerably lessen the effect of short-term declines.
You can further manage your investing risk through diversification. And today, more than ever, geographic diversification should be taken into account. Studies indicate that asset allocation is the single most important determinant of a portfolio's long-term success. The right mix of stocks, bonds and cash - aligned to your particular risk tolerance and investment objective - is very important. Age-appropriate rebalancing is also an essential aspect of asset allocation. For younger investors, an emphasis on equities - which historically have been the best-performing asset class over time - is encouraged. As investors near their specific goal, such as retirement or sending a child to college, consideration may be given to replacing volatile assets (e.g. common stocks) with more-stable fixed investments (bonds or savings plans).
A third principle - investing regularly - can help lower the average cost of your purchases. Investing a certain amount of money each month or quarter helps ensure you won't pay for all your shares at market highs. This strategy - known as dollar cost averaging - also reduces "emotion" from investing, helping shareholders avoid selling weak performers just prior to an upswing, or chasing a hot performer just before a correction.
We invite you to contact us via the Internet, through our Investor Centers or by phone. It is our privilege to provide you the information you need to make the investments that are right for you.
Sincerely,
(The acting chairman's signature appears here.)
James C. Curvey
Acting Chairman
Annual Report
Average annual total return reflects the change in the value of an investment, assuming reinvestment of the class' distributions from dividend income and capital gains (the profits earned upon the sale of securities that have grown in value, if any) and assuming a constant rate of performance each year. The $10,000 table and the fund's returns do not reflect the deduction of taxes that a shareholder would pay on fund distributions or the redemption of fund shares. During periods of reimbursement by Fidelity, a fund's total return will be greater than it would be had the reimbursement not occurred. How a fund did yesterday is no guarantee of how it will do tomorrow.
Average Annual Total Returns
Periods ended July 31, 2011 | Past 1
year | Past 5
years | Life of
fundA |
Fidelity® Small Cap Value Fund | 17.03% | 6.09% | 9.38% |
A From November 3, 2004.
$10,000 Over Life of Fund
Let's say hypothetically that $10,000 was invested in Fidelity® Small Cap Value Fund, a class of the fund, on November 3, 2004, when the fund started. The chart shows how the value of your investment would have changed, and also shows how the Russell 2000® Value Index performed over the same period.
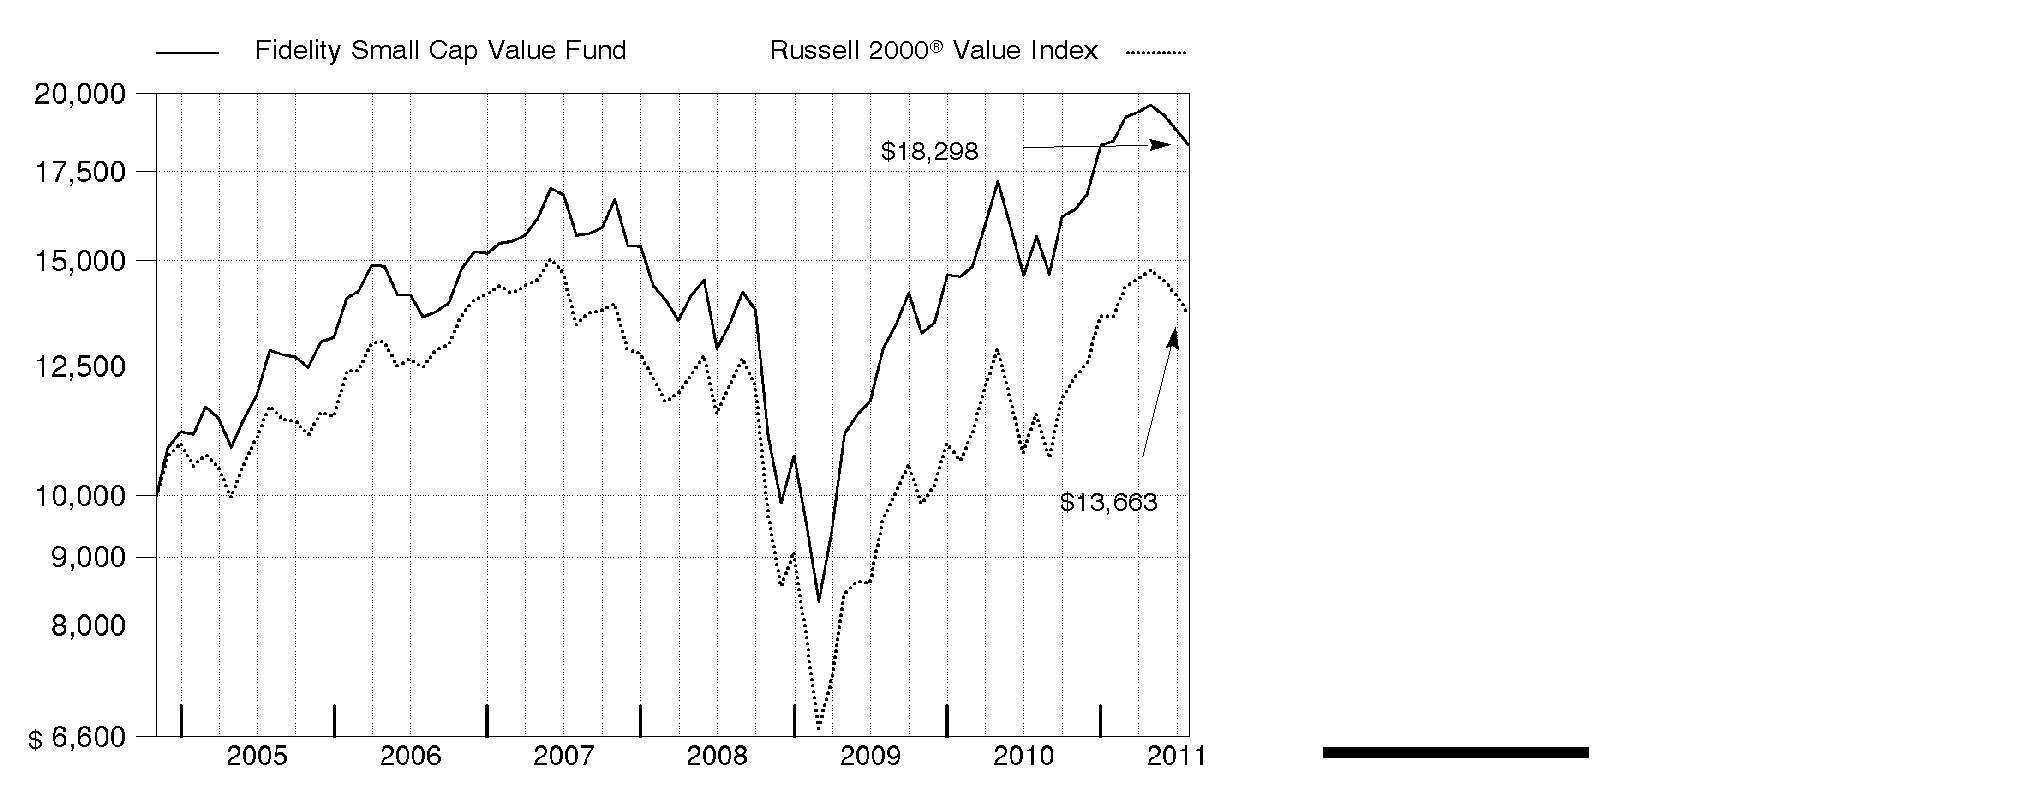
Annual Report
Market Recap: U.S. stocks registered solid double-digit gains for the 12 months ending July 31, 2011, extending a rally that began more than two years earlier. Despite a rough start in August 2010, markets turned positive in September, as increased demand for capital goods and other upbeat indicators trumped investor worry about a U.S. recessionary relapse. The broad market, as measured by the S&P 500® Index, rose 9% that month, its biggest September gain in 71 years. Seven more monthly advances followed, fueled by encouraging corporate earnings and economic activity. However, volatility picked up in the period's latter months, as markets reacted to continued high U.S. unemployment, nagging debt troubles in Europe and looming legislative battles over the federal debt ceiling. May unemployment rose above 9% for the first time in 2011, contributing to a traditional "June swoon" for stocks. Market uncertainty lingered in July, when the S&P 500® posted its second-biggest monthly loss of the period. For the full year, the S&P 500® climbed 19.65%, while the blue-chip-laden Dow Jones Industrial AverageSM rose a comparable 19.09% and the technology-heavy Nasdaq Composite® Index gained 23.40%. On the capitalization spectrum, stocks of mid-cap companies fared best, with the Russell Midcap® Index rising 24.51% and the small-cap Russell 2000® Index adding 23.92%.
Comments from Charles Myers, Portfolio Manager of Fidelity® Small Cap Value Fund: For the year, the fund's Retail Class shares gained 17.03%, versus 18.55% for the Russell 2000® Value Index. The consumer discretionary sector hurt performance, mainly due to poor stock selection in the consumer services and durables/apparel industries. An overweighting in the latter group also detracted. Another source of weakness was the financials sector, particularly banks and insurance stocks - including banks TCF Financial and Astoria Financial and reinsurer Platinum Underwriters Holdings - whose underperformance outweighed the favorable impact of my picks in the diversified financials industry. Banks were hurt by weak loan growth, while reinsurance companies were hampered by payouts for several costly disasters. Other detractors included commercial furniture maker HNI and homebuilder M.D.C. Holdings. On the positive side, stock selection in energy was very strong, led by Berry Petroleum and Superior Energy Services, both of which benefited from high oil prices. Positioning in industrials also helped, especially an investment in electrical distributor WESCO International. In health care, TeamHealth Holdings did very well. Many of the stocks I've mentioned were not in the index.
The views expressed above reflect those of the portfolio manager(s) only through the end of the period as stated on the cover of this report and do not necessarily represent the views of Fidelity or any other person in the Fidelity organization. Any such views are subject to change at any time based upon market or other conditions and Fidelity disclaims any responsibility to update such views. These views may not be relied on as investment advice and, because investment decisions for a Fidelity fund are based on numerous factors, may not be relied on as an indication of trading intent on behalf of any Fidelity fund.
Annual Report
Shareholder Expense Example
As a shareholder of the Fund, you incur two types of costs: (1) transaction costs, including sales charges (loads) on purchase payments or redemption proceeds, redemption fees, and (2) ongoing costs, including management fees, distribution and/or service (12b-1) fees and other Fund expenses. This Example is intended to help you understand your ongoing costs (in dollars) of investing in the Fund and to compare these costs with the ongoing costs of investing in other mutual funds.
The Example is based on an investment of $1,000 invested at the beginning of the period and held for the entire period (February 1, 2011 to July 31, 2011).
Actual Expenses
The first line of the accompanying table for each class of the Fund provides information about actual account values and actual expenses. You may use the information in this line, together with the amount you invested, to estimate the expenses that you paid over the period. Simply divide your account value by $1,000.00 (for example, an $8,600 account value divided by $1,000.00 = 8.6), then multiply the result by the number in the first line for a class of the Fund under the heading entitled "Expenses Paid During Period" to estimate the expenses you paid on your account during this period. A small balance maintenance fee of $12.00 that is charged once a year may apply for certain accounts with a value of less than $2,000. This fee is not included in the table below. If it was, the estimate of expenses you paid during the period would be higher, and your ending account value lower, by this amount. In addition, the Fund, as a shareholder in the underlying Fidelity Central Funds, will indirectly bear its pro-rata share of the fees and expenses incurred by the underlying Fidelity Central Funds. These fees and expenses are not included in the Fund's annualized expense ratio used to calculate the expense estimate in the table below.
Hypothetical Example for Comparison Purposes
The second line of the accompanying table for each class of the Fund provides information about hypothetical account values and hypothetical expenses based on a Class' actual expense ratio and an assumed rate of return of 5% per year before expenses, which is not the Class' actual return. The hypothetical account values and expenses may not be used to estimate the actual ending account balance or expenses you paid for the period. You may use this information to compare the ongoing costs of investing in the Fund and other funds. To do so, compare this 5% hypothetical example with the 5% hypothetical examples that appear in the shareholder reports of the other funds. A small balance maintenance fee of $12.00 that is charged once a year may apply for certain accounts with a value of less than $2,000. This fee is not included in the table below. If it was, the estimate of expenses you paid during the period would be higher, and your ending account value lower, by this amount. In addition, the Fund, as a shareholder in the underlying Fidelity Central Funds, will indirectly bear its pro-rata share of the fees and expenses incurred by the underlying Fidelity Central Funds. These fees and expenses are not included in the Fund's annualized expense ratio used to calculate the expense estimate in the table below.
Annual Report
Shareholder Expense Example - continued
Please note that the expenses shown in the table are meant to highlight your ongoing costs only and do not reflect any transaction costs. Therefore, the second line of the table is useful in comparing ongoing costs only, and will not help you determine the relative total costs of owning different funds. In addition, if these transactional costs were included, your costs would have been higher.
| Annualized
Expense
Ratio | Beginning
Account Value
February 1, 2011 | Ending
Account Value
July 31, 2011 | Expenses Paid
During Period*
February 1, 2011
to July 31, 2011 |
Class A | 1.44% | | | |
Actual | | $ 1,000.00 | $ 992.30 | $ 7.11 |
HypotheticalA | | $ 1,000.00 | $ 1,017.65 | $ 7.20 |
Class T | 1.69% | | | |
Actual | | $ 1,000.00 | $ 991.00 | $ 8.34 |
HypotheticalA | | $ 1,000.00 | $ 1,016.41 | $ 8.45 |
Class B | 2.20% | | | |
Actual | | $ 1,000.00 | $ 988.10 | $ 10.84 |
HypotheticalA | | $ 1,000.00 | $ 1,013.88 | $ 10.99 |
Class C | 2.18% | | | |
Actual | | $ 1,000.00 | $ 988.80 | $ 10.75 |
HypotheticalA | | $ 1,000.00 | $ 1,013.98 | $ 10.89 |
Small Cap Value | 1.11% | | | |
Actual | | $ 1,000.00 | $ 993.60 | $ 5.49 |
HypotheticalA | | $ 1,000.00 | $ 1,019.29 | $ 5.56 |
Class F | .88% | | | |
Actual | | $ 1,000.00 | $ 994.30 | $ 4.35 |
HypotheticalA | | $ 1,000.00 | $ 1,020.43 | $ 4.41 |
Institutional Class | 1.10% | | | |
Actual | | $ 1,000.00 | $ 993.60 | $ 5.44 |
HypotheticalA | | $ 1,000.00 | $ 1,019.34 | $ 5.51 |
A 5% return per year before expenses
* Expenses are equal to each Class' annualized expense ratio, multiplied by the average account value over the period, multiplied by 181/365 (to reflect the one-half year period).
Annual Report
Investment Changes (Unaudited)
Top Ten Stocks as of July 31, 2011 |
| % of fund's
net assets | % of fund's net assets
6 months ago |
Berry Petroleum Co. Class A | 3.4 | 3.4 |
DCT Industrial Trust, Inc. | 3.0 | 2.7 |
Superior Energy Services, Inc. | 2.8 | 3.3 |
WESCO International, Inc. | 2.7 | 3.3 |
MEDNAX, Inc. | 2.7 | 1.8 |
Highwoods Properties, Inc. (SBI) | 2.6 | 2.4 |
UGI Corp. | 2.6 | 2.6 |
United Stationers, Inc. | 2.5 | 2.3 |
TCF Financial Corp. | 2.4 | 2.8 |
Regis Corp. | 2.4 | 1.5 |
| 27.1 | |
Top Five Market Sectors as of July 31, 2011 |
| % of fund's
net assets | % of fund's net assets
6 months ago |
Financials | 35.2 | 37.0 |
Industrials | 12.5 | 13.0 |
Consumer Discretionary | 11.9 | 10.7 |
Information Technology | 11.6 | 9.2 |
Health Care | 8.3 | 7.1 |
Asset Allocation (% of fund's net assets) |
As of July 31, 2011* | As of January 31, 2011** |
| Stocks 99.7% | | | Stocks 99.1% | |
| Short-Term
Investments and
Net Other Assets 0.3% | | | Short-Term
Investments and
Net Other Assets 0.9% | |
* Foreign investments | 8.3% | | ** Foreign investments | 9.9% | |

Annual Report
Investments July 31, 2011
Showing Percentage of Net Assets
Common Stocks - 98.4% |
| Shares | | Value |
CONSUMER DISCRETIONARY - 11.4% |
Diversified Consumer Services - 3.4% |
Matthews International Corp. Class A | 740,187 | | $ 26,787,368 |
Regis Corp. (d)(e) | 4,045,824 | | 60,080,486 |
| | 86,867,854 |
Household Durables - 4.7% |
M.D.C. Holdings, Inc. (d)(e) | 2,424,300 | | 54,813,423 |
Meritage Homes Corp. (a) | 1,536,160 | | 33,565,096 |
Ryland Group, Inc. (d) | 2,153,837 | | 31,726,019 |
| | 120,104,538 |
Specialty Retail - 3.3% |
Asbury Automotive Group, Inc. (a) | 1,465,159 | | 31,544,873 |
Ascena Retail Group, Inc. (a) | 960,700 | | 31,049,824 |
Tsutsumi Jewelry Co. Ltd. | 791,400 | | 20,081,910 |
| | 82,676,607 |
TOTAL CONSUMER DISCRETIONARY | | 289,648,999 |
CONSUMER STAPLES - 2.9% |
Food & Staples Retailing - 0.4% |
Ingles Markets, Inc. Class A (e) | 664,024 | | 10,225,970 |
Food Products - 2.5% |
Chiquita Brands International, Inc. (a) | 2,070,900 | | 24,519,456 |
Dean Foods Co. (a) | 3,500,000 | | 38,570,000 |
| | 63,089,456 |
TOTAL CONSUMER STAPLES | | 73,315,426 |
ENERGY - 6.2% |
Energy Equipment & Services - 2.8% |
Superior Energy Services, Inc. (a) | 1,741,700 | | 72,263,133 |
Oil, Gas & Consumable Fuels - 3.4% |
Berry Petroleum Co. Class A | 1,500,000 | | 86,025,000 |
TOTAL ENERGY | | 158,288,133 |
FINANCIALS - 34.4% |
Capital Markets - 2.6% |
Knight Capital Group, Inc. Class A (a) | 2,029,826 | | 22,957,332 |
Waddell & Reed Financial, Inc. Class A | 1,210,000 | | 44,407,000 |
| | 67,364,332 |
Common Stocks - continued |
| Shares | | Value |
FINANCIALS - continued |
Commercial Banks - 10.8% |
Associated Banc-Corp. | 3,832,650 | | $ 52,315,673 |
CapitalSource, Inc. | 6,515,270 | | 42,088,644 |
City National Corp. | 784,900 | | 42,133,432 |
National Penn Bancshares, Inc. | 3,766,604 | | 30,283,496 |
PacWest Bancorp (e) | 1,857,600 | | 36,873,360 |
TCF Financial Corp. (d) | 4,855,800 | | 61,765,776 |
Western Liberty Bancorp (a)(e) | 2,400,000 | | 7,248,000 |
| | 272,708,381 |
Insurance - 7.2% |
Alterra Capital Holdings Ltd. | 2,357,411 | | 51,367,986 |
Aspen Insurance Holdings Ltd. | 1,320,200 | | 34,193,180 |
Platinum Underwriters Holdings Ltd. | 1,576,975 | | 54,169,091 |
ProAssurance Corp. (a) | 600,000 | | 41,790,000 |
| | 181,520,257 |
Real Estate Investment Trusts - 9.3% |
Alexandria Real Estate Equities, Inc. | 219,100 | | 17,966,200 |
American Assets Trust, Inc. | 225,200 | | 4,952,148 |
DCT Industrial Trust, Inc. (d)(e) | 13,830,586 | | 74,961,776 |
Franklin Street Properties Corp. (d) | 3,160,000 | | 39,847,600 |
Highwoods Properties, Inc. (SBI) (d) | 1,940,330 | | 66,805,562 |
National Retail Properties, Inc. (d) | 1,240,000 | | 31,111,600 |
| | 235,644,886 |
Thrifts & Mortgage Finance - 4.5% |
Astoria Financial Corp. | 4,818,152 | | 56,131,471 |
Washington Federal, Inc. | 3,486,175 | | 58,951,219 |
| | 115,082,690 |
TOTAL FINANCIALS | | 872,320,546 |
HEALTH CARE - 8.3% |
Health Care Providers & Services - 8.3% |
Centene Corp. (a) | 1,324,832 | | 43,467,738 |
Chemed Corp. | 510,200 | | 31,025,262 |
MEDNAX, Inc. (a) | 981,500 | | 66,899,040 |
Providence Service Corp. (a)(e) | 1,016,495 | | 12,045,466 |
Team Health Holdings, Inc. (a) | 2,565,700 | | 56,471,057 |
| | 209,908,563 |
Common Stocks - continued |
| Shares | | Value |
INDUSTRIALS - 12.5% |
Commercial Services & Supplies - 6.3% |
ACCO Brands Corp. (a) | 2,420,000 | | $ 20,739,400 |
HNI Corp. (d)(e) | 2,349,671 | | 49,131,621 |
Knoll, Inc. | 1,412,898 | | 25,785,389 |
United Stationers, Inc. | 1,980,800 | | 63,563,872 |
| | 159,220,282 |
Machinery - 2.3% |
Blount International, Inc. (a)(e) | 2,604,723 | | 43,316,543 |
Columbus McKinnon Corp. (NY Shares) (a) | 960,000 | | 15,792,000 |
| | 59,108,543 |
Trading Companies & Distributors - 3.9% |
H&E Equipment Services, Inc. (a)(e) | 2,439,408 | | 29,272,896 |
WESCO International, Inc. (a) | 1,350,000 | | 68,431,500 |
| | 97,704,396 |
TOTAL INDUSTRIALS | | 316,033,221 |
INFORMATION TECHNOLOGY - 11.6% |
Communications Equipment - 1.4% |
ViaSat, Inc. (a) | 809,472 | | 36,369,577 |
Electronic Equipment & Components - 6.4% |
Ingram Micro, Inc. Class A (a) | 2,753,100 | | 51,070,005 |
Macnica, Inc. | 677,400 | | 16,168,178 |
Ryoyo Electro Corp. (e) | 1,972,700 | | 19,684,709 |
SYNNEX Corp. (a) | 675,710 | | 19,136,107 |
Tech Data Corp. (a) | 1,189,600 | | 55,518,632 |
| | 161,577,631 |
Internet Software & Services - 1.8% |
DealerTrack Holdings, Inc. (a) | 1,083,804 | | 25,133,415 |
j2 Global Communications, Inc. | 730,149 | | 19,524,184 |
| | 44,657,599 |
Semiconductors & Semiconductor Equipment - 0.6% |
Miraial Co. Ltd. (e) | 720,200 | | 15,046,860 |
Software - 1.4% |
Monotype Imaging Holdings, Inc. (a)(e) | 2,583,700 | | 35,396,690 |
TOTAL INFORMATION TECHNOLOGY | | 293,048,357 |
Common Stocks - continued |
| Shares | | Value |
MATERIALS - 4.7% |
Metals & Mining - 4.7% |
Carpenter Technology Corp. | 834,380 | | $ 47,926,787 |
Haynes International, Inc. (e) | 675,317 | | 42,301,857 |
RTI International Metals, Inc. (a) | 870,997 | | 27,932,874 |
| | 118,161,518 |
UTILITIES - 6.4% |
Electric Utilities - 2.2% |
Westar Energy, Inc. (d) | 2,160,000 | | 55,749,600 |
Gas Utilities - 4.2% |
Southwest Gas Corp. | 1,130,989 | | 42,174,580 |
UGI Corp. | 2,150,000 | | 65,145,000 |
| | 107,319,580 |
TOTAL UTILITIES | | 163,069,180 |
TOTAL COMMON STOCKS (Cost $2,112,389,704) | 2,493,793,943 |
Nonconvertible Preferred Stocks - 1.3% |
| | | |
CONSUMER DISCRETIONARY - 0.5% |
Household Durables - 0.5% |
M/I Homes, Inc. Series A, 9.75% (a) | 750,400 | | 12,006,400 |
FINANCIALS - 0.8% |
Real Estate Investment Trusts - 0.8% |
Developers Diversified Realty Corp. (depositary shares) Series H, 7.375% | 818,790 | | 19,953,912 |
TOTAL NONCONVERTIBLE PREFERRED STOCKS (Cost $20,354,770) | 31,960,312 |
Money Market Funds - 4.6% |
| Shares | | Value |
Fidelity Cash Central Fund, 0.14% (b) | 13,763,496 | | $ 13,763,496 |
Fidelity Securities Lending Cash Central Fund, 0.15% (b)(c) | 102,468,175 | | 102,468,175 |
TOTAL MONEY MARKET FUNDS (Cost $116,231,671) | 116,231,671 |
TOTAL INVESTMENT PORTFOLIO - 104.3% (Cost $2,248,976,145) | | 2,641,985,926 |
NET OTHER ASSETS (LIABILITIES) - (4.3)% | | (108,404,928) |
NET ASSETS - 100% | $ 2,533,580,998 |
Legend |
(a) Non-income producing |
(b) Affiliated fund that is available only to investment companies and other accounts managed by Fidelity Investments. The rate quoted is the annualized seven-day yield of the fund at period end. A complete unaudited listing of the fund's holdings as of its most recent quarter end is available upon request. In addition, each Fidelity Central Fund's financial statements, which are not covered by the Fund's Report of Independent Registered Public Accounting Firm, are available on the SEC's website or upon request. |
(c) Investment made with cash collateral received from securities on loan. |
(d) Security or a portion of the security is on loan at period end. |
(e) Affiliated company |
Affiliated Central Funds |
Information regarding fiscal year to date income earned by the Fund from investments in Fidelity Central Funds is as follows: |
Fund | Income earned |
Fidelity Cash Central Fund | $ 20,932 |
Fidelity Securities Lending Cash Central Fund | 121,080 |
Total | $ 142,012 |
Other Affiliated Issuers |
An affiliated company is a company in which the Fund has ownership of at least 5% of the voting securities. Fiscal year to date transactions with companies which are or were affiliates are as follows: |
Affiliate | Value,
beginning of
period | Purchases | Sales
Proceeds | Dividend
Income | Value,
end of
period |
ACCO Brands Corp. | $ 22,027,864 | $ 1,922,616 | $ 12,330,836 | $ - | $ - |
Blount International, Inc. | 27,740,300 | - | - | - | 43,316,543 |
Columbus McKinnon Corp. (NY Shares) | - | 19,267,200 | - | - | - |
DCT Industrial Trust, Inc. | 46,900,000 | 19,790,290 | - | 1,656,573 | 74,961,776 |
H&E Equipment Services, Inc. | 30,357,850 | - | 20,687,104 | - | 29,272,896 |
Haynes International, Inc. | - | 33,108,436 | - | 183,909 | 42,301,857 |
HNI Corp. | 55,547,499 | 5,138,794 | - | 2,048,207 | 49,131,621 |
Ingles Markets, Inc. Class A | 13,634,514 | - | 3,506,026 | 475,816 | 10,225,970 |
M.D.C. Holdings, Inc. | 35,651,616 | 32,061,128 | - | 1,524,300 | 54,813,423 |
Miraial Co. Ltd. | 15,372,473 | 3,618,630 | - | 502,071 | 15,046,860 |
Monotype Imaging Holdings, Inc. | 11,299,816 | 12,600,234 | - | - | 35,396,690 |
PacWest Bancorp | 37,552,606 | 1,164,578 | - | 73,220 | 36,873,360 |
Providence Service Corp. | 14,637,528 | - | - | - | 12,045,466 |
Regis Corp. | 41,819,783 | 36,022,139 | 15,089,522 | 575,173 | 60,080,486 |
RTI International Metals, Inc. | 48,035,903 | - | 23,272,802 | - | - |
Ryoyo Electro Corp. | 18,932,046 | 2,120,893 | - | 687,612 | 19,684,709 |
TradeStation Group, Inc. | 13,178,039 | - | 19,917,635 | - | - |
Western Liberty Bancorp | 14,976,000 | - | - | - | 7,248,000 |
Total | $ 447,663,837 | $ 166,814,938 | $ 94,803,925 | $ 7,726,881 | $ 490,399,657 |
Other Information |
All investments are categorized as Level 1 under the Fair Value Hierarchy. The inputs or methodology used for valuing securities may not be an indication of the risk associated with investing in those securities. For more information on valuation inputs, please refer to the Security Valuation section in the accompanying Notes to Financial Statements. |
See accompanying notes which are an integral part of the financial statements.
Annual Report
Statement of Assets and Liabilities
| July 31, 2011 |
| | |
Assets | | |
Investment in securities, at value (including securities loaned of $99,483,856) - See accompanying schedule: Unaffiliated issuers (cost $1,664,327,198) | $ 2,035,354,598 | |
Fidelity Central Funds (cost $116,231,671) | 116,231,671 | |
Other affiliated issuers (cost $468,417,276) | 490,399,657 | |
Total Investments (cost $2,248,976,145) | | $ 2,641,985,926 |
Receivable for investments sold | | 174,323 |
Receivable for fund shares sold | | 3,317,218 |
Dividends receivable | | 2,265,074 |
Distributions receivable from Fidelity Central Funds | | 10,990 |
Other receivables | | 49,926 |
Total assets | | 2,647,803,457 |
| | |
Liabilities | | |
Payable for investments purchased | $ 1,298,673 | |
Payable for fund shares redeemed | 7,914,722 | |
Accrued management fee | 1,855,015 | |
Distribution and service plan fees payable | 103,978 | |
Other affiliated payables | 528,715 | |
Other payables and accrued expenses | 53,181 | |
Collateral on securities loaned, at value | 102,468,175 | |
Total liabilities | | 114,222,459 |
| | |
Net Assets | | $ 2,533,580,998 |
Net Assets consist of: | | |
Paid in capital | | $ 2,012,724,102 |
Accumulated undistributed net realized gain (loss) on investments and foreign currency transactions | | 127,839,572 |
Net unrealized appreciation (depreciation) on investments and assets and liabilities in foreign currencies | | 393,017,324 |
Net Assets | | $ 2,533,580,998 |
See accompanying notes which are an integral part of the financial statements.
Annual Report
Statement of Assets and Liabilities - continued
| July 31, 2011 |
| | |
Calculation of Maximum Offering Price
Class A:
Net Asset Value and redemption price per share
($140,706,656 ÷ 9,092,403 shares) | | $ 15.48 |
| | |
Maximum offering price per share (100/94.25 of $15.48) | | $ 16.42 |
Class T:
Net Asset Value and redemption price per share ($55,845,206 ÷ 3,640,410 shares) | | $ 15.34 |
| | |
Maximum offering price per share (100/96.50 of $15.34) | | $ 15.90 |
Class B:
Net Asset Value and offering price per share ($8,548,930 ÷ 569,799 shares)A | | $ 15.00 |
| | |
Class C:
Net Asset Value and offering price per share ($47,457,202 ÷ 3,162,480 shares)A | | $ 15.01 |
| | |
| | |
Small Cap Value:
Net Asset Value, offering price and redemption price per share ($1,899,804,971 ÷ 121,599,609 shares) | | $ 15.62 |
| | |
Class F:
Net Asset Value, offering price and redemption price per share ($279,652,893 ÷ 17,875,122 shares) | | $ 15.64 |
| | |
Institutional Class:
Net Asset Value, offering price and redemption price per share ($101,565,140 ÷ 6,496,759 shares) | | $ 15.63 |
A Redemption price per share is equal to net asset value less any applicable contingent deferred sales charge.
See accompanying notes which are an integral part of the financial statements.
Annual Report
Financial Statements - continued
Statement of Operations
| Year ended July 31, 2011 |
| | |
Investment Income | | |
Dividends (including $7,726,881 earned from other affiliated issuers) | | $ 27,691,950 |
Special dividends | | 9,360,000 |
Interest | | 82 |
Income from Fidelity Central Funds | | 142,012 |
Total income | | 37,194,044 |
| | |
Expenses | | |
Management fee
Basic fee | $ 17,642,979 | |
Performance adjustment | 3,308,761 | |
Transfer agent fees | 5,701,385 | |
Distribution and service plan fees | 1,163,925 | |
Accounting and security lending fees | 761,810 | |
Custodian fees and expenses | 41,873 | |
Independent trustees' compensation | 13,098 | |
Registration fees | 144,204 | |
Audit | 59,297 | |
Legal | 9,329 | |
Interest | 1,171 | |
Miscellaneous | 25,364 | |
Total expenses before reductions | 28,873,196 | |
Expense reductions | (44,627) | 28,828,569 |
Net investment income (loss) | | 8,365,475 |
Realized and Unrealized Gain (Loss) Net realized gain (loss) on: | | |
Investment securities: | | |
Unaffiliated issuers | 159,718,329 | |
Other affiliated issuers | (4,266,450) | |
Foreign currency transactions | 29,684 | |
Total net realized gain (loss) | | 155,481,563 |
Change in net unrealized appreciation (depreciation) on: Investment securities | 203,702,039 | |
Assets and liabilities in foreign currencies | (584) | |
Total change in net unrealized appreciation (depreciation) | | 203,701,455 |
Net gain (loss) | | 359,183,018 |
Net increase (decrease) in net assets resulting from operations | | $ 367,548,493 |
See accompanying notes which are an integral part of the financial statements.
Annual Report
Statement of Changes in Net Assets
| Year ended
July 31,
2011 | Year ended
July 31,
2010 |
Increase (Decrease) in Net Assets | | |
Operations | | |
Net investment income (loss) | $ 8,365,475 | $ 6,962,574 |
Net realized gain (loss) | 155,481,563 | 188,495,963 |
Change in net unrealized appreciation (depreciation) | 203,701,455 | 137,333,657 |
Net increase (decrease) in net assets resulting
from operations | 367,548,493 | 332,792,194 |
Distributions to shareholders from net investment income | (16,151,065) | (6,560,137) |
Distributions to shareholders from net realized gain | (20,051,059) | - |
Total distributions | (36,202,124) | (6,560,137) |
Share transactions - net increase (decrease) | 54,629,275 | 209,101,603 |
Redemption fees | 445,888 | 534,282 |
Total increase (decrease) in net assets | 386,421,532 | 535,867,942 |
| | |
Net Assets | | |
Beginning of period | 2,147,159,466 | 1,611,291,524 |
End of period (including undistributed net investment of $0 and undistributed net investment income of $5,209,766, respectively) | $ 2,533,580,998 | $ 2,147,159,466 |
See accompanying notes which are an integral part of the financial statements.
Annual Report
Financial Highlights - Class A
Years ended July 31, | 2011 | 2010 | 2009 | 2008 | 2007 |
Selected Per-Share Data | | | | | |
Net asset value, beginning of period | $ 13.45 | $ 11.13 | $ 11.82 | $ 14.34 | $ 13.17 |
Income from Investment Operations | | | | | |
Net investment income (loss) C | .01 F | .02 G | .08 | (.01) | (.06) |
Net realized and unrealized gain (loss) | 2.22 | 2.33 | (.60) | (1.98) | 1.90 |
Total from investment operations | 2.23 | 2.35 | (.52) | (1.99) | 1.84 |
Distributions from net investment income | (.08) | (.03) | (.06) | - | - |
Distributions from net realized gain | (.12) | - | (.11) | (.53) | (.67) |
Total distributions | (.20) | (.03) | (.17) | (.53) | (.67) |
Redemption fees added to paid in capital C,I | - | - | - | - | - |
Net asset value, end of period | $ 15.48 | $ 13.45 | $ 11.13 | $ 11.82 | $ 14.34 |
Total Return A,B | 16.72% | 21.16% | (4.37)% | (14.35)% | 14.59% |
Ratios to Average Net Assets D,H | | | | | |
Expenses before reductions | 1.44% | 1.47% | 1.45% | 1.43% | 1.45% |
Expenses net of fee waivers, if any | 1.43% | 1.40% | 1.40% | 1.40% | 1.40% |
Expenses net of all reductions | 1.43% | 1.39% | 1.40% | 1.40% | 1.40% |
Net investment income (loss) | .06% F | .17% G | .81% | (.05)% | (.44)% |
Supplemental Data | | | | | |
Net assets, end of period (000 omitted) | $ 140,707 | $ 96,994 | $ 55,029 | $ 52,446 | $ 61,357 |
Portfolio turnover rate E | 22% | 49% | 51% | 149% | 67% |
A Total returns would have been lower if certain expenses had not been reduced during the applicable periods shown.
B Total returns do not include the effect of the sales charges.
C Calculated based on average shares outstanding during the period.
D Fees and expenses of any underlying Fidelity Central Funds are not included in the Fund's expense ratio. The Fund indirectly bears its proportionate share of the expenses of any underlying Fidelity Central Funds.
E Amount does not include the portfolio activity of any underlying Fidelity Central Funds.
F Investment income per share reflects a special dividend which amounted to $.06 per share. Excluding the special dividend, the ratio of net investment income (loss) to average net assets would have been (.31)%.
G Investment income per share reflects a special dividend which amounted to $.03 per share. Excluding the special dividend, the ratio of net investment income (loss) to average net assets would have been (.10)%.
H Expense ratios reflect operating expenses of the class. Expenses before reductions do not reflect amounts reimbursed by the investment adviser or reductions from brokerage service arrangements or reductions from other expense offset arrangements and do not represent the amount paid by the class during periods when reimbursements or reductions occur. Expenses net of fee waivers reflect expenses after reimbursement by the investment adviser but prior to reductions from brokerage service arrangements or other expense offset arrangements. Expenses net of all reductions represent the net expenses paid by the class.
I Amount represents less than $.01 per share.
See accompanying notes which are an integral part of the financial statements.
Annual Report
Financial Highlights - Class T
Years ended July 31, | 2011 | 2010 | 2009 | 2008 | 2007 |
Selected Per-Share Data | | | | | |
Net asset value, beginning of period | $ 13.34 | $ 11.05 | $ 11.74 | $ 14.28 | $ 13.13 |
Income from Investment Operations | | | | | |
Net investment income (loss) C | (.03) F | (.01) G | .05 | (.04) | (.10) |
Net realized and unrealized gain (loss) | 2.20 | 2.31 | (.59) | (1.97) | 1.90 |
Total from investment operations | 2.17 | 2.30 | (.54) | (2.01) | 1.80 |
Distributions from net investment income | (.05) | (.01) | (.04) | - | - |
Distributions from net realized gain | (.12) | - | (.11) | (.53) | (.65) |
Total distributions | (.17) | (.01) | (.15) | (.53) | (.65) |
Redemption fees added to paid in capital C,I | - | - | - | - | - |
Net asset value, end of period | $ 15.34 | $ 13.34 | $ 11.05 | $ 11.74 | $ 14.28 |
Total ReturnA,B | 16.36% | 20.87% | (4.57)% | (14.58)% | 14.34% |
Ratios to Average Net Assets D,H | | | | | |
Expenses before reductions | 1.70% | 1.72% | 1.70% | 1.68% | 1.66% |
Expenses net of fee waivers, if any | 1.69% | 1.65% | 1.65% | 1.65% | 1.65% |
Expenses net of all reductions | 1.69% | 1.64% | 1.65% | 1.65% | 1.65% |
Net investment income (loss) | (.19)% F | (.08)% G | .56% | (.30)% | (.69)% |
Supplemental Data | | | | | |
Net assets, end of period (000 omitted) | $ 55,845 | $ 44,091 | $ 28,534 | $ 32,091 | $ 51,518 |
Portfolio turnover rate E | 22% | 49% | 51% | 149% | 67% |
A Total returns would have been lower if certain expenses had not been reduced during the applicable periods shown.
B Total returns do not include the effect of the sales charges.
C Calculated based on average shares outstanding during the period.
D Fees and expenses of any underlying Fidelity Central Funds are not included in the Fund's expense ratio. The Fund indirectly bears its proportionate share of the expenses of any underlying Fidelity Central Funds.
E Amount does not include the portfolio activity of any underlying Fidelity Central Funds.
F Investment income per share reflects a special dividend which amounted to $.06 per share. Excluding the special dividend, the ratio of net investment income (loss) to average net assets would have been (.57)%.
G Investment income per share reflects a special dividend which amounted to $.03 per share. Excluding the special dividend, the ratio of net investment income (loss) to average net assets would have been (.35)%.
H Expense ratios reflect operating expenses of the class. Expenses before reductions do not reflect amounts reimbursed by the investment adviser or reductions from brokerage service arrangements or reductions from other expense offset arrangements and do not represent the amount paid by the class during periods when reimbursements or reductions occur. Expenses net of fee waivers reflect expenses after reimbursement by the investment adviser but prior to reductions from brokerage service arrangements or other expense offset arrangements. Expenses net of all reductions represent the net expenses paid by the class.
I Amount represents less than $.01 per share.
See accompanying notes which are an integral part of the financial statements.
Annual Report
Financial Highlights - Class B
Years ended July 31, | 2011 | 2010 | 2009 | 2008 | 2007 |
Selected Per-Share Data | | | | | |
Net asset value, beginning of period | $ 13.08 | $ 10.88 | $ 11.60 | $ 14.19 | $ 13.07 |
Income from Investment Operations | | | | | |
Net investment income (loss) C | (.10) F | (.07) G | .01 | (.10) | (.17) |
Net realized and unrealized gain (loss) | 2.15 | 2.27 | (.59) | (1.96) | 1.90 |
Total from investment operations | 2.05 | 2.20 | (.58) | (2.06) | 1.73 |
Distributions from net investment income | (.01) | - | (.03) | - | - |
Distributions from net realized gain | (.12) | - | (.11) | (.53) | (.61) |
Total distributions | (.13) | - | (.14) | (.53) | (.61) |
Redemption fees added to paid in capital C,I | - | - | - | - | - |
Net asset value, end of period | $ 15.00 | $ 13.08 | $ 10.88 | $ 11.60 | $ 14.19 |
Total Return A,B | 15.80% | 20.22% | (5.05)% | (15.04)% | 13.78% |
Ratios to Average Net Assets D,H | | | | | |
Expenses before reductions | 2.20% | 2.22% | 2.20% | 2.18% | 2.20% |
Expenses net of fee waivers, if any | 2.19% | 2.15% | 2.15% | 2.15% | 2.15% |
Expenses net of all reductions | 2.19% | 2.14% | 2.15% | 2.15% | 2.15% |
Net investment income (loss) | (.69)% F | (.58)% G | .06% | (.80)% | (1.19)% |
Supplemental Data | | | | | |
Net assets, end of period (000 omitted) | $ 8,549 | $ 9,747 | $ 7,153 | $ 7,886 | $ 12,075 |
Portfolio turnover rate E | 22% | 49% | 51% | 149% | 67% |
A Total returns would have been lower if certain expenses had not been reduced during the applicable periods shown.
B Total returns do not include the effect of the contingent deferred sales charge.
C Calculated based on average shares outstanding during the period.
D Fees and expenses of any underlying Fidelity Central Funds are not included in the Fund's expense ratio. The Fund indirectly bears its proportionate share of the expenses of any underlying Fidelity Central Funds.
E Amount does not include the portfolio activity of any underlying Fidelity Central Funds.
F Investment income per share reflects a special dividend which amounted to $.06 per share. Excluding the special dividend, the ratio of net investment income (loss) to average net assets would have been (1.07)%.
G Investment income per share reflects a special dividend which amounted to $.03 per share. Excluding the special dividend, the ratio of net investment income (loss) to average net assets would have been (.85)%.
H Expense ratios reflect operating expenses of the class. Expenses before reductions do not reflect amounts reimbursed by the investment adviser or reductions from brokerage service arrangements or reductions from other expense offset arrangements and do not represent the amount paid by the class during periods when reimbursements or reductions occur. Expenses net of fee waivers reflect expenses after reimbursement by the investment adviser but prior to reductions from brokerage service arrangements or other expense offset arrangements. Expenses net of all reductions represent the net expenses paid by the class.
I Amount represents less than $.01 per share.
See accompanying notes which are an integral part of the financial statements.
Annual Report
Financial Highlights - Class C
Years ended July 31, | 2011 | 2010 | 2009 | 2008 | 2007 |
Selected Per-Share Data | | | | | |
Net asset value, beginning of period | $ 13.08 | $ 10.89 | $ 11.60 | $ 14.19 | $ 13.07 |
Income from Investment Operations | | | | | |
Net investment income (loss) C | (.10) F | (.07) G | .01 | (.10) | (.17) |
Net realized and unrealized gain (loss) | 2.17 | 2.26 | (.58) | (1.96) | 1.90 |
Total from investment operations | 2.07 | 2.19 | (.57) | (2.06) | 1.73 |
Distributions from net investment income | (.02) | - | (.03) | - | - |
Distributions from net realized gain | (.12) | - | (.11) | (.53) | (.61) |
Total distributions | (.14) | - | (.14) | (.53) | (.61) |
Redemption fees added to paid in capital C,I | - | - | - | - | - |
Net asset value, end of period | $ 15.01 | $ 13.08 | $ 10.89 | $ 11.60 | $ 14.19 |
Total ReturnA,B | 15.91% | 20.11% | (4.98)% | (15.04)% | 13.77% |
Ratios to Average Net Assets D,H | | | | | |
Expenses before reductions | 2.18% | 2.22% | 2.20% | 2.18% | 2.20% |
Expenses net of fee waivers, if any | 2.18% | 2.15% | 2.15% | 2.15% | 2.15% |
Expenses net of all reductions | 2.18% | 2.14% | 2.15% | 2.15% | 2.15% |
Net investment income (loss) | (.68)% F | (.58)% G | .06% | (.80)% | (1.19)% |
Supplemental Data | | | | | |
Net assets, end of period (000 omitted) | $ 47,457 | $ 37,346 | $ 21,345 | $ 20,924 | $ 34,155 |
Portfolio turnover rate E | 22% | 49% | 51% | 149% | 67% |
A Total returns would have been lower if certain expenses had not been reduced during the applicable periods shown.
B Total returns do not include the effect of the contingent deferred sales charge.
C Calculated based on average shares outstanding during the period.
D Fees and expenses of any underlying Fidelity Central Funds are not included in the Fund's expense ratio. The Fund indirectly bears its proportionate share of the expenses of any underlying Fidelity Central Funds.
E Amount does not include the portfolio activity of any underlying Fidelity Central Funds.
F Investment income per share reflects a special dividend which amounted to $.06 per share. Excluding the special dividend, the ratio of net investment income (loss) to average net assets would have been (1.06)%.
G Investment income per share reflects a special dividend which amounted to $.03 per share. Excluding the special dividend, the ratio of net investment income (loss) to average net assets would have been (.85)%.
H Expense ratios reflect operating expenses of the class. Expenses before reductions do not reflect amounts reimbursed by the investment adviser or reductions from brokerage service arrangements or reductions from other expense offset arrangements and do not represent the amount paid by the class during periods when reimbursements or reductions occur. Expenses net of fee waivers reflect expenses after reimbursement by the investment adviser but prior to reductions from brokerage service arrangements or other expense offset arrangements. Expenses net of all reductions represent the net expenses paid by the class.
I Amount represents less than $.01 per share.
See accompanying notes which are an integral part of the financial statements.
Annual Report
Financial Highlights - Small Cap Value
Years ended July 31, | 2011 | 2010 | 2009 | 2008 | 2007 |
Selected Per-Share Data | | | | | |
Net asset value, beginning of period | $ 13.56 | $ 11.22 | $ 11.91 | $ 14.43 | $ 13.22 |
Income from Investment Operations | | | | | |
Net investment income (loss) B | .06 E | .05 F | .10 | .03 | (.02) |
Net realized and unrealized gain (loss) | 2.23 | 2.34 | (.60) | (1.99) | 1.91 |
Total from investment operations | 2.29 | 2.39 | (.50) | (1.96) | 1.89 |
Distributions from net investment income | (.10) | (.05) | (.08) | - | - |
Distributions from net realized gain | (.13) | - | (.11) | (.56) | (.68) |
Total distributions | (.23) | (.05) | (.19) | (.56) | (.68) |
Redemption fees added to paid in capital B,H | - | - | - | - | - |
Net asset value, end of period | $ 15.62 | $ 13.56 | $ 11.22 | $ 11.91 | $ 14.43 |
Total Return A | 17.03% | 21.32% | (4.15)% | (14.10)% | 14.96% |
Ratios to Average Net Assets C,G | | | | |
Expenses before reductions | 1.13% | 1.18% | 1.20% | 1.14% | 1.11% |
Expenses net of fee waivers, if any | 1.13% | 1.18% | 1.20% | 1.14% | 1.11% |
Expenses net of all reductions | 1.13% | 1.17% | 1.20% | 1.13% | 1.11% |
Net investment income (loss) | .37% E | .39% F | 1.01% | .22% | (.15)% |
Supplemental Data | | | | | |
Net assets, end of period (000 omitted) | $ 1,899,805 | $ 1,770,675 | $ 1,488,736 | $ 1,136,860 | $ 1,233,808 |
Portfolio turnover rate D | 22% | 49% | 51% | 149% | 67% |
A Total returns would have been lower if certain expenses had not been reduced during the applicable periods shown.
B Calculated based on average shares outstanding during the period.
C Fees and expenses of any underlying Fidelity Central Funds are not included in the Fund's expense ratio. The Fund indirectly bears its proportionate share of the expenses of any underlying Fidelity Central Funds.
D Amount does not include the portfolio activity of any underlying Fidelity Central Funds.
E Investment income per share reflects a special dividend which amounted to $.06 per share. Excluding the special dividend, the ratio of net investment income (loss) to average net assets would have been (.01) %.
F Investment income per share reflects a special dividend which amounted to $.03 per share. Excluding the special dividend, the ratio of net investment income (loss) to average net assets would have been .12%.
G Expense ratios reflect operating expenses of the class. Expenses before reductions do not reflect amounts reimbursed by the investment adviser or reductions from brokerage service arrangements or reductions from other expense offset arrangements and do not represent the amount paid by the class during periods when reimbursements or reductions occur. Expenses net of fee waivers reflect expenses after reimbursement by the investment adviser but prior to reductions from brokerage service arrangements or other expense offset arrangements. Expenses net of all reductions represent the net expenses paid by the class.
H Amount represents less than $.01 per share.
See accompanying notes which are an integral part of the financial statements.
Annual Report
Financial Highlights - Class F
Years ended July 31, | 2011 | 2010 | 2009 I |
Selected Per-Share Data | | | |
Net asset value, beginning of period | $ 13.58 | $ 11.22 | $ 10.27 |
Income from Investment Operations | | | |
Net investment income (loss) D | .09 G | .09 H | .01 |
Net realized and unrealized gain (loss) | 2.23 | 2.34 | .94 |
Total from investment operations | 2.32 | 2.43 | .95 |
Distributions from net investment income | (.14) | (.07) | - |
Distributions from net realized gain | (.13) | - | - |
Total distributions | (.26) L | (.07) | - |
Redemption fees added to paid in capital D,K | - | - | - |
Net asset value, end of period | $ 15.64 | $ 13.58 | $ 11.22 |
Total Return B,C | 17.31% | 21.69% | 9.25% |
Ratios to Average Net Assets E,J | | | |
Expenses before reductions | .88% | .90% | .86% A |
Expenses net of fee waivers, if any | .88% | .90% | .86%A |
Expenses net of all reductions | .88% | .89% | .86%A |
Net investment income (loss) | .61% G | .67% H | .64%A |
Supplemental Data | | | |
Net assets, end of period (000 omitted) | $ 279,653 | $ 109,868 | $ 159 |
Portfolio turnover rate F | 22% | 49% | 51% |
A Annualized
B Total returns for periods of less than one year are not annualized.
C Total returns would have been lower if certain expenses had not been reduced during the applicable periods shown.
D Calculated based on average shares outstanding during the period.
E Fees and expenses of any underlying Fidelity Central Funds are not included in the Fund's expense ratio. The Fund indirectly bears its proportionate share of the expenses of any underlying Fidelity Central Funds.
F Amount does not include the portfolio activity of any underlying Fidelity Central Funds.
G Investment income per share reflects a special dividend which amounted to $.06 per share. Excluding the special dividend, the ratio of net investment income (loss) to average net assets would have been .24%.
H Investment income per share reflects a special dividend which amounted to $.03 per share. Excluding the special dividend, the ratio of net investment income (loss) to average net assets would have been .40%.
I For the period June 26, 2009 (commencement of sale of shares) to July 31, 2009.
J Expense ratios reflect operating expenses of the class. Expenses before reductions do not reflect amounts reimbursed by the investment adviser or reductions from brokerage service arrangements or reductions from other expense offset arrangements and do not represent the amount paid by the class during periods when reimbursements or reductions occur. Expense ratios before reductions for start-up periods may not be representative of longer-term operating periods. Expenses net of fee waivers reflect expenses after reimbursement by the investment adviser but prior to reductions from brokerage service arrangements or other expense offset arrangements. Expenses net of all reductions represent the net expenses paid by the class.
K Amount represents less than $.01 per share.
L Total distributions of $.26 per share is comprised of distributions from net investment income of $.138 and distributions from net realized gain of $.126 per share.
See accompanying notes which are an integral part of the financial statements.
Annual Report
Financial Highlights - Institutional Class
Years ended July 31, | 2011 | 2010 | 2009 | 2008 | 2007 |
Selected Per-Share Data | | | | | |
Net asset value, beginning of period | $ 13.58 | $ 11.24 | $ 11.91 | $ 14.43 | $ 13.22 |
Income from Investment Operations | | | | | |
Net investment income (loss) B | .06 E | .06 F | .10 | .03 | (.02) |
Net realized and unrealized gain (loss) | 2.23 | 2.34 | (.59) | (1.99) | 1.91 |
Total from investment operations | 2.29 | 2.40 | (.49) | (1.96) | 1.89 |
Distributions from net investment income | (.11) | (.06) | (.07) | - | - |
Distributions from net realized gain | (.13) | - | (.11) | (.56) | (.68) |
Total distributions | (.24) | (.06) | (.18) | (.56) | (.68) |
Redemption fees added to paid in capital B,H | - | - | - | - | - |
Net asset value, end of period | $ 15.63 | $ 13.58 | $ 11.24 | $ 11.91 | $ 14.43 |
Total Return A | 17.02% | 21.42% | (4.04)% | (14.10)% | 14.99% |
Ratios to Average Net Assets C,G | | | | | |
Expenses before reductions | 1.10% | 1.12% | 1.20% | 1.13% | 1.10% |
Expenses net of fee waivers, if any | 1.10% | 1.12% | 1.15% | 1.13% | 1.10% |
Expenses net of all reductions | 1.10% | 1.12% | 1.15% | 1.13% | 1.10% |
Net investment income (loss) | .39% E | .45% F | 1.06% | .22% | (.13)% |
Supplemental Data | | | | | |
Net assets, end of period (000 omitted) | $ 101,565 | $ 78,440 | $ 10,336 | $ 8,584 | $ 11,594 |
Portfolio turnover rate D | 22% | 49% | 51% | 149% | 67% |
A Total returns would have been lower if certain expenses had not been reduced during the applicable periods shown.
B Calculated based on average shares outstanding during the period.
C Fees and expenses of any underlying Fidelity Central Funds are not included in the Fund's expense ratio. The Fund indirectly bears its proportionate share of the expenses of any underlying Fidelity Central Funds.
D Amount does not include the portfolio activity of any underlying Fidelity Central Funds.
E Investment income per share reflects a special dividend which amounted to $.06 per share. Excluding the special dividend, the ratio of net investment income (loss) to average net assets would have been .01%.
F Investment income per share reflects a special dividend which amounted to $.03 per share. Excluding the special dividend, the ratio of net investment income (loss) to average net assets would have been .18%.
G Expense ratios reflect operating expenses of the class. Expenses before reductions do not reflect amounts reimbursed by the investment adviser or reductions from brokerage service arrangements or reductions from other expense offset arrangements and do not represent the amount paid by the class during periods when reimbursements or reductions occur. Expenses net of fee waivers reflect expenses after reimbursement by the investment adviser but prior to reductions from brokerage service arrangements or other expense offset arrangements. Expenses net of all reductions represent the net expenses paid by the class.
H Amount represents less than $.01 per share.
See accompanying notes which are an integral part of the financial statements.
Annual Report
Notes to Financial Statements
For the period ended July 31, 2011
1. Organization.
Fidelity Small Cap Value Fund (the Fund) is a fund of Fidelity Securities Fund (the Trust) and is authorized to issue an unlimited number of shares. The Trust is registered under the Investment Company Act of 1940, as amended (the 1940 Act), as an open-end management investment company organized as a Massachusetts business trust. The Fund offers Class A, Class T, Class C, Small Cap Value, Class F and Institutional Class shares, each of which, along with Class B shares, has equal rights as to assets and voting privileges. Effective after the close of business on September 1, 2010, Class B shares were closed to new accounts and additional purchases, except for exchanges and reinvestments, by existing shareholders. Each class has exclusive voting rights with respect to matters that affect that class. Class F shares of the Fund are only available for purchase by mutual funds for which Fidelity Management & Research Company (FMR) or an affiliate serves as investment manager. Class B shares will automatically convert to Class A shares after a holding period of seven years from the initial date of purchase. Investment income, realized and unrealized capital gains and losses, the common expenses of the Fund, and certain fund-level expense reductions, if any, are allocated on a pro-rata basis to each class based on the relative net assets of each class to the total net assets of the Fund. Each class differs with respect to transfer agent and distribution and service plan fees incurred. Certain expense reductions may also differ by class.
2. Investments in Fidelity Central Funds.
The Fund invests in Fidelity Central Funds, which are open-end investment companies available only to other investment companies and accounts managed by Fidelity Management & Research Company (FMR) and its affiliates. The Fund's Schedule of Investments lists each of the Fidelity Central Funds held as of period end, if any, as an investment of the Fund, but does not include the underlying holdings of each Fidelity Central Fund. As an Investing Fund, the Fund indirectly bears its proportionate share of the expenses of the underlying Fidelity Central Funds.
The Money Market Central Funds seek preservation of capital and current income and are managed by Fidelity Investments Money Management, Inc. (FIMM), an affiliate of FMR.
A complete unaudited list of holdings for each Fidelity Central Fund is available upon request or at the Securities and Exchange Commission (the SEC) web site at www.sec.gov. In addition, the financial statements of the Fidelity Central Funds, which are not covered by the Fund's Report of Independent Registered Public Accounting Firm, are available on the SEC web site or upon request.
Annual Report
3. Significant Accounting Policies.
The financial statements have been prepared in conformity with accounting principles generally accepted in the United States of America (GAAP), which require management to make certain estimates and assumptions at the date of the financial statements. Actual results could differ from those estimates. Subsequent events, if any, through the date that the financial statements were issued have been evaluated in the preparation of the financial statements. The following summarizes the significant accounting policies of the Fund:
Security Valuation. Investments are valued as of 4:00 p.m. Eastern time on the last calendar day of the period. The Fund uses independent pricing services approved by the Board of Trustees to value its investments. When current market prices or quotations are not readily available or reliable, valuations may be determined in good faith in accordance with procedures adopted by the Board of Trustees. Factors used in determining value may include market or security specific events. The frequency with which these procedures are used cannot be predicted and they may be utilized to a significant extent. The value used for net asset value (NAV) calculation under these procedures may differ from published prices for the same securities.
The Fund categorizes the inputs to valuation techniques used to value its investments into a disclosure hierarchy consisting of three levels as shown below:
Level 1 - quoted prices in active markets for identical investments
Level 2 - other significant observable inputs (including quoted prices for similar investments, interest rates, prepayment speeds, etc.)
Level 3 - unobservable inputs (including the Fund's own assumptions based on the best information available)
Changes in valuation techniques may result in transfers in or out of an assigned level within the disclosure hierarchy. Valuation techniques used to value the Fund's investments by major category are as follows:
Equity securities, including restricted securities, for which market quotations are readily available, are valued at the last reported sale price or official closing price as reported by an independent pricing service on the primary market or exchange on which they are traded and are categorized as Level 1 in the hierarchy. In the event there were no sales during the day or closing prices are not available, securities are valued at the last quoted bid price or may be valued using the last available price and are generally categorized as Level 2 in the hierarchy. For foreign equity securities, when significant market or security specific events arise, comparisons to the valuation of American Depositary Receipts
Annual Report
Notes to Financial Statements - continued
3. Significant Accounting Policies - continued
Security Valuation - continued
(ADRs), futures contracts, Exchange-traded funds (ETFs) and certain indexes as well as quoted prices for similar securities are used and are categorized as Level 2 in the hierarchy in these circumstances. Utilizing these techniques may result in transfers between Level 1 and Level 2. For restricted equity securities and private placements where observable inputs are limited, assumptions about market activity and risk are used and are categorized as Level 3 in the hierarchy.
Investments in open-end mutual funds, including the Fidelity Central Funds, are valued at their closing net asset value each business day and are categorized as Level 1 in the hierarchy.
Foreign Currency. The Fund may use foreign currency contracts to facilitate transactions in foreign-denominated securities. Gains and losses from these transactions may arise from changes in the value of the foreign currency or if the counterparties do not perform under the contracts' terms.
Foreign-denominated assets, including investment securities, and liabilities are translated into U.S. dollars at the exchange rate at period end. Purchases and sales of investment securities, income and dividends received and expenses denominated in foreign currencies are translated into U.S. dollars at the exchange rate in effect on the transaction date.
The effects of exchange rate fluctuations on investments are included with the net realized and unrealized gain (loss) on investment securities. Other foreign currency transactions resulting in realized and unrealized gain (loss) are disclosed separately.
Investment Transactions and Income. For financial reporting purposes, the Fund's investment holdings and NAV include trades executed through the end of the last business day of the period. The NAV per share for processing shareholder transactions is calculated as of the close of business of the New York Stock Exchange (NYSE), normally 4:00 p.m. Eastern time and includes trades executed through the end of the prior business day. Gains and losses on securities sold are determined on the basis of identified cost and may include proceeds received from litigation. Dividend income is recorded on the ex-dividend date, except for certain dividends from foreign securities where the ex-dividend date may have passed, which are recorded as soon as the Fund is informed of the ex-dividend date. Non-cash dividends included in dividend income, if any, are recorded at the fair market value of the securities received. Distributions received on securities that represent a return of capital or capital gain are recorded as a reduction of
Annual Report
3. Significant Accounting Policies - continued
Investment Transactions and Income - continued
cost of investments and/or as a realized gain. The Fund estimates the components of distributions received that may be considered return of capital distributions or capital gain distributions. Large, non-recurring dividends recognized by the Fund are presented separately on the Statement of Operations as "Special Dividends" and the impact of these dividends is presented in the Financial Highlights. Interest income and distributions from the Fidelity Central Funds are accrued as earned. Interest income includes coupon interest and amortization of premium and accretion of discount on debt securities. Investment income is recorded net of foreign taxes withheld where recovery of such taxes is uncertain.
Expenses. Expenses directly attributable to a fund are charged to that fund. Expenses attributable to more than one fund are allocated among the respective funds on the basis of relative net assets or other appropriate methods. Expense estimates are accrued in the period to which they relate and adjustments are made when actual amounts are known.
Income Tax Information and Distributions to Shareholders. Each year, the Fund intends to qualify as a regulated investment company, including distributing substantially all of its taxable income and realized gains under Subchapter M of the Internal Revenue Code and filing its U.S. federal tax return. As a result, no provision for income taxes is required. As of July 31, 2011, the Fund did not have any unrecognized tax benefits in the financial statements. A fund's federal tax return is subject to examination by the Internal Revenue Service (IRS) for a period of three years. Foreign taxes are provided for based on the Fund's understanding of the tax rules and rates that exist in the foreign markets in which it invests.
Distributions are declared and recorded on the ex-dividend date. Income dividends and capital gain distributions are declared separately for each class. Income and capital gain distributions are determined in accordance with income tax regulations, which may differ from GAAP. In addition, the Fund claimed a portion of the payment made to redeeming shareholders as a distribution for income tax purposes.
Capital accounts within the financial statements are adjusted for permanent book-tax differences. These adjustments have no impact on net assets or the results of operations. Temporary book-tax differences will reverse in a subsequent period.
Book-tax differences are primarily due to the foreign currency transactions and losses deferred due to wash sales.
Annual Report
Notes to Financial Statements - continued
3. Significant Accounting Policies - continued
Income Tax Information and Distributions to Shareholders - continued
The federal tax cost of investment securities and unrealized appreciation (depreciation) as of period end were as follows:
Gross unrealized appreciation | $ 530,639,044 |
Gross unrealized depreciation | (140,116,602) |
Net unrealized appreciation (depreciation) on securities and other investments | $ 390,522,442 |
| |
Tax Cost | $ 2,251,463,484 |
The tax-based components of distributable earnings as of period end were as follows:
Undistributed long-term capital gain | $ 130,326,950 |
Net unrealized appreciation (depreciation) | $ 390,529,985 |
Under the recently enacted Regulated Investment Company Modernization Act of 2010 (the Act), the Fund will be permitted to carry forward capital losses incurred in taxable years beginning after December 22, 2010 for an unlimited period. However, any losses incurred during those future taxable years will be required to be utilized prior to any losses incurred in pre-enactment taxable years, which generally expire after eight years from when they are incurred. Additionally, post-enactment capital losses that are carried forward will retain their character as either short-term or long-term capital losses rather than being considered all short-term as under previous law. The Fund's first fiscal year end subject to the Act will be July 31, 2012.
The tax character of distributions paid was as follows:
| July 31, 2011 | July 31, 2010 |
Ordinary Income | $ 16,899,273 | $ 6,560,137 |
Long-term Capital Gains | 19,302,851 | - |
Total | $ 36,202,124 | $ 6,560,137 |
Short-Term Trading (Redemption) Fees. Shares held by investors in the Fund less than 90 days are subject to a redemption fee equal to 1.50% of the net asset value of shares redeemed. All redemption fees, which reduce the proceeds of the shareholder redemption, are retained by the Fund and accounted for as an addition to paid in capital.
Annual Report
3. Significant Accounting Policies - continued
New Accounting Pronouncement. In May 2011, the Financial Accounting Standards Board issued Accounting Standard Update No. 2011-04, Fair Value Measurement (Topic 820) - Amendments to Achieve Common Fair Value Measurement and Disclosure Requirements in U.S. GAAP and IFRSs. The update changes the wording used to describe the requirements in GAAP for measuring fair value and for disclosing information about fair value measurements. The update is effective during interim and annual periods beginning after December 15, 2011. Management is currently evaluating the impact of the update's adoption on the Fund's financial statement disclosures.
4. Purchases and Sales of Investments.
Purchases and sales of securities, other than short-term securities, aggregated $587,909,809 and $542,085,214, respectively.
5. Fees and Other Transactions with Affiliates.
Management Fee. FMR and its affiliates provide the Fund with investment management related services for which the Fund pays a monthly management fee. The management fee is the sum of an individual fund fee rate that is based on an annual rate of .45% of the Fund's average net assets and a group fee rate that averaged .26% during the period. The group fee rate is based upon the average net assets of all the mutual funds advised by FMR. The group fee rate decreases as assets under management increase and increases as assets under management decrease. In addition, the management fee is subject to a performance adjustment (up to a maximum of ±.20% of the Fund's average net assets over a 36 month performance period). The upward or downward adjustment to the management fee is based on the relative investment performance of Small Cap Value as compared to an appropriate benchmark index. For the period, the total annual management fee rate, including the performance adjustment, was .84% of the Fund's average net assets.
Distribution and Service Plan Fees. In accordance with Rule 12b-1 of the 1940 Act, the Fund has adopted separate Distribution and Service Plans for each class of shares. Certain classes pay Fidelity Distributors Corporation (FDC), an affiliate of FMR, separate Distribution and Service Fees, each of which is based on an annual percentage of each class' average net assets. In addition, FDC may pay financial intermediaries for
Annual Report
Notes to Financial Statements - continued
5. Fees and Other Transactions with Affiliates - continued
Distribution and Service Plan Fees - continued
selling shares of the Fund and providing shareholder support services. For the period, the Distribution and Service Fee rates, total fees and amounts retained by FDC were as follows:
| Distribution
Fee | Service
Fee | Total Fees | Retained
by FDC |
Class A | -% | .25% | $ 320,077 | $ 13,128 |
Class T | .25% | .25% | 280,302 | 522 |
Class B | .75% | .25% | 97,826 | 73,433 |
Class C | .75% | .25% | 465,720 | 134,667 |
| | | $ 1,163,925 | $ 221,750 |
Sales Load. FDC may receive a front-end sales charge of up to 5.75% for selling Class A shares, and 3.50% for selling Class T shares, some of which is paid to financial intermediaries for selling shares of the Fund. Depending on the holding period, FDC may receive contingent deferred sales charges levied on Class A, Class T, Class B, and Class C redemptions. The deferred sales charges range from 5% to 1% for Class B, 1% for Class C, 1.00% for certain purchases of Class A shares and .25% for certain purchases of Class T shares.
For the period, sales charge amounts retained by FDC were as follows:
| Retained
by FDC |
Class A | $ 60,912 |
Class T | 9,625 |
Class B* | 23,049 |
Class C* | 5,402 |
| $ 98,988 |
* When Class B and Class C shares are initially sold, FDC pays commissions from its own resources to financial intermediaries through which the sales are made.
Transfer Agent Fees. Fidelity Investments Institutional Operations Company, Inc. (FIIOC), an affiliate of FMR, is the transfer, dividend disbursing and shareholder servicing agent for each class of the Fund. FIIOC receives account fees and asset-based fees that vary according to the account size and type of account of the shareholders of the respective classes of the Fund, except for Class F. FIIOC receives no fees for providing transfer agency services to Class F. FIIOC pays for typesetting, printing and mailing of
Annual Report
5. Fees and Other Transactions with Affiliates - continued
Transfer Agent Fees - continued
shareholder reports, except proxy statements. For the period, transfer agent fees for each class were as follows:
| Amount | % of
Average
Net Assets |
Class A | $ 388,730 | .30 |
Class T | 173,683 | .31 |
Class B | 30,729 | .31 |
Class C | 139,095 | .30 |
Small Cap Value | 4,748,341 | .24 |
Institutional Class | 220,807 | .22 |
| $ 5,701,385 | |
Accounting and Security Lending Fees. Fidelity Service Company, Inc. (FSC), an affiliate of FMR, maintains the Fund's accounting records. The accounting fee is based on the level of average net assets for the month. Under a separate contract, FSC administers the security lending program. The security lending fee is based on the number and duration of lending transactions.
Brokerage Commissions. The Fund placed a portion of its portfolio transactions with brokerage firms which are affiliates of the investment adviser. The commissions paid to these affiliated firms were $13,259 for the period.
Interfund Lending Program. Pursuant to an Exemptive Order issued by the SEC, the Fund, along with other registered investment companies having management contracts with FMR, may participate in an interfund lending program. This program provides an alternative credit facility allowing the funds to borrow from, or lend money to, other participating affiliated funds. At period end, there were no interfund loans outstanding. The Fund's activity in this program during the period for which loans were outstanding was as follows:
Borrower or Lender | Average Daily
Loan Balance | Weighted Average
Interest Rate | Interest
Expense |
Borrower | $ 5,022,450 | .42% | $ 1,171 |
Annual Report
Notes to Financial Statements - continued
6. Committed Line of Credit.
The Fund participates with other funds managed by FMR or an affiliate in a $4.0 billion credit facility (the "line of credit") to be utilized for temporary or emergency purposes to fund shareholder redemptions or for other short-term liquidity purposes. The Fund has agreed to pay commitment fees on its pro-rata portion of the line of credit, which amounted to $8,189 and is reflected in Miscellaneous expenses on the Statement of Operations. During the period, there were no borrowings on this line of credit.
7. Security Lending.
The Fund lends portfolio securities through a lending agent from time to time in order to earn additional income. The lending agent may loan securities to certain qualified borrowers, including Fidelity Capital Markets (FCM), a broker-dealer affiliated with the Fund. On the settlement date of the loan, the Fund receives collateral (in the form of U.S. Treasury obligations, letters of credit and/or cash) against the loaned securities and maintains collateral in an amount not less than 100% of the market value of the loaned securities during the period of the loan. The market value of the loaned securities is determined at the close of business of the Fund and any additional required collateral is delivered to the Fund on the next business day. If the borrower defaults on its obligation to return the securities loaned because of insolvency or other reasons, a fund could experience delays and costs in recovering the securities loaned or in gaining access to the collateral. Any cash collateral received is invested in the Fidelity Securities Lending Cash Central Fund. The value of loaned securities and cash collateral at period end are disclosed on the Fund's Statement of Assets and Liabilities. Security lending income represents the income earned on investing cash collateral, less rebates paid to borrowers and lending agent fees associated with the loan, plus any premium payments received for lending certain types of securities. Security lending income is presented in the Statement of Operations as a component of income from Fidelity Central Funds. Total security lending income during the period amounted to $121,080. During the period, there were no securities loaned to FCM.
8. Expense Reductions.
FMR voluntarily agreed to reimburse each class to the extent annual operating expenses exceeded certain levels of average net assets as noted in the table below. Some expenses, for example interest expense, including commitment fees, are excluded from this reimbursement.
Annual Report
8. Expense Reductions - continued
The following classes were in reimbursement during the period:
| Expense
Limitations* | Reimbursement
from adviser |
Class A | 1.40 % | $ 9,560 |
Class T | 1.65 % | 4,801 |
Class B | 2.15 % | 1,186 |
Class C | 2.15 % | 3,342 |
| | $ 18,889 |
* Effective October 1, 2010 the expense limitations were eliminated.
Many of the brokers with whom FMR places trades on behalf of the Fund provided services to the Fund in addition to trade execution. These services included payments of certain expenses on behalf of the Fund totaling $25,738 for the period.
9. Distributions to Shareholders.
Distributions to shareholders of each class were as follows:
Years ended July 31, | 2011 | 2010 |
From net investment income | | |
Class A | $ 602,963 | $ 159,193 |
Class T | 175,083 | 36,920 |
Class B | 8,350 | - |
Class C | 50,685 | - |
Small Cap Value | 13,136,446 | 6,230,380 |
Class F | 1,502,640 | 28,266 |
Institutional Class | 674,898 | 105,378 |
Total | $ 16,151,065 | $ 6,560,137 |
From net realized gain | | |
Class A | $ 938,086 | $ - |
Class T | 417,804 | - |
Class B | 85,354 | - |
Class C | 362,483 | - |
Small Cap Value | 16,213,209 | - |
Class F | 1,278,822 | - |
Institutional Class | 755,301 | - |
Total | $ 20,051,059 | $ - |
Annual Report
Notes to Financial Statements - continued
10. Share Transactions.
Transactions for each class of shares were as follows:
| Shares | Dollars |
Years ended July 31, | 2011 | 2010 | 2011 | 2010 |
Class A | | | | |
Shares sold | 4,641,222 | 4,231,111 | $ 70,784,911 | $ 54,936,600 |
Reinvestment of distributions | 98,821 | 12,276 | 1,412,739 | 146,358 |
Shares redeemed | (2,860,682) | (1,973,236) | (43,524,578) | (25,421,999) |
Net increase (decrease) | 1,879,361 | 2,270,151 | $ 28,673,072 | $ 29,660,959 |
Class T | | | | |
Shares sold | 1,830,956 | 1,449,265 | $ 27,619,849 | $ 18,793,141 |
Reinvestment of distributions | 40,370 | 3,030 | 573,649 | 35,906 |
Shares redeemed | (1,537,319) | (727,616) | (23,500,005) | (9,211,959) |
Net increase (decrease) | 334,007 | 724,679 | $ 4,693,493 | $ 9,617,088 |
Class B | | | | |
Shares sold | 84,331 | 262,419 | $ 1,230,023 | $ 3,340,905 |
Reinvestment of distributions | 5,817 | - | 79,168 | - |
Shares redeemed | (265,513) | (174,554) | (3,874,627) | (2,189,700) |
Net increase (decrease) | (175,365) | 87,865 | $ (2,565,436) | $ 1,151,205 |
Class C | | | | |
Shares sold | 1,131,174 | 1,327,692 | $ 16,672,873 | $ 17,060,657 |
Reinvestment of distributions | 25,779 | - | 354,104 | - |
Shares redeemed | (848,659) | (434,251) | (12,648,504) | (5,448,332) |
Net increase (decrease) | 308,294 | 893,441 | $ 4,378,473 | $ 11,612,325 |
Small Cap Value | | | | |
Shares sold | 35,677,635 | 45,122,251 | $ 541,990,483 | $ 585,925,779 |
Reinvestment of distributions | 1,987,755 | 507,903 | 28,460,668 | 6,101,827 |
Shares redeemed | (46,640,533) | (47,781,912) | (708,788,001) | (605,149,428) |
Net increase (decrease) | (8,975,143) | (2,151,758) | $ (138,336,850) | $ (13,121,822) |
Class F | | | | |
Shares sold | 11,644,633 | 8,411,513 | $ 177,097,711 | $ 109,778,609 |
Reinvestment of distributions | 192,943 | 2,350 | 2,781,462 | 28,266 |
Shares redeemed | (2,052,505) | (337,999) | (32,200,197) | (4,618,215) |
Net increase (decrease) | 9,785,071 | 8,075,864 | $ 147,678,976 | $ 105,188,660 |
Institutional Class | | | | |
Shares sold | 4,417,342 | 5,522,070 | $ 67,359,213 | $ 73,692,691 |
Reinvestment of distributions | 90,435 | 7,512 | 1,288,856 | 90,344 |
Shares redeemed | (3,788,938) | (671,565) | (58,540,522) | (8,789,847) |
Net increase (decrease) | 718,839 | 4,858,017 | $ 10,107,547 | $ 64,993,188 |
Annual Report
11. Other.
The Fund's organizational documents provide former and current trustees and officers with a limited indemnification against liabilities arising in connection with the performance of their duties to the Fund. In the normal course of business, the Fund may also enter into contracts that provide general indemnifications. The Fund's maximum exposure under these arrangements is unknown as this would be dependent on future claims that may be made against the Fund. The risk of material loss from such claims is considered remote.
At the end of the period, the Fidelity Freedom Funds® and Fidelity Freedom K® Funds were the owners of record, in the aggregate, of approximately 37% of the total outstanding shares of the Fund.
Annual Report
To the Trustees of Fidelity Securities Fund and the Shareholders of Fidelity Small Cap Value Fund:
In our opinion, the accompanying statement of assets and liabilities, including the schedule of investments, and the related statements of operations and of changes in net assets and the financial highlights present fairly, in all material respects, the financial position of Fidelity Small Cap Value Fund (a fund of Fidelity Securities Fund) at July 31, 2011, the results of its operations for the year then ended, the changes in its net assets for each of the two years in the period then ended and the financial highlights for each of the periods indicated, in conformity with accounting principles generally accepted in the United States of America. These financial statements and financial highlights (hereafter referred to as "financial statements") are the responsibility of the Fidelity Small Cap Value Fund's management. Our responsibility is to express an opinion on these financial statements based on our audits. We conducted our audits of these financial statements in accordance with the standards of the Public Company Accounting Oversight Board (United States). Those standards require that we plan and perform the audit to obtain reasonable assurance about whether the financial statements are free of material misstatement. An audit includes examining, on a test basis, evidence supporting the amounts and disclosures in the financial statements, assessing the accounting principles used and significant estimates made by management, and evaluating the overall financial statement presentation. We believe that our audits, which included confirmation of securities at July 31, 2011 by correspondence with the custodian and brokers, provide a reasonable basis for our opinion.
/s/PricewaterhouseCoopers LLP
PricewaterhouseCoopers LLP
Boston, Massachusetts
September 15, 2011
Annual Report
The Trustees, Members of the Advisory Board, and executive officers of the trust and fund, as applicable, are listed below. The Board of Trustees governs the fund and is responsible for protecting the interests of shareholders. The Trustees are experienced executives who meet periodically throughout the year to oversee the fund's activities, review contractual arrangements with companies that provide services to the fund, oversee management of the risks associated with such activities and contractual arrangements, and review the fund's performance. Except for James C. Curvey, each of the Trustees oversees 221 funds advised by FMR or an affiliate. Mr. Curvey oversees 419 funds advised by FMR or an affiliate.
The Trustees hold office without limit in time except that (a) any Trustee may resign; (b) any Trustee may be removed by written instrument, signed by at least two-thirds of the number of Trustees prior to such removal; (c) any Trustee who requests to be retired or who has become incapacitated by illness or injury may be retired by written instrument signed by a majority of the other Trustees; and (d) any Trustee may be removed at any special meeting of shareholders by a two-thirds vote of the outstanding voting securities of the trust. Each Trustee who is not an interested person (as defined in the 1940 Act) (Independent Trustee), shall retire not later than the last day of the calendar year in which his or her 75th birthday occurs. The Independent Trustees may waive this mandatory retirement age policy with respect to individual Trustees. The executive officers and Advisory Board Members hold office without limit in time, except that any officer and Advisory Board Member may resign or may be removed by a vote of a majority of the Trustees at any regular meeting or any special meeting of the Trustees. Except as indicated, each individual has held the office shown or other offices in the same company for the past five years.
Experience, Skills, Attributes, and Qualifications of the Fund's Trustees. The Governance and Nominating Committee has adopted a statement of policy that describes the experience, qualifications, attributes, and skills that are necessary and desirable for potential Independent Trustee candidates (Statement of Policy). The Board believes that each Trustee satisfied at the time he or she was initially elected or appointed a Trustee, and continues to satisfy, the standards contemplated by the Statement of Policy. The Governance and Nominating Committee also engages professional search firms to help identify potential Independent Trustee candidates who have the experience, qualifications, attributes, and skills consistent with the Statement of Policy. From time to time, additional criteria based on the composition and skills of the current Independent Trustees, as well as experience or skills that may be appropriate in light of future changes to board composition, business conditions, and regulatory or other developments, have also been considered by the professional search firms and the Governance and Nominating Committee. In addition, the Board takes into account the Trustees' commitment and participation in Board and committee meetings, as well as their leadership of standing and ad hoc committees throughout their tenure.
In determining that a particular Trustee was and continues to be qualified to serve as a Trustee, the Board has considered a variety of criteria, none of which, in isolation, was controlling. The Board believes that, collectively, the Trustees have balanced and diverse experience, qualifications, attributes, and skills, which allow the Board to operate effectively in governing the fund and protecting the interests of shareholders. Information about the specific experience, skills, attributes, and qualifications of each Trustee, which in each case led to the Board's conclusion that the Trustee should serve (or continue to serve) as a trustee of the fund, is provided below.
Annual Report
Board Structure and Oversight Function. James C. Curvey is an interested person (as defined in the 1940 Act) and currently serves as Acting Chairman. The Trustees have determined that an interested Chairman is appropriate and benefits shareholders because an interested Chairman has a personal and professional stake in the quality and continuity of services provided to the fund. Independent Trustees exercise their informed business judgment to appoint an individual of their choosing to serve as Chairman, regardless of whether the Trustee happens to be independent or a member of management. The Independent Trustees have determined that they can act independently and effectively without having an Independent Trustee serve as Chairman and that a key structural component for assuring that they are in a position to do so is for the Independent Trustees to constitute a substantial majority for the Board. The Independent Trustees also regularly meet in executive session. Ned C. Lautenbach serves as Chairman of the Independent Trustees and as such (i) acts as a liaison between the Independent Trustees and management with respect to matters important to the Independent Trustees and (ii) with management prepares agendas for Board meetings.
Fidelity funds are overseen by different Boards of Trustees. The fund's Board oversees Fidelity's equity and high income funds and another Board oversees Fidelity's investment-grade bond, money market, and asset allocation funds. The asset allocation funds may invest in Fidelity funds overseen by the fund's Board. The use of separate Boards, each with its own committee structure, allows the Trustees of each group of Fidelity funds to focus on the unique issues of the funds they oversee, including common research, investment, and operational issues. On occasion, the separate Boards establish joint committees to address issues of overlapping consequences for the Fidelity funds overseen by each Board.
The Trustees operate using a system of committees to facilitate the timely and efficient consideration of all matters of importance to the Trustees, the fund, and fund shareholders and to facilitate compliance with legal and regulatory requirements and oversight of the fund's activities and associated risks. The Board, acting through its committees, has charged FMR and its affiliates with (i) identifying events or circumstances the occurrence of which could have demonstrably adverse effects on the fund's business and/or reputation; (ii) implementing processes and controls to lessen the possibility that such events or circumstances occur or to mitigate the effects of such events or circumstances if they do occur; and (iii) creating and maintaining a system designed to evaluate continuously business and market conditions in order to facilitate the identification and implementation processes described in (i) and (ii) above. Because the day-to-day operations and activities of the fund are carried out by or through FMR, its affiliates and other service providers, the fund's exposure to risks is mitigated but not eliminated by the processes overseen by the Trustees. While each of the Board's committees has responsibility for overseeing different aspects of the fund's activities, oversight is exercised primarily through the Operations, Audit, and Compliance Committees. Appropriate personnel, including but not limited to the fund's Chief Compliance Officer (CCO), FMR's internal auditor, the independent accountants, the fund's Treasurer and portfolio management personnel, make periodic reports to the Board's committees, as appropriate. The responsibilities of each committee, including their oversight responsibilities, are described further under "Standing Committees of the Fund's Trustees."
Annual Report
Trustees and Officers - continued
The fund's Statement of Additional Information (SAI) includes more information about the Trustees. To request a free copy, call Fidelity at 1-800-544-8544.
Interested Trustees*:
Correspondence intended for each Trustee who is an interested person may be sent to Fidelity Investments, 82 Devonshire Street, Boston, Massachusetts 02109.
Name, Age; Principal Occupations and Other Relevant Experience+ |
James C. Curvey (76) |
| Year of Election or Appointment: 2007 Mr. Curvey is Trustee and Acting Chairman of the Board of Trustees of certain Trusts. Mr. Curvey also serves as Trustee (2007-present) of other investment companies advised by FMR. Mr. Curvey is a Director of Fidelity Investments Money Management, Inc. (2009-present), Director of Fidelity Research & Analysis Co. (2009-present) and Director of FMR and FMR Co., Inc. (2007-present). Mr. Curvey is also Vice Chairman (2007-present) and Director of FMR LLC. In addition, Mr. Curvey serves as an Overseer for the Boston Symphony Orchestra and a member of the Trustees of Villanova University. Previously, Mr. Curvey was the Vice Chairman (2006-2007) and Director (2000-2007) of FMR Corp. |
Ronald P. O'Hanley (54) |
| Year of Election or Appointment: 2011 Mr. O'Hanley is Director of FMR Co., Inc. (2010-present), Director of Fidelity Investments Money Management, Inc. (2010-present), Director of Fidelity Research & Analysis Company (2010-present), President of Fidelity Asset Management and Corporate Services and a member of Fidelity's Executive Committee (2010-present). Previously, Mr. O'Hanley served as President and Chief Executive Officer of BNY Mellon Asset Management (2007-2010). Mr. O'Hanley also served as Vice Chairman of Bank New York Mellon Corp. and a member of that firm's Executive Committee. Prior to the 2007 merger of The Bank of New York and Mellon Financial Corporation, he was Vice Chairman of Mellon Financial Corporation and President and Chief Executive Officer of Mellon Asset Management. He joined Mellon in February 1997. Mr. O'Hanley currently serves as Chairman of the Boston Public Library Foundation Board of Directors and sits on the Board of Directors of Beth Israel Deaconess Medical Center, the Board of Trustees of the Marine Biological Laboratory and the Advisory Board of the Maxwell School of Citizenship and Public Administration at Syracuse University. Mr. O'Hanley also chairs the Council on Asset Management for the Financial Services Roundtable and is a member of the Board of Directors of Institutional Investor's U.S. Institute. |
* Trustees have been determined to be "Interested Trustees" by virtue of, among other things, their affiliation with the trust or various entities under common control with FMR.
+ The information above includes each Trustee's principal occupation during the last five years and other information relating to the experience, attributes, and skills relevant to each Trustee's qualifications to serve as a Trustee, which led to the conclusion that each Trustee should serve as a Trustee for the fund.
Annual Report
Trustees and Officers - continued
Independent Trustees:
Correspondence intended for each Independent Trustee (that is, the Trustees other than the Interested Trustees) may be sent to Fidelity Investments, P.O. Box 55235, Boston, Massachusetts 02205-5235.
Name, Age; Principal Occupations and Other Relevant Experience+ |
Dennis J. Dirks (63) |
| Year of Election or Appointment: 2005 Prior to his retirement in May 2003, Mr. Dirks was Chief Operating Officer and a member of the Board of The Depository Trust & Clearing Corporation (DTCC). He also served as President, Chief Operating Officer, and Board member of The Depository Trust Company (DTC) and President and Board member of the National Securities Clearing Corporation (NSCC). In addition, Mr. Dirks served as Chief Executive Officer and Board member of the Government Securities Clearing Corporation, Chief Executive Officer and Board member of the Mortgage-Backed Securities Clearing Corporation, as a Trustee and a member of the Finance Committee of Manhattan College (2005-2008), and as a Trustee and a member of the Finance Committee of AHRC of Nassau County (2006-2008). Mr. Dirks is a member of the Independent Directors Council (IDC) Governing Council (2010-Present) and Board of Directors for The Brookville Center for Children's Services, Inc. (2009-present). |
Alan J. Lacy (57) |
| Year of Election or Appointment: 2008 Mr. Lacy serves as Senior Adviser (2007-present) of Oak Hill Capital Partners, L.P. (private equity). Mr. Lacy also served as Chief Executive Officer (2000-2005) and Vice Chairman (2005-2006) of Sears Holdings Corporation and Sears, Roebuck and Co. (retail). In addition, Mr. Lacy serves as a member of the Board of Directors of Dave & Buster's, Inc. (restaurant and entertainment complexes, 2010-present), The Hillman Companies, Inc. (hardware wholesalers, 2010-present), and Bristol-Myers Squibb Company (global pharmaceuticals, 2007-present). Mr. Lacy is a member of the Board of Trustees of The National Parks Conservation Association (2006-Present). Previously, Mr. Lacy served as Chairman of the Board of Trustees of the National Parks Conservation Association (2008-2011) and as a member of the Board of Directors for the Western Union Company (global money transfer, 2006-2011). |
Ned C. Lautenbach (67) |
| Year of Election or Appointment: 2000 Mr. Lautenbach is Chairman of the Independent Trustees of the Equity and High Income Funds (2006-present). Mr. Lautenbach currently serves as the Lead Director of the Eaton Corporation Board of Directors (diversified industrial, 1997-present). Mr. Lautenbach is also a member of the Board of Directors of the Philharmonic Center for the Arts in Naples, Florida (1999-present); a member of the Board of Trustees of Fairfield University (2005-present); and a member of the Council on Foreign Relations (1994-present). Previously, Mr. Lautenbach was a Partner/Advisory Partner at Clayton, Dubilier & Rice, LLC (private equity investment, 1998-2010), as well as a Director of Sony Corporation (2006-2007). |
Joseph Mauriello (66) |
| Year of Election or Appointment: 2008 Prior to his retirement in January 2006, Mr. Mauriello served in numerous senior management positions including Deputy Chairman and Chief Operating Officer (2004-2005), and Vice Chairman of Financial Services (2002-2004) of KPMG LLP US (professional services, 1965-2005). Mr. Mauriello currently serves as a member of the Board of Directors of XL Group plc. (global insurance and re-insurance, 2006-present) and of Arcadia Resources Inc. (health care services and products, 2007-present). Previously, Mr. Mauriello served as a Director of the Hamilton Funds of the Bank of New York (2006-2007). |
Robert W. Selander (60) |
| Year of Election or Appointment: 2011 Previously, Mr. Selander served as a Member of the Advisory Board of Fidelity's Equity and High Income Funds (2011), Executive Vice Chairman (2010), Chief Executive Officer (2009-2010), and President and Chief Executive Officer (1997-2009) of Mastercard, Inc. |
Cornelia M. Small (67) |
| Year of Election or Appointment: 2005 Ms. Small is a member of the Board of Directors of the Teagle Foundation (2009-present). Ms. Small is also a member of the Investment Committee, and Chair (2008-present) and a member of the Board of Trustees of Smith College. In addition, Ms. Small serves on the Investment Committee of the Berkshire Taconic Community Foundation (2008-present). Previously, Ms. Small served as Chairperson of the Investment Committee (2002-2008) of Smith College. In addition, Ms. Small served as Chief Investment Officer, Director of Global Equity Investments, and a member of the Board of Directors of Scudder, Stevens & Clark and Scudder Kemper Investments. |
William S. Stavropoulos (72) |
| Year of Election or Appointment: 2002 Mr. Stavropoulos is Vice Chairman of the Independent Trustees of the Equity and High Income Funds (2006-present). Mr. Stavropoulos serves as President and Founder of the Michigan Baseball Foundation, the Great Lakes Loons (2007-present). Mr. Stavropoulos is Chairman Emeritus of the Board of Directors of The Dow Chemical Company, where he previously served in numerous senior management positions, including President, CEO (1995-2000; 2002-2004), Chairman of the Executive Committee (2000-2006), and as a member of the Board of Directors (1990-2006). Currently, Mr. Stavropoulos is Chairman of Univar (global distributor of commodity and specialty chemicals, 2010-present), a Director of Teradata Corporation (data warehousing and technology solutions, 2008-present), Chemical Financial Corporation, Maersk Inc. (industrial conglomerate), Tyco International, Inc. (multinational manufacturing and services, 2007-present), and a member of the Advisory Board for Metalmark Capital (private equity investment, 2005-present). Mr. Stavropoulos is a special advisor to Clayton, Dubilier & Rice, LLC (private equity investment). In addition, Mr. Stavropoulos is a member of the University of Notre Dame Advisory Council for the College of Science. |
David M. Thomas (62) |
| Year of Election or Appointment: 2008 Previously, Mr. Thomas served as Executive Chairman (2005-2006) and Chairman and Chief Executive Officer (2000-2005) of IMS Health, Inc. (pharmaceutical and healthcare information solutions). In addition, Mr. Thomas serves as a member of the Board of Directors of Fortune Brands, Inc. (consumer products), and Interpublic Group of Companies, Inc. (marketing communication, 2004-present). |
Michael E. Wiley (60) |
| Year of Election or Appointment: 2008 Mr. Wiley also serves as a Director of Asia Pacific Exploration Consolidated (international oil and gas exploration and production, 2008-present). Mr. Wiley serves as a Director of Tesoro Corporation (independent oil refiner and marketer, 2005-present), and a Director of Bill Barrett Corporation (exploration and production, 2005-present). In addition, Mr. Wiley also serves as a Director of Post Oak Bank (privately-held bank, 2004-present). Previously, Mr. Wiley served as a member of the Board of Trustees of the University of Tulsa (2000-2006; 2007-2010), as a Senior Energy Advisor of Katzenbach Partners, LLC (consulting, 2006-2007), as an Advisory Director of Riverstone Holdings (private investment), Chairman, President, and CEO of Baker Hughes, Inc. (oilfield services, 2000-2004), and as Director of Spinnaker Exploration Company (exploration and production, 2001-2005). |
Annual Report
+ The information above includes each Trustee's principal occupation during the last five years and other information relating to the experience, attributes, and skills relevant to each Trustee's qualifications to serve as a Trustee, which led to the conclusion that each Trustee should serve as a Trustee for the fund.
Advisory Board Members and Executive Officers:
Correspondence intended for each executive officer, Edward C. Johnson 3d, and Peter S. Lynch may be sent to Fidelity Investments, 82 Devonshire Street, Boston, Massachusetts 02109.
Name, Age; Principal Occupation |
Edward C. Johnson 3d (81) |
| Year of Election or Appointment: 2011 Member of the Advisory Board of Fidelity's Equity and High Income Funds. Mr. Johnson serves as Chief Executive Officer, Chairman, and a Director of FMR LLC, and also serves as Chairman and Director of FIL Limited. Previously, Mr. Johnson served as a Trustee and Chairman of the Board of certain Fidelity Trusts, Chairman and a Director of FMR, Chairman and a Director of FMR Co., Inc., and President of FMR LLC (2006-2007). |
Peter S. Lynch (67) |
| Year of Election or Appointment: 2003 Member of the Advisory Board of Fidelity's Equity and High Income Funds. Mr. Lynch is Vice Chairman and a Director of FMR and FMR Co., Inc. In addition, Mr. Lynch serves as a Trustee of Boston College and as the Chairman of the Inner-City Scholarship Fund. Previously, Mr. Lynch served on the Special Olympics International Board of Directors (1997-2006). |
Kenneth B. Robins (41) |
| Year of Election or Appointment: 2008 President and Treasurer of Fidelity's Equity and High Income Funds. Mr. Robins also serves as President and Treasurer (2010-present) and Assistant Treasurer (2009-present) of other Fidelity funds and is an employee of Fidelity Investments (2004-present). Previously, Mr. Robins served as Deputy Treasurer of the Fidelity funds (2005-2008) and Treasurer and Chief Financial Officer of The North Carolina Capital Management Trust: Cash and Term Portfolios (2006-2008). |
Brian B. Hogan (46) |
| Year of Election or Appointment: 2009 Vice President of Equity and High Income Funds. Mr. Hogan also serves as President of FMR's Equity Division (2009-present). Previously, Mr. Hogan served as Senior Vice President, Equity Research of FMR (2006-2009) and as a portfolio manager. |
Thomas C. Hense (47) |
| Year of Election or Appointment: 2008 or 2010 Vice President of Fidelity's High Income (2008), Small Cap (2008), and Value (2010) Funds. Previously, Mr. Hense served as a portfolio manager for Fidelity's Institutional Money Management Group (Pyramis) (2003-2008). |
Scott C. Goebel (43) |
| Year of Election or Appointment: 2008 Secretary and Chief Legal Officer (CLO) of the Fidelity funds. Mr. Goebel also serves as Secretary of Fidelity Investments Money Management, Inc. (FIMM) (2010-present) and Fidelity Research and Analysis Company (FRAC) (2010-present); Secretary and CLO of The North Carolina Capital Management Trust: Cash and Term Portfolios (2008-present); General Counsel, Secretary, and Senior Vice President of FMR (2008-present) and FMR Co., Inc. (2008-present); employed by FMR LLC or an affiliate (2001-present); Chief Legal Officer of Fidelity Management & Research (Hong Kong) Limited (2008-present) and Assistant Secretary of Fidelity Management & Research (Japan) Inc. (2008-present), and Fidelity Management & Research (U.K.) Inc. (2008-present). Previously, Mr. Goebel served as Assistant Secretary of FIMM (2008-2010), FRAC (2008-2010), and the Funds (2007-2008) and as Vice President and Secretary of Fidelity Distributors Corporation (FDC) (2005-2007). |
William C. Coffey (42) |
| Year of Election or Appointment: 2009 Assistant Secretary of Fidelity's Equity and High Income Funds. Mr. Coffey also serves as Senior Vice President and Deputy General Counsel of FMR LLC (2010-present), and is an employee of Fidelity Investments. Previously, Mr. Coffey served as Vice President and Associate General Counsel of FMR LLC (2005-2009). |
Holly C. Laurent (57) |
| Year of Election or Appointment: 2008 Anti-Money Laundering (AML) Officer of the Fidelity funds. Ms. Laurent also serves as AML Officer of The North Carolina Capital Management Trust: Cash and Term Portfolios (2008-present) and is an employee of Fidelity Investments. Previously, Ms. Laurent was Senior Vice President and Head of Legal for Fidelity Business Services India Pvt. Ltd. (2006-2008), and Senior Vice President, Deputy General Counsel and Group Head for FMR LLC (2005-2006). |
Christine Reynolds (52) |
| Year of Election or Appointment: 2008 Chief Financial Officer of the Fidelity funds. Ms. Reynolds became President of Fidelity Pricing and Cash Management Services (FPCMS) in August 2008. Ms. Reynolds served as Chief Operating Officer of FPCMS (2007-2008). Previously, Ms. Reynolds served as President, Treasurer, and Anti-Money Laundering officer of the Fidelity funds (2004-2007). |
Kenneth A. Rathgeber (64) |
| Year of Election or Appointment: 2004 Chief Compliance Officer of Fidelity's Equity and High Income Funds. Mr. Rathgeber is Chief Compliance Officer of Fidelity Management & Research (Hong Kong) Limited (2008-present), Fidelity Management & Research (Japan) Inc. (2008-present), FMR (2005-present), FMR Co., Inc. (2005-present), Fidelity Management & Research (U.K.) Inc. (2005-present), Fidelity Research & Analysis Company (2005-present), Fidelity Investments Money Management, Inc. (2005-present), Pyramis Global Advisors, LLC (2005-present), and Strategic Advisers, Inc. (2005-present). |
Jeffrey S. Christian (49) |
| Year of Election or Appointment: 2009 Deputy Treasurer of the Fidelity funds. Mr. Christian is an employee of Fidelity Investments. Previously, Mr. Christian served as Chief Financial Officer (2008-2009) of certain Fidelity funds and Senior Vice President of Fidelity Pricing and Cash Management Services (FPCMS) (2004-2009). |
Bryan A. Mehrmann (50) |
| Year of Election or Appointment: 2005 Deputy Treasurer of the Fidelity funds. Mr. Mehrmann is an employee of Fidelity Investments. |
Adrien E. Deberghes (43) |
| Year of Election or Appointment: 2008 Deputy Treasurer of Fidelity's Equity and High Income Funds. Mr. Deberghes also serves as Assistant Treasurer of other Fidelity funds (2010-present) and is an employee of Fidelity Investments (2008-present). Previously, Mr. Deberghes served as Senior Vice President of Mutual Fund Administration at State Street Corporation (2007-2008), Senior Director of Mutual Fund Administration at Investors Bank & Trust (2005-2007), and Director of Finance for Dunkin' Brands (2000-2005). |
Stephanie J. Dorsey (42) |
| Year of Election or Appointment: 2010 Assistant Treasurer of Fidelity's Equity and High Income Funds. Ms. Dorsey also serves as Deputy Treasurer of other Fidelity funds (2008-present) and is an employee of Fidelity Investments (2008-present). Previously, Ms. Dorsey served as Treasurer (2004-2008) of the JPMorgan Mutual Funds and Vice President (2004-2008) of JPMorgan Chase Bank. |
John R. Hebble (53) |
| Year of Election or Appointment: 2009 Assistant Treasurer of Fidelity's Equity and High Income Funds. Mr. Hebble also serves as President (2011-present), Treasurer, and Chief Financial Officer of The North Carolina Capital Management Trust: Cash and Term Portfolios (2008-present), President and Treasurer of other Fidelity funds (2008-present) and is an employee of Fidelity Investments. |
Gary W. Ryan (52) |
| Year of Election or Appointment: 2005 Assistant Treasurer of the Fidelity funds. Mr. Ryan is an employee of Fidelity Investments. Previously, Mr. Ryan served as Vice President of Fund Reporting in Fidelity Pricing and Cash Management Services (FPCMS) (1999-2005). |
Jonathan Davis (43) |
| Year of Election or Appointment: 2010 Assistant Treasurer of the Fidelity funds. Mr. Davis is an employee of Fidelity Investments. Previously, Mr. Davis served as Vice President and Associate General Counsel of FMR LLC (2003-2010). |
Annual Report
The Board of Trustees of Fidelity Small Cap Value Fund voted to pay shareholders of record at the opening of business on record date, the following distributions per share derived from capital gains realized from sales of portfolio securities.
| Pay Date | Record Date | Capital Gains |
Small Cap Value | 09/12/2011 | 09/09/2011 | $0.815 |
Small Cap Value designates 100% of the dividends distributed during the fiscal year as qualifying for the dividends-received deduction for corporate shareholders.
Small Cap Value designates 100% of the dividends distributed during the fiscal year as amounts which can be taken into account as a dividend for the purposes of the maximum rate under section 1(h)(11) of the Internal Revenue Code.
The fund hereby designates as a capital gain dividend with respect to the taxable year ended July 31, 2011, $147,340,051, or, if subsequently determined to be different, the net capital gain of such year.
The fund will notify shareholders in January 2012 of amounts for use in preparing 2011 income tax returns.
Annual Report
Board Approval of Investment Advisory Contracts and Management Fees
Fidelity Small Cap Value Fund
Each year, the Board of Trustees, including the Independent Trustees (together, the Board), votes on the renewal of the management contract and sub-advisory agreements (together, the Advisory Contracts) for the fund. The Board, assisted by the advice of fund counsel and Independent Trustees' counsel, requests and considers a broad range of information relevant to the renewal of the Advisory Contracts throughout the year.
The Board meets regularly and considers at each of its meetings factors that are relevant to its annual consideration of the renewal of the fund's Advisory Contracts, including the services and support provided to the fund and its shareholders. The Board has established various standing committees, each composed of Independent Trustees with varying backgrounds, to which the Board has assigned specific subject matter responsibilities in order to enhance effective decision-making by the Board. The Board, acting directly and through its Committees, requests and receives information concerning the annual consideration of the renewal of the fund's Advisory Contracts. The Board also meets as needed to consider matters specifically related to the Board's annual consideration of the renewal of Advisory Contracts. Members of the Board may also meet with trustees of other Fidelity funds through ad hoc joint committees to discuss certain matters relevant to the Fidelity funds.
At its July 2011 meeting, the Board of Trustees, including the Independent Trustees, unanimously determined to renew the fund's Advisory Contracts. In reaching its determination, the Board considered all factors it believed relevant, including (i) the nature, extent, and quality of the services to be provided to the fund and its shareholders (including the investment performance of the fund); (ii) the competitiveness of the fund's management fee and total expense ratio; (iii) the total costs of the services to be provided by and the profits to be realized by Fidelity from its relationship with the fund; (iv) the extent to which economies of scale would be realized as the fund grows; and (v) whether fee levels reflect these economies of scale, if any, for the benefit of fund shareholders.
In considering whether to renew the Advisory Contracts for the fund, the Board reached a determination, with the assistance of fund counsel and Independent Trustees' counsel and through the exercise of its business judgment, that the renewal of the Advisory Contracts is in the best interests of the fund and its shareholders and that the compensation payable under the Advisory Contracts is fair and reasonable. The Board's decision to renew the Advisory Contracts was not based on any single factor, but rather was based on a comprehensive consideration of all the information provided to the Board at its meetings throughout the year. The Board, in reaching its determination to renew the Advisory Contracts, is aware that shareholders in the fund have a broad range of investment choices available to them, including a wide choice among mutual funds offered by Fidelity's competitors, and that the fund's shareholders, who have the opportunity to review and weigh the disclosure provided by the fund in its prospectus and other public disclosures, have chosen to invest in this fund, managed by Fidelity.
Annual Report
Nature, Extent, and Quality of Services Provided. The Board considered the staffing within the investment adviser, FMR, and the sub-advisers (together, the Investment Advisers), including the backgrounds of the fund's investment personnel and the fund's investment objective and discipline. The Independent Trustees also had discussions with senior management of Fidelity's investment operations and investment groups. The Board considered the structure of the portfolio manager compensation program and whether this structure provides appropriate incentives to act in the best interests of the fund.
Resources Dedicated to Investment Management and Support Services. The Board and the Fund Oversight and Research Committees reviewed the general qualifications and capabilities of the Investment Advisers' investment staff, including its size, education, experience, and resources, as well as the Investment Advisers' approach to recruiting, training, managing, and compensating investment personnel. The Board also noted that FMR has devoted increased resources to non-U.S. offices. The Board noted that Fidelity's analysts have extensive resources, tools and capabilities which allow them to conduct sophisticated quantitative and fundamental analysis, as well as credit analysis of issuers, counterparties and enhancers. The Board also believes that Fidelity's investment professionals have sufficient access to global information and data so as to provide competitive investment results over time, and that those professionals also have access to sophisticated tools which permit them to assess portfolio construction and risk and performance attribution characteristics continuously, as well as to transmit new information and research conclusions rapidly around the world. Additionally, in their deliberations, the Board considered the Investment Advisers' trading capabilities and resources which are an integral part of the investment management process.
Shareholder and Administrative Services. The Board considered (i) the nature, extent, quality, and cost of advisory, administrative, and shareholder services performed by the Investment Advisers and their affiliates under the Advisory Contracts and under separate agreements covering transfer agency, pricing and bookkeeping, and securities lending services for the fund; (ii) the nature and extent of the investment adviser's supervision of third party service providers, principally custodians and subcustodians; and (iii) the resources devoted to, and the record of compliance with, the fund's compliance policies and procedures. The Board also reviewed the allocation of fund brokerage, including allocations to brokers affiliated with the Investment Advisers, the use of brokerage commissions to pay fund expenses, and the use of "soft" commission dollars to pay for research services.
The Board noted that the growth of fund assets over time across the complex allows Fidelity to reinvest in the development of services designed to enhance the value or convenience of the Fidelity funds as investment vehicles. These services include 24-hour access to account information and market information through telephone representatives and over the Internet, investor education materials and asset allocation tools, and the expanded availability of Fidelity Investor Centers, with 35 new branches opening since 2010.
Annual Report
Board Approval of Investment Advisory Contracts and
Management Fees - continued
Investment in a Large Fund Family. The Board considered the benefits to shareholders of investing in a Fidelity fund, including the benefits of investing in a fund that is part of a large family of funds offering a variety of investment disciplines and providing a large variety of mutual fund investor services. The Board noted that Fidelity had taken, or had made recommendations that resulted in the Fidelity funds taking, a number of actions over the previous year that benefited particular funds, including (i) continuing to dedicate additional resources to investment research and support of the senior management team that oversees asset management; (ii) rationalizing product lines through the mergers of six funds into other funds; (iii) continuing to migrate the Freedom Funds to dedicated lower cost underlying funds; (iv) obtaining shareholder approval to broaden the investment strategies for Fidelity Consumer Finance Portfolio, Fidelity Emerging Asia Fund, and Fidelity Environment and Alternative Energy Portfolio; (v) contractually agreeing to reduce the management fees and impose other expense limitations on Spartan® 500 Index Fund and U.S. Bond Index Fund in connection with launching new institutional classes of these funds; (vi) changing the name, primary and supplemental benchmarks, and investment policies of Fidelity Global Strategies Fund to support the fund's flexible investment mandate and global orientation; and (vii) reducing the transfer agency account fee rates on certain accounts.
Investment Performance. The Board considered whether the fund has operated in accordance with its investment objective, as well as its record of compliance with its investment restrictions. It also reviewed the fund's absolute investment performance for each class, as well as the fund's relative investment performance for each class measured over multiple periods against (i) a broad-based securities market index, and (ii) a peer group of mutual funds deemed appropriate by Fidelity and reviewed by the Board. The following charts considered by the Board show, over the one-, three-, and five-year periods ended December 31, 2010, the cumulative total returns of Institutional Class (Class I) and Class C of the fund, the cumulative total returns of a broad-based securities market index ("benchmark"), and a range of cumulative total returns of a peer group of mutual funds identified by Morningstar, Inc. as having an investment style similar to that of the fund based on underlying portfolio holdings. The returns of Institutional Class (Class I) and Class C show the performance of the highest and lowest performing classes, respectively (based on five-year performance). The box within each chart shows the 25th percentile return (bottom of box) and the 75th percentile return (top of box) of the peer group. Returns shown above the box are in the first quartile and returns shown below the box are in the fourth quartile. The percentage beaten numbers noted below each chart correspond to the percentile box and represent the percentage of funds in the peer group whose performance was equal to or lower than that of the class indicated.
Annual Report
Fidelity Small Cap Value Fund
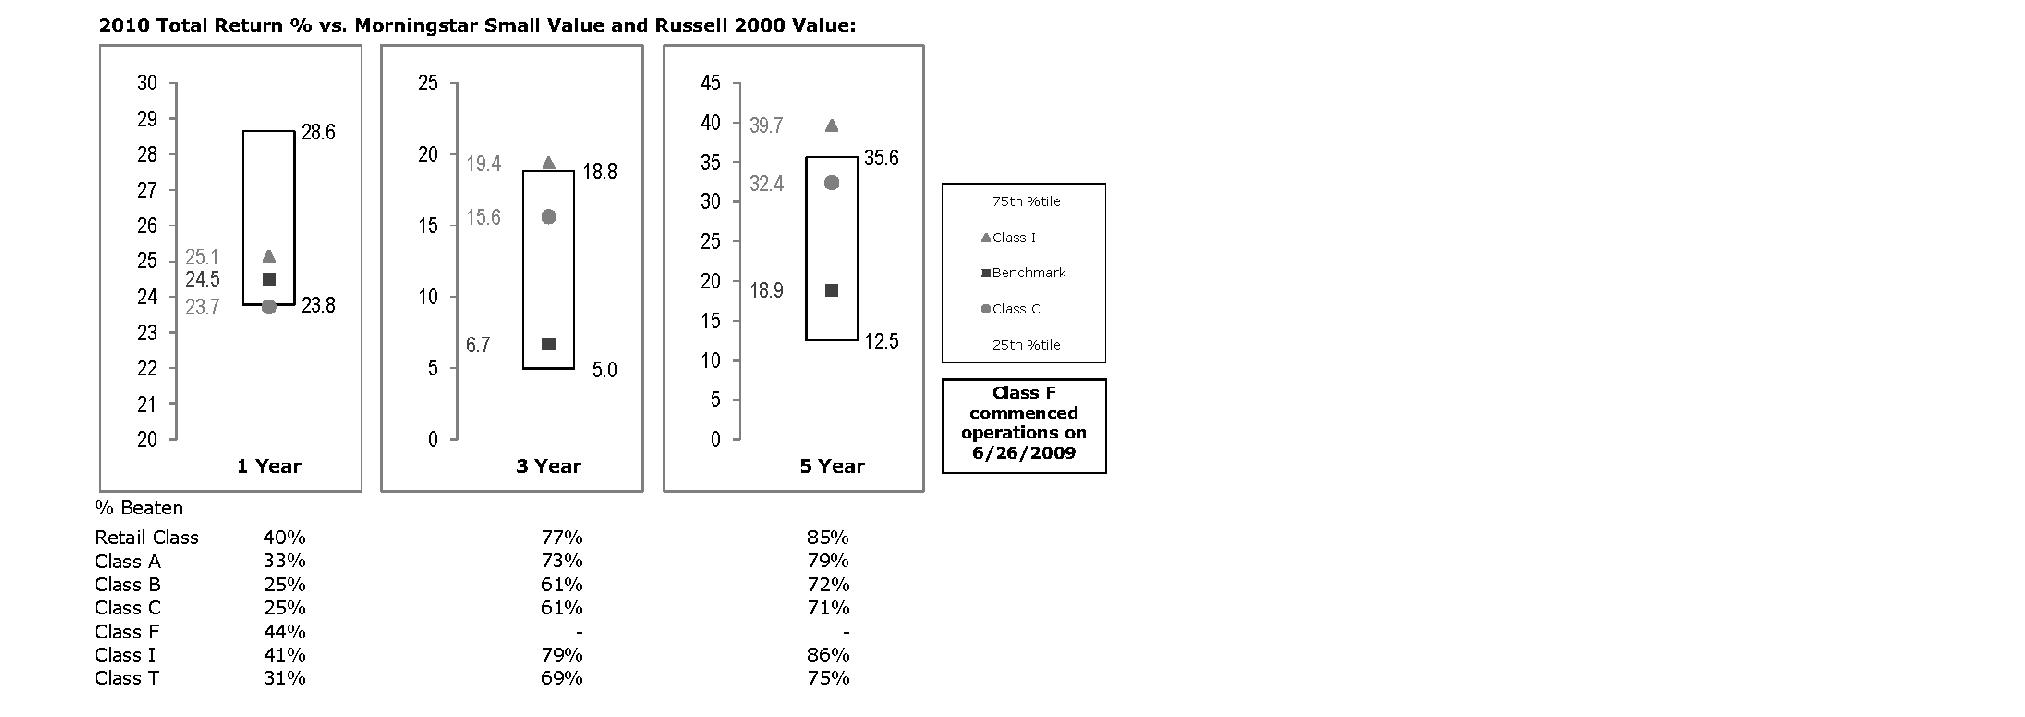
The Board reviewed the fund's relative investment performance against its peer group and noted that the performance of Institutional Class (Class I) of the fund was in the third quartile for the one-year period and the first quartile for the three- and five-year periods. The Board also noted that the investment performance of Institutional Class (Class I) of the fund compared favorably to its benchmark for all the periods shown. The Board considered that the variations in performance among the fund's classes reflect the variations in class expenses, which result in lower performance for higher expense classes. The Board also reviewed the fund's performance since inception as well as performance in the current year.
The Board also considered that the fund's management fee is subject to upward or downward adjustment depending upon whether, and to what extent, the fund's investment performance for the performance period exceeds, or is exceeded by, the record (over the same period) of a Board-approved performance adjustment index. The Board noted that the performance adjustment provides FMR with a strong economic incentive to seek to achieve superior performance for the fund's shareholders and helps to more closely align the interests of FMR and the fund's shareholders.
Based on its review, the Board concluded that the nature, extent, and quality of services provided to the fund under the Advisory Contracts should benefit the fund's shareholders.
Annual Report
Board Approval of Investment Advisory Contracts and
Management Fees - continued
Competitiveness of Management Fee and Total Expense Ratio. The Board considered the fund's management fee and total expense ratio compared to "mapped groups" of competitive funds and classes. Fidelity creates "mapped groups" by combining similar Lipper investment objective categories that have comparable management fee characteristics. Combining Lipper investment objective categories aids the Board's management fee and total expense ratio comparisons by broadening the competitive group used for comparison and by reducing the number of universes to which various Fidelity funds are compared.
Management Fee. The Board considered two proprietary management fee comparisons for the 12-month periods shown in the chart below. The group of Lipper funds used by the Board for management fee comparisons is referred to below as the "Total Mapped Group." The Total Mapped Group comparison focuses on a fund's standing relative to the total universe of comparable funds available to investors in terms of gross management fees before expense reimbursements or caps, and without giving effect to the fund's performance adjustment. "TMG %" represents the percentage of funds in the Total Mapped Group that had management fees that were lower than the fund's. For example, a TMG % of 14% means that 86% of the funds in the Total Mapped Group had higher management fees than the fund. The "Asset-Size Peer Group" (ASPG) comparison focuses on a fund's standing relative to non-Fidelity funds similar in size to the fund within the Total Mapped Group. The ASPG represents at least 15% of the funds in the Total Mapped Group with comparable asset size and management fee characteristics, subject to a minimum of 50 funds (or all funds in the Total Mapped Group if fewer than 50). Additional information, such as the ASPG quartile in which the fund's management fee ranked and the impact of the fund's performance adjustment, is also included in the chart and considered by the Board.
Annual Report
Fidelity Small Cap Value Fund
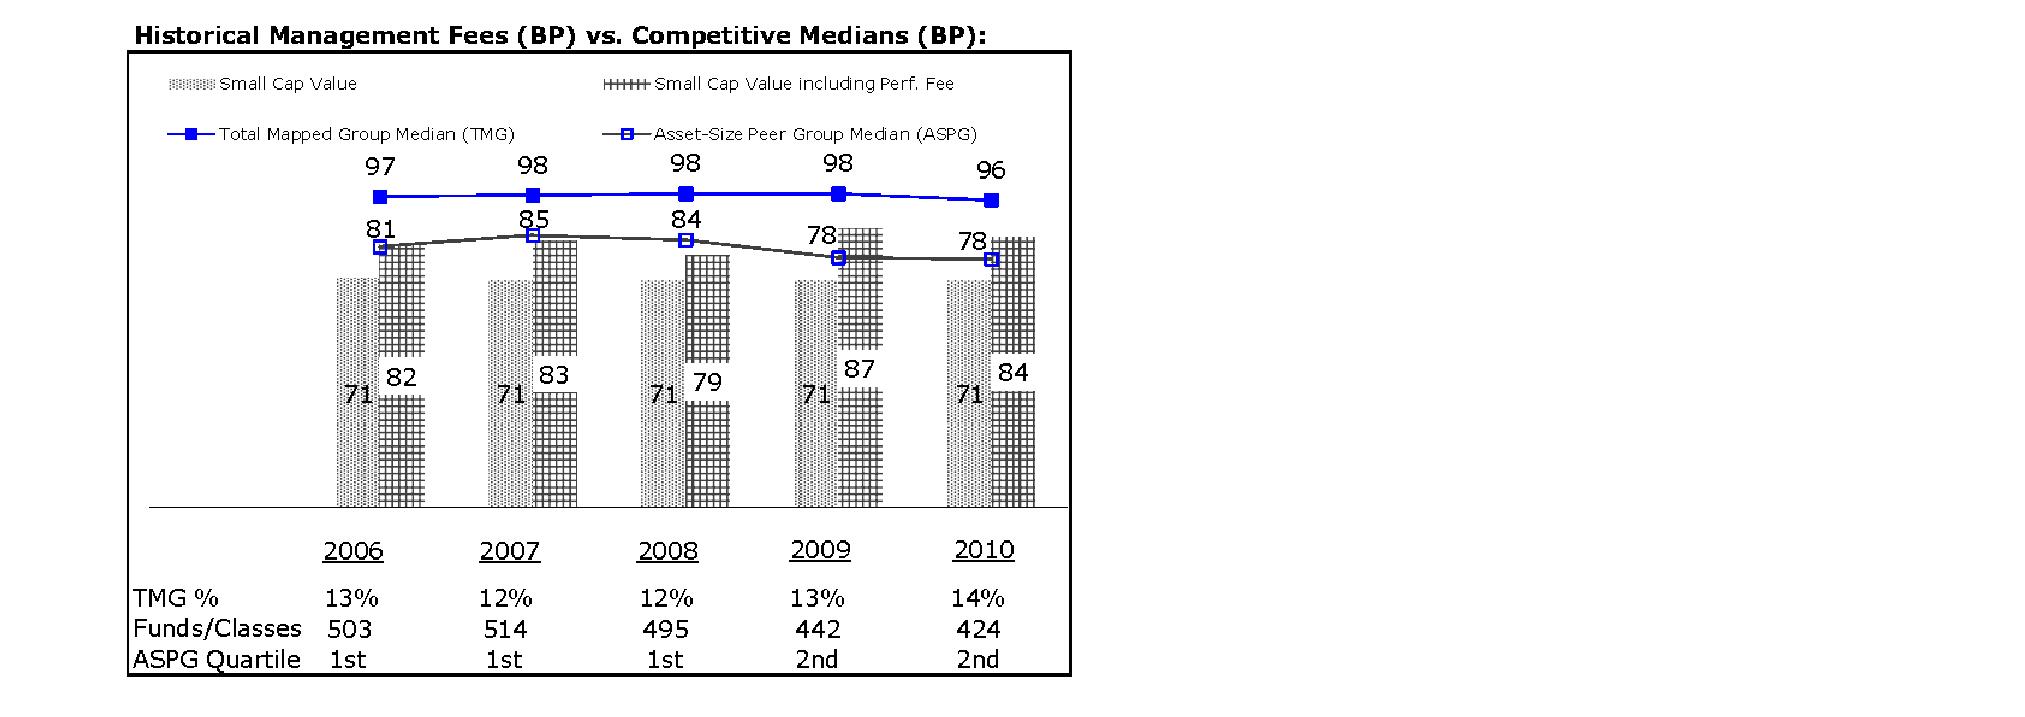
The Board noted that the fund's management fee ranked below the median of its Total Mapped Group and below the median of its ASPG for 2010. The Board also noted the effect of the fund's positive performance adjustment on the fund's management fee ranking. The Board noted that the performance adjustment for each year represents calculations for performance periods that differ from the periods shown in the performance charts above.
Based on its review, the Board concluded that the fund's management fee is fair and reasonable in light of the services that the fund receives and the other factors considered.
Total Expense Ratio. In its review of each class's total expense ratio, the Board considered the fund's management fee as well as other fund or class expenses, as applicable, such as transfer agent fees, pricing and bookkeeping fees, fund-paid 12b-1 fees, and custodial, legal, and audit fees. The Board also noted the effects of any waivers and reimbursements on fees and expenses, as well as the impact of the fund's performance adjustment. As part of its review, the Board also considered the current and historical total expense ratios of each class of the fund compared to competitive fund median expenses. Each class of the fund is compared to those funds and classes in the Total Mapped Group (used by the Board for management fee comparisons) that have a similar sales load structure.
The Board noted that the total expense ratio of each of Institutional Class, the retail class, and Class F ranked below its competitive median for 2010 and the total expense ratio of each of Class A, Class T, Class B, and Class C ranked above its competitive median for 2010. The Board considered that various factors, including 12b-1 fees, positive or negative performance adjustments, and relatively higher other expenses in the case of small fund size, can affect total expense ratios. The Board noted that the total expense ratio of Class T was above the competitive median primarily because of higher 12b-1 fees on Class T. Class T has a higher 12b-1 fee, but a lower front-end sales charge, than traditionally priced front-end sales charge classes. The Board noted that the fund offers multiple classes, each of which has a different sales load and 12b-1 fee structure, and that the multiple structures are intended to offer a range of pricing options for the intermediary market. The Board also noted that the total expense ratios of the classes vary primarily by the level of their 12b-1 fees, although differences in transfer agent fees may also cause expenses to vary from class to class.
Annual Report
Board Approval of Investment Advisory Contracts and
Management Fees - continued
Fees Charged to Other Fidelity Clients. The Board also considered Fidelity fee structures and other information with respect to clients of FMR and its affiliates, such as other mutual funds advised or subadvised by FMR or its affiliates, pension plan clients, and other institutional clients. In March 2010, the Board created an ad hoc joint committee with the board of other Fidelity funds (the Committee) to review and compare Fidelity's institutional investment advisory business with its business of providing services to the Fidelity funds, including the differences in services provided, fees charged, and costs incurred, as well as competition in their respective marketplaces.
Based on its review of total expense ratios and fees charged to other Fidelity clients, the Board concluded that the total expense ratio of each class of the fund was reasonable, although in some cases above the median of the universe presented for comparison, in light of the services that the fund and its shareholders receive and the other factors considered, including the findings of the Committee.
Costs of the Services and Profitability. The Board considered the revenues earned and the expenses incurred by Fidelity in conducting the business of developing, marketing, distributing, managing, administering and servicing the fund and its shareholders. The Board also considered the level of Fidelity's profits in respect of all the Fidelity funds.
On an annual basis, FMR presents to the Board Fidelity's profitability for the fund. Fidelity calculates the profitability for each fund, as well as aggregate profitability for groups of Fidelity funds and all Fidelity funds, using a series of detailed revenue and cost allocation methodologies which originate with the books and records of Fidelity on which Fidelity's audited financial statements are based. The Audit Committee of the Board reviews any significant changes from the prior year's methodologies.
PricewaterhouseCoopers LLP (PwC), independent registered public accounting firm and auditor to Fidelity and certain Fidelity funds, has been engaged annually by the Board as part of the Board's assessment of Fidelity's profitability analysis. PwC's engagement includes the review and assessment of Fidelity's methodologies used in determining the revenues and expenses attributable to Fidelity's mutual fund business, and completion of agreed-upon procedures surrounding the mathematical accuracy of fund profitability and its conformity to allocation methodologies. After considering PwC's reports issued under the engagement and information provided by Fidelity, the Board concluded that while other allocation methods may also be reasonable, Fidelity's profitability methodologies are reasonable in all material respects.
Annual Report
The Board also reviewed Fidelity's non-fund businesses and fall-out benefits related to the mutual fund business as well as cases where Fidelity's affiliates may benefit from or be related to the fund's business.
The Board considered the costs of the services provided by and the profits realized by Fidelity in connection with the operation of the fund and was satisfied that the profitability was not excessive in the circumstances.
Economies of Scale. The Board considered whether there have been economies of scale in respect of the management of the Fidelity funds, whether the Fidelity funds (including the fund) have appropriately benefited from any such economies of scale, and whether there is potential for realization of any further economies of scale. The Board considered the extent to which the fund will benefit from economies of scale through increased services to the fund, through waivers or reimbursements, or through fee or expense reductions. The Board also noted that in 2009, it and the board of other Fidelity funds created an ad hoc committee (the Economies of Scale Committee) to analyze whether FMR attains economies of scale in respect of the management and servicing of the Fidelity funds, whether the Fidelity funds have appropriately benefited from such economies of scale, and whether there is potential for realization of any further economies of scale.
The Board recognized that the fund's management contract incorporates a "group fee" structure, which provides for lower group fee rates as total fund assets under FMR's management increase, and for higher group fee rates as total fund assets under FMR's management decrease. FMR calculates the group fee rates based on a tiered asset "breakpoint" schedule that varies based on asset class. The Board considered that the group fee is designed to deliver the benefits of economies of scale to fund shareholders when total Fidelity fund assets increase, even if assets of any particular fund are unchanged or have declined, because some portion of Fidelity's costs are attributable to services provided to all Fidelity funds, and all funds benefit if those costs can be allocated among more assets. The Board concluded that, given the group fee structure, fund shareholders will benefit from lower management fees as assets under FMR's management increase at the fund complex level, regardless of whether Fidelity achieves any such economies of scale.
The Board concluded, taking into account the analysis of the Economies of Scale Committee, that any potential economies of scale are being appropriately shared between fund shareholders and Fidelity.
Annual Report
Board Approval of Investment Advisory Contracts and
Management Fees - continued
Additional Information Requested by the Board. In order to develop fully the factual basis for consideration of the Fidelity funds' Advisory Contracts, the Board requested and received additional information on certain topics, including (i) fund performance trends, actions to be taken by FMR to improve certain funds' overall performance, and Fidelity's long-term strategies for certain funds; (ii) portfolio manager changes that have occurred during the past year and length of portfolio manager tenure for different categories of funds over time; (iii) Fidelity's compensation structure for portfolio managers and other key personnel and strategies for attracting and retaining non-investment personnel; (iv) the amount of the investment that each portfolio manager has made in the Fidelity fund(s) that he or she manages; (v) historical trends in Fidelity's realization of fall-out benefits; (vi) Fidelity's group fee structures and the rationale for the individual fee rates of certain funds; (vii) fund profitability methodology and the impact of certain factors on fund profitability results; (viii) trends regarding industry use of performance fee structures and Fidelity's compliance practices with respect to performance adjustment calculations; (ix) the fee structures in place for certain other Fidelity clients; and (x) explanations regarding the relative total expense ratios of certain funds and classes, total expense competitive trends, and actions that might be taken by FMR to reduce total expense ratios for certain funds and classes.
Based on its evaluation of all of the conclusions noted above, and after considering all factors it believed relevant, the Board ultimately concluded that the advisory fee structures are fair and reasonable, and that the fund's Advisory Contracts should be renewed.
Annual Report
Managing Your Investments
Fidelity offers several ways to conveniently manage your personal investments via your telephone or PC. You can access your account information, conduct trades and research your investments 24 hours a day.
By Phone
Fidelity Automated Service Telephone provides a single toll-free number to access account balances, positions, quotes and trading. It's easy to navigate the service, and on your first call, the system will help you create a personal identification number (PIN) for security.
(phone_graphic)
Fidelity Automated
Service Telephone (FAST®)
1-800-544-5555
Press
For mutual fund and brokerage trading.
For quotes.*
For account balances and holdings.
To review orders and mutual
fund activity.
To change your PIN.
To speak to a Fidelity representative.
By PC
Fidelity's web site on the Internet provides a wide range of information, including daily financial news, fund performance, interactive planning tools and news about Fidelity products and services.
(computer_graphic)
Fidelity's Web Site
www.fidelity.com
* When you call the quotes line, please remember that a fund's yield and return will vary and, except for money market funds, share price will also vary. This means that you may have a gain or loss when you sell your shares. There is no assurance that money market funds will be able to maintain a stable $1 share price; an investment in a money market fund is not insured or guaranteed by the U.S. government. Total returns are historical and include changes in share price, reinvestment of dividends and capital gains distributions, and the effects of any sales charges.
Annual Report
To Visit Fidelity
For directions and hours,
please call 1-800-544-9797.
Arizona
7001 West Ray Road
Chandler, AZ
15445 N. Scottsdale Road
Scottsdale, AZ
17550 North 75th Avenue
Glendale, AZ
5330 E. Broadway Blvd
Tucson, AZ
California
815 East Birch Street
Brea, CA
1411 Chapin Avenue
Burlingame, CA
851 East Hamilton Avenue
Campbell, CA
601 Larkspur Landing Circle
Larkspur, CA
2000 Avenue of the Stars
Los Angeles, CA
27101 Puerta Real
Mission Viejo, CA
73575 El Paseo
Palm Desert, CA
251 University Avenue
Palo Alto, CA
123 South Lake Avenue
Pasadena, CA
16656 Bernardo Ctr. Drive
Rancho Bernardo, CA
1220 Roseville Parkway
Roseville, CA
1740 Arden Way
Sacramento, CA
7676 Hazard Center Drive
San Diego, CA
11943 El Camino Real
San Diego, CA
8 Montgomery Street
San Francisco, CA
3793 State Street
Santa Barbara, CA
1200 Wilshire Boulevard
Santa Monica, CA
398 West El Camino Real
Sunnyvale, CA
111 South Westlake Blvd
Thousand Oaks, CA
21701 Hawthorne Boulevard
Torrance, CA
2001 North Main Street
Walnut Creek, CA
6326 Canoga Avenue
Woodland Hills, CA
2211 Michelson Drive
Irvine, CA
Colorado
281 East Flatiron Circle
Broomfield, CO
1625 Broadway
Denver, CO
9185 Westview Road
Lone Tree, CO
Connecticut
48 West Putnam Avenue
Greenwich, CT
265 Church Street
New Haven, CT
300 Atlantic Street
Stamford, CT
29 South Main Street
West Hartford, CT
1261 Post Road
Fairfield, CT
Delaware
400 Delaware Avenue
Wilmington, DE
Florida
175 East Altamonte Drive
Altamonte Springs, FL
1400 Glades Road
Boca Raton, FL
121 Alhambra Plaza
Coral Gables, FL
2948 N. Federal Highway
Ft. Lauderdale, FL
4671 Town Center Parkway
Jacksonville, FL
8880 Tamiami Trail, North
Naples, FL
230 Royal Palm Way
Palm Beach, FL
3501 PGA Boulevard
Palm Beach Gardens, FL
3550 Tamiami Trail, South
Sarasota, FL
1502 N. Westshore Blvd.
Tampa, FL
2465 State Road 7
Wellington, FL
Georgia
3242 Peachtree Road
Atlanta, GA
1000 Abernathy Road
Atlanta, GA
Illinois
One North LaSalle Street
Chicago, IL
401 North Michigan Avenue
Chicago, IL
One Skokie Valley Road
Highland Park, IL
1415 West 22nd Street
Oak Brook, IL
15105 S LaGrange Road
Orland Park, IL
1572 East Golf Road
Schaumburg, IL
1823 Freedom Drive
Naperville, IL
Indiana
8480 Keystone Crossing
Indianapolis, IN
Kansas
5400 College Boulevard
Overland Park, KS
Maine
Three Canal Plaza
Portland, ME
Maryland
7315 Wisconsin Avenue
Bethesda, MD
610 York Road
Towson, MD
Massachusetts
801 Boylston Street
Boston, MA
155 Congress Street
Boston, MA
300 Granite Street
Braintree, MA
44 Mall Road
Burlington, MA
238 Main Street
Cambridge, MA
200 Endicott Street
Danvers, MA
Fidelity Brokerage Services, Inc., 100 Summer St., Boston, MA 02110 Member NYSE/SIPC
Annual Report
405 Cochituate Road
Framingham, MA
551 Boston Turnpike
Shrewsbury, MA
Michigan
500 E. Eisenhower Pkwy.
Ann Arbor, MI
280 N. Old Woodward Ave.
Birmingham, MI
30200 Northwestern Hwy.
Farmington Hills, MI
43420 Grand River Avenue
Novi, MI
3480 28th Street
Grand Rapids, MI
2425 S. Linden Road STE E
Flint, MI
Minnesota
7740 France Avenue South
Edina, MN
8342 3rd Street North
Oakdale, MN
Missouri
1524 South Lindbergh Blvd.
St. Louis, MO
Nevada
2225 Village Walk Drive
Henderson, NV
New Jersey
501 Route 73 South
Marlton, NJ
150 Essex Street
Millburn, NJ
35 Morris Street
Morristown, NJ
396 Route 17, North
Paramus, NJ
3518 Route 1 North
Princeton, NJ
530 Broad Street
Shrewsbury, NJ
New Mexico
2261 Q Street NE
Albuquerque, NM
New York
1130 Franklin Avenue
Garden City, NY
37 West Jericho Turnpike
Huntington Station, NY
1271 Avenue of the Americas
New York, NY
980 Madison Avenue
New York, NY
61 Broadway
New York, NY
350 Park Avenue
New York, NY
200 Fifth Avenue
New York, NY
733 Third Avenue
New York, NY
2070 Broadway
New York, NY
1075 Northern Blvd.
Roslyn, NY
799 Central Park Avenue
Scarsdale, NY
3349 Monroe Avenue
Rochester, NY
North Carolina
4611 Sharon Road
Charlotte, NC
7011 Fayetteville Road
Durham, NC
Ohio
3805 Edwards Road
Cincinnati, OH
1324 Polaris Parkway
Columbus, OH
1800 Crocker Road
Westlake, OH
28699 Chagrin Boulevard
Woodmere Village, OH
Oregon
7493 SW Bridgeport Road
Tigard, OR
Pennsylvania
600 West DeKalb Pike
King of Prussia, PA
1735 Market Street
Philadelphia, PA
12001 Perry Highway
Wexford, PA
Rhode Island
10 Memorial Boulevard
Providence, RI
Tennessee
3018 Peoples Street
Johnson City, TN
7628 West Farmington Blvd.
Germantown, TN
2035 Mallory Lane
Franklin, TN
Texas
10000 Research Boulevard
Austin, TX
4001 Northwest Parkway
Dallas, TX
12532 Memorial Drive
Houston, TX
2701 Drexel Drive
Houston, TX
6560 Fannin Street
Houston, TX
1701 Lake Robbins Drive
The Woodlands, TX
6500 N. MacArthur Blvd.
Irving, TX
6005 West Park Boulevard
Plano, TX
1576 East Southlake Blvd.
Southlake, TX
15600 Southwest Freeway
Sugar Land, TX
139 N. Loop 1604 East
San Antonio, TX
Utah
279 West South Temple
Salt Lake City, UT
Virginia
1861 International Drive
McLean, VA
11957 Democracy Drive
Reston, VA
Washington
10500 NE 8th Street
Bellevue, WA
1518 6th Avenue
Seattle, WA
304 Strander Blvd
Tukwila, WA
Washington, DC
1900 K Street, N.W.
Washington, DC
Wisconsin
16020 West Bluemound Road
Brookfield, WI
Annual Report
Investment Adviser
Fidelity Management & Research Company
Boston, MA
Investment Sub-Advisers
FMR Co., Inc.
Fidelity Management & Research
(U.K.) Inc.
Fidelity Management & Research
(Hong Kong) Limited
Fidelity Management & Research
(Japan) Inc.
General Distributor
Fidelity Distributors Corporation
Boston, MA
Transfer and Service Agents
Fidelity Investments Institutional
Operations Company, Inc.
Boston, MA
Fidelity Service Company, Inc.
Boston, MA
Custodian
Citibank, N.A.
New York, NY
The Fidelity Telephone Connection
Mutual Fund 24-Hour Service
Exchanges/Redemptions
and Account Assistance 1-800-544-6666
Product Information 1-800-544-6666
Retirement Accounts 1-800-544-4774
(8 a.m. - 9 p.m.)
TDD Service 1-800-544-0118
for the deaf and hearing impaired
(9 a.m. - 9 p.m. Eastern time)
Fidelity Automated Service
Telephone (FAST®) 1-800-544-5555
Automated line for quickest service
SCV-UANN-0911
1.803705.106
Fidelity®
Small Cap Value
Fund
Class F
Annual Report
July 31, 2011
(2_fidelity_logos) (Registered_Trademark)
Contents
Performance | <Click Here> | How the fund has done over time. |
Management's Discussion of Fund Performance | <Click Here> | The Portfolio Manager's review of fund performance and strategy. |
Shareholder Expense Example | <Click Here> | An example of shareholder expenses. |
Investment Changes | <Click Here> | A summary of major shifts in the fund's investments over the past six months. |
Investments | <Click Here> | A complete list of the fund's investments with their market values. |
Financial Statements | <Click Here> | Statements of assets and liabilities, operations, and changes in net assets,
as well as financial highlights. |
Notes | <Click Here> | Notes to the financial statements. |
Report of Independent Registered Public Accounting Firm | <Click Here> | |
Trustees and Officers | <Click Here> | |
Distributions | <Click Here> | |
Board Approval of Investment Advisory Contracts and Management Fees | <Click Here> | |
To view a fund's proxy voting guidelines and proxy voting record for the 12-month period ended June 30, visit http://www.fidelity.com/proxyvotingresults or visit the Securities and Exchange Commission's (SEC) web site at http://www.sec.gov. You may also call 1-800-835-5092 to request a free copy of the proxy voting guidelines.
Standard & Poor's, S&P and S&P 500 are registered service marks of The McGraw-Hill Companies, Inc. and have been licensed for use by Fidelity Distributors Corporation.
Other third party marks appearing herein are the property of their respective owners.
All other marks appearing herein are registered or unregistered trademarks or service marks of FMR LLC or an affiliated company.
Annual Report
This report and the financial statements contained herein are submitted for the general information of the shareholders of the fund. This report is not authorized for distribution to prospective investors in the fund unless preceded or accompanied by an effective prospectus.
A fund files its complete schedule of portfolio holdings with the SEC for the first and third quarters of each fiscal year on Form N-Q. Forms N-Q are available on the SEC's web site at http://www.sec.gov. A fund's Forms N-Q may be reviewed and copied at the SEC's Public Reference Room in Washington, DC. Information regarding the operation of the SEC's Public Reference Room may be obtained by calling 1-800-SEC-0330. For a complete list of a fund's portfolio holdings, view the most recent holdings listing, semiannual report, or annual report on Fidelity's web site at http://www.fidelity.com, http://www.advisor.fidelity.com, or http://www.401k.com, as applicable.
NOT FDIC INSURED • MAY LOSE VALUE • NO BANK GUARANTEE
Neither the fund nor Fidelity Distributors Corporation is a bank.
Annual Report
Average annual total return reflects the change in the value of an investment, assuming reinvestment of the class' distributions from dividend income and capital gains (the profits earned upon the sale of securities that have grown in value, if any) and assuming a constant rate of performance each year. The $10,000 table and the fund's returns do not reflect the deduction of taxes that a shareholder would pay on fund distributions or the redemption of fund shares. During periods of reimbursement by Fidelity, a fund's total return will be greater than it would be had the reimbursement not occurred. How a fund did yesterday is no guarantee of how it will do tomorrow.
Average Annual Total Returns
Periods ended July 31, 2011 | Past 1
year | Past 5
years | Life of fund A |
Class F B | 17.31% | 6.21% | 9.46% |
A From November 3, 2004.
B The initial offering of Class F shares took place on June 26, 2009. Returns prior to June 26, 2009 are those of Fidelity® Small Cap Value Fund, the original class of the fund.
$10,000 Over Life of Fund
Let's say hypothetically that $10,000 was invested in Fidelity® Small Cap Value Fund - Class F on November 3, 2004, when the fund started. The chart shows how the value of your investment would have changed, and also shows how the Russell 2000® Value Index performed over the same period. The initial offering of Class F took place on June 26, 2009. See above for additional information regarding the performance of Class F.
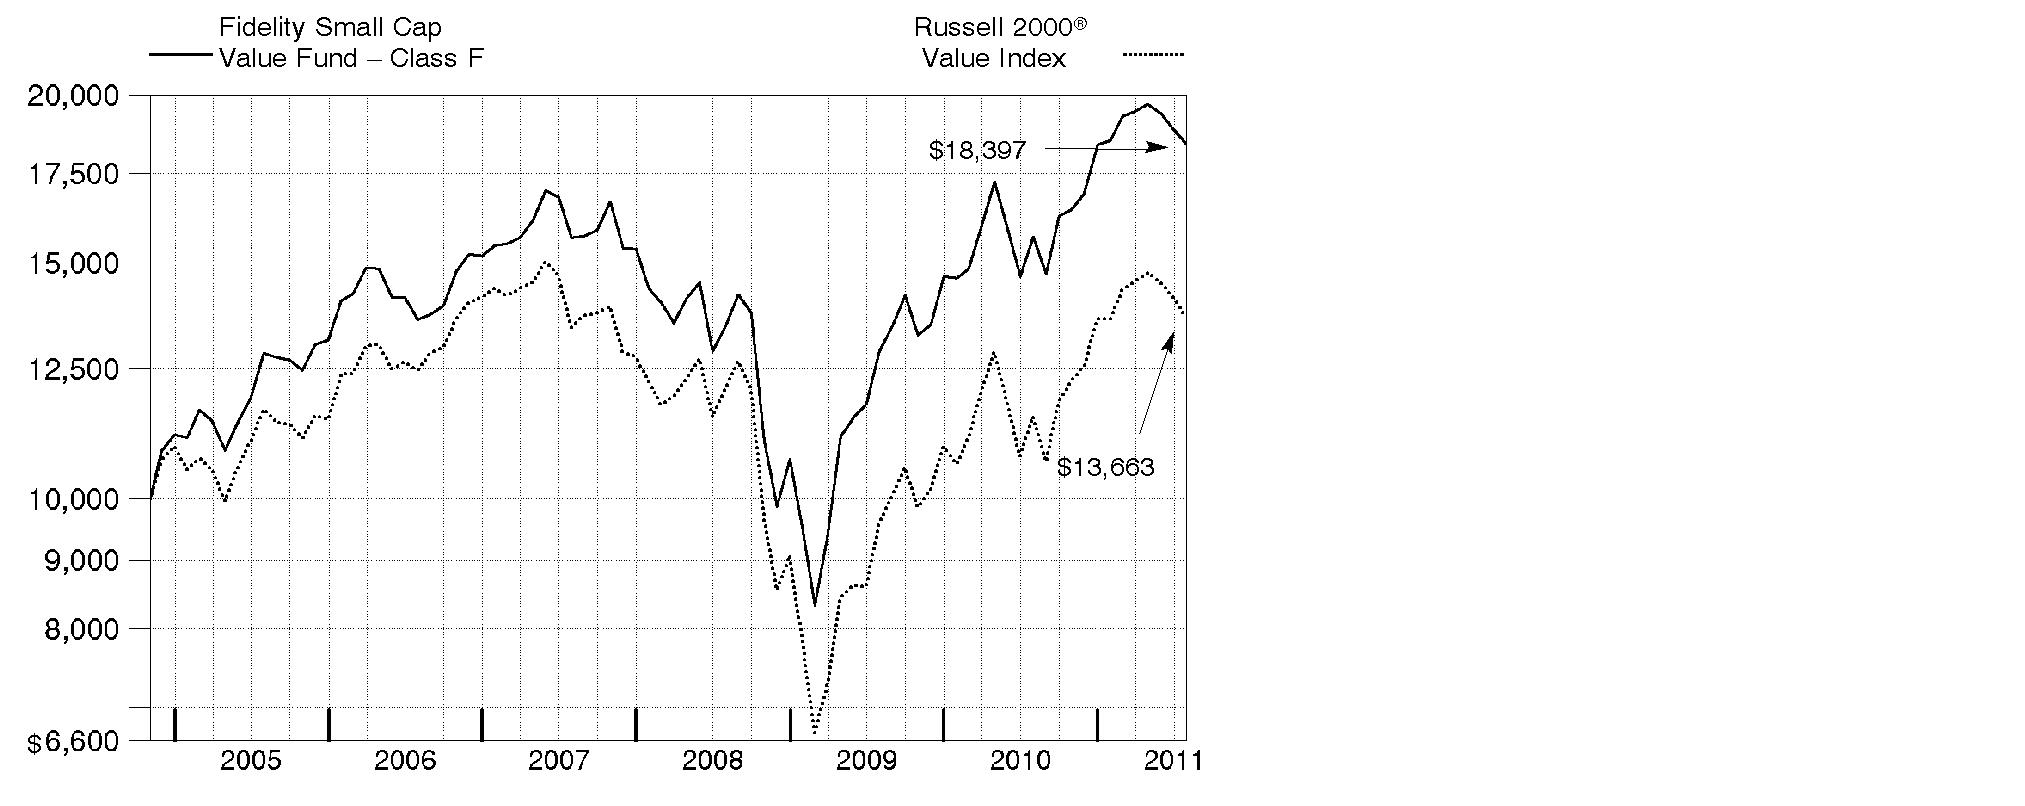
Annual Report
Market Recap: U.S. stocks registered solid double-digit gains for the 12 months ending July 31, 2011, extending a rally that began more than two years earlier. Despite a rough start in August 2010, markets turned positive in September, as increased demand for capital goods and other upbeat indicators trumped investor worry about a U.S. recessionary relapse. The broad market, as measured by the S&P 500® Index, rose 9% that month, its biggest September gain in 71 years. Seven more monthly advances followed, fueled by encouraging corporate earnings and economic activity. However, volatility picked up in the period's latter months, as markets reacted to continued high U.S. unemployment, nagging debt troubles in Europe and looming legislative battles over the federal debt ceiling. May unemployment rose above 9% for the first time in 2011, contributing to a traditional "June swoon" for stocks. Market uncertainty lingered in July, when the S&P 500® posted its second-biggest monthly loss of the period. For the full year, the S&P 500® climbed 19.65%, while the blue-chip-laden Dow Jones Industrial AverageSM rose a comparable 19.09% and the technology-heavy Nasdaq Composite® Index gained 23.40%. On the capitalization spectrum, stocks of mid-cap companies fared best, with the Russell Midcap® Index rising 24.51% and the small-cap Russell 2000® Index adding 23.92%.
Comments from Charles Myers, Portfolio Manager of Fidelity® Small Cap Value Fund: For the year, the fund's Class F shares returned 17.31%, versus 18.55% for the Russell 2000® Value Index. The consumer discretionary sector hurt performance, mainly due to poor stock selection in the consumer services and durables/apparel industries. An overweighting in the latter group also detracted. Another source of weakness was the financials sector, particularly banks and insurance stocks - including banks TCF Financial and Astoria Financial and reinsurer Platinum Underwriters Holdings - whose underperformance outweighed the favorable impact of my picks in the diversified financials industry. Banks were hurt by weak loan growth, while reinsurance companies were hampered by payouts for several costly disasters. Other detractors included commercial furniture maker HNI and homebuilder M.D.C. Holdings. On the positive side, stock selection in energy was very strong, led by Berry Petroleum and Superior Energy Services, both of which benefited from high oil prices. Positioning in industrials also helped, especially an investment in electrical distributor WESCO International. In health care, TeamHealth Holdings did very well. Many of the stocks I've mentioned were not in the index.
The views expressed above reflect those of the portfolio manager(s) only through the end of the period as stated on the cover of this report and do not necessarily represent the views of Fidelity or any other person in the Fidelity organization. Any such views are subject to change at any time based upon market or other conditions and Fidelity disclaims any responsibility to update such views. These views may not be relied on as investment advice and, because investment decisions for a Fidelity fund are based on numerous factors, may not be relied on as an indication of trading intent on behalf of any Fidelity fund.
Annual Report
Shareholder Expense Example
As a shareholder of the Fund, you incur two types of costs: (1) transaction costs, including sales charges (loads) on purchase payments or redemption proceeds, redemption fees, and (2) ongoing costs, including management fees, distribution and/or service (12b-1) fees and other Fund expenses. This Example is intended to help you understand your ongoing costs (in dollars) of investing in the Fund and to compare these costs with the ongoing costs of investing in other mutual funds.
The Example is based on an investment of $1,000 invested at the beginning of the period and held for the entire period (February 1, 2011 to July 31, 2011).
Actual Expenses
The first line of the accompanying table for each class of the Fund provides information about actual account values and actual expenses. You may use the information in this line, together with the amount you invested, to estimate the expenses that you paid over the period. Simply divide your account value by $1,000.00 (for example, an $8,600 account value divided by $1,000.00 = 8.6), then multiply the result by the number in the first line for a class of the Fund under the heading entitled "Expenses Paid During Period" to estimate the expenses you paid on your account during this period. A small balance maintenance fee of $12.00 that is charged once a year may apply for certain accounts with a value of less than $2,000. This fee is not included in the table below. If it was, the estimate of expenses you paid during the period would be higher, and your ending account value lower, by this amount. In addition, the Fund, as a shareholder in the underlying Fidelity Central Funds, will indirectly bear its pro-rata share of the fees and expenses incurred by the underlying Fidelity Central Funds. These fees and expenses are not included in the Fund's annualized expense ratio used to calculate the expense estimate in the table below.
Hypothetical Example for Comparison Purposes
The second line of the accompanying table for each class of the Fund provides information about hypothetical account values and hypothetical expenses based on a Class' actual expense ratio and an assumed rate of return of 5% per year before expenses, which is not the Class' actual return. The hypothetical account values and expenses may not be used to estimate the actual ending account balance or expenses you paid for the period. You may use this information to compare the ongoing costs of investing in the Fund and other funds. To do so, compare this 5% hypothetical example with the 5% hypothetical examples that appear in the shareholder reports of the other funds. A small balance maintenance fee of $12.00 that is charged once a year may apply for certain accounts with a value of less than $2,000. This fee is not included in the table below. If it was, the estimate of expenses you paid during the period would be higher, and your ending account value lower, by this amount. In addition, the Fund, as a shareholder in the underlying Fidelity Central Funds, will indirectly bear its pro-rata share of the fees and expenses incurred by the underlying Fidelity Central Funds. These fees and expenses are not included in the Fund's annualized expense ratio used to calculate the expense estimate in the table below.
Annual Report
Please note that the expenses shown in the table are meant to highlight your ongoing costs only and do not reflect any transaction costs. Therefore, the second line of the table is useful in comparing ongoing costs only, and will not help you determine the relative total costs of owning different funds. In addition, if these transactional costs were included, your costs would have been higher.
| Annualized
Expense
Ratio | Beginning
Account Value
February 1, 2011 | Ending
Account Value
July 31, 2011 | Expenses Paid
During Period*
February 1, 2011
to July 31, 2011 |
Class A | 1.44% | | | |
Actual | | $ 1,000.00 | $ 992.30 | $ 7.11 |
HypotheticalA | | $ 1,000.00 | $ 1,017.65 | $ 7.20 |
Class T | 1.69% | | | |
Actual | | $ 1,000.00 | $ 991.00 | $ 8.34 |
HypotheticalA | | $ 1,000.00 | $ 1,016.41 | $ 8.45 |
Class B | 2.20% | | | |
Actual | | $ 1,000.00 | $ 988.10 | $ 10.84 |
HypotheticalA | | $ 1,000.00 | $ 1,013.88 | $ 10.99 |
Class C | 2.18% | | | |
Actual | | $ 1,000.00 | $ 988.80 | $ 10.75 |
HypotheticalA | | $ 1,000.00 | $ 1,013.98 | $ 10.89 |
Small Cap Value | 1.11% | | | |
Actual | | $ 1,000.00 | $ 993.60 | $ 5.49 |
HypotheticalA | | $ 1,000.00 | $ 1,019.29 | $ 5.56 |
Class F | .88% | | | |
Actual | | $ 1,000.00 | $ 994.30 | $ 4.35 |
HypotheticalA | | $ 1,000.00 | $ 1,020.43 | $ 4.41 |
Institutional Class | 1.10% | | | |
Actual | | $ 1,000.00 | $ 993.60 | $ 5.44 |
HypotheticalA | | $ 1,000.00 | $ 1,019.34 | $ 5.51 |
A 5% return per year before expenses
* Expenses are equal to each Class' annualized expense ratio, multiplied by the average account value over the period, multiplied by 181/365 (to reflect the one-half year period).
Annual Report
Investment Changes (Unaudited)
Top Ten Stocks as of July 31, 2011 |
| % of fund's
net assets | % of fund's net assets
6 months ago |
Berry Petroleum Co. Class A | 3.4 | 3.4 |
DCT Industrial Trust, Inc. | 3.0 | 2.7 |
Superior Energy Services, Inc. | 2.8 | 3.3 |
WESCO International, Inc. | 2.7 | 3.3 |
MEDNAX, Inc. | 2.7 | 1.8 |
Highwoods Properties, Inc. (SBI) | 2.6 | 2.4 |
UGI Corp. | 2.6 | 2.6 |
United Stationers, Inc. | 2.5 | 2.3 |
TCF Financial Corp. | 2.4 | 2.8 |
Regis Corp. | 2.4 | 1.5 |
| 27.1 | |
Top Five Market Sectors as of July 31, 2011 |
| % of fund's
net assets | % of fund's net assets
6 months ago |
Financials | 35.2 | 37.0 |
Industrials | 12.5 | 13.0 |
Consumer Discretionary | 11.9 | 10.7 |
Information Technology | 11.6 | 9.2 |
Health Care | 8.3 | 7.1 |
Asset Allocation (% of fund's net assets) |
As of July 31, 2011* | As of January 31, 2011** |
| Stocks 99.7% | | | Stocks 99.1% | |
| Short-Term
Investments and
Net Other Assets 0.3% | | | Short-Term
Investments and
Net Other Assets 0.9% | |
* Foreign investments | 8.3% | | ** Foreign investments | 9.9% | |

Annual Report
Investments July 31, 2011
Showing Percentage of Net Assets
Common Stocks - 98.4% |
| Shares | | Value |
CONSUMER DISCRETIONARY - 11.4% |
Diversified Consumer Services - 3.4% |
Matthews International Corp. Class A | 740,187 | | $ 26,787,368 |
Regis Corp. (d)(e) | 4,045,824 | | 60,080,486 |
| | 86,867,854 |
Household Durables - 4.7% |
M.D.C. Holdings, Inc. (d)(e) | 2,424,300 | | 54,813,423 |
Meritage Homes Corp. (a) | 1,536,160 | | 33,565,096 |
Ryland Group, Inc. (d) | 2,153,837 | | 31,726,019 |
| | 120,104,538 |
Specialty Retail - 3.3% |
Asbury Automotive Group, Inc. (a) | 1,465,159 | | 31,544,873 |
Ascena Retail Group, Inc. (a) | 960,700 | | 31,049,824 |
Tsutsumi Jewelry Co. Ltd. | 791,400 | | 20,081,910 |
| | 82,676,607 |
TOTAL CONSUMER DISCRETIONARY | | 289,648,999 |
CONSUMER STAPLES - 2.9% |
Food & Staples Retailing - 0.4% |
Ingles Markets, Inc. Class A (e) | 664,024 | | 10,225,970 |
Food Products - 2.5% |
Chiquita Brands International, Inc. (a) | 2,070,900 | | 24,519,456 |
Dean Foods Co. (a) | 3,500,000 | | 38,570,000 |
| | 63,089,456 |
TOTAL CONSUMER STAPLES | | 73,315,426 |
ENERGY - 6.2% |
Energy Equipment & Services - 2.8% |
Superior Energy Services, Inc. (a) | 1,741,700 | | 72,263,133 |
Oil, Gas & Consumable Fuels - 3.4% |
Berry Petroleum Co. Class A | 1,500,000 | | 86,025,000 |
TOTAL ENERGY | | 158,288,133 |
FINANCIALS - 34.4% |
Capital Markets - 2.6% |
Knight Capital Group, Inc. Class A (a) | 2,029,826 | | 22,957,332 |
Waddell & Reed Financial, Inc. Class A | 1,210,000 | | 44,407,000 |
| | 67,364,332 |
Common Stocks - continued |
| Shares | | Value |
FINANCIALS - continued |
Commercial Banks - 10.8% |
Associated Banc-Corp. | 3,832,650 | | $ 52,315,673 |
CapitalSource, Inc. | 6,515,270 | | 42,088,644 |
City National Corp. | 784,900 | | 42,133,432 |
National Penn Bancshares, Inc. | 3,766,604 | | 30,283,496 |
PacWest Bancorp (e) | 1,857,600 | | 36,873,360 |
TCF Financial Corp. (d) | 4,855,800 | | 61,765,776 |
Western Liberty Bancorp (a)(e) | 2,400,000 | | 7,248,000 |
| | 272,708,381 |
Insurance - 7.2% |
Alterra Capital Holdings Ltd. | 2,357,411 | | 51,367,986 |
Aspen Insurance Holdings Ltd. | 1,320,200 | | 34,193,180 |
Platinum Underwriters Holdings Ltd. | 1,576,975 | | 54,169,091 |
ProAssurance Corp. (a) | 600,000 | | 41,790,000 |
| | 181,520,257 |
Real Estate Investment Trusts - 9.3% |
Alexandria Real Estate Equities, Inc. | 219,100 | | 17,966,200 |
American Assets Trust, Inc. | 225,200 | | 4,952,148 |
DCT Industrial Trust, Inc. (d)(e) | 13,830,586 | | 74,961,776 |
Franklin Street Properties Corp. (d) | 3,160,000 | | 39,847,600 |
Highwoods Properties, Inc. (SBI) (d) | 1,940,330 | | 66,805,562 |
National Retail Properties, Inc. (d) | 1,240,000 | | 31,111,600 |
| | 235,644,886 |
Thrifts & Mortgage Finance - 4.5% |
Astoria Financial Corp. | 4,818,152 | | 56,131,471 |
Washington Federal, Inc. | 3,486,175 | | 58,951,219 |
| | 115,082,690 |
TOTAL FINANCIALS | | 872,320,546 |
HEALTH CARE - 8.3% |
Health Care Providers & Services - 8.3% |
Centene Corp. (a) | 1,324,832 | | 43,467,738 |
Chemed Corp. | 510,200 | | 31,025,262 |
MEDNAX, Inc. (a) | 981,500 | | 66,899,040 |
Providence Service Corp. (a)(e) | 1,016,495 | | 12,045,466 |
Team Health Holdings, Inc. (a) | 2,565,700 | | 56,471,057 |
| | 209,908,563 |
Common Stocks - continued |
| Shares | | Value |
INDUSTRIALS - 12.5% |
Commercial Services & Supplies - 6.3% |
ACCO Brands Corp. (a) | 2,420,000 | | $ 20,739,400 |
HNI Corp. (d)(e) | 2,349,671 | | 49,131,621 |
Knoll, Inc. | 1,412,898 | | 25,785,389 |
United Stationers, Inc. | 1,980,800 | | 63,563,872 |
| | 159,220,282 |
Machinery - 2.3% |
Blount International, Inc. (a)(e) | 2,604,723 | | 43,316,543 |
Columbus McKinnon Corp. (NY Shares) (a) | 960,000 | | 15,792,000 |
| | 59,108,543 |
Trading Companies & Distributors - 3.9% |
H&E Equipment Services, Inc. (a)(e) | 2,439,408 | | 29,272,896 |
WESCO International, Inc. (a) | 1,350,000 | | 68,431,500 |
| | 97,704,396 |
TOTAL INDUSTRIALS | | 316,033,221 |
INFORMATION TECHNOLOGY - 11.6% |
Communications Equipment - 1.4% |
ViaSat, Inc. (a) | 809,472 | | 36,369,577 |
Electronic Equipment & Components - 6.4% |
Ingram Micro, Inc. Class A (a) | 2,753,100 | | 51,070,005 |
Macnica, Inc. | 677,400 | | 16,168,178 |
Ryoyo Electro Corp. (e) | 1,972,700 | | 19,684,709 |
SYNNEX Corp. (a) | 675,710 | | 19,136,107 |
Tech Data Corp. (a) | 1,189,600 | | 55,518,632 |
| | 161,577,631 |
Internet Software & Services - 1.8% |
DealerTrack Holdings, Inc. (a) | 1,083,804 | | 25,133,415 |
j2 Global Communications, Inc. | 730,149 | | 19,524,184 |
| | 44,657,599 |
Semiconductors & Semiconductor Equipment - 0.6% |
Miraial Co. Ltd. (e) | 720,200 | | 15,046,860 |
Software - 1.4% |
Monotype Imaging Holdings, Inc. (a)(e) | 2,583,700 | | 35,396,690 |
TOTAL INFORMATION TECHNOLOGY | | 293,048,357 |
Common Stocks - continued |
| Shares | | Value |
MATERIALS - 4.7% |
Metals & Mining - 4.7% |
Carpenter Technology Corp. | 834,380 | | $ 47,926,787 |
Haynes International, Inc. (e) | 675,317 | | 42,301,857 |
RTI International Metals, Inc. (a) | 870,997 | | 27,932,874 |
| | 118,161,518 |
UTILITIES - 6.4% |
Electric Utilities - 2.2% |
Westar Energy, Inc. (d) | 2,160,000 | | 55,749,600 |
Gas Utilities - 4.2% |
Southwest Gas Corp. | 1,130,989 | | 42,174,580 |
UGI Corp. | 2,150,000 | | 65,145,000 |
| | 107,319,580 |
TOTAL UTILITIES | | 163,069,180 |
TOTAL COMMON STOCKS (Cost $2,112,389,704) | 2,493,793,943 |
Nonconvertible Preferred Stocks - 1.3% |
| | | |
CONSUMER DISCRETIONARY - 0.5% |
Household Durables - 0.5% |
M/I Homes, Inc. Series A, 9.75% (a) | 750,400 | | 12,006,400 |
FINANCIALS - 0.8% |
Real Estate Investment Trusts - 0.8% |
Developers Diversified Realty Corp. (depositary shares) Series H, 7.375% | 818,790 | | 19,953,912 |
TOTAL NONCONVERTIBLE PREFERRED STOCKS (Cost $20,354,770) | 31,960,312 |
Money Market Funds - 4.6% |
| Shares | | Value |
Fidelity Cash Central Fund, 0.14% (b) | 13,763,496 | | $ 13,763,496 |
Fidelity Securities Lending Cash Central Fund, 0.15% (b)(c) | 102,468,175 | | 102,468,175 |
TOTAL MONEY MARKET FUNDS (Cost $116,231,671) | 116,231,671 |
TOTAL INVESTMENT PORTFOLIO - 104.3% (Cost $2,248,976,145) | | 2,641,985,926 |
NET OTHER ASSETS (LIABILITIES) - (4.3)% | | (108,404,928) |
NET ASSETS - 100% | $ 2,533,580,998 |
Legend |
(a) Non-income producing |
(b) Affiliated fund that is available only to investment companies and other accounts managed by Fidelity Investments. The rate quoted is the annualized seven-day yield of the fund at period end. A complete unaudited listing of the fund's holdings as of its most recent quarter end is available upon request. In addition, each Fidelity Central Fund's financial statements, which are not covered by the Fund's Report of Independent Registered Public Accounting Firm, are available on the SEC's website or upon request. |
(c) Investment made with cash collateral received from securities on loan. |
(d) Security or a portion of the security is on loan at period end. |
(e) Affiliated company |
Affiliated Central Funds |
Information regarding fiscal year to date income earned by the Fund from investments in Fidelity Central Funds is as follows: |
Fund | Income earned |
Fidelity Cash Central Fund | $ 20,932 |
Fidelity Securities Lending Cash Central Fund | 121,080 |
Total | $ 142,012 |
Other Affiliated Issuers |
An affiliated company is a company in which the Fund has ownership of at least 5% of the voting securities. Fiscal year to date transactions with companies which are or were affiliates are as follows: |
Affiliate | Value,
beginning of
period | Purchases | Sales
Proceeds | Dividend
Income | Value,
end of
period |
ACCO Brands Corp. | $ 22,027,864 | $ 1,922,616 | $ 12,330,836 | $ - | $ - |
Blount International, Inc. | 27,740,300 | - | - | - | 43,316,543 |
Columbus McKinnon Corp. (NY Shares) | - | 19,267,200 | - | - | - |
DCT Industrial Trust, Inc. | 46,900,000 | 19,790,290 | - | 1,656,573 | 74,961,776 |
H&E Equipment Services, Inc. | 30,357,850 | - | 20,687,104 | - | 29,272,896 |
Haynes International, Inc. | - | 33,108,436 | - | 183,909 | 42,301,857 |
HNI Corp. | 55,547,499 | 5,138,794 | - | 2,048,207 | 49,131,621 |
Ingles Markets, Inc. Class A | 13,634,514 | - | 3,506,026 | 475,816 | 10,225,970 |
M.D.C. Holdings, Inc. | 35,651,616 | 32,061,128 | - | 1,524,300 | 54,813,423 |
Miraial Co. Ltd. | 15,372,473 | 3,618,630 | - | 502,071 | 15,046,860 |
Monotype Imaging Holdings, Inc. | 11,299,816 | 12,600,234 | - | - | 35,396,690 |
PacWest Bancorp | 37,552,606 | 1,164,578 | - | 73,220 | 36,873,360 |
Providence Service Corp. | 14,637,528 | - | - | - | 12,045,466 |
Regis Corp. | 41,819,783 | 36,022,139 | 15,089,522 | 575,173 | 60,080,486 |
RTI International Metals, Inc. | 48,035,903 | - | 23,272,802 | - | - |
Ryoyo Electro Corp. | 18,932,046 | 2,120,893 | - | 687,612 | 19,684,709 |
TradeStation Group, Inc. | 13,178,039 | - | 19,917,635 | - | - |
Western Liberty Bancorp | 14,976,000 | - | - | - | 7,248,000 |
Total | $ 447,663,837 | $ 166,814,938 | $ 94,803,925 | $ 7,726,881 | $ 490,399,657 |
Other Information |
All investments are categorized as Level 1 under the Fair Value Hierarchy. The inputs or methodology used for valuing securities may not be an indication of the risk associated with investing in those securities. For more information on valuation inputs, please refer to the Security Valuation section in the accompanying Notes to Financial Statements. |
See accompanying notes which are an integral part of the financial statements.
Annual Report
Statement of Assets and Liabilities
| July 31, 2011 |
| | |
Assets | | |
Investment in securities, at value (including securities loaned of $99,483,856) - See accompanying schedule: Unaffiliated issuers (cost $1,664,327,198) | $ 2,035,354,598 | |
Fidelity Central Funds (cost $116,231,671) | 116,231,671 | |
Other affiliated issuers (cost $468,417,276) | 490,399,657 | |
Total Investments (cost $2,248,976,145) | | $ 2,641,985,926 |
Receivable for investments sold | | 174,323 |
Receivable for fund shares sold | | 3,317,218 |
Dividends receivable | | 2,265,074 |
Distributions receivable from Fidelity Central Funds | | 10,990 |
Other receivables | | 49,926 |
Total assets | | 2,647,803,457 |
| | |
Liabilities | | |
Payable for investments purchased | $ 1,298,673 | |
Payable for fund shares redeemed | 7,914,722 | |
Accrued management fee | 1,855,015 | |
Distribution and service plan fees payable | 103,978 | |
Other affiliated payables | 528,715 | |
Other payables and accrued expenses | 53,181 | |
Collateral on securities loaned, at value | 102,468,175 | |
Total liabilities | | 114,222,459 |
| | |
Net Assets | | $ 2,533,580,998 |
Net Assets consist of: | | |
Paid in capital | | $ 2,012,724,102 |
Accumulated undistributed net realized gain (loss) on investments and foreign currency transactions | | 127,839,572 |
Net unrealized appreciation (depreciation) on investments and assets and liabilities in foreign currencies | | 393,017,324 |
Net Assets | | $ 2,533,580,998 |
See accompanying notes which are an integral part of the financial statements.
Annual Report
Financial Statements - continued
Statement of Assets and Liabilities - continued
| July 31, 2011 |
| | |
Calculation of Maximum Offering Price
Class A:
Net Asset Value and redemption price per share
($140,706,656 ÷ 9,092,403 shares) | | $ 15.48 |
| | |
Maximum offering price per share (100/94.25 of $15.48) | | $ 16.42 |
Class T:
Net Asset Value and redemption price per share ($55,845,206 ÷ 3,640,410 shares) | | $ 15.34 |
| | |
Maximum offering price per share (100/96.50 of $15.34) | | $ 15.90 |
Class B:
Net Asset Value and offering price per share ($8,548,930 ÷ 569,799 shares)A | | $ 15.00 |
| | |
Class C:
Net Asset Value and offering price per share ($47,457,202 ÷ 3,162,480 shares)A | | $ 15.01 |
| | |
| | |
Small Cap Value:
Net Asset Value, offering price and redemption price per share ($1,899,804,971 ÷ 121,599,609 shares) | | $ 15.62 |
| | |
Class F:
Net Asset Value, offering price and redemption price per share ($279,652,893 ÷ 17,875,122 shares) | | $ 15.64 |
| | |
Institutional Class:
Net Asset Value, offering price and redemption price per share ($101,565,140 ÷ 6,496,759 shares) | | $ 15.63 |
A Redemption price per share is equal to net asset value less any applicable contingent deferred sales charge.
See accompanying notes which are an integral part of the financial statements.
Annual Report
Statement of Operations
| Year ended July 31, 2011 |
| | |
Investment Income | | |
Dividends (including $7,726,881 earned from other affiliated issuers) | | $ 27,691,950 |
Special dividends | | 9,360,000 |
Interest | | 82 |
Income from Fidelity Central Funds | | 142,012 |
Total income | | 37,194,044 |
| | |
Expenses | | |
Management fee
Basic fee | $ 17,642,979 | |
Performance adjustment | 3,308,761 | |
Transfer agent fees | 5,701,385 | |
Distribution and service plan fees | 1,163,925 | |
Accounting and security lending fees | 761,810 | |
Custodian fees and expenses | 41,873 | |
Independent trustees' compensation | 13,098 | |
Registration fees | 144,204 | |
Audit | 59,297 | |
Legal | 9,329 | |
Interest | 1,171 | |
Miscellaneous | 25,364 | |
Total expenses before reductions | 28,873,196 | |
Expense reductions | (44,627) | 28,828,569 |
Net investment income (loss) | | 8,365,475 |
Realized and Unrealized Gain (Loss) Net realized gain (loss) on: | | |
Investment securities: | | |
Unaffiliated issuers | 159,718,329 | |
Other affiliated issuers | (4,266,450) | |
Foreign currency transactions | 29,684 | |
Total net realized gain (loss) | | 155,481,563 |
Change in net unrealized appreciation (depreciation) on: Investment securities | 203,702,039 | |
Assets and liabilities in foreign currencies | (584) | |
Total change in net unrealized appreciation (depreciation) | | 203,701,455 |
Net gain (loss) | | 359,183,018 |
Net increase (decrease) in net assets resulting from operations | | $ 367,548,493 |
See accompanying notes which are an integral part of the financial statements.
Annual Report
Financial Statements - continued
Statement of Changes in Net Assets
| Year ended
July 31,
2011 | Year ended
July 31,
2010 |
Increase (Decrease) in Net Assets | | |
Operations | | |
Net investment income (loss) | $ 8,365,475 | $ 6,962,574 |
Net realized gain (loss) | 155,481,563 | 188,495,963 |
Change in net unrealized appreciation (depreciation) | 203,701,455 | 137,333,657 |
Net increase (decrease) in net assets resulting
from operations | 367,548,493 | 332,792,194 |
Distributions to shareholders from net investment income | (16,151,065) | (6,560,137) |
Distributions to shareholders from net realized gain | (20,051,059) | - |
Total distributions | (36,202,124) | (6,560,137) |
Share transactions - net increase (decrease) | 54,629,275 | 209,101,603 |
Redemption fees | 445,888 | 534,282 |
Total increase (decrease) in net assets | 386,421,532 | 535,867,942 |
| | |
Net Assets | | |
Beginning of period | 2,147,159,466 | 1,611,291,524 |
End of period (including undistributed net investment of $0 and undistributed net investment income of $5,209,766, respectively) | $ 2,533,580,998 | $ 2,147,159,466 |
See accompanying notes which are an integral part of the financial statements.
Annual Report
Financial Highlights - Class A
Years ended July 31, | 2011 | 2010 | 2009 | 2008 | 2007 |
Selected Per-Share Data | | | | | |
Net asset value, beginning of period | $ 13.45 | $ 11.13 | $ 11.82 | $ 14.34 | $ 13.17 |
Income from Investment Operations | | | | | |
Net investment income (loss) C | .01 F | .02 G | .08 | (.01) | (.06) |
Net realized and unrealized gain (loss) | 2.22 | 2.33 | (.60) | (1.98) | 1.90 |
Total from investment operations | 2.23 | 2.35 | (.52) | (1.99) | 1.84 |
Distributions from net investment income | (.08) | (.03) | (.06) | - | - |
Distributions from net realized gain | (.12) | - | (.11) | (.53) | (.67) |
Total distributions | (.20) | (.03) | (.17) | (.53) | (.67) |
Redemption fees added to paid in capital C,I | - | - | - | - | - |
Net asset value, end of period | $ 15.48 | $ 13.45 | $ 11.13 | $ 11.82 | $ 14.34 |
Total Return A,B | 16.72% | 21.16% | (4.37)% | (14.35)% | 14.59% |
Ratios to Average Net Assets D,H | | | | | |
Expenses before reductions | 1.44% | 1.47% | 1.45% | 1.43% | 1.45% |
Expenses net of fee waivers, if any | 1.43% | 1.40% | 1.40% | 1.40% | 1.40% |
Expenses net of all reductions | 1.43% | 1.39% | 1.40% | 1.40% | 1.40% |
Net investment income (loss) | .06% F | .17% G | .81% | (.05)% | (.44)% |
Supplemental Data | | | | | |
Net assets, end of period (000 omitted) | $ 140,707 | $ 96,994 | $ 55,029 | $ 52,446 | $ 61,357 |
Portfolio turnover rate E | 22% | 49% | 51% | 149% | 67% |
A Total returns would have been lower if certain expenses had not been reduced during the applicable periods shown.
B Total returns do not include the effect of the sales charges.
C Calculated based on average shares outstanding during the period.
D Fees and expenses of any underlying Fidelity Central Funds are not included in the Fund's expense ratio. The Fund indirectly bears its proportionate share of the expenses of any underlying Fidelity Central Funds.
E Amount does not include the portfolio activity of any underlying Fidelity Central Funds.
F Investment income per share reflects a special dividend which amounted to $.06 per share. Excluding the special dividend, the ratio of net investment income (loss) to average net assets would have been (.31)%.
G Investment income per share reflects a special dividend which amounted to $.03 per share. Excluding the special dividend, the ratio of net investment income (loss) to average net assets would have been (.10)%.
H Expense ratios reflect operating expenses of the class. Expenses before reductions do not reflect amounts reimbursed by the investment adviser or reductions from brokerage service arrangements or reductions from other expense offset arrangements and do not represent the amount paid by the class during periods when reimbursements or reductions occur. Expenses net of fee waivers reflect expenses after reimbursement by the investment adviser but prior to reductions from brokerage service arrangements or other expense offset arrangements. Expenses net of all reductions represent the net expenses paid by the class.
I Amount represents less than $.01 per share.
See accompanying notes which are an integral part of the financial statements.
Annual Report
Financial Highlights - Class T
Years ended July 31, | 2011 | 2010 | 2009 | 2008 | 2007 |
Selected Per-Share Data | | | | | |
Net asset value, beginning of period | $ 13.34 | $ 11.05 | $ 11.74 | $ 14.28 | $ 13.13 |
Income from Investment Operations | | | | | |
Net investment income (loss) C | (.03) F | (.01) G | .05 | (.04) | (.10) |
Net realized and unrealized gain (loss) | 2.20 | 2.31 | (.59) | (1.97) | 1.90 |
Total from investment operations | 2.17 | 2.30 | (.54) | (2.01) | 1.80 |
Distributions from net investment income | (.05) | (.01) | (.04) | - | - |
Distributions from net realized gain | (.12) | - | (.11) | (.53) | (.65) |
Total distributions | (.17) | (.01) | (.15) | (.53) | (.65) |
Redemption fees added to paid in capital C,I | - | - | - | - | - |
Net asset value, end of period | $ 15.34 | $ 13.34 | $ 11.05 | $ 11.74 | $ 14.28 |
Total ReturnA,B | 16.36% | 20.87% | (4.57)% | (14.58)% | 14.34% |
Ratios to Average Net Assets D,H | | | | | |
Expenses before reductions | 1.70% | 1.72% | 1.70% | 1.68% | 1.66% |
Expenses net of fee waivers, if any | 1.69% | 1.65% | 1.65% | 1.65% | 1.65% |
Expenses net of all reductions | 1.69% | 1.64% | 1.65% | 1.65% | 1.65% |
Net investment income (loss) | (.19)% F | (.08)% G | .56% | (.30)% | (.69)% |
Supplemental Data | | | | | |
Net assets, end of period (000 omitted) | $ 55,845 | $ 44,091 | $ 28,534 | $ 32,091 | $ 51,518 |
Portfolio turnover rate E | 22% | 49% | 51% | 149% | 67% |
A Total returns would have been lower if certain expenses had not been reduced during the applicable periods shown.
B Total returns do not include the effect of the sales charges.
C Calculated based on average shares outstanding during the period.
D Fees and expenses of any underlying Fidelity Central Funds are not included in the Fund's expense ratio. The Fund indirectly bears its proportionate share of the expenses of any underlying Fidelity Central Funds.
E Amount does not include the portfolio activity of any underlying Fidelity Central Funds.
F Investment income per share reflects a special dividend which amounted to $.06 per share. Excluding the special dividend, the ratio of net investment income (loss) to average net assets would have been (.57)%.
G Investment income per share reflects a special dividend which amounted to $.03 per share. Excluding the special dividend, the ratio of net investment income (loss) to average net assets would have been (.35)%.
H Expense ratios reflect operating expenses of the class. Expenses before reductions do not reflect amounts reimbursed by the investment adviser or reductions from brokerage service arrangements or reductions from other expense offset arrangements and do not represent the amount paid by the class during periods when reimbursements or reductions occur. Expenses net of fee waivers reflect expenses after reimbursement by the investment adviser but prior to reductions from brokerage service arrangements or other expense offset arrangements. Expenses net of all reductions represent the net expenses paid by the class.
I Amount represents less than $.01 per share.
See accompanying notes which are an integral part of the financial statements.
Annual Report
Financial Highlights - Class B
Years ended July 31, | 2011 | 2010 | 2009 | 2008 | 2007 |
Selected Per-Share Data | | | | | |
Net asset value, beginning of period | $ 13.08 | $ 10.88 | $ 11.60 | $ 14.19 | $ 13.07 |
Income from Investment Operations | | | | | |
Net investment income (loss) C | (.10) F | (.07) G | .01 | (.10) | (.17) |
Net realized and unrealized gain (loss) | 2.15 | 2.27 | (.59) | (1.96) | 1.90 |
Total from investment operations | 2.05 | 2.20 | (.58) | (2.06) | 1.73 |
Distributions from net investment income | (.01) | - | (.03) | - | - |
Distributions from net realized gain | (.12) | - | (.11) | (.53) | (.61) |
Total distributions | (.13) | - | (.14) | (.53) | (.61) |
Redemption fees added to paid in capital C,I | - | - | - | - | - |
Net asset value, end of period | $ 15.00 | $ 13.08 | $ 10.88 | $ 11.60 | $ 14.19 |
Total Return A,B | 15.80% | 20.22% | (5.05)% | (15.04)% | 13.78% |
Ratios to Average Net Assets D,H | | | | | |
Expenses before reductions | 2.20% | 2.22% | 2.20% | 2.18% | 2.20% |
Expenses net of fee waivers, if any | 2.19% | 2.15% | 2.15% | 2.15% | 2.15% |
Expenses net of all reductions | 2.19% | 2.14% | 2.15% | 2.15% | 2.15% |
Net investment income (loss) | (.69)% F | (.58)% G | .06% | (.80)% | (1.19)% |
Supplemental Data | | | | | |
Net assets, end of period (000 omitted) | $ 8,549 | $ 9,747 | $ 7,153 | $ 7,886 | $ 12,075 |
Portfolio turnover rate E | 22% | 49% | 51% | 149% | 67% |
A Total returns would have been lower if certain expenses had not been reduced during the applicable periods shown.
B Total returns do not include the effect of the contingent deferred sales charge.
C Calculated based on average shares outstanding during the period.
D Fees and expenses of any underlying Fidelity Central Funds are not included in the Fund's expense ratio. The Fund indirectly bears its proportionate share of the expenses of any underlying Fidelity Central Funds.
E Amount does not include the portfolio activity of any underlying Fidelity Central Funds.
F Investment income per share reflects a special dividend which amounted to $.06 per share. Excluding the special dividend, the ratio of net investment income (loss) to average net assets would have been (1.07)%.
G Investment income per share reflects a special dividend which amounted to $.03 per share. Excluding the special dividend, the ratio of net investment income (loss) to average net assets would have been (.85)%.
H Expense ratios reflect operating expenses of the class. Expenses before reductions do not reflect amounts reimbursed by the investment adviser or reductions from brokerage service arrangements or reductions from other expense offset arrangements and do not represent the amount paid by the class during periods when reimbursements or reductions occur. Expenses net of fee waivers reflect expenses after reimbursement by the investment adviser but prior to reductions from brokerage service arrangements or other expense offset arrangements. Expenses net of all reductions represent the net expenses paid by the class.
I Amount represents less than $.01 per share.
See accompanying notes which are an integral part of the financial statements.
Annual Report
Financial Highlights - Class C
Years ended July 31, | 2011 | 2010 | 2009 | 2008 | 2007 |
Selected Per-Share Data | | | | | |
Net asset value, beginning of period | $ 13.08 | $ 10.89 | $ 11.60 | $ 14.19 | $ 13.07 |
Income from Investment Operations | | | | | |
Net investment income (loss) C | (.10) F | (.07) G | .01 | (.10) | (.17) |
Net realized and unrealized gain (loss) | 2.17 | 2.26 | (.58) | (1.96) | 1.90 |
Total from investment operations | 2.07 | 2.19 | (.57) | (2.06) | 1.73 |
Distributions from net investment income | (.02) | - | (.03) | - | - |
Distributions from net realized gain | (.12) | - | (.11) | (.53) | (.61) |
Total distributions | (.14) | - | (.14) | (.53) | (.61) |
Redemption fees added to paid in capital C,I | - | - | - | - | - |
Net asset value, end of period | $ 15.01 | $ 13.08 | $ 10.89 | $ 11.60 | $ 14.19 |
Total ReturnA,B | 15.91% | 20.11% | (4.98)% | (15.04)% | 13.77% |
Ratios to Average Net Assets D,H | | | | | |
Expenses before reductions | 2.18% | 2.22% | 2.20% | 2.18% | 2.20% |
Expenses net of fee waivers, if any | 2.18% | 2.15% | 2.15% | 2.15% | 2.15% |
Expenses net of all reductions | 2.18% | 2.14% | 2.15% | 2.15% | 2.15% |
Net investment income (loss) | (.68)% F | (.58)% G | .06% | (.80)% | (1.19)% |
Supplemental Data | | | | | |
Net assets, end of period (000 omitted) | $ 47,457 | $ 37,346 | $ 21,345 | $ 20,924 | $ 34,155 |
Portfolio turnover rate E | 22% | 49% | 51% | 149% | 67% |
A Total returns would have been lower if certain expenses had not been reduced during the applicable periods shown.
B Total returns do not include the effect of the contingent deferred sales charge.
C Calculated based on average shares outstanding during the period.
D Fees and expenses of any underlying Fidelity Central Funds are not included in the Fund's expense ratio. The Fund indirectly bears its proportionate share of the expenses of any underlying Fidelity Central Funds.
E Amount does not include the portfolio activity of any underlying Fidelity Central Funds.
F Investment income per share reflects a special dividend which amounted to $.06 per share. Excluding the special dividend, the ratio of net investment income (loss) to average net assets would have been (1.06)%.
G Investment income per share reflects a special dividend which amounted to $.03 per share. Excluding the special dividend, the ratio of net investment income (loss) to average net assets would have been (.85)%.
H Expense ratios reflect operating expenses of the class. Expenses before reductions do not reflect amounts reimbursed by the investment adviser or reductions from brokerage service arrangements or reductions from other expense offset arrangements and do not represent the amount paid by the class during periods when reimbursements or reductions occur. Expenses net of fee waivers reflect expenses after reimbursement by the investment adviser but prior to reductions from brokerage service arrangements or other expense offset arrangements. Expenses net of all reductions represent the net expenses paid by the class.
I Amount represents less than $.01 per share.
See accompanying notes which are an integral part of the financial statements.
Annual Report
Financial Highlights - Small Cap Value
Years ended July 31, | 2011 | 2010 | 2009 | 2008 | 2007 |
Selected Per-Share Data | | | | | |
Net asset value, beginning of period | $ 13.56 | $ 11.22 | $ 11.91 | $ 14.43 | $ 13.22 |
Income from Investment Operations | | | | | |
Net investment income (loss) B | .06 E | .05 F | .10 | .03 | (.02) |
Net realized and unrealized gain (loss) | 2.23 | 2.34 | (.60) | (1.99) | 1.91 |
Total from investment operations | 2.29 | 2.39 | (.50) | (1.96) | 1.89 |
Distributions from net investment income | (.10) | (.05) | (.08) | - | - |
Distributions from net realized gain | (.13) | - | (.11) | (.56) | (.68) |
Total distributions | (.23) | (.05) | (.19) | (.56) | (.68) |
Redemption fees added to paid in capital B,H | - | - | - | - | - |
Net asset value, end of period | $ 15.62 | $ 13.56 | $ 11.22 | $ 11.91 | $ 14.43 |
Total Return A | 17.03% | 21.32% | (4.15)% | (14.10)% | 14.96% |
Ratios to Average Net Assets C,G | | | | |
Expenses before reductions | 1.13% | 1.18% | 1.20% | 1.14% | 1.11% |
Expenses net of fee waivers, if any | 1.13% | 1.18% | 1.20% | 1.14% | 1.11% |
Expenses net of all reductions | 1.13% | 1.17% | 1.20% | 1.13% | 1.11% |
Net investment income (loss) | .37% E | .39% F | 1.01% | .22% | (.15)% |
Supplemental Data | | | | | |
Net assets, end of period (000 omitted) | $ 1,899,805 | $ 1,770,675 | $ 1,488,736 | $ 1,136,860 | $ 1,233,808 |
Portfolio turnover rate D | 22% | 49% | 51% | 149% | 67% |
A Total returns would have been lower if certain expenses had not been reduced during the applicable periods shown.
B Calculated based on average shares outstanding during the period.
C Fees and expenses of any underlying Fidelity Central Funds are not included in the Fund's expense ratio. The Fund indirectly bears its proportionate share of the expenses of any underlying Fidelity Central Funds.
D Amount does not include the portfolio activity of any underlying Fidelity Central Funds.
E Investment income per share reflects a special dividend which amounted to $.06 per share. Excluding the special dividend, the ratio of net investment income (loss) to average net assets would have been (.01) %.
F Investment income per share reflects a special dividend which amounted to $.03 per share. Excluding the special dividend, the ratio of net investment income (loss) to average net assets would have been .12%.
G Expense ratios reflect operating expenses of the class. Expenses before reductions do not reflect amounts reimbursed by the investment adviser or reductions from brokerage service arrangements or reductions from other expense offset arrangements and do not represent the amount paid by the class during periods when reimbursements or reductions occur. Expenses net of fee waivers reflect expenses after reimbursement by the investment adviser but prior to reductions from brokerage service arrangements or other expense offset arrangements. Expenses net of all reductions represent the net expenses paid by the class.
H Amount represents less than $.01 per share.
See accompanying notes which are an integral part of the financial statements.
Annual Report
Financial Highlights - Class F
Years ended July 31, | 2011 | 2010 | 2009 I |
Selected Per-Share Data | | | |
Net asset value, beginning of period | $ 13.58 | $ 11.22 | $ 10.27 |
Income from Investment Operations | | | |
Net investment income (loss) D | .09 G | .09 H | .01 |
Net realized and unrealized gain (loss) | 2.23 | 2.34 | .94 |
Total from investment operations | 2.32 | 2.43 | .95 |
Distributions from net investment income | (.14) | (.07) | - |
Distributions from net realized gain | (.13) | - | - |
Total distributions | (.26) L | (.07) | - |
Redemption fees added to paid in capital D,K | - | - | - |
Net asset value, end of period | $ 15.64 | $ 13.58 | $ 11.22 |
Total Return B,C | 17.31% | 21.69% | 9.25% |
Ratios to Average Net Assets E,J | | | |
Expenses before reductions | .88% | .90% | .86% A |
Expenses net of fee waivers, if any | .88% | .90% | .86%A |
Expenses net of all reductions | .88% | .89% | .86%A |
Net investment income (loss) | .61% G | .67% H | .64%A |
Supplemental Data | | | |
Net assets, end of period (000 omitted) | $ 279,653 | $ 109,868 | $ 159 |
Portfolio turnover rate F | 22% | 49% | 51% |
A Annualized
B Total returns for periods of less than one year are not annualized.
C Total returns would have been lower if certain expenses had not been reduced during the applicable periods shown.
D Calculated based on average shares outstanding during the period.
E Fees and expenses of any underlying Fidelity Central Funds are not included in the Fund's expense ratio. The Fund indirectly bears its proportionate share of the expenses of any underlying Fidelity Central Funds.
F Amount does not include the portfolio activity of any underlying Fidelity Central Funds.
G Investment income per share reflects a special dividend which amounted to $.06 per share. Excluding the special dividend, the ratio of net investment income (loss) to average net assets would have been .24%.
H Investment income per share reflects a special dividend which amounted to $.03 per share. Excluding the special dividend, the ratio of net investment income (loss) to average net assets would have been .40%.
I For the period June 26, 2009 (commencement of sale of shares) to July 31, 2009.
J Expense ratios reflect operating expenses of the class. Expenses before reductions do not reflect amounts reimbursed by the investment adviser or reductions from brokerage service arrangements or reductions from other expense offset arrangements and do not represent the amount paid by the class during periods when reimbursements or reductions occur. Expense ratios before reductions for start-up periods may not be representative of longer-term operating periods. Expenses net of fee waivers reflect expenses after reimbursement by the investment adviser but prior to reductions from brokerage service arrangements or other expense offset arrangements. Expenses net of all reductions represent the net expenses paid by the class.
K Amount represents less than $.01 per share.
L Total distributions of $.26 per share is comprised of distributions from net investment income of $.138 and distributions from net realized gain of $.126 per share.
See accompanying notes which are an integral part of the financial statements.
Annual Report
Financial Highlights - Institutional Class
Years ended July 31, | 2011 | 2010 | 2009 | 2008 | 2007 |
Selected Per-Share Data | | | | | |
Net asset value, beginning of period | $ 13.58 | $ 11.24 | $ 11.91 | $ 14.43 | $ 13.22 |
Income from Investment Operations | | | | | |
Net investment income (loss) B | .06 E | .06 F | .10 | .03 | (.02) |
Net realized and unrealized gain (loss) | 2.23 | 2.34 | (.59) | (1.99) | 1.91 |
Total from investment operations | 2.29 | 2.40 | (.49) | (1.96) | 1.89 |
Distributions from net investment income | (.11) | (.06) | (.07) | - | - |
Distributions from net realized gain | (.13) | - | (.11) | (.56) | (.68) |
Total distributions | (.24) | (.06) | (.18) | (.56) | (.68) |
Redemption fees added to paid in capital B,H | - | - | - | - | - |
Net asset value, end of period | $ 15.63 | $ 13.58 | $ 11.24 | $ 11.91 | $ 14.43 |
Total Return A | 17.02% | 21.42% | (4.04)% | (14.10)% | 14.99% |
Ratios to Average Net Assets C,G | | | | | |
Expenses before reductions | 1.10% | 1.12% | 1.20% | 1.13% | 1.10% |
Expenses net of fee waivers, if any | 1.10% | 1.12% | 1.15% | 1.13% | 1.10% |
Expenses net of all reductions | 1.10% | 1.12% | 1.15% | 1.13% | 1.10% |
Net investment income (loss) | .39% E | .45% F | 1.06% | .22% | (.13)% |
Supplemental Data | | | | | |
Net assets, end of period (000 omitted) | $ 101,565 | $ 78,440 | $ 10,336 | $ 8,584 | $ 11,594 |
Portfolio turnover rate D | 22% | 49% | 51% | 149% | 67% |
A Total returns would have been lower if certain expenses had not been reduced during the applicable periods shown.
B Calculated based on average shares outstanding during the period.
C Fees and expenses of any underlying Fidelity Central Funds are not included in the Fund's expense ratio. The Fund indirectly bears its proportionate share of the expenses of any underlying Fidelity Central Funds.
D Amount does not include the portfolio activity of any underlying Fidelity Central Funds.
E Investment income per share reflects a special dividend which amounted to $.06 per share. Excluding the special dividend, the ratio of net investment income (loss) to average net assets would have been .01%.
F Investment income per share reflects a special dividend which amounted to $.03 per share. Excluding the special dividend, the ratio of net investment income (loss) to average net assets would have been .18%.
G Expense ratios reflect operating expenses of the class. Expenses before reductions do not reflect amounts reimbursed by the investment adviser or reductions from brokerage service arrangements or reductions from other expense offset arrangements and do not represent the amount paid by the class during periods when reimbursements or reductions occur. Expenses net of fee waivers reflect expenses after reimbursement by the investment adviser but prior to reductions from brokerage service arrangements or other expense offset arrangements. Expenses net of all reductions represent the net expenses paid by the class.
H Amount represents less than $.01 per share.
See accompanying notes which are an integral part of the financial statements.
Annual Report
Notes to Financial Statements
For the period ended July 31, 2011
1. Organization.
Fidelity Small Cap Value Fund (the Fund) is a fund of Fidelity Securities Fund (the Trust) and is authorized to issue an unlimited number of shares. The Trust is registered under the Investment Company Act of 1940, as amended (the 1940 Act), as an open-end management investment company organized as a Massachusetts business trust. The Fund offers Class A, Class T, Class C, Small Cap Value, Class F and Institutional Class shares, each of which, along with Class B shares, has equal rights as to assets and voting privileges. Effective after the close of business on September 1, 2010, Class B shares were closed to new accounts and additional purchases, except for exchanges and reinvestments, by existing shareholders. Each class has exclusive voting rights with respect to matters that affect that class. Class F shares of the Fund are only available for purchase by mutual funds for which Fidelity Management & Research Company (FMR) or an affiliate serves as investment manager. Class B shares will automatically convert to Class A shares after a holding period of seven years from the initial date of purchase. Investment income, realized and unrealized capital gains and losses, the common expenses of the Fund, and certain fund-level expense reductions, if any, are allocated on a pro-rata basis to each class based on the relative net assets of each class to the total net assets of the Fund. Each class differs with respect to transfer agent and distribution and service plan fees incurred. Certain expense reductions may also differ by class.
2. Investments in Fidelity Central Funds.
The Fund invests in Fidelity Central Funds, which are open-end investment companies available only to other investment companies and accounts managed by Fidelity Management & Research Company (FMR) and its affiliates. The Fund's Schedule of Investments lists each of the Fidelity Central Funds held as of period end, if any, as an investment of the Fund, but does not include the underlying holdings of each Fidelity Central Fund. As an Investing Fund, the Fund indirectly bears its proportionate share of the expenses of the underlying Fidelity Central Funds.
The Money Market Central Funds seek preservation of capital and current income and are managed by Fidelity Investments Money Management, Inc. (FIMM), an affiliate of FMR.
A complete unaudited list of holdings for each Fidelity Central Fund is available upon request or at the Securities and Exchange Commission (the SEC) web site at www.sec.gov. In addition, the financial statements of the Fidelity Central Funds, which are not covered by the Fund's Report of Independent Registered Public Accounting Firm, are available on the SEC web site or upon request.
Annual Report
3. Significant Accounting Policies.
The financial statements have been prepared in conformity with accounting principles generally accepted in the United States of America (GAAP), which require management to make certain estimates and assumptions at the date of the financial statements. Actual results could differ from those estimates. Subsequent events, if any, through the date that the financial statements were issued have been evaluated in the preparation of the financial statements. The following summarizes the significant accounting policies of the Fund:
Security Valuation. Investments are valued as of 4:00 p.m. Eastern time on the last calendar day of the period. The Fund uses independent pricing services approved by the Board of Trustees to value its investments. When current market prices or quotations are not readily available or reliable, valuations may be determined in good faith in accordance with procedures adopted by the Board of Trustees. Factors used in determining value may include market or security specific events. The frequency with which these procedures are used cannot be predicted and they may be utilized to a significant extent. The value used for net asset value (NAV) calculation under these procedures may differ from published prices for the same securities.
The Fund categorizes the inputs to valuation techniques used to value its investments into a disclosure hierarchy consisting of three levels as shown below:
Level 1 - quoted prices in active markets for identical investments
Level 2 - other significant observable inputs (including quoted prices for similar investments, interest rates, prepayment speeds, etc.)
Level 3 - unobservable inputs (including the Fund's own assumptions based on the best information available)
Changes in valuation techniques may result in transfers in or out of an assigned level within the disclosure hierarchy. Valuation techniques used to value the Fund's investments by major category are as follows:
Equity securities, including restricted securities, for which market quotations are readily available, are valued at the last reported sale price or official closing price as reported by an independent pricing service on the primary market or exchange on which they are traded and are categorized as Level 1 in the hierarchy. In the event there were no sales during the day or closing prices are not available, securities are valued at the last quoted bid price or may be valued using the last available price and are generally categorized as Level 2 in the hierarchy. For foreign equity securities, when significant market or security specific events arise, comparisons to the valuation of American Depositary Receipts
Annual Report
Notes to Financial Statements - continued
3. Significant Accounting Policies - continued
Security Valuation - continued
(ADRs), futures contracts, Exchange-traded funds (ETFs) and certain indexes as well as quoted prices for similar securities are used and are categorized as Level 2 in the hierarchy in these circumstances. Utilizing these techniques may result in transfers between Level 1 and Level 2. For restricted equity securities and private placements where observable inputs are limited, assumptions about market activity and risk are used and are categorized as Level 3 in the hierarchy.
Investments in open-end mutual funds, including the Fidelity Central Funds, are valued at their closing net asset value each business day and are categorized as Level 1 in the hierarchy.
Foreign Currency. The Fund may use foreign currency contracts to facilitate transactions in foreign-denominated securities. Gains and losses from these transactions may arise from changes in the value of the foreign currency or if the counterparties do not perform under the contracts' terms.
Foreign-denominated assets, including investment securities, and liabilities are translated into U.S. dollars at the exchange rate at period end. Purchases and sales of investment securities, income and dividends received and expenses denominated in foreign currencies are translated into U.S. dollars at the exchange rate in effect on the transaction date.
The effects of exchange rate fluctuations on investments are included with the net realized and unrealized gain (loss) on investment securities. Other foreign currency transactions resulting in realized and unrealized gain (loss) are disclosed separately.
Investment Transactions and Income. For financial reporting purposes, the Fund's investment holdings and NAV include trades executed through the end of the last business day of the period. The NAV per share for processing shareholder transactions is calculated as of the close of business of the New York Stock Exchange (NYSE), normally 4:00 p.m. Eastern time and includes trades executed through the end of the prior business day. Gains and losses on securities sold are determined on the basis of identified cost and may include proceeds received from litigation. Dividend income is recorded on the ex-dividend date, except for certain dividends from foreign securities where the ex-dividend date may have passed, which are recorded as soon as the Fund is informed of the ex-dividend date. Non-cash dividends included in dividend income, if any, are recorded at the fair market value of the securities received. Distributions received on securities that represent a return of capital or capital gain are recorded as a reduction of
Annual Report
3. Significant Accounting Policies - continued
Investment Transactions and Income - continued
cost of investments and/or as a realized gain. The Fund estimates the components of distributions received that may be considered return of capital distributions or capital gain distributions. Large, non-recurring dividends recognized by the Fund are presented separately on the Statement of Operations as "Special Dividends" and the impact of these dividends is presented in the Financial Highlights. Interest income and distributions from the Fidelity Central Funds are accrued as earned. Interest income includes coupon interest and amortization of premium and accretion of discount on debt securities. Investment income is recorded net of foreign taxes withheld where recovery of such taxes is uncertain.
Expenses. Expenses directly attributable to a fund are charged to that fund. Expenses attributable to more than one fund are allocated among the respective funds on the basis of relative net assets or other appropriate methods. Expense estimates are accrued in the period to which they relate and adjustments are made when actual amounts are known.
Income Tax Information and Distributions to Shareholders. Each year, the Fund intends to qualify as a regulated investment company, including distributing substantially all of its taxable income and realized gains under Subchapter M of the Internal Revenue Code and filing its U.S. federal tax return. As a result, no provision for income taxes is required. As of July 31, 2011, the Fund did not have any unrecognized tax benefits in the financial statements. A fund's federal tax return is subject to examination by the Internal Revenue Service (IRS) for a period of three years. Foreign taxes are provided for based on the Fund's understanding of the tax rules and rates that exist in the foreign markets in which it invests.
Distributions are declared and recorded on the ex-dividend date. Income dividends and capital gain distributions are declared separately for each class. Income and capital gain distributions are determined in accordance with income tax regulations, which may differ from GAAP. In addition, the Fund claimed a portion of the payment made to redeeming shareholders as a distribution for income tax purposes.
Capital accounts within the financial statements are adjusted for permanent book-tax differences. These adjustments have no impact on net assets or the results of operations. Temporary book-tax differences will reverse in a subsequent period.
Book-tax differences are primarily due to the foreign currency transactions and losses deferred due to wash sales.
Annual Report
Notes to Financial Statements - continued
3. Significant Accounting Policies - continued
Income Tax Information and Distributions to Shareholders - continued
The federal tax cost of investment securities and unrealized appreciation (depreciation) as of period end were as follows:
Gross unrealized appreciation | $ 530,639,044 |
Gross unrealized depreciation | (140,116,602) |
Net unrealized appreciation (depreciation) on securities and other investments | $ 390,522,442 |
| |
Tax Cost | $ 2,251,463,484 |
The tax-based components of distributable earnings as of period end were as follows:
Undistributed long-term capital gain | $ 130,326,950 |
Net unrealized appreciation (depreciation) | $ 390,529,985 |
Under the recently enacted Regulated Investment Company Modernization Act of 2010 (the Act), the Fund will be permitted to carry forward capital losses incurred in taxable years beginning after December 22, 2010 for an unlimited period. However, any losses incurred during those future taxable years will be required to be utilized prior to any losses incurred in pre-enactment taxable years, which generally expire after eight years from when they are incurred. Additionally, post-enactment capital losses that are carried forward will retain their character as either short-term or long-term capital losses rather than being considered all short-term as under previous law. The Fund's first fiscal year end subject to the Act will be July 31, 2012.
The tax character of distributions paid was as follows:
| July 31, 2011 | July 31, 2010 |
Ordinary Income | $ 16,899,273 | $ 6,560,137 |
Long-term Capital Gains | 19,302,851 | - |
Total | $ 36,202,124 | $ 6,560,137 |
Short-Term Trading (Redemption) Fees. Shares held by investors in the Fund less than 90 days are subject to a redemption fee equal to 1.50% of the net asset value of shares redeemed. All redemption fees, which reduce the proceeds of the shareholder redemption, are retained by the Fund and accounted for as an addition to paid in capital.
Annual Report
3. Significant Accounting Policies - continued
New Accounting Pronouncement. In May 2011, the Financial Accounting Standards Board issued Accounting Standard Update No. 2011-04, Fair Value Measurement (Topic 820) - Amendments to Achieve Common Fair Value Measurement and Disclosure Requirements in U.S. GAAP and IFRSs. The update changes the wording used to describe the requirements in GAAP for measuring fair value and for disclosing information about fair value measurements. The update is effective during interim and annual periods beginning after December 15, 2011. Management is currently evaluating the impact of the update's adoption on the Fund's financial statement disclosures.
4. Purchases and Sales of Investments.
Purchases and sales of securities, other than short-term securities, aggregated $587,909,809 and $542,085,214, respectively.
5. Fees and Other Transactions with Affiliates.
Management Fee. FMR and its affiliates provide the Fund with investment management related services for which the Fund pays a monthly management fee. The management fee is the sum of an individual fund fee rate that is based on an annual rate of .45% of the Fund's average net assets and a group fee rate that averaged .26% during the period. The group fee rate is based upon the average net assets of all the mutual funds advised by FMR. The group fee rate decreases as assets under management increase and increases as assets under management decrease. In addition, the management fee is subject to a performance adjustment (up to a maximum of ±.20% of the Fund's average net assets over a 36 month performance period). The upward or downward adjustment to the management fee is based on the relative investment performance of Small Cap Value as compared to an appropriate benchmark index. For the period, the total annual management fee rate, including the performance adjustment, was .84% of the Fund's average net assets.
Distribution and Service Plan Fees. In accordance with Rule 12b-1 of the 1940 Act, the Fund has adopted separate Distribution and Service Plans for each class of shares. Certain classes pay Fidelity Distributors Corporation (FDC), an affiliate of FMR, separate Distribution and Service Fees, each of which is based on an annual percentage of each class' average net assets. In addition, FDC may pay financial intermediaries for
Annual Report
Notes to Financial Statements - continued
5. Fees and Other Transactions with Affiliates - continued
Distribution and Service Plan Fees - continued
selling shares of the Fund and providing shareholder support services. For the period, the Distribution and Service Fee rates, total fees and amounts retained by FDC were as follows:
| Distribution
Fee | Service
Fee | Total Fees | Retained
by FDC |
Class A | -% | .25% | $ 320,077 | $ 13,128 |
Class T | .25% | .25% | 280,302 | 522 |
Class B | .75% | .25% | 97,826 | 73,433 |
Class C | .75% | .25% | 465,720 | 134,667 |
| | | $ 1,163,925 | $ 221,750 |
Sales Load. FDC may receive a front-end sales charge of up to 5.75% for selling Class A shares, and 3.50% for selling Class T shares, some of which is paid to financial intermediaries for selling shares of the Fund. Depending on the holding period, FDC may receive contingent deferred sales charges levied on Class A, Class T, Class B, and Class C redemptions. The deferred sales charges range from 5% to 1% for Class B, 1% for Class C, 1.00% for certain purchases of Class A shares and .25% for certain purchases of Class T shares.
For the period, sales charge amounts retained by FDC were as follows:
| Retained
by FDC |
Class A | $ 60,912 |
Class T | 9,625 |
Class B* | 23,049 |
Class C* | 5,402 |
| $ 98,988 |
* When Class B and Class C shares are initially sold, FDC pays commissions from its own resources to financial intermediaries through which the sales are made.
Transfer Agent Fees. Fidelity Investments Institutional Operations Company, Inc. (FIIOC), an affiliate of FMR, is the transfer, dividend disbursing and shareholder servicing agent for each class of the Fund. FIIOC receives account fees and asset-based fees that vary according to the account size and type of account of the shareholders of the respective classes of the Fund, except for Class F. FIIOC receives no fees for providing transfer agency services to Class F. FIIOC pays for typesetting, printing and mailing of
Annual Report
5. Fees and Other Transactions with Affiliates - continued
Transfer Agent Fees - continued
shareholder reports, except proxy statements. For the period, transfer agent fees for each class were as follows:
| Amount | % of
Average
Net Assets |
Class A | $ 388,730 | .30 |
Class T | 173,683 | .31 |
Class B | 30,729 | .31 |
Class C | 139,095 | .30 |
Small Cap Value | 4,748,341 | .24 |
Institutional Class | 220,807 | .22 |
| $ 5,701,385 | |
Accounting and Security Lending Fees. Fidelity Service Company, Inc. (FSC), an affiliate of FMR, maintains the Fund's accounting records. The accounting fee is based on the level of average net assets for the month. Under a separate contract, FSC administers the security lending program. The security lending fee is based on the number and duration of lending transactions.
Brokerage Commissions. The Fund placed a portion of its portfolio transactions with brokerage firms which are affiliates of the investment adviser. The commissions paid to these affiliated firms were $13,259 for the period.
Interfund Lending Program. Pursuant to an Exemptive Order issued by the SEC, the Fund, along with other registered investment companies having management contracts with FMR, may participate in an interfund lending program. This program provides an alternative credit facility allowing the funds to borrow from, or lend money to, other participating affiliated funds. At period end, there were no interfund loans outstanding. The Fund's activity in this program during the period for which loans were outstanding was as follows:
Borrower or Lender | Average Daily
Loan Balance | Weighted Average
Interest Rate | Interest
Expense |
Borrower | $ 5,022,450 | .42% | $ 1,171 |
Annual Report
Notes to Financial Statements - continued
6. Committed Line of Credit.
The Fund participates with other funds managed by FMR or an affiliate in a $4.0 billion credit facility (the "line of credit") to be utilized for temporary or emergency purposes to fund shareholder redemptions or for other short-term liquidity purposes. The Fund has agreed to pay commitment fees on its pro-rata portion of the line of credit, which amounted to $8,189 and is reflected in Miscellaneous expenses on the Statement of Operations. During the period, there were no borrowings on this line of credit.
7. Security Lending.
The Fund lends portfolio securities through a lending agent from time to time in order to earn additional income. The lending agent may loan securities to certain qualified borrowers, including Fidelity Capital Markets (FCM), a broker-dealer affiliated with the Fund. On the settlement date of the loan, the Fund receives collateral (in the form of U.S. Treasury obligations, letters of credit and/or cash) against the loaned securities and maintains collateral in an amount not less than 100% of the market value of the loaned securities during the period of the loan. The market value of the loaned securities is determined at the close of business of the Fund and any additional required collateral is delivered to the Fund on the next business day. If the borrower defaults on its obligation to return the securities loaned because of insolvency or other reasons, a fund could experience delays and costs in recovering the securities loaned or in gaining access to the collateral. Any cash collateral received is invested in the Fidelity Securities Lending Cash Central Fund. The value of loaned securities and cash collateral at period end are disclosed on the Fund's Statement of Assets and Liabilities. Security lending income represents the income earned on investing cash collateral, less rebates paid to borrowers and lending agent fees associated with the loan, plus any premium payments received for lending certain types of securities. Security lending income is presented in the Statement of Operations as a component of income from Fidelity Central Funds. Total security lending income during the period amounted to $121,080. During the period, there were no securities loaned to FCM.
8. Expense Reductions.
FMR voluntarily agreed to reimburse each class to the extent annual operating expenses exceeded certain levels of average net assets as noted in the table below. Some expenses, for example interest expense, including commitment fees, are excluded from this reimbursement.
Annual Report
8. Expense Reductions - continued
The following classes were in reimbursement during the period:
| Expense
Limitations* | Reimbursement
from adviser |
Class A | 1.40 % | $ 9,560 |
Class T | 1.65 % | 4,801 |
Class B | 2.15 % | 1,186 |
Class C | 2.15 % | 3,342 |
| | $ 18,889 |
* Effective October 1, 2010 the expense limitations were eliminated.
Many of the brokers with whom FMR places trades on behalf of the Fund provided services to the Fund in addition to trade execution. These services included payments of certain expenses on behalf of the Fund totaling $25,738 for the period.
9. Distributions to Shareholders.
Distributions to shareholders of each class were as follows:
Years ended July 31, | 2011 | 2010 |
From net investment income | | |
Class A | $ 602,963 | $ 159,193 |
Class T | 175,083 | 36,920 |
Class B | 8,350 | - |
Class C | 50,685 | - |
Small Cap Value | 13,136,446 | 6,230,380 |
Class F | 1,502,640 | 28,266 |
Institutional Class | 674,898 | 105,378 |
Total | $ 16,151,065 | $ 6,560,137 |
From net realized gain | | |
Class A | $ 938,086 | $ - |
Class T | 417,804 | - |
Class B | 85,354 | - |
Class C | 362,483 | - |
Small Cap Value | 16,213,209 | - |
Class F | 1,278,822 | - |
Institutional Class | 755,301 | - |
Total | $ 20,051,059 | $ - |
Annual Report
Notes to Financial Statements - continued
10. Share Transactions.
Transactions for each class of shares were as follows:
| Shares | Dollars |
Years ended July 31, | 2011 | 2010 | 2011 | 2010 |
Class A | | | | |
Shares sold | 4,641,222 | 4,231,111 | $ 70,784,911 | $ 54,936,600 |
Reinvestment of distributions | 98,821 | 12,276 | 1,412,739 | 146,358 |
Shares redeemed | (2,860,682) | (1,973,236) | (43,524,578) | (25,421,999) |
Net increase (decrease) | 1,879,361 | 2,270,151 | $ 28,673,072 | $ 29,660,959 |
Class T | | | | |
Shares sold | 1,830,956 | 1,449,265 | $ 27,619,849 | $ 18,793,141 |
Reinvestment of distributions | 40,370 | 3,030 | 573,649 | 35,906 |
Shares redeemed | (1,537,319) | (727,616) | (23,500,005) | (9,211,959) |
Net increase (decrease) | 334,007 | 724,679 | $ 4,693,493 | $ 9,617,088 |
Class B | | | | |
Shares sold | 84,331 | 262,419 | $ 1,230,023 | $ 3,340,905 |
Reinvestment of distributions | 5,817 | - | 79,168 | - |
Shares redeemed | (265,513) | (174,554) | (3,874,627) | (2,189,700) |
Net increase (decrease) | (175,365) | 87,865 | $ (2,565,436) | $ 1,151,205 |
Class C | | | | |
Shares sold | 1,131,174 | 1,327,692 | $ 16,672,873 | $ 17,060,657 |
Reinvestment of distributions | 25,779 | - | 354,104 | - |
Shares redeemed | (848,659) | (434,251) | (12,648,504) | (5,448,332) |
Net increase (decrease) | 308,294 | 893,441 | $ 4,378,473 | $ 11,612,325 |
Small Cap Value | | | | |
Shares sold | 35,677,635 | 45,122,251 | $ 541,990,483 | $ 585,925,779 |
Reinvestment of distributions | 1,987,755 | 507,903 | 28,460,668 | 6,101,827 |
Shares redeemed | (46,640,533) | (47,781,912) | (708,788,001) | (605,149,428) |
Net increase (decrease) | (8,975,143) | (2,151,758) | $ (138,336,850) | $ (13,121,822) |
Class F | | | | |
Shares sold | 11,644,633 | 8,411,513 | $ 177,097,711 | $ 109,778,609 |
Reinvestment of distributions | 192,943 | 2,350 | 2,781,462 | 28,266 |
Shares redeemed | (2,052,505) | (337,999) | (32,200,197) | (4,618,215) |
Net increase (decrease) | 9,785,071 | 8,075,864 | $ 147,678,976 | $ 105,188,660 |
Institutional Class | | | | |
Shares sold | 4,417,342 | 5,522,070 | $ 67,359,213 | $ 73,692,691 |
Reinvestment of distributions | 90,435 | 7,512 | 1,288,856 | 90,344 |
Shares redeemed | (3,788,938) | (671,565) | (58,540,522) | (8,789,847) |
Net increase (decrease) | 718,839 | 4,858,017 | $ 10,107,547 | $ 64,993,188 |
Annual Report
11. Other.
The Fund's organizational documents provide former and current trustees and officers with a limited indemnification against liabilities arising in connection with the performance of their duties to the Fund. In the normal course of business, the Fund may also enter into contracts that provide general indemnifications. The Fund's maximum exposure under these arrangements is unknown as this would be dependent on future claims that may be made against the Fund. The risk of material loss from such claims is considered remote.
At the end of the period, the Fidelity Freedom Funds® and Fidelity Freedom K® Funds were the owners of record, in the aggregate, of approximately 37% of the total outstanding shares of the Fund.
Annual Report
To the Trustees of Fidelity Securities Fund and the Shareholders of Fidelity Small Cap Value Fund:
In our opinion, the accompanying statement of assets and liabilities, including the schedule of investments, and the related statements of operations and of changes in net assets and the financial highlights present fairly, in all material respects, the financial position of Fidelity Small Cap Value Fund (a fund of Fidelity Securities Fund) at July 31, 2011, the results of its operations for the year then ended, the changes in its net assets for each of the two years in the period then ended and the financial highlights for each of the periods indicated, in conformity with accounting principles generally accepted in the United States of America. These financial statements and financial highlights (hereafter referred to as "financial statements") are the responsibility of the Fidelity Small Cap Value Fund's management. Our responsibility is to express an opinion on these financial statements based on our audits. We conducted our audits of these financial statements in accordance with the standards of the Public Company Accounting Oversight Board (United States). Those standards require that we plan and perform the audit to obtain reasonable assurance about whether the financial statements are free of material misstatement. An audit includes examining, on a test basis, evidence supporting the amounts and disclosures in the financial statements, assessing the accounting principles used and significant estimates made by management, and evaluating the overall financial statement presentation. We believe that our audits, which included confirmation of securities at July 31, 2011 by correspondence with the custodian and brokers, provide a reasonable basis for our opinion.
/s/PricewaterhouseCoopers LLP
PricewaterhouseCoopers LLP
Boston, Massachusetts
September 15, 2011
Annual Report
The Trustees, Members of the Advisory Board, and executive officers of the trust and fund, as applicable, are listed below. The Board of Trustees governs the fund and is responsible for protecting the interests of shareholders. The Trustees are experienced executives who meet periodically throughout the year to oversee the fund's activities, review contractual arrangements with companies that provide services to the fund, oversee management of the risks associated with such activities and contractual arrangements, and review the fund's performance. Except for James C. Curvey, each of the Trustees oversees 221 funds advised by FMR or an affiliate. Mr. Curvey oversees 419 funds advised by FMR or an affiliate.
The Trustees hold office without limit in time except that (a) any Trustee may resign; (b) any Trustee may be removed by written instrument, signed by at least two-thirds of the number of Trustees prior to such removal; (c) any Trustee who requests to be retired or who has become incapacitated by illness or injury may be retired by written instrument signed by a majority of the other Trustees; and (d) any Trustee may be removed at any special meeting of shareholders by a two-thirds vote of the outstanding voting securities of the trust. Each Trustee who is not an interested person (as defined in the 1940 Act) (Independent Trustee), shall retire not later than the last day of the calendar year in which his or her 75th birthday occurs. The Independent Trustees may waive this mandatory retirement age policy with respect to individual Trustees. The executive officers and Advisory Board Members hold office without limit in time, except that any officer and Advisory Board Member may resign or may be removed by a vote of a majority of the Trustees at any regular meeting or any special meeting of the Trustees. Except as indicated, each individual has held the office shown or other offices in the same company for the past five years.
Experience, Skills, Attributes, and Qualifications of the Fund's Trustees. The Governance and Nominating Committee has adopted a statement of policy that describes the experience, qualifications, attributes, and skills that are necessary and desirable for potential Independent Trustee candidates (Statement of Policy). The Board believes that each Trustee satisfied at the time he or she was initially elected or appointed a Trustee, and continues to satisfy, the standards contemplated by the Statement of Policy. The Governance and Nominating Committee also engages professional search firms to help identify potential Independent Trustee candidates who have the experience, qualifications, attributes, and skills consistent with the Statement of Policy. From time to time, additional criteria based on the composition and skills of the current Independent Trustees, as well as experience or skills that may be appropriate in light of future changes to board composition, business conditions, and regulatory or other developments, have also been considered by the professional search firms and the Governance and Nominating Committee. In addition, the Board takes into account the Trustees' commitment and participation in Board and committee meetings, as well as their leadership of standing and ad hoc committees throughout their tenure.
In determining that a particular Trustee was and continues to be qualified to serve as a Trustee, the Board has considered a variety of criteria, none of which, in isolation, was controlling. The Board believes that, collectively, the Trustees have balanced and diverse experience, qualifications, attributes, and skills, which allow the Board to operate effectively in governing the fund and protecting the interests of shareholders. Information about the specific experience, skills, attributes, and qualifications of each Trustee, which in each case led to the Board's conclusion that the Trustee should serve (or continue to serve) as a trustee of the fund, is provided below.
Annual Report
Board Structure and Oversight Function. James C. Curvey is an interested person (as defined in the 1940 Act) and currently serves as Acting Chairman. The Trustees have determined that an interested Chairman is appropriate and benefits shareholders because an interested Chairman has a personal and professional stake in the quality and continuity of services provided to the fund. Independent Trustees exercise their informed business judgment to appoint an individual of their choosing to serve as Chairman, regardless of whether the Trustee happens to be independent or a member of management. The Independent Trustees have determined that they can act independently and effectively without having an Independent Trustee serve as Chairman and that a key structural component for assuring that they are in a position to do so is for the Independent Trustees to constitute a substantial majority for the Board. The Independent Trustees also regularly meet in executive session. Ned C. Lautenbach serves as Chairman of the Independent Trustees and as such (i) acts as a liaison between the Independent Trustees and management with respect to matters important to the Independent Trustees and (ii) with management prepares agendas for Board meetings.
Fidelity funds are overseen by different Boards of Trustees. The fund's Board oversees Fidelity's equity and high income funds and another Board oversees Fidelity's investment-grade bond, money market, and asset allocation funds. The asset allocation funds may invest in Fidelity funds overseen by the fund's Board. The use of separate Boards, each with its own committee structure, allows the Trustees of each group of Fidelity funds to focus on the unique issues of the funds they oversee, including common research, investment, and operational issues. On occasion, the separate Boards establish joint committees to address issues of overlapping consequences for the Fidelity funds overseen by each Board.
The Trustees operate using a system of committees to facilitate the timely and efficient consideration of all matters of importance to the Trustees, the fund, and fund shareholders and to facilitate compliance with legal and regulatory requirements and oversight of the fund's activities and associated risks. The Board, acting through its committees, has charged FMR and its affiliates with (i) identifying events or circumstances the occurrence of which could have demonstrably adverse effects on the fund's business and/or reputation; (ii) implementing processes and controls to lessen the possibility that such events or circumstances occur or to mitigate the effects of such events or circumstances if they do occur; and (iii) creating and maintaining a system designed to evaluate continuously business and market conditions in order to facilitate the identification and implementation processes described in (i) and (ii) above. Because the day-to-day operations and activities of the fund are carried out by or through FMR, its affiliates and other service providers, the fund's exposure to risks is mitigated but not eliminated by the processes overseen by the Trustees. While each of the Board's committees has responsibility for overseeing different aspects of the fund's activities, oversight is exercised primarily through the Operations, Audit, and Compliance Committees. Appropriate personnel, including but not limited to the fund's Chief Compliance Officer (CCO), FMR's internal auditor, the independent accountants, the fund's Treasurer and portfolio management personnel, make periodic reports to the Board's committees, as appropriate. The responsibilities of each committee, including their oversight responsibilities, are described further under "Standing Committees of the Fund's Trustees."
Annual Report
Trustees and Officers - continued
The fund's Statement of Additional Information (SAI) includes more information about the Trustees. To request a free copy, call Fidelity at 1-800-835-5092.
Interested Trustees*:
Correspondence intended for each Trustee who is an interested person may be sent to Fidelity Investments, 82 Devonshire Street, Boston, Massachusetts 02109.
Name, Age; Principal Occupations and Other Relevant Experience+ |
James C. Curvey (76) |
| Year of Election or Appointment: 2007 Mr. Curvey is Trustee and Acting Chairman of the Board of Trustees of certain Trusts. Mr. Curvey also serves as Trustee (2007-present) of other investment companies advised by FMR. Mr. Curvey is a Director of Fidelity Investments Money Management, Inc. (2009-present), Director of Fidelity Research & Analysis Co. (2009-present) and Director of FMR and FMR Co., Inc. (2007-present). Mr. Curvey is also Vice Chairman (2007-present) and Director of FMR LLC. In addition, Mr. Curvey serves as an Overseer for the Boston Symphony Orchestra and a member of the Trustees of Villanova University. Previously, Mr. Curvey was the Vice Chairman (2006-2007) and Director (2000-2007) of FMR Corp. |
Ronald P. O'Hanley (54) |
| Year of Election or Appointment: 2011 Mr. O'Hanley is Director of FMR Co., Inc. (2010-present), Director of Fidelity Investments Money Management, Inc. (2010-present), Director of Fidelity Research & Analysis Company (2010-present), President of Fidelity Asset Management and Corporate Services and a member of Fidelity's Executive Committee (2010-present). Previously, Mr. O'Hanley served as President and Chief Executive Officer of BNY Mellon Asset Management (2007-2010). Mr. O'Hanley also served as Vice Chairman of Bank New York Mellon Corp. and a member of that firm's Executive Committee. Prior to the 2007 merger of The Bank of New York and Mellon Financial Corporation, he was Vice Chairman of Mellon Financial Corporation and President and Chief Executive Officer of Mellon Asset Management. He joined Mellon in February 1997. Mr. O'Hanley currently serves as Chairman of the Boston Public Library Foundation Board of Directors and sits on the Board of Directors of Beth Israel Deaconess Medical Center, the Board of Trustees of the Marine Biological Laboratory and the Advisory Board of the Maxwell School of Citizenship and Public Administration at Syracuse University. Mr. O'Hanley also chairs the Council on Asset Management for the Financial Services Roundtable and is a member of the Board of Directors of Institutional Investor's U.S. Institute. |
* Trustees have been determined to be "Interested Trustees" by virtue of, among other things, their affiliation with the trust or various entities under common control with FMR.
+ The information above includes each Trustee's principal occupation during the last five years and other information relating to the experience, attributes, and skills relevant to each Trustee's qualifications to serve as a Trustee, which led to the conclusion that each Trustee should serve as a Trustee for the fund.
Annual Report
Trustees and Officers - continued
Independent Trustees:
Correspondence intended for each Independent Trustee (that is, the Trustees other than the Interested Trustees) may be sent to Fidelity Investments, P.O. Box 55235, Boston, Massachusetts 02205-5235.
Name, Age; Principal Occupations and Other Relevant Experience+ |
Dennis J. Dirks (63) |
| Year of Election or Appointment: 2005 Prior to his retirement in May 2003, Mr. Dirks was Chief Operating Officer and a member of the Board of The Depository Trust & Clearing Corporation (DTCC). He also served as President, Chief Operating Officer, and Board member of The Depository Trust Company (DTC) and President and Board member of the National Securities Clearing Corporation (NSCC). In addition, Mr. Dirks served as Chief Executive Officer and Board member of the Government Securities Clearing Corporation, Chief Executive Officer and Board member of the Mortgage-Backed Securities Clearing Corporation, as a Trustee and a member of the Finance Committee of Manhattan College (2005-2008), and as a Trustee and a member of the Finance Committee of AHRC of Nassau County (2006-2008). Mr. Dirks is a member of the Independent Directors Council (IDC) Governing Council (2010-Present) and Board of Directors for The Brookville Center for Children's Services, Inc. (2009-present). |
Alan J. Lacy (57) |
| Year of Election or Appointment: 2008 Mr. Lacy serves as Senior Adviser (2007-present) of Oak Hill Capital Partners, L.P. (private equity). Mr. Lacy also served as Chief Executive Officer (2000-2005) and Vice Chairman (2005-2006) of Sears Holdings Corporation and Sears, Roebuck and Co. (retail). In addition, Mr. Lacy serves as a member of the Board of Directors of Dave & Buster's, Inc. (restaurant and entertainment complexes, 2010-present), The Hillman Companies, Inc. (hardware wholesalers, 2010-present), and Bristol-Myers Squibb Company (global pharmaceuticals, 2007-present). Mr. Lacy is a member of the Board of Trustees of The National Parks Conservation Association (2006-Present). Previously, Mr. Lacy served as Chairman of the Board of Trustees of the National Parks Conservation Association (2008-2011) and as a member of the Board of Directors for the Western Union Company (global money transfer, 2006-2011). |
Ned C. Lautenbach (67) |
| Year of Election or Appointment: 2000 Mr. Lautenbach is Chairman of the Independent Trustees of the Equity and High Income Funds (2006-present). Mr. Lautenbach currently serves as the Lead Director of the Eaton Corporation Board of Directors (diversified industrial, 1997-present). Mr. Lautenbach is also a member of the Board of Directors of the Philharmonic Center for the Arts in Naples, Florida (1999-present); a member of the Board of Trustees of Fairfield University (2005-present); and a member of the Council on Foreign Relations (1994-present). Previously, Mr. Lautenbach was a Partner/Advisory Partner at Clayton, Dubilier & Rice, LLC (private equity investment, 1998-2010), as well as a Director of Sony Corporation (2006-2007). |
Joseph Mauriello (66) |
| Year of Election or Appointment: 2008 Prior to his retirement in January 2006, Mr. Mauriello served in numerous senior management positions including Deputy Chairman and Chief Operating Officer (2004-2005), and Vice Chairman of Financial Services (2002-2004) of KPMG LLP US (professional services, 1965-2005). Mr. Mauriello currently serves as a member of the Board of Directors of XL Group plc. (global insurance and re-insurance, 2006-present) and of Arcadia Resources Inc. (health care services and products, 2007-present). Previously, Mr. Mauriello served as a Director of the Hamilton Funds of the Bank of New York (2006-2007). |
Robert W. Selander (60) |
| Year of Election or Appointment: 2011 Previously, Mr. Selander served as a Member of the Advisory Board of Fidelity's Equity and High Income Funds (2011), Executive Vice Chairman (2010), Chief Executive Officer (2009-2010), and President and Chief Executive Officer (1997-2009) of Mastercard, Inc. |
Cornelia M. Small (67) |
| Year of Election or Appointment: 2005 Ms. Small is a member of the Board of Directors of the Teagle Foundation (2009-present). Ms. Small is also a member of the Investment Committee, and Chair (2008-present) and a member of the Board of Trustees of Smith College. In addition, Ms. Small serves on the Investment Committee of the Berkshire Taconic Community Foundation (2008-present). Previously, Ms. Small served as Chairperson of the Investment Committee (2002-2008) of Smith College. In addition, Ms. Small served as Chief Investment Officer, Director of Global Equity Investments, and a member of the Board of Directors of Scudder, Stevens & Clark and Scudder Kemper Investments. |
William S. Stavropoulos (72) |
| Year of Election or Appointment: 2002 Mr. Stavropoulos is Vice Chairman of the Independent Trustees of the Equity and High Income Funds (2006-present). Mr. Stavropoulos serves as President and Founder of the Michigan Baseball Foundation, the Great Lakes Loons (2007-present). Mr. Stavropoulos is Chairman Emeritus of the Board of Directors of The Dow Chemical Company, where he previously served in numerous senior management positions, including President, CEO (1995-2000; 2002-2004), Chairman of the Executive Committee (2000-2006), and as a member of the Board of Directors (1990-2006). Currently, Mr. Stavropoulos is Chairman of Univar (global distributor of commodity and specialty chemicals, 2010-present), a Director of Teradata Corporation (data warehousing and technology solutions, 2008-present), Chemical Financial Corporation, Maersk Inc. (industrial conglomerate), Tyco International, Inc. (multinational manufacturing and services, 2007-present), and a member of the Advisory Board for Metalmark Capital (private equity investment, 2005-present). Mr. Stavropoulos is a special advisor to Clayton, Dubilier & Rice, LLC (private equity investment). In addition, Mr. Stavropoulos is a member of the University of Notre Dame Advisory Council for the College of Science. |
David M. Thomas (62) |
| Year of Election or Appointment: 2008 Previously, Mr. Thomas served as Executive Chairman (2005-2006) and Chairman and Chief Executive Officer (2000-2005) of IMS Health, Inc. (pharmaceutical and healthcare information solutions). In addition, Mr. Thomas serves as a member of the Board of Directors of Fortune Brands, Inc. (consumer products), and Interpublic Group of Companies, Inc. (marketing communication, 2004-present). |
Michael E. Wiley (60) |
| Year of Election or Appointment: 2008 Mr. Wiley also serves as a Director of Asia Pacific Exploration Consolidated (international oil and gas exploration and production, 2008-present). Mr. Wiley serves as a Director of Tesoro Corporation (independent oil refiner and marketer, 2005-present), and a Director of Bill Barrett Corporation (exploration and production, 2005-present). In addition, Mr. Wiley also serves as a Director of Post Oak Bank (privately-held bank, 2004-present). Previously, Mr. Wiley served as a member of the Board of Trustees of the University of Tulsa (2000-2006; 2007-2010), as a Senior Energy Advisor of Katzenbach Partners, LLC (consulting, 2006-2007), as an Advisory Director of Riverstone Holdings (private investment), Chairman, President, and CEO of Baker Hughes, Inc. (oilfield services, 2000-2004), and as Director of Spinnaker Exploration Company (exploration and production, 2001-2005). |
Annual Report
+ The information above includes each Trustee's principal occupation during the last five years and other information relating to the experience, attributes, and skills relevant to each Trustee's qualifications to serve as a Trustee, which led to the conclusion that each Trustee should serve as a Trustee for the fund.
Advisory Board Members and Executive Officers:
Correspondence intended for each executive officer, Edward C. Johnson 3d, and Peter S. Lynch may be sent to Fidelity Investments, 82 Devonshire Street, Boston, Massachusetts 02109.
Name, Age; Principal Occupation |
Edward C. Johnson 3d (81) |
| Year of Election or Appointment: 2011 Member of the Advisory Board of Fidelity's Equity and High Income Funds. Mr. Johnson serves as Chief Executive Officer, Chairman, and a Director of FMR LLC, and also serves as Chairman and Director of FIL Limited. Previously, Mr. Johnson served as a Trustee and Chairman of the Board of certain Fidelity Trusts, Chairman and a Director of FMR, Chairman and a Director of FMR Co., Inc., and President of FMR LLC (2006-2007). |
Peter S. Lynch (67) |
| Year of Election or Appointment: 2003 Member of the Advisory Board of Fidelity's Equity and High Income Funds. Mr. Lynch is Vice Chairman and a Director of FMR and FMR Co., Inc. In addition, Mr. Lynch serves as a Trustee of Boston College and as the Chairman of the Inner-City Scholarship Fund. Previously, Mr. Lynch served on the Special Olympics International Board of Directors (1997-2006). |
Kenneth B. Robins (41) |
| Year of Election or Appointment: 2008 President and Treasurer of Fidelity's Equity and High Income Funds. Mr. Robins also serves as President and Treasurer (2010-present) and Assistant Treasurer (2009-present) of other Fidelity funds and is an employee of Fidelity Investments (2004-present). Previously, Mr. Robins served as Deputy Treasurer of the Fidelity funds (2005-2008) and Treasurer and Chief Financial Officer of The North Carolina Capital Management Trust: Cash and Term Portfolios (2006-2008). |
Brian B. Hogan (46) |
| Year of Election or Appointment: 2009 Vice President of Equity and High Income Funds. Mr. Hogan also serves as President of FMR's Equity Division (2009-present). Previously, Mr. Hogan served as Senior Vice President, Equity Research of FMR (2006-2009) and as a portfolio manager. |
Thomas C. Hense (47) |
| Year of Election or Appointment: 2008 or 2010 Vice President of Fidelity's High Income (2008), Small Cap (2008), and Value (2010) Funds. Previously, Mr. Hense served as a portfolio manager for Fidelity's Institutional Money Management Group (Pyramis) (2003-2008). |
Scott C. Goebel (43) |
| Year of Election or Appointment: 2008 Secretary and Chief Legal Officer (CLO) of the Fidelity funds. Mr. Goebel also serves as Secretary of Fidelity Investments Money Management, Inc. (FIMM) (2010-present) and Fidelity Research and Analysis Company (FRAC) (2010-present); Secretary and CLO of The North Carolina Capital Management Trust: Cash and Term Portfolios (2008-present); General Counsel, Secretary, and Senior Vice President of FMR (2008-present) and FMR Co., Inc. (2008-present); employed by FMR LLC or an affiliate (2001-present); Chief Legal Officer of Fidelity Management & Research (Hong Kong) Limited (2008-present) and Assistant Secretary of Fidelity Management & Research (Japan) Inc. (2008-present), and Fidelity Management & Research (U.K.) Inc. (2008-present). Previously, Mr. Goebel served as Assistant Secretary of FIMM (2008-2010), FRAC (2008-2010), and the Funds (2007-2008) and as Vice President and Secretary of Fidelity Distributors Corporation (FDC) (2005-2007). |
William C. Coffey (42) |
| Year of Election or Appointment: 2009 Assistant Secretary of Fidelity's Equity and High Income Funds. Mr. Coffey also serves as Senior Vice President and Deputy General Counsel of FMR LLC (2010-present), and is an employee of Fidelity Investments. Previously, Mr. Coffey served as Vice President and Associate General Counsel of FMR LLC (2005-2009). |
Holly C. Laurent (57) |
| Year of Election or Appointment: 2008 Anti-Money Laundering (AML) Officer of the Fidelity funds. Ms. Laurent also serves as AML Officer of The North Carolina Capital Management Trust: Cash and Term Portfolios (2008-present) and is an employee of Fidelity Investments. Previously, Ms. Laurent was Senior Vice President and Head of Legal for Fidelity Business Services India Pvt. Ltd. (2006-2008), and Senior Vice President, Deputy General Counsel and Group Head for FMR LLC (2005-2006). |
Christine Reynolds (52) |
| Year of Election or Appointment: 2008 Chief Financial Officer of the Fidelity funds. Ms. Reynolds became President of Fidelity Pricing and Cash Management Services (FPCMS) in August 2008. Ms. Reynolds served as Chief Operating Officer of FPCMS (2007-2008). Previously, Ms. Reynolds served as President, Treasurer, and Anti-Money Laundering officer of the Fidelity funds (2004-2007). |
Kenneth A. Rathgeber (64) |
| Year of Election or Appointment: 2004 Chief Compliance Officer of Fidelity's Equity and High Income Funds. Mr. Rathgeber is Chief Compliance Officer of Fidelity Management & Research (Hong Kong) Limited (2008-present), Fidelity Management & Research (Japan) Inc. (2008-present), FMR (2005-present), FMR Co., Inc. (2005-present), Fidelity Management & Research (U.K.) Inc. (2005-present), Fidelity Research & Analysis Company (2005-present), Fidelity Investments Money Management, Inc. (2005-present), Pyramis Global Advisors, LLC (2005-present), and Strategic Advisers, Inc. (2005-present). |
Jeffrey S. Christian (49) |
| Year of Election or Appointment: 2009 Deputy Treasurer of the Fidelity funds. Mr. Christian is an employee of Fidelity Investments. Previously, Mr. Christian served as Chief Financial Officer (2008-2009) of certain Fidelity funds and Senior Vice President of Fidelity Pricing and Cash Management Services (FPCMS) (2004-2009). |
Bryan A. Mehrmann (50) |
| Year of Election or Appointment: 2005 Deputy Treasurer of the Fidelity funds. Mr. Mehrmann is an employee of Fidelity Investments. |
Adrien E. Deberghes (43) |
| Year of Election or Appointment: 2008 Deputy Treasurer of Fidelity's Equity and High Income Funds. Mr. Deberghes also serves as Assistant Treasurer of other Fidelity funds (2010-present) and is an employee of Fidelity Investments (2008-present). Previously, Mr. Deberghes served as Senior Vice President of Mutual Fund Administration at State Street Corporation (2007-2008), Senior Director of Mutual Fund Administration at Investors Bank & Trust (2005-2007), and Director of Finance for Dunkin' Brands (2000-2005). |
Stephanie J. Dorsey (42) |
| Year of Election or Appointment: 2010 Assistant Treasurer of Fidelity's Equity and High Income Funds. Ms. Dorsey also serves as Deputy Treasurer of other Fidelity funds (2008-present) and is an employee of Fidelity Investments (2008-present). Previously, Ms. Dorsey served as Treasurer (2004-2008) of the JPMorgan Mutual Funds and Vice President (2004-2008) of JPMorgan Chase Bank. |
John R. Hebble (53) |
| Year of Election or Appointment: 2009 Assistant Treasurer of Fidelity's Equity and High Income Funds. Mr. Hebble also serves as President (2011-present), Treasurer, and Chief Financial Officer of The North Carolina Capital Management Trust: Cash and Term Portfolios (2008-present), President and Treasurer of other Fidelity funds (2008-present) and is an employee of Fidelity Investments. |
Gary W. Ryan (52) |
| Year of Election or Appointment: 2005 Assistant Treasurer of the Fidelity funds. Mr. Ryan is an employee of Fidelity Investments. Previously, Mr. Ryan served as Vice President of Fund Reporting in Fidelity Pricing and Cash Management Services (FPCMS) (1999-2005). |
Jonathan Davis (43) |
| Year of Election or Appointment: 2010 Assistant Treasurer of the Fidelity funds. Mr. Davis is an employee of Fidelity Investments. Previously, Mr. Davis served as Vice President and Associate General Counsel of FMR LLC (2003-2010). |
Annual Report
The Board of Trustees of Fidelity Small Cap Value Fund voted to pay to shareholders of record at the opening of business on record date, the following distributions per share derived from capital gains realized from sales of portfolio securities:
| Pay Date | Record Date | Capital Gains |
F Class | 09/12/2011 | 09/09/2011 | $0.815 |
F Class designates 100% of the dividends distributed during the fiscal year as qualifying for the dividends-received deduction for corporate shareholders.
F Class designates 100% of the dividends distributed during the fiscal year as amounts which can be taken into account as a dividend for the purposes of the maximum rate under section 1(h)(11) of the Internal Revenue Code.
The fund hereby designates as a capital gain dividend with respect to the taxable year ended July 31, 2011, $147,340,051, or, if subsequently determined to be different, the net capital gain of such year.
The fund will notify shareholders in January 2012 of amounts for use in preparing 2011 income tax returns.
Annual Report
Board Approval of Investment Advisory Contracts and Management Fees
Fidelity Small Cap Value Fund
Each year, the Board of Trustees, including the Independent Trustees (together, the Board), votes on the renewal of the management contract and sub-advisory agreements (together, the Advisory Contracts) for the fund. The Board, assisted by the advice of fund counsel and Independent Trustees' counsel, requests and considers a broad range of information relevant to the renewal of the Advisory Contracts throughout the year.
The Board meets regularly and considers at each of its meetings factors that are relevant to its annual consideration of the renewal of the fund's Advisory Contracts, including the services and support provided to the fund and its shareholders. The Board has established various standing committees, each composed of Independent Trustees with varying backgrounds, to which the Board has assigned specific subject matter responsibilities in order to enhance effective decision-making by the Board. The Board, acting directly and through its Committees, requests and receives information concerning the annual consideration of the renewal of the fund's Advisory Contracts. The Board also meets as needed to consider matters specifically related to the Board's annual consideration of the renewal of Advisory Contracts. Members of the Board may also meet with trustees of other Fidelity funds through ad hoc joint committees to discuss certain matters relevant to the Fidelity funds.
At its July 2011 meeting, the Board of Trustees, including the Independent Trustees, unanimously determined to renew the fund's Advisory Contracts. In reaching its determination, the Board considered all factors it believed relevant, including (i) the nature, extent, and quality of the services to be provided to the fund and its shareholders (including the investment performance of the fund); (ii) the competitiveness of the fund's management fee and total expense ratio; (iii) the total costs of the services to be provided by and the profits to be realized by Fidelity from its relationship with the fund; (iv) the extent to which economies of scale would be realized as the fund grows; and (v) whether fee levels reflect these economies of scale, if any, for the benefit of fund shareholders.
In considering whether to renew the Advisory Contracts for the fund, the Board reached a determination, with the assistance of fund counsel and Independent Trustees' counsel and through the exercise of its business judgment, that the renewal of the Advisory Contracts is in the best interests of the fund and its shareholders and that the compensation payable under the Advisory Contracts is fair and reasonable. The Board's decision to renew the Advisory Contracts was not based on any single factor, but rather was based on a comprehensive consideration of all the information provided to the Board at its meetings throughout the year. The Board, in reaching its determination to renew the Advisory Contracts, is aware that shareholders in the fund have a broad range of investment choices available to them, including a wide choice among mutual funds offered by Fidelity's competitors, and that the fund's shareholders, who have the opportunity to review and weigh the disclosure provided by the fund in its prospectus and other public disclosures, have chosen to invest in this fund, managed by Fidelity.
Annual Report
Nature, Extent, and Quality of Services Provided. The Board considered the staffing within the investment adviser, FMR, and the sub-advisers (together, the Investment Advisers), including the backgrounds of the fund's investment personnel and the fund's investment objective and discipline. The Independent Trustees also had discussions with senior management of Fidelity's investment operations and investment groups. The Board considered the structure of the portfolio manager compensation program and whether this structure provides appropriate incentives to act in the best interests of the fund.
Resources Dedicated to Investment Management and Support Services. The Board and the Fund Oversight and Research Committees reviewed the general qualifications and capabilities of the Investment Advisers' investment staff, including its size, education, experience, and resources, as well as the Investment Advisers' approach to recruiting, training, managing, and compensating investment personnel. The Board also noted that FMR has devoted increased resources to non-U.S. offices. The Board noted that Fidelity's analysts have extensive resources, tools and capabilities which allow them to conduct sophisticated quantitative and fundamental analysis, as well as credit analysis of issuers, counterparties and enhancers. The Board also believes that Fidelity's investment professionals have sufficient access to global information and data so as to provide competitive investment results over time, and that those professionals also have access to sophisticated tools which permit them to assess portfolio construction and risk and performance attribution characteristics continuously, as well as to transmit new information and research conclusions rapidly around the world. Additionally, in their deliberations, the Board considered the Investment Advisers' trading capabilities and resources which are an integral part of the investment management process.
Shareholder and Administrative Services. The Board considered (i) the nature, extent, quality, and cost of advisory, administrative, and shareholder services performed by the Investment Advisers and their affiliates under the Advisory Contracts and under separate agreements covering transfer agency, pricing and bookkeeping, and securities lending services for the fund; (ii) the nature and extent of the investment adviser's supervision of third party service providers, principally custodians and subcustodians; and (iii) the resources devoted to, and the record of compliance with, the fund's compliance policies and procedures. The Board also reviewed the allocation of fund brokerage, including allocations to brokers affiliated with the Investment Advisers, the use of brokerage commissions to pay fund expenses, and the use of "soft" commission dollars to pay for research services.
The Board noted that the growth of fund assets over time across the complex allows Fidelity to reinvest in the development of services designed to enhance the value or convenience of the Fidelity funds as investment vehicles. These services include 24-hour access to account information and market information through telephone representatives and over the Internet, investor education materials and asset allocation tools, and the expanded availability of Fidelity Investor Centers, with 35 new branches opening since 2010.
Annual Report
Board Approval of Investment Advisory Contracts and
Management Fees - continued
Investment in a Large Fund Family. The Board considered the benefits to shareholders of investing in a Fidelity fund, including the benefits of investing in a fund that is part of a large family of funds offering a variety of investment disciplines and providing a large variety of mutual fund investor services. The Board noted that Fidelity had taken, or had made recommendations that resulted in the Fidelity funds taking, a number of actions over the previous year that benefited particular funds, including (i) continuing to dedicate additional resources to investment research and support of the senior management team that oversees asset management; (ii) rationalizing product lines through the mergers of six funds into other funds; (iii) continuing to migrate the Freedom Funds to dedicated lower cost underlying funds; (iv) obtaining shareholder approval to broaden the investment strategies for Fidelity Consumer Finance Portfolio, Fidelity Emerging Asia Fund, and Fidelity Environment and Alternative Energy Portfolio; (v) contractually agreeing to reduce the management fees and impose other expense limitations on Spartan® 500 Index Fund and U.S. Bond Index Fund in connection with launching new institutional classes of these funds; (vi) changing the name, primary and supplemental benchmarks, and investment policies of Fidelity Global Strategies Fund to support the fund's flexible investment mandate and global orientation; and (vii) reducing the transfer agency account fee rates on certain accounts.
Investment Performance. The Board considered whether the fund has operated in accordance with its investment objective, as well as its record of compliance with its investment restrictions. It also reviewed the fund's absolute investment performance for each class, as well as the fund's relative investment performance for each class measured over multiple periods against (i) a broad-based securities market index, and (ii) a peer group of mutual funds deemed appropriate by Fidelity and reviewed by the Board. The following charts considered by the Board show, over the one-, three-, and five-year periods ended December 31, 2010, the cumulative total returns of Institutional Class (Class I) and Class C of the fund, the cumulative total returns of a broad-based securities market index ("benchmark"), and a range of cumulative total returns of a peer group of mutual funds identified by Morningstar, Inc. as having an investment style similar to that of the fund based on underlying portfolio holdings. The returns of Institutional Class (Class I) and Class C show the performance of the highest and lowest performing classes, respectively (based on five-year performance). The box within each chart shows the 25th percentile return (bottom of box) and the 75th percentile return (top of box) of the peer group. Returns shown above the box are in the first quartile and returns shown below the box are in the fourth quartile. The percentage beaten numbers noted below each chart correspond to the percentile box and represent the percentage of funds in the peer group whose performance was equal to or lower than that of the class indicated.
Annual Report
Fidelity Small Cap Value Fund
The Board reviewed the fund's relative investment performance against its peer group and noted that the performance of Institutional Class (Class I) of the fund was in the third quartile for the one-year period and the first quartile for the three- and five-year periods. The Board also noted that the investment performance of Institutional Class (Class I) of the fund compared favorably to its benchmark for all the periods shown. The Board considered that the variations in performance among the fund's classes reflect the variations in class expenses, which result in lower performance for higher expense classes. The Board also reviewed the fund's performance since inception as well as performance in the current year.
The Board also considered that the fund's management fee is subject to upward or downward adjustment depending upon whether, and to what extent, the fund's investment performance for the performance period exceeds, or is exceeded by, the record (over the same period) of a Board-approved performance adjustment index. The Board noted that the performance adjustment provides FMR with a strong economic incentive to seek to achieve superior performance for the fund's shareholders and helps to more closely align the interests of FMR and the fund's shareholders.
Based on its review, the Board concluded that the nature, extent, and quality of services provided to the fund under the Advisory Contracts should benefit the fund's shareholders.
Annual Report
Board Approval of Investment Advisory Contracts and
Management Fees - continued
Competitiveness of Management Fee and Total Expense Ratio. The Board considered the fund's management fee and total expense ratio compared to "mapped groups" of competitive funds and classes. Fidelity creates "mapped groups" by combining similar Lipper investment objective categories that have comparable management fee characteristics. Combining Lipper investment objective categories aids the Board's management fee and total expense ratio comparisons by broadening the competitive group used for comparison and by reducing the number of universes to which various Fidelity funds are compared.
Management Fee. The Board considered two proprietary management fee comparisons for the 12-month periods shown in the chart below. The group of Lipper funds used by the Board for management fee comparisons is referred to below as the "Total Mapped Group." The Total Mapped Group comparison focuses on a fund's standing relative to the total universe of comparable funds available to investors in terms of gross management fees before expense reimbursements or caps, and without giving effect to the fund's performance adjustment. "TMG %" represents the percentage of funds in the Total Mapped Group that had management fees that were lower than the fund's. For example, a TMG % of 14% means that 86% of the funds in the Total Mapped Group had higher management fees than the fund. The "Asset-Size Peer Group" (ASPG) comparison focuses on a fund's standing relative to non-Fidelity funds similar in size to the fund within the Total Mapped Group. The ASPG represents at least 15% of the funds in the Total Mapped Group with comparable asset size and management fee characteristics, subject to a minimum of 50 funds (or all funds in the Total Mapped Group if fewer than 50). Additional information, such as the ASPG quartile in which the fund's management fee ranked and the impact of the fund's performance adjustment, is also included in the chart and considered by the Board.
Annual Report
Fidelity Small Cap Value Fund
The Board noted that the fund's management fee ranked below the median of its Total Mapped Group and below the median of its ASPG for 2010. The Board also noted the effect of the fund's positive performance adjustment on the fund's management fee ranking. The Board noted that the performance adjustment for each year represents calculations for performance periods that differ from the periods shown in the performance charts above.
Based on its review, the Board concluded that the fund's management fee is fair and reasonable in light of the services that the fund receives and the other factors considered.
Total Expense Ratio. In its review of each class's total expense ratio, the Board considered the fund's management fee as well as other fund or class expenses, as applicable, such as transfer agent fees, pricing and bookkeeping fees, fund-paid 12b-1 fees, and custodial, legal, and audit fees. The Board also noted the effects of any waivers and reimbursements on fees and expenses, as well as the impact of the fund's performance adjustment. As part of its review, the Board also considered the current and historical total expense ratios of each class of the fund compared to competitive fund median expenses. Each class of the fund is compared to those funds and classes in the Total Mapped Group (used by the Board for management fee comparisons) that have a similar sales load structure.
The Board noted that the total expense ratio of each of Institutional Class, the retail class, and Class F ranked below its competitive median for 2010 and the total expense ratio of each of Class A, Class T, Class B, and Class C ranked above its competitive median for 2010. The Board considered that various factors, including 12b-1 fees, positive or negative performance adjustments, and relatively higher other expenses in the case of small fund size, can affect total expense ratios. The Board noted that the total expense ratio of Class T was above the competitive median primarily because of higher 12b-1 fees on Class T. Class T has a higher 12b-1 fee, but a lower front-end sales charge, than traditionally priced front-end sales charge classes. The Board noted that the fund offers multiple classes, each of which has a different sales load and 12b-1 fee structure, and that the multiple structures are intended to offer a range of pricing options for the intermediary market. The Board also noted that the total expense ratios of the classes vary primarily by the level of their 12b-1 fees, although differences in transfer agent fees may also cause expenses to vary from class to class.
Annual Report
Board Approval of Investment Advisory Contracts and
Management Fees - continued
Fees Charged to Other Fidelity Clients. The Board also considered Fidelity fee structures and other information with respect to clients of FMR and its affiliates, such as other mutual funds advised or subadvised by FMR or its affiliates, pension plan clients, and other institutional clients. In March 2010, the Board created an ad hoc joint committee with the board of other Fidelity funds (the Committee) to review and compare Fidelity's institutional investment advisory business with its business of providing services to the Fidelity funds, including the differences in services provided, fees charged, and costs incurred, as well as competition in their respective marketplaces.
Based on its review of total expense ratios and fees charged to other Fidelity clients, the Board concluded that the total expense ratio of each class of the fund was reasonable, although in some cases above the median of the universe presented for comparison, in light of the services that the fund and its shareholders receive and the other factors considered, including the findings of the Committee.
Costs of the Services and Profitability. The Board considered the revenues earned and the expenses incurred by Fidelity in conducting the business of developing, marketing, distributing, managing, administering and servicing the fund and its shareholders. The Board also considered the level of Fidelity's profits in respect of all the Fidelity funds.
On an annual basis, FMR presents to the Board Fidelity's profitability for the fund. Fidelity calculates the profitability for each fund, as well as aggregate profitability for groups of Fidelity funds and all Fidelity funds, using a series of detailed revenue and cost allocation methodologies which originate with the books and records of Fidelity on which Fidelity's audited financial statements are based. The Audit Committee of the Board reviews any significant changes from the prior year's methodologies.
PricewaterhouseCoopers LLP (PwC), independent registered public accounting firm and auditor to Fidelity and certain Fidelity funds, has been engaged annually by the Board as part of the Board's assessment of Fidelity's profitability analysis. PwC's engagement includes the review and assessment of Fidelity's methodologies used in determining the revenues and expenses attributable to Fidelity's mutual fund business, and completion of agreed-upon procedures surrounding the mathematical accuracy of fund profitability and its conformity to allocation methodologies. After considering PwC's reports issued under the engagement and information provided by Fidelity, the Board concluded that while other allocation methods may also be reasonable, Fidelity's profitability methodologies are reasonable in all material respects.
Annual Report
The Board also reviewed Fidelity's non-fund businesses and fall-out benefits related to the mutual fund business as well as cases where Fidelity's affiliates may benefit from or be related to the fund's business.
The Board considered the costs of the services provided by and the profits realized by Fidelity in connection with the operation of the fund and was satisfied that the profitability was not excessive in the circumstances.
Economies of Scale. The Board considered whether there have been economies of scale in respect of the management of the Fidelity funds, whether the Fidelity funds (including the fund) have appropriately benefited from any such economies of scale, and whether there is potential for realization of any further economies of scale. The Board considered the extent to which the fund will benefit from economies of scale through increased services to the fund, through waivers or reimbursements, or through fee or expense reductions. The Board also noted that in 2009, it and the board of other Fidelity funds created an ad hoc committee (the Economies of Scale Committee) to analyze whether FMR attains economies of scale in respect of the management and servicing of the Fidelity funds, whether the Fidelity funds have appropriately benefited from such economies of scale, and whether there is potential for realization of any further economies of scale.
The Board recognized that the fund's management contract incorporates a "group fee" structure, which provides for lower group fee rates as total fund assets under FMR's management increase, and for higher group fee rates as total fund assets under FMR's management decrease. FMR calculates the group fee rates based on a tiered asset "breakpoint" schedule that varies based on asset class. The Board considered that the group fee is designed to deliver the benefits of economies of scale to fund shareholders when total Fidelity fund assets increase, even if assets of any particular fund are unchanged or have declined, because some portion of Fidelity's costs are attributable to services provided to all Fidelity funds, and all funds benefit if those costs can be allocated among more assets. The Board concluded that, given the group fee structure, fund shareholders will benefit from lower management fees as assets under FMR's management increase at the fund complex level, regardless of whether Fidelity achieves any such economies of scale.
The Board concluded, taking into account the analysis of the Economies of Scale Committee, that any potential economies of scale are being appropriately shared between fund shareholders and Fidelity.
Annual Report
Board Approval of Investment Advisory Contracts and
Management Fees - continued
Additional Information Requested by the Board. In order to develop fully the factual basis for consideration of the Fidelity funds' Advisory Contracts, the Board requested and received additional information on certain topics, including (i) fund performance trends, actions to be taken by FMR to improve certain funds' overall performance, and Fidelity's long-term strategies for certain funds; (ii) portfolio manager changes that have occurred during the past year and length of portfolio manager tenure for different categories of funds over time; (iii) Fidelity's compensation structure for portfolio managers and other key personnel and strategies for attracting and retaining non-investment personnel; (iv) the amount of the investment that each portfolio manager has made in the Fidelity fund(s) that he or she manages; (v) historical trends in Fidelity's realization of fall-out benefits; (vi) Fidelity's group fee structures and the rationale for the individual fee rates of certain funds; (vii) fund profitability methodology and the impact of certain factors on fund profitability results; (viii) trends regarding industry use of performance fee structures and Fidelity's compliance practices with respect to performance adjustment calculations; (ix) the fee structures in place for certain other Fidelity clients; and (x) explanations regarding the relative total expense ratios of certain funds and classes, total expense competitive trends, and actions that might be taken by FMR to reduce total expense ratios for certain funds and classes.
Based on its evaluation of all of the conclusions noted above, and after considering all factors it believed relevant, the Board ultimately concluded that the advisory fee structures are fair and reasonable, and that the fund's Advisory Contracts should be renewed.
Annual Report
Managing Your Investments
Fidelity offers several ways to conveniently manage your workplace benefits (including your workplace savings plan, investments, and additional services) via your telephone or PC. You can access your plan and account information and research your investments 24 hours a day.
By Phone
Fidelity provides a single toll-free number to access plan information, account balances, positions, and quotes*. It's easy to navigate the service, and on your first call, the system will help you create a personal identification number (PIN) for security.
(phone_graphic)
Fidelity Workplace
Investing
1-800-835-5092
By PC
Fidelity's web site on the Internet provides a wide range of information, including plan information, daily financial news, fund performance, interactive planning tools, and news about Fidelity products and services.
(computer_graphic)
Fidelity's Web Site
www.401k.com
* When you call the quotes line, please remember that a fund's yield and return will vary and, except for money market funds, share price will also vary. This means that you may have a gain or loss when you sell your shares. There is no assurance that money market funds will be able to maintain a stable $1 share price; an investment in a money market fund is not insured or guaranteed by the U.S. government. Total returns are historical and include changes in share price, reinvestment of dividends and capital gains distributions, and the effects of any sales charges.
Annual Report
To Write Fidelity
We'll give your correspondence immediate attention and send you written confirmation upon completion of your request.
(letter_graphic)
For Non-Retirement
Accounts
Buying shares
Fidelity Investments
P.O. Box 770001
Cincinnati, OH 45277-0003
Overnight Express
Fidelity Investments
Attn: Distribution Services
100 Crosby Parkway - KC1H
Covington, KY 41015
Selling shares
Fidelity Investments
P.O. Box 770001
Cincinnati, OH 45277-0035
Overnight Express
Fidelity Investments
Attn: Distribution Services
100 Crosby Parkway - KC1H
Covington, KY 41015
General Correspondence
Fidelity Investments
P.O. Box 500
Merrimack, NH 03054-0500
(letter_graphic)
For Retirement
Accounts
Buying shares
Fidelity Investments
P.O. Box 770001
Cincinnati, OH 45277-0003
Selling shares
Fidelity Investments
P.O. Box 770001
Cincinnati, OH 45277-0035
Overnight Express
Fidelity Investments
Attn: Distribution Services
100 Crosby Parkway - KC1H
Covington, KY 41015
General Correspondence
Fidelity Investments
P.O. Box 500
Merrimack, NH 03054-0500
Annual Report
Investment Adviser
Fidelity Management & Research Company
Boston, MA
Investment Sub-Advisers
FMR Co., Inc.
Fidelity Management & Research
(U.K.) Inc.
Fidelity Management & Research
(Hong Kong) Limited
Fidelity Management & Research
(Japan) Inc.
General Distributor
Fidelity Distributors Corporation
Boston, MA
Transfer and Service Agents
Fidelity Investments Institutional
Operations Company, Inc.
Boston, MA
Fidelity Service Company, Inc.
Boston, MA
Custodian
Citibank, N.A.
New York, NY
SCV-F-ANN-0911
1.891896.102
(Fidelity Investment logo)(registered trademark)
Fidelity Advisor®
Small Cap Value
Fund - Class A, Class T,
Class B and Class C
Annual Report
July 31, 2011
(2_fidelity_logos) (Registered_Trademark)
Class A, Class T, Class B
and Class C are classes of
Fidelity® Small Cap Value Fund
Contents
Chairman's Message | <Click Here> | The Chairman's message to shareholders. |
Performance | <Click Here> | How the fund has done over time. |
Management's Discussion of Fund Performance | <Click Here> | The Portfolio Manager's review of fundperformance and strategy. |
Shareholder Expense Example | <Click Here> | An example of shareholder expenses. |
Investment Changes | <Click Here> | A summary of major shifts in the fund's investments over the past six months. |
Investments | <Click Here> | A complete list of the fund's investments with their market values. |
Financial Statements | <Click Here> | Statements of assets and liabilities, operations, and changes in net assets,
as well as financial highlights. |
Notes | <Click Here> | Notes to the financial statements. |
Report of Independent Registered Public Accounting Firm | <Click Here> | |
Trustees and Officers | <Click Here> | |
Distributions | <Click Here> | |
Board Approval of Investment Advisory Contracts and Management Fees | <Click Here> | |
To view a fund's proxy voting guidelines and proxy voting record for the 12-month period ended June 30, visit http://www.fidelity.com/proxyvotingresults or visit the Securities and Exchange Commission's (SEC) web site at http://www.sec.gov. You may also call 1-877-208-0098 to request a free copy of the proxy voting guidelines.
Standard & Poor's, S&P and S&P 500 are registered service marks of The McGraw-Hill Companies, Inc. and have been licensed for use by Fidelity Distributors Corporation.
Other third party marks appearing herein are the property of their respective owners.
All other marks appearing herein are registered or unregistered trademarks or service marks of FMR LLC or an affiliated company.
Annual Report
This report and the financial statements contained herein are submitted for the general information of the shareholders of the fund. This report is not authorized for distribution to prospective investors in the fund unless preceded or accompanied by an effective prospectus.
A fund files its complete schedule of portfolio holdings with the SEC for the first and third quarters of each fiscal year on Form N-Q. Forms N-Q are available on the SEC's web site at http://www.sec.gov. A fund's Forms N-Q may be reviewed and copied at the SEC's Public Reference Room in Washington, DC. Information regarding the operation of the SEC's Public Reference Room may be obtained by calling 1-800-SEC-0330. For a complete list of a fund's portfolio holdings, view the most recent holdings listing, semiannual report, or annual report on Fidelity's web site at http://www.fidelity.com, http://www.advisor.fidelity.com, or http://www.401k.com, as applicable.
NOT FDIC INSURED • MAY LOSE VALUE • NO BANK GUARANTEE
Neither the fund nor Fidelity Distributors Corporation is a bank.
Annual Report
(photo_of_James_C_Curvey)
Dear Shareholder:
The second half of 2011 began with U.S. equities continuing to give back some of the gains achieved earlier in the year. In the days leading up to July 31, markets were shaken by a political stalemate in which Congress struggled to address the debt ceiling issue before an early-August deadline. The resulting uncertainty held back markets in July, the third consecutive monthly decline for equities, effectively reversing the positive momentum seen through the end of April. Financial markets are always unpredictable, of course, but there are several time-tested investment principles that can help put the odds in your favor.
One of the basic tenets is to invest for the long term. Over time, riding out the markets' inevitable ups and downs has proven much more effective than selling into panic or chasing the hottest trend. Even missing only a few of the markets' best days can significantly diminish investor returns. Patience also affords the benefits of compounding - of earning interest on additional income or reinvested dividends and capital gains. There can be tax advantages and cost benefits to consider as well. While staying the course doesn't eliminate risk, it can considerably lessen the effect of short-term declines.
You can further manage your investing risk through diversification. And today, more than ever, geographic diversification should be taken into account. Studies indicate that asset allocation is the single most important determinant of a portfolio's long-term success. The right mix of stocks, bonds and cash - aligned to your particular risk tolerance and investment objective - is very important. Age-appropriate rebalancing is also an essential aspect of asset allocation. For younger investors, an emphasis on equities - which historically have been the best-performing asset class over time - is encouraged. As investors near their specific goal, such as retirement or sending a child to college, consideration may be given to replacing volatile assets (e.g. common stocks) with more-stable fixed investments (bonds or savings plans).
A third principle - investing regularly - can help lower the average cost of your purchases. Investing a certain amount of money each month or quarter helps ensure you won't pay for all your shares at market highs. This strategy - known as dollar cost averaging - also reduces "emotion" from investing, helping shareholders avoid selling weak performers just prior to an upswing, or chasing a hot performer just before a correction.
We invite you to contact us via the Internet, through our Investor Centers or by phone. It is our privilege to provide you the information you need to make the investments that are right for you.
Sincerely,
(The acting chairman's signature appears here.)
James C. Curvey
Acting Chairman
Annual Report
Average annual total return reflects the change in the value of an investment, assuming reinvestment of the class' distributions from dividend income and capital gains (the profits earned upon the sale of securities that have grown in value, if any) and assuming a constant rate of performance each year. The $10,000 table and the fund's returns do not reflect the deduction of taxes that a shareholder would pay on fund distributions or the redemption of fund shares. During periods of reimbursement by Fidelity, a fund's total return will be greater than it would be had the reimbursement not occurred. How a fund did yesterday is no guarantee of how it will do tomorrow.
Average Annual Total Returns
Periods ended July 31, 2011 | Past 1
year | Past 5
years | Life of
fundA |
Class A (incl. 5.75% sales charge) | 10.00% | 4.58% | 8.13% |
Class T (incl. 3.50% sales charge) | 12.29% | 4.81% | 8.24% |
Class B (incl. contingent deferred sales charge) B | 10.80% | 4.69% | 8.26% |
Class C (incl. contingent deferred sales charge) C | 14.91% | 5.04% | 8.27% |
A From November 3, 2004.
B Class B shares' contingent deferred sales charges included in the past one year, past five years, and life of fund total return figures are 5%, 2%, and 1%, respectively.
C Class C shares' contingent deferred sales charges included in the past one year, past five years, and life of fund total return figures are 1%, 0%, and 0%, respectively.
Annual Report
$10,000 Over Life of Fund
Let's say hypothetically that $10,000 was invested in Fidelity Advisor® Small Cap Value Fund - Class A on November 3, 2004, when the fund started, and the current 5.75% sales charge was paid. The chart shows how the value of your investment would have changed, and also shows how the Russell 2000® Value Index performed over the same period.
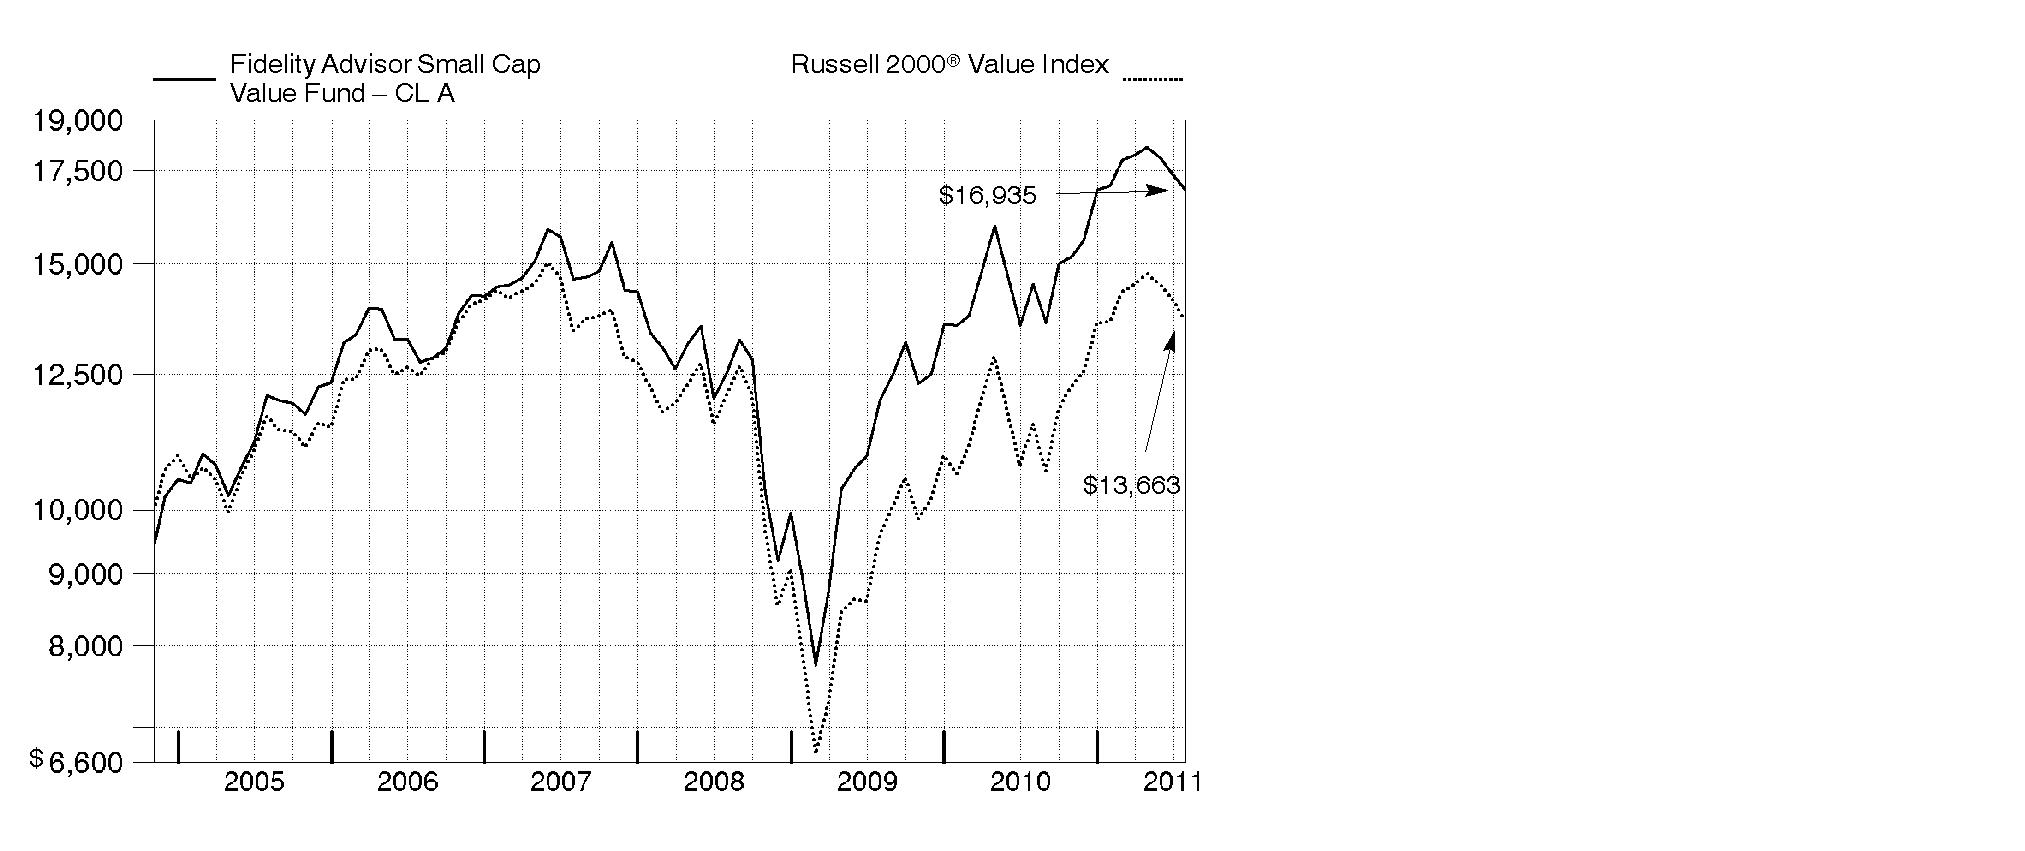
Annual Report
Market Recap: U.S. stocks registered solid double-digit gains for the 12 months ending July 31, 2011, extending a rally that began more than two years earlier. Despite a rough start in August 2010, markets turned positive in September, as increased demand for capital goods and other upbeat indicators trumped investor worry about a U.S. recessionary relapse. The broad market, as measured by the S&P 500® Index, rose 9% that month, its biggest September gain in 71 years. Seven more monthly advances followed, fueled by encouraging corporate earnings and economic activity. However, volatility picked up in the period's latter months, as markets reacted to continued high U.S. unemployment, nagging debt troubles in Europe and looming legislative battles over the federal debt ceiling. May unemployment rose above 9% for the first time in 2011, contributing to a traditional "June swoon" for stocks. Market uncertainty lingered in July, when the S&P 500® posted its second-biggest monthly loss of the period. For the full year, the S&P 500® climbed 19.65%, while the blue-chip-laden Dow Jones Industrial AverageSM rose a comparable 19.09% and the technology-heavy Nasdaq Composite® Index gained 23.40%. On the capitalization spectrum, stocks of mid-cap companies fared best, with the Russell Midcap® Index rising 24.51% and the small-cap Russell 2000® Index adding 23.92%.
Comments from Charles Myers, Portfolio Manager of Fidelity Advisor® Small Cap Value Fund: For the year, the fund's Class A, Class T, Class B and Class C shares returned 16.72%, 16.36%, 15.80% and 15.91%, respectively (excluding sales charges), versus 18.55% for the Russell 2000® Value Index. The consumer discretionary sector hurt performance, mainly due to poor stock selection in the consumer services and durables/apparel industries. An overweighting in the latter group also detracted. Another source of weakness was the financials sector, particularly banks and insurance stocks - including banks TCF Financial and Astoria Financial and reinsurer Platinum Underwriters Holdings - whose underperformance outweighed the favorable impact of my picks in the diversified financials industry. Banks were hurt by weak loan growth, while reinsurance companies were hampered by payouts for several costly disasters. Other detractors included commercial furniture maker HNI and homebuilder M.D.C. Holdings. On the positive side, stock selection in energy was very strong, led by Berry Petroleum and Superior Energy Services, both of which benefited from high oil prices. Positioning in industrials also helped, especially an investment in electrical distributor WESCO International. In health care, TeamHealth Holdings did very well. Many of the stocks I've mentioned were not in the index.
Comments from Charles Myers, Portfolio Manager of Fidelity Advisor® Small Cap Value Fund: For the year, the fund's Institutional Class shares returned 17.02%, versus 18.55% for the Russell 2000® Value Index. The consumer discretionary sector hurt performance, mainly due to poor stock selection in the consumer services and durables/apparel industries. An overweighting in the latter group also detracted. Another source of weakness was the financials sector, particularly banks and insurance stocks - including banks TCF Financial and Astoria Financial and reinsurer Platinum Underwriters Holdings - whose underperformance outweighed the favorable impact of my picks in the diversified financials industry. Banks were hurt by weak loan growth, while reinsurance companies were hampered by payouts for several costly disasters. Other detractors included commercial furniture maker HNI and homebuilder M.D.C. Holdings. On the positive side, stock selection in energy was very strong, led by Berry Petroleum and Superior Energy Services, both of which benefited from high oil prices. Positioning in industrials also helped, especially an investment in electrical distributor WESCO International. In health care, TeamHealth Holdings did very well. Many of the stocks I've mentioned were not in the index.
Annual Report
The views expressed above reflect those of the portfolio manager(s) only through the end of the period as stated on the cover of this report and do not necessarily represent the views of Fidelity or any other person in the Fidelity organization. Any such views are subject to change at any time based upon market or other conditions and Fidelity disclaims any responsibility to update such views. These views may not be relied on as investment advice and, because investment decisions for a Fidelity fund are based on numerous factors, may not be relied on as an indication of trading intent on behalf of any Fidelity fund.
Annual Report
Shareholder Expense Example
As a shareholder of the Fund, you incur two types of costs: (1) transaction costs, including sales charges (loads) on purchase payments or redemption proceeds, redemption fees, and (2) ongoing costs, including management fees, distribution and/or service (12b-1) fees and other Fund expenses. This Example is intended to help you understand your ongoing costs (in dollars) of investing in the Fund and to compare these costs with the ongoing costs of investing in other mutual funds.
The Example is based on an investment of $1,000 invested at the beginning of the period and held for the entire period (February 1, 2011 to July 31, 2011).
Actual Expenses
The first line of the accompanying table for each class of the Fund provides information about actual account values and actual expenses. You may use the information in this line, together with the amount you invested, to estimate the expenses that you paid over the period. Simply divide your account value by $1,000.00 (for example, an $8,600 account value divided by $1,000.00 = 8.6), then multiply the result by the number in the first line for a class of the Fund under the heading entitled "Expenses Paid During Period" to estimate the expenses you paid on your account during this period. A small balance maintenance fee of $12.00 that is charged once a year may apply for certain accounts with a value of less than $2,000. This fee is not included in the table below. If it was, the estimate of expenses you paid during the period would be higher, and your ending account value lower, by this amount. In addition, the Fund, as a shareholder in the underlying Fidelity Central Funds, will indirectly bear its pro-rata share of the fees and expenses incurred by the underlying Fidelity Central Funds. These fees and expenses are not included in the Fund's annualized expense ratio used to calculate the expense estimate in the table below.
Hypothetical Example for Comparison Purposes
The second line of the accompanying table for each class of the Fund provides information about hypothetical account values and hypothetical expenses based on a Class' actual expense ratio and an assumed rate of return of 5% per year before expenses, which is not the Class' actual return. The hypothetical account values and expenses may not be used to estimate the actual ending account balance or expenses you paid for the period. You may use this information to compare the ongoing costs of investing in the Fund and other funds. To do so, compare this 5% hypothetical example with the 5% hypothetical examples that appear in the shareholder reports of the other funds. A small balance maintenance fee of $12.00 that is charged once a year may apply for certain accounts with a value of less than $2,000. This fee is not included in the table below. If it was, the estimate of expenses you paid during the period would be higher, and your ending account value lower, by this amount. In addition, the Fund, as a shareholder in the underlying Fidelity Central Funds, will indirectly bear its pro-rata share of the fees and expenses incurred by the underlying Fidelity Central Funds. These fees and expenses are not included in the Fund's annualized expense ratio used to calculate the expense estimate in the table below.
Annual Report
Please note that the expenses shown in the table are meant to highlight your ongoing costs only and do not reflect any transaction costs. Therefore, the second line of the table is useful in comparing ongoing costs only, and will not help you determine the relative total costs of owning different funds. In addition, if these transactional costs were included, your costs would have been higher.
| Annualized
Expense
Ratio | Beginning
Account Value
February 1, 2011 | Ending
Account Value
July 31, 2011 | Expenses Paid
During Period*
February 1, 2011
to July 31, 2011 |
Class A | 1.44% | | | |
Actual | | $ 1,000.00 | $ 992.30 | $ 7.11 |
HypotheticalA | | $ 1,000.00 | $ 1,017.65 | $ 7.20 |
Class T | 1.69% | | | |
Actual | | $ 1,000.00 | $ 991.00 | $ 8.34 |
HypotheticalA | | $ 1,000.00 | $ 1,016.41 | $ 8.45 |
Class B | 2.20% | | | |
Actual | | $ 1,000.00 | $ 988.10 | $ 10.84 |
HypotheticalA | | $ 1,000.00 | $ 1,013.88 | $ 10.99 |
Class C | 2.18% | | | |
Actual | | $ 1,000.00 | $ 988.80 | $ 10.75 |
HypotheticalA | | $ 1,000.00 | $ 1,013.98 | $ 10.89 |
Small Cap Value | 1.11% | | | |
Actual | | $ 1,000.00 | $ 993.60 | $ 5.49 |
HypotheticalA | | $ 1,000.00 | $ 1,019.29 | $ 5.56 |
Class F | .88% | | | |
Actual | | $ 1,000.00 | $ 994.30 | $ 4.35 |
HypotheticalA | | $ 1,000.00 | $ 1,020.43 | $ 4.41 |
Institutional Class | 1.10% | | | |
Actual | | $ 1,000.00 | $ 993.60 | $ 5.44 |
HypotheticalA | | $ 1,000.00 | $ 1,019.34 | $ 5.51 |
A 5% return per year before expenses
* Expenses are equal to each Class' annualized expense ratio, multiplied by the average account value over the period, multiplied by 181/365 (to reflect the one-half year period).
Annual Report
Investment Changes (Unaudited)
Top Ten Stocks as of July 31, 2011 |
| % of fund's
net assets | % of fund's net assets
6 months ago |
Berry Petroleum Co. Class A | 3.4 | 3.4 |
DCT Industrial Trust, Inc. | 3.0 | 2.7 |
Superior Energy Services, Inc. | 2.8 | 3.3 |
WESCO International, Inc. | 2.7 | 3.3 |
MEDNAX, Inc. | 2.7 | 1.8 |
Highwoods Properties, Inc. (SBI) | 2.6 | 2.4 |
UGI Corp. | 2.6 | 2.6 |
United Stationers, Inc. | 2.5 | 2.3 |
TCF Financial Corp. | 2.4 | 2.8 |
Regis Corp. | 2.4 | 1.5 |
| 27.1 | |
Top Five Market Sectors as of July 31, 2011 |
| % of fund's
net assets | % of fund's net assets
6 months ago |
Financials | 35.2 | 37.0 |
Industrials | 12.5 | 13.0 |
Consumer Discretionary | 11.9 | 10.7 |
Information Technology | 11.6 | 9.2 |
Health Care | 8.3 | 7.1 |
Asset Allocation (% of fund's net assets) |
As of July 31, 2011* | As of January 31, 2011** |
| Stocks 99.7% | | | Stocks 99.1% | |
| Short-Term
Investments and
Net Other Assets 0.3% | | | Short-Term
Investments and
Net Other Assets 0.9% | |
* Foreign investments | 8.3% | | ** Foreign investments | 9.9% | |

Annual Report
Investments July 31, 2011
Showing Percentage of Net Assets
Common Stocks - 98.4% |
| Shares | | Value |
CONSUMER DISCRETIONARY - 11.4% |
Diversified Consumer Services - 3.4% |
Matthews International Corp. Class A | 740,187 | | $ 26,787,368 |
Regis Corp. (d)(e) | 4,045,824 | | 60,080,486 |
| | 86,867,854 |
Household Durables - 4.7% |
M.D.C. Holdings, Inc. (d)(e) | 2,424,300 | | 54,813,423 |
Meritage Homes Corp. (a) | 1,536,160 | | 33,565,096 |
Ryland Group, Inc. (d) | 2,153,837 | | 31,726,019 |
| | 120,104,538 |
Specialty Retail - 3.3% |
Asbury Automotive Group, Inc. (a) | 1,465,159 | | 31,544,873 |
Ascena Retail Group, Inc. (a) | 960,700 | | 31,049,824 |
Tsutsumi Jewelry Co. Ltd. | 791,400 | | 20,081,910 |
| | 82,676,607 |
TOTAL CONSUMER DISCRETIONARY | | 289,648,999 |
CONSUMER STAPLES - 2.9% |
Food & Staples Retailing - 0.4% |
Ingles Markets, Inc. Class A (e) | 664,024 | | 10,225,970 |
Food Products - 2.5% |
Chiquita Brands International, Inc. (a) | 2,070,900 | | 24,519,456 |
Dean Foods Co. (a) | 3,500,000 | | 38,570,000 |
| | 63,089,456 |
TOTAL CONSUMER STAPLES | | 73,315,426 |
ENERGY - 6.2% |
Energy Equipment & Services - 2.8% |
Superior Energy Services, Inc. (a) | 1,741,700 | | 72,263,133 |
Oil, Gas & Consumable Fuels - 3.4% |
Berry Petroleum Co. Class A | 1,500,000 | | 86,025,000 |
TOTAL ENERGY | | 158,288,133 |
FINANCIALS - 34.4% |
Capital Markets - 2.6% |
Knight Capital Group, Inc. Class A (a) | 2,029,826 | | 22,957,332 |
Waddell & Reed Financial, Inc. Class A | 1,210,000 | | 44,407,000 |
| | 67,364,332 |
Common Stocks - continued |
| Shares | | Value |
FINANCIALS - continued |
Commercial Banks - 10.8% |
Associated Banc-Corp. | 3,832,650 | | $ 52,315,673 |
CapitalSource, Inc. | 6,515,270 | | 42,088,644 |
City National Corp. | 784,900 | | 42,133,432 |
National Penn Bancshares, Inc. | 3,766,604 | | 30,283,496 |
PacWest Bancorp (e) | 1,857,600 | | 36,873,360 |
TCF Financial Corp. (d) | 4,855,800 | | 61,765,776 |
Western Liberty Bancorp (a)(e) | 2,400,000 | | 7,248,000 |
| | 272,708,381 |
Insurance - 7.2% |
Alterra Capital Holdings Ltd. | 2,357,411 | | 51,367,986 |
Aspen Insurance Holdings Ltd. | 1,320,200 | | 34,193,180 |
Platinum Underwriters Holdings Ltd. | 1,576,975 | | 54,169,091 |
ProAssurance Corp. (a) | 600,000 | | 41,790,000 |
| | 181,520,257 |
Real Estate Investment Trusts - 9.3% |
Alexandria Real Estate Equities, Inc. | 219,100 | | 17,966,200 |
American Assets Trust, Inc. | 225,200 | | 4,952,148 |
DCT Industrial Trust, Inc. (d)(e) | 13,830,586 | | 74,961,776 |
Franklin Street Properties Corp. (d) | 3,160,000 | | 39,847,600 |
Highwoods Properties, Inc. (SBI) (d) | 1,940,330 | | 66,805,562 |
National Retail Properties, Inc. (d) | 1,240,000 | | 31,111,600 |
| | 235,644,886 |
Thrifts & Mortgage Finance - 4.5% |
Astoria Financial Corp. | 4,818,152 | | 56,131,471 |
Washington Federal, Inc. | 3,486,175 | | 58,951,219 |
| | 115,082,690 |
TOTAL FINANCIALS | | 872,320,546 |
HEALTH CARE - 8.3% |
Health Care Providers & Services - 8.3% |
Centene Corp. (a) | 1,324,832 | | 43,467,738 |
Chemed Corp. | 510,200 | | 31,025,262 |
MEDNAX, Inc. (a) | 981,500 | | 66,899,040 |
Providence Service Corp. (a)(e) | 1,016,495 | | 12,045,466 |
Team Health Holdings, Inc. (a) | 2,565,700 | | 56,471,057 |
| | 209,908,563 |
Common Stocks - continued |
| Shares | | Value |
INDUSTRIALS - 12.5% |
Commercial Services & Supplies - 6.3% |
ACCO Brands Corp. (a) | 2,420,000 | | $ 20,739,400 |
HNI Corp. (d)(e) | 2,349,671 | | 49,131,621 |
Knoll, Inc. | 1,412,898 | | 25,785,389 |
United Stationers, Inc. | 1,980,800 | | 63,563,872 |
| | 159,220,282 |
Machinery - 2.3% |
Blount International, Inc. (a)(e) | 2,604,723 | | 43,316,543 |
Columbus McKinnon Corp. (NY Shares) (a) | 960,000 | | 15,792,000 |
| | 59,108,543 |
Trading Companies & Distributors - 3.9% |
H&E Equipment Services, Inc. (a)(e) | 2,439,408 | | 29,272,896 |
WESCO International, Inc. (a) | 1,350,000 | | 68,431,500 |
| | 97,704,396 |
TOTAL INDUSTRIALS | | 316,033,221 |
INFORMATION TECHNOLOGY - 11.6% |
Communications Equipment - 1.4% |
ViaSat, Inc. (a) | 809,472 | | 36,369,577 |
Electronic Equipment & Components - 6.4% |
Ingram Micro, Inc. Class A (a) | 2,753,100 | | 51,070,005 |
Macnica, Inc. | 677,400 | | 16,168,178 |
Ryoyo Electro Corp. (e) | 1,972,700 | | 19,684,709 |
SYNNEX Corp. (a) | 675,710 | | 19,136,107 |
Tech Data Corp. (a) | 1,189,600 | | 55,518,632 |
| | 161,577,631 |
Internet Software & Services - 1.8% |
DealerTrack Holdings, Inc. (a) | 1,083,804 | | 25,133,415 |
j2 Global Communications, Inc. | 730,149 | | 19,524,184 |
| | 44,657,599 |
Semiconductors & Semiconductor Equipment - 0.6% |
Miraial Co. Ltd. (e) | 720,200 | | 15,046,860 |
Software - 1.4% |
Monotype Imaging Holdings, Inc. (a)(e) | 2,583,700 | | 35,396,690 |
TOTAL INFORMATION TECHNOLOGY | | 293,048,357 |
Common Stocks - continued |
| Shares | | Value |
MATERIALS - 4.7% |
Metals & Mining - 4.7% |
Carpenter Technology Corp. | 834,380 | | $ 47,926,787 |
Haynes International, Inc. (e) | 675,317 | | 42,301,857 |
RTI International Metals, Inc. (a) | 870,997 | | 27,932,874 |
| | 118,161,518 |
UTILITIES - 6.4% |
Electric Utilities - 2.2% |
Westar Energy, Inc. (d) | 2,160,000 | | 55,749,600 |
Gas Utilities - 4.2% |
Southwest Gas Corp. | 1,130,989 | | 42,174,580 |
UGI Corp. | 2,150,000 | | 65,145,000 |
| | 107,319,580 |
TOTAL UTILITIES | | 163,069,180 |
TOTAL COMMON STOCKS (Cost $2,112,389,704) | 2,493,793,943 |
Nonconvertible Preferred Stocks - 1.3% |
| | | |
CONSUMER DISCRETIONARY - 0.5% |
Household Durables - 0.5% |
M/I Homes, Inc. Series A, 9.75% (a) | 750,400 | | 12,006,400 |
FINANCIALS - 0.8% |
Real Estate Investment Trusts - 0.8% |
Developers Diversified Realty Corp. (depositary shares) Series H, 7.375% | 818,790 | | 19,953,912 |
TOTAL NONCONVERTIBLE PREFERRED STOCKS (Cost $20,354,770) | 31,960,312 |
Money Market Funds - 4.6% |
| Shares | | Value |
Fidelity Cash Central Fund, 0.14% (b) | 13,763,496 | | $ 13,763,496 |
Fidelity Securities Lending Cash Central Fund, 0.15% (b)(c) | 102,468,175 | | 102,468,175 |
TOTAL MONEY MARKET FUNDS (Cost $116,231,671) | 116,231,671 |
TOTAL INVESTMENT PORTFOLIO - 104.3% (Cost $2,248,976,145) | | 2,641,985,926 |
NET OTHER ASSETS (LIABILITIES) - (4.3)% | | (108,404,928) |
NET ASSETS - 100% | $ 2,533,580,998 |
Legend |
(a) Non-income producing |
(b) Affiliated fund that is available only to investment companies and other accounts managed by Fidelity Investments. The rate quoted is the annualized seven-day yield of the fund at period end. A complete unaudited listing of the fund's holdings as of its most recent quarter end is available upon request. In addition, each Fidelity Central Fund's financial statements, which are not covered by the Fund's Report of Independent Registered Public Accounting Firm, are available on the SEC's website or upon request. |
(c) Investment made with cash collateral received from securities on loan. |
(d) Security or a portion of the security is on loan at period end. |
(e) Affiliated company |
Affiliated Central Funds |
Information regarding fiscal year to date income earned by the Fund from investments in Fidelity Central Funds is as follows: |
Fund | Income earned |
Fidelity Cash Central Fund | $ 20,932 |
Fidelity Securities Lending Cash Central Fund | 121,080 |
Total | $ 142,012 |
Other Affiliated Issuers |
An affiliated company is a company in which the Fund has ownership of at least 5% of the voting securities. Fiscal year to date transactions with companies which are or were affiliates are as follows: |
Affiliate | Value,
beginning of
period | Purchases | Sales
Proceeds | Dividend
Income | Value,
end of
period |
ACCO Brands Corp. | $ 22,027,864 | $ 1,922,616 | $ 12,330,836 | $ - | $ - |
Blount International, Inc. | 27,740,300 | - | - | - | 43,316,543 |
Columbus McKinnon Corp. (NY Shares) | - | 19,267,200 | - | - | - |
DCT Industrial Trust, Inc. | 46,900,000 | 19,790,290 | - | 1,656,573 | 74,961,776 |
H&E Equipment Services, Inc. | 30,357,850 | - | 20,687,104 | - | 29,272,896 |
Haynes International, Inc. | - | 33,108,436 | - | 183,909 | 42,301,857 |
HNI Corp. | 55,547,499 | 5,138,794 | - | 2,048,207 | 49,131,621 |
Ingles Markets, Inc. Class A | 13,634,514 | - | 3,506,026 | 475,816 | 10,225,970 |
M.D.C. Holdings, Inc. | 35,651,616 | 32,061,128 | - | 1,524,300 | 54,813,423 |
Miraial Co. Ltd. | 15,372,473 | 3,618,630 | - | 502,071 | 15,046,860 |
Monotype Imaging Holdings, Inc. | 11,299,816 | 12,600,234 | - | - | 35,396,690 |
PacWest Bancorp | 37,552,606 | 1,164,578 | - | 73,220 | 36,873,360 |
Providence Service Corp. | 14,637,528 | - | - | - | 12,045,466 |
Regis Corp. | 41,819,783 | 36,022,139 | 15,089,522 | 575,173 | 60,080,486 |
RTI International Metals, Inc. | 48,035,903 | - | 23,272,802 | - | - |
Ryoyo Electro Corp. | 18,932,046 | 2,120,893 | - | 687,612 | 19,684,709 |
TradeStation Group, Inc. | 13,178,039 | - | 19,917,635 | - | - |
Western Liberty Bancorp | 14,976,000 | - | - | - | 7,248,000 |
Total | $ 447,663,837 | $ 166,814,938 | $ 94,803,925 | $ 7,726,881 | $ 490,399,657 |
Other Information |
All investments are categorized as Level 1 under the Fair Value Hierarchy. The inputs or methodology used for valuing securities may not be an indication of the risk associated with investing in those securities. For more information on valuation inputs, please refer to the Security Valuation section in the accompanying Notes to Financial Statements. |
See accompanying notes which are an integral part of the financial statements.
Annual Report
Statement of Assets and Liabilities
| July 31, 2011 |
| | |
Assets | | |
Investment in securities, at value (including securities loaned of $99,483,856) - See accompanying schedule: Unaffiliated issuers (cost $1,664,327,198) | $ 2,035,354,598 | |
Fidelity Central Funds (cost $116,231,671) | 116,231,671 | |
Other affiliated issuers (cost $468,417,276) | 490,399,657 | |
Total Investments (cost $2,248,976,145) | | $ 2,641,985,926 |
Receivable for investments sold | | 174,323 |
Receivable for fund shares sold | | 3,317,218 |
Dividends receivable | | 2,265,074 |
Distributions receivable from Fidelity Central Funds | | 10,990 |
Other receivables | | 49,926 |
Total assets | | 2,647,803,457 |
| | |
Liabilities | | |
Payable for investments purchased | $ 1,298,673 | |
Payable for fund shares redeemed | 7,914,722 | |
Accrued management fee | 1,855,015 | |
Distribution and service plan fees payable | 103,978 | |
Other affiliated payables | 528,715 | |
Other payables and accrued expenses | 53,181 | |
Collateral on securities loaned, at value | 102,468,175 | |
Total liabilities | | 114,222,459 |
| | |
Net Assets | | $ 2,533,580,998 |
Net Assets consist of: | | |
Paid in capital | | $ 2,012,724,102 |
Accumulated undistributed net realized gain (loss) on investments and foreign currency transactions | | 127,839,572 |
Net unrealized appreciation (depreciation) on investments and assets and liabilities in foreign currencies | | 393,017,324 |
Net Assets | | $ 2,533,580,998 |
See accompanying notes which are an integral part of the financial statements.
Annual Report
Financial Statements - continued
Statement of Assets and Liabilities - continued
| July 31, 2011 |
| | |
Calculation of Maximum Offering Price
Class A:
Net Asset Value and redemption price per share
($140,706,656 ÷ 9,092,403 shares) | | $ 15.48 |
| | |
Maximum offering price per share (100/94.25 of $15.48) | | $ 16.42 |
Class T:
Net Asset Value and redemption price per share ($55,845,206 ÷ 3,640,410 shares) | | $ 15.34 |
| | |
Maximum offering price per share (100/96.50 of $15.34) | | $ 15.90 |
Class B:
Net Asset Value and offering price per share ($8,548,930 ÷ 569,799 shares)A | | $ 15.00 |
| | |
Class C:
Net Asset Value and offering price per share ($47,457,202 ÷ 3,162,480 shares)A | | $ 15.01 |
| | |
| | |
Small Cap Value:
Net Asset Value, offering price and redemption price per share ($1,899,804,971 ÷ 121,599,609 shares) | | $ 15.62 |
| | |
Class F:
Net Asset Value, offering price and redemption price per share ($279,652,893 ÷ 17,875,122 shares) | | $ 15.64 |
| | |
Institutional Class:
Net Asset Value, offering price and redemption price per share ($101,565,140 ÷ 6,496,759 shares) | | $ 15.63 |
A Redemption price per share is equal to net asset value less any applicable contingent deferred sales charge.
See accompanying notes which are an integral part of the financial statements.
Annual Report
Statement of Operations
| Year ended July 31, 2011 |
| | |
Investment Income | | |
Dividends (including $7,726,881 earned from other affiliated issuers) | | $ 27,691,950 |
Special dividends | | 9,360,000 |
Interest | | 82 |
Income from Fidelity Central Funds | | 142,012 |
Total income | | 37,194,044 |
| | |
Expenses | | |
Management fee
Basic fee | $ 17,642,979 | |
Performance adjustment | 3,308,761 | |
Transfer agent fees | 5,701,385 | |
Distribution and service plan fees | 1,163,925 | |
Accounting and security lending fees | 761,810 | |
Custodian fees and expenses | 41,873 | |
Independent trustees' compensation | 13,098 | |
Registration fees | 144,204 | |
Audit | 59,297 | |
Legal | 9,329 | |
Interest | 1,171 | |
Miscellaneous | 25,364 | |
Total expenses before reductions | 28,873,196 | |
Expense reductions | (44,627) | 28,828,569 |
Net investment income (loss) | | 8,365,475 |
Realized and Unrealized Gain (Loss) Net realized gain (loss) on: | | |
Investment securities: | | |
Unaffiliated issuers | 159,718,329 | |
Other affiliated issuers | (4,266,450) | |
Foreign currency transactions | 29,684 | |
Total net realized gain (loss) | | 155,481,563 |
Change in net unrealized appreciation (depreciation) on: Investment securities | 203,702,039 | |
Assets and liabilities in foreign currencies | (584) | |
Total change in net unrealized appreciation (depreciation) | | 203,701,455 |
Net gain (loss) | | 359,183,018 |
Net increase (decrease) in net assets resulting from operations | | $ 367,548,493 |
See accompanying notes which are an integral part of the financial statements.
Annual Report
Financial Statements - continued
Statement of Changes in Net Assets
| Year ended
July 31,
2011 | Year ended
July 31,
2010 |
Increase (Decrease) in Net Assets | | |
Operations | | |
Net investment income (loss) | $ 8,365,475 | $ 6,962,574 |
Net realized gain (loss) | 155,481,563 | 188,495,963 |
Change in net unrealized appreciation (depreciation) | 203,701,455 | 137,333,657 |
Net increase (decrease) in net assets resulting
from operations | 367,548,493 | 332,792,194 |
Distributions to shareholders from net investment income | (16,151,065) | (6,560,137) |
Distributions to shareholders from net realized gain | (20,051,059) | - |
Total distributions | (36,202,124) | (6,560,137) |
Share transactions - net increase (decrease) | 54,629,275 | 209,101,603 |
Redemption fees | 445,888 | 534,282 |
Total increase (decrease) in net assets | 386,421,532 | 535,867,942 |
| | |
Net Assets | | |
Beginning of period | 2,147,159,466 | 1,611,291,524 |
End of period (including undistributed net investment of $0 and undistributed net investment income of $5,209,766, respectively) | $ 2,533,580,998 | $ 2,147,159,466 |
See accompanying notes which are an integral part of the financial statements.
Annual Report
Financial Highlights - Class A
Years ended July 31, | 2011 | 2010 | 2009 | 2008 | 2007 |
Selected Per-Share Data | | | | | |
Net asset value, beginning of period | $ 13.45 | $ 11.13 | $ 11.82 | $ 14.34 | $ 13.17 |
Income from Investment Operations | | | | | |
Net investment income (loss) C | .01 F | .02 G | .08 | (.01) | (.06) |
Net realized and unrealized gain (loss) | 2.22 | 2.33 | (.60) | (1.98) | 1.90 |
Total from investment operations | 2.23 | 2.35 | (.52) | (1.99) | 1.84 |
Distributions from net investment income | (.08) | (.03) | (.06) | - | - |
Distributions from net realized gain | (.12) | - | (.11) | (.53) | (.67) |
Total distributions | (.20) | (.03) | (.17) | (.53) | (.67) |
Redemption fees added to paid in capital C,I | - | - | - | - | - |
Net asset value, end of period | $ 15.48 | $ 13.45 | $ 11.13 | $ 11.82 | $ 14.34 |
Total Return A,B | 16.72% | 21.16% | (4.37)% | (14.35)% | 14.59% |
Ratios to Average Net Assets D,H | | | | | |
Expenses before reductions | 1.44% | 1.47% | 1.45% | 1.43% | 1.45% |
Expenses net of fee waivers, if any | 1.43% | 1.40% | 1.40% | 1.40% | 1.40% |
Expenses net of all reductions | 1.43% | 1.39% | 1.40% | 1.40% | 1.40% |
Net investment income (loss) | .06% F | .17% G | .81% | (.05)% | (.44)% |
Supplemental Data | | | | | |
Net assets, end of period (000 omitted) | $ 140,707 | $ 96,994 | $ 55,029 | $ 52,446 | $ 61,357 |
Portfolio turnover rate E | 22% | 49% | 51% | 149% | 67% |
A Total returns would have been lower if certain expenses had not been reduced during the applicable periods shown.
B Total returns do not include the effect of the sales charges.
C Calculated based on average shares outstanding during the period.
D Fees and expenses of any underlying Fidelity Central Funds are not included in the Fund's expense ratio. The Fund indirectly bears its proportionate share of the expenses of any underlying Fidelity Central Funds.
E Amount does not include the portfolio activity of any underlying Fidelity Central Funds.
F Investment income per share reflects a special dividend which amounted to $.06 per share. Excluding the special dividend, the ratio of net investment income (loss) to average net assets would have been (.31)%.
G Investment income per share reflects a special dividend which amounted to $.03 per share. Excluding the special dividend, the ratio of net investment income (loss) to average net assets would have been (.10)%.
H Expense ratios reflect operating expenses of the class. Expenses before reductions do not reflect amounts reimbursed by the investment adviser or reductions from brokerage service arrangements or reductions from other expense offset arrangements and do not represent the amount paid by the class during periods when reimbursements or reductions occur. Expenses net of fee waivers reflect expenses after reimbursement by the investment adviser but prior to reductions from brokerage service arrangements or other expense offset arrangements. Expenses net of all reductions represent the net expenses paid by the class.
I Amount represents less than $.01 per share.
See accompanying notes which are an integral part of the financial statements.
Annual Report
Financial Highlights - Class T
Years ended July 31, | 2011 | 2010 | 2009 | 2008 | 2007 |
Selected Per-Share Data | | | | | |
Net asset value, beginning of period | $ 13.34 | $ 11.05 | $ 11.74 | $ 14.28 | $ 13.13 |
Income from Investment Operations | | | | | |
Net investment income (loss) C | (.03) F | (.01) G | .05 | (.04) | (.10) |
Net realized and unrealized gain (loss) | 2.20 | 2.31 | (.59) | (1.97) | 1.90 |
Total from investment operations | 2.17 | 2.30 | (.54) | (2.01) | 1.80 |
Distributions from net investment income | (.05) | (.01) | (.04) | - | - |
Distributions from net realized gain | (.12) | - | (.11) | (.53) | (.65) |
Total distributions | (.17) | (.01) | (.15) | (.53) | (.65) |
Redemption fees added to paid in capital C,I | - | - | - | - | - |
Net asset value, end of period | $ 15.34 | $ 13.34 | $ 11.05 | $ 11.74 | $ 14.28 |
Total ReturnA,B | 16.36% | 20.87% | (4.57)% | (14.58)% | 14.34% |
Ratios to Average Net Assets D,H | | | | | |
Expenses before reductions | 1.70% | 1.72% | 1.70% | 1.68% | 1.66% |
Expenses net of fee waivers, if any | 1.69% | 1.65% | 1.65% | 1.65% | 1.65% |
Expenses net of all reductions | 1.69% | 1.64% | 1.65% | 1.65% | 1.65% |
Net investment income (loss) | (.19)% F | (.08)% G | .56% | (.30)% | (.69)% |
Supplemental Data | | | | | |
Net assets, end of period (000 omitted) | $ 55,845 | $ 44,091 | $ 28,534 | $ 32,091 | $ 51,518 |
Portfolio turnover rate E | 22% | 49% | 51% | 149% | 67% |
A Total returns would have been lower if certain expenses had not been reduced during the applicable periods shown.
B Total returns do not include the effect of the sales charges.
C Calculated based on average shares outstanding during the period.
D Fees and expenses of any underlying Fidelity Central Funds are not included in the Fund's expense ratio. The Fund indirectly bears its proportionate share of the expenses of any underlying Fidelity Central Funds.
E Amount does not include the portfolio activity of any underlying Fidelity Central Funds.
F Investment income per share reflects a special dividend which amounted to $.06 per share. Excluding the special dividend, the ratio of net investment income (loss) to average net assets would have been (.57)%.
G Investment income per share reflects a special dividend which amounted to $.03 per share. Excluding the special dividend, the ratio of net investment income (loss) to average net assets would have been (.35)%.
H Expense ratios reflect operating expenses of the class. Expenses before reductions do not reflect amounts reimbursed by the investment adviser or reductions from brokerage service arrangements or reductions from other expense offset arrangements and do not represent the amount paid by the class during periods when reimbursements or reductions occur. Expenses net of fee waivers reflect expenses after reimbursement by the investment adviser but prior to reductions from brokerage service arrangements or other expense offset arrangements. Expenses net of all reductions represent the net expenses paid by the class.
I Amount represents less than $.01 per share.
See accompanying notes which are an integral part of the financial statements.
Annual Report
Financial Highlights - Class B
Years ended July 31, | 2011 | 2010 | 2009 | 2008 | 2007 |
Selected Per-Share Data | | | | | |
Net asset value, beginning of period | $ 13.08 | $ 10.88 | $ 11.60 | $ 14.19 | $ 13.07 |
Income from Investment Operations | | | | | |
Net investment income (loss) C | (.10) F | (.07) G | .01 | (.10) | (.17) |
Net realized and unrealized gain (loss) | 2.15 | 2.27 | (.59) | (1.96) | 1.90 |
Total from investment operations | 2.05 | 2.20 | (.58) | (2.06) | 1.73 |
Distributions from net investment income | (.01) | - | (.03) | - | - |
Distributions from net realized gain | (.12) | - | (.11) | (.53) | (.61) |
Total distributions | (.13) | - | (.14) | (.53) | (.61) |
Redemption fees added to paid in capital C,I | - | - | - | - | - |
Net asset value, end of period | $ 15.00 | $ 13.08 | $ 10.88 | $ 11.60 | $ 14.19 |
Total Return A,B | 15.80% | 20.22% | (5.05)% | (15.04)% | 13.78% |
Ratios to Average Net Assets D,H | | | | | |
Expenses before reductions | 2.20% | 2.22% | 2.20% | 2.18% | 2.20% |
Expenses net of fee waivers, if any | 2.19% | 2.15% | 2.15% | 2.15% | 2.15% |
Expenses net of all reductions | 2.19% | 2.14% | 2.15% | 2.15% | 2.15% |
Net investment income (loss) | (.69)% F | (.58)% G | .06% | (.80)% | (1.19)% |
Supplemental Data | | | | | |
Net assets, end of period (000 omitted) | $ 8,549 | $ 9,747 | $ 7,153 | $ 7,886 | $ 12,075 |
Portfolio turnover rate E | 22% | 49% | 51% | 149% | 67% |
A Total returns would have been lower if certain expenses had not been reduced during the applicable periods shown.
B Total returns do not include the effect of the contingent deferred sales charge.
C Calculated based on average shares outstanding during the period.
D Fees and expenses of any underlying Fidelity Central Funds are not included in the Fund's expense ratio. The Fund indirectly bears its proportionate share of the expenses of any underlying Fidelity Central Funds.
E Amount does not include the portfolio activity of any underlying Fidelity Central Funds.
F Investment income per share reflects a special dividend which amounted to $.06 per share. Excluding the special dividend, the ratio of net investment income (loss) to average net assets would have been (1.07)%.
G Investment income per share reflects a special dividend which amounted to $.03 per share. Excluding the special dividend, the ratio of net investment income (loss) to average net assets would have been (.85)%.
H Expense ratios reflect operating expenses of the class. Expenses before reductions do not reflect amounts reimbursed by the investment adviser or reductions from brokerage service arrangements or reductions from other expense offset arrangements and do not represent the amount paid by the class during periods when reimbursements or reductions occur. Expenses net of fee waivers reflect expenses after reimbursement by the investment adviser but prior to reductions from brokerage service arrangements or other expense offset arrangements. Expenses net of all reductions represent the net expenses paid by the class.
I Amount represents less than $.01 per share.
See accompanying notes which are an integral part of the financial statements.
Annual Report
Financial Highlights - Class C
Years ended July 31, | 2011 | 2010 | 2009 | 2008 | 2007 |
Selected Per-Share Data | | | | | |
Net asset value, beginning of period | $ 13.08 | $ 10.89 | $ 11.60 | $ 14.19 | $ 13.07 |
Income from Investment Operations | | | | | |
Net investment income (loss) C | (.10) F | (.07) G | .01 | (.10) | (.17) |
Net realized and unrealized gain (loss) | 2.17 | 2.26 | (.58) | (1.96) | 1.90 |
Total from investment operations | 2.07 | 2.19 | (.57) | (2.06) | 1.73 |
Distributions from net investment income | (.02) | - | (.03) | - | - |
Distributions from net realized gain | (.12) | - | (.11) | (.53) | (.61) |
Total distributions | (.14) | - | (.14) | (.53) | (.61) |
Redemption fees added to paid in capital C,I | - | - | - | - | - |
Net asset value, end of period | $ 15.01 | $ 13.08 | $ 10.89 | $ 11.60 | $ 14.19 |
Total ReturnA,B | 15.91% | 20.11% | (4.98)% | (15.04)% | 13.77% |
Ratios to Average Net Assets D,H | | | | | |
Expenses before reductions | 2.18% | 2.22% | 2.20% | 2.18% | 2.20% |
Expenses net of fee waivers, if any | 2.18% | 2.15% | 2.15% | 2.15% | 2.15% |
Expenses net of all reductions | 2.18% | 2.14% | 2.15% | 2.15% | 2.15% |
Net investment income (loss) | (.68)% F | (.58)% G | .06% | (.80)% | (1.19)% |
Supplemental Data | | | | | |
Net assets, end of period (000 omitted) | $ 47,457 | $ 37,346 | $ 21,345 | $ 20,924 | $ 34,155 |
Portfolio turnover rate E | 22% | 49% | 51% | 149% | 67% |
A Total returns would have been lower if certain expenses had not been reduced during the applicable periods shown.
B Total returns do not include the effect of the contingent deferred sales charge.
C Calculated based on average shares outstanding during the period.
D Fees and expenses of any underlying Fidelity Central Funds are not included in the Fund's expense ratio. The Fund indirectly bears its proportionate share of the expenses of any underlying Fidelity Central Funds.
E Amount does not include the portfolio activity of any underlying Fidelity Central Funds.
F Investment income per share reflects a special dividend which amounted to $.06 per share. Excluding the special dividend, the ratio of net investment income (loss) to average net assets would have been (1.06)%.
G Investment income per share reflects a special dividend which amounted to $.03 per share. Excluding the special dividend, the ratio of net investment income (loss) to average net assets would have been (.85)%.
H Expense ratios reflect operating expenses of the class. Expenses before reductions do not reflect amounts reimbursed by the investment adviser or reductions from brokerage service arrangements or reductions from other expense offset arrangements and do not represent the amount paid by the class during periods when reimbursements or reductions occur. Expenses net of fee waivers reflect expenses after reimbursement by the investment adviser but prior to reductions from brokerage service arrangements or other expense offset arrangements. Expenses net of all reductions represent the net expenses paid by the class.
I Amount represents less than $.01 per share.
See accompanying notes which are an integral part of the financial statements.
Annual Report
Financial Highlights - Small Cap Value
Years ended July 31, | 2011 | 2010 | 2009 | 2008 | 2007 |
Selected Per-Share Data | | | | | |
Net asset value, beginning of period | $ 13.56 | $ 11.22 | $ 11.91 | $ 14.43 | $ 13.22 |
Income from Investment Operations | | | | | |
Net investment income (loss) B | .06 E | .05 F | .10 | .03 | (.02) |
Net realized and unrealized gain (loss) | 2.23 | 2.34 | (.60) | (1.99) | 1.91 |
Total from investment operations | 2.29 | 2.39 | (.50) | (1.96) | 1.89 |
Distributions from net investment income | (.10) | (.05) | (.08) | - | - |
Distributions from net realized gain | (.13) | - | (.11) | (.56) | (.68) |
Total distributions | (.23) | (.05) | (.19) | (.56) | (.68) |
Redemption fees added to paid in capital B,H | - | - | - | - | - |
Net asset value, end of period | $ 15.62 | $ 13.56 | $ 11.22 | $ 11.91 | $ 14.43 |
Total Return A | 17.03% | 21.32% | (4.15)% | (14.10)% | 14.96% |
Ratios to Average Net Assets C,G | | | | |
Expenses before reductions | 1.13% | 1.18% | 1.20% | 1.14% | 1.11% |
Expenses net of fee waivers, if any | 1.13% | 1.18% | 1.20% | 1.14% | 1.11% |
Expenses net of all reductions | 1.13% | 1.17% | 1.20% | 1.13% | 1.11% |
Net investment income (loss) | .37% E | .39% F | 1.01% | .22% | (.15)% |
Supplemental Data | | | | | |
Net assets, end of period (000 omitted) | $ 1,899,805 | $ 1,770,675 | $ 1,488,736 | $ 1,136,860 | $ 1,233,808 |
Portfolio turnover rate D | 22% | 49% | 51% | 149% | 67% |
A Total returns would have been lower if certain expenses had not been reduced during the applicable periods shown.
B Calculated based on average shares outstanding during the period.
C Fees and expenses of any underlying Fidelity Central Funds are not included in the Fund's expense ratio. The Fund indirectly bears its proportionate share of the expenses of any underlying Fidelity Central Funds.
D Amount does not include the portfolio activity of any underlying Fidelity Central Funds.
E Investment income per share reflects a special dividend which amounted to $.06 per share. Excluding the special dividend, the ratio of net investment income (loss) to average net assets would have been (.01) %.
F Investment income per share reflects a special dividend which amounted to $.03 per share. Excluding the special dividend, the ratio of net investment income (loss) to average net assets would have been .12%.
G Expense ratios reflect operating expenses of the class. Expenses before reductions do not reflect amounts reimbursed by the investment adviser or reductions from brokerage service arrangements or reductions from other expense offset arrangements and do not represent the amount paid by the class during periods when reimbursements or reductions occur. Expenses net of fee waivers reflect expenses after reimbursement by the investment adviser but prior to reductions from brokerage service arrangements or other expense offset arrangements. Expenses net of all reductions represent the net expenses paid by the class.
H Amount represents less than $.01 per share.
See accompanying notes which are an integral part of the financial statements.
Annual Report
Financial Highlights - Class F
Years ended July 31, | 2011 | 2010 | 2009 I |
Selected Per-Share Data | | | |
Net asset value, beginning of period | $ 13.58 | $ 11.22 | $ 10.27 |
Income from Investment Operations | | | |
Net investment income (loss) D | .09 G | .09 H | .01 |
Net realized and unrealized gain (loss) | 2.23 | 2.34 | .94 |
Total from investment operations | 2.32 | 2.43 | .95 |
Distributions from net investment income | (.14) | (.07) | - |
Distributions from net realized gain | (.13) | - | - |
Total distributions | (.26) L | (.07) | - |
Redemption fees added to paid in capital D,K | - | - | - |
Net asset value, end of period | $ 15.64 | $ 13.58 | $ 11.22 |
Total Return B,C | 17.31% | 21.69% | 9.25% |
Ratios to Average Net Assets E,J | | | |
Expenses before reductions | .88% | .90% | .86% A |
Expenses net of fee waivers, if any | .88% | .90% | .86%A |
Expenses net of all reductions | .88% | .89% | .86%A |
Net investment income (loss) | .61% G | .67% H | .64%A |
Supplemental Data | | | |
Net assets, end of period (000 omitted) | $ 279,653 | $ 109,868 | $ 159 |
Portfolio turnover rate F | 22% | 49% | 51% |
A Annualized
B Total returns for periods of less than one year are not annualized.
C Total returns would have been lower if certain expenses had not been reduced during the applicable periods shown.
D Calculated based on average shares outstanding during the period.
E Fees and expenses of any underlying Fidelity Central Funds are not included in the Fund's expense ratio. The Fund indirectly bears its proportionate share of the expenses of any underlying Fidelity Central Funds.
F Amount does not include the portfolio activity of any underlying Fidelity Central Funds.
G Investment income per share reflects a special dividend which amounted to $.06 per share. Excluding the special dividend, the ratio of net investment income (loss) to average net assets would have been .24%.
H Investment income per share reflects a special dividend which amounted to $.03 per share. Excluding the special dividend, the ratio of net investment income (loss) to average net assets would have been .40%.
I For the period June 26, 2009 (commencement of sale of shares) to July 31, 2009.
J Expense ratios reflect operating expenses of the class. Expenses before reductions do not reflect amounts reimbursed by the investment adviser or reductions from brokerage service arrangements or reductions from other expense offset arrangements and do not represent the amount paid by the class during periods when reimbursements or reductions occur. Expense ratios before reductions for start-up periods may not be representative of longer-term operating periods. Expenses net of fee waivers reflect expenses after reimbursement by the investment adviser but prior to reductions from brokerage service arrangements or other expense offset arrangements. Expenses net of all reductions represent the net expenses paid by the class.
K Amount represents less than $.01 per share.
L Total distributions of $.26 per share is comprised of distributions from net investment income of $.138 and distributions from net realized gain of $.126 per share.
See accompanying notes which are an integral part of the financial statements.
Annual Report
Financial Highlights - Institutional Class
Years ended July 31, | 2011 | 2010 | 2009 | 2008 | 2007 |
Selected Per-Share Data | | | | | |
Net asset value, beginning of period | $ 13.58 | $ 11.24 | $ 11.91 | $ 14.43 | $ 13.22 |
Income from Investment Operations | | | | | |
Net investment income (loss) B | .06 E | .06 F | .10 | .03 | (.02) |
Net realized and unrealized gain (loss) | 2.23 | 2.34 | (.59) | (1.99) | 1.91 |
Total from investment operations | 2.29 | 2.40 | (.49) | (1.96) | 1.89 |
Distributions from net investment income | (.11) | (.06) | (.07) | - | - |
Distributions from net realized gain | (.13) | - | (.11) | (.56) | (.68) |
Total distributions | (.24) | (.06) | (.18) | (.56) | (.68) |
Redemption fees added to paid in capital B,H | - | - | - | - | - |
Net asset value, end of period | $ 15.63 | $ 13.58 | $ 11.24 | $ 11.91 | $ 14.43 |
Total Return A | 17.02% | 21.42% | (4.04)% | (14.10)% | 14.99% |
Ratios to Average Net Assets C,G | | | | | |
Expenses before reductions | 1.10% | 1.12% | 1.20% | 1.13% | 1.10% |
Expenses net of fee waivers, if any | 1.10% | 1.12% | 1.15% | 1.13% | 1.10% |
Expenses net of all reductions | 1.10% | 1.12% | 1.15% | 1.13% | 1.10% |
Net investment income (loss) | .39% E | .45% F | 1.06% | .22% | (.13)% |
Supplemental Data | | | | | |
Net assets, end of period (000 omitted) | $ 101,565 | $ 78,440 | $ 10,336 | $ 8,584 | $ 11,594 |
Portfolio turnover rate D | 22% | 49% | 51% | 149% | 67% |
A Total returns would have been lower if certain expenses had not been reduced during the applicable periods shown.
B Calculated based on average shares outstanding during the period.
C Fees and expenses of any underlying Fidelity Central Funds are not included in the Fund's expense ratio. The Fund indirectly bears its proportionate share of the expenses of any underlying Fidelity Central Funds.
D Amount does not include the portfolio activity of any underlying Fidelity Central Funds.
E Investment income per share reflects a special dividend which amounted to $.06 per share. Excluding the special dividend, the ratio of net investment income (loss) to average net assets would have been .01%.
F Investment income per share reflects a special dividend which amounted to $.03 per share. Excluding the special dividend, the ratio of net investment income (loss) to average net assets would have been .18%.
G Expense ratios reflect operating expenses of the class. Expenses before reductions do not reflect amounts reimbursed by the investment adviser or reductions from brokerage service arrangements or reductions from other expense offset arrangements and do not represent the amount paid by the class during periods when reimbursements or reductions occur. Expenses net of fee waivers reflect expenses after reimbursement by the investment adviser but prior to reductions from brokerage service arrangements or other expense offset arrangements. Expenses net of all reductions represent the net expenses paid by the class.
H Amount represents less than $.01 per share.
See accompanying notes which are an integral part of the financial statements.
Annual Report
Notes to Financial Statements
For the period ended July 31, 2011
1. Organization.
Fidelity Small Cap Value Fund (the Fund) is a fund of Fidelity Securities Fund (the Trust) and is authorized to issue an unlimited number of shares. The Trust is registered under the Investment Company Act of 1940, as amended (the 1940 Act), as an open-end management investment company organized as a Massachusetts business trust. The Fund offers Class A, Class T, Class C, Small Cap Value, Class F and Institutional Class shares, each of which, along with Class B shares, has equal rights as to assets and voting privileges. Effective after the close of business on September 1, 2010, Class B shares were closed to new accounts and additional purchases, except for exchanges and reinvestments, by existing shareholders. Each class has exclusive voting rights with respect to matters that affect that class. Class F shares of the Fund are only available for purchase by mutual funds for which Fidelity Management & Research Company (FMR) or an affiliate serves as investment manager. Class B shares will automatically convert to Class A shares after a holding period of seven years from the initial date of purchase. Investment income, realized and unrealized capital gains and losses, the common expenses of the Fund, and certain fund-level expense reductions, if any, are allocated on a pro-rata basis to each class based on the relative net assets of each class to the total net assets of the Fund. Each class differs with respect to transfer agent and distribution and service plan fees incurred. Certain expense reductions may also differ by class.
2. Investments in Fidelity Central Funds.
The Fund invests in Fidelity Central Funds, which are open-end investment companies available only to other investment companies and accounts managed by Fidelity Management & Research Company (FMR) and its affiliates. The Fund's Schedule of Investments lists each of the Fidelity Central Funds held as of period end, if any, as an investment of the Fund, but does not include the underlying holdings of each Fidelity Central Fund. As an Investing Fund, the Fund indirectly bears its proportionate share of the expenses of the underlying Fidelity Central Funds.
The Money Market Central Funds seek preservation of capital and current income and are managed by Fidelity Investments Money Management, Inc. (FIMM), an affiliate of FMR.
A complete unaudited list of holdings for each Fidelity Central Fund is available upon request or at the Securities and Exchange Commission (the SEC) web site at www.sec.gov. In addition, the financial statements of the Fidelity Central Funds, which are not covered by the Fund's Report of Independent Registered Public Accounting Firm, are available on the SEC web site or upon request.
Annual Report
3. Significant Accounting Policies.
The financial statements have been prepared in conformity with accounting principles generally accepted in the United States of America (GAAP), which require management to make certain estimates and assumptions at the date of the financial statements. Actual results could differ from those estimates. Subsequent events, if any, through the date that the financial statements were issued have been evaluated in the preparation of the financial statements. The following summarizes the significant accounting policies of the Fund:
Security Valuation. Investments are valued as of 4:00 p.m. Eastern time on the last calendar day of the period. The Fund uses independent pricing services approved by the Board of Trustees to value its investments. When current market prices or quotations are not readily available or reliable, valuations may be determined in good faith in accordance with procedures adopted by the Board of Trustees. Factors used in determining value may include market or security specific events. The frequency with which these procedures are used cannot be predicted and they may be utilized to a significant extent. The value used for net asset value (NAV) calculation under these procedures may differ from published prices for the same securities.
The Fund categorizes the inputs to valuation techniques used to value its investments into a disclosure hierarchy consisting of three levels as shown below:
Level 1 - quoted prices in active markets for identical investments
Level 2 - other significant observable inputs (including quoted prices for similar investments, interest rates, prepayment speeds, etc.)
Level 3 - unobservable inputs (including the Fund's own assumptions based on the best information available)
Changes in valuation techniques may result in transfers in or out of an assigned level within the disclosure hierarchy. Valuation techniques used to value the Fund's investments by major category are as follows:
Equity securities, including restricted securities, for which market quotations are readily available, are valued at the last reported sale price or official closing price as reported by an independent pricing service on the primary market or exchange on which they are traded and are categorized as Level 1 in the hierarchy. In the event there were no sales during the day or closing prices are not available, securities are valued at the last quoted bid price or may be valued using the last available price and are generally categorized as Level 2 in the hierarchy. For foreign equity securities, when significant market or security specific events arise, comparisons to the valuation of American Depositary Receipts
Annual Report
Notes to Financial Statements - continued
3. Significant Accounting Policies - continued
Security Valuation - continued
(ADRs), futures contracts, Exchange-traded funds (ETFs) and certain indexes as well as quoted prices for similar securities are used and are categorized as Level 2 in the hierarchy in these circumstances. Utilizing these techniques may result in transfers between Level 1 and Level 2. For restricted equity securities and private placements where observable inputs are limited, assumptions about market activity and risk are used and are categorized as Level 3 in the hierarchy.
Investments in open-end mutual funds, including the Fidelity Central Funds, are valued at their closing net asset value each business day and are categorized as Level 1 in the hierarchy.
Foreign Currency. The Fund may use foreign currency contracts to facilitate transactions in foreign-denominated securities. Gains and losses from these transactions may arise from changes in the value of the foreign currency or if the counterparties do not perform under the contracts' terms.
Foreign-denominated assets, including investment securities, and liabilities are translated into U.S. dollars at the exchange rate at period end. Purchases and sales of investment securities, income and dividends received and expenses denominated in foreign currencies are translated into U.S. dollars at the exchange rate in effect on the transaction date.
The effects of exchange rate fluctuations on investments are included with the net realized and unrealized gain (loss) on investment securities. Other foreign currency transactions resulting in realized and unrealized gain (loss) are disclosed separately.
Investment Transactions and Income. For financial reporting purposes, the Fund's investment holdings and NAV include trades executed through the end of the last business day of the period. The NAV per share for processing shareholder transactions is calculated as of the close of business of the New York Stock Exchange (NYSE), normally 4:00 p.m. Eastern time and includes trades executed through the end of the prior business day. Gains and losses on securities sold are determined on the basis of identified cost and may include proceeds received from litigation. Dividend income is recorded on the ex-dividend date, except for certain dividends from foreign securities where the ex-dividend date may have passed, which are recorded as soon as the Fund is informed of the ex-dividend date. Non-cash dividends included in dividend income, if any, are recorded at the fair market value of the securities received. Distributions received on securities that represent a return of capital or capital gain are recorded as a reduction of
Annual Report
3. Significant Accounting Policies - continued
Investment Transactions and Income - continued
cost of investments and/or as a realized gain. The Fund estimates the components of distributions received that may be considered return of capital distributions or capital gain distributions. Large, non-recurring dividends recognized by the Fund are presented separately on the Statement of Operations as "Special Dividends" and the impact of these dividends is presented in the Financial Highlights. Interest income and distributions from the Fidelity Central Funds are accrued as earned. Interest income includes coupon interest and amortization of premium and accretion of discount on debt securities. Investment income is recorded net of foreign taxes withheld where recovery of such taxes is uncertain.
Expenses. Expenses directly attributable to a fund are charged to that fund. Expenses attributable to more than one fund are allocated among the respective funds on the basis of relative net assets or other appropriate methods. Expense estimates are accrued in the period to which they relate and adjustments are made when actual amounts are known.
Income Tax Information and Distributions to Shareholders. Each year, the Fund intends to qualify as a regulated investment company, including distributing substantially all of its taxable income and realized gains under Subchapter M of the Internal Revenue Code and filing its U.S. federal tax return. As a result, no provision for income taxes is required. As of July 31, 2011, the Fund did not have any unrecognized tax benefits in the financial statements. A fund's federal tax return is subject to examination by the Internal Revenue Service (IRS) for a period of three years. Foreign taxes are provided for based on the Fund's understanding of the tax rules and rates that exist in the foreign markets in which it invests.
Distributions are declared and recorded on the ex-dividend date. Income dividends and capital gain distributions are declared separately for each class. Income and capital gain distributions are determined in accordance with income tax regulations, which may differ from GAAP. In addition, the Fund claimed a portion of the payment made to redeeming shareholders as a distribution for income tax purposes.
Capital accounts within the financial statements are adjusted for permanent book-tax differences. These adjustments have no impact on net assets or the results of operations. Temporary book-tax differences will reverse in a subsequent period.
Book-tax differences are primarily due to the foreign currency transactions and losses deferred due to wash sales.
Annual Report
Notes to Financial Statements - continued
3. Significant Accounting Policies - continued
Income Tax Information and Distributions to Shareholders - continued
The federal tax cost of investment securities and unrealized appreciation (depreciation) as of period end were as follows:
Gross unrealized appreciation | $ 530,639,044 |
Gross unrealized depreciation | (140,116,602) |
Net unrealized appreciation (depreciation) on securities and other investments | $ 390,522,442 |
| |
Tax Cost | $ 2,251,463,484 |
The tax-based components of distributable earnings as of period end were as follows:
Undistributed long-term capital gain | $ 130,326,950 |
Net unrealized appreciation (depreciation) | $ 390,529,985 |
Under the recently enacted Regulated Investment Company Modernization Act of 2010 (the Act), the Fund will be permitted to carry forward capital losses incurred in taxable years beginning after December 22, 2010 for an unlimited period. However, any losses incurred during those future taxable years will be required to be utilized prior to any losses incurred in pre-enactment taxable years, which generally expire after eight years from when they are incurred. Additionally, post-enactment capital losses that are carried forward will retain their character as either short-term or long-term capital losses rather than being considered all short-term as under previous law. The Fund's first fiscal year end subject to the Act will be July 31, 2012.
The tax character of distributions paid was as follows:
| July 31, 2011 | July 31, 2010 |
Ordinary Income | $ 16,899,273 | $ 6,560,137 |
Long-term Capital Gains | 19,302,851 | - |
Total | $ 36,202,124 | $ 6,560,137 |
Short-Term Trading (Redemption) Fees. Shares held by investors in the Fund less than 90 days are subject to a redemption fee equal to 1.50% of the net asset value of shares redeemed. All redemption fees, which reduce the proceeds of the shareholder redemption, are retained by the Fund and accounted for as an addition to paid in capital.
Annual Report
3. Significant Accounting Policies - continued
New Accounting Pronouncement. In May 2011, the Financial Accounting Standards Board issued Accounting Standard Update No. 2011-04, Fair Value Measurement (Topic 820) - Amendments to Achieve Common Fair Value Measurement and Disclosure Requirements in U.S. GAAP and IFRSs. The update changes the wording used to describe the requirements in GAAP for measuring fair value and for disclosing information about fair value measurements. The update is effective during interim and annual periods beginning after December 15, 2011. Management is currently evaluating the impact of the update's adoption on the Fund's financial statement disclosures.
4. Purchases and Sales of Investments.
Purchases and sales of securities, other than short-term securities, aggregated $587,909,809 and $542,085,214, respectively.
5. Fees and Other Transactions with Affiliates.
Management Fee. FMR and its affiliates provide the Fund with investment management related services for which the Fund pays a monthly management fee. The management fee is the sum of an individual fund fee rate that is based on an annual rate of .45% of the Fund's average net assets and a group fee rate that averaged .26% during the period. The group fee rate is based upon the average net assets of all the mutual funds advised by FMR. The group fee rate decreases as assets under management increase and increases as assets under management decrease. In addition, the management fee is subject to a performance adjustment (up to a maximum of ±.20% of the Fund's average net assets over a 36 month performance period). The upward or downward adjustment to the management fee is based on the relative investment performance of Small Cap Value as compared to an appropriate benchmark index. For the period, the total annual management fee rate, including the performance adjustment, was .84% of the Fund's average net assets.
Distribution and Service Plan Fees. In accordance with Rule 12b-1 of the 1940 Act, the Fund has adopted separate Distribution and Service Plans for each class of shares. Certain classes pay Fidelity Distributors Corporation (FDC), an affiliate of FMR, separate Distribution and Service Fees, each of which is based on an annual percentage of each class' average net assets. In addition, FDC may pay financial intermediaries for
Annual Report
Notes to Financial Statements - continued
5. Fees and Other Transactions with Affiliates - continued
Distribution and Service Plan Fees - continued
selling shares of the Fund and providing shareholder support services. For the period, the Distribution and Service Fee rates, total fees and amounts retained by FDC were as follows:
| Distribution
Fee | Service
Fee | Total Fees | Retained
by FDC |
Class A | -% | .25% | $ 320,077 | $ 13,128 |
Class T | .25% | .25% | 280,302 | 522 |
Class B | .75% | .25% | 97,826 | 73,433 |
Class C | .75% | .25% | 465,720 | 134,667 |
| | | $ 1,163,925 | $ 221,750 |
Sales Load. FDC may receive a front-end sales charge of up to 5.75% for selling Class A shares, and 3.50% for selling Class T shares, some of which is paid to financial intermediaries for selling shares of the Fund. Depending on the holding period, FDC may receive contingent deferred sales charges levied on Class A, Class T, Class B, and Class C redemptions. The deferred sales charges range from 5% to 1% for Class B, 1% for Class C, 1.00% for certain purchases of Class A shares and .25% for certain purchases of Class T shares.
For the period, sales charge amounts retained by FDC were as follows:
| Retained
by FDC |
Class A | $ 60,912 |
Class T | 9,625 |
Class B* | 23,049 |
Class C* | 5,402 |
| $ 98,988 |
* When Class B and Class C shares are initially sold, FDC pays commissions from its own resources to financial intermediaries through which the sales are made.
Transfer Agent Fees. Fidelity Investments Institutional Operations Company, Inc. (FIIOC), an affiliate of FMR, is the transfer, dividend disbursing and shareholder servicing agent for each class of the Fund. FIIOC receives account fees and asset-based fees that vary according to the account size and type of account of the shareholders of the respective classes of the Fund, except for Class F. FIIOC receives no fees for providing transfer agency services to Class F. FIIOC pays for typesetting, printing and mailing of
Annual Report
5. Fees and Other Transactions with Affiliates - continued
Transfer Agent Fees - continued
shareholder reports, except proxy statements. For the period, transfer agent fees for each class were as follows:
| Amount | % of
Average
Net Assets |
Class A | $ 388,730 | .30 |
Class T | 173,683 | .31 |
Class B | 30,729 | .31 |
Class C | 139,095 | .30 |
Small Cap Value | 4,748,341 | .24 |
Institutional Class | 220,807 | .22 |
| $ 5,701,385 | |
Accounting and Security Lending Fees. Fidelity Service Company, Inc. (FSC), an affiliate of FMR, maintains the Fund's accounting records. The accounting fee is based on the level of average net assets for the month. Under a separate contract, FSC administers the security lending program. The security lending fee is based on the number and duration of lending transactions.
Brokerage Commissions. The Fund placed a portion of its portfolio transactions with brokerage firms which are affiliates of the investment adviser. The commissions paid to these affiliated firms were $13,259 for the period.
Interfund Lending Program. Pursuant to an Exemptive Order issued by the SEC, the Fund, along with other registered investment companies having management contracts with FMR, may participate in an interfund lending program. This program provides an alternative credit facility allowing the funds to borrow from, or lend money to, other participating affiliated funds. At period end, there were no interfund loans outstanding. The Fund's activity in this program during the period for which loans were outstanding was as follows:
Borrower or Lender | Average Daily
Loan Balance | Weighted Average
Interest Rate | Interest
Expense |
Borrower | $ 5,022,450 | .42% | $ 1,171 |
Annual Report
Notes to Financial Statements - continued
6. Committed Line of Credit.
The Fund participates with other funds managed by FMR or an affiliate in a $4.0 billion credit facility (the "line of credit") to be utilized for temporary or emergency purposes to fund shareholder redemptions or for other short-term liquidity purposes. The Fund has agreed to pay commitment fees on its pro-rata portion of the line of credit, which amounted to $8,189 and is reflected in Miscellaneous expenses on the Statement of Operations. During the period, there were no borrowings on this line of credit.
7. Security Lending.
The Fund lends portfolio securities through a lending agent from time to time in order to earn additional income. The lending agent may loan securities to certain qualified borrowers, including Fidelity Capital Markets (FCM), a broker-dealer affiliated with the Fund. On the settlement date of the loan, the Fund receives collateral (in the form of U.S. Treasury obligations, letters of credit and/or cash) against the loaned securities and maintains collateral in an amount not less than 100% of the market value of the loaned securities during the period of the loan. The market value of the loaned securities is determined at the close of business of the Fund and any additional required collateral is delivered to the Fund on the next business day. If the borrower defaults on its obligation to return the securities loaned because of insolvency or other reasons, a fund could experience delays and costs in recovering the securities loaned or in gaining access to the collateral. Any cash collateral received is invested in the Fidelity Securities Lending Cash Central Fund. The value of loaned securities and cash collateral at period end are disclosed on the Fund's Statement of Assets and Liabilities. Security lending income represents the income earned on investing cash collateral, less rebates paid to borrowers and lending agent fees associated with the loan, plus any premium payments received for lending certain types of securities. Security lending income is presented in the Statement of Operations as a component of income from Fidelity Central Funds. Total security lending income during the period amounted to $121,080. During the period, there were no securities loaned to FCM.
8. Expense Reductions.
FMR voluntarily agreed to reimburse each class to the extent annual operating expenses exceeded certain levels of average net assets as noted in the table below. Some expenses, for example interest expense, including commitment fees, are excluded from this reimbursement.
Annual Report
8. Expense Reductions - continued
The following classes were in reimbursement during the period:
| Expense
Limitations* | Reimbursement
from adviser |
Class A | 1.40 % | $ 9,560 |
Class T | 1.65 % | 4,801 |
Class B | 2.15 % | 1,186 |
Class C | 2.15 % | 3,342 |
| | $ 18,889 |
* Effective October 1, 2010 the expense limitations were eliminated.
Many of the brokers with whom FMR places trades on behalf of the Fund provided services to the Fund in addition to trade execution. These services included payments of certain expenses on behalf of the Fund totaling $25,738 for the period.
9. Distributions to Shareholders.
Distributions to shareholders of each class were as follows:
Years ended July 31, | 2011 | 2010 |
From net investment income | | |
Class A | $ 602,963 | $ 159,193 |
Class T | 175,083 | 36,920 |
Class B | 8,350 | - |
Class C | 50,685 | - |
Small Cap Value | 13,136,446 | 6,230,380 |
Class F | 1,502,640 | 28,266 |
Institutional Class | 674,898 | 105,378 |
Total | $ 16,151,065 | $ 6,560,137 |
From net realized gain | | |
Class A | $ 938,086 | $ - |
Class T | 417,804 | - |
Class B | 85,354 | - |
Class C | 362,483 | - |
Small Cap Value | 16,213,209 | - |
Class F | 1,278,822 | - |
Institutional Class | 755,301 | - |
Total | $ 20,051,059 | $ - |
Annual Report
Notes to Financial Statements - continued
10. Share Transactions.
Transactions for each class of shares were as follows:
| Shares | Dollars |
Years ended July 31, | 2011 | 2010 | 2011 | 2010 |
Class A | | | | |
Shares sold | 4,641,222 | 4,231,111 | $ 70,784,911 | $ 54,936,600 |
Reinvestment of distributions | 98,821 | 12,276 | 1,412,739 | 146,358 |
Shares redeemed | (2,860,682) | (1,973,236) | (43,524,578) | (25,421,999) |
Net increase (decrease) | 1,879,361 | 2,270,151 | $ 28,673,072 | $ 29,660,959 |
Class T | | | | |
Shares sold | 1,830,956 | 1,449,265 | $ 27,619,849 | $ 18,793,141 |
Reinvestment of distributions | 40,370 | 3,030 | 573,649 | 35,906 |
Shares redeemed | (1,537,319) | (727,616) | (23,500,005) | (9,211,959) |
Net increase (decrease) | 334,007 | 724,679 | $ 4,693,493 | $ 9,617,088 |
Class B | | | | |
Shares sold | 84,331 | 262,419 | $ 1,230,023 | $ 3,340,905 |
Reinvestment of distributions | 5,817 | - | 79,168 | - |
Shares redeemed | (265,513) | (174,554) | (3,874,627) | (2,189,700) |
Net increase (decrease) | (175,365) | 87,865 | $ (2,565,436) | $ 1,151,205 |
Class C | | | | |
Shares sold | 1,131,174 | 1,327,692 | $ 16,672,873 | $ 17,060,657 |
Reinvestment of distributions | 25,779 | - | 354,104 | - |
Shares redeemed | (848,659) | (434,251) | (12,648,504) | (5,448,332) |
Net increase (decrease) | 308,294 | 893,441 | $ 4,378,473 | $ 11,612,325 |
Small Cap Value | | | | |
Shares sold | 35,677,635 | 45,122,251 | $ 541,990,483 | $ 585,925,779 |
Reinvestment of distributions | 1,987,755 | 507,903 | 28,460,668 | 6,101,827 |
Shares redeemed | (46,640,533) | (47,781,912) | (708,788,001) | (605,149,428) |
Net increase (decrease) | (8,975,143) | (2,151,758) | $ (138,336,850) | $ (13,121,822) |
Class F | | | | |
Shares sold | 11,644,633 | 8,411,513 | $ 177,097,711 | $ 109,778,609 |
Reinvestment of distributions | 192,943 | 2,350 | 2,781,462 | 28,266 |
Shares redeemed | (2,052,505) | (337,999) | (32,200,197) | (4,618,215) |
Net increase (decrease) | 9,785,071 | 8,075,864 | $ 147,678,976 | $ 105,188,660 |
Institutional Class | | | | |
Shares sold | 4,417,342 | 5,522,070 | $ 67,359,213 | $ 73,692,691 |
Reinvestment of distributions | 90,435 | 7,512 | 1,288,856 | 90,344 |
Shares redeemed | (3,788,938) | (671,565) | (58,540,522) | (8,789,847) |
Net increase (decrease) | 718,839 | 4,858,017 | $ 10,107,547 | $ 64,993,188 |
Annual Report
11. Other.
The Fund's organizational documents provide former and current trustees and officers with a limited indemnification against liabilities arising in connection with the performance of their duties to the Fund. In the normal course of business, the Fund may also enter into contracts that provide general indemnifications. The Fund's maximum exposure under these arrangements is unknown as this would be dependent on future claims that may be made against the Fund. The risk of material loss from such claims is considered remote.
At the end of the period, the Fidelity Freedom Funds® and Fidelity Freedom K® Funds were the owners of record, in the aggregate, of approximately 37% of the total outstanding shares of the Fund.
Annual Report
To the Trustees of Fidelity Securities Fund and the Shareholders of Fidelity Small Cap Value Fund:
In our opinion, the accompanying statement of assets and liabilities, including the schedule of investments, and the related statements of operations and of changes in net assets and the financial highlights present fairly, in all material respects, the financial position of Fidelity Small Cap Value Fund (a fund of Fidelity Securities Fund) at July 31, 2011, the results of its operations for the year then ended, the changes in its net assets for each of the two years in the period then ended and the financial highlights for each of the periods indicated, in conformity with accounting principles generally accepted in the United States of America. These financial statements and financial highlights (hereafter referred to as "financial statements") are the responsibility of the Fidelity Small Cap Value Fund's management. Our responsibility is to express an opinion on these financial statements based on our audits. We conducted our audits of these financial statements in accordance with the standards of the Public Company Accounting Oversight Board (United States). Those standards require that we plan and perform the audit to obtain reasonable assurance about whether the financial statements are free of material misstatement. An audit includes examining, on a test basis, evidence supporting the amounts and disclosures in the financial statements, assessing the accounting principles used and significant estimates made by management, and evaluating the overall financial statement presentation. We believe that our audits, which included confirmation of securities at July 31, 2011 by correspondence with the custodian and brokers, provide a reasonable basis for our opinion.
/s/PricewaterhouseCoopers LLP
PricewaterhouseCoopers LLP
Boston, Massachusetts
September 15, 2011
Annual Report
The Trustees, Members of the Advisory Board, and executive officers of the trust and fund, as applicable, are listed below. The Board of Trustees governs the fund and is responsible for protecting the interests of shareholders. The Trustees are experienced executives who meet periodically throughout the year to oversee the fund's activities, review contractual arrangements with companies that provide services to the fund, oversee management of the risks associated with such activities and contractual arrangements, and review the fund's performance. Except for James C. Curvey, each of the Trustees oversees 221 funds advised by FMR or an affiliate. Mr. Curvey oversees 419 funds advised by FMR or an affiliate.
The Trustees hold office without limit in time except that (a) any Trustee may resign; (b) any Trustee may be removed by written instrument, signed by at least two-thirds of the number of Trustees prior to such removal; (c) any Trustee who requests to be retired or who has become incapacitated by illness or injury may be retired by written instrument signed by a majority of the other Trustees; and (d) any Trustee may be removed at any special meeting of shareholders by a two-thirds vote of the outstanding voting securities of the trust. Each Trustee who is not an interested person (as defined in the 1940 Act) (Independent Trustee), shall retire not later than the last day of the calendar year in which his or her 75th birthday occurs. The Independent Trustees may waive this mandatory retirement age policy with respect to individual Trustees. The executive officers and Advisory Board Members hold office without limit in time, except that any officer and Advisory Board Member may resign or may be removed by a vote of a majority of the Trustees at any regular meeting or any special meeting of the Trustees. Except as indicated, each individual has held the office shown or other offices in the same company for the past five years.
Experience, Skills, Attributes, and Qualifications of the Fund's Trustees. The Governance and Nominating Committee has adopted a statement of policy that describes the experience, qualifications, attributes, and skills that are necessary and desirable for potential Independent Trustee candidates (Statement of Policy). The Board believes that each Trustee satisfied at the time he or she was initially elected or appointed a Trustee, and continues to satisfy, the standards contemplated by the Statement of Policy. The Governance and Nominating Committee also engages professional search firms to help identify potential Independent Trustee candidates who have the experience, qualifications, attributes, and skills consistent with the Statement of Policy. From time to time, additional criteria based on the composition and skills of the current Independent Trustees, as well as experience or skills that may be appropriate in light of future changes to board composition, business conditions, and regulatory or other developments, have also been considered by the professional search firms and the Governance and Nominating Committee. In addition, the Board takes into account the Trustees' commitment and participation in Board and committee meetings, as well as their leadership of standing and ad hoc committees throughout their tenure.
In determining that a particular Trustee was and continues to be qualified to serve as a Trustee, the Board has considered a variety of criteria, none of which, in isolation, was controlling. The Board believes that, collectively, the Trustees have balanced and diverse experience, qualifications, attributes, and skills, which allow the Board to operate effectively in governing the fund and protecting the interests of shareholders. Information about the specific experience, skills, attributes, and qualifications of each Trustee, which in each case led to the Board's conclusion that the Trustee should serve (or continue to serve) as a trustee of the fund, is provided below.
Annual Report
Board Structure and Oversight Function. James C. Curvey is an interested person (as defined in the 1940 Act) and currently serves as Acting Chairman. The Trustees have determined that an interested Chairman is appropriate and benefits shareholders because an interested Chairman has a personal and professional stake in the quality and continuity of services provided to the fund. Independent Trustees exercise their informed business judgment to appoint an individual of their choosing to serve as Chairman, regardless of whether the Trustee happens to be independent or a member of management. The Independent Trustees have determined that they can act independently and effectively without having an Independent Trustee serve as Chairman and that a key structural component for assuring that they are in a position to do so is for the Independent Trustees to constitute a substantial majority for the Board. The Independent Trustees also regularly meet in executive session. Ned C. Lautenbach serves as Chairman of the Independent Trustees and as such (i) acts as a liaison between the Independent Trustees and management with respect to matters important to the Independent Trustees and (ii) with management prepares agendas for Board meetings.
Fidelity funds are overseen by different Boards of Trustees. The fund's Board oversees Fidelity's equity and high income funds and another Board oversees Fidelity's investment-grade bond, money market, and asset allocation funds. The asset allocation funds may invest in Fidelity funds overseen by the fund's Board. The use of separate Boards, each with its own committee structure, allows the Trustees of each group of Fidelity funds to focus on the unique issues of the funds they oversee, including common research, investment, and operational issues. On occasion, the separate Boards establish joint committees to address issues of overlapping consequences for the Fidelity funds overseen by each Board.
The Trustees operate using a system of committees to facilitate the timely and efficient consideration of all matters of importance to the Trustees, the fund, and fund shareholders and to facilitate compliance with legal and regulatory requirements and oversight of the fund's activities and associated risks. The Board, acting through its committees, has charged FMR and its affiliates with (i) identifying events or circumstances the occurrence of which could have demonstrably adverse effects on the fund's business and/or reputation; (ii) implementing processes and controls to lessen the possibility that such events or circumstances occur or to mitigate the effects of such events or circumstances if they do occur; and (iii) creating and maintaining a system designed to evaluate continuously business and market conditions in order to facilitate the identification and implementation processes described in (i) and (ii) above. Because the day-to-day operations and activities of the fund are carried out by or through FMR, its affiliates and other service providers, the fund's exposure to risks is mitigated but not eliminated by the processes overseen by the Trustees. While each of the Board's committees has responsibility for overseeing different aspects of the fund's activities, oversight is exercised primarily through the Operations, Audit, and Compliance Committees. Appropriate personnel, including but not limited to the fund's Chief Compliance Officer (CCO), FMR's internal auditor, the independent accountants, the fund's Treasurer and portfolio management personnel, make periodic reports to the Board's committees, as appropriate. The responsibilities of each committee, including their oversight responsibilities, are described further under "Standing Committees of the Fund's Trustees."
Annual Report
Trustees and Officers - continued
The fund's Statement of Additional Information (SAI) includes more information about the Trustees. To request a free copy, call Fidelity at 1-800-208-0098.
Interested Trustees*:
Correspondence intended for each Trustee who is an interested person may be sent to Fidelity Investments, 82 Devonshire Street, Boston, Massachusetts 02109.
Name, Age; Principal Occupations and Other Relevant Experience+ |
James C. Curvey (76) |
| Year of Election or Appointment: 2007
Mr. Curvey is Trustee and Acting Chairman of the Board of Trustees of certain Trusts. Mr. Curvey also serves as Trustee (2007-present) of other investment companies advised by FMR. Mr. Curvey is a Director of Fidelity Investments Money Management, Inc. (2009-present), Director of Fidelity Research & Analysis Co. (2009-present) and Director of FMR and FMR Co., Inc. (2007-present). Mr. Curvey is also Vice Chairman (2007-present) and Director of FMR LLC. In addition, Mr. Curvey serves as an Overseer for the Boston Symphony Orchestra and a member of the Trustees of Villanova University. Previously, Mr. Curvey was the Vice Chairman (2006-2007) and Director (2000-2007) of FMR Corp. |
Ronald P. O'Hanley (54) |
| Year of Election or Appointment: 2011
Mr. O'Hanley is Director of FMR Co., Inc. (2010-present), Director of Fidelity Investments Money Management, Inc. (2010-present), Director of Fidelity Research & Analysis Company (2010-present), President of Fidelity Asset Management and Corporate Services and a member of Fidelity's Executive Committee (2010-present). Previously, Mr. O'Hanley served as President and Chief Executive Officer of BNY Mellon Asset Management (2007-2010). Mr. O'Hanley also served as Vice Chairman of Bank New York Mellon Corp. and a member of that firm's Executive Committee. Prior to the 2007 merger of The Bank of New York and Mellon Financial Corporation, he was Vice Chairman of Mellon Financial Corporation and President and Chief Executive Officer of Mellon Asset Management. He joined Mellon in February 1997. Mr. O'Hanley currently serves as Chairman of the Boston Public Library Foundation Board of Directors and sits on the Board of Directors of Beth Israel Deaconess Medical Center, the Board of Trustees of the Marine Biological Laboratory and the Advisory Board of the Maxwell School of Citizenship and Public Administration at Syracuse University. Mr. O'Hanley also chairs the Council on Asset Management for the Financial Services Roundtable and is a member of the Board of Directors of Institutional Investor's U.S. Institute. |
* Trustees have been determined to be "Interested Trustees" by virtue of, among other things, their affiliation with the trust or various entities under common control with FMR.
+ The information above includes each Trustee's principal occupation during the last five years and other information relating to the experience, attributes, and skills relevant to each Trustee's qualifications to serve as a Trustee, which led to the conclusion that each Trustee should serve as a Trustee for the fund.
Annual Report
Trustees and Officers - continued
Independent Trustees:
Correspondence intended for each Independent Trustee (that is, the Trustees other than the Interested Trustees) may be sent to Fidelity Investments, P.O. Box 55235, Boston, Massachusetts 02205-5235.
Name, Age; Principal Occupations and Other Relevant Experience+ |
Dennis J. Dirks (63) |
| Year of Election or Appointment: 2005 Prior to his retirement in May 2003, Mr. Dirks was Chief Operating Officer and a member of the Board of The Depository Trust & Clearing Corporation (DTCC). He also served as President, Chief Operating Officer, and Board member of The Depository Trust Company (DTC) and President and Board member of the National Securities Clearing Corporation (NSCC). In addition, Mr. Dirks served as Chief Executive Officer and Board member of the Government Securities Clearing Corporation, Chief Executive Officer and Board member of the Mortgage-Backed Securities Clearing Corporation, as a Trustee and a member of the Finance Committee of Manhattan College (2005-2008), and as a Trustee and a member of the Finance Committee of AHRC of Nassau County (2006-2008). Mr. Dirks is a member of the Independent Directors Council (IDC) Governing Council (2010-Present) and Board of Directors for The Brookville Center for Children's Services, Inc. (2009-present). |
Alan J. Lacy (57) |
| Year of Election or Appointment: 2008 Mr. Lacy serves as Senior Adviser (2007-present) of Oak Hill Capital Partners, L.P. (private equity). Mr. Lacy also served as Chief Executive Officer (2000-2005) and Vice Chairman (2005-2006) of Sears Holdings Corporation and Sears, Roebuck and Co. (retail). In addition, Mr. Lacy serves as a member of the Board of Directors of Dave & Buster's, Inc. (restaurant and entertainment complexes, 2010-present), The Hillman Companies, Inc. (hardware wholesalers, 2010-present), and Bristol-Myers Squibb Company (global pharmaceuticals, 2007-present). Mr. Lacy is a member of the Board of Trustees of The National Parks Conservation Association (2006-Present). Previously, Mr. Lacy served as Chairman of the Board of Trustees of the National Parks Conservation Association (2008-2011) and as a member of the Board of Directors for the Western Union Company (global money transfer, 2006-2011). |
Ned C. Lautenbach (67) |
| Year of Election or Appointment: 2000 Mr. Lautenbach is Chairman of the Independent Trustees of the Equity and High Income Funds (2006-present). Mr. Lautenbach currently serves as the Lead Director of the Eaton Corporation Board of Directors (diversified industrial, 1997-present). Mr. Lautenbach is also a member of the Board of Directors of the Philharmonic Center for the Arts in Naples, Florida (1999-present); a member of the Board of Trustees of Fairfield University (2005-present); and a member of the Council on Foreign Relations (1994-present). Previously, Mr. Lautenbach was a Partner/Advisory Partner at Clayton, Dubilier & Rice, LLC (private equity investment, 1998-2010), as well as a Director of Sony Corporation (2006-2007). |
Joseph Mauriello (66) |
| Year of Election or Appointment: 2008 Prior to his retirement in January 2006, Mr. Mauriello served in numerous senior management positions including Deputy Chairman and Chief Operating Officer (2004-2005), and Vice Chairman of Financial Services (2002-2004) of KPMG LLP US (professional services, 1965-2005). Mr. Mauriello currently serves as a member of the Board of Directors of XL Group plc. (global insurance and re-insurance, 2006-present) and of Arcadia Resources Inc. (health care services and products, 2007-present). Previously, Mr. Mauriello served as a Director of the Hamilton Funds of the Bank of New York (2006-2007). |
Robert W. Selander (60) |
| Year of Election or Appointment: 2011
Previously, Mr. Selander served as a Member of the Advisory Board of Fidelity's Equity and High Income Funds (2011), Executive Vice Chairman (2010), Chief Executive Officer (2009-2010), and President and Chief Executive Officer (1997-2009) of Mastercard, Inc. |
Cornelia M. Small (67) |
| Year of Election or Appointment: 2005 Ms. Small is a member of the Board of Directors of the Teagle Foundation (2009-present). Ms. Small is also a member of the Investment Committee, and Chair (2008-present) and a member of the Board of Trustees of Smith College. In addition, Ms. Small serves on the Investment Committee of the Berkshire Taconic Community Foundation (2008-present). Previously, Ms. Small served as Chairperson of the Investment Committee (2002-2008) of Smith College. In addition, Ms. Small served as Chief Investment Officer, Director of Global Equity Investments, and a member of the Board of Directors of Scudder, Stevens & Clark and Scudder Kemper Investments. |
William S. Stavropoulos (72) |
| Year of Election or Appointment: 2002 Mr. Stavropoulos is Vice Chairman of the Independent Trustees of the Equity and High Income Funds (2006-present). Mr. Stavropoulos serves as President and Founder of the Michigan Baseball Foundation, the Great Lakes Loons (2007-present). Mr. Stavropoulos is Chairman Emeritus of the Board of Directors of The Dow Chemical Company, where he previously served in numerous senior management positions, including President, CEO (1995-2000; 2002-2004), Chairman of the Executive Committee (2000-2006), and as a member of the Board of Directors (1990-2006). Currently, Mr. Stavropoulos is Chairman of Univar (global distributor of commodity and specialty chemicals, 2010-present), a Director of Teradata Corporation (data warehousing and technology solutions, 2008-present), Chemical Financial Corporation, Maersk Inc. (industrial conglomerate), Tyco International, Inc. (multinational manufacturing and services, 2007-present), and a member of the Advisory Board for Metalmark Capital (private equity investment, 2005-present). Mr. Stavropoulos is a special advisor to Clayton, Dubilier & Rice, LLC (private equity investment). In addition, Mr. Stavropoulos is a member of the University of Notre Dame Advisory Council for the College of Science. |
David M. Thomas (62) |
| Year of Election or Appointment: 2008 Previously, Mr. Thomas served as Executive Chairman (2005-2006) and Chairman and Chief Executive Officer (2000-2005) of IMS Health, Inc. (pharmaceutical and healthcare information solutions). In addition, Mr. Thomas serves as a member of the Board of Directors of Fortune Brands, Inc. (consumer products), and Interpublic Group of Companies, Inc. (marketing communication, 2004-present). |
Michael E. Wiley (60) |
| Year of Election or Appointment: 2008 Mr. Wiley also serves as a Director of Asia Pacific Exploration Consolidated (international oil and gas exploration and production, 2008-present). Mr. Wiley serves as a Director of Tesoro Corporation (independent oil refiner and marketer, 2005-present), and a Director of Bill Barrett Corporation (exploration and production, 2005-present). In addition, Mr. Wiley also serves as a Director of Post Oak Bank (privately-held bank, 2004-present). Previously, Mr. Wiley served as a member of the Board of Trustees of the University of Tulsa (2000-2006; 2007-2010), as a Senior Energy Advisor of Katzenbach Partners, LLC (consulting, 2006-2007), as an Advisory Director of Riverstone Holdings (private investment), Chairman, President, and CEO of Baker Hughes, Inc. (oilfield services, 2000-2004), and as Director of Spinnaker Exploration Company (exploration and production, 2001-2005). |
Annual Report
+ The information above includes each Trustee's principal occupation during the last five years and other information relating to the experience, attributes, and skills relevant to each Trustee's qualifications to serve as a Trustee, which led to the conclusion that each Trustee should serve as a Trustee for the fund.
Advisory Board Members and Executive Officers:
Correspondence intended for each executive officer, Edward C. Johnson 3d, and Peter S. Lynch may be sent to Fidelity Investments, 82 Devonshire Street, Boston, Massachusetts 02109.
Name, Age; Principal Occupation |
Edward C. Johnson 3d (81) |
| Year of Election or Appointment: 2011 Member of the Advisory Board of Fidelity's Equity and High Income Funds. Mr. Johnson serves as Chief Executive Officer, Chairman, and a Director of FMR LLC, and also serves as Chairman and Director of FIL Limited. Previously, Mr. Johnson served as a Trustee and Chairman of the Board of certain Fidelity Trusts, Chairman and a Director of FMR, Chairman and a Director of FMR Co., Inc., and President of FMR LLC (2006-2007). |
Peter S. Lynch (67) |
| Year of Election or Appointment: 2003 Member of the Advisory Board of Fidelity's Equity and High Income Funds. Mr. Lynch is Vice Chairman and a Director of FMR and FMR Co., Inc. In addition, Mr. Lynch serves as a Trustee of Boston College and as the Chairman of the Inner-City Scholarship Fund. Previously, Mr. Lynch served on the Special Olympics International Board of Directors (1997-2006). |
Kenneth B. Robins (41) |
| Year of Election or Appointment: 2008 President and Treasurer of Fidelity's Equity and High Income Funds. Mr. Robins also serves as President and Treasurer (2010-present) and Assistant Treasurer (2009-present) of other Fidelity funds and is an employee of Fidelity Investments (2004-present). Previously, Mr. Robins served as Deputy Treasurer of the Fidelity funds (2005-2008) and Treasurer and Chief Financial Officer of The North Carolina Capital Management Trust: Cash and Term Portfolios (2006-2008). |
Brian B. Hogan (46) |
| Year of Election or Appointment: 2009 Vice President of Equity and High Income Funds. Mr. Hogan also serves as President of FMR's Equity Division (2009-present). Previously, Mr. Hogan served as Senior Vice President, Equity Research of FMR (2006-2009) and as a portfolio manager. |
Thomas C. Hense (47) |
| Year of Election or Appointment: 2008 or 2010 Vice President of Fidelity's High Income (2008), Small Cap (2008), and Value (2010) Funds. Previously, Mr. Hense served as a portfolio manager for Fidelity's Institutional Money Management Group (Pyramis) (2003-2008). |
Scott C. Goebel (43) |
| Year of Election or Appointment: 2008 Secretary and Chief Legal Officer (CLO) of the Fidelity funds. Mr. Goebel also serves as Secretary of Fidelity Investments Money Management, Inc. (FIMM) (2010-present) and Fidelity Research and Analysis Company (FRAC) (2010-present); Secretary and CLO of The North Carolina Capital Management Trust: Cash and Term Portfolios (2008-present); General Counsel, Secretary, and Senior Vice President of FMR (2008-present) and FMR Co., Inc. (2008-present); employed by FMR LLC or an affiliate (2001-present); Chief Legal Officer of Fidelity Management & Research (Hong Kong) Limited (2008-present) and Assistant Secretary of Fidelity Management & Research (Japan) Inc. (2008-present), and Fidelity Management & Research (U.K.) Inc. (2008-present). Previously, Mr. Goebel served as Assistant Secretary of FIMM (2008-2010), FRAC (2008-2010), and the Funds (2007-2008) and as Vice President and Secretary of Fidelity Distributors Corporation (FDC) (2005-2007). |
William C. Coffey (42) |
| Year of Election or Appointment: 2009 Assistant Secretary of Fidelity's Equity and High Income Funds. Mr. Coffey also serves as Senior Vice President and Deputy General Counsel of FMR LLC (2010-present), and is an employee of Fidelity Investments. Previously, Mr. Coffey served as Vice President and Associate General Counsel of FMR LLC (2005-2009). |
Holly C. Laurent (57) |
| Year of Election or Appointment: 2008 Anti-Money Laundering (AML) Officer of the Fidelity funds. Ms. Laurent also serves as AML Officer of The North Carolina Capital Management Trust: Cash and Term Portfolios (2008-present) and is an employee of Fidelity Investments. Previously, Ms. Laurent was Senior Vice President and Head of Legal for Fidelity Business Services India Pvt. Ltd. (2006-2008), and Senior Vice President, Deputy General Counsel and Group Head for FMR LLC (2005-2006). |
Christine Reynolds (52) |
| Year of Election or Appointment: 2008 Chief Financial Officer of the Fidelity funds. Ms. Reynolds became President of Fidelity Pricing and Cash Management Services (FPCMS) in August 2008. Ms. Reynolds served as Chief Operating Officer of FPCMS (2007-2008). Previously, Ms. Reynolds served as President, Treasurer, and Anti-Money Laundering officer of the Fidelity funds (2004-2007). |
Kenneth A. Rathgeber (64) |
| Year of Election or Appointment: 2004 Chief Compliance Officer of Fidelity's Equity and High Income Funds. Mr. Rathgeber is Chief Compliance Officer of Fidelity Management & Research (Hong Kong) Limited (2008-present), Fidelity Management & Research (Japan) Inc. (2008-present), FMR (2005-present), FMR Co., Inc. (2005-present), Fidelity Management & Research (U.K.) Inc. (2005-present), Fidelity Research & Analysis Company (2005-present), Fidelity Investments Money Management, Inc. (2005-present), Pyramis Global Advisors, LLC (2005-present), and Strategic Advisers, Inc. (2005-present). |
Jeffrey S. Christian (49) |
| Year of Election or Appointment: 2009 Deputy Treasurer of the Fidelity funds. Mr. Christian is an employee of Fidelity Investments. Previously, Mr. Christian served as Chief Financial Officer (2008-2009) of certain Fidelity funds and Senior Vice President of Fidelity Pricing and Cash Management Services (FPCMS) (2004-2009). |
Bryan A. Mehrmann (50) |
| Year of Election or Appointment: 2005 Deputy Treasurer of the Fidelity funds. Mr. Mehrmann is an employee of Fidelity Investments. |
Adrien E. Deberghes (43) |
| Year of Election or Appointment: 2008 Deputy Treasurer of Fidelity's Equity and High Income Funds. Mr. Deberghes also serves as Assistant Treasurer of other Fidelity funds (2010-present) and is an employee of Fidelity Investments (2008-present). Previously, Mr. Deberghes served as Senior Vice President of Mutual Fund Administration at State Street Corporation (2007-2008), Senior Director of Mutual Fund Administration at Investors Bank & Trust (2005-2007), and Director of Finance for Dunkin' Brands (2000-2005). |
Stephanie J. Dorsey (42) |
| Year of Election or Appointment: 2010 Assistant Treasurer of Fidelity's Equity and High Income Funds. Ms. Dorsey also serves as Deputy Treasurer of other Fidelity funds (2008-present) and is an employee of Fidelity Investments (2008-present). Previously, Ms. Dorsey served as Treasurer (2004-2008) of the JPMorgan Mutual Funds and Vice President (2004-2008) of JPMorgan Chase Bank. |
John R. Hebble (53) |
| Year of Election or Appointment: 2009 Assistant Treasurer of Fidelity's Equity and High Income Funds. Mr. Hebble also serves as President (2011-present), Treasurer, and Chief Financial Officer of The North Carolina Capital Management Trust: Cash and Term Portfolios (2008-present), President and Treasurer of other Fidelity funds (2008-present) and is an employee of Fidelity Investments. |
Gary W. Ryan (52) |
| Year of Election or Appointment: 2005 Assistant Treasurer of the Fidelity funds. Mr. Ryan is an employee of Fidelity Investments. Previously, Mr. Ryan served as Vice President of Fund Reporting in Fidelity Pricing and Cash Management Services (FPCMS) (1999-2005). |
Jonathan Davis (43) |
| Year of Election or Appointment: 2010 Assistant Treasurer of the Fidelity funds. Mr. Davis is an employee of Fidelity Investments. Previously, Mr. Davis served as Vice President and Associate General Counsel of FMR LLC (2003-2010). |
Annual Report
The Board of Trustees of Fidelity Small Cap Value Fund voted to pay to shareholders of record at the opening of business on record date, the following distributions per share derived from capital gains realized from sales of portfolio securities:
| Pay Date | Record Date | Capital Gains |
Class A | 09/12/11 | 09/09/11 | $0.815 |
Class T | 09/12/11 | 09/09/11 | $0.815 |
Class B | 09/12/11 | 09/09/11 | $0.815 |
Class C | 09/12/11 | 09/09/11 | $0.815 |
Class A, T, B, and C designates 100% of the dividends distributed during the fiscal year as qualifying for the dividends-received deduction for corporate shareholders.
Class A, T, B, and C designates 100% of the dividends distributed during the fiscal year as amounts which can be taken into account as a dividend for the purposes of the maximum rate under section 1(h)(11) of the Internal Revenue Code.
The fund hereby designates as a capital gain dividend with respect to the taxable year ended July 31, 2011, $147,340,051, or, if subsequently determined to be different, the net capital gain of such year.
The fund will notify shareholders in January 2012 of amounts for use in preparing 2011 income tax returns.
Annual Report
Board Approval of Investment Advisory Contracts and Management Fees
Fidelity Small Cap Value Fund
Each year, the Board of Trustees, including the Independent Trustees (together, the Board), votes on the renewal of the management contract and sub-advisory agreements (together, the Advisory Contracts) for the fund. The Board, assisted by the advice of fund counsel and Independent Trustees' counsel, requests and considers a broad range of information relevant to the renewal of the Advisory Contracts throughout the year.
The Board meets regularly and considers at each of its meetings factors that are relevant to its annual consideration of the renewal of the fund's Advisory Contracts, including the services and support provided to the fund and its shareholders. The Board has established various standing committees, each composed of Independent Trustees with varying backgrounds, to which the Board has assigned specific subject matter responsibilities in order to enhance effective decision-making by the Board. The Board, acting directly and through its Committees, requests and receives information concerning the annual consideration of the renewal of the fund's Advisory Contracts. The Board also meets as needed to consider matters specifically related to the Board's annual consideration of the renewal of Advisory Contracts. Members of the Board may also meet with trustees of other Fidelity funds through ad hoc joint committees to discuss certain matters relevant to the Fidelity funds.
At its July 2011 meeting, the Board of Trustees, including the Independent Trustees, unanimously determined to renew the fund's Advisory Contracts. In reaching its determination, the Board considered all factors it believed relevant, including (i) the nature, extent, and quality of the services to be provided to the fund and its shareholders (including the investment performance of the fund); (ii) the competitiveness of the fund's management fee and total expense ratio; (iii) the total costs of the services to be provided by and the profits to be realized by Fidelity from its relationship with the fund; (iv) the extent to which economies of scale would be realized as the fund grows; and (v) whether fee levels reflect these economies of scale, if any, for the benefit of fund shareholders.
In considering whether to renew the Advisory Contracts for the fund, the Board reached a determination, with the assistance of fund counsel and Independent Trustees' counsel and through the exercise of its business judgment, that the renewal of the Advisory Contracts is in the best interests of the fund and its shareholders and that the compensation payable under the Advisory Contracts is fair and reasonable. The Board's decision to renew the Advisory Contracts was not based on any single factor, but rather was based on a comprehensive consideration of all the information provided to the Board at its meetings throughout the year. The Board, in reaching its determination to renew the Advisory Contracts, is aware that shareholders in the fund have a broad range of investment choices available to them, including a wide choice among mutual funds offered by Fidelity's competitors, and that the fund's shareholders, who have the opportunity to review and weigh the disclosure provided by the fund in its prospectus and other public disclosures, have chosen to invest in this fund, managed by Fidelity.
Annual Report
Nature, Extent, and Quality of Services Provided. The Board considered the staffing within the investment adviser, FMR, and the sub-advisers (together, the Investment Advisers), including the backgrounds of the fund's investment personnel and the fund's investment objective and discipline. The Independent Trustees also had discussions with senior management of Fidelity's investment operations and investment groups. The Board considered the structure of the portfolio manager compensation program and whether this structure provides appropriate incentives to act in the best interests of the fund.
Resources Dedicated to Investment Management and Support Services. The Board and the Fund Oversight and Research Committees reviewed the general qualifications and capabilities of the Investment Advisers' investment staff, including its size, education, experience, and resources, as well as the Investment Advisers' approach to recruiting, training, managing, and compensating investment personnel. The Board also noted that FMR has devoted increased resources to non-U.S. offices. The Board noted that Fidelity's analysts have extensive resources, tools and capabilities which allow them to conduct sophisticated quantitative and fundamental analysis, as well as credit analysis of issuers, counterparties and enhancers. The Board also believes that Fidelity's investment professionals have sufficient access to global information and data so as to provide competitive investment results over time, and that those professionals also have access to sophisticated tools which permit them to assess portfolio construction and risk and performance attribution characteristics continuously, as well as to transmit new information and research conclusions rapidly around the world. Additionally, in their deliberations, the Board considered the Investment Advisers' trading capabilities and resources which are an integral part of the investment management process.
Shareholder and Administrative Services. The Board considered (i) the nature, extent, quality, and cost of advisory, administrative, and shareholder services performed by the Investment Advisers and their affiliates under the Advisory Contracts and under separate agreements covering transfer agency, pricing and bookkeeping, and securities lending services for the fund; (ii) the nature and extent of the investment adviser's supervision of third party service providers, principally custodians and subcustodians; and (iii) the resources devoted to, and the record of compliance with, the fund's compliance policies and procedures. The Board also reviewed the allocation of fund brokerage, including allocations to brokers affiliated with the Investment Advisers, the use of brokerage commissions to pay fund expenses, and the use of "soft" commission dollars to pay for research services.
The Board noted that the growth of fund assets over time across the complex allows Fidelity to reinvest in the development of services designed to enhance the value or convenience of the Fidelity funds as investment vehicles. These services include 24-hour access to account information and market information through telephone representatives and over the Internet, investor education materials and asset allocation tools, and the expanded availability of Fidelity Investor Centers, with 35 new branches opening since 2010.
Annual Report
Board Approval of Investment Advisory Contracts and
Management Fees - continued
Investment in a Large Fund Family. The Board considered the benefits to shareholders of investing in a Fidelity fund, including the benefits of investing in a fund that is part of a large family of funds offering a variety of investment disciplines and providing a large variety of mutual fund investor services. The Board noted that Fidelity had taken, or had made recommendations that resulted in the Fidelity funds taking, a number of actions over the previous year that benefited particular funds, including (i) continuing to dedicate additional resources to investment research and support of the senior management team that oversees asset management; (ii) rationalizing product lines through the mergers of six funds into other funds; (iii) continuing to migrate the Freedom Funds to dedicated lower cost underlying funds; (iv) obtaining shareholder approval to broaden the investment strategies for Fidelity Consumer Finance Portfolio, Fidelity Emerging Asia Fund, and Fidelity Environment and Alternative Energy Portfolio; (v) contractually agreeing to reduce the management fees and impose other expense limitations on Spartan® 500 Index Fund and U.S. Bond Index Fund in connection with launching new institutional classes of these funds; (vi) changing the name, primary and supplemental benchmarks, and investment policies of Fidelity Global Strategies Fund to support the fund's flexible investment mandate and global orientation; and (vii) reducing the transfer agency account fee rates on certain accounts.
Investment Performance. The Board considered whether the fund has operated in accordance with its investment objective, as well as its record of compliance with its investment restrictions. It also reviewed the fund's absolute investment performance for each class, as well as the fund's relative investment performance for each class measured over multiple periods against (i) a broad-based securities market index, and (ii) a peer group of mutual funds deemed appropriate by Fidelity and reviewed by the Board. The following charts considered by the Board show, over the one-, three-, and five-year periods ended December 31, 2010, the cumulative total returns of Institutional Class (Class I) and Class C of the fund, the cumulative total returns of a broad-based securities market index ("benchmark"), and a range of cumulative total returns of a peer group of mutual funds identified by Morningstar, Inc. as having an investment style similar to that of the fund based on underlying portfolio holdings. The returns of Institutional Class (Class I) and Class C show the performance of the highest and lowest performing classes, respectively (based on five-year performance). The box within each chart shows the 25th percentile return (bottom of box) and the 75th percentile return (top of box) of the peer group. Returns shown above the box are in the first quartile and returns shown below the box are in the fourth quartile. The percentage beaten numbers noted below each chart correspond to the percentile box and represent the percentage of funds in the peer group whose performance was equal to or lower than that of the class indicated.
Annual Report
Fidelity Small Cap Value Fund
The Board reviewed the fund's relative investment performance against its peer group and noted that the performance of Institutional Class (Class I) of the fund was in the third quartile for the one-year period and the first quartile for the three- and five-year periods. The Board also noted that the investment performance of Institutional Class (Class I) of the fund compared favorably to its benchmark for all the periods shown. The Board considered that the variations in performance among the fund's classes reflect the variations in class expenses, which result in lower performance for higher expense classes. The Board also reviewed the fund's performance since inception as well as performance in the current year.
The Board also considered that the fund's management fee is subject to upward or downward adjustment depending upon whether, and to what extent, the fund's investment performance for the performance period exceeds, or is exceeded by, the record (over the same period) of a Board-approved performance adjustment index. The Board noted that the performance adjustment provides FMR with a strong economic incentive to seek to achieve superior performance for the fund's shareholders and helps to more closely align the interests of FMR and the fund's shareholders.
Based on its review, the Board concluded that the nature, extent, and quality of services provided to the fund under the Advisory Contracts should benefit the fund's shareholders.
Annual Report
Board Approval of Investment Advisory Contracts and
Management Fees - continued
Competitiveness of Management Fee and Total Expense Ratio. The Board considered the fund's management fee and total expense ratio compared to "mapped groups" of competitive funds and classes. Fidelity creates "mapped groups" by combining similar Lipper investment objective categories that have comparable management fee characteristics. Combining Lipper investment objective categories aids the Board's management fee and total expense ratio comparisons by broadening the competitive group used for comparison and by reducing the number of universes to which various Fidelity funds are compared.
Management Fee. The Board considered two proprietary management fee comparisons for the 12-month periods shown in the chart below. The group of Lipper funds used by the Board for management fee comparisons is referred to below as the "Total Mapped Group." The Total Mapped Group comparison focuses on a fund's standing relative to the total universe of comparable funds available to investors in terms of gross management fees before expense reimbursements or caps, and without giving effect to the fund's performance adjustment. "TMG %" represents the percentage of funds in the Total Mapped Group that had management fees that were lower than the fund's. For example, a TMG % of 14% means that 86% of the funds in the Total Mapped Group had higher management fees than the fund. The "Asset-Size Peer Group" (ASPG) comparison focuses on a fund's standing relative to non-Fidelity funds similar in size to the fund within the Total Mapped Group. The ASPG represents at least 15% of the funds in the Total Mapped Group with comparable asset size and management fee characteristics, subject to a minimum of 50 funds (or all funds in the Total Mapped Group if fewer than 50). Additional information, such as the ASPG quartile in which the fund's management fee ranked and the impact of the fund's performance adjustment, is also included in the chart and considered by the Board.
Annual Report
Fidelity Small Cap Value Fund
The Board noted that the fund's management fee ranked below the median of its Total Mapped Group and below the median of its ASPG for 2010. The Board also noted the effect of the fund's positive performance adjustment on the fund's management fee ranking. The Board noted that the performance adjustment for each year represents calculations for performance periods that differ from the periods shown in the performance charts above.
Based on its review, the Board concluded that the fund's management fee is fair and reasonable in light of the services that the fund receives and the other factors considered.
Total Expense Ratio. In its review of each class's total expense ratio, the Board considered the fund's management fee as well as other fund or class expenses, as applicable, such as transfer agent fees, pricing and bookkeeping fees, fund-paid 12b-1 fees, and custodial, legal, and audit fees. The Board also noted the effects of any waivers and reimbursements on fees and expenses, as well as the impact of the fund's performance adjustment. As part of its review, the Board also considered the current and historical total expense ratios of each class of the fund compared to competitive fund median expenses. Each class of the fund is compared to those funds and classes in the Total Mapped Group (used by the Board for management fee comparisons) that have a similar sales load structure.
The Board noted that the total expense ratio of each of Institutional Class, the retail class, and Class F ranked below its competitive median for 2010 and the total expense ratio of each of Class A, Class T, Class B, and Class C ranked above its competitive median for 2010. The Board considered that various factors, including 12b-1 fees, positive or negative performance adjustments, and relatively higher other expenses in the case of small fund size, can affect total expense ratios. The Board noted that the total expense ratio of Class T was above the competitive median primarily because of higher 12b-1 fees on Class T. Class T has a higher 12b-1 fee, but a lower front-end sales charge, than traditionally priced front-end sales charge classes. The Board noted that the fund offers multiple classes, each of which has a different sales load and 12b-1 fee structure, and that the multiple structures are intended to offer a range of pricing options for the intermediary market. The Board also noted that the total expense ratios of the classes vary primarily by the level of their 12b-1 fees, although differences in transfer agent fees may also cause expenses to vary from class to class.
Annual Report
Board Approval of Investment Advisory Contracts and
Management Fees - continued
Fees Charged to Other Fidelity Clients. The Board also considered Fidelity fee structures and other information with respect to clients of FMR and its affiliates, such as other mutual funds advised or subadvised by FMR or its affiliates, pension plan clients, and other institutional clients. In March 2010, the Board created an ad hoc joint committee with the board of other Fidelity funds (the Committee) to review and compare Fidelity's institutional investment advisory business with its business of providing services to the Fidelity funds, including the differences in services provided, fees charged, and costs incurred, as well as competition in their respective marketplaces.
Based on its review of total expense ratios and fees charged to other Fidelity clients, the Board concluded that the total expense ratio of each class of the fund was reasonable, although in some cases above the median of the universe presented for comparison, in light of the services that the fund and its shareholders receive and the other factors considered, including the findings of the Committee.
Costs of the Services and Profitability. The Board considered the revenues earned and the expenses incurred by Fidelity in conducting the business of developing, marketing, distributing, managing, administering and servicing the fund and its shareholders. The Board also considered the level of Fidelity's profits in respect of all the Fidelity funds.
On an annual basis, FMR presents to the Board Fidelity's profitability for the fund. Fidelity calculates the profitability for each fund, as well as aggregate profitability for groups of Fidelity funds and all Fidelity funds, using a series of detailed revenue and cost allocation methodologies which originate with the books and records of Fidelity on which Fidelity's audited financial statements are based. The Audit Committee of the Board reviews any significant changes from the prior year's methodologies.
PricewaterhouseCoopers LLP (PwC), independent registered public accounting firm and auditor to Fidelity and certain Fidelity funds, has been engaged annually by the Board as part of the Board's assessment of Fidelity's profitability analysis. PwC's engagement includes the review and assessment of Fidelity's methodologies used in determining the revenues and expenses attributable to Fidelity's mutual fund business, and completion of agreed-upon procedures surrounding the mathematical accuracy of fund profitability and its conformity to allocation methodologies. After considering PwC's reports issued under the engagement and information provided by Fidelity, the Board concluded that while other allocation methods may also be reasonable, Fidelity's profitability methodologies are reasonable in all material respects.
Annual Report
The Board also reviewed Fidelity's non-fund businesses and fall-out benefits related to the mutual fund business as well as cases where Fidelity's affiliates may benefit from or be related to the fund's business.
The Board considered the costs of the services provided by and the profits realized by Fidelity in connection with the operation of the fund and was satisfied that the profitability was not excessive in the circumstances.
Economies of Scale. The Board considered whether there have been economies of scale in respect of the management of the Fidelity funds, whether the Fidelity funds (including the fund) have appropriately benefited from any such economies of scale, and whether there is potential for realization of any further economies of scale. The Board considered the extent to which the fund will benefit from economies of scale through increased services to the fund, through waivers or reimbursements, or through fee or expense reductions. The Board also noted that in 2009, it and the board of other Fidelity funds created an ad hoc committee (the Economies of Scale Committee) to analyze whether FMR attains economies of scale in respect of the management and servicing of the Fidelity funds, whether the Fidelity funds have appropriately benefited from such economies of scale, and whether there is potential for realization of any further economies of scale.
The Board recognized that the fund's management contract incorporates a "group fee" structure, which provides for lower group fee rates as total fund assets under FMR's management increase, and for higher group fee rates as total fund assets under FMR's management decrease. FMR calculates the group fee rates based on a tiered asset "breakpoint" schedule that varies based on asset class. The Board considered that the group fee is designed to deliver the benefits of economies of scale to fund shareholders when total Fidelity fund assets increase, even if assets of any particular fund are unchanged or have declined, because some portion of Fidelity's costs are attributable to services provided to all Fidelity funds, and all funds benefit if those costs can be allocated among more assets. The Board concluded that, given the group fee structure, fund shareholders will benefit from lower management fees as assets under FMR's management increase at the fund complex level, regardless of whether Fidelity achieves any such economies of scale.
The Board concluded, taking into account the analysis of the Economies of Scale Committee, that any potential economies of scale are being appropriately shared between fund shareholders and Fidelity.
Annual Report
Board Approval of Investment Advisory Contracts and
Management Fees - continued
Additional Information Requested by the Board. In order to develop fully the factual basis for consideration of the Fidelity funds' Advisory Contracts, the Board requested and received additional information on certain topics, including (i) fund performance trends, actions to be taken by FMR to improve certain funds' overall performance, and Fidelity's long-term strategies for certain funds; (ii) portfolio manager changes that have occurred during the past year and length of portfolio manager tenure for different categories of funds over time; (iii) Fidelity's compensation structure for portfolio managers and other key personnel and strategies for attracting and retaining non-investment personnel; (iv) the amount of the investment that each portfolio manager has made in the Fidelity fund(s) that he or she manages; (v) historical trends in Fidelity's realization of fall-out benefits; (vi) Fidelity's group fee structures and the rationale for the individual fee rates of certain funds; (vii) fund profitability methodology and the impact of certain factors on fund profitability results; (viii) trends regarding industry use of performance fee structures and Fidelity's compliance practices with respect to performance adjustment calculations; (ix) the fee structures in place for certain other Fidelity clients; and (x) explanations regarding the relative total expense ratios of certain funds and classes, total expense competitive trends, and actions that might be taken by FMR to reduce total expense ratios for certain funds and classes.
Based on its evaluation of all of the conclusions noted above, and after considering all factors it believed relevant, the Board ultimately concluded that the advisory fee structures are fair and reasonable, and that the fund's Advisory Contracts should be renewed.
Annual Report
Investment Adviser
Fidelity Management & Research Company
Boston, MA
Investment Sub-Advisers
FMR Co., Inc.
Fidelity Management & Research
(U.K.) Inc.
Fidelity Management & Research
(Hong Kong) Limited
Fidelity Management & Research
(Japan) Inc.
General Distributor
Fidelity Distributors Corporation
Boston, MA
Transfer and Service Agents
Fidelity Investments Institutional
Operations Company, Inc.
Boston, MA
Fidelity Service Company, Inc.
Boston, MA
Custodian
Citibank, N.A.
New York, NY
ASCV-UANN-0911
1.803731.106
(Fidelity Investment logo)(registered trademark)
Fidelity Advisor®
Small Cap Value
Fund - Institutional Class
Annual Report
July 31, 2011
(2_fidelity_logos) (Registered_Trademark)
Institutional Class
is a class of Fidelity®
Small Cap Value Fund
Contents
Chairman's Message | <Click Here> | The Chairman's message to shareholders. |
Performance | <Click Here> | How the fund has done over time. |
Management's Discussion of Fund Performance | <Click Here> | The Portfolio Manager's review of fundperformance and strategy. |
Shareholder Expense Example | <Click Here> | An example of shareholder expenses. |
Investment Changes | <Click Here> | A summary of major shifts in the fund's investments over the past six months. |
Investments | <Click Here> | A complete list of the fund's investments with their market values. |
Financial Statements | <Click Here> | Statements of assets and liabilities, operations, and changes in net assets,
as well as financial highlights. |
Notes | <Click Here> | Notes to the financial statements. |
Report of Independent Registered Public Accounting Firm | <Click Here> | |
Trustees and Officers | <Click Here> | |
Distributions | <Click Here> | |
Board Approval of Investment Advisory Contracts and Management Fees | <Click Here> | |
To view a fund's proxy voting guidelines and proxy voting record for the 12-month period ended June 30, visit http://www.fidelity.com/proxyvotingresults or visit the Securities and Exchange Commission's (SEC) web site at http://www.sec.gov. You may also call 1-877-208-0098 to request a free copy of the proxy voting guidelines.
Standard & Poor's, S&P and S&P 500 are registered service marks of The McGraw-Hill Companies, Inc. and have been licensed for use by Fidelity Distributors Corporation.
Other third party marks appearing herein are the property of their respective owners.
All other marks appearing herein are registered or unregistered trademarks or service marks of FMR LLC or an affiliated company.
Annual Report
This report and the financial statements contained herein are submitted for the general information of the shareholders of the fund. This report is not authorized for distribution to prospective investors in the fund unless preceded or accompanied by an effective prospectus.
A fund files its complete schedule of portfolio holdings with the SEC for the first and third quarters of each fiscal year on Form N-Q. Forms N-Q are available on the SEC's web site at http://www.sec.gov. A fund's Forms N-Q may be reviewed and copied at the SEC's Public Reference Room in Washington, DC. Information regarding the operation of the SEC's Public Reference Room may be obtained by calling 1-800-SEC-0330. For a complete list of a fund's portfolio holdings, view the most recent holdings listing, semiannual report, or annual report on Fidelity's web site at http://www.fidelity.com, http://www.advisor.fidelity.com, or http://www.401k.com, as applicable.
NOT FDIC INSURED • MAY LOSE VALUE • NO BANK GUARANTEE
Neither the fund nor Fidelity Distributors Corporation is a bank.
Annual Report
(photo_of_James_C_Curvey)
Dear Shareholder:
The second half of 2011 began with U.S. equities continuing to give back some of the gains achieved earlier in the year. In the days leading up to July 31, markets were shaken by a political stalemate in which Congress struggled to address the debt ceiling issue before an early-August deadline. The resulting uncertainty held back markets in July, the third consecutive monthly decline for equities, effectively reversing the positive momentum seen through the end of April. Financial markets are always unpredictable, of course, but there are several time-tested investment principles that can help put the odds in your favor.
One of the basic tenets is to invest for the long term. Over time, riding out the markets' inevitable ups and downs has proven much more effective than selling into panic or chasing the hottest trend. Even missing only a few of the markets' best days can significantly diminish investor returns. Patience also affords the benefits of compounding - of earning interest on additional income or reinvested dividends and capital gains. There can be tax advantages and cost benefits to consider as well. While staying the course doesn't eliminate risk, it can considerably lessen the effect of short-term declines.
You can further manage your investing risk through diversification. And today, more than ever, geographic diversification should be taken into account. Studies indicate that asset allocation is the single most important determinant of a portfolio's long-term success. The right mix of stocks, bonds and cash - aligned to your particular risk tolerance and investment objective - is very important. Age-appropriate rebalancing is also an essential aspect of asset allocation. For younger investors, an emphasis on equities - which historically have been the best-performing asset class over time - is encouraged. As investors near their specific goal, such as retirement or sending a child to college, consideration may be given to replacing volatile assets (e.g. common stocks) with more-stable fixed investments (bonds or savings plans).
A third principle - investing regularly - can help lower the average cost of your purchases. Investing a certain amount of money each month or quarter helps ensure you won't pay for all your shares at market highs. This strategy - known as dollar cost averaging - also reduces "emotion" from investing, helping shareholders avoid selling weak performers just prior to an upswing, or chasing a hot performer just before a correction.
We invite you to contact us via the Internet, through our Investor Centers or by phone. It is our privilege to provide you the information you need to make the investments that are right for you.
Sincerely,
(The acting chairman's signature appears here.)
James C. Curvey
Acting Chairman
Annual Report
Average annual total return reflects the change in the value of an investment, assuming reinvestment of the class' distributions from dividend income and capital gains (the profits earned upon the sale of securities that have grown in value, if any) and assuming a constant rate of performance each year. The $10,000 table and the fund's returns do not reflect the deduction of taxes that a shareholder would pay on fund distributions or the redemption of fund shares. During periods of reimbursement by Fidelity, a fund's total return will be greater than it would be had the reimbursement not occurred. How a fund did yesterday is no guarantee of how it will do tomorrow.
Average Annual Total Returns
Periods ended July 31, 2011 | Past 1
year | Past 5
years | Life of
fundA |
Institutional Class | 17.02% | 6.14% | 9.41% |
A From November 3, 2004.
$10,000 Over Life of Fund
Let's say hypothetically that $10,000 was invested in Fidelity Advisor® Small Cap Value Fund - Institutional Class on November 3, 2004, when the fund started. The chart shows how the value of your investment would have changed, and also shows how the Russell 2000® Value Index performed over the same period.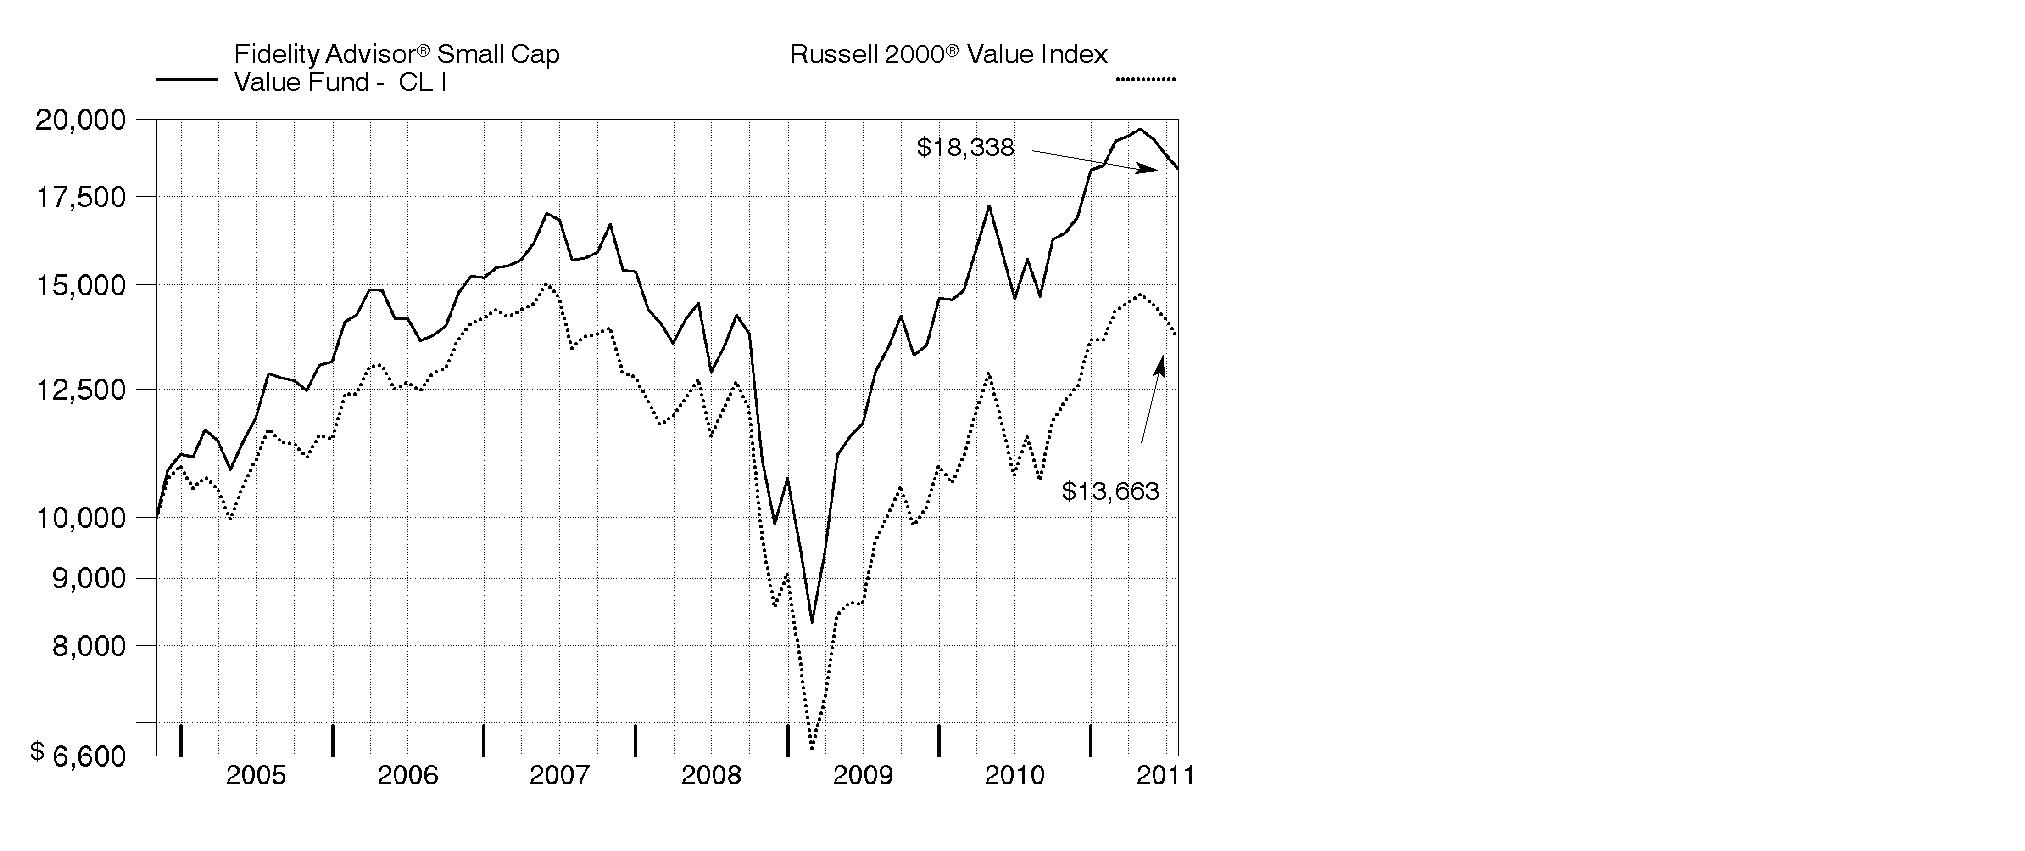
Annual Report
Market Recap: U.S. stocks registered solid double-digit gains for the 12 months ending July 31, 2011, extending a rally that began more than two years earlier. Despite a rough start in August 2010, markets turned positive in September, as increased demand for capital goods and other upbeat indicators trumped investor worry about a U.S. recessionary relapse. The broad market, as measured by the S&P 500® Index, rose 9% that month, its biggest September gain in 71 years. Seven more monthly advances followed, fueled by encouraging corporate earnings and economic activity. However, volatility picked up in the period's latter months, as markets reacted to continued high U.S. unemployment, nagging debt troubles in Europe and looming legislative battles over the federal debt ceiling. May unemployment rose above 9% for the first time in 2011, contributing to a traditional "June swoon" for stocks. Market uncertainty lingered in July, when the S&P 500® posted its second-biggest monthly loss of the period. For the full year, the S&P 500® climbed 19.65%, while the blue-chip-laden Dow Jones Industrial AverageSM rose a comparable 19.09% and the technology-heavy Nasdaq Composite® Index gained 23.40%. On the capitalization spectrum, stocks of mid-cap companies fared best, with the Russell Midcap® Index rising 24.51% and the small-cap Russell 2000® Index adding 23.92%.
Comments from Charles Myers, Portfolio Manager of Fidelity Advisor® Small Cap Value Fund: For the year, the fund's Class A, Class T, Class B and Class C shares returned 16.72%, 16.36%, 15.80% and 15.91%, respectively (excluding sales charges), versus 18.55% for the Russell 2000® Value Index. The consumer discretionary sector hurt performance, mainly due to poor stock selection in the consumer services and durables/apparel industries. An overweighting in the latter group also detracted. Another source of weakness was the financials sector, particularly banks and insurance stocks - including banks TCF Financial and Astoria Financial and reinsurer Platinum Underwriters Holdings - whose underperformance outweighed the favorable impact of my picks in the diversified financials industry. Banks were hurt by weak loan growth, while reinsurance companies were hampered by payouts for several costly disasters. Other detractors included commercial furniture maker HNI and homebuilder M.D.C. Holdings. On the positive side, stock selection in energy was very strong, led by Berry Petroleum and Superior Energy Services, both of which benefited from high oil prices. Positioning in industrials also helped, especially an investment in electrical distributor WESCO International. In health care, TeamHealth Holdings did very well. Many of the stocks I've mentioned were not in the index.
Comments from Charles Myers, Portfolio Manager of Fidelity Advisor® Small Cap Value Fund: For the year, the fund's Institutional Class shares returned 17.02%, versus 18.55% for the Russell 2000® Value Index. The consumer discretionary sector hurt performance, mainly due to poor stock selection in the consumer services and durables/apparel industries. An overweighting in the latter group also detracted. Another source of weakness was the financials sector, particularly banks and insurance stocks - including banks TCF Financial and Astoria Financial and reinsurer Platinum Underwriters Holdings - whose underperformance outweighed the favorable impact of my picks in the diversified financials industry. Banks were hurt by weak loan growth, while reinsurance companies were hampered by payouts for several costly disasters. Other detractors included commercial furniture maker HNI and homebuilder M.D.C. Holdings. On the positive side, stock selection in energy was very strong, led by Berry Petroleum and Superior Energy Services, both of which benefited from high oil prices. Positioning in industrials also helped, especially an investment in electrical distributor WESCO International. In health care, TeamHealth Holdings did very well. Many of the stocks I've mentioned were not in the index.
Annual Report
The views expressed above reflect those of the portfolio manager(s) only through the end of the period as stated on the cover of this report and do not necessarily represent the views of Fidelity or any other person in the Fidelity organization. Any such views are subject to change at any time based upon market or other conditions and Fidelity disclaims any responsibility to update such views. These views may not be relied on as investment advice and, because investment decisions for a Fidelity fund are based on numerous factors, may not be relied on as an indication of trading intent on behalf of any Fidelity fund.
Annual Report
Shareholder Expense Example
As a shareholder of the Fund, you incur two types of costs: (1) transaction costs, including sales charges (loads) on purchase payments or redemption proceeds, redemption fees, and (2) ongoing costs, including management fees, distribution and/or service (12b-1) fees and other Fund expenses. This Example is intended to help you understand your ongoing costs (in dollars) of investing in the Fund and to compare these costs with the ongoing costs of investing in other mutual funds.
The Example is based on an investment of $1,000 invested at the beginning of the period and held for the entire period (February 1, 2011 to July 31, 2011).
Actual Expenses
The first line of the accompanying table for each class of the Fund provides information about actual account values and actual expenses. You may use the information in this line, together with the amount you invested, to estimate the expenses that you paid over the period. Simply divide your account value by $1,000.00 (for example, an $8,600 account value divided by $1,000.00 = 8.6), then multiply the result by the number in the first line for a class of the Fund under the heading entitled "Expenses Paid During Period" to estimate the expenses you paid on your account during this period. A small balance maintenance fee of $12.00 that is charged once a year may apply for certain accounts with a value of less than $2,000. This fee is not included in the table below. If it was, the estimate of expenses you paid during the period would be higher, and your ending account value lower, by this amount. In addition, the Fund, as a shareholder in the underlying Fidelity Central Funds, will indirectly bear its pro-rata share of the fees and expenses incurred by the underlying Fidelity Central Funds. These fees and expenses are not included in the Fund's annualized expense ratio used to calculate the expense estimate in the table below.
Hypothetical Example for Comparison Purposes
The second line of the accompanying table for each class of the Fund provides information about hypothetical account values and hypothetical expenses based on a Class' actual expense ratio and an assumed rate of return of 5% per year before expenses, which is not the Class' actual return. The hypothetical account values and expenses may not be used to estimate the actual ending account balance or expenses you paid for the period. You may use this information to compare the ongoing costs of investing in the Fund and other funds. To do so, compare this 5% hypothetical example with the 5% hypothetical examples that appear in the shareholder reports of the other funds. A small balance maintenance fee of $12.00 that is charged once a year may apply for certain accounts with a value of less than $2,000. This fee is not included in the table below. If it was, the estimate of expenses you paid during the period would be higher, and your ending account value lower, by this amount. In addition, the Fund, as a shareholder in the underlying Fidelity Central Funds, will indirectly bear its pro-rata share of the fees and expenses incurred by the underlying Fidelity Central Funds. These fees and expenses are not included in the Fund's annualized expense ratio used to calculate the expense estimate in the table below.
Annual Report
Please note that the expenses shown in the table are meant to highlight your ongoing costs only and do not reflect any transaction costs. Therefore, the second line of the table is useful in comparing ongoing costs only, and will not help you determine the relative total costs of owning different funds. In addition, if these transactional costs were included, your costs would have been higher.
| Annualized
Expense
Ratio | Beginning
Account Value
February 1, 2011 | Ending
Account Value
July 31, 2011 | Expenses Paid
During Period*
February 1, 2011
to July 31, 2011 |
Class A | 1.44% | | | |
Actual | | $ 1,000.00 | $ 992.30 | $ 7.11 |
HypotheticalA | | $ 1,000.00 | $ 1,017.65 | $ 7.20 |
Class T | 1.69% | | | |
Actual | | $ 1,000.00 | $ 991.00 | $ 8.34 |
HypotheticalA | | $ 1,000.00 | $ 1,016.41 | $ 8.45 |
Class B | 2.20% | | | |
Actual | | $ 1,000.00 | $ 988.10 | $ 10.84 |
HypotheticalA | | $ 1,000.00 | $ 1,013.88 | $ 10.99 |
Class C | 2.18% | | | |
Actual | | $ 1,000.00 | $ 988.80 | $ 10.75 |
HypotheticalA | | $ 1,000.00 | $ 1,013.98 | $ 10.89 |
Small Cap Value | 1.11% | | | |
Actual | | $ 1,000.00 | $ 993.60 | $ 5.49 |
HypotheticalA | | $ 1,000.00 | $ 1,019.29 | $ 5.56 |
Class F | .88% | | | |
Actual | | $ 1,000.00 | $ 994.30 | $ 4.35 |
HypotheticalA | | $ 1,000.00 | $ 1,020.43 | $ 4.41 |
Institutional Class | 1.10% | | | |
Actual | | $ 1,000.00 | $ 993.60 | $ 5.44 |
HypotheticalA | | $ 1,000.00 | $ 1,019.34 | $ 5.51 |
A 5% return per year before expenses
* Expenses are equal to each Class' annualized expense ratio, multiplied by the average account value over the period, multiplied by 181/365 (to reflect the one-half year period).
Annual Report
Investment Changes (Unaudited)
Top Ten Stocks as of July 31, 2011 |
| % of fund's
net assets | % of fund's net assets
6 months ago |
Berry Petroleum Co. Class A | 3.4 | 3.4 |
DCT Industrial Trust, Inc. | 3.0 | 2.7 |
Superior Energy Services, Inc. | 2.8 | 3.3 |
WESCO International, Inc. | 2.7 | 3.3 |
MEDNAX, Inc. | 2.7 | 1.8 |
Highwoods Properties, Inc. (SBI) | 2.6 | 2.4 |
UGI Corp. | 2.6 | 2.6 |
United Stationers, Inc. | 2.5 | 2.3 |
TCF Financial Corp. | 2.4 | 2.8 |
Regis Corp. | 2.4 | 1.5 |
| 27.1 | |
Top Five Market Sectors as of July 31, 2011 |
| % of fund's
net assets | % of fund's net assets
6 months ago |
Financials | 35.2 | 37.0 |
Industrials | 12.5 | 13.0 |
Consumer Discretionary | 11.9 | 10.7 |
Information Technology | 11.6 | 9.2 |
Health Care | 8.3 | 7.1 |
Asset Allocation (% of fund's net assets) |
As of July 31, 2011* | As of January 31, 2011** |
| Stocks 99.7% | | | Stocks 99.1% | |
| Short-Term
Investments and
Net Other Assets 0.3% | | | Short-Term
Investments and
Net Other Assets 0.9% | |
* Foreign investments | 8.3% | | ** Foreign investments | 9.9% | |

Annual Report
Investments July 31, 2011
Showing Percentage of Net Assets
Common Stocks - 98.4% |
| Shares | | Value |
CONSUMER DISCRETIONARY - 11.4% |
Diversified Consumer Services - 3.4% |
Matthews International Corp. Class A | 740,187 | | $ 26,787,368 |
Regis Corp. (d)(e) | 4,045,824 | | 60,080,486 |
| | 86,867,854 |
Household Durables - 4.7% |
M.D.C. Holdings, Inc. (d)(e) | 2,424,300 | | 54,813,423 |
Meritage Homes Corp. (a) | 1,536,160 | | 33,565,096 |
Ryland Group, Inc. (d) | 2,153,837 | | 31,726,019 |
| | 120,104,538 |
Specialty Retail - 3.3% |
Asbury Automotive Group, Inc. (a) | 1,465,159 | | 31,544,873 |
Ascena Retail Group, Inc. (a) | 960,700 | | 31,049,824 |
Tsutsumi Jewelry Co. Ltd. | 791,400 | | 20,081,910 |
| | 82,676,607 |
TOTAL CONSUMER DISCRETIONARY | | 289,648,999 |
CONSUMER STAPLES - 2.9% |
Food & Staples Retailing - 0.4% |
Ingles Markets, Inc. Class A (e) | 664,024 | | 10,225,970 |
Food Products - 2.5% |
Chiquita Brands International, Inc. (a) | 2,070,900 | | 24,519,456 |
Dean Foods Co. (a) | 3,500,000 | | 38,570,000 |
| | 63,089,456 |
TOTAL CONSUMER STAPLES | | 73,315,426 |
ENERGY - 6.2% |
Energy Equipment & Services - 2.8% |
Superior Energy Services, Inc. (a) | 1,741,700 | | 72,263,133 |
Oil, Gas & Consumable Fuels - 3.4% |
Berry Petroleum Co. Class A | 1,500,000 | | 86,025,000 |
TOTAL ENERGY | | 158,288,133 |
FINANCIALS - 34.4% |
Capital Markets - 2.6% |
Knight Capital Group, Inc. Class A (a) | 2,029,826 | | 22,957,332 |
Waddell & Reed Financial, Inc. Class A | 1,210,000 | | 44,407,000 |
| | 67,364,332 |
Common Stocks - continued |
| Shares | | Value |
FINANCIALS - continued |
Commercial Banks - 10.8% |
Associated Banc-Corp. | 3,832,650 | | $ 52,315,673 |
CapitalSource, Inc. | 6,515,270 | | 42,088,644 |
City National Corp. | 784,900 | | 42,133,432 |
National Penn Bancshares, Inc. | 3,766,604 | | 30,283,496 |
PacWest Bancorp (e) | 1,857,600 | | 36,873,360 |
TCF Financial Corp. (d) | 4,855,800 | | 61,765,776 |
Western Liberty Bancorp (a)(e) | 2,400,000 | | 7,248,000 |
| | 272,708,381 |
Insurance - 7.2% |
Alterra Capital Holdings Ltd. | 2,357,411 | | 51,367,986 |
Aspen Insurance Holdings Ltd. | 1,320,200 | | 34,193,180 |
Platinum Underwriters Holdings Ltd. | 1,576,975 | | 54,169,091 |
ProAssurance Corp. (a) | 600,000 | | 41,790,000 |
| | 181,520,257 |
Real Estate Investment Trusts - 9.3% |
Alexandria Real Estate Equities, Inc. | 219,100 | | 17,966,200 |
American Assets Trust, Inc. | 225,200 | | 4,952,148 |
DCT Industrial Trust, Inc. (d)(e) | 13,830,586 | | 74,961,776 |
Franklin Street Properties Corp. (d) | 3,160,000 | | 39,847,600 |
Highwoods Properties, Inc. (SBI) (d) | 1,940,330 | | 66,805,562 |
National Retail Properties, Inc. (d) | 1,240,000 | | 31,111,600 |
| | 235,644,886 |
Thrifts & Mortgage Finance - 4.5% |
Astoria Financial Corp. | 4,818,152 | | 56,131,471 |
Washington Federal, Inc. | 3,486,175 | | 58,951,219 |
| | 115,082,690 |
TOTAL FINANCIALS | | 872,320,546 |
HEALTH CARE - 8.3% |
Health Care Providers & Services - 8.3% |
Centene Corp. (a) | 1,324,832 | | 43,467,738 |
Chemed Corp. | 510,200 | | 31,025,262 |
MEDNAX, Inc. (a) | 981,500 | | 66,899,040 |
Providence Service Corp. (a)(e) | 1,016,495 | | 12,045,466 |
Team Health Holdings, Inc. (a) | 2,565,700 | | 56,471,057 |
| | 209,908,563 |
Common Stocks - continued |
| Shares | | Value |
INDUSTRIALS - 12.5% |
Commercial Services & Supplies - 6.3% |
ACCO Brands Corp. (a) | 2,420,000 | | $ 20,739,400 |
HNI Corp. (d)(e) | 2,349,671 | | 49,131,621 |
Knoll, Inc. | 1,412,898 | | 25,785,389 |
United Stationers, Inc. | 1,980,800 | | 63,563,872 |
| | 159,220,282 |
Machinery - 2.3% |
Blount International, Inc. (a)(e) | 2,604,723 | | 43,316,543 |
Columbus McKinnon Corp. (NY Shares) (a) | 960,000 | | 15,792,000 |
| | 59,108,543 |
Trading Companies & Distributors - 3.9% |
H&E Equipment Services, Inc. (a)(e) | 2,439,408 | | 29,272,896 |
WESCO International, Inc. (a) | 1,350,000 | | 68,431,500 |
| | 97,704,396 |
TOTAL INDUSTRIALS | | 316,033,221 |
INFORMATION TECHNOLOGY - 11.6% |
Communications Equipment - 1.4% |
ViaSat, Inc. (a) | 809,472 | | 36,369,577 |
Electronic Equipment & Components - 6.4% |
Ingram Micro, Inc. Class A (a) | 2,753,100 | | 51,070,005 |
Macnica, Inc. | 677,400 | | 16,168,178 |
Ryoyo Electro Corp. (e) | 1,972,700 | | 19,684,709 |
SYNNEX Corp. (a) | 675,710 | | 19,136,107 |
Tech Data Corp. (a) | 1,189,600 | | 55,518,632 |
| | 161,577,631 |
Internet Software & Services - 1.8% |
DealerTrack Holdings, Inc. (a) | 1,083,804 | | 25,133,415 |
j2 Global Communications, Inc. | 730,149 | | 19,524,184 |
| | 44,657,599 |
Semiconductors & Semiconductor Equipment - 0.6% |
Miraial Co. Ltd. (e) | 720,200 | | 15,046,860 |
Software - 1.4% |
Monotype Imaging Holdings, Inc. (a)(e) | 2,583,700 | | 35,396,690 |
TOTAL INFORMATION TECHNOLOGY | | 293,048,357 |
Common Stocks - continued |
| Shares | | Value |
MATERIALS - 4.7% |
Metals & Mining - 4.7% |
Carpenter Technology Corp. | 834,380 | | $ 47,926,787 |
Haynes International, Inc. (e) | 675,317 | | 42,301,857 |
RTI International Metals, Inc. (a) | 870,997 | | 27,932,874 |
| | 118,161,518 |
UTILITIES - 6.4% |
Electric Utilities - 2.2% |
Westar Energy, Inc. (d) | 2,160,000 | | 55,749,600 |
Gas Utilities - 4.2% |
Southwest Gas Corp. | 1,130,989 | | 42,174,580 |
UGI Corp. | 2,150,000 | | 65,145,000 |
| | 107,319,580 |
TOTAL UTILITIES | | 163,069,180 |
TOTAL COMMON STOCKS (Cost $2,112,389,704) | 2,493,793,943 |
Nonconvertible Preferred Stocks - 1.3% |
| | | |
CONSUMER DISCRETIONARY - 0.5% |
Household Durables - 0.5% |
M/I Homes, Inc. Series A, 9.75% (a) | 750,400 | | 12,006,400 |
FINANCIALS - 0.8% |
Real Estate Investment Trusts - 0.8% |
Developers Diversified Realty Corp. (depositary shares) Series H, 7.375% | 818,790 | | 19,953,912 |
TOTAL NONCONVERTIBLE PREFERRED STOCKS (Cost $20,354,770) | 31,960,312 |
Money Market Funds - 4.6% |
| Shares | | Value |
Fidelity Cash Central Fund, 0.14% (b) | 13,763,496 | | $ 13,763,496 |
Fidelity Securities Lending Cash Central Fund, 0.15% (b)(c) | 102,468,175 | | 102,468,175 |
TOTAL MONEY MARKET FUNDS (Cost $116,231,671) | 116,231,671 |
TOTAL INVESTMENT PORTFOLIO - 104.3% (Cost $2,248,976,145) | | 2,641,985,926 |
NET OTHER ASSETS (LIABILITIES) - (4.3)% | | (108,404,928) |
NET ASSETS - 100% | $ 2,533,580,998 |
Legend |
(a) Non-income producing |
(b) Affiliated fund that is available only to investment companies and other accounts managed by Fidelity Investments. The rate quoted is the annualized seven-day yield of the fund at period end. A complete unaudited listing of the fund's holdings as of its most recent quarter end is available upon request. In addition, each Fidelity Central Fund's financial statements, which are not covered by the Fund's Report of Independent Registered Public Accounting Firm, are available on the SEC's website or upon request. |
(c) Investment made with cash collateral received from securities on loan. |
(d) Security or a portion of the security is on loan at period end. |
(e) Affiliated company |
Affiliated Central Funds |
Information regarding fiscal year to date income earned by the Fund from investments in Fidelity Central Funds is as follows: |
Fund | Income earned |
Fidelity Cash Central Fund | $ 20,932 |
Fidelity Securities Lending Cash Central Fund | 121,080 |
Total | $ 142,012 |
Other Affiliated Issuers |
An affiliated company is a company in which the Fund has ownership of at least 5% of the voting securities. Fiscal year to date transactions with companies which are or were affiliates are as follows: |
Affiliate | Value,
beginning of
period | Purchases | Sales
Proceeds | Dividend
Income | Value,
end of
period |
ACCO Brands Corp. | $ 22,027,864 | $ 1,922,616 | $ 12,330,836 | $ - | $ - |
Blount International, Inc. | 27,740,300 | - | - | - | 43,316,543 |
Columbus McKinnon Corp. (NY Shares) | - | 19,267,200 | - | - | - |
DCT Industrial Trust, Inc. | 46,900,000 | 19,790,290 | - | 1,656,573 | 74,961,776 |
H&E Equipment Services, Inc. | 30,357,850 | - | 20,687,104 | - | 29,272,896 |
Haynes International, Inc. | - | 33,108,436 | - | 183,909 | 42,301,857 |
HNI Corp. | 55,547,499 | 5,138,794 | - | 2,048,207 | 49,131,621 |
Ingles Markets, Inc. Class A | 13,634,514 | - | 3,506,026 | 475,816 | 10,225,970 |
M.D.C. Holdings, Inc. | 35,651,616 | 32,061,128 | - | 1,524,300 | 54,813,423 |
Miraial Co. Ltd. | 15,372,473 | 3,618,630 | - | 502,071 | 15,046,860 |
Monotype Imaging Holdings, Inc. | 11,299,816 | 12,600,234 | - | - | 35,396,690 |
PacWest Bancorp | 37,552,606 | 1,164,578 | - | 73,220 | 36,873,360 |
Providence Service Corp. | 14,637,528 | - | - | - | 12,045,466 |
Regis Corp. | 41,819,783 | 36,022,139 | 15,089,522 | 575,173 | 60,080,486 |
RTI International Metals, Inc. | 48,035,903 | - | 23,272,802 | - | - |
Ryoyo Electro Corp. | 18,932,046 | 2,120,893 | - | 687,612 | 19,684,709 |
TradeStation Group, Inc. | 13,178,039 | - | 19,917,635 | - | - |
Western Liberty Bancorp | 14,976,000 | - | - | - | 7,248,000 |
Total | $ 447,663,837 | $ 166,814,938 | $ 94,803,925 | $ 7,726,881 | $ 490,399,657 |
Other Information |
All investments are categorized as Level 1 under the Fair Value Hierarchy. The inputs or methodology used for valuing securities may not be an indication of the risk associated with investing in those securities. For more information on valuation inputs, please refer to the Security Valuation section in the accompanying Notes to Financial Statements. |
See accompanying notes which are an integral part of the financial statements.
Annual Report
Statement of Assets and Liabilities
| July 31, 2011 |
| | |
Assets | | |
Investment in securities, at value (including securities loaned of $99,483,856) - See accompanying schedule: Unaffiliated issuers (cost $1,664,327,198) | $ 2,035,354,598 | |
Fidelity Central Funds (cost $116,231,671) | 116,231,671 | |
Other affiliated issuers (cost $468,417,276) | 490,399,657 | |
Total Investments (cost $2,248,976,145) | | $ 2,641,985,926 |
Receivable for investments sold | | 174,323 |
Receivable for fund shares sold | | 3,317,218 |
Dividends receivable | | 2,265,074 |
Distributions receivable from Fidelity Central Funds | | 10,990 |
Other receivables | | 49,926 |
Total assets | | 2,647,803,457 |
| | |
Liabilities | | |
Payable for investments purchased | $ 1,298,673 | |
Payable for fund shares redeemed | 7,914,722 | |
Accrued management fee | 1,855,015 | |
Distribution and service plan fees payable | 103,978 | |
Other affiliated payables | 528,715 | |
Other payables and accrued expenses | 53,181 | |
Collateral on securities loaned, at value | 102,468,175 | |
Total liabilities | | 114,222,459 |
| | |
Net Assets | | $ 2,533,580,998 |
Net Assets consist of: | | |
Paid in capital | | $ 2,012,724,102 |
Accumulated undistributed net realized gain (loss) on investments and foreign currency transactions | | 127,839,572 |
Net unrealized appreciation (depreciation) on investments and assets and liabilities in foreign currencies | | 393,017,324 |
Net Assets | | $ 2,533,580,998 |
See accompanying notes which are an integral part of the financial statements.
Annual Report
Financial Statements - continued
Statement of Assets and Liabilities - continued
| July 31, 2011 |
| | |
Calculation of Maximum Offering Price
Class A:
Net Asset Value and redemption price per share
($140,706,656 ÷ 9,092,403 shares) | | $ 15.48 |
| | |
Maximum offering price per share (100/94.25 of $15.48) | | $ 16.42 |
Class T:
Net Asset Value and redemption price per share ($55,845,206 ÷ 3,640,410 shares) | | $ 15.34 |
| | |
Maximum offering price per share (100/96.50 of $15.34) | | $ 15.90 |
Class B:
Net Asset Value and offering price per share ($8,548,930 ÷ 569,799 shares)A | | $ 15.00 |
| | |
Class C:
Net Asset Value and offering price per share ($47,457,202 ÷ 3,162,480 shares)A | | $ 15.01 |
| | |
| | |
Small Cap Value:
Net Asset Value, offering price and redemption price per share ($1,899,804,971 ÷ 121,599,609 shares) | | $ 15.62 |
| | |
Class F:
Net Asset Value, offering price and redemption price per share ($279,652,893 ÷ 17,875,122 shares) | | $ 15.64 |
| | |
Institutional Class:
Net Asset Value, offering price and redemption price per share ($101,565,140 ÷ 6,496,759 shares) | | $ 15.63 |
A Redemption price per share is equal to net asset value less any applicable contingent deferred sales charge.
See accompanying notes which are an integral part of the financial statements.
Annual Report
Statement of Operations
| Year ended July 31, 2011 |
| | |
Investment Income | | |
Dividends (including $7,726,881 earned from other affiliated issuers) | | $ 27,691,950 |
Special dividends | | 9,360,000 |
Interest | | 82 |
Income from Fidelity Central Funds | | 142,012 |
Total income | | 37,194,044 |
| | |
Expenses | | |
Management fee
Basic fee | $ 17,642,979 | |
Performance adjustment | 3,308,761 | |
Transfer agent fees | 5,701,385 | |
Distribution and service plan fees | 1,163,925 | |
Accounting and security lending fees | 761,810 | |
Custodian fees and expenses | 41,873 | |
Independent trustees' compensation | 13,098 | |
Registration fees | 144,204 | |
Audit | 59,297 | |
Legal | 9,329 | |
Interest | 1,171 | |
Miscellaneous | 25,364 | |
Total expenses before reductions | 28,873,196 | |
Expense reductions | (44,627) | 28,828,569 |
Net investment income (loss) | | 8,365,475 |
Realized and Unrealized Gain (Loss) Net realized gain (loss) on: | | |
Investment securities: | | |
Unaffiliated issuers | 159,718,329 | |
Other affiliated issuers | (4,266,450) | |
Foreign currency transactions | 29,684 | |
Total net realized gain (loss) | | 155,481,563 |
Change in net unrealized appreciation (depreciation) on: Investment securities | 203,702,039 | |
Assets and liabilities in foreign currencies | (584) | |
Total change in net unrealized appreciation (depreciation) | | 203,701,455 |
Net gain (loss) | | 359,183,018 |
Net increase (decrease) in net assets resulting from operations | | $ 367,548,493 |
See accompanying notes which are an integral part of the financial statements.
Annual Report
Financial Statements - continued
Statement of Changes in Net Assets
| Year ended
July 31,
2011 | Year ended
July 31,
2010 |
Increase (Decrease) in Net Assets | | |
Operations | | |
Net investment income (loss) | $ 8,365,475 | $ 6,962,574 |
Net realized gain (loss) | 155,481,563 | 188,495,963 |
Change in net unrealized appreciation (depreciation) | 203,701,455 | 137,333,657 |
Net increase (decrease) in net assets resulting
from operations | 367,548,493 | 332,792,194 |
Distributions to shareholders from net investment income | (16,151,065) | (6,560,137) |
Distributions to shareholders from net realized gain | (20,051,059) | - |
Total distributions | (36,202,124) | (6,560,137) |
Share transactions - net increase (decrease) | 54,629,275 | 209,101,603 |
Redemption fees | 445,888 | 534,282 |
Total increase (decrease) in net assets | 386,421,532 | 535,867,942 |
| | |
Net Assets | | |
Beginning of period | 2,147,159,466 | 1,611,291,524 |
End of period (including undistributed net investment of $0 and undistributed net investment income of $5,209,766, respectively) | $ 2,533,580,998 | $ 2,147,159,466 |
See accompanying notes which are an integral part of the financial statements.
Annual Report
Financial Highlights - Class A
Years ended July 31, | 2011 | 2010 | 2009 | 2008 | 2007 |
Selected Per-Share Data | | | | | |
Net asset value, beginning of period | $ 13.45 | $ 11.13 | $ 11.82 | $ 14.34 | $ 13.17 |
Income from Investment Operations | | | | | |
Net investment income (loss) C | .01 F | .02 G | .08 | (.01) | (.06) |
Net realized and unrealized gain (loss) | 2.22 | 2.33 | (.60) | (1.98) | 1.90 |
Total from investment operations | 2.23 | 2.35 | (.52) | (1.99) | 1.84 |
Distributions from net investment income | (.08) | (.03) | (.06) | - | - |
Distributions from net realized gain | (.12) | - | (.11) | (.53) | (.67) |
Total distributions | (.20) | (.03) | (.17) | (.53) | (.67) |
Redemption fees added to paid in capital C,I | - | - | - | - | - |
Net asset value, end of period | $ 15.48 | $ 13.45 | $ 11.13 | $ 11.82 | $ 14.34 |
Total Return A,B | 16.72% | 21.16% | (4.37)% | (14.35)% | 14.59% |
Ratios to Average Net Assets D,H | | | | | |
Expenses before reductions | 1.44% | 1.47% | 1.45% | 1.43% | 1.45% |
Expenses net of fee waivers, if any | 1.43% | 1.40% | 1.40% | 1.40% | 1.40% |
Expenses net of all reductions | 1.43% | 1.39% | 1.40% | 1.40% | 1.40% |
Net investment income (loss) | .06% F | .17% G | .81% | (.05)% | (.44)% |
Supplemental Data | | | | | |
Net assets, end of period (000 omitted) | $ 140,707 | $ 96,994 | $ 55,029 | $ 52,446 | $ 61,357 |
Portfolio turnover rate E | 22% | 49% | 51% | 149% | 67% |
A Total returns would have been lower if certain expenses had not been reduced during the applicable periods shown.
B Total returns do not include the effect of the sales charges.
C Calculated based on average shares outstanding during the period.
D Fees and expenses of any underlying Fidelity Central Funds are not included in the Fund's expense ratio. The Fund indirectly bears its proportionate share of the expenses of any underlying Fidelity Central Funds.
E Amount does not include the portfolio activity of any underlying Fidelity Central Funds.
F Investment income per share reflects a special dividend which amounted to $.06 per share. Excluding the special dividend, the ratio of net investment income (loss) to average net assets would have been (.31)%.
G Investment income per share reflects a special dividend which amounted to $.03 per share. Excluding the special dividend, the ratio of net investment income (loss) to average net assets would have been (.10)%.
H Expense ratios reflect operating expenses of the class. Expenses before reductions do not reflect amounts reimbursed by the investment adviser or reductions from brokerage service arrangements or reductions from other expense offset arrangements and do not represent the amount paid by the class during periods when reimbursements or reductions occur. Expenses net of fee waivers reflect expenses after reimbursement by the investment adviser but prior to reductions from brokerage service arrangements or other expense offset arrangements. Expenses net of all reductions represent the net expenses paid by the class.
I Amount represents less than $.01 per share.
See accompanying notes which are an integral part of the financial statements.
Annual Report
Financial Highlights - Class T
Years ended July 31, | 2011 | 2010 | 2009 | 2008 | 2007 |
Selected Per-Share Data | | | | | |
Net asset value, beginning of period | $ 13.34 | $ 11.05 | $ 11.74 | $ 14.28 | $ 13.13 |
Income from Investment Operations | | | | | |
Net investment income (loss) C | (.03) F | (.01) G | .05 | (.04) | (.10) |
Net realized and unrealized gain (loss) | 2.20 | 2.31 | (.59) | (1.97) | 1.90 |
Total from investment operations | 2.17 | 2.30 | (.54) | (2.01) | 1.80 |
Distributions from net investment income | (.05) | (.01) | (.04) | - | - |
Distributions from net realized gain | (.12) | - | (.11) | (.53) | (.65) |
Total distributions | (.17) | (.01) | (.15) | (.53) | (.65) |
Redemption fees added to paid in capital C,I | - | - | - | - | - |
Net asset value, end of period | $ 15.34 | $ 13.34 | $ 11.05 | $ 11.74 | $ 14.28 |
Total ReturnA,B | 16.36% | 20.87% | (4.57)% | (14.58)% | 14.34% |
Ratios to Average Net Assets D,H | | | | | |
Expenses before reductions | 1.70% | 1.72% | 1.70% | 1.68% | 1.66% |
Expenses net of fee waivers, if any | 1.69% | 1.65% | 1.65% | 1.65% | 1.65% |
Expenses net of all reductions | 1.69% | 1.64% | 1.65% | 1.65% | 1.65% |
Net investment income (loss) | (.19)% F | (.08)% G | .56% | (.30)% | (.69)% |
Supplemental Data | | | | | |
Net assets, end of period (000 omitted) | $ 55,845 | $ 44,091 | $ 28,534 | $ 32,091 | $ 51,518 |
Portfolio turnover rate E | 22% | 49% | 51% | 149% | 67% |
A Total returns would have been lower if certain expenses had not been reduced during the applicable periods shown.
B Total returns do not include the effect of the sales charges.
C Calculated based on average shares outstanding during the period.
D Fees and expenses of any underlying Fidelity Central Funds are not included in the Fund's expense ratio. The Fund indirectly bears its proportionate share of the expenses of any underlying Fidelity Central Funds.
E Amount does not include the portfolio activity of any underlying Fidelity Central Funds.
F Investment income per share reflects a special dividend which amounted to $.06 per share. Excluding the special dividend, the ratio of net investment income (loss) to average net assets would have been (.57)%.
G Investment income per share reflects a special dividend which amounted to $.03 per share. Excluding the special dividend, the ratio of net investment income (loss) to average net assets would have been (.35)%.
H Expense ratios reflect operating expenses of the class. Expenses before reductions do not reflect amounts reimbursed by the investment adviser or reductions from brokerage service arrangements or reductions from other expense offset arrangements and do not represent the amount paid by the class during periods when reimbursements or reductions occur. Expenses net of fee waivers reflect expenses after reimbursement by the investment adviser but prior to reductions from brokerage service arrangements or other expense offset arrangements. Expenses net of all reductions represent the net expenses paid by the class.
I Amount represents less than $.01 per share.
See accompanying notes which are an integral part of the financial statements.
Annual Report
Financial Highlights - Class B
Years ended July 31, | 2011 | 2010 | 2009 | 2008 | 2007 |
Selected Per-Share Data | | | | | |
Net asset value, beginning of period | $ 13.08 | $ 10.88 | $ 11.60 | $ 14.19 | $ 13.07 |
Income from Investment Operations | | | | | |
Net investment income (loss) C | (.10) F | (.07) G | .01 | (.10) | (.17) |
Net realized and unrealized gain (loss) | 2.15 | 2.27 | (.59) | (1.96) | 1.90 |
Total from investment operations | 2.05 | 2.20 | (.58) | (2.06) | 1.73 |
Distributions from net investment income | (.01) | - | (.03) | - | - |
Distributions from net realized gain | (.12) | - | (.11) | (.53) | (.61) |
Total distributions | (.13) | - | (.14) | (.53) | (.61) |
Redemption fees added to paid in capital C,I | - | - | - | - | - |
Net asset value, end of period | $ 15.00 | $ 13.08 | $ 10.88 | $ 11.60 | $ 14.19 |
Total Return A,B | 15.80% | 20.22% | (5.05)% | (15.04)% | 13.78% |
Ratios to Average Net Assets D,H | | | | | |
Expenses before reductions | 2.20% | 2.22% | 2.20% | 2.18% | 2.20% |
Expenses net of fee waivers, if any | 2.19% | 2.15% | 2.15% | 2.15% | 2.15% |
Expenses net of all reductions | 2.19% | 2.14% | 2.15% | 2.15% | 2.15% |
Net investment income (loss) | (.69)% F | (.58)% G | .06% | (.80)% | (1.19)% |
Supplemental Data | | | | | |
Net assets, end of period (000 omitted) | $ 8,549 | $ 9,747 | $ 7,153 | $ 7,886 | $ 12,075 |
Portfolio turnover rate E | 22% | 49% | 51% | 149% | 67% |
A Total returns would have been lower if certain expenses had not been reduced during the applicable periods shown.
B Total returns do not include the effect of the contingent deferred sales charge.
C Calculated based on average shares outstanding during the period.
D Fees and expenses of any underlying Fidelity Central Funds are not included in the Fund's expense ratio. The Fund indirectly bears its proportionate share of the expenses of any underlying Fidelity Central Funds.
E Amount does not include the portfolio activity of any underlying Fidelity Central Funds.
F Investment income per share reflects a special dividend which amounted to $.06 per share. Excluding the special dividend, the ratio of net investment income (loss) to average net assets would have been (1.07)%.
G Investment income per share reflects a special dividend which amounted to $.03 per share. Excluding the special dividend, the ratio of net investment income (loss) to average net assets would have been (.85)%.
H Expense ratios reflect operating expenses of the class. Expenses before reductions do not reflect amounts reimbursed by the investment adviser or reductions from brokerage service arrangements or reductions from other expense offset arrangements and do not represent the amount paid by the class during periods when reimbursements or reductions occur. Expenses net of fee waivers reflect expenses after reimbursement by the investment adviser but prior to reductions from brokerage service arrangements or other expense offset arrangements. Expenses net of all reductions represent the net expenses paid by the class.
I Amount represents less than $.01 per share.
See accompanying notes which are an integral part of the financial statements.
Annual Report
Financial Highlights - Class C
Years ended July 31, | 2011 | 2010 | 2009 | 2008 | 2007 |
Selected Per-Share Data | | | | | |
Net asset value, beginning of period | $ 13.08 | $ 10.89 | $ 11.60 | $ 14.19 | $ 13.07 |
Income from Investment Operations | | | | | |
Net investment income (loss) C | (.10) F | (.07) G | .01 | (.10) | (.17) |
Net realized and unrealized gain (loss) | 2.17 | 2.26 | (.58) | (1.96) | 1.90 |
Total from investment operations | 2.07 | 2.19 | (.57) | (2.06) | 1.73 |
Distributions from net investment income | (.02) | - | (.03) | - | - |
Distributions from net realized gain | (.12) | - | (.11) | (.53) | (.61) |
Total distributions | (.14) | - | (.14) | (.53) | (.61) |
Redemption fees added to paid in capital C,I | - | - | - | - | - |
Net asset value, end of period | $ 15.01 | $ 13.08 | $ 10.89 | $ 11.60 | $ 14.19 |
Total ReturnA,B | 15.91% | 20.11% | (4.98)% | (15.04)% | 13.77% |
Ratios to Average Net Assets D,H | | | | | |
Expenses before reductions | 2.18% | 2.22% | 2.20% | 2.18% | 2.20% |
Expenses net of fee waivers, if any | 2.18% | 2.15% | 2.15% | 2.15% | 2.15% |
Expenses net of all reductions | 2.18% | 2.14% | 2.15% | 2.15% | 2.15% |
Net investment income (loss) | (.68)% F | (.58)% G | .06% | (.80)% | (1.19)% |
Supplemental Data | | | | | |
Net assets, end of period (000 omitted) | $ 47,457 | $ 37,346 | $ 21,345 | $ 20,924 | $ 34,155 |
Portfolio turnover rate E | 22% | 49% | 51% | 149% | 67% |
A Total returns would have been lower if certain expenses had not been reduced during the applicable periods shown.
B Total returns do not include the effect of the contingent deferred sales charge.
C Calculated based on average shares outstanding during the period.
D Fees and expenses of any underlying Fidelity Central Funds are not included in the Fund's expense ratio. The Fund indirectly bears its proportionate share of the expenses of any underlying Fidelity Central Funds.
E Amount does not include the portfolio activity of any underlying Fidelity Central Funds.
F Investment income per share reflects a special dividend which amounted to $.06 per share. Excluding the special dividend, the ratio of net investment income (loss) to average net assets would have been (1.06)%.
G Investment income per share reflects a special dividend which amounted to $.03 per share. Excluding the special dividend, the ratio of net investment income (loss) to average net assets would have been (.85)%.
H Expense ratios reflect operating expenses of the class. Expenses before reductions do not reflect amounts reimbursed by the investment adviser or reductions from brokerage service arrangements or reductions from other expense offset arrangements and do not represent the amount paid by the class during periods when reimbursements or reductions occur. Expenses net of fee waivers reflect expenses after reimbursement by the investment adviser but prior to reductions from brokerage service arrangements or other expense offset arrangements. Expenses net of all reductions represent the net expenses paid by the class.
I Amount represents less than $.01 per share.
See accompanying notes which are an integral part of the financial statements.
Annual Report
Financial Highlights - Small Cap Value
Years ended July 31, | 2011 | 2010 | 2009 | 2008 | 2007 |
Selected Per-Share Data | | | | | |
Net asset value, beginning of period | $ 13.56 | $ 11.22 | $ 11.91 | $ 14.43 | $ 13.22 |
Income from Investment Operations | | | | | |
Net investment income (loss) B | .06 E | .05 F | .10 | .03 | (.02) |
Net realized and unrealized gain (loss) | 2.23 | 2.34 | (.60) | (1.99) | 1.91 |
Total from investment operations | 2.29 | 2.39 | (.50) | (1.96) | 1.89 |
Distributions from net investment income | (.10) | (.05) | (.08) | - | - |
Distributions from net realized gain | (.13) | - | (.11) | (.56) | (.68) |
Total distributions | (.23) | (.05) | (.19) | (.56) | (.68) |
Redemption fees added to paid in capital B,H | - | - | - | - | - |
Net asset value, end of period | $ 15.62 | $ 13.56 | $ 11.22 | $ 11.91 | $ 14.43 |
Total Return A | 17.03% | 21.32% | (4.15)% | (14.10)% | 14.96% |
Ratios to Average Net Assets C,G | | | | |
Expenses before reductions | 1.13% | 1.18% | 1.20% | 1.14% | 1.11% |
Expenses net of fee waivers, if any | 1.13% | 1.18% | 1.20% | 1.14% | 1.11% |
Expenses net of all reductions | 1.13% | 1.17% | 1.20% | 1.13% | 1.11% |
Net investment income (loss) | .37% E | .39% F | 1.01% | .22% | (.15)% |
Supplemental Data | | | | | |
Net assets, end of period (000 omitted) | $ 1,899,805 | $ 1,770,675 | $ 1,488,736 | $ 1,136,860 | $ 1,233,808 |
Portfolio turnover rate D | 22% | 49% | 51% | 149% | 67% |
A Total returns would have been lower if certain expenses had not been reduced during the applicable periods shown.
B Calculated based on average shares outstanding during the period.
C Fees and expenses of any underlying Fidelity Central Funds are not included in the Fund's expense ratio. The Fund indirectly bears its proportionate share of the expenses of any underlying Fidelity Central Funds.
D Amount does not include the portfolio activity of any underlying Fidelity Central Funds.
E Investment income per share reflects a special dividend which amounted to $.06 per share. Excluding the special dividend, the ratio of net investment income (loss) to average net assets would have been (.01) %.
F Investment income per share reflects a special dividend which amounted to $.03 per share. Excluding the special dividend, the ratio of net investment income (loss) to average net assets would have been .12%.
G Expense ratios reflect operating expenses of the class. Expenses before reductions do not reflect amounts reimbursed by the investment adviser or reductions from brokerage service arrangements or reductions from other expense offset arrangements and do not represent the amount paid by the class during periods when reimbursements or reductions occur. Expenses net of fee waivers reflect expenses after reimbursement by the investment adviser but prior to reductions from brokerage service arrangements or other expense offset arrangements. Expenses net of all reductions represent the net expenses paid by the class.
H Amount represents less than $.01 per share.
See accompanying notes which are an integral part of the financial statements.
Annual Report
Financial Highlights - Class F
Years ended July 31, | 2011 | 2010 | 2009 I |
Selected Per-Share Data | | | |
Net asset value, beginning of period | $ 13.58 | $ 11.22 | $ 10.27 |
Income from Investment Operations | | | |
Net investment income (loss) D | .09 G | .09 H | .01 |
Net realized and unrealized gain (loss) | 2.23 | 2.34 | .94 |
Total from investment operations | 2.32 | 2.43 | .95 |
Distributions from net investment income | (.14) | (.07) | - |
Distributions from net realized gain | (.13) | - | - |
Total distributions | (.26) L | (.07) | - |
Redemption fees added to paid in capital D,K | - | - | - |
Net asset value, end of period | $ 15.64 | $ 13.58 | $ 11.22 |
Total Return B,C | 17.31% | 21.69% | 9.25% |
Ratios to Average Net Assets E,J | | | |
Expenses before reductions | .88% | .90% | .86% A |
Expenses net of fee waivers, if any | .88% | .90% | .86%A |
Expenses net of all reductions | .88% | .89% | .86%A |
Net investment income (loss) | .61% G | .67% H | .64%A |
Supplemental Data | | | |
Net assets, end of period (000 omitted) | $ 279,653 | $ 109,868 | $ 159 |
Portfolio turnover rate F | 22% | 49% | 51% |
A Annualized
B Total returns for periods of less than one year are not annualized.
C Total returns would have been lower if certain expenses had not been reduced during the applicable periods shown.
D Calculated based on average shares outstanding during the period.
E Fees and expenses of any underlying Fidelity Central Funds are not included in the Fund's expense ratio. The Fund indirectly bears its proportionate share of the expenses of any underlying Fidelity Central Funds.
F Amount does not include the portfolio activity of any underlying Fidelity Central Funds.
G Investment income per share reflects a special dividend which amounted to $.06 per share. Excluding the special dividend, the ratio of net investment income (loss) to average net assets would have been .24%.
H Investment income per share reflects a special dividend which amounted to $.03 per share. Excluding the special dividend, the ratio of net investment income (loss) to average net assets would have been .40%.
I For the period June 26, 2009 (commencement of sale of shares) to July 31, 2009.
J Expense ratios reflect operating expenses of the class. Expenses before reductions do not reflect amounts reimbursed by the investment adviser or reductions from brokerage service arrangements or reductions from other expense offset arrangements and do not represent the amount paid by the class during periods when reimbursements or reductions occur. Expense ratios before reductions for start-up periods may not be representative of longer-term operating periods. Expenses net of fee waivers reflect expenses after reimbursement by the investment adviser but prior to reductions from brokerage service arrangements or other expense offset arrangements. Expenses net of all reductions represent the net expenses paid by the class.
K Amount represents less than $.01 per share.
L Total distributions of $.26 per share is comprised of distributions from net investment income of $.138 and distributions from net realized gain of $.126 per share.
See accompanying notes which are an integral part of the financial statements.
Annual Report
Financial Highlights - Institutional Class
Years ended July 31, | 2011 | 2010 | 2009 | 2008 | 2007 |
Selected Per-Share Data | | | | | |
Net asset value, beginning of period | $ 13.58 | $ 11.24 | $ 11.91 | $ 14.43 | $ 13.22 |
Income from Investment Operations | | | | | |
Net investment income (loss) B | .06 E | .06 F | .10 | .03 | (.02) |
Net realized and unrealized gain (loss) | 2.23 | 2.34 | (.59) | (1.99) | 1.91 |
Total from investment operations | 2.29 | 2.40 | (.49) | (1.96) | 1.89 |
Distributions from net investment income | (.11) | (.06) | (.07) | - | - |
Distributions from net realized gain | (.13) | - | (.11) | (.56) | (.68) |
Total distributions | (.24) | (.06) | (.18) | (.56) | (.68) |
Redemption fees added to paid in capital B,H | - | - | - | - | - |
Net asset value, end of period | $ 15.63 | $ 13.58 | $ 11.24 | $ 11.91 | $ 14.43 |
Total Return A | 17.02% | 21.42% | (4.04)% | (14.10)% | 14.99% |
Ratios to Average Net Assets C,G | | | | | |
Expenses before reductions | 1.10% | 1.12% | 1.20% | 1.13% | 1.10% |
Expenses net of fee waivers, if any | 1.10% | 1.12% | 1.15% | 1.13% | 1.10% |
Expenses net of all reductions | 1.10% | 1.12% | 1.15% | 1.13% | 1.10% |
Net investment income (loss) | .39% E | .45% F | 1.06% | .22% | (.13)% |
Supplemental Data | | | | | |
Net assets, end of period (000 omitted) | $ 101,565 | $ 78,440 | $ 10,336 | $ 8,584 | $ 11,594 |
Portfolio turnover rate D | 22% | 49% | 51% | 149% | 67% |
A Total returns would have been lower if certain expenses had not been reduced during the applicable periods shown.
B Calculated based on average shares outstanding during the period.
C Fees and expenses of any underlying Fidelity Central Funds are not included in the Fund's expense ratio. The Fund indirectly bears its proportionate share of the expenses of any underlying Fidelity Central Funds.
D Amount does not include the portfolio activity of any underlying Fidelity Central Funds.
E Investment income per share reflects a special dividend which amounted to $.06 per share. Excluding the special dividend, the ratio of net investment income (loss) to average net assets would have been .01%.
F Investment income per share reflects a special dividend which amounted to $.03 per share. Excluding the special dividend, the ratio of net investment income (loss) to average net assets would have been .18%.
G Expense ratios reflect operating expenses of the class. Expenses before reductions do not reflect amounts reimbursed by the investment adviser or reductions from brokerage service arrangements or reductions from other expense offset arrangements and do not represent the amount paid by the class during periods when reimbursements or reductions occur. Expenses net of fee waivers reflect expenses after reimbursement by the investment adviser but prior to reductions from brokerage service arrangements or other expense offset arrangements. Expenses net of all reductions represent the net expenses paid by the class.
H Amount represents less than $.01 per share.
See accompanying notes which are an integral part of the financial statements.
Annual Report
Notes to Financial Statements
For the period ended July 31, 2011
1. Organization.
Fidelity Small Cap Value Fund (the Fund) is a fund of Fidelity Securities Fund (the Trust) and is authorized to issue an unlimited number of shares. The Trust is registered under the Investment Company Act of 1940, as amended (the 1940 Act), as an open-end management investment company organized as a Massachusetts business trust. The Fund offers Class A, Class T, Class C, Small Cap Value, Class F and Institutional Class shares, each of which, along with Class B shares, has equal rights as to assets and voting privileges. Effective after the close of business on September 1, 2010, Class B shares were closed to new accounts and additional purchases, except for exchanges and reinvestments, by existing shareholders. Each class has exclusive voting rights with respect to matters that affect that class. Class F shares of the Fund are only available for purchase by mutual funds for which Fidelity Management & Research Company (FMR) or an affiliate serves as investment manager. Class B shares will automatically convert to Class A shares after a holding period of seven years from the initial date of purchase. Investment income, realized and unrealized capital gains and losses, the common expenses of the Fund, and certain fund-level expense reductions, if any, are allocated on a pro-rata basis to each class based on the relative net assets of each class to the total net assets of the Fund. Each class differs with respect to transfer agent and distribution and service plan fees incurred. Certain expense reductions may also differ by class.
2. Investments in Fidelity Central Funds.
The Fund invests in Fidelity Central Funds, which are open-end investment companies available only to other investment companies and accounts managed by Fidelity Management & Research Company (FMR) and its affiliates. The Fund's Schedule of Investments lists each of the Fidelity Central Funds held as of period end, if any, as an investment of the Fund, but does not include the underlying holdings of each Fidelity Central Fund. As an Investing Fund, the Fund indirectly bears its proportionate share of the expenses of the underlying Fidelity Central Funds.
The Money Market Central Funds seek preservation of capital and current income and are managed by Fidelity Investments Money Management, Inc. (FIMM), an affiliate of FMR.
A complete unaudited list of holdings for each Fidelity Central Fund is available upon request or at the Securities and Exchange Commission (the SEC) web site at www.sec.gov. In addition, the financial statements of the Fidelity Central Funds, which are not covered by the Fund's Report of Independent Registered Public Accounting Firm, are available on the SEC web site or upon request.
Annual Report
3. Significant Accounting Policies.
The financial statements have been prepared in conformity with accounting principles generally accepted in the United States of America (GAAP), which require management to make certain estimates and assumptions at the date of the financial statements. Actual results could differ from those estimates. Subsequent events, if any, through the date that the financial statements were issued have been evaluated in the preparation of the financial statements. The following summarizes the significant accounting policies of the Fund:
Security Valuation. Investments are valued as of 4:00 p.m. Eastern time on the last calendar day of the period. The Fund uses independent pricing services approved by the Board of Trustees to value its investments. When current market prices or quotations are not readily available or reliable, valuations may be determined in good faith in accordance with procedures adopted by the Board of Trustees. Factors used in determining value may include market or security specific events. The frequency with which these procedures are used cannot be predicted and they may be utilized to a significant extent. The value used for net asset value (NAV) calculation under these procedures may differ from published prices for the same securities.
The Fund categorizes the inputs to valuation techniques used to value its investments into a disclosure hierarchy consisting of three levels as shown below:
Level 1 - quoted prices in active markets for identical investments
Level 2 - other significant observable inputs (including quoted prices for similar investments, interest rates, prepayment speeds, etc.)
Level 3 - unobservable inputs (including the Fund's own assumptions based on the best information available)
Changes in valuation techniques may result in transfers in or out of an assigned level within the disclosure hierarchy. Valuation techniques used to value the Fund's investments by major category are as follows:
Equity securities, including restricted securities, for which market quotations are readily available, are valued at the last reported sale price or official closing price as reported by an independent pricing service on the primary market or exchange on which they are traded and are categorized as Level 1 in the hierarchy. In the event there were no sales during the day or closing prices are not available, securities are valued at the last quoted bid price or may be valued using the last available price and are generally categorized as Level 2 in the hierarchy. For foreign equity securities, when significant market or security specific events arise, comparisons to the valuation of American Depositary Receipts
Annual Report
Notes to Financial Statements - continued
3. Significant Accounting Policies - continued
Security Valuation - continued
(ADRs), futures contracts, Exchange-traded funds (ETFs) and certain indexes as well as quoted prices for similar securities are used and are categorized as Level 2 in the hierarchy in these circumstances. Utilizing these techniques may result in transfers between Level 1 and Level 2. For restricted equity securities and private placements where observable inputs are limited, assumptions about market activity and risk are used and are categorized as Level 3 in the hierarchy.
Investments in open-end mutual funds, including the Fidelity Central Funds, are valued at their closing net asset value each business day and are categorized as Level 1 in the hierarchy.
Foreign Currency. The Fund may use foreign currency contracts to facilitate transactions in foreign-denominated securities. Gains and losses from these transactions may arise from changes in the value of the foreign currency or if the counterparties do not perform under the contracts' terms.
Foreign-denominated assets, including investment securities, and liabilities are translated into U.S. dollars at the exchange rate at period end. Purchases and sales of investment securities, income and dividends received and expenses denominated in foreign currencies are translated into U.S. dollars at the exchange rate in effect on the transaction date.
The effects of exchange rate fluctuations on investments are included with the net realized and unrealized gain (loss) on investment securities. Other foreign currency transactions resulting in realized and unrealized gain (loss) are disclosed separately.
Investment Transactions and Income. For financial reporting purposes, the Fund's investment holdings and NAV include trades executed through the end of the last business day of the period. The NAV per share for processing shareholder transactions is calculated as of the close of business of the New York Stock Exchange (NYSE), normally 4:00 p.m. Eastern time and includes trades executed through the end of the prior business day. Gains and losses on securities sold are determined on the basis of identified cost and may include proceeds received from litigation. Dividend income is recorded on the ex-dividend date, except for certain dividends from foreign securities where the ex-dividend date may have passed, which are recorded as soon as the Fund is informed of the ex-dividend date. Non-cash dividends included in dividend income, if any, are recorded at the fair market value of the securities received. Distributions received on securities that represent a return of capital or capital gain are recorded as a reduction of
Annual Report
3. Significant Accounting Policies - continued
Investment Transactions and Income - continued
cost of investments and/or as a realized gain. The Fund estimates the components of distributions received that may be considered return of capital distributions or capital gain distributions. Large, non-recurring dividends recognized by the Fund are presented separately on the Statement of Operations as "Special Dividends" and the impact of these dividends is presented in the Financial Highlights. Interest income and distributions from the Fidelity Central Funds are accrued as earned. Interest income includes coupon interest and amortization of premium and accretion of discount on debt securities. Investment income is recorded net of foreign taxes withheld where recovery of such taxes is uncertain.
Expenses. Expenses directly attributable to a fund are charged to that fund. Expenses attributable to more than one fund are allocated among the respective funds on the basis of relative net assets or other appropriate methods. Expense estimates are accrued in the period to which they relate and adjustments are made when actual amounts are known.
Income Tax Information and Distributions to Shareholders. Each year, the Fund intends to qualify as a regulated investment company, including distributing substantially all of its taxable income and realized gains under Subchapter M of the Internal Revenue Code and filing its U.S. federal tax return. As a result, no provision for income taxes is required. As of July 31, 2011, the Fund did not have any unrecognized tax benefits in the financial statements. A fund's federal tax return is subject to examination by the Internal Revenue Service (IRS) for a period of three years. Foreign taxes are provided for based on the Fund's understanding of the tax rules and rates that exist in the foreign markets in which it invests.
Distributions are declared and recorded on the ex-dividend date. Income dividends and capital gain distributions are declared separately for each class. Income and capital gain distributions are determined in accordance with income tax regulations, which may differ from GAAP. In addition, the Fund claimed a portion of the payment made to redeeming shareholders as a distribution for income tax purposes.
Capital accounts within the financial statements are adjusted for permanent book-tax differences. These adjustments have no impact on net assets or the results of operations. Temporary book-tax differences will reverse in a subsequent period.
Book-tax differences are primarily due to the foreign currency transactions and losses deferred due to wash sales.
Annual Report
Notes to Financial Statements - continued
3. Significant Accounting Policies - continued
Income Tax Information and Distributions to Shareholders - continued
The federal tax cost of investment securities and unrealized appreciation (depreciation) as of period end were as follows:
Gross unrealized appreciation | $ 530,639,044 |
Gross unrealized depreciation | (140,116,602) |
Net unrealized appreciation (depreciation) on securities and other investments | $ 390,522,442 |
| |
Tax Cost | $ 2,251,463,484 |
The tax-based components of distributable earnings as of period end were as follows:
Undistributed long-term capital gain | $ 130,326,950 |
Net unrealized appreciation (depreciation) | $ 390,529,985 |
Under the recently enacted Regulated Investment Company Modernization Act of 2010 (the Act), the Fund will be permitted to carry forward capital losses incurred in taxable years beginning after December 22, 2010 for an unlimited period. However, any losses incurred during those future taxable years will be required to be utilized prior to any losses incurred in pre-enactment taxable years, which generally expire after eight years from when they are incurred. Additionally, post-enactment capital losses that are carried forward will retain their character as either short-term or long-term capital losses rather than being considered all short-term as under previous law. The Fund's first fiscal year end subject to the Act will be July 31, 2012.
The tax character of distributions paid was as follows:
| July 31, 2011 | July 31, 2010 |
Ordinary Income | $ 16,899,273 | $ 6,560,137 |
Long-term Capital Gains | 19,302,851 | - |
Total | $ 36,202,124 | $ 6,560,137 |
Short-Term Trading (Redemption) Fees. Shares held by investors in the Fund less than 90 days are subject to a redemption fee equal to 1.50% of the net asset value of shares redeemed. All redemption fees, which reduce the proceeds of the shareholder redemption, are retained by the Fund and accounted for as an addition to paid in capital.
Annual Report
3. Significant Accounting Policies - continued
New Accounting Pronouncement. In May 2011, the Financial Accounting Standards Board issued Accounting Standard Update No. 2011-04, Fair Value Measurement (Topic 820) - Amendments to Achieve Common Fair Value Measurement and Disclosure Requirements in U.S. GAAP and IFRSs. The update changes the wording used to describe the requirements in GAAP for measuring fair value and for disclosing information about fair value measurements. The update is effective during interim and annual periods beginning after December 15, 2011. Management is currently evaluating the impact of the update's adoption on the Fund's financial statement disclosures.
4. Purchases and Sales of Investments.
Purchases and sales of securities, other than short-term securities, aggregated $587,909,809 and $542,085,214, respectively.
5. Fees and Other Transactions with Affiliates.
Management Fee. FMR and its affiliates provide the Fund with investment management related services for which the Fund pays a monthly management fee. The management fee is the sum of an individual fund fee rate that is based on an annual rate of .45% of the Fund's average net assets and a group fee rate that averaged .26% during the period. The group fee rate is based upon the average net assets of all the mutual funds advised by FMR. The group fee rate decreases as assets under management increase and increases as assets under management decrease. In addition, the management fee is subject to a performance adjustment (up to a maximum of ±.20% of the Fund's average net assets over a 36 month performance period). The upward or downward adjustment to the management fee is based on the relative investment performance of Small Cap Value as compared to an appropriate benchmark index. For the period, the total annual management fee rate, including the performance adjustment, was .84% of the Fund's average net assets.
Distribution and Service Plan Fees. In accordance with Rule 12b-1 of the 1940 Act, the Fund has adopted separate Distribution and Service Plans for each class of shares. Certain classes pay Fidelity Distributors Corporation (FDC), an affiliate of FMR, separate Distribution and Service Fees, each of which is based on an annual percentage of each class' average net assets. In addition, FDC may pay financial intermediaries for
Annual Report
Notes to Financial Statements - continued
5. Fees and Other Transactions with Affiliates - continued
Distribution and Service Plan Fees - continued
selling shares of the Fund and providing shareholder support services. For the period, the Distribution and Service Fee rates, total fees and amounts retained by FDC were as follows:
| Distribution
Fee | Service
Fee | Total Fees | Retained
by FDC |
Class A | -% | .25% | $ 320,077 | $ 13,128 |
Class T | .25% | .25% | 280,302 | 522 |
Class B | .75% | .25% | 97,826 | 73,433 |
Class C | .75% | .25% | 465,720 | 134,667 |
| | | $ 1,163,925 | $ 221,750 |
Sales Load. FDC may receive a front-end sales charge of up to 5.75% for selling Class A shares, and 3.50% for selling Class T shares, some of which is paid to financial intermediaries for selling shares of the Fund. Depending on the holding period, FDC may receive contingent deferred sales charges levied on Class A, Class T, Class B, and Class C redemptions. The deferred sales charges range from 5% to 1% for Class B, 1% for Class C, 1.00% for certain purchases of Class A shares and .25% for certain purchases of Class T shares.
For the period, sales charge amounts retained by FDC were as follows:
| Retained
by FDC |
Class A | $ 60,912 |
Class T | 9,625 |
Class B* | 23,049 |
Class C* | 5,402 |
| $ 98,988 |
* When Class B and Class C shares are initially sold, FDC pays commissions from its own resources to financial intermediaries through which the sales are made.
Transfer Agent Fees. Fidelity Investments Institutional Operations Company, Inc. (FIIOC), an affiliate of FMR, is the transfer, dividend disbursing and shareholder servicing agent for each class of the Fund. FIIOC receives account fees and asset-based fees that vary according to the account size and type of account of the shareholders of the respective classes of the Fund, except for Class F. FIIOC receives no fees for providing transfer agency services to Class F. FIIOC pays for typesetting, printing and mailing of
Annual Report
5. Fees and Other Transactions with Affiliates - continued
Transfer Agent Fees - continued
shareholder reports, except proxy statements. For the period, transfer agent fees for each class were as follows:
| Amount | % of
Average
Net Assets |
Class A | $ 388,730 | .30 |
Class T | 173,683 | .31 |
Class B | 30,729 | .31 |
Class C | 139,095 | .30 |
Small Cap Value | 4,748,341 | .24 |
Institutional Class | 220,807 | .22 |
| $ 5,701,385 | |
Accounting and Security Lending Fees. Fidelity Service Company, Inc. (FSC), an affiliate of FMR, maintains the Fund's accounting records. The accounting fee is based on the level of average net assets for the month. Under a separate contract, FSC administers the security lending program. The security lending fee is based on the number and duration of lending transactions.
Brokerage Commissions. The Fund placed a portion of its portfolio transactions with brokerage firms which are affiliates of the investment adviser. The commissions paid to these affiliated firms were $13,259 for the period.
Interfund Lending Program. Pursuant to an Exemptive Order issued by the SEC, the Fund, along with other registered investment companies having management contracts with FMR, may participate in an interfund lending program. This program provides an alternative credit facility allowing the funds to borrow from, or lend money to, other participating affiliated funds. At period end, there were no interfund loans outstanding. The Fund's activity in this program during the period for which loans were outstanding was as follows:
Borrower or Lender | Average Daily
Loan Balance | Weighted Average
Interest Rate | Interest
Expense |
Borrower | $ 5,022,450 | .42% | $ 1,171 |
Annual Report
Notes to Financial Statements - continued
6. Committed Line of Credit.
The Fund participates with other funds managed by FMR or an affiliate in a $4.0 billion credit facility (the "line of credit") to be utilized for temporary or emergency purposes to fund shareholder redemptions or for other short-term liquidity purposes. The Fund has agreed to pay commitment fees on its pro-rata portion of the line of credit, which amounted to $8,189 and is reflected in Miscellaneous expenses on the Statement of Operations. During the period, there were no borrowings on this line of credit.
7. Security Lending.
The Fund lends portfolio securities through a lending agent from time to time in order to earn additional income. The lending agent may loan securities to certain qualified borrowers, including Fidelity Capital Markets (FCM), a broker-dealer affiliated with the Fund. On the settlement date of the loan, the Fund receives collateral (in the form of U.S. Treasury obligations, letters of credit and/or cash) against the loaned securities and maintains collateral in an amount not less than 100% of the market value of the loaned securities during the period of the loan. The market value of the loaned securities is determined at the close of business of the Fund and any additional required collateral is delivered to the Fund on the next business day. If the borrower defaults on its obligation to return the securities loaned because of insolvency or other reasons, a fund could experience delays and costs in recovering the securities loaned or in gaining access to the collateral. Any cash collateral received is invested in the Fidelity Securities Lending Cash Central Fund. The value of loaned securities and cash collateral at period end are disclosed on the Fund's Statement of Assets and Liabilities. Security lending income represents the income earned on investing cash collateral, less rebates paid to borrowers and lending agent fees associated with the loan, plus any premium payments received for lending certain types of securities. Security lending income is presented in the Statement of Operations as a component of income from Fidelity Central Funds. Total security lending income during the period amounted to $121,080. During the period, there were no securities loaned to FCM.
8. Expense Reductions.
FMR voluntarily agreed to reimburse each class to the extent annual operating expenses exceeded certain levels of average net assets as noted in the table below. Some expenses, for example interest expense, including commitment fees, are excluded from this reimbursement.
Annual Report
8. Expense Reductions - continued
The following classes were in reimbursement during the period:
| Expense
Limitations* | Reimbursement
from adviser |
Class A | 1.40 % | $ 9,560 |
Class T | 1.65 % | 4,801 |
Class B | 2.15 % | 1,186 |
Class C | 2.15 % | 3,342 |
| | $ 18,889 |
* Effective October 1, 2010 the expense limitations were eliminated.
Many of the brokers with whom FMR places trades on behalf of the Fund provided services to the Fund in addition to trade execution. These services included payments of certain expenses on behalf of the Fund totaling $25,738 for the period.
9. Distributions to Shareholders.
Distributions to shareholders of each class were as follows:
Years ended July 31, | 2011 | 2010 |
From net investment income | | |
Class A | $ 602,963 | $ 159,193 |
Class T | 175,083 | 36,920 |
Class B | 8,350 | - |
Class C | 50,685 | - |
Small Cap Value | 13,136,446 | 6,230,380 |
Class F | 1,502,640 | 28,266 |
Institutional Class | 674,898 | 105,378 |
Total | $ 16,151,065 | $ 6,560,137 |
From net realized gain | | |
Class A | $ 938,086 | $ - |
Class T | 417,804 | - |
Class B | 85,354 | - |
Class C | 362,483 | - |
Small Cap Value | 16,213,209 | - |
Class F | 1,278,822 | - |
Institutional Class | 755,301 | - |
Total | $ 20,051,059 | $ - |
Annual Report
Notes to Financial Statements - continued
10. Share Transactions.
Transactions for each class of shares were as follows:
| Shares | Dollars |
Years ended July 31, | 2011 | 2010 | 2011 | 2010 |
Class A | | | | |
Shares sold | 4,641,222 | 4,231,111 | $ 70,784,911 | $ 54,936,600 |
Reinvestment of distributions | 98,821 | 12,276 | 1,412,739 | 146,358 |
Shares redeemed | (2,860,682) | (1,973,236) | (43,524,578) | (25,421,999) |
Net increase (decrease) | 1,879,361 | 2,270,151 | $ 28,673,072 | $ 29,660,959 |
Class T | | | | |
Shares sold | 1,830,956 | 1,449,265 | $ 27,619,849 | $ 18,793,141 |
Reinvestment of distributions | 40,370 | 3,030 | 573,649 | 35,906 |
Shares redeemed | (1,537,319) | (727,616) | (23,500,005) | (9,211,959) |
Net increase (decrease) | 334,007 | 724,679 | $ 4,693,493 | $ 9,617,088 |
Class B | | | | |
Shares sold | 84,331 | 262,419 | $ 1,230,023 | $ 3,340,905 |
Reinvestment of distributions | 5,817 | - | 79,168 | - |
Shares redeemed | (265,513) | (174,554) | (3,874,627) | (2,189,700) |
Net increase (decrease) | (175,365) | 87,865 | $ (2,565,436) | $ 1,151,205 |
Class C | | | | |
Shares sold | 1,131,174 | 1,327,692 | $ 16,672,873 | $ 17,060,657 |
Reinvestment of distributions | 25,779 | - | 354,104 | - |
Shares redeemed | (848,659) | (434,251) | (12,648,504) | (5,448,332) |
Net increase (decrease) | 308,294 | 893,441 | $ 4,378,473 | $ 11,612,325 |
Small Cap Value | | | | |
Shares sold | 35,677,635 | 45,122,251 | $ 541,990,483 | $ 585,925,779 |
Reinvestment of distributions | 1,987,755 | 507,903 | 28,460,668 | 6,101,827 |
Shares redeemed | (46,640,533) | (47,781,912) | (708,788,001) | (605,149,428) |
Net increase (decrease) | (8,975,143) | (2,151,758) | $ (138,336,850) | $ (13,121,822) |
Class F | | | | |
Shares sold | 11,644,633 | 8,411,513 | $ 177,097,711 | $ 109,778,609 |
Reinvestment of distributions | 192,943 | 2,350 | 2,781,462 | 28,266 |
Shares redeemed | (2,052,505) | (337,999) | (32,200,197) | (4,618,215) |
Net increase (decrease) | 9,785,071 | 8,075,864 | $ 147,678,976 | $ 105,188,660 |
Institutional Class | | | | |
Shares sold | 4,417,342 | 5,522,070 | $ 67,359,213 | $ 73,692,691 |
Reinvestment of distributions | 90,435 | 7,512 | 1,288,856 | 90,344 |
Shares redeemed | (3,788,938) | (671,565) | (58,540,522) | (8,789,847) |
Net increase (decrease) | 718,839 | 4,858,017 | $ 10,107,547 | $ 64,993,188 |
Annual Report
11. Other.
The Fund's organizational documents provide former and current trustees and officers with a limited indemnification against liabilities arising in connection with the performance of their duties to the Fund. In the normal course of business, the Fund may also enter into contracts that provide general indemnifications. The Fund's maximum exposure under these arrangements is unknown as this would be dependent on future claims that may be made against the Fund. The risk of material loss from such claims is considered remote.
At the end of the period, the Fidelity Freedom Funds® and Fidelity Freedom K® Funds were the owners of record, in the aggregate, of approximately 37% of the total outstanding shares of the Fund.
Annual Report
To the Trustees of Fidelity Securities Fund and the Shareholders of Fidelity Small Cap Value Fund:
In our opinion, the accompanying statement of assets and liabilities, including the schedule of investments, and the related statements of operations and of changes in net assets and the financial highlights present fairly, in all material respects, the financial position of Fidelity Small Cap Value Fund (a fund of Fidelity Securities Fund) at July 31, 2011, the results of its operations for the year then ended, the changes in its net assets for each of the two years in the period then ended and the financial highlights for each of the periods indicated, in conformity with accounting principles generally accepted in the United States of America. These financial statements and financial highlights (hereafter referred to as "financial statements") are the responsibility of the Fidelity Small Cap Value Fund's management. Our responsibility is to express an opinion on these financial statements based on our audits. We conducted our audits of these financial statements in accordance with the standards of the Public Company Accounting Oversight Board (United States). Those standards require that we plan and perform the audit to obtain reasonable assurance about whether the financial statements are free of material misstatement. An audit includes examining, on a test basis, evidence supporting the amounts and disclosures in the financial statements, assessing the accounting principles used and significant estimates made by management, and evaluating the overall financial statement presentation. We believe that our audits, which included confirmation of securities at July 31, 2011 by correspondence with the custodian and brokers, provide a reasonable basis for our opinion.
/s/PricewaterhouseCoopers LLP
PricewaterhouseCoopers LLP
Boston, Massachusetts
September 15, 2011
Annual Report
The Trustees, Members of the Advisory Board, and executive officers of the trust and fund, as applicable, are listed below. The Board of Trustees governs the fund and is responsible for protecting the interests of shareholders. The Trustees are experienced executives who meet periodically throughout the year to oversee the fund's activities, review contractual arrangements with companies that provide services to the fund, oversee management of the risks associated with such activities and contractual arrangements, and review the fund's performance. Except for James C. Curvey, each of the Trustees oversees 221 funds advised by FMR or an affiliate. Mr. Curvey oversees 419 funds advised by FMR or an affiliate.
The Trustees hold office without limit in time except that (a) any Trustee may resign; (b) any Trustee may be removed by written instrument, signed by at least two-thirds of the number of Trustees prior to such removal; (c) any Trustee who requests to be retired or who has become incapacitated by illness or injury may be retired by written instrument signed by a majority of the other Trustees; and (d) any Trustee may be removed at any special meeting of shareholders by a two-thirds vote of the outstanding voting securities of the trust. Each Trustee who is not an interested person (as defined in the 1940 Act) (Independent Trustee), shall retire not later than the last day of the calendar year in which his or her 75th birthday occurs. The Independent Trustees may waive this mandatory retirement age policy with respect to individual Trustees. The executive officers and Advisory Board Members hold office without limit in time, except that any officer and Advisory Board Member may resign or may be removed by a vote of a majority of the Trustees at any regular meeting or any special meeting of the Trustees. Except as indicated, each individual has held the office shown or other offices in the same company for the past five years.
Experience, Skills, Attributes, and Qualifications of the Fund's Trustees. The Governance and Nominating Committee has adopted a statement of policy that describes the experience, qualifications, attributes, and skills that are necessary and desirable for potential Independent Trustee candidates (Statement of Policy). The Board believes that each Trustee satisfied at the time he or she was initially elected or appointed a Trustee, and continues to satisfy, the standards contemplated by the Statement of Policy. The Governance and Nominating Committee also engages professional search firms to help identify potential Independent Trustee candidates who have the experience, qualifications, attributes, and skills consistent with the Statement of Policy. From time to time, additional criteria based on the composition and skills of the current Independent Trustees, as well as experience or skills that may be appropriate in light of future changes to board composition, business conditions, and regulatory or other developments, have also been considered by the professional search firms and the Governance and Nominating Committee. In addition, the Board takes into account the Trustees' commitment and participation in Board and committee meetings, as well as their leadership of standing and ad hoc committees throughout their tenure.
In determining that a particular Trustee was and continues to be qualified to serve as a Trustee, the Board has considered a variety of criteria, none of which, in isolation, was controlling. The Board believes that, collectively, the Trustees have balanced and diverse experience, qualifications, attributes, and skills, which allow the Board to operate effectively in governing the fund and protecting the interests of shareholders. Information about the specific experience, skills, attributes, and qualifications of each Trustee, which in each case led to the Board's conclusion that the Trustee should serve (or continue to serve) as a trustee of the fund, is provided below.
Annual Report
Board Structure and Oversight Function. James C. Curvey is an interested person (as defined in the 1940 Act) and currently serves as Acting Chairman. The Trustees have determined that an interested Chairman is appropriate and benefits shareholders because an interested Chairman has a personal and professional stake in the quality and continuity of services provided to the fund. Independent Trustees exercise their informed business judgment to appoint an individual of their choosing to serve as Chairman, regardless of whether the Trustee happens to be independent or a member of management. The Independent Trustees have determined that they can act independently and effectively without having an Independent Trustee serve as Chairman and that a key structural component for assuring that they are in a position to do so is for the Independent Trustees to constitute a substantial majority for the Board. The Independent Trustees also regularly meet in executive session. Ned C. Lautenbach serves as Chairman of the Independent Trustees and as such (i) acts as a liaison between the Independent Trustees and management with respect to matters important to the Independent Trustees and (ii) with management prepares agendas for Board meetings.
Fidelity funds are overseen by different Boards of Trustees. The fund's Board oversees Fidelity's equity and high income funds and another Board oversees Fidelity's investment-grade bond, money market, and asset allocation funds. The asset allocation funds may invest in Fidelity funds overseen by the fund's Board. The use of separate Boards, each with its own committee structure, allows the Trustees of each group of Fidelity funds to focus on the unique issues of the funds they oversee, including common research, investment, and operational issues. On occasion, the separate Boards establish joint committees to address issues of overlapping consequences for the Fidelity funds overseen by each Board.
The Trustees operate using a system of committees to facilitate the timely and efficient consideration of all matters of importance to the Trustees, the fund, and fund shareholders and to facilitate compliance with legal and regulatory requirements and oversight of the fund's activities and associated risks. The Board, acting through its committees, has charged FMR and its affiliates with (i) identifying events or circumstances the occurrence of which could have demonstrably adverse effects on the fund's business and/or reputation; (ii) implementing processes and controls to lessen the possibility that such events or circumstances occur or to mitigate the effects of such events or circumstances if they do occur; and (iii) creating and maintaining a system designed to evaluate continuously business and market conditions in order to facilitate the identification and implementation processes described in (i) and (ii) above. Because the day-to-day operations and activities of the fund are carried out by or through FMR, its affiliates and other service providers, the fund's exposure to risks is mitigated but not eliminated by the processes overseen by the Trustees. While each of the Board's committees has responsibility for overseeing different aspects of the fund's activities, oversight is exercised primarily through the Operations, Audit, and Compliance Committees. Appropriate personnel, including but not limited to the fund's Chief Compliance Officer (CCO), FMR's internal auditor, the independent accountants, the fund's Treasurer and portfolio management personnel, make periodic reports to the Board's committees, as appropriate. The responsibilities of each committee, including their oversight responsibilities, are described further under "Standing Committees of the Fund's Trustees."
Annual Report
Trustees and Officers - continued
The fund's Statement of Additional Information (SAI) includes more information about the Trustees. To request a free copy, call Fidelity at 1-800-208-0098.
Interested Trustees*:
Correspondence intended for each Trustee who is an interested person may be sent to Fidelity Investments, 82 Devonshire Street, Boston, Massachusetts 02109.
Name, Age; Principal Occupations and Other Relevant Experience+ |
James C. Curvey (76) |
| Year of Election or Appointment: 2007
Mr. Curvey is Trustee and Acting Chairman of the Board of Trustees of certain Trusts. Mr. Curvey also serves as Trustee (2007-present) of other investment companies advised by FMR. Mr. Curvey is a Director of Fidelity Investments Money Management, Inc. (2009-present), Director of Fidelity Research & Analysis Co. (2009-present) and Director of FMR and FMR Co., Inc. (2007-present). Mr. Curvey is also Vice Chairman (2007-present) and Director of FMR LLC. In addition, Mr. Curvey serves as an Overseer for the Boston Symphony Orchestra and a member of the Trustees of Villanova University. Previously, Mr. Curvey was the Vice Chairman (2006-2007) and Director (2000-2007) of FMR Corp. |
Ronald P. O'Hanley (54) |
| Year of Election or Appointment: 2011
Mr. O'Hanley is Director of FMR Co., Inc. (2010-present), Director of Fidelity Investments Money Management, Inc. (2010-present), Director of Fidelity Research & Analysis Company (2010-present), President of Fidelity Asset Management and Corporate Services and a member of Fidelity's Executive Committee (2010-present). Previously, Mr. O'Hanley served as President and Chief Executive Officer of BNY Mellon Asset Management (2007-2010). Mr. O'Hanley also served as Vice Chairman of Bank New York Mellon Corp. and a member of that firm's Executive Committee. Prior to the 2007 merger of The Bank of New York and Mellon Financial Corporation, he was Vice Chairman of Mellon Financial Corporation and President and Chief Executive Officer of Mellon Asset Management. He joined Mellon in February 1997. Mr. O'Hanley currently serves as Chairman of the Boston Public Library Foundation Board of Directors and sits on the Board of Directors of Beth Israel Deaconess Medical Center, the Board of Trustees of the Marine Biological Laboratory and the Advisory Board of the Maxwell School of Citizenship and Public Administration at Syracuse University. Mr. O'Hanley also chairs the Council on Asset Management for the Financial Services Roundtable and is a member of the Board of Directors of Institutional Investor's U.S. Institute. |
* Trustees have been determined to be "Interested Trustees" by virtue of, among other things, their affiliation with the trust or various entities under common control with FMR.
+ The information above includes each Trustee's principal occupation during the last five years and other information relating to the experience, attributes, and skills relevant to each Trustee's qualifications to serve as a Trustee, which led to the conclusion that each Trustee should serve as a Trustee for the fund.
Annual Report
Trustees and Officers - continued
Independent Trustees:
Correspondence intended for each Independent Trustee (that is, the Trustees other than the Interested Trustees) may be sent to Fidelity Investments, P.O. Box 55235, Boston, Massachusetts 02205-5235.
Name, Age; Principal Occupations and Other Relevant Experience+ |
Dennis J. Dirks (63) |
| Year of Election or Appointment: 2005 Prior to his retirement in May 2003, Mr. Dirks was Chief Operating Officer and a member of the Board of The Depository Trust & Clearing Corporation (DTCC). He also served as President, Chief Operating Officer, and Board member of The Depository Trust Company (DTC) and President and Board member of the National Securities Clearing Corporation (NSCC). In addition, Mr. Dirks served as Chief Executive Officer and Board member of the Government Securities Clearing Corporation, Chief Executive Officer and Board member of the Mortgage-Backed Securities Clearing Corporation, as a Trustee and a member of the Finance Committee of Manhattan College (2005-2008), and as a Trustee and a member of the Finance Committee of AHRC of Nassau County (2006-2008). Mr. Dirks is a member of the Independent Directors Council (IDC) Governing Council (2010-Present) and Board of Directors for The Brookville Center for Children's Services, Inc. (2009-present). |
Alan J. Lacy (57) |
| Year of Election or Appointment: 2008 Mr. Lacy serves as Senior Adviser (2007-present) of Oak Hill Capital Partners, L.P. (private equity). Mr. Lacy also served as Chief Executive Officer (2000-2005) and Vice Chairman (2005-2006) of Sears Holdings Corporation and Sears, Roebuck and Co. (retail). In addition, Mr. Lacy serves as a member of the Board of Directors of Dave & Buster's, Inc. (restaurant and entertainment complexes, 2010-present), The Hillman Companies, Inc. (hardware wholesalers, 2010-present), and Bristol-Myers Squibb Company (global pharmaceuticals, 2007-present). Mr. Lacy is a member of the Board of Trustees of The National Parks Conservation Association (2006-Present). Previously, Mr. Lacy served as Chairman of the Board of Trustees of the National Parks Conservation Association (2008-2011) and as a member of the Board of Directors for the Western Union Company (global money transfer, 2006-2011). |
Ned C. Lautenbach (67) |
| Year of Election or Appointment: 2000 Mr. Lautenbach is Chairman of the Independent Trustees of the Equity and High Income Funds (2006-present). Mr. Lautenbach currently serves as the Lead Director of the Eaton Corporation Board of Directors (diversified industrial, 1997-present). Mr. Lautenbach is also a member of the Board of Directors of the Philharmonic Center for the Arts in Naples, Florida (1999-present); a member of the Board of Trustees of Fairfield University (2005-present); and a member of the Council on Foreign Relations (1994-present). Previously, Mr. Lautenbach was a Partner/Advisory Partner at Clayton, Dubilier & Rice, LLC (private equity investment, 1998-2010), as well as a Director of Sony Corporation (2006-2007). |
Joseph Mauriello (66) |
| Year of Election or Appointment: 2008 Prior to his retirement in January 2006, Mr. Mauriello served in numerous senior management positions including Deputy Chairman and Chief Operating Officer (2004-2005), and Vice Chairman of Financial Services (2002-2004) of KPMG LLP US (professional services, 1965-2005). Mr. Mauriello currently serves as a member of the Board of Directors of XL Group plc. (global insurance and re-insurance, 2006-present) and of Arcadia Resources Inc. (health care services and products, 2007-present). Previously, Mr. Mauriello served as a Director of the Hamilton Funds of the Bank of New York (2006-2007). |
Robert W. Selander (60) |
| Year of Election or Appointment: 2011
Previously, Mr. Selander served as a Member of the Advisory Board of Fidelity's Equity and High Income Funds (2011), Executive Vice Chairman (2010), Chief Executive Officer (2009-2010), and President and Chief Executive Officer (1997-2009) of Mastercard, Inc. |
Cornelia M. Small (67) |
| Year of Election or Appointment: 2005 Ms. Small is a member of the Board of Directors of the Teagle Foundation (2009-present). Ms. Small is also a member of the Investment Committee, and Chair (2008-present) and a member of the Board of Trustees of Smith College. In addition, Ms. Small serves on the Investment Committee of the Berkshire Taconic Community Foundation (2008-present). Previously, Ms. Small served as Chairperson of the Investment Committee (2002-2008) of Smith College. In addition, Ms. Small served as Chief Investment Officer, Director of Global Equity Investments, and a member of the Board of Directors of Scudder, Stevens & Clark and Scudder Kemper Investments. |
William S. Stavropoulos (72) |
| Year of Election or Appointment: 2002 Mr. Stavropoulos is Vice Chairman of the Independent Trustees of the Equity and High Income Funds (2006-present). Mr. Stavropoulos serves as President and Founder of the Michigan Baseball Foundation, the Great Lakes Loons (2007-present). Mr. Stavropoulos is Chairman Emeritus of the Board of Directors of The Dow Chemical Company, where he previously served in numerous senior management positions, including President, CEO (1995-2000; 2002-2004), Chairman of the Executive Committee (2000-2006), and as a member of the Board of Directors (1990-2006). Currently, Mr. Stavropoulos is Chairman of Univar (global distributor of commodity and specialty chemicals, 2010-present), a Director of Teradata Corporation (data warehousing and technology solutions, 2008-present), Chemical Financial Corporation, Maersk Inc. (industrial conglomerate), Tyco International, Inc. (multinational manufacturing and services, 2007-present), and a member of the Advisory Board for Metalmark Capital (private equity investment, 2005-present). Mr. Stavropoulos is a special advisor to Clayton, Dubilier & Rice, LLC (private equity investment). In addition, Mr. Stavropoulos is a member of the University of Notre Dame Advisory Council for the College of Science. |
David M. Thomas (62) |
| Year of Election or Appointment: 2008 Previously, Mr. Thomas served as Executive Chairman (2005-2006) and Chairman and Chief Executive Officer (2000-2005) of IMS Health, Inc. (pharmaceutical and healthcare information solutions). In addition, Mr. Thomas serves as a member of the Board of Directors of Fortune Brands, Inc. (consumer products), and Interpublic Group of Companies, Inc. (marketing communication, 2004-present). |
Michael E. Wiley (60) |
| Year of Election or Appointment: 2008 Mr. Wiley also serves as a Director of Asia Pacific Exploration Consolidated (international oil and gas exploration and production, 2008-present). Mr. Wiley serves as a Director of Tesoro Corporation (independent oil refiner and marketer, 2005-present), and a Director of Bill Barrett Corporation (exploration and production, 2005-present). In addition, Mr. Wiley also serves as a Director of Post Oak Bank (privately-held bank, 2004-present). Previously, Mr. Wiley served as a member of the Board of Trustees of the University of Tulsa (2000-2006; 2007-2010), as a Senior Energy Advisor of Katzenbach Partners, LLC (consulting, 2006-2007), as an Advisory Director of Riverstone Holdings (private investment), Chairman, President, and CEO of Baker Hughes, Inc. (oilfield services, 2000-2004), and as Director of Spinnaker Exploration Company (exploration and production, 2001-2005). |
Annual Report
+ The information above includes each Trustee's principal occupation during the last five years and other information relating to the experience, attributes, and skills relevant to each Trustee's qualifications to serve as a Trustee, which led to the conclusion that each Trustee should serve as a Trustee for the fund.
Advisory Board Members and Executive Officers:
Correspondence intended for each executive officer, Edward C. Johnson 3d, and Peter S. Lynch may be sent to Fidelity Investments, 82 Devonshire Street, Boston, Massachusetts 02109.
Name, Age; Principal Occupation |
Edward C. Johnson 3d (81) |
| Year of Election or Appointment: 2011 Member of the Advisory Board of Fidelity's Equity and High Income Funds. Mr. Johnson serves as Chief Executive Officer, Chairman, and a Director of FMR LLC, and also serves as Chairman and Director of FIL Limited. Previously, Mr. Johnson served as a Trustee and Chairman of the Board of certain Fidelity Trusts, Chairman and a Director of FMR, Chairman and a Director of FMR Co., Inc., and President of FMR LLC (2006-2007). |
Peter S. Lynch (67) |
| Year of Election or Appointment: 2003 Member of the Advisory Board of Fidelity's Equity and High Income Funds. Mr. Lynch is Vice Chairman and a Director of FMR and FMR Co., Inc. In addition, Mr. Lynch serves as a Trustee of Boston College and as the Chairman of the Inner-City Scholarship Fund. Previously, Mr. Lynch served on the Special Olympics International Board of Directors (1997-2006). |
Kenneth B. Robins (41) |
| Year of Election or Appointment: 2008 President and Treasurer of Fidelity's Equity and High Income Funds. Mr. Robins also serves as President and Treasurer (2010-present) and Assistant Treasurer (2009-present) of other Fidelity funds and is an employee of Fidelity Investments (2004-present). Previously, Mr. Robins served as Deputy Treasurer of the Fidelity funds (2005-2008) and Treasurer and Chief Financial Officer of The North Carolina Capital Management Trust: Cash and Term Portfolios (2006-2008). |
Brian B. Hogan (46) |
| Year of Election or Appointment: 2009 Vice President of Equity and High Income Funds. Mr. Hogan also serves as President of FMR's Equity Division (2009-present). Previously, Mr. Hogan served as Senior Vice President, Equity Research of FMR (2006-2009) and as a portfolio manager. |
Thomas C. Hense (47) |
| Year of Election or Appointment: 2008 or 2010 Vice President of Fidelity's High Income (2008), Small Cap (2008), and Value (2010) Funds. Previously, Mr. Hense served as a portfolio manager for Fidelity's Institutional Money Management Group (Pyramis) (2003-2008). |
Scott C. Goebel (43) |
| Year of Election or Appointment: 2008 Secretary and Chief Legal Officer (CLO) of the Fidelity funds. Mr. Goebel also serves as Secretary of Fidelity Investments Money Management, Inc. (FIMM) (2010-present) and Fidelity Research and Analysis Company (FRAC) (2010-present); Secretary and CLO of The North Carolina Capital Management Trust: Cash and Term Portfolios (2008-present); General Counsel, Secretary, and Senior Vice President of FMR (2008-present) and FMR Co., Inc. (2008-present); employed by FMR LLC or an affiliate (2001-present); Chief Legal Officer of Fidelity Management & Research (Hong Kong) Limited (2008-present) and Assistant Secretary of Fidelity Management & Research (Japan) Inc. (2008-present), and Fidelity Management & Research (U.K.) Inc. (2008-present). Previously, Mr. Goebel served as Assistant Secretary of FIMM (2008-2010), FRAC (2008-2010), and the Funds (2007-2008) and as Vice President and Secretary of Fidelity Distributors Corporation (FDC) (2005-2007). |
William C. Coffey (42) |
| Year of Election or Appointment: 2009 Assistant Secretary of Fidelity's Equity and High Income Funds. Mr. Coffey also serves as Senior Vice President and Deputy General Counsel of FMR LLC (2010-present), and is an employee of Fidelity Investments. Previously, Mr. Coffey served as Vice President and Associate General Counsel of FMR LLC (2005-2009). |
Holly C. Laurent (57) |
| Year of Election or Appointment: 2008 Anti-Money Laundering (AML) Officer of the Fidelity funds. Ms. Laurent also serves as AML Officer of The North Carolina Capital Management Trust: Cash and Term Portfolios (2008-present) and is an employee of Fidelity Investments. Previously, Ms. Laurent was Senior Vice President and Head of Legal for Fidelity Business Services India Pvt. Ltd. (2006-2008), and Senior Vice President, Deputy General Counsel and Group Head for FMR LLC (2005-2006). |
Christine Reynolds (52) |
| Year of Election or Appointment: 2008 Chief Financial Officer of the Fidelity funds. Ms. Reynolds became President of Fidelity Pricing and Cash Management Services (FPCMS) in August 2008. Ms. Reynolds served as Chief Operating Officer of FPCMS (2007-2008). Previously, Ms. Reynolds served as President, Treasurer, and Anti-Money Laundering officer of the Fidelity funds (2004-2007). |
Kenneth A. Rathgeber (64) |
| Year of Election or Appointment: 2004 Chief Compliance Officer of Fidelity's Equity and High Income Funds. Mr. Rathgeber is Chief Compliance Officer of Fidelity Management & Research (Hong Kong) Limited (2008-present), Fidelity Management & Research (Japan) Inc. (2008-present), FMR (2005-present), FMR Co., Inc. (2005-present), Fidelity Management & Research (U.K.) Inc. (2005-present), Fidelity Research & Analysis Company (2005-present), Fidelity Investments Money Management, Inc. (2005-present), Pyramis Global Advisors, LLC (2005-present), and Strategic Advisers, Inc. (2005-present). |
Jeffrey S. Christian (49) |
| Year of Election or Appointment: 2009 Deputy Treasurer of the Fidelity funds. Mr. Christian is an employee of Fidelity Investments. Previously, Mr. Christian served as Chief Financial Officer (2008-2009) of certain Fidelity funds and Senior Vice President of Fidelity Pricing and Cash Management Services (FPCMS) (2004-2009). |
Bryan A. Mehrmann (50) |
| Year of Election or Appointment: 2005 Deputy Treasurer of the Fidelity funds. Mr. Mehrmann is an employee of Fidelity Investments. |
Adrien E. Deberghes (43) |
| Year of Election or Appointment: 2008 Deputy Treasurer of Fidelity's Equity and High Income Funds. Mr. Deberghes also serves as Assistant Treasurer of other Fidelity funds (2010-present) and is an employee of Fidelity Investments (2008-present). Previously, Mr. Deberghes served as Senior Vice President of Mutual Fund Administration at State Street Corporation (2007-2008), Senior Director of Mutual Fund Administration at Investors Bank & Trust (2005-2007), and Director of Finance for Dunkin' Brands (2000-2005). |
Stephanie J. Dorsey (42) |
| Year of Election or Appointment: 2010 Assistant Treasurer of Fidelity's Equity and High Income Funds. Ms. Dorsey also serves as Deputy Treasurer of other Fidelity funds (2008-present) and is an employee of Fidelity Investments (2008-present). Previously, Ms. Dorsey served as Treasurer (2004-2008) of the JPMorgan Mutual Funds and Vice President (2004-2008) of JPMorgan Chase Bank. |
John R. Hebble (53) |
| Year of Election or Appointment: 2009 Assistant Treasurer of Fidelity's Equity and High Income Funds. Mr. Hebble also serves as President (2011-present), Treasurer, and Chief Financial Officer of The North Carolina Capital Management Trust: Cash and Term Portfolios (2008-present), President and Treasurer of other Fidelity funds (2008-present) and is an employee of Fidelity Investments. |
Gary W. Ryan (52) |
| Year of Election or Appointment: 2005 Assistant Treasurer of the Fidelity funds. Mr. Ryan is an employee of Fidelity Investments. Previously, Mr. Ryan served as Vice President of Fund Reporting in Fidelity Pricing and Cash Management Services (FPCMS) (1999-2005). |
Jonathan Davis (43) |
| Year of Election or Appointment: 2010 Assistant Treasurer of the Fidelity funds. Mr. Davis is an employee of Fidelity Investments. Previously, Mr. Davis served as Vice President and Associate General Counsel of FMR LLC (2003-2010). |
Annual Report
The Board of Trustees of Fidelity Small Cap Value Fund voted to pay to shareholders of record at the opening of business on record date, the following distributions per share derived from capital gains realized from sales of portfolio securities:
| Pay Date | Record Date | Capital Gains |
Institutional Class | 09/12/2011 | 09/09/2011 | $0.815 |
Institutional Class designates 100% of the dividends distributed during the fiscal year as qualifying for the dividends-received deduction for corporate shareholders.
Institutional Class designates 100% of the dividends distributed during the fiscal year as amounts which can be taken into account as a dividend for the purposes of the maximum rate under section 1(h)(11) of the Internal Revenue Code.
The fund hereby designates as a capital gain dividend with respect to the taxable year ended July 31, 2011, $147,340,051, or, if subsequently determined to be different, the net capital gain of such year.
The fund will notify shareholders in January 2012 of amounts for use in preparing 2011 income tax returns.
Annual Report
Board Approval of Investment Advisory Contracts and Management Fees
Fidelity Small Cap Value Fund
Each year, the Board of Trustees, including the Independent Trustees (together, the Board), votes on the renewal of the management contract and sub-advisory agreements (together, the Advisory Contracts) for the fund. The Board, assisted by the advice of fund counsel and Independent Trustees' counsel, requests and considers a broad range of information relevant to the renewal of the Advisory Contracts throughout the year.
The Board meets regularly and considers at each of its meetings factors that are relevant to its annual consideration of the renewal of the fund's Advisory Contracts, including the services and support provided to the fund and its shareholders. The Board has established various standing committees, each composed of Independent Trustees with varying backgrounds, to which the Board has assigned specific subject matter responsibilities in order to enhance effective decision-making by the Board. The Board, acting directly and through its Committees, requests and receives information concerning the annual consideration of the renewal of the fund's Advisory Contracts. The Board also meets as needed to consider matters specifically related to the Board's annual consideration of the renewal of Advisory Contracts. Members of the Board may also meet with trustees of other Fidelity funds through ad hoc joint committees to discuss certain matters relevant to the Fidelity funds.
At its July 2011 meeting, the Board of Trustees, including the Independent Trustees, unanimously determined to renew the fund's Advisory Contracts. In reaching its determination, the Board considered all factors it believed relevant, including (i) the nature, extent, and quality of the services to be provided to the fund and its shareholders (including the investment performance of the fund); (ii) the competitiveness of the fund's management fee and total expense ratio; (iii) the total costs of the services to be provided by and the profits to be realized by Fidelity from its relationship with the fund; (iv) the extent to which economies of scale would be realized as the fund grows; and (v) whether fee levels reflect these economies of scale, if any, for the benefit of fund shareholders.
In considering whether to renew the Advisory Contracts for the fund, the Board reached a determination, with the assistance of fund counsel and Independent Trustees' counsel and through the exercise of its business judgment, that the renewal of the Advisory Contracts is in the best interests of the fund and its shareholders and that the compensation payable under the Advisory Contracts is fair and reasonable. The Board's decision to renew the Advisory Contracts was not based on any single factor, but rather was based on a comprehensive consideration of all the information provided to the Board at its meetings throughout the year. The Board, in reaching its determination to renew the Advisory Contracts, is aware that shareholders in the fund have a broad range of investment choices available to them, including a wide choice among mutual funds offered by Fidelity's competitors, and that the fund's shareholders, who have the opportunity to review and weigh the disclosure provided by the fund in its prospectus and other public disclosures, have chosen to invest in this fund, managed by Fidelity.
Annual Report
Nature, Extent, and Quality of Services Provided. The Board considered the staffing within the investment adviser, FMR, and the sub-advisers (together, the Investment Advisers), including the backgrounds of the fund's investment personnel and the fund's investment objective and discipline. The Independent Trustees also had discussions with senior management of Fidelity's investment operations and investment groups. The Board considered the structure of the portfolio manager compensation program and whether this structure provides appropriate incentives to act in the best interests of the fund.
Resources Dedicated to Investment Management and Support Services. The Board and the Fund Oversight and Research Committees reviewed the general qualifications and capabilities of the Investment Advisers' investment staff, including its size, education, experience, and resources, as well as the Investment Advisers' approach to recruiting, training, managing, and compensating investment personnel. The Board also noted that FMR has devoted increased resources to non-U.S. offices. The Board noted that Fidelity's analysts have extensive resources, tools and capabilities which allow them to conduct sophisticated quantitative and fundamental analysis, as well as credit analysis of issuers, counterparties and enhancers. The Board also believes that Fidelity's investment professionals have sufficient access to global information and data so as to provide competitive investment results over time, and that those professionals also have access to sophisticated tools which permit them to assess portfolio construction and risk and performance attribution characteristics continuously, as well as to transmit new information and research conclusions rapidly around the world. Additionally, in their deliberations, the Board considered the Investment Advisers' trading capabilities and resources which are an integral part of the investment management process.
Shareholder and Administrative Services. The Board considered (i) the nature, extent, quality, and cost of advisory, administrative, and shareholder services performed by the Investment Advisers and their affiliates under the Advisory Contracts and under separate agreements covering transfer agency, pricing and bookkeeping, and securities lending services for the fund; (ii) the nature and extent of the investment adviser's supervision of third party service providers, principally custodians and subcustodians; and (iii) the resources devoted to, and the record of compliance with, the fund's compliance policies and procedures. The Board also reviewed the allocation of fund brokerage, including allocations to brokers affiliated with the Investment Advisers, the use of brokerage commissions to pay fund expenses, and the use of "soft" commission dollars to pay for research services.
The Board noted that the growth of fund assets over time across the complex allows Fidelity to reinvest in the development of services designed to enhance the value or convenience of the Fidelity funds as investment vehicles. These services include 24-hour access to account information and market information through telephone representatives and over the Internet, investor education materials and asset allocation tools, and the expanded availability of Fidelity Investor Centers, with 35 new branches opening since 2010.
Annual Report
Board Approval of Investment Advisory Contracts and
Management Fees - continued
Investment in a Large Fund Family. The Board considered the benefits to shareholders of investing in a Fidelity fund, including the benefits of investing in a fund that is part of a large family of funds offering a variety of investment disciplines and providing a large variety of mutual fund investor services. The Board noted that Fidelity had taken, or had made recommendations that resulted in the Fidelity funds taking, a number of actions over the previous year that benefited particular funds, including (i) continuing to dedicate additional resources to investment research and support of the senior management team that oversees asset management; (ii) rationalizing product lines through the mergers of six funds into other funds; (iii) continuing to migrate the Freedom Funds to dedicated lower cost underlying funds; (iv) obtaining shareholder approval to broaden the investment strategies for Fidelity Consumer Finance Portfolio, Fidelity Emerging Asia Fund, and Fidelity Environment and Alternative Energy Portfolio; (v) contractually agreeing to reduce the management fees and impose other expense limitations on Spartan® 500 Index Fund and U.S. Bond Index Fund in connection with launching new institutional classes of these funds; (vi) changing the name, primary and supplemental benchmarks, and investment policies of Fidelity Global Strategies Fund to support the fund's flexible investment mandate and global orientation; and (vii) reducing the transfer agency account fee rates on certain accounts.
Investment Performance. The Board considered whether the fund has operated in accordance with its investment objective, as well as its record of compliance with its investment restrictions. It also reviewed the fund's absolute investment performance for each class, as well as the fund's relative investment performance for each class measured over multiple periods against (i) a broad-based securities market index, and (ii) a peer group of mutual funds deemed appropriate by Fidelity and reviewed by the Board. The following charts considered by the Board show, over the one-, three-, and five-year periods ended December 31, 2010, the cumulative total returns of Institutional Class (Class I) and Class C of the fund, the cumulative total returns of a broad-based securities market index ("benchmark"), and a range of cumulative total returns of a peer group of mutual funds identified by Morningstar, Inc. as having an investment style similar to that of the fund based on underlying portfolio holdings. The returns of Institutional Class (Class I) and Class C show the performance of the highest and lowest performing classes, respectively (based on five-year performance). The box within each chart shows the 25th percentile return (bottom of box) and the 75th percentile return (top of box) of the peer group. Returns shown above the box are in the first quartile and returns shown below the box are in the fourth quartile. The percentage beaten numbers noted below each chart correspond to the percentile box and represent the percentage of funds in the peer group whose performance was equal to or lower than that of the class indicated.
Annual Report
Fidelity Small Cap Value Fund
The Board reviewed the fund's relative investment performance against its peer group and noted that the performance of Institutional Class (Class I) of the fund was in the third quartile for the one-year period and the first quartile for the three- and five-year periods. The Board also noted that the investment performance of Institutional Class (Class I) of the fund compared favorably to its benchmark for all the periods shown. The Board considered that the variations in performance among the fund's classes reflect the variations in class expenses, which result in lower performance for higher expense classes. The Board also reviewed the fund's performance since inception as well as performance in the current year.
The Board also considered that the fund's management fee is subject to upward or downward adjustment depending upon whether, and to what extent, the fund's investment performance for the performance period exceeds, or is exceeded by, the record (over the same period) of a Board-approved performance adjustment index. The Board noted that the performance adjustment provides FMR with a strong economic incentive to seek to achieve superior performance for the fund's shareholders and helps to more closely align the interests of FMR and the fund's shareholders.
Based on its review, the Board concluded that the nature, extent, and quality of services provided to the fund under the Advisory Contracts should benefit the fund's shareholders.
Annual Report
Board Approval of Investment Advisory Contracts and
Management Fees - continued
Competitiveness of Management Fee and Total Expense Ratio. The Board considered the fund's management fee and total expense ratio compared to "mapped groups" of competitive funds and classes. Fidelity creates "mapped groups" by combining similar Lipper investment objective categories that have comparable management fee characteristics. Combining Lipper investment objective categories aids the Board's management fee and total expense ratio comparisons by broadening the competitive group used for comparison and by reducing the number of universes to which various Fidelity funds are compared.
Management Fee. The Board considered two proprietary management fee comparisons for the 12-month periods shown in the chart below. The group of Lipper funds used by the Board for management fee comparisons is referred to below as the "Total Mapped Group." The Total Mapped Group comparison focuses on a fund's standing relative to the total universe of comparable funds available to investors in terms of gross management fees before expense reimbursements or caps, and without giving effect to the fund's performance adjustment. "TMG %" represents the percentage of funds in the Total Mapped Group that had management fees that were lower than the fund's. For example, a TMG % of 14% means that 86% of the funds in the Total Mapped Group had higher management fees than the fund. The "Asset-Size Peer Group" (ASPG) comparison focuses on a fund's standing relative to non-Fidelity funds similar in size to the fund within the Total Mapped Group. The ASPG represents at least 15% of the funds in the Total Mapped Group with comparable asset size and management fee characteristics, subject to a minimum of 50 funds (or all funds in the Total Mapped Group if fewer than 50). Additional information, such as the ASPG quartile in which the fund's management fee ranked and the impact of the fund's performance adjustment, is also included in the chart and considered by the Board.
Annual Report
Fidelity Small Cap Value Fund
The Board noted that the fund's management fee ranked below the median of its Total Mapped Group and below the median of its ASPG for 2010. The Board also noted the effect of the fund's positive performance adjustment on the fund's management fee ranking. The Board noted that the performance adjustment for each year represents calculations for performance periods that differ from the periods shown in the performance charts above.
Based on its review, the Board concluded that the fund's management fee is fair and reasonable in light of the services that the fund receives and the other factors considered.
Total Expense Ratio. In its review of each class's total expense ratio, the Board considered the fund's management fee as well as other fund or class expenses, as applicable, such as transfer agent fees, pricing and bookkeeping fees, fund-paid 12b-1 fees, and custodial, legal, and audit fees. The Board also noted the effects of any waivers and reimbursements on fees and expenses, as well as the impact of the fund's performance adjustment. As part of its review, the Board also considered the current and historical total expense ratios of each class of the fund compared to competitive fund median expenses. Each class of the fund is compared to those funds and classes in the Total Mapped Group (used by the Board for management fee comparisons) that have a similar sales load structure.
The Board noted that the total expense ratio of each of Institutional Class, the retail class, and Class F ranked below its competitive median for 2010 and the total expense ratio of each of Class A, Class T, Class B, and Class C ranked above its competitive median for 2010. The Board considered that various factors, including 12b-1 fees, positive or negative performance adjustments, and relatively higher other expenses in the case of small fund size, can affect total expense ratios. The Board noted that the total expense ratio of Class T was above the competitive median primarily because of higher 12b-1 fees on Class T. Class T has a higher 12b-1 fee, but a lower front-end sales charge, than traditionally priced front-end sales charge classes. The Board noted that the fund offers multiple classes, each of which has a different sales load and 12b-1 fee structure, and that the multiple structures are intended to offer a range of pricing options for the intermediary market. The Board also noted that the total expense ratios of the classes vary primarily by the level of their 12b-1 fees, although differences in transfer agent fees may also cause expenses to vary from class to class.
Annual Report
Board Approval of Investment Advisory Contracts and
Management Fees - continued
Fees Charged to Other Fidelity Clients. The Board also considered Fidelity fee structures and other information with respect to clients of FMR and its affiliates, such as other mutual funds advised or subadvised by FMR or its affiliates, pension plan clients, and other institutional clients. In March 2010, the Board created an ad hoc joint committee with the board of other Fidelity funds (the Committee) to review and compare Fidelity's institutional investment advisory business with its business of providing services to the Fidelity funds, including the differences in services provided, fees charged, and costs incurred, as well as competition in their respective marketplaces.
Based on its review of total expense ratios and fees charged to other Fidelity clients, the Board concluded that the total expense ratio of each class of the fund was reasonable, although in some cases above the median of the universe presented for comparison, in light of the services that the fund and its shareholders receive and the other factors considered, including the findings of the Committee.
Costs of the Services and Profitability. The Board considered the revenues earned and the expenses incurred by Fidelity in conducting the business of developing, marketing, distributing, managing, administering and servicing the fund and its shareholders. The Board also considered the level of Fidelity's profits in respect of all the Fidelity funds.
On an annual basis, FMR presents to the Board Fidelity's profitability for the fund. Fidelity calculates the profitability for each fund, as well as aggregate profitability for groups of Fidelity funds and all Fidelity funds, using a series of detailed revenue and cost allocation methodologies which originate with the books and records of Fidelity on which Fidelity's audited financial statements are based. The Audit Committee of the Board reviews any significant changes from the prior year's methodologies.
PricewaterhouseCoopers LLP (PwC), independent registered public accounting firm and auditor to Fidelity and certain Fidelity funds, has been engaged annually by the Board as part of the Board's assessment of Fidelity's profitability analysis. PwC's engagement includes the review and assessment of Fidelity's methodologies used in determining the revenues and expenses attributable to Fidelity's mutual fund business, and completion of agreed-upon procedures surrounding the mathematical accuracy of fund profitability and its conformity to allocation methodologies. After considering PwC's reports issued under the engagement and information provided by Fidelity, the Board concluded that while other allocation methods may also be reasonable, Fidelity's profitability methodologies are reasonable in all material respects.
Annual Report
The Board also reviewed Fidelity's non-fund businesses and fall-out benefits related to the mutual fund business as well as cases where Fidelity's affiliates may benefit from or be related to the fund's business.
The Board considered the costs of the services provided by and the profits realized by Fidelity in connection with the operation of the fund and was satisfied that the profitability was not excessive in the circumstances.
Economies of Scale. The Board considered whether there have been economies of scale in respect of the management of the Fidelity funds, whether the Fidelity funds (including the fund) have appropriately benefited from any such economies of scale, and whether there is potential for realization of any further economies of scale. The Board considered the extent to which the fund will benefit from economies of scale through increased services to the fund, through waivers or reimbursements, or through fee or expense reductions. The Board also noted that in 2009, it and the board of other Fidelity funds created an ad hoc committee (the Economies of Scale Committee) to analyze whether FMR attains economies of scale in respect of the management and servicing of the Fidelity funds, whether the Fidelity funds have appropriately benefited from such economies of scale, and whether there is potential for realization of any further economies of scale.
The Board recognized that the fund's management contract incorporates a "group fee" structure, which provides for lower group fee rates as total fund assets under FMR's management increase, and for higher group fee rates as total fund assets under FMR's management decrease. FMR calculates the group fee rates based on a tiered asset "breakpoint" schedule that varies based on asset class. The Board considered that the group fee is designed to deliver the benefits of economies of scale to fund shareholders when total Fidelity fund assets increase, even if assets of any particular fund are unchanged or have declined, because some portion of Fidelity's costs are attributable to services provided to all Fidelity funds, and all funds benefit if those costs can be allocated among more assets. The Board concluded that, given the group fee structure, fund shareholders will benefit from lower management fees as assets under FMR's management increase at the fund complex level, regardless of whether Fidelity achieves any such economies of scale.
The Board concluded, taking into account the analysis of the Economies of Scale Committee, that any potential economies of scale are being appropriately shared between fund shareholders and Fidelity.
Annual Report
Board Approval of Investment Advisory Contracts and
Management Fees - continued
Additional Information Requested by the Board. In order to develop fully the factual basis for consideration of the Fidelity funds' Advisory Contracts, the Board requested and received additional information on certain topics, including (i) fund performance trends, actions to be taken by FMR to improve certain funds' overall performance, and Fidelity's long-term strategies for certain funds; (ii) portfolio manager changes that have occurred during the past year and length of portfolio manager tenure for different categories of funds over time; (iii) Fidelity's compensation structure for portfolio managers and other key personnel and strategies for attracting and retaining non-investment personnel; (iv) the amount of the investment that each portfolio manager has made in the Fidelity fund(s) that he or she manages; (v) historical trends in Fidelity's realization of fall-out benefits; (vi) Fidelity's group fee structures and the rationale for the individual fee rates of certain funds; (vii) fund profitability methodology and the impact of certain factors on fund profitability results; (viii) trends regarding industry use of performance fee structures and Fidelity's compliance practices with respect to performance adjustment calculations; (ix) the fee structures in place for certain other Fidelity clients; and (x) explanations regarding the relative total expense ratios of certain funds and classes, total expense competitive trends, and actions that might be taken by FMR to reduce total expense ratios for certain funds and classes.
Based on its evaluation of all of the conclusions noted above, and after considering all factors it believed relevant, the Board ultimately concluded that the advisory fee structures are fair and reasonable, and that the fund's Advisory Contracts should be renewed.
Annual Report
Investment Adviser
Fidelity Management & Research Company
Boston, MA
Investment Sub-Advisers
FMR Co., Inc.
Fidelity Management & Research
(U.K.) Inc.
Fidelity Management & Research
(Hong Kong) Limited
Fidelity Management & Research
(Japan) Inc.
General Distributor
Fidelity Distributors Corporation
Boston, MA
Transfer and Service Agents
Fidelity Investments Institutional
Operations Company, Inc.
Boston, MA
Fidelity Service Company, Inc.
Boston, MA
Custodian
Citibank, N.A.
New York, NY
ASCVI-UANN-0911
1.803743.106
Item 2. Code of Ethics
As of the end of the period, July 31, 2011, Fidelity Securities Fund (the trust) has adopted a code of ethics, as defined in Item 2 of Form N-CSR, that applies to its President and Treasurer and its Chief Financial Officer. A copy of the code of ethics is filed as an exhibit to this Form N-CSR.
Item 3. Audit Committee Financial Expert
The Board of Trustees of the trust has determined that Joseph Mauriello is an audit committee financial expert, as defined in Item 3 of Form N-CSR. Mr. Mauriello is independent for purposes of Item 3 of Form N-CSR.
Item 4. Principal Accountant Fees and Services
Fees and Services
The following table presents fees billed by Deloitte & Touche LLP, the member firms of Deloitte Touche Tohmatsu, and their respective affiliates (collectively, "Deloitte Entities") in each of the last two fiscal years for services rendered to Fidelity Blue Chip Growth Fund, Fidelity OTC Portfolio, Fidelity Real Estate Income Fund, and Fidelity Series Small Cap Opportunities Fund (the "Funds"):
Services Billed by Deloitte Entities
July 31, 2011 FeesA
| Audit Fees | Audit-Related Fees | Tax Fees | All Other Fees |
Fidelity Blue Chip Growth Fund | $50,000 | $- | $4,900 | $1,000 |
Fidelity OTC Portfolio | $43,000 | $- | $6,000 | $600 |
Fidelity Real Estate Income Fund | $144,000 | $- | $7,600 | $300 |
Fidelity Series Small Cap Opportunities Fund | $46,000 | $- | $4,600 | $300 |
July 31, 2010 FeesA
| Audit Fees | Audit-Related Fees | Tax Fees | All Other Fees |
Fidelity Blue Chip Growth Fund | $49,000 | $- | $4,700 | $- |
Fidelity OTC Portfolio | $42,000 | $- | $5,600 | $- |
Fidelity Real Estate Income Fund | $145,000 | $- | $6,900 | $- |
Fidelity Series Small Cap Opportunities Fund | $45,000 | $- | $5,000 | $- |
A Amounts may reflect rounding.
The following table presents fees billed by PricewaterhouseCoopers LLP ("PwC") in each of the last two fiscal years for services rendered to Fidelity Blue Chip Value Fund, Fidelity Dividend Growth Fund, Fidelity Growth & Income Portfolio, Fidelity International Real Estate Fund, Fidelity Leveraged Company Stock Fund, Fidelity Small Cap Growth Fund, and Fidelity Small Cap Value Fund (the "Funds"):
Services Billed by PwC
July 31, 2011 FeesA
| Audit Fees | Audit-Related Fees | Tax Fees | All Other Fees |
Fidelity Blue Chip Value Fund | $50,000 | $- | $3,300 | $2,000 |
Fidelity Dividend Growth Fund | $69,000 | $- | $3,300 | $6,600 |
Fidelity Growth & Income Portfolio | $72,000 | $- | $4,300 | $4,900 |
Fidelity International Real Estate Fund | $59,000 | $- | $7,400 | $2,000 |
Fidelity Leveraged Company Stock Fund | $55,000 | $- | $4,300 | $4,100 |
Fidelity Small Cap Growth Fund | $51,000 | $- | $3,300 | $2,700 |
Fidelity Small Cap Value Fund | $53,000 | $- | $3,300 | $3,000 |
July 31, 2010 FeesA
| Audit Fees | Audit-Related Fees | Tax Fees | All Other Fees |
Fidelity Blue Chip Value Fund | $48,000 | $- | $3,200 | $1,700 |
Fidelity Dividend Growth Fund | $68,000 | $- | $3,200 | $5,700 |
Fidelity Growth & Income Portfolio | $74,000 | $- | $4,100 | $5,000 |
Fidelity International Real Estate Fund | $56,000 | $- | $7,100 | $1,700 |
Fidelity Leveraged Company Stock Fund | $55,000 | $- | $4,100 | $3,900 |
Fidelity Small Cap Growth Fund | $50,000 | $- | $3,200 | $2,300 |
Fidelity Small Cap Value Fund | $51,000 | $- | $3,200 | $2,600 |
A Amounts may reflect rounding.
The following table presents fees billed by PwC and Deloitte Entities that were required to be approved by the Audit Committee for services that relate directly to the operations and financial reporting of the Funds and that are rendered on behalf of Fidelity Management & Research Company ("FMR") and entities controlling, controlled by, or under common control with FMR (not including any sub-adviser whose role is primarily portfolio management and is subcontracted with or overseen by another investment adviser) that provide ongoing services to the Funds ("Fund Service Providers"):
Services Billed by Deloitte Entities
| July 31, 2011A | July 31, 2010A |
Audit-Related Fees | $645,000 | $720,000 |
Tax Fees | $- | $- |
All Other Fees | $730,000 | $450,000 |
A Amounts may reflect rounding.
Services Billed by PwC
| July 31, 2011A | July 31, 2010A |
Audit-Related Fees | $1,860,000 | $2,180,000 |
Tax Fees | $- | $- |
All Other Fees | $365,000 | $145,000 |
A Amounts may reflect rounding.
"Audit-Related Fees" represent fees billed for assurance and related services that are reasonably related to the performance of the fund audit or the review of the fund's financial statements and that are not reported under Audit Fees.
"Tax Fees" represent fees billed for tax compliance, tax advice or tax planning that relate directly to the operations and financial reporting of the fund.
"All Other Fees" represent fees billed for services provided to the fund or Fund Service Provider, a significant portion of which are assurance related, that relate directly to the operations and financial reporting of the fund, excluding those services that are reported under Audit Fees, Audit-Related Fees or Tax Fees.
Assurance services must be performed by an independent public accountant.
* * *
The aggregate non-audit fees billed by PwC and Deloitte Entities for services rendered to the Funds, FMR (not including any sub-adviser whose role is primarily portfolio management and is subcontracted with or overseen by another investment adviser), and any Fund Service Provider for each of the last two fiscal years of the Funds are as follows:
Billed By | July 31, 2011 A | July 31, 2010 A |
PwC | $4,145,000 | $4,540,000 |
Deloitte Entities | $1,495,000 | $1,225,000 |
A Amounts may reflect rounding.
The trust's Audit Committee has considered non-audit services that were not pre-approved that were provided by PwC and Deloitte Entities to Fund Service Providers to be compatible with maintaining the independence of PwC and Deloitte Entities in their audits of the Funds, taking into account representations from PwC and Deloitte Entities, in accordance with Public Company Accounting Oversight Board rules, regarding their independence from the Funds and their related entities and FMR's review of the appropriateness and permissibility under applicable law of such non-audit services prior to their provision to the Fund Service Providers.
Audit Committee Pre-Approval Policies and Procedures
The trust's Audit Committee must pre-approve all audit and non-audit services provided by a fund's independent registered public accounting firm relating to the operations or financial reporting of the fund. Prior to the commencement of any audit or non-audit services to a fund, the Audit Committee reviews the services to determine whether they are appropriate and permissible under applicable law.
The Audit Committee has adopted policies and procedures to, among other purposes, provide a framework for the Committee's consideration of non-audit services by the audit firms that audit the Fidelity funds. The policies and procedures require that any non-audit service provided by a fund audit firm to a Fidelity fund and any non-audit service provided by a fund auditor to a Fund Service Provider that relates directly to the operations and financial reporting of a Fidelity fund ("Covered Service") are subject to approval by the Audit Committee before such service is provided.
All Covered Services must be approved in advance of provision of the service either: (i) by formal resolution of the Audit Committee, or (ii) by oral or written approval of the service by the Chair of the Audit Committee (or if the Chair is unavailable, such other member of the Audit Committee as may be designated by the Chair to act in the Chair's absence). The approval contemplated by (ii) above is permitted where the Treasurer determines that action on such an engagement is necessary before the next meeting of the Audit Committee.
Non-audit services provided by a fund audit firm to a Fund Service Provider that do not relate directly to the operations and financial reporting of a Fidelity fund are reported to the Audit Committee on a periodic basis.
Non-Audit Services Approved Pursuant to Rule 2-01(c)(7)(i)(C) and (ii) of Regulation S-X ("De Minimis Exception")
There were no non-audit services approved or required to be approved by the Audit Committee pursuant to the De Minimis Exception during the Funds' last two fiscal years relating to services provided to (i) the Funds or (ii) any Fund Service Provider that relate directly to the operations and financial reporting of the Funds.
Item 5. Audit Committee of Listed Registrants
Not applicable.
Item 6. Investments
(a) Not applicable.
(b) Not applicable
Item 7. Disclosure of Proxy Voting Policies and Procedures for Closed-End Management Investment Companies
Not applicable.
Item 8. Portfolio Managers of Closed-End Management Investment Companies
Not applicable.
Item 9. Purchase of Equity Securities by Closed-End Management Investment Company and Affiliated Purchasers
Not applicable.
Item 10. Submission of Matters to a Vote of Security Holders
There were no material changes to the procedures by which shareholders may recommend nominees to the trust's Board of Trustees.
Item 11. Controls and Procedures
(a)(i) The President and Treasurer and the Chief Financial Officer have concluded that the trust's disclosure controls and procedures (as defined in Rule 30a-3(c) under the Investment Company Act) provide reasonable assurances that material information relating to the trust is made known to them by the appropriate persons, based on their evaluation of these controls and procedures as of a date within 90 days of the filing date of this report.
(a)(ii) There was no change in the trust's internal control over financial reporting (as defined in Rule 30a-3(d) under the Investment Company Act) that occurred during the second fiscal quarter of the period covered by this report that has materially affected, or is reasonably likely to materially affect, the trust's internal control over financial reporting.
Item 12. Exhibits
(a) | (1) | Code of Ethics pursuant to Item 2 of Form N-CSR is filed and attached hereto as EX-99.CODE ETH. |
(a) | (2) | Certification pursuant to Rule 30a-2(a) under the Investment Company Act of 1940 (17 CFR 270.30a-2(a)) is filed and attached hereto as Exhibit 99.CERT. |
(a) | (3) | Not applicable. |
(b) | | Certification pursuant to Rule 30a-2(b) under the Investment Company Act of 1940 (17 CFR 270.30a-2(b)) is furnished and attached hereto as Exhibit 99.906CERT. |
SIGNATURES
Pursuant to the requirements of the Securities Exchange Act of 1934 and the Investment Company Act of 1940, the registrant has duly caused this report to be signed on its behalf by the undersigned, thereunto duly authorized.
Fidelity Securities Fund
By: | /s/Kenneth B. Robins |
| Kenneth B. Robins |
| President and Treasurer |
| |
Date: | September 26, 2011 |
Pursuant to the requirements of the Securities Exchange Act of 1934 and the Investment Company Act of 1940, this report has been signed below by the following persons on behalf of the registrant and in the capacities and on the dates indicated.
By: | /s/Kenneth B. Robins |
| Kenneth B. Robins |
| President and Treasurer |
| |
Date: | September 26, 2011 |
By: | /s/Christine Reynolds |
| Christine Reynolds |
| Chief Financial Officer |
| |
Date: | September 26, 2011 |