UNITED STATES
SECURITIES AND EXCHANGE COMMISSION
Washington, D.C. 20549
FORM N-CSR
CERTIFIED SHAREHOLDER REPORT OF REGISTERED
MANAGEMENT INVESTMENT COMPANIES
Investment Company Act file number 811-4118
Fidelity Securities Fund
(Exact name of registrant as specified in charter)
82 Devonshire St., Boston, Massachusetts 02109
(Address of principal executive offices) (Zip code)
Eric D. Roiter, Secretary
82 Devonshire St.
Boston, Massachusetts 02109
(Name and address of agent for service)
Registrant's telephone number, including area code: 617-563-7000
Date of fiscal year end: | July 31 |
Date of reporting period: | January 31, 2006 |
Item 1. Reports to Stockholders
| Fidelity® Blue Chip Growth Fund |
| Semiannual Report January 31, 2006 |
![]()

| Contents | ||||
| Chairman’s Message | 3 | Ned Johnson’s message to shareholders. | ||
| Shareholder Expense | 4 | An example of shareholder expenses. | ||
| Example | ||||
| Investment Changes | 5 | A summary of major shifts in the fund’s | ||
| investments over the past six months. | ||||
| Investments | 6 | A complete list of the fund’s investments | ||
| with their market values. | ||||
| Financial Statements | 16 | Statements of assets and liabilities, | ||
| operations, and changes in net assets, | ||||
| as well as financial highlights. | ||||
| Notes | 20 | Notes to the financial statements. | ||
| Board Approval of | 26 | |||
| Investment Advisory | ||||
| Contracts and | ||||
| Management Fees | ||||
| To view a fund’s proxy voting guidelines and proxy voting record for the 12 month period ended June 30, visit www.fidelity.com/proxyvotingresults or visit the Securities and Exchange Commission’s (SEC) web site at www.sec.gov. You may also call 1-800-544-8544 to request a free copy of the proxy voting guidelines. Standard & Poor’s, S&P and S&P 500 are registered service marks of The McGraw Hill Companies, Inc. and have been licensed for use by Fidelity Distributors Corporation. Other third party marks appearing herein are the property of their respective owners. All other marks appearing herein are registered or unregistered trademarks or service marks of FMR Corp. or an affiliated company. |
| This report and the financial statements contained herein are submitted for the general information of the shareholders of the fund. This report is not authorized for distribution to prospective investors in the fund unless preceded or accompanied by an effective prospectus. A fund files its complete schedule of portfolio holdings with the SEC for the first and third quar ters of each fiscal year on Form N Q. Forms N Q are available on the SEC’s web site at http://www.sec.gov. A fund’s Forms N Q may be reviewed and copied at the SEC’s Public Refer ence Room in Washington, DC. Information regarding the operation of the SEC’s Public Refer ence Room may be obtained by calling 1-800-SEC-0330. For a complete list of a fund’s portfolio holdings, view the most recent quarterly holdings report, semiannual report, or annual report on Fidelity’s web site at http://www.fidelity.com/holdings. NOT FDIC INSURED · MAY LOSE VALUE · NO BANK GUARANTEE Neither the fund nor Fidelity Distributors Corporation is a bank. |
Semiannual Report 2
Chairman’s Message
(photograph of Edward C. Johnson 3d)
Dear Shareholder:
During the past year or so, much has been reported about the mutual fund industry, and much of it has been more critical than I believe is warranted. Allegations that some companies have been less than forthright with their shareholders have cast a shadow on the entire industry. I continue to find these reports disturbing, and assert that they do not create an accurate picture of the industry overall. Therefore, I would like to remind every one where Fidelity stands on these issues. I will say two things specifically regarding allegations that some mutual fund companies were in violation of the Securities and Exchange Commission’s forward pricing rules or were involved in so called “market timing” activities.
First, Fidelity has no agreements that permit customers who buy fund shares after 4 p.m. to obtain the 4 p.m. price. This is not a new policy. This is not to say that some one could not deceive the company through fraudulent acts. However, we are extremely diligent in preventing fraud from occurring in this manner and in every other. But I underscore again that Fidelity has no so called “agreements” that sanction illegal practices.
Second, Fidelity continues to stand on record, as we have for years, in opposition to predatory short term trading that adversely affects shareholders in a mutual fund. Back in the 1980s, we initiated a fee which is returned to the fund and, therefore, to investors to discourage this activity. Further, we took the lead several years ago in developing a Fair Value Pricing Policy to prevent market timing on foreign securities in our funds. I am confident we will find other ways to make it more difficult for predatory traders to operate. However, this will only be achieved through close cooperation among regulators, legislators and the industry.
Yes, there have been unfortunate instances of unethical and illegal activity within the mutual fund industry from time to time. That is true of any industry. When this occurs, confessed or convicted offenders should be dealt with appropriately. But we are still concerned about the risk of over regulation and the quick application of simplistic solutions to intricate problems. Every system can be improved, and we support and applaud well thought out improvements by regulators, legislators and industry representatives that achieve the common goal of building and protecting the value of investors’ holdings.
For nearly 60 years, Fidelity has worked very hard to improve its products and service to justify your trust. When our family founded this company in 1946, we had only a few hundred customers. Today, we serve more than 18 million customers including individual investors and participants in retirement plans across America. Let me close by saying that we do not take your trust in us for granted, and we realize that we must always work to improve all aspects of our service to you. In turn, we urge you to continue your active participation with your financial matters, so that your interests can be well served.
Best regards,
/s/ Edward C. Johnson 3d
Edward C. Johnson 3d
3 Semiannual Report
Shareholder Expense Example
As a shareholder of the Fund, you incur two types of costs: (1) transaction costs, and (2) ongoing costs, including management fees and other Fund expenses. This Example is intended to help you understand your ongoing costs (in dollars) of investing in the Fund and to compare these costs with the ongoing costs of investing in other mutual funds. The Example is based on an investment of $1,000 invested at the beginning of the period and held for the entire period (August 1, 2005 to January 31, 2006).
| Actual Expenses |
The first line of the table below provides information about actual account values and actual expenses. You may use the information in this line, together with the amount you invested, to estimate the expenses that you paid over the period. Simply divide your account value by $1,000.00 (for example, an $8,600 account value divided by $1,000.00 = 8.6), then multiply the result by the number in the first line under the heading entitled “Expenses Paid During Period” to estimate the expenses you paid on your account during this period. A small balance maintenance fee of $12.00 that is charged once a year may apply for certain accounts with a value of less than $2,000. This fee is not included in the table below. If it was, the estimate of expenses you paid during the period would be higher, and your ending account value lower, by this amount.
Hypothetical Example for Comparison Purposes
The second line of the table below provides information about hypothetical account values and hypothetical expenses based on the Fund’s actual expense ratio and an assumed rate of return of 5% per year before expenses, which is not the Fund’s actual return. The hypothetical account values and expenses may not be used to estimate the actual ending account balance or expenses you paid for the period. You may use this information to compare the ongoing costs of investing in the Fund and other funds. To do so, compare this 5% hypothetical example with the 5% hypothetical examples that appear in the share holder reports of the other funds. A small balance maintenance fee of $12.00 that is charged once a year may apply for certain accounts with a value of less than $2,000. This fee is not included in the table below. If it was, the estimate of expenses you paid during the period would be higher, and your ending account value lower, by this amount.
Please note that the expenses shown in the table are meant to highlight your ongoing costs only and do not reflect any transaction costs. Therefore, the second line of the table is useful in comparing ongoing costs only, and will not help you determine the relative total costs of owning different funds.
| Expenses Paid | ||||||||||||
| Beginning | Ending | During Period* | ||||||||||
| Account Value | Account Value | August 1, 2005 to | ||||||||||
| August 1, 2005 | January 31, 2006 | January 31, 2006 | ||||||||||
| Actual | $ | 1,000.00 | $ | 1,040.50 | $ | 3.29 | ||||||
| Hypothetical (5% return per year | ||||||||||||
| before expenses) | $ | 1,000.00 | $ | 1,021.98 | $ | 3.26 | ||||||
* Expenses are equal to the Fund’s annualized expense ratio of .64%; multiplied by the average account value over the period, multiplied by 184/365 (to reflect the one half year period).
| Semiannual Report |
| 4 |
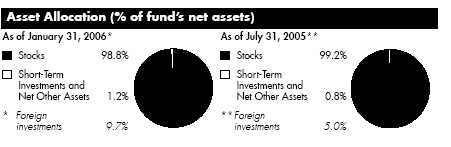
| Investment Changes | ||||
| Top Ten Stocks as of January 31, 2006 | ||||
| % of fund’s | % of fund’s net assets | |||
| net assets | 6 months ago | |||
| Microsoft Corp. | 5.0 | 4.3 | ||
| General Electric Co. | 3.6 | 3.8 | ||
| Johnson & Johnson | 3.1 | 2.7 | ||
| American International Group, Inc. | 2.9 | 2.4 | ||
| Wal Mart Stores, Inc. | 2.6 | 2.0 | ||
| UnitedHealth Group, Inc. | 2.0 | 1.7 | ||
| Wyeth | 2.0 | 1.6 | ||
| Schlumberger Ltd. (NY Shares) | 1.8 | 1.0 | ||
| PepsiCo, Inc. | 1.8 | 1.6 | ||
| Halliburton Co. | 1.7 | 1.3 | ||
| 26.5 | ||||
| Top Five Market Sectors as of January 31, 2006 | ||||
| % of fund’s | % of fund’s net assets | |||
| net assets | 6 months ago | |||
| Information Technology | 24.4 | 25.8 | ||
| Health Care | 22.8 | 21.3 | ||
| Financials | 11.7 | 10.5 | ||
| Consumer Discretionary | 10.7 | 12.1 | ||
| Consumer Staples | 10.4 | 10.5 | ||
5 Semiannual Report
| Investments January 31, 2006 (Unaudited) | ||||||
| Showing Percentage of Net Assets | ||||||
| Common Stocks 98.8% | ||||||
| Shares | Value (Note 1) | |||||
| (000s) | ||||||
| CONSUMER DISCRETIONARY – 10.7% | ||||||
| Hotels, Restaurants & Leisure 0.9% | ||||||
| Carnival Corp. unit | 2,547,200 | $ | 131,843 | |||
| Chipotle Mexican Grill, Inc. Class A | 15,100 | 718 | ||||
| Jack in the Box, Inc. (a) | 200,000 | 7,952 | ||||
| Royal Caribbean Cruises Ltd. | 1,468,300 | 60,053 | ||||
| 200,566 | ||||||
| Household Durables – 0.3% | ||||||
| Sony Corp. sponsored ADR | 1,461,400 | 71,462 | ||||
| Internet & Catalog Retail 0.9% | ||||||
| eBay, Inc. (a) | 4,408,200 | 189,993 | ||||
| GSI Commerce, Inc. (a) | 850,000 | 14,340 | ||||
| 204,333 | ||||||
| Media – 1.8% | ||||||
| EchoStar Communications Corp. Class A (a) | 1,326,534 | 36,612 | ||||
| Getty Images, Inc. (a) | 261,960 | 21,389 | ||||
| Omnicom Group, Inc. | 2,159,400 | 176,617 | ||||
| Univision Communications, Inc. Class A (a) | 3,609,500 | 114,926 | ||||
| XM Satellite Radio Holdings, Inc. Class A (a) | 1,547,500 | 40,514 | ||||
| 390,058 | ||||||
| Multiline Retail – 2.1% | ||||||
| Dollar General Corp. | 2,488,900 | 42,062 | ||||
| Federated Department Stores, Inc. | 1,121,900 | 74,752 | ||||
| Target Corp. | 6,168,800 | 337,742 | ||||
| 454,556 | ||||||
| Specialty Retail – 4.6% | ||||||
| Best Buy Co., Inc. | 4,785,100 | 242,413 | ||||
| Circuit City Stores, Inc. | 1,900,000 | 47,899 | ||||
| Home Depot, Inc. | 5,221,200 | 211,720 | ||||
| Lowe’s Companies, Inc. | 3,222,300 | 204,777 | ||||
| Staples, Inc. | 7,967,900 | 188,919 | ||||
| Urban Outfitters, Inc. (a) | 4,396,700 | 120,074 | ||||
| 1,015,802 | ||||||
| Textiles, Apparel & Luxury Goods – 0.1% | ||||||
| Carter’s, Inc. (a) | 175,000 | 11,898 | ||||
| NIKE, Inc. Class B | 177,400 | 14,361 | ||||
| 26,259 | ||||||
| TOTAL CONSUMER DISCRETIONARY | 2,363,036 | |||||
| See accompanying notes which are an integral part of the financial statements. | ||||||
| Semiannual Report | 6 | |||||
| Common Stocks continued | ||||||
| Shares | Value (Note 1) | |||||
| (000s) | ||||||
| CONSUMER STAPLES – 10.4% | ||||||
| Beverages – 1.8% | ||||||
| PepsiCo, Inc. | 6,758,762 | $ | 386,466 | |||
| Food & Staples Retailing – 3.7% | ||||||
| CVS Corp. | 2,810,400 | 78,017 | ||||
| Wal-Mart Stores, Inc. | 12,405,855 | 572,034 | ||||
| Walgreen Co. | 3,879,900 | 167,922 | ||||
| 817,973 | ||||||
| Food Products 0.9% | ||||||
| Global Bio-Chem Technology Group Co. Ltd. | 35,330,000 | 19,046 | ||||
| Nestle SA sponsored ADR | 2,538,600 | 186,333 | ||||
| 205,379 | ||||||
| Household Products – 1.9% | ||||||
| Colgate-Palmolive Co. | 3,031,800 | 166,416 | ||||
| Procter & Gamble Co. | 4,312,005 | 255,400 | ||||
| 421,816 | ||||||
| Personal Products 0.6% | ||||||
| Avon Products, Inc. | 4,531,500 | 128,332 | ||||
| Tobacco 1.5% | ||||||
| Altria Group, Inc. | 4,436,300 | 320,922 | ||||
| TOTAL CONSUMER STAPLES | 2,280,888 | |||||
| ENERGY 7.8% | ||||||
| Energy Equipment & Services – 6.3% | ||||||
| Baker Hughes, Inc. | 2,760,800 | 213,796 | ||||
| BJ Services Co. | 2,770,100 | 112,161 | ||||
| Diamond Offshore Drilling, Inc. | 764,500 | 64,883 | ||||
| Halliburton Co. | 4,719,200 | 375,412 | ||||
| National Oilwell Varco, Inc. (a) | 94,973 | 7,225 | ||||
| Schlumberger Ltd. (NY Shares) | 3,101,200 | 395,248 | ||||
| Transocean, Inc. (a) | 1,407,900 | 114,251 | ||||
| Weatherford International Ltd. (a) | 2,087,600 | 93,483 | ||||
| 1,376,459 | ||||||
| Oil, Gas & Consumable Fuels – 1.5% | ||||||
| Amerada Hess Corp. | 574,900 | 88,995 | ||||
| BG Group PLC sponsored ADR | 394,900 | 22,426 | ||||
| BP PLC sponsored ADR | 142,100 | 10,275 | ||||
| Chevron Corp. | 1,974,200 | 117,228 | ||||
See accompanying notes which are an integral part of the financial statements.
| 7 Semiannual Report |
| Investments (Unaudited) continued | ||||||
| Common Stocks continued | ||||||
| Shares | Value (Note 1) | |||||
| (000s) | ||||||
| ENERGY – continued | ||||||
| Oil, Gas & Consumable Fuels – continued | ||||||
| Total SA sponsored ADR | 373,500 | $ | 51,666 | |||
| Valero Energy Corp. | 727,200 | 45,399 | ||||
| 335,989 | ||||||
| TOTAL ENERGY | 1,712,448 | |||||
| FINANCIALS – 11.7% | ||||||
| Capital Markets 2.7% | ||||||
| Ameriprise Financial, Inc. | 1,808,325 | 73,581 | ||||
| Credit Suisse Group sponsored ADR | 1,611,400 | 94,299 | ||||
| E*TRADE Securities Co. Ltd. (d) | 6,000 | 16,927 | ||||
| Goldman Sachs Group, Inc. | 108,000 | 15,255 | ||||
| Nomura Holdings, Inc. sponsored ADR | 6,677,300 | 130,274 | ||||
| State Street Corp. | 2,847,300 | 172,148 | ||||
| UBS AG (NY Shares) | 868,500 | 94,493 | ||||
| 596,977 | ||||||
| Commercial Banks – 0.7% | ||||||
| Bank of America Corp. | 314,300 | 13,901 | ||||
| Mitsubishi UFJ Financial Group, Inc. sponsored ADR | 9,017,800 | 130,307 | ||||
| 144,208 | ||||||
| Consumer Finance – 1.8% | ||||||
| American Express Co. | 5,063,129 | 265,561 | ||||
| SLM Corp. | 2,420,800 | 135,468 | ||||
| 401,029 | ||||||
| Diversified Financial Services – 0.0% | ||||||
| IntercontinentalExchange, Inc. | 31,300 | 1,591 | ||||
| Insurance – 4.9% | ||||||
| AFLAC, Inc. | 1,979,100 | 92,919 | ||||
| AMBAC Financial Group, Inc. | 1,238,700 | 95,145 | ||||
| American International Group, Inc. | 9,807,555 | 642,003 | ||||
| Hartford Financial Services Group, Inc. | 115,000 | 9,456 | ||||
| MBIA, Inc. | 741,050 | 45,619 | ||||
| Prudential Financial, Inc. | 1,578,000 | 118,887 | ||||
| The St. Paul Travelers Companies, Inc. | 1,655,500 | 75,127 | ||||
| 1,079,156 | ||||||
See accompanying notes which are an integral part of the financial statements.
| Semiannual Report |
| 8 |
| Common Stocks continued | ||||||
| Shares | Value (Note 1) | |||||
| (000s) | ||||||
| FINANCIALS – continued | ||||||
| Thrifts & Mortgage Finance – 1.6% | ||||||
| Fannie Mae | 4,044,200 | $ | 234,321 | |||
| Golden West Financial Corp., Delaware | 1,635,400 | 115,492 | ||||
| 349,813 | ||||||
| TOTAL FINANCIALS | 2,572,774 | |||||
| HEALTH CARE – 22.8% | ||||||
| Biotechnology – 4.2% | ||||||
| Affymetrix, Inc. (a) | 500,000 | 19,090 | ||||
| Alnylam Pharmaceuticals, Inc. (a) | 106,800 | 1,435 | ||||
| Amgen, Inc. (a) | 4,705,800 | 343,006 | ||||
| Arena Pharmaceuticals, Inc. (a) | 187,500 | 3,182 | ||||
| Biogen Idec, Inc. (a) | 1,490,650 | 66,707 | ||||
| Cephalon, Inc. (a) | 726,700 | 51,516 | ||||
| Genentech, Inc. (a) | 3,715,600 | 319,244 | ||||
| Gilead Sciences, Inc. (a) | 2,016,800 | 122,763 | ||||
| 926,943 | ||||||
| Health Care Equipment & Supplies – 4.8% | ||||||
| Baxter International, Inc. | 5,172,200 | 190,596 | ||||
| Becton, Dickinson & Co. | 1,356,100 | 87,875 | ||||
| C.R. Bard, Inc. | 2,392,600 | 151,739 | ||||
| Cytyc Corp. (a) | 2,796,300 | 84,169 | ||||
| Fisher Scientific International, Inc. (a) | 1,145,500 | 76,600 | ||||
| Medtronic, Inc. | 3,484,800 | 196,787 | ||||
| Millipore Corp. (a) | 1,370,400 | 94,256 | ||||
| St. Jude Medical, Inc. (a) | 2,137,700 | 105,025 | ||||
| Waters Corp. (a) | 1,421,800 | 59,645 | ||||
| 1,046,692 | ||||||
| Health Care Providers & Services – 5.5% | ||||||
| Acibadem Saglik Hizmetleri AS | 1,500,000 | 15,748 | ||||
| Aetna, Inc. | 2,164,900 | 209,562 | ||||
| Cardinal Health, Inc. | 2,330,075 | 167,859 | ||||
| McKesson Corp. | 372,600 | 19,748 | ||||
| Medco Health Solutions, Inc. (a) | 1,865,200 | 100,907 | ||||
| Omnicare, Inc. | 1,498,500 | 74,475 | ||||
| UnitedHealth Group, Inc. | 7,456,400 | 443,059 | ||||
| WellPoint, Inc. (a) | 2,364,100 | 181,563 | ||||
| 1,212,921 | ||||||
See accompanying notes which are an integral part of the financial statements.
| 9 Semiannual Report |
| Investments (Unaudited) continued | ||||||
| Common Stocks continued | ||||||
| Shares | Value (Note 1) | |||||
| (000s) | ||||||
| HEALTH CARE – continued | ||||||
| Pharmaceuticals – 8.3% | ||||||
| Allergan, Inc. | 1,184,100 | $ | 137,829 | |||
| Barr Pharmaceuticals, Inc. (a) | 1,356,500 | 88,959 | ||||
| Johnson & Johnson | 11,656,804 | 670,733 | ||||
| Nastech Pharmaceutical Co., Inc. (a)(e) | 1,665,200 | 26,477 | ||||
| Novartis AG sponsored ADR | 4,733,700 | 261,111 | ||||
| Schering-Plough Corp. | 10,226,300 | 195,834 | ||||
| Wyeth | 9,521,100 | 440,351 | ||||
| 1,821,294 | ||||||
| TOTAL HEALTH CARE | 5,007,850 | |||||
| INDUSTRIALS – 7.7% | ||||||
| Aerospace & Defense – 1.6% | ||||||
| Honeywell International, Inc. | 5,962,100 | 229,064 | ||||
| United Technologies Corp. | 2,034,400 | 118,748 | ||||
| 347,812 | ||||||
| Air Freight & Logistics – 0.2% | ||||||
| FedEx Corp. | 558,400 | 56,482 | ||||
| Commercial Services & Supplies – 0.6% | ||||||
| Cintas Corp. | 1,113,200 | 47,422 | ||||
| Robert Half International, Inc. | 2,204,900 | 80,545 | ||||
| 127,967 | ||||||
| Construction & Engineering – 0.8% | ||||||
| Chicago Bridge & Iron Co. NV (NY Shares) | 570,942 | 17,614 | ||||
| Fluor Corp. | 1,644,100 | 144,599 | ||||
| Jacobs Engineering Group, Inc. (a) | 112,000 | 9,337 | ||||
| 171,550 | ||||||
| Electrical Equipment – 0.2% | ||||||
| Roper Industries, Inc. | 919,900 | 37,118 | ||||
| Industrial Conglomerates – 4.3% | ||||||
| 3M Co. | 1,402,400 | 102,025 | ||||
| General Electric Co. | 24,574,400 | 804,812 | ||||
| Tyco International Ltd. | 1,850,700 | 48,211 | ||||
| �� | 955,048 | |||||
| TOTAL INDUSTRIALS | 1,695,977 | |||||
See accompanying notes which are an integral part of the financial statements.
| Semiannual Report |
| 10 |
| Common Stocks continued | ||||||
| Shares | Value (Note 1) | |||||
| (000s) | ||||||
| INFORMATION TECHNOLOGY – 24.4% | ||||||
| Communications Equipment – 3.8% | ||||||
| AudioCodes Ltd. (a)(e) | 3,233,400 | $ | 40,967 | |||
| Avaya, Inc. (a) | 1,500,000 | 15,825 | ||||
| Cisco Systems, Inc. (a) | 9,425,900 | 175,039 | ||||
| Corning, Inc. (a) | 6,586,800 | 160,389 | ||||
| Harris Corp. | 1,012,800 | 47,024 | ||||
| Nortel Networks Corp. (a) | 6,000,000 | 18,000 | ||||
| QUALCOMM, Inc. | 7,165,200 | 343,643 | ||||
| Sonus Networks, Inc. (a) | 4,700,000 | 21,996 | ||||
| 822,883 | ||||||
| Computers & Peripherals – 4.2% | ||||||
| Apple Computer, Inc. (a) | 3,776,100 | 285,133 | ||||
| Dell, Inc. (a) | 9,821,600 | 287,871 | ||||
| EMC Corp. (a) | 20,766,400 | 278,270 | ||||
| Hewlett-Packard Co. | 837,300 | 26,107 | ||||
| Intermec, Inc. (a) | 721,873 | 25,172 | ||||
| QLogic Corp. (a) | 214,200 | 8,497 | ||||
| SanDisk Corp. (a) | 120,600 | 8,124 | ||||
| 919,174 | ||||||
| Electronic Equipment & Instruments – 0.9% | ||||||
| Flextronics International Ltd. (a) | 1,945,100 | 20,346 | ||||
| Hon Hai Precision Industry Co. Ltd. (Foxconn) | 1,682,000 | 11,624 | ||||
| Jabil Circuit, Inc. (a) | 3,494,900 | 141,194 | ||||
| National Instruments Corp. | 647,658 | 21,431 | ||||
| 194,595 | ||||||
| Internet Software & Services – 2.5% | ||||||
| aQuantive, Inc. (a) | 1,112,000 | 28,923 | ||||
| Google, Inc. Class A (sub. vtg.) (a) | 604,300 | 261,813 | ||||
| Yahoo! Japan Corp | 16,000 | 21,682 | ||||
| Yahoo!, Inc. (a) | 7,097,464 | 243,727 | ||||
| 556,145 | ||||||
| IT Services – 1.4% | ||||||
| Affiliated Computer Services, Inc. Class A (a) | 1,327,500 | 83,102 | ||||
| First Data Corp. | 4,858,200 | 219,105 | ||||
| 302,207 | ||||||
| Office Electronics – 0.1% | ||||||
| Zebra Technologies Corp. Class A (a) | 600,000 | 27,018 | ||||
| Semiconductors & Semiconductor Equipment – 4.8% | ||||||
| Altera Corp. (a) | 2,897,700 | 55,955 | ||||
See accompanying notes which are an integral part of the financial statements.
11 Semiannual Report
| Investments (Unaudited) continued | ||||||||
| Common Stocks continued | ||||||||
| Shares | Value (Note 1) | |||||||
| (000s) | ||||||||
| INFORMATION TECHNOLOGY – continued | ||||||||
| Semiconductors & Semiconductor Equipment – continued | ||||||||
| Analog Devices, Inc. | 4,109,800 | $ | 163,447 | |||||
| Applied Materials, Inc. | 8,952,600 | 170,547 | ||||||
| ATI Technologies, Inc. (a) | 1,000,000 | 17,736 | ||||||
| Cree, Inc. (a)(d) | 704,700 | 18,414 | ||||||
| Intel Corp. | 10,767,840 | 229,032 | ||||||
| KLA Tencor Corp. | 1,992,000 | 103,544 | ||||||
| Marvell Technology Group Ltd. (a) | 1,513,500 | 103,554 | ||||||
| Microchip Technology, Inc. | 1,911,100 | 71,685 | ||||||
| PMC-Sierra, Inc. (a) | 2,732,100 | 25,846 | ||||||
| Saifun Semiconductors Ltd. | 321,500 | 10,931 | ||||||
| Samsung Electronics Co. Ltd. | 49,690 | 38,308 | ||||||
| Silicon Laboratories, Inc. (a) | 243,300 | 11,978 | ||||||
| Teradyne, Inc. (a) | 1,448,900 | 25,240 | ||||||
| Texas Instruments, Inc. | 621,900 | 18,178 | ||||||
| 1,064,395 | ||||||||
| Software 6.7% | ||||||||
| BEA Systems, Inc. (a) | 3,083,800 | 31,979 | ||||||
| Citrix Systems, Inc. (a) | 2,167,400 | 66,843 | ||||||
| Cognos, Inc. (a) | 400,000 | 15,488 | ||||||
| Electronic Arts, Inc. (a) | 175,000 | 9,552 | ||||||
| Hyperion Solutions Corp. (a) | 635,000 | 21,850 | ||||||
| McAfee, Inc. (a) | 2,133,000 | 49,464 | ||||||
| Microsoft Corp. | 38,806,300 | 1,092,389 | ||||||
| Oracle Corp. (a) | 8,620,400 | 108,358 | ||||||
| Symantec Corp. (a) | 4,150,989 | 76,295 | ||||||
| 1,472,218 | ||||||||
| TOTAL INFORMATION TECHNOLOGY | 5,358,635 | |||||||
| MATERIALS 2.3% | ||||||||
| Chemicals – 2.0% | ||||||||
| Monsanto Co. | 2,002,100 | 169,398 | ||||||
| Potash Corp. of Saskatchewan | 852,900 | 76,757 | ||||||
| Praxair, Inc. | 3,380,500 | 178,085 | ||||||
| Tokuyama Corp. | 615,000 | 11,663 | ||||||
| 435,903 | ||||||||
See accompanying notes which are an integral part of the financial statements.
| Semiannual Report |
| 12 |
| Common Stocks continued | ||||||||
| Shares | Value (Note 1) | |||||||
| (000s) | ||||||||
| MATERIALS – continued | ||||||||
| Metals & Mining – 0.3% | ||||||||
| Allegheny Technologies, Inc. | 1,125,900 | $ | 58,378 | |||||
| Oregon Steel Mills, Inc. (a) | 300,000 | 12,351 | ||||||
| 70,729 | ||||||||
| TOTAL MATERIALS | 506,632 | |||||||
| TELECOMMUNICATION SERVICES – 1.0% | ||||||||
| Diversified Telecommunication Services – 0.0% | ||||||||
| Cbeyond Communications, Inc. | 500,000 | 5,540 | ||||||
| Wireless Telecommunication Services – 1.0% | ||||||||
| American Tower Corp. Class A (a) | 3,392,200 | 104,955 | ||||||
| Sprint Nextel Corp. | 4,796,194 | 109,785 | ||||||
| 214,740 | ||||||||
| TOTAL TELECOMMUNICATION SERVICES | 220,280 | |||||||
| TOTAL COMMON STOCKS | ||||||||
| (Cost $18,134,974) | 21,718,520 | |||||||
| Convertible Preferred Stocks 0.0% | ||||||||
| INFORMATION TECHNOLOGY – 0.0% | ||||||||
| Communications Equipment – 0.0% | ||||||||
| Chorum Technologies, Inc. Series E (a)(f) | 132,000 | 0 | ||||||
| TOTAL CONVERTIBLE PREFERRED STOCKS | ||||||||
| (Cost $1,980) | 0 | |||||||
See accompanying notes which are an integral part of the financial statements.
13 Semiannual Report
| Investments (Unaudited) continued | ||||||||
| Money Market Funds 0.8% | ||||||||
| Shares | Value (Note 1) | |||||||
| (000s) | ||||||||
| Fidelity Cash Central Fund, 4.46% (b) | 156,786,875 | $ | 156,787 | |||||
| Fidelity Securities Lending Cash Central Fund, | ||||||||
| 4.48% (b)(c) | 15,436,329 | 15,436 | ||||||
| TOTAL MONEY MARKET FUNDS | ||||||||
| (Cost $172,223) | 172,223 | |||||||
| TOTAL INVESTMENT PORTFOLIO 99.6% | ||||||||
| (Cost $18,309,177) | 21,890,743 | |||||||
| NET OTHER ASSETS – 0.4% | 85,747 | |||||||
| NET ASSETS 100% | $ | 21,976,490 | ||||||
| Legend (a) Non-income producing (b) Affiliated fund that is available only to investment companies and other accounts managed by Fidelity Investments. The rate quoted is the annualized seven-day yield of the fund at period end. A complete unaudited listing of the fund’s holdings as of its most recent quarter end is available upon request. (c) Investment made with cash collateral received from securities on loan. (d) Security or a portion of the security is on loan at period end. |
| (e) Affiliated company (f) Restricted securities – Investment in securities not registered under the Securities Act of 1933 (excluding 144A issues). At the end of the period, the value of restricted securities (excluding 144A issues) amounted to $0 or 0.0% of net assets. |
Additional information on each holding is as follows:
| Acquisition | Acquisition | |||||
| Security | Date | Cost (000s) | ||||
| Chorum | ||||||
| Technologies, Inc. | ||||||
| Series E | 9/19/00 | $ | 1,980 | |||
Affiliated Central Funds
Information regarding fiscal year to date income received by the fund from the affiliated Central funds is as follows:
| Fund | Income received | |||
| (amounts in thousands) | ||||
| Fidelity Cash Central Fund | $ | 3,610 | ||
| Fidelity Securities Lending Cash Central Fund | 554 | |||
| Total | $ | 4,164 | ||
See accompanying notes which are an integral part of the financial statements.
Semiannual Report 14
Other Affiliated Issuers
An affiliated company is a company in which the fund has ownership of at least 5% of the voting securities. Fiscal year to date transactions with companies which are or were affiliates are as follows:
| Value, | ||||||||||||||||||||
| Affiliates | beginning of | Sales | Dividend | Value, end of | ||||||||||||||||
| (amounts in thousands) | period | Purchases | Proceeds | Income | period | |||||||||||||||
| AudioCodes Ltd. | $ | 16,894 | $ | 15,958 | $ | — | $ | — | $ | 40,967 | ||||||||||
| Nastech | ||||||||||||||||||||
| Pharmaceutical Co., | ||||||||||||||||||||
| Inc. | 20,455 | 3,252 | — | — | 26,477 | |||||||||||||||
| Total | $ | 37,349 | $ | 19,210 | $ | — | $ | — | $ | 67,444 | ||||||||||
Income Tax Information
At July 31, 2005, the fund had a capital loss carryforward of approximately $1,279,950,000 all of which will expire on July 31, 2011.
See accompanying notes which are an integral part of the financial statements.
15 Semiannual Report
| Financial Statements | ||||||
| Statement of Assets and Liabilities | ||||||
| Amounts in thousands (except per share amount) | January 31, 2006 (Unaudited) | |||||
| Assets | ||||||
| Investment in securities, at value (including securities | ||||||
| loaned of $14,707) See accompanying schedule: | ||||||
| Unaffiliated issuers (cost $18,080,796) | $ | 21,651,076 | ||||
| Affiliated Central Funds (cost $172,223) | 172,223 | |||||
| Other affiliated issuers (cost $56,158) | 67,444 | |||||
| Total Investments (cost $18,309,177) | $ | 21,890,743 | ||||
| Cash | 1,262 | |||||
| Receivable for investments sold | 420,733 | |||||
| Receivable for fund shares sold | 17,118 | |||||
| Dividends receivable | 6,315 | |||||
| Interest receivable | 577 | |||||
| Prepaid expenses | 101 | |||||
| Other affiliated receivables | 149 | |||||
| Other receivables | 1,542 | |||||
| Total assets | 22,338,540 | |||||
| Liabilities | ||||||
| Payable for investments purchased | $ | 293,785 | ||||
| Payable for fund shares redeemed | 40,675 | |||||
| Accrued management fee | 6,950 | |||||
| Other affiliated payables | 5,063 | |||||
| Other payables and accrued expenses | 141 | |||||
| Collateral on securities loaned, at value | 15,436 | |||||
| Total liabilities | 362,050 | |||||
| Net Assets | $ | 21,976,490 | ||||
| Net Assets consist of: | ||||||
| Paid in capital | $ | 18,555,375 | ||||
| Distributions in excess of net investment income | (4,643) | |||||
| Accumulated undistributed net realized gain (loss) on | ||||||
| investments and foreign currency transactions | (156,200) | |||||
| Net unrealized appreciation (depreciation) on | ||||||
| investments and assets and liabilities in foreign | ||||||
| currencies | 3,581,958 | |||||
| Net Assets, for 498,436 shares outstanding | $ | 21,976,490 | ||||
| Net Asset Value, offering price and redemption price per | ||||||
| share ($21,976,490 ÷ 498,436 shares) | $ | 44.09 | ||||
See accompanying notes which are an integral part of the financial statements.
Semiannual Report 16
| Statement of Operations | ||||||
| Amounts in thousands | Six months ended January 31, 2006 (Unaudited) | |||||
| Investment Income | ||||||
| Dividends | $ | 116,400 | ||||
| Interest | 10 | |||||
| Income from affiliated Central Funds | 4,164 | |||||
| Total income | 120,574 | |||||
| Expenses | ||||||
| Management fee | ||||||
| Basic fee | $ | 63,503 | ||||
| Performance adjustment | (21,186) | |||||
| Transfer agent fees | 27,336 | |||||
| Accounting and security lending fees | 874 | |||||
| Independent trustees’ compensation | 48 | |||||
| Appreciation in deferred trustee compensation account | 19 | |||||
| Custodian fees and expenses | 193 | |||||
| Registration fees | 33 | |||||
| Audit | 81 | |||||
| Legal | 131 | |||||
| Interest | 21 | |||||
| Miscellaneous | 104 | |||||
| Total expenses before reductions | 71,157 | |||||
| Expense reductions | (3,010) | 68,147 | ||||
| Net investment income (loss) | 52,427 | |||||
| Realized and Unrealized Gain (Loss) | ||||||
| Net realized gain (loss) on: | ||||||
| Investment securities: | ||||||
| Unaffiliated issuers | 1,133,549 | |||||
| Foreign currency transactions | 137 | |||||
| Total net realized gain (loss) | 1,133,686 | |||||
| Change in net unrealized appreciation (depreciation) on: | ||||||
| Investment securities | (301,841) | |||||
| Assets and liabilities in foreign currencies | 390 | |||||
| Total change in net unrealized appreciation | ||||||
| (depreciation) | (301,451) | |||||
| Net gain (loss) | 832,235 | |||||
| Net increase (decrease) in net assets resulting from | ||||||
| operations | $ | 884,662 | ||||
See accompanying notes which are an integral part of the financial statements.
17 Semiannual Report
| Financial Statements continued | ||||||||
| Statement of Changes in Net Assets | ||||||||
| Six months ended | Year ended | |||||||
| January 31, 2006 | July 31, | |||||||
| Amounts in thousands | (Unaudited) | 2005 | ||||||
| Increase (Decrease) in Net Assets | ||||||||
| Operations | ||||||||
| Net investment income (loss) | $ | 52,427 | $ | 236,112 | ||||
| Net realized gain (loss) | 1,133,686 | 1,609,034 | ||||||
| Change in net unrealized appreciation (depreciation) . | (301,451) | 529,332 | ||||||
| Net increase (decrease) in net assets resulting | ||||||||
| from operations | 884,662 | 2,374,478 | ||||||
| Distributions to shareholders from net investment income . | (120,772) | (220,167) | ||||||
| Share transactions | ||||||||
| Proceeds from sales of shares | 1,425,009 | 3,792,068 | ||||||
| Reinvestment of distributions | 118,853 | 214,432 | ||||||
| Cost of shares redeemed | (3,212,029) | (5,382,182) | ||||||
| Net increase (decrease) in net assets resulting from | ||||||||
| share transactions | (1,668,167) | (1,375,682) | ||||||
| Total increase (decrease) in net assets | (904,277) | 778,629 | ||||||
| Net Assets | ||||||||
| Beginning of period | 22,880,767 | 22,102,138 | ||||||
| End of period (including distributions in excess of net | ||||||||
| investment income of $4,643 and undistributed net | ||||||||
| investment income of $63,702, respectively) | $ | 21,976,490 | $ | 22,880,767 | ||||
| Other Information | ||||||||
| Shares | ||||||||
| Sold | 33,399 | 94,109 | ||||||
| Issued in reinvestment of distributions | 2,760 | 5,283 | ||||||
| Redeemed | (74,880) | (133,003) | ||||||
| Net increase (decrease) | (38,721) | (33,611) | ||||||
See accompanying notes which are an integral part of the financial statements.
| Semiannual Report |
| 18 |
| Financial Highlights | ||||||||||||
| Six months ended | ||||||||||||
| January 31, 2006 | Years ended July 31, | |||||||||||
| (Unaudited) | 2005 | 2004 | 2003 | 2002 | 2001 | |||||||
| Selected Per Share Data | ||||||||||||
| Net asset value, beginning | ||||||||||||
| of period | $ 42.60 | $ 38.72 | $ 36.13 | $ 33.24 | $ 45.08 | $ 60.25 | ||||||
| Income from Investment | ||||||||||||
| Operations | ||||||||||||
| Net investment income | ||||||||||||
| (loss)D | 10 | .42E | .19 | .21 | .10 | .01 | ||||||
| Net realized and unre | ||||||||||||
| alized gain (loss) | 1.62 | 3.85 | 2.62 | 2.81 | (11.88) | (12.66) | ||||||
| Total from investment | ||||||||||||
| operations | 1.72 | 4.27 | 2.81 | 3.02 | (11.78) | (12.65) | ||||||
| Distributions from net | ||||||||||||
| investment income | (.23) | (.39) | (.22) | (.13) | (.06) | — | ||||||
| Distributions from net | ||||||||||||
| realized gain | — | — | — | — | — | (2.52) | ||||||
| Total distributions | (.23) | (.39) | (.22) | (.13) | (.06) | (2.52) | ||||||
| Net asset value, end of | ||||||||||||
| period | $ 44.09 | $ 42.60 | $ 38.72 | $ 36.13 | $ 33.24 | $ 45.08 | ||||||
| Total ReturnB,C | 4.05% | 11.08% | 7.79% | 9.13% | (26.16)% | (21.92)% | ||||||
| Ratios to Average Net AssetsF | ||||||||||||
| Expenses before | ||||||||||||
| reductions | 64%A | .66% | .68% | .71% | .76% | .89% | ||||||
| Expenses net of fee | ||||||||||||
| waivers, if any | 64%A | .66% | .68% | .71% | .76% | .89% | ||||||
| Expenses net of all | ||||||||||||
| reductions | 61%A | .64% | .67% | .69% | .74% | .87% | ||||||
| Net investment income | ||||||||||||
| (loss) | 47%A | 1.05%E | .48% | .64% | .25% | .01% | ||||||
| Supplemental Data | ||||||||||||
| Net assets, end of pe- | ||||||||||||
| riod (in millions) | $21,976 | $22,881 | $22,102 | $19,936 | $17,021 | $23,032 | ||||||
| Portfolio turnover rate . | 52%A | 29% | 23% | 24% | 33% | 46% | ||||||
| A Annualized B Total returns for periods of less than one year are not annualized. C Total returns would have been lower had certain expenses not been reduced during the periods shown. D Calculated based on average shares outstanding during the period. E Investment income per share reflects a special dividend which amounted to $.20 per share. Excluding the special dividend, the ratio of net investment income to average net assets would have been .56%. F Expense ratios reflect operating expenses of the fund. Expenses before reductions do not reflect amounts reimbursed by the investment adviser or reductions from brokerage service arrangements or other expense offset arrangements and do not represent the amount paid by the fund during periods when reimbursements or reductions occur. Expenses net of fee waivers reflect expenses after reimbursement by the investment adviser but prior to reductions from brokerage service arrangements or other expense offset arrangements. Expenses net of all reductions represent the net expenses paid by the fund. |
See accompanying notes which are an integral part of the financial statements.
19 Semiannual Report
Notes to Financial Statements
For the period ended January 31, 2006 (Unaudited)
(Amounts in thousands except ratios)
1. Significant Accounting Policies.
Fidelity Blue Chip Growth Fund (the fund) is a fund of Fidelity Securities Fund (the trust) and is authorized to issue an unlimited number of shares. The trust is registered under the Investment Company Act of 1940, as amended (the 1940 Act), as an open end management investment company organized as a Massachusetts business trust. The fund may invest in affiliated money market central funds (Money Market Central Funds) which are open end investment companies available to investment companies and other accounts managed by Fidelity Management & Research Company (FMR) and its affili ates. The financial statements have been prepared in conformity with accounting principles generally accepted in the United States of America, which require manage ment to make certain estimates and assumptions at the date of the financial statements. The following summarizes the significant accounting policies of the fund:
Security Valuation. Investments are valued and net asset value (NAV) per share is calculated (NAV calculation) as of the close of business of the New York Stock Exchange (NYSE), normally 4:00 p.m. Eastern time. Wherever possible, the fund uses independent pricing services approved by the Board of Trustees to value its investments.
Equity securities, including restricted securities, for which market quotations are readily available, are valued at the last reported sale price or official closing price as reported by an independent pricing service on the primary market or exchange on which they are traded. In the event there were no sales during the day or closing prices are not available, securities are valued at the last quoted bid price. Investments in open end mutual funds are valued at their closing net asset value each business day. Short term securities with remaining maturities of sixty days or less for which quotations are not readily available are valued at amortized cost, which approximates value.
When current market prices or quotations are not readily available or do not accurately reflect fair value, valuations may be determined in accordance with procedures adopted by the Board of Trustees. For example, when developments occur between the close of a market and the close of the NYSE that may materially affect the value of some or all of the securities, or when trading in a security is halted, those securities may be fair valued. Factors used in the determination of fair value may include monitoring news to identify significant market or security specific events such as changes in the value of U.S. securi ties markets, reviewing developments in foreign markets and evaluating the perfor mance of ADRs, futures contracts and exchange traded funds. Because the fund’s utilization of fair value pricing depends on market activity, the frequency with which fair value pricing is used can not be predicted and may be utilized to a significant extent. The value of securities used for NAV calculation under fair value pricing may differ from published prices for the same securities.
Foreign Currency. The fund uses foreign currency contracts to facilitate transactions in foreign denominated securities. Losses from these transactions may arise from
| Semiannual Report |
| 20 |
| 1. Significant Accounting Policies continued | ||
Foreign Currency continued | ||
changes in the value of the foreign currency or if the counterparties do not perform under the contracts’ terms.
Foreign denominated assets, including investment securities, and liabilities are trans lated into U.S. dollars at the exchange rate at period end. Purchases and sales of investment securities, income and dividends received and expenses denominated in foreign currencies are translated into U.S. dollars at the exchange rate in effect on the transac tion date.
The effects of exchange rate fluctuations on investments are included with the net realized and unrealized gain (loss) on investment securities. Other foreign currency transactions resulting in realized and unrealized gain (loss) are disclosed separately.
Investment Transactions and Income. Security transactions are accounted for as of trade date. Gains and losses on securities sold are determined on the basis of identified cost and may include proceeds received from litigation. Dividend income is recorded on the ex dividend date, except for certain dividends from foreign securities where the ex dividend date may have passed, which are recorded as soon as the fund is informed of the ex dividend date. Non cash dividends included in dividend income, if any, are recorded at the fair market value of the securities received. Distributions received on securities that represent a return of capital or capital gain are recorded as a reduction of cost of investments and/or as a realized gain. The fund estimates the components of distributions received that may be considered return of capital distributions or capital gain distributions. Interest income is accrued as earned. Interest income includes coupon interest and amortization of premium and accretion of discount on debt securi ties. Investment income is recorded net of foreign taxes withheld where recovery of such taxes is uncertain.
Expenses. Most expenses of the trust can be directly attributed to a fund. Expenses which cannot be directly attributed are apportioned among each fund in the trust.
Deferred Trustee Compensation. Under a Deferred Compensation Plan (the Plan), independent Trustees must defer receipt of a portion of, and may elect to defer receipt of an additional portion of, their annual compensation. Deferred amounts are treated as though equivalent dollar amounts had been invested in shares of the fund or are invested in a cross section of other Fidelity funds, and are marked to market. Deferred amounts remain in the fund until distributed in accordance with the Plan.
Income Tax Information and Distributions to Shareholders. Each year, the fund intends to qualify as a regulated investment company by distributing all of its taxable
21 Semiannual Report
| Notes to Financial Statements (Unaudited) continued |
| (Amounts in thousands except ratios) |
| 1. Significant Accounting Policies continued |
Income Tax Information and Distributions to Shareholders continued |
income and realized gains under Subchapter M of the Internal Revenue Code. As a result, no provision for income taxes is required in the accompanying financial statements. Foreign taxes are provided for based on the fund’s understanding of the tax rules and rates that exist in the foreign markets in which it invests.
Distributions are recorded on the ex dividend date. Income and capital gain distribu tions are determined in accordance with income tax regulations, which may differ from generally accepted accounting principles.
Capital accounts within the financial statements are adjusted for permanent book tax differences. These adjustments have no impact on net assets or the results of operations. Temporary book tax differences will reverse in a subsequent period.
Book tax differences are primarily due to foreign currency transactions, deferred trus tees compensation, capital loss carryforwards and losses deferred due to wash sales.
The federal tax cost of investments and unrealized appreciation (depreciation) as of period end were as follows:
| Unrealized appreciation | $ | 4,372,621 | ||
| Unrealized depreciation | (795,542) | |||
| Net unrealized appreciation (depreciation) | $ | 3,577,079 | ||
| Cost for federal income tax purposes | $ | 18,313,664 | ||
| 2. Operating Policies. | ||||
Repurchase Agreements. FMR has received an Exemptive Order from the Securities and Exchange Commission (the SEC) which permits the fund and other affiliated entities of FMR to transfer uninvested cash balances into joint trading accounts which are then invested in repurchase agreements. The fund may also invest directly with institutions in repurchase agreements. Repurchase agreements are collateralized by government or non government securities. Collateral is held in segregated accounts with custodian banks and may be obtained in the event of a default of the counterparty. The fund monitors, on a daily basis, the value of the collateral to ensure it is at least equal to the principal amount of the repurchase agreement (including accrued interest). In the event of a default by the counterparty, realization of the collateral proceeds could be delayed, during which time the value of the collateral may decline.
Restricted Securities. The fund may invest in securities that are subject to legal or contractual restrictions on resale. These securities generally may be resold in transac tions exempt from registration or to the public if the securities are registered. Disposal of these securities may involve time consuming negotiations and expense, and prompt sale
| Semiannual Report |
| 22 |
2. Operating Policies continued
Restricted Securities continued
at an acceptable price may be difficult. Information regarding restricted securities is included at the end of the fund’s Schedule of Investments.
3. Purchases and Sales of Investments.
Purchases and sales of securities, other than short term securities and U.S. government securities, aggregated $5,755,889 and $7,568,677, respectively.
4. Fees and Other Transactions with Affiliates.
Management Fee. FMR and its affiliates provide the fund with investment manage ment related services for which the fund pays a monthly management fee. The manage ment fee is the sum of an individual fund fee rate that is based on an annual rate of .30% of the fund’s average net assets and a group fee rate that averaged .27% during the period. The group fee rate is based upon the average net assets of all the mutual funds advised by FMR. The group fee rate decreases as assets under management increase and increases as assets under management decrease. In addition, the management fee is subject to a performance adjustment (up to a maximum of ±.20% of the fund’s average net assets over a 36 month performance period). The upward or downward adjustment to the management fee is based on the fund’s relative investment performance as compared to an appropriate benchmark index. For the period, the total annualized management fee rate, including the performance adjustment, was .38% of the fund’s average net assets.
Transfer Agent Fees. Fidelity Service Company, Inc. (FSC), an affiliate of FMR, is the fund’s transfer, dividend disbursing and shareholder servicing agent. FSC receives account fees and asset based fees that vary according to account size and type of ac count. FSC pays for typesetting, printing and mailing of shareholder reports, except proxy statements. For the period, the transfer agent fees were equivalent to an annual ized rate of .25% of average net assets.
Accounting and Security Lending Fees. FSC maintains the fund’s accounting rec ords. The accounting fee is based on the level of average net assets for the month. Under a separate contract, FSC administers the security lending program. The security lending fee is based on the number and duration of lending transactions.
23 Semiannual Report
| Notes to Financial Statements (Unaudited) continued |
| (Amounts in thousands except ratios) |
| 4. Fees and Other Transactions with Affiliates continued |
Affiliated Central Funds. The fund may invest in Money Market Central Funds which seek preservation of capital and current income and are managed by Fidelity Invest ments Money Management, Inc. (FIMM), an affiliate of FMR.
The Money Market Central Funds do not pay a management fee.
Brokerage Commissions. The fund placed a portion of its portfolio transactions with brokerage firms which are affiliates of the investment adviser. The commissions paid to these affiliated firms were $71 for the period.
Interfund Lending Program. Pursuant to an Exemptive Order issued by the SEC, the fund, along with other registered investment companies having management contracts with FMR, may participate in an interfund lending program. This program provides an alternative credit facility allowing the funds to borrow from, or lend money to, other participating affiliated funds. At period end, there were no interfund loans outstanding. The fund’s activity in this program during the period for which loans were outstanding was as follows:
| Average Daily Loan | Weighted Average | |||||||||
| Borrower or Lender | Balance | Interest Rate | Interest Expense | |||||||
| Borrower | $ | 57,828 | 4.40% | $ | 21 | |||||
| 5. Committed Line of Credit. | ||||||||||
The fund participates with other funds managed by FMR in a $4.2 billion credit facility (the “line of credit”) to be utilized for temporary or emergency purposes to fund share holder redemptions or for other short term liquidity purposes. The fund has agreed to pay commitment fees on its pro rata portion of the line of credit. During the period, there were no borrowings on this line of credit.
| 6. Security Lending. |
The fund lends portfolio securities from time to time in order to earn additional income. On the settlement date of the loan, the fund receives collateral (in the form of U.S. Treasury obligations, letters of credit and/or cash) against the loaned securities and maintains collateral in an amount not less than 100% of the market value of the loaned securities during the period of the loan. The market value of the loaned securities is determined at the close of business of the fund and any additional required collateral is delivered to the fund on the next business day. If the borrower defaults on its obligation to return the securities loaned because of insolvency or other reasons, a fund could experience delays and costs in recovering the securities loaned or in gaining access to the collateral. Any cash collateral received is invested in the Fidelity Securities Lending Cash Central Fund. The value of loaned securities and cash collateral at period end are
| Semiannual Report |
| 24 |
6. Security Lending continued
disclosed on the fund’s Statement of Assets and Liabilities. Security lending income represents the income earned on investing cash collateral, less fees and expenses associated with the loan, plus any premium payments that may be received on the loan of certain types of securities. Security lending income is presented in the Statement of Operations as a component of income from affiliated central funds. Net income from lending portfolio securities during the period amounted to $554.
| 7. Expense Reductions. |
Many of the brokers with whom FMR places trades on behalf of the fund provided services to the fund in addition to trade execution. These services included payments of certain expenses on behalf of the fund totaling $2,453 for the period. In addition, through arrangements with the fund’s transfer agent, credits realized as a result of uninvested cash balances were used to reduce the fund’s expenses. During the period, these credits reduced the fund’s transfer agent expenses by $557.
| 8. Other. |
The fund’s organizational documents provide former and current trustees and officers with a limited indemnification against liabilities arising in connection with the perfor mance of their duties to the fund. In the normal course of business, the fund may also enter into contracts that provide general indemnifications. The fund’s maximum exposure under these arrangements is unknown as this would be dependent on future claims that may be made against the fund. The risk of material loss from such claims is considered remote.
25 Semiannual Report
Board Approval of Investment Advisory Contracts and Management Fees
Fidelity Blue Chip Growth Fund
On November 17, 2005, the Board of Trustees, including the independent Trustees (together, the Board), voted to approve an amended management contract (the Amended Contract) for the fund and to submit the Amended Contract to shareholders for their approval. If approved by shareholders, the Amended Contract will prospectively change the index used to calculate the fund’s performance adjustment from the S&P 500 Index (the Current Index) to the Russell 1000 Growth Index (the Proposed Index). The Amended Contract also will allow the Board to change the fund’s performance adjust ment index in the future without a shareholder vote, if applicable law permits the Board to do so. The Board, assisted by the advice of fund counsel and independent Trustees’ counsel, considered a broad range of information.
In determining whether to approve the Amended Contract for the fund, the Board was aware that shareholders in the fund have a broad range of investment choices available to them, including a wide choice among mutual funds offered by competitors to Fidelity, and that the fund’s shareholders, with the opportunity to review and weigh the disclosure provided by the fund in its prospectus and other public disclosures, have chosen to invest in this fund, managed by Fidelity.
Nature, Extent, and Quality of Services Provided by Fidelity. The Board consid ered the nature, quality, cost and extent of administrative, distribution and shareholder services performed by the investment adviser, FMR, and the sub advisers, and by affili ated companies.
Shareholder and Administrative Services. The Board noted that the growth of fund assets across the complex allows Fidelity to reinvest in the development of services designed to enhance the value or convenience of the Fidelity funds as investment vehicles. These services include 24 hour access to account information and market information through phone representatives and over the Internet, and investor education materials and asset allocation tools.
Investment in a Large Fund Family. The Board considered the benefits to shareholders of investing in a Fidelity fund, including the benefits of investing in a fund that is part of a large family of funds offering a variety of investment disciplines and providing for a large variety of mutual fund shareholder services.
Investment Performance. In determining whether the Proposed Index is an appropriate index against which to measure the fund’s investment performance, the Board consid ered that the fund seeks growth of capital over the long term by investing primarily in common stocks of well known and established companies that FMR believes have above average growth potential. The Board also considered that the Current Index is designed as a broad measure of the performance of the overall U.S. stock market and includes both growth and value stocks (style flexible), whereas the Proposed Index
| Semiannual Report |
| 26 |
includes only growth stocks (style specific). The Board noted that the fund uses a growth oriented (style specific) investment strategy that differs from the investment strategies of more style flexible funds.
The Board considered the rolling 36 month returns of the fund compared to the rolling 36 month returns of the Current Index and the Proposed Index over the past three years ended October 31, 2005. The Board noted that the fund’s returns have corresponded more closely to the returns of the Proposed Index than to the returns of the Current Index over the period. The Board also noted that over the past ten years, the fund’s returns have shown a higher rolling 36 month correlation to the returns of the Proposed Index than to the returns of the Current Index. The Board noted that the Fund underper formed the Current Index by more than the Proposed Index over the previous rolling 36 month period.
The Board considered the performance of the Current Index compared to the perfor mance of the Proposed Index over the past ten calendar years and for the ten months ended October 31, 2005. The Board noted that the two indices have performed differently at times over the period, with the Proposed Index outperforming the Current Index in four of the past ten calendar years. The Board also noted that the fund’s performance has lagged both the Current Index and the Proposed Index in recent years, but that in the most recent rolling 36 month period, the Fund underperformed the Proposed Index by less than it underperformed the Current Index. The Board noted that had the Proposed Index been in effect, FMR would have received a higher management fee by virtue of having a lower downward adjustment than FMR actually experienced. The Board recognized that, in connection with its annual renewal of the fund’s current management contract and sub advisory agreements at its July 2005 meeting, the Board had reviewed the fund’s returns and the returns of the Current Index over the one , three , and five year periods ended December 31, 2004, and had stated that the relative investment performance of the fund was lower than the Current Index over time. The Board also had discussed with FMR actions to be taken by FMR to improve the fund’s disappointing performance.
The Board considered that the Proposed Index conforms more closely to the fund’s growth oriented investment strategy and that adopting a style specific index will help communicate to investors that the fund uses a style specific investment strategy that differs from the investment strategies of more style flexible funds. In this regard, the Board also noted that the Amended Contract would give the Board the ability to desig nate an alternative appropriate index for the fund without the delay and expense of having first to conduct a proxy solicitation, if applicable law would permit the Board to do so.
Based on its review, the Board concluded that the nature, extent, and quality of the services provided by Fidelity will benefit the fund’s shareholders, particularly in light of
27 Semiannual Report
Board Approval of Investment Advisory Contracts and Management Fees continued
the Board’s view that the fund’s shareholders benefit from investing in a fund that is part of a large family of funds offering a variety of investment disciplines and services.
Competitiveness of Management Fee and Total Fund Expenses. The Board considered that, because the change in the index used to calculate the fund’s performance adjustment will be implemented prospectively, the future impact on management fees will depend solely on the fund’s future performance relative to the Proposed Index.
Nonetheless, the Board considered the total management fee (basic fee performance adjustment) that the fund incurred under the current management contract (with the Current Index) for the 12 month period ended October 31, 2005, compared to the hypothetical total management fee (basic fee performance adjustment) that the fund would have incurred if the Amended Contract (with the Proposed Index) had been in effect during that period.
The Board noted that, under the current management contract, the fund’s basic fee would have been reduced by a negative performance adjustment of 18.3 basis points and that, if the Amended Contract had been in effect during the 12 month period ended October 31, 2005, the fund’s basic fee would have been reduced by a negative perfor mance adjustment of 6.9 basis points. As a result, the fund’s hypothetical total manage ment fee would have been 11.4 basis points ($25,474,528) higher if the Amended Contract had been in effect during that period. The Board noted that the fund’s perfor mance lagged both the Current Index and the Proposed Index over that period, but that the negative performance adjustment would have been lower, and the hypothetical total management fee therefore would have been higher, if the Amended Contract had been in effect during that period.
The Board also noted that, although the hypothetical total management fee would have been higher if the Amended Contract had been in effect during the 12 month period ended October 31, 2005, the fund’s total management fee still would have ranked below the median of its Total Mapped Group and below the median of its Asset Size Peer Group (ASPG). The Total Mapped Group comparison focuses on the fund’s standing relative to the total universe of comparable funds available to investors, in terms of gross manage ment fees before expense reimbursements or caps. The ASPG comparison focuses on the fund’s standing relative to non Fidelity funds similar in size to the fund within the Total Mapped Group.
Based on its review, the Board concluded that the fund’s management fee was fair and reasonable in light of the services that the fund receives and the other factors considered.
Because the fund’s total management fee impacts the fund’s total expenses and because the future impact on management fees will depend solely on the fund’s future
| Semiannual Report |
| 28 |
performance relative to the Proposed Index the Board will review the fund’s total expenses compared to competitive fund median expenses in connection with its future renewal of the fund’s management contract and sub advisory agreements.
Also in connection with its future renewal of the fund’s management contract and sub advisory agreements, the Board will consider Fidelity fee structures and other information on clients that FMR and its affiliates service in other competitive markets, such as other mutual funds advised or subadvised by FMR or its affiliates, pension plan clients, and other institutional clients.
Costs of the Services and Profitability. Because the Board was approving an arrangement under which the management fee that the fund pays FMR will depend solely on the fund’s future performance relative to the Proposed Index, it did not consider data regarding the impact on Fidelity’s costs of services, revenues, or profitability from the new arrangement to be a significant factor in its decision.
In connection with its future renewal of the fund’s management contract and sub advisory agreements, the Board will consider the revenues earned and the expenses incurred by Fidelity in conducting the business of developing, marketing, distributing, managing, administering and servicing the fund and its shareholders.
Economies of Scale. The Board recognized that the fund’s Amended Contract incorpo rates a “group fee” structure, which provides for lower fee rates as total fund assets under FMR’s management increase, and for higher fee rates as total fund assets under FMR’s management decrease. The Board considered that the group fee is designed to deliver the benefits of economies of scale to fund shareholders when total fund assets increase, even if assets of any particular fund are unchanged or have declined, because some portion of Fidelity’s costs are attributable to services provided to all Fidelity funds, and all funds benefit if those costs can be allocated among more assets. The Board concluded that, given the group fee structure, fund shareholders will achieve a certain level of economies of scale as assets under FMR’s management increase at the fund complex level, regardless of whether Fidelity achieves any such economies of scale.
In connection with its future renewal of the fund’s management contract and sub advisory agreements, the Board will consider whether there have been economies of scale in respect of the management of the Fidelity funds, whether the Fidelity funds (including the fund) have appropriately benefited from any such economies of scale, and whether there is potential for realization of any further economies of scale.
Based on its evaluation of all of the conclusions noted above, and after considering all material factors, the Board ultimately concluded that the Amended Contract is fair and reasonable, and that the Amended Contract should be approved and submitted to shareholders for their approval.
29 Semiannual Report
Board Approval of Investment Advisory Contracts and Management Fees continued
On January 19, 2006, the Board of Trustees, including the Independent Trustees (together, the Board), voted to approve a general research services agreement (the Agreement) between FMR, FMR Co., Inc. (FMRC), Fidelity Investments Money Manage ment, Inc. (FIMM), and Fidelity Research & Analysis Company (FRAC) (together, the Investment Advisers) for the fund, effective January 20, 2006, pursuant to which FRAC may provide general research and investment advisory support services to FMRC and FIMM. The Board considered that it has approved previously various sub advisory agreements for the fund with affiliates of FMR that allow FMR to obtain research, non discretionary advice, or discretionary portfolio management at no additional ex pense to the fund. The Board, assisted by the advice of fund counsel and independent Trustees’ counsel, considered a broad range of information and determined that it would be beneficial for the fund to access the research and investment advisory support services supplied by FRAC at no additional expense to the fund.
The Board reached this determination in part because the new arrangement will involve no changes in (i) the contractual terms of and fees payable under the fund’s manage ment contract or sub advisory agreements; (ii) the investment process or strategies employed in the management of the fund’s assets; (iii) the nature or level of services provided under the fund’s management contract or sub advisory agreements; (iv) the day to day management of the fund or the persons primarily responsible for such man agement; or (v) the ultimate control or beneficial ownership of FMR, FMRC, or FIMM. The Board also considered that the establishment of the Agreement would not necessitate prior shareholder approval of the Agreement or result in an assignment and termination of the fund’s management contract or sub advisory agreements under the Investment Company Act of 1940.
Because the Board was approving an arrangement with FRAC under which the fund will not bear any additional management fees or expenses and under which the fund’s portfolio manager would not change, it did not consider the fund’s investment perfor mance, competitiveness of management fee and total expenses, costs of services and profitability, or economies of scale to be significant factors in its decision.
In connection with its future renewal of the fund’s management contract and sub advisory agreements, the Board will consider: (i) the nature, extent, and quality of services provided to the fund, including shareholder and administrative services and investment performance; (ii) the competitiveness of the fund’s management fee and total expenses; (iii) the costs of the services and profitability, including the revenues earned and the expenses incurred by Fidelity in conducting the business of developing, marketing, distributing, managing, administering, and servicing the fund and its shareholders; and (iv) whether there have been economies of scale in respect of the management of the Fidelity funds, whether the Fidelity funds (including the fund) have appropriately benefited from any such economies of scale, and whether there is potential for realization of any further economies.
| Semiannual Report |
| 30 |
Based on its evaluation of all of the conclusions noted above, and after considering all material factors, the Board ultimately concluded that the fund’s Agreement is fair and reasonable, and that the fund’s Agreement should be approved.
31 Semiannual Report
| Investment Adviser Fidelity Management & Research Company Boston, MA Investment Sub Advisers FMR Co., Inc. Fidelity Research & Analysis Company (formerly Fidelity Management & Research (Far East) Inc.) Fidelity Management & Research (U.K.) Inc. Fidelity Investments Japan Limited Fidelity International Investment Advisors Fidelity International Investment Advisors (U.K.) Limited General Distributor Fidelity Distributors Corporation Boston, MA Transfer and Service Agent Fidelity Service Company, Inc. Boston, MA Custodian Citibank, N.A. New York, NY |
| The Fidelity Telephone Connection | ||
| Mutual Fund 24-Hour Service | ||
| Exchanges/Redemptions | ||
| and Account Assistance | 1-800-544-6666 | |
| Product Information | 1-800-544-6666 | |
| Retirement Accounts | 1-800-544-4774 | |
| (8 a.m. - 9 p.m.) | ||
| TDD Service | 1-800-544-0118 | |
| for the deaf and hearing impaired | ||
| (9 a.m. - 9 p.m. Eastern time) | ||
| Fidelity Automated Service | ||
| Telephone (FAST®) (automated phone logo) | 1-800-544-5555 | |
| (automated phone logo) Automated line for quickest service | ||
| BCF USAN-0306 1.789282.102 |

Item 2. Code of Ethics
Not applicable.
Item 3. Audit Committee Financial Expert
Not applicable.
Item 4. Principal Accountant Fees and Services
Not applicable.
Item 5. Audit Committee of Listed Registrants
Not applicable.
Item 6. Schedule of Investments
Not applicable.
Item 7. Disclosure of Proxy Voting Policies and Procedures for Closed-End Management Investment Companies
Not applicable.
Item 8. Portfolio Managers of Closed-End Management Investment Companies
Not applicable.
Item 9. Purchase of Equity Securities by Closed-End Management Investment Company and Affiliated Purchasers
Not applicable.
Item 10. Submission of Matters to a Vote of Security Holders
There were no material changes to the procedures by which shareholders may recommend nominees to the Fidelity Securities Fund: Fidelity Blue Chip Growth Fund's Board of Trustees.
Item 11. Controls and Procedures
(a)(i) The President and Treasurer and the Chief Financial Officer have concluded that the Fidelity Securities Fund: Fidelity Blue Chip Growth Fund's (the "Fund") disclosure controls and procedures (as defined in Rule 30a-3(c) under the Investment Company Act) provide reasonable assurances that material information relating to the Fund is made known to them by the appropriate persons, based on their evaluation of these controls and procedures as of a date within 90 days of the filing date of this report.
(a)(ii) There was no change in the Fund's internal control over financial reporting (as defined in Rule 30a-3(d) under the Investment Company Act) that occurred during the second fiscal quarter of the period covered by this report that has materially affected, or is reasonably likely to materially affect, the Fund's internal control over financial reporting.
Item 12. Exhibits
(a) | (1) | Not applicable. |
(a) | (2) | Certification pursuant to Rule 30a-2(a) under the Investment Company Act of 1940 (17 CFR 270.30a-2(a)) is filed and attached hereto as Exhibit 99.CERT. |
(a) | (3) | Not applicable. |
(b) | Certification pursuant to Rule 30a-2(b) under the Investment Company Act of 1940 (17 CFR 270.30a-2(b)) is furnished and attached hereto as Exhibit 99.906CERT. |
SIGNATURES
Pursuant to the requirements of the Securities Exchange Act of 1934 and the Investment Company Act of 1940, the registrant has duly caused this report to be signed on its behalf by the undersigned, thereunto duly authorized.
Fidelity Securities Fund
By: | /s/Christine Reynolds |
Christine Reynolds | |
President and Treasurer | |
Date: | March 17, 2006 |
Pursuant to the requirements of the Securities Exchange Act of 1934 and the Investment Company Act of 1940, this report has been signed below by the following persons on behalf of the registrant and in the capacities and on the dates indicated.
By: | /s/Christine Reynolds |
Christine Reynolds | |
President and Treasurer | |
Date: | March 17, 2006 |
By: | /s/Paul M. Murphy |
Paul M. Murphy | |
Chief Financial Officer | |
Date: | March 17, 2006 |