UNITED STATES
SECURITIES AND EXCHANGE COMMISSION
Washington, D.C. 20549
FORM N-CSR
CERTIFIED SHAREHOLDER REPORT OF REGISTERED
MANAGEMENT INVESTMENT COMPANIES
Investment Company Act file number 811-4118
Fidelity Securities Fund
(Exact name of registrant as specified in charter)
82 Devonshire St., Boston, Massachusetts 02109
(Address of principal executive offices) (Zip code)
Eric D. Roiter, Secretary
82 Devonshire St.
Boston, Massachusetts 02109
(Name and address of agent for service)
Registrant's telephone number, including area code: 617-563-7000
Date of fiscal year end: | November 30 |
| |
Date of reporting period: | May 31, 2006 |
Item 1. Reports to Stockholders

Fidelity® Advisor
Aggressive Growth
Fund - Class A, Class T, Class B and Class C
Semiannual Report May 31, 2006
| Contents | | | | |
| |
| Chairman’s Message | | 3 | | Ned Johnson’s message to shareholders. |
| Shareholder Expense | | 4 | | An example of shareholder expenses. |
| Example | | | | |
| Investment Changes | | 6 | | A summary of major shifts in the fund’s |
| | | | | investments over the past six months. |
| Investments | | 7 | | A complete list of the fund’s investments |
| | | | | with their market values. |
| Financial Statements | | 13 | | Statements of assets and liabilities, |
| | | | | operations, and changes in net assets, |
| | | | | as well as financial highlights. |
| Notes | | 22 | | Notes to the financial statements. |
| Proxy Voting Results | | 30 | | |
| Board Approval of | | 31 | | |
| Investment Advisory | | | | |
| Contracts and | | | | |
| Management Fees | | | | |
To view a fund’s proxy voting guidelines and proxy voting record for the 12-month period ended June 30, visit www.fidelity.com/proxyvotingresults or visit the Securities and Exchange Commission’s (SEC) web site at www.sec.gov. You may also call 1-877-208-0098 to request a free copy of the proxy voting guidelines.
Standard & Poor’s, S&P and S&P 500 are registered service marks of The McGraw-Hill Companies, Inc. and have been licensed for use by Fidelity Distributors Corporation.
Other third party marks appearing herein are the property of their respective owners. All other marks appearing herein are registered or unregistered trademarks or service marks of FMR Corp. or an affiliated company.
This report and the financial statements contained herein are submitted for the general information of the shareholders of the fund. This report is not authorized for distribution to prospective investors in the fund unless preceded or accompanied by an effective prospectus.
A fund files its complete schedule of portfolio holdings with the SEC for the first and third quarters of each fiscal year on Form N-Q. Forms N-Q are available on the SEC’s web site at http://www.sec.gov. A fund’s Forms N-Q may be reviewed and copied at the SEC’s Public Reference Room in Washington, DC. Information regarding the operation of the SEC’s Public Reference Room may be obtained by calling 1-800-SEC-0330. For a complete list of a fund’s portfolio holdings, view the most recent quarterly holdings report, semiannual report, or annual report on Fidelity’s web site at http://www.advisor.fidelity.com.
NOT FDIC INSURED · MAY LOSE VALUE · NO BANK GUARANTEE
Neither the fund nor Fidelity Distributors Corporation is a bank.
Semiannual Report 2
Chairman’s Message
(photograph of Edward C. Johnson 3d)
Dear Shareholder:
|
Although many securities markets made gains in early 2006, there is only one certainty when it comes to investing: There is no sure thing. There are, however, a number of time-tested, fundamental investment principles that can put the historical odds in your favor.
One of the basic tenets is to invest for the long term. Over time, riding out the markets’ inevitable ups and downs has proven much more effective than selling into panic or chasing the hottest trend. Even missing only a few of the markets’ best days can significantly diminish investor returns. Patience also affords the benefits of compounding — of earning interest on additional income or reinvested dividends and capital gains. There are tax advantages and cost benefits to consider as well. The more you sell, the more taxes you pay, and the more you trade, the higher the costs. While staying the course doesn’t eliminate risk, it can considerably lessen the effect of short-term declines.
You can further manage your investing risk through diversification. And today, more than ever, geographic diversification should be taken into account. Studies indicate that asset allocation is the single most important determinant of a portfolio’s long-term success. The right mix of stocks, bonds and cash —aligned to your particular risk tolerance and investment objective — is very important. Age-appropriate rebalancing is also an essential aspect of asset allocation. For younger investors, an emphasis on equities — which historically have been the best performing asset class over time — is encouraged. As investors near their specific goal, such as retirement or sending a child to college, consideration may be given to replacing volatile assets (e.g. common stocks) with more-stable fixed investments (bonds or savings plans).
A third investment principle — investing regularly — can help lower the average cost of your purchases. Investing a certain amount of money each month or quarter helps ensure you won’t pay for all your shares at market highs. This strategy — known as dollar cost averaging — also reduces unconstruc-tive “emotion” from investing, helping shareholders avoid selling weak performers just prior to an upswing, or chasing a hot performer just before a correction.
We invite you to contact us via the Internet, through our Investor Centers or over the phone. It is our privilege to provide you the information you need to make the investments that are right for you.
Sincerely,
/s/Edward C. Johnson 3d
Edward C. Johnson 3d
3 Semiannual Report
Shareholder Expense Example
As a shareholder of the Fund, you incur two types of costs: (1) transaction costs, including sales charges (loads) on purchase payments or redemption proceeds, and (2) ongoing costs, including management fees, distribution and/or service (12b-1) fees and other Fund expenses. This Example is intended to help you understand your ongoing costs (in dollars) of investing in the Fund and to compare these costs with the ongoing costs of investing in other mutual funds.
The Example is based on an investment of $1,000 invested at the beginning of the period and held for the entire period (December 1, 2005 to May 31, 2006).
The first line of the table below for each class of the Fund provides information about actual account values and actual expenses. You may use the information in this line, together with the amount you invested, to estimate the expenses that you paid over the period. Simply divide your account value by $1,000.00 (for example, an $8,600 account value divided by $1,000.00 = 8.6), then multiply the result by the number in the first line for a class of the Fund under the heading entitled “Expenses Paid During Period” to estimate the expenses you paid on your account during this period.
Hypothetical Example for Comparison Purposes
The second line of the table below for each class of the Fund provides information about hypothetical account values and hypothetical expenses based on a Class’ actual expense ratio and an assumed rate of return of 5% per year before expenses, which is not the Class’ actual return. The hypothetical account values and expenses may not be used to estimate the actual ending account balance or expenses you paid for the period. You may use this information to compare the ongoing costs of investing in the Fund and other funds. To do so, compare this 5% hypothetical example with the 5% hypothetical examples that appear in the shareholder reports of the other funds.
Semiannual Report 4
Please note that the expenses shown in the table are meant to highlight your ongoing costs only and do not reflect any transaction costs. Therefore, the second line of the table is useful in comparing ongoing costs only, and will not help you determine the relative total costs of owning different funds. In addition, if these transactional costs were included, your costs would have been higher.
| | | | | | | | | | | Expenses Paid |
| | | Beginning | | | | Ending | | During Period* |
| | | Account Value | | | | Account Value | | December 1, 2005 |
| | | December 1, 2005 | | | | May 31, 2006 | | to May 31, 2006 |
| Class A | | | | | | | | | | | | |
| Actual | | | | $1,000.00 | | | | $1,000.00 | | | | $6.48 |
| HypotheticalA | | | | $1,000.00 | | | | $1,018.45 | | | | $6.54 |
| Class T | | | | | | | | | | | | |
| Actual | | | | $1,000.00 | | | | $998.90 | | | | $7.72 |
| HypotheticalA | | | | $1,000.00 | | | | $1,017.20 | | | | $7.80 |
| Class B | | | | | | | | | | | | |
| Actual | | | | $1,000.00 | | | | $996.70 | | | | $10.21 |
| HypotheticalA | | | | $1,000.00 | | | | $1,014.71 | | | | $10.30 |
| Class C | | | | | | | | | | | | |
| Actual | | | | $1,000.00 | | | | $996.70 | | | | $10.21 |
| HypotheticalA | | | | $1,000.00 | | | | $1,014.71 | | | | $10.30 |
| Institutional Class | | | | | | | | | | | | |
| Actual | | | | $1,000.00 | | | | $1,001.00 | | | | $5.24 |
| HypotheticalA | | | | $1,000.00 | | | | $1,019.70 | | | | $5.29 |
| |
| A 5% return per year before expenses | | | | | | | | |
* Expenses are equal to each Class’ annualized expense ratio (shown in the table below); multiplied by the average account value over the period, multiplied by 182/365 (to reflect the one-half year period).
| | | Annualized |
| | | Expense Ratio |
| Class A | | 1.30% |
| Class T | | 1.55% |
| Class B | | 2.05% |
| Class C | | 2.05% |
| Institutional Class | | 1.05% |
5 Semiannual Report
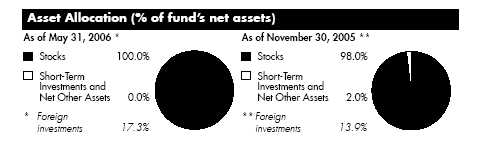
| Investment Changes | | | | |
| |
| |
| Top Ten Stocks as of May 31, 2006 | | | | |
| | | % of fund’s | | % of fund’s net assets |
| | | net assets | | 6 months ago |
| St. Jude Medical, Inc. | | 3.1 | | 3.2 |
| Allergan, Inc. | | 3.1 | | 1.3 |
| IntercontinentalExchange, Inc. | | 2.3 | | 0.5 |
| Ventana Medical Systems, Inc. | | 2.2 | | 1.4 |
| Monsanto Co. | | 2.1 | | 2.0 |
| Comverse Technology, Inc. | | 2.0 | | 1.5 |
| Potash Corp. of Saskatchewan, Inc. | | 2.0 | | 2.5 |
| Broadcom Corp. Class A | | 2.0 | | 0.0 |
| Chicago Mercantile Exchange Holdings, Inc. | | | | |
| Class A | | 2.0 | | 0.0 |
| Humana, Inc. | | 1.8 | | 1.5 |
| | | 22.6 | | |
| Top Five Market Sectors as of May 31, 2006 | | |
| | | % of fund’s | | % of fund’s net assets |
| | | net assets | | 6 months ago |
| Health Care | | 28.4 | | 31.4 |
| Information Technology | | 27.7 | | 20.2 |
| Industrials | | 11.4 | | 7.3 |
| Energy | | 10.6 | | 11.3 |
| Consumer Discretionary | | 7.2 | | 15.4 |
Semiannual Report 6
| Investments May 31, 2006 (Unaudited) |
| Showing Percentage of Net Assets | | | | | | |
| |
| Common Stocks — 100.0% | | | | | | |
| | | Shares | | Value (Note 1) |
| |
| CONSUMER DISCRETIONARY – 7.2% | | | | | | |
| Hotels, Restaurants & Leisure – 2.0% | | | | | | |
| Penn National Gaming, Inc. (a) | | 10,822 | | | | $415,889 |
| Starwood Hotels & Resorts Worldwide, Inc. | | 6,500 | | | | 397,150 |
| | | | | | | 813,039 |
| Household Durables – 1.1% | | | | | | |
| Harman International Industries, Inc. | | 5,100 | | | | 432,123 |
| Internet & Catalog Retail – 1.0% | | | | | | |
| Coldwater Creek, Inc. (a) | | 16,335 | | | | 419,810 |
| Media – 1.1% | | | | | | |
| Focus Media Holding Ltd. ADR | | 6,800 | | | | 429,556 |
| Specialty Retail – 2.0% | | | | | | |
| Abercrombie & Fitch Co. Class A | | 7,200 | | | | 416,520 |
| Urban Outfitters, Inc. (a) | | 20,800 | | | | 386,256 |
| Williams-Sonoma, Inc. | | 300 | | | | 10,845 |
| | | | | | | 813,621 |
| |
| TOTAL CONSUMER DISCRETIONARY | | | | | | 2,908,149 |
| |
| CONSUMER STAPLES – 0.1% | | | | | | |
| Beverages – 0.1% | | | | | | |
| Coca-Cola Enterprises, Inc. | | 1,000 | | | | 19,660 |
| |
| ENERGY – 10.6% | | | | | | |
| Energy Equipment & Services – 1.3% | | | | | | |
| FMC Technologies, Inc. (a) | | 6,100 | | | | 407,114 |
| W-H Energy Services, Inc. (a) | | 1,880 | | | | 105,919 |
| | | | | | | 513,033 |
| Oil, Gas & Consumable Fuels – 9.3% | | | | | | |
| Arch Coal, Inc. | | 8,000 | | | | 386,880 |
| Chesapeake Energy Corp. | | 14,200 | | | | 434,378 |
| CONSOL Energy, Inc. | | 4,800 | | | | 423,600 |
| EOG Resources, Inc. | | 5,900 | | | | 387,394 |
| Peabody Energy Corp. | | 9,400 | | | | 585,996 |
| Quicksilver Resources, Inc. (a) | | 7,500 | | | | 263,025 |
| Range Resources Corp. | | 16,050 | | | | 415,695 |
| Ultra Petroleum Corp. (a) | | 7,200 | | | | 414,360 |
| XTO Energy, Inc. | | 10,200 | | | | 420,444 |
| | | | | | | 3,731,772 |
| |
| TOTAL ENERGY | | | | | | 4,244,805 |
| |
| |
| See accompanying notes which are an integral part of the financial statements. | | | | |
7 Semiannual Report
| Investments (Unaudited) - continued | | | | | | |
| |
| |
| Common Stocks – continued | | | | | | |
| | | Shares | | Value (Note 1) |
| |
| FINANCIALS – 6.6% | | | | | | |
| Capital Markets – 2.1% | | | | | | |
| Daiwa Securities Group, Inc. | | 17,000 | | | | $210,627 |
| Greenhill & Co., Inc. | | 2,000 | | | | 118,800 |
| Indiabulls Financial Services Ltd. | | 21,204 | | | | 136,163 |
| Indiabulls Financial Services Ltd. GDR (e) | | 11,268 | | | | 72,257 |
| Jefferies Group, Inc. | | 3,600 | | | | 105,264 |
| Nikko Cordial Corp. | | 13,500 | | | | 198,457 |
| | | | | | | 841,568 |
| Diversified Financial Services – 4.3% | | | | | | |
| Chicago Mercantile Exchange Holdings, Inc. Class A | | 1,800 | | | | 794,340 |
| IntercontinentalExchange, Inc. | | 16,700 | | | | 930,190 |
| | | | | | | 1,724,530 |
| Real Estate Investment Trusts – 0.2% | | | | | | |
| Host Hotels & Resorts Inc. | | 4,224 | | | | 84,776 |
| |
| TOTAL FINANCIALS | | | | | | 2,650,874 |
| |
| HEALTH CARE – 28.4% | | | | | | |
| Biotechnology – 3.9% | | | | | | |
| Alnylam Pharmaceuticals, Inc. (a) | | 19,800 | | | | 292,842 |
| Celgene Corp. (a) | | 10,080 | | | | 417,816 |
| PDL BioPharma, Inc. (a) | | 21,770 | | | | 440,843 |
| Telik, Inc. (a) | | 14,500 | | | | 231,710 |
| Theravance, Inc. (a) | | 7,500 | | | | 179,400 |
| | | | | | | 1,562,611 |
| Health Care Equipment & Supplies – 12.5% | | | | | | |
| Advanced Medical Optics, Inc. (a) | | 13,400 | | | | 607,288 |
| American Medical Systems Holdings, Inc. (a) | | 31,800 | | | | 628,686 |
| Cyberonics, Inc. (a) | | 26,200 | | | | 654,738 |
| Cytyc Corp. (a) | | 8,076 | | | | 212,237 |
| Mentor Corp. | | 11,600 | | | | 468,524 |
| NeuroMetrix, Inc. (a) | | 6,806 | | | | 198,327 |
| Northstar Neuroscience, Inc. | | 6,700 | | | | 91,522 |
| NuVasive, Inc. (a) | | 25,900 | | | | 425,537 |
| Palomar Medical Technologies, Inc. (a) | | 3,000 | | | | 133,890 |
| Somanetics Corp. (a) | | 9,496 | | | | 148,612 |
| St. Jude Medical, Inc. (a) | | 36,700 | | | | 1,251,468 |
| Varian Medical Systems, Inc. (a) | | 4,500 | | | | 211,050 |
| | | | | | | 5,031,879 |
| |
| |
| See accompanying notes which are an integral part of the financial statements. | | | | |
Semiannual Report 8
| Common Stocks – continued | | | | | | |
| | | Shares | | Value (Note 1) |
| |
| HEALTH CARE – continued | | | | | | |
| Health Care Providers & Services – 2.0% | | | | | | |
| Humana, Inc. (a) | | 14,050 | | | | $711,352 |
| Sierra Health Services, Inc. (a) | | 2,500 | | | | 103,000 |
| | | | | | | 814,352 |
| Health Care Technology – 1.1% | | | | | | |
| Eclipsys Corp. (a) | | 6,600 | | | | 128,304 |
| Merge Technologies, Inc. (a) | | 23,875 | | | | 303,451 |
| | | | | | | 431,755 |
| Life Sciences Tools & Services – 2.2% | | | | | | |
| Ventana Medical Systems, Inc. (a) | | 18,320 | | | | 869,467 |
| Pharmaceuticals – 6.7% | | | | | | |
| Allergan, Inc. | | 13,021 | | | | 1,234,651 |
| Elan Corp. PLC sponsored ADR (a) | | 22,000 | | | | 413,820 |
| Medicis Pharmaceutical Corp. Class A | | 20,500 | | | | 611,310 |
| Sepracor, Inc. (a) | | 8,100 | | | | 419,337 |
| | | | | | | 2,679,118 |
| |
| TOTAL HEALTH CARE | | | | | | 11,389,182 |
| |
| INDUSTRIALS – 11.4% | | | | | | |
| Aerospace & Defense – 1.0% | | | | | | |
| Ceradyne, Inc. (a) | | 9,378 | | | | 409,537 |
| Air Freight & Logistics – 1.0% | | | | | | |
| UTI Worldwide, Inc. | | 14,943 | | | | 406,898 |
| Commercial Services & Supplies – 0.7% | | | | | | |
| Monster Worldwide, Inc. (a) | | 6,078 | | | | 297,032 |
| Construction & Engineering – 2.0% | | | | | | |
| Infrasource Services, Inc. (a) | | 21,500 | | | | 395,600 |
| Quanta Services, Inc. (a) | | 23,900 | | | | 397,935 |
| | | | | | | 793,535 |
| Electrical Equipment – 4.6% | | | | | | |
| AMETEK, Inc. | | 8,700 | | | | 396,981 |
| Energy Conversion Devices, Inc. (a) | | 15,200 | | | | 604,200 |
| Rockwell Automation, Inc. | | 6,200 | | | | 423,336 |
| Suntech Power Holdings Co. Ltd. sponsored ADR | | 14,900 | | | | 419,882 |
| | | | | | | 1,844,399 |
| Industrial Conglomerates – 1.0% | | | | | | |
| McDermott International, Inc. (a) | | 6,000 | | | | 393,660 |
| Machinery – 1.0% | | | | | | |
| Deere & Co. | | 4,700 | | | | 402,320 |
| See accompanying notes which are an integral part of the financial statements. | | | | |
9 Semiannual Report
| Investments (Unaudited) - continued | | | | | | |
| |
| |
| Common Stocks – continued | | | | | | |
| | | Shares | | Value (Note 1) |
| |
| INDUSTRIALS – continued | | | | | | |
| Marine – 0.1% | | | | | | |
| Diana Shipping, Inc. | | 3,900 | | | | $42,783 |
| |
| TOTAL INDUSTRIALS | | | | | | 4,590,164 |
| |
| INFORMATION TECHNOLOGY – 27.7% | | | | | | |
| Communications Equipment – 3.4% | | | | | | |
| ADC Telecommunications, Inc. (a)(d) | | 20,600 | | | | 369,152 |
| Comverse Technology, Inc. (a) | | 35,973 | | | | 810,112 |
| Foundry Networks, Inc. (a) | | 14,900 | | | | 191,614 |
| | | | | | | 1,370,878 |
| Internet Software & Services – 2.1% | | | | | | |
| Bankrate, Inc. (a) | | 9,400 | | | | 428,170 |
| VeriSign, Inc. (a) | | 18,400 | | | | 413,080 |
| | | | | | | 841,250 |
| IT Services – 1.1% | | | | | | |
| Paychex, Inc. | | 11,400 | | | | 418,494 |
| Semiconductors & Semiconductor Equipment – 10.7% | | | | | | |
| Altera Corp. (a) | | 21,387 | | | | 418,330 |
| ARM Holdings PLC sponsored ADR | | 60,700 | | | | 400,620 |
| ASML Holding NV (NY Shares) (a) | | 29,600 | | | | 602,064 |
| Broadcom Corp. Class A (a) | | 23,700 | | | | 801,297 |
| Marvell Technology Group Ltd. (a) | | 8,100 | | | | 386,127 |
| Microchip Technology, Inc. | | 11,870 | | | | 407,141 |
| PMC-Sierra, Inc. (a) | | 41,930 | | | | 404,205 |
| Renewable Energy Corp. AS | | 31,600 | | | | 485,922 |
| Xilinx, Inc. | | 15,200 | | | | 395,200 |
| | | | | | | 4,300,906 |
| Software – 10.4% | | | | | | |
| Activision, Inc. (a) | | 32,510 | | | | 424,906 |
| Adobe Systems, Inc. (a) | | 14,600 | | | | 417,998 |
| Autodesk, Inc. (a) | | 10,700 | | | | 389,373 |
| BEA Systems, Inc. (a) | | 31,000 | | | | 420,360 |
| Cognos, Inc. (a) | | 12,700 | | | | 389,117 |
| Hyperion Solutions Corp. (a) | | 13,398 | | | | 384,657 |
| Informatica Corp. (a) | | 14,600 | | | | 205,276 |
| NAVTEQ Corp. (a) | | 10,300 | | | | 430,025 |
| Nintendo Co. Ltd. | | 2,500 | | | | 423,933 |
| |
| |
| |
| See accompanying notes which are an integral part of the financial statements. | | | | |
Semiannual Report 10
| Common Stocks – continued | | | | | | |
| | | Shares | | Value (Note 1) |
| |
| INFORMATION TECHNOLOGY – continued | | | | | | |
| Software – continued | | | | | | |
| Quality Systems, Inc. | | 8,900 | | | | $295,658 |
| Wind River Systems, Inc. (a) | | 42,919 | | | | 405,585 |
| | | | | | | 4,186,888 |
| |
| TOTAL INFORMATION TECHNOLOGY | | | | | | 11,118,416 |
| |
| MATERIALS – 6.0% | | | | | | |
| Chemicals – 6.0% | | | | | | |
| Agrium, Inc. | | 15,500 | | | | 379,882 |
| Monsanto Co. | | 9,800 | | | | 824,768 |
| Mosaic Co. (a) | | 25,300 | | | | 393,668 |
| Potash Corp. of Saskatchewan, Inc. | | 8,800 | | | | 802,893 |
| | | | | | | 2,401,211 |
| |
| TELECOMMUNICATION SERVICES – 1.0% | | | | | | |
| Wireless Telecommunication Services – 1.0% | | | | | | |
| American Tower Corp. Class A (a) | | 12,700 | | | | 393,319 |
| UTILITIES – 1.0% | | | | | | |
| Independent Power Producers & Energy Traders – 1.0% | | | | | | |
| Ormat Technologies, Inc. | | 11,026 | | | | 410,939 |
| TOTAL COMMON STOCKS | | | | | | |
| (Cost $42,145,945) | | | | 40,126,719 |
| |
| Money Market Funds — 1.9% | | | | | | |
| |
| Fidelity Cash Central Fund, 5.03% (b) | | 466,881 | | | | $466,881 |
| Fidelity Securities Lending Cash Central Fund, 5.09% (b)(c) | | 292,100 | | | | 292,100 |
| TOTAL MONEY MARKET FUNDS | | | | | | |
| (Cost $758,981) | | | | | | 758,981 |
| |
| TOTAL INVESTMENT PORTFOLIO – 101.9% | | | | | | |
| (Cost $42,904,926) | | | | 40,885,700 |
| |
| NET OTHER ASSETS – (1.9)% | | | | | | (764,795) |
| NET ASSETS – 100% | | | | $40,120,905 |
| |
| |
| |
| See accompanying notes which are an integral part of the financial statements. | | | | |
11 Semiannual Report
| Investments (Unaudited) - continued | | |
| |
| |
| Legend | | | | | | (c) | | Investment made with cash collateral |
| (a) Non-income producing | | | | | | | | received from securities on loan. |
| (b) Affiliated fund that is available only to | | (d) | | Security or a portion of the security is on |
| investment companies and other | | | | | | loan at period end. | | |
| accounts managed by Fidelity | | | | (e) | | Security exempt from registration under |
| Investments. The rate quoted is the | | | | | | Rule 144A of the Securities Act of 1933. |
| annualized seven-day yield of the fund | | | | These securities may be resold in |
| at period end. A complete unaudited | | | | transactions exempt from registration, |
| listing of the fund’s holdings as of its | | | | normally to qualified institutional buyers. |
| most recent quarter end is available | | | | At the period end, the value of these |
| upon request. | | | | | | | | securities amounted to $72,257 or 0.2% |
| | | | | | | | | of net assets. | | |
| Affiliated Central Funds | | | | | | | | |
| Information regarding fiscal year to date income earned by the fund from the affiliated Central |
| funds is as follows: | | | | | | | | | | |
| |
| Fund | | | | | | | | | | Income earned |
| Fidelity Cash Central Fund | | | | | | | | | | $14,893 |
| Fidelity Securities Lending Cash Central Fund | | | | | | 1,142 |
| Total | | | | | | | | | | $16,035 |
| |
| Other Information | | | | | | Income Tax Information |
| Distribution of investments by country of | | At November 30, 2005, the fund had a |
| issue, as a percentage of total net assets, is | | capital loss carryforward of approximately |
| as follows: | | | | | | $4,868,687 all of which will expire on |
| | | | | | | November 30, 2010. | | |
| United States of America | | | | 82.7% | | | | | | |
| Canada | | | | 4.9% | | | | | | |
| Japan | | | | 2.0% | | | | | | |
| Netherlands | | | | 1.5% | | | | | | |
| Norway | | | | 1.2% | | | | | | |
| China | | | | 1.1% | | | | | | |
| Cayman Islands | | | | 1.0% | | | | | | |
| Ireland | | | | 1.0% | | | | | | |
| British Virgin Islands | | | | 1.0% | | | | | | |
| United Kingdom | | | | 1.0% | | | | | | |
| Panama | | | | 1.0% | | | | | | |
| Bermuda | | | | 1.0% | | | | | | |
| Others (individually less than 1%) | | 0.6% | | | | | | |
| | | 100.0% | | | | | | |
| |
| |
| |
| See accompanying notes which are an integral part of the financial statements. | | |
Semiannual Report 12
| Financial Statements | | | | | | |
| |
| Statement of Assets and Liabilities | | | | | | |
| | | | | May 31, 2006 (Unaudited) |
| |
| Assets | | | | | | |
| Investment in securities, at value (including securities | | | | | | |
| loaned of $227,584) — See accompanying schedule: | | | | | | |
| Unaffiliated issuers (cost $42,145,945) | | | | $40,126,719 | | |
| Affiliated Central Funds (cost $758,981) | | | | 758,981 | | |
| Total Investments (cost $42,904,926) | | | | | | $40,885,700 |
| Cash | | | | | | 5 |
| Receivable for investments sold | | | | | | 562,281 |
| Receivable for fund shares sold | | | | | | 19,973 |
| Dividends receivable | | | | | | 18,965 |
| Interest receivable | | | | | | 2,502 |
| Prepaid expenses | | | | | | 103 |
| Receivable from investment adviser for expense | | | | | | |
| reductions | | | | | | 10,729 |
| Other receivables | | | | | | 382 |
| Total assets | | | | | | 41,500,640 |
| Liabilities | | | | | | |
| Payable for investments purchased | | | | $932,543 | | |
| Payable for fund shares redeemed | | | | 66,383 | | |
| Accrued management fee | | | | 21,470 | | |
| Distribution fees payable | | | | 22,176 | | |
| Other affiliated payables | | | | 13,924 | | |
| Other payables and accrued expenses | | | | 31,139 | | |
| Collateral on securities loaned, at value | | | | 292,100 | | |
| Total liabilities | | | | | | 1,379,735 |
| Net Assets | | | | | | $40,120,905 |
| Net Assets consist of: | | | | | | |
| Paid in capital | | | | | | $43,368,651 |
| Accumulated net investment loss | | | | | | (151,121) |
| Accumulated undistributed net realized gain (loss) on | | | | | | |
| investments and foreign currency transactions | | | | | | (1,075,969) |
| Net unrealized appreciation (depreciation) on | | | | | | |
| investments and assets and liabilities in foreign | | | | | | |
| currencies | | | | | | (2,020,656) |
| Net Assets | | | | | | $40,120,905 |
13 Semiannual Report
| Financial Statements - continued | | | | | | |
| |
| |
| Statement of Assets and Liabilities - continued | | | | |
| | | May 31, 2006 (Unaudited) |
| |
| Calculation of Maximum Offering Price | | | | | | |
| Class A: | | | | | | |
| Net Asset Value and redemption price per share | | | | | | |
| ($8,274,353 ÷ 878,533 shares) | | | | | | $9.42 |
| Maximum offering price per share (100/94.25 of $9.42) | | | | | | $9.99 |
| Class T: | | | | | | |
| Net Asset Value and redemption price per share | | | | | | |
| ($15,551,789 ÷ 1,675,611 shares) | | | | | | $9.28 |
| Maximum offering price per share (100/96.50 of $9.28) | | | | | | $9.62 |
| Class B: | | | | | | |
| Net Asset Value and offering price per share | | | | | | |
| ($8,589,426 ÷ 950,356 shares)A | | | | | | $9.04 |
| Class C: | | | | | | |
| Net Asset Value and offering price per share | | | | | | |
| ($7,048,652 ÷ 778,640 shares)A | | | | | | $9.05 |
| Institutional Class: | | | | | | |
| Net Asset Value, offering price and redemption price per | | | | |
| share ($656,685 ÷ 68,551 shares) | | | | | | $9.58 |
| |
| A Redemption price per share is equal to net asset value less any applicable contingent deferred sales charge. | | | | |
| |
| |
| |
| |
| See accompanying notes which are an integral part of the financial statements. | | | | |
Semiannual Report 14
| Statement of Operations | | | | | | |
| | | Six months ended May 31, 2006 (Unaudited) |
| |
| Investment Income | | | | | | |
| Dividends | | | | | | $88,994 |
| Special dividends | | | | | | 101,520 |
| Interest | | | | | | 40 |
| Income from affiliated Central Funds | | | | | | 16,035 |
| Total income | | | | | | 206,589 |
| |
| Expenses | | | | | | |
| Management fee | | | | $132,096 | | |
| Transfer agent fees | | | | 83,594 | | |
| Distribution fees | | | | 138,369 | | |
| Accounting and security lending fees | | | | 9,240 | | |
| Independent trustees’ compensation | | | | 85 | | |
| Custodian fees and expenses | | | | 11,583 | | |
| Registration fees | | | | 27,793 | | |
| Audit | | | | 23,050 | | |
| Legal | | | | 1,963 | | |
| Miscellaneous | | | | 8,976 | | |
| Total expenses before reductions | | | | 436,749 | | |
| Expense reductions | | | | (79,039) | | 357,710 |
| |
| Net investment income (loss) | | | | | | (151,121) |
| Realized and Unrealized Gain (Loss) | | | | | | |
| Net realized gain (loss) on: | | | | | | |
| Investment securities: | | | | | | |
| Unaffiliated issuers | | | | 3,935,238 | | |
| Foreign currency transactions | | | | 4,185 | | |
| Total net realized gain (loss) | | | | | | 3,939,423 |
| Change in net unrealized appreciation (depreciation) on: | | | | |
| Investment securities (net of increase in deferred | | | | | | |
| foreign taxes of $1,939) | | | | (3,792,180) | | |
| Assets and liabilities in foreign currencies | | | | 503 | | |
| Total change in net unrealized appreciation | | | | | | |
| (depreciation) | | | | | | (3,791,677) |
| Net gain (loss) | | | | | | 147,746 |
| Net increase (decrease) in net assets resulting from | | | | | | |
| operations | | | | | | $(3,375) |
| |
| |
| |
| |
| See accompanying notes which are an integral part of the financial statements. | | |
15 Semiannual Report
| Financial Statements - continued | | | | | | | | |
| |
| |
| Statement of Changes in Net Assets | | | | | | | | |
| | | Six months ended | | | | Year ended |
| | | May 31, 2006 | | | | November 30, |
| | | (Unaudited) | | | | 2005 |
| Increase (Decrease) in Net Assets | | | | | | | | |
| Operations | | | | | | | | |
| Net investment income (loss) | | | | $(151,121) | | | | $(419,489) |
| Net realized gain (loss) | | | | 3,939,423 | | | | 6,395,351 |
| Change in net unrealized appreciation (depreciation) . | | | | (3,791,677) | | | | (2,534,892) |
| Net increase (decrease) in net assets resulting | | | | | | | | |
| from operations | | | | (3,375) | | | | 3,440,970 |
| Share transactions -- net increase (decrease) | | | | (962,543) | | | | (3,060,326) |
| Total increase (decrease) in net assets | | | | (965,918) | | | | 380,644 |
| |
| Net Assets | | | | | | | | |
| Beginning of period | | | | 41,086,823 | | | | 40,706,179 |
| End of period (including accumulated net investment | | | | | | | | |
| loss of $151,121 and $0, respectively) | | | | $40,120,905 | | | | $41,086,823 |
| |
| |
| |
| |
| See accompanying notes which are an integral part of the financial statements. | | | | |
Semiannual Report 16
| Financial Highlights — Class A | | | | | | | | | | | | | | | | | | |
| |
| | | | | Six months ended | | | | | | | | | | | | | | | | | | | | |
| | | | | May 31, 2006 | | | | | | | | Years ended November 30, | | | | |
| | | | | (Unaudited) | | | | 2005 | | | | 2004 | | | | 2003 | | | | 2002 | | | | 2001 |
| Selected Per-Share Data | | | | | | | | | | | | | | | | | | | | | | | | |
| Net asset value, | | | | | | | | | | | | | | | | | | | | | | | | |
| beginning of period . | | | | $9.42 | | | | $8.61 | | | | $8.02 | | | | $6.47 | | | | $8.08 | | | | $9.05 |
| Income from Investment | | | | | | | | | | | | | | | | | | | | | | | | |
| Operations | | | | | | | | | | | | | | | | | | | | | | | | |
| Net investment in- | | | | | | | | | | | | | | | | | | | | | | | | |
| | | come (loss)E | | | | (.02)F | | | | (.06)G | | | | (.09) | | | | (.06) | | | | (.08) | | | | (.01) |
| Net realized and un- | | | | | | | | | | | | | | | | | | | | | | | | |
| | | realized gain (loss) | | | | .02 | | | | .87 | | | | .68 | | | | 1.61 | | | | (1.53) | | | | (.95) |
| Total from investment | | | | | | | | | | | | | | | | | | | | | | | | |
| operations | | | | — | | | | .81 | | | | .59 | | | | 1.55 | | | | (1.61) | | | | (.96) |
| Distributions from net | | | | | | | | | | | | | | | | | | | | | | | | |
| realized gain | | | | — | | | | — | | | | — | | | | — | | | | — | | | | (.01) |
| Net asset value, end of | | | | | | | | | | | | | | | | | | | | | | | | |
| period | | | | $9.42 | | | | $9.42 | | | | $8.61 | | | | $8.02 | | | | $6.47 | | | | $8.08 |
| Total ReturnB,C,D | | | | —% | | | | 9.41% | | | | 7.36% | | 23.96% | | (19.93)% | | (10.62)% |
| Ratios to Average Net AssetsH | | | | | | | | | | | | | | | | | | | | | | |
| Expenses before | | | | | | | | | | | | | | | | | | | | | | | | |
| | | reductions | | | | 1.62%A | | | | 1.60% | | | | 1.90% | | | | 2.25% | | | | 2.05% | | | | 2.06% |
| Expenses net of fee | | | | | | | | | | | | | | | | | | | | | | | | |
| | | waivers, if any | | | | 1.30%A | | | | 1.33% | | | | 1.50% | | | | 1.54% | | | | 1.69% | | | | 1.75% |
| Expenses net of all | | | | | | | | | | | | | | | | | | | | | | | | |
| | | reductions | | | | 1.27%A | | | | 1.25% | | | | 1.45% | | | | 1.47% | | | | 1.49% | | | | 1.71% |
| Net investment in- | | | | | | | | | | | | | | | | | | | | | | | | |
| | | come (loss) | | (.31)%A,F | | | | (.63)%G | | (1.03)% | | | | (.89)% | | (1.07)% | | | | (.14)% |
| Supplemental Data | | | | | | | | | | | | | | | | | | | | | | | | |
| Net assets, end of | | | | | | | | | | | | | | | | | | | | | | | | |
| | | period (000 | | | | | | | | | | | | | | | | | | | | | | | | |
| | | omitted) | | | | $8,274 | | | | $7,206 | | | | $6,227 | | $4,177 | | | | $2,620 | | $3,320 |
| Portfolio turnover | | | | | | | | | | | | | | | | | | | | | | | | |
| | | rate | | | | 185%A | | | | 213% | | | | 94% | | | | 158% | | | | 473% | | | | 481% |
| A | | Annualized | | | | | | | | | | | | | | | | | | | | | | | | |
| B | | Total returns for periods of less than one year are not annualized. | | | | | | | | | | | | | | | | |
| C | | Total returns would have been lower had certain expenses not been reduced during the periods shown. | | | | | | | | |
| D | | Total returns do not include the effect of the sales charges. | | | | | | | | | | | | | | | | | | | | |
| E | | Calculated based on average shares outstanding during the period. | | | | | | | | | | | | | | | | |
| F | | Investment income per share reflects a special dividend which amounted to $.02 per share. Excluding the special dividend, the ratio of net |
| | | investment income (loss) to average net assets would have been (.78)%. | | | | | | | | | | | | | | | | |
| G | | Investment income per share reflects a special dividend which amounted to $.01 per share. Excluding the special dividend, the ratio of net |
| | | investment income (loss) to average net assets would have been (.69)%. | | | | | | | | | | | | | | | | |
| H | | Expense ratios reflect operating expenses of the class. Expenses before reductions do not reflect amounts reimbursed by the investment adviser or |
| | | reductions from brokerage service arrangements or other expense offset arrangements and do not represent the amount paid by the class during |
| | | periods when reimbursements or reductions occur. Expenses net of fee waivers reflect expenses after reimbursement by the investment adviser but |
| | | prior to reductions from brokerage service arrangements or other expense offset arrangements. Expenses net of all reductions represent the net |
| | | expenses paid by the class. | | | | | | | | | | | | | | | | | | | | | | | | |
| See accompanying notes which are an integral part of the financial statements. | | | | | | | | |
17 Semiannual Report
| Financial Highlights — Class T | | | | | | | | | | | | | | | | | | | | |
| |
| | | | | Six months ended | | | | | | | | | | | | | | | | | | | | |
| | | | | May 31, 2006 | | | | | | | | Years ended November 30, | | | | |
| | | | | (Unaudited) | | | | 2005 | | | | 2004 | | | | 2003 | | | | 2002 | | | | 2001 |
| Selected Per-Share Data | | | | | | | | | | | | | | | | | | | | | | | | |
| Net asset value, | | | | | | | | | | | | | | | | | | | | | | | | |
| beginning of period . | | | | $9.29 | | | | $8.52 | | | | $7.95 | | | | $6.43 | | | | $8.06 | | | | $9.05 |
| Income from Investment | | | | | | | | | | | | | | | | | | | | | | | | |
| Operations | | | | | | | | | | | | | | | | | | | | | | | | |
| Net investment | | | | | | | | | | | | | | | | | | | | | | | | |
| | | income (loss)E | | | | (.03)F | | | | (.08)G | | | | (.11) | | | | (.08) | | | | (.10) | | | | (.03) |
| Net realized and un- | | | | | | | | | | | | | | | | | | | | | | | | |
| | | realized gain (loss) | | | | .02 | | | | .85 | | | | .68 | | | | 1.60 | | | | (1.53) | | | | (.95) |
| Total from investment | | | | | | | | | | | | | | | | | | | | | | | | |
| operations | | | | (.01) | | | | .77 | | | | .57 | | | | 1.52 | | | | (1.63) | | | | (.98) |
| Distributions from net | | | | | | | | | | | | | | | | | | | | | | | | |
| realized gain | | | | — | | | | — | | | | — | | | | — | | | | — | | | | (.01) |
| Net asset value, end of | | | | | | | | | | | | | | | | | | | | | | | | |
| period | | | | $9.28 | | | | $9.29 | | | | $8.52 | | | | $7.95 | | | | $6.43 | | | | $8.06 |
| Total ReturnB,C,D | | | | (.11)% | | | | 9.04% | | | | 7.17% | | 23.64% | | (20.22)% | | (10.84)% |
| Ratios to Average Net AssetsH | | | | | | | | | | | | | | | | | | | | | | |
| Expenses before | | | | | | | | | | | | | | | | | | | | | | | | |
| | | reductions | | | | 1.94%A | | | | 1.93% | | | | 2.25% | | | | 2.47% | | | | 2.16% | | | | 2.30% |
| Expenses net of fee | | | | | | | | | | | | | | | | | | | | | | | | |
| | | waivers, if any | | | | 1.55%A | | | | 1.58% | | | | 1.75% | | | | 1.79% | | | | 1.92% | | | | 2.00% |
| Expenses net of all | | | | | | | | | | | | | | | | | | | | | | | | |
| | | reductions | | | | 1.53%A | | | | 1.50% | | | | 1.71% | | | | 1.72% | | | | 1.72% | | | | 1.96% |
| Net investment in- | | | | | | | | | | | | | | | | | | | | | | | | |
| | | come (loss) | | (.56)%A,F | | | | (.88)%G | | (1.28)% | | (1.14)% | | (1.29)% | | | | (.39)% |
| Supplemental Data | | | | | | | | | | | | | | | | | | | | | | | | |
| Net assets, end of | | | | | | | | | | | | | | | | | | | | | | | | |
| | | period (000 | | | | | | | | | | | | | | | | | | | | | | | | |
| | | omitted) | | $15,552 | | $16,331 | | $15,101 | | $12,458 | | $10,511 | | $14,165 |
| Portfolio turnover | | | | | | | | | | | | | | | | | | | | | | | | |
| | | rate | | | | 185%A | | | | 213% | | | | 94% | | | | 158% | | | | 473% | | | | 481% |
| A | | Annualized | | | | | | | | | | | | | | | | | | | | | | | | |
| B | | Total returns for periods of less than one year are not annualized. | | | | | | | | | | | | | | | | |
| C | | Total returns would have been lower had certain expenses not been reduced during the periods shown. | | | | | | | | |
| D | | Total returns do not include the effect of the sales charges. | | | | | | | | | | | | | | | | | | | | |
| E | | Calculated based on average shares outstanding during the period. | | | | | | | | | | | | | | | | |
| F | | Investment income per share reflects a special dividend which amounted to $.02 per share. Excluding the special dividend, the ratio of net |
| | | investment income (loss) to average net assets would have been (1.04)%. | | | | | | | | | | | | | | | | |
| G | | Investment income per share reflects a special dividend which amounted to $.01 per share. Excluding the special dividend, the ratio of net |
| | | investment income (loss) to average net assets would have been (.94)%. | | | | | | | | | | | | | | | | |
| H | | Expense ratios reflect operating expenses of the class. Expenses before reductions do not reflect amounts reimbursed by the investment adviser or |
| | | reductions from brokerage service arrangements or other expense offset arrangements and do not represent the amount paid by the class during |
| | | periods when reimbursements or reductions occur. Expenses net of fee waivers reflect expenses after reimbursement by the investment adviser but |
| | | prior to reductions from brokerage service arrangements or other expense offset arrangements. Expenses net of all reductions represent the net |
| | | expenses paid by the class. | | | | | | | | | | | | | | | | | | | | | | | | |
| See accompanying notes which are an integral part of the financial statements. | | | | | | | | |
Semiannual Report 18
| Financial Highlights — Class B | | | | | | | | | | | | | | | | | | |
| |
| | | | | Six months ended | | | | | | | | | | | | | | | | | | | | |
| | | | | May 31, 2006 | | | | | | | | Years ended November 30, | | | | |
| | | | | (Unaudited) | | | | 2005 | | | | 2004 | | | | 2003 | | | | 2002 | | | | 2001 |
| Selected Per-Share Data | | | | | | | | | | | | | | | | | | | | | | | | |
| Net asset value, | | | | | | | | | | | | | | | | | | | | | | | | |
| beginning of period . | | | | $9.07 | | | | $8.36 | | | | $7.84 | | | | $6.37 | | | | $8.02 | | | | $9.05 |
| Income from Investment | | | | | | | | | | | | | | | | | | | | | | | | |
| Operations | | | | | | | | | | | | | | | | | | | | | | | | |
| Net investment | | | | | | | | | | | | | | | | | | | | | | | | |
| | | income (loss)E | | | | (.05)F | | | | (.12)G | | | | (.14) | | | | (.11) | | | | (.13) | | | | (.08) |
| Net realized and un- | | | | | | | | | | | | | | | | | | | | | | | | |
| | | realized gain (loss) | | | | .02 | | | | .83 | | | | .66 | | | | 1.58 | | | | (1.52) | | | | (.94) |
| Total from investment | | | | | | | | | | | | | | | | | | | | | | | | |
| operations | | | | (.03) | | | | .71 | | | | .52 | | | | 1.47 | | | | (1.65) | | | | (1.02) |
| Distributions from net | | | | | | | | | | | | | | | | | | | | | | | | |
| realized gain | | | | — | | | | — | | | | — | | | | — | | | | — | | | | (.01) |
| Net asset value, end of | | | | | | | | | | | | | | | | | | | | | | | | |
| period | | | | $9.04 | | | | $9.07 | | | | $8.36 | | | | $7.84 | | | | $6.37 | | | | $8.02 |
| Total ReturnB,C,D | | | | (.33)% | | | | 8.49% | | | | 6.63% | | 23.08% | | (20.57)% | | (11.29)% |
| Ratios to Average Net AssetsH | | | | | | | | | | | | | | | | | | | | | | |
| Expenses before | | | | | | | | | | | | | | | | | | | | | | | | |
| | | reductions | | | | 2.36%A | | | | 2.35% | | | | 2.67% | | | | 2.92% | | | | 2.73% | | | | 2.86% |
| Expenses net of fee | | | | | | | | | | | | | | | | | | | | | | | | |
| | | waivers, if any | | | | 2.05%A | | | | 2.09% | | | | 2.25% | | | | 2.25% | | | | 2.43% | | | | 2.50% |
| Expenses net of all | | | | | | | | | | | | | | | | | | | | | | | | |
| | | reductions | | | | 2.02%A | | | | 2.00% | | | | 2.21% | | | | 2.18% | | | | 2.23% | | | | 2.46% |
| Net investment in- | | | | | | | | | | | | | | | | | | | | | | | | |
| | | come (loss) | | (1.06)%A,F | | (1.38)%G | | (1.78)% | | (1.60)% | | (1.81)% | | | | (.89)% |
| Supplemental Data | | | | | | | | | | | | | | | | | | | | | | | | |
| Net assets, end of | | | | | | | | | | | | | | | | | | | | | | | | |
| | | period (000 | | | | | | | | | | | | | | | | | | | | | | | | |
| | | omitted) | | | | $8,589 | | $ | | $9,237 | | $9,593 | | $8,422 | | | | $6,262 | | $8,038 |
| Portfolio turnover | | | | | | | | | | | | | | | | | | | | | | | | |
| | | rate | | | | 185%A | | | | 213% | | | | 94% | | | | 158% | | | | 473% | | | | 481% |
| A | | Annualized | | | | | | | | | | | | | | | | | | | | | | | | |
| B | | Total returns for periods of less than one year are not annualized. | | | | | | | | | | | | | | | | |
| C | | Total returns would have been lower had certain expenses not been reduced during the periods shown. | | | | | | | | |
| D | | Total returns do not include the effect of the contingent deferred sales charge. | | | | | | | | | | | | | | |
| E | | Calculated based on average shares outstanding during the period. | | | | | | | | | | | | | | | | |
| F | | Investment income per share reflects a special dividend which amounted to $.02 per share. Excluding the special dividend, the ratio of net |
| | | investment income (loss) to average net assets would have been (1.53)%. | | | | | | | | | | | | | | | | |
| G | | Investment income per share reflects a special dividend which amounted to $.01 per share. Excluding the special dividend, the ratio of net |
| | | investment income (loss) to average net assets would have been (1.44)%. | | | | | | | | | | | | | | | | |
| H | | Expense ratios reflect operating expenses of the class. Expenses before reductions do not reflect amounts reimbursed by the investment adviser or |
| | | reductions from brokerage service arrangements or other expense offset arrangements and do not represent the amount paid by the class during |
| | | periods when reimbursements or reductions occur. Expenses net of fee waivers reflect expenses after reimbursement by the investment adviser but |
| | | prior to reductions from brokerage service arrangements or other expense offset arrangements. Expenses net of all reductions represent the net |
| | | expenses paid by the class. | | | | | | | | | | | | | | | | | | | | | | | | |
| See accompanying notes which are an integral part of the financial statements. | | | | | | | | |
19 Semiannual Report
| Financial Highlights — Class C | | | | | | | | | | | | | | | | | | |
| |
| | | | | Six months ended | | | | | | | | | | | | | | | | | | | | |
| | | | | May 31, 2006 | | | | | | | | Years ended November 30, | | | | |
| | | | | (Unaudited) | | | | 2005 | | | | 2004 | | | | 2003 | | | | 2002 | | | | 2001 |
| Selected Per-Share Data | | | | | | | | | | | | | | | | | | | | | | | | |
| Net asset value, | | | | | | | | | | | | | | | | | | | | | | | | |
| beginning of period . | | | | $9.08 | | | | $8.37 | | | | $7.85 | | | | $6.38 | | | | $8.03 | | | | $9.05 |
| Income from Investment | | | | | | | | | | | | | | | | | | | | | | | | |
| Operations | | | | | | | | | | | | | | | | | | | | | | | | |
| Net investment in- | | | | | | | | | | | | | | | | | | | | | | | | |
| | | come (loss)E | | | | (.05)F | | | | (.12)G | | | | (.14) | | | | (.11) | | | | (.13) | | | | (.08) |
| Net realized and un- | | | | | | | | | | | | | | | | | | | | | | | | |
| | | realized gain (loss) | | | | .02 | | | | .83 | | | | .66 | | | | 1.58 | | | | (1.52) | | | | (.93) |
| Total from investment | | | | | | | | | | | | | | | | | | | | | | | | |
| operations | | | | (.03) | | | | .71 | | | | .52 | | | | 1.47 | | | | (1.65) | | | | (1.01) |
| Distributions from net | | | | | | | | | | | | | | | | | | | | | | | | |
| realized gain | | | | — | | | | — | | | | — | | | | — | | | | — | | | | (.01) |
| Net asset value, end of | | | | | | | | | | | | | | | | | | | | | | | | |
| period | | | | $9.05 | | | | $9.08 | | | | $8.37 | | | | $7.85 | | | | $6.38 | | | | $8.03 |
| Total ReturnB,C,D | | | | (.33)% | | | | 8.48% | | | | 6.62% | | 23.04% | | (20.55)% | | (11.18)% |
| Ratios to Average Net AssetsH | | | | | | | | | | | | | | | | | | | | | | |
| Expenses before | | | | | | | | | | | | | | | | | | | | | | | | |
| | | reductions | | | | 2.36%A | | | | 2.34% | | | | 2.52% | | | | 2.77% | | | | 2.58% | | | | 2.79% |
| Expenses net of fee | | | | | | | | | | | | | | | | | | | | | | | | |
| | | waivers, if any | | | | 2.05%A | | | | 2.09% | | | | 2.25% | | | | 2.25% | | | | 2.36% | | | | 2.50% |
| Expenses net of all | | | | | | | | | | | | | | | | | | | | | | | | |
| | | reductions | | | | 2.02%A | | | | 2.01% | | | | 2.21% | | | | 2.18% | | | | 2.16% | | | | 2.46% |
| Net investment in- | | | | | | | | | | | | | | | | | | | | | | | | |
| | | come (loss) | | (1.06)%A,F | | (1.38)%G | | (1.78)% | | (1.61)% | | (1.74)% | | | | (.89)% |
| Supplemental Data | | | | | | | | | | | | | | | | | | | | | | | | |
| Net assets, end of | | | | | | | | | | | | | | | | | | | | | | | | |
| | | period (000 | | | | | | | | | | | | | | | | | | | | | | | | |
| | | omitted) | | | | $7,049 | | $ | | $7,791 | | $9,136 | | $8,427 | | | | $6,636 | | $8,532 |
| Portfolio turnover | | | | | | | | | | | | | | | | | | | | | | | | |
| | | rate | | | | 185%A | | | | 213% | | | | 94% | | | | 158% | | | | 473% | | | | 481% |
| A | | Annualized | | | | | | | | | | | | | | | | | | | | | | | | |
| B | | Total returns for periods of less than one year are not annualized. | | | | | | | | | | | | | | | | |
| C | | Total returns would have been lower had certain expenses not been reduced during the periods shown. | | | | | | | | |
| D | | Total returns do not include the effect of the contingent deferred sales charge. | | | | | | | | | | | | | | |
| E | | Calculated based on average shares outstanding during the period. | | | | | | | | | | | | | | | | |
| F | | Investment income per share reflects a special dividend which amounted to $.02 per share. Excluding the special dividend, the ratio of net |
| | | investment income (loss) to average net assets would have been (1.53)%. | | | | | | | | | | | | | | | | |
| G | | Investment income per share reflects a special dividend which amounted to $.01 per share. Excluding the special dividend, the ratio of net |
| | | investment income (loss) to average net assets would have been (1.44)%. | | | | | | | | | | | | | | | | |
| H | | Expense ratios reflect operating expenses of the class. Expenses before reductions do not reflect amounts reimbursed by the investment adviser or |
| | | reductions from brokerage service arrangements or other expense offset arrangements and do not represent the amount paid by the class during |
| | | periods when reimbursements or reductions occur. Expenses net of fee waivers reflect expenses after reimbursement by the investment adviser but |
| | | prior to reductions from brokerage service arrangements or other expense offset arrangements. Expenses net of all reductions represent the net |
| | | expenses paid by the class. | | | | | | | | | | | | | | | | | | | | | | | | |
| See accompanying notes which are an integral part of the financial statements. | | | | | | | | |
Semiannual Report 20
| Financial Highlights — Institutional Class | | | | | | | | | | | | |
| |
| | | | | Six months ended | | | | | | | | | | | | | | | | | | | | |
| | | | | May 31, 2006 | | | | | | | | Years ended November 30, | | | | |
| | | | | (Unaudited) | | | | 2005 | | | | 2004 | | | | 2003 | | | | 2002 | | | | 2001 |
| Selected Per-Share Data | | | | | | | | | | | | | | | | | | | | | | | | |
| Net asset value, | | | | | | | | | | | | | | | | | | | | | | | | |
| beginning of period . | | | | $9.57 | | | | $8.73 | | | | $8.10 | | | | $6.52 | | | | $8.11 | | | | $9.06 |
| Income from Investment | | | | | | | | | | | | | | | | | | | | | | | | |
| Operations | | | | | | | | | | | | | | | | | | | | | | | | |
| Net investment in- | | | | | | | | | | | | | | | | | | | | | | | | |
| | | come (loss)D | | | | —E,H | | | | (.03)F | | | | (.07) | | | | (.04) | | | | (.05) | | | | .01 |
| Net realized and un- | | | | | | | | | | | | | | | | | | | | | | | | |
| | | realized gain (loss) | | | | .01 | | | | .87 | | | | .70 | | | | 1.62 | | | | (1.54) | | | | (.95) |
| Total from investment | | | | | | | | | | | | | | | | | | | | | | | | |
| operations | | | | .01 | | | | .84 | | | | .63 | | | | 1.58 | | | | (1.59) | | | | (.94) |
| Distributions from net | | | | | | | | | | | | | | | | | | | | | | | | |
| realized gain | | | | — | | | | — | | | | — | | | | — | | | | — | | | | (.01) |
| Net asset value, end of | | | | | | | | | | | | | | | | | | | | | | | | |
| period | | | | $9.58 | | | | $9.57 | | | | $8.73 | | | | $8.10 | | | | $6.52 | | | | $8.11 |
| Total ReturnB,C | | | | .10% | | | | 9.62% | | | | 7.78% | | 24.23% | | (19.61)% | | (10.39)% |
| Ratios to Average Net AssetsG | | | | | | | | | | | | | | | | | | | | | | |
| Expenses before | | | | | | | | | | | | | | | | | | | | | | | | |
| | | reductions | | | | 1.28%A | | | | 1.28% | | | | 1.35% | | | | 1.61% | | | | 1.43% | | | | 1.73% |
| Expenses net of fee | | | | | | | | | | | | | | | | | | | | | | | | |
| | | waivers, if any | | | | 1.05%A | | | | 1.09% | | | | 1.25% | | | | 1.25% | | | | 1.27% | | | | 1.50% |
| Expenses net of all | | | | | | | | | | | | | | | | | | | | | | | | |
| | | reductions | | | | 1.02%A | | | | 1.01% | | | | 1.20% | | | | 1.18% | | | | 1.07% | | | | 1.46% |
| Net investment in- | | | | | | | | | | | | | | | | | | | | | | | | |
| | | come (loss) | | (.06)%A,E | | | | (.38)%F | | | | (.78)% | | | | (.61)% | | | | (.64)% | | | | .11% |
| Supplemental Data | | | | | | | | | | | | | | | | | | | | | | | | |
| Net assets, end of | | | | | | | | | | | | | | | | | | | | | | | | |
| | | period (000 | | | | | | | | | | | | | | | | | | | | | | | | |
| | | omitted) | | | | $657 | | | | $522 | | | | $648 | | | | $579 | | | | $513 | | | | $761 |
| Portfolio turnover | | | | | | | | | | | | | | | | | | | | | | | | |
| | | rate | | | | 185%A | | | | 213% | | | | 94% | | | | 158% | | | | 473% | | | | 481% |
| A | | Annualized | | | | | | | | | | | | | | | | | | | | | | | | |
| B | | Total returns for periods of less than one year are not annualized. | | | | | | | | | | | | | | | | |
| C | | Total returns would have been lower had certain expenses not been reduced during the periods shown. | | | | | | | | |
| D | | Calculated based on average shares outstanding during the period. | | | | | | | | | | | | | | | | |
| E | | Investment income per share reflects a special dividend which amounted to $.02 per share. Excluding the special dividend, the ratio of net |
| | | investment income (loss) to average net assets would have been (.53)%. | | | | | | | | | | | | | | | | |
| F | | Investment income per share reflects a special dividend which amounted to $.01 per share. Excluding the special dividend, the ratio of net |
| | | investment income (loss) to average net assets would have been (.44)%. | | | | �� | | | | | | | | | | | | |
| G | | Expense ratios reflect operating expenses of the class. Expenses before reductions do not reflect amounts reimbursed by the investment adviser or |
| | | reductions from brokerage service arrangements or other expense offset arrangements and do not represent the amount paid by the class during |
| | | periods when reimbursements or reductions occur. Expenses net of fee waivers reflect expenses after reimbursement by the investment adviser but |
| | | prior to reductions from brokerage service arrangements or other expense offset arrangements. Expenses net of all reductions represent the net |
| | | expenses paid by the class. | | | | | | | | | | | | | | | | | | | | | | | | |
| H | | Amount represents less than $.01 per share. | | | | | | | | | | | | | | | | | | | | |
| See accompanying notes which are an integral part of the financial statements. | | | | | | | | |
21 Semiannual Report
Notes to Financial Statements
For the period ended May 31, 2006 (Unaudited)
1. Significant Accounting Policies.
Fidelity Advisor Aggressive Growth Fund (the fund) is a fund of Fidelity Securities Fund (the trust) and is authorized to issue an unlimited number of shares. The trust is registered under the Investment Company Act of 1940, as amended (the 1940 Act), as an open-end management investment company organized as a Massachusetts business trust.
The fund offers Class A, Class T, Class B, Class C, and Institutional Class shares, each of which has equal rights as to assets and voting privileges. Each class has exclusive voting rights with respect to matters that affect that class. Class B shares will automatically convert to Class A shares after a holding period of seven years from the initial date of purchase. Investment income, realized and unrealized capital gains and losses, the common expenses of the fund, and certain fund-level expense reductions, if any, are allocated on a pro rata basis to each class based on the relative net assets of each class to the total net assets of the fund. Each class differs with respect to transfer agent and distribution and service plan fees incurred. Certain expense reductions also differ by class.
The fund may invest in affiliated money market central funds (Money Market Central Funds), which are open-end investment companies available to investment companies and other accounts managed by Fidelity Management & Research Company (FMR) and its affiliates. The financial statements have been prepared in conformity with accounting principles generally accepted in the United States of America, which require management to make certain estimates and assumptions at the date of the financial statements. The following summarizes the significant accounting policies of the fund:
Security Valuation. Investments are valued and net asset value (NAV) per share is calculated (NAV calculation) as of the close of business of the New York Stock Exchange (NYSE), normally 4:00 p.m. Eastern time. Wherever possible, the fund uses independent pricing services approved by the Board of Trustees to value its investments.
Equity securities, including restricted securities, for which market quotations are readily available, are valued at the last reported sale price or official closing price as reported by an independent pricing service on the primary market or exchange on which they are traded. In the event there were no sales during the day or closing prices are not available, securities are valued at the last quoted bid price. Investments in open-end mutual funds, are valued at their closing net asset value each business day. Short-term securities with remaining maturities of sixty days or less for which quotations are not readily available are valued at amortized cost, which approximates value.
When current market prices or quotations are not readily available or do not accurately reflect fair value, valuations may be determined in accordance with procedures adopted by the Board of Trustees. For example, when developments occur between the close of a
Semiannual Report 22
1. Significant Accounting Policies - continued
Security Valuation - continued market and the close of the NYSE that may materially affect the value of some or all of the securities, or when trading in a security is halted, those securities may be fair valued. Factors used in the determination of fair value may include monitoring news to identify significant market or security specific events such as changes in the value of U.S. securities markets, reviewing developments in foreign markets and evaluating the performance of ADRs, futures contracts and exchange-traded funds. Because the fund’s utilization of fair value pricing depends on market activity, the frequency with which fair value pricing is used can not be predicted and may be utilized to a significant extent. The value of securities used for NAV calculation under fair value pricing may differ from published prices for the same securities.
Foreign Currency. The fund uses foreign currency contracts to facilitate transactions in foreign-denominated securities. Losses from these transactions may arise from changes in the value of the foreign currency or if the counterparties do not perform under the contracts’ terms.
Foreign-denominated assets, including investment securities, and liabilities are translated into U.S. dollars at the exchange rate at period end. Purchases and sales of investment securities, income and dividends received and expenses denominated in foreign currencies are translated into U.S. dollars at the exchange rate in effect on the transaction date.
The effects of exchange rate fluctuations on investments are included with the net realized and unrealized gain (loss) on investment securities. Other foreign currency transactions resulting in realized and unrealized gain (loss) are disclosed separately.
Investment Transactions and Income. Security transactions are accounted for as of trade date. Gains and losses on securities sold are determined on the basis of identified cost and may include proceeds received from litigation. Dividend income is recorded on the ex-dividend date, except for certain dividends from foreign securities where the ex-dividend date may have passed, which are recorded as soon as the fund is informed of the ex-dividend date. Non-cash dividends included in dividend income, if any, are recorded at the fair market value of the securities received. Distributions received on securities that represent a return of capital or capital gain are recorded as a reduction of cost of investments and/or as a realized gain. The fund estimates the components of distributions received that may be considered return of capital distributions or capital gain distributions. Large, non-recurring dividends recognized by the fund are presented separately on the Statement of Operations as “Special Dividends” and the impact of these dividends is presented in the Financial Highlights. Interest income is accrued as earned. Interest income includes coupon interest and amortization of premium and accretion of
23 Semiannual Report
Notes to Financial Statements (Unaudited) - continued
1. Significant Accounting Policies - - continued
Investment Transactions and Income - - continued discount on debt securities. Investment income is recorded net of foreign taxes withheld where recovery of such taxes is uncertain.
Expenses. Most expenses of the trust can be directly attributed to a fund. Expenses which cannot be directly attributed are apportioned among each fund in the trust.
Income Tax Information and Distributions to Shareholders. Each year, the fund intends to qualify as a regulated investment company by distributing all of its taxable income and realized gains under Subchapter M of the Internal Revenue Code. As a result, no provision for income taxes is required in the accompanying financial statements. Foreign taxes are provided for based on the fund’s understanding of the tax rules and rates that exist in the foreign markets in which it invests.
Distributions are recorded on the ex-dividend date. Income dividends and capital gain distributions are declared separately for each class. Income and capital gain distributions are determined in accordance with income tax regulations, which may differ from generally accepted accounting principles.
Capital accounts within the financial statements are adjusted for permanent book-tax differences. These adjustments have no impact on net assets or the results of operations. Temporary book-tax differences will reverse in a subsequent period.
Book-tax differences are primarily due to foreign currency transactions, net operating losses, capital loss carryforwards and losses deferred due to wash sales.
The federal tax cost of investments and unrealized appreciation (depreciation) as of period end were as follows:
| Unrealized appreciation | | | | $2,286,354 |
| Unrealized depreciation | | | | (4,401,513) |
| Net unrealized appreciation (depreciation) | | | | $(2,115,159) |
| Cost for federal income tax purposes | | | | $43,000,859 |
| |
| 2. Operating Policies. | | | | |
Repurchase Agreements. FMR has received an Exemptive Order from the Securities and Exchange Commission (the SEC) which permits the fund and other affiliated entities of FMR to transfer uninvested cash balances into joint trading accounts which are then invested in repurchase agreements. The fund may also invest directly with institutions in repurchase agreements. Repurchase agreements are collateralized by government or non-government securities. Upon settlement date, collateral is held in segregated accounts with custodian banks and may be obtained in the event of a default
Semiannual Report 24
2. Operating Policies - continued
Repurchase Agreements - continued of the counterparty. The fund monitors, on a daily basis, the value of the collateral to ensure it is at least equal to the principal amount of the repurchase agreement (including accrued interest). In the event of a default by the counterparty, realization of the collateral proceeds could be delayed, during which time the value of the collateral may decline.
Restricted Securities. The fund may invest in securities that are subject to legal or contractual restrictions on resale. These securities generally may be resold in transactions exempt from registration or to the public if the securities are registered. Disposal of these securities may involve time-consuming negotiations and expense, and prompt sale at an acceptable price may be difficult. Information regarding restricted securities is included at the end of the fund’s Schedule of Investments.
3. Purchases and Sales of Investments.
Purchases and sales of securities, other than short-term securities, aggregated $38,472,051 and $38,613,577, respectively.
4. Fees and Other Transactions with Affiliates.
Management Fee. FMR and its affiliates provide the fund with investment management related services for which the fund pays a monthly management fee. The management fee is the sum of an individual fund fee rate that is based on an annual rate of .35% of the fund’s average net assets and a group fee rate that averaged .27% during the period. The group fee rate is based upon the average net assets of all the mutual funds advised by FMR. The group fee rate decreases as assets under management increase and increases as assets under management decrease. For the period, the total annualized management fee rate was .62% of the fund’s average net assets.
Distribution and Service Plan. In accordance with Rule 12b-1 of the 1940 Act, the fund has adopted separate Distribution and Service Plans for each class of shares. Certain classes pay Fidelity Distributors Corporation (FDC), an affiliate of FMR, separate Distribution and Service Fees, each of which is based on an annual percentage of each class’ average net assets. In addition, FDC may pay financial intermediaries for selling shares of the fund and providing shareholder support services. For the period, the
25 Semiannual Report
Notes to Financial Statements (Unaudited) - continued
4. Fees and Other Transactions with Affiliates - continued
Distribution and Service Plan - continued
Distribution and Service Fee rates and the total amounts paid to and retained by FDC were as follows:
| | | Distribution | | Service | | | | Paid to | | | | Retained |
| | | Fee | | Fee | | | | FDC | | | | by FDC |
| Class A | | 0% | | .25% | | | | $10,135 | | | | $136 |
| Class T | | 25% | | .25% | | | | 42,558 | | | | 199 |
| Class B | | 75% | | .25% | | | | 46,474 | | | | 34,915 |
| Class C | | 75% | | .25% | | | | 39,202 | | | | 3,894 |
| | | | | | | | | $138,369 | | | | v39,144 |
Sales Load. FDC receives a front-end sales charge of up to 5.75% for selling Class A shares, and 3.50% for selling Class T shares, some of which is paid to financial intermediaries for selling shares of the fund. FDC receives the proceeds of contingent deferred sales charges levied on Class A, Class T, Class B, and Class C redemptions. These charges depend on the holding period. The deferred sales charges range from 5% to 1% for Class B, 1% for Class C, 1.00% to .50% for certain purchases of Class A shares (.25% prior to February 24, 2006) and .25% for certain purchases of Class T shares.
| For the period, sales charge amounts retained by FDC were as follows: | | |
| | | | | Retained |
| | | | | by FDC |
| Class A | | | | $8,927 |
| Class T | | | | 6,870 |
| Class B* | | | | 13,166 |
| Class C* | | | | 594 |
| | | | | $29,557 |
* When Class B and Class C shares are initially sold, FDC pays commissions from its own resources to financial intermediaries through which the sales are made.
Transfer Agent Fees. Fidelity Investments Institutional Operations Company, Inc. (FIIOC), an affiliate of FMR, is the transfer, dividend disbursing and shareholder servicing agent for each class of the fund. FIIOC receives account fees and asset-based fees that vary according to the account size and type of account of the shareholders of the respective classes of the fund. FIIOC pays for typesetting, printing and mailing of
Semiannual Report 26
4. Fees and Other Transactions with Affiliates - continued
Transfer Agent Fees - continued shareholder reports, except proxy statements. For the period the total transfer agent fees paid by each class to FIIOC, were as follows:
| | | | | | | % of |
| | | | | | | Average |
| | | | | Amount | | Net Assets |
| Class A | | | | $14,847 | | .37* |
| Class T | | | | 37,468 | | .44* |
| Class B | | | | 16,392 | | .35* |
| Class C | | | | 14,064 | | .36* |
| Institutional Class | | | | 823 | | .28* |
| | | | | $83,594 | | |
| * Annualized | | | | | | |
Accounting and Security Lending Fees. Fidelity Service Company, Inc. (FSC), an affiliate of FMR, maintains the fund’s accounting records. The accounting fee is based on the level of average net assets for the month. Under a separate contract, FSC administers the security lending program. The security lending fee is based on the number and duration of lending transactions.
Affiliated Central Funds. The fund may invest in Money Market Central Funds which seek preservation of capital and current income and are managed by Fidelity Investments Money Management, Inc. (FIMM), an affiliate of FMR.
The Money Market Central Funds do not pay a management fee.
Brokerage Commissions. The fund placed a portion of its portfolio transactions with brokerage firms which are affiliates of the investment adviser. The commissions paid to these affiliated firms were $966 for the period.
5. Committed Line of Credit.
|
The fund participates with other funds managed by FMR in a $4.2 billion credit facility (the “line of credit”) to be utilized for temporary or emergency purposes to fund shareholder redemptions or for other short-term liquidity purposes. The fund has agreed to pay commitment fees on its pro rata portion of the line of credit, which amounts to $63 and is reflected in Miscellaneous Expense on the Statement of Operations. During the period, there were no borrowings on this line of credit.
27 Semiannual Report
Notes to Financial Statements (Unaudited) - continued
6. Security Lending.
The fund lends portfolio securities from time to time in order to earn additional income. On the settlement date of the loan, the fund receives collateral (in the form of U.S. Treasury obligations, letters of credit and/or cash) against the loaned securities and maintains collateral in an amount not less than 100% of the market value of the loaned securities during the period of the loan. The market value of the loaned securities is determined at the close of business of the fund and any additional required collateral is delivered to the fund on the next business day. If the borrower defaults on its obligation to return the securities loaned because of insolvency or other reasons, a fund could experience delays and costs in recovering the securities loaned or in gaining access to the collateral. Any cash collateral received is invested in the Fidelity Securities Lending Cash Central Fund. The value of loaned securities and cash collateral at period end are disclosed on the fund’s Statement of Assets and Liabilities. Security lending income represents the income earned on investing cash collateral, less fees and expenses associated with the loan, plus any premium payments that may be received on the loan of certain types of securities. Security lending income is presented in the Statement of Operations as a component of income from affiliated central funds. Net income from lending portfolio securities during the period amounted to $1,142.
FMR voluntarily agreed to reimburse each class to the extent annual operating expenses exceeded certain levels of average net assets as noted in the table below. Some expenses, for example interest expense, are excluded from this reimbursement.
| The following classes were in reimbursement during the period: | | | | |
| | | Expense | | | | Reimbursement |
| | | Limitations | | | | from adviser |
| Class A | | 1.30% | | | | $12,916 |
| Class T | | 1.55% | | | | 33,260 |
| Class B | | 2.05% | | | | 14,174 |
| Class C | | 2.05% | | | | 12,312 |
| Institutional Class | | 1.05% | | | | 686 |
| | | | | | | $73,348 |
Many of the brokers with whom FMR places trades on behalf of the fund provided services to the fund in addition to trade execution. These services included payments of certain expenses on behalf of the fund totaling $5,619 for the period. In addition, through arrangements with the each class’ transfer agent, credits realized as a result of
Semiannual Report 28
7. Expense Reductions - continued uninvested cash balances were used to reduce the fund’s expenses. During the period, credits reduced each class’ transfer agent expense as noted in the table below.
| | | | | Transfer Agent |
| | | | | expense reduction |
| |
| Class B | | | | 70 |
| Institutional Class | | | | 2 |
| | | | | $72 |
8. Other.
The fund’s organizational documents provide former and current trustees and officers with a limited indemnification against liabilities arising in connection with the performance of their duties to the fund. In the normal course of business, the fund may also enter into contracts that provide general indemnifications. The fund’s maximum exposure under these arrangements is unknown as this would be dependent on future claims that may be made against the fund. The risk of material loss from such claims is considered remote.
9. Share Transactions.
Transactions for each class of shares were as follows:
| | | Shares | | | | Dollars |
| | | Six months en- | | Year ended | | Six months en- | | | | Year ended |
| | | ded May 31, | | November 30, | | ded May 31, | | | | November 30, |
| | | 2006 | | 2005 | | 2006 | | | | 2005 |
| Class A | | | | | | | | | | | | |
| Shares sold | | 197,549 | | 270,002 | | | | $1,969,409 | | | | $2,351,220 |
| Shares redeemed | | (84,396) | | (227,735) | | | | (834,110) | | | | (2,008,944) |
| Net increase (decrease) | | 113,153 | | 42,267 | | | | $1,135,299 | | | | $342,276 |
| Class T | | | | | | | | | | | | |
| Shares sold | | 251,081 | | 613,840 | | | | $2,462,320 | | | | $5,303,116 |
| Shares redeemed | | (333,291) | | (628,481) | | | | (3,286,768) | | | | (5,486,557) |
| Net increase (decrease) | | (82,210) | | (14,641) | | | | $(824,448) | | | | $(183,441) |
| Class B | | | | | | | | | | | | |
| Shares sold | | 89,179 | | 183,867 | | | | $850,052 | | | | $1,559,053 |
| Shares redeemed | | (157,220) | | (313,200) | | | | (1,503,351) | | | | (2,654,466) |
| Net increase (decrease) | | (68,041) | | (129,333) | | | | $(653,299) | | | | $(1,095,413) |
| Class C | | | | | | | | | | | | |
| Shares sold | | 79,303 | | 159,513 | | | | $758,042 | | | | $1,357,035 |
| Shares redeemed | | (158,269) | | (393,180) | | | | (1,520,572) | | | | (3,315,155) |
| Net increase (decrease) | | (78,966) | | (233,667) | | | | $(762,530) | | | | $(1,958,120) |
| Institutional Class | | | | | | | | | | | | |
| Shares sold | | 17,071 | | 10,062 | | | | $173,654 | | | | $90,084 |
| Shares redeemed | | (3,066) | | (29,827) | | | | (31,219) | | | | (255,712) |
| Net increase (decrease) | | 14,005 | | (19,765) | | | | $142,435 | | | | (165,628) |
29 Semiannual Report
Proxy Voting Results
A special meeting of the fund’s shareholders was held on May 17, 2006. The results of votes taken among shareholders on the proposals before them are reported below. Each vote reported represents one dollar of net asset value held on the record date for the meeting.
| PROPOSAL 1 | | | | Ned C. Lautenbach | | |
| To elect a Board of Trustees.A | | | | Affirmative | | 43,082,185,255.05 | | 95.372 |
| | | # of | | % of | | Withheld | | 2,090,721,879.16 | | 4.628 |
| | | Votes | | Votes | | TOTAL | | 45,172,907,134.21 | | 100.000 |
| |
| Dennis J. Dirks | | | | William O. McCoy | | |
| Affirmative | | 43,119,905,166.54 | | 95.455 | | Affirmative | | 42,960,162,066.32 | | 95.102 |
| Withheld | | 2,053,001,967.67 | | 4.545 | | Withheld | | 2,212,745,067.89 | | 4.898 |
| TOTAL | | 45,172,907,134.21 | | 100.000 | | TOTAL | | 45,172,907,134.21 | | 100.000 |
| |
| Albert R. Gamper, Jr. | | | | Robert L. Reynolds | | |
| Affirmative | | 43,068,780,128.62 | | 95.342 | | Affirmative | | 43,087,560,419.66 | | 95.384 |
| Withheld | | 2,104,127,005.59 | | 4.658 | | Withheld | | 2,085,346,714.55 | | 4.616 |
| TOTAL | | 45,172,907,134.21 | | 100.000 | | TOTAL | | 45,172,907,134.21 | | 100.000 |
| |
| Robert M. Gates | | | | Cornelia M. Small | | |
| Affirmative | | 43,032,117,662.60 | | 95.261 | | Affirmative | | 43,092,070,014.53 | | 95.394 |
| Withheld | | 2,140,789,471.61 | | 4.739 | | Withheld | | 2,080,837,119.68 | | 4.606 |
| TOTAL | | 45,172,907,134.21 | | 100.000 | | TOTAL | | 45,172,907,134.21 | | 100.000 |
| |
| George H. Heilmeier | | | | William S. Stavropoulos | | |
| Affirmative | | 43,023,368,882.30 | | 95.242 | | Affirmative | | 43,002,032,676.43 | | 95.194 |
| Withheld | | 2,149,538,251.91 | | 4.758 | | Withheld | | 2,170,874,457.78 | | 4.806 |
| TOTAL | | 45,172,907,134.21 | | 100.000 | | TOTAL | | 45,172,907,134.21 | | 100.000 |
| |
| Edward C. Johnson 3d | | | | Kenneth L. Wolfe | | |
| Affirmative | | 42,881,915,819.70 | | 94.928 | | Affirmative | | 43,047,241,852.81 | | 95.294 |
| Withheld | | 2,290,991,314.51 | | 5.072 | | Withheld | | 2,125,665,281.40 | | 4.706 |
| TOTAL | | 45,172,907,134.21 | | 100.000 | | TOTAL | | 45,172,907,134.21 | | 100.000 |
| Stephen P. Jonas | | | | Abstain | | 503,291,649.48 | | 4.447 |
| | | | | | | Broker | | | | |
| Affirmative | | 43,081,912,066.37 | | 95.371 | | Non-Votes . | | 163,474,631.25 | | 1.445 |
| Withheld | | 2,090,995,067.84 | | 4.629 | | TOTAL | | 11,316,706,049.75 | | 100.000 |
| TOTAL | | 45,172,907,134.21 | | 100.000 | | | | | | |
| |
| James H. KeyesB | | | | A Denotes trust-wide proposal and voting results. |
| Affirmative | | 43,049,050,093.79 | | 95.298 | | B Effective on or about January 1, 2007. | | |
| Withheld | | 2,123,857,040.42 | | 4.702 | | | | | | |
| TOTAL | | 45,172,907,134.21 | | 100.000 | | | | | | |
| |
| Marie L. Knowles | | | | | | | | |
| Affirmative | | 43,090,434,696.02 | | 95.390 | | | | | | |
| Withheld | | 2,082,472,438.19 | | 4.610 | | | | | | |
| TOTAL | | 45,172,907,134.21 | | 100.000 | | | | | | |
Semiannual Report 30
Board Approval of Investment Advisory Contracts and Management Fees
Advisor Aggressive Growth Fund
On January 19, 2006, the Board of Trustees, including the Independent Trustees (together, the Board), voted to approve a general research services agreement (the Agreement) between FMR, FMR Co., Inc. (FMRC), Fidelity Investments Money Management, Inc. (FIMM), and Fidelity Research & Analysis Company (FRAC) (together, the Investment Advisers) for the fund, effective January 20, 2006, pursuant to which FRAC may provide general research and investment advisory support services to FMRC and FIMM. The Board considered that it has approved previously various sub-advisory agreements for the fund with affiliates of FMR that allow FMR to obtain research, non-discretionary advice, or discretionary portfolio management at no additional expense to the fund. The Board, assisted by the advice of fund counsel and independent Trustees’ counsel, considered a broad range of information and determined that it would be beneficial for the fund to access the research and investment advisory support services supplied by FRAC at no additional expense to the fund.
The Board reached this determination in part because the new arrangement will involve no changes in (i) the contractual terms of and fees payable under the fund’s management contract or sub-advisory agreements; (ii) the investment process or strategies employed in the management of the fund’s assets; (iii) the nature or level of services provided under the fund’s management contract or sub-advisory agreements; (iv) the day-to-day management of the fund or the persons primarily responsible for such management; or (v) the ultimate control or beneficial ownership of FMR, FMRC, or FIMM. The Board also considered that the establishment of the Agreement would not necessitate prior shareholder approval of the Agreement or result in an assignment and termination of the fund’s management contract or sub-advisory agreements under the Investment Company Act of 1940.
Because the Board was approving an arrangement with FRAC under which the fund will not bear any additional management fees or expenses and under which the fund’s portfolio manager would not change, it did not consider the fund’s investment performance, competitiveness of management fee and total expenses, costs of services and profitability, or economies of scale to be significant factors in its decision.
In connection with its future renewal of the fund’s management contract and sub-advisory agreements, the Board will consider: (i) the nature, extent, and quality of services provided to the fund, including shareholder and administrative services and investment performance; (ii) the competitiveness of the fund’s management fee and total expenses; (iii) the costs of the services and profitability, including the revenues earned and the expenses incurred by Fidelity in conducting the business of developing, marketing, distributing, managing, administering, and servicing the fund and its shareholders; and (iv) whether there have been economies of scale in respect of the management of the Fidelity funds, whether the Fidelity funds (including the fund) have
31 Semiannual Report
Board Approval of Investment Advisory Contracts and Management Fees - continued
appropriately benefited from any such economies of scale, and whether there is potential for realization of any further economies.
Based on its evaluation of all of the conclusions noted above, and after considering all material factors, the Board ultimately concluded that the fund’s Agreement is fair and reasonable, and that the fund’s Agreement should be approved.
Semiannual Report 32
33 Semiannual Report
Semiannual Report 34
35 Semiannual Report
Semiannual Report 36
37 Semiannual Report
Investment Adviser
Fidelity Management & Research Company
Boston, MA
Investment Sub-Advisers
FMR Co., Inc.
Fidelity Management & Research
(U.K.) Inc.
Fidelity Research & Analysis Company
(formerly Fidelity Management & Research
(Far East) Inc.)
Fidelity International Investment Advisors
Fidelity Investments Japan Limited
Fidelity International Investment Advisors (U.K.) Limited
General Distributor
Fidelity Distributors Corporation
Boston, MA
Transfer and Service Agents
Fidelity Investments Institutional
Operations Company, Inc.
Boston, MA
Fidelity Service Company, Inc.
Boston, MA
Custodian
State Street Bank and Trust Company
Quincy, MA
|

AAG-USAN-0706 1.786773.103


Fidelity® Advisor
Aggressive Growth
Fund - Institutional Class
Semiannual Report May 31, 2006

| Contents | | | | |
| |
| Chairman’s Message | | 3 | | Ned Johnson’s message to shareholders. |
| Shareholder Expense | | 4 | | An example of shareholder expenses. |
| Example | | | | |
| Investment Changes | | 6 | | A summary of major shifts in the fund’s |
| | | | | investments over the past six months. |
| Investments | | 7 | | A complete list of the fund’s investments |
| | | | | with their market values. |
| Financial Statements | | 13 | | Statements of assets and liabilities, |
| | | | | operations, and changes in net assets, |
| | | | | as well as financial highlights. |
| Notes | | 22 | | Notes to the financial statements. |
| Proxy Voting Results | | 30 | | |
| Board Approval of | | 31 | | |
| Investment Advisory | | | | |
| Contracts and | | | | |
| Management Fees | | | | |
To view a fund’s proxy voting guidelines and proxy voting record for the 12-month period ended June 30, visit www.fidelity.com/proxyvotingresults or visit the Securities and Exchange Commission’s (SEC) web site at www.sec.gov. You may also call 1-877-208-0098 to request a free copy of the proxy voting guidelines.
Standard & Poor’s, S&P and S&P 500 are registered service marks of The McGraw-Hill Companies, Inc. and have been licensed for use by Fidelity Distributors Corporation.
Other third party marks appearing herein are the property of their respective owners. All other marks appearing herein are registered or unregistered trademarks or service marks of FMR Corp. or an affiliated company.
This report and the financial statements contained herein are submitted for the general information of the shareholders of the fund. This report is not authorized for distribution to prospective investors in the fund unless preceded or accompanied by an effective prospectus.
A fund files its complete schedule of portfolio holdings with the SEC for the first and third quarters of each fiscal year on Form N-Q. Forms N-Q are available on the SEC’s web site at http://www.sec.gov. A fund’s Forms N-Q may be reviewed and copied at the SEC’s Public Reference Room in Washington, DC. Information regarding the operation of the SEC’s Public Reference Room may be obtained by calling 1-800-SEC-0330. For a complete list of a fund’s portfolio holdings, view the most recent quarterly holdings report, semiannual report, or annual report on Fidelity’s web site at http://www.advisor.fidelity.com.
NOT FDIC INSURED · MAY LOSE VALUE · NO BANK GUARANTEE
Neither the fund nor Fidelity Distributors Corporation is a bank.
Semiannual Report 2
Chairman’s Message
(photograph of Edward C. Johnson 3d)
Dear Shareholder:
|
Although many securities markets made gains in early 2006, there is only one certainty when it comes to investing: There is no sure thing. There are, however, a number of time-tested, fundamental investment principles that can put the historical odds in your favor.
One of the basic tenets is to invest for the long term. Over time, riding out the markets’ inevitable ups and downs has proven much more effective than selling into panic or chasing the hottest trend. Even missing only a few of the markets’ best days can significantly diminish investor returns. Patience also affords the benefits of compounding — of earning interest on additional income or reinvested dividends and capital gains. There are tax advantages and cost benefits to consider as well. The more you sell, the more taxes you pay, and the more you trade, the higher the costs. While staying the course doesn’t eliminate risk, it can considerably lessen the effect of short-term declines.
You can further manage your investing risk through diversification. And today, more than ever, geographic diversification should be taken into account. Studies indicate that asset allocation is the single most important determinant of a portfolio’s long-term success. The right mix of stocks, bonds and cash —aligned to your particular risk tolerance and investment objective — is very important. Age-appropriate rebalancing is also an essential aspect of asset allocation. For younger investors, an emphasis on equities — which historically have been the best performing asset class over time — is encouraged. As investors near their specific goal, such as retirement or sending a child to college, consideration may be given to replacing volatile assets (e.g. common stocks) with more-stable fixed investments (bonds or savings plans).
A third investment principle — investing regularly — can help lower the average cost of your purchases. Investing a certain amount of money each month or quarter helps ensure you won’t pay for all your shares at market highs. This strategy — known as dollar cost averaging — also reduces unconstruc-tive “emotion” from investing, helping shareholders avoid selling weak performers just prior to an upswing, or chasing a hot performer just before a correction.
We invite you to contact us via the Internet, through our Investor Centers or over the phone. It is our privilege to provide you the information you need to make the investments that are right for you.
Sincerely,
/s/Edward C. Johnson 3d
Edward C. Johnson 3d
3 Semiannual Report
Shareholder Expense Example
As a shareholder of the Fund, you incur two types of costs: (1) transaction costs, including sales charges (loads) on purchase payments or redemption proceeds, and (2) ongoing costs, including management fees, distribution and/or service (12b-1) fees and other Fund expenses. This Example is intended to help you understand your ongoing costs (in dollars) of investing in the Fund and to compare these costs with the ongoing costs of investing in other mutual funds.
The Example is based on an investment of $1,000 invested at the beginning of the period and held for the entire period (December 1, 2005 to May 31, 2006).
The first line of the table below for each class of the Fund provides information about actual account values and actual expenses. You may use the information in this line, together with the amount you invested, to estimate the expenses that you paid over the period. Simply divide your account value by $1,000.00 (for example, an $8,600 account value divided by $1,000.00 = 8.6), then multiply the result by the number in the first line for a class of the Fund under the heading entitled “Expenses Paid During Period” to estimate the expenses you paid on your account during this period.
Hypothetical Example for Comparison Purposes
The second line of the table below for each class of the Fund provides information about hypothetical account values and hypothetical expenses based on a Class’ actual expense ratio and an assumed rate of return of 5% per year before expenses, which is not the Class’ actual return. The hypothetical account values and expenses may not be used to estimate the actual ending account balance or expenses you paid for the period. You may use this information to compare the ongoing costs of investing in the Fund and other funds. To do so, compare this 5% hypothetical example with the 5% hypothetical examples that appear in the shareholder reports of the other funds.
Semiannual Report 4
Please note that the expenses shown in the table are meant to highlight your ongoing costs only and do not reflect any transaction costs. Therefore, the second line of the table is useful in comparing ongoing costs only, and will not help you determine the relative total costs of owning different funds. In addition, if these transactional costs were included, your costs would have been higher.
| | | | | | | | | | | Expenses Paid |
| | | Beginning | | | | Ending | | During Period* |
| | | Account Value | | | | Account Value | | December 1, 2005 |
| | | December 1, 2005 | | | | May 31, 2006 | | to May 31, 2006 |
| Class A | | | | | | | | | | | | |
| Actual | | | | $1,000.00 | | | | $1,000.00 | | | | $6.48 |
| HypotheticalA | | | | $1,000.00 | | | | $1,018.45 | | | | $6.54 |
| Class T | | | | | | | | | | | | |
| Actual | | | | $1,000.00 | | | | $998.90 | | | | $7.72 |
| HypotheticalA | | | | $1,000.00 | | | | $1,017.20 | | | | $7.80 |
| Class B | | | | | | | | | | | | |
| Actual | | | | $1,000.00 | | | | $996.70 | | | | $10.21 |
| HypotheticalA | | | | $1,000.00 | | | | $1,014.71 | | | | $10.30 |
| Class C | | | | | | | | | | | | |
| Actual | | | | $1,000.00 | | | | $996.70 | | | | $10.21 |
| HypotheticalA | | | | $1,000.00 | | | | $1,014.71 | | | | $10.30 |
| Institutional Class | | | | | | | | | | | | |
| Actual | | | | $1,000.00 | | | | v1,001.00 | | | | $5.24 |
| HypotheticalA | | | | $1,000.00 | | | | $1,019.70 | | | | $5.29 |
| |
| A 5% return per year before expenses | | | | | | | | |
* Expenses are equal to each Class’ annualized expense ratio (shown in the table below); multiplied by the average account value over the period, multiplied by 182/365 (to reflect the one-half year period).
| | | Annualized |
| | | Expense Ratio |
| Class A | | 1.30% |
| Class T | | 1.55% |
| Class B | | 2.05% |
| Class C | | 2.05% |
| Institutional Class | | 1.05% |
5 Semiannual Report
| Investment Changes | | | | |
| |
| |
| Top Ten Stocks as of May 31, 2006 | | | | |
| | | % of fund’s | | % of fund’s net assets |
| | | net assets | | 6 months ago |
| St. Jude Medical, Inc. | | 3.1 | | 3.2 |
| Allergan, Inc. | | 3.1 | | 1.3 |
| IntercontinentalExchange, Inc. | | 2.3 | | 0.5 |
| Ventana Medical Systems, Inc. | | 2.2 | | 1.4 |
| Monsanto Co. | | 2.1 | | 2.0 |
| Comverse Technology, Inc. | | 2.0 | | 1.5 |
| Potash Corp. of Saskatchewan, Inc. | | 2.0 | | 2.5 |
| Broadcom Corp. Class A | | 2.0 | | 0.0 |
| Chicago Mercantile Exchange Holdings, Inc. | | | | |
| Class A | | 2.0 | | 0.0 |
| Humana, Inc. | | 1.8 | | 1.5 |
| | | 22.6 | | |
| Top Five Market Sectors as of May 31, 2006 | | |
| | | % of fund’s | | % of fund’s net assets |
| | | net assets | | 6 months ago |
| Health Care | | 28.4 | | 31.4 |
| Information Technology | | 27.7 | | 20.2 |
| Industrials | | 11.4 | | 7.3 |
| Energy | | 10.6 | | 11.3 |
| Consumer Discretionary | | 7.2 | | 15.4 |
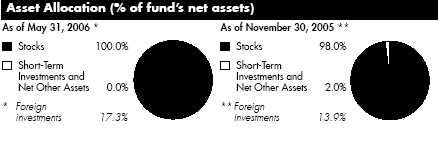
Semiannual Report 6
| Investments May 31, 2006 (Unaudited) |
| Showing Percentage of Net Assets | | | | | | |
| |
| Common Stocks — 100.0% | | | | | | |
| | | Shares | | Value (Note 1) |
| |
| CONSUMER DISCRETIONARY – 7.2% | | | | | | |
| Hotels, Restaurants & Leisure – 2.0% | | | | | | |
| Penn National Gaming, Inc. (a) | | 10,822 | | | | $415,889 |
| Starwood Hotels & Resorts Worldwide, Inc. | | 6,500 | | | | 397,150 |
| | | | | | | 813,039 |
| Household Durables – 1.1% | | | | | | |
| Harman International Industries, Inc. | | 5,100 | | | | 432,123 |
| Internet & Catalog Retail – 1.0% | | | | | | |
| Coldwater Creek, Inc. (a) | | 16,335 | | | | 419,810 |
| Media – 1.1% | | | | | | |
| Focus Media Holding Ltd. ADR | | 6,800 | | | | 429,556 |
| Specialty Retail – 2.0% | | | | | | |
| Abercrombie & Fitch Co. Class A | | 7,200 | | | | 416,520 |
| Urban Outfitters, Inc. (a) | | 20,800 | | | | 386,256 |
| Williams-Sonoma, Inc. | | 300 | | | | 10,845 |
| | | | | | | 813,621 |
| |
| TOTAL CONSUMER DISCRETIONARY | | | | | | 2,908,149 |
| |
| CONSUMER STAPLES – 0.1% | | | | | | |
| Beverages – 0.1% | | | | | | |
| Coca-Cola Enterprises, Inc. | | 1,000 | | | | 19,660 |
| |
| ENERGY – 10.6% | | | | | | |
| Energy Equipment & Services – 1.3% | | | | | | |
| FMC Technologies, Inc. (a) | | 6,100 | | | | 407,114 |
| W-H Energy Services, Inc. (a) | | 1,880 | | | | 105,919 |
| | | | | | | 513,033 |
| Oil, Gas & Consumable Fuels – 9.3% | | | | | | |
| Arch Coal, Inc. | | 8,000 | | | | 386,880 |
| Chesapeake Energy Corp. | | 14,200 | | | | 434,378 |
| CONSOL Energy, Inc. | | 4,800 | | | | 423,600 |
| EOG Resources, Inc. | | 5,900 | | | | 387,394 |
| Peabody Energy Corp. | | 9,400 | | | | 585,996 |
| Quicksilver Resources, Inc. (a) | | 7,500 | | | | 263,025 |
| Range Resources Corp. | | 16,050 | | | | 415,695 |
| Ultra Petroleum Corp. (a) | | 7,200 | | | | 414,360 |
| XTO Energy, Inc. | | 10,200 | | | | 420,444 |
| | | | | | | 3,731,772 |
| |
| TOTAL ENERGY | | | | | | 4,244,805 |
| |
| |
| See accompanying notes which are an integral part of the financial statements. | | | | |
7 Semiannual Report
| Investments (Unaudited) - continued | | | | | | |
| |
| |
| Common Stocks – continued | | | | | | |
| | | Shares | | Value (Note 1) |
| |
| FINANCIALS – 6.6% | | | | | | |
| Capital Markets – 2.1% | | | | | | |
| Daiwa Securities Group, Inc. | | 17,000 | | | | $210,627 |
| Greenhill & Co., Inc. | | 2,000 | | | | 118,800 |
| Indiabulls Financial Services Ltd. | | 21,204 | | | | 136,163 |
| Indiabulls Financial Services Ltd. GDR (e) | | 11,268 | | | | 72,257 |
| Jefferies Group, Inc. | | 3,600 | | | | 105,264 |
| Nikko Cordial Corp. | | 13,500 | | | | 198,457 |
| | | | | | | 841,568 |
| Diversified Financial Services – 4.3% | | | | | | |
| Chicago Mercantile Exchange Holdings, Inc. Class A | | 1,800 | | | | 794,340 |
| IntercontinentalExchange, Inc. | | 16,700 | | | | 930,190 |
| | | | | | | 1,724,530 |
| Real Estate Investment Trusts – 0.2% | | | | | | |
| Host Hotels & Resorts Inc. | | 4,224 | | | | 84,776 |
| |
| TOTAL FINANCIALS | | | | | | 2,650,874 |
| |
| HEALTH CARE – 28.4% | | | | | | |
| Biotechnology – 3.9% | | | | | | |
| Alnylam Pharmaceuticals, Inc. (a) | | 19,800 | | | | 292,842 |
| Celgene Corp. (a) | | 10,080 | | | | 417,816 |
| PDL BioPharma, Inc. (a) | | 21,770 | | | | 440,843 |
| Telik, Inc. (a) | | 14,500 | | | | 231,710 |
| Theravance, Inc. (a) | | 7,500 | | | | 179,400 |
| | | | | | | 1,562,611 |
| Health Care Equipment & Supplies – 12.5% | | | | | | |
| Advanced Medical Optics, Inc. (a) | | 13,400 | | | | 607,288 |
| American Medical Systems Holdings, Inc. (a) | | 31,800 | | | | 628,686 |
| Cyberonics, Inc. (a) | | 26,200 | | | | 654,738 |
| Cytyc Corp. (a) | | 8,076 | | | | 212,237 |
| Mentor Corp. | | 11,600 | | | | 468,524 |
| NeuroMetrix, Inc. (a) | | 6,806 | | | | 198,327 |
| Northstar Neuroscience, Inc. | | 6,700 | | | | 91,522 |
| NuVasive, Inc. (a) | | 25,900 | | | | 425,537 |
| Palomar Medical Technologies, Inc. (a) | | 3,000 | | | | 133,890 |
| Somanetics Corp. (a) | | 9,496 | | | | 148,612 |
| St. Jude Medical, Inc. (a) | | 36,700 | | | | 1,251,468 |
| Varian Medical Systems, Inc. (a) | | 4,500 | | | | 211,050 |
| | | | | | | 5,031,879 |
| |
| |
| See accompanying notes which are an integral part of the financial statements. | | | | |
Semiannual Report 8
| Common Stocks – continued | | | | | | |
| | | Shares | | Value (Note 1) |
| |
| HEALTH CARE – continued | | | | | | |
| Health Care Providers & Services – 2.0% | | | | | | |
| Humana, Inc. (a) | | 14,050 | | | | $711,352 |
| Sierra Health Services, Inc. (a) | | 2,500 | | | | 103,000 |
| | | | | | | 814,352 |
| Health Care Technology – 1.1% | | | | | | |
| Eclipsys Corp. (a) | | 6,600 | | | | 128,304 |
| Merge Technologies, Inc. (a) | | 23,875 | | | | 303,451 |
| | | | | | | 431,755 |
| Life Sciences Tools & Services – 2.2% | | | | | | |
| Ventana Medical Systems, Inc. (a) | | 18,320 | | | | 869,467 |
| Pharmaceuticals – 6.7% | | | | | | |
| Allergan, Inc. | | 13,021 | | | | 1,234,651 |
| Elan Corp. PLC sponsored ADR (a) | | 22,000 | | | | 413,820 |
| Medicis Pharmaceutical Corp. Class A | | 20,500 | | | | 611,310 |
| Sepracor, Inc. (a) | | 8,100 | | | | 419,337 |
| | | | | | | 2,679,118 |
| |
| TOTAL HEALTH CARE | | | | | | 11,389,182 |
| |
| INDUSTRIALS – 11.4% | | | | | | |
| Aerospace & Defense – 1.0% | | | | | | |
| Ceradyne, Inc. (a) | | 9,378 | | | | 409,537 |
| Air Freight & Logistics – 1.0% | | | | | | |
| UTI Worldwide, Inc. | | 14,943 | | | | 406,898 |
| Commercial Services & Supplies – 0.7% | | | | | | |
| Monster Worldwide, Inc. (a) | | 6,078 | | | | 297,032 |
| Construction & Engineering – 2.0% | | | | | | |
| Infrasource Services, Inc. (a) | | 21,500 | | | | 395,600 |
| Quanta Services, Inc. (a) | | 23,900 | | | | 397,935 |
| | | | | | | 793,535 |
| Electrical Equipment – 4.6% | | | | | | |
| AMETEK, Inc. | | 8,700 | | | | 396,981 |
| Energy Conversion Devices, Inc. (a) | | 15,200 | | | | 604,200 |
| Rockwell Automation, Inc. | | 6,200 | | | | 423,336 |
| Suntech Power Holdings Co. Ltd. sponsored ADR | | 14,900 | | | | 419,882 |
| | | | | | | 1,844,399 |
| Industrial Conglomerates – 1.0% | | | | | | |
| McDermott International, Inc. (a) | | 6,000 | | | | 393,660 |
| Machinery – 1.0% | | | | | | |
| Deere & Co. | | 4,700 | | | | 402,320 |
| See accompanying notes which are an integral part of the financial statements. | | | | |
9 Semiannual Report
| Investments (Unaudited) - continued | | | | | | |
| |
| |
| Common Stocks – continued | | | | | | |
| | | Shares | | Value (Note 1) |
| |
| INDUSTRIALS – continued | | | | | | |
| Marine – 0.1% | | | | | | |
| Diana Shipping, Inc. | | 3,900 | | | | $42,783 |
| |
| TOTAL INDUSTRIALS | | | | | | 4,590,164 |
| |
| INFORMATION TECHNOLOGY – 27.7% | | | | | | |
| Communications Equipment – 3.4% | | | | | | |
| ADC Telecommunications, Inc. (a)(d) | | 20,600 | | | | 369,152 |
| Comverse Technology, Inc. (a) | | 35,973 | | | | 810,112 |
| Foundry Networks, Inc. (a) | | 14,900 | | | | 191,614 |
| | | | | | | 1,370,878 |
| Internet Software & Services – 2.1% | | | | | | |
| Bankrate, Inc. (a) | | 9,400 | | | | 428,170 |
| VeriSign, Inc. (a) | | 18,400 | | | | 413,080 |
| | | | | | | 841,250 |
| IT Services – 1.1% | | | | | | |
| Paychex, Inc. | | 11,400 | | | | 418,494 |
| Semiconductors & Semiconductor Equipment – 10.7% | | | | | | |
| Altera Corp. (a) | | 21,387 | | | | 418,330 |
| ARM Holdings PLC sponsored ADR | | 60,700 | | | | 400,620 |
| ASML Holding NV (NY Shares) (a) | | 29,600 | | | | 602,064 |
| Broadcom Corp. Class A (a) | | 23,700 | | | | 801,297 |
| Marvell Technology Group Ltd. (a) | | 8,100 | | | | 386,127 |
| Microchip Technology, Inc. | | 11,870 | | | | 407,141 |
| PMC-Sierra, Inc. (a) | | 41,930 | | | | 404,205 |
| Renewable Energy Corp. AS | | 31,600 | | | | 485,922 |
| Xilinx, Inc. | | 15,200 | | | | 395,200 |
| | | | | | | 4,300,906 |
| Software – 10.4% | | | | | | |
| Activision, Inc. (a) | | 32,510 | | | | 424,906 |
| Adobe Systems, Inc. (a) | | 14,600 | | | | 417,998 |
| Autodesk, Inc. (a) | | 10,700 | | | | 389,373 |
| BEA Systems, Inc. (a) | | 31,000 | | | | 420,360 |
| Cognos, Inc. (a) | | 12,700 | | | | 389,117 |
| Hyperion Solutions Corp. (a) | | 13,398 | | | | 384,657 |
| Informatica Corp. (a) | | 14,600 | | | | 205,276 |
| NAVTEQ Corp. (a) | | 10,300 | | | | 430,025 |
| Nintendo Co. Ltd. | | 2,500 | | | | 423,933 |
| |
| |
| |
| See accompanying notes which are an integral part of the financial statements. | | | | |
Semiannual Report 10
| Common Stocks – continued | | | | | | |
| | | Shares | | Value (Note 1) |
| |
| INFORMATION TECHNOLOGY – continued | | | | | | |
| Software – continued | | | | | | |
| Quality Systems, Inc. | | 8,900 | | | | $295,658 |
| Wind River Systems, Inc. (a) | | 42,919 | | | | 405,585 |
| | | | | | | 4,186,888 |
| |
| TOTAL INFORMATION TECHNOLOGY | | | | | | 11,118,416 |
| |
| MATERIALS – 6.0% | | | | | | |
| Chemicals – 6.0% | | | | | | |
| Agrium, Inc. | | 15,500 | | | | 379,882 |
| Monsanto Co. | | 9,800 | | | | 824,768 |
| Mosaic Co. (a) | | 25,300 | | | | 393,668 |
| Potash Corp. of Saskatchewan, Inc. | | 8,800 | | | | 802,893 |
| | | | | | | 2,401,211 |
| |
| TELECOMMUNICATION SERVICES – 1.0% | | | | | | |
| Wireless Telecommunication Services – 1.0% | | | | | | |
| American Tower Corp. Class A (a) | | 12,700 | | | | 393,319 |
| UTILITIES – 1.0% | | | | | | |
| Independent Power Producers & Energy Traders – 1.0% | | | | | | |
| Ormat Technologies, Inc. | | 11,026 | | | | 410,939 |
| TOTAL COMMON STOCKS | | | | | | |
| (Cost $42,145,945) | | | | 40,126,719 |
| |
| Money Market Funds — 1.9% | | | | | | |
| |
| Fidelity Cash Central Fund, 5.03% (b) | | 466,881 | | | | $466,881 |
| Fidelity Securities Lending Cash Central Fund, 5.09% (b)(c) | | 292,100 | | | | 292,100 |
| TOTAL MONEY MARKET FUNDS | | | | | | |
| (Cost $758,981) | | | | | | 758,981 |
| |
| TOTAL INVESTMENT PORTFOLIO – 101.9% | | | | | | |
| (Cost $42,904,926) | | | | 40,885,700 |
| |
| NET OTHER ASSETS – (1.9)% | | | | | | (764,795) |
| NET ASSETS – 100% | | | | $40,120,905 |
| |
| |
| |
| See accompanying notes which are an integral part of the financial statements. | | | | |
11 Semiannual Report
Investments (Unaudited) - continued
(a) Non-income producing
(b) Affiliated fund that is available only to investment companies and other accounts managed by Fidelity Investments. The rate quoted is the annualized seven-day yield of the fund at period end. A complete unaudited listing of the fund’s holdings as of its most recent quarter end is available upon request.
(c) Investment made with cash collateral received from securities on loan. (d) Security or a portion of the security is on loan at period end.
(e) Security exempt from registration under Rule 144A of the Securities Act of 1933.
These securities may be resold in transactions exempt from registration, normally to qualified institutional buyers. At the period end, the value of these securities amounted to $72,257 or 0.2% of net assets.
Information regarding fiscal year to date income earned by the fund from the affiliated Central funds is as follows:
| Fund | | | | | | Income earned |
| Fidelity Cash Central Fund | | | | | | $14,893 |
| Fidelity Securities Lending Cash Central Fund | | | | 1,142 |
| Total | | | | | | $16,035 |
| |
| Other Information | | | | Income Tax Information |
| Distribution of investments by country of | | At November 30, 2005, the fund had a |
| issue, as a percentage of total net assets, is | | capital loss carryforward of approximately |
| as follows: | | | | $4,868,687 all of which will expire on |
| | | | | November 30, 2010. | | |
| United States of America | | 82.7% | | | | |
| Canada | | 4.9% | | | | |
| Japan | | 2.0% | | | | |
| Netherlands | | 1.5% | | | | |
| Norway | | 1.2% | | | | |
| China | | 1.1% | | | | |
| Cayman Islands | | 1.0% | | | | |
| Ireland | | 1.0% | | | | |
| British Virgin Islands | | 1.0% | | | | |
| United Kingdom | | 1.0% | | | | |
| Panama | | 1.0% | | | | |
| Bermuda | | 1.0% | | | | |
| Others (individually less than 1%) . | | 0.6% | | | | |
| | | 100.0% | | | | |
| |
| |
| |
| See accompanying notes which are an integral part of the financial statements. | | |
Semiannual Report 12
| Financial Statements | | | | | | |
| |
| Statement of Assets and Liabilities | | | | | | |
| | | | | May 31, 2006 (Unaudited) |
| |
| Assets | | | | | | |
| Investment in securities, at value (including securities | | | | | | |
| loaned of $227,584) — See accompanying schedule: | | | | | | |
| Unaffiliated issuers (cost $42,145,945) | | | | $40,126,719 | | |
| Affiliated Central Funds (cost $758,981) | | | | 758,981 | | |
| Total Investments (cost $42,904,926) | | | | | | $40,885,700 |
| Cash | | | | | | 5 |
| Receivable for investments sold | | | | | | 562,281 |
| Receivable for fund shares sold | | | | | | 19,973 |
| Dividends receivable | | | | | | 18,965 |
| Interest receivable | | | | | | 2,502 |
| Prepaid expenses | | | | | | 103 |
| Receivable from investment adviser for expense | | | | | | |
| reductions | | | | | | 10,729 |
| Other receivables | | | | | | 382 |
| Total assets | | | | | | 41,500,640 |
| Liabilities | | | | | | |
| Payable for investments purchased | | | | $932,543 | | |
| Payable for fund shares redeemed | | | | 66,383 | | |
| Accrued management fee | | | | 21,470 | | |
| Distribution fees payable | | | | 22,176 | | |
| Other affiliated payables | | | | 13,924 | | |
| Other payables and accrued expenses | | | | 31,139 | | |
| Collateral on securities loaned, at value | | | | 292,100 | | |
| Total liabilities | | | | | | 1,379,735 |
| Net Assets | | | | | | $40,120,905 |
| Net Assets consist of: | | | | | | |
| Paid in capital | | | | | | $43,368,651 |
| Accumulated net investment loss | | | | | | (151,121) |
| Accumulated undistributed net realized gain (loss) on | | | | | | |
| investments and foreign currency transactions | | | | | | (1,075,969) |
| Net unrealized appreciation (depreciation) on | | | | | | |
| investments and assets and liabilities in foreign | | | | | | |
| currencies | | | | | | (2,020,656) |
| Net Assets | | | | | | $40,120,905 |
| |
| |
| |
| |
| See accompanying notes which are an integral part of the financial statements. | | |
13 Semiannual Report
| Financial Statements - continued | | | | | | |
| |
| |
| Statement of Assets and Liabilities - continued | | | | |
| | | May 31, 2006 (Unaudited) |
| |
| Calculation of Maximum Offering Price | | | | | | |
| Class A: | | | | | | |
| Net Asset Value and redemption price per share | | | | | | |
| ($8,274,353 ÷ 878,533 shares) | | | | | | $9.42 |
| Maximum offering price per share (100/94.25 of $9.42) | | | | | | $9.99 |
| Class T: | | | | | | |
| Net Asset Value and redemption price per share | | | | | | |
| ($15,551,789 ÷ 1,675,611 shares) | | | | | | $9.28 |
| Maximum offering price per share (100/96.50 of $9.28) | | | | | | $9.62 |
| Class B: | | | | | | |
| Net Asset Value and offering price per share | | | | | | |
| ($8,589,426 ÷ 950,356 shares)A | | | | | | $9.04 |
| Class C: | | | | | | |
| Net Asset Value and offering price per share | | | | | | |
| ($7,048,652 ÷ 778,640 shares)A | | | | | | $9.05 |
| Institutional Class: | | | | | | |
| Net Asset Value, offering price and redemption price per | | | | |
| share ($656,685 ÷ 68,551 shares) | | | | | | $9.58 |
| |
| A Redemption price per share is equal to net asset value less any applicable contingent deferred sales charge. | | | | |
| |
| |
| |
| |
| See accompanying notes which are an integral part of the financial statements. | | | | |
Semiannual Report 14
| Statement of Operations | | | | | | |
| | | Six months ended May 31, 2006 (Unaudited) |
| |
| Investment Income | | | | | | |
| Dividends | | | | | | $88,994 |
| Special dividends | | | | | | 101,520 |
| Interest | | | | | | 40 |
| Income from affiliated Central Funds | | | | | | 16,035 |
| Total income | | | | | | 206,589 |
| |
| Expenses | | | | | | |
| Management fee | | | | $132,096 | | |
| Transfer agent fees | | | | 83,594 | | |
| Distribution fees | | | | 138,369 | | |
| Accounting and security lending fees | | | | 9,240 | | |
| Independent trustees’ compensation | | | | 85 | | |
| Custodian fees and expenses | | | | 11,583 | | |
| Registration fees | | | | 27,793 | | |
| Audit | | | | 23,050 | | |
| Legal | | | | 1,963 | | |
| Miscellaneous | | | | 8,976 | | |
| Total expenses before reductions | | | | 436,749 | | |
| Expense reductions | | | | (79,039) | | 357,710 |
| |
| Net investment income (loss) | | | | | | (151,121) |
| Realized and Unrealized Gain (Loss) | | | | | | |
| Net realized gain (loss) on: | | | | | | |
| Investment securities: | | | | | | |
| Unaffiliated issuers | | | | 3,935,238 | | |
| Foreign currency transactions | | | | 4,185 | | |
| Total net realized gain (loss) | | | | | | 3,939,423 |
| Change in net unrealized appreciation (depreciation) on: | | | | |
| Investment securities (net of increase in deferred | | | | | | |
| foreign taxes of $1,939) | | | | (3,792,180) | | |
| Assets and liabilities in foreign currencies | | | | 503 | | |
| Total change in net unrealized appreciation | | | | | | |
| (depreciation) | | | | | | (3,791,677) |
| Net gain (loss) | | | | | | 147,746 |
| Net increase (decrease) in net assets resulting from | | | | | | |
| operations | | | | | | $(3,375) |
| |
| |
| |
| |
| See accompanying notes which are an integral part of the financial statements. | | |
15 Semiannual Report
| Financial Statements - continued | | | | | | | | |
| |
| |
| Statement of Changes in Net Assets | | | | | | | | |
| | | Six months ended | | | | Year ended |
| | | May 31, 2006 | | | | November 30, |
| | | (Unaudited) | | | | 2005 |
| Increase (Decrease) in Net Assets | | | | | | | | |
| Operations | | | | | | | | |
| Net investment income (loss) | | | | $(151,121) | | | | $(419,489) |
| Net realized gain (loss) | | | | 3,939,423 | | | | 6,395,351 |
| Change in net unrealized appreciation (depreciation) . | | | | (3,791,677) | | | | (2,534,892) |
| Net increase (decrease) in net assets resulting | | | | | | | | |
| from operations | | | | (3,375) | | | | 3,440,970 |
| Share transactions -- net increase (decrease) | | | | (962,543) | | | | (3,060,326) |
| Total increase (decrease) in net assets | | | | (965,918) | | | | 380,644 |
| |
| Net Assets | | | | | | | | |
| Beginning of period | | | | 41,086,823 | | | | 40,706,179 |
| End of period (including accumulated net investment | | | | | | | | |
| loss of $151,121 and $0, respectively) | | | | $40,120,905 | | | | $41,086,823 |
| |
| |
| |
| |
| See accompanying notes which are an integral part of the financial statements. | | | | |
Semiannual Report 16
| Financial Highlights — Class A | | | | | | | | | | | | | | | | | | |
| |
| | | | | Six months ended | | | | | | | | | | | | | | | | | | | | |
| | | | | May 31, 2006 | | | | | | | | Years ended November 30, | | | | |
| | | | | (Unaudited) | | | | 2005 | | | | 2004 | | | | 2003 | | | | 2002 | | | | 2001 |
| Selected Per-Share Data | | | | | | | | | | | | | | | | | | | | | | | | |
| Net asset value, | | | | | | | | | | | | | | | | | | | | | | | | |
| beginning of period . | | | | $9.42 | | | | $8.61 | | | | $8.02 | | | | $6.47 | | | | $8.08 | | | | $9.05 |
| Income from Investment | | | | | | | | | | | | | | | | | | | | | | | | |
| Operations | | | | | | | | | | | | | | | | | | | | | | | | |
| Net investment in- | | | | | | | | | | | | | | | | | | | | | | | | |
| | | come (loss)E | | | | (.02)F | | | | (.06)G | | | | (.09) | | | | (.06) | | | | (.08) | | | | (.01) |
| Net realized and un- | | | | | | | | | | | | | | | | | | | | | | | | |
| | | realized gain (loss) | | | | .02 | | | | .87 | | | | .68 | | | | 1.61 | | | | (1.53) | | | | (.95) |
| Total from investment | | | | | | | | | | | | | | | | | | | | | | | | |
| operations | | | | — | | | | .81 | | | | .59 | | | | 1.55 | | | | (1.61) | | | | (.96) |
| Distributions from net | | | | | | | | | | | | | | | | | | | | | | | | |
| realized gain | | | | — | | | | — | | | | — | | | | — | | | | — | | | | (.01) |
| Net asset value, end of | | | | | | | | | | | | | | | | | | | | | | | | |
| period | | | | $9.42 | | | | $9.42 | | | | $8.61 | | | | $8.02 | | | | $6.47 | | | | $8.08 |
| Total ReturnB,C,D | | | | —% | | | | 9.41% | | | | 7.36% | | 23.96% | | (19.93)% | | (10.62)% |
| Ratios to Average Net AssetsH | | | | | | | | | | | | | | | | | | | | | | |
| Expenses before | | | | | | | | | | | | | | | | | | | | | | | | |
| | | reductions | | | | 1.62%A | | | | 1.60% | | | | 1.90% | | | | 2.25% | | | | 2.05% | | | | 2.06% |
| Expenses net of fee | | | | | | | | | | | | | | | | | | | | | | | | |
| | | waivers, if any | | | | 1.30%A | | | | 1.33% | | | | 1.50% | | | | 1.54% | | | | 1.69% | | | | 1.75% |
| Expenses net of all | | | | | | | | | | | | | | | | | | | | | | | | |
| | | reductions | | | | 1.27%A | | | | 1.25% | | | | 1.45% | | | | 1.47% | | | | 1.49% | | | | 1.71% |
| Net investment in- | | | | | | | | | | | | | | | | | | | | | | | | |
| | | come (loss) | | (.31)%A,F | | | | (.63)%G | | (1.03)% | | | | (.89)% | | (1.07)% | | | | (.14)% |
| Supplemental Data | | | | | | | | | | | | | | | | | | | | | | | | |
| Net assets, end of | | | | | | | | | | | | | | | | | | | | | | | | |
| | | period (000 | | | | | | | | | | | | | | | | | | | | | | | | |
| | | omitted) | | | | $8,274 | | | | $7,206 | | | | $6,227 | | $4,177 | | | | $2,620 | | $3,320 |
| Portfolio turnover | | | | | | | | | | | | | | | | | | | | | | | | |
| | | rate | | | | 185%A | | | | 213% | | | | 94% | | | | 158% | | | | 473% | | | | 481% |
| A | | Annualized | | | | | | | | | | | | | | | | | | | | | | | | |
| B | | Total returns for periods of less than one year are not annualized. | | | | | | | | | | | | | | | | |
| C | | Total returns would have been lower had certain expenses not been reduced during the periods shown. | | | | | | | | |
| D | | Total returns do not include the effect of the sales charges. | | | | | | | | | | | | | | | | | | | | |
| E | | Calculated based on average shares outstanding during the period. | | | | | | | | | | | | | | | | |
| F | | Investment income per share reflects a special dividend which amounted to $.02 per share. Excluding the special dividend, the ratio of net |
| | | investment income (loss) to average net assets would have been (.78)%. | | | | | | | | | | | | | | | | |
| G | | Investment income per share reflects a special dividend which amounted to $.01 per share. Excluding the special dividend, the ratio of net |
| | | investment income (loss) to average net assets would have been (.69)%. | | | | | | | | | | | | | | | | |
| H | | Expense ratios reflect operating expenses of the class. Expenses before reductions do not reflect amounts reimbursed by the investment adviser or |
| | | reductions from brokerage service arrangements or other expense offset arrangements and do not represent the amount paid by the class during |
| | | periods when reimbursements or reductions occur. Expenses net of fee waivers reflect expenses after reimbursement by the investment adviser but |
| | | prior to reductions from brokerage service arrangements or other expense offset arrangements. Expenses net of all reductions represent the net |
| | | expenses paid by the class. | | | | | | | | | | | | | | | | | | | | | | | | |
| See accompanying notes which are an integral part of the financial statements. | | | | | | | | |
17 Semiannual Report
| Financial Highlights — Class T | | | | | | | | | | | | | | | | | | | | |
| |
| | | | | Six months ended | | | | | | | | | | | | | | | | | | | | |
| | | | | May 31, 2006 | | | | | | | | Years ended November 30, | | | | |
| | | | | (Unaudited) | | | | 2005 | | | | 2004 | | | | 2003 | | | | 2002 | | | | 2001 |
| Selected Per-Share Data | | | | | | | | | | | | | | | | | | | | | | | | |
| Net asset value, | | | | | | | | | | | | | | | | | | | | | | | | |
| beginning of period . | | | | $9.29 | | | | $8.52 | | | | $7.95 | | | | $6.43 | | | | $8.06 | | | | $9.05 |
| Income from Investment | | | | | | | | | | | | | | | | | | | | | | | | |
| Operations | | | | | | | | | | | | | | | | | | | | | | | | |
| Net investment | | | | | | | | | | | | | | | | | | | | | | | | |
| | | income (loss)E | | | | (.03)F | | | | (.08)G | | | | (.11) | | | | (.08) | | | | (.10) | | | | (.03) |
| Net realized and un- | | | | | | | | | | | | | | | | | | | | | | | | |
| | | realized gain (loss) | | | | .02 | | | | .85 | | | | .68 | | | | 1.60 | | | | (1.53) | | | | (.95) |
| Total from investment | | | | | | | | | | | | | | | | | | | | | | | | |
| operations | | | | (.01) | | | | .77 | | | | .57 | | | | 1.52 | | | | (1.63) | | | | (.98) |
| Distributions from net | | | | | | | | | | | | | | | | | | | | | | | | |
| realized gain | | | | — | | | | — | | | | — | | | | — | | | | — | | | | (.01) |
| Net asset value, end of | | | | | | | | | | | | | | | | | | | | | | | | |
| period | | | | $9.28 | | | | $9.29 | | | | $8.52 | | | | $7.95 | | | | $6.43 | | | | $8.06 |
| Total ReturnB,C,D | | | | (.11)% | | | | 9.04% | | | | 7.17% | | 23.64% | | (20.22)% | | (10.84)% |
| Ratios to Average Net AssetsH | | | | | | | | | | | | | | | | | | | | | | |
| Expenses before | | | | | | | | | | | | | | | | | | | | | | | | |
| | | reductions | | | | 1.94%A | | | | 1.93% | | | | 2.25% | | | | 2.47% | | | | 2.16% | | | | 2.30% |
| Expenses net of fee | | | | | | | | | | | | | | | | | | | | | | | | |
| | | waivers, if any | | | | 1.55%A | | | | 1.58% | | | | 1.75% | | | | 1.79% | | | | 1.92% | | | | 2.00% |
| Expenses net of all | | | | | | | | | | | | | | | | | | | | | | | | |
| | | reductions | | | | 1.53%A | | | | 1.50% | | | | 1.71% | | | | 1.72% | | | | 1.72% | | | | 1.96% |
| Net investment in- | | | | | | | | | | | | | | | | | | | | | | | | |
| | | come (loss) | | (.56)%A,F | | | | (.88)%G | | (1.28)% | | (1.14)% | | (1.29)% | | | | (.39)% |
| Supplemental Data | | | | | | | | | | | | | | | | | | | | | | | | |
| Net assets, end of | | | | | | | | | | | | | | | | | | | | | | | | |
| | | period (000 | | | | | | | | | | | | | | | | | | | | | | | | |
| | | omitted) | | $15,552 | | $16,331 | | $15,101 | | $12,458 | | $10,511 | | $14,165 |
| Portfolio turnover | | | | | | | | | | | | | | | | | | | | | | | | |
| | | rate | | | | 185%A | | | | 213% | | | | 94% | | | | 158% | | | | 473% | | | | 481% |
| A | | Annualized | | | | | | | | | | | | | | | | | | | | | | | | |
| B | | Total returns for periods of less than one year are not annualized. | | | | | | | | | | | | | | | | |
| C | | Total returns would have been lower had certain expenses not been reduced during the periods shown. | | | | | | | | |
| D | | Total returns do not include the effect of the sales charges. | | | | | | | | | | | | | | | | | | | | |
| E | | Calculated based on average shares outstanding during the period. | | | | | | | | | | | | | | | | |
| F | | Investment income per share reflects a special dividend which amounted to $.02 per share. Excluding the special dividend, the ratio of net |
| | | investment income (loss) to average net assets would have been (1.04)%. | | | | | | | | | | | | | | | | |
| G | | Investment income per share reflects a special dividend which amounted to $.01 per share. Excluding the special dividend, the ratio of net |
| | | investment income (loss) to average net assets would have been (.94)%. | | | | | | | | | | | | | | | | |
| H | | Expense ratios reflect operating expenses of the class. Expenses before reductions do not reflect amounts reimbursed by the investment adviser or |
| | | reductions from brokerage service arrangements or other expense offset arrangements and do not represent the amount paid by the class during |
| | | periods when reimbursements or reductions occur. Expenses net of fee waivers reflect expenses after reimbursement by the investment adviser but |
| | | prior to reductions from brokerage service arrangements or other expense offset arrangements. Expenses net of all reductions represent the net |
| | | expenses paid by the class. | | | | | | | | | | | | | | | | | | | | | | | | |
| See accompanying notes which are an integral part of the financial statements. | | | | | | | | |
Semiannual Report 18
| Financial Highlights — Class B | | | | | | | | | | | | | | | | | | |
| |
| | | | | Six months ended | | | | | | | | | | | | | | | | | | | | |
| | | | | May 31, 2006 | | | | | | | | Years ended November 30, | | | | |
| | | | | (Unaudited) | | | | 2005 | | | | 2004 | | | | 2003 | | | | 2002 | | | | 2001 |
| Selected Per-Share Data | | | | | | | | | | | | | | | | | | | | | | | | |
| Net asset value, | | | | | | | | | | | | | | | | | | | | | | | | |
| beginning of period . | | | | $9.07 | | | | $8.36 | | | | $7.84 | | | | $6.37 | | | | $8.02 | | | | $9.05 |
| Income from Investment | | | | | | | | | | | | | | | | | | | | | | | | |
| Operations | | | | | | | | | | | | | | | | | | | | | | | | |
| Net investment | | | | | | | | | | | | | | | | | | | | | | | | |
| | | income (loss)E | | | | (.05)F | | | | (.12)G | | | | (.14) | | | | (.11) | | | | (.13) | | | | (.08) |
| Net realized and un- | | | | | | | | | | | | | | | | | | | | | | | | |
| | | realized gain (loss) | | | | .02 | | | | .83 | | | | .66 | | | | 1.58 | | | | (1.52) | | | | (.94) |
| Total from investment | | | | | | | | | | | | | | | | | | | | | | | | |
| operations | | | | (.03) | | | | .71 | | | | .52 | | | | 1.47 | | | | (1.65) | | | | (1.02) |
| Distributions from net | | | | | | | | | | | | | | | | | | | | | | | | |
| realized gain | | | | — | | | | — | | | | — | | | | — | | | | — | | | | (.01) |
| Net asset value, end of | | | | | | | | | | | | | | | | | | | | | | | | |
| period | | | | $9.04 | | | | $9.07 | | | | $8.36 | | | | $7.84 | | | | $6.37 | | | | $8.02 |
| Total ReturnB,C,D | | | | (.33)% | | | | 8.49% | | | | 6.63% | | 23.08% | | (20.57)% | | (11.29)% |
| Ratios to Average Net AssetsH | | | | | | | | | | | | | | | | | | | | | | |
| Expenses before | | | | | | | | | | | | | | | | | | | | | | | | |
| | | reductions | | | | 2.36%A | | | | 2.35% | | | | 2.67% | | | | 2.92% | | | | 2.73% | | | | 2.86% |
| Expenses net of fee | | | | | | | | | | | | | | | | | | | | | | | | |
| | | waivers, if any | | | | 2.05%A | | | | 2.09% | | | | 2.25% | | | | 2.25% | | | | 2.43% | | | | 2.50% |
| Expenses net of all | | | | | | | | | | | | | | | | | | | | | | | | |
| | | reductions | | | | 2.02%A | | | | 2.00% | | | | 2.21% | | | | 2.18% | | | | 2.23% | | | | 2.46% |
| Net investment in- | | | | | | | | | | | | | | | | | | | | | | | | |
| | | come (loss) | | (1.06)%A,F | | (1.38)%G | | (1.78)% | | (1.60)% | | (1.81)% | | | | (.89)% |
| Supplemental Data | | | | | | | | | | | | | | | | | | | | | | | | |
| Net assets, end of | | | | | | | | | | | | | | | | | | | | | | | | |
| | | period (000 | | | | | | | | | | | | | | | | | | | | | | | | |
| | | omitted) | | | | $8,589 | | | | $9,237 | | $9,593 | | $8,422 | | | | $6,262 | | $8,038 |
| Portfolio turnover | | | | | | | | | | | | | | | | | | | | | | | | |
| | | rate | | | | 185%A | | | | 213% | | | | 94% | | | | 158% | | | | 473% | | | | 481% |
| A | | Annualized | | | | | | | | | | | | | | | | | | | | | | | | |
| B | | Total returns for periods of less than one year are not annualized. | | | | | | | | | | | | | | | | |
| C | | Total returns would have been lower had certain expenses not been reduced during the periods shown. | | | | | | | | |
| D | | Total returns do not include the effect of the contingent deferred sales charge. | | | | | | | | | | | | | | |
| E | | Calculated based on average shares outstanding during the period. | | | | | | | | | | | | | | | | |
| F | | Investment income per share reflects a special dividend which amounted to $.02 per share. Excluding the special dividend, the ratio of net |
| | | investment income (loss) to average net assets would have been (1.53)%. | | | | | | | | | | | | | | | | |
| G | | Investment income per share reflects a special dividend which amounted to $.01 per share. Excluding the special dividend, the ratio of net |
| | | investment income (loss) to average net assets would have been (1.44)%. | | | | | | | | | | | | | | | | |
| H | | Expense ratios reflect operating expenses of the class. Expenses before reductions do not reflect amounts reimbursed by the investment adviser or |
| | | reductions from brokerage service arrangements or other expense offset arrangements and do not represent the amount paid by the class during |
| | | periods when reimbursements or reductions occur. Expenses net of fee waivers reflect expenses after reimbursement by the investment adviser but |
| | | prior to reductions from brokerage service arrangements or other expense offset arrangements. Expenses net of all reductions represent the net |
| | | expenses paid by the class. | | | | | | | | | | | | | | | | | | | | | | | | |
| See accompanying notes which are an integral part of the financial statements. | | | | | | | | |
19 Semiannual Report
| Financial Highlights — Class C | | | | | | | | | | | | | | | | | | |
| |
| | | | | Six months ended | | | | | | | | | | | | | | | | | | | | |
| | | | | May 31, 2006 | | | | | | | | Years ended November 30, | | | | |
| | | | | (Unaudited) | | | | 2005 | | | | 2004 | | | | 2003 | | | | 2002 | | | | 2001 |
| Selected Per-Share Data | | | | | | | | | | | | | | | | | | | | | | | | |
| Net asset value, | | | | | | | | | | | | | | | | | | | | | | | | |
| beginning of period . | | | | $9.08 | | | | $8.37 | | | | $7.85 | | | | $6.38 | | | | $8.03 | | | | $9.05 |
| Income from Investment | | | | | | | | | | | | | | | | | | | | | | | | |
| Operations | | | | | | | | | | | | | | | | | | | | | | | | |
| Net investment in- | | | | | | | | | | | | | | | | | | | | | | | | |
| | | come (loss)E | | | | (.05)F | | | | (.12)G | | | | (.14) | | | | (.11) | | | | (.13) | | | | (.08) |
| Net realized and un- | | | | | | | | | | | | | | | | | | | | | | | | |
| | | realized gain (loss) | | | | .02 | | | | .83 | | | | .66 | | | | 1.58 | | | | (1.52) | | | | (.93) |
| Total from investment | | | | | | | | | | | | | | | | | | | | | | | | |
| operations | | | | (.03) | | | | .71 | | | | .52 | | | | 1.47 | | | | (1.65) | | | | (1.01) |
| Distributions from net | | | | | | | | | | | | | | | | | | | | | | | | |
| realized gain | | | | — | | | | — | | | | — | | | | — | | | | — | | | | (.01) |
| Net asset value, end of | | | | | | | | | | | | | | | | | | | | | | | | |
| period | | | | $9.05 | | | | $9.08 | | | | $8.37 | | | | $7.85 | | | | $6.38 | | | | $8.03 |
| Total ReturnB,C,D | | | | (.33)% | | | | 8.48% | | | | 6.62% | | 23.04% | | (20.55)% | | (11.18)% |
| Ratios to Average Net AssetsH | | | | | | | | | | | | | | | | | | | | | | |
| Expenses before | | | | | | | | | | | | | | | | | | | | | | | | |
| | | reductions | | | | 2.36%A | | | | 2.34% | | | | 2.52% | | | | 2.77% | | | | 2.58% | | | | 2.79% |
| Expenses net of fee | | | | | | | | | | | | | | | | | | | | | | | | |
| | | waivers, if any | | | | 2.05%A | | | | 2.09% | | | | 2.25% | | | | 2.25% | | | | 2.36% | | | | 2.50% |
| Expenses net of all | | | | | | | | | | | | | | | | | | | | | | | | |
| | | reductions | | | | 2.02%A | | | | 2.01% | | | | 2.21% | | | | 2.18% | | | | 2.16% | | | | 2.46% |
| Net investment in- | | | | | | | | | | | | | | | | | | | | | | | | |
| | | come (loss) | | (1.06)%A,F | | (1.38)%G | | (1.78)% | | (1.61)% | | (1.74)% | | | | (.89)% |
| Supplemental Data | | | | | | | | | | | | | | | | | | | | | | | | |
| Net assets, end of | | | | | | | | | | | | | | | | | | | | | | | | |
| | | period (000 | | | | | | | | | | | | | | | | | | | | | | | | |
| | | omitted) | | | | $7,049 | | | | $7,791 | | $9,136 | | $8,427 | | | | $6,636 | | $8,532 |
| Portfolio turnover | | | | | | | | | | | | | | | | | | | | | | | | |
| | | rate | | | | 185%A | | | | 213% | | | | 94% | | | | 158% | | | | 473% | | | | 481% |
| A | | Annualized | | | | | | | | | | | | | | | | | | | | | | | | |
| B | | Total returns for periods of less than one year are not annualized. | | | | | | | | | | | | | | | | |
| C | | Total returns would have been lower had certain expenses not been reduced during the periods shown. | | | | | | | | |
| D | | Total returns do not include the effect of the contingent deferred sales charge. | | | | | | | | | | | | | | |
| E | | Calculated based on average shares outstanding during the period. | | | | | | | | | | | | | | | | |
| F | | Investment income per share reflects a special dividend which amounted to $.02 per share. Excluding the special dividend, the ratio of net |
| | | investment income (loss) to average net assets would have been (1.53)%. | | | | | | | | | | | | | | | | |
| G | | Investment income per share reflects a special dividend which amounted to $.01 per share. Excluding the special dividend, the ratio of net |
| | | investment income (loss) to average net assets would have been (1.44)%. | | | | | | | | | | | | | | | | |
| H | | Expense ratios reflect operating expenses of the class. Expenses before reductions do not reflect amounts reimbursed by the investment adviser or |
| | | reductions from brokerage service arrangements or other expense offset arrangements and do not represent the amount paid by the class during |
| | | periods when reimbursements or reductions occur. Expenses net of fee waivers reflect expenses after reimbursement by the investment adviser but |
| | | prior to reductions from brokerage service arrangements or other expense offset arrangements. Expenses net of all reductions represent the net |
| | | expenses paid by the class. | | | | | | | | | | | | | | | | | | | | | | | | |
| See accompanying notes which are an integral part of the financial statements. | | | | | | | | |
Semiannual Report 20
| Financial Highlights — Institutional Class | | | | | | | | | | | | |
| |
| | | | | Six months ended | | | | | | | | | | | | | | | | | | | | |
| | | | | May 31, 2006 | | | | | | | | Years ended November 30, | | | | |
| | | | | (Unaudited) | | | | 2005 | | | | 2004 | | | | 2003 | | | | 2002 | | | | 2001 |
| Selected Per-Share Data | | | | | | | | | | | | | | | | | | | | | | | | |
| Net asset value, | | | | | | | | | | | | | | | | | | | | | | | | |
| beginning of period . | | | | $9.57 | | | | $8.73 | | | | $8.10 | | | | $6.52 | | | | $8.11 | | | | $9.06 |
| Income from Investment | | | | | | | | | | | | | | | | | | | | | | | | |
| Operations | | | | | | | | | | | | | | | | | | | | | | | | |
| Net investment in- | | | | | | | | | | | | | | | | | | | | | | | | |
| | | come (loss)D | | | | —E,H | | | | (.03)F | | | | (.07) | | | | (.04) | | | | (.05) | | | | .01 |
| Net realized and un- | | | | | | | | | | | | | | | | | | | | | | | | |
| | | realized gain (loss) | | | | .01 | | | | .87 | | | | .70 | | | | 1.62 | | | | (1.54) | | | | (.95) |
| Total from investment | | | | | | | | | | | | | | | | | | | | | | | | |
| operations | | | | 01 | | | | .84 | | | | .63 | | | | 1.58 | | | | (1.59) | | | | (.94) |
| Distributions from net | | | | | | | | | | | | | | | | | | | | | | | | |
| realized gain | | | | — | | | | — | | | | — | | | | — | | | | — | | | | (.01) |
| Net asset value, end of | | | | | | | | | | | | | | | | | | | | | | | | |
| period | | | | $9.58 | | | | $9.57 | | | | $8.73 | | | | $8.10 | | | | $6.52 | | | | $8.11 |
| Total ReturnB,C | | | | 10% | | | | 9.62% | | | | 7.78% | | 24.23% | | (19.61)% | | (10.39)% |
| Ratios to Average Net AssetsG | | | | | | | | | | | | | | | | | | | | | | |
| Expenses before | | | | | | | | | | | | | | | | | | | | | | | | |
| | | reductions | | | | 1.28%A | | | | 1.28% | | | | 1.35% | | | | 1.61% | | | | 1.43% | | | | 1.73% |
| Expenses net of fee | | | | | | | | | | | | | | | | | | | | | | | | |
| | | waivers, if any | | | | 1.05%A | | | | 1.09% | | | | 1.25% | | | | 1.25% | | | | 1.27% | | | | 1.50% |
| Expenses net of all | | | | | | | | | | | | | | | | | | | | | | | | |
| | | reductions | | | | 1.02%A | | | | 1.01% | | | | 1.20% | | | | 1.18% | | | | 1.07% | | | | 1.46% |
| Net investment in- | | | | | | | | | | | | | | | | | | | | | | | | |
| | | come (loss) | | (.06)%A,E | | | | (.38)%F | | | | (.78)% | | | | (.61)% | | | | (.64)% | | | | .11% |
| Supplemental Data | | | | | | | | | | | | | | | | | | | | | | | | |
| Net assets, end of | | | | | | | | | | | | | | | | | | | | | | | | |
| | | period (000 | | | | | | | | | | | | | | | | | | | | | | | | |
| | | omitted) | | | | $657 | | | | $522 | | | | $648 | | | | $579 | | | | $513 | | | | $761 |
| Portfolio turnover | | | | | | | | | | | | | | | | | | | | | | | | |
| | | rate | | | | 185%A | | | | 213% | | | | 94% | | | | 158% | | | | 473% | | | | 481% |
| A | | Annualized | | | | | | | | | | | | | | | | | | | | | | | | |
| B | | Total returns for periods of less than one year are not annualized. | | | | | | | | | | | | | | | | |
| C | | Total returns would have been lower had certain expenses not been reduced during the periods shown. | | | | | | | | |
| D | | Calculated based on average shares outstanding during the period. | | | | | | | | | | | | | | | | |
| E | | Investment income per share reflects a special dividend which amounted to $.02 per share. Excluding the special dividend, the ratio of net |
| | | investment income (loss) to average net assets would have been (.53)%. | | | | | | | | | | | | | | | | |
| F | | Investment income per share reflects a special dividend which amounted to $.01 per share. Excluding the special dividend, the ratio of net |
| | | investment income (loss) to average net assets would have been (.44)%. | | | | | | | | | | | | | | | | |
| G | | Expense ratios reflect operating expenses of the class. Expenses before reductions do not reflect amounts reimbursed by the investment adviser or |
| | | reductions from brokerage service arrangements or other expense offset arrangements and do not represent the amount paid by the class during |
| | | periods when reimbursements or reductions occur. Expenses net of fee waivers reflect expenses after reimbursement by the investment adviser but |
| | | prior to reductions from brokerage service arrangements or other expense offset arrangements. Expenses net of all reductions represent the net |
| | | expenses paid by the class. | | | | | | | | | | | | | | | | | | | | | | | | |
| H | | Amount represents less than $.01 per share. | | | | | | | | | | | | | | | | | | | | |
| See accompanying notes which are an integral part of the financial statements. | | | | | | | | |
21 Semiannual Report
Notes to Financial Statements
For the period ended May 31, 2006 (Unaudited)
1. Significant Accounting Policies.
Fidelity Advisor Aggressive Growth Fund (the fund) is a fund of Fidelity Securities Fund (the trust) and is authorized to issue an unlimited number of shares. The trust is registered under the Investment Company Act of 1940, as amended (the 1940 Act), as an open-end management investment company organized as a Massachusetts business trust.
The fund offers Class A, Class T, Class B, Class C, and Institutional Class shares, each of which has equal rights as to assets and voting privileges. Each class has exclusive voting rights with respect to matters that affect that class. Class B shares will automatically convert to Class A shares after a holding period of seven years from the initial date of purchase. Investment income, realized and unrealized capital gains and losses, the common expenses of the fund, and certain fund-level expense reductions, if any, are allocated on a pro rata basis to each class based on the relative net assets of each class to the total net assets of the fund. Each class differs with respect to transfer agent and distribution and service plan fees incurred. Certain expense reductions also differ by class.
The fund may invest in affiliated money market central funds (Money Market Central Funds), which are open-end investment companies available to investment companies and other accounts managed by Fidelity Management & Research Company (FMR) and its affiliates. The financial statements have been prepared in conformity with accounting principles generally accepted in the United States of America, which require management to make certain estimates and assumptions at the date of the financial statements. The following summarizes the significant accounting policies of the fund:
Security Valuation. Investments are valued and net asset value (NAV) per share is calculated (NAV calculation) as of the close of business of the New York Stock Exchange (NYSE), normally 4:00 p.m. Eastern time. Wherever possible, the fund uses independent pricing services approved by the Board of Trustees to value its investments.
Equity securities, including restricted securities, for which market quotations are readily available, are valued at the last reported sale price or official closing price as reported by an independent pricing service on the primary market or exchange on which they are traded. In the event there were no sales during the day or closing prices are not available, securities are valued at the last quoted bid price. Investments in open-end mutual funds, are valued at their closing net asset value each business day. Short-term securities with remaining maturities of sixty days or less for which quotations are not readily available are valued at amortized cost, which approximates value.
When current market prices or quotations are not readily available or do not accurately reflect fair value, valuations may be determined in accordance with procedures adopted by the Board of Trustees. For example, when developments occur between the close of a
Semiannual Report 22
1. Significant Accounting Policies - continued
Security Valuation - continued market and the close of the NYSE that may materially affect the value of some or all of the securities, or when trading in a security is halted, those securities may be fair valued. Factors used in the determination of fair value may include monitoring news to identify significant market or security specific events such as changes in the value of U.S. securities markets, reviewing developments in foreign markets and evaluating the performance of ADRs, futures contracts and exchange-traded funds. Because the fund’s utilization of fair value pricing depends on market activity, the frequency with which fair value pricing is used can not be predicted and may be utilized to a significant extent. The value of securities used for NAV calculation under fair value pricing may differ from published prices for the same securities.
Foreign Currency. The fund uses foreign currency contracts to facilitate transactions in foreign-denominated securities. Losses from these transactions may arise from changes in the value of the foreign currency or if the counterparties do not perform under the contracts’ terms.
Foreign-denominated assets, including investment securities, and liabilities are translated into U.S. dollars at the exchange rate at period end. Purchases and sales of investment securities, income and dividends received and expenses denominated in foreign currencies are translated into U.S. dollars at the exchange rate in effect on the transaction date.
The effects of exchange rate fluctuations on investments are included with the net realized and unrealized gain (loss) on investment securities. Other foreign currency transactions resulting in realized and unrealized gain (loss) are disclosed separately.
Investment Transactions and Income. Security transactions are accounted for as of trade date. Gains and losses on securities sold are determined on the basis of identified cost and may include proceeds received from litigation. Dividend income is recorded on the ex-dividend date, except for certain dividends from foreign securities where the ex-dividend date may have passed, which are recorded as soon as the fund is informed of the ex-dividend date. Non-cash dividends included in dividend income, if any, are recorded at the fair market value of the securities received. Distributions received on securities that represent a return of capital or capital gain are recorded as a reduction of cost of investments and/or as a realized gain. The fund estimates the components of distributions received that may be considered return of capital distributions or capital gain distributions. Large, non-recurring dividends recognized by the fund are presented separately on the Statement of Operations as “Special Dividends” and the impact of these dividends is presented in the Financial Highlights. Interest income is accrued as earned. Interest income includes coupon interest and amortization of premium and accretion of
23 Semiannual Report
Notes to Financial Statements (Unaudited) - continued
1. Significant Accounting Policies - - continued
Investment Transactions and Income - - continued discount on debt securities. Investment income is recorded net of foreign taxes withheld where recovery of such taxes is uncertain.
Expenses. Most expenses of the trust can be directly attributed to a fund. Expenses which cannot be directly attributed are apportioned among each fund in the trust.
Income Tax Information and Distributions to Shareholders. Each year, the fund intends to qualify as a regulated investment company by distributing all of its taxable income and realized gains under Subchapter M of the Internal Revenue Code. As a result, no provision for income taxes is required in the accompanying financial statements. Foreign taxes are provided for based on the fund’s understanding of the tax rules and rates that exist in the foreign markets in which it invests.
Distributions are recorded on the ex-dividend date. Income dividends and capital gain distributions are declared separately for each class. Income and capital gain distributions are determined in accordance with income tax regulations, which may differ from generally accepted accounting principles.
Capital accounts within the financial statements are adjusted for permanent book-tax differences. These adjustments have no impact on net assets or the results of operations. Temporary book-tax differences will reverse in a subsequent period.
Book-tax differences are primarily due to foreign currency transactions, net operating losses, capital loss carryforwards and losses deferred due to wash sales.
The federal tax cost of investments and unrealized appreciation (depreciation) as of period end were as follows:
| Unrealized appreciation | | | | $2,286,354 |
| Unrealized depreciation | | | | (4,401,513) |
| Net unrealized appreciation (depreciation) | | | | $(2,115,159) |
| Cost for federal income tax purposes | | | | $43,000,859 |
| |
| 2. Operating Policies. | | | | |
Repurchase Agreements. FMR has received an Exemptive Order from the Securities and Exchange Commission (the SEC) which permits the fund and other affiliated entities of FMR to transfer uninvested cash balances into joint trading accounts which are then invested in repurchase agreements. The fund may also invest directly with institutions in repurchase agreements. Repurchase agreements are collateralized by government or non-government securities. Upon settlement date, collateral is held in segregated accounts with custodian banks and may be obtained in the event of a default
Semiannual Report 24
2. Operating Policies - continued
Repurchase Agreements - continued of the counterparty. The fund monitors, on a daily basis, the value of the collateral to ensure it is at least equal to the principal amount of the repurchase agreement (including accrued interest). In the event of a default by the counterparty, realization of the collateral proceeds could be delayed, during which time the value of the collateral may decline.
Restricted Securities. The fund may invest in securities that are subject to legal or contractual restrictions on resale. These securities generally may be resold in transactions exempt from registration or to the public if the securities are registered. Disposal of these securities may involve time-consuming negotiations and expense, and prompt sale at an acceptable price may be difficult. Information regarding restricted securities is included at the end of the fund’s Schedule of Investments.
3. Purchases and Sales of Investments.
Purchases and sales of securities, other than short-term securities, aggregated $38,472,051 and $38,613,577, respectively.
4. Fees and Other Transactions with Affiliates.
Management Fee. FMR and its affiliates provide the fund with investment management related services for which the fund pays a monthly management fee. The management fee is the sum of an individual fund fee rate that is based on an annual rate of .35% of the fund’s average net assets and a group fee rate that averaged .27% during the period. The group fee rate is based upon the average net assets of all the mutual funds advised by FMR. The group fee rate decreases as assets under management increase and increases as assets under management decrease. For the period, the total annualized management fee rate was .62% of the fund’s average net assets.
Distribution and Service Plan. In accordance with Rule 12b-1 of the 1940 Act, the fund has adopted separate Distribution and Service Plans for each class of shares. Certain classes pay Fidelity Distributors Corporation (FDC), an affiliate of FMR, separate Distribution and Service Fees, each of which is based on an annual percentage of each class’ average net assets. In addition, FDC may pay financial intermediaries for selling shares of the fund and providing shareholder support services. For the period, the
25 Semiannual Report
Notes to Financial Statements (Unaudited) - continued
4. Fees and Other Transactions with Affiliates - continued
Distribution and Service Plan - continued
Distribution and Service Fee rates and the total amounts paid to and retained by FDC were as follows:
| | | Distribution | | Service | | | | Paid to | | | | Retained |
| | | Fee | | Fee | | | | FDC | | | | by FDC |
| Class A | | 0% | | .25% | | | | $10,135 | | | | $136 |
| Class T | | 25% | | .25% | | | | 42,558 | | | | 199 |
| Class B | | 75% | | .25% | | | | 46,474 | | | | 34,915 |
| Class C | | 75% | | .25% | | | | 39,202 | | | | 3,894 |
| | | | | | | | | $138,369 | | | | $39,144 |
Sales Load. FDC receives a front-end sales charge of up to 5.75% for selling Class A shares, and 3.50% for selling Class T shares, some of which is paid to financial intermediaries for selling shares of the fund. FDC receives the proceeds of contingent deferred sales charges levied on Class A, Class T, Class B, and Class C redemptions. These charges depend on the holding period. The deferred sales charges range from 5% to 1% for Class B, 1% for Class C, 1.00% to .50% for certain purchases of Class A shares (.25% prior to February 24, 2006) and .25% for certain purchases of Class T shares.
| For the period, sales charge amounts retained by FDC were as follows: | | |
| | | | | Retained |
| | | | | by FDC |
| Class A | | | | $8,927 |
| Class T | | | | 6,870 |
| Class B* | | | | 13,166 |
| Class C* | | | | 594 |
| | | | | $29,557 |
* When Class B and Class C shares are initially sold, FDC pays commissions from its own resources to financial intermediaries through which the sales are made.
Transfer Agent Fees. Fidelity Investments Institutional Operations Company, Inc. (FIIOC), an affiliate of FMR, is the transfer, dividend disbursing and shareholder servicing agent for each class of the fund. FIIOC receives account fees and asset-based fees that vary according to the account size and type of account of the shareholders of the respective classes of the fund. FIIOC pays for typesetting, printing and mailing of
Semiannual Report 26
4. Fees and Other Transactions with Affiliates - continued
Transfer Agent Fees - continued shareholder reports, except proxy statements. For the period the total transfer agent fees paid by each class to FIIOC, were as follows:
| | | | | | | % of |
| | | | | | | Average |
| | | | | Amount | | Net Assets |
| Class A | | | | $14,847 | | .37* |
| Class T | | | | 37,468 | | .44* |
| Class B | | | | 16,392 | | .35* |
| Class C | | | | 14,064 | | .36* |
| Institutional Class | | | | 823 | | .28* |
| | | | | $83,594 | | |
| * Annualized | | | | | | |
Accounting and Security Lending Fees. Fidelity Service Company, Inc. (FSC), an affiliate of FMR, maintains the fund’s accounting records. The accounting fee is based on the level of average net assets for the month. Under a separate contract, FSC administers the security lending program. The security lending fee is based on the number and duration of lending transactions.
Affiliated Central Funds. The fund may invest in Money Market Central Funds which seek preservation of capital and current income and are managed by Fidelity Investments Money Management, Inc. (FIMM), an affiliate of FMR.
The Money Market Central Funds do not pay a management fee.
Brokerage Commissions. The fund placed a portion of its portfolio transactions with brokerage firms which are affiliates of the investment adviser. The commissions paid to these affiliated firms were $966 for the period.
5. Committed Line of Credit.
|
The fund participates with other funds managed by FMR in a $4.2 billion credit facility (the “line of credit”) to be utilized for temporary or emergency purposes to fund shareholder redemptions or for other short-term liquidity purposes. The fund has agreed to pay commitment fees on its pro rata portion of the line of credit, which amounts to $63 and is reflected in Miscellaneous Expense on the Statement of Operations. During the period, there were no borrowings on this line of credit.
27 Semiannual Report
Notes to Financial Statements (Unaudited) - continued
6. Security Lending.
The fund lends portfolio securities from time to time in order to earn additional income. On the settlement date of the loan, the fund receives collateral (in the form of U.S. Treasury obligations, letters of credit and/or cash) against the loaned securities and maintains collateral in an amount not less than 100% of the market value of the loaned securities during the period of the loan. The market value of the loaned securities is determined at the close of business of the fund and any additional required collateral is delivered to the fund on the next business day. If the borrower defaults on its obligation to return the securities loaned because of insolvency or other reasons, a fund could experience delays and costs in recovering the securities loaned or in gaining access to the collateral. Any cash collateral received is invested in the Fidelity Securities Lending Cash Central Fund. The value of loaned securities and cash collateral at period end are disclosed on the fund’s Statement of Assets and Liabilities. Security lending income represents the income earned on investing cash collateral, less fees and expenses associated with the loan, plus any premium payments that may be received on the loan of certain types of securities. Security lending income is presented in the Statement of Operations as a component of income from affiliated central funds. Net income from lending portfolio securities during the period amounted to $1,142.
FMR voluntarily agreed to reimburse each class to the extent annual operating expenses exceeded certain levels of average net assets as noted in the table below. Some expenses, for example interest expense, are excluded from this reimbursement.
| The following classes were in reimbursement during the period: | | | | |
| | | Expense | | | | Reimbursement |
| | | Limitations | | | | from adviser |
| Class A | | 1.30% | | | | $12,916 |
| Class T | | 1.55% | | | | 33,260 |
| Class B | | 2.05% | | | | 14,174 |
| Class C | | 2.05% | | | | 12,312 |
| Institutional Class | | 1.05% | | | | 686 |
| | | | | | | $73,348 |
Many of the brokers with whom FMR places trades on behalf of the fund provided services to the fund in addition to trade execution. These services included payments of certain expenses on behalf of the fund totaling $5,619 for the period. In addition, through arrangements with the each class’ transfer agent, credits realized as a result of
Semiannual Report 28
7. Expense Reductions - continued uninvested cash balances were used to reduce the fund’s expenses. During the period, credits reduced each class’ transfer agent expense as noted in the table below.
| | | | | Transfer Agent |
| | | | | expense reduction |
| |
| Class B | | | | 70 |
| Institutional Class | | | | 2 |
| | | | | $72 |
8. Other.
The fund’s organizational documents provide former and current trustees and officers with a limited indemnification against liabilities arising in connection with the performance of their duties to the fund. In the normal course of business, the fund may also enter into contracts that provide general indemnifications. The fund’s maximum exposure under these arrangements is unknown as this would be dependent on future claims that may be made against the fund. The risk of material loss from such claims is considered remote.
9. Share Transactions.
Transactions for each class of shares were as follows:
| | | Shares | | | | Dollars |
| | | Six months en- | | Year ended | | Six months en- | | | | Year ended |
| | | ded May 31, | | November 30, | | ded May 31, | | | | November 30, |
| | | 2006 | | 2005 | | 2006 | | | | 2005 |
| Class A | | | | | | | | | | | | |
| Shares sold | | 197,549 | | 270,002 | | | | $1,969,409 | | | | $2,351,220 |
| Shares redeemed | | (84,396) | | (227,735) | | | | (834,110) | | | | (2,008,944) |
| Net increase (decrease) | | 113,153 | | 42,267 | | | | $1,135,299 | | | | $342,276 |
| Class T | | | | | | | | | | | | |
| Shares sold | | 251,081 | | 613,840 | | | | $2,462,320 | | | | $5,303,116 |
| Shares redeemed | | (333,291) | | (628,481) | | | | (3,286,768) | | | | (5,486,557) |
| Net increase (decrease) | | (82,210) | | (14,641) | | | | $(824,448) | | | | $(183,441) |
| Class B | | | | | | | | | | | | |
| Shares sold | | 89,179 | | 183,867 | | | | $850,052 | | | | $1,559,053 |
| Shares redeemed | | (157,220) | | (313,200) | | | | (1,503,351) | | | | (2,654,466) |
| Net increase (decrease) | | (68,041) | | (129,333) | | | | $(653,299) | | | | $(1,095,413) |
| Class C | | | | | | | | | | | | |
| Shares sold | | 79,303 | | 159,513 | | | | $758,042 | | | | $1,357,035 |
| Shares redeemed | | (158,269) | | (393,180) | | | | (1,520,572) | | | | (3,315,155) |
| Net increase (decrease) | | (78,966) | | (233,667) | | | | $(762,530) | | | | $(1,958,120) |
| Institutional Class | | | | | | | | | | | | |
| Shares sold | | 17,071 | | 10,062 | | | | $173,654 | | | | $90,084 |
| Shares redeemed | | (3,066) | | (29,827) | | | | (31,219) | | | | (255,712) |
| Net increase (decrease) | | 14,005 | | (19,765) | | | | $142,435 | | | | $(165,628) |
29 Semiannual Report
Proxy Voting Results
A special meeting of the fund’s shareholders was held on May 17, 2006. The results of votes taken among shareholders on the proposals before them are reported below. Each vote reported represents one dollar of net asset value held on the record date for the meeting.
| PROPOSAL 1 | | | | Ned C. Lautenbach | | |
| To elect a Board of Trustees.A | | | | Affirmative | | 43,082,185,255.05 | | 95.372 |
| | | # of | | % of | | Withheld | | 2,090,721,879.16 | | 4.628 |
| | | Votes | | Votes | | TOTAL | | 45,172,907,134.21 | | 100.000 |
| |
| Dennis J. Dirks | | | | William O. McCoy | | |
| Affirmative | | 43,119,905,166.54 | | 95.455 | | Affirmative | | 42,960,162,066.32 | | 95.102 |
| Withheld | | 2,053,001,967.67 | | 4.545 | | Withheld | | 2,212,745,067.89 | | 4.898 |
| TOTAL | | 45,172,907,134.21 | | 100.000 | | TOTAL | | 45,172,907,134.21 | | 100.000 |
| |
| Albert R. Gamper, Jr. | | | | Robert L. Reynolds | | |
| Affirmative | | 43,068,780,128.62 | | 95.342 | | Affirmative | | 43,087,560,419.66 | | 95.384 |
| Withheld | | 2,104,127,005.59 | | 4.658 | | Withheld | | 2,085,346,714.55 | | 4.616 |
| TOTAL | | 45,172,907,134.21 | | 100.000 | | TOTAL | | 45,172,907,134.21 | | 100.000 |
| |
| Robert M. Gates | | | | Cornelia M. Small | | |
| Affirmative | | 43,032,117,662.60 | | 95.261 | | Affirmative | | 43,092,070,014.53 | | 95.394 |
| Withheld | | 2,140,789,471.61 | | 4.739 | | Withheld | | 2,080,837,119.68 | | 4.606 |
| TOTAL | | 45,172,907,134.21 | | 100.000 | | TOTAL | | 45,172,907,134.21 | | 100.000 |
| |
| George H. Heilmeier | | | | William S. Stavropoulos | | |
| Affirmative | | 43,023,368,882.30 | | 95.242 | | Affirmative | | 43,002,032,676.43 | | 95.194 |
| Withheld | | 2,149,538,251.91 | | 4.758 | | Withheld | | 2,170,874,457.78 | | 4.806 |
| TOTAL | | 45,172,907,134.21 | | 100.000 | | TOTAL | | 45,172,907,134.21 | | 100.000 |
| |
| Edward C. Johnson 3d | | | | Kenneth L. Wolfe | | |
| Affirmative | | 42,881,915,819.70 | | 94.928 | | Affirmative | | 43,047,241,852.81 | | 95.294 |
| Withheld | | 2,290,991,314.51 | | 5.072 | | Withheld | | 2,125,665,281.40 | | 4.706 |
| TOTAL | | 45,172,907,134.21 | | 100.000 | | TOTAL | | 45,172,907,134.21 | | 100.000 |
| Stephen P. Jonas | | | | Abstain | | 503,291,649.48 | | 4.447 |
| | | | | | | Broker | | | | |
| Affirmative | | 43,081,912,066.37 | | 95.371 | | Non-Votes . | | 163,474,631.25 | | 1.445 |
| Withheld | | 2,090,995,067.84 | | 4.629 | | TOTAL | | 11,316,706,049.75 | | 100.000 |
| TOTAL | | 45,172,907,134.21 | | 100.000 | | | | | | |
| |
| James H. KeyesB | | | | A Denotes trust-wide proposal and voting results |
| Affirmative | | 43,049,050,093.79 | | 95.298 | | B Effective on or about January 1, 2007. | | |
| Withheld | | 2,123,857,040.42 | | 4.702 | | | | | | |
| TOTAL | | 45,172,907,134.21 | | 100.000 | | | | | | |
| |
| Marie L. Knowles | | | | | | | | |
| Affirmative | | 43,090,434,696.02 | | 95.390 | | | | | | |
| Withheld | | 2,082,472,438.19 | | 4.610 | | | | | | |
| TOTAL | | 45,172,907,134.21 | | 100.000 | | | | | | |
Semiannual Report 30
Board Approval of Investment Advisory Contracts and Management Fees
Advisor Aggressive Growth Fund
On January 19, 2006, the Board of Trustees, including the Independent Trustees (together, the Board), voted to approve a general research services agreement (the Agreement) between FMR, FMR Co., Inc. (FMRC), Fidelity Investments Money Management, Inc. (FIMM), and Fidelity Research & Analysis Company (FRAC) (together, the Investment Advisers) for the fund, effective January 20, 2006, pursuant to which FRAC may provide general research and investment advisory support services to FMRC and FIMM. The Board considered that it has approved previously various sub-advisory agreements for the fund with affiliates of FMR that allow FMR to obtain research, non-discretionary advice, or discretionary portfolio management at no additional expense to the fund. The Board, assisted by the advice of fund counsel and independent Trustees’ counsel, considered a broad range of information and determined that it would be beneficial for the fund to access the research and investment advisory support services supplied by FRAC at no additional expense to the fund.
The Board reached this determination in part because the new arrangement will involve no changes in (i) the contractual terms of and fees payable under the fund’s management contract or sub-advisory agreements; (ii) the investment process or strategies employed in the management of the fund’s assets; (iii) the nature or level of services provided under the fund’s management contract or sub-advisory agreements; (iv) the day-to-day management of the fund or the persons primarily responsible for such management; or (v) the ultimate control or beneficial ownership of FMR, FMRC, or FIMM. The Board also considered that the establishment of the Agreement would not necessitate prior shareholder approval of the Agreement or result in an assignment and termination of the fund’s management contract or sub-advisory agreements under the Investment Company Act of 1940.
Because the Board was approving an arrangement with FRAC under which the fund will not bear any additional management fees or expenses and under which the fund’s portfolio manager would not change, it did not consider the fund’s investment performance, competitiveness of management fee and total expenses, costs of services and profitability, or economies of scale to be significant factors in its decision.
In connection with its future renewal of the fund’s management contract and sub-advisory agreements, the Board will consider: (i) the nature, extent, and quality of services provided to the fund, including shareholder and administrative services and investment performance; (ii) the competitiveness of the fund’s management fee and total expenses; (iii) the costs of the services and profitability, including the revenues earned and the expenses incurred by Fidelity in conducting the business of developing, marketing, distributing, managing, administering, and servicing the fund and its shareholders; and (iv) whether there have been economies of scale in respect of the management of the Fidelity funds, whether the Fidelity funds (including the fund) have
31 Semiannual Report
Board Approval of Investment Advisory Contracts and Management Fees - continued
appropriately benefited from any such economies of scale, and whether there is potential for realization of any further economies.
Based on its evaluation of all of the conclusions noted above, and after considering all material factors, the Board ultimately concluded that the fund’s Agreement is fair and reasonable, and that the fund’s Agreement should be approved.
Semiannual Report 32
33 Semiannual Report
Semiannual Report 34
35 Semiannual Report
Semiannual Report 36
37 Semiannual Report
Semiannual Report 38
39 Semiannual Report
Investment Adviser
Fidelity Management & Research Company
Boston, MA
Investment Sub-Advisers
FMR Co., Inc.
Fidelity Management & Research
(U.K.) Inc.
Fidelity Research & Analysis Company
(formerly Fidelity Management & Research
(Far East) Inc.)
Fidelity International Investment Advisors
Fidelity Investments Japan Limited
Fidelity International Investment Advisors (U.K.) Limited
General Distributor
Fidelity Distributors Corporation
Boston, MA
Transfer and Service Agents
Fidelity Investments Institutional
Operations Company, Inc.
Boston, MA
Fidelity Service Company, Inc.
Boston, MA
Custodian
State Street Bank and Trust Company
Quincy, MA
|

AAGI-USAN-0706 1.786774.103
Item 2. Code of Ethics
Not applicable.
Item 3. Audit Committee Financial Expert
Not applicable.
Item 4. Principal Accountant Fees and Services
Not applicable.
Item 5. Audit Committee of Listed Registrants
Not applicable.
Item 6. Schedule of Investments
Not applicable.
Item 7. Disclosure of Proxy Voting Policies and Procedures for Closed-End Management Investment Companies
Not applicable.
Item 8. Portfolio Managers of Closed-End Management Investment Companies
Not applicable.
Item 9. Purchase of Equity Securities by Closed-End Management Investment Company and Affiliated Purchasers
Not applicable.
Item 10. Submission of Matters to a Vote of Security Holders
There were no material changes to the procedures by which shareholders may recommend nominees to the Fidelity Securities Fund's Board of Trustees.
Item 11. Controls and Procedures
(a)(i) The President and Treasurer and the Chief Financial Officer have concluded that the Fidelity Securities Fund's (the "Trust") disclosure controls and procedures (as defined in Rule 30a-3(c) under the Investment Company Act) provide reasonable assurances that material information relating to the Trust is made known to them by the appropriate persons, based on their evaluation of these controls and procedures as of a date within 90 days of the filing date of this report.
(a)(ii) There was no change in the Trust's internal control over financial reporting (as defined in Rule 30a-3(d) under the Investment Company Act) that occurred during the second fiscal quarter of the period covered by this report that has materially affected, or is reasonably likely to materially affect, the Trust's internal control over financial reporting.
Item 12. Exhibits
(a) | (1) | Not applicable. |
(a) | (2) | Certification pursuant to Rule 30a-2(a) under the Investment Company Act of 1940 (17 CFR 270.30a-2(a)) is filed and attached hereto as Exhibit 99.CERT. |
(a) | (3) | Not applicable. |
(b) | | Certification pursuant to Rule 30a-2(b) under the Investment Company Act of 1940 (17 CFR 270.30a-2(b)) is furnished and attached hereto as Exhibit 99.906CERT. |
SIGNATURES
Pursuant to the requirements of the Securities Exchange Act of 1934 and the Investment Company Act of 1940, the registrant has duly caused this report to be signed on its behalf by the undersigned, thereunto duly authorized.
Fidelity Securities Fund
By: | /s/Christine Reynolds |
| Christine Reynolds |
| President and Treasurer |
| |
Date: | July 19, 2006 |
Pursuant to the requirements of the Securities Exchange Act of 1934 and the Investment Company Act of 1940, this report has been signed below by the following persons on behalf of the registrant and in the capacities and on the dates indicated.
By: | /s/Christine Reynolds |
| Christine Reynolds |
| President and Treasurer |
| |
Date: | July 19, 2006 |
By: | /s/Paul M. Murphy |
| Paul M. Murphy |
| Chief Financial Officer |
| |
Date: | July 19, 2006 |