UNITED STATES
SECURITIES AND EXCHANGE COMMISSION
Washington, D.C. 20549
FORM N-CSR
CERTIFIED SHAREHOLDER REPORT OF REGISTERED
MANAGEMENT INVESTMENT COMPANIES
Investment Company Act file number 811-4118
Fidelity Securities Fund
(Exact name of registrant as specified in charter)
82 Devonshire St., Boston, Massachusetts 02109
(Address of principal executive offices) (Zip code)
Eric D. Roiter, Secretary
82 Devonshire St.
Boston, Massachusetts 02109
(Name and address of agent for service)
Registrant's telephone number, including area code: 617-563-7000
Date of fiscal year end: | July 31 |
| |
Date of reporting period: | July 31, 2007 |
Item 1. Reports to Stockholders
Fidelity®
Blue Chip Growth
Fund
Annual Report
July 31, 2007
(2_fidelity_logos) (Registered_Trademark)
Contents
Chairman's Message | <Click Here> | Ned Johnson's message to shareholders. |
Performance | <Click Here> | How the fund has done over time. |
Management's Discussion | <Click Here> | The managers review of fund performance, strategy and outlook |
Shareholder Expense Example | <Click Here> | An example of shareholder expenses. |
Investment Changes | <Click Here> | A summary of major shifts in the fund's investments over the past six months. |
Investments | <Click Here> | A complete list of the fund's investments with their market values. |
Financial Statements | <Click Here> | Statements of assets and liabilities, operations, and changes in net assets,
as well as financial highlights. |
Notes | <Click Here> | Notes to the financial statements. |
Report of Independent Registered Public Accounting Firm | <Click Here> | |
Trustees and Officers | <Click Here> | |
Distributions | <Click Here> | |
Board Approval of Investment Advisory Contracts and Management Fees | <Click Here> | |
To view a fund's proxy voting guidelines and proxy voting record for the 12-month period ended June 30, visit http://www.fidelity.com (search for "proxy voting guidelines") or visit the Securities and Exchange Commission's (SEC) web site at http://www.sec.gov. You may also call 1-800-544-8544 to request a free copy of the proxy voting guidelines.
Standard & Poor's, S&P and S&P 500 are registered service marks of The McGraw-Hill Companies, Inc. and have been licensed for use by Fidelity Distributors Corporation.
Other third party marks appearing herein are the property of their respective owners.
All other marks appearing herein are registered or unregistered trademarks or service marks of FMR Corp. or an affiliated company.
Annual Report
This report and the financial statements contained herein are submitted for the general information of the shareholders of the fund. This report is not authorized for distribution to prospective investors in the fund unless preceded or accompanied by an effective prospectus.
A fund files its complete schedule of portfolio holdings with the SEC for the first and third quarters of each fiscal year on Form N-Q. Forms N-Q are available on the SEC's web site at http://www.sec.gov. A fund's Forms N-Q may be reviewed and copied at the SEC's Public Reference Room in Washington, DC. Information regarding the operation of the SEC's Public Reference Room may be obtained by calling 1-800-SEC-0330. For a complete list of a fund's portfolio holdings, view the most recent holdings listing, semiannual report, or annual report on Fidelity's web site at http://www.fidelity.com or http://www.advisor.fidelity.com, as applicable.
NOT FDIC INSURED · MAY LOSE VALUE · NO BANK GUARANTEE
Neither the fund nor Fidelity Distributors Corporation is a bank.
Annual Report
Chairman's Message
(photo_of_Edward_C_Johnson_3d)
Dear Shareholder:
Stocks are currently on pace to register their fifth straight year of positive returns, although gains could be trimmed if the U.S. economy continues to slow. While financial markets are always unpredictable, there are a number of time-tested principles that can put the historical odds in your favor.
One of the basic tenets is to invest for the long term. Over time, riding out the markets' inevitable ups and downs has proven much more effective than selling into panic or chasing the hottest trend. Even missing only a few of the markets' best days can significantly diminish investor returns. Patience also affords the benefits of compounding - of earning interest on additional income or reinvested dividends and capital gains. There are tax advantages and cost benefits to consider as well. The more you sell, the more taxes you pay, and the more you trade, the higher the costs. While staying the course doesn't eliminate risk, it can considerably lessen the effect of short-term declines.
You can further manage your investing risk through diversification. And today, more than ever, geographic diversification should be taken into account. Studies indicate that asset allocation is the single most important determinant of a portfolio's long-term success. The right mix of stocks, bonds and cash - aligned to your particular risk tolerance and investment objective - is very important. Age-appropriate rebalancing is also an essential aspect of asset allocation. For younger investors, an emphasis on equities - which historically have been the best-performing asset class over time - is encouraged. As investors near their specific goal, such as retirement or sending a child to college, consideration may be given to replacing volatile assets (e.g. common stocks) with more-stable fixed investments (bonds or savings plans).
A third investment principle - investing regularly - can help lower the average cost of your purchases. Investing a certain amount of money each month or quarter helps ensure you won't pay for all your shares at market highs. This strategy - known as dollar cost averaging - also reduces unconstructive "emotion" from investing, helping shareholders avoid selling weak performers just prior to an upswing, or chasing a hot performer just before a correction.
We invite you to contact us via the Internet, through our Investor Centers or over the phone. It is our privilege to provide you the information you need to make the investments that are right for you.
Sincerely,
/s/Edward C. Johnson 3d
Edward C. Johnson 3d
Annual Report
Performance: The Bottom Line
Average annual total return reflects the change in the value of an investment, assuming reinvestment of the fund's dividend income and capital gains (the profits earned upon the sale of securities that have grown in value) and assuming a constant rate of performance each year. The $10,000 table and the fund's returns do not reflect the deduction of taxes that a shareholder would pay on fund distributions or the redemption of fund shares. During periods of reimbursement by Fidelity, a fund's total return will be greater than it would be had the reimbursement not occurred. How a fund did yesterday is no guarantee of how it will do tomorrow.
Average Annual Total Returns
Periods ended July 31, 2007 | Past 1
year | Past 5
years | Past 10
years |
Fidelity® Blue Chip Growth Fund | 16.02% | 8.25% | 3.78% |
$10,000 Over 10 Years
Let's say hypothetically that $10,000 was invested in Fidelity® Blue Chip Growth Fund on July 31, 1997. The chart shows how the value of your investment would have changed, and also shows how the Russell 1000® Growth Index performed over the same period.
Annual Report
Management's Discussion of Fund Performance
Comments from Jennifer Uhrig, Portfolio Manager of Fidelity® Blue Chip Growth Fund
Major U.S. equity benchmarks approached or exceeded gains of 20% and several set record highs during the 12-month period ending July 31, 2007. In that time, the Dow Jones Industrial AverageSM rose 20.84%, the Standard & Poor's 500SM Index advanced 16.13% and the NASDAQ Composite® Index gained 22.67%. The small-cap Russell 2000® Index fared less well after falling nearly 7% in July, but still returned 12.12% for the year overall. The first half of the period featured six consecutive months of positive returns spurred by the more relaxed monetary policy of the Federal Reserve Board and falling energy prices, which softened inflationary pressures on the U.S. economy. Stocks slipped in February, however, as energy prices crept higher, the housing market slumped, subprime mortgage woes mounted and the Chinese stock market declined 9% in a single day. But equities soared again from March through May, as reflected by the Dow and the S&P 500®, which climbed nearly 12% and more than 9%, respectively. In June and July, though, stocks sank again on inflation concerns and a worsening subprime loan crisis.
Blue Chip Growth Fund produced a solid total return of 16.02% for the 12-month period, but it came up short of the 19.47% gain of the Russell 1000® Growth Index. The fund underperformed the index, mostly due to unfavorable industry positioning. An overweighting in the pharmaceuticals, biotechnology and life science segment of health care, the weakest sector in the index, hurt fund results the most, with untimely exposures to energy and consumer discretionary, plus an overweighting in insurance stocks, detracting as well. Global insurance giant American International Group (AIG) was the biggest detractor during the period, followed closely by biotechnology pioneer Genentech. Energy services contractor Baker Hughes was another weak performer, and I exited the position. Relative results also were held back substantially by inopportune stock selection in the information technology sector. On the upside, performance versus the benchmark was buoyed somewhat by favorable selection among materials, telecommunication services and utilities stocks. Among the fund's most notable contributors were Amazon.com, which is building a dominant presence in the online retailing space, and Apple, where product innovations in its consumer electronics business drove strong stock price appreciation.
The views expressed above reflect those of the portfolio manager(s) only through the end of the period as stated on the cover of this report and do not necessarily represent the views of Fidelity or any other person in the Fidelity organization. Any such views are subject to change at any time based upon market or other conditions and Fidelity disclaims any responsibility to update such views. These views may not be relied on as investment advice and, because investment decisions for a Fidelity fund are based on numerous factors, may not be relied on as an indication of trading intent on behalf of any Fidelity fund.
Annual Report
Shareholder Expense Example
As a shareholder of the Fund, you incur two types of costs: (1) transaction costs, and (2) ongoing costs, including management fees and other Fund expenses. This Example is intended to help you understand your ongoing costs (in dollars) of investing in the Fund and to compare these costs with the ongoing costs of investing in other mutual funds.
The Example is based on an investment of $1,000 invested at the beginning of the period and held for the entire period (February 1, 2007 to July 31, 2007).
Actual Expenses
The first line of the accompanying table provides information about actual account values and actual expenses. You may use the information in this line, together with the amount you invested, to estimate the expenses that you paid over the period. Simply divide your account value by $1,000.00 (for example, an $8,600 account value divided by $1,000.00 = 8.6), then multiply the result by the number in the first line under the heading entitled "Expenses Paid During Period" to estimate the expenses you paid on your account during this period. A small balance maintenance fee of $12.00 that is charged once a year may apply for certain accounts with a value of less than $2,000. This fee is not included in the table below. If it was, the estimate of expenses you paid during the period would be higher, and your ending account value lower, by this amount. In addition, the Fund, as a shareholder in the underlying Fidelity Central Funds, will indirectly bear its pro rata share of the fees and expenses incurred by the underlying Fidelity Central Funds. These fees and expenses are not included in the Fund's annualized expense ratio used to calculate the expense estimate in the table below.
Hypothetical Example for Comparison Purposes
The second line of the accompanying table provides information about hypothetical account values and hypothetical expenses based on the Fund's actual expense ratio and an assumed rate of return of 5% per year before expenses, which is not the Fund's actual return. The hypothetical account values and expenses may not be used to estimate the actual ending account balance or expenses you paid for the period. You may use this information to compare the ongoing costs of investing in the Fund and other funds. To do so, compare this 5% hypothetical example with the 5% hypothetical examples that appear in the shareholder reports of the other funds. A small balance maintenance fee of $12.00 that is charged once a year may apply for certain accounts with a value of less than $2,000. This fee is not included in the table below. If it was, the estimate of expenses you paid during the period would be higher, and your ending account value lower, by this amount. In addition, the Fund, as a shareholder in the underlying Fidelity Central Funds, will indirectly bear its pro rata share of the fees and expenses incurred by the underlying Fidelity Central Funds. These fees and expenses are not included in the Fund's annualized expense ratio used to calculate the expense estimate in the table below.
Please note that the expenses shown in the table are meant to highlight your ongoing costs only and do not reflect any transaction costs. Therefore, the second line of the table is useful in comparing ongoing costs only, and will not help you determine the relative total costs of owning different funds.
Annual Report
Shareholder Expense Example - continued
| Beginning
Account Value
February 1, 2007 | Ending
Account Value
July 31, 2007 | Expenses Paid
During Period*
February 1, 2007
to July 31, 2007 |
Actual | $ 1,000.00 | $ 1,040.60 | $ 2.99 |
Hypothetical (5% return per year before expenses) | $ 1,000.00 | $ 1,021.87 | $ 2.96 |
* Expenses are equal to the Fund's annualized expense ratio of .59%; multiplied by the average account value over the period, multiplied by 181/365 (to reflect the one-half year period).
Annual Report
Investment Changes
Top Ten Stocks as of July 31, 2007 |
| % of fund's
net assets | % of fund's net assets
6 months ago |
Microsoft Corp. | 3.7 | 4.1 |
Cisco Systems, Inc. | 3.6 | 2.7 |
Intel Corp. | 3.3 | 2.6 |
International Business Machines Corp. | 3.1 | 2.0 |
The Coca-Cola Co. | 2.7 | 1.4 |
Google, Inc. Class A (sub. vtg.) | 2.5 | 2.4 |
Exxon Mobil Corp. | 2.3 | 1.3 |
Schlumberger Ltd. (NY Shares) | 2.2 | 1.6 |
Wal-Mart Stores, Inc. | 2.1 | 2.6 |
Apple, Inc. | 2.1 | 1.9 |
| 27.6 | |
Top Five Market Sectors as of July 31, 2007 |
| % of fund's
net assets | % of fund's net assets
6 months ago |
Information Technology | 33.2 | 30.1 |
Health Care | 13.7 | 17.7 |
Consumer Staples | 12.3 | 12.5 |
Financials | 10.6 | 9.5 |
Consumer Discretionary | 10.4 | 13.8 |
Asset Allocation (% of fund's net assets) |
As of July 31, 2007 * | As of January 31, 2007 ** |
 | Stocks 99.2% | | | Stocks 99.2% | |
 | Short-Term
Investments and
Net Other Assets 0.8% | | | Short-Term
Investments and
Net Other Assets 0.8% | |
* Foreign investments | 14.2% | | **Foreign investments | 6.2% | |

Annual Report
Investments July 31, 2007
Showing Percentage of Net Assets
Common Stocks - 99.2% |
| Shares | | Value (000s) |
CONSUMER DISCRETIONARY - 10.4% |
Automobiles - 0.5% |
Toyota Motor Corp. sponsored ADR | 773,300 | | $ 93,283 |
Diversified Consumer Services - 0.0% |
Weight Watchers International, Inc. | 146,300 | | 7,098 |
Hotels, Restaurants & Leisure - 1.7% |
IHOP Corp. | 377,142 | | 24,601 |
McDonald's Corp. | 3,241,500 | | 155,171 |
Starbucks Corp. (a) | 1,828,300 | | 48,779 |
Yum! Brands, Inc. | 3,015,500 | | 96,617 |
| | 325,168 |
Household Durables - 1.7% |
Centex Corp. | 846,700 | | 31,590 |
Ethan Allen Interiors, Inc. | 1,015,589 | | 34,693 |
Furniture Brands International, Inc. (d) | 1,749,800 | | 19,283 |
La-Z-Boy, Inc. (d)(e) | 4,574,100 | | 45,787 |
Lennar Corp. Class A | 707,500 | | 21,692 |
Pulte Homes, Inc. | 1,524,000 | | 29,474 |
Sony Corp. sponsored ADR | 2,078,500 | | 109,620 |
Toll Brothers, Inc. (a) | 760,000 | | 16,667 |
| | 308,806 |
Internet & Catalog Retail - 0.9% |
Amazon.com, Inc. (a) | 2,108,600 | | 165,609 |
Media - 2.3% |
Interpublic Group of Companies, Inc. (d) | 12,711,300 | | 133,342 |
Lamar Advertising Co. Class A | 960,200 | | 57,161 |
The New York Times Co. Class A (d) | 2,792,000 | | 63,825 |
Time Warner, Inc. | 8,961,200 | | 172,593 |
| | 426,921 |
Specialty Retail - 1.9% |
Guess?, Inc. | 2,091,500 | | 99,325 |
Home Depot, Inc. | 4,269,800 | | 158,708 |
J. Crew Group, Inc. | 880,829 | | 44,306 |
Williams-Sonoma, Inc. (d) | 1,502,300 | | 46,256 |
| | 348,595 |
Common Stocks - continued |
| Shares | | Value (000s) |
CONSUMER DISCRETIONARY - continued |
Textiles, Apparel & Luxury Goods - 1.4% |
NIKE, Inc. Class B (d) | 4,126,700 | | $ 232,952 |
Under Armour, Inc. Class A (sub. vtg.) (a)(d) | 552,000 | | 33,898 |
| | 266,850 |
TOTAL CONSUMER DISCRETIONARY | | 1,942,330 |
CONSUMER STAPLES - 12.3% |
Beverages - 4.7% |
PepsiCo, Inc. | 5,712,662 | | 374,865 |
The Coca-Cola Co. | 9,517,400 | | 495,952 |
| | 870,817 |
Food & Staples Retailing - 3.7% |
Costco Wholesale Corp. (d) | 963,700 | | 57,629 |
Kroger Co. | 3,593,800 | | 93,295 |
Metro AG | 732,500 | | 57,403 |
Safeway, Inc. | 2,648,700 | | 84,414 |
Wal-Mart Stores, Inc. | 8,682,955 | | 398,982 |
| | 691,723 |
Food Products - 1.6% |
Groupe Danone | 1,218,900 | | 87,147 |
Nestle SA sponsored ADR | 1,079,400 | | 104,162 |
Tyson Foods, Inc. Class A | 5,282,200 | | 112,511 |
| | 303,820 |
Household Products - 1.5% |
Church & Dwight Co., Inc. | 1,385,500 | | 67,973 |
Colgate-Palmolive Co. | 587,600 | | 38,782 |
Procter & Gamble Co. | 1,559,230 | | 96,454 |
Reckitt Benckiser PLC | 1,276,500 | | 68,769 |
| | 271,978 |
Personal Products - 0.8% |
Avon Products, Inc. | 3,967,500 | | 142,870 |
TOTAL CONSUMER STAPLES | | 2,281,208 |
ENERGY - 5.6% |
Energy Equipment & Services - 2.4% |
Oceaneering International, Inc. (a) | 750,000 | | 42,120 |
Schlumberger Ltd. (NY Shares) | 4,275,200 | | 404,947 |
| | 447,067 |
Common Stocks - continued |
| Shares | | Value (000s) |
ENERGY - continued |
Oil, Gas & Consumable Fuels - 3.2% |
Chesapeake Energy Corp. | 556,000 | | $ 18,926 |
Enterprise Products Partners LP | 909,400 | | 28,282 |
EOG Resources, Inc. | 261,500 | | 18,331 |
Exxon Mobil Corp. | 5,083,500 | | 432,758 |
Newfield Exploration Co. (a) | 416,300 | | 20,003 |
Sasol Ltd. sponsored ADR | 1,825,800 | | 68,668 |
| | 586,968 |
TOTAL ENERGY | | 1,034,035 |
FINANCIALS - 10.6% |
Capital Markets - 2.9% |
Charles Schwab Corp. | 5,195,600 | | 104,587 |
Janus Capital Group, Inc. | 2,729,900 | | 82,061 |
State Street Corp. | 3,069,600 | | 205,755 |
T. Rowe Price Group, Inc. | 2,689,081 | | 140,182 |
| | 532,585 |
Commercial Banks - 0.5% |
Societe Generale Series A | 263,400 | | 45,832 |
Unicredito Italiano SpA | 5,349,400 | | 45,917 |
| | 91,749 |
Consumer Finance - 1.1% |
American Express Co. | 3,459,229 | | 202,503 |
Diversified Financial Services - 1.8% |
Citigroup, Inc. | 2,871,600 | | 133,730 |
CME Group, Inc. | 257,963 | | 142,525 |
Deutsche Boerse AG | 480,600 | | 56,208 |
| | 332,463 |
Insurance - 3.7% |
ACE Ltd. | 1,432,500 | | 82,684 |
AFLAC, Inc. | 2,453,600 | | 127,882 |
American International Group, Inc. | 4,298,455 | | 275,875 |
Principal Financial Group, Inc. | 1,016,200 | | 57,304 |
Prudential Financial, Inc. | 1,725,800 | | 152,958 |
| | 696,703 |
Real Estate Management & Development - 0.1% |
GAGFAH SA (d) | 801,800 | | 16,029 |
Common Stocks - continued |
| Shares | | Value (000s) |
FINANCIALS - continued |
Thrifts & Mortgage Finance - 0.5% |
Fannie Mae | 844,000 | | $ 50,505 |
Freddie Mac | 759,300 | | 43,485 |
| | 93,990 |
TOTAL FINANCIALS | | 1,966,022 |
HEALTH CARE - 13.7% |
Biotechnology - 3.4% |
Amylin Pharmaceuticals, Inc. (a)(d) | 1,718,700 | | 79,937 |
Celgene Corp. (a) | 1,643,200 | | 99,512 |
CSL Ltd. | 1,064,620 | | 80,697 |
Genentech, Inc. (a) | 2,470,800 | | 183,778 |
Gilead Sciences, Inc. (a) | 4,892,800 | | 182,159 |
| | 626,083 |
Health Care Equipment & Supplies - 2.5% |
Alcon, Inc. | 697,100 | | 95,154 |
Becton, Dickinson & Co. | 2,883,400 | | 220,176 |
C.R. Bard, Inc. | 1,870,400 | | 146,770 |
| | 462,100 |
Health Care Providers & Services - 0.6% |
AMN Healthcare Services, Inc. (a)(e) | 3,219,800 | | 69,129 |
Cross Country Healthcare, Inc. (a)(e) | 3,075,850 | | 50,352 |
| | 119,481 |
Life Sciences Tools & Services - 1.3% |
Millipore Corp. (a)(d) | 1,952,700 | | 153,502 |
Thermo Fisher Scientific, Inc. (a) | 1,862,000 | | 97,215 |
| | 250,717 |
Pharmaceuticals - 5.9% |
Barr Pharmaceuticals, Inc. (a) | 1,783,200 | | 91,336 |
Bristol-Myers Squibb Co. | 4,889,500 | | 138,911 |
Johnson & Johnson | 4,224,604 | | 255,589 |
Merck & Co., Inc. | 7,314,800 | | 363,180 |
Nastech Pharmaceutical Co., Inc. (a)(d)(e) | 2,067,400 | | 26,132 |
Schering-Plough Corp. | 7,550,200 | | 215,483 |
| | 1,090,631 |
TOTAL HEALTH CARE | | 2,549,012 |
Common Stocks - continued |
| Shares | | Value (000s) |
INDUSTRIALS - 8.6% |
Aerospace & Defense - 4.3% |
Honeywell International, Inc. | 2,875,000 | | $ 165,341 |
Lockheed Martin Corp. | 1,853,100 | | 182,493 |
Raytheon Co. | 2,461,600 | | 136,274 |
Rockwell Collins, Inc. | 1,529,400 | | 105,070 |
United Technologies Corp. | 2,793,800 | | 203,864 |
| | 793,042 |
Electrical Equipment - 0.5% |
Renewable Energy Corp. AS (d) | 1,786,400 | | 71,409 |
Vestas Wind Systems AS (a) | 346,700 | | 23,463 |
| | 94,872 |
Industrial Conglomerates - 3.8% |
3M Co. | 3,563,300 | | 316,849 |
General Electric Co. | 7,673,900 | | 297,440 |
Siemens AG sponsored ADR | 778,100 | | 98,531 |
| | 712,820 |
TOTAL INDUSTRIALS | | 1,600,734 |
INFORMATION TECHNOLOGY - 33.2% |
Communications Equipment - 6.3% |
Cisco Systems, Inc. (a) | 23,070,900 | | 666,980 |
Motorola, Inc. | 5,535,500 | | 94,048 |
QUALCOMM, Inc. | 6,242,400 | | 259,996 |
Research In Motion Ltd. (a) | 695,100 | | 148,751 |
| | 1,169,775 |
Computers & Peripherals - 6.6% |
Apple, Inc. (a) | 3,019,400 | | 397,836 |
Dell, Inc. (a) | 9,008,700 | | 251,973 |
International Business Machines Corp. | 5,234,700 | | 579,220 |
| | 1,229,029 |
Electronic Equipment & Instruments - 1.1% |
Hon Hai Precision Industry Co. Ltd. (Foxconn) | 14,075,400 | | 116,691 |
Tyco Electronics Ltd. (a) | 2,538,325 | | 90,923 |
| | 207,614 |
Internet Software & Services - 2.5% |
Google, Inc. Class A (sub. vtg.) (a) | 922,500 | | 470,475 |
IT Services - 2.9% |
Accenture Ltd. Class A | 985,700 | | 41,528 |
Cognizant Technology Solutions Corp. Class A (a) | 1,015,370 | | 82,225 |
Common Stocks - continued |
| Shares | | Value (000s) |
INFORMATION TECHNOLOGY - continued |
IT Services - continued |
Fidelity National Information Services, Inc. | 1,242,600 | | $ 61,670 |
Gartner, Inc. Class A (a) | 2,903,500 | | 60,770 |
Infosys Technologies Ltd. sponsored ADR | 1,442,500 | | 71,548 |
Satyam Computer Services Ltd. sponsored ADR | 3,434,000 | | 91,550 |
The Western Union Co. | 6,698,100 | | 133,627 |
| | 542,918 |
Semiconductors & Semiconductor Equipment - 7.0% |
Altera Corp. | 5,503,200 | | 127,674 |
Applied Materials, Inc. | 7,952,300 | | 175,269 |
Broadcom Corp. Class A (a) | 4,135,300 | | 135,679 |
Cypress Semiconductor Corp. (a) | 962,800 | | 24,128 |
Intel Corp. | 26,238,640 | | 619,757 |
Maxim Integrated Products, Inc. | 2,788,700 | | 88,402 |
Samsung Electronics Co. Ltd. | 33,198 | | 21,916 |
Taiwan Semiconductor Manufacturing Co. Ltd. sponsored ADR | 11,281,678 | | 114,509 |
| | 1,307,334 |
Software - 6.8% |
Intuit, Inc. (a)(d) | 3,994,600 | | 114,405 |
Microsoft Corp. | 23,541,200 | | 682,455 |
Oracle Corp. (a) | 13,467,600 | | 257,501 |
SAP AG sponsored ADR (d) | 1,135,000 | | 61,199 |
Synopsys, Inc. (a) | 2,274,200 | | 55,627 |
Take-Two Interactive Software, Inc. (a)(d) | 3,550,000 | | 62,587 |
Ubisoft Entertainment SA (a) | 428,300 | | 28,102 |
| | 1,261,876 |
TOTAL INFORMATION TECHNOLOGY | | 6,189,021 |
MATERIALS - 1.6% |
Chemicals - 1.6% |
Monsanto Co. | 2,761,800 | | 177,998 |
Praxair, Inc. | 868,800 | | 66,567 |
Syngenta AG sponsored ADR | 1,665,700 | | 62,780 |
| | 307,345 |
TELECOMMUNICATION SERVICES - 2.1% |
Diversified Telecommunication Services - 2.1% |
AT&T, Inc. | 4,753,000 | | 186,127 |
Verizon Communications, Inc. | 4,632,400 | | 197,433 |
| | 383,560 |
Common Stocks - continued |
| Shares | | Value (000s) |
UTILITIES - 1.1% |
Electric Utilities - 1.1% |
E.ON AG sponsored ADR | 1,895,200 | | $ 99,176 |
Electricite de France | 1,044,100 | | 106,895 |
| | 206,071 |
TOTAL COMMON STOCKS (Cost $15,624,663) | 18,459,338 |
Money Market Funds - 2.2% |
| | | |
Fidelity Cash Central Fund, 5.38% (b) | 91,436,003 | | 91,436 |
Fidelity Securities Lending Cash Central Fund, 5.39% (b)(c) | 326,333,075 | | 326,333 |
TOTAL MONEY MARKET FUNDS (Cost $417,769) | 417,769 |
TOTAL INVESTMENT PORTFOLIO - 101.4% (Cost $16,042,432) | | 18,877,107 |
NET OTHER ASSETS - (1.4)% | | (260,834) |
NET ASSETS - 100% | $ 18,616,273 |
Legend |
(a) Non-income producing |
(b) Affiliated fund that is available only to investment companies and other accounts managed by Fidelity Investments. The rate quoted is the annualized seven-day yield of the fund at period end. A complete unaudited listing of the fund's holdings as of its most recent quarter end is available upon request. |
(c) Investment made with cash collateral received from securities on loan. |
(d) Security or a portion of the security is on loan at period end. |
(e) Affiliated company |
Affiliated Central Funds |
Information regarding fiscal year to date income earned by the Fund from investments in Fidelity Central Funds is as follows: |
Fund | Income earned
(Amounts in thousands) |
Fidelity Cash Central Fund | $ 9,397 |
Fidelity Securities Lending Cash Central Fund | 3,337 |
Total | $ 12,734 |
Other Affiliated Issuers |
An affiliated company is a company in which the fund has ownership of at least 5% of the voting securities. Fiscal year to date transactions with companies which are or were affiliates are as follows: |
Affiliates
(Amounts in thousands) | Value, beginning of period | Purchases | Sales Proceeds | Dividend Income | Value,
end of period |
AMN Healthcare Services, Inc. | $ - | $ 91,103 | $ 2,544 | $ - | $ 69,129 |
AudioCodes Ltd. | 33,305 | - | 32,111 | - | - |
Cross Country Healthcare, Inc. | - | 70,547 | 2,397 | - | 50,352 |
La-Z-Boy, Inc. | - | 58,320 | - | 1,647 | 45,787 |
Nastech Pharmaceutical Co., Inc. | 28,514 | - | 424 | - | 26,132 |
Take-Two Interactive Software, Inc. | - | 70,765 | 11,877 | - | - |
Total | $ 61,819 | $ 290,735 | $ 49,353 | $ 1,647 | $ 191,400 |
Other Information |
Distribution of investments by country of issue, as a percentage of total net assets, is as follows: |
United States of America | 85.8% |
Netherlands Antilles | 2.2% |
Germany | 1.9% |
France | 1.5% |
Switzerland | 1.3% |
Taiwan | 1.2% |
Japan | 1.1% |
Others (individually less than 1%) | 5.0% |
| 100.0% |
See accompanying notes which are an integral part of the financial statements.
Annual Report
Financial Statements
Statement of Assets and Liabilities
Amounts in thousands (except per-share amount) | July 31, 2007 |
| | |
Assets | | |
Investment in securities, at value (including securities loaned of $320,301) - See accompanying schedule: Unaffiliated issuers (cost $15,380,024) | $ 18,267,938 | |
Fidelity Central Funds (cost $417,769) | 417,769 | |
Other affiliated issuers (cost $244,639) | 191,400 | |
Total Investments (cost $16,042,432) | | $ 18,877,107 |
Foreign currency held at value (cost $245) | | 245 |
Receivable for investments sold | | 139,525 |
Receivable for fund shares sold | | 8,852 |
Dividends receivable | | 14,398 |
Distributions receivable from Fidelity Central Funds | | 726 |
Prepaid expenses | | 37 |
Other receivables | | 15,315 |
Total assets | | 19,056,205 |
| | |
Liabilities | | |
Payable to custodian bank | $ 10,558 | |
Payable for investments purchased | 53,155 | |
Payable for fund shares redeemed | 39,870 | |
Accrued management fee | 5,502 | |
Other affiliated payables | 3,935 | |
Other payables and accrued expenses | 579 | |
Collateral on securities loaned, at value | 326,333 | |
Total liabilities | | 439,932 |
| | |
Net Assets | | $ 18,616,273 |
Net Assets consist of: | | |
Paid in capital | | $ 14,077,718 |
Undistributed net investment income | | 82,288 |
Accumulated undistributed net realized gain (loss) on investments and foreign currency transactions | | 1,621,591 |
Net unrealized appreciation (depreciation) on investments and assets and liabilities in foreign currencies | | 2,834,676 |
Net Assets, for 397,145 shares outstanding | | $ 18,616,273 |
Net Asset Value, offering price and redemption price per share ($18,616,273 ÷ 397,145 shares) | | $ 46.88 |
See accompanying notes which are an integral part of the financial statements.
Annual Report
Statement of Operations
Amounts in thousands | Year ended July 31, 2007 |
| | |
Investment Income | | |
Dividends (including $1,647 earned from other affiliated issuers) | | $ 250,565 |
Interest | | 227 |
Income from Fidelity Central Funds | | 12,734 |
Total income | | 263,526 |
| | |
Expenses | | |
Management fee
Basic fee | $ 113,348 | |
Performance adjustment | (43,551) | |
Transfer agent fees | 47,628 | |
Accounting and security lending fees | 1,710 | |
Custodian fees and expenses | 343 | |
Independent trustees' compensation | 66 | |
Appreciation in deferred trustee compensation account | 1 | |
Registration fees | 154 | |
Audit | 146 | |
Legal | 314 | |
Interest | 93 | |
Miscellaneous | 510 | |
Total expenses before reductions | 120,762 | |
Expense reductions | (2,533) | 118,229 |
Net investment income (loss) | | 145,297 |
Realized and Unrealized Gain (Loss) Net realized gain (loss) on: | | |
Investment securities: | | |
Unaffiliated issuers | 1,628,955 | |
Other affiliated issuers | (3,425) | |
Foreign currency transactions | 135 | |
Total net realized gain (loss) | | 1,625,665 |
Change in net unrealized appreciation (depreciation) on Investment securities | | 1,230,855 |
Net gain (loss) | | 2,856,520 |
Net increase (decrease) in net assets resulting from operations | | $ 3,001,817 |
See accompanying notes which are an integral part of the financial statements.
Annual Report
Financial Statements - continued
Statement of Changes in Net Assets
Amounts in thousands | Year ended
July 31,
2007 | Year ended
July 31,
2006 |
Increase (Decrease) in Net Assets | | |
Operations | | |
Net investment income (loss) | $ 145,297 | $ 116,285 |
Net realized gain (loss) | 1,625,665 | 1,817,893 |
Change in net unrealized appreciation (depreciation) | 1,230,855 | (2,279,588) |
Net increase (decrease) in net assets resulting
from operations | 3,001,817 | (345,410) |
Distributions to shareholders from net investment income | (110,618) | (120,771) |
Distributions to shareholders from net realized gain | (430,992) | - |
Total distributions | (541,610) | (120,771) |
Share transactions
Proceeds from sales of shares | 2,670,983 | 3,136,779 |
Reinvestment of distributions | 535,074 | 118,853 |
Cost of shares redeemed | (6,620,849) | (6,099,360) |
Net increase (decrease) in net assets resulting from share transactions | (3,414,792) | (2,843,728) |
Total increase (decrease) in net assets | (954,585) | (3,309,909) |
| | |
Net Assets | | |
Beginning of period | 19,570,858 | 22,880,767 |
End of period (including undistributed net investment income of $82,288 and undistributed net investment income of $58,948, respectively) | $ 18,616,273 | $ 19,570,858 |
Other Information Shares | | |
Sold | 59,925 | 73,088 |
Issued in reinvestment of distributions | 12,779 | 2,760 |
Redeemed | (146,659) | (141,905) |
Net increase (decrease) | (73,955) | (66,057) |
See accompanying notes which are an integral part of the financial statements.
Annual Report
Financial Highlights
Years ended July 31, | 2007 | 2006 | 2005 | 2004 | 2003 |
Selected Per-Share Data | | | | | |
Net asset value,
beginning of period | $ 41.54 | $ 42.60 | $ 38.72 | $ 36.13 | $ 33.24 |
Income from Investment Operations | | | | | |
Net investment income (loss) B | .32 | .23 | .42E | .19 | .21 |
Net realized and
unrealized gain (loss) | 6.19 | (1.06) | 3.85 | 2.62 | 2.81 |
Total from investment operations | 6.51 | (.83) | 4.27 | 2.81 | 3.02 |
Distributions from net investment income | (.24) | (.23) | (.39) | (.22) | (.13) |
Distributions from net realized gain | (.93) | - | - | - | - |
Total distributions | (1.17) | (.23) | (.39) | (.22) | (.13) |
Net asset value, end of period | $ 46.88 | $ 41.54 | $ 42.60 | $ 38.72 | $ 36.13 |
Total Return A | 16.02% | (1.97)% | 11.08% | 7.79% | 9.13% |
Ratios to Average Net Assets C, F | | | | | |
Expenses before reductions | .60% | .63% | .66% | .68% | .71% |
Expenses net of fee waivers,
if any | .60% | .63% | .66% | .68% | .71% |
Expenses net of all reductions | .59% | .61% | .64% | .67% | .69% |
Net investment income (loss) | .72% | .54% | 1.05%E | .48% | .64% |
Supplemental Data | | | | | |
Net assets, end of period
(in millions) | $ 18,616 | $ 19,571 | $ 22,881 | $ 22,102 | $ 19,936 |
Portfolio turnover rateD | 87% | 48% | 29% | 23% | 24% |
A Total returns would have been lower had certain expenses not been reduced during the periods shown.
B Calculated based on average shares outstanding during the period.
C Fees and expenses of the underlying Fidelity Central Funds are not included in the Fund's expense ratio. The Fund indirectly bears its proportionate share of the expenses of any underlying Fidelity Central Funds.
D Amount does not include the portfolio activity of any underlying Fidelity Central Funds.
E Investment income per share reflects a special dividend which amounted to $.20 per share. Excluding the special dividend, the ratio of net investment income (loss) to average net assets would have been .56%.
F Expense ratios reflect operating expenses of the Fund. Expenses before reductions do not reflect amounts reimbursed by the investment adviser or reductions from brokerage service arrangements or other expense offset arrangements and do not represent the amount paid by the Fund during periods when reimbursements or reductions occur. Expenses net of fee waivers reflect expenses after reimbursement by the investment adviser but prior to reductions from brokerage service arrangements or other expense offset arrangements. Expenses net of all reductions represent the net expenses paid by the Fund.
See accompanying notes which are an integral part of the financial statements.
Annual Report
Notes to Financial Statements
For the period ended July 31, 2007
(Amounts in thousands except ratios)
1. Organization.
Fidelity Blue Chip Growth Fund (the Fund) is a fund of Fidelity Securities Fund (the trust) and is authorized to issue an unlimited number of shares. The trust is registered under the Investment Company Act of 1940, as amended (the 1940 Act), as an open-end management investment company organized as a Massachusetts business trust.
2. Investments in Fidelity Central Funds.
The Fund may invest in Fidelity Central Funds which are open-end investment companies available only to other investment companies and accounts managed by Fidelity Management & Research Company (FMR) and its affiliates. The Fund's Schedule of Investments lists each of the Fidelity Central Funds as an investment of the Fund, but does not include the underlying holdings of each Fidelity Central Fund. As an Investing Fund, the Fund indirectly bears its proportionate share of the expenses of the underlying Fidelity Central Funds. The Money Market Central Funds seek preservation of capital and current income and are managed by Fidelity Investments Money Management, Inc. (FIMM), an affiliate of FMR.
A complete list of holdings for each Fidelity Central Fund is available upon request or at the SEC's web site at www.sec.gov. In addition, the financial statements of the Fidelity Central Funds, which are not covered by the Fund's Report of Independent Registered Public Accounting Firm, are available on the SEC's web site or upon request.
3. Significant Accounting Policies.
The financial statements have been prepared in conformity with accounting principles generally accepted in the United States of America, which require management to make certain estimates and assumptions at the date of the financial statements. The following summarizes the significant accounting policies of the Fund:
Security Valuation. Investments are valued and net asset value (NAV) per share is calculated (NAV calculation) as of the close of business of the New York Stock Exchange (NYSE), normally 4:00 p.m. Eastern time. Wherever possible, the Fund uses independent pricing services approved by the Board of Trustees to value its investments.
Equity securities, including restricted securities, for which market quotations are readily available, are valued at the last reported sale price or official closing price as reported by an independent pricing service on the primary market or exchange on which they are traded. In the event there were no sales during the day or closing prices are not available, securities are valued at the last quoted bid price. Investments in open-end mutual funds, including the Fidelity Central Funds, are valued at their closing net asset value each
Annual Report
3. Significant Accounting Policies - continued
Security Valuation - continued
business day. Short-term securities with remaining maturities of sixty days or less for which quotations are not readily available are valued at amortized cost, which approximates value.
When current market prices or quotations are not readily available or do not accurately reflect fair value, valuations may be determined in accordance with procedures adopted by the Board of Trustees. For example, when developments occur between the close of a market and the close of the NYSE that may materially affect the value of some or all of the securities, or when trading in a security is halted, those securities may be fair valued. Factors used in the determination of fair value may include monitoring news to identify significant market or security specific events such as changes in the value of U.S. securities markets, reviewing developments in foreign markets and evaluating the performance of ADRs, futures contracts and exchange-traded funds. Because the Fund's utilization of fair value pricing depends on market activity, the frequency with which fair value pricing is used cannot be predicted and may be utilized to a significant extent. The value of securities used for NAV calculation under fair value pricing may differ from published prices for the same securities.
Foreign Currency. The Fund uses foreign currency contracts to facilitate transactions in foreign-denominated securities. Losses from these transactions may arise from changes in the value of the foreign currency or if the counterparties do not perform under the contracts' terms.
Foreign-denominated assets, including investment securities, and liabilities are translated into U.S. dollars at the exchange rate at period end. Purchases and sales of investment securities, income and dividends received and expenses denominated in foreign currencies are translated into U.S. dollars at the exchange rate in effect on the transaction date.
The effects of exchange rate fluctuations on investments are included with the net realized and unrealized gain (loss) on investment securities. Other foreign currency transactions resulting in realized and unrealized gain (loss) are disclosed separately.
Investment Transactions and Income. For financial reporting purposes, the Fund's investment holdings and NAV include trades executed through the end of the last business day of the period. The NAV for processing shareholder transactions includes trades executed through the end of the prior business day. Gains and losses on securities sold are determined on the basis of identified cost and may include proceeds received from litigation. Dividend income is recorded on the ex-dividend date, except for certain dividends from foreign securities where the ex-dividend date may have passed, which are recorded as soon as the Fund is informed of the ex-dividend date. Non-cash dividends
Annual Report
Notes to Financial Statements - continued
(Amounts in thousands except ratios)
3. Significant Accounting Policies - continued
Investment Transactions and Income - continued
included in dividend income, if any, are recorded at the fair market value of the securities received. Distributions received on securities that represent a return of capital or capital gain are recorded as a reduction of cost of investments and/or as a realized gain. The Fund estimates the components of distributions received that may be considered return of capital distributions or capital gain distributions. Interest income and income distributions from the Fidelity Central Funds are accrued as earned. Interest income includes coupon interest and amortization of premium and accretion of discount on debt securities. Investment income is recorded net of foreign taxes withheld where recovery of such taxes is uncertain.
Expenses. Most expenses of the trust can be directly attributed to a fund. Expenses which cannot be directly attributed are apportioned among each Fund in the trust. Expense estimates are accrued in the period to which they relate and adjustments are made when actual amounts are known.
Deferred Trustee Compensation. Under a Deferred Compensation Plan (the Plan), Independent Trustees must defer receipt of a portion of, and may elect to defer receipt of an additional portion of, their annual compensation. Deferred amounts are invested in a cross-section of Fidelity funds, are marked-to-market and remain in the Fund until distributed in accordance with the Plan. The investment of deferred amounts and the offsetting payable to the Trustees are included in the accompanying Statement of Assets and Liabilities.
Income Tax Information and Distributions to Shareholders. Each year, the Fund intends to qualify as a regulated investment company by distributing all of its taxable income and realized gains under Subchapter M of the Internal Revenue Code. As a result, no provision for income taxes is required in the accompanying financial statements. Foreign taxes are provided for based on the Fund's understanding of the tax rules and rates that exist in the foreign markets in which it invests.
Distributions are recorded on the ex-dividend date. Income and capital gain distributions are determined in accordance with income tax regulations, which may differ from generally accepted accounting principles. In addition, the Fund will claim a portion of the payment made to redeeming shareholders as a distribution for income tax purposes.
Capital accounts within the financial statements are adjusted for permanent book-tax differences. These adjustments have no impact on net assets or the results of operations. Temporary book-tax differences will reverse in a subsequent period.
Annual Report
3. Significant Accounting Policies - continued
Income Tax Information and Distributions to Shareholders - continued
Book-tax differences are primarily due to foreign currency transactions, deferred trustee compensation, and losses deferred due to wash sales.
The tax-basis components of distributable earnings and the federal tax cost as of period end were as follows:
Unrealized appreciation | $ 3,217,539 | |
Unrealized depreciation | (418,826) | |
Net unrealized appreciation (depreciation) | 2,798,713 | |
Undistributed ordinary income | 72,548 | |
Undistributed long-term capital gain | 1,453,024 | |
| | |
Cost for federal income tax purposes | $ 16,078,394 | |
The tax character of distributions paid was as follows:
| July 31, 2007 | July 31, 2006 |
Ordinary Income | $ 110,618 | $ 120,771 |
Long-term Capital Gains | 430,992 | - |
Total | $ 541,610 | $ 120,771 |
New Accounting Pronouncements. In July 2006, Financial Accounting Standards Board Interpretation No. 48, Accounting for Uncertainty in Income Taxes - an interpretation of FASB Statement 109 (FIN 48), was issued and is effective on the last business day of the semiannual reporting period for fiscal years beginning after December 15, 2006. FIN 48 sets forth a threshold for financial statement recognition, measurement and disclosure of a tax position taken or expected to be taken on a tax return. Management has concluded that the adoption of FIN 48 will not result in a material impact on the Fund's net assets, results of operations and financial statement disclosures.
In addition, in September 2006, Statement of Financial Accounting Standards No. 157, Fair Value Measurements (SFAS 157), was issued and is effective for fiscal years beginning after November 15, 2007. SFAS 157 defines fair value, establishes a framework for measuring fair value and expands disclosures about fair value measurements. Management is currently evaluating the impact the adoption of SFAS 157 will have on the Fund's financial statement disclosures.
Annual Report
Notes to Financial Statements - continued
(Amounts in thousands except ratios)
4. Operating Policies.
Repurchase Agreements. FMR has received an Exemptive Order from the Securities and Exchange Commission (the SEC) which permits the Fund and other affiliated entities of FMR to transfer uninvested cash balances into joint trading accounts which are then invested in repurchase agreements. The Fund may also invest directly with institutions in repurchase agreements. Repurchase agreements are collateralized by government or non-government securities. Upon settlement date, collateral is held in segregated accounts with custodian banks and may be obtained in the event of a default of the counterparty. The Fund monitors, on a daily basis, the value of the collateral to ensure it is at least equal to the principal amount of the repurchase agreement (including accrued interest). In the event of a default by the counterparty, realization of the collateral proceeds could be delayed, during which time the value of the collateral may decline.
5. Purchases and Sales of Investments.
Purchases and sales of securities, other than short-term securities, aggregated $17,124,099 and $20,833,224, respectively.
6. Fees and Other Transactions with Affiliates.
Management Fee. FMR and its affiliates provide the Fund with investment management related services for which the Fund pays a monthly management fee. The management fee is the sum of an individual fund fee rate that is based on an annual rate of .30% of the Fund's average net assets and a group fee rate that averaged ..26% during the period. The group fee rate is based upon the average net assets of all the mutual funds advised by FMR. The group fee rate decreases as assets under management increase and increases as assets under management decrease. In addition, the management fee is subject to a performance adjustment (up to a maximum of ± .20% of the Fund's average net assets over a 36 month performance period). The upward or downward adjustment to the management fee is based on the Fund's relative investment performance as compared to an appropriate benchmark index. For the period, the total annual management fee rate, including the performance adjustment, was .35% of the Fund's average net assets.
Transfer Agent Fees. Fidelity Service Company, Inc. (FSC), an affiliate of FMR, is the Fund's transfer, dividend disbursing and shareholder servicing agent. FSC receives account fees and asset-based fees that vary according to account size and type of account. FSC pays for typesetting, printing and mailing of shareholder reports, except proxy statements. For the period the transfer agent fees were equivalent to an annual rate of .24% of average net assets.
Annual Report
6. Fees and Other Transactions with Affiliates - continued
Accounting and Security Lending Fees. FSC maintains the Fund's accounting records. The accounting fee is based on the level of average net assets for the month. Under a separate contract, FSC administers the security lending program. The security lending fee is based on the number and duration of lending transactions.
Brokerage Commissions. The Fund placed a portion of its portfolio transactions with brokerage firms which are affiliates of the investment adviser. The commissions paid to these affiliated firms were $170 for the period.
Interfund Lending Program. Pursuant to an Exemptive Order issued by the SEC, the Fund, along with other registered investment companies having management contracts with FMR, may participate in an interfund lending program. This program provides an alternative credit facility allowing the funds to borrow from, or lend money to, other participating affiliated funds. At period end, there were no interfund loans outstanding. The Fund's activity in this program during the period for which loans were outstanding was as follows:
Borrower or Lender | Average Daily Loan Balance | Weighted Average Interest Rate | Interest Expense |
Borrower | $ 23,016 | 5.41% | $ 93 |
7. Committed Line of Credit.
The Fund participates with other funds managed by FMR in a $4.2 billion credit facility (the "line of credit") to be utilized for temporary or emergency purposes to fund shareholder redemptions or for other short-term liquidity purposes. The Fund has agreed to pay commitment fees on its pro rata portion of the line of credit, which amounted to $38 and is reflected in Miscellaneous Expense on the Statement of Operations. During the period, there were no borrowings on this line of credit.
8. Security Lending.
The Fund lends portfolio securities from time to time in order to earn additional income. On the settlement date of the loan, the Fund receives collateral (in the form of U.S. Treasury obligations, letters of credit and/or cash) against the loaned securities and maintains collateral in an amount not less than 100% of the market value of the loaned securities during the period of the loan. The market value of the loaned securities is determined at the close of business of the Fund and any additional required collateral is delivered to the Fund on the next business day. If the borrower defaults on its obligation to return the securities loaned because of insolvency or other reasons, a fund could
Annual Report
Notes to Financial Statements - continued
(Amounts in thousands except ratios)
8. Security Lending - continued
experience delays and costs in recovering the securities loaned or in gaining access to the collateral. Any cash collateral received is invested in the Fidelity Securities Lending Cash Central Fund. The value of loaned securities and cash collateral at period end are disclosed on the Fund's Statement of Assets and Liabilities. Security lending income represents the income earned on investing cash collateral, less fees and expenses associated with the loan, plus any premium payments that may be received on the loan of certain types of securities. Security lending income is presented in the Statement of Operations as a component of income from Fidelity Central Funds. Net income from lending portfolio securities during the period amounted to $3,337.
9. Expense Reductions.
Many of the brokers with whom FMR places trades on behalf of the Fund provided services to the Fund in addition to trade execution. These services included payments of certain expenses on behalf of the Fund totaling $461 for the period. In addition, through arrangements with the Fund's custodian and transfer agent, credits realized as a result of uninvested cash balances were used to reduce the Fund's expenses. During the period, these credits reduced the Fund's custody and transfer agent expenses by $36 and $1,707, respectively.
10. Other.
The Fund's organizational documents provide former and current trustees and officers with a limited indemnification against liabilities arising in connection with the performance of their duties to the Fund. In the normal course of business, the Fund may also enter into contracts that provide general indemnifications. The Fund's maximum exposure under these arrangements is unknown as this would be dependent on future claims that may be made against the Fund. The risk of material loss from such claims is considered remote.
The United States Securities and Exchange Commission ("SEC") is conducting an investigation of FMR (covering the years 2002 to 2004) arising from gifts, gratuities and business entertainment provided by certain brokers to certain individuals who were employed on FMR's domestic equity trading desk during that period. FMR is in discussions with the SEC staff regarding the possible resolution of the matter, but as of period-end no final resolution has been reached.
Annual Report
10. Other - continued
In December 2006, the Independent Trustees completed their own investigation of the matter with the assistance of independent counsel. The Independent Trustees and FMR agree that, despite the absence of proof that the Fidelity mutual funds experienced diminished execution quality as a result of the improper receipt of gifts and business entertainment, the conduct at issue was serious and is worthy of redress. Accordingly, the Independent Trustees have requested and FMR has agreed to pay $42 million to Fidelity mutual funds, plus interest to be determined at the time that payment is made. A method of allocating this payment among the funds has not yet been determined. The total payment to the Fund is not anticipated to have a material impact on the Fund's net assets. In addition, FMR reimbursed related legal expenses which are recorded in the accompanying Statement of Operations as an expense reduction.
Annual Report
Report of Independent Registered Public Accounting Firm
To the Trustees of Fidelity Securities Fund and Shareholders of Fidelity Blue Chip Growth Fund:
We have audited the accompanying statement of assets and liabilities of Fidelity Blue Chip Growth Fund (the Fund), a fund of Fidelity Securities Fund (the trust), including the schedule of investments as of July 31, 2007, and the related statement of operations for the year then ended, the statement of changes in net assets for each of the two years in the period then ended, and the financial highlights for each of the five years in the period then ended. These financial statements and financial highlights are the responsibility of the Fund's management. Our responsibility is to express an opinion on these financial statements and financial highlights based on our audits.
We conducted our audits in accordance with standards of the Public Company Accounting Oversight Board (United States). Those standards require that we plan and perform the audit to obtain reasonable assurance about whether the financial statements and financial highlights are free of material misstatement. The Fund is not required to have, nor were we engaged to perform, an audit of its internal control over financial reporting. Our audits included consideration of internal control over financial reporting as a basis for designing audit procedures that are appropriate in the circumstances, but not for the purpose of expressing an opinion on the effectiveness of the Fund's internal control over financial reporting. Accordingly, we express no such opinion. An audit also includes examining, on a test basis, evidence supporting the amounts and disclosures in the financial statements, assessing the accounting principles used and significant estimates made by management, as well as evaluating the overall financial statement presentation. Our procedures included confirmation of securities owned as of July 31, 2007, by correspondence with the custodians and brokers; where replies were not received from brokers, we performed other auditing procedures. We believe that our audits provide a reasonable basis for our opinion.
In our opinion, the financial statements and financial highlights referred to above present fairly, in all material respects, the financial position of Fidelity Blue Chip Growth Fund as of July 31, 2007, the results of its operations for the year then ended, the changes in its net assets for each of the two years in the period then ended, and its financial highlights for each of the five years in the period then ended, in conformity with accounting principles generally accepted in the United States of America.
/s/ Deloitte & Touche LLP
DELOITTE & TOUCHE LLP
Boston, Massachusetts
September 18, 2007
Annual Report
Trustees and Officers
The Trustees, Members of the Advisory Board, and executive officers of the trust and fund, as applicable, are listed below. The Board of Trustees governs the fund and is responsible for protecting the interests of shareholders. The Trustees are experienced executives who meet periodically throughout the year to oversee the fund's activities, review contractual arrangements with companies that provide services to the fund, and review the fund's performance. Except for James C. Curvey, each of the Trustees oversees 353 funds advised by FMR or an affiliate. Mr. Curvey oversees 317 funds advised by FMR or an affiliate.
The Trustees hold office without limit in time except that (a) any Trustee may resign; (b) any Trustee may be removed by written instrument, signed by at least two-thirds of the number of Trustees prior to such removal; (c) any Trustee who requests to be retired or who has become incapacitated by illness or injury may be retired by written instrument signed by a majority of the other Trustees; and (d) any Trustee may be removed at any special meeting of shareholders by a two-thirds vote of the outstanding voting securities of the trust. Each Trustee who is not an interested person (as defined in the 1940 Act) (Independent Trustee), shall retire not later than the last day of the calendar year in which his or her 72nd birthday occurs. The Independent Trustees may waive this mandatory retirement age policy with respect to individual Trustees. The executive officers and Advisory Board Members hold office without limit in time, except that any officer and Advisory Board Member may resign or may be removed by a vote of a majority of the Trustees at any regular meeting or any special meeting of the Trustees. Except as indicated, each individual has held the office shown or other offices in the same company for the past five years.
The fund's Statement of Additional Information (SAI) includes more information about the Trustees. To request a free copy, call Fidelity at 1-800-544-8544.
Interested Trustees*:
Correspondence intended for each Trustee who is an interested person may be sent to Fidelity Investments, 82 Devonshire Street, Boston, Massachusetts 02109.
Name, Age; Principal Occupation |
Edward C. Johnson 3d (77) |
| Year of Election or Appointment: 1984 Mr. Johnson is Chairman of the Board of Trustees. Mr. Johnson serves as President (2006-present), Chief Executive Officer, Chairman, and a Director of FMR Corp.; Chairman and a Director of FMR; Chairman and a Director of Fidelity Research & Analysis Company (FRAC); Chairman and a Director of Fidelity Investments Money Management, Inc.; and Chairman (2001-present) and a Director of FMR Co., Inc. In addition, Mr. Johnson serves as Chairman and Director of Fidelity International Limited (FIL). |
James C. Curvey (72) |
| Year of Election or Appointment: 2007 Mr. Curvey also serves as Trustee (2007-present) or Member of the Advisory Board (2007-present) of other investment companies advised by FMR. Mr. Curvey is Vice Chairman (2006-present) and Director of FMR Corp. Mr. Curvey joined Fidelity in 1982 and served in numerous senior management positions, including President and Chief Operating Officer of FMR Corp. (1997-2000) and President of Fidelity Strategic Investments (2000-2002). In addition, he serves as a member of the Board of Directors of Geerlings & Wade, Inc. (wine distribution). |
* Trustees have been determined to be "Interested Trustees" by virtue of, among other things, their affiliation with the trust or various entities under common control with FMR.
Independent Trustees:
Correspondence intended for each Independent Trustee (that is, the Trustees other than the Interested Trustees) may be sent to Fidelity Investments, P.O. Box 55235, Boston, Massachusetts 02205-5235.
Name, Age; Principal Occupation |
Dennis J. Dirks (59) |
| Year of Election or Appointment: 2005 Prior to his retirement in May 2003, Mr. Dirks was Chief Operating Officer and a member of the Board of The Depository Trust & Clearing Corporation (DTCC) (1999-2003). He also served as President, Chief Operating Officer, and Board member of The Depository Trust Company (DTC) (1999-2003) and President and Board member of the National Securities Clearing Corporation (NSCC) (1999-2003). In addition, Mr. Dirks served as Chief Executive Officer and Board member of the Government Securities Clearing Corporation (2001-2003) and Chief Executive Officer and Board member of the Mortgage-Backed Securities Clearing Corporation (2001-2003). Mr. Dirks also serves as a Trustee and a member of the Finance Committee of Manhattan College (2005-present) and a Trustee and a member of the Finance Committee of AHRC of Nassau County (2006-present). |
Albert R. Gamper, Jr. (65) |
| Year of Election or Appointment: 2006 Prior to his retirement in December 2004, Mr. Gamper served as Chairman of the Board of CIT Group Inc. (commercial finance). During his tenure with CIT Group Inc. Mr. Gamper served in numerous senior management positions, including Chairman (1987-1989; 1999-2001; 2002-2004), Chief Executive Officer (1987-2004), and President (1989-2002). He currently serves as a member of the Board of Directors of Public Service Enterprise Group (utilities, 2001-present), Chairman of the Board of Governors, Rutgers University (2004-present), and Chairman of the Board of Saint Barnabas Health Care System. |
George H. Heilmeier (71) |
| Year of Election or Appointment: 2004 Dr. Heilmeier is Chairman Emeritus of Telcordia Technologies (communication software and systems), where prior to his retirement, he served as company Chairman and Chief Executive Officer. He currently serves on the Boards of Directors of The Mitre Corporation (systems engineering and information technology support for the government), and HRL Laboratories (private research and development, 2004-present). He is Chairman of the General Motors Science & Technology Advisory Board and a Life Fellow of the Institute of Electrical and Electronics Engineers (IEEE). Dr. Heilmeier is a member of the Defense Science Board and the National Security Agency Advisory Board. He is also a member of the National Academy of Engineering, the American Academy of Arts and Sciences, and the Board of Overseers of the School of Engineering and Applied Science of the University of Pennsylvania. Previously, Dr. Heilmeier served as a Director of TRW Inc. (automotive, space, defense, and information technology, 1992-2002), Compaq (1994-2002), Automatic Data Processing, Inc. (ADP) (technology-based business outsourcing, 1995-2002), INET Technologies Inc. (telecommunications network surveillance, 2001-2004), and Teletech Holdings (customer management services). He is the recipient of the 2005 Kyoto Prize in Advanced Technology for his invention of the liquid crystal display, and a member of the Consumer Electronics Hall of Fame. |
James H. Keyes (66) |
| Year of Election or Appointment: 2007 Prior to his retirement in 2003, Mr. Keyes was Chairman, President, and Chief Executive Officer of Johnson Controls, Inc. (automotive supplier, 1993-2003). He currently serves as a member of the boards of LSI Logic Corporation (semiconductor technologies), Navistar International Corporation (manufacture and sale of trucks, buses, and diesel engines, 2002-present), and Pitney Bowes, Inc. (integrated mail, messaging, and document management solutions). |
Marie L. Knowles (60) |
| Year of Election or Appointment: 2001 Prior to Ms. Knowles' retirement in June 2000, she served as Executive Vice President and Chief Financial Officer of Atlantic Richfield Company (ARCO) (diversified energy, 1996-2000). From 1993 to 1996, she was a Senior Vice President of ARCO and President of ARCO Transportation Company. She served as a Director of ARCO from 1996 to 1998. She currently serves as a Director of Phelps Dodge Corporation (copper mining and manufacturing) and McKesson Corporation (healthcare service, 2002-present). Ms. Knowles is a Trustee of the Brookings Institution and the Catalina Island Conservancy and also serves as a member of the Advisory Board for the School of Engineering of the University of Southern California. |
Ned C. Lautenbach (63) |
| Year of Election or Appointment: 2000 Mr. Lautenbach is Chairman of the Independent Trustees (2006-present). Mr. Lautenbach has been a partner of Clayton, Dubilier & Rice, Inc. (private equity investment firm) since September 1998. Previously, Mr. Lautenbach was with the International Business Machines Corporation (IBM) from 1968 until his retirement in 1998. Mr. Lautenbach serves as a Director of Sony Corporation (2006-present) and Eaton Corporation (diversified industrial) as well as the Philharmonic Center for the Arts in Naples, Florida. He also is a member of the Board of Trustees of Fairfield University (2005-present), as well as a member of the Council on Foreign Relations. |
Cornelia M. Small (63) |
| Year of Election or Appointment: 2005 Ms. Small is a member (2000-present) and Chairperson (2002-present) of the Investment Committee, and a member (2002-present) of the Board of Trustees of Smith College. Previously, she served as Chief Investment Officer (1999-2000), Director of Global Equity Investments (1996-1999), and a member of the Board of Directors of Scudder, Stevens & Clark (1990-1997) and Scudder Kemper Investments (1997-1999). In addition, Ms. Small served as Co-Chair (2000-2003) of the Annual Fund for the Fletcher School of Law and Diplomacy. |
William S. Stavropoulos (68) |
| Year of Election or Appointment: 2002 Mr. Stavropoulos is Chairman Emeritus of the Board of Directors of The Dow Chemical Company. Since joining The Dow Chemical Company in 1967, Mr. Stavropoulos served in numerous senior management positions, including President (1993-2000; 2002-2003), CEO (1995-2000; 2002-2004), and Chairman of the Executive Committee (2000-2004). Currently, he is a Director of NCR Corporation (data warehousing and technology solutions), Chemical Financial Corporation, Maersk Inc. (industrial conglomerate, 2002-present), Tyco International, Inc. (multinational manufacturing and services, 2007-present), and a member of the Advisory Board for Metalmark Capital (private equity investment firm, 2005-present). He is a special advisor to Clayton, Dubilier & Rice, Inc., a private equity investment firm. He also serves as a member of the Board of Trustees of the American Enterprise Institute for Public Policy Research. In addition, Mr. Stavropoulos is a member of The Business Council, J.P. Morgan International Council and the University of Notre Dame Advisory Council for the College of Science. |
Kenneth L. Wolfe (68) |
| Year of Election or Appointment: 2005 Prior to his retirement in 2001, Mr. Wolfe was Chairman and Chief Executive Officer of Hershey Foods Corporation (1993-2001). He currently serves as a member of the boards of Adelphia Communications Corporation (2003-present), Bausch & Lomb, Inc., and Revlon Inc. (2004-present). |
Advisory Board Members and Executive Officers:
Correspondence intended for Mr. Mauriello may be sent to Fidelity Investments, P.O. Box 55235, Boston, Massachusetts 02205-5235. Correspondence intended for each executive officer and Mr. Lynch may be sent to Fidelity Investments, 82 Devonshire Street, Boston, Massachusetts 02109.
Name, Age; Principal Occupation |
Peter S. Lynch (63) |
| Year of Election or Appointment: 2003 Member of the Advisory Board of Fidelity Securities Fund. Mr. Lynch is Vice Chairman and a Director of FMR, and Vice Chairman (2001-present) and a Director of FMR Co., Inc. Previously, Mr. Lynch served as a Trustee of the Fidelity funds (1990-2003). In addition, he serves as a Trustee of Boston College and as the Chairman of the Inner-City Scholarship Fund. |
Joseph Mauriello (62) |
| Year of Election or Appointment: 2007 Member of the Advisory Board of Fidelity Securities Fund. Prior to his retirement in January 2006, Mr. Mauriello served in numerous senior management positions including Deputy Chairman and Chief Operating Officer (2004-2005), and Vice Chairman of Financial Services (2002-2004) of KPMG LLP US (professional services firm, 1965-2005). Mr. Mauriello currently serves as a member of the Board of Directors of XL Capital Ltd., (global insurance and re-insurance company, 2006-present) and of Arcadia Resources Inc., (health care services and products, 2007-present). He also served as a Director of the Hamilton Funds of the Bank of New York (2006-2007). |
Kimberley H. Monasterio (43) |
| Year of Election or Appointment: 2007 President and Treasurer of Blue Chip Growth. Ms. Monasterio also serves as President and Treasurer of other Fidelity funds (2007-present) and is an employee of FMR (2004-present). Previously, Ms. Monasterio served as Deputy Treasurer of the Fidelity funds (2004-2006). Before joining Fidelity Investments, Ms. Monasterio served as Treasurer (2000-2004) and Chief Financial Officer (2002-2004) of the Franklin Templeton Funds and Senior Vice President of Franklin Templeton Services, LLC (2000-2004). |
Dwight D. Churchill (53) |
| Year of Election or Appointment: 2005 Vice President of Blue Chip Growth. Mr. Churchill also serves as Vice President of certain Equity Funds (2005-present). Mr. Churchill is Executive Vice President of FMR (2005-present) and FMR Co., Inc. (2005-present). Previously, Mr. Churchill served as Senior Vice President of Fidelity Investments Money Management, Inc. (2005-2006), Head of Fidelity's Fixed-Income Division (2000-2005), Vice President of Fidelity's Money Market Funds (2000-2005), Vice President of Fidelity's Bond Funds, and Senior Vice President of FMR. |
Bruce T. Herring (41) |
| Year of Election or Appointment: 2006 Vice President of Blue Chip Growth. Mr. Herring also serves as Vice President of certain Equity Funds (2006-present). Mr. Herring is Senior Vice President of FMR (2006-present) and Vice President of FMR Co., Inc. (2001-present). Previously, Mr. Herring served as a portfolio manager for Fidelity U.S. Equity Funds (2001-2005). |
Jennifer Uhrig (46) |
| Year of Election or Appointment: 2006 Vice President of Blue Chip Growth. Prior to assuming her current responsibilities, Ms. Uhrig worked as a research analyst and portfolio manager. Ms. Uhrig also serves as Senior Vice President of FMR and Vice President of FMR Co., Inc. (2005). |
Eric D. Roiter (58) |
| Year of Election or Appointment: 1998 Secretary of Blue Chip Growth. He also serves as Secretary of other Fidelity funds; Vice President, General Counsel, and Secretary of FMR Co., Inc. (2001-present) and FMR; Assistant Secretary of Fidelity Management & Research (U.K.) Inc. (2001-present), Fidelity Research & Analysis Company (2001-present), and Fidelity Investments Money Management, Inc. (2001-present). Mr. Roiter is an Adjunct Member, Faculty of Law, at Boston College Law School (2003-present). Previously, Mr. Roiter served as Vice President and Secretary of Fidelity Distributors Corporation (FDC) (1998-2005). |
Scott C. Goebel (39) |
| Year of Election or Appointment: 2007 Assistant Secretary of Blue Chip Growth. Mr. Goebel also serves as Assistant Secretary of other Fidelity funds (2007-present), Vice President and Secretary of FDC (2006-present), and is an employee of FMR. |
R. Stephen Ganis (41) |
| Year of Election or Appointment: 2006 Anti-Money Laundering (AML) officer of Blue Chip Growth. Mr. Ganis also serves as AML officer of other Fidelity funds (2006-present) and FMR Corp. (2003-present). Before joining Fidelity Investments, Mr. Ganis practiced law at Goodwin Procter, LLP (2000-2002). |
Joseph B. Hollis (59) |
| Year of Election or Appointment: 2006 Chief Financial Officer of Blue Chip Growth. Mr. Hollis also serves as Chief Financial Officer of other Fidelity funds. Mr. Hollis is President of Fidelity Pricing and Cash Management Services (FPCMS) (2005-present). Mr. Hollis also serves as President and Director of Fidelity Service Company, Inc. (2006-present). Previously, Mr. Hollis served as Senior Vice President of Cash Management Services (1999-2002) and Investment Management Operations (2002-2005). |
Kenneth A. Rathgeber (60) |
| Year of Election or Appointment: 2004 Chief Compliance Officer of Blue Chip Growth. Mr. Rathgeber also serves as Chief Compliance Officer of other Fidelity funds (2004-present) and Executive Vice President of Risk Oversight for Fidelity Investments (2002-present). He is Chief Compliance Officer of FMR (2005-present), FMR Co., Inc. (2005-present), Fidelity Management & Research (U.K.) Inc. (2005-present), Fidelity Research & Analysis Company (2005-present), Fidelity Investments Money Management, Inc. (2005-present), and Strategic Advisers, Inc. (2005-present). Previously, Mr. Rathgeber served as Executive Vice President and Chief Operating Officer for Fidelity Investments Institutional Services Company, Inc. (1998-2002). |
Bryan A. Mehrmann (46) |
| Year of Election or Appointment: 2005 Deputy Treasurer of Blue Chip Growth. Mr. Mehrmann also serves as Deputy Treasurer of other Fidelity funds (2005-present) and is an employee of FMR. Previously, Mr. Mehrmann served as Vice President of Fidelity Investments Institutional Services Group (FIIS)/Fidelity Investments Institutional Operations Corporation, Inc. (FIIOC) Client Services (1998-2004). |
Kenneth B. Robins (37) |
| Year of Election or Appointment:2005 Deputy Treasurer of Blue Chip Growth. Mr. Robins also serves as Deputy Treasurer of other Fidelity funds (2005-present) and is an employee of FMR (2004-present). Before joining Fidelity Investments, Mr. Robins worked at KPMG LLP, where he was a partner in KPMG's department of professional practice (2002-2004) and a Senior Manager (1999-2000). In addition, Mr. Robins served as Assistant Chief Accountant, United States Securities and Exchange Commission (2000-2002). |
Robert G. Byrnes (40) |
| Year of Election or Appointment: 2005 Assistant Treasurer of Blue Chip Growth. Mr. Byrnes also serves as Assistant Treasurer of other Fidelity funds (2005-present) and is an employee of FMR (2005-present). Previously, Mr. Byrnes served as Vice President of FPCMS (2003-2005). Before joining Fidelity Investments, Mr. Byrnes worked at Deutsche Asset Management where he served as Vice President of the Investment Operations Group (2000-2003). |
Peter L. Lydecker (53) |
| Year of Election or Appointment: 2004 Assistant Treasurer of Blue Chip Growth. Mr. Lydecker also serves as Assistant Treasurer of other Fidelity funds (2004) and is an employee of FMR. |
Gary W. Ryan (48) |
| Year of Election or Appointment: 2005 Assistant Treasurer of Blue Chip Growth. Mr. Ryan also serves as Assistant Treasurer of other Fidelity funds (2005-present) and is an employee of FMR (2005-present). Previously, Mr. Ryan served as Vice President of Fund Reporting in FPCMS (1999-2005). |
Annual Report
Distributions
The Board of Trustees of Fidelity Blue Chip Growth Fund voted to pay on September 10, 2007, to shareholders of record at the opening of business on September 7, 2007, a distribution of $3.79 per share derived from capital gains realized from sales of portfolio securities and a dividend of $.19 per share from net investment income.
The fund hereby designates as a capital gain dividend with respect to the taxable year ended July 31, 2007, $1,492,425,000, or, if subsequently determined to be different, the net capital gain of such year.
The fund designates 100% of the dividends distributed during the fiscal year as qualifying for the dividends-received deduction for corporate shareholders.
The fund designates 100% of the dividends distributed during the fiscal year as amounts which may be taken into account as a dividend for the purposes of the maximum rate under section 1(h)(11) of the Internal Revenue Code.
The fund will notify shareholders in January 2008 of amounts for use in preparing 2007 income tax returns.
Annual Report
Board Approval of Investment Advisory Contracts and Management Fees
Fidelity Blue Chip Growth Fund
Each year, typically in July, the Board of Trustees, including the Independent Trustees (together, the Board), votes on the renewal of the management contract and sub-advisory agreements (together, the Advisory Contracts) for the fund. The Board, assisted by the advice of fund counsel and Independent Trustees' counsel, requests and considers a broad range of information throughout the year.
The Board meets regularly each month except August and takes into account throughout the year matters bearing on Advisory Contracts. The Board, acting directly and through its separate committees, considers at each of its meetings factors that are relevant to the annual renewal of the fund's Advisory Contracts, including the services and support provided to the fund and its shareholders. At the time of the renewal, the Board had 12 standing committees, each composed of Independent Trustees with varying backgrounds, to which the Board has assigned specific subject matter responsibilities in order to enhance effective decision-making by the Board. Each committee has adopted a written charter outlining the structure and purposes of the committee. One such committee, the Equity Contract Committee, meets periodically as needed throughout the year to consider matters specifically related to the annual renewal of Advisory Contracts. The committee requests and receives information on, and makes recommendations to the Independent Trustees concerning, the approval and annual review of the Advisory Contracts.
At its July 2007 meeting, the Board of Trustees, including the Independent Trustees, unanimously determined to renew the Advisory Contracts for the fund. In reaching its determination, the Board considered all factors it believed relevant, including (i) the nature, extent, and quality of the services to be provided to the fund and its shareholders (including the investment performance of the fund); (ii) the competitiveness of the management fee and total expenses of the fund; (iii) the total costs of the services to be provided by and the profits to be realized by the investment adviser and its affiliates from the relationship with the fund; (iv) the extent to which economies of scale would be realized as the fund grows; and (v) whether fee levels reflect these economies of scale, if any, for the benefit of fund shareholders. The Board also approved amendments to the fund's agreements with foreign sub-advisers to clarify that each sub-adviser provides services as an independent contractor.
In determining whether to renew the Advisory Contracts for the fund, the Board ultimately reached a determination, with the assistance of fund counsel and Independent Trustees' counsel, that the renewal of the Advisory Contracts and the compensation to be received by Fidelity under the management contract is consistent with Fidelity's fiduciary duty under applicable law. In addition to evaluating the specific factors noted above, the Board, in reaching its determination, is aware that shareholders in the fund have a broad range of investment choices available to them, including a wide choice among mutual funds offered by competitors to Fidelity, and that the fund's shareholders, with the opportunity to review and weigh the disclosure provided by the fund in its prospectus and other public disclosures, have chosen to invest in this fund, managed by Fidelity.
Annual Report
Board Approval of Investment Advisory Contracts and
Management Fees - continued
Nature, Extent, and Quality of Services Provided. The Board considered staffing within the investment adviser, FMR, and the sub-advisers (together, the Investment Advisers), including the background of the fund's portfolio manager and the fund's investment objective and discipline. The Independent Trustees also had discussions with senior management of Fidelity's investment operations and investment groups. The Board considered the structure of the portfolio manager compensation program and whether this structure provides appropriate incentives.
Resources Dedicated to Investment Management and Support Services. The Board reviewed the size, education, and experience of the Investment Advisers' investment staff, their use of technology, and the Investment Advisers' approach to recruiting, training, and retaining portfolio managers and other research, advisory, and management personnel. The Board considered Fidelity's extensive global research capabilities that enable the Investment Advisers to aggregate data from various sources in an effort to produce positive investment results. The Board noted that Fidelity's analysts have access to a variety of technological tools that enable them to perform both fundamental and quantitative analysis and to specialize in various disciplines. The Board also considered that Fidelity's portfolio managers and analysts have access to daily portfolio attribution that allows for monitoring of a fund's portfolio, as well as an electronic communication system that provides immediate real-time access to research concerning issuers and credit enhancers.
Shareholder and Administrative Services. The Board considered (i) the nature, extent, quality, and cost of advisory, administrative, distribution, and shareholder services performed by the Investment Advisers and their affiliates under the Advisory Contracts and under separate agreements covering transfer agency, pricing and bookkeeping, and securities lending services for the fund; (ii) the nature and extent of the Investment Advisers' supervision of third party service providers, principally custodians and subcustodians; and (iii) the resources devoted to, and the record of compliance with, the fund's compliance policies and procedures. The Board reviewed the allocation of fund brokerage, including allocations to brokers affiliated with the Investment Advisers, the use of brokerage commissions to pay fund expenses, and the use of "soft" commission dollars to pay for research services. The Board also considered that Fidelity voluntarily pays for market data out of its own resources. The Board also considered the agreement reached between the Independent Trustees and Fidelity in December 2006 following an independent review of matters relating to receipt of travel, entertainment, gifts and gratuities in violation of Fidelity policies.
The Board noted that the growth of fund assets across the complex allows Fidelity to reinvest in the development of services designed to enhance the value or convenience of the Fidelity funds as investment vehicles. These services include 24-hour access to account information and market information through phone representatives and over the Internet, and investor education materials and asset allocation tools.
Annual Report
Investment in a Large Fund Family. The Board considered the benefits to shareholders of investing in a Fidelity fund, including the benefits of investing in a fund that is part of a large family of funds offering a variety of investment disciplines and providing for a large variety of mutual fund investor services. For example, fund shareholders are offered the privilege of exchanging shares of the fund for shares of other Fidelity funds, as set forth in the fund's prospectus, without paying a sales charge. The Board noted that, since the last Advisory Contract renewals in July 2006, Fidelity has taken a number of actions that benefited particular funds, including (i) dedicating additional resources to investment research and to restructure the investment research teams; (ii) contractually agreeing to reduce the management fee on Fidelity Advisor Floating Rate High Income Fund; (iii) contractually agreeing to reduce the management fees on Fidelity's California, Massachusetts, New Jersey, and New York AMT Tax-Free Money Market Funds, launching new Institutional Classes and Service Classes of these funds, and contractually agreeing to impose expense limitations on these funds; (iv) eliminating the exchange fee on the Fidelity Select Portfolios and reducing the pricing and bookkeeping fee rates for these funds; (v) reducing the maximum transfer agency fee rates on high income funds and certain equity funds; (vi) proposing amended management contracts that, if approved by shareholders, will add a performance adjustment component to the management fees paid by 18 Fidelity Advisor equity funds; (vii) contractually agreeing to reduce fees for Ultra-Short Central Fund and the money market Central Funds; (viii) waiving the Fidelity Advisor funds' contingent deferred sales charge on certain redemptions made through systematic withdrawal programs; and (ix) amending the management contracts for equity and fixed-income funds whose management contracts incorporate a "group fee" structure by adding four new fee "breakpoints" to the group fee rate schedules.
Investment Performance and Compliance. The Board considered whether the fund has operated within its investment objective, as well as its record of compliance with its investment restrictions. It also reviewed the fund's absolute investment performance, as well as the fund's relative investment performance measured against (i) a broad-based securities market index, and (ii) a peer group of mutual funds deemed appropriate by the Board over multiple periods. The following charts considered by the Board show, over the one-, three-, and five-year periods ended December 31, 2006, the fund's cumulative total returns, the cumulative total returns of a broad-based securities market index ("benchmark"), and a range of cumulative total returns of a peer group of mutual funds identified by Morningstar, Inc. as having an investment style similar to that of the fund based on underlying portfolio holdings. The box within each chart shows the 25th percentile return (bottom of box) and the 75th percentile return (top of box) of the peer group. Returns shown above the box are in the first quartile and returns shown below the box are in the fourth quartile. The percentage beaten number noted below each chart corresponds to the percentile box and represents the percentage of funds in the peer group whose performance was equal to or lower than that of the fund.
Annual Report
Board Approval of Investment Advisory Contracts and
Management Fees - continued
Fidelity Blue Chip Growth Fund
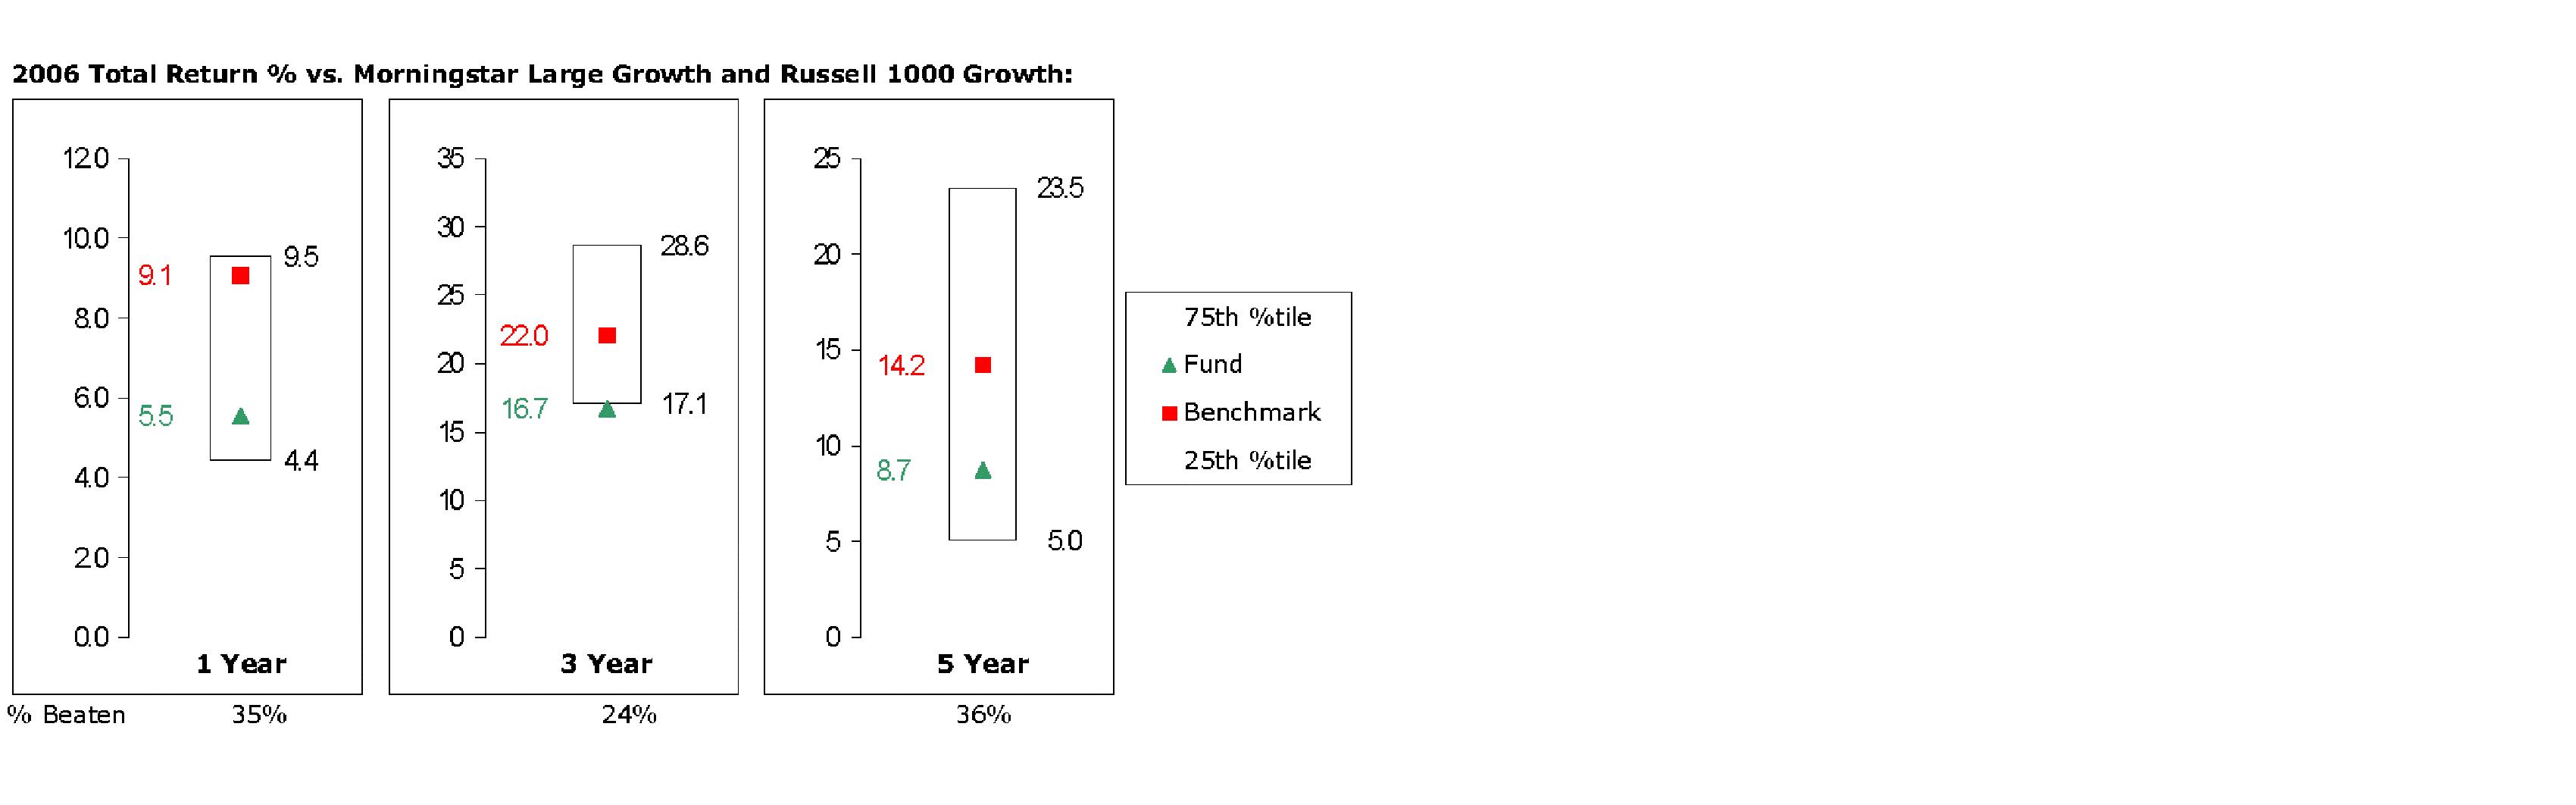
The Board reviewed the fund's relative investment performance against its peer group and stated that the performance of the fund was in the third quartile for the one- and five-year periods and the fourth quartile for the three-year period. The Board also stated that the investment performance of the fund was lower than its benchmark for all the periods shown. The Board discussed with FMR actions to be taken by FMR to improve the fund's disappointing performance relative to its peer group. The Board will continue to closely monitor the performance of the fund in the coming year.
The Board also considered that the fund's management fee is subject to upward or downward adjustment depending upon whether, and to what extent, the fund's investment performance for the performance period exceeds, or is exceeded by, the record (over the same period) of a Board-approved performance adjustment index. The Board realizes that the performance adjustment provides FMR with a strong economic incentive to seek to achieve superior performance for the fund's shareholders and helps to more closely align the interests of FMR and the fund's shareholders.
The Board considered that FMR has taken steps to refocus and strengthen equity research, equity portfolio management, and compliance.
Based on its review, and giving particular weight to the nature and quality of the resources dedicated by the Investment Advisers to maintain and improve relative performance, the Board concluded that the nature, extent, and quality of the services provided to the fund will benefit the fund's shareholders, particularly in light of the Board's view that the fund's shareholders benefit from investing in a fund that is part of a large family of funds offering a variety of investment disciplines and services.
Annual Report
Competitiveness of Management Fee and Total Fund Expenses. The Board considered the fund's management fee and total expenses compared to "mapped groups" of competitive funds and classes. Fidelity creates "mapped groups" by combining similar Lipper investment objective categories that have comparable management fee characteristics. Combining Lipper investment objective categories aids the Board's management fee and total expense comparisons by broadening the competitive group used for comparison and by reducing the number of universes to which various Fidelity funds are compared. The Board also considered supplemental information about how the fund's management fee and total expenses ranked relative to groups based on Lipper classifications, which take into account a fund's market capitalization and style.
The Board considered two proprietary management fee comparisons for the 12-month periods shown in the chart below. The group of Lipper funds used by the Board for management fee comparisons is referred to below as the "Total Mapped Group." The Total Mapped Group comparison focuses on a fund's standing relative to the total universe of comparable funds available to investors, in terms of gross management fees before expense reimbursements or caps, and without giving effect to the fund's performance adjustment. "TMG %" represents the percentage of funds in the Total Mapped Group that had management fees that were lower than the fund's. For example, a TMG % of 10% means that 90% of the funds in the Total Mapped Group had higher management fees than the fund. The "Asset-Size Peer Group" (ASPG) comparison focuses on a fund's standing relative to non-Fidelity funds similar in size to the fund within the Total Mapped Group. The ASPG represents at least 15% of the funds in the Total Mapped Group with comparable asset size and management fee characteristics, subject to a minimum of 50 funds (or all funds in the Total Mapped Group if fewer than 50). Additional information, such as the ASPG quartile in which the fund's management fee ranked and the impact of the fund's performance adjustment, is also included in the chart and considered by the Board.
Annual Report
Board Approval of Investment Advisory Contracts and
Management Fees - continued
Fidelity Blue Chip Growth Fund
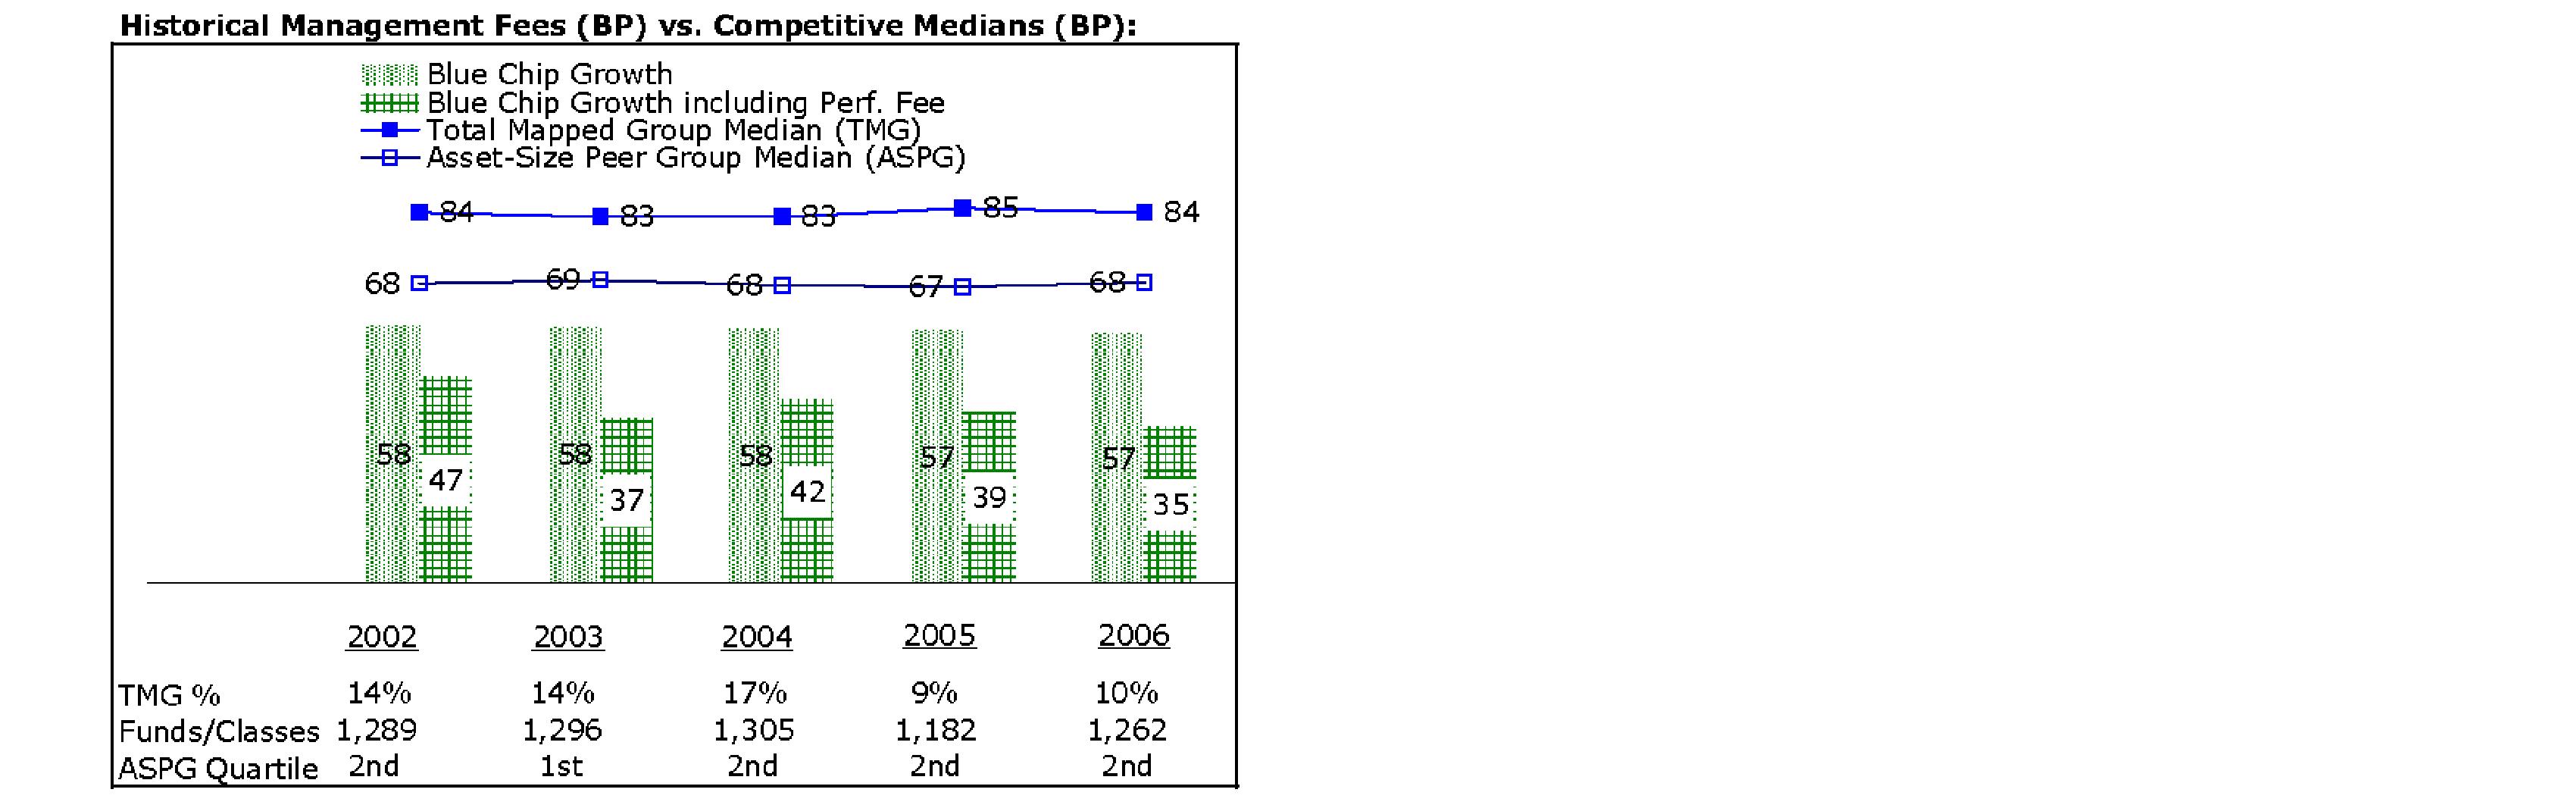
The Board noted that the fund's management fee ranked below the median of its Total Mapped Group and below the median of its ASPG for 2006. The Board also noted the effect of the fund's negative performance adjustment on the fund's management fee ranking. The Board noted that the performance adjustment for each year represents calculations for performance periods that differ from the periods shown in the performance charts above.
Furthermore, the Board considered that shareholders approved a prospective change in the index used to calculate the fund's performance adjustment beginning June 1, 2006. The Board also considered that, because the performance adjustment is based on a rolling 36-month measurement period, during a transition period the fund's performance is compared to a blended index return that reflects the performance of the former index for the portion of the measurement period prior to June 1, 2006 and the performance of the current index for the remainder of the measurement period. The Board noted that the fund's performance adjustment for 2006 shown in the chart above reflects the effect of using the blended index return to calculate the fund's performance adjustment.
In connection with the renewal of the fund's management contract, the Board also approved non-material amendments to the fund's management contract to clarify certain provisions regarding the calculation of the fund's performance adjustment.
Based on its review, the Board concluded that the fund's management fee was fair and reasonable in light of the services that the fund receives and the other factors considered.
Annual Report
In its review of the fund's total expenses, the Board considered the fund's management fee as well as other fund expenses, such as transfer agent fees, pricing and bookkeeping fees, and custodial, legal, and audit fees. The Board also noted the effects of any waivers and reimbursements on fees and expenses, as well as the fund's negative performance adjustment. As part of its review, the Board also considered current and historical total expenses of the fund compared to competitive fund median expenses. The fund is compared to those funds and classes in the Total Mapped Group (used by the Board for management fee comparisons) that have a similar sales load structure.
The Board noted that the fund's total expenses ranked below its competitive median for 2006.
In its review of total expenses, the Board also considered Fidelity fee structures and other information on clients that FMR and its affiliates service in other competitive markets, such as other mutual funds advised or subadvised by FMR or its affiliates, pension plan clients, and other institutional clients.
Based on its review, the Board concluded that the fund's total expenses were reasonable in light of the services that the fund and its shareholders receive and the other factors considered.
Costs of the Services and Profitability. The Board considered the revenues earned and the expenses incurred by Fidelity in conducting the business of developing, marketing, distributing, managing, administering and servicing the fund and its shareholders. The Board also considered the level of Fidelity's profits in respect of all the Fidelity funds.
On an annual basis, FMR presents to the Board Fidelity's profitability for the fund. Fidelity calculates the profitability for each fund, as well as aggregate profitability for groups of Fidelity funds and all Fidelity funds, using a series of detailed revenue and cost allocation methodologies which originate with the audited books and records of Fidelity. The Audit Committee of the Board reviews any significant changes from the prior year's methodologies.
PricewaterhouseCoopers LLP (PwC), independent registered public accounting firm and auditor to Fidelity and certain Fidelity funds, has been engaged annually by the Board as part of the Board's assessment of the results of Fidelity's profitability analysis. PwC's engagement includes the review and assessment of Fidelity's methodologies used in determining the revenues and expenses attributable to Fidelity's mutual fund business, and completion of agreed-upon procedures surrounding the mathematical accuracy of fund profitability and its conformity to allocation methodologies. After considering PwC's reports issued under the engagement and information provided by Fidelity, the Board believes that while other allocation methods may also be reasonable, Fidelity's profitability methodologies are reasonable in all material respects.
Annual Report
Board Approval of Investment Advisory Contracts and
Management Fees - continued
The Board has also reviewed Fidelity's non-fund businesses and any fall-out benefits related to the mutual fund business as well as cases where Fidelity's affiliates may benefit from or be related to the fund's business.
The Board considered the costs of the services provided by and the profits realized by Fidelity in connection with the operation of the fund and determined that the amount of profit is a fair entrepreneurial profit for the management of the fund.
Economies of Scale. The Board considered whether there have been economies of scale in respect of the management of the Fidelity funds, whether the Fidelity funds (including the fund) have appropriately benefited from any such economies of scale, and whether there is potential for realization of any further economies of scale. The Board considered the extent to which the fund will benefit from economies of scale through increased services to the fund, through waivers or reimbursements, or through fee or expense reductions, including reductions that occur through operation of the transfer agent agreement. The transfer agent fee varies in part based on the number of accounts in the fund. If the number of accounts decreases or the average account size increases, the overall transfer agent fee rate decreases.
The Board recognized that the fund's management contract incorporates a "group fee" structure, which provides for lower group fee rates as total fund assets under FMR's management increase, and for higher group fee rates as total fund assets under FMR's management decrease. FMR determines the group fee rates based on a tiered asset "breakpoint" schedule. In connection with the renewal of the fund's management contract, the Board approved amendments to the fund's management contract that added four new fee breakpoints to the group fee rate schedule for assets under FMR's management above $1,386 billion. The Board considered that the group fee rate declines under both the present and amended schedules, but that under the amended schedule, the group fee rate declines faster as assets under FMR's management exceed $1,386 billion. The Board considered that the group fee is designed to deliver the benefits of economies of scale to fund shareholders when total fund assets increase, even if assets of any particular fund are unchanged or have declined, because some portion of Fidelity's costs are attributable to services provided to all Fidelity funds, and all funds benefit if those costs can be allocated among more assets. The Board concluded that, given the group fee structure, fund shareholders will achieve a certain level of economies of scale as assets under FMR's management increase at the fund complex level, regardless of whether Fidelity achieves any such economies of scale.
The Board further concluded that any potential economies of scale are being shared between fund shareholders and Fidelity in an appropriate manner.
Additional Information Requested by the Board. In order to develop fully the factual basis for consideration of the Fidelity funds' Advisory Contracts, the Board requested and received additional information on several topics, including (i) fund performance trends and actions to be taken by FMR to improve certain funds' overall performance; (ii) Fidelity's portfolio manager compensation structure, including its effects on fund profitability and the extent to which portfolio manager compensation is linked to fund performance; (iii) Fidelity's fee structures; (iv) the funds' sub-advisory arrangements; and (v) accounts managed by Fidelity other than the Fidelity funds.
Annual Report
Based on its evaluation of all of the conclusions noted above, and after considering all material factors, the Board ultimately concluded that the advisory fee structures are fair and reasonable, and that the fund's Advisory Contracts should be renewed.
Annual Report
Managing Your Investments
Fidelity offers several ways to conveniently manage your personal investments via your telephone or PC. You can access your account information, conduct trades and research your investments 24 hours a day.
By Phone
Fidelity Automated Service Telephone provides a single toll-free number to access account balances, positions, quotes and trading. It's easy to navigate the service, and on your first call, the system will help you create a personal identification number (PIN) for security.
(phone_graphic)
Fidelity Automated
Service Telephone (FAST®)
1-800-544-5555
Press
1 For mutual fund and brokerage trading.
2 For quotes.*
3 For account balances and holdings.
4 To review orders and mutual
fund activity.
5 To change your PIN.
*0 To speak to a Fidelity representative.
By PC
Fidelity's web site on the Internet provides a wide range of information, including daily financial news, fund performance, interactive planning tools and news about Fidelity products and services.
(computer_graphic)
Fidelity's Web Site
www.fidelity.com
* When you call the quotes line, please remember that a fund's yield and return will vary and, except for money market funds, share price will also vary. This means that you may have a gain or loss when you sell your shares. There is no assurance that money market funds will be able to maintain a stable $1 share price; an investment in a money market fund is not insured or guaranteed by the U.S. government. Total returns are historical and include changes in share price, reinvestment of dividends and capital gains, and the effects of any sales charges.
Annual Report
To Write Fidelity
We'll give your correspondence immediate attention and send you written confirmation upon completion of your request.
(letter_graphic)
Making Changes
To Your Account
(such as changing name, address, bank, etc.)
Fidelity Investments
P.O. Box 770001
Cincinnati, OH 45277-0002
(letter_graphic)
For Non-Retirement
Accounts
Buying shares
Fidelity Investments
P.O. Box 770001
Cincinnati, OH 45277-0003
Overnight Express
Fidelity Investments
Attn: Distribution Services
100 Crosby Parkway - KC1H
Covington, KY 41015
Selling shares
Fidelity Investments
P.O. Box 770001
Cincinnati, OH 45277-0035
Overnight Express
Fidelity Investments
Attn: Distribution Services
100 Crosby Parkway - KC1H
Covington, KY 41015
General Correspondence
Fidelity Investments
P.O. Box 500
Merrimack, NH 03054-0500
(letter_graphic)
For Retirement
Accounts
Buying shares
Fidelity Investments
P.O. Box 770001
Cincinnati, OH 45277-0003
Selling shares
Fidelity Investments
P.O. Box 770001
Cincinnati, OH 45277-0035
Overnight Express
Fidelity Investments
Attn: Distribution Services
100 Crosby Parkway - KC1H
Covington, KY 41015
General Correspondence
Fidelity Investments
P.O. Box 500
Merrimack, NH 03054-0500
Annual Report
To Visit Fidelity
For directions and hours,
please call 1-800-544-9797.
Arizona
7001 West Ray Road
Chandler, AZ
15445 N. Scottsdale Road
Scottsdale, AZ
California
815 East Birch Street
Brea, CA
1411 Chapin Avenue
Burlingame, CA
851 East Hamilton Avenue
Campbell, CA
19200 Von Karman Avenue
Irvine, CA
601 Larkspur Landing Circle
Larkspur, CA
10100 Santa Monica Blvd.
Los Angeles, CA
27101 Puerta Real
Mission Viejo, CA
73-575 El Paseo
Palm Desert, CA
251 University Avenue
Palo Alto, CA
123 South Lake Avenue
Pasadena, CA
16995 Bernardo Ctr. Drive
Rancho Bernardo, CA
1220 Roseville Parkway
Roseville, CA
1740 Arden Way
Sacramento, CA
7676 Hazard Center Drive
San Diego, CA
11943 El Camino Real
San Diego, CA
8 Montgomery Street
San Francisco, CA
3793 State Street
Santa Barbara, CA
1200 Wilshire Boulevard
Santa Monica, CA
21701 Hawthorne Boulevard
Torrance, CA
2001 North Main Street
Walnut Creek, CA
6300 Canoga Avenue
Woodland Hills, CA
Colorado
1625 Broadway
Denver, CO
9185 Westview Road
Lone Tree, CO
Connecticut
48 West Putnam Avenue
Greenwich, CT
265 Church Street
New Haven, CT
300 Atlantic Street
Stamford, CT
29 South Main Street
West Hartford, CT
Delaware
400 Delaware Avenue
Wilmington, DE
Florida
4400 N. Federal Highway
Boca Raton, FL
121 Alhambra Plaza
Coral Gables, FL
2948 N. Federal Highway
Ft. Lauderdale, FL
4671 Town Center Parkway
Jacksonville, FL
1907 West State Road 434
Longwood, FL
8880 Tamiami Trail, North
Naples, FL
3501 PGA Boulevard
Palm Beach Gardens, FL
3550 Tamiami Trail, South
Sarasota, FL
1502 N. Westshore Blvd.
Tampa, FL
2465 State Road 7
Wellington, FL
Georgia
3445 Peachtree Road, N.E.
Atlanta, GA
1000 Abernathy Road
Atlanta, GA
Illinois
One North LaSalle Street
Chicago, IL
875 North Michigan Ave.
Chicago, IL
1415 West 22nd Street
Oak Brook, IL
1572 East Golf Road
Schaumburg, IL
3232 Lake Avenue
Wilmette, IL
Indiana
4729 East 82nd Street
Indianapolis, IN
Kansas
5400 College Boulevard
Overland Park, KS
Maine
Three Canal Plaza
Portland, ME
Maryland
7315 Wisconsin Avenue
Bethesda, MD
One W. Pennsylvania Ave.
Towson, MD
Massachusetts
801 Boylston Street
Boston, MA
155 Congress Street
Boston, MA
300 Granite Street
Braintree, MA
44 Mall Road
Burlington, MA
238 Main Street
Cambridge, MA
405 Cochituate Road
Framingham, MA
416 Belmont Street
Worcester, MA
Annual Report
Michigan
500 E. Eisenhower Pkwy.
Ann Arbor, MI
280 Old N. Woodward Ave.
Birmingham, MI
43420 Grand River Avenue
Novi, MI
29155 Northwestern Hwy.
Southfield, MI
Minnesota
7600 France Avenue South
Edina, MN
Missouri
1524 South Lindbergh Blvd.
St. Louis, MO
Nevada
2225 Village Walk Drive
Henderson, NV
New Jersey
150 Essex Street
Millburn, NJ
56 South Street
Morristown, NJ
396 Route 17, North
Paramus, NJ
3518 Route 1 North
Princeton, NJ
530 Broad Street
Shrewsbury, NJ
New York
1055 Franklin Avenue
Garden City, NY
37 West Jericho Turnpike
Huntington Station, NY
1271 Avenue of the Americas
New York, NY
980 Madison Avenue
New York, NY
61 Broadway
New York, NY
350 Park Avenue
New York, NY
200 Fifth Avenue
New York, NY
733 Third Avenue
New York, NY
11 Penn Plaza
New York, NY
2070 Broadway
New York, NY
1075 Northern Blvd.
Roslyn, NY
799 Central Park Avenue
Scarsdale, NY
North Carolina
4611 Sharon Road
Charlotte, NC
7011 Fayetteville Road
Durham, NC
Ohio
3805 Edwards Road
Cincinnati, OH
1324 Polaris Parkway
Columbus, OH
28699 Chagrin Boulevard
Woodmere Village, OH
Oregon
7493 SW Bridgeport Road
Tigard, OR
Pennsylvania
600 West DeKalb Pike
King of Prussia, PA
1735 Market Street
Philadelphia, PA
12001 Perry Highway
Wexford, PA
Rhode Island
47 Providence Place
Providence, RI
Tennessee
6150 Poplar Avenue
Memphis, TN
Texas
10000 Research Boulevard
Austin, TX
4001 Northwest Parkway
Dallas, TX
12532 Memorial Drive
Houston, TX
2701 Drexel Drive
Houston, TX
6560 Fannin Street
Houston, TX
6500 N. MacArthur Blvd.
Irving, TX
6005 West Park Boulevard
Plano, TX
14100 San Pedro
San Antonio, TX
1576 East Southlake Blvd.
Southlake, TX
19740 IH 45 North
Spring, TX
Utah
279 West South Temple
Salt Lake City, UT
Virginia
1861 International Drive
McLean, VA
Washington
411 108th Avenue, N.E.
Bellevue, WA
1518 6th Avenue
Seattle, WA
Washington, DC
1900 K Street, N.W.
Washington, DC
Wisconsin
595 North Barker Road
Brookfield, WI
Fidelity Brokerage Services, Inc., 100 Summer St., Boston, MA 02110 Member NYSE/SIPC
Annual Report
Annual Report
Annual Report
Investment Adviser
Fidelity Management & Research Company
Boston, MA
Investment Sub-Advisers
FMR Co., Inc.
Fidelity Research & Analysis Company
Fidelity Management & Research
(U.K.) Inc.
Fidelity Investments Japan Limited
Fidelity International Investment
Advisors
Fidelity International Investment
Advisors (U.K.) Limited
General Distributor
Fidelity Distributors Corporation
Boston, MA
Transfer and Service Agent
Fidelity Service Company, Inc.
Boston, MA
Custodian
Citibank, N.A.
New York, NY
The Fidelity Telephone Connection
Mutual Fund 24-Hour Service
Exchanges/Redemptions
and Account Assistance 1-800-544-6666
Product Information 1-800-544-6666
Retirement Accounts 1-800-544-4774
(8 a.m. - 9 p.m.)
TDD Service 1-800-544-0118
for the deaf and hearing impaired
(9 a.m. - 9 p.m. Eastern time)
Fidelity Automated Service
Telephone (FAST®) (automated graphic) 1-800-544-5555
(automated graphic) Automated line for quickest service
BCF-UANN-0907
1.789244.104
(Fidelity Investment logo)(registered trademark)
Corporate Headquarters
82 Devonshire St., Boston, MA 02109
www.fidelity.com
Fidelity®
Blue Chip Value
Fund
Annual Report
July 31, 2007
(2_fidelity_logos) (Registered_Trademark)
Contents
Chairman's Message | <Click Here> | Ned Johnson's message to shareholders. |
Performance | <Click Here> | How the fund has done over time. |
Management's Discussion | <Click Here> | The manager's review of fund performance, strategy and outlook. |
Shareholder Expense Example | <Click Here> | An example of shareholder expenses. |
Investment Changes | <Click Here> | A summary of major shifts in the fund's investments over the past 6 months. |
Investments | <Click Here> | A complete list of the fund's investments with their market values. |
Financial Statements | <Click Here> | Statements of assets and liabilities, operations, and changes in net assets,
as well as financial highlights. |
Notes | <Click Here> | Notes to the financial statements. |
Report of Independent Registered Public Accounting Firm | <Click Here> | |
Trustees and Officers | <Click Here> | |
Distributions | <Click Here> | |
Board Approval of Investment Advisory Contracts and Management Fees | <Click Here> | |
To view a fund's proxy voting guidelines and proxy voting record for the 12-month period ended June 30, visit http://www.fidelity.com (search for "proxy voting guidelines") or visit the Securities and Exchange Commission's (SEC) web site at http://www.sec.gov. You may also call 1-800-544-8544 to request a free copy of the proxy voting guidelines.
Standard & Poor's, S&P and S&P 500 are registered service marks of The McGraw-Hill Companies, Inc. and have been licensed for use by Fidelity Distributors Corporation.
Other third party marks appearing herein are the property of their respective owners.
All other marks appearing herein are registered or unregistered trademarks or service marks of FMR Corp. or an affiliated company.
Annual Report
This report and the financial statements contained herein are submitted for the general information of the shareholders of the fund. This report is not authorized for distribution to prospective investors in the fund unless preceded or accompanied by an effective prospectus.
A fund files its complete schedule of portfolio holdings with the SEC for the first and third quarters of each fiscal year on Form N-Q. Forms N-Q are available on the SEC's web site at http://www.sec.gov. A fund's Forms N-Q may be reviewed and copied at the SEC's Public Reference Room in Washington, DC. Information regarding the operation of the SEC's Public Reference Room may be obtained by calling 1-800-SEC-0330. For a complete list of a fund's portfolio holdings, view the most recent holdings listing, semiannual report, or annual report on Fidelity's web site at http://www.fidelity.com or http://www.advisor.fidelity.com, as applicable.
NOT FDIC INSURED · MAY LOSE VALUE · NO BANK GUARANTEE
Neither the fund nor Fidelity Distributors Corporation is a bank.
Annual Report
Chairman's Message
(photo_of_Edward_C_Johnson_3d)
Dear Shareholder:
Stocks are currently on pace to register their fifth straight year of positive returns, although gains could be trimmed if the U.S. economy continues to slow. While financial markets are always unpredictable, there are a number of time-tested principles that can put the historical odds in your favor.
One of the basic tenets is to invest for the long term. Over time, riding out the markets' inevitable ups and downs has proven much more effective than selling into panic or chasing the hottest trend. Even missing only a few of the markets' best days can significantly diminish investor returns. Patience also affords the benefits of compounding - of earning interest on additional income or reinvested dividends and capital gains. There are tax advantages and cost benefits to consider as well. The more you sell, the more taxes you pay, and the more you trade, the higher the costs. While staying the course doesn't eliminate risk, it can considerably lessen the effect of short-term declines.
You can further manage your investing risk through diversification. And today, more than ever, geographic diversification should be taken into account. Studies indicate that asset allocation is the single most important determinant of a portfolio's long-term success. The right mix of stocks, bonds and cash - aligned to your particular risk tolerance and investment objective - is very important. Age-appropriate rebalancing is also an essential aspect of asset allocation. For younger investors, an emphasis on equities - which historically have been the best-performing asset class over time - is encouraged. As investors near their specific goal, such as retirement or sending a child to college, consideration may be given to replacing volatile assets (e.g. common stocks) with more-stable fixed investments (bonds or savings plans).
A third investment principle - investing regularly - can help lower the average cost of your purchases. Investing a certain amount of money each month or quarter helps ensure you won't pay for all your shares at market highs. This strategy - known as dollar cost averaging - also reduces unconstructive "emotion" from investing, helping shareholders avoid selling weak performers just prior to an upswing, or chasing a hot performer just before a correction.
We invite you to contact us via the Internet, through our Investor Centers or over the phone. It is our privilege to provide you the information you need to make the investments that are right for you.
Sincerely,
/s/Edward C. Johnson 3d
Edward C. Johnson 3d
Annual Report
Performance: The Bottom Line
Average annual total return reflects the change in the value of an investment, assuming reinvestment of the fund's dividend income and capital gains (the profits earned upon the sale of securities that have grown in value) and assuming a constant rate of performance each year. The $10,000 table and the fund's returns do not reflect the deduction of taxes that a shareholder would pay on fund distributions or the redemption of fund shares. During periods of reimbursement by Fidelity, a fund's total return will be greater than it would be had the reimbursement not occurred. How a fund did yesterday is no guarantee of how it will do tomorrow.
Average Annual Total Returns
Periods ended July 31, 2007 | Past 1
year | Life of
FundA |
Fidelity® Blue Chip Value Fund | 16.60% | 13.69% |
A From June 17, 2003.
$10,000 Over Life of Fund
Let's say hypothetically that $10,000 was invested in Fidelity® Blue Chip Value Fund on June 17, 2003, when the fund started. The chart shows how the value of your investment would have changed, and also shows how the Russell 1000® Value Index performed over the same period.

Annual Report
Management's Discussion of Fund Performance
Comments from Charles Hebard, Portfolio Manager of Fidelity® Blue Chip Value Fund
Major U.S. equity benchmarks approached or exceeded gains of 20% and several set record highs during the 12-month period ending July 31, 2007. In that time, the Dow Jones Industrial AverageSM rose 20.84%, the Standard & Poor's 500SM Index advanced 16.13% and the NASDAQ Composite® Index gained 22.67%. The small-cap Russell 2000® Index fared less well after falling nearly 7% in July, but still returned 12.12% for the year overall. The first half of the period featured six consecutive months of positive returns spurred by the more relaxed monetary policy of the Federal Reserve Board and falling energy prices, which softened inflationary pressures on the U.S. economy. Stocks slipped in February, however, as energy prices crept higher, the housing market slumped, subprime mortgage woes mounted and the Chinese stock market declined 9% in a single day. But equities soared again from March through May, as reflected by the Dow and the S&P 500®, which climbed nearly 12% and more than 9%, respectively. In June and July, though, stocks sank again on inflation concerns and a worsening subprime loan crisis.
The fund was up 16.60% during the past year, solidly outperforming the 13.47% return of the Russell 1000® Value Index. Financials and energy were the two largest concentrations in both the fund and the benchmark, and our positioning in both sectors aided results. A strong showing from our holdings in consumer staples and utilities also helped, while our choices within consumer discretionary detracted from performance. In terms of individual stocks, oil-field services firms National Oilwell Varco and Smith International - a non-index holding - were top contributors. Both companies continued to beat Wall Street analysts' earnings expectations, and I think the market finally gained confidence that their strong performance could be sustainable. Honeywell International was another holding that benefited from beating earnings expectations. Overweighting integrated oil giant ConocoPhillips helped as the firm's stock price appreciated nicely. Stock selection in financials was fruitful, as I underweighted some of the weaker stocks in the group, including banking firm Wells Fargo. Conversely, underweighting index components Chevron and Exxon Mobil hurt results when those integrated oil companies posted solid gains. KB Home, a homebuilder, detracted because the outlook for the housing market deteriorated further and the stock retreated. Gold producer Newmont Mining stumbled as operating costs rose while gold prices appreciated less than a number of other commodities during the period. Some stocks mentioned in this discussion were not held at period end.
The views expressed above reflect those of the portfolio manager only through the end of the period as stated on the cover of this report and do not necessarily represent the views of Fidelity or any other person in the Fidelity organization. Any such views are subject to change at any time based upon market or other conditions and Fidelity disclaims any responsibility to update such views. These views may not be relied on as investment advice and, because investment decisions for a Fidelity fund are based on numerous factors, may not be relied on as an indication of trading intent on behalf of any Fidelity fund.
Annual Report
Shareholder Expense Example
As a shareholder of the Fund, you incur two types of costs: (1) transaction costs, and (2) ongoing costs, including management fees and other Fund expenses. This Example is intended to help you understand your ongoing costs (in dollars) of investing in the Fund and to compare these costs with the ongoing costs of investing in other mutual funds.
The Example is based on an investment of $1,000 invested at the beginning of the period and held for the entire period (February 1, 2007 to July 31, 2007).
Actual Expenses
The first line of the accompanying table provides information about actual account values and actual expenses. You may use the information in this line, together with the amount you invested, to estimate the expenses that you paid over the period. Simply divide your account value by $1,000.00 (for example, an $8,600 account value divided by $1,000.00 = 8.6), then multiply the result by the number in the first line under the heading entitled "Expenses Paid During Period" to estimate the expenses you paid on your account during this period. A small balance maintenance fee of $12.00 that is charged once a year may apply for certain accounts with a value of less than $2,000. This fee is not included in the table below. If it was, the estimate of expenses you paid during the period would be higher, and your ending account value lower, by this amount. In addition, the Fund, as a shareholder in the underlying Fidelity Central Funds, will indirectly bear its pro rata share of the fees and expenses incurred by the underlying Fidelity Central Funds. These fees and expenses are not included in the Fund's annualized expense ratio used to calculate the expense estimate in the table below.
Hypothetical Example for Comparison Purposes
The second line of the accompanying table provides information about hypothetical account values and hypothetical expenses based on the Fund's actual expense ratio and an assumed rate of return of 5% per year before expenses, which is not the Fund's actual return. The hypothetical account values and expenses may not be used to estimate the actual ending account balance or expenses you paid for the period. You may use this information to compare the ongoing costs of investing in the Fund and other funds. To do so, compare this 5% hypothetical example with the 5% hypothetical examples that appear in the shareholder reports of the other funds. A small balance maintenance fee of $12.00 that is charged once a year may apply for certain accounts with a value of less than $2,000. This fee is not included in the table below. If it was, the estimate of expenses you paid during the period would be higher, and your ending account value lower, by this amount. In addition, the Fund, as a shareholder in the underlying Fidelity Central Funds, will indirectly bear its pro rata share of the fees and expenses incurred by the underlying Fidelity Central Funds. These fees and expenses are not included in the Fund's annualized expense ratio used to calculate the expense estimate in the table below.
Please note that the expenses shown in the table are meant to highlight your ongoing costs only and do not reflect any transaction costs. Therefore, the second line of the table is useful in comparing ongoing costs only, and will not help you determine the relative total costs of owning different funds.
Annual Report
Shareholder Expense Example - continued
| Beginning
Account Value
February 1, 2007 | Ending
Account Value
July 31, 2007 | Expenses Paid
During Period*
February 1, 2007
to July 31, 2007 |
Actual | $ 1,000.00 | $ 1,028.60 | $ 4.38 |
Hypothetical (5% return per year before expenses) | $ 1,000.00 | $ 1,020.48 | $ 4.36 |
* Expenses are equal to the Fund's annualized expense ratio of .87%; multiplied by the average account value over the period, multiplied by 181/365 (to reflect the one-half year period).
Annual Report
Investment Changes
Top Ten Stocks as of July 31, 2007 |
| % of fund's
net assets | % of fund's net assets
6 months ago |
AT&T, Inc. | 5.0 | 4.3 |
Bank of America Corp. | 4.6 | 3.7 |
Citigroup, Inc. | 4.2 | 0.0 |
ConocoPhillips | 4.2 | 1.8 |
American International Group, Inc. | 3.5 | 3.3 |
General Electric Co. | 3.2 | 3.3 |
JPMorgan Chase & Co. | 2.6 | 2.7 |
Exxon Mobil Corp. | 2.5 | 1.8 |
Procter & Gamble Co. | 2.1 | 0.0 |
Merck & Co., Inc. | 1.6 | 1.6 |
| 33.5 | |
Top Five Market Sectors as of July 31, 2007 |
| % of fund's
net assets | % of fund's net assets
6 months ago |
Financials | 31.3 | 32.0 |
Energy | 15.9 | 15.4 |
Industrials | 10.3 | 10.5 |
Consumer Discretionary | 7.8 | 7.7 |
Consumer Staples | 7.3 | 7.3 |
Asset Allocation (% of fund's net assets) |
As of July 31, 2007 * | As of January 31, 2007 ** |
| Stocks 99.6% | | | Stocks 99.5% | |
| Short-Term
Investments and
Net Other Assets 0.4% | | | Short-Term
Investments and
Net Other Assets 0.5% | |
*Foreign investments | 12.8% | | **Foreign investments | 14.7% | |

Annual Report
Investments July 31, 2007
Showing Percentage of Net Assets
Common Stocks - 99.6% |
| Shares | | Value |
CONSUMER DISCRETIONARY - 7.8% |
Automobiles - 0.6% |
General Motors Corp. | 73,800 | | $ 2,391,120 |
Renault SA | 14,200 | | 2,080,237 |
| | 4,471,357 |
Diversified Consumer Services - 0.2% |
H&R Block, Inc. | 72,000 | | 1,436,400 |
Hotels, Restaurants & Leisure - 0.3% |
McDonald's Corp. | 48,600 | | 2,326,482 |
Household Durables - 2.0% |
Bassett Furniture Industries, Inc. | 39,800 | | 520,186 |
Beazer Homes USA, Inc. | 62,100 | | 868,779 |
D.R. Horton, Inc. | 107,450 | | 1,753,584 |
KB Home (d) | 182,400 | | 5,802,144 |
M.D.C. Holdings, Inc. (d) | 51,700 | | 2,378,200 |
Standard Pacific Corp. | 131,838 | | 1,952,521 |
Whirlpool Corp. | 15,200 | | 1,552,072 |
| | 14,827,486 |
Leisure Equipment & Products - 0.5% |
Brunswick Corp. | 46,700 | | 1,305,732 |
Eastman Kodak Co. | 73,500 | | 1,855,875 |
| | 3,161,607 |
Media - 2.0% |
Comcast Corp. Class A (special) (non-vtg.) | 66,550 | | 1,741,614 |
Getty Images, Inc. (a) | 34,200 | | 1,536,606 |
Live Nation, Inc. (a) | 12,100 | | 240,306 |
News Corp. Class A | 126,500 | | 2,671,680 |
Regal Entertainment Group Class A | 90,600 | | 1,937,934 |
Time Warner, Inc. | 343,800 | | 6,621,588 |
| | 14,749,728 |
Multiline Retail - 0.6% |
Retail Ventures, Inc. (a) | 69,100 | | 899,682 |
Sears Holdings Corp. (a) | 24,100 | | 3,296,639 |
Tuesday Morning Corp. | 28,400 | | 331,144 |
| | 4,527,465 |
Specialty Retail - 1.3% |
Christopher & Banks Corp. | 67,400 | | 1,005,608 |
Home Depot, Inc. | 51,200 | | 1,903,104 |
PETsMART, Inc. | 41,000 | | 1,325,530 |
Staples, Inc. | 68,600 | | 1,579,172 |
Common Stocks - continued |
| Shares | | Value |
CONSUMER DISCRETIONARY - continued |
Specialty Retail - continued |
TJX Companies, Inc. | 65,500 | | $ 1,817,625 |
Williams-Sonoma, Inc. | 61,300 | | 1,887,427 |
| | 9,518,466 |
Textiles, Apparel & Luxury Goods - 0.3% |
Liz Claiborne, Inc. | 56,100 | | 1,971,354 |
TOTAL CONSUMER DISCRETIONARY | | 56,990,345 |
CONSUMER STAPLES - 7.3% |
Food & Staples Retailing - 0.8% |
Rite Aid Corp. (a) | 327,300 | | 1,803,423 |
Wal-Mart Stores, Inc. | 56,100 | | 2,577,795 |
Winn-Dixie Stores, Inc. (a) | 69,762 | | 1,863,343 |
| | 6,244,561 |
Food Products - 2.2% |
Cermaq ASA | 94,400 | | 1,757,206 |
Chiquita Brands International, Inc. | 84,900 | | 1,490,844 |
Marine Harvest ASA (a)(d) | 2,175,000 | | 2,750,094 |
Nestle SA (Reg.) | 18,284 | | 7,057,639 |
Ralcorp Holdings, Inc. (a) | 23,700 | | 1,231,452 |
Tyson Foods, Inc. Class A | 82,100 | | 1,748,730 |
| | 16,035,965 |
Household Products - 2.3% |
Central Garden & Pet Co. Class A (non-vtg.) (a) | 125,300 | | 1,533,672 |
Procter & Gamble Co. | 249,200 | | 15,415,512 |
| | 16,949,184 |
Tobacco - 2.0% |
Altria Group, Inc. | 94,900 | | 6,308,003 |
British American Tobacco PLC sponsored ADR | 123,700 | | 8,051,633 |
| | 14,359,636 |
TOTAL CONSUMER STAPLES | | 53,589,346 |
ENERGY - 15.9% |
Energy Equipment & Services - 3.3% |
Hanover Compressor Co. (a) | 51,800 | | 1,234,394 |
National Oilwell Varco, Inc. (a) | 79,657 | | 9,567,602 |
Common Stocks - continued |
| Shares | | Value |
ENERGY - continued |
Energy Equipment & Services - continued |
Smith International, Inc. | 143,000 | | $ 8,781,630 |
Transocean, Inc. (a) | 38,900 | | 4,179,805 |
| | 23,763,431 |
Oil, Gas & Consumable Fuels - 12.6% |
Chesapeake Energy Corp. | 58,700 | | 1,998,148 |
ConocoPhillips | 382,700 | | 30,937,468 |
CONSOL Energy, Inc. | 76,800 | | 3,198,720 |
EnCana Corp. | 33,000 | | 2,020,156 |
EOG Resources, Inc. | 95,300 | | 6,680,530 |
EXCO Resources, Inc. (a) | 83,600 | | 1,459,656 |
Exxon Mobil Corp. | 217,800 | | 18,541,314 |
Occidental Petroleum Corp. | 140,200 | | 7,952,144 |
Quicksilver Resources, Inc. (a) | 53,650 | | 2,259,738 |
Suncor Energy, Inc. | 31,800 | | 2,875,326 |
Ultra Petroleum Corp. (a) | 97,200 | | 5,374,188 |
Uranium One, Inc. (a) | 85,700 | | 993,821 |
Valero Energy Corp. | 117,000 | | 7,840,170 |
| | 92,131,379 |
TOTAL ENERGY | | 115,894,810 |
FINANCIALS - 31.3% |
Capital Markets - 4.5% |
Ares Capital Corp. | 84,900 | | 1,323,591 |
Bear Stearns Companies, Inc. | 24,700 | | 2,994,134 |
Charles Schwab Corp. | 62,032 | | 1,248,704 |
Julius Baer Holding AG (Bearer) | 27,992 | | 1,982,621 |
KKR Private Equity Investors, LP | 116,179 | | 2,370,052 |
KKR Private Equity Investors, LP Restricted Depositary Units (e) | 7,700 | | 157,080 |
Lehman Brothers Holdings, Inc. | 44,700 | | 2,771,400 |
Merrill Lynch & Co., Inc. | 59,500 | | 4,414,900 |
Morgan Stanley | 90,100 | | 5,754,687 |
Nomura Holdings, Inc. | 51,500 | | 976,955 |
State Street Corp. | 100,944 | | 6,766,276 |
T. Rowe Price Group, Inc. | 37,000 | | 1,928,810 |
| | 32,689,210 |
Commercial Banks - 2.6% |
Associated Banc-Corp. | 51,037 | | 1,466,803 |
Commerce Bancorp, Inc. | 73,700 | | 2,465,265 |
HSBC Holdings PLC sponsored ADR | 32,400 | | 3,018,384 |
Common Stocks - continued |
| Shares | | Value |
FINANCIALS - continued |
Commercial Banks - continued |
Mizuho Financial Group, Inc. | 173 | | $ 1,218,458 |
Siam City Bank PCL NVDR | 2,289,200 | | 1,327,661 |
Unicredito Italiano SpA | 219,300 | | 1,882,397 |
Wachovia Corp. | 158,042 | | 7,461,163 |
| | 18,840,131 |
Consumer Finance - 0.2% |
Discover Financial Services (a) | 57,500 | | 1,325,375 |
Diversified Financial Services - 11.4% |
Bank of America Corp. | 701,816 | | 33,280,115 |
Citigroup, Inc. | 665,200 | | 30,978,364 |
JPMorgan Chase & Co. | 440,052 | | 19,366,689 |
| | 83,625,168 |
Insurance - 8.1% |
ACE Ltd. | 115,680 | | 6,677,050 |
AFLAC, Inc. | 37,700 | | 1,964,924 |
American International Group, Inc. | 401,800 | | 25,787,524 |
Argonaut Group, Inc. | 66,300 | | 1,825,239 |
Assurant, Inc. | 39,400 | | 1,998,368 |
Everest Re Group Ltd. | 22,800 | | 2,240,100 |
Hartford Financial Services Group, Inc. | 54,700 | | 5,025,289 |
IPC Holdings Ltd. | 146,232 | | 3,628,016 |
Max Capital Group Ltd. | 87,591 | | 2,287,001 |
Montpelier Re Holdings Ltd. | 127,100 | | 2,014,535 |
Platinum Underwriters Holdings Ltd. | 97,870 | | 3,249,284 |
Principal Financial Group, Inc. | 41,100 | | 2,317,629 |
| | 59,014,959 |
Real Estate Investment Trusts - 1.1% |
Alexandria Real Estate Equities, Inc. | 21,800 | | 1,877,634 |
Annaly Capital Management, Inc. | 126,200 | | 1,823,590 |
Developers Diversified Realty Corp. | 23,400 | | 1,123,200 |
Duke Realty LP | 29,300 | | 957,817 |
General Growth Properties, Inc. | 28,800 | | 1,381,824 |
Home Properties, Inc. | 29,000 | | 1,342,700 |
| | 8,506,765 |
Real Estate Management & Development - 0.1% |
CB Richard Ellis Group, Inc. Class A (a) | 31,600 | | 1,103,472 |
Thrifts & Mortgage Finance - 3.3% |
BankUnited Financial Corp. Class A | 97,347 | | 1,639,323 |
Countrywide Financial Corp. | 134,700 | | 3,794,499 |
Common Stocks - continued |
| Shares | | Value |
FINANCIALS - continued |
Thrifts & Mortgage Finance - continued |
Fannie Mae | 141,740 | | $ 8,481,722 |
FirstFed Financial Corp., Delaware (a) | 25,400 | | 1,148,080 |
Hudson City Bancorp, Inc. | 136,500 | | 1,668,030 |
New York Community Bancorp, Inc. (d) | 112,500 | | 1,825,875 |
People's United Financial, Inc. | 99,900 | | 1,610,388 |
Radian Group, Inc. | 53,600 | | 1,806,856 |
Washington Federal, Inc. | 86,336 | | 1,945,150 |
| | 23,919,923 |
TOTAL FINANCIALS | | 229,025,003 |
HEALTH CARE - 6.1% |
Biotechnology - 1.4% |
Amgen, Inc. (a) | 141,800 | | 7,620,332 |
Biogen Idec, Inc. (a) | 24,300 | | 1,373,922 |
Cephalon, Inc. (a) | 20,200 | | 1,517,828 |
| | 10,512,082 |
Health Care Equipment & Supplies - 1.0% |
Becton, Dickinson & Co. | 34,100 | | 2,603,876 |
C.R. Bard, Inc. | 23,900 | | 1,875,433 |
Covidien Ltd. (a) | 59,585 | | 2,440,006 |
| | 6,919,315 |
Health Care Providers & Services - 0.3% |
Brookdale Senior Living, Inc. | 52,700 | | 2,108,527 |
Life Sciences Tools & Services - 0.2% |
Thermo Fisher Scientific, Inc. (a) | 29,600 | | 1,545,416 |
Pharmaceuticals - 3.2% |
Endo Pharmaceuticals Holdings, Inc. (a) | 50,600 | | 1,720,906 |
Johnson & Johnson | 110,000 | | 6,655,000 |
Merck & Co., Inc. | 231,200 | | 11,479,080 |
MGI Pharma, Inc. (a) | 79,400 | | 1,987,382 |
Wyeth | 31,200 | | 1,513,824 |
| | 23,356,192 |
TOTAL HEALTH CARE | | 44,441,532 |
INDUSTRIALS - 10.3% |
Aerospace & Defense - 3.2% |
General Dynamics Corp. | 90,500 | | 7,109,680 |
Honeywell International, Inc. | 107,760 | | 6,197,278 |
Common Stocks - continued |
| Shares | | Value |
INDUSTRIALS - continued |
Aerospace & Defense - continued |
Raytheon Co. | 43,500 | | $ 2,408,160 |
United Technologies Corp. | 110,200 | | 8,041,294 |
| | 23,756,412 |
Air Freight & Logistics - 0.4% |
United Parcel Service, Inc. Class B | 38,300 | | 2,900,076 |
Airlines - 0.3% |
Delta Air Lines, Inc. (a) | 60,900 | | 1,085,238 |
US Airways Group, Inc. (a) | 26,200 | | 812,462 |
| | 1,897,700 |
Building Products - 0.2% |
Masco Corp. | 43,800 | | 1,191,798 |
Commercial Services & Supplies - 0.8% |
Allied Waste Industries, Inc. (a) | 201,400 | | 2,592,018 |
Robert Half International, Inc. | 45,100 | | 1,532,949 |
The Brink's Co. | 31,900 | | 1,950,685 |
| | 6,075,652 |
Construction & Engineering - 0.4% |
Fluor Corp. | 26,900 | | 3,107,219 |
Electrical Equipment - 0.2% |
SolarWorld AG | 34,600 | | 1,684,532 |
Industrial Conglomerates - 3.9% |
General Electric Co. | 600,350 | | 23,269,566 |
Siemens AG sponsored ADR | 25,900 | | 3,279,717 |
Tyco International Ltd. | 44,785 | | 2,117,883 |
| | 28,667,166 |
Machinery - 0.6% |
Bucyrus International, Inc. Class A | 31,400 | | 1,995,784 |
Oshkosh Truck Co. | 37,700 | | 2,158,325 |
| | 4,154,109 |
Road & Rail - 0.3% |
Ryder System, Inc. | 36,200 | | 1,968,194 |
TOTAL INDUSTRIALS | | 75,402,858 |
INFORMATION TECHNOLOGY - 6.6% |
Communications Equipment - 1.0% |
Alcatel-Lucent SA sponsored ADR | 110,900 | | 1,286,440 |
Common Stocks - continued |
| Shares | | Value |
INFORMATION TECHNOLOGY - continued |
Communications Equipment - continued |
Comverse Technology, Inc. (a) | 68,700 | | $ 1,323,849 |
Motorola, Inc. | 254,100 | | 4,317,159 |
| | 6,927,448 |
Computers & Peripherals - 2.8% |
Hewlett-Packard Co. | 191,800 | | 8,828,554 |
International Business Machines Corp. | 44,500 | | 4,923,925 |
NCR Corp. (a) | 40,100 | | 2,094,022 |
Seagate Technology | 75,500 | | 1,775,005 |
Sun Microsystems, Inc. (a) | 546,900 | | 2,789,190 |
| | 20,410,696 |
Electronic Equipment & Instruments - 1.0% |
Agilent Technologies, Inc. (a) | 54,200 | | 2,067,730 |
Amphenol Corp. Class A | 9,400 | | 322,044 |
Flextronics International Ltd. (a) | 138,100 | | 1,542,577 |
Motech Industries, Inc. | 121,000 | | 1,512,085 |
Tyco Electronics Ltd. (a) | 59,585 | | 2,134,335 |
| | 7,578,771 |
Internet Software & Services - 0.2% |
VeriSign, Inc. (a) | 50,000 | | 1,484,500 |
IT Services - 0.5% |
Infosys Technologies Ltd. sponsored ADR | 11,100 | | 550,560 |
The Western Union Co. | 88,600 | | 1,767,570 |
Unisys Corp. (a) | 203,200 | | 1,643,888 |
| | 3,962,018 |
Semiconductors & Semiconductor Equipment - 1.1% |
Advanced Micro Devices, Inc. (a) | 125,800 | | 1,703,332 |
Analog Devices, Inc. | 33,800 | | 1,198,210 |
Applied Materials, Inc. | 69,000 | | 1,520,760 |
Intel Corp. | 114,600 | | 2,706,852 |
ON Semiconductor Corp. (a) | 23,100 | | 273,042 |
Volterra Semiconductor Corp. (a) | 56,900 | | 653,781 |
| | 8,055,977 |
TOTAL INFORMATION TECHNOLOGY | | 48,419,410 |
MATERIALS - 2.8% |
Chemicals - 0.9% |
Agrium, Inc. | 61,900 | | 2,602,620 |
Chemtura Corp. | 93,500 | | 975,205 |
Common Stocks - continued |
| Shares | | Value |
MATERIALS - continued |
Chemicals - continued |
Dyno Nobel Ltd. | 604,400 | | $ 1,107,335 |
Ecolab, Inc. | 41,900 | | 1,764,409 |
| | 6,449,569 |
Metals & Mining - 1.9% |
Alcoa, Inc. | 73,800 | | 2,819,160 |
Arcelor Mittal | 36,700 | | 2,239,434 |
Carpenter Technology Corp. | 15,900 | | 1,887,171 |
Freeport-McMoRan Copper & Gold, Inc. Class B | 38,100 | | 3,580,638 |
Meridian Gold, Inc. (a) | 73,200 | | 2,066,437 |
Reliance Steel & Aluminum Co. | 28,000 | | 1,471,120 |
| | 14,063,960 |
TOTAL MATERIALS | | 20,513,529 |
TELECOMMUNICATION SERVICES - 6.9% |
Diversified Telecommunication Services - 6.5% |
AT&T, Inc. | 930,410 | | 36,434,853 |
Cincinnati Bell, Inc. | 308,800 | | 1,593,408 |
Verizon Communications, Inc. | 224,500 | | 9,568,190 |
| | 47,596,451 |
Wireless Telecommunication Services - 0.4% |
American Tower Corp. Class A (a) | 35,200 | | 1,466,432 |
Sprint Nextel Corp. | 80,300 | | 1,648,559 |
| | 3,114,991 |
TOTAL TELECOMMUNICATION SERVICES | | 50,711,442 |
UTILITIES - 4.6% |
Electric Utilities - 1.8% |
E.ON AG sponsored ADR | 32,100 | | 1,679,793 |
Entergy Corp. | 51,900 | | 5,187,924 |
PPL Corp. | 82,400 | | 3,884,336 |
Reliant Energy, Inc. (a) | 105,500 | | 2,709,240 |
| | 13,461,293 |
Independent Power Producers & Energy Traders - 1.6% |
AES Corp. (a) | 104,300 | | 2,049,495 |
Constellation Energy Group, Inc. | 78,700 | | 6,595,060 |
NRG Energy, Inc. (a) | 71,300 | | 2,748,615 |
| | 11,393,170 |
Common Stocks - continued |
| Shares | | Value |
UTILITIES - continued |
Multi-Utilities - 1.2% |
CMS Energy Corp. | 62,300 | | $ 1,006,768 |
Public Service Enterprise Group, Inc. | 69,100 | | 5,952,965 |
Sempra Energy | 37,200 | | 1,961,184 |
| | 8,920,917 |
TOTAL UTILITIES | | 33,775,380 |
TOTAL COMMON STOCKS (Cost $696,539,669) | 728,763,655 |
Money Market Funds - 2.8% |
| | | |
Fidelity Cash Central Fund, 5.38% (b) | 11,970,920 | | 11,970,920 |
Fidelity Securities Lending Cash Central Fund, 5.39% (b)(c) | 8,162,050 | | 8,162,050 |
TOTAL MONEY MARKET FUNDS (Cost $20,132,970) | 20,132,970 |
TOTAL INVESTMENT PORTFOLIO - 102.4% (Cost $716,672,639) | | 748,896,625 |
NET OTHER ASSETS - (2.4)% | | (17,545,143) |
NET ASSETS - 100% | $ 731,351,482 |
Legend |
(a) Non-income producing |
(b) Affiliated fund that is available only to investment companies and other accounts managed by Fidelity Investments. The rate quoted is the annualized seven-day yield of the fund at period end. A complete unaudited listing of the fund's holdings as of its most recent quarter end is available upon request. |
(c) Investment made with cash collateral received from securities on loan. |
(d) Security or a portion of the security is on loan at period end. |
(e) Security exempt from registration under Rule 144A of the Securities Act of 1933. These securities may be resold in transactions exempt from registration, normally to qualified institutional buyers. At the end of the period, the value of these securities amounted to $157,080 or 0.0% of net assets. |
Affiliated Central Funds |
Information regarding fiscal year to date income earned by the Fund from investments in Fidelity Central Funds is as follows: |
Fund | Income earned |
Fidelity Cash Central Fund | $ 425,339 |
Fidelity Securities Lending Cash Central Fund | 22,197 |
Total | $ 447,536 |
Other Information |
Distribution of investments by country of issue, as a percentage of total net assets, is as follows: |
United States of America | 87.2% |
Bermuda | 2.7% |
Canada | 2.2% |
United Kingdom | 1.8% |
Switzerland | 1.3% |
Cayman Islands | 1.1% |
Others (individually less than 1%) | 3.7% |
| 100.0% |
See accompanying notes which are an integral part of the financial statements.
Annual Report
Financial Statements
Statement of Assets and Liabilities
| July 31, 2007 |
| | |
Assets | | |
Investment in securities, at value (including securities loaned of $7,991,447) - See accompanying schedule: Unaffiliated issuers (cost $696,539,669) | $ 728,763,655 | |
Fidelity Central Funds (cost $20,132,970) | 20,132,970 | |
Total Investments (cost $716,672,639) | | $ 748,896,625 |
Receivable for investments sold | | 2,648,312 |
Receivable for fund shares sold | | 3,452,699 |
Dividends receivable | | 906,344 |
Distributions receivable from Fidelity Central Funds | | 38,107 |
Prepaid expenses | | 507 |
Other receivables | | 3,588 |
Total assets | | 755,946,182 |
| | |
Liabilities | | |
Payable for investments purchased | $ 14,546,468 | |
Payable for fund shares redeemed | 1,310,957 | |
Accrued management fee | 347,596 | |
Other affiliated payables | 175,264 | |
Other payables and accrued expenses | 52,365 | |
Collateral on securities loaned, at value | 8,162,050 | |
Total liabilities | | 24,594,700 |
| | |
Net Assets | | $ 731,351,482 |
Net Assets consist of: | | |
Paid in capital | | $ 667,020,678 |
Undistributed net investment income | | 4,072,223 |
Accumulated undistributed net realized gain (loss) on investments and foreign currency transactions | | 28,033,996 |
Net unrealized appreciation (depreciation) on investments and assets and liabilities in foreign currencies | | 32,224,585 |
Net Assets, for 47,315,384 shares outstanding | | $ 731,351,482 |
Net Asset Value, offering price and redemption price per share ($731,351,482 ÷ 47,315,384 shares) | | $ 15.46 |
See accompanying notes which are an integral part of the financial statements.
Annual Report
Statement of Operations
| Year ended July 31, 2007 |
| | |
Investment Income | | |
Dividends | | $ 9,509,586 |
Interest | | 9,801 |
Income from Fidelity Central Funds | | 447,536 |
Total income | | 9,966,923 |
| | |
Expenses | | |
Management fee
Basic fee | $ 2,649,519 | |
Performance adjustment | (188,994) | |
Transfer agent fees | 1,238,205 | |
Accounting and security lending fees | 176,291 | |
Custodian fees and expenses | 50,615 | |
Independent trustees' compensation | 1,357 | |
Registration fees | 99,968 | |
Audit | 52,637 | |
Legal | 6,051 | |
Interest | 21,926 | |
Miscellaneous | 8,020 | |
Total expenses before reductions | 4,115,595 | |
Expense reductions | (32,566) | 4,083,029 |
Net investment income (loss) | | 5,883,894 |
Realized and Unrealized Gain (Loss) Net realized gain (loss) on: | | |
Investment securities: | | |
Unaffiliated issuers (net of foreign taxes of $91) | 35,685,355 | |
Foreign currency transactions | 87,351 | |
Total net realized gain (loss) | | 35,772,706 |
Change in net unrealized appreciation (depreciation) on: Investment securities | 5,245,598 | |
Assets and liabilities in foreign currencies | 315 | |
Total change in net unrealized appreciation (depreciation) | | 5,245,913 |
Net gain (loss) | | 41,018,619 |
Net increase (decrease) in net assets resulting from operations | | $ 46,902,513 |
See accompanying notes which are an integral part of the financial statements.
Annual Report
Financial Statements - continued
Statement of Changes in Net Assets
| Year ended
July 31,
2007 | Year ended
July 31,
2006 |
Increase (Decrease) in Net Assets | | |
Operations | | |
Net investment income (loss) | $ 5,883,894 | $ 1,770,397 |
Net realized gain (loss) | 35,772,706 | 8,883,622 |
Change in net unrealized appreciation (depreciation) | 5,245,913 | 4,671,035 |
Net increase (decrease) in net assets resulting
from operations | 46,902,513 | 15,325,054 |
Distributions to shareholders from net investment income | (2,803,432) | (1,177,122) |
Distributions to shareholders from net realized gain | (12,620,941) | (3,435,206) |
Total distributions | (15,424,373) | (4,612,328) |
Share transactions
Proceeds from sales of shares | 640,676,434 | 153,895,657 |
Reinvestment of distributions | 14,852,830 | 4,472,639 |
Cost of shares redeemed | (228,357,433) | (78,450,120) |
Net increase (decrease) in net assets resulting from share transactions | 427,171,831 | 79,918,176 |
Total increase (decrease) in net assets | 458,649,971 | 90,630,902 |
| | |
Net Assets | | |
Beginning of period | 272,701,511 | 182,070,609 |
End of period (including undistributed net investment income of $4,072,223 and undistributed net investment income of $1,126,551, respectively) | $ 731,351,482 | $ 272,701,511 |
Other Information Shares | | |
Sold | 41,940,771 | 11,169,831 |
Issued in reinvestment of distributions | 1,040,054 | 332,759 |
Redeemed | (15,217,485) | (5,729,799) |
Net increase (decrease) | 27,763,340 | 5,772,791 |
See accompanying notes which are an integral part of the financial statements.
Annual Report
Financial Highlights
Years ended July 31, | 2007 | 2006 | 2005 | 2004 | 2003 G |
Selected Per-Share Data | | | | | |
Net asset value,
beginning of period | $ 13.95 | $ 13.21 | $ 11.24 | $ 9.73 | $ 10.00 |
Income from Investment Operations | | | | | |
Net investment income (loss) D | .19 | .10 | .11 | .05 | - I |
Net realized and
unrealized gain (loss) | 2.05 | .95 | 2.03 | 1.52 | (.27) |
Total from investment
operations | 2.24 | 1.05 | 2.14 | 1.57 | (.27) |
Distributions from
net investment income | (.13) | (.08) | (.09) | (.02) | - |
Distributions from net realized gain | (.60) | (.23) | (.08) | (.04) | - |
Total distributions | (.73) | (.31) | (.17) | (.06) | - |
Net asset value, end of period | $ 15.46 | $ 13.95 | $ 13.21 | $ 11.24 | $ 9.73 |
Total Return B, C | 16.60% | 8.05% | 19.20% | 16.16% | (2.70)% |
Ratios to Average Net Assets E, H | | | | | |
Expenses before reductions | .87% | .94% | .97% | 1.17% | 3.37%A |
Expenses net of fee waivers,
if any | .87% | .94% | .97% | 1.17% | 1.50%A |
Expenses net of all reductions | .87% | .93% | .93% | 1.13% | 1.50%A |
Net investment income (loss) | 1.25% | .76% | .85% | .50% | .41%A |
Supplemental Data | | | | | |
Net assets, end of period
(000 omitted) | $ 731,351 | $ 272,702 | $ 182,071 | $ 68,541 | $ 18,582 |
Portfolio turnover rate F | 92% | 74% | 81% | 111% | 84%A |
A Annualized
B Total returns for periods of less than one year are not annualized.
C Total returns would have been lower had certain expenses not been reduced during the periods shown.
D Calculated based on average shares outstanding during the period.
E Fees and expenses of the underlying Fidelity Central Funds are not included in the Fund's expense ratio. The Fund indirectly bears its proportionate share of the expenses of any underlying Fidelity Central Funds.
F Amount does not include the portfolio activity of any underlying Fidelity Central Funds.
G For the period June 17, 2003 (commencement of operations) to July 31, 2003.
H Expense ratios reflect operating expenses of the Fund. Expenses before reductions do not reflect amounts reimbursed by the investment adviser or reductions from brokerage service arrangements or other expense offset arrangements and do not represent the amount paid by the Fund during periods when reimbursements or reductions occur. Expense ratios before reductions for start-up periods may not be representative of longer term operating periods. Expenses net of fee waivers reflect expenses after reimbursement by the investment adviser but prior to reductions from brokerage service arrangements or other expense offset arrangements. Expenses net of all reductions represent the net expenses paid by the Fund.
I Amount represents less than $.01 per share.
See accompanying notes which are an integral part of the financial statements.
Annual Report
Notes to Financial Statements
For the period ended July 31, 2007
1. Organization.
Fidelity Blue Chip Value Fund (the Fund) is a fund of Fidelity Securities Fund (the trust) and is authorized to issue an unlimited number of shares. The trust is registered under the Investment Company Act of 1940, as amended (the 1940 Act), as an open-end management investment company organized as a Massachusetts business trust.
2. Investments in Fidelity Central Funds.
The Fund may invest in Fidelity Central Funds which are open-end investment companies available only to other investment companies and accounts managed by Fidelity Management & Research Company (FMR) and its affiliates. The Fund's Schedule of Investments lists each of the Fidelity Central Funds as an investment of the Fund, but does not include the underlying holdings of each Fidelity Central Fund. As an Investing Fund, the Fund indirectly bears its proportionate share of the expenses of the underlying Fidelity Central Funds. The Money Market Central Funds seek preservation of capital and current income and are managed by Fidelity Investments Money Management, Inc. (FIMM), an affiliate of FMR.
A complete list of holdings for each Fidelity Central Fund is available upon request or at the SEC's web site at www.sec.gov. In addition, the financial statements of the Fidelity Central Funds, which are not covered by the Fund's Report of Independent Registered Public Accounting Firm, are available on the SEC's web site or upon request.
3. Significant Accounting Policies.
The financial statements have been prepared in conformity with accounting principles generally accepted in the United States of America, which require management to make certain estimates and assumptions at the date of the financial statements. The following summarizes the significant accounting policies of the Fund:
Security Valuation. Investments are valued and net asset value (NAV) per share is calculated (NAV calculation) as of the close of business of the New York Stock Exchange (NYSE), normally 4:00 p.m. Eastern time. Wherever possible, the Fund uses independent pricing services approved by the Board of Trustees to value its investments.
Equity securities, including restricted securities, for which market quotations are readily available, are valued at the last reported sale price or official closing price as reported by an independent pricing service on the primary market or exchange on which they are traded. In the event there were no sales during the day or closing prices are not available, securities are valued at the last quoted bid price.
Annual Report
3. Significant Accounting Policies - continued
Security Valuation - continued
Investments in open-end mutual funds, including the Fidelity Central Funds, are valued at their closing net asset value each business day. Short-term securities with remaining maturities of sixty days or less for which quotations are not readily available are valued at amortized cost, which approximates value.
When current market prices or quotations are not readily available or do not accurately reflect fair value, valuations may be determined in accordance with procedures adopted by the Board of Trustees. For example, when developments occur between the close of a market and the close of the NYSE that may materially affect the value of some or all of the securities, or when trading in a security is halted, those securities may be fair valued. Factors used in the determination of fair value may include monitoring news to identify significant market or security specific events such as changes in the value of U.S. securities markets, reviewing developments in foreign markets and evaluating the performance of ADRs, futures contracts and exchange-traded funds. Because the Fund's utilization of fair value pricing depends on market activity, the frequency with which fair value pricing is used cannot be predicted and may be utilized to a significant extent. The value of securities used for NAV calculation under fair value pricing may differ from published prices for the same securities.
Foreign Currency. The Fund uses foreign currency contracts to facilitate transactions in foreign-denominated securities. Losses from these transactions may arise from changes in the value of the foreign currency or if the counterparties do not perform under the contracts' terms.
Foreign-denominated assets, including investment securities, and liabilities are translated into U.S. dollars at the exchange rate at period end. Purchases and sales of investment securities, income and dividends received and expenses denominated in foreign currencies are translated into U.S. dollars at the exchange rate in effect on the transaction date.
The effects of exchange rate fluctuations on investments are included with the net realized and unrealized gain (loss) on investment securities. Other foreign currency transactions resulting in realized and unrealized gain (loss) are disclosed separately.
Annual Report
Notes to Financial Statements - continued
3. Significant Accounting Policies - continued
Investment Transactions and Income. For financial reporting purposes, the Fund's investment holdings and NAV include trades executed through the end of the last business day of the period. The NAV for processing shareholder transactions includes trades executed through the end of the prior business day. Gains and losses on securities sold are determined on the basis of identified cost and may include proceeds received from litigation. Dividend income is recorded on the ex-dividend date. Non-cash dividends included in dividend income, if any, are recorded at the fair market value of the securities received. Distributions received on securities that represent a return of capital or capital gain are recorded as a reduction of cost of investments and/or as a realized gain. The Fund estimates the components of distributions received that may be considered return of capital distributions or capital gain distributions. Interest income and income distributions from the Fidelity Central Funds are accrued as earned. Interest income includes coupon interest and amortization of premium and accretion of discount on debt securities. Investment income is recorded net of foreign taxes withheld where recovery of such taxes is uncertain.
Expenses. Most expenses of the trust can be directly attributed to a fund. Expenses which cannot be directly attributed are apportioned among each Fund in the trust. Expense estimates are accrued in the period to which they relate and adjustments are made when actual amounts are known.
Income Tax Information and Distributions to Shareholders. Each year, the Fund intends to qualify as a regulated investment company by distributing all of its taxable income and realized gains under Subchapter M of the Internal Revenue Code. As a result, no provision for income taxes is required in the accompanying financial statements. Foreign taxes are provided for based on the Fund's understanding of the tax rules and rates that exist in the foreign markets in which it invests.
Distributions are recorded on the ex-dividend date. Income and capital gain distributions are determined in accordance with income tax regulations, which may differ from generally accepted accounting principles. In addition, the Fund will claim a portion of the payment made to redeeming shareholders as a distribution for income tax purposes.
Capital accounts within the financial statements are adjusted for permanent book-tax differences. These adjustments have no impact on net assets or the results of operations. Temporary book-tax differences will reverse in a subsequent period.
Book-tax differences are primarily due to foreign currency transactions, certain foreign taxes, passive foreign investment companies (PFIC), partnerships and losses deferred due to wash sales.
Annual Report
3. Significant Accounting Policies - continued
Income Tax Information and Distributions to Shareholders - continued
The tax-basis components of distributable earnings and the federal tax cost as of period end were as follows:
Unrealized appreciation | $ 70,604,732 | |
Unrealized depreciation | (39,302,836) | |
Net unrealized appreciation (depreciation) | 31,301,896 | |
Undistributed ordinary income | 15,201,009 | |
Undistributed long-term capital gain | 13,485,336 | |
| | |
Cost for federal income tax purposes | $ 717,594,729 | |
The tax character of distributions paid was as follows:
| July 31, 2007 | July 31, 2006 |
Ordinary Income | $ 3,302,868 | $ 1,482,715 |
Long-term Capital Gains | 12,121,505 | 3,129,613 |
Total | $ 15,424,373 | $ 4,612,328 |
New Accounting Pronouncements. In July 2006, Financial Accounting Standards Board Interpretation No. 48, Accounting for Uncertainty in Income Taxes - an interpretation of FASB Statement 109 (FIN 48), was issued and is effective on the last business day of the semiannual reporting period for fiscal years beginning after December 15, 2006. FIN 48 sets forth a threshold for financial statement recognition, measurement and disclosure of a tax position taken or expected to be taken on a tax return. Management has concluded that the adoption of FIN 48 will not result in a material impact on the Fund's net assets, results of operations and financial statement disclosures.
In addition, in September 2006, Statement of Financial Accounting Standards No. 157, Fair Value Measurements (SFAS 157), was issued and is effective for fiscal years beginning after November 15, 2007. SFAS 157 defines fair value, establishes a framework for measuring fair value and expands disclosures about fair value measurements. Management is currently evaluating the impact the adoption of SFAS 157 will have on the Fund's financial statement disclosures.
Annual Report
Notes to Financial Statements - continued
4. Operating Policies.
Repurchase Agreements. FMR has received an Exemptive Order from the Securities and Exchange Commission (the SEC) which permits the Fund and other affiliated entities of FMR to transfer uninvested cash balances into joint trading accounts which are then invested in repurchase agreements. The Fund may also invest directly with institutions in repurchase agreements. Repurchase agreements are collateralized by government or non-government securities. Upon settlement date, collateral is held in segregated accounts with custodian banks and may be obtained in the event of a default of the counterparty. The Fund monitors, on a daily basis, the value of the collateral to ensure it is at least equal to the principal amount of the repurchase agreement (including accrued interest). In the event of a default by the counterparty, realization of the collateral proceeds could be delayed, during which time the value of the collateral may decline.
Restricted Securities. The Fund may invest in securities that are subject to legal or contractual restrictions on resale. These securities generally may be resold in transactions exempt from registration or to the public if the securities are registered. Disposal of these securities may involve time-consuming negotiations and expense, and prompt sale at an acceptable price may be difficult. Information regarding restricted securities is included at the end of the Fund's Schedule of Investments.
5. Purchases and Sales of Investments.
Purchases and sales of securities, other than short-term securities, aggregated $852,380,616 and $432,362,994, respectively.
6. Fees and Other Transactions with Affiliates.
Management Fee. FMR and its affiliates provide the Fund with investment management related services for which the Fund pays a monthly management fee. The management fee is the sum of an individual fund fee rate that is based on an annual rate of .30% of the Fund's average net assets and a group fee rate that averaged ..26% during the period. The group fee rate is based upon the average net assets of all the mutual funds advised by FMR. The group fee rate decreases as assets under management increase and increases as assets under management decrease. In addition, the management fee is subject to a performance adjustment(up to a maximum of ± .20% of the Fund's average net assets over a 36 month performance period). The upward or downward adjustment to the management fee is based on the Fund's relative investment performance as compared to an appropriate benchmark index. For the period, the total annual management fee rate, including the performance adjustment, was .52% of the Fund's average net assets.
Annual Report
6. Fees and Other Transactions with Affiliates - continued
Transfer Agent Fees. Fidelity Service Company, Inc. (FSC), an affiliate of FMR, is the Fund's transfer, dividend disbursing and shareholder servicing agent. FSC receives account fees and asset-based fees that vary according to account size and type of account. FSC pays for typesetting, printing and mailing of shareholder reports, except proxy statements. For the period the transfer agent fees were equivalent to an annual rate of .26% of average net assets.
Accounting and Security Lending Fees. FSC maintains the Fund's accounting records. The accounting fee is based on the level of average net assets for the month. Under a separate contract, FSC administers the security lending program. The security lending fee is based on the number and duration of lending transactions.
Brokerage Commissions. The Fund placed a portion of its portfolio transactions with brokerage firms which are affiliates of the investment adviser. The commissions paid to these affiliated firms were $7,041 for the period.
7. Committed Line of Credit.
The Fund participates with other funds managed by FMR in a $4.2 billion credit facility (the "line of credit") to be utilized for temporary or emergency purposes to fund shareholder redemptions or for other short-term liquidity purposes. The Fund has agreed to pay commitment fees on its pro rata portion of the line of credit, which amounted to $660 and is reflected in Miscellaneous Expense on the Statement of Operations. During the period, there were no borrowings on this line of credit.
8. Security Lending.
The Fund lends portfolio securities from time to time in order to earn additional income. On the settlement date of the loan, the Fund receives collateral (in the form of U.S. Treasury obligations, letters of credit and/or cash) against the loaned securities and maintains collateral in an amount not less than 100% of the market value of the loaned securities during the period of the loan. The market value of the loaned securities is determined at the close of business of the Fund and any additional required collateral is delivered to the Fund on the next business day. If the borrower defaults on its obligation to return the securities loaned because of insolvency or other reasons, a fund could experience delays and costs in recovering the securities loaned or in gaining access to the collateral. Any cash collateral received is invested in the Fidelity Securities Lending Cash Central Fund. The value of loaned securities and cash collateral at period end are disclosed on the Fund's Statement of Assets and Liabilities. Security lending income represents the income earned on investing cash collateral, less fees and expenses
Annual Report
Notes to Financial Statements - continued
8. Security Lending - continued
associated with the loan, plus any premium payments that may be received on the loan of certain types of securities. Security lending income is presented in the Statement of Operations as a component of income from Fidelity Central Funds. Net income from lending portfolio securities during the period amounted to $22,197.
9. Bank Borrowings.
The Fund is permitted to have bank borrowings for temporary or emergency purposes to fund shareholder redemptions. The Fund has established borrowing arrangements with certain banks. The interest rate on the borrowings is the bank's base rate, as revised from time to time. The average daily loan balance during the period for which loans were outstanding amounted to $35,779,750. The weighted average interest rate was 5.52%. The interest expense amounted to $21,926 under the bank borrowing program.
10. Expense Reductions.
Many of the brokers with whom FMR places trades on behalf of the Fund provided services to the Fund in addition to trade execution. These services included payments of certain expenses on behalf of the Fund totaling $12,660 for the period. In addition, through arrangements with the Fund's custodian and transfer agent, credits realized as a result of uninvested cash balances were used to reduce the Fund's expenses. During the period, these credits reduced the Fund's custody and transfer agent expenses by $5,419 and $10,549, respectively.
11. Other.
The Fund's organizational documents provide former and current trustees and officers with a limited indemnification against liabilities arising in connection with the performance of their duties to the Fund. In the normal course of business, the Fund may also enter into contracts that provide general indemnifications. The Fund's maximum exposure under these arrangements is unknown as this would be dependent on future claims that may be made against the Fund. The risk of material loss from such claims is considered remote.
The United States Securities and Exchange Commission ("SEC") is conducting an investigation of FMR (covering the years 2002 to 2004) arising from gifts, gratuities and business entertainment provided by certain brokers to certain individuals who were employed on FMR's domestic equity trading desk during that period. FMR is in discussions with the SEC staff regarding the possible resolution of the matter, but as of period-end no final resolution has been reached.
Annual Report
11. Other - continued
In December 2006, the Independent Trustees completed their own investigation of the matter with the assistance of independent counsel. The Independent Trustees and FMR agree that, despite the absence of proof that the Fidelity mutual funds experienced diminished execution quality as a result of the improper receipt of gifts and business entertainment, the conduct at issue was serious and is worthy of redress. Accordingly, the Independent Trustees have requested and FMR has agreed to pay $42 million to Fidelity mutual funds, plus interest to be determined at the time that payment is made. A method of allocating this payment among the funds has not yet been determined. The total payment to the Fund is not anticipated to have a material impact on the Fund's net assets. In addition, FMR reimbursed related legal expenses which are recorded in the accompanying Statement of Operations as an expense reduction.
Annual Report
Report of Independent Registered Public Accounting Firm
To the Trustees of Fidelity Securities Fund and the Shareholders of Fidelity Blue Chip Value Fund:
In our opinion, the accompanying statement of assets and liabilities, including the schedule of investments, and the related statements of operations and of changes in net assets and the financial highlights present fairly, in all material respects, the financial position of Fidelity Blue Chip Value Fund (a fund of Fidelity Securities Fund) at July 31, 2007, the results of its operations for the year then ended, the changes in its net assets for each of the two years in the period then ended and the financial highlights for each of the periods indicated, in conformity with accounting principles generally accepted in the United States of America. These financial statements and financial highlights (hereafter referred to as "financial statements") are the responsibility of the Fidelity Blue Chip Value Fund's management. Our responsibility is to express an opinion on these financial statements based on our audits. We conducted our audits of these financial statements in accordance with the standards of the Public Company Accounting Oversight Board (United States). Those standards require that we plan and perform the audit to obtain reasonable assurance about whether the financial statements are free of material misstatement. An audit includes examining, on a test basis, evidence supporting the amounts and disclosures in the financial statements, assessing the accounting principles used and significant estimates made by management, and evaluating the overall financial statement presentation. We believe that our audits, which included confirmation of securities at July 31, 2007 by correspondence with the custodian and brokers, provide a reasonable basis for our opinion.
/s/ PricewaterhouseCoopers LLP
PricewaterhouseCoopers LLP
Boston, Massachusetts
September 18, 2007
Annual Report
Trustees and Officers
The Trustees, Members of the Advisory Board, and executive officers of the trust and fund, as applicable, are listed below. The Board of Trustees governs the fund and is responsible for protecting the interests of shareholders. The Trustees are experienced executives who meet periodically throughout the year to oversee the fund's activities, review contractual arrangements with companies that provide services to the fund, and review the fund's performance. Except for James C. Curvey, each of the Trustees oversees 353 funds advised by FMR or an affiliate. Mr. Curvey oversees 317 funds advised by FMR or an affiliate.
The Trustees hold office without limit in time except that (a) any Trustee may resign; (b) any Trustee may be removed by written instrument, signed by at least two-thirds of the number of Trustees prior to such removal; (c) any Trustee who requests to be retired or who has become incapacitated by illness or injury may be retired by written instrument signed by a majority of the other Trustees; and (d) any Trustee may be removed at any special meeting of shareholders by a two-thirds vote of the outstanding voting securities of the trust. Each Trustee who is not an interested person (as defined in the 1940 Act) (Independent Trustee), shall retire not later than the last day of the calendar year in which his or her 72nd birthday occurs. The Independent Trustees may waive this mandatory retirement age policy with respect to individual Trustees. The executive officers and Advisory Board Members hold office without limit in time, except that any officer and Advisory Board Member may resign or may be removed by a vote of a majority of the Trustees at any regular meeting or any special meeting of the Trustees. Except as indicated, each individual has held the office shown or other offices in the same company for the past five years.
The fund's Statement of Additional Information (SAI) includes more information about the Trustees. To request a free copy, call Fidelity at 1-800-544-8544.
Interested Trustees*:
Correspondence intended for each Trustee who is an interested person may be sent to Fidelity Investments, 82 Devonshire Street, Boston, Massachusetts 02109.
Name, Age; Principal Occupation |
Edward C. Johnson 3d (77) |
| Year of Election or Appointment: 1984 Mr. Johnson is Chairman of the Board of Trustees. Mr. Johnson serves as President (2006-present), Chief Executive Officer, Chairman, and a Director of FMR Corp.; Chairman and a Director of FMR; Chairman and a Director of Fidelity Research & Analysis Company (FRAC); Chairman and a Director of Fidelity Investments Money Management, Inc.; and Chairman (2001-present) and a Director of FMR Co., Inc. In addition, Mr. Johnson serves as Chairman and Director of Fidelity International Limited (FIL). |
James C. Curvey (72) |
| Year of Election or Appointment: 2007 Mr. Curvey also serves as Trustee (2007-present) or Member of the Advisory Board (2007-present) of other investment companies advised by FMR. Mr. Curvey is Vice Chairman (2006-present) and Director of FMR Corp. Mr. Curvey joined Fidelity in 1982 and served in numerous senior management positions, including President and Chief Operating Officer of FMR Corp. (1997-2000) and President of Fidelity Strategic Investments (2000-2002). In addition, he serves as a member of the Board of Directors of Geerlings & Wade, Inc. (wine distribution). |
* Trustees have been determined to be "Interested Trustees" by virtue of, among other things, their affiliation with the trust or various entities under common control with FMR.
Independent Trustees:
Correspondence intended for each Independent Trustee (that is, the Trustees other than the Interested Trustees) may be sent to Fidelity Investments, P.O. Box 55235, Boston, Massachusetts 02205-5235.
Name, Age; Principal Occupation |
Dennis J. Dirks (59) |
| Year of Election or Appointment: 2005 Prior to his retirement in May 2003, Mr. Dirks was Chief Operating Officer and a member of the Board of The Depository Trust & Clearing Corporation (DTCC) (1999-2003). He also served as President, Chief Operating Officer, and Board member of The Depository Trust Company (DTC) (1999-2003) and President and Board member of the National Securities Clearing Corporation (NSCC) (1999-2003). In addition, Mr. Dirks served as Chief Executive Officer and Board member of the Government Securities Clearing Corporation (2001-2003) and Chief Executive Officer and Board member of the Mortgage-Backed Securities Clearing Corporation (2001-2003). Mr. Dirks also serves as a Trustee and a member of the Finance Committee of Manhattan College (2005-present) and a Trustee and a member of the Finance Committee of AHRC of Nassau County (2006-present). |
Albert R. Gamper, Jr. (65) |
| Year of Election or Appointment: 2006 Prior to his retirement in December 2004, Mr. Gamper served as Chairman of the Board of CIT Group Inc. (commercial finance). During his tenure with CIT Group Inc. Mr. Gamper served in numerous senior management positions, including Chairman (1987-1989; 1999-2001; 2002-2004), Chief Executive Officer (1987-2004), and President (1989-2002). He currently serves as a member of the Board of Directors of Public Service Enterprise Group (utilities, 2001-present), Chairman of the Board of Governors, Rutgers University (2004-present), and Chairman of the Board of Saint Barnabas Health Care System. |
George H. Heilmeier (71) |
| Year of Election or Appointment: 2004 Dr. Heilmeier is Chairman Emeritus of Telcordia Technologies (communication software and systems), where prior to his retirement, he served as company Chairman and Chief Executive Officer. He currently serves on the Boards of Directors of The Mitre Corporation (systems engineering and information technology support for the government), and HRL Laboratories (private research and development, 2004-present). He is Chairman of the General Motors Science & Technology Advisory Board and a Life Fellow of the Institute of Electrical and Electronics Engineers (IEEE). Dr. Heilmeier is a member of the Defense Science Board and the National Security Agency Advisory Board. He is also a member of the National Academy of Engineering, the American Academy of Arts and Sciences, and the Board of Overseers of the School of Engineering and Applied Science of the University of Pennsylvania. Previously, Dr. Heilmeier served as a Director of TRW Inc. (automotive, space, defense, and information technology, 1992-2002), Compaq (1994-2002), Automatic Data Processing, Inc. (ADP) (technology-based business outsourcing, 1995-2002), INET Technologies Inc. (telecommunications network surveillance, 2001-2004), and Teletech Holdings (customer management services). He is the recipient of the 2005 Kyoto Prize in Advanced Technology for his invention of the liquid crystal display, and a member of the Consumer Electronics Hall of Fame. |
James H. Keyes (66) |
| Year of Election or Appointment: 2007 Prior to his retirement in 2003, Mr. Keyes was Chairman, President, and Chief Executive Officer of Johnson Controls, Inc. (automotive supplier, 1993-2003). He currently serves as a member of the boards of LSI Logic Corporation (semiconductor technologies), Navistar International Corporation (manufacture and sale of trucks, buses, and diesel engines, 2002-present), and Pitney Bowes, Inc. (integrated mail, messaging, and document management solutions). |
Marie L. Knowles (60) |
| Year of Election or Appointment: 2001 Prior to Ms. Knowles' retirement in June 2000, she served as Executive Vice President and Chief Financial Officer of Atlantic Richfield Company (ARCO) (diversified energy, 1996-2000). From 1993 to 1996, she was a Senior Vice President of ARCO and President of ARCO Transportation Company. She served as a Director of ARCO from 1996 to 1998. She currently serves as a Director of Phelps Dodge Corporation (copper mining and manufacturing) and McKesson Corporation (healthcare service, 2002-present). Ms. Knowles is a Trustee of the Brookings Institution and the Catalina Island Conservancy and also serves as a member of the Advisory Board for the School of Engineering of the University of Southern California. |
Ned C. Lautenbach (63) |
| Year of Election or Appointment: 2000 Mr. Lautenbach is Chairman of the Independent Trustees (2006-present). Mr. Lautenbach has been a partner of Clayton, Dubilier & Rice, Inc. (private equity investment firm) since September 1998. Previously, Mr. Lautenbach was with the International Business Machines Corporation (IBM) from 1968 until his retirement in 1998. Mr. Lautenbach serves as a Director of Sony Corporation (2006-present) and Eaton Corporation (diversified industrial) as well as the Philharmonic Center for the Arts in Naples, Florida. He also is a member of the Board of Trustees of Fairfield University (2005-present), as well as a member of the Council on Foreign Relations. |
Cornelia M. Small (63) |
| Year of Election or Appointment: 2005 Ms. Small is a member (2000-present) and Chairperson (2002-present) of the Investment Committee, and a member (2002-present) of the Board of Trustees of Smith College. Previously, she served as Chief Investment Officer (1999-2000), Director of Global Equity Investments (1996-1999), and a member of the Board of Directors of Scudder, Stevens & Clark (1990-1997) and Scudder Kemper Investments (1997-1999). In addition, Ms. Small served as Co-Chair (2000-2003) of the Annual Fund for the Fletcher School of Law and Diplomacy. |
William S. Stavropoulos (68) |
| Year of Election or Appointment: 2002 Mr. Stavropoulos is Chairman Emeritus of the Board of Directors of The Dow Chemical Company. Since joining The Dow Chemical Company in 1967, Mr. Stavropoulos served in numerous senior management positions, including President (1993-2000; 2002-2003), CEO (1995-2000; 2002-2004), and Chairman of the Executive Committee (2000-2004). Currently, he is a Director of NCR Corporation (data warehousing and technology solutions), Chemical Financial Corporation, Maersk Inc. (industrial conglomerate, 2002-present), Tyco International, Inc. (multinational manufacturing and services, 2007-present), and a member of the Advisory Board for Metalmark Capital (private equity investment firm, 2005-present). He is a special advisor to Clayton, Dubilier & Rice, Inc., a private equity investment firm. He also serves as a member of the Board of Trustees of the American Enterprise Institute for Public Policy Research. In addition, Mr. Stavropoulos is a member of The Business Council, J.P. Morgan International Council and the University of Notre Dame Advisory Council for the College of Science. |
Kenneth L. Wolfe (68) |
| Year of Election or Appointment: 2005 Prior to his retirement in 2001, Mr. Wolfe was Chairman and Chief Executive Officer of Hershey Foods Corporation (1993-2001). He currently serves as a member of the boards of Adelphia Communications Corporation (2003-present), Bausch & Lomb, Inc., and Revlon Inc. (2004-present). |
Advisory Board Members and Executive Officers:
Correspondence intended for Mr. Mauriello may be sent to Fidelity Investments, P.O. Box 55235, Boston, Massachusetts 02205-5235. Correspondence intended for each executive officer and Mr. Lynch may be sent to Fidelity Investments, 82 Devonshire Street, Boston, Massachusetts 02109.
Name, Age; Principal Occupation |
Peter S. Lynch (63) |
| Year of Election or Appointment: 2003 Member of the Advisory Board of Fidelity Securities Fund. Mr. Lynch is Vice Chairman and a Director of FMR, and Vice Chairman (2001-present) and a Director of FMR Co., Inc. Previously, Mr. Lynch served as a Trustee of the Fidelity funds (1990-2003). In addition, he serves as a Trustee of Boston College and as the Chairman of the Inner-City Scholarship Fund. |
Joseph Mauriello (62) |
| Year of Election or Appointment: 2007 Member of the Advisory Board of Fidelity Securities Fund. Prior to his retirement in January 2006, Mr. Mauriello served in numerous senior management positions including Deputy Chairman and Chief Operating Officer (2004-2005), and Vice Chairman of Financial Services (2002-2004) of KPMG LLP US (professional services firm, 1965-2005). Mr. Mauriello currently serves as a member of the Board of Directors of XL Capital Ltd., (global insurance and re-insurance company, 2006-present) and of Arcadia Resources Inc., (health care services and products, 2007-present). He also served as a Director of the Hamilton Funds of the Bank of New York (2006-2007). |
Kimberley H. Monasterio (43) |
| Year of Election or Appointment: 2007 President and Treasurer of Blue Chip Value. Ms. Monasterio also serves as President and Treasurer of other Fidelity funds (2007-present) and is an employee of FMR (2004-present). Previously, Ms. Monasterio served as Deputy Treasurer of the Fidelity funds (2004-2006). Before joining Fidelity Investments, Ms. Monasterio served as Treasurer (2000-2004) and Chief Financial Officer (2002-2004) of the Franklin Templeton Funds and Senior Vice President of Franklin Templeton Services, LLC (2000-2004). |
Dwight D. Churchill (53) |
| Year of Election or Appointment: 2005 Vice President of Blue Chip Value. Mr. Churchill also serves as Vice President of certain Equity Funds (2005-present). Mr. Churchill is Executive Vice President of FMR (2005-present) and FMR Co., Inc. (2005-present). Previously, Mr. Churchill served as Senior Vice President of Fidelity Investments Money Management, Inc. (2005-2006), Head of Fidelity's Fixed-Income Division (2000-2005), Vice President of Fidelity's Money Market Funds (2000-2005), Vice President of Fidelity's Bond Funds, and Senior Vice President of FMR. |
Bruce T. Herring (41) |
| Year of Election or Appointment: 2006 Vice President of Blue Chip Value. Mr. Herring also serves as Vice President of certain Equity Funds (2006-present). Mr. Herring is Senior Vice President of FMR (2006-present) and Vice President of FMR Co., Inc. (2001-present). Previously, Mr. Herring served as a portfolio manager for Fidelity U.S. Equity Funds (2001-2005). |
Charles Hebard (37) |
| Year of Election or Appointment: 2006 Vice President of Blue Chip Value. Mr. Hebard also serves as Vice President of another fund advised by FMR. Prior to assuming his current responsibilities, Mr. Hebard worked as a research analyst. |
Eric D. Roiter (58) |
| Year of Election or Appointment: 2003 Secretary of Blue Chip Value. He also serves as Secretary of other Fidelity funds; Vice President, General Counsel, and Secretary of FMR Co., Inc. (2001-present) and FMR; Assistant Secretary of Fidelity Management & Research (U.K.) Inc. (2001-present), Fidelity Research & Analysis Company (2001-present), and Fidelity Investments Money Management, Inc. (2001-present). Mr. Roiter is an Adjunct Member, Faculty of Law, at Boston College Law School (2003-present). Previously, Mr. Roiter served as Vice President and Secretary of Fidelity Distributors Corporation (FDC) (1998-2005). |
Scott C. Goebel (39) |
| Year of Election or Appointment: 2007 Assistant Secretary of Blue Chip Value. Mr. Goebel also serves as Assistant Secretary of other Fidelity funds (2007-present), Vice President and Secretary of FDC (2006-present), and is an employee of FMR. |
R. Stephen Ganis (41) |
| Year of Election or Appointment: 2006 Anti-Money Laundering (AML) officer of Blue Chip Value. Mr. Ganis also serves as AML officer of other Fidelity funds (2006-present) and FMR Corp. (2003-present). Before joining Fidelity Investments, Mr. Ganis practiced law at Goodwin Procter, LLP (2000-2002). |
Joseph B. Hollis (59) |
| Year of Election or Appointment: 2006 Chief Financial Officer of Blue Chip Value. Mr. Hollis also serves as Chief Financial Officer of other Fidelity funds. Mr. Hollis is President of Fidelity Pricing and Cash Management Services (FPCMS) (2005-present). Mr. Hollis also serves as President and Director of Fidelity Service Company, Inc. (2006-present). Previously, Mr. Hollis served as Senior Vice President of Cash Management Services (1999-2002) and Investment Management Operations (2002-2005). |
Kenneth A. Rathgeber (60) |
| Year of Election or Appointment: 2004 Chief Compliance Officer of Blue Chip Value. Mr. Rathgeber also serves as Chief Compliance Officer of other Fidelity funds (2004-present) and Executive Vice President of Risk Oversight for Fidelity Investments (2002-present). He is Chief Compliance Officer of FMR (2005-present), FMR Co., Inc. (2005-present), Fidelity Management & Research (U.K.) Inc. (2005-present), Fidelity Research & Analysis Company (2005-present), Fidelity Investments Money Management, Inc. (2005-present), and Strategic Advisers, Inc. (2005-present). Previously, Mr. Rathgeber served as Executive Vice President and Chief Operating Officer for Fidelity Investments Institutional Services Company, Inc. (1998-2002). |
Bryan A. Mehrmann (46) |
| Year of Election or Appointment: 2005 Deputy Treasurer of Blue Chip Value. Mr. Mehrmann also serves as Deputy Treasurer of other Fidelity funds (2005-present) and is an employee of FMR. Previously, Mr. Mehrmann served as Vice President of Fidelity Investments Institutional Services Group (FIIS)/Fidelity Investments Institutional Operations Corporation, Inc. (FIIOC) Client Services (1998-2004). |
Kenneth B. Robins (37) |
| Year of Election or Appointment: 2005 Deputy Treasurer of Blue Chip Value. Mr. Robins also serves as Deputy Treasurer of other Fidelity funds (2005-present) and is an employee of FMR (2004-present). Before joining Fidelity Investments, Mr. Robins worked at KPMG LLP, where he was a partner in KPMG's department of professional practice (2002-2004) and a Senior Manager (1999-2000). In addition, Mr. Robins served as Assistant Chief Accountant, United States Securities and Exchange Commission (2000-2002). |
Robert G. Byrnes (40) |
| Year of Election or Appointment: 2005 Assistant Treasurer of Blue Chip Value. Mr. Byrnes also serves as Assistant Treasurer of other Fidelity funds (2005-present) and is an employee of FMR (2005-present). Previously, Mr. Byrnes served as Vice President of FPCMS (2003-2005). Before joining Fidelity Investments, Mr. Byrnes worked at Deutsche Asset Management where he served as Vice President of the Investment Operations Group (2000-2003). |
Peter L. Lydecker (53) |
| Year of Election or Appointment: 2004 Assistant Treasurer of Blue Chip Value. Mr. Lydecker also serves as Assistant Treasurer of other Fidelity funds (2004) and is an employee of FMR. |
Gary W. Ryan (48) |
| Year of Election or Appointment: 2005 Assistant Treasurer of Blue Chip Value. Mr. Ryan also serves as Assistant Treasurer of other Fidelity funds (2005-present) and is an employee of FMR (2005-present). Previously, Mr. Ryan served as Vice President of Fund Reporting in FPCMS (1999-2005). |
Annual Report
Distributions
The Board of Trustees of Fidelity Blue Chip Value Fund voted to pay on September 10, 2007, to shareholders of record at the opening of business on September 7, 2007, a distribution of $.54 per share derived from capital gains realized from sales of portfolio securities and a dividend of $.08 per share from net investment income.
The fund hereby designates as a capital gain dividend with respect to the taxable year ended July 31, 2007, $19,948,345, or, if subsequently determined to be different, the net capital gain of such year.
The fund designates 100% of the dividends distributed during the fiscal year as qualifying for the dividends-received deduction for corporate shareholders.
The fund designates 100% of the dividends distributed during the fiscal year as amounts which may be taken into account as a dividend for the purposes of the maximum rate under section 1(h)(11) of the Internal Revenue Code.
The fund will notify shareholders in January 2008 of amounts for use in preparing 2007 income tax returns.
Annual Report
Board Approval of Investment Advisory Contracts and Management Fees
Fidelity Blue Chip Value Fund
Each year, typically in July, the Board of Trustees, including the Independent Trustees (together, the Board), votes on the renewal of the management contract and sub-advisory agreements (together, the Advisory Contracts) for the fund. The Board, assisted by the advice of fund counsel and Independent Trustees' counsel, requests and considers a broad range of information throughout the year.
The Board meets regularly each month except August and takes into account throughout the year matters bearing on Advisory Contracts. The Board, acting directly and through its separate committees, considers at each of its meetings factors that are relevant to the annual renewal of the fund's Advisory Contracts, including the services and support provided to the fund and its shareholders. At the time of the renewal, the Board had 12 standing committees, each composed of Independent Trustees with varying backgrounds, to which the Board has assigned specific subject matter responsibilities in order to enhance effective decision-making by the Board. Each committee has adopted a written charter outlining the structure and purposes of the committee. One such committee, the Equity Contract Committee, meets periodically as needed throughout the year to consider matters specifically related to the annual renewal of Advisory Contracts. The committee requests and receives information on, and makes recommendations to the Independent Trustees concerning, the approval and annual review of the Advisory Contracts.
At its July 2007 meeting, the Board of Trustees, including the Independent Trustees, unanimously determined to renew the Advisory Contracts for the fund. In reaching its determination, the Board considered all factors it believed relevant, including (i) the nature, extent, and quality of the services to be provided to the fund and its shareholders (including the investment performance of the fund); (ii) the competitiveness of the management fee and total expenses of the fund; (iii) the total costs of the services to be provided by and the profits to be realized by the investment adviser and its affiliates from the relationship with the fund; (iv) the extent to which economies of scale would be realized as the fund grows; and (v) whether fee levels reflect these economies of scale, if any, for the benefit of fund shareholders. The Board also approved amendments to the fund's agreements with foreign sub-advisers to clarify that each sub-adviser provides services as an independent contractor.
In determining whether to renew the Advisory Contracts for the fund, the Board ultimately reached a determination, with the assistance of fund counsel and Independent Trustees' counsel, that the renewal of the Advisory Contracts and the compensation to be received by Fidelity under the management contract is consistent with Fidelity's fiduciary duty under applicable law. In addition to evaluating the specific factors noted above, the Board, in reaching its determination, is aware that shareholders in the fund have a broad range of investment choices available to them, including a wide choice among mutual funds offered by competitors to Fidelity, and that the fund's shareholders, with the opportunity to review and weigh the disclosure provided by the fund in its prospectus and other public disclosures, have chosen to invest in this fund, managed by Fidelity.
Annual Report
Board Approval of Investment Advisory Contracts and
Management Fees - continued
Nature, Extent, and Quality of Services Provided. The Board considered staffing within the investment adviser, FMR, and the sub-advisers (together, the Investment Advisers), including the background of the fund's portfolio manager and the fund's investment objective and discipline. The Independent Trustees also had discussions with senior management of Fidelity's investment operations and investment groups. The Board considered the structure of the portfolio manager compensation program and whether this structure provides appropriate incentives.
Resources Dedicated to Investment Management and Support Services. The Board reviewed the size, education, and experience of the Investment Advisers' investment staff, their use of technology, and the Investment Advisers' approach to recruiting, training, and retaining portfolio managers and other research, advisory, and management personnel. The Board considered Fidelity's extensive global research capabilities that enable the Investment Advisers to aggregate data from various sources in an effort to produce positive investment results. The Board noted that Fidelity's analysts have access to a variety of technological tools that enable them to perform both fundamental and quantitative analysis and to specialize in various disciplines. The Board also considered that Fidelity's portfolio managers and analysts have access to daily portfolio attribution that allows for monitoring of a fund's portfolio, as well as an electronic communication system that provides immediate real-time access to research concerning issuers and credit enhancers.
Shareholder and Administrative Services. The Board considered (i) the nature, extent, quality, and cost of advisory, administrative, distribution, and shareholder services performed by the Investment Advisers and their affiliates under the Advisory Contracts and under separate agreements covering transfer agency, pricing and bookkeeping, and securities lending services for the fund; (ii) the nature and extent of the Investment Advisers' supervision of third party service providers, principally custodians and subcustodians; and (iii) the resources devoted to, and the record of compliance with, the fund's compliance policies and procedures. The Board reviewed the allocation of fund brokerage, including allocations to brokers affiliated with the Investment Advisers, the use of brokerage commissions to pay fund expenses, and the use of "soft" commission dollars to pay for research services. The Board also considered that Fidelity voluntarily pays for market data out of its own resources. The Board also considered the agreement reached between the Independent Trustees and Fidelity in December 2006 following an independent review of matters relating to receipt of travel, entertainment, gifts and gratuities in violation of Fidelity policies.
Annual Report
The Board noted that the growth of fund assets across the complex allows Fidelity to reinvest in the development of services designed to enhance the value or convenience of the Fidelity funds as investment vehicles. These services include 24-hour access to account information and market information through phone representatives and over the Internet, and investor education materials and asset allocation tools.
Investment in a Large Fund Family. The Board considered the benefits to shareholders of investing in a Fidelity fund, including the benefits of investing in a fund that is part of a large family of funds offering a variety of investment disciplines and providing for a large variety of mutual fund investor services. For example, fund shareholders are offered the privilege of exchanging shares of the fund for shares of other Fidelity funds, as set forth in the fund's prospectus, without paying a sales charge. The Board noted that, since the last Advisory Contract renewals in July 2006, Fidelity has taken a number of actions that benefited particular funds, including (i) dedicating additional resources to investment research and to restructure the investment research teams; (ii) contractually agreeing to reduce the management fee on Fidelity Advisor Floating Rate High Income Fund; (iii) contractually agreeing to reduce the management fees on Fidelity's California, Massachusetts, New Jersey, and New York AMT Tax-Free Money Market Funds, launching new Institutional Classes and Service Classes of these funds, and contractually agreeing to impose expense limitations on these funds; (iv) eliminating the exchange fee on the Fidelity Select Portfolios and reducing the pricing and bookkeeping fee rates for these funds; (v) reducing the maximum transfer agency fee rates on high income funds and certain equity funds; (vi) proposing amended management contracts that, if approved by shareholders, will add a performance adjustment component to the management fees paid by 18 Fidelity Advisor equity funds; (vii) contractually agreeing to reduce fees for Ultra-Short Central Fund and the money market Central Funds; (viii) waiving the Fidelity Advisor funds' contingent deferred sales charge on certain redemptions made through systematic withdrawal programs; and (ix) amending the management contracts for equity and fixed-income funds whose management contracts incorporate a "group fee" structure by adding four new fee "breakpoints" to the group fee rate schedules.
Investment Performance and Compliance. The Board considered whether the fund has operated within its investment objective, as well as its record of compliance with its investment restrictions. It also reviewed the fund's absolute investment performance, as well as the fund's relative investment performance measured against (i) a broad-based securities market index, and (ii) a peer group of mutual funds deemed appropriate by the Board over multiple periods. Because the fund had been in existence less than five calendar years, the following charts considered by the Board show, over the one- and three-year periods ended December 31, 2006, the fund's cumulative total returns, the cumulative total returns of a broad-based securities market index ("benchmark"), and a range of cumulative total returns of a peer group of mutual funds identified by Morningstar, Inc. as having an investment style similar to that of the fund based on underlying portfolio holdings. The box within each chart shows the 25th percentile return (bottom of box) and the 75th percentile return (top of box) of the peer group. Returns shown above the box are in the first quartile and returns shown below the box are in the fourth quartile. The percentage beaten number noted below each chart corresponds to the percentile box and represents the percentage of funds in the peer group whose performance was equal to or lower than that of the fund.
Annual Report
Board Approval of Investment Advisory Contracts and
Management Fees - continued
Fidelity Blue Chip Value Fund
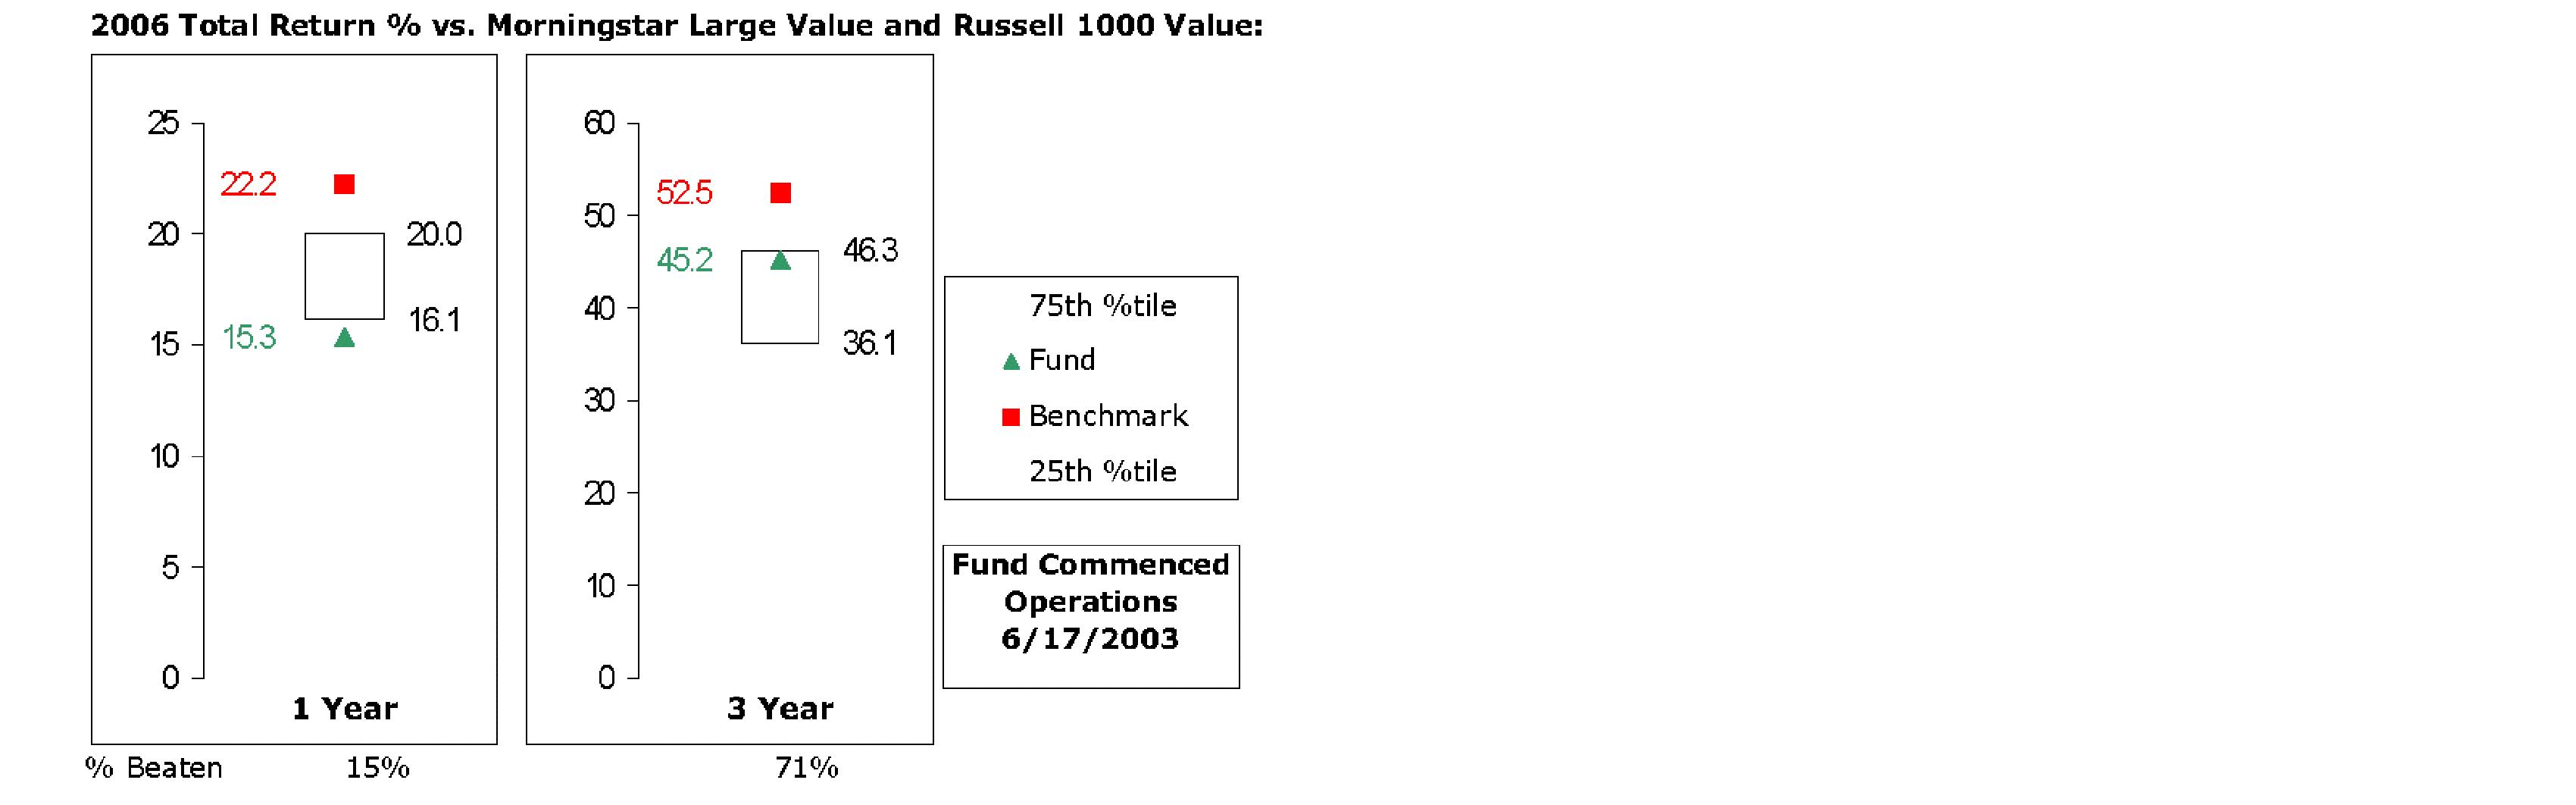
The Board reviewed the fund's relative investment performance against its peer group and stated that the performance of the fund was in the fourth quartile for the one-year period and the second quartile for the three-year period. The Board also stated that the investment performance of the fund was lower than its benchmark for all the periods shown.
The Board also considered that the fund's management fee is subject to upward or downward adjustment depending upon whether, and to what extent, the fund's investment performance for the performance period exceeds, or is exceeded by, the record (over the same period) of a Board-approved performance adjustment index. The Board realizes that the performance adjustment provides FMR with a strong economic incentive to seek to achieve superior performance for the fund's shareholders and helps to more closely align the interests of FMR and the fund's shareholders.
The Board considered that FMR has taken steps to refocus and strengthen equity research, equity portfolio management, and compliance.
Based on its review, and giving particular weight to the nature and quality of the resources dedicated by the Investment Advisers to maintain and improve relative performance, the Board concluded that the nature, extent, and quality of the services provided to the fund will benefit the fund's shareholders, particularly in light of the Board's view that the fund's shareholders benefit from investing in a fund that is part of a large family of funds offering a variety of investment disciplines and services.
Annual Report
Competitiveness of Management Fee and Total Fund Expenses. The Board considered the fund's management fee and total expenses compared to "mapped groups" of competitive funds and classes. Fidelity creates "mapped groups" by combining similar Lipper investment objective categories that have comparable management fee characteristics. Combining Lipper investment objective categories aids the Board's management fee and total expense comparisons by broadening the competitive group used for comparison and by reducing the number of universes to which various Fidelity funds are compared. The Board also considered supplemental information about how the fund's management fee and total expenses ranked relative to groups based on Lipper classifications, which take into account a fund's market capitalization and style.
The Board considered two proprietary management fee comparisons for the 12-month (or shorter) periods shown in the chart below. The group of Lipper funds used by the Board for management fee comparisons is referred to below as the "Total Mapped Group." The Total Mapped Group comparison focuses on a fund's standing relative to the total universe of comparable funds available to investors, in terms of gross management fees before expense reimbursements or caps, and without giving effect to the fund's performance adjustment. "TMG %" represents the percentage of funds in the Total Mapped Group that had management fees that were lower than the fund's. For example, a TMG % of 10% means that 90% of the funds in the Total Mapped Group had higher management fees than the fund. The "Asset-Size Peer Group" (ASPG) comparison focuses on a fund's standing relative to non-Fidelity funds similar in size to the fund within the Total Mapped Group. The ASPG represents at least 15% of the funds in the Total Mapped Group with comparable asset size and management fee characteristics, subject to a minimum of 50 funds (or all funds in the Total Mapped Group if fewer than 50). Additional information, such as the ASPG quartile in which the fund's management fee ranked and the impact of the fund's performance adjustment, is also included in the chart and considered by the Board.
Annual Report
Board Approval of Investment Advisory Contracts and
Management Fees - continued
Fidelity Blue Chip Value Fund
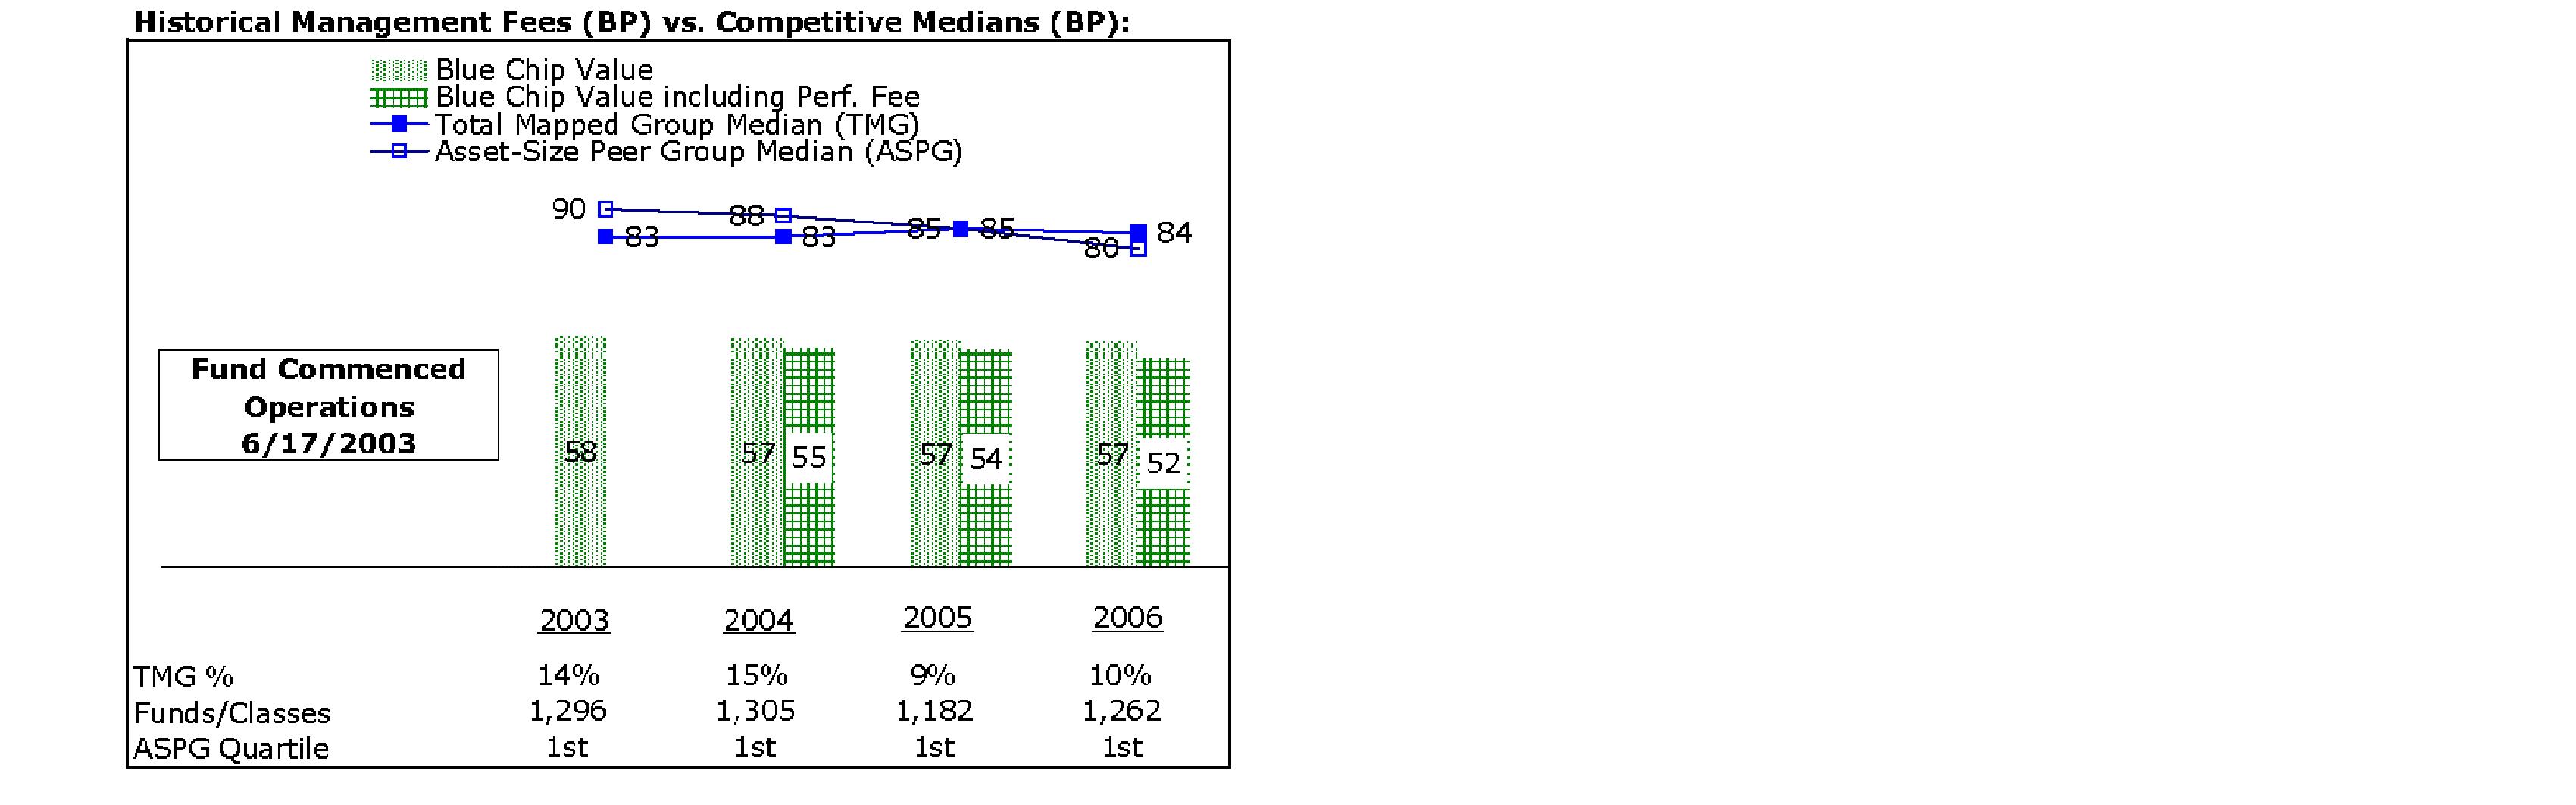
The Board noted that the fund's management fee ranked below the median of its Total Mapped Group and below the median of its ASPG for 2006. The Board also noted the effect of the fund's negative performance adjustment on the fund's management fee ranking. The Board noted that the performance adjustment for each year represents calculations for performance periods that differ from the periods shown in the performance charts above.
Based on its review, the Board concluded that the fund's management fee was fair and reasonable in light of the services that the fund receives and the other factors considered.
In its review of the fund's total expenses, the Board considered the fund's management fee as well as other fund expenses, such as transfer agent fees, pricing and bookkeeping fees, and custodial, legal, and audit fees. The Board also noted the effects of any waivers and reimbursements on fees and expenses, as well as the fund's negative performance adjustment. As part of its review, the Board also considered current and historical total expenses of the fund compared to competitive fund median expenses. The fund is compared to those funds and classes in the Total Mapped Group (used by the Board for management fee comparisons) that have a similar sales load structure.
The Board noted that the fund's total expenses ranked below its competitive median for 2006.
In its review of total expenses, the Board also considered Fidelity fee structures and other information on clients that FMR and its affiliates service in other competitive markets, such as other mutual funds advised or subadvised by FMR or its affiliates, pension plan clients, and other institutional clients.
Annual Report
Based on its review, the Board concluded that the fund's total expenses were reasonable in light of the services that the fund and its shareholders receive and the other factors considered.
Costs of the Services and Profitability. The Board considered the revenues earned and the expenses incurred by Fidelity in conducting the business of developing, marketing, distributing, managing, administering and servicing the fund and its shareholders. The Board also considered the level of Fidelity's profits in respect of all the Fidelity funds.
On an annual basis, FMR presents to the Board Fidelity's profitability for the fund. Fidelity calculates the profitability for each fund, as well as aggregate profitability for groups of Fidelity funds and all Fidelity funds, using a series of detailed revenue and cost allocation methodologies which originate with the audited books and records of Fidelity. The Audit Committee of the Board reviews any significant changes from the prior year's methodologies.
PricewaterhouseCoopers LLP (PwC), independent registered public accounting firm and auditor to Fidelity and certain Fidelity funds, has been engaged annually by the Board as part of the Board's assessment of the results of Fidelity's profitability analysis. PwC's engagement includes the review and assessment of Fidelity's methodologies used in determining the revenues and expenses attributable to Fidelity's mutual fund business, and completion of agreed-upon procedures surrounding the mathematical accuracy of fund profitability and its conformity to allocation methodologies. After considering PwC's reports issued under the engagement and information provided by Fidelity, the Board believes that while other allocation methods may also be reasonable, Fidelity's profitability methodologies are reasonable in all material respects.
The Board has also reviewed Fidelity's non-fund businesses and any fall-out benefits related to the mutual fund business as well as cases where Fidelity's affiliates may benefit from or be related to the fund's business.
The Board considered the costs of the services provided by and the profits realized by Fidelity in connection with the operation of the fund and determined that the amount of profit is a fair entrepreneurial profit for the management of the fund.
Economies of Scale. The Board considered whether there have been economies of scale in respect of the management of the Fidelity funds, whether the Fidelity funds (including the fund) have appropriately benefited from any such economies of scale, and whether there is potential for realization of any further economies of scale. The Board considered the extent to which the fund will benefit from economies of scale through increased services to the fund, through waivers or reimbursements, or through fee or expense reductions, including reductions that occur through operation of the transfer agent agreement. The transfer agent fee varies in part based on the number of accounts in the fund. If the number of accounts decreases or the average account size increases, the overall transfer agent fee rate decreases.
Annual Report
Board Approval of Investment Advisory Contracts and
Management Fees - continued
The Board recognized that the fund's management contract incorporates a "group fee" structure, which provides for lower group fee rates as total fund assets under FMR's management increase, and for higher group fee rates as total fund assets under FMR's management decrease. FMR determines the group fee rates based on a tiered asset "breakpoint" schedule. In connection with the renewal of the fund's management contract, the Board approved amendments to the fund's management contract that added four new fee breakpoints to the group fee rate schedule for assets under FMR's management above $1,386 billion. The Board considered that the group fee rate declines under both the present and amended schedules, but that under the amended schedule, the group fee rate declines faster as assets under FMR's management exceed $1,386 billion. The Board considered that the group fee is designed to deliver the benefits of economies of scale to fund shareholders when total fund assets increase, even if assets of any particular fund are unchanged or have declined, because some portion of Fidelity's costs are attributable to services provided to all Fidelity funds, and all funds benefit if those costs can be allocated among more assets. The Board concluded that, given the group fee structure, fund shareholders will achieve a certain level of economies of scale as assets under FMR's management increase at the fund complex level, regardless of whether Fidelity achieves any such economies of scale.
The Board further concluded that any potential economies of scale are being shared between fund shareholders and Fidelity in an appropriate manner.
Additional Information Requested by the Board. In order to develop fully the factual basis for consideration of the Fidelity funds' Advisory Contracts, the Board requested and received additional information on several topics, including (i) fund performance trends and actions to be taken by FMR to improve certain funds' overall performance; (ii) Fidelity's portfolio manager compensation structure, including its effects on fund profitability and the extent to which portfolio manager compensation is linked to fund performance; (iii) Fidelity's fee structures; (iv) the funds' sub-advisory arrangements; and (v) accounts managed by Fidelity other than the Fidelity funds.
Based on its evaluation of all of the conclusions noted above, and after considering all material factors, the Board ultimately concluded that the advisory fee structures are fair and reasonable, and that the fund's Advisory Contracts should be renewed.
Annual Report
Managing Your Investments
Fidelity offers several ways to conveniently manage your personal investments via your telephone or PC. You can access your account information, conduct trades and research your investments 24 hours a day.
By Phone
Fidelity Automated Service Telephone provides a single toll-free number to access account balances, positions, quotes and trading. It's easy to navigate the service, and on your first call, the system will help you create a personal identification number (PIN) for security.
(phone_graphic)
Fidelity Automated
Service Telephone (FAST®)
1-800-544-5555
Press
1 For mutual fund and brokerage trading.
2 For quotes.*
3 For account balances and holdings.
4 To review orders and mutual
fund activity.
5 To change your PIN.
*0 To speak to a Fidelity representative.
By PC
Fidelity's web site on the Internet provides a wide range of information, including daily financial news, fund performance, interactive planning tools and news about Fidelity products and services.
(computer_graphic)
Fidelity's Web Site
www.fidelity.com
* When you call the quotes line, please remember that a fund's yield and return will vary and, except for money market funds, share price will also vary. This means that you may have a gain or loss when you sell your shares. There is no assurance that money market funds will be able to maintain a stable $1 share price; an investment in a money market fund is not insured or guaranteed by the U.S. government. Total returns are historical and include changes in share price, reinvestment of dividends and capital gains, and the effects of any sales charges.
Annual Report
To Visit Fidelity
For directions and hours,
please call 1-800-544-9797.
Arizona
7001 West Ray Road
Chandler, AZ
15445 N. Scottsdale Road
Scottsdale, AZ
California
815 East Birch Street
Brea, CA
1411 Chapin Avenue
Burlingame, CA
851 East Hamilton Avenue
Campbell, CA
19200 Von Karman Avenue
Irvine, CA
601 Larkspur Landing Circle
Larkspur, CA
10100 Santa Monica Blvd.
Los Angeles, CA
27101 Puerta Real
Mission Viejo, CA
73-575 El Paseo
Palm Desert, CA
251 University Avenue
Palo Alto, CA
123 South Lake Avenue
Pasadena, CA
16995 Bernardo Ctr. Drive
Rancho Bernardo, CA
1220 Roseville Parkway
Roseville, CA
1740 Arden Way
Sacramento, CA
7676 Hazard Center Drive
San Diego, CA
11943 El Camino Real
San Diego, CA
8 Montgomery Street
San Francisco, CA
3793 State Street
Santa Barbara, CA
1200 Wilshire Boulevard
Santa Monica, CA
21701 Hawthorne Boulevard
Torrance, CA
2001 North Main Street
Walnut Creek, CA
6300 Canoga Avenue
Woodland Hills, CA
Colorado
1625 Broadway
Denver, CO
9185 Westview Road
Lone Tree, CO
Connecticut
48 West Putnam Avenue
Greenwich, CT
265 Church Street
New Haven, CT
300 Atlantic Street
Stamford, CT
29 South Main Street
West Hartford, CT
Delaware
400 Delaware Avenue
Wilmington, DE
Florida
4400 N. Federal Highway
Boca Raton, FL
121 Alhambra Plaza
Coral Gables, FL
2948 N. Federal Highway
Ft. Lauderdale, FL
4671 Town Center Parkway
Jacksonville, FL
1907 West State Road 434
Longwood, FL
8880 Tamiami Trail, North
Naples, FL
3501 PGA Boulevard
Palm Beach Gardens, FL
3550 Tamiami Trail, South
Sarasota, FL
1502 N. Westshore Blvd.
Tampa, FL
2465 State Road 7
Wellington, FL
Georgia
3445 Peachtree Road, N.E.
Atlanta, GA
1000 Abernathy Road
Atlanta, GA
Illinois
One North LaSalle Street
Chicago, IL
875 North Michigan Ave.
Chicago, IL
1415 West 22nd Street
Oak Brook, IL
1572 East Golf Road
Schaumburg, IL
3232 Lake Avenue
Wilmette, IL
Indiana
4729 East 82nd Street
Indianapolis, IN
Kansas
5400 College Boulevard
Overland Park, KS
Maine
Three Canal Plaza
Portland, ME
Maryland
7315 Wisconsin Avenue
Bethesda, MD
One W. Pennsylvania Ave.
Towson, MD
Massachusetts
801 Boylston Street
Boston, MA
155 Congress Street
Boston, MA
300 Granite Street
Braintree, MA
44 Mall Road
Burlington, MA
238 Main Street
Cambridge, MA
405 Cochituate Road
Framingham, MA
416 Belmont Street
Worcester, MA
Annual Report
Michigan
500 E. Eisenhower Pkwy.
Ann Arbor, MI
280 Old N. Woodward Ave.
Birmingham, MI
43420 Grand River Avenue
Novi, MI
29155 Northwestern Hwy.
Southfield, MI
Minnesota
7600 France Avenue South
Edina, MN
Missouri
1524 South Lindbergh Blvd.
St. Louis, MO
Nevada
2225 Village Walk Drive
Henderson, NV
New Jersey
150 Essex Street
Millburn, NJ
56 South Street
Morristown, NJ
396 Route 17, North
Paramus, NJ
3518 Route 1 North
Princeton, NJ
530 Broad Street
Shrewsbury, NJ
New York
1055 Franklin Avenue
Garden City, NY
37 West Jericho Turnpike
Huntington Station, NY
1271 Avenue of the Americas
New York, NY
980 Madison Avenue
New York, NY
61 Broadway
New York, NY
350 Park Avenue
New York, NY
200 Fifth Avenue
New York, NY
733 Third Avenue
New York, NY
11 Penn Plaza
New York, NY
2070 Broadway
New York, NY
1075 Northern Blvd.
Roslyn, NY
799 Central Park Avenue
Scarsdale, NY
North Carolina
4611 Sharon Road
Charlotte, NC
7011 Fayetteville Road
Durham, NC
Ohio
3805 Edwards Road
Cincinnati, OH
1324 Polaris Parkway
Columbus, OH
28699 Chagrin Boulevard
Woodmere Village, OH
Oregon
7493 SW Bridgeport Road
Tigard, OR
Pennsylvania
600 West DeKalb Pike
King of Prussia, PA
1735 Market Street
Philadelphia, PA
12001 Perry Highway
Wexford, PA
Rhode Island
47 Providence Place
Providence, RI
Tennessee
6150 Poplar Avenue
Memphis, TN
Texas
10000 Research Boulevard
Austin, TX
4001 Northwest Parkway
Dallas, TX
12532 Memorial Drive
Houston, TX
2701 Drexel Drive
Houston, TX
6560 Fannin Street
Houston, TX
6500 N. MacArthur Blvd.
Irving, TX
6005 West Park Boulevard
Plano, TX
14100 San Pedro
San Antonio, TX
1576 East Southlake Blvd.
Southlake, TX
19740 IH 45 North
Spring, TX
Utah
279 West South Temple
Salt Lake City, UT
Virginia
1861 International Drive
McLean, VA
Washington
411 108th Avenue, N.E.
Bellevue, WA
1518 6th Avenue
Seattle, WA
Washington, DC
1900 K Street, N.W.
Washington, DC
Wisconsin
595 North Barker Road
Brookfield, WI
Fidelity Brokerage Services, Inc., 100 Summer St., Boston, MA 02110 Member NYSE/SIPC
Annual Report
To Write Fidelity
We'll give your correspondence immediate attention and send you written confirmation upon completion of your request.
(letter_graphic)
Making Changes
To Your Account
(such as changing name, address, bank, etc.)
Fidelity Investments
P.O. Box 770001
Cincinnati, OH 45277-0002
(letter_graphic)
For Non-Retirement
Accounts
Buying shares
Fidelity Investments
P.O. Box 770001
Cincinnati, OH 45277-0003
Overnight Express
Fidelity Investments
Attn: Distribution Services
100 Crosby Parkway - KC1H
Covington, KY 41015
Selling shares
Fidelity Investments
P.O. Box 770001
Cincinnati, OH 45277-0035
Overnight Express
Fidelity Investments
Attn: Distribution Services
100 Crosby Parkway - KC1H
Covington, KY 41015
General Correspondence
Fidelity Investments
P.O. Box 500
Merrimack, NH 03054-0500
(letter_graphic)
For Retirement
Accounts
Buying shares
Fidelity Investments
P.O. Box 770001
Cincinnati, OH 45277-0003
Selling shares
Fidelity Investments
P.O. Box 770001
Cincinnati, OH 45277-0035
Overnight Express
Fidelity Investments
Attn: Distribution Services
100 Crosby Parkway - KC1H
Covington, KY 41015
General Correspondence
Fidelity Investments
P.O. Box 500
Merrimack, NH 03054-0500
Annual Report
Annual Report
Investment Adviser
Fidelity Management & Research Company
Boston, MA
Investment Sub-Advisers
FMR Co., Inc.
Fidelity Research & Analysis Company
Fidelity Management & Research
(U.K.) Inc.
Fidelity Investments Japan Limited
Fidelity International Investment
Advisors
Fidelity International Investment
Advisors (U.K.) Limited
General Distributor
Fidelity Distributors Corporation
Boston, MA
Transfer and Service Agent
Fidelity Service Company, Inc.
Boston, MA
Custodian
Brown Brothers Harriman & Co.
Boston, MA
The Fidelity Telephone Connection
Mutual Fund 24-Hour Service
Exchanges/Redemptions
and Account Assistance 1-800-544-6666
Product Information 1-800-544-6666
Retirement Accounts 1-800-544-4774
(8 a.m. - 9 p.m.)
TDD Service 1-800-544-0118
for the deaf and hearing impaired
(9 a.m. - 9 p.m. Eastern time)
Fidelity Automated Service
Telephone (FAST®) (automated graphic) 1-800-544-5555
(automated graphic) Automated line for quickest service
BCV-UANN-0907
1.789709.104
(Fidelity Investment logo)(registered trademark)
Corporate Headquarters
82 Devonshire St., Boston, MA 02109
www.fidelity.com
Fidelity®
Dividend Growth
Fund
Annual Report
July 31, 2007
(2_fidelity_logos) (Registered_Trademark)
Contents
Chairman's Message | <Click Here> | Ned Johnson's message to shareholders. |
Performance | <Click Here> | How the fund has done over time. |
Management's Discussion | <Click Here> | The manager's review of fund performance, strategy and outlook. |
Shareholder Expense Example | <Click Here> | An example of shareholder expenses. |
Investment Changes | <Click Here> | A summary of major shifts in the fund's investments over the past six months. |
Investments | <Click Here> | A complete list of the fund's investments with their market values. |
Financial Statements | <Click Here> | Statements of assets and liabilities, operations, and changes in net assets,
as well as financial highlights. |
Notes | <Click Here> | Notes to the financial statements. |
Report of Independent Registered Public Accounting Firm | <Click Here> | |
Trustees and Officers | <Click Here> | |
Distributions | <Click Here> | |
Board Approval of Investment Advisory Contracts and Management Fees | <Click Here> | |
To view a fund's proxy voting guidelines and proxy voting record for the 12-month period ended June 30, visit http://www.fidelity.com (search for "proxy voting guidelines") or visit the Securities and Exchange Commission's (SEC) web site at http://www.sec.gov. You may also call 1-800-544-8544 to request a free copy of the proxy voting guidelines.
Standard & Poor's, S&P and S&P 500 are registered service marks of The McGraw-Hill Companies, Inc. and have been licensed for use by Fidelity Distributors Corporation.
Other third party marks appearing herein are the property of their respective owners.
All other marks appearing herein are registered or unregistered trademarks or service marks of FMR Corp. or an affiliated company.
Annual Report
This report and the financial statements contained herein are submitted for the general information of the shareholders of the fund. This report is not authorized for distribution to prospective investors in the fund unless preceded or accompanied by an effective prospectus.
A fund files its complete schedule of portfolio holdings with the SEC for the first and third quarters of each fiscal year on Form N-Q. Forms N-Q are available on the SEC's web site at http://www.sec.gov. A fund's Forms N-Q may be reviewed and copied at the SEC's Public Reference Room in Washington, DC. Information regarding the operation of the SEC's Public Reference Room may be obtained by calling 1-800-SEC-0330. For a complete list of a fund's portfolio holdings, view the most recent holdings listing, semiannual report, or annual report on Fidelity's web site at http://www.fidelity.com or http://www.advisor.fidelity.com, as applicable.
NOT FDIC INSURED · MAY LOSE VALUE · NO BANK GUARANTEE
Neither the fund nor Fidelity Distributors Corporation is a bank.
Annual Report
Chairman's Message
(photo_of_Edward_C_Johnson_3d)
Dear Shareholder:
Stocks are currently on pace to register their fifth straight year of positive returns, although gains could be trimmed if the U.S. economy continues to slow. While financial markets are always unpredictable, there are a number of time-tested principles that can put the historical odds in your favor.
One of the basic tenets is to invest for the long term. Over time, riding out the markets' inevitable ups and downs has proven much more effective than selling into panic or chasing the hottest trend. Even missing only a few of the markets' best days can significantly diminish investor returns. Patience also affords the benefits of compounding - of earning interest on additional income or reinvested dividends and capital gains. There are tax advantages and cost benefits to consider as well. The more you sell, the more taxes you pay, and the more you trade, the higher the costs. While staying the course doesn't eliminate risk, it can considerably lessen the effect of short-term declines.
You can further manage your investing risk through diversification. And today, more than ever, geographic diversification should be taken into account. Studies indicate that asset allocation is the single most important determinant of a portfolio's long-term success. The right mix of stocks, bonds and cash - aligned to your particular risk tolerance and investment objective - is very important. Age-appropriate rebalancing is also an essential aspect of asset allocation. For younger investors, an emphasis on equities - which historically have been the best-performing asset class over time - is encouraged. As investors near their specific goal, such as retirement or sending a child to college, consideration may be given to replacing volatile assets (e.g. common stocks) with more-stable fixed investments (bonds or savings plans).
A third investment principle - investing regularly - can help lower the average cost of your purchases. Investing a certain amount of money each month or quarter helps ensure you won't pay for all your shares at market highs. This strategy - known as dollar cost averaging - also reduces unconstructive "emotion" from investing, helping shareholders avoid selling weak performers just prior to an upswing, or chasing a hot performer just before a correction.
We invite you to contact us via the Internet, through our Investor Centers or over the phone. It is our privilege to provide you the information you need to make the investments that are right for you.
Sincerely,
/s/Edward C. Johnson 3d
Edward C. Johnson 3d
Annual Report
Performance: The Bottom Line
Average annual total return reflects the change in the value of an investment, assuming reinvestment of the fund's dividend income and capital gains (the profits earned upon the sale of securities that have grown in value) and assuming a constant rate of performance each year. The $10,000 table and the fund's returns do not reflect the deduction of taxes that a shareholder would pay on fund distributions or the redemption of fund shares. During periods of reimbursement by Fidelity, a fund's total return will be greater than it would be had the reimbursement not occurred. How a fund did yesterday is no guarantee of how it will do tomorrow.
Average Annual Total Returns
Periods ended July 31, 2007 | Past 1
year | Past 5
years | Past 10
years |
Fidelity® Dividend Growth Fund | 15.62% | 10.20% | 7.62% |
$10,000 Over 10 Years
Let's say hypothetically that $10,000 was invested in Fidelity® Dividend Growth Fund on July 31, 1997. The chart shows how the value of your investment would have changed, and also shows how the Standard & Poor's 500SM Index performed over the same period.
Annual Report
Management's Discussion of Fund Performance
Comments from Charles Mangum, Portfolio Manager of Fidelity® Dividend Growth Fund
Major U.S. equity benchmarks approached or exceeded gains of 20% and several set record highs during the 12-month period ending July 31, 2007. In that time, the Dow Jones Industrial AverageSM rose 20.84%, the Standard & Poor's 500SM Index advanced 16.13% and the NASDAQ Composite® Index gained 22.67%. The small-cap Russell 2000® Index fared less well after falling nearly 7% in July, but still returned 12.12% for the year overall. The first half of the period featured six consecutive months of positive returns spurred by the more relaxed monetary policy of the Federal Reserve Board and falling energy prices, which softened inflationary pressures on the U.S. economy. Stocks slipped in February, however, as energy prices crept higher, the housing market slumped, subprime mortgage woes mounted and the Chinese stock market declined 9% in a single day. But equities soared again from March through May, as reflected by the Dow and the S&P 500®, which climbed nearly 12% and more than 9%, respectively. In June and July, though, stocks sank again on inflation concerns and a worsening subprime loan crisis.
Dividend Growth gained 15.62% for the year, just slightly behind the S&P 500's return. The biggest drag on relative performance came from health care, one of the weakest sectors in the index, where a substantial overweighting and owning some of the wrong names - such as health care supplies distributor Cardinal Health, products giant Johnson & Johnson and pharmaceuticals firm Wyeth - took away from our results. Having almost no stake in the materials sector - which led the index during the period - also hurt, as did overweightings in the insurance segment of financials and the food and staples retailing group of consumer staples. Positions in insurance giant American International Group and diversified financials firm Bank of America detracted as well. On the plus side, the fund's relative return was aided by a combination of favorable security selection and opportune sector weightings in pockets of consumer discretionary, information technology, energy, financials and telecommunication services. Telecom giant AT&T and media and entertainment company Clear Channel Communications were among the top contributors to relative performance, along with out-of-index energy services firms Diamond Offshore Drilling and GlobalSantaFe.
The views expressed above reflect those of the portfolio manager(s) only through the end of the period as stated on the cover of this report and do not necessarily represent the views of Fidelity or any other person in the Fidelity organization. Any such views are subject to change at any time based upon market or other conditions and Fidelity disclaims any responsibility to update such views. These views may not be relied on as investment advice and, because investment decisions for a Fidelity fund are based on numerous factors, may not be relied on as an indication of trading intent on behalf of any Fidelity fund.
Annual Report
Shareholder Expense Example
As a shareholder of the Fund, you incur two types of costs: (1) transaction costs, and (2) ongoing costs, including management fees and other Fund expenses. This Example is intended to help you understand your ongoing costs (in dollars) of investing in the Fund and to compare these costs with the ongoing costs of investing in other mutual funds.
The Example is based on an investment of $1,000 invested at the beginning of the period and held for the entire period (February 1, 2007 to July 31, 2007).
Actual Expenses
The first line of the accompanying table provides information about actual account values and actual expenses. You may use the information in this line, together with the amount you invested, to estimate the expenses that you paid over the period. Simply divide your account value by $1,000.00 (for example, an $8,600 account value divided by $1,000.00 = 8.6), then multiply the result by the number in the first line under the heading entitled "Expenses Paid During Period" to estimate the expenses you paid on your account during this period. A small balance maintenance fee of $12.00 that is charged once a year may apply for certain accounts with a value of less than $2,000. This fee is not included in the table below. If it was, the estimate of expenses you paid during the period would be higher, and your ending account value lower, by this amount. In addition, the Fund, as a shareholder in the underlying Fidelity Central Funds, will indirectly bear its pro rata share of the fees and expenses incurred by the underlying Fidelity Central Funds. These fees and expenses are not included in the Fund's annualized expense ratio used to calculate the expense estimate in the table below.
Hypothetical Example for Comparison Purposes
The second line of the accompanying table provides information about hypothetical account values and hypothetical expenses based on the Fund's actual expense ratio and an assumed rate of return of 5% per year before expenses, which is not the Fund's actual return. The hypothetical account values and expenses may not be used to estimate the actual ending account balance or expenses you paid for the period. You may use this information to compare the ongoing costs of investing in the Fund and other funds. To do so, compare this 5% hypothetical example with the 5% hypothetical examples that appear in the shareholder reports of the other funds. A small balance maintenance fee of $12.00 that is charged once a year may apply for certain accounts with a value of less than $2,000. This fee is not included in the table below. If it was, the estimate of expenses you paid during the period would be higher, and your ending account value lower, by this amount. In addition, the Fund, as a shareholder in the underlying Fidelity Central Funds, will indirectly bear its pro rata share of the fees and expenses incurred by the underlying Fidelity Central Funds. These fees and expenses are not included in the Fund's annualized expense ratio used to calculate the expense estimate in the table below.
Annual Report
Shareholder Expense Example - continued
Please note that the expenses shown in the table are meant to highlight your ongoing costs only and do not reflect any transaction costs. Therefore, the second line of the table is useful in comparing ongoing costs only, and will not help you determine the relative total costs of owning different funds.
| Beginning
Account Value
February 1, 2007 | Ending
Account Value
July 31, 2007 | Expenses Paid
During Period*
February 1, 2007
to July 31, 2007 |
Actual | $ 1,000.00 | $ 1,019.90 | $ 3.11 |
Hypothetical (5% return per year before expenses) | $ 1,000.00 | $ 1,021.72 | $ 3.11 |
* Expenses are equal to the Fund's annualized expense ratio of .62%; multiplied by the average account value over the period, multiplied by 181/365 (to reflect the one-half year period).
Annual Report
Investment Changes
Top Ten Stocks as of July 31, 2007 |
| % of fund's
net assets | % of fund's net assets
6 months ago |
Cardinal Health, Inc. | 7.0 | 7.6 |
American International Group, Inc. | 6.0 | 6.1 |
Johnson & Johnson | 5.6 | 4.3 |
Bank of America Corp. | 5.0 | 3.7 |
AT&T, Inc. | 4.9 | 5.1 |
General Electric Co. | 4.4 | 4.4 |
Clear Channel Communications, Inc. | 4.2 | 4.7 |
Wyeth | 3.7 | 4.9 |
Wal-Mart Stores, Inc. | 3.1 | 4.7 |
International Business Machines Corp. | 2.8 | 2.4 |
| 46.7 | |
Top Five Market Sectors as of July 31, 2007 |
| % of fund's
net assets | % of fund's net assets
6 months ago |
Financials | 21.8 | 21.3 |
Information Technology | 19.0 | 15.5 |
Health Care | 18.6 | 19.8 |
Consumer Discretionary | 11.3 | 11.4 |
Industrials | 8.4 | 8.6 |
Asset Allocation (% of fund's net assets) |
As of July 31, 2007* | As of January 31, 2007** |
| Stocks 96.8% | | | Stocks 96.9% | |
 | Convertible
Securities 0.6% | | | Convertible
Securities 0.6% | |
| Short-Term
Investments and
Net Other Assets 2.6% | | | Short-Term
Investments and
Net Other Assets 2.5% | |
* Foreign investments | 3.4% | | ** Foreign investments | 3.7% | |

Annual Report
Investments July 31, 2007
Showing Percentage of Net Assets
Common Stocks - 96.8% |
| Shares | | Value (000s) |
CONSUMER DISCRETIONARY - 11.0% |
Hotels, Restaurants & Leisure - 0.1% |
McDonald's Corp. | 246,700 | | $ 11,810 |
Media - 7.2% |
Clear Channel Communications, Inc. | 18,585,931 | | 685,821 |
News Corp. Class A | 1,085,800 | | 22,932 |
Time Warner, Inc. | 23,159,500 | | 446,052 |
Viacom, Inc. Class B (non-vtg.) (a) | 640,904 | | 24,547 |
| | 1,179,352 |
Multiline Retail - 0.7% |
Target Corp. | 1,817,325 | | 110,075 |
Specialty Retail - 3.0% |
Gap, Inc. | 2,502,200 | | 43,038 |
Home Depot, Inc. | 12,075,400 | | 448,843 |
| | 491,881 |
TOTAL CONSUMER DISCRETIONARY | | 1,793,118 |
CONSUMER STAPLES - 5.9% |
Food & Staples Retailing - 5.1% |
CVS Caremark Corp. | 9,115,900 | | 320,789 |
Wal-Mart Stores, Inc. (d) | 11,209,372 | | 515,071 |
| | 835,860 |
Household Products - 0.6% |
Procter & Gamble Co. | 1,532,400 | | 94,794 |
Tobacco - 0.2% |
Altria Group, Inc. | 438,800 | | 29,167 |
TOTAL CONSUMER STAPLES | | 959,821 |
ENERGY - 6.3% |
Energy Equipment & Services - 3.3% |
Diamond Offshore Drilling, Inc. | 3,198,400 | | 330,011 |
GlobalSantaFe Corp. | 2,455,429 | | 176,079 |
Halliburton Co. (d) | 1,044,800 | | 37,634 |
| | 543,724 |
Oil, Gas & Consumable Fuels - 3.0% |
Chesapeake Energy Corp. (d) | 1,518,200 | | 51,680 |
ConocoPhillips | 2,145,525 | | 173,444 |
EOG Resources, Inc. | 288,200 | | 20,203 |
Marathon Oil Corp. | 593,400 | | 32,756 |
Common Stocks - continued |
| Shares | | Value (000s) |
ENERGY - continued |
Oil, Gas & Consumable Fuels - continued |
Quicksilver Resources, Inc. (a) | 476,900 | | $ 20,087 |
Ultra Petroleum Corp. (a) | 834,300 | | 46,128 |
Valero Energy Corp. | 1,759,700 | | 117,917 |
XTO Energy, Inc. | 367,900 | | 20,062 |
| | 482,277 |
TOTAL ENERGY | | 1,026,001 |
FINANCIALS - 21.8% |
Capital Markets - 1.6% |
Bank New York Mellon Corp. | 1,629,607 | | 69,340 |
Franklin Resources, Inc. | 100,600 | | 12,813 |
Goldman Sachs Group, Inc. | 231,100 | | 43,525 |
KKR Private Equity Investors, LP | 605,700 | | 12,356 |
KKR Private Equity Investors, LP Restricted Depositary Units (e) | 2,296,400 | | 46,847 |
Merrill Lynch & Co., Inc. | 708,700 | | 52,586 |
State Street Corp. | 399,800 | | 26,799 |
| | 264,266 |
Commercial Banks - 2.8% |
PNC Financial Services Group, Inc. | 3,208,207 | | 213,827 |
U.S. Bancorp, Delaware | 683,900 | | 20,483 |
Wachovia Corp. | 4,724,571 | | 223,047 |
Wells Fargo & Co. | 74,200 | | 2,506 |
| | 459,863 |
Consumer Finance - 0.7% |
American Express Co. | 1,772,400 | | 103,756 |
Capital One Financial Corp. (d) | 184,600 | | 13,062 |
| | 116,818 |
Diversified Financial Services - 5.3% |
Bank of America Corp. | 17,009,603 | | 806,595 |
Citigroup, Inc. | 1,012,539 | | 47,154 |
| | 853,749 |
Insurance - 11.3% |
ACE Ltd. | 2,136,500 | | 123,319 |
AFLAC, Inc. | 290,600 | | 15,146 |
AMBAC Financial Group, Inc. | 194,400 | | 13,054 |
American International Group, Inc. | 15,167,600 | | 973,457 |
Hartford Financial Services Group, Inc. | 4,402,420 | | 404,450 |
MBIA, Inc. | 1,049,000 | | 58,849 |
Common Stocks - continued |
| Shares | | Value (000s) |
FINANCIALS - continued |
Insurance - continued |
MetLife, Inc. | 2,387,100 | | $ 143,751 |
PartnerRe Ltd. | 280,400 | | 19,917 |
The Chubb Corp. | 1,742,700 | | 87,850 |
| | 1,839,793 |
Thrifts & Mortgage Finance - 0.1% |
Fannie Mae | 254,433 | | 15,225 |
TOTAL FINANCIALS | | 3,549,714 |
HEALTH CARE - 18.6% |
Biotechnology - 0.3% |
Amgen, Inc. (a) | 715,624 | | 38,458 |
Health Care Providers & Services - 7.0% |
Cardinal Health, Inc. | 17,341,770 | | 1,139,871 |
UnitedHealth Group, Inc. | 39,200 | | 1,898 |
| | 1,141,769 |
Pharmaceuticals - 11.3% |
Johnson & Johnson | 15,154,232 | | 916,831 |
Merck & Co., Inc. | 4,299,005 | | 213,446 |
Schering-Plough Corp. | 3,876,530 | | 110,636 |
Wyeth | 12,259,260 | | 594,819 |
| | 1,835,732 |
TOTAL HEALTH CARE | | 3,015,959 |
INDUSTRIALS - 8.4% |
Aerospace & Defense - 1.7% |
General Dynamics Corp. | 599,455 | | 47,093 |
Honeywell International, Inc. | 2,240,200 | | 128,834 |
Raytheon Co. | 1,870,000 | | 103,523 |
| | 279,450 |
Air Freight & Logistics - 1.0% |
United Parcel Service, Inc. Class B | 2,179,790 | | 165,054 |
Industrial Conglomerates - 4.9% |
3M Co. | 328,300 | | 29,192 |
General Electric Co. | 18,600,880 | | 720,970 |
Tyco International Ltd. | 1,027,572 | | 48,594 |
| | 798,756 |
Common Stocks - continued |
| Shares | | Value (000s) |
INDUSTRIALS - continued |
Machinery - 0.8% |
Illinois Tool Works, Inc. | 1,992,874 | | $ 109,708 |
Ingersoll-Rand Co. Ltd. Class A | 335,000 | | 16,857 |
| | 126,565 |
TOTAL INDUSTRIALS | | 1,369,825 |
INFORMATION TECHNOLOGY - 19.0% |
Communications Equipment - 4.4% |
Cisco Systems, Inc. (a) | 11,387,100 | | 329,201 |
Motorola, Inc. | 20,455,220 | | 347,534 |
QUALCOMM, Inc. | 1,017,400 | | 42,375 |
| | 719,110 |
Computers & Peripherals - 5.4% |
Dell, Inc. (a) | 5,751,400 | | 160,867 |
EMC Corp. (a) | 1,513,600 | | 28,017 |
Hewlett-Packard Co. | 4,942,200 | | 227,489 |
International Business Machines Corp. | 4,198,019 | | 464,511 |
| | 880,884 |
Electronic Equipment & Instruments - 0.2% |
Tyco Electronics Ltd. (a) | 1,027,572 | | 36,808 |
IT Services - 0.7% |
Accenture Ltd. Class A | 496,310 | | 20,910 |
The Western Union Co. | 4,463,394 | | 89,045 |
| | 109,955 |
Semiconductors & Semiconductor Equipment - 4.3% |
Altera Corp. | 294,600 | | 6,835 |
Analog Devices, Inc. | 1,329,400 | | 47,127 |
Applied Materials, Inc. | 5,875,800 | | 129,503 |
Intel Corp. | 11,561,700 | | 273,087 |
KLA-Tencor Corp. | 75,300 | | 4,276 |
Lam Research Corp. (a) | 1,136,693 | | 65,746 |
Linear Technology Corp. (d) | 2,279,619 | | 81,268 |
National Semiconductor Corp. | 1,372,777 | | 35,678 |
Taiwan Semiconductor Manufacturing Co. Ltd. sponsored ADR | 2,558,969 | | 25,974 |
Texas Instruments, Inc. | 694,200 | | 24,429 |
| | 693,923 |
Software - 4.0% |
BEA Systems, Inc. (a) | 3,976,400 | | 49,228 |
Microsoft Corp. | 12,535,087 | | 363,392 |
Common Stocks - continued |
| Shares | | Value (000s) |
INFORMATION TECHNOLOGY - continued |
Software - continued |
Oracle Corp. (a) | 10,968,700 | | $ 209,722 |
Symantec Corp. (a) | 1,497,737 | | 28,757 |
| | 651,099 |
TOTAL INFORMATION TECHNOLOGY | | 3,091,779 |
TELECOMMUNICATION SERVICES - 5.8% |
Diversified Telecommunication Services - 5.4% |
AT&T, Inc. | 20,276,884 | | 794,043 |
Qwest Communications International, Inc. (a) | 9,543,400 | | 81,405 |
| | 875,448 |
Wireless Telecommunication Services - 0.4% |
Sprint Nextel Corp. | 3,337,686 | | 68,523 |
TOTAL TELECOMMUNICATION SERVICES | | 943,971 |
TOTAL COMMON STOCKS (Cost $12,984,034) | 15,750,188 |
Convertible Preferred Stocks - 0.2% |
| | | |
CONSUMER DISCRETIONARY - 0.2% |
Automobiles - 0.2% |
Ford Motor Co. Capital Trust II 6.50% | 747,200 | | 29,029 |
TOTAL CONVERTIBLE PREFERRED STOCKS (Cost $24,978) | 29,029 |
Convertible Bonds - 0.4% |
| Principal Amount (000s) | | |
CONSUMER DISCRETIONARY - 0.1% |
Automobiles - 0.1% |
Ford Motor Co. 4.25% 12/15/36 | | $ 12,030 | | 13,844 |
Convertible Bonds - continued |
| Principal Amount (000s) | | Value (000s) |
TELECOMMUNICATION SERVICES - 0.3% |
Diversified Telecommunication Services - 0.3% |
Qwest Communications International, Inc. 3.5% 11/15/25 | | $ 36,750 | | $ 58,513 |
TOTAL CONVERTIBLE BONDS (Cost $48,780) | 72,357 |
U.S. Treasury Obligations - 0.1% |
|
U.S. Treasury Bills, yield at date of purchase 4.51% to 4.61% 9/6/07
(Cost $15,011) | | 15,080 | | 15,005 |
Money Market Funds - 3.2% |
| Shares | | |
Fidelity Cash Central Fund, 5.38% (b) | 395,808,540 | | 395,809 |
Fidelity Securities Lending Cash Central Fund, 5.39% (b)(c) | 117,739,400 | | 117,739 |
TOTAL MONEY MARKET FUNDS (Cost $513,548) | 513,548 |
TOTAL INVESTMENT PORTFOLIO - 100.7% (Cost $13,586,351) | | 16,380,127 |
NET OTHER ASSETS - (0.7)% | | (115,465) |
NET ASSETS - 100% | $ 16,264,662 |
Legend |
(a) Non-income producing |
(b) Affiliated fund that is available only to investment companies and other accounts managed by Fidelity Investments. The rate quoted is the annualized seven-day yield of the fund at period end. A complete unaudited listing of the fund's holdings as of its most recent quarter end is available upon request. |
(c) Investment made with cash collateral received from securities on loan. |
(d) Security or a portion of the security is on loan at period end. |
(e) Security exempt from registration under Rule 144A of the Securities Act of 1933. These securities may be resold in transactions exempt from registration, normally to qualified institutional buyers. At the end of the period, the value of these securities amounted to $46,847,000 or 0.3% of net assets. |
Affiliated Central Funds |
Information regarding fiscal year to date income earned by the Fund from investments in Fidelity Central Funds is as follows: |
Fund | Income earned
(Amounts in thousands) |
Fidelity Cash Central Fund | $ 21,191 |
Fidelity Securities Lending Cash Central Fund | 260 |
Total | $ 21,451 |
Other Affiliated Issuers |
An affiliated company is a company in which the fund has ownership of at least 5% of the voting securities. Fiscal year to date transactions with companies which are or were affiliates are as follows: |
Affiliate
(Amounts in thousands) | Value, beginning of period | Purchases | Sales Proceeds | Dividend Income | Value,
end of
period |
Clear Channel Outdoor Holding, Inc. Class A | $ 46,412 | $ 8,523 | $ 64,661 | $ - | $ - |
See accompanying notes which are an integral part of the financial statements.
Annual Report
Financial Statements
Statement of Assets and Liabilities
Amounts in thousands (except per-share amount) | July 31, 2007 |
| | |
Assets | | |
Investment in securities, at value (including securities loaned of $113,096) - See accompanying schedule: Unaffiliated issuers (cost $13,072,803) | $ 15,866,579 | |
Fidelity Central Funds (cost $513,548) | 513,548 | |
Total Investments (cost $13,586,351) | | $ 16,380,127 |
Receivable for investments sold | | 59,772 |
Receivable for fund shares sold | | 11,566 |
Dividends receivable | | 10,835 |
Interest receivable | | 332 |
Distributions receivable from Fidelity Central Funds | | 1,421 |
Prepaid expenses | | 29 |
Other receivables | | 11,954 |
Total assets | | 16,476,036 |
| | |
Liabilities | | |
Payable for investments purchased | $ 72,566 | |
Payable for fund shares redeemed | 11,558 | |
Accrued management fee | 6,007 | |
Other affiliated payables | 3,163 | |
Other payables and accrued expenses | 341 | |
Collateral on securities loaned, at value | 117,739 | |
Total liabilities | | 211,374 |
| | |
Net Assets | | $ 16,264,662 |
Net Assets consist of: | | |
Paid in capital | | $ 12,446,494 |
Undistributed net investment income | | 139,799 |
Accumulated undistributed net realized gain (loss) on investments and foreign currency transactions | | 884,593 |
Net unrealized appreciation (depreciation) on investments and assets and liabilities in foreign currencies | | 2,793,776 |
Net Assets, for 496,915 shares outstanding | | $ 16,264,662 |
Net Asset Value, offering price and redemption price per share ($16,264,662 ÷ 496,915 shares) | | $ 32.73 |
See accompanying notes which are an integral part of the financial statements.
Annual Report
Financial Statements - continued
Statement of Operations
Amounts in thousands | Year ended July 31, 2007 |
| | |
Investment Income | | |
Dividends | | $ 312,541 |
Special dividends | | 36,877 |
Interest | | 1,821 |
Income from Fidelity Central Funds | | 21,451 |
Total income | | 372,690 |
| | |
Expenses | | |
Management fee
Basic fee | $ 94,301 | |
Performance adjustment | (30,501) | |
Transfer agent fees | 36,238 | |
Accounting and security lending fees | 1,553 | |
Custodian fees and expenses | 247 | |
Independent trustees' compensation | 55 | |
Registration fees | 140 | |
Audit | 134 | |
Legal | 222 | |
Miscellaneous | 374 | |
Total expenses before reductions | 102,763 | |
Expense reductions | (1,339) | 101,424 |
Net investment income (loss) | | 271,266 |
Realized and Unrealized Gain (Loss) Net realized gain (loss) on: | | |
Investment securities: | | |
Unaffiliated issuers | 1,145,927 | |
Other affiliated issuers | 13,929 | |
Foreign currency transactions | (3) | |
Futures contracts | (6,229) | |
Total net realized gain (loss) | | 1,153,624 |
Change in net unrealized appreciation (depreciation) on: Investment securities | | 986,456 |
Net gain (loss) | | 2,140,080 |
Net increase (decrease) in net assets resulting from operations | | $ 2,411,346 |
See accompanying notes which are an integral part of the financial statements.
Annual Report
Statement of Changes in Net Assets
Amounts in thousands | Year ended
July 31,
2007 | Year ended
July 31,
2006 |
Increase (Decrease) in Net Assets | | |
Operations | | |
Net investment income (loss) | $ 271,266 | $ 197,918 |
Net realized gain (loss) | 1,153,624 | 446,359 |
Change in net unrealized appreciation (depreciation) | 986,456 | 101,276 |
Net increase (decrease) in net assets resulting
from operations | 2,411,346 | 745,553 |
Distributions to shareholders from net investment income | (237,313) | (179,291) |
Distributions to shareholders from net realized gain | (431,005) | (217,913) |
Total distributions | (668,318) | (397,204) |
Share transactions
Proceeds from sales of shares | 2,819,194 | 2,158,432 |
Reinvestment of distributions | 650,322 | 386,764 |
Cost of shares redeemed | (4,470,484) | (4,769,535) |
Net increase (decrease) in net assets resulting from share transactions | (1,000,968) | (2,224,339) |
Total increase (decrease) in net assets | 742,060 | (1,875,990) |
| | |
Net Assets | | |
Beginning of period | 15,522,602 | 17,398,592 |
End of period (including undistributed net investment income of $139,799 and undistributed net investment income of $115,144, respectively) | $ 16,264,662 | $ 15,522,602 |
Other Information Shares | | |
Sold | 88,615 | 74,177 |
Issued in reinvestment of distributions | 21,336 | 13,484 |
Redeemed | (139,296) | (164,415) |
Net increase (decrease) | (29,345) | (76,754) |
See accompanying notes which are an integral part of the financial statements.
Annual Report
Financial Highlights
Years ended July 31, | 2007 | 2006 | 2005 | 2004 | 2003 |
Selected Per-Share Data | | | | | |
Net asset value, beginning of period | $ 29.50 | $ 28.85 | $ 26.58 | $ 24.76 | $ 22.20 |
Income from Investment Operations | | | | | |
Net investment income (loss) B | .52 E | .35 | .45 F | .20 | .22 |
Net realized and unrealized gain (loss) | 3.98 | .99 | 2.21 | 1.84 | 2.56 |
Total from investment operations | 4.50 | 1.34 | 2.66 | 2.04 | 2.78 |
Distributions from net investment income | (.45) | (.31) | (.39) | (.22) | (.22) |
Distributions from net realized gain | (.82) | (.38) | - | - | - |
Total distributions | (1.27) | (.69) | (.39) | (.22) | (.22) |
Net asset value, end of period | $ 32.73 | $ 29.50 | $ 28.85 | $ 26.58 | $ 24.76 |
Total Return A | 15.62% | 4.73% | 10.08% | 8.27% | 12.63% |
Ratios to Average Net Assets C,G | | | | | |
Expenses before reductions | .61% | .60% | .68% | .90% | 1.05% |
Expenses net of fee waivers, if any | .61% | .60% | .68% | .90% | 1.05% |
Expenses net of all reductions | .60% | .59% | .66% | .89% | 1.02% |
Net investment income (loss) | 1.62% E | 1.21% | 1.64% F | .75% | .94% |
Supplemental Data | | | | | |
Net assets, end of period (in millions) | $ 16,265 | $ 15,523 | $ 17,399 | $ 18,387 | $ 15,737 |
Portfolio turnover rate D | 36% | 30% | 26% | 37% | 51% |
A Total returns would have been lower had certain expenses not been reduced during the periods shown.
B Calculated based on average shares outstanding during the period.
C Fees and expenses of the underlying Fidelity Central Funds are not included in the Fund's expense ratio. The Fund indirectly bears its proportionate share of the expenses of any underlying Fidelity Central Funds.
D Amount does not include the portfolio activity of any underlying Fidelity Central Funds.
E Investment income per share reflects a special dividend which amounted to $.07 per share. Excluding the special dividend, the ratio of net investment income (loss) to average net assets would have been 1.40%.
F Investment income per share reflects a special dividend which amounted to $.16 per share. Excluding the special dividend, the ratio of net investment income (loss) to average net assets would have been 1.06%.
G Expense ratios reflect operating expenses of the Fund. Expenses before reductions do not reflect amounts reimbursed by the investment adviser or reductions from brokerage service arrangements or other expense offset arrangements and do not represent the amount paid by the Fund during periods when reimbursements or reductions occur. Expenses net of fee waivers reflect expenses after reimbursement by the investment adviser but prior to reductions from brokerage service arrangements or other expense offset arrangements. Expenses net of all reductions represent the net expenses paid by the Fund.
See accompanying notes which are an integral part of the financial statements.
Annual Report
Notes to Financial Statements
For the period ended July 31, 2007
(Amounts in thousands except ratios)
1. Organization.
Fidelity Dividend Growth Fund (the Fund) is a fund of Fidelity Securities Fund (the trust) and is authorized to issue an unlimited number of shares. The trust is registered under the Investment Company Act of 1940, as amended (the 1940 Act), as an open-end management investment company organized as a Massachusetts business trust.
2. Investments in Fidelity Central Funds.
The Fund may invest in Fidelity Central Funds which are open-end investment companies available only to other investment companies and accounts managed by Fidelity Management & Research Company (FMR) and its affiliates. The Fund's Schedule of Investments lists each of the Fidelity Central Funds as an investment of the Fund, but does not include the underlying holdings of each Fidelity Central Fund. As an Investing Fund, the Fund indirectly bears its proportionate share of the expenses of the underlying Fidelity Central Funds.
The Money Market Central Funds seek preservation of capital and current income and are managed by Fidelity Investments Money Management, Inc. (FIMM), an affiliate of FMR.
A complete list of holdings for each Fidelity Central Fund is available upon request or at the SEC's web site at www.sec.gov. In addition, the financial statements of the Fidelity Central Funds, which are not covered by the Fund's Report of Independent Registered Public Accounting Firm, are available on the SEC's web site or upon request.
3. Significant Accounting Policies.
The financial statements have been prepared in conformity with accounting principles generally accepted in the United States of America, which require management to make certain estimates and assumptions at the date of the financial statements. The following summarizes the significant accounting policies of the Fund:
Security Valuation. Investments are valued and net asset value (NAV) per share is calculated (NAV calculation) as of the close of business of the New York Stock Exchange (NYSE), normally 4:00 p.m. Eastern time. Wherever possible, the Fund uses independent pricing services approved by the Board of Trustees to value its investments.
Equity securities, including restricted securities, for which market quotations are readily available, are valued at the last reported sale price or official closing price as reported by an independent pricing service on the primary market or exchange on which they are traded. In the event there were no sales during the day or closing prices are not available, securities are valued at the last quoted bid price. Debt securities, including restricted securities, for which quotations are readily available, are valued by independent pricing services or by dealers who make markets in such securities. Pricing services consider yield or price of bonds of comparable quality, coupon, maturity and type as well as dealer supplied prices. Investments in open-end mutual funds, including the Fidelity Central
Annual Report
Notes to Financial Statements - continued
(Amounts in thousands except ratios)
3. Significant Accounting Policies - continued
Security Valuation - continued
Funds, are valued at their closing net asset value each business day. Short-term securities with remaining maturities of sixty days or less for which quotations are not readily available are valued at amortized cost, which approximates value.
When current market prices or quotations are not readily available or do not accurately reflect fair value, valuations may be determined in accordance with procedures adopted by the Board of Trustees. For example, when developments occur between the close of a market and the close of the NYSE that may materially affect the value of some or all of the securities, or when trading in a security is halted, those securities may be fair valued. Factors used in the determination of fair value may include monitoring news to identify significant market or security specific events such as changes in the value of U.S. securities markets, reviewing developments in foreign markets and evaluating the performance of ADRs, futures contracts and exchange-traded funds. Because the Fund's utilization of fair value pricing depends on market activity, the frequency with which fair value pricing is used cannot be predicted and may be utilized to a significant extent. The value of securities used for NAV calculation under fair value pricing may differ from published prices for the same securities.
Foreign Currency. The Fund uses foreign currency contracts to facilitate transactions in foreign-denominated securities. Losses from these transactions may arise from changes in the value of the foreign currency or if the counterparties do not perform under the contracts' terms.
Foreign-denominated assets, including investment securities, and liabilities are translated into U.S. dollars at the exchange rate at period end. Purchases and sales of investment securities, income and dividends received and expenses denominated in foreign currencies are translated into U.S. dollars at the exchange rate in effect on the transaction date.
The effects of exchange rate fluctuations on investments are included with the net realized and unrealized gain (loss) on investment securities. Other foreign currency transactions resulting in realized and unrealized gain (loss) are disclosed separately.
Investment Transactions and Income. For financial reporting purposes, the Fund's investment holdings and NAV include trades executed through the end of the last business day of the period. The NAV for processing shareholder transactions includes trades executed through the end of the prior business day. Gains and losses on securities sold are determined on the basis of identified cost and may include proceeds received from litigation. Dividend income is recorded on the ex-dividend date, except for certain dividends from foreign securities where the ex-dividend date may have passed, which are recorded as soon as the Fund is informed of the ex-dividend date. Non-cash dividends included in dividend income, if any, are recorded at the fair market value of the
Annual Report
3. Significant Accounting Policies - continued
Investment Transactions and Income - continued
securities received. Distributions received on securities that represent a return of capital or capital gain are recorded as a reduction of cost of investments and/or as a realized gain. The Fund estimates the components of distributions received that may be considered return of capital distributions or capital gain distributions. Large, non-recurring dividends recognized by the Fund are presented separately on the Statement of Operations as "Special Dividends" and the impact of these dividends is presented in the Financial Highlights. Interest income and distributions from the Fidelity Central Funds are accrued as earned. Interest income includes coupon interest and amortization of premium and accretion of discount on debt securities. Investment income is recorded net of foreign taxes withheld where recovery of such taxes is uncertain.
Expenses. Most expenses of the trust can be directly attributed to a fund. Expenses which cannot be directly attributed are apportioned among each Fund in the trust. Expense estimates are accrued in the period to which they relate and adjustments are made when actual amounts are known.
Deferred Trustee Compensation. Under a Deferred Compensation Plan (the Plan), Independent Trustees must defer receipt of a portion of, and may elect to defer receipt of an additional portion of, their annual compensation. Deferred amounts are invested in a cross-section of Fidelity funds, are marked-to-market and remain in the Fund until distributed in accordance with the Plan. The investment of deferred amounts and the offsetting payable to the Trustees are included in the accompanying Statement of Assets and Liabilities.
Income Tax Information and Distributions to Shareholders. Each year, the Fund intends to qualify as a regulated investment company by distributing all of its taxable income and realized gains under Subchapter M of the Internal Revenue Code. As a result, no provision for income taxes is required in the accompanying financial statements. Foreign taxes are provided for based on the Fund's understanding of the tax rules and rates that exist in the foreign markets in which it invests.
Distributions are recorded on the ex-dividend date. Income and capital gain distributions are determined in accordance with income tax regulations, which may differ from generally accepted accounting principles. In addition, the Fund will claim a portion of the payment made to redeeming shareholders as a distribution for income tax purposes.
Capital accounts within the financial statements are adjusted for permanent book-tax differences. These adjustments have no impact on net assets or the results of operations. Temporary book-tax differences will reverse in a subsequent period.
Book-tax differences are primarily due to futures transactions, foreign currency transactions, partnerships, deferred trustees compensation and losses deferred due to wash sales.
Annual Report
Notes to Financial Statements - continued
(Amounts in thousands except ratios)
3. Significant Accounting Policies - continued
Income Tax Information and Distributions to Shareholders - continued
The tax-basis components of distributable earnings and the federal tax cost as of period end were as follows:
Unrealized appreciation | $ 3,166,173 | |
Unrealized depreciation | (392,468) | |
Net unrealized appreciation (depreciation) | 2,773,705 | |
Undistributed ordinary income | 219,837 | |
Undistributed long-term capital gain | 719,639 | |
| | |
Cost for federal income tax purposes | $ 13,606,422 | |
The tax character of distributions paid was as follows:
| July 31, 2007 | July 31, 2006 |
Ordinary Income | $ 311,177 | $ 253,177 |
Long-term Capital Gains | 357,141 | 144,027 |
Total | $ 668,318 | $ 397,204 |
New Accounting Pronouncements. In July 2006, Financial Accounting Standards Board Interpretation No. 48, Accounting for Uncertainty in Income Taxes - an interpretation of FASB Statement 109 (FIN 48), was issued and is effective on the last business day of the semiannual reporting period for fiscal years beginning after December 15, 2006. FIN 48 sets forth a threshold for financial statement recognition, measurement and disclosure of a tax position taken or expected to be taken on a tax return. Management has concluded that the adoption of FIN 48 will not result in a material impact on the Fund's net assets, results of operations and financial statement disclosures.
In addition, in September 2006, Statement of Financial Accounting Standards No. 157, Fair Value Measurements (SFAS 157), was issued and is effective for fiscal years beginning after November 15, 2007. SFAS 157 defines fair value, establishes a framework for measuring fair value and expands disclosures about fair value measurements. Management is currently evaluating the impact the adoption of SFAS 157 will have on the Fund's financial statement disclosures.
4. Operating Policies.
Repurchase Agreements. FMR has received an Exemptive Order from the Securities and Exchange Commission (the SEC) which permits the Fund and other affiliated entities of FMR to transfer uninvested cash balances into joint trading accounts which are then invested in repurchase agreements. The Fund may also invest directly with institutions in repurchase agreements. Repurchase agreements are collateralized by government or non-government securities. Upon settlement date, collateral is held in segregated accounts with custodian banks and may be obtained in the event of a default of the counterparty. The Fund monitors, on a daily basis, the value of the collateral to
Annual Report
4. Operating Policies - continued
Repurchase Agreements - continued
ensure it is at least equal to the principal amount of the repurchase agreement (including accrued interest). In the event of a default by the counterparty, realization of the collateral proceeds could be delayed, during which time the value of the collateral may decline.
Futures Contracts. The Fund may use futures contracts to manage its exposure to the stock market. Buying futures tends to increase a fund's exposure to the underlying instrument, while selling futures tends to decrease a fund's exposure to the underlying instrument or hedge other fund investments. Upon entering into a futures contract, a fund is required to deposit with a clearing broker, no later than the following business day, an amount ("initial margin") equal to a certain percentage of the face value of the contract. The initial margin may be in the form of cash or securities and is transferred to a segregated account on settlement date. Subsequent payments ("variation margin") are made or received by a fund depending on the daily fluctuations in the value of the futures contract and are accounted for as unrealized gains or losses. Realized gains (losses) are recorded upon the expiration or closing of the futures contract. Securities deposited to meet margin requirements are identified in the Schedule of Investments. Losses may arise from changes in the value of the underlying instruments or if the counterparties do not perform under the contract's terms. Futures contracts are valued at the settlement price established each day by the board of trade or exchange on which they are traded.
Restricted Securities. The Fund may invest in securities that are subject to legal or contractual restrictions on resale. These securities generally may be resold in transactions exempt from registration or to the public if the securities are registered. Disposal of these securities may involve time-consuming negotiations and expense, and prompt sale at an acceptable price may be difficult. Information regarding restricted securities is included at the end of the Fund's Schedule of Investments.
5. Purchases and Sales of Investments.
Purchases and sales of securities, other than short-term securities, aggregated $5,871,449 and $7,197,085, respectively.
6. Fees and Other Transactions with Affiliates.
Management Fee. FMR and its affiliates provide the Fund with investment management related services for which the Fund pays a monthly management fee. The management fee is the sum of an individual fund fee rate that is based on an annual rate of .30% of the Fund's average net assets and a group fee rate that averaged ..26% during the period. The group fee rate is based upon the average net assets of all the mutual funds advised by FMR. The group fee rate decreases as assets under management increase and increases as assets under management decrease. In addition, the management fee is subject to a performance adjustment (up to a maximum of ± .20% of the Fund's average
Annual Report
Notes to Financial Statements - continued
(Amounts in thousands except ratios)
6. Fees and Other Transactions with Affiliates - continued
Management Fee - continued
net assets over a 36 month performance period). The upward or downward adjustment to the management fee is based on the Fund's relative investment performance as compared to an appropriate benchmark index. For the period, the total annual management fee rate, including the performance adjustment, was .38% of the Fund's average net assets.
Transfer Agent Fees. Fidelity Service Company, Inc. (FSC), an affiliate of FMR, is the Fund's transfer, dividend disbursing and shareholder servicing agent. FSC receives account fees and asset-based fees that vary according to account size and type of account. FSC pays for typesetting, printing and mailing of shareholder reports, except proxy statements. For the period, the transfer agent fees were equivalent to an annual rate of .22% of average net assets.
Accounting and Security Lending Fees. FSC maintains the Fund's accounting records. The accounting fee is based on the level of average net assets for the month. Under a separate contract, FSC administers the security lending program. The security lending fee is based on the number and duration of lending transactions.
Brokerage Commissions. The Fund placed a portion of its portfolio transactions with brokerage firms which are affiliates of the investment adviser. The commissions paid to these affiliated firms were $37 for the period.
7. Committed Line of Credit.
The Fund participates with other funds managed by FMR in a $4.2 billion credit facility (the "line of credit") to be utilized for temporary or emergency purposes to fund shareholder redemptions or for other short-term liquidity purposes. The Fund has agreed to pay commitment fees on its pro rata portion of the line of credit, which amounted to $31 and is reflected in Miscellaneous Expense on the Statement of Operations. During the period, there were no borrowings on this line of credit.
8. Security Lending.
The Fund lends portfolio securities from time to time in order to earn additional income. On the settlement date of the loan, the Fund receives collateral (in the form of U.S. Treasury obligations, letters of credit and/or cash) against the loaned securities and maintains collateral in an amount not less than 100% of the market value of the loaned securities during the period of the loan. The market value of the loaned securities is determined at the close of business of the Fund and any additional required collateral is delivered to the Fund on the next business day. If the borrower defaults on its obligation to return the securities loaned because of insolvency or other reasons, a fund could experience delays and costs in recovering the securities loaned or in gaining access to the collateral. Any cash collateral received is invested in the Fidelity Securities Lending
Annual Report
8. Security Lending - continued
Cash Central Fund. The value of loaned securities and cash collateral at period end are disclosed on the Fund's Statement of Assets and Liabilities. Security lending income represents the income earned on investing cash collateral, less fees and expenses associated with the loan, plus any premium payments that may be received on the loan of certain types of securities. Security lending income is presented in the Statement of Operations as a component of income from Fidelity Central Funds. Net income from lending portfolio securities during the period amounted to $260.
9. Expense Reductions.
Many of the brokers with whom FMR places trades on behalf of the Fund provided services to the Fund in addition to trade execution. These services included payments of certain expenses on behalf of the Fund totaling $13 for the period. In addition, through arrangements with the Fund's custodian and transfer agent, credits realized as a result of uninvested cash balances were used to reduce the Fund's expenses. During the period, these credits reduced the Fund's custody and transfer agent expenses by $21 and $1,051, respectively.
10. Other.
The Fund's organizational documents provide former and current trustees and officers with a limited indemnification against liabilities arising in connection with the performance of their duties to the Fund. In the normal course of business, the Fund may also enter into contracts that provide general indemnifications. The Fund's maximum exposure under these arrangements is unknown as this would be dependent on future claims that may be made against the Fund. The risk of material loss from such claims is considered remote.
The United States Securities and Exchange Commission ("SEC") is conducting an investigation of FMR (covering the years 2002 to 2004) arising from gifts, gratuities and business entertainment provided by certain brokers to certain individuals who were employed on FMR's domestic equity trading desk during that period. FMR is in discussions with the SEC staff regarding the possible resolution of the matter, but as of period-end no final resolution has been reached.
In December 2006, the Independent Trustees completed their own investigation of the matter with the assistance of independent counsel. The Independent Trustees and FMR agree that, despite the absence of proof that the Fidelity mutual funds experienced diminished execution quality as a result of the improper receipt of gifts and business entertainment, the conduct at issue was serious and is worthy of redress. Accordingly, the Independent Trustees have requested and FMR has agreed to pay $42 million to Fidelity mutual funds, plus interest to be determined at the time that payment is made. A method of allocating this payment among the funds has not yet been determined. The total payment to the Fund is not anticipated to have a material impact on the Fund's net assets. In addition, FMR reimbursed related legal expenses which are recorded in the accompanying Statement of Operations as an expense reduction.
Annual Report
Report of Independent Registered Public Accounting Firm
To the Trustees of Fidelity Securities Fund and the Shareholders of Fidelity Dividend Growth Fund:
In our opinion, the accompanying statement of assets and liabilities, including the schedule of investments, and the related statements of operations and of changes in net assets and the financial highlights present fairly, in all material respects, the financial position of Fidelity Dividend Growth Fund (a fund of Fidelity Securities Fund) at July 31, 2007, the results of its operations for the year then ended, the changes in its net assets for each of the two years in the period then ended and the financial highlights for each of the five years in the period then ended, in conformity with accounting principles generally accepted in the United States of America. These financial statements and financial highlights (hereafter referred to as "financial statements") are the responsibility of the Fidelity Dividend Growth Fund's management. Our responsibility is to express an opinion on these financial statements based on our audits. We conducted our audits of these financial statements in accordance with the standards of the Public Company Accounting Oversight Board (United States). Those standards require that we plan and perform the audit to obtain reasonable assurance about whether the financial statements are free of material misstatement. An audit includes examining, on a test basis, evidence supporting the amounts and disclosures in the financial statements, assessing the accounting principles used and significant estimates made by management, and evaluating the overall financial statement presentation. We believe that our audits, which included confirmation of securities at July 31, 2007 by correspondence with the custodian and brokers, provide a reasonable basis for our opinion.
/s/ PricewaterhouseCoopers LLP
PricewaterhouseCoopers LLP
Boston, Massachusetts
September 13, 2007
Annual Report
Trustees and Officers
The Trustees, Members of the Advisory Board, and executive officers of the trust and fund, as applicable, are listed below. The Board of Trustees governs the fund and is responsible for protecting the interests of shareholders. The Trustees are experienced executives who meet periodically throughout the year to oversee the fund's activities, review contractual arrangements with companies that provide services to the fund, and review the fund's performance. Except for James C. Curvey, each of the Trustees oversees 353 funds advised by FMR or an affiliate. Mr. Curvey oversees 317 funds advised by FMR or an affiliate.
The Trustees hold office without limit in time except that (a) any Trustee may resign; (b) any Trustee may be removed by written instrument, signed by at least two-thirds of the number of Trustees prior to such removal; (c) any Trustee who requests to be retired or who has become incapacitated by illness or injury may be retired by written instrument signed by a majority of the other Trustees; and (d) any Trustee may be removed at any special meeting of shareholders by a two-thirds vote of the outstanding voting securities of the trust. Each Trustee who is not an interested person (as defined in the 1940 Act) (Independent Trustee), shall retire not later than the last day of the calendar year in which his or her 72nd birthday occurs. The Independent Trustees may waive this mandatory retirement age policy with respect to individual Trustees. The executive officers and Advisory Board Members hold office without limit in time, except that any officer and Advisory Board Member may resign or may be removed by a vote of a majority of the Trustees at any regular meeting or any special meeting of the Trustees. Except as indicated, each individual has held the office shown or other offices in the same company for the past five years.
The Fund's Statement of Additional Information (SAI) includes more information about the trustees. To request a free copy, call Fidelity at 1-800-544-8444.
Interested Trustees*:
Correspondence intended for each Trustee who is an interested person may be sent to Fidelity Investments, 82 Devonshire Street, Boston, Massachusetts 02109.
Name, Age; Principal Occupation |
Edward C. Johnson 3d (77) |
| Year of Election or Appointment: 1984 Mr. Johnson is Chairman of the Board of Trustees. Mr. Johnson serves as President (2006-present), Chief Executive Officer, Chairman, and a Director of FMR Corp.; Chairman and a Director of FMR; Chairman and a Director of Fidelity Research & Analysis Company (FRAC); Chairman and a Director of Fidelity Investments Money Management, Inc.; and Chairman (2001-present) and a Director of FMR Co., Inc. In addition, Mr. Johnson serves as Chairman and Director of Fidelity International Limited (FIL). |
James C. Curvey (72) |
| Year of Election or Appointment: 2007 Mr. Curvey also serves as Trustee (2007-present) or Member of the Advisory Board (2007-present) of other investment companies advised by FMR. Mr. Curvey is Vice Chairman (2006-present) and Director of FMR Corp. Mr. Curvey joined Fidelity in 1982 and served in numerous senior management positions, including President and Chief Operating Officer of FMR Corp. (1997-2000) and President of Fidelity Strategic Investments (2000-2002). In addition, he serves as a member of the Board of Directors of Geerlings & Wade, Inc. (wine distribution). |
* Trustees have been determined to be "Interested Trustees" by virtue of, among other things, their affiliation with the trust or various entities under common control with FMR.
Independent Trustees:
Correspondence intended for each Independent Trustee (that is, the Trustees other than the Interested Trustees) may be sent to Fidelity Investments, P.O. Box 55235, Boston, Massachusetts 02205-5235.
Name, Age; Principal Occupation |
Dennis J. Dirks (59) |
| Year of Election or Appointment: 2005 Prior to his retirement in May 2003, Mr. Dirks was Chief Operating Officer and a member of the Board of The Depository Trust & Clearing Corporation (DTCC) (1999-2003). He also served as President, Chief Operating Officer, and Board member of The Depository Trust Company (DTC) (1999-2003) and President and Board member of the National Securities Clearing Corporation (NSCC) (1999-2003). In addition, Mr. Dirks served as Chief Executive Officer and Board member of the Government Securities Clearing Corporation (2001-2003) and Chief Executive Officer and Board member of the Mortgage-Backed Securities Clearing Corporation (2001-2003). Mr. Dirks also serves as a Trustee and a member of the Finance Committee of Manhattan College (2005-present) and a Trustee and a member of the Finance Committee of AHRC of Nassau County (2006-present). |
Albert R. Gamper, Jr. (65) |
| Year of Election or Appointment: 2006 Prior to his retirement in December 2004, Mr. Gamper served as Chairman of the Board of CIT Group Inc. (commercial finance). During his tenure with CIT Group Inc. Mr. Gamper served in numerous senior management positions, including Chairman (1987-1989; 1999-2001; 2002-2004), Chief Executive Officer (1987-2004), and President (1989-2002). He currently serves as a member of the Board of Directors of Public Service Enterprise Group (utilities, 2001-present), Chairman of the Board of Governors, Rutgers University (2004-present), and Chairman of the Board of Saint Barnabas Health Care System. |
George H. Heilmeier (71) |
| Year of Election or Appointment: 2004 Dr. Heilmeier is Chairman Emeritus of Telcordia Technologies (communication software and systems), where prior to his retirement, he served as company Chairman and Chief Executive Officer. He currently serves on the Boards of Directors of The Mitre Corporation (systems engineering and information technology support for the government), and HRL Laboratories (private research and development, 2004-present). He is Chairman of the General Motors Science & Technology Advisory Board and a Life Fellow of the Institute of Electrical and Electronics Engineers (IEEE). Dr. Heilmeier is a member of the Defense Science Board and the National Security Agency Advisory Board. He is also a member of the National Academy of Engineering, the American Academy of Arts and Sciences, and the Board of Overseers of the School of Engineering and Applied Science of the University of Pennsylvania. Previously, Dr. Heilmeier served as a Director of TRW Inc. (automotive, space, defense, and information technology, 1992-2002), Compaq (1994-2002), Automatic Data Processing, Inc. (ADP) (technology-based business outsourcing, 1995-2002), INET Technologies Inc. (telecommunications network surveillance, 2001-2004), and Teletech Holdings (customer management services). He is the recipient of the 2005 Kyoto Prize in Advanced Technology for his invention of the liquid crystal display, and a member of the Consumer Electronics Hall of Fame. |
James H. Keyes (66) |
| Year of Election or Appointment: 2007 Prior to his retirement in 2003, Mr. Keyes was Chairman, President, and Chief Executive Officer of Johnson Controls, Inc. (automotive supplier, 1993-2003). He currently serves as a member of the boards of LSI Logic Corporation (semiconductor technologies), Navistar International Corporation (manufacture and sale of trucks, buses, and diesel engines, 2002-present), and Pitney Bowes, Inc. (integrated mail, messaging, and document management solutions). |
Marie L. Knowles (60) |
| Year of Election or Appointment: 2001 Prior to Ms. Knowles' retirement in June 2000, she served as Executive Vice President and Chief Financial Officer of Atlantic Richfield Company (ARCO) (diversified energy, 1996-2000). From 1993 to 1996, she was a Senior Vice President of ARCO and President of ARCO Transportation Company. She served as a Director of ARCO from 1996 to 1998. She currently serves as a Director of Phelps Dodge Corporation (copper mining and manufacturing) and McKesson Corporation (healthcare service, 2002-present). Ms. Knowles is a Trustee of the Brookings Institution and the Catalina Island Conservancy and also serves as a member of the Advisory Board for the School of Engineering of the University of Southern California. |
Ned C. Lautenbach (63) |
| Year of Election or Appointment: 2000 Mr. Lautenbach is Chairman of the Independent Trustees (2006-present). Mr. Lautenbach has been a partner of Clayton, Dubilier & Rice, Inc. (private equity investment firm) since September 1998. Previously, Mr. Lautenbach was with the International Business Machines Corporation (IBM) from 1968 until his retirement in 1998. Mr. Lautenbach serves as a Director of Sony Corporation (2006-present) and Eaton Corporation (diversified industrial) as well as the Philharmonic Center for the Arts in Naples, Florida. He also is a member of the Board of Trustees of Fairfield University (2005-present), as well as a member of the Council on Foreign Relations. |
Cornelia M. Small (63) |
| Year of Election or Appointment: 2005 Ms. Small is a member (2000-present) and Chairperson (2002-present) of the Investment Committee, and a member (2002-present) of the Board of Trustees of Smith College. Previously, she served as Chief Investment Officer (1999-2000), Director of Global Equity Investments (1996-1999), and a member of the Board of Directors of Scudder, Stevens & Clark (1990-1997) and Scudder Kemper Investments (1997-1999). In addition, Ms. Small served as Co-Chair (2000-2003) of the Annual Fund for the Fletcher School of Law and Diplomacy. |
William S. Stavropoulos (68) |
| Year of Election or Appointment: 2002 Mr. Stavropoulos is Chairman Emeritus of the Board of Directors of The Dow Chemical Company. Since joining The Dow Chemical Company in 1967, Mr. Stavropoulos served in numerous senior management positions, including President (1993-2000; 2002-2003), CEO (1995-2000; 2002-2004), and Chairman of the Executive Committee (2000-2004). Currently, he is a Director of NCR Corporation (data warehousing and technology solutions), Chemical Financial Corporation, Maersk Inc. (industrial conglomerate, 2002-present), Tyco International, Inc. (multinational manufacturing and services, 2007-present), and a member of the Advisory Board for Metalmark Capital (private equity investment firm, 2005-present). He is a special advisor to Clayton, Dubilier & Rice, Inc., a private equity investment firm. He also serves as a member of the Board of Trustees of the American Enterprise Institute for Public Policy Research. In addition, Mr. Stavropoulos is a member of The Business Council, J.P. Morgan International Council and the University of Notre Dame Advisory Council for the College of Science. |
Kenneth L. Wolfe (68) |
| Year of Election or Appointment: 2005 Prior to his retirement in 2001, Mr. Wolfe was Chairman and Chief Executive Officer of Hershey Foods Corporation (1993-2001). He currently serves as a member of the boards of Adelphia Communications Corporation (2003-present), Bausch & Lomb, Inc., and Revlon Inc. (2004-present). |
Advisory Board Members and Executive Officers:
Correspondence intended for Mr. Mauriello may be sent to Fidelity Investments, P.O. Box 55235, Boston, Massachusetts 02205-5235. Correspondence intended for each executive officer and Mr. Lynch may be sent to Fidelity Investments, 82 Devonshire Street, Boston, Massachusetts 02109.
Name, Age; Principal Occupation |
Peter S. Lynch (63) |
| Year of Election or Appointment: 2003 Member of the Advisory Board of Fidelity Securities Fund. Mr. Lynch is Vice Chairman and a Director of FMR, and Vice Chairman (2001-present) and a Director of FMR Co., Inc. Previously, Mr. Lynch served as a Trustee of the Fidelity funds (1990-2003). In addition, he serves as a Trustee of Boston College and as the Chairman of the Inner-City Scholarship Fund. |
Joseph Mauriello (62) |
| Year of Election or Appointment: 2007 Member of the Advisory Board of Fidelity Securities Fund. Prior to his retirement in January 2006, Mr. Mauriello served in numerous senior management positions including Deputy Chairman and Chief Operating Officer (2004-2005), and Vice Chairman of Financial Services (2002-2004) of KPMG LLP US (professional services firm, 1965-2005). Mr. Mauriello currently serves as a member of the Board of Directors of XL Capital Ltd., (global insurance and re-insurance company, 2006-present) and of Arcadia Resources Inc., (health care services and products, 2007-present). He also served as a Director of the Hamilton Funds of the Bank of New York (2006-2007). |
Kimberley H. Monasterio (43) |
| Year of Election or Appointment: 2007 President and Treasurer of Dividend Growth. Ms. Monasterio also serves as President and Treasurer of other Fidelity funds (2007-present) and is an employee of FMR (2004-present). Previously, Ms. Monasterio served as Deputy Treasurer of the Fidelity funds (2004-2006). Before joining Fidelity Investments, Ms. Monasterio served as Treasurer (2000-2004) and Chief Financial Officer (2002-2004) of the Franklin Templeton Funds and Senior Vice President of Franklin Templeton Services, LLC (2000-2004). |
Philip L. Bullen (47) |
| Year of Election or Appointment: 2006 Vice President of Dividend Growth. Mr. Bullen also serves as Vice President of certain Equity Funds (2006-present). Mr. Bullen is Senior Vice President of FMR (2001-present) and FMR Co., Inc. (2001-present). Previously, Mr. Bullen served as President and a Director of Fidelity Research & Analysis Company (2001-2005), President and a Director of Fidelity Management & Research (U.K.) Inc. (2002-2006), and a Director of Strategic Advisers, Inc. (2002-2005). |
Dwight D. Churchill (53) |
| Year of Election or Appointment: 2005 Vice President of Dividend Growth. Mr. Churchill also serves as Vice President of certain Equity Funds (2005-present). Mr. Churchill is Executive Vice President of FMR (2005-present) and FMR Co., Inc. (2005-present). Previously, Mr. Churchill served as Senior Vice President of Fidelity Investments Money Management, Inc. (2005-2006), Head of Fidelity's Fixed-Income Division (2000-2005), Vice President of Fidelity's Money Market Funds (2000-2005), Vice President of Fidelity's Bond Funds, and Senior Vice President of FMR. |
Charles Mangum (42) |
| Year of Election or Appointment: 1997 Vice President of Dividend Growth. Mr. Mangum also serves as Vice President of other funds advised by FMR. Prior to assuming his current responsibilities, Mr. Mangum worked as a research analyst and portfolio manager. Mr. Mangum also serves as Senior Vice President of FMR and FMR Co., Inc. (2005). |
Eric D. Roiter (58) |
| Year of Election or Appointment: 1998 Secretary of Dividend Growth. He also serves as Secretary of other Fidelity funds; Vice President, General Counsel, and Secretary of FMR Co., Inc. (2001-present) and FMR; Assistant Secretary of Fidelity Management & Research (U.K.) Inc. (2001-present), Fidelity Research & Analysis Company (2001-present), and Fidelity Investments Money Management, Inc. (2001-present). Mr. Roiter is an Adjunct Member, Faculty of Law, at Boston College Law School (2003-present). Previously, Mr. Roiter served as Vice President and Secretary of Fidelity Distributors Corporation (FDC) (1998-2005). |
Scott C. Goebel (39) |
| Year of Election or Appointment: 2007 Assistant Secretary of Dividend Growth. Mr. Goebel also serves as Assistant Secretary of other Fidelity funds (2007-present), Vice President and Secretary of FDC (2006-present), and is an employee of FMR. |
R. Stephen Ganis (41) |
| Year of Election or Appointment: 2006 Anti-Money Laundering (AML) officer of Dividend Growth. Mr. Ganis also serves as AML officer of other Fidelity funds (2006-present) and FMR Corp. (2003-present). Before joining Fidelity Investments, Mr. Ganis practiced law at Goodwin Procter, LLP (2000-2002). |
Joseph B. Hollis (59) |
| Year of Election or Appointment: 2006 Chief Financial Officer of Dividend Growth. Mr. Hollis also serves as Chief Financial Officer of other Fidelity funds. Mr. Hollis is President of Fidelity Pricing and Cash Management Services (FPCMS) (2005-present). Mr. Hollis also serves as President and Director of Fidelity Service Company, Inc. (2006-present). Previously, Mr. Hollis served as Senior Vice President of Cash Management Services (1999-2002) and Investment Management Operations (2002-2005). |
Kenneth A. Rathgeber (60) |
| Year of Election or Appointment: 2004 Chief Compliance Officer of Dividend Growth. Mr. Rathgeber also serves as Chief Compliance Officer of other Fidelity funds (2004-present) and Executive Vice President of Risk Oversight for Fidelity Investments (2002-present). He is Chief Compliance Officer of FMR (2005-present), FMR Co., Inc. (2005-present), Fidelity Management & Research (U.K.) Inc. (2005-present), Fidelity Research & Analysis Company (2005-present), Fidelity Investments Money Management, Inc. (2005-present), and Strategic Advisers, Inc. (2005-present). Previously, Mr. Rathgeber served as Executive Vice President and Chief Operating Officer for Fidelity Investments Institutional Services Company, Inc. (1998-2002). |
Bryan A. Mehrmann (46) |
| Year of Election or Appointment: 2005 Deputy Treasurer of Dividend Growth. Mr. Mehrmann also serves as Deputy Treasurer of other Fidelity funds (2005-present) and is an employee of FMR. Previously, Mr. Mehrmann served as Vice President of Fidelity Investments Institutional Services Group (FIIS)/Fidelity Investments Institutional Operations Corporation, Inc. (FIIOC) Client Services (1998-2004). |
Kenneth B. Robins (37) |
| Year of Election or Appointment: 2005 Deputy Treasurer of Dividend Growth. Mr. Robins also serves as Deputy Treasurer of other Fidelity funds (2005-present) and is an employee of FMR (2004-present). Before joining Fidelity Investments, Mr. Robins worked at KPMG LLP, where he was a partner in KPMG's department of professional practice (2002-2004) and a Senior Manager (1999-2000). In addition, Mr. Robins served as Assistant Chief Accountant, United States Securities and Exchange Commission (2000-2002). |
Robert G. Byrnes (40) |
| Year of Election or Appointment: 2005 Assistant Treasurer of Dividend Growth. Mr. Byrnes also serves as Assistant Treasurer of other Fidelity funds (2005-present) and is an employee of FMR (2005-present). Previously, Mr. Byrnes served as Vice President of FPCMS (2003-2005). Before joining Fidelity Investments, Mr. Byrnes worked at Deutsche Asset Management where he served as Vice President of the Investment Operations Group (2000-2003). |
Peter L. Lydecker (53) |
| Year of Election or Appointment: 2004 Assistant Treasurer of Dividend Growth. Mr. Lydecker also serves as Assistant Treasurer of other Fidelity funds (2004) and is an employee of FMR. |
Gary W. Ryan (48) |
| Year of Election or Appointment: 2005 Assistant Treasurer of Dividend Growth. Mr. Ryan also serves as Assistant Treasurer of other Fidelity funds (2005-present) and is an employee of FMR (2005-present). Previously, Mr. Ryan served as Vice President of Fund Reporting in FPCMS (1999-2005). |
Annual Report
Distributions
The Board of Trustees of Fidelity Dividend Growth Fund voted to pay on September 10, 2007 to shareholders of record at the opening of business on September 7, 2007, a distribution of $1.66 per share derived from capital gains realized from sales of portfolio securities and a dividend of $0.26 per share from net investment income.
The fund hereby designates as a capital gain dividend with respect to the taxable year ended July 31, 2007, $869,884,894, or, if subsequently determined to be different, the net capital gain of such year.
The fund designates 100% and 95% of the dividends distributed in September and December respectively during the fiscal year as qualifying for the dividends-received deduction for corporate shareholders.
The fund designates 100% and 97% of the dividends distributed in September and December respectively during the fiscal year as amounts which may be taken into account as a dividend for the purposes of the maximum rate under section 1(h)(11) of the Internal Revenue Code.
The fund will notify shareholders in January 2008 of amounts for use in preparing 2007 income tax returns.
Annual Report
Board Approval of Investment Advisory Contracts and Management Fees
Fidelity Dividend Growth Fund
Each year, typically in July, the Board of Trustees, including the Independent Trustees (together, the Board), votes on the renewal of the management contract and sub-advisory agreements (together, the Advisory Contracts) for the fund. The Board, assisted by the advice of fund counsel and Independent Trustees' counsel, requests and considers a broad range of information throughout the year.
The Board meets regularly each month except August and takes into account throughout the year matters bearing on Advisory Contracts. The Board, acting directly and through its separate committees, considers at each of its meetings factors that are relevant to the annual renewal of the fund's Advisory Contracts, including the services and support provided to the fund and its shareholders. At the time of the renewal, the Board had 12 standing committees, each composed of Independent Trustees with varying backgrounds, to which the Board has assigned specific subject matter responsibilities in order to enhance effective decision-making by the Board. Each committee has adopted a written charter outlining the structure and purposes of the committee. One such committee, the Equity Contract Committee, meets periodically as needed throughout the year to consider matters specifically related to the annual renewal of Advisory Contracts. The committee requests and receives information on, and makes recommendations to the Independent Trustees concerning, the approval and annual review of the Advisory Contracts.
At its July 2007 meeting, the Board of Trustees, including the Independent Trustees, unanimously determined to renew the Advisory Contracts for the fund. In reaching its determination, the Board considered all factors it believed relevant, including (i) the nature, extent, and quality of the services to be provided to the fund and its shareholders (including the investment performance of the fund); (ii) the competitiveness of the management fee and total expenses of the fund; (iii) the total costs of the services to be provided by and the profits to be realized by the investment adviser and its affiliates from the relationship with the fund; (iv) the extent to which economies of scale would be realized as the fund grows; and (v) whether fee levels reflect these economies of scale, if any, for the benefit of fund shareholders. The Board also approved amendments to the fund's agreements with foreign sub-advisers to clarify that each sub-adviser provides services as an independent contractor.
In determining whether to renew the Advisory Contracts for the fund, the Board ultimately reached a determination, with the assistance of fund counsel and Independent Trustees' counsel, that the renewal of the Advisory Contracts and the compensation to be received by Fidelity under the management contract is consistent with Fidelity's fiduciary duty under applicable law. In addition to evaluating the specific factors noted above, the Board, in reaching its determination, is aware that shareholders in the fund have a broad range of investment choices available to them, including a wide choice among mutual funds offered by competitors to Fidelity, and that the fund's shareholders, with the opportunity to review and weigh the disclosure provided by the fund in its prospectus and other public disclosures, have chosen to invest in this fund, managed by Fidelity.
Annual Report
Board Approval of Investment Advisory Contracts and
Management Fees - continued
Nature, Extent, and Quality of Services Provided. The Board considered staffing within the investment adviser, FMR, and the sub-advisers (together, the Investment Advisers), including the background of the fund's portfolio manager and the fund's investment objective and discipline. The Independent Trustees also had discussions with senior management of Fidelity's investment operations and investment groups. The Board considered the structure of the portfolio manager compensation program and whether this structure provides appropriate incentives.
Resources Dedicated to Investment Management and Support Services. The Board reviewed the size, education, and experience of the Investment Advisers' investment staff, their use of technology, and the Investment Advisers' approach to recruiting, training, and retaining portfolio managers and other research, advisory, and management personnel. The Board considered Fidelity's extensive global research capabilities that enable the Investment Advisers to aggregate data from various sources in an effort to produce positive investment results. The Board noted that Fidelity's analysts have access to a variety of technological tools that enable them to perform both fundamental and quantitative analysis and to specialize in various disciplines. The Board also considered that Fidelity's portfolio managers and analysts have access to daily portfolio attribution that allows for monitoring of a fund's portfolio, as well as an electronic communication system that provides immediate real-time access to research concerning issuers and credit enhancers.
Shareholder and Administrative Services. The Board considered (i) the nature, extent, quality, and cost of advisory, administrative, distribution, and shareholder services performed by the Investment Advisers and their affiliates under the Advisory Contracts and under separate agreements covering transfer agency, pricing and bookkeeping, and securities lending services for the fund; (ii) the nature and extent of the Investment Advisers' supervision of third party service providers, principally custodians and subcustodians; and (iii) the resources devoted to, and the record of compliance with, the fund's compliance policies and procedures. The Board reviewed the allocation of fund brokerage, including allocations to brokers affiliated with the Investment Advisers, the use of brokerage commissions to pay fund expenses, and the use of "soft" commission dollars to pay for research services. The Board also considered that Fidelity voluntarily pays for market data out of its own resources. The Board also considered the agreement reached between the Independent Trustees and Fidelity in December 2006 following an independent review of matters relating to receipt of travel, entertainment, gifts and gratuities in violation of Fidelity policies.
Annual Report
The Board noted that the growth of fund assets across the complex allows Fidelity to reinvest in the development of services designed to enhance the value or convenience of the Fidelity funds as investment vehicles. These services include 24-hour access to account information and market information through phone representatives and over the Internet, and investor education materials and asset allocation tools.
Investment in a Large Fund Family. The Board considered the benefits to shareholders of investing in a Fidelity fund, including the benefits of investing in a fund that is part of a large family of funds offering a variety of investment disciplines and providing for a large variety of mutual fund investor services. For example, fund shareholders are offered the privilege of exchanging shares of the fund for shares of other Fidelity funds, as set forth in the fund's prospectus, without paying a sales charge. The Board noted that, since the last Advisory Contract renewals in July 2006, Fidelity has taken a number of actions that benefited particular funds, including (i) dedicating additional resources to investment research and to restructure the investment research teams; (ii) contractually agreeing to reduce the management fee on Fidelity Advisor Floating Rate High Income Fund; (iii) contractually agreeing to reduce the management fees on Fidelity's California, Massachusetts, New Jersey, and New York AMT Tax-Free Money Market Funds, launching new Institutional Classes and Service Classes of these funds, and contractually agreeing to impose expense limitations on these funds; (iv) eliminating the exchange fee on the Fidelity Select Portfolios and reducing the pricing and bookkeeping fee rates for these funds; (v) reducing the maximum transfer agency fee rates on high income funds and certain equity funds; (vi) proposing amended management contracts that, if approved by shareholders, will add a performance adjustment component to the management fees paid by 18 Fidelity Advisor equity funds; (vii) contractually agreeing to reduce fees for Ultra-Short Central Fund and the money market Central Funds; (viii) waiving the Fidelity Advisor funds' contingent deferred sales charge on certain redemptions made through systematic withdrawal programs; and (ix) amending the management contracts for equity and fixed-income funds whose management contracts incorporate a "group fee" structure by adding four new fee "breakpoints" to the group fee rate schedules.
Investment Performance and Compliance. The Board considered whether the fund has operated within its investment objective, as well as its record of compliance with its investment restrictions. It also reviewed the fund's absolute investment performance, as well as the fund's relative investment performance measured against (i) a broad-based securities market index, and (ii) a peer group of mutual funds deemed appropriate by the Board over multiple periods. The following charts considered by the Board show, over the one-, three-, and five-year periods ended December 31, 2006, the fund's cumulative total returns, the cumulative total returns of a broad-based securities market index ("benchmark"), and a range of cumulative total returns of a peer group of mutual funds identified by Morningstar, Inc. as having an investment style similar to that of the fund based on underlying portfolio holdings. The box within each chart shows the 25th percentile return (bottom of box) and the 75th percentile return (top of box) of the peer group. Returns shown above the box are in the first quartile and returns shown below the box are in the fourth quartile. The percentage beaten number noted below each chart corresponds to the percentile box and represents the percentage of funds in the peer group whose performance was equal to or lower than that of the fund.
Annual Report
Board Approval of Investment Advisory Contracts and
Management Fees - continued
Fidelity Dividend Growth Fund
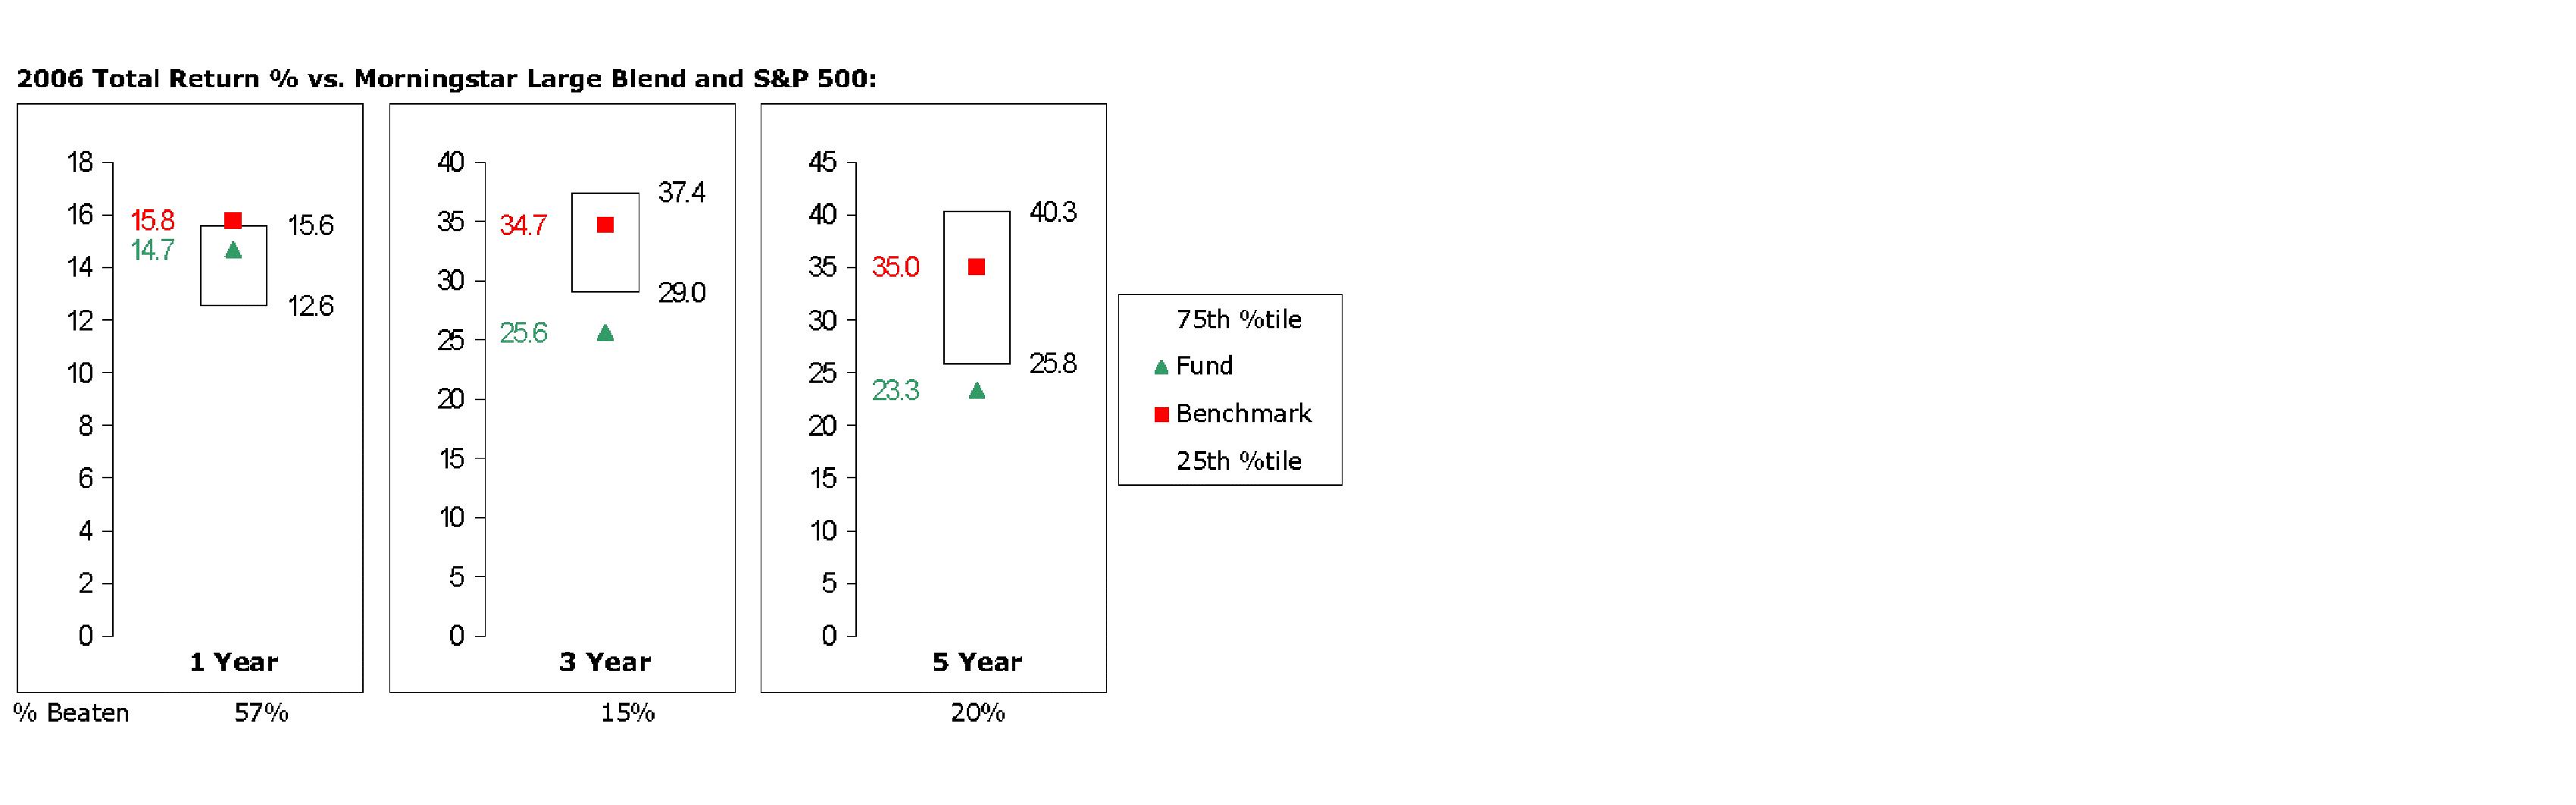
The Board reviewed the fund's relative investment performance against its peer group and stated that the performance of the fund was in the second quartile for the one-year period and the fourth quartile for the three- and five-year periods. The Board also stated that the investment performance of the fund was lower than its benchmark for all the periods shown.
The Board also considered that the fund's management fee is subject to upward or downward adjustment depending upon whether, and to what extent, the fund's investment performance for the performance period exceeds, or is exceeded by, the record (over the same period) of a Board-approved performance adjustment index. The Board realizes that the performance adjustment provides FMR with a strong economic incentive to seek to achieve superior performance for the fund's shareholders and helps to more closely align the interests of FMR and the fund's shareholders.
The Board considered that FMR has taken steps to refocus and strengthen equity research, equity portfolio management, and compliance.
Based on its review, and giving particular weight to the nature and quality of the resources dedicated by the Investment Advisers to maintain and improve relative performance, the Board concluded that the nature, extent, and quality of the services provided to the fund will benefit the fund's shareholders, particularly in light of the Board's view that the fund's shareholders benefit from investing in a fund that is part of a large family of funds offering a variety of investment disciplines and services.
Annual Report
Competitiveness of Management Fee and Total Fund Expenses. The Board considered the fund's management fee and total expenses compared to "mapped groups" of competitive funds and classes. Fidelity creates "mapped groups" by combining similar Lipper investment objective categories that have comparable management fee characteristics. Combining Lipper investment objective categories aids the Board's management fee and total expense comparisons by broadening the competitive group used for comparison and by reducing the number of universes to which various Fidelity funds are compared. The Board also considered supplemental information about how the fund's management fee and total expenses ranked relative to groups based on Lipper classifications, which take into account a fund's market capitalization and style.
The Board considered two proprietary management fee comparisons for the 12-month periods shown in the chart below. The group of Lipper funds used by the Board for management fee comparisons is referred to below as the "Total Mapped Group." The Total Mapped Group comparison focuses on a fund's standing relative to the total universe of comparable funds available to investors, in terms of gross management fees before expense reimbursements or caps, and without giving effect to the fund's performance adjustment. "TMG %" represents the percentage of funds in the Total Mapped Group that had management fees that were lower than the fund's. For example, a TMG % of 10% means that 90% of the funds in the Total Mapped Group had higher management fees than the fund. The "Asset-Size Peer Group" (ASPG) comparison focuses on a fund's standing relative to non-Fidelity funds similar in size to the fund within the Total Mapped Group. The ASPG represents at least 15% of the funds in the Total Mapped Group with comparable asset size and management fee characteristics, subject to a minimum of 50 funds (or all funds in the Total Mapped Group if fewer than 50). Additional information, such as the ASPG quartile in which the fund's management fee ranked and the impact of the fund's performance adjustment, is also included in the chart and considered by the Board.
Annual Report
Board Approval of Investment Advisory Contracts and
Management Fees - continued
Fidelity Dividend Growth Fund
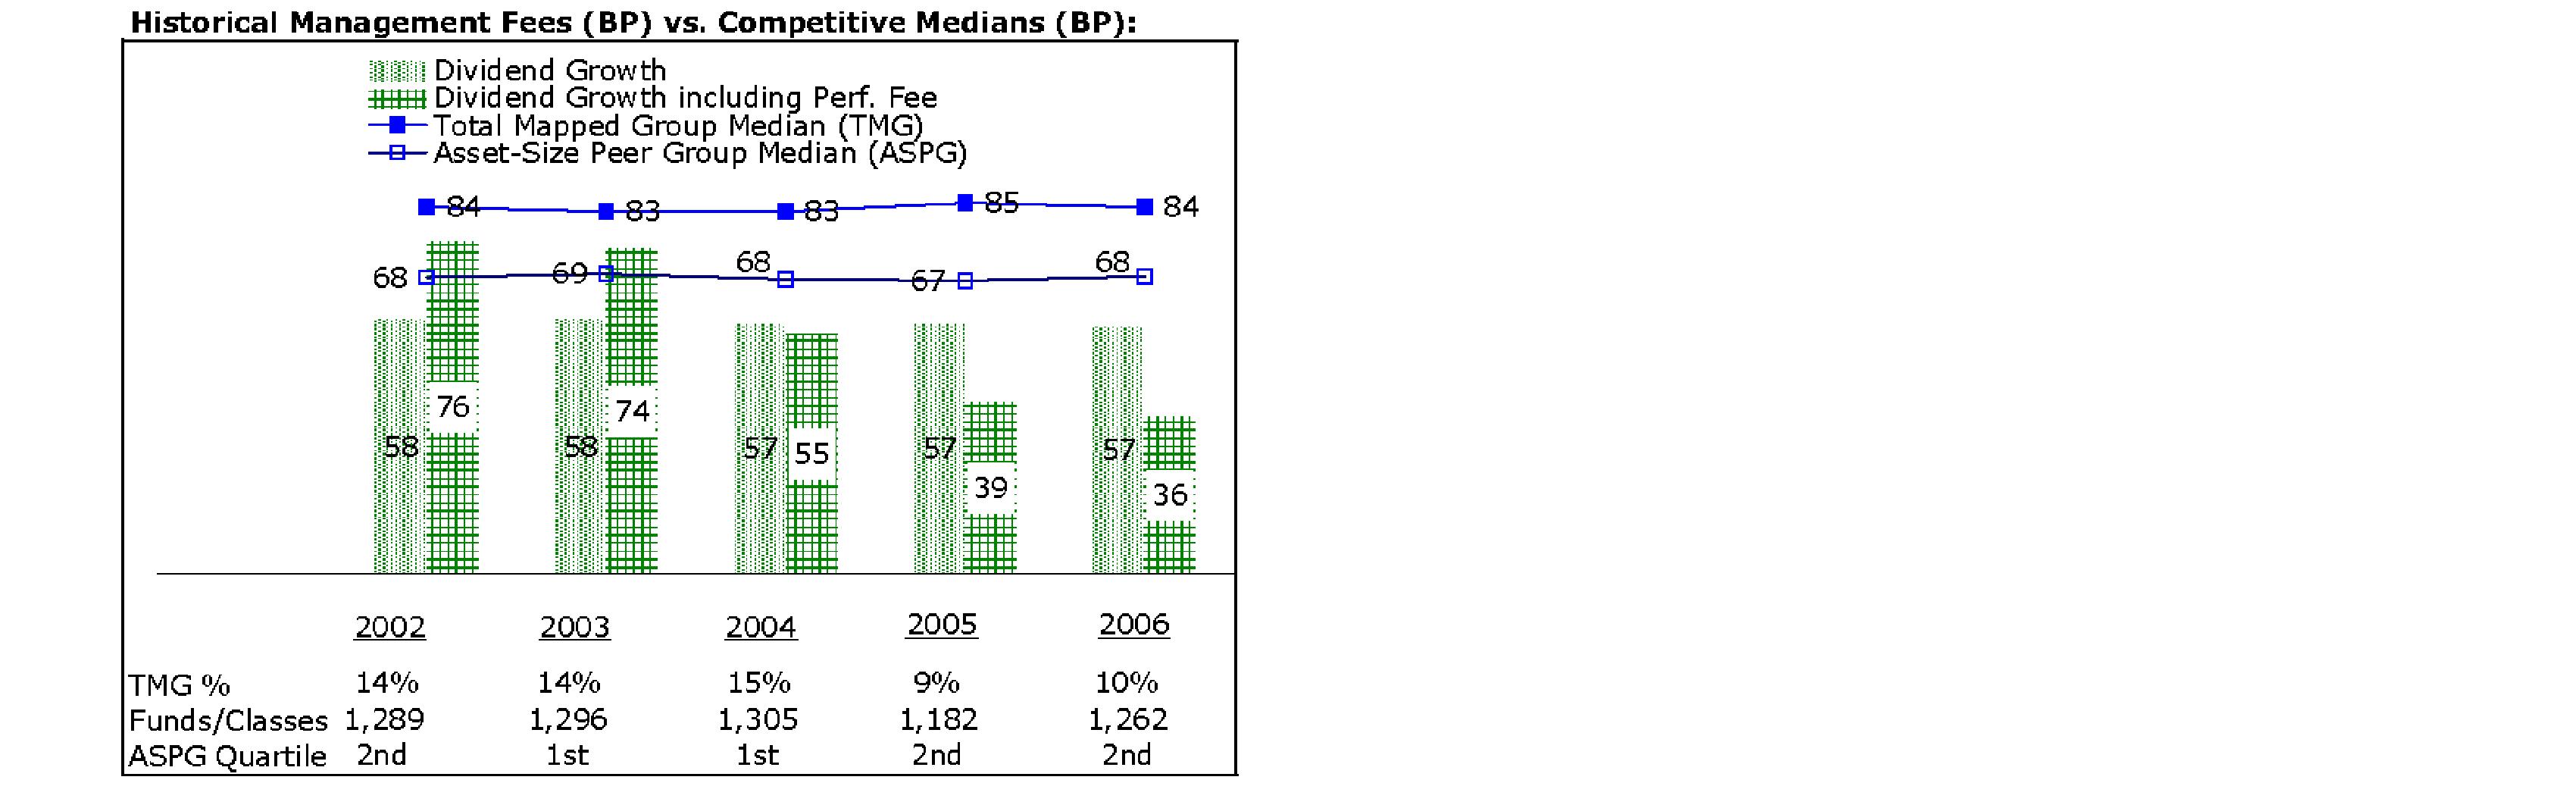
The Board noted that the fund's management fee ranked below the median of its Total Mapped Group and below the median of its ASPG for 2006. The Board also noted the effect of the fund's negative performance adjustment on the fund's management fee ranking. The Board noted that the performance adjustment for each year represents calculations for performance periods that differ from the periods shown in the performance charts above.
Based on its review, the Board concluded that the fund's management fee was fair and reasonable in light of the services that the fund receives and the other factors considered.
In its review of the fund's total expenses, the Board considered the fund's management fee as well as other fund expenses, such as transfer agent fees, pricing and bookkeeping fees, and custodial, legal, and audit fees. The Board also noted the effects of any waivers and reimbursements on fees and expenses, as well as the fund's negative performance adjustment. As part of its review, the Board also considered current and historical total expenses of the fund compared to competitive fund median expenses. The fund is compared to those funds and classes in the Total Mapped Group (used by the Board for management fee comparisons) that have a similar sales load structure.
The Board noted that the fund's total expenses ranked below its competitive median for 2006.
In its review of total expenses, the Board also considered Fidelity fee structures and other information on clients that FMR and its affiliates service in other competitive markets, such as other mutual funds advised or subadvised by FMR or its affiliates, pension plan clients, and other institutional clients.
Annual Report
Based on its review, the Board concluded that the fund's total expenses were reasonable in light of the services that the fund and its shareholders receive and the other factors considered.
Costs of the Services and Profitability. The Board considered the revenues earned and the expenses incurred by Fidelity in conducting the business of developing, marketing, distributing, managing, administering and servicing the fund and its shareholders. The Board also considered the level of Fidelity's profits in respect of all the Fidelity funds.
On an annual basis, FMR presents to the Board Fidelity's profitability for the fund. Fidelity calculates the profitability for each fund, as well as aggregate profitability for groups of Fidelity funds and all Fidelity funds, using a series of detailed revenue and cost allocation methodologies which originate with the audited books and records of Fidelity. The Audit Committee of the Board reviews any significant changes from the prior year's methodologies.
PricewaterhouseCoopers LLP (PwC), independent registered public accounting firm and auditor to Fidelity and certain Fidelity funds, has been engaged annually by the Board as part of the Board's assessment of the results of Fidelity's profitability analysis. PwC's engagement includes the review and assessment of Fidelity's methodologies used in determining the revenues and expenses attributable to Fidelity's mutual fund business, and completion of agreed-upon procedures surrounding the mathematical accuracy of fund profitability and its conformity to allocation methodologies. After considering PwC's reports issued under the engagement and information provided by Fidelity, the Board believes that while other allocation methods may also be reasonable, Fidelity's profitability methodologies are reasonable in all material respects.
The Board has also reviewed Fidelity's non-fund businesses and any fall-out benefits related to the mutual fund business as well as cases where Fidelity's affiliates may benefit from or be related to the fund's business.
The Board considered the costs of the services provided by and the profits realized by Fidelity in connection with the operation of the fund and determined that the amount of profit is a fair entrepreneurial profit for the management of the fund.
Economies of Scale. The Board considered whether there have been economies of scale in respect of the management of the Fidelity funds, whether the Fidelity funds (including the fund) have appropriately benefited from any such economies of scale, and whether there is potential for realization of any further economies of scale. The Board considered the extent to which the fund will benefit from economies of scale through increased services to the fund, through waivers or reimbursements, or through fee or expense reductions, including reductions that occur through operation of the transfer agent agreement. The transfer agent fee varies in part based on the number of accounts in the fund. If the number of accounts decreases or the average account size increases, the overall transfer agent fee rate decreases.
Annual Report
Board Approval of Investment Advisory Contracts and
Management Fees - continued
The Board recognized that the fund's management contract incorporates a "group fee" structure, which provides for lower group fee rates as total fund assets under FMR's management increase, and for higher group fee rates as total fund assets under FMR's management decrease. FMR determines the group fee rates based on a tiered asset "breakpoint" schedule. In connection with the renewal of the fund's management contract, the Board approved amendments to the fund's management contract that added four new fee breakpoints to the group fee rate schedule for assets under FMR's management above $1,386 billion. The Board considered that the group fee rate declines under both the present and amended schedules, but that under the amended schedule, the group fee rate declines faster as assets under FMR's management exceed $1,386 billion. The Board considered that the group fee is designed to deliver the benefits of economies of scale to fund shareholders when total fund assets increase, even if assets of any particular fund are unchanged or have declined, because some portion of Fidelity's costs are attributable to services provided to all Fidelity funds, and all funds benefit if those costs can be allocated among more assets. The Board concluded that, given the group fee structure, fund shareholders will achieve a certain level of economies of scale as assets under FMR's management increase at the fund complex level, regardless of whether Fidelity achieves any such economies of scale.
The Board further concluded that any potential economies of scale are being shared between fund shareholders and Fidelity in an appropriate manner.
Additional Information Requested by the Board. In order to develop fully the factual basis for consideration of the Fidelity funds' Advisory Contracts, the Board requested and received additional information on several topics, including (i) fund performance trends and actions to be taken by FMR to improve certain funds' overall performance; (ii) Fidelity's portfolio manager compensation structure, including its effects on fund profitability and the extent to which portfolio manager compensation is linked to fund performance; (iii) Fidelity's fee structures; (iv) the funds' sub-advisory arrangements; and (v) accounts managed by Fidelity other than the Fidelity funds.
Based on its evaluation of all of the conclusions noted above, and after considering all material factors, the Board ultimately concluded that the advisory fee structures are fair and reasonable, and that the fund's Advisory Contracts should be renewed.
Annual Report
Managing Your Investments
Fidelity offers several ways to conveniently manage your personal investments via your telephone or PC. You can access your account information, conduct trades and research your investments 24 hours a day.
By Phone
Fidelity Automated Service Telephone provides a single toll-free number to access account balances, positions, quotes and trading. It's easy to navigate the service, and on your first call, the system will help you create a personal identification number (PIN) for security.
(phone_graphic)
Fidelity Automated
Service Telephone (FAST®)
1-800-544-5555
Press
1 For mutual fund and brokerage trading.
2 For quotes.*
3 For account balances and holdings.
4 To review orders and mutual
fund activity.
5 To change your PIN.
*0 To speak to a Fidelity representative.
By PC
Fidelity's web site on the Internet provides a wide range of information, including daily financial news, fund performance, interactive planning tools and news about Fidelity products and services.
(computer_graphic)
Fidelity's Web Site
www.fidelity.com
* When you call the quotes line, please remember that a fund's yield and return will vary and, except for money market funds, share price will also vary. This means that you may have a gain or loss when you sell your shares. There is no assurance that money market funds will be able to maintain a stable $1 share price; an investment in a money market fund is not insured or guaranteed by the U.S. government. Total returns are historical and include changes in share price, reinvestment of dividends and capital gains, and the effects of any sales charges.
Annual Report
Investment Adviser
Fidelity Management & Research Company
Boston, MA
Investment Sub Advisers
FMR Co., Inc.
Fidelity Research & Analysis Company
Fidelity Management & Research
(U.K.) Inc.
Fidelity International Investment
Advisors
Fidelity Investments Japan Limited
Fidelity International Investment
Advisors (U.K.) Limited
General Distributor
Fidelity Distributors Corporation
Boston, MA
Transfer and Service Agent
Fidelity Service Company, Inc.
Boston, MA
Custodian
Citibank, N.A.,
New York, NY
The Fidelity Telephone Connection
Mutual Fund 24-Hour Service
Exchanges/Redemptions
and Account Assistance 1-800-544-6666
Product Information 1-800-544-6666
Retirement Accounts 1-800-544-4774
(8 a.m. - 9 p.m.)
TDD Service 1-800-544-0118
for the deaf and hearing impaired
(9 a.m. - 9 p.m. Eastern time)
Fidelity Automated Service
Telephone (FAST ®) (automated graphic) 1-800-544-5555
(automated graphic) Automated line for quickest service
DGF-UANN-0907
1.789245.104
(Fidelity Investment logo)(registered trademark)
Corporate Headquarters
82 Devonshire St., Boston, MA 02109
www.fidelity.com
Fidelity®
Growth & Income
Portfolio
Annual Report
July 31, 2007
(2_fidelity_logos) (Registered_Trademark)
Contents
Chairman's Message | <Click Here> | Ned Johnson's message to shareholders. |
Performance | <Click Here> | How the fund has done over time. |
Management's Discussion | <Click Here> | The manager's review of fund performance, strategy and outlook. |
Shareholder Expense Example | <Click Here> | An example of shareholder expenses. |
Investment Changes | <Click Here> | A summary of major shifts in the fund's investments over the past six months. |
Investments | <Click Here> | A complete list of the fund's investments with their market values. |
Financial Statements | <Click Here> | Statements of assets and liabilities, operations, and changes in net assets,
as well as financial highlights. |
Notes | <Click Here> | Notes to the financial statements. |
Report of Independent Registered Public Accounting Firm | <Click Here> | |
Trustees and Officers | <Click Here> | |
Distributions | <Click Here> | |
Board Approval of Investment Advisory Contracts and Management Fees | <Click Here> | |
To view a fund's proxy voting guidelines and proxy voting record for the 12-month period ended June 30, visit http://www.fidelity.com (search for "proxy voting guidelines") or visit the Securities and Exchange Commission's (SEC) web site at http://www.sec.gov. You may also call 1-800-544-8544 to request a free copy of the proxy voting guidelines.
Standard & Poor's, S&P and S&P 500 are registered service marks of The McGraw-Hill Companies, Inc. and have been licensed for use by Fidelity Distributors Corporation.
Other third party marks appearing herein are the property of their respective owners.
All other marks appearing herein are registered or unregistered trademarks or service marks of FMR Corp. or an affiliated company.
Annual Report
This report and the financial statements contained herein are submitted for the general information of the shareholders of the fund. This report is not authorized for distribution to prospective investors in the fund unless preceded or accompanied by an effective prospectus.
A fund files its complete schedule of portfolio holdings with the SEC for the first and third quarters of each fiscal year on Form N-Q. Forms N-Q are available on the SEC's web site at http://www.sec.gov. A fund's Forms N-Q may be reviewed and copied at the SEC's Public Reference Room in Washington, DC. Information regarding the operation of the SEC's Public Reference Room may be obtained by calling 1-800-SEC-0330. For a complete list of a fund's portfolio holdings, view the most recent holdings listing, semiannual report, or annual report on Fidelity's web site at http://www.fidelity.com or http://www.advisor.com, as applicable.
NOT FDIC INSURED · MAY LOSE VALUE · NO BANK GUARANTEE
Neither the fund nor Fidelity Distributors Corporation is a bank.
Annual Report
Chairman's Message
(photo_of_Edward_C_Johnson_3d)
Dear Shareholder:
Stocks are currently on pace to register their fifth-straight year of positive returns, although gains could be trimmed if the U.S. economy continues to slow. While financial markets are always unpredictable, there are a number of time-tested principles that can put the historical odds in your favor.
One of the basic tenets is to invest for the long term. Over time, riding out the markets' inevitable ups and downs has proven much more effective than selling into panic or chasing the hottest trend. Even missing only a few of the markets' best days can significantly diminish investor returns. Patience also affords the benefits of compounding - of earning interest on additional income or reinvested dividends and capital gains. There are tax advantages and cost benefits to consider as well. The more you sell, the more taxes you pay, and the more you trade, the higher the costs. While staying the course doesn't eliminate risk, it can considerably lessen the effect of short-term declines.
You can further manage your investing risk through diversification. And today, more than ever, geographic diversification should be taken into account. Studies indicate that asset allocation is the single most important determinant of a portfolio's long-term success. The right mix of stocks, bonds and cash - aligned to your particular risk tolerance and investment objective - is very important. Age-appropriate rebalancing is also an essential aspect of asset allocation. For younger investors, an emphasis on equities - which historically have been the best-performing asset class over time - is encouraged. As investors near their specific goal, such as retirement or sending a child to college, consideration may be given to replacing volatile assets (e.g. common stocks) with more-stable fixed investments (bonds or savings plans).
A third investment principle - investing regularly - can help lower the average cost of your purchases. Investing a certain amount of money each month or quarter helps ensure you won't pay for all your shares at market highs. This strategy - known as dollar cost averaging - also reduces unconstructive "emotion" from investing, helping shareholders avoid selling weak performers just prior to an upswing, or chasing a hot performer just before a correction.
We invite you to contact us via the Internet, through our Investor Centers or over the phone. It is our privilege to provide you the information you need to make the investments that are right for you.
Sincerely,
/s/Edward C. Johnson 3d
Edward C. Johnson 3d
Annual Report
Performance: The Bottom Line
Average annual total return reflects the change in the value of an investment, assuming reinvestment of the fund's dividend income and capital gains (the profits earned upon the sale of securities that have grown in value) and assuming a constant rate of performance each year. The $10,000 table and the fund's returns do not reflect the deduction of taxes that a shareholder would pay on fund distributions or the redemption of fund shares. During periods of reimbursement by Fidelity, a fund's total return will be greater than it would be had the reimbursement not occurred. How a fund did yesterday is no guarantee of how it will do tomorrow.
Average Annual Total Returns
Periods ended July 31, 2007 | Past 1
year | Past 5
years | Past 10
years |
Fidelity® Growth & Income Portfolio | 14.28% | 8.11% | 5.00% |
$10,000 Over 10 Years
Let's say hypothetically that $10,000 was invested in Fidelity ® Growth & Income Portfolio on July 31, 1997. The chart shows how the value of your investment would have changed, and also shows how the Standard & Poor's 500SM Index (S&P 500®) performed over the same period.
Annual Report
Management's Discussion of Fund Performance
Comments from Timothy Cohen, Portfolio Manager of Fidelity® Growth & Income Portfolio
Major U.S. equity benchmarks approached or exceeded gains of 20% and several set record highs during the 12-month period ending July 31, 2007. In that time, the Dow Jones Industrial AverageSM rose 20.84%, the Standard & Poor's 500SM Index advanced 16.13% and the NASDAQ Composite® Index gained 22.67%. The small-cap Russell 2000® Index fared less well after falling nearly 7% in July, but still returned 12.12% for the year overall. The first half of the period featured six consecutive months of positive returns spurred by the more relaxed monetary policy of the Federal Reserve Board and falling energy prices, which softened inflationary pressures on the U.S. economy. Stocks slipped in February, however, as energy prices crept higher, the housing market slumped, subprime mortgage woes mounted and the Chinese stock market declined 9% in a single day. But equities soared again from March through May, as reflected by the Dow and the S&P 500®, which climbed nearly 12% and more than 9%, respectively. In June and July, though, stocks sank again on inflation concerns and a worsening subprime loan crisis.
Growth & Income gained 14.28% for the 12-month span, falling somewhat shy of the S&P 500 benchmark's return. Unproductive security selection within consumer durables - - mainly in U.S. homebuilders, such as KB Home - and among banks and diversified financials firms with exposure to the weak housing market, including mortgage lender Countrywide Financial and mortgage insurer MGIC Investment, hurt the most. Diversified financials holding Bank of America also dragged on performance, as did a sizable overweighting in the insurance segment. My decision not to have any exposure to the strong-performing telecommunication services sector - based on stretched valuations - detracted as well. Conversely, our results were helped by favorable stock picking in the information technology sector, especially within software and services, as well as in the capital goods segment of industrials. Productive picks in materials also were beneficial. Notable among the stocks contributing to relative performance were Research In Motion, the Canadian manufacturer of the BlackBerry wireless messaging device; Honeywell International, the diversified capital goods maker; and Internet search leader Google.
The views expressed above reflect those of the portfolio manager(s) only through the end of the period as stated on the cover of this report and do not necessarily represent the views of Fidelity or any other person in the Fidelity organization. Any such views are subject to change at any time based upon market or other conditions and Fidelity disclaims any responsibility to update such views. These views may not be relied on as investment advice and, because investment decisions for a Fidelity fund are based on numerous factors, may not be relied on as an indication of trading intent on behalf of any Fidelity fund.
Annual Report
Shareholder Expense Example
As a shareholder of the Fund, you incur two types of costs: (1) transaction costs, and (2) ongoing costs, including management fees and other Fund expenses. This Example is intended to help you understand your ongoing costs (in dollars) of investing in the Fund and to compare these costs with the ongoing costs of investing in other mutual funds.
The Example is based on an investment of $1,000 invested at the beginning of the period and held for the entire period (February 1, 2007 to July 31, 2007).
Actual Expenses
The first line of the accompanying table provides information about actual account values and actual expenses. You may use the information in this line, together with the amount you invested, to estimate the expenses that you paid over the period. Simply divide your account value by $1,000.00 (for example, an $8,600 account value divided by $1,000.00 = 8.6), then multiply the result by the number in the first line under the heading entitled "Expenses Paid During Period" to estimate the expenses you paid on your account during this period. A small balance maintenance fee of $12.00 that is charged once a year may apply for certain accounts with a value of less than $2,000. This fee is not included in the table below. If it was, the estimate of expenses you paid during the period would be higher, and your ending account value lower, by this amount. In addition, the Fund, as a shareholder in the underlying Fidelity Central Funds, will indirectly bear its pro rata share of the fees and expenses incurred by the underlying Fidelity Central Funds. These fees and expenses are not included in the Fund's annualized expense ratio used to calculate the expense estimate in the table below.
Hypothetical Example for Comparison Purposes
The second line of the accompanying table provides information about hypothetical account values and hypothetical expenses based on the Fund's actual expense ratio and an assumed rate of return of 5% per year before expenses, which is not the Fund's actual return. The hypothetical account values and expenses may not be used to estimate the actual ending account balance or expenses you paid for the period. You may use this information to compare the ongoing costs of investing in the Fund and other funds. To do so, compare this 5% hypothetical example with the 5% hypothetical examples that appear in the shareholder reports of the other funds. A small balance maintenance fee of $12.00 that is charged once a year may apply for certain accounts with a value of less than $2,000. This fee is not included in the table below. If it was, the estimate of expenses you paid during the period would be higher, and your ending account value lower, by this amount. In addition, the Fund, as a shareholder in the underlying Fidelity Central Funds, will indirectly bear its pro rata share of the fees and expenses incurred by the underlying Fidelity Central Funds. These fees and expenses are not included in the Fund's annualized expense ratio used to calculate the expense estimate in the table below.
Annual Report
Shareholder Expense Example - continued
Please note that the expenses shown in the table are meant to highlight your ongoing costs only and do not reflect any transaction costs. Therefore, the second line of the table is useful in comparing ongoing costs only, and will not help you determine the relative total costs of owning different funds.
| Beginning
Account Value
February 1, 2007 | Ending
Account Value
July 31, 2007 | Expenses Paid
During Period*
February 1, 2007
to July 31, 2007 |
Actual | $ 1,000.00 | $ 1,015.70 | $ 3.35 |
Hypothetical (5% return per year before expenses) | $ 1,000.00 | $ 1,021.47 | $ 3.36 |
* Expenses are equal to the Fund's annualized expense ratio of .67%; multiplied by the average account value over the period, multiplied by 181/365 (to reflect the one-half year period).
Annual Report
Investment Changes
Top Ten Stocks as of July 31, 2007 |
| % of fund's
net assets | % of fund's net assets
6 months ago |
American International Group, Inc. | 6.2 | 5.4 |
General Electric Co. | 6.1 | 7.3 |
Bank of America Corp. | 5.2 | 4.9 |
Wachovia Corp. | 3.7 | 2.1 |
Procter & Gamble Co. | 3.6 | 0.0 |
Home Depot, Inc. | 3.3 | 4.5 |
Google, Inc. Class A (sub. vtg.) | 3.1 | 2.6 |
JPMorgan Chase & Co. | 2.6 | 0.0 |
Comcast Corp. Class A | 2.4 | 0.0 |
Johnson & Johnson | 2.1 | 2.5 |
| 38.3 | |
Top Five Market Sectors as of July 31, 2007 |
| % of fund's
net assets | % of fund's net assets
6 months ago |
Financials | 30.2 | 23.4 |
Consumer Discretionary | 14.9 | 15.0 |
Energy | 12.3 | 13.5 |
Health Care | 11.8 | 13.4 |
Information Technology | 11.4 | 14.5 |
Asset Allocation (% of fund's net assets) |
As of July 31, 2007* | As of January 31, 2007** |
 | Stocks 99.2% | | | Stocks 99.9% | |
 | Short-Term
Investments and
Net Other Assets 0.8% | | | Short-Term
Investments and
Net Other Assets 0.1% | |
* Foreign investments | 20.3% | | ** Foreign investments | 16.7% | |

Annual Report
Investments July 31, 2007
Showing Percentage of Net Assets
Common Stocks - 99.2% |
| Shares | | Value (000s) |
CONSUMER DISCRETIONARY - 14.9% |
Diversified Consumer Services - 1.0% |
Apollo Group, Inc. Class A (non-vtg.) (a) | 3,800,000 | | $ 224,618 |
Hotels, Restaurants & Leisure - 0.7% |
Starbucks Corp. (a) | 6,100,000 | | 162,748 |
Household Durables - 2.3% |
D.R. Horton, Inc. | 7,000,000 | | 114,240 |
Hovnanian Enterprises, Inc. Class A (d) | 1,800,000 | | 23,832 |
KB Home (d) | 3,600,000 | | 114,516 |
Ryland Group, Inc. (d)(e) | 3,200,000 | | 106,400 |
Standard Pacific Corp. (d)(e) | 4,000,000 | | 59,240 |
Toll Brothers, Inc. (a)(d) | 4,500,000 | | 98,685 |
| | 516,913 |
Media - 2.7% |
Comcast Corp. Class A (a) | 21,000,000 | | 551,670 |
Focus Media Holding Ltd. ADR (a)(d) | 1,642,100 | | 67,835 |
| | 619,505 |
Multiline Retail - 1.2% |
Target Corp. | 4,500,000 | | 272,565 |
Specialty Retail - 7.0% |
Best Buy Co., Inc. | 4,800,000 | | 214,032 |
Home Depot, Inc. | 20,116,300 | | 747,723 |
Lowe's Companies, Inc. | 9,500,000 | | 266,095 |
Staples, Inc. | 15,500,000 | | 356,810 |
| | 1,584,660 |
TOTAL CONSUMER DISCRETIONARY | | 3,381,009 |
CONSUMER STAPLES - 6.2% |
Food & Staples Retailing - 2.0% |
Wal-Mart Stores, Inc. | 8,000,000 | | 367,600 |
X5 Retail Group NV GDR (a)(f) | 3,000,000 | | 93,030 |
| | 460,630 |
Food Products - 0.6% |
Nestle SA (Reg.) | 328,429 | | 126,774 |
Household Products - 3.6% |
Procter & Gamble Co. | 13,100,000 | | 810,366 |
TOTAL CONSUMER STAPLES | | 1,397,770 |
Common Stocks - continued |
| Shares | | Value (000s) |
ENERGY - 12.3% |
Energy Equipment & Services - 4.0% |
National Oilwell Varco, Inc. (a) | 1,284,100 | | $ 154,233 |
Schlumberger Ltd. (NY Shares) | 4,900,000 | | 464,128 |
Smith International, Inc. | 2,381,100 | | 146,223 |
Weatherford International Ltd. (a) | 2,500,000 | | 138,325 |
| | 902,909 |
Oil, Gas & Consumable Fuels - 8.3% |
Canadian Natural Resources Ltd. | 1,970,600 | | 135,247 |
Chesapeake Energy Corp. | 7,143,300 | | 243,158 |
EOG Resources, Inc. | 3,366,400 | | 235,985 |
Occidental Petroleum Corp. | 3,800,000 | | 215,536 |
Petroplus Holdings AG | 1,385,560 | | 133,770 |
Plains Exploration & Production Co. (a) | 2,052,700 | | 88,697 |
Suncor Energy, Inc. | 1,395,800 | | 126,207 |
Ultra Petroleum Corp. (a) | 1,860,992 | | 102,894 |
Valero Energy Corp. | 6,000,000 | | 402,060 |
XTO Energy, Inc. | 3,612,700 | | 197,001 |
| | 1,880,555 |
TOTAL ENERGY | | 2,783,464 |
FINANCIALS - 30.2% |
Capital Markets - 2.3% |
AP Alternative Assets, L.P. Restricted Depositary Units (f) | 4,454,200 | | 80,176 |
KKR Private Equity Investors, LP | 3,874,500 | | 79,040 |
KKR Private Equity Investors, LP Restricted Depositary Units (f) | 6,842,100 | | 139,579 |
UBS AG (NY Shares) | 4,200,000 | | 231,294 |
| | 530,089 |
Commercial Banks - 5.8% |
Erste Bank AG | 1,806,400 | | 137,110 |
HSBC Holdings PLC sponsored ADR (d) | 1,400,000 | | 130,424 |
Societe Generale Series A | 533,700 | | 92,864 |
Standard Chartered PLC (United Kingdom) | 3,300,000 | | 108,733 |
Wachovia Corp. | 17,700,000 | | 835,617 |
| | 1,304,748 |
Diversified Financial Services - 8.7% |
African Bank Investments Ltd. | 16,421,500 | | 75,968 |
Bank of America Corp. | 25,000,000 | | 1,185,500 |
Common Stocks - continued |
| Shares | | Value (000s) |
FINANCIALS - continued |
Diversified Financial Services - continued |
JPMorgan Chase & Co. | 13,500,000 | | $ 594,135 |
Moody's Corp. (d) | 2,100,000 | | 112,980 |
| | 1,968,583 |
Insurance - 10.6% |
ACE Ltd. | 2,955,900 | | 170,615 |
AFLAC, Inc. | 3,300,000 | | 171,996 |
American International Group, Inc. | 22,000,000 | | 1,411,959 |
Hartford Financial Services Group, Inc. | 1,700,000 | | 156,179 |
RenaissanceRe Holdings Ltd. (e) | 3,631,400 | | 208,806 |
The Chubb Corp. | 3,600,000 | | 181,476 |
W.R. Berkley Corp. | 3,700,000 | | 108,854 |
| | 2,409,885 |
Thrifts & Mortgage Finance - 2.8% |
Countrywide Financial Corp. (d) | 15,700,000 | | 442,269 |
MGIC Investment Corp. (e) | 4,678,125 | | 180,856 |
Radian Group, Inc. | 543,700 | | 18,328 |
| | 641,453 |
TOTAL FINANCIALS | | 6,854,758 |
HEALTH CARE - 11.8% |
Biotechnology - 3.7% |
Amgen, Inc. (a) | 5,100,000 | | 274,074 |
Celgene Corp. (a) | 2,200,000 | | 133,232 |
Cephalon, Inc. (a)(d) | 1,800,000 | | 135,252 |
Genentech, Inc. (a) | 2,200,200 | | 163,651 |
MannKind Corp. (a)(d) | 1,900,000 | | 20,064 |
Vertex Pharmaceuticals, Inc. (a) | 3,301,694 | | 106,645 |
| | 832,918 |
Health Care Providers & Services - 2.3% |
Cardinal Health, Inc. | 2,852,200 | | 187,475 |
UnitedHealth Group, Inc. | 6,900,000 | | 334,167 |
| | 521,642 |
Life Sciences Tools & Services - 0.9% |
Illumina, Inc. (a)(d)(e) | 2,900,000 | | 132,153 |
Pharmaceutical Product Development, Inc. | 2,300,000 | | 77,050 |
| | 209,203 |
Pharmaceuticals - 4.9% |
Allergan, Inc. | 4,400,500 | | 255,801 |
Common Stocks - continued |
| Shares | | Value (000s) |
HEALTH CARE - continued |
Pharmaceuticals - continued |
Elan Corp. PLC sponsored ADR (a) | 7,800,200 | | $ 146,098 |
Johnson & Johnson | 8,000,000 | | 484,000 |
Roche Holding AG (participation certificate) | 574,751 | | 102,422 |
Sirtris Pharmaceuticals, Inc. | 340,125 | | 4,238 |
Teva Pharmaceutical Industries Ltd. sponsored ADR (d) | 2,700,000 | | 113,454 |
| | 1,106,013 |
TOTAL HEALTH CARE | | 2,669,776 |
INDUSTRIALS - 11.2% |
Aerospace & Defense - 1.2% |
Honeywell International, Inc. | 4,700,000 | | 270,297 |
Commercial Services & Supplies - 1.3% |
Robert Half International, Inc. (e) | 9,000,000 | | 305,910 |
Electrical Equipment - 1.6% |
Evergreen Solar, Inc. (a) | 3,800,000 | | 31,654 |
Q-Cells AG | 780,000 | | 69,055 |
Renewable Energy Corp. AS | 1,560,000 | | 62,359 |
SolarWorld AG (d) | 2,200,000 | | 107,109 |
Suntech Power Holdings Co. Ltd. sponsored ADR (a)(d) | 2,300,000 | | 92,759 |
| | 362,936 |
Industrial Conglomerates - 6.1% |
General Electric Co. | 35,500,000 | | 1,375,980 |
Machinery - 1.0% |
Illinois Tool Works, Inc. | 4,300,000 | | 236,715 |
TOTAL INDUSTRIALS | | 2,551,838 |
INFORMATION TECHNOLOGY - 11.4% |
Communications Equipment - 0.3% |
Research In Motion Ltd. (a) | 300,000 | | 64,200 |
Computers & Peripherals - 0.7% |
Dell, Inc. (a) | 6,000,000 | | 167,820 |
Electronic Equipment & Instruments - 0.8% |
Molex, Inc. | 3,100,000 | | 87,854 |
Motech Industries, Inc. | 6,800,000 | | 84,977 |
Motech Industries, Inc. GDR (a)(f) | 700,000 | | 8,715 |
| | 181,546 |
Common Stocks - continued |
| Shares | | Value (000s) |
INFORMATION TECHNOLOGY - continued |
Internet Software & Services - 3.4% |
Google, Inc. Class A (sub. vtg.) (a) | 1,350,000 | | $ 688,500 |
ValueClick, Inc. (a) | 3,500,000 | | 74,830 |
| | 763,330 |
IT Services - 1.7% |
Cognizant Technology Solutions Corp. Class A (a) | 2,300,100 | | 186,262 |
Infosys Technologies Ltd. sponsored ADR | 1,800,000 | | 89,280 |
Satyam Computer Services Ltd. sponsored ADR | 4,000,000 | | 106,640 |
| | 382,182 |
Office Electronics - 0.3% |
Zebra Technologies Corp. Class A (a)(d) | 1,806,400 | | 65,446 |
Semiconductors & Semiconductor Equipment - 4.2% |
Applied Materials, Inc. | 8,700,000 | | 191,748 |
ARM Holdings PLC | 52,548,600 | | 158,253 |
ASML Holding NV (NY Shares) (a) | 3,600,000 | | 106,416 |
Marvell Technology Group Ltd. (a) | 3,600,000 | | 64,800 |
Maxim Integrated Products, Inc. | 3,800,000 | | 120,460 |
MEMC Electronic Materials, Inc. (a) | 2,100,000 | | 128,772 |
Renesola Ltd. (d) | 3,775,300 | | 36,428 |
Taiwan Semiconductor Manufacturing Co. Ltd. | 80,349,942 | | 159,186 |
| | 966,063 |
TOTAL INFORMATION TECHNOLOGY | | 2,590,587 |
MATERIALS - 1.2% |
Metals & Mining - 1.2% |
Arcelor Mittal (NY Shares) Class A (d) | 4,600,000 | | 280,692 |
TOTAL COMMON STOCKS (Cost $19,831,921) | 22,509,894 |
Money Market Funds - 2.0% |
| | | |
Fidelity Cash Central Fund, 5.38% (b) | 6,340,455 | | 6,340 |
Fidelity Securities Lending Cash Central Fund, 5.39% (b)(c) | 459,319,319 | | 459,319 |
TOTAL MONEY MARKET FUNDS (Cost $465,659) | 465,659 |
Cash Equivalents - 0.1% |
| Maturity Amount (000s) | | Value (000s) |
Investments in repurchase agreements in a joint trading account at 5.09%, dated 7/31/07 due 8/1/07 (Collateralized by U.S. Treasury Obligations) #
(Cost $20,463) | $ 20,466 | | $ 20,463 |
TOTAL INVESTMENT PORTFOLIO - 101.3% (Cost $20,318,043) | | 22,996,016 |
NET OTHER ASSETS - (1.3)% | | (302,797) |
NET ASSETS - 100% | $ 22,693,219 |
Legend |
(a) Non-income producing |
(b) Affiliated fund that is available only to investment companies and other accounts managed by Fidelity Investments. The rate quoted is the annualized seven-day yield of the fund at period end. A complete unaudited listing of the fund's holdings as of its most recent quarter end is available upon request. |
(c) Investment made with cash collateral received from securities on loan. |
(d) Security or a portion of the security is on loan at period end. |
(e) Affiliated company |
(f) Security exempt from registration under Rule 144A of the Securities Act of 1933. These securities may be resold in transactions exempt from registration, normally to qualified institutional buyers. At the end of the period, the value of these securities amounted to $321,500,000 or 1.4% of net assets. |
# Additional Information on each counterparty to the repurchase agreement is as follows: |
Repurchase Agreement / Counterparty | Value
(000s) |
$20,463,000 due 8/01/07 at 5.09% |
Banc of America Securities LLC | $ 3,674 |
Merrill Lynch Government Securities, Inc. | 16,789 |
| $ 20,463 |
Affiliated Central Funds |
Information regarding fiscal year to date income earned by the Fund from investments in Fidelity Central Funds is as follows: |
Funds | Income earned
(Amounts in thousands) |
Fidelity Cash Central Fund | $ 6,336 |
Fidelity Securities Lending Cash Central Fund | 2,801 |
Total | $ 9,137 |
Other Affiliated Issuers |
An affiliated company is a company in which the fund has ownership of at least 5% of the voting securities. Fiscal year to date transactions with companies which are or were affiliates are as follows: |
Affiliates
(Amounts in thousands) | Value, beginning of period | Purchases | Sales Proceeds | Dividend Income | Value,
end of
period |
ARM Holdings PLC | $ 148,296 | $ - | $ 47,338 | $ 1,310 | $ - |
Clear Channel Outdoor Holding, Inc. Class A | 50,100 | - | 63,161 | - | - |
Illumina, Inc. | 108,494 | 5,924 | 4,266 | - | 132,153 |
KB Home | 102,162 | 91,425 | 37,141 | 3,518 | - |
MGIC Investment Corp. | - | 269,574 | - | 725 | 180,856 |
RenaissanceRe Holdings Ltd. | 188,143 | - | - | 3,123 | 208,806 |
Robert Half International, Inc. | 333,620 | 45,123 | 102,375 | 3,912 | 305,910 |
Ryland Group, Inc. | 85,426 | 86,032 | 35,445 | 1,739 | 106,400 |
Standard Pacific Corp. | 83,097 | 28,159 | 18,373 | 744 | 59,240 |
Zebra Technologies Corp. Class A | 130,785 | 14,249 | 111,985 | - | - |
Total | $ 1,230,123 | $ 540,486 | $ 420,084 | $ 15,071 | $ 993,365 |
Other Information |
Distribution of investments by country of issue, as a percentage of total net assets, is as follows: |
United States of America | 79.7% |
United Kingdom | 3.1% |
Switzerland | 2.7% |
Netherlands | 2.1% |
Netherlands Antilles | 2.1% |
Canada | 1.9% |
Bermuda | 1.2% |
Cayman Islands | 1.1% |
Taiwan | 1.1% |
Others (individually less than 1%) | 5.0% |
| 100.0% |
See accompanying notes which are an integral part of the financial statements.
Annual Report
Financial Statements
Statement of Assets and Liabilities
Amounts in thousands (except per-share amount) | July 31, 2007 |
Assets | | |
Investment in securities, at value (including securities loaned of $444,405 and repurchase agreements of $20,463) - See accompanying schedule: Unaffiliated issuers (cost $18,820,704) | $ 21,536,992 | |
Fidelity Central Funds (cost $465,659) | 465,659 | |
Other affiliated issuers (cost $1,031,680) | 993,365 | |
Total Investments (cost $20,318,043) | | $ 22,996,016 |
Cash | | 2,077 |
Receivable for investments sold | | 373,188 |
Receivable for fund shares sold | | 9,549 |
Dividends receivable | | 8,506 |
Distributions receivable from Fidelity Central Funds | | 479 |
Prepaid expenses | | 54 |
Other receivables | | 931 |
Total assets | | 23,390,800 |
| | |
Liabilities | | |
Payable for investments purchased | $ 138,543 | |
Payable for fund shares redeemed | 83,163 | |
Accrued management fee | 10,505 | |
Other affiliated payables | 4,951 | |
Other payables and accrued expenses | 1,100 | |
Collateral on securities loaned, at value | 459,319 | |
Total liabilities | | 697,581 |
| | |
Net Assets | | $ 22,693,219 |
Net Assets consist of: | | |
Paid in capital | | $ 18,028,463 |
Distributions in excess of net investment income | | (1,828) |
Accumulated undistributed net realized gain (loss) on investments and foreign currency transactions | | 1,988,610 |
Net unrealized appreciation (depreciation) on investments and assets and liabilities in foreign currencies | | 2,677,974 |
Net Assets, for 711,024 shares outstanding | | $ 22,693,219 |
Net Asset Value, offering price and redemption price per share ($22,693,219 ÷ 711,024 shares) | | $ 31.92 |
See accompanying notes which are an integral part of the financial statements.
Annual Report
Financial Statements - continued
Statement of Operations
Amounts in thousands | Year ended July 31, 2007 |
Investment Income | | |
Dividends (including $15,071 earned from other affiliated issuers) | | $ 430,825 |
Interest | | 407 |
Income from Fidelity Central Funds | | 9,137 |
Total income | | 440,369 |
| | |
Expenses | | |
Management fee | $ 135,077 | |
Transfer agent fees | 58,453 | |
Accounting and security lending fees | 2,043 | |
Custodian fees and expenses | 693 | |
Independent trustees' compensation | 96 | |
Appreciation in deferred trustee compensation account | 6 | |
Registration fees | 96 | |
Audit | 209 | |
Legal | 451 | |
Interest | 343 | |
Miscellaneous | 554 | |
Total expenses before reductions | 198,021 | |
Expense reductions | (3,145) | 194,876 |
Net investment income (loss) | | 245,493 |
Realized and Unrealized Gain (Loss) Net realized gain (loss) on: | | |
Investment securities: | | |
Unaffiliated issuers | 2,286,759 | |
Redemption in-kind with affiliated entities | 1,740,467 | |
Other affiliated issuers | (10,285) | |
Foreign currency transactions | (372) | |
Total net realized gain (loss) | | 4,016,569 |
Change in net unrealized appreciation (depreciation) on Investment securities | | (36,094) |
Net gain (loss) | | 3,980,475 |
Net increase (decrease) in net assets resulting from operations | | $ 4,225,968 |
See accompanying notes which are an integral part of the financial statements.
Annual Report
Statement of Changes in Net Assets
Amounts in thousands | Year ended
July 31,
2007 | Year ended
July 31,
2006 |
Increase (Decrease) in Net Assets | | |
Operations | | |
Net investment income (loss) | $ 245,493 | $ 287,131 |
Net realized gain (loss) | 4,016,569 | 8,393,121 |
Change in net unrealized appreciation (depreciation) | (36,094) | (8,258,352) |
Net increase (decrease) in net assets resulting
from operations | 4,225,968 | 421,900 |
Distributions to shareholders from net investment income | (249,549) | (320,403) |
Distributions to shareholders from net realized gain | (5,102,919) | (3,635,165) |
Total distributions | (5,352,468) | (3,955,568) |
Share transactions
Proceeds from sales of shares | 3,378,425 | 3,926,843 |
Reinvestment of distributions | 5,231,624 | 3,859,564 |
Cost of shares redeemed | (13,651,081) | (7,181,012) |
Net increase (decrease) in net assets resulting from share transactions | (5,041,032) | 605,395 |
Total increase (decrease) in net assets | (6,167,532) | (2,928,273) |
| | |
Net Assets | | |
Beginning of period | 28,860,751 | 31,789,024 |
End of period (including distributions in excess of net investment income of $1,828 and distributions in excess of net investment income of $790, respectively) | $ 22,693,219 | $ 28,860,751 |
Other Information Shares | | |
Sold | 104,430 | 109,956 |
Issued in reinvestment of distributions | 180,580 | 108,570 |
Redeemed | (418,890) | (201,011) |
Net increase (decrease) | (133,880) | 17,515 |
See accompanying notes which are an integral part of the financial statements.
Annual Report
Financial Highlights
Years ended July 31, | 2007 | 2006 | 2005 | 2004 | 2003 |
Selected Per-Share Data | | | | | |
Net asset value, beginning of period | $ 34.16 | $ 38.42 | $ 35.46 | $ 32.84 | $ 31.61 |
Income from Investment Operations | | | | | |
Net investment income (loss) B | .27 | .34 | .60 E | .40 | .40 |
Net realized and unrealized gain (loss) | 3.84 | .18 | 3.31 | 2.63 | 1.20 |
Total from investment operations | 4.11 | .52 | 3.91 | 3.03 | 1.60 |
Distributions from net investment income | (.27) | (.38) | (.61) | (.41) | (.37) |
Distributions from net realized gain | (6.08) | (4.40) | (.34) | - | - |
Total distributions | (6.35) | (4.78) | (.95) | (.41) | (.37) |
Net asset value, end of period | $ 31.92 | $ 34.16 | $ 38.42 | $ 35.46 | $ 32.84 |
Total Return A | 14.28% | 1.22% | 11.15% | 9.24% | 5.15% |
Ratios to Average Net Assets C,F | | | | | |
Expenses before reductions | .68% | .69% | .69% | .70% | .73% |
Expenses net of fee waivers, if any | .68% | .69% | .69% | .70% | .73% |
Expenses net of all reductions | .67% | .65% | .68% | .69% | .71% |
Net investment income (loss) | .84% | .94% | 1.63% E | 1.13% | 1.29% |
Supplemental Data | | | | | |
Net assets, end of period (in millions) | $ 22,693 | $ 28,861 | $ 31,789 | $ 29,776 | $ 28,263 |
Portfolio turnover rate D | 52% | 120% | 31% | 30% | 33% |
A Total returns would have been lower had certain expenses not been reduced during the periods shown.
B Calculated based on average shares outstanding during the period.
C Fees and expenses of the underlying Fidelity Central Funds are not included in the Fund's expense ratio. The Fund indirectly bears its proportionate share of the expenses of any underlying Fidelity Central Funds.
D Amount does not include the portfolio activity of any underlying Fidelity Central Funds.
E Investment income per share reflects a special dividend which amounted to $.13 per share. Excluding the special dividend, the ratio of net investment income (loss) to average net assets would have been 1.27%.
F Expense ratios reflect operating expenses of the Fund. Expenses before reductions do not reflect amounts reimbursed by the investment adviser or reductions from brokerage service arrangements or other expense offset arrangements and do not represent the amount paid by the Fund during periods when reimbursements or reductions occur. Expenses net of fee waivers reflect expenses after reimbursement by the investment adviser but prior to reductions from brokerage service arrangements or other expense offset arrangements. Expenses net of all reductions represent the net expenses paid by the Fund.
See accompanying notes which are an integral part of the financial statements.
Annual Report
Notes to Financial Statements
For the period ended July 31, 2007
(Amounts in thousands except ratios)
1. Organization.
Fidelity Growth & Income Portfolio (the Fund) is a fund of Fidelity Securities Fund (the trust) and is authorized to issue an unlimited number of shares. The trust is registered under the Investment Company Act of 1940, as amended (the 1940 Act), as an open-end management investment company organized as a Massachusetts business trust.
2. Investments in Fidelity Central Funds.
The Fund may invest in Fidelity Central Funds which are open-end investment companies available only to other investment companies and accounts managed by Fidelity Management & Research Company (FMR) and its affiliates. The Fund's Schedule of Investments lists each of the Fidelity Central Funds as an investment of the Fund, but does not include the underlying holdings of each Fidelity Central Fund. As an Investing Fund, the Fund indirectly bears its proportionate share of the expenses of the underlying Fidelity Central Funds.
The Money Market Central Funds seek preservation of capital and current income and are managed by Fidelity Investments Money Management, Inc. (FIMM), an affiliate of FMR.
A complete list of holdings for each Fidelity Central Fund is available upon request or at the SEC's web site at www.sec.gov. In addition, the financial statements of the Fidelity Central Funds, which are not covered by the Fund's Report of Independent Registered Public Accounting Firm, are available on the SEC's web site, or upon request.
3. Significant Accounting Policies.
The financial statements have been prepared in conformity with accounting principles generally accepted in the United States of America, which require management to make certain estimates and assumptions at the date of the financial statements. The following summarizes the significant accounting policies of the Fund:
Security Valuation. Investments are valued and net asset value (NAV) per share is calculated (NAV calculation) as of the close of business of the New York Stock Exchange (NYSE), normally 4:00 p.m. Eastern time. Wherever possible, the Fund uses independent pricing services approved by the Board of Trustees to value its investments.
Equity securities, including restricted securities, for which market quotations are readily available, are valued at the last reported sale price or official closing price as reported by an independent pricing service on the primary market or exchange on which they are traded. In the event there were no sales during the day or closing prices are not available, securities are valued at the last quoted bid price. Investments in open-end mutual funds, including the Fidelity Central Funds, are valued at their closing net asset value each business day. Short-term securities with remaining maturities of sixty days or less for
Annual Report
Notes to Financial Statements - continued
(Amounts in thousands except ratios)
3. Significant Accounting Policies - continued
Security Valuation - continued
which quotations are not readily available are valued at amortized cost, which approximates value.
When current market prices or quotations are not readily available or do not accurately reflect fair value, valuations may be determined in accordance with procedures adopted by the Board of Trustees. For example, when developments occur between the close of a market and the close of the NYSE that may materially affect the value of some or all of the securities, or when trading in a security is halted, those securities may be fair valued. Factors used in the determination of fair value may include monitoring news to identify significant market or security specific events such as changes in the value of U.S. securities markets, reviewing developments in foreign markets and evaluating the performance of ADRs, futures contracts and exchange-traded funds. Because the Fund's utilization of fair value pricing depends on market activity, the frequency with which fair value pricing is used cannot be predicted and may be utilized to a significant extent. The value of securities used for NAV calculation under fair value pricing may differ from published prices for the same securities.
Foreign Currency. The Fund uses foreign currency contracts to facilitate transactions in foreign-denominated securities. Losses from these transactions may arise from changes in the value of the foreign currency or if the counterparties do not perform under the contracts' terms.
Foreign-denominated assets, including investment securities, and liabilities are translated into U.S. dollars at the exchange rate at period end. Purchases and sales of investment securities, income and dividends received and expenses denominated in foreign currencies are translated into U.S. dollars at the exchange rate in effect on the transaction date.
The effects of exchange rate fluctuations on investments are included with the net realized and unrealized gain (loss) on investment securities. Other foreign currency transactions resulting in realized and unrealized gain (loss) are disclosed separately.
Investment Transactions and Income. For financial reporting purposes, the Fund's investment holdings and NAV include trades executed through the end of the last business day of the period. The NAV for processing shareholder transactions includes trades executed through the end of the prior business day. Gains and losses on securities sold are determined on the basis of identified cost and may include proceeds received from litigation. Dividend income is recorded on the ex-dividend date, except for certain dividends from foreign securities where the ex-dividend date may have passed, which are recorded as soon as the Fund is informed of the ex-dividend date. Non-cash dividends included in dividend income, if any, are recorded at the fair market value of the
Annual Report
3. Significant Accounting Policies - continued
Investment Transactions and Income - continued
securities received. Distributions received on securities that represent a return of capital or capital gain are recorded as a reduction of cost of investments and/or as a realized gain. The Fund estimates the components of distributions received that may be considered return of capital distributions or capital gain distributions. Interest income and distributions from the Fidelity Central Funds are accrued as earned. Interest income includes coupon interest and amortization of premium and accretion of discount on debt securities. Investment income is recorded net of foreign taxes withheld where recovery of such taxes is uncertain.
Expenses. Most expenses of the trust can be directly attributed to a fund. Expenses which cannot be directly attributed are apportioned among each Fund in the trust. Expense estimates are accrued in the period to which they relate and adjustments are made when actual amounts are known.
Deferred Trustee Compensation. Under a Deferred Compensation Plan (the Plan), Independent Trustees must defer receipt of a portion of, and may elect to defer receipt of an additional portion of, their annual compensation. Deferred amounts are invested in a cross-section of Fidelity funds, are marked-to-market and remain in the Fund until distributed in accordance with the Plan. The investment of deferred amounts and the offsetting payable to the Trustees are included in the accompanying Statement of Assets and Liabilities.
Income Tax Information and Distributions to Shareholders. Each year, the Fund intends to qualify as a regulated investment company by distributing all of its taxable income and realized gains under Subchapter M of the Internal Revenue Code. As a result, no provision for income taxes is required in the accompanying financial statements. Foreign taxes are provided for based on the Fund's understanding of the tax rules and rates that exist in the foreign markets in which it invests.
Distributions are recorded on the ex-dividend date. Income and capital gain distributions are determined in accordance with income tax regulations, which may differ from generally accepted accounting principles. In addition, the Fund will claim a portion of the payment made to redeeming shareholders as a distribution for income tax purposes.
Capital accounts within the financial statements are adjusted for permanent book-tax differences. These adjustments have no impact on net assets or the results of operations. Temporary book-tax differences will reverse in a subsequent period.
Book-tax differences are primarily due to foreign currency transactions, redemptions in kind, partnerships, deferred trustees compensation, and losses deferred due to wash sales.
Annual Report
Notes to Financial Statements - continued
(Amounts in thousands except ratios)
3. Significant Accounting Policies - continued
Income Tax Information and Distributions to Shareholders - continued
The tax-basis components of distributable earnings and the federal tax cost as of period end were as follows:
Unrealized appreciation | $ 3,757,676 | |
Unrealized depreciation | (1,094,268) | |
Net unrealized appreciation (depreciation) | 2,663,408 | |
Undistributed ordinary income | 357,187 | |
Undistributed long-term capital gain | 1,486,827 | |
Cost for federal income tax purposes | $ 20,332,608 | |
The tax character of distributions paid was as follows:
| July 31, 2007 | July 31, 2006 |
Ordinary Income | $ 371,434 | $ 320,403 |
Long-term Capital Gains | 4,981,034 | 3,635,165 |
Total | $ 5,352,468 | $ 3,955,568 |
New Accounting Pronouncements. In July 2006, Financial Accounting Standards Board Interpretation No. 48, Accounting for Uncertainty in Income Taxes - an interpretation of FASB Statement 109 (FIN 48), was issued and is effective on the last business day of the semiannual reporting period for fiscal years beginning after December 15, 2006. FIN 48 sets forth a threshold for financial statement recognition, measurement and disclosure of a tax position taken or expected to be taken on a tax return. Management has concluded that the adoption of FIN 48 will not result in a material impact on the Fund's net assets, results of operations and financial statement disclosures.
In addition, in September 2006, Statement of Financial Accounting Standards No. 157, Fair Value Measurements (SFAS 157), was issued and is effective for fiscal years beginning after November 15, 2007. SFAS 157 defines fair value, establishes a framework for measuring fair value and expands disclosures about fair value measurements. Management is currently evaluating the impact the adoption of SFAS 157 will have on the Fund's financial statement disclosures.
4. Operating Policies.
Repurchase Agreements. FMR has received an Exemptive Order from the Securities and Exchange Commission (the SEC) which permits the Fund and other affiliated entities of FMR to transfer uninvested cash balances into joint trading accounts which are then invested in repurchase agreements. The Fund may also invest directly with institutions in repurchase agreements. Repurchase agreements are collateralized by government or non-government securities. Upon settlement date, collateral is held in
Annual Report
4. Operating Policies - continued
Repurchase Agreements - continued
segregated accounts with custodian banks and may be obtained in the event of a default of the counterparty. The Fund monitors, on a daily basis, the value of the collateral to ensure it is at least equal to the principal amount of the repurchase agreement (including accrued interest). In the event of a default by the counterparty, realization of the collateral proceeds could be delayed, during which time the value of the collateral may decline.
Restricted Securities. The Fund may invest in securities that are subject to legal or contractual restrictions on resale. These securities generally may be resold in transactions exempt from registration or to the public if the securities are registered. Disposal of these securities may involve time-consuming negotiations and expense, and prompt sale at an acceptable price may be difficult. Information regarding restricted securities is included at the end of the Fund's Schedule of Investments.
5. Purchases and Sales of Investments.
Purchases and sales of securities, other than short-term securities, aggregated $15,027,484 and $25,276,548, respectively.
6. Fees and Other Transactions with Affiliates.
Management Fee. FMR and its affiliates provide the Fund with investment management related services for which the Fund pays a monthly management fee. The management fee is the sum of an individual fund fee rate that is based on an annual rate of .20% of the Fund's average net assets and a group fee rate that averaged ..26% during the period. The group fee rate is based upon the average net assets of all the mutual funds advised by FMR. The group fee rate decreases as assets under management increase and increases as assets under management decrease. For the period, the total annual management fee rate was .46% of the Fund's average net assets.
Transfer Agent Fees. Fidelity Service Company, Inc. (FSC), an affiliate of FMR, is the Fund's transfer, dividend disbursing and shareholder servicing agent. FSC receives account fees and asset-based fees that vary according to account size and type of account. FSC pays for typesetting, printing and mailing of shareholder reports, except proxy statements. For the period the transfer agent fees were equivalent to an annual rate of .20% of average net assets.
Accounting and Security Lending Fees. FSC maintains the Fund's accounting records. The accounting fee is based on the level of average net assets for the month. Under a separate contract, FSC administers the security lending program. The security lending fee is based on the number and duration of lending transactions.
Annual Report
Notes to Financial Statements - continued
(Amounts in thousands except ratios)
6. Fees and Other Transactions with Affiliates - continued
Brokerage Commissions. The Fund placed a portion of its portfolio transactions with brokerage firms which are affiliates of the investment adviser. The commissions paid to these affiliated firms were $121 for the period.
Interfund Lending Program. Pursuant to an Exemptive Order issued by the SEC, the Fund, along with other registered investment companies having management contracts with FMR, may participate in an interfund lending program. This program provides an alternative credit facility allowing the funds to borrow from, or lend money to, other participating affiliated funds. At period end, there were no interfund loans outstanding. The Fund's activity in this program during the period for which loans were outstanding was as follows:
Borrower or Lender | Average Daily
Loan Balance | Weighted Average Interest Rate | Interest
Expense |
Borrower | $ 34,674 | 5.41% | $ 323 |
Redemption-in-Kind. On July 20, 2007, 143,251 fund shares held by affiliated entities were redeemed in kind for cash and securities with a value of $4,826,123. The realized gain (loss) of $1,740,467 on securities delivered through the in-kind redemption is included in the accompanying Statement of Operations and is not taxable to the Fund.
7. Committed Line of Credit.
The Fund participates with other funds managed by FMR in a $4.2 billion credit facility (the "line of credit") to be utilized for temporary or emergency purposes to fund shareholder redemptions or for other short-term liquidity purposes. The Fund has agreed to pay commitment fees on its pro rata portion of the line of credit, which amounted to $55 and is reflected in Miscellaneous Expense on the Statement of Operations. During the period, there were no borrowings on this line of credit.
8. Security Lending.
The Fund lends portfolio securities from time to time in order to earn additional income. On the settlement date of the loan, the Fund receives collateral (in the form of U.S. Treasury obligations, letters of credit and/or cash) against the loaned securities and maintains collateral in an amount not less than 100% of the market value of the loaned securities during the period of the loan. The market value of the loaned securities is determined at the close of business of the Fund and any additional required collateral is delivered to the Fund on the next business day. If the borrower defaults on its obligation to return the securities loaned because of insolvency or other reasons, a fund could experience delays and costs in recovering the securities loaned or in gaining access to the collateral. Any cash collateral received is invested in the Fidelity Securities Lending Cash Central Fund. The value of loaned securities and cash collateral at period end are
Annual Report
8. Security Lending - continued
disclosed on the Fund's Statement of Assets and Liabilities. Security lending income represents the income earned on investing cash collateral, less fees and expenses associated with the loan, plus any premium payments that may be received on the loan of certain types of securities. Security lending income is presented in the Statement of Operations as a component of income from Fidelity Central Funds. Net income from lending portfolio securities during the period amounted to $2,801.
9. Bank Borrowings.
The Fund is permitted to have bank borrowings for temporary or emergency purposes to fund shareholder redemptions. The Fund has established borrowing arrangements with certain banks. The interest rate on the borrowings is the bank's base rate, as revised from time to time. The average daily loan balance during the period for which loans were outstanding amounted to $25,590. The weighted average interest rate was 5.56%. The interest expense amounted to $20 under the bank borrowing program. At period end, there were no bank borrowings outstanding.
10. Expense Reductions.
Many of the brokers with whom FMR places trades on behalf of the Fund provided services to the Fund in addition to trade execution. These services included payments of certain expenses on behalf of the Fund totaling $680 for the period. In addition, through arrangements with the Fund's custodian and transfer agent, credits realized as a result of uninvested cash balances were used to reduce the Fund's expenses. During the period, these credits reduced the Fund's custody and transfer agent expenses by $13 and $1,980, respectively.
11. Other.
The Fund's organizational documents provide former and current trustees and officers with a limited indemnification against liabilities arising in connection with the performance of their duties to the Fund. In the normal course of business, the Fund may also enter into contracts that provide general indemnifications. The Fund's maximum exposure under these arrangements is unknown as this would be dependent on future claims that may be made against the Fund. The risk of material loss from such claims is considered remote.
The United States Securities and Exchange Commission ("SEC") is conducting an investigation of FMR (covering the years 2002 to 2004) arising from gifts, gratuities and business entertainment provided by certain brokers to certain individuals who were
Annual Report
Notes to Financial Statements - continued
(Amounts in thousands except ratios)
11. Other - continued
employed on FMR's domestic equity trading desk during that period. FMR is in discussions with the SEC staff regarding the possible resolution of the matter, but as of period-end no final resolution has been reached.
In December 2006, the Independent Trustees completed their own investigation of the matter with the assistance of independent counsel. The Independent Trustees and FMR agree that, despite the absence of proof that the Fidelity mutual funds experienced diminished execution quality as a result of the improper receipt of gifts and business entertainment, the conduct at issue was serious and is worthy of redress. Accordingly, the Independent Trustees have requested and FMR has agreed to pay $42 million to Fidelity mutual funds, plus interest to be determined at the time that payment is made. A method of allocating this payment among the funds has not yet been determined. The total payment to the Fund is not anticipated to have a material impact on the Fund's net assets. In addition, FMR reimbursed related legal expenses which are recorded in the accompanying Statement of Operations as an expense reduction.
Annual Report
Report of Independent Registered Public Accounting Firm
To the Trustees of Fidelity Securities Fund and the Shareholders of Fidelity Growth & Income Portfolio:
In our opinion, the accompanying statement of assets and liabilities, including the schedule of investments, and the related statements of operations and of changes in net assets and the financial highlights present fairly, in all material respects, the financial position of Fidelity Growth & Income Portfolio (a fund of Fidelity Securities Fund) at July 31, 2007, the results of its operations for the year then ended, the changes in its net assets for each of the two years in the period then ended and the financial highlights for each of the five years in the period then ended, in conformity with accounting principles generally accepted in the United States of America. These financial statements and financial highlights (hereafter referred to as "financial statements") are the responsibility of the Fidelity Growth & Income Portfolio's management. Our responsibility is to express an opinion on these financial statements based on our audits. We conducted our audits of these financial statements in accordance with the standards of the Public Company Accounting Oversight Board (United States). Those standards require that we plan and perform the audit to obtain reasonable assurance about whether the financial statements are free of material misstatement. An audit includes examining, on a test basis, evidence supporting the amounts and disclosures in the financial statements, assessing the accounting principles used and significant estimates made by management, and evaluating the overall financial statement presentation. We believe that our audits, which included confirmation of securities at July 31, 2007 by correspondence with the custodian and brokers, provide a reasonable basis for our opinion.
/s/ PricewaterhouseCoopers LLP
PricewaterhouseCoopers LLP
Boston, Massachusetts
September 17, 2007
Annual Report
Trustees and Officers
The Trustees, Members of the Advisory Board, and executive officers of the trust and fund, as applicable, are listed below. The Board of Trustees governs the fund and is responsible for protecting the interests of shareholders. The Trustees are experienced executives who meet periodically throughout the year to oversee the fund's activities, review contractual arrangements with companies that provide services to the fund, and review the fund's performance. Except for James C. Curvey, each of the Trustees oversees 353 funds advised by FMR or an affiliate. Mr. Curvey oversees 317 funds advised by FMR or an affiliate.
The Trustees hold office without limit in time except that (a) any Trustee may resign; (b) any Trustee may be removed by written instrument, signed by at least two-thirds of the number of Trustees prior to such removal; (c) any Trustee who requests to be retired or who has become incapacitated by illness or injury may be retired by written instrument signed by a majority of the other Trustees; and (d) any Trustee may be removed at any special meeting of shareholders by a two-thirds vote of the outstanding voting securities of the trust. Each Trustee who is not an interested person (as defined in the 1940 Act) (Independent Trustee), shall retire not later than the last day of the calendar year in which his or her 72nd birthday occurs. The Independent Trustees may waive this mandatory retirement age policy with respect to individual Trustees. The executive officers and Advisory Board Members hold office without limit in time, except that any officer and Advisory Board Member may resign or may be removed by a vote of a majority of the Trustees at any regular meeting or any special meeting of the Trustees. Except as indicated, each individual has held the office shown or other offices in the same company for the past five years.
The fund's Statement of Additional Information (SAI) includes more information about the Trustees. To obtain a free copy, please call Fidelity at 1-800-544-8544.
Interested Trustees*:
Correspondence intended for each Trustee who is an interested person may be sent to Fidelity Investments, 82 Devonshire Street, Boston, Massachusetts 02109.
Name, Age; Principal Occupation |
Edward C. Johnson 3d (77) |
| Year of Election or Appointment: 1984 Mr. Johnson is Chairman of the Board of Trustees. Mr. Johnson serves as President (2006-present), Chief Executive Officer, Chairman, and a Director of FMR Corp.; Chairman and a Director of FMR; Chairman and a Director of Fidelity Research & Analysis Company (FRAC); Chairman and a Director of Fidelity Investments Money Management, Inc.; and Chairman (2001-present) and a Director of FMR Co., Inc. In addition, Mr. Johnson serves as Chairman and Director of Fidelity International Limited (FIL). |
James C. Curvey (72) |
| Year of Election or Appointment: 2007 Mr. Curvey also serves as Trustee (2007-present) or Member of the Advisory Board (2007-present) of other investment companies advised by FMR. Mr. Curvey is Vice Chairman (2006-present) and Director of FMR Corp. Mr. Curvey joined Fidelity in 1982 and served in numerous senior management positions, including President and Chief Operating Officer of FMR Corp. (1997-2000) and President of Fidelity Strategic Investments (2000-2002). In addition, he serves as a member of the Board of Directors of Geerlings & Wade, Inc. (wine distribution). |
* Trustees have been determined to be "Interested Trustees" by virtue of, among other things, their affiliation with the trust or various entities under common control with FMR.
Independent Trustees:
Correspondence intended for each Independent Trustee (that is, the Trustees other than the Interested Trustees) may be sent to Fidelity Investments, P.O. Box 55235, Boston, Massachusetts 02205-5235.
Name, Age; Principal Occupation |
Dennis J. Dirks (59) |
| Year of Election or Appointment: 2005 Prior to his retirement in May 2003, Mr. Dirks was Chief Operating Officer and a member of the Board of The Depository Trust & Clearing Corporation (DTCC) (1999-2003). He also served as President, Chief Operating Officer, and Board member of The Depository Trust Company (DTC) (1999-2003) and President and Board member of the National Securities Clearing Corporation (NSCC) (1999-2003). In addition, Mr. Dirks served as Chief Executive Officer and Board member of the Government Securities Clearing Corporation (2001-2003) and Chief Executive Officer and Board member of the Mortgage-Backed Securities Clearing Corporation (2001-2003). Mr. Dirks also serves as a Trustee and a member of the Finance Committee of Manhattan College (2005-present) and a Trustee and a member of the Finance Committee of AHRC of Nassau County (2006-present). |
Albert R. Gamper, Jr. (65) |
| Year of Election or Appointment: 2006 Prior to his retirement in December 2004, Mr. Gamper served as Chairman of the Board of CIT Group Inc. (commercial finance). During his tenure with CIT Group Inc. Mr. Gamper served in numerous senior management positions, including Chairman (1987-1989; 1999-2001; 2002-2004), Chief Executive Officer (1987-2004), and President (1989-2002). He currently serves as a member of the Board of Directors of Public Service Enterprise Group (utilities, 2001-present), Chairman of the Board of Governors, Rutgers University (2004-present), and Chairman of the Board of Saint Barnabas Health Care System. |
George H. Heilmeier (71) |
| Year of Election or Appointment: 2004 Dr. Heilmeier is Chairman Emeritus of Telcordia Technologies (communication software and systems), where prior to his retirement, he served as company Chairman and Chief Executive Officer. He currently serves on the Boards of Directors of The Mitre Corporation (systems engineering and information technology support for the government), and HRL Laboratories (private research and development, 2004-present). He is Chairman of the General Motors Science & Technology Advisory Board and a Life Fellow of the Institute of Electrical and Electronics Engineers (IEEE). Dr. Heilmeier is a member of the Defense Science Board and the National Security Agency Advisory Board. He is also a member of the National Academy of Engineering, the American Academy of Arts and Sciences, and the Board of Overseers of the School of Engineering and Applied Science of the University of Pennsylvania. Previously, Dr. Heilmeier served as a Director of TRW Inc. (automotive, space, defense, and information technology, 1992-2002), Compaq (1994-2002), Automatic Data Processing, Inc. (ADP) (technology-based business outsourcing, 1995-2002), INET Technologies Inc. (telecommunications network surveillance, 2001-2004), and Teletech Holdings (customer management services). He is the recipient of the 2005 Kyoto Prize in Advanced Technology for his invention of the liquid crystal display, and a member of the Consumer Electronics Hall of Fame. |
James H. Keyes (66) |
| Year of Election or Appointment: 2007 Prior to his retirement in 2003, Mr. Keyes was Chairman, President, and Chief Executive Officer of Johnson Controls, Inc. (automotive supplier, 1993-2003). He currently serves as a member of the boards of LSI Logic Corporation (semiconductor technologies), Navistar International Corporation (manufacture and sale of trucks, buses, and diesel engines, 2002-present), and Pitney Bowes, Inc. (integrated mail, messaging, and document management solutions). |
Marie L. Knowles (60) |
| Year of Election or Appointment: 2001 Prior to Ms. Knowles' retirement in June 2000, she served as Executive Vice President and Chief Financial Officer of Atlantic Richfield Company (ARCO) (diversified energy, 1996-2000). From 1993 to 1996, she was a Senior Vice President of ARCO and President of ARCO Transportation Company. She served as a Director of ARCO from 1996 to 1998. She currently serves as a Director of Phelps Dodge Corporation (copper mining and manufacturing) and McKesson Corporation (healthcare service, 2002-present). Ms. Knowles is a Trustee of the Brookings Institution and the Catalina Island Conservancy and also serves as a member of the Advisory Board for the School of Engineering of the University of Southern California. |
Ned C. Lautenbach (63) |
| Year of Election or Appointment: 2000 Mr. Lautenbach is Chairman of the Independent Trustees (2006-present). Mr. Lautenbach has been a partner of Clayton, Dubilier & Rice, Inc. (private equity investment firm) since September 1998. Previously, Mr. Lautenbach was with the International Business Machines Corporation (IBM) from 1968 until his retirement in 1998. Mr. Lautenbach serves as a Director of Sony Corporation (2006-present) and Eaton Corporation (diversified industrial) as well as the Philharmonic Center for the Arts in Naples, Florida. He also is a member of the Board of Trustees of Fairfield University (2005-present), as well as a member of the Council on Foreign Relations. |
Cornelia M. Small (63) |
| Year of Election or Appointment: 2005 Ms. Small is a member (2000-present) and Chairperson (2002-present) of the Investment Committee, and a member (2002-present) of the Board of Trustees of Smith College. Previously, she served as Chief Investment Officer (1999-2000), Director of Global Equity Investments (1996-1999), and a member of the Board of Directors of Scudder, Stevens & Clark (1990-1997) and Scudder Kemper Investments (1997-1999). In addition, Ms. Small served as Co-Chair (2000-2003) of the Annual Fund for the Fletcher School of Law and Diplomacy. |
William S. Stavropoulos (68) |
| Year of Election or Appointment: 2001 Mr. Stavropoulos is Chairman Emeritus of the Board of Directors of The Dow Chemical Company. Since joining The Dow Chemical Company in 1967, Mr. Stavropoulos served in numerous senior management positions, including President (1993-2000; 2002-2003), CEO (1995-2000; 2002-2004), and Chairman of the Executive Committee (2000-2004). Currently, he is a Director of NCR Corporation (data warehousing and technology solutions), Chemical Financial Corporation, Maersk Inc. (industrial conglomerate, 2002-present), Tyco International, Inc. (multinational manufacturing and services, 2007-present), and a member of the Advisory Board for Metalmark Capital (private equity investment firm, 2005-present). He is a special advisor to Clayton, Dubilier & Rice, Inc., a private equity investment firm. He also serves as a member of the Board of Trustees of the American Enterprise Institute for Public Policy Research. In addition, Mr. Stavropoulos is a member of The Business Council, J.P. Morgan International Council and the University of Notre Dame Advisory Council for the College of Science. |
Kenneth L. Wolfe (68) |
| Year of Election or Appointment: 2005 Prior to his retirement in 2001, Mr. Wolfe was Chairman and Chief Executive Officer of Hershey Foods Corporation (1993-2001). He currently serves as a member of the boards of Adelphia Communications Corporation (2003-present), Bausch & Lomb, Inc., and Revlon Inc. (2004-present). |
Advisory Board Members and Executive Officers:
Correspondence intended for Mr. Mauriello may be sent to Fidelity Investments, P.O. Box 55235, Boston, Massachusetts 02205-5235. Correspondence intended for each executive officer and Mr. Lynch may be sent to Fidelity Investments, 82 Devonshire Street, Boston, Massachusetts 02109.
Name, Age; Principal Occupation |
Peter S. Lynch (63) |
| Year of Election or Appointment: 2003 Member of the Advisory Board of Fidelity Securities Fund. Mr. Lynch is Vice Chairman and a Director of FMR, and Vice Chairman (2001-present) and a Director of FMR Co., Inc. Previously, Mr. Lynch served as a Trustee of the Fidelity funds (1990-2003). In addition, he serves as a Trustee of Boston College and as the Chairman of the Inner-City Scholarship Fund. |
Joseph Mauriello (62) |
| Year of Election or Appointment: 2007 Member of the Advisory Board of Fidelity Securities Fund. Prior to his retirement in January 2006, Mr. Mauriello served in numerous senior management positions including Deputy Chairman and Chief Operating Officer (2004-2005), and Vice Chairman of Financial Services (2002-2004) of KPMG LLP US (professional services firm, 1965-2005). Mr. Mauriello currently serves as a member of the Board of Directors of XL Capital Ltd., (global insurance and re-insurance company, 2006-present) and of Arcadia Resources Inc., (health care services and products, 2007-present). He also served as a Director of the Hamilton Funds of the Bank of New York (2006-2007). |
Kimberley H. Monasterio (43) |
| Year of Election or Appointment: 2007 President and Treasurer of Growth & Income. Ms. Monasterio also serves as President and Treasurer of other Fidelity funds (2007-present) and is an employee of FMR (2004-present). Previously, Ms. Monasterio served as Deputy Treasurer of the Fidelity funds (2004-2006). Before joining Fidelity Investments, Ms. Monasterio served as Treasurer (2000-2004) and Chief Financial Officer (2002-2004) of the Franklin Templeton Funds and Senior Vice President of Franklin Templeton Services, LLC (2000-2004). |
Philip L. Bullen (47) |
| Year of Election or Appointment: 2006 Vice President of Growth & Income. Mr. Bullen also serves as Vice President of certain Equity Funds (2006-present). Mr. Bullen is Senior Vice President of FMR (2001-present) and FMR Co., Inc. (2001-present). Previously, Mr. Bullen served as President and a Director of Fidelity Research & Analysis Company (2001-2005), President and a Director of Fidelity Management & Research (U.K.) Inc. (2002-2006), and a Director of Strategic Advisers, Inc. (2002-2005). |
Dwight D. Churchill (53) |
| Year of Election or Appointment: 2005 Vice President of Growth & Income. Mr. Churchill also serves as Vice President of certain Equity Funds (2005-present). Mr. Churchill is Executive Vice President of FMR (2005-present) and FMR Co., Inc. (2005-present). Previously, Mr. Churchill served as Senior Vice President of Fidelity Investments Money Management, Inc. (2005-2006), Head of Fidelity's Fixed-Income Division (2000-2005), Vice President of Fidelity's Money Market Funds (2000-2005), Vice President of Fidelity's Bond Funds, and Senior Vice President of FMR. |
Timothy M. Cohen (37) |
| Year of Election or Appointment: 2005 Vice President of Growth & Income. Prior to assuming his current responsibilities, Mr. Cohen worked as an analyst and portfolio manager. Mr. Cohen also serves as Vice President of FMR and FMR Co., Inc. (2003). |
Eric D. Roiter (58) |
| Year of Election or Appointment: 1998 Secretary of Growth & Income. He also serves as Secretary of other Fidelity funds; Vice President, General Counsel, and Secretary of FMR Co., Inc. (2001-present) and FMR; Assistant Secretary of Fidelity Management & Research (U.K.) Inc. (2001-present), Fidelity Research & Analysis Company (2001-present), and Fidelity Investments Money Management, Inc. (2001-present). Mr. Roiter is an Adjunct Member, Faculty of Law, at Boston College Law School (2003-present). Previously, Mr. Roiter served as Vice President and Secretary of Fidelity Distributors Corporation (FDC) (1998-2005). |
Scott C. Goebel (39) |
| Year of Election or Appointment: 2007 Assistant Secretary of Growth & Income. Mr. Goebel also serves as Assistant Secretary of other Fidelity funds (2007-present), Vice President and Secretary of FDC (2006-present), and is an employee of FMR. |
R. Stephen Ganis (41) |
| Year of Election or Appointment: 2006 Anti-Money Laundering (AML) officer of Growth & Income. Mr. Ganis also serves as AML officer of other Fidelity funds (2006-present) and FMR Corp. (2003-present). Before joining Fidelity Investments, Mr. Ganis practiced law at Goodwin Procter, LLP (2000-2002). |
Joseph B. Hollis (59) |
| Year of Election or Appointment: 2006 Chief Financial Officer of Growth & Income. Mr. Hollis also serves as Chief Financial Officer of other Fidelity funds. Mr. Hollis is President of Fidelity Pricing and Cash Management Services (FPCMS) (2005-present). Mr. Hollis also serves as President and Director of Fidelity Service Company, Inc. (2006-present). Previously, Mr. Hollis served as Senior Vice President of Cash Management Services (1999-2002) and Investment Management Operations (2002-2005). |
Kenneth A. Rathgeber (60) |
| Year of Election or Appointment: 2004 Chief Compliance Officer of Growth & Income. Mr. Rathgeber also serves as Chief Compliance Officer of other Fidelity funds (2004-present) and Executive Vice President of Risk Oversight for Fidelity Investments (2002-present). He is Chief Compliance Officer of FMR (2005-present), FMR Co., Inc. (2005-present), Fidelity Management & Research (U.K.) Inc. (2005-present), Fidelity Research & Analysis Company (2005-present), Fidelity Investments Money Management, Inc. (2005-present), and Strategic Advisers, Inc. (2005-present). Previously, Mr. Rathgeber served as Executive Vice President and Chief Operating Officer for Fidelity Investments Institutional Services Company, Inc. (1998-2002). |
Bryan A. Mehrmann (46) |
| Year of Election or Appointment: 2005 Deputy Treasurer of Growth & Income. Mr. Mehrmann also serves as Deputy Treasurer of other Fidelity funds (2005-present) and is an employee of FMR. Previously, Mr. Mehrmann served as Vice President of Fidelity Investments Institutional Services Group (FIIS)/Fidelity Investments Institutional Operations Corporation, Inc. (FIIOC) Client Services (1998-2004). |
Kenneth B. Robins (37) |
| Year of Election or Appointment 2005 Deputy Treasurer of Growth & Income. Mr. Robins also serves as Deputy Treasurer of other Fidelity funds (2005-present) and is an employee of FMR (2004-present). Before joining Fidelity Investments, Mr. Robins worked at KPMG LLP, where he was a partner in KPMG's department of professional practice (2002-2004) and a Senior Manager (1999-2000). In addition, Mr. Robins served as Assistant Chief Accountant, United States Securities and Exchange Commission (2000-2002). |
Robert G. Byrnes (40) |
| Year of Election or Appointment: 2005 Assistant Treasurer of Growth & Income. Mr. Byrnes also serves as Assistant Treasurer of other Fidelity funds (2005-present) and is an employee of FMR (2005-present). Previously, Mr. Byrnes served as Vice President of FPCMS (2003-2005). Before joining Fidelity Investments, Mr. Byrnes worked at Deutsche Asset Management where he served as Vice President of the Investment Operations Group (2000-2003). |
Peter L. Lydecker (53) |
| Year of Election or Appointment: 2004 Assistant Treasurer of Growth & Income. Mr. Lydecker also serves as Assistant Treasurer of other Fidelity funds (2004) and is an employee of FMR. |
Gary W. Ryan (48) |
| Year of Election or Appointment: 2005 Assistant Treasurer of Growth & Income. Mr. Ryan also serves as Assistant Treasurer of other Fidelity funds (2005-present) and is an employee of FMR (2005-present). Previously, Mr. Ryan served as Vice President of Fund Reporting in FPCMS (1999-2005). |
Annual Report
Distributions
The Board of Trustees of Fidelity Growth & Income Portfolio voted to pay on September 10, 2007, to shareholders of record at the opening of business on September 7, 2007, a distribution of $2.66 per share derived from capital gains realized from sales of portfolio securities.
The fund hereby designates as a capital gain dividend with respect to the taxable year ended July 31, 2007, $1,710,804,000, or, if subsequently determined to be different, the net capital gain of such year.
A total of 0.03% of the dividends distributed during the fiscal year was derived from interest on U.S. Government securities which is generally exempt from state income tax.
The fund designates 100% of the dividends distributed during the fiscal year as qualifying for the dividends-received deduction for corporate shareholders.
The fund designates 100% of the dividends distributed during the fiscal year as amounts which may be taken into account as a dividend for the purposes of the maximum rate under section 1(h)(11) of the Internal Revenue Code.
The fund will notify shareholders in January 2008 of amounts for use in preparing 2007 income tax returns.
Annual Report
Board Approval of Investment Advisory Contracts and Management Fees
Fidelity Growth & Income Portfolio
Each year, typically in July, the Board of Trustees, including the Independent Trustees (together, the Board), votes on the renewal of the management contract and sub-advisory agreements (together, the Advisory Contracts) for the fund. The Board, assisted by the advice of fund counsel and Independent Trustees' counsel, requests and considers a broad range of information throughout the year.
The Board meets regularly each month except August and takes into account throughout the year matters bearing on Advisory Contracts. The Board, acting directly and through its separate committees, considers at each of its meetings factors that are relevant to the annual renewal of the fund's Advisory Contracts, including the services and support provided to the fund and its shareholders. At the time of the renewal, the Board had 12 standing committees, each composed of Independent Trustees with varying backgrounds, to which the Board has assigned specific subject matter responsibilities in order to enhance effective decision-making by the Board. Each committee has adopted a written charter outlining the structure and purposes of the committee. One such committee, the Equity Contract Committee, meets periodically as needed throughout the year to consider matters specifically related to the annual renewal of Advisory Contracts. The committee requests and receives information on, and makes recommendations to the Independent Trustees concerning, the approval and annual review of the Advisory Contracts.
At its July 2007 meeting, the Board of Trustees, including the Independent Trustees, unanimously determined to renew the Advisory Contracts for the fund. In reaching its determination, the Board considered all factors it believed relevant, including (i) the nature, extent, and quality of the services to be provided to the fund and its shareholders (including the investment performance of the fund); (ii) the competitiveness of the management fee and total expenses of the fund; (iii) the total costs of the services to be provided by and the profits to be realized by the investment adviser and its affiliates from the relationship with the fund; (iv) the extent to which economies of scale would be realized as the fund grows; and (v) whether fee levels reflect these economies of scale, if any, for the benefit of fund shareholders. The Board also approved amendments to the fund's agreements with foreign sub-advisers to clarify that each sub-adviser provides services as an independent contractor.
In determining whether to renew the Advisory Contracts for the fund, the Board ultimately reached a determination, with the assistance of fund counsel and Independent Trustees' counsel, that the renewal of the Advisory Contracts and the compensation to be received by Fidelity under the management contract is consistent with Fidelity's fiduciary duty under applicable law. In addition to evaluating the specific factors noted above, the Board, in reaching its determination, is aware that shareholders in the fund have a broad range of investment choices available to them, including a wide choice among mutual funds offered by competitors to Fidelity, and that the fund's shareholders, with the opportunity to review and weigh the disclosure provided by the fund in its prospectus and other public disclosures, have chosen to invest in this fund, managed by Fidelity.
Annual Report
Nature, Extent, and Quality of Services Provided. The Board considered staffing within the investment adviser, FMR, and the sub-advisers (together, the Investment Advisers), including the background of the fund's portfolio manager and the fund's investment objective and discipline. The Independent Trustees also had discussions with senior management of Fidelity's investment operations and investment groups. The Board considered the structure of the portfolio manager compensation program and whether this structure provides appropriate incentives.
Resources Dedicated to Investment Management and Support Services. The Board reviewed the size, education, and experience of the Investment Advisers' investment staff, their use of technology, and the Investment Advisers' approach to recruiting, training, and retaining portfolio managers and other research, advisory, and management personnel. The Board considered Fidelity's extensive global research capabilities that enable the Investment Advisers to aggregate data from various sources in an effort to produce positive investment results. The Board noted that Fidelity's analysts have access to a variety of technological tools that enable them to perform both fundamental and quantitative analysis and to specialize in various disciplines. The Board also considered that Fidelity's portfolio managers and analysts have access to daily portfolio attribution that allows for monitoring of a fund's portfolio, as well as an electronic communication system that provides immediate real-time access to research concerning issuers and credit enhancers.
Shareholder and Administrative Services. The Board considered (i) the nature, extent, quality, and cost of advisory, administrative, distribution, and shareholder services performed by the Investment Advisers and their affiliates under the Advisory Contracts and under separate agreements covering transfer agency, pricing and bookkeeping, and securities lending services for the fund; (ii) the nature and extent of the Investment Advisers' supervision of third party service providers, principally custodians and subcustodians; and (iii) the resources devoted to, and the record of compliance with, the fund's compliance policies and procedures. The Board reviewed the allocation of fund brokerage, including allocations to brokers affiliated with the Investment Advisers, the use of brokerage commissions to pay fund expenses, and the use of "soft" commission dollars to pay for research services. The Board also considered that Fidelity voluntarily pays for market data out of its own resources. The Board also considered the agreement reached between the Independent Trustees and Fidelity in December 2006 following an independent review of matters relating to receipt of travel, entertainment, gifts and gratuities in violation of Fidelity policies.
The Board noted that the growth of fund assets across the complex allows Fidelity to reinvest in the development of services designed to enhance the value or convenience of the Fidelity funds as investment vehicles. These services include 24 hour access to account information and market information through phone representatives and over the Internet, and investor education materials and asset allocation tools.
Annual Report
Board Approval of Investment Advisory Contracts and
Management Fees - continued
Investment in a Large Fund Family. The Board considered the benefits to shareholders of investing in a Fidelity fund, including the benefits of investing in a fund that is part of a large family of funds offering a variety of investment disciplines and providing for a large variety of mutual fund investor services. For example, fund shareholders are offered the privilege of exchanging shares of the fund for shares of other Fidelity funds, as set forth in the fund's prospectus, without paying a sales charge. The Board noted that, since the last Advisory Contract renewals in July 2006, Fidelity has taken a number of actions that benefited particular funds, including (i) dedicating additional resources to investment research and to restructure the investment research teams; (ii) contractually agreeing to reduce the management fee on Fidelity Advisor Floating Rate High Income Fund; (iii) contractually agreeing to reduce the management fees on Fidelity's California, Massachusetts, New Jersey, and New York AMT Tax-Free Money Market Funds, launching new Institutional Classes and Service Classes of these funds, and contractually agreeing to impose expense limitations on these funds; (iv) eliminating the exchange fee on the Fidelity Select Portfolios and reducing the pricing and bookkeeping fee rates for these funds; (v) reducing the maximum transfer agency fee rates on high income funds and certain equity funds; (vi) proposing amended management contracts that, if approved by shareholders, will add a performance adjustment component to the management fees paid by 18 Fidelity Advisor equity funds; (vii) contractually agreeing to reduce fees for Ultra-Short Central Fund and the money market Central Funds; (viii) waiving the Fidelity Advisor funds' contingent deferred sales charge on certain redemptions made through systematic withdrawal programs; and (ix) amending the management contracts for equity and fixed-income funds whose management contracts incorporate a "group fee" structure by adding four new fee "breakpoints" to the group fee rate schedules.
Investment Performance and Compliance. The Board considered whether the fund has operated within its investment objective, as well as its record of compliance with its investment restrictions. It also reviewed the fund's absolute investment performance, as well as the fund's relative investment performance measured against (i) a broad-based securities market index, and (ii) a peer group of mutual funds deemed appropriate by the Board over multiple periods. The following charts considered by the Board show, over the one-, three-, and five-year periods ended December 31, 2006, the fund's cumulative total returns, the cumulative total returns of a broad-based securities market index ("benchmark"), and a range of cumulative total returns of a peer group of mutual funds identified by Morningstar, Inc. as having an investment style similar to that of the fund based on underlying portfolio holdings. The box within each chart shows the 25th percentile return (bottom of box) and the 75th percentile return (top of box) of the peer group. Returns shown above the box are in the first quartile and returns shown below the box are in the fourth quartile. The percentage beaten number noted below each chart corresponds to the percentile box and represents the percentage of funds in the peer group whose performance was equal to or lower than that of the fund.
Annual Report
Fidelity Growth & Income Portfolio
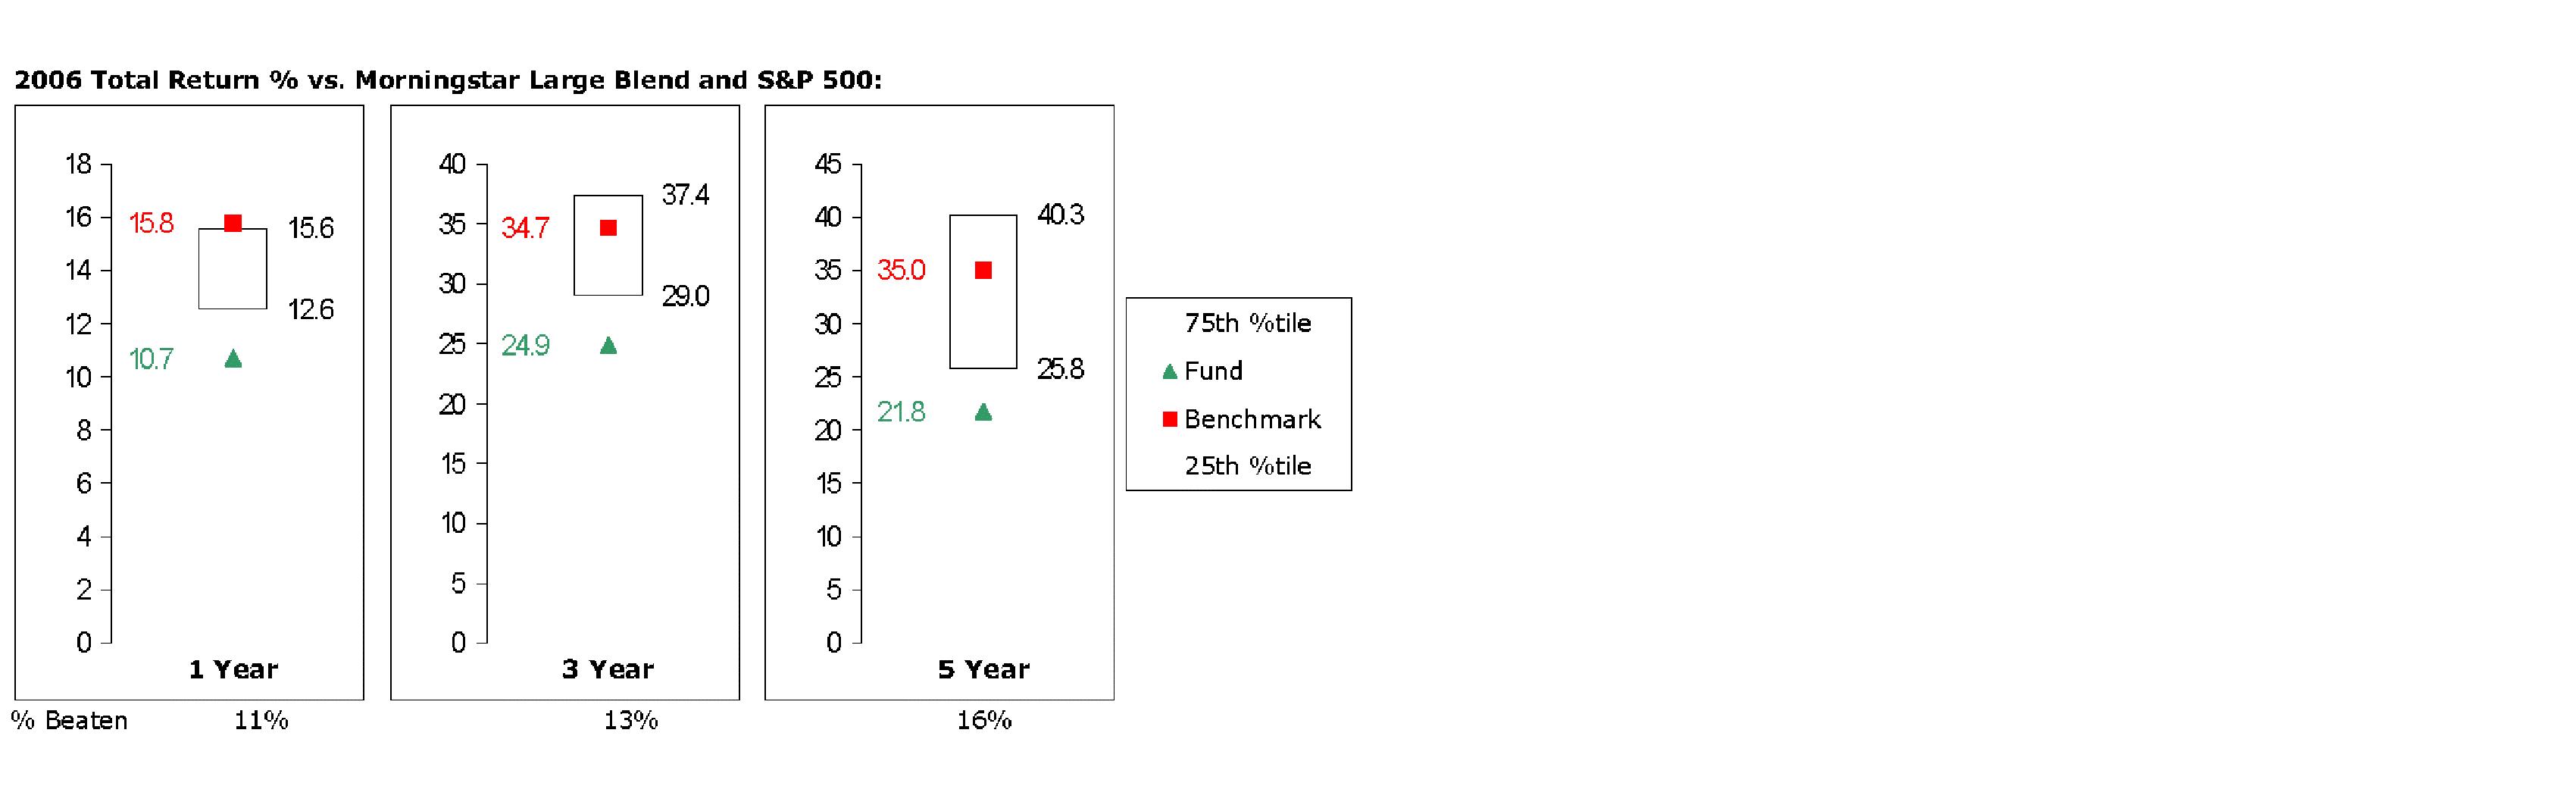
The Board reviewed the fund's relative investment performance against its peer group and stated that the performance of the fund was in the fourth quartile for all the periods shown. The Board also stated that the investment performance of the fund was lower than its benchmark for all the periods shown. The Board discussed with FMR actions to be taken by FMR to improve the fund's disappointing performance relative to its peer group. The Board will continue to closely monitor the performance of the fund in the coming year and discuss with FMR other appropriate actions to address the performance of the fund.
The Board considered that FMR has taken steps to refocus and strengthen equity research, equity portfolio management, and compliance.
Based on its review, and giving particular weight to the nature and quality of the resources dedicated by the Investment Advisers to maintain and improve relative performance, the Board concluded that the nature, extent, and quality of the services provided to the fund will benefit the fund's shareholders, particularly in light of the Board's view that the fund's shareholders benefit from investing in a fund that is part of a large family of funds offering a variety of investment disciplines and services.
Competitiveness of Management Fee and Total Fund Expenses. The Board considered the fund's management fee and total expenses compared to "mapped groups" of competitive funds and classes. Fidelity creates "mapped groups" by combining similar Lipper investment objective categories that have comparable management fee characteristics. Combining Lipper investment objective categories aids the Board's management fee and total expense comparisons by broadening the competitive group used for comparison and by reducing the number of universes to which various Fidelity funds are compared. The Board also considered supplemental information about how the fund's management fee and total expenses ranked relative to groups based on Lipper classifications, which take into account a fund's market capitalization and style.
Annual Report
Board Approval of Investment Advisory Contracts and
Management Fees - continued
The Board considered two proprietary management fee comparisons for the 12 month periods shown in the chart below. The group of Lipper funds used by the Board for management fee comparisons is referred to below as the "Total Mapped Group." The Total Mapped Group comparison focuses on a fund's standing relative to the total universe of comparable funds available to investors, in terms of gross management fees before expense reimbursements or caps. "TMG %" represents the percentage of funds in the Total Mapped Group that had management fees that were lower than the fund's. For example, a TMG % of 12% means that 88% of the funds in the Total Mapped Group had higher management fees than the fund. The "Asset-Size Peer Group" (ASPG) comparison focuses on a fund's standing relative to non-Fidelity funds similar in size to the fund within the Total Mapped Group. The ASPG represents at least 15% of the funds in the Total Mapped Group with comparable asset size and management fee characteristics, subject to a minimum of 50 funds (or all funds in the Total Mapped Group if fewer than 50). Additional information, such as the ASPG quartile in which the fund's management fee ranked, is also included in the chart and considered by the Board.
Fidelity Growth & Income Portfolio
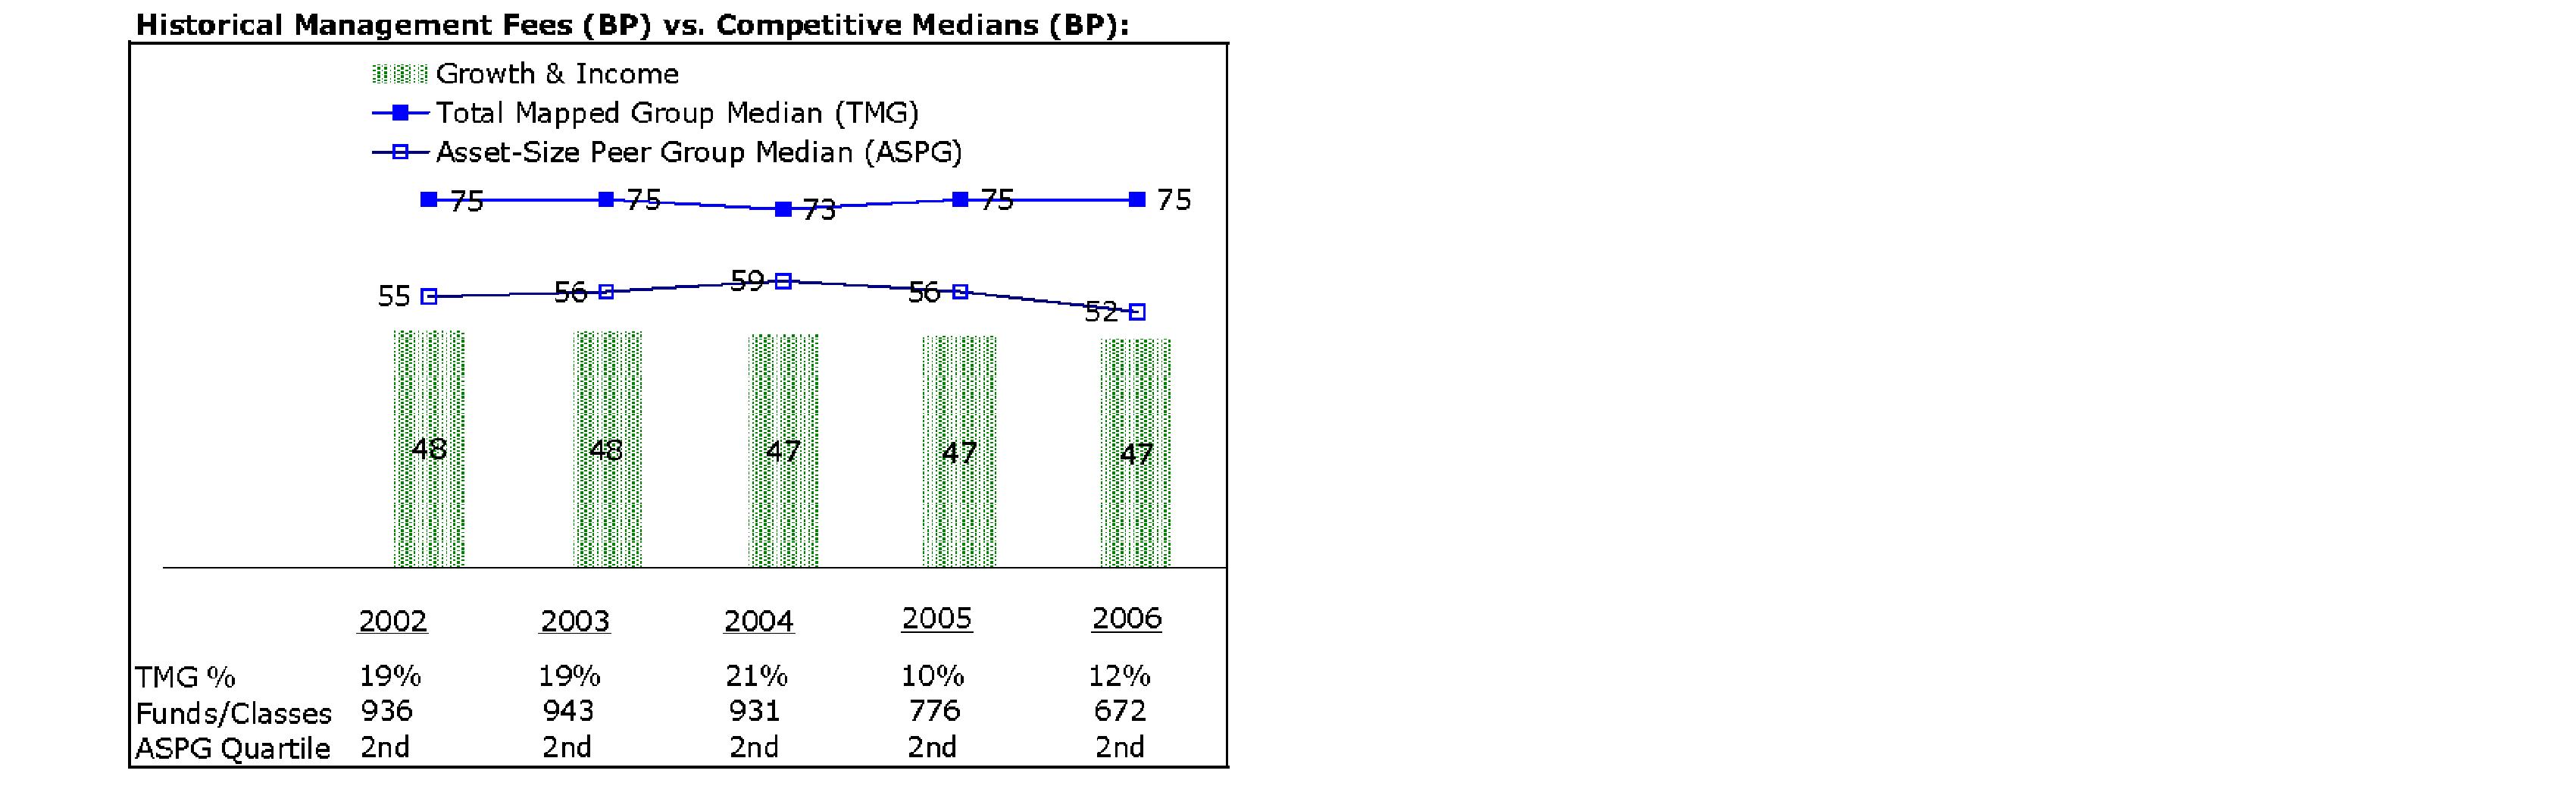
Annual Report
The Board noted that the fund's management fee ranked below the median of its Total Mapped Group and below the median of its ASPG for 2006.
Based on its review, the Board concluded that the fund's management fee was fair and reasonable in light of the services that the fund receives and the other factors considered.
In its review of the fund's total expenses, the Board considered the fund's management fee as well as other fund expenses, such as transfer agent fees, pricing and bookkeeping fees, and custodial, legal, and audit fees. The Board also noted the effects of any waivers and reimbursements on fees and expenses. As part of its review, the Board also considered current and historical total expenses of the fund compared to competitive fund median expenses. The fund is compared to those funds and classes in the Total Mapped Group (used by the Board for management fee comparisons) that have a similar sales load structure.
The Board noted that the fund's total expenses ranked below its competitive median for 2006.
In its review of total expenses, the Board also considered Fidelity fee structures and other information on clients that FMR and its affiliates service in other competitive markets, such as other mutual funds advised or subadvised by FMR or its affiliates, pension plan clients, and other institutional clients.
Based on its review, the Board concluded that the fund's total expenses were reasonable in light of the services that the fund and its shareholders receive and the other factors considered.
Costs of the Services and Profitability. The Board considered the revenues earned and the expenses incurred by Fidelity in conducting the business of developing, marketing, distributing, managing, administering and servicing the fund and its shareholders. The Board also considered the level of Fidelity's profits in respect of all the Fidelity funds.
On an annual basis, FMR presents to the Board Fidelity's profitability for the fund. Fidelity calculates the profitability for each fund, as well as aggregate profitability for groups of Fidelity funds and all Fidelity funds, using a series of detailed revenue and cost allocation methodologies which originate with the audited books and records of Fidelity. The Audit Committee of the Board reviews any significant changes from the prior year's methodologies.
PricewaterhouseCoopers LLP (PwC), independent registered public accounting firm and auditor to Fidelity and certain Fidelity funds, has been engaged annually by the Board as part of the Board's assessment of the results of Fidelity's profitability analysis. PwC's engagement includes the review and assessment of Fidelity's methodologies used in determining the revenues and expenses attributable to Fidelity's mutual fund business, and completion of agreed-upon procedures surrounding the mathematical accuracy of fund profitability and its conformity to allocation methodologies. After considering PwC's reports issued under the engagement and information provided by Fidelity, the Board believes that while other allocation methods may also be reasonable, Fidelity's profitability methodologies are reasonable in all material respects.
Annual Report
Board Approval of Investment Advisory Contracts and
Management Fees - continued
The Board has also reviewed Fidelity's non-fund businesses and any fall-out benefits related to the mutual fund business as well as cases where Fidelity's affiliates may benefit from or be related to the fund's business.
The Board considered the costs of the services provided by and the profits realized by Fidelity in connection with the operation of the fund and determined that the amount of profit is a fair entrepreneurial profit for the management of the fund.
Economies of Scale. The Board considered whether there have been economies of scale in respect of the management of the Fidelity funds, whether the Fidelity funds (including the fund) have appropriately benefited from any such economies of scale, and whether there is potential for realization of any further economies of scale. The Board considered the extent to which the fund will benefit from economies of scale through increased services to the fund, through waivers or reimbursements, or through fee or expense reductions, including reductions that occur through operation of the transfer agent agreement. The transfer agent fee varies in part based on the number of accounts in the fund. If the number of accounts decreases or the average account size increases, the overall transfer agent fee rate decreases.
The Board recognized that the fund's management contract incorporates a "group fee" structure, which provides for lower group fee rates as total fund assets under FMR's management increase, and for higher group fee rates as total fund assets under FMR's management decrease. FMR determines the group fee rates based on a tiered asset "breakpoint" schedule. In connection with the renewal of the fund's management contract, the Board approved amendments to the fund's management contract that added four new fee breakpoints to the group fee rate schedule for assets under FMR's management above $1,386 billion. The Board considered that the group fee rate declines under both the present and amended schedules, but that under the amended schedule, the group fee rate declines faster as assets under FMR's management exceed $1,386 billion. The Board considered that the group fee is designed to deliver the benefits of economies of scale to fund shareholders when total fund assets increase, even if assets of any particular fund are unchanged or have declined, because some portion of Fidelity's costs are attributable to services provided to all Fidelity funds, and all funds benefit if those costs can be allocated among more assets. The Board concluded that, given the group fee structure, fund shareholders will achieve a certain level of economies of scale as assets under FMR's management increase at the fund complex level, regardless of whether Fidelity achieves any such economies of scale.
Annual Report
The Board further concluded that any potential economies of scale are being shared between fund shareholders and Fidelity in an appropriate manner.
Additional Information Requested by the Board. In order to develop fully the factual basis for consideration of the Fidelity funds' Advisory Contracts, the Board requested and received additional information on several topics, including (i) fund performance trends and actions to be taken by FMR to improve certain funds' overall performance; (ii) Fidelity's portfolio manager compensation structure, including its effects on fund profitability and the extent to which portfolio manager compensation is linked to fund performance; (iii) Fidelity's fee structures; (iv) the funds' sub-advisory arrangements; and (v) accounts managed by Fidelity other than the Fidelity funds.
Based on its evaluation of all of the conclusions noted above, and after considering all material factors, the Board ultimately concluded that the advisory fee structures are fair and reasonable, and that the fund's Advisory Contracts should be renewed.
Annual Report
Annual Report
Investment Adviser
Fidelity Management & Research Company
Boston, MA
Investment Sub-Advisers
FMR Co., Inc.
Fidelity Research & Analysis Company
Fidelity Management & Research
(U.K.) Inc.
Fidelity Investments Japan Limited
Fidelity International Investment
Advisors
Fidelity International Investment
Advisors (U.K.) Limited
General Distributor
Fidelity Distributors Corporation
Boston, MA
Transfer and Service Agent
Fidelity Service Company, Inc.
Boston, MA
Custodian
JPMorgan Chase Bank
New York, NY
The Fidelity Telephone Connection
Mutual Fund 24-Hour Service
Exchanges/Redemptions
and Account Assistance 1-800-544-6666
Product Information 1-800-544-6666
Retirement Accounts 1-800-544-4774
(8 a.m. - 9 p.m.)
TDD Service 1-800-544-0118
for the deaf and hearing impaired
(9 a.m. - 9 p.m. Eastern time)
Fidelity Automated Service
Telephone (FAST®) (automated graphic) 1-800-544-5555
(automated graphic) Automated line for quickest service
GAI-UANNPRO-0907
1.789247.104
(Fidelity Investment logo)(registered trademark)
Corporate Headquarters
82 Devonshire St., Boston, MA 02109
www.fidelity.com
Fidelity®
International Real Estate
Fund
Annual Report
July 31, 2007
(2_fidelity_logos) (Registered_Trademark)
Contents
Chairman's Message | <Click Here> | Ned Johnson's message to shareholders. |
Performance | <Click Here> | How the fund has done over time. |
Management's Discussion | <Click Here> | The manager's review of fund performance, strategy and outlook. |
Shareholder Expense Example | <Click Here> | An example of shareholder expenses. |
Investment Changes | <Click Here> | A summary of major shifts in the fund's investments over the past six months. |
Investments | <Click Here> | A complete list of the fund's investments with their market values. |
Financial Statements | <Click Here> | Statements of assets and liabilities, operations, and changes in net assets,
as well as financial highlights. |
Notes | <Click Here> | Notes to the financial statements. |
Report of Independent Registered Public Accounting Firm | <Click Here> | |
Trustees and Officers | <Click Here> | |
Distributions | <Click Here> | |
Board Approval of Investment Advisory Contracts and Management Fees | <Click Here> | |
To view a fund's proxy voting guidelines and proxy voting record for the 12-month period ended June 30, visit http://www.fidelity.com (search for "proxy voting guidelines") or visit the Securities and Exchange Commission's (SEC) web site at http://www.sec.gov. You may also call 1-800-544-8544 to request a free copy of the proxy voting guidelines.
Standard & Poor's, S&P and S&P 500 are registered service marks of The McGraw-Hill Companies, Inc. and have been licensed for use by Fidelity Distributors Corporation.
Other third party marks appearing herein are the property of their respective owners.
All other marks appearing herein are registered or unregistered trademarks or service marks of FMR Corp. or an affiliated company.
Annual Report
This report and the financial statements contained herein are submitted for the general information of the shareholders of the fund. This report is not authorized for distribution to prospective investors in the fund unless preceded or accompanied by an effective prospectus.
A fund files its complete schedule of portfolio holdings with the SEC for the first and third quarters of each fiscal year on Form N-Q. Forms N-Q are available on the SEC's web site at http://www.sec.gov. A fund's Forms N-Q may be reviewed and copied at the SEC's Public Reference Room in Washington, DC. Information regarding the operation of the SEC's Public Reference Room may be obtained by calling 1-800-SEC-0330. For a complete list of a fund's portfolio holdings, view the most recent holdings listing, semiannual report, or annual report on Fidelity's web site at http://www.fidelity.com or http://www.advisor.fidelity.com, as applicable.
NOT FDIC INSURED · MAY LOSE VALUE · NO BANK GUARANTEE
Neither the fund nor Fidelity Distributors Corporation is a bank.
Annual Report
Chairman's Message
(photo_of_Edward_C_Johnson_3d)
Dear Shareholder:
Stocks are currently on pace to register their fifth straight year of positive returns, although gains could be trimmed if the U.S. economy continues to slow. While financial markets are always unpredictable, there are a number of time-tested principles that can put the historical odds in your favor.
One of the basic tenets is to invest for the long term. Over time, riding out the markets' inevitable ups and downs has proven much more effective than selling into panic or chasing the hottest trend. Even missing only a few of the markets' best days can significantly diminish investor returns. Patience also affords the benefits of compounding - of earning interest on additional income or reinvested dividends and capital gains. There are tax advantages and cost benefits to consider as well. The more you sell, the more taxes you pay, and the more you trade, the higher the costs. While staying the course doesn't eliminate risk, it can considerably lessen the effect of short-term declines.
You can further manage your investing risk through diversification. And today, more than ever, geographic diversification should be taken into account. Studies indicate that asset allocation is the single most important determinant of a portfolio's long-term success. The right mix of stocks, bonds and cash - aligned to your particular risk tolerance and investment objective - is very important. Age-appropriate rebalancing is also an essential aspect of asset allocation. For younger investors, an emphasis on equities - which historically have been the best-performing asset class over time - is encouraged. As investors near their specific goal, such as retirement or sending a child to college, consideration may be given to replacing volatile assets (e.g. common stocks) with more-stable fixed investments (bonds or savings plans).
A third investment principle - investing regularly - can help lower the average cost of your purchases. Investing a certain amount of money each month or quarter helps ensure you won't pay for all your shares at market highs. This strategy - known as dollar cost averaging - also reduces unconstructive "emotion" from investing, helping shareholders avoid selling weak performers just prior to an upswing, or chasing a hot performer just before a correction.
We invite you to contact us via the Internet, through our Investor Centers or over the phone. It is our privilege to provide you the information you need to make the investments that are right for you.
Sincerely,
/s/Edward C. Johnson 3d
Edward C. Johnson 3d
Annual Report
Performance: The Bottom Line
Average annual total return reflects the change in the value of an investment, assuming reinvestment of International Real Estate's dividend income and capital gains (the profits earned upon the sale of securities that have grown in value) and assuming a constant rate of performance each year. The $10,000 table and the fund's returns do not reflect the deduction of taxes that a shareholder would pay on fund distributions or the redemption of fund shares. During periods of reimbursement by Fidelity, a fund's total return will be greater than it would be had the reimbursement not occurred. How a fund did yesterday is no guarantee of how it will do tomorrow.
Average Annual Total Returns
Periods ended July 31, 2007 | Past 1
year | Life of Fund A |
International Real Estate | 19.01% | 23.67% |
A From September 8, 2004.
$10,000 Over Life of Fund
Let's say hypothetically that $10,000 was invested in International Real Estate on September 8, 2004, when the fund started. The chart shows how the value of your investment would have changed, and also shows how the Morgan Stanley Capital InternationalSM Europe, Australasia and Far East (MSCI® EAFE®) Index performed over the same period.
Annual Report
Management's Discussion of Fund Performance
Comments from Steven Buller, Portfolio Manager of Fidelity® International Real Estate Fund
The period ending July 31, 2007, began with real estate securities on the rise and ended with them in decline. Overall, international property stocks, as measured by the EPRA/NAREIT Global Real Estate ex North America Index, gained 25.95% during the past year - significantly better than the 0.55% decline in the U.S. real estate investment trust market, as measured by the Dow Jones Wilshire Real Estate Securities IndexSM. Despite global property markets' second-half correction, the fundamentals of commercial real estate companies actually remained quite good during the entire year, with increasing occupancy and rental rates present in a growing number of markets. Nevertheless, property stocks found themselves on a roller coaster ride. Much of the volatility was attributable to the flow of investment capital into and out of the real estate sector. During the period's second half, investors became increasingly concerned about losing money, which in turn triggered significant fund flows out of property stocks and declining valuations.
For the 12 months ending July 31, 2007, International Real Estate returned 19.01%, lagging the return of the EPRA/NAREIT index. Additionally, the broad international stock market - as measured by the Morgan Stanley Capital InternationalSM Europe, Australasia and Far East Index - returned 24.10%. Weak security selection detracted from the fund's performance versus the EPRA/NAREIT index. On a country basis, the worst drag came from disappointing stock picks in the United Kingdom. An overweighting in Germany also hurt. In contrast, positive stock selection in Hong Kong helped. On a sector basis, security selection among diversified property stocks and hotels was favorable, although those gains were outweighed by weak picks in offices and retail. A small allocation to cash also hurt. The fund's biggest individual negative was U.K.-based real estate company Capital & Regional, which lagged badly during the period's second half, as investors worried about slowing retail sales. A couple of German property stocks, Patrizia Immobilien and IVG Immobilien, also hurt, as did an underweighting in strong-performing China Overseas Land & Investment. On the positive side, Kerry Properties, a commercial and residential property company that does most of its business in Hong Kong and China, benefited from growth in those two markets. Also performing well was New World China Land, a Grand Cayman-listed commercial/residential developer focused on China.
The views expressed above reflect those of the portfolio manager(s) only through the end of the period as stated on the cover of this report and do not necessarily represent the views of Fidelity or any other person in the Fidelity organization. Any such views are subject to change at any time based upon market or other conditions and Fidelity disclaims any responsibility to update such views. These views may not be relied on as investment advice and, because investment decisions for a Fidelity fund are based on numerous factors, may not be relied on as an indication of trading intent on behalf of any Fidelity fund.
Annual Report
Shareholder Expense Example
As a shareholder of the Fund, you incur two types of costs: (1) transaction costs, including sales charges (loads) on purchase payments or redemption proceeds, redemption fees, and (2) ongoing costs, including management fees, distribution and/or service (12b-1) fees and other Fund expenses. This Example is intended to help you understand your ongoing costs (in dollars) of investing in the Fund and to compare these costs with the ongoing costs of investing in other mutual funds.
The actual example is based on an investment of $1,000 invested at the beginning of the period and held for the entire period (February 1, 2007 to July 31, 2007) for the International Real Estate class and for the entire period (April 4, 2007 to July 31, 2007) for Class A, Class T, Class B, Class C and Institutional Class. The hypothetical expense example is based on an investment of $1,000 for one-half year period (February 1, 2007 to July 31, 2007).
Actual Expenses
The first line of the accompanying table for each class of the Fund provides information about actual account values and actual expenses. You may use the information in this line, together with the amount you invested, to estimate the expenses that you paid over the period. Simply divide your account value by $1,000.00 (for example, an $8,600 account value divided by $1,000.00 = 8.6), then multiply the result by the number in the first line for a class of the Fund under the heading entitled "Expenses Paid During Period" to estimate the expenses you paid on your account during this period. A small balance maintenance fee of $12.00 that is charged once a year may apply for certain accounts with a value of less than $2,000. This fee is not included in the table below. If it was, the estimate of expenses you paid during the period would be higher, and your ending account value lower, by this amount. In addition, the Fund, as a shareholder in the underlying Fidelity Central Funds, will indirectly bear its pro rata share of the fees and expenses incurred by the underlying Fidelity Central Funds. These fees and expenses are not included in the Fund's annualized expense ratio used to calculate the expense estimate in the table below.
Hypothetical Example for Comparison Purposes
The second line of the accompanying table for each class of the Fund provides information about hypothetical account values and hypothetical expenses based on a Class' actual expense ratio and an assumed rate of return of 5% per year before expenses, which is not the Class' actual return. The hypothetical account values and expenses may not be used to estimate the actual ending account balance or expenses you paid for the period. You may use this information to compare the ongoing costs of investing in the Fund and other funds. To do so, compare this 5% hypothetical example with the 5% hypothetical examples that appear in the shareholder reports of the other funds. A small balance maintenance fee of $12.00 that is charged once a year may apply for certain accounts with a value of less than $2,000. This fee is not included in the table below. If it was, the estimate of expenses you paid during the period would be higher, and your ending account value lower, by this amount. In addition, the Fund, as a shareholder in the underlying Fidelity Central Funds, will indirectly bear its pro rata share of the fees and expenses incurred by the underlying Fidelity Central Funds. These fees and expenses are not included in the Fund's annualized expense ratio used to calculate the expense estimate in the table below.
Annual Report
Shareholder Expense Example - continued
Please note that the expenses shown in the table are meant to highlight your ongoing costs only and do not reflect any transaction costs. Therefore, the second line of the table is useful in comparing ongoing costs only, and will not help you determine the relative total costs of owning different funds. In addition, if these transactional costs were included, your costs would have been higher.
| Beginning
Account Value | Ending
Account Value
July 31, 2007 | Expenses Paid
During Period |
Class A | | | |
Actual | $ 1,000.00 | $ 947.00 | $ 4.35 B |
HypotheticalA | $ 1,000.00 | $ 1,018.00 | $ 6.85 C |
Class T | | | |
Actual | $ 1,000.00 | $ 946.40 | $ 5.11 B |
HypotheticalA | $ 1,000.00 | $ 1,016.81 | $ 8.05 C |
Class B | | | |
Actual | $ 1,000.00 | $ 944.50 | $ 6.69 B |
HypotheticalA | $ 1,000.00 | $ 1,014.33 | $ 10.54 C |
Class C | | | |
Actual | $ 1,000.00 | $ 944.50 | $ 6.66 B |
HypotheticalA | $ 1,000.00 | $ 1,014.38 | $ 10.49 C |
International Real Estate | | | |
Actual | $ 1,000.00 | $ 948.20 | $ 5.07 B |
HypotheticalA | $ 1,000.00 | $ 1,019.59 | $ 5.26 C |
Institutional Class | | | |
Actual | $ 1,000.00 | $ 948.20 | $ 3.43 B |
HypotheticalA | $ 1,000.00 | $ 1,019.44 | $ 5.41 C |
A 5% return per year before expenses
B Actual expenses are equal to each Class' annualized expense ratio (shown in the table below); multiplied by the average account value over the period, multiplied by 181/365 (to reflect the one-half year period) for the International Real Estate class and multiplied by 119/365 (to reflect the period April 4, 2007 to July 31, 2007) for Class A, Class T, Class B, Class C, and Institutional Class.
C Hypothetical expenses are equal to each Class' annualized expense ratio (shown in the table below); multiplied by the average account value over the period, multiplied by 181/365 (to reflect the one-half year period).
| Annualized
Expense Ratio |
Class A | 1.37% |
Class T | 1.61% |
Class B | 2.11% |
Class C | 2.10% |
International Real Estate | 1.05% |
Institutional Class | 1.08% |
Annual Report
Investment Changes
Top Ten Stocks as of July 31, 2007 |
| % of fund's
net assets | % of fund's net assets
6 months ago |
Mitsubishi Estate Co. Ltd. | 6.9 | 7.4 |
British Land Co. PLC | 5.8 | 4.8 |
Kerry Properties Ltd. | 4.9 | 4.4 |
IVG Immobilien AG | 4.5 | 2.6 |
Westfield Group unit | 4.0 | 6.4 |
The GPT Group unit | 3.9 | 3.7 |
Unibail-Rodamco | 3.6 | 0.0 |
Land Securities Group PLC | 3.5 | 4.9 |
CapitaLand Ltd. | 3.5 | 2.1 |
Cheung Kong Holdings Ltd. | 2.9 | 2.1 |
| 43.5 | |
Top Five Countries as of July 31, 2007 |
(excluding cash equivalents) | % of fund's
net assets | % of fund's net assets
6 months ago |
Australia | 21.0 | 19.9 |
Hong Kong | 17.6 | 12.0 |
Japan | 17.3 | 20.7 |
United Kingdom | 15.2 | 19.1 |
Germany | 6.6 | 6.5 |
Percentages are adjusted for the effect of open futures contracts, if applicable. |
Top Five REIT Sectors as of July 31, 2007 |
| % of fund's
net assets | % of fund's net assets
6 months ago |
REITs - Management/Investment | 34.6 | 35.6 |
REITs - Shopping Centers | 2.2 | 2.4 |
REITs - Apartments | 1.5 | 2.0 |
REITs - Office Buildings | 1.4 | 2.8 |
REITs - Industrial Buildings | 0.7 | 1.0 |
Asset Allocation (% of fund's net assets) |
As of July 31, 2007 * | As of January 31, 2007 ** |
 | Stocks and
Investment
Companies 98.5% | | | Stocks and
Investment
Companies 97.8% | |
 | Short-Term
Investments and
Net Other Assets 1.5% | | | Short-Term
Investments and
Net Other Assets 2.2% | |
* Foreign investments | 98.5% | | ** Foreign investments | 97.8% | |

Annual Report
Investments July 31, 2007
Showing Percentage of Net Assets
Common Stocks - 97.6% |
| Shares | | Value |
Australia - 21.0% |
Aspen Group unit | 6,320,625 | | $ 14,003,914 |
CFS Retail Property Trust | 10,309,000 | | 18,887,351 |
Charter Hall Group unit | 7,254,842 | | 17,557,487 |
DB RREEF Trust unit | 18,635,600 | | 28,822,793 |
FKP Property Group unit | 978,123 | | 5,817,882 |
Goodman Group unit | 5,374,309 | | 27,844,682 |
Stockland Corp. Ltd. unit | 2,741,000 | | 18,055,295 |
The GPT Group unit | 10,573,692 | | 40,636,776 |
Westfield Group: | | | |
unit | 2,566,400 | | 41,661,545 |
unit New | 442,269 | | 6,979,809 |
TOTAL AUSTRALIA | | 220,267,534 |
Austria - 0.9% |
Immoeast AG (a) | 686,100 | | 9,012,719 |
Brazil - 0.6% |
EZ Tec Empreendimentos & Participacoes SA | 644,600 | | 4,259,245 |
MRV Engenharia e Participacoes SA | 119,500 | | 1,959,744 |
TOTAL BRAZIL | | 6,218,989 |
Cayman Islands - 2.0% |
New World China Land Ltd. | 19,550,000 | | 20,568,955 |
Finland - 1.5% |
Citycon Oyj | 2,496,403 | | 16,020,820 |
France - 4.8% |
Fonciere Des Regions (d) | 81,000 | | 12,302,835 |
Unibail-Rodamco (d) | 158,517 | | 38,023,751 |
TOTAL FRANCE | | 50,326,586 |
Germany - 6.6% |
DIC Asset AG | 176,960 | | 5,581,401 |
IVG Immobilien AG | 1,277,000 | | 47,057,023 |
Patrizia Immobilien AG (d) | 1,042,000 | | 16,183,065 |
TOTAL GERMANY | | 68,821,489 |
Greece - 2.1% |
Babis Vovos International Technical SA | 692,830 | | 22,089,190 |
Hong Kong - 17.6% |
Cheung Kong Holdings Ltd. | 2,175,000 | | 30,520,220 |
China Overseas Land & Investment Ltd. | 4,260,000 | | 9,022,963 |
Hong Kong Land Holdings Ltd. | 6,779,000 | | 28,878,540 |
Hopson Development Holdings Ltd. | 2,106,000 | | 7,506,748 |
Common Stocks - continued |
| Shares | | Value |
Hong Kong - continued |
Hysan Development Co. Ltd. | 6,780,000 | | $ 17,471,415 |
Kerry Properties Ltd. | 7,185,911 | | 51,783,134 |
Link (REIT) | 7,114,000 | | 14,761,663 |
Sun Hung Kai Properties Ltd. | 1,895,000 | | 24,099,896 |
TOTAL HONG KONG | | 184,044,579 |
India - 0.2% |
Indiabulls Real Estate Ltd. sponsored GDR (a) | 203,855 | | 2,676,616 |
Japan - 17.3% |
Japan Logistics Fund, Inc. (d) | 836 | | 6,958,929 |
Japan Retail Fund Investment Corp. | 985 | | 7,957,667 |
Mitsubishi Estate Co. Ltd. | 2,833,000 | | 72,071,161 |
Mitsui Fudosan Co. Ltd. | 1,160,000 | | 30,287,120 |
Nippon Residential Investment Corp. | 2,957 | | 16,108,919 |
NTT Urban Development Co. | 12,305 | | 22,272,427 |
Sumitomo Realty & Development Co. Ltd. | 857,000 | | 25,463,558 |
TOTAL JAPAN | | 181,119,781 |
Philippines - 2.6% |
Ayala Land, Inc. | 36,233,760 | | 13,567,708 |
Filinvest Land, Inc. | 250,214,000 | | 10,581,738 |
Vista Land & Lifescapes, Inc. | 19,471,000 | | 2,701,923 |
TOTAL PHILIPPINES | | 26,851,369 |
Russia - 0.7% |
PIK Group GDR (a) | 263,600 | | 7,401,888 |
Singapore - 3.5% |
CapitaLand Ltd. | 7,325,900 | | 36,242,909 |
Spain - 1.0% |
Realia Business SA | 1,158,300 | | 10,127,893 |
United Kingdom - 15.2% |
British Land Co. PLC | 2,429,400 | | 61,343,084 |
Capital & Regional PLC | 1,296,500 | | 26,495,124 |
Derwent London PLC | 422,500 | | 14,324,468 |
Land Securities Group PLC | 1,060,500 | | 36,450,751 |
Savills PLC | 1,075,900 | | 11,463,384 |
Songbird Estates PLC Class B | 1,433,200 | | 7,162,050 |
Unite Group PLC | 320,000 | | 2,340,173 |
TOTAL UNITED KINGDOM | | 159,579,034 |
TOTAL COMMON STOCKS (Cost $968,263,629) | 1,021,370,351 |
Investment Companies - 0.9% |
| Shares | | Value |
Luxembourg - 0.9% |
ProLogis European Properties Fund
(Cost $11,897,123) | 594,000 | | $ 9,184,639 |
Money Market Funds - 4.0% |
| | | |
Fidelity Cash Central Fund, 5.38% (b) | 6,256,438 | | 6,256,438 |
Fidelity Securities Lending Cash Central Fund, 5.39% (b)(c) | 35,505,018 | | 35,505,018 |
TOTAL MONEY MARKET FUNDS (Cost $41,761,456) | 41,761,456 |
TOTAL INVESTMENT PORTFOLIO - 102.5% (Cost $1,021,922,208) | | 1,072,316,446 |
NET OTHER ASSETS - (2.5)% | | (26,429,430) |
NET ASSETS - 100% | $ 1,045,887,016 |
Legend |
(a) Non-income producing |
(b) Affiliated fund that is available only to investment companies and other accounts managed by Fidelity Investments. The rate quoted is the annualized seven-day yield of the fund at period end. A complete unaudited listing of the fund's holdings as of its most recent quarter end is available upon request. |
(c) Investment made with cash collateral received from securities on loan. |
(d) Security or a portion of the security is on loan at period end. |
Affiliated Central Funds |
Information regarding fiscal year to date income earned by the Fund from investments in Fidelity Central Funds is as follows: |
Fund | Income earned |
Fidelity Cash Central Fund | $ 1,495,848 |
Fidelity Securities Lending Cash Central Fund | 670,450 |
Total | $ 2,166,298 |
See accompanying notes which are an integral part of the financial statements.
Annual Report
Financial Statements
Statement of Assets and Liabilities
| July 31, 2007 |
Assets | | |
Investment in securities, at value (including securities loaned of $35,591,593) - See accompanying schedule: Unaffiliated issuers (cost $980,160,752) | $ 1,030,554,990 | |
Fidelity Central Funds (cost $41,761,456) | 41,761,456 | |
Total Investments (cost $1,021,922,208) | | $ 1,072,316,446 |
Foreign currency held at value (cost $156) | | 156 |
Receivable for investments sold | | 13,831,367 |
Receivable for fund shares sold | | 1,477,857 |
Dividends receivable | | 3,422,908 |
Distributions receivable from Fidelity Central Funds | | 101,758 |
Prepaid expenses | | 805 |
Other receivables | | 645,459 |
Total assets | | 1,091,796,756 |
| | |
Liabilities | | |
Payable for investments purchased | $ 2,728,217 | |
Payable for fund shares redeemed | 6,535,236 | |
Accrued management fee | 668,181 | |
Distribution fees payable | 4,979 | |
Other affiliated payables | 294,171 | |
Other payables and accrued expenses | 173,938 | |
Collateral on securities loaned, at value | 35,505,018 | |
Total liabilities | | 45,909,740 |
| | |
Net Assets | | $ 1,045,887,016 |
Net Assets consist of: | | |
Paid in capital | | $ 965,220,976 |
Undistributed net investment income | | 15,501,269 |
Accumulated undistributed net realized gain (loss) on investments and foreign currency transactions | | 14,696,166 |
Net unrealized appreciation (depreciation) on investments and assets and liabilities in foreign currencies | | 50,468,605 |
Net Assets | | $ 1,045,887,016 |
See accompanying notes which are an integral part of the financial statements.
Annual Report
Statement of Assets and Liabilities - continued
| July 31, 2007 |
Calculation of Maximum Offering Price Class A:
Net Asset Value and redemption price per share ($5,087,287 ÷ 323,851 shares) | | $ 15.71 |
| | |
Maximum offering price per share (100/94.25 of $15.71) | | $ 16.67 |
Class T:
Net Asset Value and redemption price per share ($2,397,650 ÷ 152,721 shares) | | $ 15.70 |
| | |
Maximum offering price per share (100/96.50 of $15.70) | | $ 16.27 |
Class B:
Net Asset Value and offering price per share ($1,157,900 ÷ 73,897 shares)A | | $ 15.67 |
| | |
Class C:
Net Asset Value and offering price per share ($2,629,333 ÷ 167,749 shares)A | | $ 15.67 |
| | |
International Real Estate:
Net Asset Value, offering price and redemption price per share ($1,032,138,075 ÷ 65,628,364 shares) | | $ 15.73 |
| | |
Institutional Class:
Net Asset Value, offering price and redemption price per share ($2,476,771 ÷ 157,488 shares) | | $ 15.73 |
A Redemption price per share is equal to net asset value less any applicable contingent deferred sales charge.
See accompanying notes which are an integral part of the financial statements.
Annual Report
Financial Statements - continued
Statement of Operations
| Year ended July 31, 2007 |
Investment Income | | |
Dividends | | $ 29,601,642 |
Interest | | 59,101 |
Income from Fidelity Central Funds | | 2,166,298 |
| | 31,827,041 |
Less foreign taxes withheld | | (2,955,827) |
Total income | | 28,871,214 |
| | |
Expenses | | |
Management fee | $ 7,329,886 | |
Transfer agent fees | 2,462,591 | |
Distribution fees | 12,863 | |
Accounting and security lending fees | 478,272 | |
Custodian fees and expenses | 341,426 | |
Independent trustees' compensation | 3,032 | |
Registration fees | 218,117 | |
Audit | 62,980 | |
Legal | 17,143 | |
Interest | 20,398 | |
Miscellaneous | 9,756 | |
Total expenses before reductions | 10,956,464 | |
Expense reductions | (1,145,752) | 9,810,712 |
Net investment income (loss) | | 19,060,502 |
Realized and Unrealized Gain (Loss) Net realized gain (loss) on: | | |
Investment securities: | | |
Unaffiliated issuers (net of foreign taxes of $14,337) | 65,495,797 | |
Foreign currency transactions | (26,616) | |
Total net realized gain (loss) | | 65,469,181 |
Change in net unrealized appreciation (depreciation) on: Investment securities | 11,346,926 | |
Assets and liabilities in foreign currencies | 24,358 | |
Total change in net unrealized appreciation (depreciation) | | 11,371,284 |
Net gain (loss) | | 76,840,465 |
Net increase (decrease) in net assets resulting from operations | | $ 95,900,967 |
See accompanying notes which are an integral part of the financial statements.
Annual Report
Statement of Changes in Net Assets
| Year ended
July 31,
2007 | Year ended
July 31,
2006 |
Increase (Decrease) in Net Assets | | |
Operations | | |
Net investment income (loss) | $ 19,060,502 | $ 6,265,391 |
Net realized gain (loss) | 65,469,181 | 18,392,807 |
Change in net unrealized appreciation (depreciation) | 11,371,284 | 28,618,723 |
Net increase (decrease) in net assets resulting
from operations | 95,900,967 | 53,276,921 |
Distributions to shareholders from net investment income | (8,677,416) | (3,273,462) |
Distributions to shareholders from net realized gain | (61,685,812) | (5,444,196) |
Total distributions | (70,363,228) | (8,717,658) |
Share transactions - net increase (decrease) | 571,194,492 | 242,030,836 |
Redemption fees | 1,300,956 | 283,977 |
Total increase (decrease) in net assets | 598,033,187 | 286,874,076 |
| | |
Net Assets | | |
Beginning of period | 447,853,829 | 160,979,753 |
End of period (including undistributed net investment income of $15,501,269 and undistributed net investment income of $5,544,851, respectively) | $ 1,045,887,016 | $ 447,853,829 |
See accompanying notes which are an integral part of the financial statements.
Annual Report
Financial Highlights - Class A
Year ended July 31, | 2007 I |
Selected Per-Share Data | |
Net asset value, beginning of period | $ 17.46 |
Income from Investment Operations | |
Net investment income (loss) E | .11 |
Net realized and unrealized gain (loss) | (1.87) H |
Total from investment operations | (1.76) |
Redemption fees added to paid in capital E | .01 |
Net asset value, end of period | $ 15.71 |
Total Return B, C, D | (10.02)% |
Ratios to Average Net Assets F, J | |
Expenses before reductions | 1.37% A |
Expenses net of fee waivers, if any | 1.37% A |
Expenses net of all reductions | 1.26% A |
Net investment income (loss) | 2.08% A |
Supplemental Data | |
Net assets, end of period (000 omitted) | $ 5,087 |
Portfolio turnover rate G | 144% |
A Annualized
B Total returns for periods of less than one year are not annualized.
C Total returns would have been lower had certain expenses not been reduced during the periods shown.
D Total returns do not include the effect of the sales charges.
E Calculated based on average shares outstanding during the period.
F Fees and expenses of the underlying Fidelity Central Funds are not included in the Fund's expense ratio. The Fund indirectly bears its proportionate share of the expenses of any underlying Fidelity Central Funds.
G Amount does not include the portfolio activity of any underlying Fidelity Central Funds.
H The amount shown for a share outstanding does not correspond with the aggregate net gain (loss) on investments for the period due to the timing of sales and repurchases of shares in relation to fluctuating market values of the investments of the Fund.
I For the period April 4, 2007 (commencement of sale of shares) to July 31, 2007.
J Expense ratios reflect operating expenses of the class. Expenses before reductions do not reflect amounts reimbursed by the investment adviser or reductions from brokerage service arrangements or other expense offset arrangements and do not represent the amount paid by the class during periods when reimbursements or reductions occur. Expenses net of fee waivers reflect expenses after reimbursement by the investment adviser but prior to reductions from brokerage service arrangements or other expense offset arrangements. Expenses net of all reductions represent the net expenses paid by the class.
See accompanying notes which are an integral part of the financial statements.
Annual Report
Financial Highlights - Class T
Year ended July 31, | 2007 I |
Selected Per-Share Data | |
Net asset value, beginning of period | $ 17.46 |
Income from Investment Operations | |
Net investment income (loss) E | .10 |
Net realized and unrealized gain (loss) | (1.87) H |
Total from investment operations | (1.77) |
Redemption fees added to paid in capital E | .01 |
Net asset value, end of period | $ 15.70 |
Total Return B, C, D | (10.08)% |
Ratios to Average Net Assets F, J | |
Expenses before reductions | 1.61% A |
Expenses net of fee waivers, if any | 1.61% A |
Expenses net of all reductions | 1.51% A |
Net investment income (loss) | 1.90% A |
Supplemental Data | |
Net assets, end of period (000 omitted) | $ 2,398 |
Portfolio turnover rate G | 144% |
A Annualized
B Total returns for periods of less than one year are not annualized.
C Total returns would have been lower had certain expenses not been reduced during the periods shown.
D Total returns do not include the effect of the sales charges.
E Calculated based on average shares outstanding during the period.
F Fees and expenses of the underlying Fidelity Central Funds are not included in the Fund's expense ratio. The Fund indirectly bears its proportionate share of the expenses of any underlying Fidelity Central Funds.
G Amount does not include the portfolio activity of any underlying Fidelity Central Funds.
H The amount shown for a share outstanding does not correspond with the aggregate net gain (loss) on investments for the period due to the timing of sales and repurchases of shares in relation to fluctuating market values of the investments of the Fund.
I For the period April 4, 2007 (commencement of sale of shares) to July 31, 2007.
J Expense ratios reflect operating expenses of the class. Expenses before reductions do not reflect amounts reimbursed by the investment adviser or reductions from brokerage service arrangements or other expense offset arrangements and do not represent the amount paid by the class during periods when reimbursements or reductions occur. Expenses net of fee waivers reflect expenses after reimbursement by the investment adviser but prior to reductions from brokerage service arrangements or other expense offset arrangements. Expenses net of all reductions represent the net expenses paid by the class.
See accompanying notes which are an integral part of the financial statements.
Annual Report
Financial Highlights - Class B
Year ended July 31, | 2007 I |
Selected Per-Share Data | |
Net asset value, beginning of period | $ 17.46 |
Income from Investment Operations | |
Net investment income (loss) E | .07 |
Net realized and unrealized gain (loss) | (1.87) H |
Total from investment operations | (1.80) |
Redemption fees added to paid in capital E | .01 |
Net asset value, end of period | $ 15.67 |
Total Return B, C, D | (10.25)% |
Ratios to Average Net Assets F, J | |
Expenses before reductions | 2.11% A |
Expenses net of fee waivers, if any | 2.11% A |
Expenses net of all reductions | 2.01% A |
Net investment income (loss) | 1.38% A |
Supplemental Data | |
Net assets, end of period (000 omitted) | $ 1,158 |
Portfolio turnover rate G | 144% |
A Annualized
B Total returns for periods of less than one year are not annualized.
C Total returns would have been lower had certain expenses not been reduced during the periods shown.
D Total returns do not include the effect of the contingent deferred sales charge.
E Calculated based on average shares outstanding during the period.
F Fees and expenses of the underlying Fidelity Central Funds are not included in the Fund's expense ratio. The Fund indirectly bears its proportionate share of the expenses of any underlying Fidelity Central Funds.
G Amount does not include the portfolio activity of any underlying Fidelity Central Funds.
H The amount shown for a share outstanding does not correspond with the aggregate net gain (loss) on investments for the period due to the timing of sales and repurchases of shares in relation to fluctuating market values of the investments of the Fund.
I For the period April 4, 2007 (commencement of sale of shares) to July 31, 2007.
J Expense ratios reflect operating expenses of the class. Expenses before reductions do not reflect amounts reimbursed by the investment adviser or reductions from brokerage service arrangements or other expense offset arrangements and do not represent the amount paid by the class during periods when reimbursements or reductions occur. Expenses net of fee waivers reflect expenses after reimbursement by the investment adviser but prior to reductions from brokerage service arrangements or other expense offset arrangements. Expenses net of all reductions represent the net expenses paid by the class.
See accompanying notes which are an integral part of the financial statements.
Annual Report
Financial Highlights - Class C
Year ended July 31, | 2007 I |
Selected Per-Share Data | |
Net asset value, beginning of period | $ 17.46 |
Income from Investment Operations | |
Net investment income (loss) E | .07 |
Net realized and unrealized gain (loss) | (1.87) H |
Total from investment operations | (1.80) |
Redemption fees added to paid in capital E | .01 |
Net asset value, end of period | $ 15.67 |
Total Return B, C, D | (10.25)% |
Ratios to Average Net Assets F, J | |
Expenses before reductions | 2.10% A |
Expenses net of fee waivers, if any | 2.10% A |
Expenses net of all reductions | 2.00% A |
Net investment income (loss) | 1.35% A |
Supplemental Data | |
Net assets, end of period (000 omitted) | $ 2,629 |
Portfolio turnover rate G | 144% |
A Annualized
B Total returns for periods of less than one year are not annualized.
C Total returns would have been lower had certain expenses not been reduced during the periods shown.
D Total returns do not include the effect of the contingent deferred sales charge.
E Calculated based on average shares outstanding during the period.
F Fees and expenses of the underlying Fidelity Central Funds are not included in the Fund's expense ratio. The Fund indirectly bears its proportionate share of the expenses of any underlying Fidelity Central Funds.
G Amount does not include the portfolio activity of any underlying Fidelity Central Funds.
H The amount shown for a share outstanding does not correspond with the aggregate net gain (loss) on investments for the period due to the timing of sales and repurchases of shares in relation to fluctuating market values of the investments of the Fund.
I For the period April 4, 2007 (commencement of sale of shares) to July 31, 2007.
J Expense ratios reflect operating expenses of the class. Expenses before reductions do not reflect amounts reimbursed by the investment adviser or reductions from brokerage service arrangements or other expense offset arrangements and do not represent the amount paid by the class during periods when reimbursements or reductions occur. Expenses net of fee waivers reflect expenses after reimbursement by the investment adviser but prior to reductions from brokerage service arrangements or other expense offset arrangements. Expenses net of all reductions represent the net expenses paid by the class.
See accompanying notes which are an integral part of the financial statements.
Annual Report
Financial Highlights - International Real Estate
Years ended July 31, | 2007 | 2006 | 2005 G |
Selected Per-Share Data | | | |
Net asset value, beginning of period | $ 14.69 | $ 12.09 | $ 10.00 |
Income from Investment Operations | | | |
Net investment income (loss) D | .31 | .30 | .23 |
Net realized and unrealized gain (loss) | 2.35 | 2.93 | 1.91 |
Total from investment operations | 2.66 | 3.23 | 2.14 |
Distributions from net investment income | (.22) | (.24) | (.03) |
Distributions from net realized gain | (1.42) | (.40) | (.03) |
Total distributions | (1.64) | (.64) | (.06) |
Redemption fees added to paid in capital D | .02 | .01 | .01 |
Net asset value, end of period | $ 15.73 | $ 14.69 | $ 12.09 |
Total Return B, C | 19.01% | 27.85% | 21.53% |
Ratios to Average Net Assets E, H | | | |
Expenses before reductions | 1.07% | 1.12% | 1.29% A |
Expenses net of fee waivers, if any | 1.06% | 1.12% | 1.29% A |
Expenses net of all reductions | .96% | .91% | 1.27% A |
Net investment income (loss) | 1.86% | 2.23% | 2.21% A |
Supplemental Data | | | |
Net assets, end of period (000 omitted) | $ 1,032,138 | $ 447,854 | $ 160,980 |
Portfolio turnover rate F | 144% | 234% | 36% A |
A Annualized
B Total returns for periods of less than one year are not annualized.
C Total returns would have been lower had certain expenses not been reduced during the periods shown.
D Calculated based on average shares outstanding during the period.
E Fees and expenses of the underlying Fidelity Central Funds are not included in the Fund's expense ratio. The Fund indirectly bears its proportionate share of the expenses of any underlying Fidelity Central Funds.
F Amount does not include the portfolio activity of any underlying Fidelity Central Funds.
G For the period September 8, 2004 (commencement of operations) to July 31, 2005.
H Expense ratios reflect operating expenses of the class. Expenses before reductions do not reflect amounts reimbursed by the investment adviser or reductions from brokerage service arrangements or other expense offset arrangements and do not represent the amount paid by the class during periods when reimbursements or reductions occur. Expenses net of fee waivers reflect expenses after reimbursement by the investment adviser but prior to reductions from brokerage service arrangements or other expense offset arrangements. Expenses net of all reductions represent the net expenses paid by the class.
See accompanying notes which are an integral part of the financial statements.
Annual Report
Financial Highlights - Institutional Class
Year ended July 31, | 2007 H |
Selected Per-Share Data | |
Net asset value, beginning of period | $ 17.46 |
Income from Investment Operations | |
Net investment income (loss) D | .12 |
Net realized and unrealized gain (loss) | (1.86) G |
Total from investment operations | (1.74) |
Redemption fees added to paid in capital D | .01 |
Net asset value, end of period | $ 15.73 |
Total Return B, C | (9.91)% |
Ratios to Average Net Assets E, I | |
Expenses before reductions | 1.08% A |
Expenses net of fee waivers, if any | 1.08% A |
Expenses net of all reductions | .97% A |
Net investment income (loss) | 2.27% A |
Supplemental Data | |
Net assets, end of period (000 omitted) | $ 2,477 |
Portfolio turnover rate F | 144% |
A Annualized
B Total returns for periods of less than one year are not annualized.
C Total returns would have been lower had certain expenses not been reduced during the periods shown.
D Calculated based on average shares outstanding during the period.
E Fees and expenses of the underlying Fidelity Central Funds are not included in the Fund's expense ratio. The Fund indirectly bears its proportionate share of the expenses of any underlying Fidelity Central Funds.
F Amount does not include the portfolio activity of any underlying Fidelity Central Funds.
G The amount shown for a share outstanding does not correspond with the aggregate net gain (loss) on investments for the period due to the timing of sales and repurchases of shares in relation to fluctuating market values of the investments of the Fund.
H For the period April 4, 2007 (commencement of sale of shares) to July 31, 2007.
I Expense ratios reflect operating expenses of the class. Expenses before reductions do not reflect amounts reimbursed by the investment adviser or reductions from brokerage service arrangements or other expense offset arrangements and do not represent the amount paid by the class during periods when reimbursements or reductions occur. Expenses net of fee waivers reflect expenses after reimbursement by the investment adviser but prior to reductions from brokerage service arrangements or other expense offset arrangements. Expenses net of all reductions represent the net expenses paid by the class.
See accompanying notes which are an integral part of the financial statements.
Annual Report
Notes to Financial Statements
For the period ended July 31, 2007
1. Organization.
Fidelity International Real Estate Fund (the Fund) is a non-diversified fund of Fidelity Securities Fund (the trust) and is authorized to issue an unlimited number of shares. The trust is registered under the Investment Company Act of 1940, as amended (the 1940 Act), as an open-end management investment company organized as a Massachusetts business trust. The Fund offers Class A, Class T, Class B, Class C, International Real Estate, and Institutional Class shares, each of which has equal rights as to assets and voting privileges. Each class has exclusive voting rights with respect to matters that affect that class. The Fund commenced sale of Class A, Class T, Class B, Class C and Institutional Class shares and the existing class was designated International Real Estate on April 4, 2007. Class B shares will automatically convert to Class A shares after a holding period of seven years from the initial date of purchase. Investment income, realized and unrealized capital gains and losses, the common expenses of the Fund, and certain fund-level expense reductions, if any, are allocated on a pro rata basis to each class based on the relative net assets of each class to the total net assets of the Fund. Each class differs with respect to transfer agent and distribution and service plan fees incurred. Certain expense reductions also differ by class. The Fund's investments in emerging markets can be subject to social, economic, regulatory, and political uncertainties and can be extremely volatile.
2. Investments in Fidelity Central Funds.
The Fund may invest in Fidelity Central Funds which are open-end investment companies available only to other investment companies and accounts managed by Fidelity Management & Research Company (FMR) and its affiliates. The Fund's Schedule of Investments lists each of the Fidelity Central Funds as an investment of the Fund, but does not include the underlying holdings of each Fidelity Central Fund. As an Investing Fund, the Fund indirectly bears its proportionate share of the expenses of the underlying Fidelity Central Funds.
The Money Market Central Funds seek preservation of capital and current income and are managed by Fidelity Investments Money Management, Inc. (FIMM), an affiliate of FMR.
A complete list of holdings for each Fidelity Central Fund is available upon request or at the SEC's web site at www.sec.gov. In addition, the financial statements of the Fidelity Central Funds, which are not covered by the Fund's Report of Independent Registered Public Accounting Firm, are available on the SEC's web site or upon request.
3. Significant Accounting Policies.
The financial statements have been prepared in conformity with accounting principles generally accepted in the United States of America, which require management to make certain estimates and assumptions at the date of the financial statements. The following summarizes the significant accounting policies of the Fund:
Annual Report
3. Significant Accounting Policies - continued
Security Valuation. Investments are valued and net asset value (NAV) per share is calculated (NAV calculation) as of the close of business of the New York Stock Exchange (NYSE), normally 4:00 p.m. Eastern time. Wherever possible, the Fund uses independent pricing services approved by the Board of Trustees to value its investments.
Equity securities, including restricted securities, for which market quotations are readily available, are valued at the last reported sale price or official closing price as reported by an independent pricing service on the primary market or exchange on which they are traded. In the event there were no sales during the day or closing prices are not available, securities are valued at the last quoted bid price. Investments in open-end mutual funds, including the Fidelity Central Funds, are valued at their closing net asset value each business day. Short-term securities with remaining maturities of sixty days or less for which quotations are not readily available are valued at amortized cost, which approximates value.
When current market prices or quotations are not readily available or do not accurately reflect fair value, valuations may be determined in accordance with procedures adopted by the Board of Trustees. For example, when developments occur between the close of a market and the close of the NYSE that may materially affect the value of some or all of the securities, or when trading in a security is halted, those securities may be fair valued. Factors used in the determination of fair value may include monitoring news to identify significant market or security specific events such as changes in the value of U.S. securities markets, reviewing developments in foreign markets and evaluating the performance of ADRs, futures contracts and exchange-traded funds. Because the Fund's utilization of fair value pricing depends on market activity, the frequency with which fair value pricing is used cannot be predicted and may be utilized to a significant extent. The value of securities used for NAV calculation under fair value pricing may differ from published prices for the same securities.
Foreign Currency. The Fund uses foreign currency contracts to facilitate transactions in foreign-denominated securities. Losses from these transactions may arise from changes in the value of the foreign currency or if the counterparties do not perform under the contracts' terms.
Foreign-denominated assets, including investment securities, and liabilities are translated into U.S. dollars at the exchange rate at period end. Purchases and sales of investment securities, income and dividends received and expenses denominated in foreign currencies are translated into U.S. dollars at the exchange rate in effect on the transaction date.
The effects of exchange rate fluctuations on investments are included with the net realized and unrealized gain (loss) on investment securities. Other foreign currency transactions resulting in realized and unrealized gain (loss) are disclosed separately.
Annual Report
Notes to Financial Statements - continued
3. Significant Accounting Policies - continued
Investment Transactions and Income. For financial reporting purposes, the Fund's investment holdings and NAV include trades executed through the end of the last business day of the period. The NAV for processing shareholder transactions includes trades executed through the end of the prior business day. Gains and losses on securities sold are determined on the basis of identified cost. Dividend income is recorded on the ex-dividend date, except for certain dividends from foreign securities where the ex-dividend date may have passed, which are recorded as soon as the Fund is informed of the ex-dividend date. Non-cash dividends included in dividend income, if any, are recorded at the fair market value of the securities received. Distributions received on securities that represent a return of capital or capital gain are recorded as a reduction of cost of investments and/or as a realized gain. The Fund estimates the components of distributions received that may be considered return of capital distributions or capital gain distributions. Interest income and distributions from the Fidelity Central Funds are accrued as earned. Interest income includes coupon interest and amortization of premium and accretion of discount on debt securities. Investment income is recorded net of foreign taxes withheld where recovery of such taxes is uncertain.
Expenses. Most expenses of the trust can be directly attributed to a fund. Expenses which cannot be directly attributed are apportioned among each Fund in the trust. Expense estimates are accrued in the period to which they relate and adjustments are made when actual amounts are known.
Income Tax Information and Distributions to Shareholders. Each year, the Fund intends to qualify as a regulated investment company by distributing all of its taxable income and realized gains under Subchapter M of the Internal Revenue Code. As a result, no provision for income taxes is required in the accompanying financial statements. Foreign taxes are provided for based on the Fund's understanding of the tax rules and rates that exist in the foreign markets in which it invests.
Distributions are recorded on the ex-dividend date. Income dividends and capital gain distributions are declared separately for each class. Income and capital gain distributions are determined in accordance with income tax regulations, which may differ from generally accepted accounting principles. In addition, the Fund will claim a portion of the payment made to redeeming shareholders as a distribution for income tax purposes.
Capital accounts within the financial statements are adjusted for permanent book-tax differences. These adjustments have no impact on net assets or the results of operations. Temporary book-tax differences will reverse in a subsequent period.
Book-tax differences are primarily due to foreign currency transactions, certain foreign taxes, passive foreign investment companies (PFIC), and losses deferred due to wash sales.
Annual Report
3. Significant Accounting Policies - continued
Income Tax Information and Distributions to Shareholders - continued
The tax-basis components of distributable earnings and the federal tax cost as of period end were as follows:
Unrealized appreciation | $ 94,707,335 |
Unrealized depreciation | (87,911,618) |
Net unrealized appreciation (depreciation) | 6,795,717 |
Undistributed ordinary income | 54,277,494 |
Undistributed long-term capital gain | 4,675,655 |
| |
Cost for federal income tax purposes | $ 1,065,520,729 |
The tax character of distributions paid was as follows:
| July 31, 2007 | July 31, 2006 |
Ordinary Income | $ 58,738,310 | $ 8,431,124 |
Long-term Capital Gains | 11,624,918 | 286,534 |
Total | $ 70,363,228 | $ 8,717,658 |
Short-Term Trading (Redemption) Fees. Shares held in the Fund less than 90 days are subject to a redemption fee equal to 1.50% of the proceeds of the redeemed shares. All redemption fees, including any estimated redemption fees paid by FMR, are retained by the Fund and accounted for as an addition to paid in capital.
New Accounting Pronouncements. In July 2006, Financial Accounting Standards Board Interpretation No. 48, Accounting for Uncertainty in Income Taxes - an interpretation of FASB Statement 109 (FIN 48), was issued and is effective on the last business day of the semiannual reporting period for fiscal years beginning after December 15, 2006. FIN 48 sets forth a threshold for financial statement recognition, measurement and disclosure of a tax position taken or expected to be taken on a tax return. Management has concluded that the adoption of FIN 48 will not result in a material impact on the Fund's net assets, results of operations and financial statement disclosures.
In addition, in September 2006, Statement of Financial Accounting Standards No. 157, Fair Value Measurements (SFAS 157), was issued and is effective for fiscal years beginning after November 15, 2007. SFAS 157 defines fair value, establishes a framework for measuring fair value and expands disclosures about fair value measurements. Management is currently evaluating the impact the adoption of SFAS 157 will have on the Fund's financial statement disclosures.
Annual Report
Notes to Financial Statements - continued
4. Operating Policies.
Repurchase Agreements. FMR has received an Exemptive Order from the Securities and Exchange Commission (the SEC) which permits the Fund and other affiliated entities of FMR to transfer uninvested cash balances into joint trading accounts which are then invested in repurchase agreements. The Fund may also invest directly with institutions in repurchase agreements. Repurchase agreements are collateralized by government or non-government securities. Upon settlement date, collateral is held in segregated accounts with custodian banks and may be obtained in the event of a default of the counterparty. The Fund monitors, on a daily basis, the value of the collateral to ensure it is at least equal to the principal amount of the repurchase agreement (including accrued interest). In the event of a default by the counterparty, realization of the collateral proceeds could be delayed, during which time the value of the collateral may decline.
5. Purchases and Sales of Investments.
Purchases and sales of securities, other than short-term securities, aggregated $1,940,342,064 and $1,414,287,899, respectively.
6. Fees and Other Transactions with Affiliates.
Management Fee. FMR and its affiliates provide the Fund with investment management related services for which the Fund pays a monthly management fee. The management fee is the sum of an individual fund fee rate that is based on an annual rate of .45% of the Fund's average net assets and a group fee rate that averaged .26% during the period. The group fee rate is based upon the average net assets of all the mutual funds advised by FMR. The group fee rate decreases as assets under management increase and increases as assets under management decrease. For the period, the total annual management fee rate was .71% of the Fund's average net assets.
Distribution and Service Plan. In accordance with Rule 12b-1 of the 1940 Act, the Fund has adopted separate Distribution and Service Plans for each class of shares. Certain classes pay Fidelity Distributors Corporation (FDC), an affiliate of FMR, separate Distribution and Service Fees, each of which is based on an annual percentage of each class' average net assets. In addition, FDC may pay financial intermediaries for selling shares of the Fund and providing shareholder support services. For the period, the Distribution and Service Fee rates and the total amounts paid to and retained by FDC were as follows:
| Distribution
Fee | Service
Fee | Paid to
FDC | Retained
by FDC |
Class A | 0% | .25% | $ 2,571 | $ 377 |
Class T | .25% | .25% | 2,562 | 1,280 |
Class B | .75% | .25% | 2,468 | 1,922 |
Class C | .75% | .25% | 5,262 | 4,263 |
| | | $ 12,863 | $ 7,842 |
Annual Report
6. Fees and Other Transactions with Affiliates - continued
Sales Load. FDC receives a front-end sales charge of up to 5.75% for selling Class A shares, and 3.50% for selling Class T shares, some of which is paid to financial intermediaries for selling shares of the Fund. FDC receives the proceeds of contingent deferred sales charges levied on Class A, Class T, Class B, and Class C redemptions. These charges depend on the holding period. The deferred sales charges range from 5% to 1% for Class B, 1% for Class C, 1.00% to .50% for certain purchases of Class A shares and .25% for certain purchases of Class T shares.
For the period, sales charge amounts retained by FDC were as follows:
| Retained
by FDC |
Class A | $ 17,963 |
Class T | 4,269 |
Class C* | 29 |
| $ 22,261 |
* When Class C shares are initially sold, FDC pays commissions from its own resources to financial intermediaries through which the sales are made.
Transfer Agent Fees. Fidelity Investments Institutional Operations Company, Inc. (FIIOC), an affiliate of FMR, is the transfer, dividend disbursing and shareholder servicing agent for each class of the Fund, except for International Real Estate. Fidelity Service Company, Inc. (FSC), an affiliate of FMR, is the transfer agent for International Real Estate shares. FIIOC and FSC receive account fees and asset-based fees that vary according to the account size and type of account of the shareholders of the respective classes of the Fund. FIIOC and FSC pay for typesetting, printing and mailing of shareholder reports, except proxy statements. For the period, the total transfer agent fees paid by each class to FIIOC or FSC, were as follows:
| Amount | % of
Average
Net Assets |
Class A | $ 2,951 | .29 * |
Class T | 1,450 | .28 * |
Class B | 705 | .28 * |
Class C | 1,464 | .28 * |
International Real Estate | 2,454,942 | .24 |
Institutional Class | 1,079 | .24 * |
| $ 2,462,591 | |
* Annualized
Annual Report
Notes to Financial Statements - continued
6. Fees and Other Transactions with Affiliates - continued
Accounting and Security Lending Fees. FSC maintains the Fund's accounting records. The accounting fee is based on the level of average net assets for the month. Under a separate contract, FSC administers the security lending program. The security lending fee is based on the number and duration of lending transactions.
Interfund Lending Program. Pursuant to an Exemptive Order issued by the SEC, the Fund, along with other registered investment companies having management contracts with FMR, may participate in an interfund lending program. This program provides an alternative credit facility allowing the funds to borrow from, or lend money to, other participating affiliated funds. At period end, there were no interfund loans outstanding. The Fund's activity in this program during the period for which loans were outstanding was as follows:
Borrower or Lender | Average Daily
Loan Balance | Weighted Average
Interest Rate | Interest
Expense |
Borrower | $ 10,469,077 | 5.40% | $ 20,398 |
7. Committed Line of Credit.
The Fund participates with other funds managed by FMR in a $4.2 billion credit facility (the "line of credit") to be utilized for temporary or emergency purposes to fund shareholder redemptions or for other short-term liquidity purposes. The Fund has agreed to pay commitment fees on its pro rata portion of the line of credit, which amounted to $1,511 and is reflected in Miscellaneous Expense on the Statement of Operations. During the period, there were no borrowings on this line of credit.
8. Security Lending.
The Fund lends portfolio securities from time to time in order to earn additional income. On the settlement date of the loan, the Fund receives collateral (in the form of U.S. Treasury obligations, letters of credit and/or cash) against the loaned securities and maintains collateral in an amount not less than 100% of the market value of the loaned securities during the period of the loan. The market value of the loaned securities is determined at the close of business of the Fund and any additional required collateral is delivered to the Fund on the next business day. If the borrower defaults on its obligation to return the securities loaned because of insolvency or other reasons, a fund could experience delays and costs in recovering the securities loaned or in gaining access to the collateral. Any cash collateral received is invested in the Fidelity Securities Lending Cash Central Fund. The value of loaned securities and cash collateral at period end are disclosed on the Fund's Statement of Assets and Liabilities. Security lending income represents the income earned on investing cash collateral, less fees and expenses associated
Annual Report
8. Security Lending - continued
with the loan, plus any premium payments that may be received on the loan of certain types of securities. Security lending income is presented in the Statement of Operations as a component of income from Fidelity Central Funds. Net income from lending portfolio securities during the period amounted to $670,450.
9. Expense Reductions.
FMR voluntarily agreed to reimburse a portion of International Real Estate's operating expenses. During the period, this reimbursement reduced the class' expenses by $65,025.
Many of the brokers with whom FMR places trades on behalf of the Fund provided services to the Fund in addition to trade execution. These services included payments of certain expenses on behalf of the Fund totaling $1,069,050 for the period. In addition, through arrangements with each class' transfer agent, credits realized as a result of uninvested cash balances were used to reduce the Fund's expenses. During the period, credits reduced each class' transfer agent expense as noted in the table below.
| Transfer Agent
expense reduction |
Class B | $ 2 |
International Real Estate | 11,675 |
| $ 11,677 |
10. Other.
The Fund's organizational documents provide former and current trustees and officers with a limited indemnification against liabilities arising in connection with the performance of their duties to the Fund. In the normal course of business, the Fund may also enter into contracts that provide general indemnifications. The Fund's maximum exposure under these arrangements is unknown as this would be dependent on future claims that may be made against the Fund. The risk of material loss from such claims is considered remote.
11. Distributions to Shareholders.
Distributions to shareholders of each class were as follows:
Years ended July 31, | 2007 | 2006 |
From net investment income | | |
International Real Estate | $ 8,677,416 | $ 3,273,462 |
From net realized gain | | |
International Real Estate | $ 61,685,812 | $ 5,444,196 |
Annual Report
Notes to Financial Statements - continued
12. Share Transactions.
Transactions for each class of shares were as follows:
| Shares | Dollars |
Years ended July 31, | 2007 A | 2006 | 2007 A | 2006 |
Class A | | | | |
Shares sold | 352,797 | - | $ 6,021,703 | $ - |
Shares redeemed | (28,946) | - | (470,996) | - |
Net increase (decrease) | 323,851 | - | $ 5,550,707 | $ - |
Class T | | | | |
Shares sold | 163,911 | - | $ 2,804,594 | $ - |
Shares redeemed | (11,190) | - | (189,267) | - |
Net increase (decrease) | 152,721 | - | $ 2,615,327 | $ - |
Class B | | | | |
Shares sold | 74,357 | - | $ 1,273,355 | $ - |
Shares redeemed | (460) | - | (7,526) | - |
Net increase (decrease) | 73,897 | - | $ 1,265,829 | $ - |
Class C | | | | |
Shares sold | 188,521 | - | $ 3,213,374 | $ - |
Shares redeemed | (20,772) | - | (352,540) | - |
Net increase (decrease) | 167,749 | - | $ 2,860,834 | $ - |
International Real Estate | | | | |
Shares sold | 78,643,461 | 23,490,365 | $ 1,288,512,778 | $ 327,866,574 |
Reinvestment of distributions | 4,249,998 | 646,412 | 65,004,744 | 7,986,974 |
Shares redeemed | (47,753,325) | (6,968,124) | (797,297,400) | (93,822,712) |
Net increase (decrease) | 35,140,134 | 17,168,653 | $ 556,220,122 | $ 242,030,836 |
Institutional Class | | | | |
Shares sold | 158,866 | - | $ 2,704,482 | $ - |
Shares redeemed | (1,378) | - | (22,809) | - |
Net increase (decrease) | 157,488 | - | $ 2,681,673 | $ - |
A Share transactions for Class A, Class T, Class B, Class C, and Institutional Class are for the period April 4, 2007 (commencement of sale of shares) to July 31, 2007.
Annual Report
Report of Independent Registered Public Accounting Firm
To the Trustees of Fidelity Securities Fund and the Shareholders of Fidelity International Real Estate Fund:
In our opinion, the accompanying statement of assets and liabilities, including the schedule of investments, and the related statements of operations and of changes in net assets and the financial highlights present fairly, in all material respects, the financial position of Fidelity International Real Estate Fund (a fund of Fidelity Securities Fund) at July 31, 2007, the results of its operations for the year then ended, the changes in its net assets for each of the two years in the period then ended and the financial highlights for each of the periods indicated, in conformity with accounting principles generally accepted in the United States of America. These financial statements and financial highlights (hereafter referred to as "financial statements") are the responsibility of the Fidelity International Real Estate Fund's management. Our responsibility is to express an opinion on these financial statements based on our audits. We conducted our audits of these financial statements in accordance with the standards of the Public Company Accounting Oversight Board (United States). Those standards require that we plan and perform the audit to obtain reasonable assurance about whether the financial statements are free of material misstatement. An audit includes examining, on a test basis, evidence supporting the amounts and disclosures in the financial statements, assessing the accounting principles used and significant estimates made by management, and evaluating the overall financial statement presentation. We believe that our audits, which included confirmation of securities at July 31, 2007 by correspondence with the custodian and brokers, provide a reasonable basis for our opinion.
/s/ PricewaterhouseCoopers LLP
PricewaterhouseCoopers LLP
Boston, Massachusetts
September 18, 2007
Annual Report
Trustees and Officers
The Trustees, Members of the Advisory Board, and executive officers of the trust and fund, as applicable, are listed below. The Board of Trustees governs the fund and is responsible for protecting the interests of shareholders. The Trustees are experienced executives who meet periodically throughout the year to oversee the fund's activities, review contractual arrangements with companies that provide services to the fund, and review the fund's performance. Except for James C. Curvey, each of the Trustees oversees 353 funds advised by FMR or an affiliate. Mr. Curvey oversees 317 funds advised by FMR or an affiliate.
The Trustees hold office without limit in time except that (a) any Trustee may resign; (b) any Trustee may be removed by written instrument, signed by at least two-thirds of the number of Trustees prior to such removal; (c) any Trustee who requests to be retired or who has become incapacitated by illness or injury may be retired by written instrument signed by a majority of the other Trustees; and (d) any Trustee may be removed at any special meeting of shareholders by a two-thirds vote of the outstanding voting securities of the trust. Each Trustee who is not an interested person (as defined in the 1940 Act) (Independent Trustee), shall retire not later than the last day of the calendar year in which his or her 72nd birthday occurs. The Independent Trustees may waive this mandatory retirement age policy with respect to individual Trustees. The executive officers and Advisory Board Members hold office without limit in time, except that any officer and Advisory Board Member may resign or may be removed by a vote of a majority of the Trustees at any regular meeting or any special meeting of the Trustees. Except as indicated, each individual has held the office shown or other offices in the same company for the past five years.
The fund's Statements of Additional Information (SAI) includes more information about the Trustees. To request a free copy, call Fidelity at 1-800-544-8544.
Interested Trustees*:
Correspondence intended for each Trustee who is an interested person may be sent to Fidelity Investments, 82 Devonshire Street, Boston, Massachusetts 02109.
Name, Age; Principal Occupation |
Edward C. Johnson 3d (77) |
| Year of Election or Appointment: 1984 Mr. Johnson is Chairman of the Board of Trustees. Mr. Johnson serves as President (2006-present), Chief Executive Officer, Chairman, and a Director of FMR Corp.; Chairman and a Director of FMR; Chairman and a Director of Fidelity Research & Analysis Company (FRAC); Chairman and a Director of Fidelity Investments Money Management, Inc.; and Chairman (2001-present) and a Director of FMR Co., Inc. In addition, Mr. Johnson serves as Chairman and Director of Fidelity International Limited (FIL). |
James C. Curvey (72) |
| Year of Election or Appointment: 2007 Mr. Curvey also serves as Trustee (2007-present) or Member of the Advisory Board (2007-present) of other investment companies advised by FMR. Mr. Curvey is Vice Chairman (2006-present) and Director of FMR Corp. Mr. Curvey joined Fidelity in 1982 and served in numerous senior management positions, including President and Chief Operating Officer of FMR Corp. (1997-2000) and President of Fidelity Strategic Investments (2000-2002). In addition, he serves as a member of the Board of Directors of Geerlings & Wade, Inc. (wine distribution). |
* Trustees have been determined to be "Interested Trustees" by virtue of, among other things, their affiliation with the trust or various entities under common control with FMR.
Independent Trustees:
Correspondence intended for each Independent Trustee (that is, the Trustees other than the Interested Trustees) may be sent to Fidelity Investments, P.O. Box 55235, Boston, Massachusetts 02205-5235.
Name, Age; Principal Occupation |
Dennis J. Dirks (59) |
| Year of Election or Appointment: 2005 Prior to his retirement in May 2003, Mr. Dirks was Chief Operating Officer and a member of the Board of The Depository Trust & Clearing Corporation (DTCC) (1999-2003). He also served as President, Chief Operating Officer, and Board member of The Depository Trust Company (DTC) (1999-2003) and President and Board member of the National Securities Clearing Corporation (NSCC) (1999-2003). In addition, Mr. Dirks served as Chief Executive Officer and Board member of the Government Securities Clearing Corporation (2001-2003) and Chief Executive Officer and Board member of the Mortgage-Backed Securities Clearing Corporation (2001-2003). Mr. Dirks also serves as a Trustee and a member of the Finance Committee of Manhattan College (2005-present) and a Trustee and a member of the Finance Committee of AHRC of Nassau County (2006-present). |
Albert R. Gamper, Jr. (65) |
| Year of Election or Appointment: 2006 Prior to his retirement in December 2004, Mr. Gamper served as Chairman of the Board of CIT Group Inc. (commercial finance). During his tenure with CIT Group Inc. Mr. Gamper served in numerous senior management positions, including Chairman (1987-1989; 1999-2001; 2002-2004), Chief Executive Officer (1987-2004), and President (1989-2002). He currently serves as a member of the Board of Directors of Public Service Enterprise Group (utilities, 2001-present), Chairman of the Board of Governors, Rutgers University (2004-present), and Chairman of the Board of Saint Barnabas Health Care System. |
George H. Heilmeier (71) |
| Year of Election or Appointment: 2004 Dr. Heilmeier is Chairman Emeritus of Telcordia Technologies (communication software and systems), where prior to his retirement, he served as company Chairman and Chief Executive Officer. He currently serves on the Boards of Directors of The Mitre Corporation (systems engineering and information technology support for the government), and HRL Laboratories (private research and development, 2004-present). He is Chairman of the General Motors Science & Technology Advisory Board and a Life Fellow of the Institute of Electrical and Electronics Engineers (IEEE). Dr. Heilmeier is a member of the Defense Science Board and the National Security Agency Advisory Board. He is also a member of the National Academy of Engineering, the American Academy of Arts and Sciences, and the Board of Overseers of the School of Engineering and Applied Science of the University of Pennsylvania. Previously, Dr. Heilmeier served as a Director of TRW Inc. (automotive, space, defense, and information technology, 1992-2002), Compaq (1994-2002), Automatic Data Processing, Inc. (ADP) (technology-based business outsourcing, 1995-2002), INET Technologies Inc. (telecommunications network surveillance, 2001-2004), and Teletech Holdings (customer management services). He is the recipient of the 2005 Kyoto Prize in Advanced Technology for his invention of the liquid crystal display, and a member of the Consumer Electronics Hall of Fame. |
James H. Keyes (66) |
| Year of Election or Appointment: 2007 Prior to his retirement in 2003, Mr. Keyes was Chairman, President, and Chief Executive Officer of Johnson Controls, Inc. (automotive supplier, 1993-2003). He currently serves as a member of the boards of LSI Logic Corporation (semiconductor technologies), Navistar International Corporation (manufacture and sale of trucks, buses, and diesel engines, 2002-present), and Pitney Bowes, Inc. (integrated mail, messaging, and document management solutions). |
Marie L. Knowles (60) |
| Year of Election or Appointment: 2001 Prior to Ms. Knowles' retirement in June 2000, she served as Executive Vice President and Chief Financial Officer of Atlantic Richfield Company (ARCO) (diversified energy, 1996-2000). From 1993 to 1996, she was a Senior Vice President of ARCO and President of ARCO Transportation Company. She served as a Director of ARCO from 1996 to 1998. She currently serves as a Director of Phelps Dodge Corporation (copper mining and manufacturing) and McKesson Corporation (healthcare service, 2002-present). Ms. Knowles is a Trustee of the Brookings Institution and the Catalina Island Conservancy and also serves as a member of the Advisory Board for the School of Engineering of the University of Southern California. |
Ned C. Lautenbach (63) |
| Year of Election or Appointment: 2000 Mr. Lautenbach is Chairman of the Independent Trustees (2006-present). Mr. Lautenbach has been a partner of Clayton, Dubilier & Rice, Inc. (private equity investment firm) since September 1998. Previously, Mr. Lautenbach was with the International Business Machines Corporation (IBM) from 1968 until his retirement in 1998. Mr. Lautenbach serves as a Director of Sony Corporation (2006-present) and Eaton Corporation (diversified industrial) as well as the Philharmonic Center for the Arts in Naples, Florida. He also is a member of the Board of Trustees of Fairfield University (2005-present), as well as a member of the Council on Foreign Relations. |
Cornelia M. Small (63) |
| Year of Election or Appointment: 2005 Ms. Small is a member (2000-present) and Chairperson (2002-present) of the Investment Committee, and a member (2002-present) of the Board of Trustees of Smith College. Previously, she served as Chief Investment Officer (1999-2000), Director of Global Equity Investments (1996-1999), and a member of the Board of Directors of Scudder, Stevens & Clark (1990-1997) and Scudder Kemper Investments (1997-1999). In addition, Ms. Small served as Co-Chair (2000-2003) of the Annual Fund for the Fletcher School of Law and Diplomacy. |
William S. Stavropoulos (68) |
| Year of Election or Appointment: 2002 Mr. Stavropoulos is Chairman Emeritus of the Board of Directors of The Dow Chemical Company. Since joining The Dow Chemical Company in 1967, Mr. Stavropoulos served in numerous senior management positions, including President (1993-2000; 2002-2003), CEO (1995-2000; 2002-2004), and Chairman of the Executive Committee (2000-2004). Currently, he is a Director of NCR Corporation (data warehousing and technology solutions), Chemical Financial Corporation, Maersk Inc. (industrial conglomerate, 2002-present), Tyco International, Inc. (multinational manufacturing and services, 2007-present), and a member of the Advisory Board for Metalmark Capital (private equity investment firm, 2005-present). He is a special advisor to Clayton, Dubilier & Rice, Inc., a private equity investment firm. He also serves as a member of the Board of Trustees of the American Enterprise Institute for Public Policy Research. In addition, Mr. Stavropoulos is a member of The Business Council, J.P. Morgan International Council and the University of Notre Dame Advisory Council for the College of Science. |
Kenneth L. Wolfe (68) |
| Year of Election or Appointment: 2005 Prior to his retirement in 2001, Mr. Wolfe was Chairman and Chief Executive Officer of Hershey Foods Corporation (1993-2001). He currently serves as a member of the boards of Adelphia Communications Corporation (2003-present), Bausch & Lomb, Inc., and Revlon Inc. (2004-present). |
Advisory Board Members and Executive Officers:
Correspondence intended for Mr. Mauriello may be sent to Fidelity Investments, P.O. Box 55235, Boston, Massachusetts 02205-5235. Correspondence intended for each executive officer and Mr. Lynch may be sent to Fidelity Investments, 82 Devonshire Street, Boston, Massachusetts 02109.
Name, Age; Principal Occupation |
Peter S. Lynch (63) |
| Year of Election or Appointment: 2003 Member of the Advisory Board of Fidelity Securities Fund. Mr. Lynch is Vice Chairman and a Director of FMR, and Vice Chairman (2001-present) and a Director of FMR Co., Inc. Previously, Mr. Lynch served as a Trustee of the Fidelity funds (1990-2003). In addition, he serves as a Trustee of Boston College and as the Chairman of the Inner-City Scholarship Fund. |
Joseph Mauriello (62) |
| Year of Election or Appointment: 2007 Member of the Advisory Board of Fidelity Securities Fund. Prior to his retirement in January 2006, Mr. Mauriello served in numerous senior management positions including Deputy Chairman and Chief Operating Officer (2004-2005), and Vice Chairman of Financial Services (2002-2004) of KPMG LLP US (professional services firm, 1965-2005). Mr. Mauriello currently serves as a member of the Board of Directors of XL Capital Ltd., (global insurance and re-insurance company, 2006-present) and of Arcadia Resources Inc., (health care services and products, 2007-present). He also served as a Director of the Hamilton Funds of the Bank of New York (2006-2007). |
Kimberley H. Monasterio (43) |
| Year of Election or Appointment: 2007 President and Treasurer of International Real Estate. Ms. Monasterio also serves as President and Treasurer of other Fidelity funds (2007-present) and is an employee of FMR (2004-present). Previously, Ms. Monasterio served as Deputy Treasurer of the Fidelity funds (2004-2006). Before joining Fidelity Investments, Ms. Monasterio served as Treasurer (2000-2004) and Chief Financial Officer (2002-2004) of the Franklin Templeton Funds and Senior Vice President of Franklin Templeton Services, LLC (2000-2004). |
Dwight D. Churchill (53) |
| Year of Election or Appointment: 2005 Vice President of International Real Estate. Mr. Churchill also serves as Vice President of certain Equity Funds (2005-present). Mr. Churchill is Executive Vice President of FMR (2005-present) and FMR Co., Inc. (2005-present). Previously, Mr. Churchill served as Senior Vice President of Fidelity Investments Money Management, Inc. (2005-2006), Head of Fidelity's Fixed-Income Division (2000-2005), Vice President of Fidelity's Money Market Funds (2000-2005), Vice President of Fidelity's Bond Funds, and Senior Vice President of FMR. |
Steven J. Buller (40) |
| Year of Election or Appointment: 2007 Vice President of International Real Estate. Mr. Buller also serves as Vice President of another fund advised by FMR. Prior to assuming his current responsibilities, Mr. Buller worked as a research analyst and a portfolio manager. Mr. Buller also serves as Vice President of FMR (2000) and FMR Co., Inc. (2001). |
Eric D. Roiter (58) |
| Year of Election or Appointment: 2004 Secretary of International Real Estate. He also serves as Secretary of other Fidelity funds; Vice President, General Counsel, and Secretary of FMR Co., Inc. (2001-present) and FMR; Assistant Secretary of Fidelity Management & Research (U.K.) Inc. (2001-present), Fidelity Research & Analysis Company (2001-present), and Fidelity Investments Money Management, Inc. (2001-present). Mr. Roiter is an Adjunct Member, Faculty of Law, at Boston College Law School (2003-present). Previously, Mr. Roiter served as Vice President and Secretary of Fidelity Distributors Corporation (FDC) (1998-2005). |
Scott C. Goebel (39) |
| Year of Election or Appointment: 2007 Assistant Secretary of International Real Estate. Mr. Goebel also serves as Assistant Secretary of other Fidelity funds (2007-present), Vice President and Secretary of FDC (2006-present), and is an employee of FMR. |
R. Stephen Ganis (41) |
| Year of Election or Appointment: 2006 Anti-Money Laundering (AML) officer of International Real Estate. Mr. Ganis also serves as AML officer of other Fidelity funds (2006-present) and FMR Corp. (2003-present). Before joining Fidelity Investments, Mr. Ganis practiced law at Goodwin Procter, LLP (2000-2002). |
Joseph B. Hollis (59) |
| Year of Election or Appointment: 2006 Chief Financial Officer of International Real Estate. Mr. Hollis also serves as Chief Financial Officer of other Fidelity funds. Mr. Hollis is President of Fidelity Pricing and Cash Management Services (FPCMS) (2005-present). Mr. Hollis also serves as President and Director of Fidelity Service Company, Inc. (2006-present). Previously, Mr. Hollis served as Senior Vice President of Cash Management Services (1999-2002) and Investment Management Operations (2002-2005). |
Kenneth A. Rathgeber (60) |
| Year of Election or Appointment: 2004 Chief Compliance Officer of International Real Estate. Mr. Rathgeber also serves as Chief Compliance Officer of other Fidelity funds (2004-present) and Executive Vice President of Risk Oversight for Fidelity Investments (2002-present). He is Chief Compliance Officer of FMR (2005-present), FMR Co., Inc. (2005-present), Fidelity Management & Research (U.K.) Inc. (2005-present), Fidelity Research & Analysis Company (2005-present), Fidelity Investments Money Management, Inc. (2005-present), and Strategic Advisers, Inc. (2005-present). Previously, Mr. Rathgeber served as Executive Vice President and Chief Operating Officer for Fidelity Investments Institutional Services Company, Inc. (1998-2002). |
Bryan A. Mehrmann (46) |
| Year of Election or Appointment: 2005 Deputy Treasurer of International Real Estate. Mr. Mehrmann also serves as Deputy Treasurer of other Fidelity funds (2005-present) and is an employee of FMR. Previously, Mr. Mehrmann served as Vice President of Fidelity Investments Institutional Services Group (FIIS)/Fidelity Investments Institutional Operations Corporation, Inc. (FIIOC) Client Services (1998-2004). |
Kenneth B. Robins (37) |
| Year of Election or Appointment: 2005 Deputy Treasurer of International Real Estate. Mr. Robins also serves as Deputy Treasurer of other Fidelity funds (2005-present) and is an employee of FMR (2004-present). Before joining Fidelity Investments, Mr. Robins worked at KPMG LLP, where he was a partner in KPMG's department of professional practice (2002-2004) and a Senior Manager (1999-2000). In addition, Mr. Robins served as Assistant Chief Accountant, United States Securities and Exchange Commission (2000-2002). |
Robert G. Byrnes (40) |
| Year of Election or Appointment: 2005 Assistant Treasurer of International Real Estate. Mr. Byrnes also serves as Assistant Treasurer of other Fidelity funds (2005-present) and is an employee of FMR (2005-present). Previously, Mr. Byrnes served as Vice President of FPCMS (2003-2005). Before joining Fidelity Investments, Mr. Byrnes worked at Deutsche Asset Management where he served as Vice President of the Investment Operations Group (2000-2003). |
Peter L. Lydecker (53) |
| Year of Election or Appointment: 2004 Assistant Treasurer of International Real Estate. Mr. Lydecker also serves as Assistant Treasurer of other Fidelity funds (2004) and is an employee of FMR. |
Gary W. Ryan (48) |
| Year of Election or Appointment: 2005 Assistant Treasurer of International Real Estate. Mr. Ryan also serves as Assistant Treasurer of other Fidelity funds (2005-present) and is an employee of FMR (2005-present). Previously, Mr. Ryan served as Vice President of Fund Reporting in FPCMS (1999-2005). |
Annual Report
Distributions
The Board of Trustees of Fidelity International Real Estate Fund voted to pay to shareholders of record at the opening of business on record date, the following distributions per share derived from capital gains realized from sales of portfolio securities, and dividends derived from net investment income:
| Pay Date | Record Date | Dividends | Capital Gains |
International
Real Estate | 09/10/2007 | 09/07/2007 | $.202 | $.780 |
The fund hereby designates as a capital gain dividend with respect to the taxable year ended July 31, 2007, $8,966,251, or, if subsequently determined to be different, the net capital gain of such year.
The fund designates 11% and 2% of the dividends distributed in September and December, respectively during the fiscal year as amounts which may be taken into account as a dividend for the purposes of the maximum rate under section 1(h)(11) of the Internal Revenue Code.
The amounts per share which represent income derived from sources within, and taxes paid to, foreign countries or possessions of the United States are as follows:
Pay Date | Income | Taxes |
09/11/06 | $0.160 | $0.0149 |
12/18/06 | $0.077 | $0.0051 |
The fund will notify shareholders in January 2008 of amounts for use in preparing 2007 income tax returns.
Annual Report
Board Approval of Investment Advisory Contracts and Management Fees
Fidelity International Real Estate Fund
Each year, typically in July, the Board of Trustees, including the Independent Trustees (together, the Board), votes on the renewal of the management contract and sub-advisory agreements (together, the Advisory Contracts) for the fund. The Board, assisted by the advice of fund counsel and Independent Trustees' counsel, requests and considers a broad range of information throughout the year.
The Board meets regularly each month except August and takes into account throughout the year matters bearing on Advisory Contracts. The Board, acting directly and through its separate committees, considers at each of its meetings factors that are relevant to the annual renewal of the fund's Advisory Contracts, including the services and support provided to the fund and its shareholders. At the time of the renewal, the Board had 12 standing committees, each composed of Independent Trustees with varying backgrounds, to which the Board has assigned specific subject matter responsibilities in order to enhance effective decision-making by the Board. Each committee has adopted a written charter outlining the structure and purposes of the committee. One such committee, the Equity Contract Committee, meets periodically as needed throughout the year to consider matters specifically related to the annual renewal of Advisory Contracts. The committee requests and receives information on, and makes recommendations to the Independent Trustees concerning, the approval and annual review of the Advisory Contracts.
At its July 2007 meeting, the Board of Trustees, including the Independent Trustees, unanimously determined to renew the Advisory Contracts for the fund. In reaching its determination, the Board considered all factors it believed relevant, including (i) the nature, extent, and quality of the services to be provided to the fund and its shareholders (including the investment performance of the fund); (ii) the competitiveness of the management fee and total expenses of the fund; (iii) the total costs of the services to be provided by and the profits to be realized by the investment adviser and its affiliates from the relationship with the fund; (iv) the extent to which economies of scale would be realized as the fund grows; and (v) whether fee levels reflect these economies of scale, if any, for the benefit of fund shareholders. The Board also approved amendments to the fund's agreements with foreign sub-advisers to clarify that each sub-adviser provides services as an independent contractor.
In determining whether to renew the Advisory Contracts for the fund, the Board ultimately reached a determination, with the assistance of fund counsel and Independent Trustees' counsel, that the renewal of the Advisory Contracts and the compensation to be received by Fidelity under the management contract is consistent with Fidelity's fiduciary duty under applicable law. In addition to evaluating the specific factors noted above, the Board, in reaching its determination, is aware that shareholders in the fund have a broad range of investment choices available to them, including a wide choice among mutual funds offered by competitors to Fidelity, and that the fund's shareholders, with the opportunity to review and weigh the disclosure provided by the fund in its prospectus and other public disclosures, have chosen to invest in this fund, managed by Fidelity.
Annual Report
Nature, Extent, and Quality of Services Provided. The Board considered staffing within the investment adviser, FMR, and the sub-advisers (together, the Investment Advisers), including the background of the fund's portfolio manager and the fund's investment objective and discipline. The Independent Trustees also had discussions with senior management of Fidelity's investment operations and investment groups. The Board considered the structure of the portfolio manager compensation program and whether this structure provides appropriate incentives.
Resources Dedicated to Investment Management and Support Services. The Board reviewed the size, education, and experience of the Investment Advisers' investment staff, their use of technology, and the Investment Advisers' approach to recruiting, training, and retaining portfolio managers and other research, advisory, and management personnel. The Board considered Fidelity's extensive global research capabilities that enable the Investment Advisers to aggregate data from various sources in an effort to produce positive investment results. The Board noted that Fidelity's analysts have access to a variety of technological tools that enable them to perform both fundamental and quantitative analysis and to specialize in various disciplines. The Board also considered that Fidelity's portfolio managers and analysts have access to daily portfolio attribution that allows for monitoring of a fund's portfolio, as well as an electronic communication system that provides immediate real-time access to research concerning issuers and credit enhancers.
Shareholder and Administrative Services. The Board considered (i) the nature, extent, quality, and cost of advisory, administrative, distribution, and shareholder services performed by the Investment Advisers and their affiliates under the Advisory Contracts and under separate agreements covering transfer agency, pricing and bookkeeping, and securities lending services for the fund; (ii) the nature and extent of the Investment Advisers' supervision of third party service providers, principally custodians and subcustodians; and (iii) the resources devoted to, and the record of compliance with, the fund's compliance policies and procedures. The Board reviewed the allocation of fund brokerage, including allocations to brokers affiliated with the Investment Advisers, the use of brokerage commissions to pay fund expenses, and the use of "soft" commission dollars to pay for research services. The Board also considered that Fidelity voluntarily pays for market data out of its own resources. The Board also considered the agreement reached between the Independent Trustees and Fidelity in December 2006 following an independent review of matters relating to receipt of travel, entertainment, gifts and gratuities in violation of Fidelity policies.
The Board noted that the growth of fund assets across the complex allows Fidelity to reinvest in the development of services designed to enhance the value or convenience of the Fidelity funds as investment vehicles. These services include 24-hour access to account information and market information through phone representatives and over the Internet, and investor education materials and asset allocation tools.
Annual Report
Board Approval of Investment Advisory Contracts and
Management Fees - continued
Investment in a Large Fund Family. The Board considered the benefits to shareholders of investing in a Fidelity fund, including the benefits of investing in a fund that is part of a large family of funds offering a variety of investment disciplines and providing for a large variety of mutual fund investor services. For example, fund shareholders are offered the privilege of exchanging shares of the fund for shares of other Fidelity funds, as set forth in the fund's prospectus, without paying a sales charge. The Board noted that, since the last Advisory Contract renewals in July 2006, Fidelity has taken a number of actions that benefited particular funds, including (i) dedicating additional resources to investment research and to restructure the investment research teams; (ii) contractually agreeing to reduce the management fee on Fidelity Advisor Floating Rate High Income Fund; (iii) contractually agreeing to reduce the management fees on Fidelity's California, Massachusetts, New Jersey, and New York AMT Tax-Free Money Market Funds, launching new Institutional Classes and Service Classes of these funds, and contractually agreeing to impose expense limitations on these funds; (iv) eliminating the exchange fee on the Fidelity Select Portfolios and reducing the pricing and bookkeeping fee rates for these funds; (v) reducing the maximum transfer agency fee rates on high income funds and certain equity funds; (vi) proposing amended management contracts that, if approved by shareholders, will add a performance adjustment component to the management fees paid by 18 Fidelity Advisor equity funds; (vii) contractually agreeing to reduce fees for Ultra-Short Central Fund and the money market Central Funds; (viii) waiving the Fidelity Advisor funds' contingent deferred sales charge on certain redemptions made through systematic withdrawal programs; and (ix) amending the management contracts for equity and fixed-income funds whose management contracts incorporate a "group fee" structure by adding four new fee "breakpoints" to the group fee rate schedules.
Investment Performance and Compliance. The Board considered whether the fund has operated within its investment objective, as well as its record of compliance with its investment restrictions. It also reviewed the fund's absolute investment performance, as well as the fund's relative investment performance measured against a broad-based securities market index. The Board noted that FMR does not believe that a meaningful peer group exists against which to compare the fund's performance. Because the fund had been in existence less than three calendar years, the following chart considered by the Board shows, for the one-year period ended December 31, 2006, the fund's total return and the total return of a broad-based securities market index ("benchmark"). (The fund did not offer Advisor classes as of December 31, 2006.)
Annual Report
Fidelity International Real Estate Fund
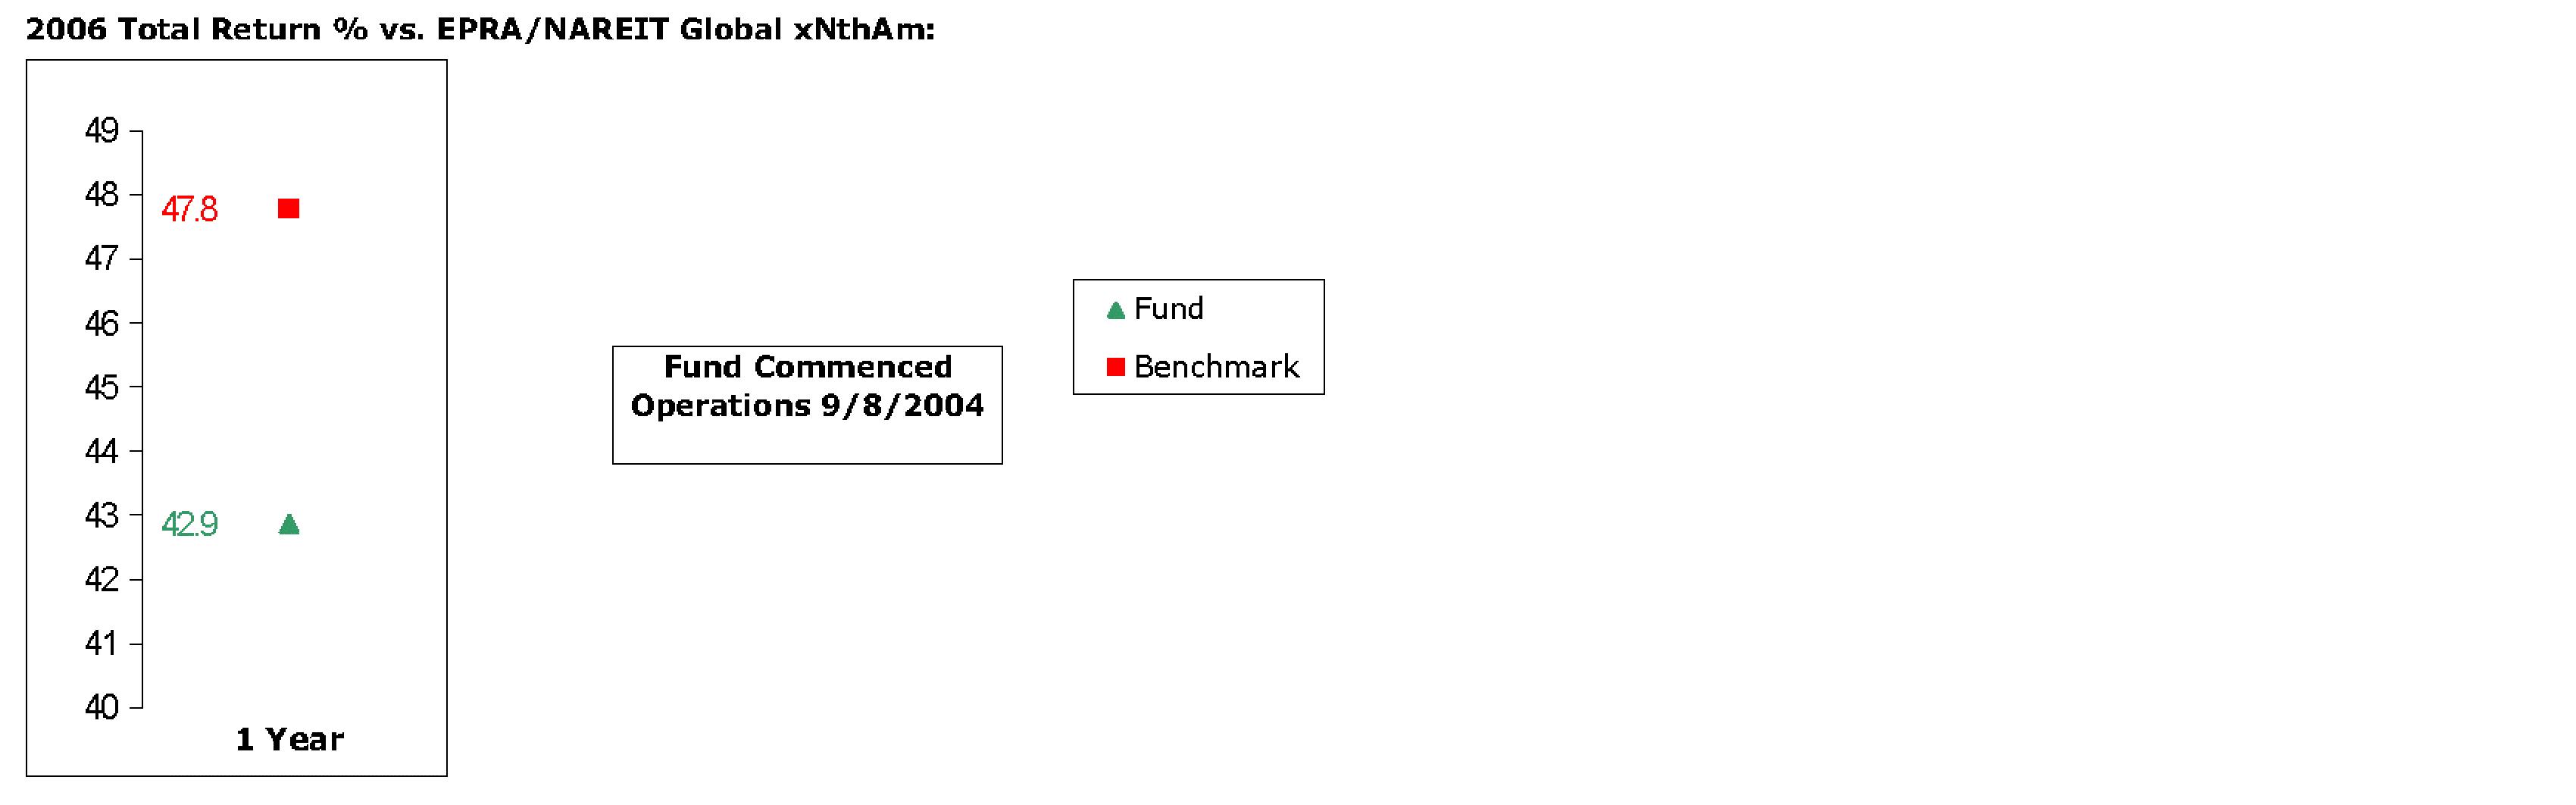
The Board stated that the relative investment performance of the fund was lower than its benchmark for the period shown. The Board stated that it is difficult to evaluate in any comprehensive fashion the performance of the fund, in light of its relatively recent commencement of operations.
The Board considered that FMR has taken steps to refocus and strengthen equity research, equity portfolio management, and compliance.
Based on its review, and giving particular weight to the nature and quality of the resources dedicated by the Investment Advisers to maintain and improve relative performance, the Board concluded that the nature, extent, and quality of the services provided to the fund will benefit the fund's shareholders, particularly in light of the Board's view that the fund's shareholders benefit from investing in a fund that is part of a large family of funds offering a variety of investment disciplines and services.
Competitiveness of Management Fee and Total Fund Expenses. The Board considered the fund's management fee and total expenses compared to "mapped groups" of competitive funds and classes. Fidelity creates "mapped groups" by combining similar Lipper investment objective categories that have comparable management fee characteristics. Combining Lipper investment objective categories aids the Board's management fee and total expense comparisons by broadening the competitive group used for comparison and by reducing the number of universes to which various Fidelity funds are compared. The Board also considered supplemental information about how the fund's management fee and total expenses ranked relative to groups based on Lipper classifications, which take into account a fund's market capitalization and style.
Annual Report
Board Approval of Investment Advisory Contracts and
Management Fees - continued
The Board considered two proprietary management fee comparisons for the 12-month (or shorter) periods shown in the chart below. The group of Lipper funds used by the Board for management fee comparisons is referred to below as the "Total Mapped Group." The Total Mapped Group comparison focuses on a fund's standing relative to the total universe of comparable funds available to investors, in terms of gross management fees before expense reimbursements or caps. "TMG %" represents the percentage of funds in the Total Mapped Group that had management fees that were lower than the fund's. For example, a TMG % of 30% means that 70% of the funds in the Total Mapped Group had higher management fees than the fund. The "Asset-Size Peer Group" (ASPG) comparison focuses on a fund's standing relative to non-Fidelity funds similar in size to the fund within the Total Mapped Group. The ASPG represents at least 15% of the funds in the Total Mapped Group with comparable asset size and management fee characteristics, subject to a minimum of 50 funds (or all funds in the Total Mapped Group if fewer than 50). Additional information, such as the ASPG quartile in which the fund's management fee ranked, is also included in the chart and considered by the Board.
Fidelity International Real Estate Fund

The Board noted that the fund's management fee ranked below the median of its Total Mapped Group and below the median of its ASPG for 2006.
Based on its review, the Board concluded that the fund's management fee was fair and reasonable in light of the services that the fund receives and the other factors considered.
In its review of the fund's total expenses, the Board considered the fund's management fee as well as other fund expenses, such as transfer agent fees, pricing and bookkeeping fees, and custodial, legal, and audit fees. The Board also noted the effects of any waivers and reimbursements on fees and expenses. As part of its review, the Board also considered current and historical total expenses of the fund compared to competitive fund median expenses. The fund is compared to those funds and classes in the Total Mapped Group (used by the Board for management fee comparisons) that have a similar sales load structure.
Annual Report
The Board noted that the fund's total expenses ranked below its competitive median for 2006.
In its review of total expenses, the Board also considered Fidelity fee structures and other information on clients that FMR and its affiliates service in other competitive markets, such as other mutual funds advised or subadvised by FMR or its affiliates, pension plan clients, and other institutional clients.
Based on its review, the Board concluded that the fund's total expenses were reasonable, although above the median of the universe presented for comparison, in light of the services that the fund and its shareholders receive and the other factors considered.
Costs of the Services and Profitability. The Board considered the revenues earned and the expenses incurred by Fidelity in conducting the business of developing, marketing, distributing, managing, administering and servicing the fund and its shareholders. The Board also considered the level of Fidelity's profits in respect of all the Fidelity funds.
On an annual basis, FMR presents to the Board Fidelity's profitability for the fund. Fidelity calculates the profitability for each fund, as well as aggregate profitability for groups of Fidelity funds and all Fidelity funds, using a series of detailed revenue and cost allocation methodologies which originate with the audited books and records of Fidelity. The Audit Committee of the Board reviews any significant changes from the prior year's methodologies.
PricewaterhouseCoopers LLP (PwC), independent registered public accounting firm and auditor to Fidelity and certain Fidelity funds, has been engaged annually by the Board as part of the Board's assessment of the results of Fidelity's profitability analysis. PwC's engagement includes the review and assessment of Fidelity's methodologies used in determining the revenues and expenses attributable to Fidelity's mutual fund business, and completion of agreed-upon procedures surrounding the mathematical accuracy of fund profitability and its conformity to allocation methodologies. After considering PwC's reports issued under the engagement and information provided by Fidelity, the Board believes that while other allocation methods may also be reasonable, Fidelity's profitability methodologies are reasonable in all material respects.
The Board has also reviewed Fidelity's non-fund businesses and any fall-out benefits related to the mutual fund business as well as cases where Fidelity's affiliates may benefit from or be related to the fund's business.
Annual Report
Board Approval of Investment Advisory Contracts and
Management Fees - continued
The Board considered the costs of the services provided by and the profits realized by Fidelity in connection with the operation of the fund and determined that the amount of profit is a fair entrepreneurial profit for the management of the fund.
Economies of Scale. The Board considered whether there have been economies of scale in respect of the management of the Fidelity funds, whether the Fidelity funds (including the fund) have appropriately benefited from any such economies of scale, and whether there is potential for realization of any further economies of scale. The Board considered the extent to which the fund will benefit from economies of scale through increased services to the fund, through waivers or reimbursements, or through fee or expense reductions, including reductions that occur through operation of the transfer agent agreement. The transfer agent fee varies in part based on the number of accounts in the fund. If the number of accounts decreases or the average account size increases, the overall transfer agent fee rate decreases.
The Board recognized that the fund's management contract incorporates a "group fee" structure, which provides for lower group fee rates as total fund assets under FMR's management increase, and for higher group fee rates as total fund assets under FMR's management decrease. FMR determines the group fee rates based on a tiered asset "breakpoint" schedule. In connection with the renewal of the fund's management contract, the Board approved amendments to the fund's management contract that added four new fee breakpoints to the group fee rate schedule for assets under FMR's management above $1,386 billion. The Board considered that the group fee rate declines under both the present and amended schedules, but that under the amended schedule, the group fee rate declines faster as assets under FMR's management exceed $1,386 billion. The Board considered that the group fee is designed to deliver the benefits of economies of scale to fund shareholders when total fund assets increase, even if assets of any particular fund are unchanged or have declined, because some portion of Fidelity's costs are attributable to services provided to all Fidelity funds, and all funds benefit if those costs can be allocated among more assets. The Board concluded that, given the group fee structure, fund shareholders will achieve a certain level of economies of scale as assets under FMR's management increase at the fund complex level, regardless of whether Fidelity achieves any such economies of scale.
The Board further concluded that any potential economies of scale are being shared between fund shareholders and Fidelity in an appropriate manner.
Additional Information Requested by the Board. In order to develop fully the factual basis for consideration of the Fidelity funds' Advisory Contracts, the Board requested and received additional information on several topics, including (i) fund performance trends and actions to be taken by FMR to improve certain funds' overall performance; (ii) Fidelity's portfolio manager compensation structure, including its effects on fund profitability and the extent to which portfolio manager compensation is linked to fund performance; (iii) Fidelity's fee structures; (iv) the funds' sub-advisory arrangements; and (v) accounts managed by Fidelity other than the Fidelity funds.
Annual Report
Based on its evaluation of all of the conclusions noted above, and after considering all material factors, the Board ultimately concluded that the advisory fee structures are fair and reasonable, and that the fund's Advisory Contracts should be renewed.
Annual Report
Managing Your Investments
Fidelity offers several ways to conveniently manage your personal investments via your telephone or PC. You can access your account information, conduct trades and research your investments 24 hours a day.
By Phone
Fidelity Automated Service Telephone provides a single toll-free number to access account balances, positions, quotes and trading. It's easy to navigate the service, and on your first call, the system will help you create a personal identification number (PIN) for security.
(phone_graphic)
Fidelity Automated
Service Telephone (FAST®)
1-800-544-5555
Press
1 For mutual fund and brokerage trading.
2 For quotes.*
3 For account balances and holdings.
4 To review orders and mutual
fund activity.
5 To change your PIN.
*0 To speak to a Fidelity representative.
By PC
Fidelity's web site on the Internet provides a wide range of information, including daily financial news, fund performance, interactive planning tools and news about Fidelity products and services.
(computer_graphic)
Fidelity's Web Site
www.fidelity.com
* When you call the quotes line, please remember that a fund's yield and return will vary and, except for money market funds, share price will also vary. This means that you may have a gain or loss when you sell your shares. There is no assurance that money market funds will be able to maintain a stable $1 share price; an investment in a money market fund is not insured or guaranteed by the U.S. government. Total returns are historical and include changes in share price, reinvestment of dividends and capital gains, and the effects of any sales charges.
Annual Report
To Write Fidelity
We'll give your correspondence immediate attention and send you written confirmation upon completion of your request.
(letter_graphic)
Making Changes
To Your Account
(such as changing name, address, bank, etc.)
Fidelity Investments
P.O. Box 770001
Cincinnati, OH 45277-0002
(letter_graphic)
For Non-Retirement
Accounts
Buying shares
Fidelity Investments
P.O. Box 770001
Cincinnati, OH 45277-0003
Overnight Express
Fidelity Investments
Attn: Distribution Services
100 Crosby Parkway - KC1H
Covington, KY 41015
Selling shares
Fidelity Investments
P.O. Box 770001
Cincinnati, OH 45277-0035
Overnight Express
Fidelity Investments
Attn: Distribution Services
100 Crosby Parkway - KC1H
Covington, KY 41015
General Correspondence
Fidelity Investments
P.O. Box 500
Merrimack, NH 03054-0500
(letter_graphic)
For Retirement
Accounts
Buying shares
Fidelity Investments
P.O. Box 770001
Cincinnati, OH 45277-0003
Selling shares
Fidelity Investments
P.O. Box 770001
Cincinnati, OH 45277-0035
Overnight Express
Fidelity Investments
Attn: Distribution Services
100 Crosby Parkway - KC1H
Covington, KY 41015
General Correspondence
Fidelity Investments
P.O. Box 500
Merrimack, NH 03054-0500
Annual Report
To Visit Fidelity
For directions and hours,
please call 1-800-544-9797.
Arizona
7001 West Ray Road
Chandler, AZ
15445 N. Scottsdale Road
Scottsdale, AZ
California
815 East Birch Street
Brea, CA
1411 Chapin Avenue
Burlingame, CA
851 East Hamilton Avenue
Campbell, CA
19200 Von Karman Avenue
Irvine, CA
601 Larkspur Landing Circle
Larkspur, CA
10100 Santa Monica Blvd.
Los Angeles, CA
27101 Puerta Real
Mission Viejo, CA
73-575 El Paseo
Palm Desert, CA
251 University Avenue
Palo Alto, CA
123 South Lake Avenue
Pasadena, CA
16995 Bernardo Ctr. Drive
Rancho Bernardo, CA
1220 Roseville Parkway
Roseville, CA
1740 Arden Way
Sacramento, CA
7676 Hazard Center Drive
San Diego, CA
11943 El Camino Real
San Diego, CA
8 Montgomery Street
San Francisco, CA
3793 State Street
Santa Barbara, CA
1200 Wilshire Boulevard
Santa Monica, CA
21701 Hawthorne Boulevard
Torrance, CA
2001 North Main Street
Walnut Creek, CA
6300 Canoga Avenue
Woodland Hills, CA
Colorado
1625 Broadway
Denver, CO
9185 Westview Road
Lone Tree, CO
Connecticut
48 West Putnam Avenue
Greenwich, CT
265 Church Street
New Haven, CT
300 Atlantic Street
Stamford, CT
29 South Main Street
West Hartford, CT
Delaware
400 Delaware Avenue
Wilmington, DE
Florida
4400 N. Federal Highway
Boca Raton, FL
121 Alhambra Plaza
Coral Gables, FL
2948 N. Federal Highway
Ft. Lauderdale, FL
4671 Town Center Parkway
Jacksonville, FL
1907 West State Road 434
Longwood, FL
8880 Tamiami Trail, North
Naples, FL
3501 PGA Boulevard
Palm Beach Gardens, FL
3550 Tamiami Trail, South
Sarasota, FL
1502 N. Westshore Blvd.
Tampa, FL
2465 State Road 7
Wellington, FL
Georgia
3445 Peachtree Road, N.E.
Atlanta, GA
1000 Abernathy Road
Atlanta, GA
Illinois
One North LaSalle Street
Chicago, IL
875 North Michigan Ave.
Chicago, IL
1415 West 22nd Street
Oak Brook, IL
1572 East Golf Road
Schaumburg, IL
3232 Lake Avenue
Wilmette, IL
Indiana
4729 East 82nd Street
Indianapolis, IN
Kansas
5400 College Boulevard
Overland Park, KS
Maine
Three Canal Plaza
Portland, ME
Maryland
7315 Wisconsin Avenue
Bethesda, MD
One W. Pennsylvania Ave.
Towson, MD
Massachusetts
801 Boylston Street
Boston, MA
155 Congress Street
Boston, MA
300 Granite Street
Braintree, MA
44 Mall Road
Burlington, MA
238 Main Street
Cambridge, MA
405 Cochituate Road
Framingham, MA
416 Belmont Street
Worcester, MA
Annual Report
Michigan
500 E. Eisenhower Pkwy.
Ann Arbor, MI
280 Old N. Woodward Ave.
Birmingham, MI
43420 Grand River Avenue
Novi, MI
29155 Northwestern Hwy.
Southfield, MI
Minnesota
7600 France Avenue South
Edina, MN
Missouri
1524 South Lindbergh Blvd.
St. Louis, MO
Nevada
2225 Village Walk Drive
Henderson, NV
New Jersey
150 Essex Street
Millburn, NJ
56 South Street
Morristown, NJ
396 Route 17, North
Paramus, NJ
3518 Route 1 North
Princeton, NJ
530 Broad Street
Shrewsbury, NJ
New York
1055 Franklin Avenue
Garden City, NY
37 West Jericho Turnpike
Huntington Station, NY
1271 Avenue of the Americas
New York, NY
980 Madison Avenue
New York, NY
61 Broadway
New York, NY
350 Park Avenue
New York, NY
200 Fifth Avenue
New York, NY
733 Third Avenue
New York, NY
11 Penn Plaza
New York, NY
2070 Broadway
New York, NY
1075 Northern Blvd.
Roslyn, NY
799 Central Park Avenue
Scarsdale, NY
North Carolina
4611 Sharon Road
Charlotte, NC
7011 Fayetteville Road
Durham, NC
Ohio
3805 Edwards Road
Cincinnati, OH
1324 Polaris Parkway
Columbus, OH
28699 Chagrin Boulevard
Woodmere Village, OH
Oregon
7493 SW Bridgeport Road
Tigard, OR
Pennsylvania
600 West DeKalb Pike
King of Prussia, PA
1735 Market Street
Philadelphia, PA
12001 Perry Highway
Wexford, PA
Rhode Island
47 Providence Place
Providence, RI
Tennessee
6150 Poplar Avenue
Memphis, TN
Texas
10000 Research Boulevard
Austin, TX
4001 Northwest Parkway
Dallas, TX
12532 Memorial Drive
Houston, TX
2701 Drexel Drive
Houston, TX
6560 Fannin Street
Houston, TX
6500 N. MacArthur Blvd.
Irving, TX
6005 West Park Boulevard
Plano, TX
14100 San Pedro
San Antonio, TX
1576 East Southlake Blvd.
Southlake, TX
19740 IH 45 North
Spring, TX
Utah
279 West South Temple
Salt Lake City, UT
Virginia
1861 International Drive
McLean, VA
Washington
411 108th Avenue, N.E.
Bellevue, WA
1518 6th Avenue
Seattle, WA
Washington, DC
1900 K Street, N.W.
Washington, DC
Wisconsin
595 North Barker Road
Brookfield, WI
Fidelity Brokerage Services, Inc., 100 Summer St., Boston, MA 02110 Member NYSE/SIPC
Annual Report
Investment Adviser
Fidelity Management & Research Company
Boston, MA
Investment Sub-Advisers
FMR Co., Inc.
Fidelity Research & Analysis Company
Fidelity Management & Research
(U.K.) Inc.
Fidelity Investments Japan Limited
Fidelity International Investment
Advisers
Fidelity International Investment
Advisers (U.K.) Limited
General Distributor
Fidelity Distributors Corporation
Boston, MA
Transfer and Service Agent
Fidelity Service Company, Inc.
Boston, MA
Custodian
Mellon Bank, N.A.
Pittsburgh, PA
The Fidelity Telephone Connection
Mutual Fund 24-Hour Service
Exchanges/Redemptions
and Account Assistance 1-800-544-6666
Product Information 1-800-544-6666
Retirement Accounts 1-800-544-4774
(8 a.m. - 9 p.m.)
TDD Service 1-800-544-0118
for the deaf and hearing impaired
(9 a.m. - 9 p.m. Eastern time)
Fidelity Automated Service
Telephone (FAST®) (automated graphic) 1-800-544-5555
(automated graphic) Automated line for quickest service
IRE-UANN-0907
1.801327.102
(Fidelity Investment logo)(registered trademark)
Corporate Headquarters
82 Devonshire St., Boston, MA 02109
www.fidelity.com
(Fidelity Investment logo)(registered trademark)
Fidelity Advisor
International Real Estate
Fund - Class A, Class T,
Class B, and Class C
Annual Report
July 31, 2007
Class A, Class T, Class B,
and Class C are classes
of Fidelity® International
Real Estate Fund
(2_fidelity_logos) (Registered_Trademark)
Contents
Chairman's Message | <Click Here> | Ned Johnson's message to shareholders. |
Performance | <Click Here> | How the fund has done over time. |
Management's Discussion | <Click Here> | The manager's review of fund performance, strategy and outlook. |
Shareholder Expense Example | <Click Here> | An example of shareholder expenses. |
Investment Changes | <Click Here> | A summary of major shifts in the fund's investments over the past six months. |
Investments | <Click Here> | A complete list of the fund's investments with their market values. |
Financial Statements | <Click Here> | Statements of assets and liabilities, operations, and changes in net assets,
as well as financial highlights. |
Notes | <Click Here> | Notes to the financial statements. |
Report of Independent Registered Public Accounting Firm | <Click Here> | |
Trustees and Officers | <Click Here> | |
Distributions | <Click Here> | |
Board Approval of Investment Advisory Contracts and Management Fees | <Click Here> | |
To view a fund's proxy voting guidelines and proxy voting record for the 12-month period ended June 30, visit http://www.fidelity.com (search for "proxy voting guidelines") or visit the Securities and Exchange Commission's (SEC) web site at http://www.sec.gov. You may also call 1-800-544-8544 to request a free copy of the proxy voting guidelines.
Standard & Poor's, S&P and S&P 500 are registered service marks of The McGraw-Hill Companies, Inc. and have been licensed for use by Fidelity Distributors Corporation.
Other third party marks appearing herein are the property of their respective owners.
All other marks appearing herein are registered or unregistered trademarks or service marks of FMR Corp. or an affiliated company.
Annual Report
This report and the financial statements contained herein are submitted for the general information of the shareholders of the fund. This report is not authorized for distribution to prospective investors in the fund unless preceded or accompanied by an effective prospectus.
A fund files its complete schedule of portfolio holdings with the SEC for the first and third quarters of each fiscal year on Form N-Q. Forms N-Q are available on the SEC's web site at http://www.sec.gov. A fund's Forms N-Q may be reviewed and copied at the SEC's Public Reference Room in Washington, DC. Information regarding the operation of the SEC's Public Reference Room may be obtained by calling 1-800-SEC-0330. For a complete list of a fund's portfolio holdings, view the most recent holdings listing, semiannual report, or annual report on Fidelity's web site at http://www.fidelity.com or http://www.advisor.fidelity.com, as applicable.
NOT FDIC INSURED · MAY LOSE VALUE · NO BANK GUARANTEE
Neither the fund nor Fidelity Distributors Corporation is a bank.
Annual Report
Chairman's Message
(photo_of_Edward_C_Johnson_3d)
Dear Shareholder:
Stocks are currently on pace to register their fifth straight year of positive returns, although gains could be trimmed if the U.S. economy continues to slow. While financial markets are always unpredictable, there are a number of time-tested principles that can put the historical odds in your favor.
One of the basic tenets is to invest for the long term. Over time, riding out the markets' inevitable ups and downs has proven much more effective than selling into panic or chasing the hottest trend. Even missing only a few of the markets' best days can significantly diminish investor returns. Patience also affords the benefits of compounding - of earning interest on additional income or reinvested dividends and capital gains. There are tax advantages and cost benefits to consider as well. The more you sell, the more taxes you pay, and the more you trade, the higher the costs. While staying the course doesn't eliminate risk, it can considerably lessen the effect of short-term declines.
You can further manage your investing risk through diversification. And today, more than ever, geographic diversification should be taken into account. Studies indicate that asset allocation is the single most important determinant of a portfolio's long-term success. The right mix of stocks, bonds and cash - aligned to your particular risk tolerance and investment objective - is very important. Age-appropriate rebalancing is also an essential aspect of asset allocation. For younger investors, an emphasis on equities - which historically have been the best-performing asset class over time - is encouraged. As investors near their specific goal, such as retirement or sending a child to college, consideration may be given to replacing volatile assets (e.g. common stocks) with more-stable fixed investments (bonds or savings plans).
A third investment principle - investing regularly - can help lower the average cost of your purchases. Investing a certain amount of money each month or quarter helps ensure you won't pay for all your shares at market highs. This strategy - known as dollar cost averaging - also reduces unconstructive "emotion" from investing, helping shareholders avoid selling weak performers just prior to an upswing, or chasing a hot performer just before a correction.
We invite you to contact us via the Internet, through our Investor Centers or over the phone. It is our privilege to provide you the information you need to make the investments that are right for you.
Sincerely,
/s/Edward C. Johnson 3d
Edward C. Johnson 3d
Annual Report
Fidelity Advisor International Real Estate Fund - Class A, T, B, and C
Performance: The Bottom Line
Average annual total return reflects the change in the value of an investment, assuming reinvestment of the class' dividend income and capital gains (the profits earned upon the sale of securities that have grown in value) and assuming a constant rate of performance each year. The $10,000 table and the fund's returns do not reflect the deduction of taxes that a shareholder would pay on fund distributions or the redemption of fund shares. During periods of reimbursement by Fidelity, a fund's total return will be greater than it would be had the reimbursement not occurred. How a fund did yesterday is no guarantee of how it will do tomorrow.
Average Annual Total Returns
Periods ended July 31, 2007 | Past 1
year | Life of
fund A |
Class A (incl. 5.75% sales charge) B | 12.02% | 21.11% |
Class T (incl. 3.50% sales charge) C | 14.62% | 22.08% |
Class B (incl. contingent deferred sales charge) D | 13.55% | 22.81% |
Class C (incl. contingent deferred sales charge) E | 17.55% | 23.51% |
A From September 8, 2004.
B Class A shares bear a 0.25% 12b-1 fee. The initial offering of Class A shares took place on April 4, 2007. Returns prior to April 4, 2007 are those of International Real Estate, the original retail class of the fund, which does not bear a 12b-1 fee. Had Class A shares' 12b-1 fee been reflected, returns prior to April 4, 2007 would have been lower.
C Class T shares bear a 0.50% 12b-1 fee. The initial offering of Class T shares took place on April 4, 2007. Returns prior to April 4, 2007 are those of International Real Estate, the original retail class of the fund, which does not bear a 12b-1 fee. Had Class T shares' 12b-1 fee been reflected, returns prior to April 4, 2007 would have been lower.
D Class B shares bear a 1.00% 12b-1 fee. The initial offering of Class B shares took place on April 4, 2007. Returns prior to April 4, 2007 are those of International Real Estate, the original retail class of the fund, which does not bear a 12b-1 fee. Had Class B shares' 12b-1 fee been reflected, returns prior to April 4, 2007 would have been lower. Class B shares' contingent deferred sales charges included in past one year and life of fund total return figures are 5% and 3%, respectively.
E Class C shares bear a 1.00% 12b-1 fee. The initial offering of Class C shares took place on April 4, 2007. Returns prior to April 4, 2007 are those of International Real Estate, the original retail class of the fund, which does not bear a 12b-1 fee. Had Class C shares' 12b-1 fee been reflected, returns prior to April 4, 2007 would have been lower. Class C shares' contingent deferred sales charges included in the past one year and life of fund total return figures are 1% and 0%, respectively.
Annual Report
$10,000 Over Life of Fund
Let's say hypothetically that $10,000 was invested in Fidelity Advisor International Real Estate Fund - Class T(dagger) on September 8, 2004, when the fund started, and the current 3.50% sales charge was paid. The chart shows how the value of your investment would have changed, and also shows how the Morgan Stanley Capital InternationalSM Europe, Australasia, Far East Index performed over the same period.
(dagger) Class T shares bear a 0.50% 12b-1 fee. The initial offering of Class T shares took place on April 4, 2007. Returns prior to April 4, 2007 are those of International Real Estate, the original class of the fund, which does not bear a 12b-1 fee. Had Class T shares' 12b-1 fee been reflected, returns prior to April 4, 2007 would have been lower.
Annual Report
Management's Discussion of Fund Performance
Comments from Steven Buller, Portfolio Manager of Fidelity Advisor International Real Estate Fund
The period ending July 31, 2007, began with real estate securities on the rise and ended with them in decline. Overall, international property stocks, as measured by the EPRA/NAREIT Global Real Estate ex North America Index, gained 25.95% during the past year - significantly better than the 0.55% decline in the U.S. real estate investment trust market, as measured by the Dow Jones Wilshire Real Estate Securities IndexSM. Despite global property markets' second-half correction, the fundamentals of commercial real estate companies actually remained quite good during the entire year, with increasing occupancy and rental rates present in a growing number of markets. Nevertheless, property stocks found themselves on a roller coaster ride. Much of the volatility was attributable to the flow of investment capital into and out of the real estate sector. During the period's second half, investors became increasingly concerned about losing money, which in turn triggered significant fund flows out of property stocks and declining valuations.
During the past year, the fund did well in absolute terms (excluding sales charges) but lagged the EPRA/NAREIT index and the broad international stock market - as measured by the Morgan Stanley Capital InternationalSM Europe, Australasia and Far East Index - which returned 24.10%. (For specific class-level performance results, please refer to the performance section of this report.) Weak security selection detracted versus the EPRA/NAREIT index. On a country basis, the worst drag came from disappointing stock picks in the United Kingdom. An overweighting in Germany also hurt. In contrast, positive stock selection in Hong Kong helped. On a sector basis, security selection among diversified property stocks and hotels was favorable, although those gains were outweighed by weak picks in offices and retail. A small allocation to cash also hurt. The fund's biggest individual negative was U.K.-based real estate company Capital & Regional, which lagged badly during the period's second half on worries about slowing retail sales. A couple of German property stocks, Patrizia Immobilien and IVG Immobilien, also hurt, as did an underweighting in strong-performing China Overseas Land & Investment. Conversely, Kerry Properties, a commercial and residential property company that does most of its business in Hong Kong and China, benefited from growth in those two markets. Also performing well was New World China Land, a Grand Cayman-listed commercial/residential developer focused on China.
The views expressed above reflect those of the portfolio manager(s) only through the end of the period as stated on the cover of this report and do not necessarily represent the views of Fidelity or any other person in the Fidelity organization. Any such views are subject to change at any time based upon market or other conditions and Fidelity disclaims any responsibility to update such views. These views may not be relied on as investment advice and, because investment decisions for a Fidelity fund are based on numerous factors, may not be relied on as an indication of trading intent on behalf of any Fidelity fund.
Annual Report
Shareholder Expense Example
As a shareholder of the Fund, you incur two types of costs: (1) transaction costs, including sales charges (loads) on purchase payments or redemption proceeds, redemption fees, and (2) ongoing costs, including management fees, distribution and/or service (12b-1) fees and other Fund expenses. This Example is intended to help you understand your ongoing costs (in dollars) of investing in the Fund and to compare these costs with the ongoing costs of investing in other mutual funds.
The actual example is based on an investment of $1,000 invested at the beginning of the period and held for the entire period (February 1, 2007 to July 31, 2007) for the International Real Estate class and for the entire period (April 4, 2007 to July 31, 2007) for Class A, Class T, Class B, Class C and Institutional Class. The hypothetical expense example is based on an investment of $1,000 for one-half year period (February 1, 2007 to July 31, 2007).
Actual Expenses
The first line of the accompanying table for each class of the Fund provides information about actual account values and actual expenses. You may use the information in this line, together with the amount you invested, to estimate the expenses that you paid over the period. Simply divide your account value by $1,000.00 (for example, an $8,600 account value divided by $1,000.00 = 8.6), then multiply the result by the number in the first line for a class of the Fund under the heading entitled "Expenses Paid During Period" to estimate the expenses you paid on your account during this period. A small balance maintenance fee of $12.00 that is charged once a year may apply for certain accounts with a value of less than $2,000. This fee is not included in the table below. If it was, the estimate of expenses you paid during the period would be higher, and your ending account value lower, by this amount. In addition, the Fund, as a shareholder in the underlying Fidelity Central Funds, will indirectly bear its pro rata share of the fees and expenses incurred by the underlying Fidelity Central Funds. These fees and expenses are not included in the Fund's annualized expense ratio used to calculate the expense estimate in the table below.
Hypothetical Example for Comparison Purposes
The second line of the accompanying table for each class of the Fund provides information about hypothetical account values and hypothetical expenses based on a Class' actual expense ratio and an assumed rate of return of 5% per year before expenses, which is not the Class' actual return. The hypothetical account values and expenses may not be used to estimate the actual ending account balance or expenses you paid for the period. You may use this information to compare the ongoing costs of investing in the Fund and other funds. To do so, compare this 5% hypothetical example with the 5% hypothetical examples that appear in the shareholder reports of the other funds. A small balance maintenance fee of $12.00 that is charged once a year may apply for certain accounts with a value of less than $2,000. This fee is not included in the table below. If it was, the estimate of expenses you paid during the period would be higher, and your ending account value lower, by this amount. In addition, the Fund, as a shareholder in the underlying Fidelity Central Funds, will indirectly bear its pro rata share of the fees and expenses incurred by the underlying Fidelity Central Funds. These fees and expenses are not included in the Fund's annualized expense ratio used to calculate the expense estimate in the table below.
Annual Report
Please note that the expenses shown in the table are meant to highlight your ongoing costs only and do not reflect any transaction costs. Therefore, the second line of the table is useful in comparing ongoing costs only, and will not help you determine the relative total costs of owning different funds. In addition, if these transactional costs were included, your costs would have been higher.
| Beginning
Account Value | Ending
Account Value
July 31, 2007 | Expenses Paid
During Period |
Class A | | | |
Actual | $ 1,000.00 | $ 947.00 | $ 4.35 B |
HypotheticalA | $ 1,000.00 | $ 1,018.00 | $ 6.85 C |
Class T | | | |
Actual | $ 1,000.00 | $ 946.40 | $ 5.11 B |
HypotheticalA | $ 1,000.00 | $ 1,016.81 | $ 8.05 C |
Class B | | | |
Actual | $ 1,000.00 | $ 944.50 | $ 6.69 B |
HypotheticalA | $ 1,000.00 | $ 1,014.33 | $ 10.54 C |
Class C | | | |
Actual | $ 1,000.00 | $ 944.50 | $ 6.66 B |
HypotheticalA | $ 1,000.00 | $ 1,014.38 | $ 10.49 C |
International Real Estate | | | |
Actual | $ 1,000.00 | $ 948.20 | $ 5.07 B |
HypotheticalA | $ 1,000.00 | $ 1,019.59 | $ 5.26 C |
Institutional Class | | | |
Actual | $ 1,000.00 | $ 948.20 | $ 3.43 B |
HypotheticalA | $ 1,000.00 | $ 1,019.44 | $ 5.41 C |
A 5% return per year before expenses
B Actual expenses are equal to each Class' annualized expense ratio (shown in the table below); multiplied by the average account value over the period, multiplied by 181/365 (to reflect the one-half year period) for the International Real Estate class and multiplied by 119/365 (to reflect the period April 4, 2007 to July 31, 2007) for Class A, Class T, Class B, Class C, and Institutional Class.
C Hypothetical expenses are equal to each Class' annualized expense ratio (shown in the table below); multiplied by the average account value over the period, multiplied by 181/365 (to reflect the one-half year period).
| Annualized
Expense Ratio |
Class A | 1.37% |
Class T | 1.61% |
Class B | 2.11% |
Class C | 2.10% |
International Real Estate | 1.05% |
Institutional Class | 1.08% |
Annual Report
Investment Changes
Top Ten Stocks as of July 31, 2007 |
| % of fund's
net assets | % of fund's net assets
6 months ago |
Mitsubishi Estate Co. Ltd. | 6.9 | 7.4 |
British Land Co. PLC | 5.8 | 4.8 |
Kerry Properties Ltd. | 4.9 | 4.4 |
IVG Immobilien AG | 4.5 | 2.6 |
Westfield Group unit | 4.0 | 6.4 |
The GPT Group unit | 3.9 | 3.7 |
Unibail-Rodamco | 3.6 | 0.0 |
Land Securities Group PLC | 3.5 | 4.9 |
CapitaLand Ltd. | 3.5 | 2.1 |
Cheung Kong Holdings Ltd. | 2.9 | 2.1 |
| 43.5 | |
Top Five Countries as of July 31, 2007 |
(excluding cash equivalents) | % of fund's
net assets | % of fund's net assets
6 months ago |
Australia | 21.0 | 19.9 |
Hong Kong | 17.6 | 12.0 |
Japan | 17.3 | 20.7 |
United Kingdom | 15.2 | 19.1 |
Germany | 6.6 | 6.5 |
Percentages are adjusted for the effect of open futures contracts, if applicable. |
Top Five REIT Sectors as of July 31, 2007 |
| % of fund's
net assets | % of fund's net assets
6 months ago |
REITs - Management/Investment | 34.6 | 35.6 |
REITs - Shopping Centers | 2.2 | 2.4 |
REITs - Apartments | 1.5 | 2.0 |
REITs - Office Buildings | 1.4 | 2.8 |
REITs - Industrial Buildings | 0.7 | 1.0 |
Asset Allocation (% of fund's net assets) |
As of July 31, 2007 * | As of January 31, 2007 ** |
| Stocks and
Investment
Companies 98.5% | | | Stocks and
Investment
Companies 97.8% | |
| Short-Term
Investments and
Net Other Assets 1.5% | | | Short-Term
Investments and
Net Other Assets 2.2% | |
* Foreign investments | 98.5% | | ** Foreign investments | 97.8% | |

Annual Report
Investments July 31, 2007
Showing Percentage of Net Assets
Common Stocks - 97.6% |
| Shares | | Value |
Australia - 21.0% |
Aspen Group unit | 6,320,625 | | $ 14,003,914 |
CFS Retail Property Trust | 10,309,000 | | 18,887,351 |
Charter Hall Group unit | 7,254,842 | | 17,557,487 |
DB RREEF Trust unit | 18,635,600 | | 28,822,793 |
FKP Property Group unit | 978,123 | | 5,817,882 |
Goodman Group unit | 5,374,309 | | 27,844,682 |
Stockland Corp. Ltd. unit | 2,741,000 | | 18,055,295 |
The GPT Group unit | 10,573,692 | | 40,636,776 |
Westfield Group: | | | |
unit | 2,566,400 | | 41,661,545 |
unit New | 442,269 | | 6,979,809 |
TOTAL AUSTRALIA | | 220,267,534 |
Austria - 0.9% |
Immoeast AG (a) | 686,100 | | 9,012,719 |
Brazil - 0.6% |
EZ Tec Empreendimentos & Participacoes SA | 644,600 | | 4,259,245 |
MRV Engenharia e Participacoes SA | 119,500 | | 1,959,744 |
TOTAL BRAZIL | | 6,218,989 |
Cayman Islands - 2.0% |
New World China Land Ltd. | 19,550,000 | | 20,568,955 |
Finland - 1.5% |
Citycon Oyj | 2,496,403 | | 16,020,820 |
France - 4.8% |
Fonciere Des Regions (d) | 81,000 | | 12,302,835 |
Unibail-Rodamco (d) | 158,517 | | 38,023,751 |
TOTAL FRANCE | | 50,326,586 |
Germany - 6.6% |
DIC Asset AG | 176,960 | | 5,581,401 |
IVG Immobilien AG | 1,277,000 | | 47,057,023 |
Patrizia Immobilien AG (d) | 1,042,000 | | 16,183,065 |
TOTAL GERMANY | | 68,821,489 |
Greece - 2.1% |
Babis Vovos International Technical SA | 692,830 | | 22,089,190 |
Hong Kong - 17.6% |
Cheung Kong Holdings Ltd. | 2,175,000 | | 30,520,220 |
China Overseas Land & Investment Ltd. | 4,260,000 | | 9,022,963 |
Hong Kong Land Holdings Ltd. | 6,779,000 | | 28,878,540 |
Hopson Development Holdings Ltd. | 2,106,000 | | 7,506,748 |
Common Stocks - continued |
| Shares | | Value |
Hong Kong - continued |
Hysan Development Co. Ltd. | 6,780,000 | | $ 17,471,415 |
Kerry Properties Ltd. | 7,185,911 | | 51,783,134 |
Link (REIT) | 7,114,000 | | 14,761,663 |
Sun Hung Kai Properties Ltd. | 1,895,000 | | 24,099,896 |
TOTAL HONG KONG | | 184,044,579 |
India - 0.2% |
Indiabulls Real Estate Ltd. sponsored GDR (a) | 203,855 | | 2,676,616 |
Japan - 17.3% |
Japan Logistics Fund, Inc. (d) | 836 | | 6,958,929 |
Japan Retail Fund Investment Corp. | 985 | | 7,957,667 |
Mitsubishi Estate Co. Ltd. | 2,833,000 | | 72,071,161 |
Mitsui Fudosan Co. Ltd. | 1,160,000 | | 30,287,120 |
Nippon Residential Investment Corp. | 2,957 | | 16,108,919 |
NTT Urban Development Co. | 12,305 | | 22,272,427 |
Sumitomo Realty & Development Co. Ltd. | 857,000 | | 25,463,558 |
TOTAL JAPAN | | 181,119,781 |
Philippines - 2.6% |
Ayala Land, Inc. | 36,233,760 | | 13,567,708 |
Filinvest Land, Inc. | 250,214,000 | | 10,581,738 |
Vista Land & Lifescapes, Inc. | 19,471,000 | | 2,701,923 |
TOTAL PHILIPPINES | | 26,851,369 |
Russia - 0.7% |
PIK Group GDR (a) | 263,600 | | 7,401,888 |
Singapore - 3.5% |
CapitaLand Ltd. | 7,325,900 | | 36,242,909 |
Spain - 1.0% |
Realia Business SA | 1,158,300 | | 10,127,893 |
United Kingdom - 15.2% |
British Land Co. PLC | 2,429,400 | | 61,343,084 |
Capital & Regional PLC | 1,296,500 | | 26,495,124 |
Derwent London PLC | 422,500 | | 14,324,468 |
Land Securities Group PLC | 1,060,500 | | 36,450,751 |
Savills PLC | 1,075,900 | | 11,463,384 |
Songbird Estates PLC Class B | 1,433,200 | | 7,162,050 |
Unite Group PLC | 320,000 | | 2,340,173 |
TOTAL UNITED KINGDOM | | 159,579,034 |
TOTAL COMMON STOCKS (Cost $968,263,629) | 1,021,370,351 |
Investment Companies - 0.9% |
| Shares | | Value |
Luxembourg - 0.9% |
ProLogis European Properties Fund
(Cost $11,897,123) | 594,000 | | $ 9,184,639 |
Money Market Funds - 4.0% |
| | | |
Fidelity Cash Central Fund, 5.38% (b) | 6,256,438 | | 6,256,438 |
Fidelity Securities Lending Cash Central Fund, 5.39% (b)(c) | 35,505,018 | | 35,505,018 |
TOTAL MONEY MARKET FUNDS (Cost $41,761,456) | 41,761,456 |
TOTAL INVESTMENT PORTFOLIO - 102.5% (Cost $1,021,922,208) | | 1,072,316,446 |
NET OTHER ASSETS - (2.5)% | | (26,429,430) |
NET ASSETS - 100% | $ 1,045,887,016 |
Legend |
(a) Non-income producing |
(b) Affiliated fund that is available only to investment companies and other accounts managed by Fidelity Investments. The rate quoted is the annualized seven-day yield of the fund at period end. A complete unaudited listing of the fund's holdings as of its most recent quarter end is available upon request. |
(c) Investment made with cash collateral received from securities on loan. |
(d) Security or a portion of the security is on loan at period end. |
Affiliated Central Funds |
Information regarding fiscal year to date income earned by the Fund from investments in Fidelity Central Funds is as follows: |
Fund | Income earned |
Fidelity Cash Central Fund | $ 1,495,848 |
Fidelity Securities Lending Cash Central Fund | 670,450 |
Total | $ 2,166,298 |
See accompanying notes which are an integral part of the financial statements.
Annual Report
Financial Statements
Statement of Assets and Liabilities
| July 31, 2007 |
Assets | | |
Investment in securities, at value (including securities loaned of $35,591,593) - See accompanying schedule: Unaffiliated issuers (cost $980,160,752) | $ 1,030,554,990 | |
Fidelity Central Funds (cost $41,761,456) | 41,761,456 | |
Total Investments (cost $1,021,922,208) | | $ 1,072,316,446 |
Foreign currency held at value (cost $156) | | 156 |
Receivable for investments sold | | 13,831,367 |
Receivable for fund shares sold | | 1,477,857 |
Dividends receivable | | 3,422,908 |
Distributions receivable from Fidelity Central Funds | | 101,758 |
Prepaid expenses | | 805 |
Other receivables | | 645,459 |
Total assets | | 1,091,796,756 |
| | |
Liabilities | | |
Payable for investments purchased | $ 2,728,217 | |
Payable for fund shares redeemed | 6,535,236 | |
Accrued management fee | 668,181 | |
Distribution fees payable | 4,979 | |
Other affiliated payables | 294,171 | |
Other payables and accrued expenses | 173,938 | |
Collateral on securities loaned, at value | 35,505,018 | |
Total liabilities | | 45,909,740 |
| | |
Net Assets | | $ 1,045,887,016 |
Net Assets consist of: | | |
Paid in capital | | $ 965,220,976 |
Undistributed net investment income | | 15,501,269 |
Accumulated undistributed net realized gain (loss) on investments and foreign currency transactions | | 14,696,166 |
Net unrealized appreciation (depreciation) on investments and assets and liabilities in foreign currencies | | 50,468,605 |
Net Assets | | $ 1,045,887,016 |
See accompanying notes which are an integral part of the financial statements.
Annual Report
Financial Statements - continued
Statement of Assets and Liabilities - continued
| July 31, 2007 |
Calculation of Maximum Offering Price Class A:
Net Asset Value and redemption price per share ($5,087,287 ÷ 323,851 shares) | | $ 15.71 |
| | |
Maximum offering price per share (100/94.25 of $15.71) | | $ 16.67 |
Class T:
Net Asset Value and redemption price per share ($2,397,650 ÷ 152,721 shares) | | $ 15.70 |
| | |
Maximum offering price per share (100/96.50 of $15.70) | | $ 16.27 |
Class B:
Net Asset Value and offering price per share ($1,157,900 ÷ 73,897 shares)A | | $ 15.67 |
| | |
Class C:
Net Asset Value and offering price per share ($2,629,333 ÷ 167,749 shares)A | | $ 15.67 |
| | |
International Real Estate:
Net Asset Value, offering price and redemption price per share ($1,032,138,075 ÷ 65,628,364 shares) | | $ 15.73 |
| | |
Institutional Class:
Net Asset Value, offering price and redemption price per share ($2,476,771 ÷ 157,488 shares) | | $ 15.73 |
A Redemption price per share is equal to net asset value less any applicable contingent deferred sales charge.
See accompanying notes which are an integral part of the financial statements.
Annual Report
Statement of Operations
| Year ended July 31, 2007 |
Investment Income | | |
Dividends | | $ 29,601,642 |
Interest | | 59,101 |
Income from Fidelity Central Funds | | 2,166,298 |
| | 31,827,041 |
Less foreign taxes withheld | | (2,955,827) |
Total income | | 28,871,214 |
| | |
Expenses | | |
Management fee | $ 7,329,886 | |
Transfer agent fees | 2,462,591 | |
Distribution fees | 12,863 | |
Accounting and security lending fees | 478,272 | |
Custodian fees and expenses | 341,426 | |
Independent trustees' compensation | 3,032 | |
Registration fees | 218,117 | |
Audit | 62,980 | |
Legal | 17,143 | |
Interest | 20,398 | |
Miscellaneous | 9,756 | |
Total expenses before reductions | 10,956,464 | |
Expense reductions | (1,145,752) | 9,810,712 |
Net investment income (loss) | | 19,060,502 |
Realized and Unrealized Gain (Loss) Net realized gain (loss) on: | | |
Investment securities: | | |
Unaffiliated issuers (net of foreign taxes of $14,337) | 65,495,797 | |
Foreign currency transactions | (26,616) | |
Total net realized gain (loss) | | 65,469,181 |
Change in net unrealized appreciation (depreciation) on: Investment securities | 11,346,926 | |
Assets and liabilities in foreign currencies | 24,358 | |
Total change in net unrealized appreciation (depreciation) | | 11,371,284 |
Net gain (loss) | | 76,840,465 |
Net increase (decrease) in net assets resulting from operations | | $ 95,900,967 |
See accompanying notes which are an integral part of the financial statements.
Annual Report
Financial Statements - continued
Statement of Changes in Net Assets
| Year ended
July 31,
2007 | Year ended
July 31,
2006 |
Increase (Decrease) in Net Assets | | |
Operations | | |
Net investment income (loss) | $ 19,060,502 | $ 6,265,391 |
Net realized gain (loss) | 65,469,181 | 18,392,807 |
Change in net unrealized appreciation (depreciation) | 11,371,284 | 28,618,723 |
Net increase (decrease) in net assets resulting
from operations | 95,900,967 | 53,276,921 |
Distributions to shareholders from net investment income | (8,677,416) | (3,273,462) |
Distributions to shareholders from net realized gain | (61,685,812) | (5,444,196) |
Total distributions | (70,363,228) | (8,717,658) |
Share transactions - net increase (decrease) | 571,194,492 | 242,030,836 |
Redemption fees | 1,300,956 | 283,977 |
Total increase (decrease) in net assets | 598,033,187 | 286,874,076 |
| | |
Net Assets | | |
Beginning of period | 447,853,829 | 160,979,753 |
End of period (including undistributed net investment income of $15,501,269 and undistributed net investment income of $5,544,851, respectively) | $ 1,045,887,016 | $ 447,853,829 |
See accompanying notes which are an integral part of the financial statements.
Annual Report
Financial Highlights - Class A
Year ended July 31, | 2007 I |
Selected Per-Share Data | |
Net asset value, beginning of period | $ 17.46 |
Income from Investment Operations | |
Net investment income (loss) E | .11 |
Net realized and unrealized gain (loss) | (1.87) H |
Total from investment operations | (1.76) |
Redemption fees added to paid in capital E | .01 |
Net asset value, end of period | $ 15.71 |
Total Return B, C, D | (10.02)% |
Ratios to Average Net Assets F, J | |
Expenses before reductions | 1.37% A |
Expenses net of fee waivers, if any | 1.37% A |
Expenses net of all reductions | 1.26% A |
Net investment income (loss) | 2.08% A |
Supplemental Data | |
Net assets, end of period (000 omitted) | $ 5,087 |
Portfolio turnover rate G | 144% |
A Annualized
B Total returns for periods of less than one year are not annualized.
C Total returns would have been lower had certain expenses not been reduced during the periods shown.
D Total returns do not include the effect of the sales charges.
E Calculated based on average shares outstanding during the period.
F Fees and expenses of the underlying Fidelity Central Funds are not included in the Fund's expense ratio. The Fund indirectly bears its proportionate share of the expenses of any underlying Fidelity Central Funds.
G Amount does not include the portfolio activity of any underlying Fidelity Central Funds.
H The amount shown for a share outstanding does not correspond with the aggregate net gain (loss) on investments for the period due to the timing of sales and repurchases of shares in relation to fluctuating market values of the investments of the Fund.
I For the period April 4, 2007 (commencement of sale of shares) to July 31, 2007.
J Expense ratios reflect operating expenses of the class. Expenses before reductions do not reflect amounts reimbursed by the investment adviser or reductions from brokerage service arrangements or other expense offset arrangements and do not represent the amount paid by the class during periods when reimbursements or reductions occur. Expenses net of fee waivers reflect expenses after reimbursement by the investment adviser but prior to reductions from brokerage service arrangements or other expense offset arrangements. Expenses net of all reductions represent the net expenses paid by the class.
See accompanying notes which are an integral part of the financial statements.
Annual Report
Financial Highlights - Class T
Year ended July 31, | 2007 I |
Selected Per-Share Data | |
Net asset value, beginning of period | $ 17.46 |
Income from Investment Operations | |
Net investment income (loss) E | .10 |
Net realized and unrealized gain (loss) | (1.87) H |
Total from investment operations | (1.77) |
Redemption fees added to paid in capital E | .01 |
Net asset value, end of period | $ 15.70 |
Total Return B, C, D | (10.08)% |
Ratios to Average Net Assets F, J | |
Expenses before reductions | 1.61% A |
Expenses net of fee waivers, if any | 1.61% A |
Expenses net of all reductions | 1.51% A |
Net investment income (loss) | 1.90% A |
Supplemental Data | |
Net assets, end of period (000 omitted) | $ 2,398 |
Portfolio turnover rate G | 144% |
A Annualized
B Total returns for periods of less than one year are not annualized.
C Total returns would have been lower had certain expenses not been reduced during the periods shown.
D Total returns do not include the effect of the sales charges.
E Calculated based on average shares outstanding during the period.
F Fees and expenses of the underlying Fidelity Central Funds are not included in the Fund's expense ratio. The Fund indirectly bears its proportionate share of the expenses of any underlying Fidelity Central Funds.
G Amount does not include the portfolio activity of any underlying Fidelity Central Funds.
H The amount shown for a share outstanding does not correspond with the aggregate net gain (loss) on investments for the period due to the timing of sales and repurchases of shares in relation to fluctuating market values of the investments of the Fund.
I For the period April 4, 2007 (commencement of sale of shares) to July 31, 2007.
J Expense ratios reflect operating expenses of the class. Expenses before reductions do not reflect amounts reimbursed by the investment adviser or reductions from brokerage service arrangements or other expense offset arrangements and do not represent the amount paid by the class during periods when reimbursements or reductions occur. Expenses net of fee waivers reflect expenses after reimbursement by the investment adviser but prior to reductions from brokerage service arrangements or other expense offset arrangements. Expenses net of all reductions represent the net expenses paid by the class.
See accompanying notes which are an integral part of the financial statements.
Annual Report
Financial Highlights - Class B
Year ended July 31, | 2007 I |
Selected Per-Share Data | |
Net asset value, beginning of period | $ 17.46 |
Income from Investment Operations | |
Net investment income (loss) E | .07 |
Net realized and unrealized gain (loss) | (1.87) H |
Total from investment operations | (1.80) |
Redemption fees added to paid in capital E | .01 |
Net asset value, end of period | $ 15.67 |
Total Return B, C, D | (10.25)% |
Ratios to Average Net Assets F, J | |
Expenses before reductions | 2.11% A |
Expenses net of fee waivers, if any | 2.11% A |
Expenses net of all reductions | 2.01% A |
Net investment income (loss) | 1.38% A |
Supplemental Data | |
Net assets, end of period (000 omitted) | $ 1,158 |
Portfolio turnover rate G | 144% |
A Annualized
B Total returns for periods of less than one year are not annualized.
C Total returns would have been lower had certain expenses not been reduced during the periods shown.
D Total returns do not include the effect of the contingent deferred sales charge.
E Calculated based on average shares outstanding during the period.
F Fees and expenses of the underlying Fidelity Central Funds are not included in the Fund's expense ratio. The Fund indirectly bears its proportionate share of the expenses of any underlying Fidelity Central Funds.
G Amount does not include the portfolio activity of any underlying Fidelity Central Funds.
H The amount shown for a share outstanding does not correspond with the aggregate net gain (loss) on investments for the period due to the timing of sales and repurchases of shares in relation to fluctuating market values of the investments of the Fund.
I For the period April 4, 2007 (commencement of sale of shares) to July 31, 2007.
J Expense ratios reflect operating expenses of the class. Expenses before reductions do not reflect amounts reimbursed by the investment adviser or reductions from brokerage service arrangements or other expense offset arrangements and do not represent the amount paid by the class during periods when reimbursements or reductions occur. Expenses net of fee waivers reflect expenses after reimbursement by the investment adviser but prior to reductions from brokerage service arrangements or other expense offset arrangements. Expenses net of all reductions represent the net expenses paid by the class.
See accompanying notes which are an integral part of the financial statements.
Annual Report
Financial Highlights - Class C
Year ended July 31, | 2007 I |
Selected Per-Share Data | |
Net asset value, beginning of period | $ 17.46 |
Income from Investment Operations | |
Net investment income (loss) E | .07 |
Net realized and unrealized gain (loss) | (1.87) H |
Total from investment operations | (1.80) |
Redemption fees added to paid in capital E | .01 |
Net asset value, end of period | $ 15.67 |
Total Return B, C, D | (10.25)% |
Ratios to Average Net Assets F, J | |
Expenses before reductions | 2.10% A |
Expenses net of fee waivers, if any | 2.10% A |
Expenses net of all reductions | 2.00% A |
Net investment income (loss) | 1.35% A |
Supplemental Data | |
Net assets, end of period (000 omitted) | $ 2,629 |
Portfolio turnover rate G | 144% |
A Annualized
B Total returns for periods of less than one year are not annualized.
C Total returns would have been lower had certain expenses not been reduced during the periods shown.
D Total returns do not include the effect of the contingent deferred sales charge.
E Calculated based on average shares outstanding during the period.
F Fees and expenses of the underlying Fidelity Central Funds are not included in the Fund's expense ratio. The Fund indirectly bears its proportionate share of the expenses of any underlying Fidelity Central Funds.
G Amount does not include the portfolio activity of any underlying Fidelity Central Funds.
H The amount shown for a share outstanding does not correspond with the aggregate net gain (loss) on investments for the period due to the timing of sales and repurchases of shares in relation to fluctuating market values of the investments of the Fund.
I For the period April 4, 2007 (commencement of sale of shares) to July 31, 2007.
J Expense ratios reflect operating expenses of the class. Expenses before reductions do not reflect amounts reimbursed by the investment adviser or reductions from brokerage service arrangements or other expense offset arrangements and do not represent the amount paid by the class during periods when reimbursements or reductions occur. Expenses net of fee waivers reflect expenses after reimbursement by the investment adviser but prior to reductions from brokerage service arrangements or other expense offset arrangements. Expenses net of all reductions represent the net expenses paid by the class.
See accompanying notes which are an integral part of the financial statements.
Annual Report
Financial Highlights - International Real Estate
Years ended July 31, | 2007 | 2006 | 2005 G |
Selected Per-Share Data | | | |
Net asset value, beginning of period | $ 14.69 | $ 12.09 | $ 10.00 |
Income from Investment Operations | | | |
Net investment income (loss) D | .31 | .30 | .23 |
Net realized and unrealized gain (loss) | 2.35 | 2.93 | 1.91 |
Total from investment operations | 2.66 | 3.23 | 2.14 |
Distributions from net investment income | (.22) | (.24) | (.03) |
Distributions from net realized gain | (1.42) | (.40) | (.03) |
Total distributions | (1.64) | (.64) | (.06) |
Redemption fees added to paid in capital D | .02 | .01 | .01 |
Net asset value, end of period | $ 15.73 | $ 14.69 | $ 12.09 |
Total Return B, C | 19.01% | 27.85% | 21.53% |
Ratios to Average Net Assets E, H | | | |
Expenses before reductions | 1.07% | 1.12% | 1.29% A |
Expenses net of fee waivers, if any | 1.06% | 1.12% | 1.29% A |
Expenses net of all reductions | .96% | .91% | 1.27% A |
Net investment income (loss) | 1.86% | 2.23% | 2.21% A |
Supplemental Data | | | |
Net assets, end of period (000 omitted) | $ 1,032,138 | $ 447,854 | $ 160,980 |
Portfolio turnover rate F | 144% | 234% | 36% A |
A Annualized
B Total returns for periods of less than one year are not annualized.
C Total returns would have been lower had certain expenses not been reduced during the periods shown.
D Calculated based on average shares outstanding during the period.
E Fees and expenses of the underlying Fidelity Central Funds are not included in the Fund's expense ratio. The Fund indirectly bears its proportionate share of the expenses of any underlying Fidelity Central Funds.
F Amount does not include the portfolio activity of any underlying Fidelity Central Funds.
G For the period September 8, 2004 (commencement of operations) to July 31, 2005.
H Expense ratios reflect operating expenses of the class. Expenses before reductions do not reflect amounts reimbursed by the investment adviser or reductions from brokerage service arrangements or other expense offset arrangements and do not represent the amount paid by the class during periods when reimbursements or reductions occur. Expenses net of fee waivers reflect expenses after reimbursement by the investment adviser but prior to reductions from brokerage service arrangements or other expense offset arrangements. Expenses net of all reductions represent the net expenses paid by the class.
See accompanying notes which are an integral part of the financial statements.
Annual Report
Financial Highlights - Institutional Class
Year ended July 31, | 2007 H |
Selected Per-Share Data | |
Net asset value, beginning of period | $ 17.46 |
Income from Investment Operations | |
Net investment income (loss) D | .12 |
Net realized and unrealized gain (loss) | (1.86) G |
Total from investment operations | (1.74) |
Redemption fees added to paid in capital D | .01 |
Net asset value, end of period | $ 15.73 |
Total Return B, C | (9.91)% |
Ratios to Average Net Assets E, I | |
Expenses before reductions | 1.08% A |
Expenses net of fee waivers, if any | 1.08% A |
Expenses net of all reductions | .97% A |
Net investment income (loss) | 2.27% A |
Supplemental Data | |
Net assets, end of period (000 omitted) | $ 2,477 |
Portfolio turnover rate F | 144% |
A Annualized
B Total returns for periods of less than one year are not annualized.
C Total returns would have been lower had certain expenses not been reduced during the periods shown.
D Calculated based on average shares outstanding during the period.
E Fees and expenses of the underlying Fidelity Central Funds are not included in the Fund's expense ratio. The Fund indirectly bears its proportionate share of the expenses of any underlying Fidelity Central Funds.
F Amount does not include the portfolio activity of any underlying Fidelity Central Funds.
G The amount shown for a share outstanding does not correspond with the aggregate net gain (loss) on investments for the period due to the timing of sales and repurchases of shares in relation to fluctuating market values of the investments of the Fund.
H For the period April 4, 2007 (commencement of sale of shares) to July 31, 2007.
I Expense ratios reflect operating expenses of the class. Expenses before reductions do not reflect amounts reimbursed by the investment adviser or reductions from brokerage service arrangements or other expense offset arrangements and do not represent the amount paid by the class during periods when reimbursements or reductions occur. Expenses net of fee waivers reflect expenses after reimbursement by the investment adviser but prior to reductions from brokerage service arrangements or other expense offset arrangements. Expenses net of all reductions represent the net expenses paid by the class.
See accompanying notes which are an integral part of the financial statements.
Annual Report
Notes to Financial Statements
For the period ended July 31, 2007
1. Organization.
Fidelity International Real Estate Fund (the Fund) is a non-diversified fund of Fidelity Securities Fund (the trust) and is authorized to issue an unlimited number of shares. The trust is registered under the Investment Company Act of 1940, as amended (the 1940 Act), as an open-end management investment company organized as a Massachusetts business trust. The Fund offers Class A, Class T, Class B, Class C, International Real Estate, and Institutional Class shares, each of which has equal rights as to assets and voting privileges. Each class has exclusive voting rights with respect to matters that affect that class. The Fund commenced sale of Class A, Class T, Class B, Class C and Institutional Class shares and the existing class was designated International Real Estate on April 4, 2007. Class B shares will automatically convert to Class A shares after a holding period of seven years from the initial date of purchase. Investment income, realized and unrealized capital gains and losses, the common expenses of the Fund, and certain fund-level expense reductions, if any, are allocated on a pro rata basis to each class based on the relative net assets of each class to the total net assets of the Fund. Each class differs with respect to transfer agent and distribution and service plan fees incurred. Certain expense reductions also differ by class. The Fund's investments in emerging markets can be subject to social, economic, regulatory, and political uncertainties and can be extremely volatile.
2. Investments in Fidelity Central Funds.
The Fund may invest in Fidelity Central Funds which are open-end investment companies available only to other investment companies and accounts managed by Fidelity Management & Research Company (FMR) and its affiliates. The Fund's Schedule of Investments lists each of the Fidelity Central Funds as an investment of the Fund, but does not include the underlying holdings of each Fidelity Central Fund. As an Investing Fund, the Fund indirectly bears its proportionate share of the expenses of the underlying Fidelity Central Funds.
The Money Market Central Funds seek preservation of capital and current income and are managed by Fidelity Investments Money Management, Inc. (FIMM), an affiliate of FMR.
A complete list of holdings for each Fidelity Central Fund is available upon request or at the SEC's web site at www.sec.gov. In addition, the financial statements of the Fidelity Central Funds, which are not covered by the Fund's Report of Independent Registered Public Accounting Firm, are available on the SEC's web site or upon request.
3. Significant Accounting Policies.
The financial statements have been prepared in conformity with accounting principles generally accepted in the United States of America, which require management to make certain estimates and assumptions at the date of the financial statements. The following summarizes the significant accounting policies of the Fund:
Annual Report
Notes to Financial Statements - continued
3. Significant Accounting Policies - continued
Security Valuation. Investments are valued and net asset value (NAV) per share is calculated (NAV calculation) as of the close of business of the New York Stock Exchange (NYSE), normally 4:00 p.m. Eastern time. Wherever possible, the Fund uses independent pricing services approved by the Board of Trustees to value its investments.
Equity securities, including restricted securities, for which market quotations are readily available, are valued at the last reported sale price or official closing price as reported by an independent pricing service on the primary market or exchange on which they are traded. In the event there were no sales during the day or closing prices are not available, securities are valued at the last quoted bid price. Investments in open-end mutual funds, including the Fidelity Central Funds, are valued at their closing net asset value each business day. Short-term securities with remaining maturities of sixty days or less for which quotations are not readily available are valued at amortized cost, which approximates value.
When current market prices or quotations are not readily available or do not accurately reflect fair value, valuations may be determined in accordance with procedures adopted by the Board of Trustees. For example, when developments occur between the close of a market and the close of the NYSE that may materially affect the value of some or all of the securities, or when trading in a security is halted, those securities may be fair valued. Factors used in the determination of fair value may include monitoring news to identify significant market or security specific events such as changes in the value of U.S. securities markets, reviewing developments in foreign markets and evaluating the performance of ADRs, futures contracts and exchange-traded funds. Because the Fund's utilization of fair value pricing depends on market activity, the frequency with which fair value pricing is used cannot be predicted and may be utilized to a significant extent. The value of securities used for NAV calculation under fair value pricing may differ from published prices for the same securities.
Foreign Currency. The Fund uses foreign currency contracts to facilitate transactions in foreign-denominated securities. Losses from these transactions may arise from changes in the value of the foreign currency or if the counterparties do not perform under the contracts' terms.
Foreign-denominated assets, including investment securities, and liabilities are translated into U.S. dollars at the exchange rate at period end. Purchases and sales of investment securities, income and dividends received and expenses denominated in foreign currencies are translated into U.S. dollars at the exchange rate in effect on the transaction date.
The effects of exchange rate fluctuations on investments are included with the net realized and unrealized gain (loss) on investment securities. Other foreign currency transactions resulting in realized and unrealized gain (loss) are disclosed separately.
Annual Report
3. Significant Accounting Policies - continued
Investment Transactions and Income. For financial reporting purposes, the Fund's investment holdings and NAV include trades executed through the end of the last business day of the period. The NAV for processing shareholder transactions includes trades executed through the end of the prior business day. Gains and losses on securities sold are determined on the basis of identified cost. Dividend income is recorded on the ex-dividend date, except for certain dividends from foreign securities where the ex-dividend date may have passed, which are recorded as soon as the Fund is informed of the ex-dividend date. Non-cash dividends included in dividend income, if any, are recorded at the fair market value of the securities received. Distributions received on securities that represent a return of capital or capital gain are recorded as a reduction of cost of investments and/or as a realized gain. The Fund estimates the components of distributions received that may be considered return of capital distributions or capital gain distributions. Interest income and distributions from the Fidelity Central Funds are accrued as earned. Interest income includes coupon interest and amortization of premium and accretion of discount on debt securities. Investment income is recorded net of foreign taxes withheld where recovery of such taxes is uncertain.
Expenses. Most expenses of the trust can be directly attributed to a fund. Expenses which cannot be directly attributed are apportioned among each Fund in the trust. Expense estimates are accrued in the period to which they relate and adjustments are made when actual amounts are known.
Income Tax Information and Distributions to Shareholders. Each year, the Fund intends to qualify as a regulated investment company by distributing all of its taxable income and realized gains under Subchapter M of the Internal Revenue Code. As a result, no provision for income taxes is required in the accompanying financial statements. Foreign taxes are provided for based on the Fund's understanding of the tax rules and rates that exist in the foreign markets in which it invests.
Distributions are recorded on the ex-dividend date. Income dividends and capital gain distributions are declared separately for each class. Income and capital gain distributions are determined in accordance with income tax regulations, which may differ from generally accepted accounting principles. In addition, the Fund will claim a portion of the payment made to redeeming shareholders as a distribution for income tax purposes.
Capital accounts within the financial statements are adjusted for permanent book-tax differences. These adjustments have no impact on net assets or the results of operations. Temporary book-tax differences will reverse in a subsequent period.
Book-tax differences are primarily due to foreign currency transactions, certain foreign taxes, passive foreign investment companies (PFIC), and losses deferred due to wash sales.
Annual Report
Notes to Financial Statements - continued
3. Significant Accounting Policies - continued
Income Tax Information and Distributions to Shareholders - continued
The tax-basis components of distributable earnings and the federal tax cost as of period end were as follows:
Unrealized appreciation | $ 94,707,335 |
Unrealized depreciation | (87,911,618) |
Net unrealized appreciation (depreciation) | 6,795,717 |
Undistributed ordinary income | 54,277,494 |
Undistributed long-term capital gain | 4,675,655 |
| |
Cost for federal income tax purposes | $ 1,065,520,729 |
The tax character of distributions paid was as follows:
| July 31, 2007 | July 31, 2006 |
Ordinary Income | $ 58,738,310 | $ 8,431,124 |
Long-term Capital Gains | 11,624,918 | 286,534 |
Total | $ 70,363,228 | $ 8,717,658 |
Short-Term Trading (Redemption) Fees. Shares held in the Fund less than 90 days are subject to a redemption fee equal to 1.50% of the proceeds of the redeemed shares. All redemption fees, including any estimated redemption fees paid by FMR, are retained by the Fund and accounted for as an addition to paid in capital.
New Accounting Pronouncements. In July 2006, Financial Accounting Standards Board Interpretation No. 48, Accounting for Uncertainty in Income Taxes - an interpretation of FASB Statement 109 (FIN 48), was issued and is effective on the last business day of the semiannual reporting period for fiscal years beginning after December 15, 2006. FIN 48 sets forth a threshold for financial statement recognition, measurement and disclosure of a tax position taken or expected to be taken on a tax return. Management has concluded that the adoption of FIN 48 will not result in a material impact on the Fund's net assets, results of operations and financial statement disclosures.
In addition, in September 2006, Statement of Financial Accounting Standards No. 157, Fair Value Measurements (SFAS 157), was issued and is effective for fiscal years beginning after November 15, 2007. SFAS 157 defines fair value, establishes a framework for measuring fair value and expands disclosures about fair value measurements. Management is currently evaluating the impact the adoption of SFAS 157 will have on the Fund's financial statement disclosures.
Annual Report
4. Operating Policies.
Repurchase Agreements. FMR has received an Exemptive Order from the Securities and Exchange Commission (the SEC) which permits the Fund and other affiliated entities of FMR to transfer uninvested cash balances into joint trading accounts which are then invested in repurchase agreements. The Fund may also invest directly with institutions in repurchase agreements. Repurchase agreements are collateralized by government or non-government securities. Upon settlement date, collateral is held in segregated accounts with custodian banks and may be obtained in the event of a default of the counterparty. The Fund monitors, on a daily basis, the value of the collateral to ensure it is at least equal to the principal amount of the repurchase agreement (including accrued interest). In the event of a default by the counterparty, realization of the collateral proceeds could be delayed, during which time the value of the collateral may decline.
5. Purchases and Sales of Investments.
Purchases and sales of securities, other than short-term securities, aggregated $1,940,342,064 and $1,414,287,899, respectively.
6. Fees and Other Transactions with Affiliates.
Management Fee. FMR and its affiliates provide the Fund with investment management related services for which the Fund pays a monthly management fee. The management fee is the sum of an individual fund fee rate that is based on an annual rate of .45% of the Fund's average net assets and a group fee rate that averaged .26% during the period. The group fee rate is based upon the average net assets of all the mutual funds advised by FMR. The group fee rate decreases as assets under management increase and increases as assets under management decrease. For the period, the total annual management fee rate was .71% of the Fund's average net assets.
Distribution and Service Plan. In accordance with Rule 12b-1 of the 1940 Act, the Fund has adopted separate Distribution and Service Plans for each class of shares. Certain classes pay Fidelity Distributors Corporation (FDC), an affiliate of FMR, separate Distribution and Service Fees, each of which is based on an annual percentage of each class' average net assets. In addition, FDC may pay financial intermediaries for selling shares of the Fund and providing shareholder support services. For the period, the Distribution and Service Fee rates and the total amounts paid to and retained by FDC were as follows:
| Distribution
Fee | Service
Fee | Paid to
FDC | Retained
by FDC |
Class A | 0% | .25% | $ 2,571 | $ 377 |
Class T | .25% | .25% | 2,562 | 1,280 |
Class B | .75% | .25% | 2,468 | 1,922 |
Class C | .75% | .25% | 5,262 | 4,263 |
| | | $ 12,863 | $ 7,842 |
Annual Report
Notes to Financial Statements - continued
6. Fees and Other Transactions with Affiliates - continued
Sales Load. FDC receives a front-end sales charge of up to 5.75% for selling Class A shares, and 3.50% for selling Class T shares, some of which is paid to financial intermediaries for selling shares of the Fund. FDC receives the proceeds of contingent deferred sales charges levied on Class A, Class T, Class B, and Class C redemptions. These charges depend on the holding period. The deferred sales charges range from 5% to 1% for Class B, 1% for Class C, 1.00% to .50% for certain purchases of Class A shares and .25% for certain purchases of Class T shares.
For the period, sales charge amounts retained by FDC were as follows:
| Retained
by FDC |
Class A | $ 17,963 |
Class T | 4,269 |
Class C* | 29 |
| $ 22,261 |
* When Class C shares are initially sold, FDC pays commissions from its own resources to financial intermediaries through which the sales are made.
Transfer Agent Fees. Fidelity Investments Institutional Operations Company, Inc. (FIIOC), an affiliate of FMR, is the transfer, dividend disbursing and shareholder servicing agent for each class of the Fund, except for International Real Estate. Fidelity Service Company, Inc. (FSC), an affiliate of FMR, is the transfer agent for International Real Estate shares. FIIOC and FSC receive account fees and asset-based fees that vary according to the account size and type of account of the shareholders of the respective classes of the Fund. FIIOC and FSC pay for typesetting, printing and mailing of shareholder reports, except proxy statements. For the period, the total transfer agent fees paid by each class to FIIOC or FSC, were as follows:
| Amount | % of
Average
Net Assets |
Class A | $ 2,951 | .29 * |
Class T | 1,450 | .28 * |
Class B | 705 | .28 * |
Class C | 1,464 | .28 * |
International Real Estate | 2,454,942 | .24 |
Institutional Class | 1,079 | .24 * |
| $ 2,462,591 | |
* Annualized
Annual Report
6. Fees and Other Transactions with Affiliates - continued
Accounting and Security Lending Fees. FSC maintains the Fund's accounting records. The accounting fee is based on the level of average net assets for the month. Under a separate contract, FSC administers the security lending program. The security lending fee is based on the number and duration of lending transactions.
Interfund Lending Program. Pursuant to an Exemptive Order issued by the SEC, the Fund, along with other registered investment companies having management contracts with FMR, may participate in an interfund lending program. This program provides an alternative credit facility allowing the funds to borrow from, or lend money to, other participating affiliated funds. At period end, there were no interfund loans outstanding. The Fund's activity in this program during the period for which loans were outstanding was as follows:
Borrower or Lender | Average Daily
Loan Balance | Weighted Average
Interest Rate | Interest
Expense |
Borrower | $ 10,469,077 | 5.40% | $ 20,398 |
7. Committed Line of Credit.
The Fund participates with other funds managed by FMR in a $4.2 billion credit facility (the "line of credit") to be utilized for temporary or emergency purposes to fund shareholder redemptions or for other short-term liquidity purposes. The Fund has agreed to pay commitment fees on its pro rata portion of the line of credit, which amounted to $1,511 and is reflected in Miscellaneous Expense on the Statement of Operations. During the period, there were no borrowings on this line of credit.
8. Security Lending.
The Fund lends portfolio securities from time to time in order to earn additional income. On the settlement date of the loan, the Fund receives collateral (in the form of U.S. Treasury obligations, letters of credit and/or cash) against the loaned securities and maintains collateral in an amount not less than 100% of the market value of the loaned securities during the period of the loan. The market value of the loaned securities is determined at the close of business of the Fund and any additional required collateral is delivered to the Fund on the next business day. If the borrower defaults on its obligation to return the securities loaned because of insolvency or other reasons, a fund could experience delays and costs in recovering the securities loaned or in gaining access to the collateral. Any cash collateral received is invested in the Fidelity Securities Lending Cash Central Fund. The value of loaned securities and cash collateral at period end are disclosed on the Fund's Statement of Assets and Liabilities. Security lending income represents the income earned on investing cash collateral, less fees and expenses associated
Annual Report
Notes to Financial Statements - continued
8. Security Lending - continued
with the loan, plus any premium payments that may be received on the loan of certain types of securities. Security lending income is presented in the Statement of Operations as a component of income from Fidelity Central Funds. Net income from lending portfolio securities during the period amounted to $670,450.
9. Expense Reductions.
FMR voluntarily agreed to reimburse a portion of International Real Estate's operating expenses. During the period, this reimbursement reduced the class' expenses by $65,025.
Many of the brokers with whom FMR places trades on behalf of the Fund provided services to the Fund in addition to trade execution. These services included payments of certain expenses on behalf of the Fund totaling $1,069,050 for the period. In addition, through arrangements with each class' transfer agent, credits realized as a result of uninvested cash balances were used to reduce the Fund's expenses. During the period, credits reduced each class' transfer agent expense as noted in the table below.
| Transfer Agent
expense reduction |
Class B | $ 2 |
International Real Estate | 11,675 |
| $ 11,677 |
10. Other.
The Fund's organizational documents provide former and current trustees and officers with a limited indemnification against liabilities arising in connection with the performance of their duties to the Fund. In the normal course of business, the Fund may also enter into contracts that provide general indemnifications. The Fund's maximum exposure under these arrangements is unknown as this would be dependent on future claims that may be made against the Fund. The risk of material loss from such claims is considered remote.
11. Distributions to Shareholders.
Distributions to shareholders of each class were as follows:
Years ended July 31, | 2007 | 2006 |
From net investment income | | |
International Real Estate | $ 8,677,416 | $ 3,273,462 |
From net realized gain | | |
International Real Estate | $ 61,685,812 | $ 5,444,196 |
Annual Report
12. Share Transactions.
Transactions for each class of shares were as follows:
| Shares | Dollars |
Years ended July 31, | 2007 A | 2006 | 2007 A | 2006 |
Class A | | | | |
Shares sold | 352,797 | - | $ 6,021,703 | $ - |
Shares redeemed | (28,946) | - | (470,996) | - |
Net increase (decrease) | 323,851 | - | $ 5,550,707 | $ - |
Class T | | | | |
Shares sold | 163,911 | - | $ 2,804,594 | $ - |
Shares redeemed | (11,190) | - | (189,267) | - |
Net increase (decrease) | 152,721 | - | $ 2,615,327 | $ - |
Class B | | | | |
Shares sold | 74,357 | - | $ 1,273,355 | $ - |
Shares redeemed | (460) | - | (7,526) | - |
Net increase (decrease) | 73,897 | - | $ 1,265,829 | $ - |
Class C | | | | |
Shares sold | 188,521 | - | $ 3,213,374 | $ - |
Shares redeemed | (20,772) | - | (352,540) | - |
Net increase (decrease) | 167,749 | - | $ 2,860,834 | $ - |
International Real Estate | | | | |
Shares sold | 78,643,461 | 23,490,365 | $ 1,288,512,778 | $ 327,866,574 |
Reinvestment of distributions | 4,249,998 | 646,412 | 65,004,744 | 7,986,974 |
Shares redeemed | (47,753,325) | (6,968,124) | (797,297,400) | (93,822,712) |
Net increase (decrease) | 35,140,134 | 17,168,653 | $ 556,220,122 | $ 242,030,836 |
Institutional Class | | | | |
Shares sold | 158,866 | - | $ 2,704,482 | $ - |
Shares redeemed | (1,378) | - | (22,809) | - |
Net increase (decrease) | 157,488 | - | $ 2,681,673 | $ - |
A Share transactions for Class A, Class T, Class B, Class C, and Institutional Class are for the period April 4, 2007 (commencement of sale of shares) to July 31, 2007.
Annual Report
Report of Independent Registered Public Accounting Firm
To the Trustees of Fidelity Securities Fund and the Shareholders of Fidelity International Real Estate Fund:
In our opinion, the accompanying statement of assets and liabilities, including the schedule of investments, and the related statements of operations and of changes in net assets and the financial highlights present fairly, in all material respects, the financial position of Fidelity International Real Estate Fund (a fund of Fidelity Securities Fund) at July 31, 2007, the results of its operations for the year then ended, the changes in its net assets for each of the two years in the period then ended and the financial highlights for each of the periods indicated, in conformity with accounting principles generally accepted in the United States of America. These financial statements and financial highlights (hereafter referred to as "financial statements") are the responsibility of the Fidelity International Real Estate Fund's management. Our responsibility is to express an opinion on these financial statements based on our audits. We conducted our audits of these financial statements in accordance with the standards of the Public Company Accounting Oversight Board (United States). Those standards require that we plan and perform the audit to obtain reasonable assurance about whether the financial statements are free of material misstatement. An audit includes examining, on a test basis, evidence supporting the amounts and disclosures in the financial statements, assessing the accounting principles used and significant estimates made by management, and evaluating the overall financial statement presentation. We believe that our audits, which included confirmation of securities at July 31, 2007 by correspondence with the custodian and brokers, provide a reasonable basis for our opinion.
/s/ PricewaterhouseCoopers LLP
PricewaterhouseCoopers LLP
Boston, Massachusetts
September 18, 2007
Annual Report
Trustees and Officers
The Trustees, Members of the Advisory Board, and executive officers of the trust and fund, as applicable, are listed below. The Board of Trustees governs the fund and is responsible for protecting the interests of shareholders. The Trustees are experienced executives who meet periodically throughout the year to oversee the fund's activities, review contractual arrangements with companies that provide services to the fund, and review the fund's performance. Except for James C. Curvey, each of the Trustees oversees 353 funds advised by FMR or an affiliate. Mr. Curvey oversees 317 funds advised by FMR or an affiliate.
The Trustees hold office without limit in time except that (a) any Trustee may resign; (b) any Trustee may be removed by written instrument, signed by at least two-thirds of the number of Trustees prior to such removal; (c) any Trustee who requests to be retired or who has become incapacitated by illness or injury may be retired by written instrument signed by a majority of the other Trustees; and (d) any Trustee may be removed at any special meeting of shareholders by a two-thirds vote of the outstanding voting securities of the trust. Each Trustee who is not an interested person (as defined in the 1940 Act) (Independent Trustee), shall retire not later than the last day of the calendar year in which his or her 72nd birthday occurs. The Independent Trustees may waive this mandatory retirement age policy with respect to individual Trustees. The executive officers and Advisory Board Members hold office without limit in time, except that any officer and Advisory Board Member may resign or may be removed by a vote of a majority of the Trustees at any regular meeting or any special meeting of the Trustees. Except as indicated, each individual has held the office shown or other offices in the same company for the past five years.
The fund's Statements of Additional Information (SAI) includes more information about the Trustees. To request a free copy, call Fidelity at 1-877-208-0098.
Interested Trustees *:
Correspondence intended for each Trustee who is an interested person may be sent to Fidelity Investments, 82 Devonshire Street, Boston, Massachusetts 02109.
Name, Age; Principal Occupation |
Edward C. Johnson 3d (77) |
| Year of Election or Appointment: 1984 Mr. Johnson is Chairman of the Board of Trustees. Mr. Johnson serves as President (2006-present), Chief Executive Officer, Chairman, and a Director of FMR Corp.; Chairman and a Director of FMR; Chairman and a Director of Fidelity Research & Analysis Company (FRAC); Chairman and a Director of Fidelity Investments Money Management, Inc.; and Chairman (2001-present) and a Director of FMR Co., Inc. In addition, Mr. Johnson serves as Chairman and Director of Fidelity International Limited (FIL). |
James C. Curvey (72) |
| Year of Election or Appointment: 2007 Mr. Curvey also serves as Trustee (2007-present) or Member of the Advisory Board (2007-present) of other investment companies advised by FMR. Mr. Curvey is Vice Chairman (2006-present) and Director of FMR Corp. Mr. Curvey joined Fidelity in 1982 and served in numerous senior management positions, including President and Chief Operating Officer of FMR Corp. (1997-2000) and President of Fidelity Strategic Investments (2000-2002). In addition, he serves as a member of the Board of Directors of Geerlings & Wade, Inc. (wine distribution). |
* Trustees have been determined to be "Interested Trustees" by virtue of, among other things, their affiliation with the trust or various entities under common control with FMR.
Independent Trustees:
Correspondence intended for each Independent Trustee (that is, the Trustees other than the Interested Trustees) may be sent to Fidelity Investments, P.O. Box 55235, Boston, Massachusetts 02205-5235.
Name, Age; Principal Occupation |
Dennis J. Dirks (59) |
| Year of Election or Appointment: 2005 Prior to his retirement in May 2003, Mr. Dirks was Chief Operating Officer and a member of the Board of The Depository Trust & Clearing Corporation (DTCC) (1999-2003). He also served as President, Chief Operating Officer, and Board member of The Depository Trust Company (DTC) (1999-2003) and President and Board member of the National Securities Clearing Corporation (NSCC) (1999-2003). In addition, Mr. Dirks served as Chief Executive Officer and Board member of the Government Securities Clearing Corporation (2001-2003) and Chief Executive Officer and Board member of the Mortgage-Backed Securities Clearing Corporation (2001-2003). Mr. Dirks also serves as a Trustee and a member of the Finance Committee of Manhattan College (2005-present) and a Trustee and a member of the Finance Committee of AHRC of Nassau County (2006-present). |
Albert R. Gamper, Jr. (65) |
| Year of Election or Appointment: 2006 Prior to his retirement in December 2004, Mr. Gamper served as Chairman of the Board of CIT Group Inc. (commercial finance). During his tenure with CIT Group Inc. Mr. Gamper served in numerous senior management positions, including Chairman (1987-1989; 1999-2001; 2002-2004), Chief Executive Officer (1987-2004), and President (1989-2002). He currently serves as a member of the Board of Directors of Public Service Enterprise Group (utilities, 2001-present), Chairman of the Board of Governors, Rutgers University (2004-present), and Chairman of the Board of Saint Barnabas Health Care System. |
George H. Heilmeier (71) |
| Year of Election or Appointment: 2004 Dr. Heilmeier is Chairman Emeritus of Telcordia Technologies (communication software and systems), where prior to his retirement, he served as company Chairman and Chief Executive Officer. He currently serves on the Boards of Directors of The Mitre Corporation (systems engineering and information technology support for the government), and HRL Laboratories (private research and development, 2004-present). He is Chairman of the General Motors Science & Technology Advisory Board and a Life Fellow of the Institute of Electrical and Electronics Engineers (IEEE). Dr. Heilmeier is a member of the Defense Science Board and the National Security Agency Advisory Board. He is also a member of the National Academy of Engineering, the American Academy of Arts and Sciences, and the Board of Overseers of the School of Engineering and Applied Science of the University of Pennsylvania. Previously, Dr. Heilmeier served as a Director of TRW Inc. (automotive, space, defense, and information technology, 1992-2002), Compaq (1994-2002), Automatic Data Processing, Inc. (ADP) (technology-based business outsourcing, 1995-2002), INET Technologies Inc. (telecommunications network surveillance, 2001-2004), and Teletech Holdings (customer management services). He is the recipient of the 2005 Kyoto Prize in Advanced Technology for his invention of the liquid crystal display, and a member of the Consumer Electronics Hall of Fame. |
James H. Keyes (66) |
| Year of Election or Appointment: 2007 Prior to his retirement in 2003, Mr. Keyes was Chairman, President, and Chief Executive Officer of Johnson Controls, Inc. (automotive supplier, 1993-2003). He currently serves as a member of the boards of LSI Logic Corporation (semiconductor technologies), Navistar International Corporation (manufacture and sale of trucks, buses, and diesel engines, 2002-present), and Pitney Bowes, Inc. (integrated mail, messaging, and document management solutions). |
Marie L. Knowles (60) |
| Year of Election or Appointment: 2001 Prior to Ms. Knowles' retirement in June 2000, she served as Executive Vice President and Chief Financial Officer of Atlantic Richfield Company (ARCO) (diversified energy, 1996-2000). From 1993 to 1996, she was a Senior Vice President of ARCO and President of ARCO Transportation Company. She served as a Director of ARCO from 1996 to 1998. She currently serves as a Director of Phelps Dodge Corporation (copper mining and manufacturing) and McKesson Corporation (healthcare service, 2002-present). Ms. Knowles is a Trustee of the Brookings Institution and the Catalina Island Conservancy and also serves as a member of the Advisory Board for the School of Engineering of the University of Southern California. |
Ned C. Lautenbach (63) |
| Year of Election or Appointment: 2000 Mr. Lautenbach is Chairman of the Independent Trustees (2006-present). Mr. Lautenbach has been a partner of Clayton, Dubilier & Rice, Inc. (private equity investment firm) since September 1998. Previously, Mr. Lautenbach was with the International Business Machines Corporation (IBM) from 1968 until his retirement in 1998. Mr. Lautenbach serves as a Director of Sony Corporation (2006-present) and Eaton Corporation (diversified industrial) as well as the Philharmonic Center for the Arts in Naples, Florida. He also is a member of the Board of Trustees of Fairfield University (2005-present), as well as a member of the Council on Foreign Relations. |
Cornelia M. Small (63) |
| Year of Election or Appointment: 2005 Ms. Small is a member (2000-present) and Chairperson (2002-present) of the Investment Committee, and a member (2002-present) of the Board of Trustees of Smith College. Previously, she served as Chief Investment Officer (1999-2000), Director of Global Equity Investments (1996-1999), and a member of the Board of Directors of Scudder, Stevens & Clark (1990-1997) and Scudder Kemper Investments (1997-1999). In addition, Ms. Small served as Co-Chair (2000-2003) of the Annual Fund for the Fletcher School of Law and Diplomacy. |
William S. Stavropoulos (68) |
| Year of Election or Appointment: 2002 Mr. Stavropoulos is Chairman Emeritus of the Board of Directors of The Dow Chemical Company. Since joining The Dow Chemical Company in 1967, Mr. Stavropoulos served in numerous senior management positions, including President (1993-2000; 2002-2003), CEO (1995-2000; 2002-2004), and Chairman of the Executive Committee (2000-2004). Currently, he is a Director of NCR Corporation (data warehousing and technology solutions), Chemical Financial Corporation, Maersk Inc. (industrial conglomerate, 2002-present), Tyco International, Inc. (multinational manufacturing and services, 2007-present), and a member of the Advisory Board for Metalmark Capital (private equity investment firm, 2005-present). He is a special advisor to Clayton, Dubilier & Rice, Inc., a private equity investment firm. He also serves as a member of the Board of Trustees of the American Enterprise Institute for Public Policy Research. In addition, Mr. Stavropoulos is a member of The Business Council, J.P. Morgan International Council and the University of Notre Dame Advisory Council for the College of Science. |
Kenneth L. Wolfe (68) |
| Year of Election or Appointment: 2005 Prior to his retirement in 2001, Mr. Wolfe was Chairman and Chief Executive Officer of Hershey Foods Corporation (1993-2001). He currently serves as a member of the boards of Adelphia Communications Corporation (2003-present), Bausch & Lomb, Inc., and Revlon Inc. (2004-present). |
Advisory Board Members and Executive Officers:
Correspondence intended for Mr. Mauriello may be sent to Fidelity Investments, P.O. Box 55235, Boston, Massachusetts 02205-5235. Correspondence intended for each executive officer and Mr. Lynch may be sent to Fidelity Investments, 82 Devonshire Street, Boston, Massachusetts 02109.
Name, Age; Principal Occupation |
Peter S. Lynch (63) |
| Year of Election or Appointment: 2003 Member of the Advisory Board of Fidelity Securities Fund. Mr. Lynch is Vice Chairman and a Director of FMR, and Vice Chairman (2001-present) and a Director of FMR Co., Inc. Previously, Mr. Lynch served as a Trustee of the Fidelity funds (1990-2003). In addition, he serves as a Trustee of Boston College and as the Chairman of the Inner-City Scholarship Fund. |
Joseph Mauriello (62) |
| Year of Election or Appointment: 2007 Member of the Advisory Board of Fidelity Securities Fund. Prior to his retirement in January 2006, Mr. Mauriello served in numerous senior management positions including Deputy Chairman and Chief Operating Officer (2004-2005), and Vice Chairman of Financial Services (2002-2004) of KPMG LLP US (professional services firm, 1965-2005). Mr. Mauriello currently serves as a member of the Board of Directors of XL Capital Ltd., (global insurance and re-insurance company, 2006-present) and of Arcadia Resources Inc., (health care services and products, 2007-present). He also served as a Director of the Hamilton Funds of the Bank of New York (2006-2007). |
Kimberley H. Monasterio (43) |
| Year of Election or Appointment: 2007 President and Treasurer of the fund. Ms. Monasterio also serves as President and Treasurer of other Fidelity funds (2007-present) and is an employee of FMR (2004-present). Previously, Ms. Monasterio served as Deputy Treasurer of the Fidelity funds (2004-2006). Before joining Fidelity Investments, Ms. Monasterio served as Treasurer (2000-2004) and Chief Financial Officer (2002-2004) of the Franklin Templeton Funds and Senior Vice President of Franklin Templeton Services, LLC (2000-2004). |
Dwight D. Churchill (53) |
| Year of Election or Appointment: 2005 Vice President of the fund. Mr. Churchill also serves as Vice President of certain Equity Funds (2005-present). Mr. Churchill is Executive Vice President of FMR (2005-present) and FMR Co., Inc. (2005-present). Previously, Mr. Churchill served as Senior Vice President of Fidelity Investments Money Management, Inc. (2005-2006), Head of Fidelity's Fixed-Income Division (2000-2005), Vice President of Fidelity's Money Market Funds (2000-2005), Vice President of Fidelity's Bond Funds, and Senior Vice President of FMR. |
Steven J. Buller (40) |
| Year of Election or Appointment: 2007 Vice President of the fund. Mr. Buller also serves as Vice President of another fund advised by FMR. Prior to assuming his current responsibilities, Mr. Buller worked as a research analyst and a portfolio manager. Mr. Buller also serves as Vice President of FMR (2000) and FMR Co., Inc. (2001). |
Eric D. Roiter (58) |
| Year of Election or Appointment: 2004 Secretary of the fund. He also serves as Secretary of other Fidelity funds; Vice President, General Counsel, and Secretary of FMR Co., Inc. (2001-present) and FMR; Assistant Secretary of Fidelity Management & Research (U.K.) Inc. (2001-present), Fidelity Research & Analysis Company (2001-present), and Fidelity Investments Money Management, Inc. (2001-present). Mr. Roiter is an Adjunct Member, Faculty of Law, at Boston College Law School (2003-present). Previously, Mr. Roiter served as Vice President and Secretary of Fidelity Distributors Corporation (FDC) (1998-2005). |
Scott C. Goebel (39) |
| Year of Election or Appointment: 2007 Assistant Secretary of the fund. Mr. Goebel also serves as Assistant Secretary of other Fidelity funds (2007-present), Vice President and Secretary of FDC (2006-present), and is an employee of FMR. |
R. Stephen Ganis (41) |
| Year of Election or Appointment: 2006 Anti-Money Laundering (AML) officer of the fund. Mr. Ganis also serves as AML officer of other Fidelity funds (2006-present) and FMR Corp. (2003-present). Before joining Fidelity Investments, Mr. Ganis practiced law at Goodwin Procter, LLP (2000-2002). |
Joseph B. Hollis (59) |
| Year of Election or Appointment: 2006 Chief Financial Officer of the fund. Mr. Hollis also serves as Chief Financial Officer of other Fidelity funds. Mr. Hollis is President of Fidelity Pricing and Cash Management Services (FPCMS) (2005-present). Mr. Hollis also serves as President and Director of Fidelity Service Company, Inc. (2006-present). Previously, Mr. Hollis served as Senior Vice President of Cash Management Services (1999-2002) and Investment Management Operations (2002-2005). |
Kenneth A. Rathgeber (60) |
| Year of Election or Appointment: 2004 Chief Compliance Officer of the fund. Mr. Rathgeber also serves as Chief Compliance Officer of other Fidelity funds (2004-present) and Executive Vice President of Risk Oversight for Fidelity Investments (2002-present). He is Chief Compliance Officer of FMR (2005-present), FMR Co., Inc. (2005-present), Fidelity Management & Research (U.K.) Inc. (2005-present), Fidelity Research & Analysis Company (2005-present), Fidelity Investments Money Management, Inc. (2005-present), and Strategic Advisers, Inc. (2005-present). Previously, Mr. Rathgeber served as Executive Vice President and Chief Operating Officer for Fidelity Investments Institutional Services Company, Inc. (1998-2002). |
Bryan A. Mehrmann (46) |
| Year of Election or Appointment: 2005 Deputy Treasurer of the fund. Mr. Mehrmann also serves as Deputy Treasurer of other Fidelity funds (2005-present) and is an employee of FMR. Previously, Mr. Mehrmann served as Vice President of Fidelity Investments Institutional Services Group (FIIS)/Fidelity Investments Institutional Operations Corporation, Inc. (FIIOC) Client Services (1998-2004). |
Kenneth B. Robins (37) |
| Year of Election or Appointment: 2005 Deputy Treasurer of the fund. Mr. Robins also serves as Deputy Treasurer of other Fidelity funds (2005-present) and is an employee of FMR (2004-present). Before joining Fidelity Investments, Mr. Robins worked at KPMG LLP, where he was a partner in KPMG's department of professional practice (2002-2004) and a Senior Manager (1999-2000). In addition, Mr. Robins served as Assistant Chief Accountant, United States Securities and Exchange Commission (2000-2002). |
Robert G. Byrnes (40) |
| Year of Election or Appointment: 2005 Assistant Treasurer of the fund. Mr. Byrnes also serves as Assistant Treasurer of other Fidelity funds (2005-present) and is an employee of FMR (2005-present). Previously, Mr. Byrnes served as Vice President of FPCMS (2003-2005). Before joining Fidelity Investments, Mr. Byrnes worked at Deutsche Asset Management where he served as Vice President of the Investment Operations Group (2000-2003). |
Name, Age; Principal Occupation |
Peter L. Lydecker (53) |
| Year of Election or Appointment: 2004 Assistant Treasurer of the fund. Mr. Lydecker also serves as Assistant Treasurer of other Fidelity funds (2004) and is an employee of FMR. |
Gary W. Ryan (48) |
| Year of Election or Appointment: 2005 Assistant Treasurer of the fund. Mr. Ryan also serves as Assistant Treasurer of other Fidelity funds (2005-present) and is an employee of FMR (2005-present). Previously, Mr. Ryan served as Vice President of Fund Reporting in FPCMS (1999-2005). |
Annual Report
Distributions
The Board of Trustees of Fidelity International Real Estate Fund voted to pay to shareholders of record at the opening of business on record date, the following distributions per share derived from capital gains realized from sales of portfolio securities, and dividends derived from net investment income:
| Pay Date | Record Date | Dividends | Capital Gains |
Class A | 09/10/2007 | 09/07/2007 | $.215 | $.780 |
Class T | 09/10/2007 | 09/07/2007 | $.206 | $.780 |
Class B | 09/10/2007 | 09/07/2007 | $.191 | $.780 |
Class C | 09/10/2007 | 09/07/2007 | $.195 | $.780 |
The fund hereby designates as a capital gain dividend with respect to the taxable year ended July 31, 2007, $8,966,251, or, if subsequently determined to be different, the net capital gain of such year.
The fund will notify shareholders in January 2008 of amounts for use in preparing 2007 income tax returns.
Annual Report
Board Approval of Investment Advisory Contracts and Management Fees
Fidelity International Real Estate Fund
Each year, typically in July, the Board of Trustees, including the Independent Trustees (together, the Board), votes on the renewal of the management contract and sub-advisory agreements (together, the Advisory Contracts) for the fund. The Board, assisted by the advice of fund counsel and Independent Trustees' counsel, requests and considers a broad range of information throughout the year.
The Board meets regularly each month except August and takes into account throughout the year matters bearing on Advisory Contracts. The Board, acting directly and through its separate committees, considers at each of its meetings factors that are relevant to the annual renewal of the fund's Advisory Contracts, including the services and support provided to the fund and its shareholders. At the time of the renewal, the Board had 12 standing committees, each composed of Independent Trustees with varying backgrounds, to which the Board has assigned specific subject matter responsibilities in order to enhance effective decision-making by the Board. Each committee has adopted a written charter outlining the structure and purposes of the committee. One such committee, the Equity Contract Committee, meets periodically as needed throughout the year to consider matters specifically related to the annual renewal of Advisory Contracts. The committee requests and receives information on, and makes recommendations to the Independent Trustees concerning, the approval and annual review of the Advisory Contracts.
At its July 2007 meeting, the Board of Trustees, including the Independent Trustees, unanimously determined to renew the Advisory Contracts for the fund. In reaching its determination, the Board considered all factors it believed relevant, including (i) the nature, extent, and quality of the services to be provided to the fund and its shareholders (including the investment performance of the fund); (ii) the competitiveness of the management fee and total expenses of the fund; (iii) the total costs of the services to be provided by and the profits to be realized by the investment adviser and its affiliates from the relationship with the fund; (iv) the extent to which economies of scale would be realized as the fund grows; and (v) whether fee levels reflect these economies of scale, if any, for the benefit of fund shareholders. The Board also approved amendments to the fund's agreements with foreign sub-advisers to clarify that each sub-adviser provides services as an independent contractor.
In determining whether to renew the Advisory Contracts for the fund, the Board ultimately reached a determination, with the assistance of fund counsel and Independent Trustees' counsel, that the renewal of the Advisory Contracts and the compensation to be received by Fidelity under the management contract is consistent with Fidelity's fiduciary duty under applicable law. In addition to evaluating the specific factors noted above, the Board, in reaching its determination, is aware that shareholders in the fund have a broad range of investment choices available to them, including a wide choice among mutual funds offered by competitors to Fidelity, and that the fund's shareholders, with the opportunity to review and weigh the disclosure provided by the fund in its prospectus and other public disclosures, have chosen to invest in this fund, managed by Fidelity.
Annual Report
Board Approval of Investment Advisory Contracts and
Management Fees - continued
Nature, Extent, and Quality of Services Provided. The Board considered staffing within the investment adviser, FMR, and the sub-advisers (together, the Investment Advisers), including the background of the fund's portfolio manager and the fund's investment objective and discipline. The Independent Trustees also had discussions with senior management of Fidelity's investment operations and investment groups. The Board considered the structure of the portfolio manager compensation program and whether this structure provides appropriate incentives.
Resources Dedicated to Investment Management and Support Services. The Board reviewed the size, education, and experience of the Investment Advisers' investment staff, their use of technology, and the Investment Advisers' approach to recruiting, training, and retaining portfolio managers and other research, advisory, and management personnel. The Board considered Fidelity's extensive global research capabilities that enable the Investment Advisers to aggregate data from various sources in an effort to produce positive investment results. The Board noted that Fidelity's analysts have access to a variety of technological tools that enable them to perform both fundamental and quantitative analysis and to specialize in various disciplines. The Board also considered that Fidelity's portfolio managers and analysts have access to daily portfolio attribution that allows for monitoring of a fund's portfolio, as well as an electronic communication system that provides immediate real-time access to research concerning issuers and credit enhancers.
Shareholder and Administrative Services. The Board considered (i) the nature, extent, quality, and cost of advisory, administrative, distribution, and shareholder services performed by the Investment Advisers and their affiliates under the Advisory Contracts and under separate agreements covering transfer agency, pricing and bookkeeping, and securities lending services for the fund; (ii) the nature and extent of the Investment Advisers' supervision of third party service providers, principally custodians and subcustodians; and (iii) the resources devoted to, and the record of compliance with, the fund's compliance policies and procedures. The Board reviewed the allocation of fund brokerage, including allocations to brokers affiliated with the Investment Advisers, the use of brokerage commissions to pay fund expenses, and the use of "soft" commission dollars to pay for research services. The Board also considered that Fidelity voluntarily pays for market data out of its own resources. The Board also considered the agreement reached between the Independent Trustees and Fidelity in December 2006 following an independent review of matters relating to receipt of travel, entertainment, gifts and gratuities in violation of Fidelity policies.
The Board noted that the growth of fund assets across the complex allows Fidelity to reinvest in the development of services designed to enhance the value or convenience of the Fidelity funds as investment vehicles. These services include 24-hour access to account information and market information through phone representatives and over the Internet, and investor education materials and asset allocation tools.
Annual Report
Investment in a Large Fund Family. The Board considered the benefits to shareholders of investing in a Fidelity fund, including the benefits of investing in a fund that is part of a large family of funds offering a variety of investment disciplines and providing for a large variety of mutual fund investor services. For example, fund shareholders are offered the privilege of exchanging shares of the fund for shares of other Fidelity funds, as set forth in the fund's prospectus, without paying a sales charge. The Board noted that, since the last Advisory Contract renewals in July 2006, Fidelity has taken a number of actions that benefited particular funds, including (i) dedicating additional resources to investment research and to restructure the investment research teams; (ii) contractually agreeing to reduce the management fee on Fidelity Advisor Floating Rate High Income Fund; (iii) contractually agreeing to reduce the management fees on Fidelity's California, Massachusetts, New Jersey, and New York AMT Tax-Free Money Market Funds, launching new Institutional Classes and Service Classes of these funds, and contractually agreeing to impose expense limitations on these funds; (iv) eliminating the exchange fee on the Fidelity Select Portfolios and reducing the pricing and bookkeeping fee rates for these funds; (v) reducing the maximum transfer agency fee rates on high income funds and certain equity funds; (vi) proposing amended management contracts that, if approved by shareholders, will add a performance adjustment component to the management fees paid by 18 Fidelity Advisor equity funds; (vii) contractually agreeing to reduce fees for Ultra-Short Central Fund and the money market Central Funds; (viii) waiving the Fidelity Advisor funds' contingent deferred sales charge on certain redemptions made through systematic withdrawal programs; and (ix) amending the management contracts for equity and fixed-income funds whose management contracts incorporate a "group fee" structure by adding four new fee "breakpoints" to the group fee rate schedules.
Investment Performance and Compliance. The Board considered whether the fund has operated within its investment objective, as well as its record of compliance with its investment restrictions. It also reviewed the fund's absolute investment performance, as well as the fund's relative investment performance measured against a broad-based securities market index. The Board noted that FMR does not believe that a meaningful peer group exists against which to compare the fund's performance. Because the fund had been in existence less than three calendar years, the following chart considered by the Board shows, for the one-year period ended December 31, 2006, the fund's total return and the total return of a broad-based securities market index ("benchmark"). (The fund did not offer Advisor classes as of December 31, 2006.)
Annual Report
Board Approval of Investment Advisory Contracts and
Management Fees - continued
Fidelity International Real Estate Fund

The Board stated that the relative investment performance of the fund was lower than its benchmark for the period shown. The Board stated that it is difficult to evaluate in any comprehensive fashion the performance of the fund, in light of its relatively recent commencement of operations.
The Board considered that FMR has taken steps to refocus and strengthen equity research, equity portfolio management, and compliance.
Based on its review, and giving particular weight to the nature and quality of the resources dedicated by the Investment Advisers to maintain and improve relative performance, the Board concluded that the nature, extent, and quality of the services provided to the fund will benefit the fund's shareholders, particularly in light of the Board's view that the fund's shareholders benefit from investing in a fund that is part of a large family of funds offering a variety of investment disciplines and services.
Competitiveness of Management Fee and Total Fund Expenses. The Board considered the fund's management fee and total expenses compared to "mapped groups" of competitive funds and classes. Fidelity creates "mapped groups" by combining similar Lipper investment objective categories that have comparable management fee characteristics. Combining Lipper investment objective categories aids the Board's management fee and total expense comparisons by broadening the competitive group used for comparison and by reducing the number of universes to which various Fidelity funds are compared. The Board also considered supplemental information about how the fund's management fee and total expenses ranked relative to groups based on Lipper classifications, which take into account a fund's market capitalization and style.
Annual Report
The Board considered two proprietary management fee comparisons for the 12-month (or shorter) periods shown in the chart below. The group of Lipper funds used by the Board for management fee comparisons is referred to below as the "Total Mapped Group." The Total Mapped Group comparison focuses on a fund's standing relative to the total universe of comparable funds available to investors, in terms of gross management fees before expense reimbursements or caps. "TMG %" represents the percentage of funds in the Total Mapped Group that had management fees that were lower than the fund's. For example, a TMG % of 30% means that 70% of the funds in the Total Mapped Group had higher management fees than the fund. The "Asset-Size Peer Group" (ASPG) comparison focuses on a fund's standing relative to non-Fidelity funds similar in size to the fund within the Total Mapped Group. The ASPG represents at least 15% of the funds in the Total Mapped Group with comparable asset size and management fee characteristics, subject to a minimum of 50 funds (or all funds in the Total Mapped Group if fewer than 50). Additional information, such as the ASPG quartile in which the fund's management fee ranked, is also included in the chart and considered by the Board.
Fidelity International Real Estate Fund

The Board noted that the fund's management fee ranked below the median of its Total Mapped Group and below the median of its ASPG for 2006.
Based on its review, the Board concluded that the fund's management fee was fair and reasonable in light of the services that the fund receives and the other factors considered.
In its review of the fund's total expenses, the Board considered the fund's management fee as well as other fund expenses, such as transfer agent fees, pricing and bookkeeping fees, and custodial, legal, and audit fees. The Board also noted the effects of any waivers and reimbursements on fees and expenses. As part of its review, the Board also considered current and historical total expenses of the fund compared to competitive fund median expenses. The fund is compared to those funds and classes in the Total Mapped Group (used by the Board for management fee comparisons) that have a similar sales load structure.
Annual Report
Board Approval of Investment Advisory Contracts and
Management Fees - continued
The Board noted that the fund's total expenses ranked below its competitive median for 2006.
In its review of total expenses, the Board also considered Fidelity fee structures and other information on clients that FMR and its affiliates service in other competitive markets, such as other mutual funds advised or subadvised by FMR or its affiliates, pension plan clients, and other institutional clients.
Based on its review, the Board concluded that the fund's total expenses were reasonable, although above the median of the universe presented for comparison, in light of the services that the fund and its shareholders receive and the other factors considered.
Costs of the Services and Profitability. The Board considered the revenues earned and the expenses incurred by Fidelity in conducting the business of developing, marketing, distributing, managing, administering and servicing the fund and its shareholders. The Board also considered the level of Fidelity's profits in respect of all the Fidelity funds.
On an annual basis, FMR presents to the Board Fidelity's profitability for the fund. Fidelity calculates the profitability for each fund, as well as aggregate profitability for groups of Fidelity funds and all Fidelity funds, using a series of detailed revenue and cost allocation methodologies which originate with the audited books and records of Fidelity. The Audit Committee of the Board reviews any significant changes from the prior year's methodologies.
PricewaterhouseCoopers LLP (PwC), independent registered public accounting firm and auditor to Fidelity and certain Fidelity funds, has been engaged annually by the Board as part of the Board's assessment of the results of Fidelity's profitability analysis. PwC's engagement includes the review and assessment of Fidelity's methodologies used in determining the revenues and expenses attributable to Fidelity's mutual fund business, and completion of agreed-upon procedures surrounding the mathematical accuracy of fund profitability and its conformity to allocation methodologies. After considering PwC's reports issued under the engagement and information provided by Fidelity, the Board believes that while other allocation methods may also be reasonable, Fidelity's profitability methodologies are reasonable in all material respects.
The Board has also reviewed Fidelity's non-fund businesses and any fall-out benefits related to the mutual fund business as well as cases where Fidelity's affiliates may benefit from or be related to the fund's business.
Annual Report
The Board considered the costs of the services provided by and the profits realized by Fidelity in connection with the operation of the fund and determined that the amount of profit is a fair entrepreneurial profit for the management of the fund.
Economies of Scale. The Board considered whether there have been economies of scale in respect of the management of the Fidelity funds, whether the Fidelity funds (including the fund) have appropriately benefited from any such economies of scale, and whether there is potential for realization of any further economies of scale. The Board considered the extent to which the fund will benefit from economies of scale through increased services to the fund, through waivers or reimbursements, or through fee or expense reductions, including reductions that occur through operation of the transfer agent agreement. The transfer agent fee varies in part based on the number of accounts in the fund. If the number of accounts decreases or the average account size increases, the overall transfer agent fee rate decreases.
The Board recognized that the fund's management contract incorporates a "group fee" structure, which provides for lower group fee rates as total fund assets under FMR's management increase, and for higher group fee rates as total fund assets under FMR's management decrease. FMR determines the group fee rates based on a tiered asset "breakpoint" schedule. In connection with the renewal of the fund's management contract, the Board approved amendments to the fund's management contract that added four new fee breakpoints to the group fee rate schedule for assets under FMR's management above $1,386 billion. The Board considered that the group fee rate declines under both the present and amended schedules, but that under the amended schedule, the group fee rate declines faster as assets under FMR's management exceed $1,386 billion. The Board considered that the group fee is designed to deliver the benefits of economies of scale to fund shareholders when total fund assets increase, even if assets of any particular fund are unchanged or have declined, because some portion of Fidelity's costs are attributable to services provided to all Fidelity funds, and all funds benefit if those costs can be allocated among more assets. The Board concluded that, given the group fee structure, fund shareholders will achieve a certain level of economies of scale as assets under FMR's management increase at the fund complex level, regardless of whether Fidelity achieves any such economies of scale.
The Board further concluded that any potential economies of scale are being shared between fund shareholders and Fidelity in an appropriate manner.
Additional Information Requested by the Board. In order to develop fully the factual basis for consideration of the Fidelity funds' Advisory Contracts, the Board requested and received additional information on several topics, including (i) fund performance trends and actions to be taken by FMR to improve certain funds' overall performance; (ii) Fidelity's portfolio manager compensation structure, including its effects on fund profitability and the extent to which portfolio manager compensation is linked to fund performance; (iii) Fidelity's fee structures; (iv) the funds' sub-advisory arrangements; and (v) accounts managed by Fidelity other than the Fidelity funds.
Annual Report
Board Approval of Investment Advisory Contracts and
Management Fees - continued
Based on its evaluation of all of the conclusions noted above, and after considering all material factors, the Board ultimately concluded that the advisory fee structures are fair and reasonable, and that the fund's Advisory Contracts should be renewed.
Annual Report
Annual Report
Investment Adviser
Fidelity Management & Research Company
Boston, MA
Investment Sub-Advisers
FMR Co., Inc.
Fidelity Research & Analysis Company
Fidelity Management & Research
(U.K.) Inc.
Fidelity Investments Japan Limited
Fidelity International Investment
Advisers
Fidelity International Investment
Advisers (U.K.) Limited
General Distributor
Fidelity Distributors Corporation
Boston, MA
Transfer and Service Agent
Fidelity Investments Institutional
Operations Company, Inc.
Boston, MA
Fidelity Service Company, Inc.
Boston, MA
Custodian
Mellon Bank, N.A.
Pittsburgh, PA
AIRE-UANN-0907
1.843178.100
(Fidelity Investment logo)(registered trademark)
(Fidelity Investment logo)(registered trademark)
Fidelity Advisor
International Real Estate
Fund - Institutional Class
Annual Report
July 31, 2007
Institutional Class is a
class of Fidelity®
International Real Estate Fund
(2_fidelity_logos) (Registered_Trademark)
Contents
Chairman's Message | <Click Here> | Ned Johnson's message to shareholders. |
Performance | <Click Here> | How the fund has done over time. |
Management's Discussion | <Click Here> | The manager's review of fund performance, strategy and outlook. |
Shareholder Expense Example | <Click Here> | An example of shareholder expenses. |
Investment Changes | <Click Here> | A summary of major shifts in the fund's investments over the past six months. |
Investments | <Click Here> | A complete list of the fund's investments with their market values. |
Financial Statements | <Click Here> | Statements of assets and liabilities, operations, and changes in net assets,
as well as financial highlights. |
Notes | <Click Here> | Notes to the financial statements. |
Report of Independent Registered Public Accounting Firm | <Click Here> | |
Trustees and Officers | <Click Here> | |
Distributions | <Click Here> | |
Board Approval of Investment Advisory Contracts and Management Fees | <Click Here> | |
To view a fund's proxy voting guidelines and proxy voting record for the 12-month period ended June 30, visit http://www.fidelity.com (search for "proxy voting guidelines") or visit the Securities and Exchange Commission's (SEC) web site at http://www.sec.gov. You may also call 1-800-544-8544 to request a free copy of the proxy voting guidelines.
Standard & Poor's, S&P and S&P 500 are registered service marks of The McGraw-Hill Companies, Inc. and have been licensed for use by Fidelity Distributors Corporation.
Other third party marks appearing herein are the property of their respective owners.
All other marks appearing herein are registered or unregistered trademarks or service marks of FMR Corp. or an affiliated company.
Annual Report
This report and the financial statements contained herein are submitted for the general information of the shareholders of the fund. This report is not authorized for distribution to prospective investors in the fund unless preceded or accompanied by an effective prospectus.
A fund files its complete schedule of portfolio holdings with the SEC for the first and third quarters of each fiscal year on Form N-Q. Forms N-Q are available on the SEC's web site at http://www.sec.gov. A fund's Forms N-Q may be reviewed and copied at the SEC's Public Reference Room in Washington, DC. Information regarding the operation of the SEC's Public Reference Room may be obtained by calling 1-800-SEC-0330. For a complete list of a fund's portfolio holdings, view the most recent holdings listing, semiannual report, or annual report on Fidelity's web site at http://www.fidelity.com or http://www.advisor.fidelity.com, as applicable.
NOT FDIC INSURED · MAY LOSE VALUE · NO BANK GUARANTEE
Neither the fund nor Fidelity Distributors Corporation is a bank.
Annual Report
Chairman's Message
(photo_of_Edward_C_Johnson_3d)
Dear Shareholder:
Stocks are currently on pace to register their fifth straight year of positive returns, although gains could be trimmed if the U.S. economy continues to slow. While financial markets are always unpredictable, there are a number of time-tested principles that can put the historical odds in your favor.
One of the basic tenets is to invest for the long term. Over time, riding out the markets' inevitable ups and downs has proven much more effective than selling into panic or chasing the hottest trend. Even missing only a few of the markets' best days can significantly diminish investor returns. Patience also affords the benefits of compounding - of earning interest on additional income or reinvested dividends and capital gains. There are tax advantages and cost benefits to consider as well. The more you sell, the more taxes you pay, and the more you trade, the higher the costs. While staying the course doesn't eliminate risk, it can considerably lessen the effect of short-term declines.
You can further manage your investing risk through diversification. And today, more than ever, geographic diversification should be taken into account. Studies indicate that asset allocation is the single most important determinant of a portfolio's long-term success. The right mix of stocks, bonds and cash - aligned to your particular risk tolerance and investment objective - is very important. Age-appropriate rebalancing is also an essential aspect of asset allocation. For younger investors, an emphasis on equities - which historically have been the best-performing asset class over time - is encouraged. As investors near their specific goal, such as retirement or sending a child to college, consideration may be given to replacing volatile assets (e.g. common stocks) with more-stable fixed investments (bonds or savings plans).
A third investment principle - investing regularly - can help lower the average cost of your purchases. Investing a certain amount of money each month or quarter helps ensure you won't pay for all your shares at market highs. This strategy - known as dollar cost averaging - also reduces unconstructive "emotion" from investing, helping shareholders avoid selling weak performers just prior to an upswing, or chasing a hot performer just before a correction.
We invite you to contact us via the Internet, through our Investor Centers or over the phone. It is our privilege to provide you the information you need to make the investments that are right for you.
Sincerely,
/s/Edward C. Johnson 3d
Edward C. Johnson 3d
Annual Report
Fidelity Advisor International Real Estate Fund - Institutional Class
Performance: The Bottom Line
Average annual total return reflects the change in the value of an investment, assuming reinvestment of the class' dividend income and capital gains (the profits earned upon the sale of securities that have grown in value) and assuming a constant rate of performance each year. The $10,000 table and the fund's returns do not reflect the deduction of taxes that a shareholder would pay on fund distributions or the redemption of fund shares. During periods of reimbursement by Fidelity, a fund's total return will be greater than it would be had the reimbursement not occurred. How a fund did yesterday is no guarantee of how it will do tomorrow.
Average Annual Total Returns
Periods ended July 31, 2007 | Past 1
year | Life of
FundA |
Institutional Class B | 19.01% | 23.67% |
A From September 8, 2004.
B The initial offering of Institutional Class shares took place on April 4, 2007. Returns prior to April 4, 2007 are those of International Real Estate, the original class of the fund.
$10,000 Over Life of Fund
Let's say hypothetically that $10,000 was invested in Fidelity Advisor International Real Estate Fund - Institutional Class(dagger) on September 8, 2004, when the fund started. The chart shows how the value of your investment would have changed, and also shows how the Morgan Stanley Capital InternationalSM Europe, Australasia and Far East(MSCI® EAFE®) performed over the same period.
* The initial offering of Institutional Class shares took place on April 4, 2007. Returns prior to April 4, 2007 are those of International Real Estate, the original class of the fund.
Annual Report
Management's Discussion of Fund Performance
Comments from Steven Buller, Portfolio Manager of Fidelity Advisor International Real Estate Fund
The period ending July 31, 2007, began with real estate securities on the rise and ended with them in decline. Overall, international property stocks, as measured by the EPRA/NAREIT Global Real Estate ex North America Index, gained 25.95% during the past year - significantly better than the 0.55% decline in the U.S. real estate investment trust market, as measured by the Dow Jones Wilshire Real Estate Securities IndexSM. Despite global property markets' second-half correction, the fundamentals of commercial real estate companies actually remained quite good during the entire year, with increasing occupancy and rental rates present in a growing number of markets. Nevertheless, property stocks found themselves on a roller coaster ride. Much of the volatility was attributable to the flow of investment capital into and out of the real estate sector. During the period's second half, investors became increasingly concerned about losing money, which in turn triggered significant fund flows out of property stocks and declining valuations.
During the past year, the fund did well in absolute terms but lagged the EPRA/NAREIT index and the broad international stock market - as measured by the Morgan Stanley Capital InternationalSM Europe, Australasia and Far East Index - which returned 24.10%. (For specific class-level performance results, please refer to the performance section of this report.) Weak security selection detracted versus the EPRA/NAREIT index. On a country basis, the worst drag came from disappointing stock picks in the United Kingdom. An overweighting in Germany also hurt. In contrast, positive stock selection in Hong Kong helped. On a sector basis, security selection among diversified property stocks and hotels was favorable, although those gains were outweighed by weak picks in offices and retail. A small allocation to cash also hurt. The fund's biggest individual negative was U.K.-based real estate company Capital & Regional, which lagged badly during the period's second half on worries about slowing retail sales. A couple of German property stocks, Patrizia Immobilien and IVG Immobilien, also hurt, as did an underweighting in strong-performing China Overseas Land & Investment. Conversely, Kerry Properties, a commercial and residential property company that does most of its business in Hong Kong and China, benefited from growth in those two markets. Also performing well was New World China Land, a Grand Cayman-listed commercial/residential developer focused on China.
The views expressed above reflect those of the portfolio manager(s) only through the end of the period as stated on the cover of this report and do not necessarily represent the views of Fidelity or any other person in the Fidelity organization. Any such views are subject to change at any time based upon market or other conditions and Fidelity disclaims any responsibility to update such views. These views may not be relied on as investment advice and, because investment decisions for a Fidelity fund are based on numerous factors, may not be relied on as an indication of trading intent on behalf of any Fidelity fund.
Annual Report
Shareholder Expense Example
As a shareholder of the Fund, you incur two types of costs: (1) transaction costs, including sales charges (loads) on purchase payments or redemption proceeds, redemption fees, and (2) ongoing costs, including management fees, distribution and/or service (12b-1) fees and other Fund expenses. This Example is intended to help you understand your ongoing costs (in dollars) of investing in the Fund and to compare these costs with the ongoing costs of investing in other mutual funds.
The actual example is based on an investment of $1,000 invested at the beginning of the period and held for the entire period (February 1, 2007 to July 31, 2007) for the International Real Estate class and for the entire period (April 4, 2007 to July 31, 2007) for Class A, Class T, Class B, Class C and Institutional Class. The hypothetical expense example is based on an investment of $1,000 for one-half year period (February 1, 2007 to July 31, 2007).
Actual Expenses
The first line of the accompanying table for each class of the Fund provides information about actual account values and actual expenses. You may use the information in this line, together with the amount you invested, to estimate the expenses that you paid over the period. Simply divide your account value by $1,000.00 (for example, an $8,600 account value divided by $1,000.00 = 8.6), then multiply the result by the number in the first line for a class of the Fund under the heading entitled "Expenses Paid During Period" to estimate the expenses you paid on your account during this period. A small balance maintenance fee of $12.00 that is charged once a year may apply for certain accounts with a value of less than $2,000. This fee is not included in the table below. If it was, the estimate of expenses you paid during the period would be higher, and your ending account value lower, by this amount. In addition, the Fund, as a shareholder in the underlying Fidelity Central Funds, will indirectly bear its pro rata share of the fees and expenses incurred by the underlying Fidelity Central Funds. These fees and expenses are not included in the Fund's annualized expense ratio used to calculate the expense estimate in the table below.
Hypothetical Example for Comparison Purposes
The second line of the accompanying table for each class of the Fund provides information about hypothetical account values and hypothetical expenses based on a Class' actual expense ratio and an assumed rate of return of 5% per year before expenses, which is not the Class' actual return. The hypothetical account values and expenses may not be used to estimate the actual ending account balance or expenses you paid for the period. You may use this information to compare the ongoing costs of investing in the Fund and other funds. To do so, compare this 5% hypothetical example with the 5% hypothetical examples that appear in the shareholder reports of the other funds. A small balance maintenance fee of $12.00 that is charged once a year may apply for certain accounts with a value of less than $2,000. This fee is not included in the table below. If it was, the estimate of expenses you paid during the period would be higher, and your ending account value lower, by this amount. In addition, the Fund, as a shareholder in the underlying Fidelity Central Funds, will indirectly bear its pro rata share of the fees and expenses incurred by the underlying Fidelity Central Funds. These fees and expenses are not included in the Fund's annualized expense ratio used to calculate the expense estimate in the table below.
Annual Report
Shareholder Expense Example - continued
Please note that the expenses shown in the table are meant to highlight your ongoing costs only and do not reflect any transaction costs. Therefore, the second line of the table is useful in comparing ongoing costs only, and will not help you determine the relative total costs of owning different funds. In addition, if these transactional costs were included, your costs would have been higher.
| Beginning
Account Value | Ending
Account Value
July 31, 2007 | Expenses Paid
During Period |
Class A | | | |
Actual | $ 1,000.00 | $ 947.00 | $ 4.35 B |
HypotheticalA | $ 1,000.00 | $ 1,018.00 | $ 6.85 C |
Class T | | | |
Actual | $ 1,000.00 | $ 946.40 | $ 5.11 B |
HypotheticalA | $ 1,000.00 | $ 1,016.81 | $ 8.05 C |
Class B | | | |
Actual | $ 1,000.00 | $ 944.50 | $ 6.69 B |
HypotheticalA | $ 1,000.00 | $ 1,014.33 | $ 10.54 C |
Class C | | | |
Actual | $ 1,000.00 | $ 944.50 | $ 6.66 B |
HypotheticalA | $ 1,000.00 | $ 1,014.38 | $ 10.49 C |
International Real Estate | | | |
Actual | $ 1,000.00 | $ 948.20 | $ 5.07 B |
HypotheticalA | $ 1,000.00 | $ 1,019.59 | $ 5.26 C |
Institutional Class | | | |
Actual | $ 1,000.00 | $ 948.20 | $ 3.43 B |
HypotheticalA | $ 1,000.00 | $ 1,019.44 | $ 5.41 C |
A 5% return per year before expenses
B Actual expenses are equal to each Class' annualized expense ratio (shown in the table below); multiplied by the average account value over the period, multiplied by 181/365 (to reflect the one-half year period) for the International Real Estate class and multiplied by 119/365 (to reflect the period April 4, 2007 to July 31, 2007) for Class A, Class T, Class B, Class C, and Institutional Class.
C Hypothetical expenses are equal to each Class' annualized expense ratio (shown in the table below); multiplied by the average account value over the period, multiplied by 181/365 (to reflect the one-half year period).
| Annualized
Expense Ratio |
Class A | 1.37% |
Class T | 1.61% |
Class B | 2.11% |
Class C | 2.10% |
International Real Estate | 1.05% |
Institutional Class | 1.08% |
Annual Report
Investment Changes
Top Ten Stocks as of July 31, 2007 |
| % of fund's
net assets | % of fund's net assets
6 months ago |
Mitsubishi Estate Co. Ltd. | 6.9 | 7.4 |
British Land Co. PLC | 5.8 | 4.8 |
Kerry Properties Ltd. | 4.9 | 4.4 |
IVG Immobilien AG | 4.5 | 2.6 |
Westfield Group unit | 4.0 | 6.4 |
The GPT Group unit | 3.9 | 3.7 |
Unibail-Rodamco | 3.6 | 0.0 |
Land Securities Group PLC | 3.5 | 4.9 |
CapitaLand Ltd. | 3.5 | 2.1 |
Cheung Kong Holdings Ltd. | 2.9 | 2.1 |
| 43.5 | |
Top Five Countries as of July 31, 2007 |
(excluding cash equivalents) | % of fund's
net assets | % of fund's net assets
6 months ago |
Australia | 21.0 | 19.9 |
Hong Kong | 17.6 | 12.0 |
Japan | 17.3 | 20.7 |
United Kingdom | 15.2 | 19.1 |
Germany | 6.6 | 6.5 |
Percentages are adjusted for the effect of open futures contracts, if applicable. |
Top Five REIT Sectors as of July 31, 2007 |
| % of fund's
net assets | % of fund's net assets
6 months ago |
REITs - Management/Investment | 34.6 | 35.6 |
REITs - Shopping Centers | 2.2 | 2.4 |
REITs - Apartments | 1.5 | 2.0 |
REITs - Office Buildings | 1.4 | 2.8 |
REITs - Industrial Buildings | 0.7 | 1.0 |
Asset Allocation (% of fund's net assets) |
As of July 31, 2007 * | As of January 31, 2007 ** |
| Stocks and
Investment
Companies 98.5% | | | Stocks and
Investment
Companies 97.8% | |
| Short-Term
Investments and
Net Other Assets 1.5% | | | Short-Term
Investments and
Net Other Assets 2.2% | |
* Foreign investments | 98.5% | | ** Foreign investments | 97.8% | |

Annual Report
Investments July 31, 2007
Showing Percentage of Net Assets
Common Stocks - 97.6% |
| Shares | | Value |
Australia - 21.0% |
Aspen Group unit | 6,320,625 | | $ 14,003,914 |
CFS Retail Property Trust | 10,309,000 | | 18,887,351 |
Charter Hall Group unit | 7,254,842 | | 17,557,487 |
DB RREEF Trust unit | 18,635,600 | | 28,822,793 |
FKP Property Group unit | 978,123 | | 5,817,882 |
Goodman Group unit | 5,374,309 | | 27,844,682 |
Stockland Corp. Ltd. unit | 2,741,000 | | 18,055,295 |
The GPT Group unit | 10,573,692 | | 40,636,776 |
Westfield Group: | | | |
unit | 2,566,400 | | 41,661,545 |
unit New | 442,269 | | 6,979,809 |
TOTAL AUSTRALIA | | 220,267,534 |
Austria - 0.9% |
Immoeast AG (a) | 686,100 | | 9,012,719 |
Brazil - 0.6% |
EZ Tec Empreendimentos & Participacoes SA | 644,600 | | 4,259,245 |
MRV Engenharia e Participacoes SA | 119,500 | | 1,959,744 |
TOTAL BRAZIL | | 6,218,989 |
Cayman Islands - 2.0% |
New World China Land Ltd. | 19,550,000 | | 20,568,955 |
Finland - 1.5% |
Citycon Oyj | 2,496,403 | | 16,020,820 |
France - 4.8% |
Fonciere Des Regions (d) | 81,000 | | 12,302,835 |
Unibail-Rodamco (d) | 158,517 | | 38,023,751 |
TOTAL FRANCE | | 50,326,586 |
Germany - 6.6% |
DIC Asset AG | 176,960 | | 5,581,401 |
IVG Immobilien AG | 1,277,000 | | 47,057,023 |
Patrizia Immobilien AG (d) | 1,042,000 | | 16,183,065 |
TOTAL GERMANY | | 68,821,489 |
Greece - 2.1% |
Babis Vovos International Technical SA | 692,830 | | 22,089,190 |
Hong Kong - 17.6% |
Cheung Kong Holdings Ltd. | 2,175,000 | | 30,520,220 |
China Overseas Land & Investment Ltd. | 4,260,000 | | 9,022,963 |
Hong Kong Land Holdings Ltd. | 6,779,000 | | 28,878,540 |
Hopson Development Holdings Ltd. | 2,106,000 | | 7,506,748 |
Common Stocks - continued |
| Shares | | Value |
Hong Kong - continued |
Hysan Development Co. Ltd. | 6,780,000 | | $ 17,471,415 |
Kerry Properties Ltd. | 7,185,911 | | 51,783,134 |
Link (REIT) | 7,114,000 | | 14,761,663 |
Sun Hung Kai Properties Ltd. | 1,895,000 | | 24,099,896 |
TOTAL HONG KONG | | 184,044,579 |
India - 0.2% |
Indiabulls Real Estate Ltd. sponsored GDR (a) | 203,855 | | 2,676,616 |
Japan - 17.3% |
Japan Logistics Fund, Inc. (d) | 836 | | 6,958,929 |
Japan Retail Fund Investment Corp. | 985 | | 7,957,667 |
Mitsubishi Estate Co. Ltd. | 2,833,000 | | 72,071,161 |
Mitsui Fudosan Co. Ltd. | 1,160,000 | | 30,287,120 |
Nippon Residential Investment Corp. | 2,957 | | 16,108,919 |
NTT Urban Development Co. | 12,305 | | 22,272,427 |
Sumitomo Realty & Development Co. Ltd. | 857,000 | | 25,463,558 |
TOTAL JAPAN | | 181,119,781 |
Philippines - 2.6% |
Ayala Land, Inc. | 36,233,760 | | 13,567,708 |
Filinvest Land, Inc. | 250,214,000 | | 10,581,738 |
Vista Land & Lifescapes, Inc. | 19,471,000 | | 2,701,923 |
TOTAL PHILIPPINES | | 26,851,369 |
Russia - 0.7% |
PIK Group GDR (a) | 263,600 | | 7,401,888 |
Singapore - 3.5% |
CapitaLand Ltd. | 7,325,900 | | 36,242,909 |
Spain - 1.0% |
Realia Business SA | 1,158,300 | | 10,127,893 |
United Kingdom - 15.2% |
British Land Co. PLC | 2,429,400 | | 61,343,084 |
Capital & Regional PLC | 1,296,500 | | 26,495,124 |
Derwent London PLC | 422,500 | | 14,324,468 |
Land Securities Group PLC | 1,060,500 | | 36,450,751 |
Savills PLC | 1,075,900 | | 11,463,384 |
Songbird Estates PLC Class B | 1,433,200 | | 7,162,050 |
Unite Group PLC | 320,000 | | 2,340,173 |
TOTAL UNITED KINGDOM | | 159,579,034 |
TOTAL COMMON STOCKS (Cost $968,263,629) | 1,021,370,351 |
Investment Companies - 0.9% |
| Shares | | Value |
Luxembourg - 0.9% |
ProLogis European Properties Fund
(Cost $11,897,123) | 594,000 | | $ 9,184,639 |
Money Market Funds - 4.0% |
| | | |
Fidelity Cash Central Fund, 5.38% (b) | 6,256,438 | | 6,256,438 |
Fidelity Securities Lending Cash Central Fund, 5.39% (b)(c) | 35,505,018 | | 35,505,018 |
TOTAL MONEY MARKET FUNDS (Cost $41,761,456) | 41,761,456 |
TOTAL INVESTMENT PORTFOLIO - 102.5% (Cost $1,021,922,208) | | 1,072,316,446 |
NET OTHER ASSETS - (2.5)% | | (26,429,430) |
NET ASSETS - 100% | $ 1,045,887,016 |
Legend |
(a) Non-income producing |
(b) Affiliated fund that is available only to investment companies and other accounts managed by Fidelity Investments. The rate quoted is the annualized seven-day yield of the fund at period end. A complete unaudited listing of the fund's holdings as of its most recent quarter end is available upon request. |
(c) Investment made with cash collateral received from securities on loan. |
(d) Security or a portion of the security is on loan at period end. |
Affiliated Central Funds |
Information regarding fiscal year to date income earned by the Fund from investments in Fidelity Central Funds is as follows: |
Fund | Income earned |
Fidelity Cash Central Fund | $ 1,495,848 |
Fidelity Securities Lending Cash Central Fund | 670,450 |
Total | $ 2,166,298 |
See accompanying notes which are an integral part of the financial statements.
Annual Report
Financial Statements
Statement of Assets and Liabilities
| July 31, 2007 |
Assets | | |
Investment in securities, at value (including securities loaned of $35,591,593) - See accompanying schedule: Unaffiliated issuers (cost $980,160,752) | $ 1,030,554,990 | |
Fidelity Central Funds (cost $41,761,456) | 41,761,456 | |
Total Investments (cost $1,021,922,208) | | $ 1,072,316,446 |
Foreign currency held at value (cost $156) | | 156 |
Receivable for investments sold | | 13,831,367 |
Receivable for fund shares sold | | 1,477,857 |
Dividends receivable | | 3,422,908 |
Distributions receivable from Fidelity Central Funds | | 101,758 |
Prepaid expenses | | 805 |
Other receivables | | 645,459 |
Total assets | | 1,091,796,756 |
| | |
Liabilities | | |
Payable for investments purchased | $ 2,728,217 | |
Payable for fund shares redeemed | 6,535,236 | |
Accrued management fee | 668,181 | |
Distribution fees payable | 4,979 | |
Other affiliated payables | 294,171 | |
Other payables and accrued expenses | 173,938 | |
Collateral on securities loaned, at value | 35,505,018 | |
Total liabilities | | 45,909,740 |
| | |
Net Assets | | $ 1,045,887,016 |
Net Assets consist of: | | |
Paid in capital | | $ 965,220,976 |
Undistributed net investment income | | 15,501,269 |
Accumulated undistributed net realized gain (loss) on investments and foreign currency transactions | | 14,696,166 |
Net unrealized appreciation (depreciation) on investments and assets and liabilities in foreign currencies | | 50,468,605 |
Net Assets | | $ 1,045,887,016 |
See accompanying notes which are an integral part of the financial statements.
Annual Report
Statement of Assets and Liabilities - continued
| July 31, 2007 |
Calculation of Maximum Offering Price Class A:
Net Asset Value and redemption price per share ($5,087,287 ÷ 323,851 shares) | | $ 15.71 |
| | |
Maximum offering price per share (100/94.25 of $15.71) | | $ 16.67 |
Class T:
Net Asset Value and redemption price per share ($2,397,650 ÷ 152,721 shares) | | $ 15.70 |
| | |
Maximum offering price per share (100/96.50 of $15.70) | | $ 16.27 |
Class B:
Net Asset Value and offering price per share ($1,157,900 ÷ 73,897 shares)A | | $ 15.67 |
| | |
Class C:
Net Asset Value and offering price per share ($2,629,333 ÷ 167,749 shares)A | | $ 15.67 |
| | |
International Real Estate:
Net Asset Value, offering price and redemption price per share ($1,032,138,075 ÷ 65,628,364 shares) | | $ 15.73 |
| | |
Institutional Class:
Net Asset Value, offering price and redemption price per share ($2,476,771 ÷ 157,488 shares) | | $ 15.73 |
A Redemption price per share is equal to net asset value less any applicable contingent deferred sales charge.
See accompanying notes which are an integral part of the financial statements.
Annual Report
Financial Statements - continued
Statement of Operations
| Year ended July 31, 2007 |
Investment Income | | |
Dividends | | $ 29,601,642 |
Interest | | 59,101 |
Income from Fidelity Central Funds | | 2,166,298 |
| | 31,827,041 |
Less foreign taxes withheld | | (2,955,827) |
Total income | | 28,871,214 |
| | |
Expenses | | |
Management fee | $ 7,329,886 | |
Transfer agent fees | 2,462,591 | |
Distribution fees | 12,863 | |
Accounting and security lending fees | 478,272 | |
Custodian fees and expenses | 341,426 | |
Independent trustees' compensation | 3,032 | |
Registration fees | 218,117 | |
Audit | 62,980 | |
Legal | 17,143 | |
Interest | 20,398 | |
Miscellaneous | 9,756 | |
Total expenses before reductions | 10,956,464 | |
Expense reductions | (1,145,752) | 9,810,712 |
Net investment income (loss) | | 19,060,502 |
Realized and Unrealized Gain (Loss) Net realized gain (loss) on: | | |
Investment securities: | | |
Unaffiliated issuers (net of foreign taxes of $14,337) | 65,495,797 | |
Foreign currency transactions | (26,616) | |
Total net realized gain (loss) | | 65,469,181 |
Change in net unrealized appreciation (depreciation) on: Investment securities | 11,346,926 | |
Assets and liabilities in foreign currencies | 24,358 | |
Total change in net unrealized appreciation (depreciation) | | 11,371,284 |
Net gain (loss) | | 76,840,465 |
Net increase (decrease) in net assets resulting from operations | | $ 95,900,967 |
See accompanying notes which are an integral part of the financial statements.
Annual Report
Statement of Changes in Net Assets
| Year ended
July 31,
2007 | Year ended
July 31,
2006 |
Increase (Decrease) in Net Assets | | |
Operations | | |
Net investment income (loss) | $ 19,060,502 | $ 6,265,391 |
Net realized gain (loss) | 65,469,181 | 18,392,807 |
Change in net unrealized appreciation (depreciation) | 11,371,284 | 28,618,723 |
Net increase (decrease) in net assets resulting
from operations | 95,900,967 | 53,276,921 |
Distributions to shareholders from net investment income | (8,677,416) | (3,273,462) |
Distributions to shareholders from net realized gain | (61,685,812) | (5,444,196) |
Total distributions | (70,363,228) | (8,717,658) |
Share transactions - net increase (decrease) | 571,194,492 | 242,030,836 |
Redemption fees | 1,300,956 | 283,977 |
Total increase (decrease) in net assets | 598,033,187 | 286,874,076 |
| | |
Net Assets | | |
Beginning of period | 447,853,829 | 160,979,753 |
End of period (including undistributed net investment income of $15,501,269 and undistributed net investment income of $5,544,851, respectively) | $ 1,045,887,016 | $ 447,853,829 |
See accompanying notes which are an integral part of the financial statements.
Annual Report
Financial Highlights - Class A
Year ended July 31, | 2007 I |
Selected Per-Share Data | |
Net asset value, beginning of period | $ 17.46 |
Income from Investment Operations | |
Net investment income (loss) E | .11 |
Net realized and unrealized gain (loss) | (1.87) H |
Total from investment operations | (1.76) |
Redemption fees added to paid in capital E | .01 |
Net asset value, end of period | $ 15.71 |
Total Return B, C, D | (10.02)% |
Ratios to Average Net Assets F, J | |
Expenses before reductions | 1.37% A |
Expenses net of fee waivers, if any | 1.37% A |
Expenses net of all reductions | 1.26% A |
Net investment income (loss) | 2.08% A |
Supplemental Data | |
Net assets, end of period (000 omitted) | $ 5,087 |
Portfolio turnover rate G | 144% |
A Annualized
B Total returns for periods of less than one year are not annualized.
C Total returns would have been lower had certain expenses not been reduced during the periods shown.
D Total returns do not include the effect of the sales charges.
E Calculated based on average shares outstanding during the period.
F Fees and expenses of the underlying Fidelity Central Funds are not included in the Fund's expense ratio. The Fund indirectly bears its proportionate share of the expenses of any underlying Fidelity Central Funds.
G Amount does not include the portfolio activity of any underlying Fidelity Central Funds.
H The amount shown for a share outstanding does not correspond with the aggregate net gain (loss) on investments for the period due to the timing of sales and repurchases of shares in relation to fluctuating market values of the investments of the Fund.
I For the period April 4, 2007 (commencement of sale of shares) to July 31, 2007.
J Expense ratios reflect operating expenses of the class. Expenses before reductions do not reflect amounts reimbursed by the investment adviser or reductions from brokerage service arrangements or other expense offset arrangements and do not represent the amount paid by the class during periods when reimbursements or reductions occur. Expenses net of fee waivers reflect expenses after reimbursement by the investment adviser but prior to reductions from brokerage service arrangements or other expense offset arrangements. Expenses net of all reductions represent the net expenses paid by the class.
See accompanying notes which are an integral part of the financial statements.
Annual Report
Financial Highlights - Class T
Year ended July 31, | 2007 I |
Selected Per-Share Data | |
Net asset value, beginning of period | $ 17.46 |
Income from Investment Operations | |
Net investment income (loss) E | .10 |
Net realized and unrealized gain (loss) | (1.87) H |
Total from investment operations | (1.77) |
Redemption fees added to paid in capital E | .01 |
Net asset value, end of period | $ 15.70 |
Total Return B, C, D | (10.08)% |
Ratios to Average Net Assets F, J | |
Expenses before reductions | 1.61% A |
Expenses net of fee waivers, if any | 1.61% A |
Expenses net of all reductions | 1.51% A |
Net investment income (loss) | 1.90% A |
Supplemental Data | |
Net assets, end of period (000 omitted) | $ 2,398 |
Portfolio turnover rate G | 144% |
A Annualized
B Total returns for periods of less than one year are not annualized.
C Total returns would have been lower had certain expenses not been reduced during the periods shown.
D Total returns do not include the effect of the sales charges.
E Calculated based on average shares outstanding during the period.
F Fees and expenses of the underlying Fidelity Central Funds are not included in the Fund's expense ratio. The Fund indirectly bears its proportionate share of the expenses of any underlying Fidelity Central Funds.
G Amount does not include the portfolio activity of any underlying Fidelity Central Funds.
H The amount shown for a share outstanding does not correspond with the aggregate net gain (loss) on investments for the period due to the timing of sales and repurchases of shares in relation to fluctuating market values of the investments of the Fund.
I For the period April 4, 2007 (commencement of sale of shares) to July 31, 2007.
J Expense ratios reflect operating expenses of the class. Expenses before reductions do not reflect amounts reimbursed by the investment adviser or reductions from brokerage service arrangements or other expense offset arrangements and do not represent the amount paid by the class during periods when reimbursements or reductions occur. Expenses net of fee waivers reflect expenses after reimbursement by the investment adviser but prior to reductions from brokerage service arrangements or other expense offset arrangements. Expenses net of all reductions represent the net expenses paid by the class.
See accompanying notes which are an integral part of the financial statements.
Annual Report
Financial Highlights - Class B
Year ended July 31, | 2007 I |
Selected Per-Share Data | |
Net asset value, beginning of period | $ 17.46 |
Income from Investment Operations | |
Net investment income (loss) E | .07 |
Net realized and unrealized gain (loss) | (1.87) H |
Total from investment operations | (1.80) |
Redemption fees added to paid in capital E | .01 |
Net asset value, end of period | $ 15.67 |
Total Return B, C, D | (10.25)% |
Ratios to Average Net Assets F, J | |
Expenses before reductions | 2.11% A |
Expenses net of fee waivers, if any | 2.11% A |
Expenses net of all reductions | 2.01% A |
Net investment income (loss) | 1.38% A |
Supplemental Data | |
Net assets, end of period (000 omitted) | $ 1,158 |
Portfolio turnover rate G | 144% |
A Annualized
B Total returns for periods of less than one year are not annualized.
C Total returns would have been lower had certain expenses not been reduced during the periods shown.
D Total returns do not include the effect of the contingent deferred sales charge.
E Calculated based on average shares outstanding during the period.
F Fees and expenses of the underlying Fidelity Central Funds are not included in the Fund's expense ratio. The Fund indirectly bears its proportionate share of the expenses of any underlying Fidelity Central Funds.
G Amount does not include the portfolio activity of any underlying Fidelity Central Funds.
H The amount shown for a share outstanding does not correspond with the aggregate net gain (loss) on investments for the period due to the timing of sales and repurchases of shares in relation to fluctuating market values of the investments of the Fund.
I For the period April 4, 2007 (commencement of sale of shares) to July 31, 2007.
J Expense ratios reflect operating expenses of the class. Expenses before reductions do not reflect amounts reimbursed by the investment adviser or reductions from brokerage service arrangements or other expense offset arrangements and do not represent the amount paid by the class during periods when reimbursements or reductions occur. Expenses net of fee waivers reflect expenses after reimbursement by the investment adviser but prior to reductions from brokerage service arrangements or other expense offset arrangements. Expenses net of all reductions represent the net expenses paid by the class.
See accompanying notes which are an integral part of the financial statements.
Annual Report
Financial Highlights - Class C
Year ended July 31, | 2007 I |
Selected Per-Share Data | |
Net asset value, beginning of period | $ 17.46 |
Income from Investment Operations | |
Net investment income (loss) E | .07 |
Net realized and unrealized gain (loss) | (1.87) H |
Total from investment operations | (1.80) |
Redemption fees added to paid in capital E | .01 |
Net asset value, end of period | $ 15.67 |
Total Return B, C, D | (10.25)% |
Ratios to Average Net Assets F, J | |
Expenses before reductions | 2.10% A |
Expenses net of fee waivers, if any | 2.10% A |
Expenses net of all reductions | 2.00% A |
Net investment income (loss) | 1.35% A |
Supplemental Data | |
Net assets, end of period (000 omitted) | $ 2,629 |
Portfolio turnover rate G | 144% |
A Annualized
B Total returns for periods of less than one year are not annualized.
C Total returns would have been lower had certain expenses not been reduced during the periods shown.
D Total returns do not include the effect of the contingent deferred sales charge.
E Calculated based on average shares outstanding during the period.
F Fees and expenses of the underlying Fidelity Central Funds are not included in the Fund's expense ratio. The Fund indirectly bears its proportionate share of the expenses of any underlying Fidelity Central Funds.
G Amount does not include the portfolio activity of any underlying Fidelity Central Funds.
H The amount shown for a share outstanding does not correspond with the aggregate net gain (loss) on investments for the period due to the timing of sales and repurchases of shares in relation to fluctuating market values of the investments of the Fund.
I For the period April 4, 2007 (commencement of sale of shares) to July 31, 2007.
J Expense ratios reflect operating expenses of the class. Expenses before reductions do not reflect amounts reimbursed by the investment adviser or reductions from brokerage service arrangements or other expense offset arrangements and do not represent the amount paid by the class during periods when reimbursements or reductions occur. Expenses net of fee waivers reflect expenses after reimbursement by the investment adviser but prior to reductions from brokerage service arrangements or other expense offset arrangements. Expenses net of all reductions represent the net expenses paid by the class.
See accompanying notes which are an integral part of the financial statements.
Annual Report
Financial Highlights - International Real Estate
Years ended July 31, | 2007 | 2006 | 2005 G |
Selected Per-Share Data | | | |
Net asset value, beginning of period | $ 14.69 | $ 12.09 | $ 10.00 |
Income from Investment Operations | | | |
Net investment income (loss) D | .31 | .30 | .23 |
Net realized and unrealized gain (loss) | 2.35 | 2.93 | 1.91 |
Total from investment operations | 2.66 | 3.23 | 2.14 |
Distributions from net investment income | (.22) | (.24) | (.03) |
Distributions from net realized gain | (1.42) | (.40) | (.03) |
Total distributions | (1.64) | (.64) | (.06) |
Redemption fees added to paid in capital D | .02 | .01 | .01 |
Net asset value, end of period | $ 15.73 | $ 14.69 | $ 12.09 |
Total Return B, C | 19.01% | 27.85% | 21.53% |
Ratios to Average Net Assets E, H | | | |
Expenses before reductions | 1.07% | 1.12% | 1.29% A |
Expenses net of fee waivers, if any | 1.06% | 1.12% | 1.29% A |
Expenses net of all reductions | .96% | .91% | 1.27% A |
Net investment income (loss) | 1.86% | 2.23% | 2.21% A |
Supplemental Data | | | |
Net assets, end of period (000 omitted) | $ 1,032,138 | $ 447,854 | $ 160,980 |
Portfolio turnover rate F | 144% | 234% | 36% A |
A Annualized
B Total returns for periods of less than one year are not annualized.
C Total returns would have been lower had certain expenses not been reduced during the periods shown.
D Calculated based on average shares outstanding during the period.
E Fees and expenses of the underlying Fidelity Central Funds are not included in the Fund's expense ratio. The Fund indirectly bears its proportionate share of the expenses of any underlying Fidelity Central Funds.
F Amount does not include the portfolio activity of any underlying Fidelity Central Funds.
G For the period September 8, 2004 (commencement of operations) to July 31, 2005.
H Expense ratios reflect operating expenses of the class. Expenses before reductions do not reflect amounts reimbursed by the investment adviser or reductions from brokerage service arrangements or other expense offset arrangements and do not represent the amount paid by the class during periods when reimbursements or reductions occur. Expenses net of fee waivers reflect expenses after reimbursement by the investment adviser but prior to reductions from brokerage service arrangements or other expense offset arrangements. Expenses net of all reductions represent the net expenses paid by the class.
See accompanying notes which are an integral part of the financial statements.
Annual Report
Financial Highlights - Institutional Class
Year ended July 31, | 2007 H |
Selected Per-Share Data | |
Net asset value, beginning of period | $ 17.46 |
Income from Investment Operations | |
Net investment income (loss) D | .12 |
Net realized and unrealized gain (loss) | (1.86) G |
Total from investment operations | (1.74) |
Redemption fees added to paid in capital D | .01 |
Net asset value, end of period | $ 15.73 |
Total Return B, C | (9.91)% |
Ratios to Average Net Assets E, I | |
Expenses before reductions | 1.08% A |
Expenses net of fee waivers, if any | 1.08% A |
Expenses net of all reductions | .97% A |
Net investment income (loss) | 2.27% A |
Supplemental Data | |
Net assets, end of period (000 omitted) | $ 2,477 |
Portfolio turnover rate F | 144% |
A Annualized
B Total returns for periods of less than one year are not annualized.
C Total returns would have been lower had certain expenses not been reduced during the periods shown.
D Calculated based on average shares outstanding during the period.
E Fees and expenses of the underlying Fidelity Central Funds are not included in the Fund's expense ratio. The Fund indirectly bears its proportionate share of the expenses of any underlying Fidelity Central Funds.
F Amount does not include the portfolio activity of any underlying Fidelity Central Funds.
G The amount shown for a share outstanding does not correspond with the aggregate net gain (loss) on investments for the period due to the timing of sales and repurchases of shares in relation to fluctuating market values of the investments of the Fund.
H For the period April 4, 2007 (commencement of sale of shares) to July 31, 2007.
I Expense ratios reflect operating expenses of the class. Expenses before reductions do not reflect amounts reimbursed by the investment adviser or reductions from brokerage service arrangements or other expense offset arrangements and do not represent the amount paid by the class during periods when reimbursements or reductions occur. Expenses net of fee waivers reflect expenses after reimbursement by the investment adviser but prior to reductions from brokerage service arrangements or other expense offset arrangements. Expenses net of all reductions represent the net expenses paid by the class.
See accompanying notes which are an integral part of the financial statements.
Annual Report
Notes to Financial Statements
For the period ended July 31, 2007
1. Organization.
Fidelity International Real Estate Fund (the Fund) is a non-diversified fund of Fidelity Securities Fund (the trust) and is authorized to issue an unlimited number of shares. The trust is registered under the Investment Company Act of 1940, as amended (the 1940 Act), as an open-end management investment company organized as a Massachusetts business trust. The Fund offers Class A, Class T, Class B, Class C, International Real Estate, and Institutional Class shares, each of which has equal rights as to assets and voting privileges. Each class has exclusive voting rights with respect to matters that affect that class. The Fund commenced sale of Class A, Class T, Class B, Class C and Institutional Class shares and the existing class was designated International Real Estate on April 4, 2007. Class B shares will automatically convert to Class A shares after a holding period of seven years from the initial date of purchase. Investment income, realized and unrealized capital gains and losses, the common expenses of the Fund, and certain fund-level expense reductions, if any, are allocated on a pro rata basis to each class based on the relative net assets of each class to the total net assets of the Fund. Each class differs with respect to transfer agent and distribution and service plan fees incurred. Certain expense reductions also differ by class. The Fund's investments in emerging markets can be subject to social, economic, regulatory, and political uncertainties and can be extremely volatile.
2. Investments in Fidelity Central Funds.
The Fund may invest in Fidelity Central Funds which are open-end investment companies available only to other investment companies and accounts managed by Fidelity Management & Research Company (FMR) and its affiliates. The Fund's Schedule of Investments lists each of the Fidelity Central Funds as an investment of the Fund, but does not include the underlying holdings of each Fidelity Central Fund. As an Investing Fund, the Fund indirectly bears its proportionate share of the expenses of the underlying Fidelity Central Funds.
The Money Market Central Funds seek preservation of capital and current income and are managed by Fidelity Investments Money Management, Inc. (FIMM), an affiliate of FMR.
A complete list of holdings for each Fidelity Central Fund is available upon request or at the SEC's web site at www.sec.gov. In addition, the financial statements of the Fidelity Central Funds, which are not covered by the Fund's Report of Independent Registered Public Accounting Firm, are available on the SEC's web site or upon request.
3. Significant Accounting Policies.
The financial statements have been prepared in conformity with accounting principles generally accepted in the United States of America, which require management to make certain estimates and assumptions at the date of the financial statements. The following summarizes the significant accounting policies of the Fund:
Annual Report
3. Significant Accounting Policies - continued
Security Valuation. Investments are valued and net asset value (NAV) per share is calculated (NAV calculation) as of the close of business of the New York Stock Exchange (NYSE), normally 4:00 p.m. Eastern time. Wherever possible, the Fund uses independent pricing services approved by the Board of Trustees to value its investments.
Equity securities, including restricted securities, for which market quotations are readily available, are valued at the last reported sale price or official closing price as reported by an independent pricing service on the primary market or exchange on which they are traded. In the event there were no sales during the day or closing prices are not available, securities are valued at the last quoted bid price. Investments in open-end mutual funds, including the Fidelity Central Funds, are valued at their closing net asset value each business day. Short-term securities with remaining maturities of sixty days or less for which quotations are not readily available are valued at amortized cost, which approximates value.
When current market prices or quotations are not readily available or do not accurately reflect fair value, valuations may be determined in accordance with procedures adopted by the Board of Trustees. For example, when developments occur between the close of a market and the close of the NYSE that may materially affect the value of some or all of the securities, or when trading in a security is halted, those securities may be fair valued. Factors used in the determination of fair value may include monitoring news to identify significant market or security specific events such as changes in the value of U.S. securities markets, reviewing developments in foreign markets and evaluating the performance of ADRs, futures contracts and exchange-traded funds. Because the Fund's utilization of fair value pricing depends on market activity, the frequency with which fair value pricing is used cannot be predicted and may be utilized to a significant extent. The value of securities used for NAV calculation under fair value pricing may differ from published prices for the same securities.
Foreign Currency. The Fund uses foreign currency contracts to facilitate transactions in foreign-denominated securities. Losses from these transactions may arise from changes in the value of the foreign currency or if the counterparties do not perform under the contracts' terms.
Foreign-denominated assets, including investment securities, and liabilities are translated into U.S. dollars at the exchange rate at period end. Purchases and sales of investment securities, income and dividends received and expenses denominated in foreign currencies are translated into U.S. dollars at the exchange rate in effect on the transaction date.
The effects of exchange rate fluctuations on investments are included with the net realized and unrealized gain (loss) on investment securities. Other foreign currency transactions resulting in realized and unrealized gain (loss) are disclosed separately.
Annual Report
Notes to Financial Statements - continued
3. Significant Accounting Policies - continued
Investment Transactions and Income. For financial reporting purposes, the Fund's investment holdings and NAV include trades executed through the end of the last business day of the period. The NAV for processing shareholder transactions includes trades executed through the end of the prior business day. Gains and losses on securities sold are determined on the basis of identified cost. Dividend income is recorded on the ex-dividend date, except for certain dividends from foreign securities where the ex-dividend date may have passed, which are recorded as soon as the Fund is informed of the ex-dividend date. Non-cash dividends included in dividend income, if any, are recorded at the fair market value of the securities received. Distributions received on securities that represent a return of capital or capital gain are recorded as a reduction of cost of investments and/or as a realized gain. The Fund estimates the components of distributions received that may be considered return of capital distributions or capital gain distributions. Interest income and distributions from the Fidelity Central Funds are accrued as earned. Interest income includes coupon interest and amortization of premium and accretion of discount on debt securities. Investment income is recorded net of foreign taxes withheld where recovery of such taxes is uncertain.
Expenses. Most expenses of the trust can be directly attributed to a fund. Expenses which cannot be directly attributed are apportioned among each Fund in the trust. Expense estimates are accrued in the period to which they relate and adjustments are made when actual amounts are known.
Income Tax Information and Distributions to Shareholders. Each year, the Fund intends to qualify as a regulated investment company by distributing all of its taxable income and realized gains under Subchapter M of the Internal Revenue Code. As a result, no provision for income taxes is required in the accompanying financial statements. Foreign taxes are provided for based on the Fund's understanding of the tax rules and rates that exist in the foreign markets in which it invests.
Distributions are recorded on the ex-dividend date. Income dividends and capital gain distributions are declared separately for each class. Income and capital gain distributions are determined in accordance with income tax regulations, which may differ from generally accepted accounting principles. In addition, the Fund will claim a portion of the payment made to redeeming shareholders as a distribution for income tax purposes.
Capital accounts within the financial statements are adjusted for permanent book-tax differences. These adjustments have no impact on net assets or the results of operations. Temporary book-tax differences will reverse in a subsequent period.
Book-tax differences are primarily due to foreign currency transactions, certain foreign taxes, passive foreign investment companies (PFIC), and losses deferred due to wash sales.
Annual Report
3. Significant Accounting Policies - continued
Income Tax Information and Distributions to Shareholders - continued
The tax-basis components of distributable earnings and the federal tax cost as of period end were as follows:
Unrealized appreciation | $ 94,707,335 |
Unrealized depreciation | (87,911,618) |
Net unrealized appreciation (depreciation) | 6,795,717 |
Undistributed ordinary income | 54,277,494 |
Undistributed long-term capital gain | 4,675,655 |
| |
Cost for federal income tax purposes | $ 1,065,520,729 |
The tax character of distributions paid was as follows:
| July 31, 2007 | July 31, 2006 |
Ordinary Income | $ 58,738,310 | $ 8,431,124 |
Long-term Capital Gains | 11,624,918 | 286,534 |
Total | $ 70,363,228 | $ 8,717,658 |
Short-Term Trading (Redemption) Fees. Shares held in the Fund less than 90 days are subject to a redemption fee equal to 1.50% of the proceeds of the redeemed shares. All redemption fees, including any estimated redemption fees paid by FMR, are retained by the Fund and accounted for as an addition to paid in capital.
New Accounting Pronouncements. In July 2006, Financial Accounting Standards Board Interpretation No. 48, Accounting for Uncertainty in Income Taxes - an interpretation of FASB Statement 109 (FIN 48), was issued and is effective on the last business day of the semiannual reporting period for fiscal years beginning after December 15, 2006. FIN 48 sets forth a threshold for financial statement recognition, measurement and disclosure of a tax position taken or expected to be taken on a tax return. Management has concluded that the adoption of FIN 48 will not result in a material impact on the Fund's net assets, results of operations and financial statement disclosures.
In addition, in September 2006, Statement of Financial Accounting Standards No. 157, Fair Value Measurements (SFAS 157), was issued and is effective for fiscal years beginning after November 15, 2007. SFAS 157 defines fair value, establishes a framework for measuring fair value and expands disclosures about fair value measurements. Management is currently evaluating the impact the adoption of SFAS 157 will have on the Fund's financial statement disclosures.
Annual Report
Notes to Financial Statements - continued
4. Operating Policies.
Repurchase Agreements. FMR has received an Exemptive Order from the Securities and Exchange Commission (the SEC) which permits the Fund and other affiliated entities of FMR to transfer uninvested cash balances into joint trading accounts which are then invested in repurchase agreements. The Fund may also invest directly with institutions in repurchase agreements. Repurchase agreements are collateralized by government or non-government securities. Upon settlement date, collateral is held in segregated accounts with custodian banks and may be obtained in the event of a default of the counterparty. The Fund monitors, on a daily basis, the value of the collateral to ensure it is at least equal to the principal amount of the repurchase agreement (including accrued interest). In the event of a default by the counterparty, realization of the collateral proceeds could be delayed, during which time the value of the collateral may decline.
5. Purchases and Sales of Investments.
Purchases and sales of securities, other than short-term securities, aggregated $1,940,342,064 and $1,414,287,899, respectively.
6. Fees and Other Transactions with Affiliates.
Management Fee. FMR and its affiliates provide the Fund with investment management related services for which the Fund pays a monthly management fee. The management fee is the sum of an individual fund fee rate that is based on an annual rate of .45% of the Fund's average net assets and a group fee rate that averaged .26% during the period. The group fee rate is based upon the average net assets of all the mutual funds advised by FMR. The group fee rate decreases as assets under management increase and increases as assets under management decrease. For the period, the total annual management fee rate was .71% of the Fund's average net assets.
Distribution and Service Plan. In accordance with Rule 12b-1 of the 1940 Act, the Fund has adopted separate Distribution and Service Plans for each class of shares. Certain classes pay Fidelity Distributors Corporation (FDC), an affiliate of FMR, separate Distribution and Service Fees, each of which is based on an annual percentage of each class' average net assets. In addition, FDC may pay financial intermediaries for selling shares of the Fund and providing shareholder support services. For the period, the Distribution and Service Fee rates and the total amounts paid to and retained by FDC were as follows:
| Distribution
Fee | Service
Fee | Paid to
FDC | Retained
by FDC |
Class A | 0% | .25% | $ 2,571 | $ 377 |
Class T | .25% | .25% | 2,562 | 1,280 |
Class B | .75% | .25% | 2,468 | 1,922 |
Class C | .75% | .25% | 5,262 | 4,263 |
| | | $ 12,863 | $ 7,842 |
Annual Report
6. Fees and Other Transactions with Affiliates - continued
Sales Load. FDC receives a front-end sales charge of up to 5.75% for selling Class A shares, and 3.50% for selling Class T shares, some of which is paid to financial intermediaries for selling shares of the Fund. FDC receives the proceeds of contingent deferred sales charges levied on Class A, Class T, Class B, and Class C redemptions. These charges depend on the holding period. The deferred sales charges range from 5% to 1% for Class B, 1% for Class C, 1.00% to .50% for certain purchases of Class A shares and .25% for certain purchases of Class T shares.
For the period, sales charge amounts retained by FDC were as follows:
| Retained
by FDC |
Class A | $ 17,963 |
Class T | 4,269 |
Class C* | 29 |
| $ 22,261 |
* When Class C shares are initially sold, FDC pays commissions from its own resources to financial intermediaries through which the sales are made.
Transfer Agent Fees. Fidelity Investments Institutional Operations Company, Inc. (FIIOC), an affiliate of FMR, is the transfer, dividend disbursing and shareholder servicing agent for each class of the Fund, except for International Real Estate. Fidelity Service Company, Inc. (FSC), an affiliate of FMR, is the transfer agent for International Real Estate shares. FIIOC and FSC receive account fees and asset-based fees that vary according to the account size and type of account of the shareholders of the respective classes of the Fund. FIIOC and FSC pay for typesetting, printing and mailing of shareholder reports, except proxy statements. For the period, the total transfer agent fees paid by each class to FIIOC or FSC, were as follows:
| Amount | % of
Average
Net Assets |
Class A | $ 2,951 | .29 * |
Class T | 1,450 | .28 * |
Class B | 705 | .28 * |
Class C | 1,464 | .28 * |
International Real Estate | 2,454,942 | .24 |
Institutional Class | 1,079 | .24 * |
| $ 2,462,591 | |
* Annualized
Annual Report
Notes to Financial Statements - continued
6. Fees and Other Transactions with Affiliates - continued
Accounting and Security Lending Fees. FSC maintains the Fund's accounting records. The accounting fee is based on the level of average net assets for the month. Under a separate contract, FSC administers the security lending program. The security lending fee is based on the number and duration of lending transactions.
Interfund Lending Program. Pursuant to an Exemptive Order issued by the SEC, the Fund, along with other registered investment companies having management contracts with FMR, may participate in an interfund lending program. This program provides an alternative credit facility allowing the funds to borrow from, or lend money to, other participating affiliated funds. At period end, there were no interfund loans outstanding. The Fund's activity in this program during the period for which loans were outstanding was as follows:
Borrower or Lender | Average Daily
Loan Balance | Weighted Average
Interest Rate | Interest
Expense |
Borrower | $ 10,469,077 | 5.40% | $ 20,398 |
7. Committed Line of Credit.
The Fund participates with other funds managed by FMR in a $4.2 billion credit facility (the "line of credit") to be utilized for temporary or emergency purposes to fund shareholder redemptions or for other short-term liquidity purposes. The Fund has agreed to pay commitment fees on its pro rata portion of the line of credit, which amounted to $1,511 and is reflected in Miscellaneous Expense on the Statement of Operations. During the period, there were no borrowings on this line of credit.
8. Security Lending.
The Fund lends portfolio securities from time to time in order to earn additional income. On the settlement date of the loan, the Fund receives collateral (in the form of U.S. Treasury obligations, letters of credit and/or cash) against the loaned securities and maintains collateral in an amount not less than 100% of the market value of the loaned securities during the period of the loan. The market value of the loaned securities is determined at the close of business of the Fund and any additional required collateral is delivered to the Fund on the next business day. If the borrower defaults on its obligation to return the securities loaned because of insolvency or other reasons, a fund could experience delays and costs in recovering the securities loaned or in gaining access to the collateral. Any cash collateral received is invested in the Fidelity Securities Lending Cash Central Fund. The value of loaned securities and cash collateral at period end are disclosed on the Fund's Statement of Assets and Liabilities. Security lending income represents the income earned on investing cash collateral, less fees and expenses associated
Annual Report
8. Security Lending - continued
with the loan, plus any premium payments that may be received on the loan of certain types of securities. Security lending income is presented in the Statement of Operations as a component of income from Fidelity Central Funds. Net income from lending portfolio securities during the period amounted to $670,450.
9. Expense Reductions.
FMR voluntarily agreed to reimburse a portion of International Real Estate's operating expenses. During the period, this reimbursement reduced the class' expenses by $65,025.
Many of the brokers with whom FMR places trades on behalf of the Fund provided services to the Fund in addition to trade execution. These services included payments of certain expenses on behalf of the Fund totaling $1,069,050 for the period. In addition, through arrangements with each class' transfer agent, credits realized as a result of uninvested cash balances were used to reduce the Fund's expenses. During the period, credits reduced each class' transfer agent expense as noted in the table below.
| Transfer Agent
expense reduction |
Class B | $ 2 |
International Real Estate | 11,675 |
| $ 11,677 |
10. Other.
The Fund's organizational documents provide former and current trustees and officers with a limited indemnification against liabilities arising in connection with the performance of their duties to the Fund. In the normal course of business, the Fund may also enter into contracts that provide general indemnifications. The Fund's maximum exposure under these arrangements is unknown as this would be dependent on future claims that may be made against the Fund. The risk of material loss from such claims is considered remote.
11. Distributions to Shareholders.
Distributions to shareholders of each class were as follows:
Years ended July 31, | 2007 | 2006 |
From net investment income | | |
International Real Estate | $ 8,677,416 | $ 3,273,462 |
From net realized gain | | |
International Real Estate | $ 61,685,812 | $ 5,444,196 |
Annual Report
Notes to Financial Statements - continued
12. Share Transactions.
Transactions for each class of shares were as follows:
| Shares | Dollars |
Years ended July 31, | 2007 A | 2006 | 2007 A | 2006 |
Class A | | | | |
Shares sold | 352,797 | - | $ 6,021,703 | $ - |
Shares redeemed | (28,946) | - | (470,996) | - |
Net increase (decrease) | 323,851 | - | $ 5,550,707 | $ - |
Class T | | | | |
Shares sold | 163,911 | - | $ 2,804,594 | $ - |
Shares redeemed | (11,190) | - | (189,267) | - |
Net increase (decrease) | 152,721 | - | $ 2,615,327 | $ - |
Class B | | | | |
Shares sold | 74,357 | - | $ 1,273,355 | $ - |
Shares redeemed | (460) | - | (7,526) | - |
Net increase (decrease) | 73,897 | - | $ 1,265,829 | $ - |
Class C | | | | |
Shares sold | 188,521 | - | $ 3,213,374 | $ - |
Shares redeemed | (20,772) | - | (352,540) | - |
Net increase (decrease) | 167,749 | - | $ 2,860,834 | $ - |
International Real Estate | | | | |
Shares sold | 78,643,461 | 23,490,365 | $ 1,288,512,778 | $ 327,866,574 |
Reinvestment of distributions | 4,249,998 | 646,412 | 65,004,744 | 7,986,974 |
Shares redeemed | (47,753,325) | (6,968,124) | (797,297,400) | (93,822,712) |
Net increase (decrease) | 35,140,134 | 17,168,653 | $ 556,220,122 | $ 242,030,836 |
Institutional Class | | | | |
Shares sold | 158,866 | - | $ 2,704,482 | $ - |
Shares redeemed | (1,378) | - | (22,809) | - |
Net increase (decrease) | 157,488 | - | $ 2,681,673 | $ - |
A Share transactions for Class A, Class T, Class B, Class C, and Institutional Class are for the period April 4, 2007 (commencement of sale of shares) to July 31, 2007.
Annual Report
Report of Independent Registered Public Accounting Firm
To the Trustees of Fidelity Securities Fund and the Shareholders of Fidelity International Real Estate Fund:
In our opinion, the accompanying statement of assets and liabilities, including the schedule of investments, and the related statements of operations and of changes in net assets and the financial highlights present fairly, in all material respects, the financial position of Fidelity International Real Estate Fund (a fund of Fidelity Securities Fund) at July 31, 2007, the results of its operations for the year then ended, the changes in its net assets for each of the two years in the period then ended and the financial highlights for each of the periods indicated, in conformity with accounting principles generally accepted in the United States of America. These financial statements and financial highlights (hereafter referred to as "financial statements") are the responsibility of the Fidelity International Real Estate Fund's management. Our responsibility is to express an opinion on these financial statements based on our audits. We conducted our audits of these financial statements in accordance with the standards of the Public Company Accounting Oversight Board (United States). Those standards require that we plan and perform the audit to obtain reasonable assurance about whether the financial statements are free of material misstatement. An audit includes examining, on a test basis, evidence supporting the amounts and disclosures in the financial statements, assessing the accounting principles used and significant estimates made by management, and evaluating the overall financial statement presentation. We believe that our audits, which included confirmation of securities at July 31, 2007 by correspondence with the custodian and brokers, provide a reasonable basis for our opinion.
/s/ PricewaterhouseCoopers LLP
PricewaterhouseCoopers LLP
Boston, Massachusetts
September 18, 2007
Annual Report
Trustees and Officers
The Trustees, Members of the Advisory Board, and executive officers of the trust and fund, as applicable, are listed below. The Board of Trustees governs the fund and is responsible for protecting the interests of shareholders. The Trustees are experienced executives who meet periodically throughout the year to oversee the fund's activities, review contractual arrangements with companies that provide services to the fund, and review the fund's performance. Except for James C. Curvey, each of the Trustees oversees 353 funds advised by FMR or an affiliate. Mr. Curvey oversees 317 funds advised by FMR or an affiliate.
The Trustees hold office without limit in time except that (a) any Trustee may resign; (b) any Trustee may be removed by written instrument, signed by at least two-thirds of the number of Trustees prior to such removal; (c) any Trustee who requests to be retired or who has become incapacitated by illness or injury may be retired by written instrument signed by a majority of the other Trustees; and (d) any Trustee may be removed at any special meeting of shareholders by a two-thirds vote of the outstanding voting securities of the trust. Each Trustee who is not an interested person (as defined in the 1940 Act) (Independent Trustee), shall retire not later than the last day of the calendar year in which his or her 72nd birthday occurs. The Independent Trustees may waive this mandatory retirement age policy with respect to individual Trustees. The executive officers and Advisory Board Members hold office without limit in time, except that any officer and Advisory Board Member may resign or may be removed by a vote of a majority of the Trustees at any regular meeting or any special meeting of the Trustees. Except as indicated, each individual has held the office shown or other offices in the same company for the past five years.
The fund's Statements of Additional Information (SAI) includes more information about the Trustees. To request a free copy, call Fidelity at 1-877-208-0098.
Interested Trustees *:
Correspondence intended for each Trustee who is an interested person may be sent to Fidelity Investments, 82 Devonshire Street, Boston, Massachusetts 02109.
Name, Age; Principal Occupation |
Edward C. Johnson 3d (77) |
| Year of Election or Appointment: 1984 Mr. Johnson is Chairman of the Board of Trustees. Mr. Johnson serves as President (2006-present), Chief Executive Officer, Chairman, and a Director of FMR Corp.; Chairman and a Director of FMR; Chairman and a Director of Fidelity Research & Analysis Company (FRAC); Chairman and a Director of Fidelity Investments Money Management, Inc.; and Chairman (2001-present) and a Director of FMR Co., Inc. In addition, Mr. Johnson serves as Chairman and Director of Fidelity International Limited (FIL). |
James C. Curvey (72) |
| Year of Election or Appointment: 2007 Mr. Curvey also serves as Trustee (2007-present) or Member of the Advisory Board (2007-present) of other investment companies advised by FMR. Mr. Curvey is Vice Chairman (2006-present) and Director of FMR Corp. Mr. Curvey joined Fidelity in 1982 and served in numerous senior management positions, including President and Chief Operating Officer of FMR Corp. (1997-2000) and President of Fidelity Strategic Investments (2000-2002). In addition, he serves as a member of the Board of Directors of Geerlings & Wade, Inc. (wine distribution). |
* Trustees have been determined to be "Interested Trustees" by virtue of, among other things, their affiliation with the trust or various entities under common control with FMR.
Independent Trustees:
Correspondence intended for each Independent Trustee (that is, the Trustees other than the Interested Trustees) may be sent to Fidelity Investments, P.O. Box 55235, Boston, Massachusetts 02205-5235.
Name, Age; Principal Occupation |
Dennis J. Dirks (59) |
| Year of Election or Appointment: 2005 Prior to his retirement in May 2003, Mr. Dirks was Chief Operating Officer and a member of the Board of The Depository Trust & Clearing Corporation (DTCC) (1999-2003). He also served as President, Chief Operating Officer, and Board member of The Depository Trust Company (DTC) (1999-2003) and President and Board member of the National Securities Clearing Corporation (NSCC) (1999-2003). In addition, Mr. Dirks served as Chief Executive Officer and Board member of the Government Securities Clearing Corporation (2001-2003) and Chief Executive Officer and Board member of the Mortgage-Backed Securities Clearing Corporation (2001-2003). Mr. Dirks also serves as a Trustee and a member of the Finance Committee of Manhattan College (2005-present) and a Trustee and a member of the Finance Committee of AHRC of Nassau County (2006-present). |
Albert R. Gamper, Jr. (65) |
| Year of Election or Appointment: 2006 Prior to his retirement in December 2004, Mr. Gamper served as Chairman of the Board of CIT Group Inc. (commercial finance). During his tenure with CIT Group Inc. Mr. Gamper served in numerous senior management positions, including Chairman (1987-1989; 1999-2001; 2002-2004), Chief Executive Officer (1987-2004), and President (1989-2002). He currently serves as a member of the Board of Directors of Public Service Enterprise Group (utilities, 2001-present), Chairman of the Board of Governors, Rutgers University (2004-present), and Chairman of the Board of Saint Barnabas Health Care System. |
George H. Heilmeier (71) |
| Year of Election or Appointment: 2004 Dr. Heilmeier is Chairman Emeritus of Telcordia Technologies (communication software and systems), where prior to his retirement, he served as company Chairman and Chief Executive Officer. He currently serves on the Boards of Directors of The Mitre Corporation (systems engineering and information technology support for the government), and HRL Laboratories (private research and development, 2004-present). He is Chairman of the General Motors Science & Technology Advisory Board and a Life Fellow of the Institute of Electrical and Electronics Engineers (IEEE). Dr. Heilmeier is a member of the Defense Science Board and the National Security Agency Advisory Board. He is also a member of the National Academy of Engineering, the American Academy of Arts and Sciences, and the Board of Overseers of the School of Engineering and Applied Science of the University of Pennsylvania. Previously, Dr. Heilmeier served as a Director of TRW Inc. (automotive, space, defense, and information technology, 1992-2002), Compaq (1994-2002), Automatic Data Processing, Inc. (ADP) (technology-based business outsourcing, 1995-2002), INET Technologies Inc. (telecommunications network surveillance, 2001-2004), and Teletech Holdings (customer management services). He is the recipient of the 2005 Kyoto Prize in Advanced Technology for his invention of the liquid crystal display, and a member of the Consumer Electronics Hall of Fame. |
James H. Keyes (66) |
| Year of Election or Appointment: 2007 Prior to his retirement in 2003, Mr. Keyes was Chairman, President, and Chief Executive Officer of Johnson Controls, Inc. (automotive supplier, 1993-2003). He currently serves as a member of the boards of LSI Logic Corporation (semiconductor technologies), Navistar International Corporation (manufacture and sale of trucks, buses, and diesel engines, 2002-present), and Pitney Bowes, Inc. (integrated mail, messaging, and document management solutions). |
Marie L. Knowles (60) |
| Year of Election or Appointment: 2001 Prior to Ms. Knowles' retirement in June 2000, she served as Executive Vice President and Chief Financial Officer of Atlantic Richfield Company (ARCO) (diversified energy, 1996-2000). From 1993 to 1996, she was a Senior Vice President of ARCO and President of ARCO Transportation Company. She served as a Director of ARCO from 1996 to 1998. She currently serves as a Director of Phelps Dodge Corporation (copper mining and manufacturing) and McKesson Corporation (healthcare service, 2002-present). Ms. Knowles is a Trustee of the Brookings Institution and the Catalina Island Conservancy and also serves as a member of the Advisory Board for the School of Engineering of the University of Southern California. |
Ned C. Lautenbach (63) |
| Year of Election or Appointment: 2000 Mr. Lautenbach is Chairman of the Independent Trustees (2006-present). Mr. Lautenbach has been a partner of Clayton, Dubilier & Rice, Inc. (private equity investment firm) since September 1998. Previously, Mr. Lautenbach was with the International Business Machines Corporation (IBM) from 1968 until his retirement in 1998. Mr. Lautenbach serves as a Director of Sony Corporation (2006-present) and Eaton Corporation (diversified industrial) as well as the Philharmonic Center for the Arts in Naples, Florida. He also is a member of the Board of Trustees of Fairfield University (2005-present), as well as a member of the Council on Foreign Relations. |
Cornelia M. Small (63) |
| Year of Election or Appointment: 2005 Ms. Small is a member (2000-present) and Chairperson (2002-present) of the Investment Committee, and a member (2002-present) of the Board of Trustees of Smith College. Previously, she served as Chief Investment Officer (1999-2000), Director of Global Equity Investments (1996-1999), and a member of the Board of Directors of Scudder, Stevens & Clark (1990-1997) and Scudder Kemper Investments (1997-1999). In addition, Ms. Small served as Co-Chair (2000-2003) of the Annual Fund for the Fletcher School of Law and Diplomacy. |
William S. Stavropoulos (68) |
| Year of Election or Appointment: 2002 Mr. Stavropoulos is Chairman Emeritus of the Board of Directors of The Dow Chemical Company. Since joining The Dow Chemical Company in 1967, Mr. Stavropoulos served in numerous senior management positions, including President (1993-2000; 2002-2003), CEO (1995-2000; 2002-2004), and Chairman of the Executive Committee (2000-2004). Currently, he is a Director of NCR Corporation (data warehousing and technology solutions), Chemical Financial Corporation, Maersk Inc. (industrial conglomerate, 2002-present), Tyco International, Inc. (multinational manufacturing and services, 2007-present), and a member of the Advisory Board for Metalmark Capital (private equity investment firm, 2005-present). He is a special advisor to Clayton, Dubilier & Rice, Inc., a private equity investment firm. He also serves as a member of the Board of Trustees of the American Enterprise Institute for Public Policy Research. In addition, Mr. Stavropoulos is a member of The Business Council, J.P. Morgan International Council and the University of Notre Dame Advisory Council for the College of Science. |
Kenneth L. Wolfe (68) |
| Year of Election or Appointment: 2005 Prior to his retirement in 2001, Mr. Wolfe was Chairman and Chief Executive Officer of Hershey Foods Corporation (1993-2001). He currently serves as a member of the boards of Adelphia Communications Corporation (2003-present), Bausch & Lomb, Inc., and Revlon Inc. (2004-present). |
Advisory Board Members and Executive Officers:
Correspondence intended for Mr. Mauriello may be sent to Fidelity Investments, P.O. Box 55235, Boston, Massachusetts 02205-5235. Correspondence intended for each executive officer and Mr. Lynch may be sent to Fidelity Investments, 82 Devonshire Street, Boston, Massachusetts 02109.
Name, Age; Principal Occupation |
Peter S. Lynch (63) |
| Year of Election or Appointment: 2003 Member of the Advisory Board of Fidelity Securities Fund. Mr. Lynch is Vice Chairman and a Director of FMR, and Vice Chairman (2001-present) and a Director of FMR Co., Inc. Previously, Mr. Lynch served as a Trustee of the Fidelity funds (1990-2003). In addition, he serves as a Trustee of Boston College and as the Chairman of the Inner-City Scholarship Fund. |
Joseph Mauriello (62) |
| Year of Election or Appointment: 2007 Member of the Advisory Board of Fidelity Securities Fund. Prior to his retirement in January 2006, Mr. Mauriello served in numerous senior management positions including Deputy Chairman and Chief Operating Officer (2004-2005), and Vice Chairman of Financial Services (2002-2004) of KPMG LLP US (professional services firm, 1965-2005). Mr. Mauriello currently serves as a member of the Board of Directors of XL Capital Ltd., (global insurance and re-insurance company, 2006-present) and of Arcadia Resources Inc., (health care services and products, 2007-present). He also served as a Director of the Hamilton Funds of the Bank of New York (2006-2007). |
Kimberley H. Monasterio (43) |
| Year of Election or Appointment: 2007 President and Treasurer of the fund. Ms. Monasterio also serves as President and Treasurer of other Fidelity funds (2007-present) and is an employee of FMR (2004-present). Previously, Ms. Monasterio served as Deputy Treasurer of the Fidelity funds (2004-2006). Before joining Fidelity Investments, Ms. Monasterio served as Treasurer (2000-2004) and Chief Financial Officer (2002-2004) of the Franklin Templeton Funds and Senior Vice President of Franklin Templeton Services, LLC (2000-2004). |
Dwight D. Churchill (53) |
| Year of Election or Appointment: 2005 Vice President of the fund. Mr. Churchill also serves as Vice President of certain Equity Funds (2005-present). Mr. Churchill is Executive Vice President of FMR (2005-present) and FMR Co., Inc. (2005-present). Previously, Mr. Churchill served as Senior Vice President of Fidelity Investments Money Management, Inc. (2005-2006), Head of Fidelity's Fixed-Income Division (2000-2005), Vice President of Fidelity's Money Market Funds (2000-2005), Vice President of Fidelity's Bond Funds, and Senior Vice President of FMR. |
Steven J. Buller (40) |
| Year of Election or Appointment: 2007 Vice President of the fund. Mr. Buller also serves as Vice President of another fund advised by FMR. Prior to assuming his current responsibilities, Mr. Buller worked as a research analyst and a portfolio manager. Mr. Buller also serves as Vice President of FMR (2000) and FMR Co., Inc. (2001). |
Eric D. Roiter (58) |
| Year of Election or Appointment: 2004 Secretary of the fund. He also serves as Secretary of other Fidelity funds; Vice President, General Counsel, and Secretary of FMR Co., Inc. (2001-present) and FMR; Assistant Secretary of Fidelity Management & Research (U.K.) Inc. (2001-present), Fidelity Research & Analysis Company (2001-present), and Fidelity Investments Money Management, Inc. (2001-present). Mr. Roiter is an Adjunct Member, Faculty of Law, at Boston College Law School (2003-present). Previously, Mr. Roiter served as Vice President and Secretary of Fidelity Distributors Corporation (FDC) (1998-2005). |
Scott C. Goebel (39) |
| Year of Election or Appointment: 2007 Assistant Secretary of the fund. Mr. Goebel also serves as Assistant Secretary of other Fidelity funds (2007-present), Vice President and Secretary of FDC (2006-present), and is an employee of FMR. |
R. Stephen Ganis (41) |
| Year of Election or Appointment: 2006 Anti-Money Laundering (AML) officer of the fund. Mr. Ganis also serves as AML officer of other Fidelity funds (2006-present) and FMR Corp. (2003-present). Before joining Fidelity Investments, Mr. Ganis practiced law at Goodwin Procter, LLP (2000-2002). |
Joseph B. Hollis (59) |
| Year of Election or Appointment: 2006 Chief Financial Officer of the fund. Mr. Hollis also serves as Chief Financial Officer of other Fidelity funds. Mr. Hollis is President of Fidelity Pricing and Cash Management Services (FPCMS) (2005-present). Mr. Hollis also serves as President and Director of Fidelity Service Company, Inc. (2006-present). Previously, Mr. Hollis served as Senior Vice President of Cash Management Services (1999-2002) and Investment Management Operations (2002-2005). |
Kenneth A. Rathgeber (60) |
| Year of Election or Appointment: 2004 Chief Compliance Officer of the fund. Mr. Rathgeber also serves as Chief Compliance Officer of other Fidelity funds (2004-present) and Executive Vice President of Risk Oversight for Fidelity Investments (2002-present). He is Chief Compliance Officer of FMR (2005-present), FMR Co., Inc. (2005-present), Fidelity Management & Research (U.K.) Inc. (2005-present), Fidelity Research & Analysis Company (2005-present), Fidelity Investments Money Management, Inc. (2005-present), and Strategic Advisers, Inc. (2005-present). Previously, Mr. Rathgeber served as Executive Vice President and Chief Operating Officer for Fidelity Investments Institutional Services Company, Inc. (1998-2002). |
Bryan A. Mehrmann (46) |
| Year of Election or Appointment: 2005 Deputy Treasurer of the fund. Mr. Mehrmann also serves as Deputy Treasurer of other Fidelity funds (2005-present) and is an employee of FMR. Previously, Mr. Mehrmann served as Vice President of Fidelity Investments Institutional Services Group (FIIS)/Fidelity Investments Institutional Operations Corporation, Inc. (FIIOC) Client Services (1998-2004). |
Kenneth B. Robins (37) |
| Year of Election or Appointment: 2005 Deputy Treasurer of the fund. Mr. Robins also serves as Deputy Treasurer of other Fidelity funds (2005-present) and is an employee of FMR (2004-present). Before joining Fidelity Investments, Mr. Robins worked at KPMG LLP, where he was a partner in KPMG's department of professional practice (2002-2004) and a Senior Manager (1999-2000). In addition, Mr. Robins served as Assistant Chief Accountant, United States Securities and Exchange Commission (2000-2002). |
Robert G. Byrnes (40) |
| Year of Election or Appointment: 2005 Assistant Treasurer of the fund. Mr. Byrnes also serves as Assistant Treasurer of other Fidelity funds (2005-present) and is an employee of FMR (2005-present). Previously, Mr. Byrnes served as Vice President of FPCMS (2003-2005). Before joining Fidelity Investments, Mr. Byrnes worked at Deutsche Asset Management where he served as Vice President of the Investment Operations Group (2000-2003). |
Name, Age; Principal Occupation |
Peter L. Lydecker (53) |
| Year of Election or Appointment: 2004 Assistant Treasurer of the fund. Mr. Lydecker also serves as Assistant Treasurer of other Fidelity funds (2004) and is an employee of FMR. |
Gary W. Ryan (48) |
| Year of Election or Appointment: 2005 Assistant Treasurer of the fund. Mr. Ryan also serves as Assistant Treasurer of other Fidelity funds (2005-present) and is an employee of FMR (2005-present). Previously, Mr. Ryan served as Vice President of Fund Reporting in FPCMS (1999-2005). |
Annual Report
Distributions
The Board of Trustees of Fidelity International Real Estate Fund voted to pay to shareholders of record at the opening of business on record date, the following distributions per share derived from capital gains realized from sales of portfolio securities, and dividends derived from net investment income:
| Pay Date | Record Date | Dividends | Capital Gains |
Institutional Class | 09/10/2007 | 09/07/2007 | $.224 | $.780 |
The fund hereby designates as a capital gain dividend with respect to the taxable year ended July 31, 2007, $8,966,251, or, if subsequently determined to be different, the net capital gain of such year.
The fund will notify shareholders in January 2008 of amounts for use in preparing 2007 income tax returns.
Annual Report
Board Approval of Investment Advisory Contracts and Management Fees
Fidelity International Real Estate Fund
Each year, typically in July, the Board of Trustees, including the Independent Trustees (together, the Board), votes on the renewal of the management contract and sub-advisory agreements (together, the Advisory Contracts) for the fund. The Board, assisted by the advice of fund counsel and Independent Trustees' counsel, requests and considers a broad range of information throughout the year.
The Board meets regularly each month except August and takes into account throughout the year matters bearing on Advisory Contracts. The Board, acting directly and through its separate committees, considers at each of its meetings factors that are relevant to the annual renewal of the fund's Advisory Contracts, including the services and support provided to the fund and its shareholders. At the time of the renewal, the Board had 12 standing committees, each composed of Independent Trustees with varying backgrounds, to which the Board has assigned specific subject matter responsibilities in order to enhance effective decision-making by the Board. Each committee has adopted a written charter outlining the structure and purposes of the committee. One such committee, the Equity Contract Committee, meets periodically as needed throughout the year to consider matters specifically related to the annual renewal of Advisory Contracts. The committee requests and receives information on, and makes recommendations to the Independent Trustees concerning, the approval and annual review of the Advisory Contracts.
At its July 2007 meeting, the Board of Trustees, including the Independent Trustees, unanimously determined to renew the Advisory Contracts for the fund. In reaching its determination, the Board considered all factors it believed relevant, including (i) the nature, extent, and quality of the services to be provided to the fund and its shareholders (including the investment performance of the fund); (ii) the competitiveness of the management fee and total expenses of the fund; (iii) the total costs of the services to be provided by and the profits to be realized by the investment adviser and its affiliates from the relationship with the fund; (iv) the extent to which economies of scale would be realized as the fund grows; and (v) whether fee levels reflect these economies of scale, if any, for the benefit of fund shareholders. The Board also approved amendments to the fund's agreements with foreign sub-advisers to clarify that each sub-adviser provides services as an independent contractor.
In determining whether to renew the Advisory Contracts for the fund, the Board ultimately reached a determination, with the assistance of fund counsel and Independent Trustees' counsel, that the renewal of the Advisory Contracts and the compensation to be received by Fidelity under the management contract is consistent with Fidelity's fiduciary duty under applicable law. In addition to evaluating the specific factors noted above, the Board, in reaching its determination, is aware that shareholders in the fund have a broad range of investment choices available to them, including a wide choice among mutual funds offered by competitors to Fidelity, and that the fund's shareholders, with the opportunity to review and weigh the disclosure provided by the fund in its prospectus and other public disclosures, have chosen to invest in this fund, managed by Fidelity.
Annual Report
Nature, Extent, and Quality of Services Provided. The Board considered staffing within the investment adviser, FMR, and the sub-advisers (together, the Investment Advisers), including the background of the fund's portfolio manager and the fund's investment objective and discipline. The Independent Trustees also had discussions with senior management of Fidelity's investment operations and investment groups. The Board considered the structure of the portfolio manager compensation program and whether this structure provides appropriate incentives.
Resources Dedicated to Investment Management and Support Services. The Board reviewed the size, education, and experience of the Investment Advisers' investment staff, their use of technology, and the Investment Advisers' approach to recruiting, training, and retaining portfolio managers and other research, advisory, and management personnel. The Board considered Fidelity's extensive global research capabilities that enable the Investment Advisers to aggregate data from various sources in an effort to produce positive investment results. The Board noted that Fidelity's analysts have access to a variety of technological tools that enable them to perform both fundamental and quantitative analysis and to specialize in various disciplines. The Board also considered that Fidelity's portfolio managers and analysts have access to daily portfolio attribution that allows for monitoring of a fund's portfolio, as well as an electronic communication system that provides immediate real-time access to research concerning issuers and credit enhancers.
Shareholder and Administrative Services. The Board considered (i) the nature, extent, quality, and cost of advisory, administrative, distribution, and shareholder services performed by the Investment Advisers and their affiliates under the Advisory Contracts and under separate agreements covering transfer agency, pricing and bookkeeping, and securities lending services for the fund; (ii) the nature and extent of the Investment Advisers' supervision of third party service providers, principally custodians and subcustodians; and (iii) the resources devoted to, and the record of compliance with, the fund's compliance policies and procedures. The Board reviewed the allocation of fund brokerage, including allocations to brokers affiliated with the Investment Advisers, the use of brokerage commissions to pay fund expenses, and the use of "soft" commission dollars to pay for research services. The Board also considered that Fidelity voluntarily pays for market data out of its own resources. The Board also considered the agreement reached between the Independent Trustees and Fidelity in December 2006 following an independent review of matters relating to receipt of travel, entertainment, gifts and gratuities in violation of Fidelity policies.
The Board noted that the growth of fund assets across the complex allows Fidelity to reinvest in the development of services designed to enhance the value or convenience of the Fidelity funds as investment vehicles. These services include 24-hour access to account information and market information through phone representatives and over the Internet, and investor education materials and asset allocation tools.
Annual Report
Board Approval of Investment Advisory Contracts and
Management Fees - continued
Investment in a Large Fund Family. The Board considered the benefits to shareholders of investing in a Fidelity fund, including the benefits of investing in a fund that is part of a large family of funds offering a variety of investment disciplines and providing for a large variety of mutual fund investor services. For example, fund shareholders are offered the privilege of exchanging shares of the fund for shares of other Fidelity funds, as set forth in the fund's prospectus, without paying a sales charge. The Board noted that, since the last Advisory Contract renewals in July 2006, Fidelity has taken a number of actions that benefited particular funds, including (i) dedicating additional resources to investment research and to restructure the investment research teams; (ii) contractually agreeing to reduce the management fee on Fidelity Advisor Floating Rate High Income Fund; (iii) contractually agreeing to reduce the management fees on Fidelity's California, Massachusetts, New Jersey, and New York AMT Tax-Free Money Market Funds, launching new Institutional Classes and Service Classes of these funds, and contractually agreeing to impose expense limitations on these funds; (iv) eliminating the exchange fee on the Fidelity Select Portfolios and reducing the pricing and bookkeeping fee rates for these funds; (v) reducing the maximum transfer agency fee rates on high income funds and certain equity funds; (vi) proposing amended management contracts that, if approved by shareholders, will add a performance adjustment component to the management fees paid by 18 Fidelity Advisor equity funds; (vii) contractually agreeing to reduce fees for Ultra-Short Central Fund and the money market Central Funds; (viii) waiving the Fidelity Advisor funds' contingent deferred sales charge on certain redemptions made through systematic withdrawal programs; and (ix) amending the management contracts for equity and fixed-income funds whose management contracts incorporate a "group fee" structure by adding four new fee "breakpoints" to the group fee rate schedules.
Investment Performance and Compliance. The Board considered whether the fund has operated within its investment objective, as well as its record of compliance with its investment restrictions. It also reviewed the fund's absolute investment performance, as well as the fund's relative investment performance measured against a broad-based securities market index. The Board noted that FMR does not believe that a meaningful peer group exists against which to compare the fund's performance. Because the fund had been in existence less than three calendar years, the following chart considered by the Board shows, for the one-year period ended December 31, 2006, the fund's total return and the total return of a broad-based securities market index ("benchmark"). (The fund did not offer Advisor classes as of December 31, 2006.)
Annual Report
Fidelity International Real Estate Fund

The Board stated that the relative investment performance of the fund was lower than its benchmark for the period shown. The Board stated that it is difficult to evaluate in any comprehensive fashion the performance of the fund, in light of its relatively recent commencement of operations.
The Board considered that FMR has taken steps to refocus and strengthen equity research, equity portfolio management, and compliance.
Based on its review, and giving particular weight to the nature and quality of the resources dedicated by the Investment Advisers to maintain and improve relative performance, the Board concluded that the nature, extent, and quality of the services provided to the fund will benefit the fund's shareholders, particularly in light of the Board's view that the fund's shareholders benefit from investing in a fund that is part of a large family of funds offering a variety of investment disciplines and services.
Competitiveness of Management Fee and Total Fund Expenses. The Board considered the fund's management fee and total expenses compared to "mapped groups" of competitive funds and classes. Fidelity creates "mapped groups" by combining similar Lipper investment objective categories that have comparable management fee characteristics. Combining Lipper investment objective categories aids the Board's management fee and total expense comparisons by broadening the competitive group used for comparison and by reducing the number of universes to which various Fidelity funds are compared. The Board also considered supplemental information about how the fund's management fee and total expenses ranked relative to groups based on Lipper classifications, which take into account a fund's market capitalization and style.
Annual Report
Board Approval of Investment Advisory Contracts and
Management Fees - continued
The Board considered two proprietary management fee comparisons for the 12-month (or shorter) periods shown in the chart below. The group of Lipper funds used by the Board for management fee comparisons is referred to below as the "Total Mapped Group." The Total Mapped Group comparison focuses on a fund's standing relative to the total universe of comparable funds available to investors, in terms of gross management fees before expense reimbursements or caps. "TMG %" represents the percentage of funds in the Total Mapped Group that had management fees that were lower than the fund's. For example, a TMG % of 30% means that 70% of the funds in the Total Mapped Group had higher management fees than the fund. The "Asset-Size Peer Group" (ASPG) comparison focuses on a fund's standing relative to non-Fidelity funds similar in size to the fund within the Total Mapped Group. The ASPG represents at least 15% of the funds in the Total Mapped Group with comparable asset size and management fee characteristics, subject to a minimum of 50 funds (or all funds in the Total Mapped Group if fewer than 50). Additional information, such as the ASPG quartile in which the fund's management fee ranked, is also included in the chart and considered by the Board.
Fidelity International Real Estate Fund
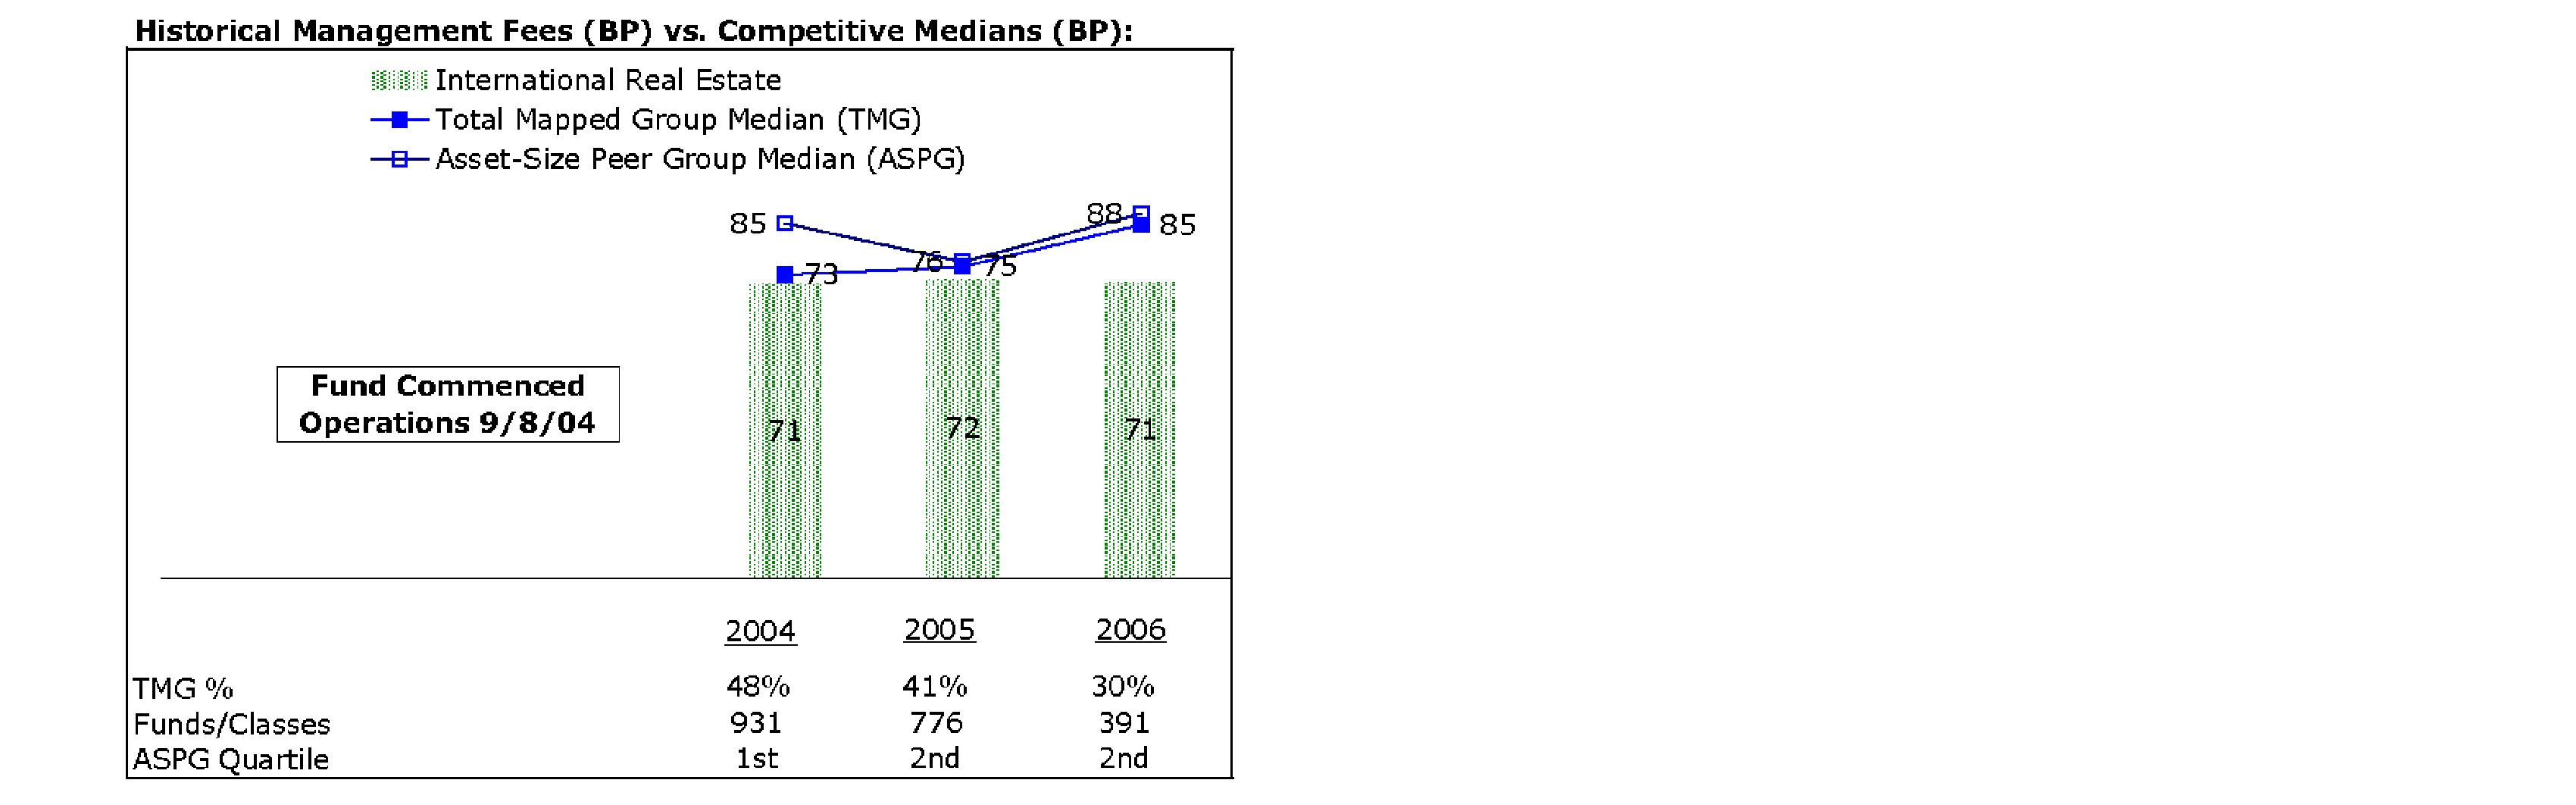
The Board noted that the fund's management fee ranked below the median of its Total Mapped Group and below the median of its ASPG for 2006.
Based on its review, the Board concluded that the fund's management fee was fair and reasonable in light of the services that the fund receives and the other factors considered.
In its review of the fund's total expenses, the Board considered the fund's management fee as well as other fund expenses, such as transfer agent fees, pricing and bookkeeping fees, and custodial, legal, and audit fees. The Board also noted the effects of any waivers and reimbursements on fees and expenses. As part of its review, the Board also considered current and historical total expenses of the fund compared to competitive fund median expenses. The fund is compared to those funds and classes in the Total Mapped Group (used by the Board for management fee comparisons) that have a similar sales load structure.
Annual Report
The Board noted that the fund's total expenses ranked below its competitive median for 2006.
In its review of total expenses, the Board also considered Fidelity fee structures and other information on clients that FMR and its affiliates service in other competitive markets, such as other mutual funds advised or subadvised by FMR or its affiliates, pension plan clients, and other institutional clients.
Based on its review, the Board concluded that the fund's total expenses were reasonable, although above the median of the universe presented for comparison, in light of the services that the fund and its shareholders receive and the other factors considered.
Costs of the Services and Profitability. The Board considered the revenues earned and the expenses incurred by Fidelity in conducting the business of developing, marketing, distributing, managing, administering and servicing the fund and its shareholders. The Board also considered the level of Fidelity's profits in respect of all the Fidelity funds.
On an annual basis, FMR presents to the Board Fidelity's profitability for the fund. Fidelity calculates the profitability for each fund, as well as aggregate profitability for groups of Fidelity funds and all Fidelity funds, using a series of detailed revenue and cost allocation methodologies which originate with the audited books and records of Fidelity. The Audit Committee of the Board reviews any significant changes from the prior year's methodologies.
PricewaterhouseCoopers LLP (PwC), independent registered public accounting firm and auditor to Fidelity and certain Fidelity funds, has been engaged annually by the Board as part of the Board's assessment of the results of Fidelity's profitability analysis. PwC's engagement includes the review and assessment of Fidelity's methodologies used in determining the revenues and expenses attributable to Fidelity's mutual fund business, and completion of agreed-upon procedures surrounding the mathematical accuracy of fund profitability and its conformity to allocation methodologies. After considering PwC's reports issued under the engagement and information provided by Fidelity, the Board believes that while other allocation methods may also be reasonable, Fidelity's profitability methodologies are reasonable in all material respects.
The Board has also reviewed Fidelity's non-fund businesses and any fall-out benefits related to the mutual fund business as well as cases where Fidelity's affiliates may benefit from or be related to the fund's business.
Annual Report
Board Approval of Investment Advisory Contracts and
Management Fees - continued
The Board considered the costs of the services provided by and the profits realized by Fidelity in connection with the operation of the fund and determined that the amount of profit is a fair entrepreneurial profit for the management of the fund.
Economies of Scale. The Board considered whether there have been economies of scale in respect of the management of the Fidelity funds, whether the Fidelity funds (including the fund) have appropriately benefited from any such economies of scale, and whether there is potential for realization of any further economies of scale. The Board considered the extent to which the fund will benefit from economies of scale through increased services to the fund, through waivers or reimbursements, or through fee or expense reductions, including reductions that occur through operation of the transfer agent agreement. The transfer agent fee varies in part based on the number of accounts in the fund. If the number of accounts decreases or the average account size increases, the overall transfer agent fee rate decreases.
The Board recognized that the fund's management contract incorporates a "group fee" structure, which provides for lower group fee rates as total fund assets under FMR's management increase, and for higher group fee rates as total fund assets under FMR's management decrease. FMR determines the group fee rates based on a tiered asset "breakpoint" schedule. In connection with the renewal of the fund's management contract, the Board approved amendments to the fund's management contract that added four new fee breakpoints to the group fee rate schedule for assets under FMR's management above $1,386 billion. The Board considered that the group fee rate declines under both the present and amended schedules, but that under the amended schedule, the group fee rate declines faster as assets under FMR's management exceed $1,386 billion. The Board considered that the group fee is designed to deliver the benefits of economies of scale to fund shareholders when total fund assets increase, even if assets of any particular fund are unchanged or have declined, because some portion of Fidelity's costs are attributable to services provided to all Fidelity funds, and all funds benefit if those costs can be allocated among more assets. The Board concluded that, given the group fee structure, fund shareholders will achieve a certain level of economies of scale as assets under FMR's management increase at the fund complex level, regardless of whether Fidelity achieves any such economies of scale.
The Board further concluded that any potential economies of scale are being shared between fund shareholders and Fidelity in an appropriate manner.
Additional Information Requested by the Board. In order to develop fully the factual basis for consideration of the Fidelity funds' Advisory Contracts, the Board requested and received additional information on several topics, including (i) fund performance trends and actions to be taken by FMR to improve certain funds' overall performance; (ii) Fidelity's portfolio manager compensation structure, including its effects on fund profitability and the extent to which portfolio manager compensation is linked to fund performance; (iii) Fidelity's fee structures; (iv) the funds' sub-advisory arrangements; and (v) accounts managed by Fidelity other than the Fidelity funds.
Annual Report
Based on its evaluation of all of the conclusions noted above, and after considering all material factors, the Board ultimately concluded that the advisory fee structures are fair and reasonable, and that the fund's Advisory Contracts should be renewed.
Annual Report
Annual Report
Annual Report
Annual Report
Annual Report
Investment Adviser
Fidelity Management & Research Company
Boston, MA
Investment Sub-Advisers
FMR Co., Inc.
Fidelity Research & Analysis Company
Fidelity Management & Research
(U.K.) Inc.
Fidelity Investments Japan Limited
Fidelity International Investment
Advisers
Fidelity International Investment
Advisers (U.K.) Limited
General Distributor
Fidelity Distributors Corporation
Boston, MA
Transfer and Service Agent
Fidelity Investments Institutional
Operations Company, Inc.
Boston, MA
Fidelity Service Company, Inc.
Boston, MA
Custodian
Mellon Bank, N.A.
Pittsburgh, PA
AIREI-UANN-0907
1.843171.100
(Fidelity Investment logo)(registered trademark)
Fidelity®
Leveraged Company Stock
Fund
Annual Report
July 31, 2007
(2_fidelity_logos) (Registered_Trademark)
Contents
Chairman's Message | <Click Here> | Ned Johnson's message to shareholders. |
Performance | <Click Here> | How the fund has done over time. |
Management's Discussion | <Click Here> | The manager's review of fund performance, strategy and outlook. |
Shareholder Expense Example | <Click Here> | An example of shareholder expenses. |
Investment Changes | <Click Here> | A summary of major shifts in the fund's investments over the last six months. |
Investments | <Click Here> | A complete list of the fund's investments with their market values. |
Financial Statements | <Click Here> | Statements of assets and liabilities, operations, and changes in net assets,
as well as financial highlights. |
Notes | <Click Here> | Notes to the financial statements. |
Report of Independent Registered Public Accounting Firm | <Click Here> | |
Trustees and Officers | <Click Here> | |
Distributions | <Click Here> | |
Board Approval of Investment Advisory Contracts and Management Fees | <Click Here> | |
To view a fund's proxy voting guidelines and proxy voting record for the 12-month period ended June 30, visit http://www.fidelity.com (search for "proxy voting guidelines") or visit the Securities and Exchange Commission's (SEC) web site at http://www.sec.gov. You may also call 1-800-544-8544 to request a free copy of the proxy voting guidelines.
Standard & Poor's, S&P and S&P 500 are registered service marks of The McGraw-Hill Companies, Inc. and have been licensed for use by Fidelity Distributors Corporation.
Other third party marks appearing herein are the property of their respective owners.
All other marks appearing herein are registered or unregistered trademarks or service marks of FMR Corp. or an affiliated company.
Annual Report
This report and the financial statements contained herein are submitted for the general information of the shareholders of the fund. This report is not authorized for distribution to prospective investors in the fund unless preceded or accompanied by an effective prospectus.
A fund files its complete schedule of portfolio holdings with the SEC for the first and third quarters of each fiscal year on Form N-Q. Forms N-Q are available on the SEC's web site at http://www.sec.gov. A fund's Forms N-Q may be reviewed and copied at the SEC's Public Reference Room in Washington, DC. Information regarding the operation of the SEC's Public Reference Room may be obtained by calling 1-800-SEC-0330. For a complete list of a fund's portfolio holdings, view the most recent holdings listing, semiannual report, or annual report on Fidelity's web site at http://www.fidelity.com or http://www.advisor.fidelity.com, as applicable.
NOT FDIC INSURED · MAY LOSE VALUE · NO BANK GUARANTEE
Neither the fund nor Fidelity Distributors Corporation is a bank.
Annual Report
Chairman's Message
(photo_of_Edward_C_Johnson_3d)
Dear Shareholder:
Stocks are currently on pace to register their fifth straight year of positive returns, although gains could be trimmed if the U.S. economy continues to slow. While financial markets are always unpredictable, there are a number of time-tested principles that can put the historical odds in your favor.
One of the basic tenets is to invest for the long term. Over time, riding out the markets' inevitable ups and downs has proven much more effective than selling into panic or chasing the hottest trend. Even missing only a few of the markets' best days can significantly diminish investor returns. Patience also affords the benefits of compounding - of earning interest on additional income or reinvested dividends and capital gains. There are tax advantages and cost benefits to consider as well. The more you sell, the more taxes you pay, and the more you trade, the higher the costs. While staying the course doesn't eliminate risk, it can considerably lessen the effect of short-term declines.
You can further manage your investing risk through diversification. And today, more than ever, geographic diversification should be taken into account. Studies indicate that asset allocation is the single most important determinant of a portfolio's long-term success. The right mix of stocks, bonds and cash - aligned to your particular risk tolerance and investment objective - is very important. Age-appropriate rebalancing is also an essential aspect of asset allocation. For younger investors, an emphasis on equities - which historically have been the best-performing asset class over time - is encouraged. As investors near their specific goal, such as retirement or sending a child to college, consideration may be given to replacing volatile assets (e.g. common stocks) with more-stable fixed investments (bonds or savings plans).
A third investment principle - investing regularly - can help lower the average cost of your purchases. Investing a certain amount of money each month or quarter helps ensure you won't pay for all your shares at market highs. This strategy - known as dollar cost averaging - also reduces unconstructive "emotion" from investing, helping shareholders avoid selling weak performers just prior to an upswing, or chasing a hot performer just before a correction.
We invite you to contact us via the Internet, through our Investor Centers or over the phone. It is our privilege to provide you the information you need to make the investments that are right for you.
Sincerely,
/s/Edward C. Johnson 3d
Edward C. Johnson 3d
Annual Report
Performance: The Bottom Line
Average annual total return reflects the change in the value of an investment, assuming reinvestment of the fund's dividend income and capital gains (the profits earned upon the sale of securities that have grown in value) and assuming a constant rate of performance each year. The $10,000 table and the fund's returns do not reflect the deduction of taxes that a shareholder would pay on fund distributions or the redemption of fund shares. During periods of reimbursement by Fidelity, a fund's total return will be greater than it would be had the reimbursement not occurred. How a fund did yesterday is no guarantee of how it will do tomorrow.
Average Annual Total Returns
Periods ended July 31, 2007 | Past 1
year | Past 5
years | Life of
fundA |
Fidelity® Leveraged Company Stock Fund | 27.08% | 39.80% | 23.39% |
A From December 19, 2000
$10,000 Over Life of Fund
Let's say hypothetically that $10,000 was invested in Fidelity ® Leveraged Company Stock Fund on December 19, 2000, when the fund started. The chart shows how the value of your investment would have changed, and also shows how the Standard & Poor's 500SM Index performed over the same period.
Annual Report
Management's Discussion of Fund Performance
Comments from Thomas Soviero, Portfolio Manager of Fidelity® Leveraged Company Stock Fund
Major U.S. equity benchmarks approached or exceeded gains of 20% and several set record highs during the 12-month period ending July 31, 2007. In that time, the Dow Jones Industrial AverageSM rose 20.84%, the Standard & Poor's 500SM Index advanced 16.13% and the NASDAQ Composite® Index gained 22.67%. The small-cap Russell 2000® Index fared less well after falling nearly 7% in July, but still returned 12.12% for the year overall. The first half of the period featured six consecutive months of positive returns spurred by the more relaxed monetary policy of the Federal Reserve Board and falling energy prices, which softened inflationary pressures on the U.S. economy. Stocks slipped in February, however, as energy prices crept higher, the housing market slumped, subprime mortgage woes mounted and the Chinese stock market declined 9% in a single day. But equities soared again from March through May, as reflected by the Dow and the S&P 500®, which climbed nearly 12% and more than 9%, respectively. In June and July, though, stocks sank again on inflation concerns and a worsening subprime loan crisis.
For the 12 months that ended July 31, 2007, Fidelity Leveraged Company Stock Fund returned 27.08%, easily outperforming the S&P 500 and the 22.50% return of the Credit Suisse Leveraged Equity Index. The main contributor to the fund's outperformance of the S&P 500 was a significant overweighting of and successful stock selection in materials. Carrying almost no financials stocks - which make up more than 20% of the S&P 500 - also bolstered relative returns, as this sector lagged. Good stock picking within consumer discretionary and industrials helped further. On the downside, less-favorable security selection in and an underweighting of telecommunication services dampened relative performance. Top contributors included out-of-benchmark positions in semiconductor testing and packaging firm Amkor Technology, ON Semiconductor, funeral home operator Service Corp. International, specialty chemical company Celanese and heavy-construction services provider Foster Wheeler. Overweighting index component Freeport-McMoRan Copper & Gold further helped returns. Conversely, semiconductor manufacturer Advanced Micro Devices, an out-of-benchmark position in Canadian printed circuit board manufacturer Celestica - no longer held - and not owning selected index components that fared well - including Cisco Systems, Apple and Exxon Mobil - detracted from relative performance.
The views expressed above reflect those of the portfolio manager(s) only through the end of the period as stated on the cover of this report and do not necessarily represent the views of Fidelity or any other person in the Fidelity organization. Any such views are subject to change at any time based upon market or other conditions and Fidelity disclaims any responsibility to update such views. These views may not be relied on as investment advice and, because investment decisions for a Fidelity fund are based on numerous factors, may not be relied on as an indication of trading intent on behalf of any Fidelity fund.
Annual Report
Shareholder Expense Example
As a shareholder of the Fund, you incur two types of costs: (1) transaction costs, including redemption fees, and (2) ongoing costs, including management fees and other Fund expenses. This Example is intended to help you understand your ongoing costs (in dollars) of investing in the Fund and to compare these costs with the ongoing costs of investing in other mutual funds.
The Example is based on an investment of $1,000 invested at the beginning of the period and held for the entire period (February 1, 2007 to July 31, 2007).
Actual Expenses
The first line of the accompanying table provides information about actual account values and actual expenses. You may use the information in this line, together with the amount you invested, to estimate the expenses that you paid over the period. Simply divide your account value by $1,000.00 (for example, an $8,600 account value divided by $1,000.00 = 8.6), then multiply the result by the number in the first line under the heading entitled "Expenses Paid During Period" to estimate the expenses you paid on your account during this period. A small balance maintenance fee of $12.00 that is charged once a year may apply for certain accounts with a value of less than $2,000. This fee is not included in the table below. If it was, the estimate of expenses you paid during the period would be higher, and your ending account value lower, by this amount. In addition, the Fund, as a shareholder in the underlying Fidelity Central Funds, will indirectly bear its pro rata share of the fees and expenses incurred by the underlying Fidelity Central Funds. These fees and expenses are not included in the Fund's annualized expense ratio used to calculate the expense estimate in the table below.
Hypothetical Example for Comparison Purposes
The second line of the accompanying table provides information about hypothetical account values and hypothetical expenses based on the Fund's actual expense ratio and an assumed rate of return of 5% per year before expenses, which is not the Fund's actual return. The hypothetical account values and expenses may not be used to estimate the actual ending account balance or expenses you paid for the period. You may use this information to compare the ongoing costs of investing in the Fund and other funds. To do so, compare this 5% hypothetical example with the 5% hypothetical examples that appear in the shareholder reports of the other funds. A small balance maintenance fee of $12.00 that is charged once a year may apply for certain accounts with a value of less than $2,000. This fee is not included in the table below. If it was, the estimate of expenses you paid during the period would be higher, and your ending account value lower, by this amount. In addition, the Fund, as a shareholder in the underlying Fidelity Central Funds, will indirectly bear its pro rata share of the fees and expenses incurred by the underlying Fidelity Central Funds. These fees and expenses are not included in the Fund's annualized expense ratio used to calculate the expense estimate in the table below.
Annual Report
Shareholder Expense Example - continued
Please note that the expenses shown in the table are meant to highlight your ongoing costs only and do not reflect any transaction costs. Therefore, the second line of the table is useful in comparing ongoing costs only, and will not help you determine the relative total costs of owning different funds. In addition, if these transactional costs were included, your costs would have been higher.
| Beginning
Account Value
February 1, 2007 | Ending
Account Value
July 31, 2007 | Expenses Paid
During Period*
February 1, 2007
to July 31, 2007 |
Actual | $ 1,000.00 | $ 1,138.10 | $ 4.35 |
Hypothetical (5% return per year before expenses) | $ 1,000.00 | $ 1,020.73 | $ 4.11 |
* Expenses are equal to the Fund's annualized expense ratio of .82%; multiplied by the average account value over the period, multiplied by 181/365 (to reflect the one-half year period).
Annual Report
Investment Changes
Top Ten Stocks as of July 31, 2007 |
| % of fund's
net assets | % of fund's net assets
6 months ago |
Freeport-McMoRan Copper & Gold, Inc. Class B | 5.1 | 0.5 |
ON Semiconductor Corp. | 2.7 | 2.9 |
Service Corp. International | 2.5 | 3.3 |
Teekay Corp. | 2.4 | 3.3 |
Forest Oil Corp. | 2.1 | 2.3 |
Chesapeake Energy Corp. | 2.0 | 1.7 |
El Paso Corp. | 2.0 | 1.6 |
Amkor Technology, Inc. | 2.0 | 2.6 |
Celanese Corp. Class A | 1.9 | 2.1 |
Universal Compression Holdings, Inc. | 1.9 | 1.8 |
| 24.6 | |
Top Five Market Sectors as of July 31, 2007 |
| % of fund's
net assets | % of fund's net assets
6 months ago |
Energy | 33.5 | 33.9 |
Information Technology | 16.1 | 19.5 |
Industrials | 15.3 | 12.1 |
Materials | 13.7 | 9.0 |
Consumer Discretionary | 7.8 | 8.9 |
Asset Allocation (% of fund's net assets) |
As of July 31, 2007 * | As of January 31, 2007 ** |
 | Stocks 96.3% | |  | Stocks 97.2% | |
 | Bonds 0.2% | | | Bonds 0.6% | |
 | Convertible
Securities 0.6% | |  | Convertible
Securities 0.2% | |
 | Other
Investments 0.1% | |  | Short-Term
Investments and
Net Other Assets 2.0% | |
| Short-Term
Investments and
Net Other Assets 2.8% | |  | | |
* Foreign investments | 14.7% | | ** Foreign investments | 18.4% | |

Annual Report
Investments July 31, 2007
Showing Percentage of Net Assets
Common Stocks - 96.3% |
| Shares | | Value (000s) |
CONSUMER DISCRETIONARY - 7.6% |
Auto Components - 0.5% |
Delphi Corp. (a) | 2,000,000 | | $ 2,480 |
The Goodyear Tire & Rubber Co. (a)(e) | 564,063 | | 16,200 |
TRW Automotive Holdings Corp. (a) | 622,000 | | 20,445 |
| | 39,125 |
Automobiles - 0.1% |
Ford Motor Co. | 1,420,000 | | 12,084 |
Diversified Consumer Services - 2.7% |
Carriage Services, Inc. Class A (a) | 266,200 | | 2,361 |
Service Corp. International (f) | 15,906,400 | | 192,786 |
Stewart Enterprises, Inc. Class A | 2,747,278 | | 19,258 |
| | 214,405 |
Hotels, Restaurants & Leisure - 1.5% |
Bally Technologies, Inc. (a) | 1,152,360 | | 28,348 |
Friendly Ice Cream Corp. (a)(f) | 423,400 | | 6,478 |
Penn National Gaming, Inc. (a) | 664,700 | | 38,220 |
Six Flags, Inc. (a)(e) | 3,295,400 | | 12,555 |
Station Casinos, Inc. | 221,000 | | 19,123 |
Steak n Shake Co. (a) | 659,400 | | 9,891 |
| | 114,615 |
Household Durables - 0.1% |
Foamex International, Inc. (a) | 590,352 | | 5,608 |
Leisure Equipment & Products - 0.2% |
Callaway Golf Co. | 970,287 | | 15,748 |
Media - 2.0% |
Cablevision Systems Corp. - NY Group Class A (a) | 242,900 | | 8,645 |
Charter Communications, Inc. Class A (a)(e) | 11,565,971 | | 46,958 |
Cinemark Holdings, Inc. | 1,554,497 | | 25,416 |
GateHouse Media, Inc. | 555,500 | | 9,438 |
Gray Television, Inc. | 1,829,442 | | 14,727 |
Knology, Inc. (a) | 113,144 | | 1,756 |
Liberty Global, Inc.: | | | |
Class A (a) | 570,854 | | 23,936 |
Class C (a) | 33,815 | | 1,347 |
Nexstar Broadcasting Group, Inc. Class A (a) | 940,500 | | 9,640 |
Virgin Media, Inc. | 643,680 | | 15,989 |
| | 157,852 |
Common Stocks - continued |
| Shares | | Value (000s) |
CONSUMER DISCRETIONARY - continued |
Specialty Retail - 0.5% |
Gamestop Corp. Class A (a) | 452,000 | | $ 18,238 |
The Pep Boys - Manny, Moe & Jack | 1,185,692 | | 20,074 |
| | 38,312 |
TOTAL CONSUMER DISCRETIONARY | | 597,749 |
CONSUMER STAPLES - 2.9% |
Food & Staples Retailing - 1.3% |
Koninklijke Ahold NV sponsored ADR (a) | 3,106,200 | | 39,324 |
Kroger Co. | 339,300 | | 8,808 |
SUPERVALU, Inc. | 1,347,217 | | 56,139 |
| | 104,271 |
Food Products - 1.3% |
Corn Products International, Inc. | 994,019 | | 44,353 |
Dean Foods Co. (e) | 989,600 | | 28,471 |
Interstate Bakeries Corp. (a)(f) | 2,911,700 | | 5,678 |
Kellogg Co. | 84,900 | | 4,399 |
Smithfield Foods, Inc. (a) | 711,700 | | 22,105 |
| | 105,006 |
Personal Products - 0.3% |
Playtex Products, Inc. (a) | 1,020,955 | | 18,285 |
Revlon, Inc. Class A (sub. vtg.) (a) | 3,694,361 | | 3,805 |
| | 22,090 |
TOTAL CONSUMER STAPLES | | 231,367 |
ENERGY - 33.1% |
Energy Equipment & Services - 8.7% |
Basic Energy Services, Inc. (a) | 249,300 | | 5,240 |
Grant Prideco, Inc. (a) | 2,243,420 | | 125,856 |
Grey Wolf, Inc. (a) | 8,326,600 | | 61,700 |
Hanover Compressor Co. (a) | 4,625,462 | | 110,225 |
Hercules Offshore, Inc. (a)(e) | 1,072,822 | | 32,206 |
Nabors Industries Ltd. (a) | 808,800 | | 23,649 |
Noble Corp. | 348,000 | | 35,656 |
Oil States International, Inc. (a) | 270,700 | | 11,840 |
Parker Drilling Co. (a) | 800,000 | | 7,536 |
Petroleum Geo-Services ASA | 1,049,100 | | 25,230 |
Petroleum Geo-Services ASA sponsored ADR | 2,244,777 | | 53,987 |
Pride International, Inc. (a) | 646,100 | | 22,646 |
Common Stocks - continued |
| Shares | | Value (000s) |
ENERGY - continued |
Energy Equipment & Services - continued |
Rowan Companies, Inc. | 321,100 | | $ 13,547 |
Universal Compression Holdings, Inc. (a)(f) | 2,034,500 | | 148,600 |
| | 677,918 |
Oil, Gas & Consumable Fuels - 24.4% |
Alpha Natural Resources, Inc. (a)(e)(f) | 3,830,295 | | 68,371 |
Anadarko Petroleum Corp. | 340,948 | | 17,160 |
Arch Coal, Inc. (e) | 688,255 | | 20,572 |
Cabot Oil & Gas Corp. | 787,400 | | 26,929 |
Chesapeake Energy Corp. (e) | 4,710,100 | | 160,332 |
ConocoPhillips | 414,631 | | 33,519 |
Double Hull Tankers, Inc. (f) | 2,298,600 | | 40,938 |
El Paso Corp. | 9,622,112 | | 160,208 |
EOG Resources, Inc. | 368,700 | | 25,846 |
Forest Oil Corp. (a) | 3,977,500 | | 160,969 |
Frontier Oil Corp. | 1,583,600 | | 61,333 |
Frontline Ltd. (e) | 185,300 | | 8,742 |
Frontline Ltd. (NY Shares) | 1,810,700 | | 83,365 |
General Maritime Corp. (f) | 3,249,200 | | 84,479 |
Mariner Energy, Inc. (a) | 2,921,653 | | 61,735 |
Massey Energy Co. | 2,557,500 | | 54,603 |
Nexen, Inc. | 1,663,200 | | 51,578 |
Overseas Shipholding Group, Inc. (f) | 1,812,900 | | 140,663 |
Paladin Resources Ltd. (a) | 2,042,400 | | 12,496 |
Peabody Energy Corp. (e) | 1,482,716 | | 62,660 |
Petrohawk Energy Corp. (a) | 2,719,148 | | 40,760 |
Plains Exploration & Production Co. (a) | 299,100 | | 12,924 |
Pogo Producing Co. | 304,600 | | 16,223 |
Range Resources Corp. | 3,489,300 | | 129,593 |
Ship Finance International Ltd.: | | | |
(Norway) (e) | 53,099 | | 1,460 |
(NY Shares) | 1,275,051 | | 35,638 |
Teekay Corp. | 3,343,200 | | 187,453 |
Valero Energy Corp. | 1,387,400 | | 92,970 |
Williams Companies, Inc. | 1,784,400 | | 57,547 |
| | 1,911,066 |
TOTAL ENERGY | | 2,588,984 |
Common Stocks - continued |
| Shares | | Value (000s) |
FINANCIALS - 0.7% |
Capital Markets - 0.1% |
Merrill Lynch & Co., Inc. | 126,000 | | $ 9,349 |
Commercial Banks - 0.1% |
PNC Financial Services Group, Inc. | 157,200 | | 10,477 |
Insurance - 0.2% |
American Financial Group, Inc. | 500,550 | | 14,060 |
Real Estate Management & Development - 0.3% |
CB Richard Ellis Group, Inc. Class A (a) | 553,200 | | 19,318 |
TOTAL FINANCIALS | | 53,204 |
HEALTH CARE - 2.6% |
Biotechnology - 0.0% |
Lexicon Pharmaceuticals, Inc. (a) | 392,187 | | 1,267 |
Health Care Equipment & Supplies - 1.1% |
Baxter International, Inc. | 430,100 | | 22,623 |
Beckman Coulter, Inc. | 354,200 | | 25,084 |
Covidien Ltd. (a) | 631,050 | | 25,841 |
Hospira, Inc. (a) | 361,900 | | 13,995 |
| | 87,543 |
Health Care Providers & Services - 1.4% |
Community Health Systems, Inc. (a) | 484,500 | | 18,847 |
DaVita, Inc. (a) | 1,439,200 | | 76,191 |
Rural/Metro Corp. (a) | 834,200 | | 3,754 |
Tenet Healthcare Corp. (a)(e) | 1,543,452 | | 7,995 |
| | 106,787 |
Pharmaceuticals - 0.1% |
Adams Respiratory Therapeutics, Inc. (a) | 207,300 | | 7,672 |
TOTAL HEALTH CARE | | 203,269 |
INDUSTRIALS - 15.2% |
Aerospace & Defense - 1.2% |
American Science & Engineering, Inc. (a)(e) | 314,591 | | 17,435 |
Armor Holdings, Inc. (a) | 77,000 | | 6,774 |
DRS Technologies, Inc. | 138,500 | | 7,252 |
United Technologies Corp. | 832,550 | | 60,751 |
| | 92,212 |
Air Freight & Logistics - 0.0% |
Park-Ohio Holdings Corp. (a) | 179,465 | | 4,458 |
Common Stocks - continued |
| Shares | | Value (000s) |
INDUSTRIALS - continued |
Airlines - 1.0% |
AirTran Holdings, Inc. (a)(e) | 861,500 | | $ 8,477 |
AMR Corp. (a)(e) | 670,630 | | 16,551 |
Delta Air Lines, Inc. (a) | 2,112,876 | | 37,651 |
Northwest Airlines Corp. (a) | 178,917 | | 3,119 |
UAL Corp. (a) | 280,400 | | 12,377 |
| | 78,175 |
Building Products - 1.9% |
American Standard Companies, Inc. | 634,600 | | 34,300 |
Armstrong World Industries, Inc. (a) | 120,989 | | 5,241 |
Goodman Global, Inc. (a) | 426,400 | | 10,285 |
Lennox International, Inc. | 230,700 | | 8,836 |
Owens Corning (a)(e) | 2,943,849 | | 89,581 |
Owens Corning warrants 10/31/13 (a) | 406,600 | | 2,647 |
| | 150,890 |
Commercial Services & Supplies - 3.7% |
Allied Waste Industries, Inc. (a) | 6,312,500 | | 81,242 |
Cenveo, Inc. (a)(f) | 3,848,400 | | 80,855 |
Deluxe Corp. | 355,000 | | 13,405 |
Interface, Inc. Class A | 266,673 | | 4,915 |
Layne Christensen Co. (a) | 652,609 | | 29,478 |
Republic Services, Inc. | 744,750 | | 23,795 |
Waste Management, Inc. | 1,494,300 | | 56,828 |
| | 290,518 |
Construction & Engineering - 1.0% |
Foster Wheeler Ltd. (a) | 697,900 | | 78,437 |
Electrical Equipment - 0.6% |
Baldor Electric Co. (e) | 404,900 | | 18,480 |
Emerson Electric Co. | 389,900 | | 18,353 |
GrafTech International Ltd. (a) | 837,325 | | 12,970 |
| | 49,803 |
Industrial Conglomerates - 0.2% |
Tyco International Ltd. | 352,150 | | 16,653 |
Machinery - 2.8% |
Accuride Corp. (a) | 1,384,197 | | 19,531 |
Badger Meter, Inc. (e) | 406,854 | | 13,691 |
Cummins, Inc. | 462,000 | | 54,839 |
Dover Corp. | 742,300 | | 37,857 |
Eaton Corp. | 328,800 | | 31,953 |
FreightCar America, Inc. (e) | 151,247 | | 7,149 |
Common Stocks - continued |
| Shares | | Value (000s) |
INDUSTRIALS - continued |
Machinery - continued |
Ingersoll-Rand Co. Ltd. Class A | 405,600 | | $ 20,410 |
Thermadyne Holdings Corp. (a) | 64,900 | | 1,107 |
Timken Co. | 92,800 | | 3,100 |
Watts Water Technologies, Inc. Class A (e) | 906,136 | | 31,633 |
| | 221,270 |
Marine - 1.8% |
Genco Shipping & Trading Ltd. | 700,300 | | 39,448 |
Golden Ocean Group Ltd. (e) | 2,067,600 | | 9,666 |
Navios Maritime Holdings, Inc. (f) | 5,631,886 | | 73,496 |
OceanFreight, Inc. (f) | 740,600 | | 17,693 |
| | 140,303 |
Road & Rail - 0.3% |
Burlington Northern Santa Fe Corp. | 246,400 | | 20,239 |
Trading Companies & Distributors - 0.6% |
H&E Equipment Services, Inc. (a) | 12,900 | | 350 |
UAP Holding Corp. | 846,600 | | 23,002 |
United Rentals, Inc. (a)(e) | 655,600 | | 21,071 |
| | 44,423 |
Transportation Infrastructure - 0.1% |
Aegean Marine Petroleum Network, Inc. | 215,300 | | 4,511 |
TOTAL INDUSTRIALS | | 1,191,892 |
INFORMATION TECHNOLOGY - 16.1% |
Communications Equipment - 0.3% |
Alcatel-Lucent SA sponsored ADR | 636,273 | | 7,381 |
Motorola, Inc. | 1,155,400 | | 19,630 |
| | 27,011 |
Computers & Peripherals - 1.4% |
EMC Corp. (a) | 3,501,700 | | 64,816 |
Seagate Technology | 1,230,800 | | 28,936 |
Sun Microsystems, Inc. (a) | 3,927,500 | | 20,030 |
| | 113,782 |
Electronic Equipment & Instruments - 3.7% |
Cogent, Inc. (a) | 1,966,117 | | 26,169 |
DDi Corp. (a) | 295,899 | | 2,234 |
Flextronics International Ltd. (a) | 12,054,148 | | 134,645 |
Itron, Inc. (a)(e) | 475,800 | | 37,793 |
Common Stocks - continued |
| Shares | | Value (000s) |
INFORMATION TECHNOLOGY - continued |
Electronic Equipment & Instruments - continued |
Merix Corp. (a)(f) | 1,545,123 | | $ 11,635 |
Solectron Corp. (a) | 3,673,600 | | 13,813 |
TTM Technologies, Inc. (a) | 346,314 | | 4,516 |
Tyco Electronics Ltd. (a) | 631,050 | | 22,604 |
Viasystems Group, Inc. (a) | 775,300 | | 7,365 |
Viasystems Group, Inc. (a)(h) | 625,780 | | 5,945 |
Vishay Intertechnology, Inc. (a) | 1,248,400 | | 19,363 |
| | 286,082 |
Internet Software & Services - 0.1% |
VeriSign, Inc. (a) | 194,300 | | 5,769 |
IT Services - 0.9% |
Affiliated Computer Services, Inc. Class A (a) | 65,100 | | 3,493 |
CACI International, Inc. Class A (a) | 348,000 | | 15,465 |
Cognizant Technology Solutions Corp. Class A (a) | 28,100 | | 2,276 |
Global Cash Access Holdings, Inc. (a) | 1,835,000 | | 25,066 |
Hewitt Associates, Inc. Class A (a) | 147,000 | | 4,398 |
SAIC, Inc. | 1,381,400 | | 23,152 |
| | 73,850 |
Semiconductors & Semiconductor Equipment - 8.6% |
Advanced Micro Devices, Inc. (a)(e) | 8,842,500 | | 119,727 |
AMIS Holdings, Inc. (a)(f) | 4,524,524 | | 46,648 |
Amkor Technology, Inc. (a)(e)(f) | 12,599,836 | | 155,734 |
Atmel Corp. (a) | 7,032,223 | | 37,904 |
Cypress Semiconductor Corp. (a) | 1,151,200 | | 28,849 |
Fairchild Semiconductor International, Inc. (a) | 200,000 | | 3,650 |
Intel Corp. | 1,361,300 | | 32,154 |
Micron Technology, Inc. (a) | 1,361,300 | | 16,159 |
ON Semiconductor Corp. (a)(e)(f) | 17,876,600 | | 211,301 |
Skyworks Solutions, Inc. (a) | 1,112,647 | | 8,812 |
Texas Instruments, Inc. | 262,700 | | 9,244 |
| | 670,182 |
Software - 1.1% |
Autodesk, Inc. (a) | 632,300 | | 26,791 |
Sybase, Inc. (a) | 396,100 | | 9,395 |
Symantec Corp. (a)(e) | 2,549,400 | | 48,948 |
| | 85,134 |
TOTAL INFORMATION TECHNOLOGY | | 1,261,810 |
Common Stocks - continued |
| Shares | | Value (000s) |
MATERIALS - 13.7% |
Chemicals - 4.4% |
Agrium, Inc. | 344,200 | | $ 14,472 |
Albemarle Corp. | 815,496 | | 32,807 |
Arch Chemicals, Inc. | 648,542 | | 22,945 |
Celanese Corp. Class A | 4,043,100 | | 151,616 |
Georgia Gulf Corp. (e) | 609,840 | | 9,873 |
H.B. Fuller Co. | 1,844,982 | | 50,977 |
Lyondell Chemical Co. | 682,100 | | 30,626 |
Methanex Corp. | 83,800 | | 2,072 |
Monsanto Co. | 469,600 | | 30,266 |
Pliant Corp. (a) | 567 | | 0 |
Texas Petrochemicals, Inc. (a) | 11,700 | | 339 |
| | 345,993 |
Containers & Packaging - 1.4% |
Owens-Illinois, Inc. (a) | 1,263,090 | | 50,498 |
Packaging Corp. of America | 179,700 | | 4,586 |
Sealed Air Corp. | 313,800 | | 8,551 |
Smurfit-Stone Container Corp. (a) | 3,726,482 | | 43,935 |
| | 107,570 |
Metals & Mining - 6.2% |
Chaparral Steel Co. | 107,600 | | 9,043 |
Freeport-McMoRan Copper & Gold, Inc. Class B | 4,221,352 | | 396,729 |
Ormet Corp. (a) | 330,000 | | 9,669 |
Ormet Corp. (a)(h) | 1,075,000 | | 26,773 |
Reliance Steel & Aluminum Co. | 498,683 | | 26,201 |
United States Steel Corp. | 160,000 | | 15,726 |
| | 484,141 |
Paper & Forest Products - 1.7% |
Domtar Corp. (a) | 1,901,400 | | 18,082 |
International Paper Co. (e) | 1,209,800 | | 44,847 |
Neenah Paper, Inc. | 518,300 | | 20,074 |
Weyerhaeuser Co. | 694,300 | | 49,462 |
| | 132,465 |
TOTAL MATERIALS | | 1,070,169 |
TELECOMMUNICATION SERVICES - 0.8% |
Diversified Telecommunication Services - 0.8% |
General Communications, Inc. Class A (a) | 907,800 | | 10,449 |
Level 3 Communications, Inc. (a) | 1,000,000 | | 5,230 |
Common Stocks - continued |
| Shares | | Value (000s) |
TELECOMMUNICATION SERVICES - continued |
Diversified Telecommunication Services - continued |
McLeodUSA, Inc. (a) | 1,701,867 | | $ 12,764 |
Qwest Communications International, Inc. (a)(e) | 3,203,500 | | 27,326 |
XO Holdings, Inc. (a) | 926,500 | | 4,123 |
| | 59,892 |
UTILITIES - 3.6% |
Electric Utilities - 0.2% |
Allegheny Energy, Inc. (a) | 269,300 | | 14,066 |
Gas Utilities - 0.2% |
ONEOK, Inc. | 317,600 | | 16,118 |
Independent Power Producers & Energy Traders - 2.2% |
AES Corp. (a) | 6,222,740 | | 122,277 |
Dynegy, Inc. Class A (a) | 1,987,000 | | 17,704 |
Mirant Corp. (a) | 714,500 | | 27,030 |
NRG Energy, Inc. (a) | 137,700 | | 5,308 |
| | 172,319 |
Multi-Utilities - 1.0% |
Aquila, Inc. (a) | 911,800 | | 3,447 |
CMS Energy Corp. | 4,552,600 | | 73,570 |
| | 77,017 |
TOTAL UTILITIES | | 279,520 |
TOTAL COMMON STOCKS (Cost $5,718,885) | 7,537,856 |
Preferred Stocks - 0.4% |
| | | |
Convertible Preferred Stocks - 0.4% |
ENERGY - 0.4% |
Oil, Gas & Consumable Fuels - 0.4% |
EXCO Resources, Inc. Series A1: | | | |
11.00% (h) | 527 | | 5,481 |
7.00% (h) | 2,173 | | 23,153 |
| | 28,634 |
Preferred Stocks - continued |
| Shares | | Value (000s) |
Nonconvertible Preferred Stocks - 0.0% |
MATERIALS - 0.0% |
Chemicals - 0.0% |
Pliant Corp. Series AA 13.00% | 5,008 | | $ 2,754 |
TELECOMMUNICATION SERVICES - 0.0% |
Diversified Telecommunication Services - 0.0% |
PTV, Inc. Series A, 10.00% | 84 | | 1 |
TOTAL NONCONVERTIBLE PREFERRED STOCKS | | 2,755 |
TOTAL PREFERRED STOCKS (Cost $29,411) | 31,389 |
Corporate Bonds - 0.4% |
| Principal Amount (000s) | | |
Convertible Bonds - 0.2% |
TELECOMMUNICATION SERVICES - 0.2% |
Wireless Telecommunication Services - 0.2% |
ICO North America, Inc. 7.5% 8/15/09 (h) | $ 15,495 | | 15,650 |
Nonconvertible Bonds - 0.2% |
CONSUMER DISCRETIONARY - 0.2% |
Auto Components - 0.2% |
IdleAire Technologies Corp. 0% 12/15/12 unit (d)(g) | 24,470 | | 14,193 |
INDUSTRIALS - 0.0% |
Airlines - 0.0% |
Delta Air Lines, Inc. 8% 12/15/07 (g) | 4,145 | | 269 |
Northwest Airlines, Inc. 9.875% 3/15/49 | 7,000 | | 805 |
| 1,074 |
TOTAL NONCONVERTIBLE BONDS | 15,267 |
TOTAL CORPORATE BONDS (Cost $37,687) | 30,917 |
Money Market Funds - 9.3% |
| Shares | | Value (000s) |
Fidelity Cash Central Fund, 5.38% (b) | 244,918,478 | | $ 244,918 |
Fidelity Securities Lending Cash Central Fund, 5.39% (b)(c) | 485,880,044 | | 485,880 |
TOTAL MONEY MARKET FUNDS (Cost $730,798) | 730,798 |
Cash Equivalents - 0.1% |
| Maturity Amount (000s) | | |
Investments in repurchase agreements in a joint trading account at 5.09%, dated 7/31/07 due 8/1/07 (Collateralized by U.S. Treasury Obligations) #
(Cost $10,013) | 10,014 | | 10,013 |
Other - 0.1% |
| Shares | | |
Other - 0.1% |
Delta Air Lines ALPA Claim (a)
(Cost $769) | 64,750,000 | | 3,885 |
TOTAL INVESTMENT PORTFOLIO - 106.6% (Cost $6,527,563) | | 8,344,858 |
NET OTHER ASSETS - (6.6)% | | (514,759) |
NET ASSETS - 100% | $ 7,830,099 |
Legend |
(a) Non-income producing |
(b) Affiliated fund that is available only to investment companies and other accounts managed by Fidelity Investments. The rate quoted is the annualized seven-day yield of the fund at period end. A complete unaudited listing of the fund's holdings as of its most recent quarter end is available upon request. |
(c) Investment made with cash collateral received from securities on loan. |
(d) Security initially issued in zero coupon form which converts to coupon form at a specified rate and date. The rate shown is the rate at period end. |
(e) Security or a portion of the security is on loan at period end. |
(f) Affiliated company |
(g) Security exempt from registration under Rule 144A of the Securities Act of 1933. These securities may be resold in transactions exempt from registration, normally to qualified institutional buyers. At the end of the period, the value of these securities amounted to $14,670,000 or 0.2% of net assets. |
(h) Restricted securities - Investment in securities not registered under the Securities Act of 1933 (excluding 144A issues). At the end of the period, the value of restricted securities (excluding 144A issues) amounted to $77,002,000 or 1.0% of net assets. |
Additional information on each holding is as follows: |
Security | Acquisition Date | Acquisition Cost (000s) |
EXCO Resources, Inc. Series A1, 11.00% | 3/28/07 | $ 21,730 |
EXCO Resources, Inc. Series A1, 7.00% | 3/28/07 | $ 5,270 |
ICO North America, Inc. 7.5% 8/15/09 | 8/12/05 - 2/14/07 | $ 15,649 |
Ormet Corp. | 2/27/07 - 4/4/07 | $ 20,556 |
Viasystems Group, Inc. | 2/13/04 | $ 12,594 |
# Additional Information on each counterparty to the repurchase agreement is as follows: |
Repurchase Agreement/Counterparty | Value
(000s) |
$10,013,000 due 8/01/07 at 5.09% |
Banc of America Securities LLC | $ 1,798 |
Merrill Lynch Government Securities, Inc. | 8,215 |
| $ 10,013 |
Affiliated Central Funds |
Information regarding fiscal year to date income earned by the Fund from investments in Fidelity Central Funds is as follows: |
Fund | Income earned
(Amounts in thousands) |
Fidelity Cash Central Fund | $ 9,414 |
Fidelity Securities Lending Cash Central Fund | 2,817 |
Total | $ 12,231 |
Other Affiliated Issuers |
An affiliated company is a company in which the fund has ownership of at least 5% of the voting securities. Fiscal year to date transactions with companies which are or were affiliates are as follows: |
Affiliate
(Amounts in thousands) | Value, beginning of period | Purchases | Sales
Proceeds | Dividend
Income | Value,
end of
period |
Alpha Natural Resources, Inc. | $ 50,922 | $ 11,682 | $ - | $ - | $ 68,371 |
AMIS Holdings, Inc. | 17,614 | 28,288 | 1,194 | - | 46,648 |
Amkor Technology, Inc. | 77,867 | - | - | - | 155,734 |
Capital Crossing Bank | 6,897 | - | 7,764 | - | - |
Cenveo, Inc. | 56,139 | 18,440 | - | - | 80,855 |
Double Hull Tankers, Inc. | - | 38,005 | - | - | 40,938 |
Forest Oil Corp. | 120,974 | 14,391 | - | - | - |
Friendly Ice Cream Corp. | 3,260 | - | - | - | 6,478 |
General Maritime Corp. | 117,946 | - | - | 53,844 | 84,479 |
Interstate Bakeries Corp. | - | 8,726 | - | - | 5,678 |
Merix Corp. | 16,239 | - | - | - | 11,635 |
Navios Maritime Holdings, Inc. | - | 50,709 | - | 437 | 73,496 |
Nexstar Broadcasting Group, Inc. Class A | 2,093 | 1,936 | - | - | - |
OceanFreight, Inc. | - | 14,245 | - | - | 17,693 |
OMI Corp. | 112,526 | - | 149,201 | 2,627 | - |
ON Semiconductor Corp. | 112,444 | - | - | - | 211,301 |
Overseas Shipholding Group, Inc. | 62,806 | 56,763 | - | 1,200 | 140,663 |
Service Corp. International | 117,896 | 2,018 | - | 1,825 | 192,786 |
Affiliate
(Amounts in thousands) | Value, beginning of period | Purchases | Sales
Proceeds | Dividend
Income | Value,
end of
period |
Universal Compression Holdings, Inc. | 82,523 | 47,587 | - | - | 148,600 |
Total | $ 958,146 | $ 292,790 | $ 158,159 | $ 59,933 | $ 1,285,355 |
Other Information |
Distribution of investments by country of issue, as a percentage of total net assets, is as follows: |
United States of America | 85.3% |
Marshall Islands | 5.8% |
Bermuda | 3.6% |
Singapore | 1.7% |
Norway | 1.0% |
Others (individually less than 1%) | 2.6% |
| 100.0% |
See accompanying notes which are an integral part of the financial statements.
Annual Report
Financial Statements
Statement of Assets and Liabilities
Amounts in thousands (except per-share amount) | July 31, 2007 |
Assets | | |
Investment in securities, at value (including securities loaned of $469,596 and repurchase agreements of $10,013) - See accompanying schedule: Unaffiliated issuers (cost $4,950,673) | $ 6,328,705 | |
Fidelity Central Funds (cost $730,798) | 730,798 | |
Other affiliated issuers (cost $846,092) | 1,285,355 | |
Total Investments (cost $6,527,563) | | $ 8,344,858 |
Receivable for investments sold | | 3,273 |
Receivable for fund shares sold | | 25,856 |
Dividends receivable | | 2,130 |
Interest receivable | | 484 |
Distributions receivable from Fidelity Central Funds | | 1,933 |
Prepaid expenses | | 8 |
Other receivables | | 47 |
Total assets | | 8,378,589 |
| | |
Liabilities | | |
Payable to custodian bank | $ 1,835 | |
Payable for investments purchased | 36,638 | |
Payable for fund shares redeemed | 11,904 | |
Accrued management fee | 4,125 | |
Other affiliated payables | 1,263 | |
Other payables and accrued expenses | 6,845 | |
Collateral on securities loaned, at value | 485,880 | |
Total liabilities | | 548,490 |
| | |
Net Assets | | $ 7,830,099 |
Net Assets consist of: | | |
Paid in capital | | $ 5,674,912 |
Undistributed net investment income | | 73,047 |
Accumulated undistributed net realized gain (loss) on investments and foreign currency transactions | | 264,830 |
Net unrealized appreciation (depreciation) on investments and assets and liabilities in foreign currencies | | 1,817,310 |
Net Assets, for 231,812 shares outstanding | | $ 7,830,099 |
Net Asset Value, offering price and redemption price per share ($7,830,099 ÷ 231,812 shares) | | $ 33.78 |
See accompanying notes which are an integral part of the financial statements.
Annual Report
Statement of Operations
Amounts in thousands | Year ended July 31, 2007 |
Investment Income | | |
Dividends (including $12,657 earned from other affiliated issuers) | | $ 63,857 |
Special dividends (earned from other affiliated
issuers) | | 47,276 |
Interest | | 3,584 |
Income from Fidelity Central Funds | | 12,231 |
Total income | | 126,948 |
| | |
Expenses | | |
Management fee | $ 34,353 | |
Transfer agent fees | 10,792 | |
Accounting and security lending fees | 1,134 | |
Custodian fees and expenses | 68 | |
Independent trustees' compensation | 17 | |
Registration fees | 268 | |
Audit | 74 | |
Legal | 63 | |
Miscellaneous | 83 | |
Total expenses before reductions | 46,852 | |
Expense reductions | (213) | 46,639 |
Net investment income (loss) | | 80,309 |
Realized and Unrealized Gain (Loss) Net realized gain (loss) on: | | |
Investment securities: | | |
Unaffiliated issuers | 249,118 | |
Other affiliated issuers | 70,341 | |
Foreign currency transactions | 61 | |
Total net realized gain (loss) | | 319,520 |
Change in net unrealized appreciation (depreciation) on: Investment securities | 841,286 | |
Assets and liabilities in foreign currencies | 15 | |
Total change in net unrealized appreciation (depreciation) | | 841,301 |
Net gain (loss) | | 1,160,821 |
Net increase (decrease) in net assets resulting from operations | | $ 1,241,130 |
See accompanying notes which are an integral part of the financial statements.
Annual Report
Financial Statements - continued
Statement of Changes in Net Assets
Amounts in thousands | Year ended
July 31,
2007 | Year ended
July 31,
2006 |
Increase (Decrease) in Net Assets | | |
Operations | | |
Net investment income (loss) | $ 80,309 | $ 22,425 |
Net realized gain (loss) | 319,520 | 201,182 |
Change in net unrealized appreciation (depreciation) | 841,301 | 191,436 |
Net increase (decrease) in net assets resulting
from operations | 1,241,130 | 415,043 |
Distributions to shareholders from net investment income | (19,040) | (28,125) |
Distributions to shareholders from net realized gain | (219,421) | (54,860) |
Total distributions | (238,461) | (82,985) |
Share transactions
Proceeds from sales of shares | 3,685,329 | 1,839,637 |
Reinvestment of distributions | 228,498 | 79,716 |
Cost of shares redeemed | (1,261,801) | (1,406,453) |
Net increase (decrease) in net assets resulting from share transactions | 2,652,026 | 512,900 |
Redemption fees | 1,519 | 1,158 |
Total increase (decrease) in net assets | 3,656,214 | 846,116 |
| | |
Net Assets | | |
Beginning of period | 4,173,885 | 3,327,769 |
End of period (including undistributed net investment income of $73,047 and undistributed net investment income of $13,934, respectively) | $ 7,830,099 | $ 4,173,885 |
Other Information Shares | | |
Sold | 116,056 | 68,132 |
Issued in reinvestment of distributions | 8,328 | 3,063 |
Redeemed | (41,247) | (53,133) |
Net increase (decrease) | 83,137 | 18,062 |
See accompanying notes which are an integral part of the financial statements.
Annual Report
Financial Highlights
Years ended July 31, | 2007 | 2006 | 2005 | 2004 | 2003 |
Selected Per-Share Data | | | | |
Net asset value, beginning of period | $ 28.07 | $ 25.48 | $ 20.18 | $ 14.93 | $ 7.37 |
Income from Investment Operations | | | | | |
Net investment income (loss) B | .44 G | .16 | .24 E | .04 | .01 |
Net realized and unrealized gain (loss) | 6.78 | 3.04 | 6.21 | 5.45 | 7.49 |
Total from investment operations | 7.22 | 3.20 | 6.45 | 5.49 | 7.50 |
Distributions from net investment income | (.12) | (.21) | (.04) | - | - |
Distributions from net realized gain | (1.40) | (.41) | (1.12) | (.27) | - |
Total distributions | (1.52) | (.62) | (1.16) | (.27) | - |
Redemption fees added to paid in capital B | .01 | .01 | .01 | .03 | .06 |
Net asset value, end of period | $ 33.78 | $ 28.07 | $ 25.48 | $ 20.18 | $ 14.93 |
Total Return A | 27.08% | 12.80% | 33.93% | 37.27% | 102.58% |
Ratios to Average Net Assets C, F | | | |
Expenses before reductions | .83% | .86% | .87% | .88% | .93% |
Expenses net of fee waivers, if any | .83% | .86% | .87% | .88% | .93% |
Expenses net of all reductions | .83% | .85% | .84% | .85% | .83% |
Net investment income (loss) | 1.43% G | .60% | 1.04% E | .23% | .07% |
Supplemental Data | | | | | |
Net assets, end of period (in millions) | $ 7,830 | $ 4,174 | $ 3,328 | $ 1,504 | $ 718 |
Portfolio turnover rate D | 20% | 23% | 16% | 35% | 79% |
A Total returns would have been lower had certain expenses not been reduced during the periods shown.
B Calculated based on average shares outstanding during the period.
C Fees and expenses of the underlying Fidelity Central Funds are not included in the Fund's expense ratio. The Fund indirectly bears its proportionate share of the expenses of any underlying Fidelity Central Funds.
D Amount does not include the portfolio activity of any underlying Fidelity Central Funds.
E Investment income per share reflects an in-kind dividend received in a corporate reorganization which amounted to $.10 per share. Excluding this dividend, the ratio of net investment income (loss) to average net assets would have been .61%.
F Expense ratios reflect operating expenses of the Fund. Expenses before reductions do not reflect amounts reimbursed by the investment adviser or reductions from brokerage service arrangements or other expense offset arrangements and do not represent the amount paid by the Fund during periods when reimbursements or reductions occur. Expenses net of fee waivers reflect expenses after reimbursement by the investment adviser but prior to reductions from brokerage service arrangements or other expense offset arrangements. Expenses net of all reductions represent the net expenses paid by the Fund.
G Investment income per share reflects a special dividend which amounted to $.26 per share. Excluding the special dividend, the ratio of net investment income (loss) to average net assets would have been .59%.
See accompanying notes which are an integral part of the financial statements.
Annual Report
Notes to Financial Statements
For the period ended July 31, 2007
(Amounts in thousands except ratios)
1. Organization.
Fidelity Leveraged Company Stock Fund (the Fund) is a fund of Fidelity Securities Fund (the trust) and is authorized to issue an unlimited number of shares. The trust is registered under the Investment Company Act of 1940, as amended (the 1940 Act), as an open-end management investment company organized as a Massachusetts business trust.
2. Investments in Fidelity Central Funds.
The Fund may invest in Fidelity Central Funds which are open-end investment companies available only to other investment companies and accounts managed by Fidelity Management & Research Company (FMR) and its affiliates. The Fund's Schedule of Investments lists each of the Fidelity Central Funds as an investment of the Fund, but does not include the underlying holdings of each Fidelity Central Fund. As an Investing Fund, the Fund indirectly bears its proportionate share of the expenses of the underlying Fidelity Central Funds. The Money Market Central Funds seek preservation of capital and current income and are managed by Fidelity Investments Money Management, Inc. (FIMM), an affiliate of FMR.
A complete list of holdings for each Fidelity Central Fund is available upon request or at the SEC's web site at www.sec.gov. In addition, the financial statements of the Fidelity Central Funds, which are not covered by the Fund's Report of Independent Registered Public Accounting Firm, are available on the SEC's web site or upon request.
3. Significant Accounting Policies.
The financial statements have been prepared in conformity with accounting principles generally accepted in the United States of America, which require management to make certain estimates and assumptions at the date of the financial statements. The following summarizes the significant accounting policies of the Fund:
Security Valuation. Investments are valued and net asset value (NAV) per share is calculated (NAV calculation) as of the close of business of the New York Stock Exchange (NYSE), normally 4:00 p.m. Eastern time. Wherever possible, the Fund uses independent pricing services approved by the Board of Trustees to value its investments.
Equity securities, including restricted securities, for which market quotations are readily available, are valued at the last reported sale price or official closing price as reported by an independent pricing service on the primary market or exchange on which they are traded. In the event there were no sales during the day or closing prices are not available, securities are valued at the last quoted bid price. Debt securities, including restricted
Annual Report
3. Significant Accounting Policies - continued
Security Valuation - continued
securities, for which quotations are readily available, are valued by independent pricing services or by dealers who make markets in such securities. Pricing services consider yield or price of bonds of comparable quality, coupon, maturity and type as well as dealer supplied prices. Investments in open-end mutual funds, including the Fidelity Central Funds, are valued at their closing net asset value each business day. Short-term securities with remaining maturities of sixty days or less for which quotations are not readily available are valued at amortized cost, which approximates value.
When current market prices or quotations are not readily available or do not accurately reflect fair value, valuations may be determined in accordance with procedures adopted by the Board of Trustees. For example, when developments occur between the close of a market and the close of the NYSE that may materially affect the value of some or all of the securities, or when trading in a security is halted, those securities may be fair valued. Factors used in the determination of fair value may include monitoring news to identify significant market or security specific events such as changes in the value of U.S. securities markets, reviewing developments in foreign markets and evaluating the performance of ADRs, futures contracts and exchange-traded funds. Because the Fund's utilization of fair value pricing depends on market activity, the frequency with which fair value pricing is used cannot be predicted and may be utilized to a significant extent. The value of securities used for NAV calculation under fair value pricing may differ from published prices for the same securities.
Foreign Currency. The Fund uses foreign currency contracts to facilitate transactions in foreign-denominated securities. Losses from these transactions may arise from changes in the value of the foreign currency or if the counterparties do not perform under the contracts' terms.
Foreign-denominated assets, including investment securities, and liabilities are translated into U.S. dollars at the exchange rate at period end. Purchases and sales of investment securities, income and dividends received and expenses denominated in foreign currencies are translated into U.S. dollars at the exchange rate in effect on the transaction date.
The effects of exchange rate fluctuations on investments are included with the net realized and unrealized gain (loss) on investment securities. Other foreign currency transactions resulting in realized and unrealized gain (loss) are disclosed separately.
Investment Transactions and Income. For financial reporting purposes, the Fund's investment holdings and NAV include trades executed through the end of the last business day of the period. The NAV for processing shareholder transactions includes trades executed through the end of the prior business day. Gains and losses on securities
Annual Report
Notes to Financial Statements - continued
(Amounts in thousands except ratios)
3. Significant Accounting Policies - continued
Investment Transactions and Income - continued
sold are determined on the basis of identified cost and may include proceeds received from litigation. Dividend income is recorded on the ex-dividend date, except for certain dividends from foreign securities where the ex-dividend date may have passed, which are recorded as soon as the Fund is informed of the ex-dividend date. Non-cash dividends included in dividend income, if any, are recorded at the fair market value of the securities received. Distributions received on securities that represent a return of capital or capital gain are recorded as a reduction of cost of investments and/or as a realized gain. The Fund estimates the components of distributions received that may be considered return of capital distributions or capital gain distributions. Large, non-recurring dividends recognized by the Fund are presented separately on the Statement of Operations as "Special Dividends" and the impact of these dividends is presented in the Financial Highlights. Interest income and income distributions from the Fidelity Central Funds are accrued as earned. Interest income includes coupon interest and amortization of premium and accretion of discount on debt securities. Investment income is recorded net of foreign taxes withheld where recovery of such taxes is uncertain.
Expenses. Most expenses of the trust can be directly attributed to a fund. Expenses which cannot be directly attributed are apportioned among each Fund in the trust. Expense estimates are accrued in the period to which they relate and adjustments are made when actual amounts are known.
Income Tax Information and Distributions to Shareholders. Each year, the Fund intends to qualify as a regulated investment company by distributing all of its taxable income and realized gains under Subchapter M of the Internal Revenue Code. As a result, no provision for income taxes is required in the accompanying financial statements. Foreign taxes are provided for based on the Fund's understanding of the tax rules and rates that exist in the foreign markets in which it invests.
Distributions are recorded on the ex-dividend date. Income and capital gain distributions are determined in accordance with income tax regulations, which may differ from generally accepted accounting principles. In addition, the Fund will claim a portion of the payment made to redeeming shareholders as a distribution for income tax purposes.
Capital accounts within the financial statements are adjusted for permanent book-tax differences. These adjustments have no impact on net assets or the results of operations. Temporary book-tax differences will reverse in a subsequent period.
Book-tax differences are primarily due to foreign currency transactions and market discounts.
Annual Report
3. Significant Accounting Policies - continued
Income Tax Information and Distributions to Shareholders - continued
The tax-basis components of distributable earnings and the federal tax cost as of period end were as follows:
Unrealized appreciation | $ 2,092,797 |
Unrealized depreciation | (272,148) |
Net unrealized appreciation (depreciation) | 1,820,649 |
Undistributed ordinary income | 64,544 |
Undistributed long-term capital gain | 247,859 |
| |
Cost for federal income tax purposes | $ 6,524,209 |
The tax character of distributions paid was as follows:
| July 31, 2007 | July 31, 2006 |
Ordinary Income | $ 31,376 | $ 28,125 |
Long-term Capital Gains | 207,085 | 54,860 |
Total | $ 238,461 | $ 82,985 |
Short-Term Trading (Redemption) Fees. Shares held in the Fund less than 90 days are subject to a redemption fee equal to 1.50% of the proceeds of the redeemed shares. All redemption fees, including any estimated redemption fees paid by FMR, are retained by the Fund and accounted for as an addition to paid in capital.
New Accounting Pronouncements. In July 2006, Financial Accounting Standards Board Interpretation No. 48, Accounting for Uncertainty in Income Taxes - an interpretation of FASB Statement 109 (FIN 48), was issued and is effective on the last business day of the semiannual reporting period for fiscal years beginning after December 15, 2006. FIN 48 sets forth a threshold for financial statement recognition, measurement and disclosure of a tax position taken or expected to be taken on a tax return. Management has concluded that the adoption of FIN 48 will not result in a material impact on the Fund's net assets, results of operations and financial statement disclosures.
In addition, in September 2006, Statement of Financial Accounting Standards No. 157, Fair Value Measurements (SFAS 157), was issued and is effective for fiscal years beginning after November 15, 2007. SFAS 157 defines fair value, establishes a framework for measuring fair value and expands disclosures about fair value measurements. Management is currently evaluating the impact the adoption of SFAS 157 will have on the Fund's financial statement disclosures.
Annual Report
Notes to Financial Statements - continued
(Amounts in thousands except ratios)
4. Operating Policies.
Repurchase Agreements. FMR has received an Exemptive Order from the Securities and Exchange Commission (the SEC) which permits the Fund and other affiliated entities of FMR to transfer uninvested cash balances into joint trading accounts which are then invested in repurchase agreements. The Fund may also invest directly with institutions in repurchase agreements. Repurchase agreements are collateralized by government or non-government securities. Upon settlement date, collateral is held in segregated accounts with custodian banks and may be obtained in the event of a default of the counterparty. The Fund monitors, on a daily basis, the value of the collateral to ensure it is at least equal to the principal amount of the repurchase agreement (including accrued interest). In the event of a default by the counterparty, realization of the collateral proceeds could be delayed, during which time the value of the collateral may decline.
Restricted Securities. The Fund may invest in securities that are subject to legal or contractual restrictions on resale. These securities generally may be resold in transactions exempt from registration or to the public if the securities are registered. Disposal of these securities may involve time-consuming negotiations and expense, and prompt sale at an acceptable price may be difficult. Information regarding restricted securities is included at the end of the Fund's Schedule of Investments.
5. Purchases and Sales of Investments.
Purchases and sales of securities, other than short-term securities, aggregated $3,419,677 and $1,098,849, respectively.
6. Fees and Other Transactions with Affiliates.
Management Fee. FMR and its affiliates provide the Fund with investment management related services for which the Fund pays a monthly management fee. The management fee is the sum of an individual fund fee rate that is based on an annual rate of .35% of the Fund's average net assets and a group fee rate that averaged ..26% during the period. The group fee rate is based upon the average net assets of all the mutual funds advised by FMR. The group fee rate decreases as assets under management increase and increases as assets under management decrease. For the period, the total annual management fee rate was .61% of the Fund's average net assets.
Transfer Agent Fees. Fidelity Service Company, Inc. (FSC), an affiliate of FMR, is the Fund's transfer, dividend disbursing and shareholder servicing agent. FSC receives account fees and asset-based fees that vary according to account size and type of account. FSC pays for typesetting, printing and mailing of shareholder reports, except proxy statements. For the period the transfer agent fees were equivalent to an annual rate of .19% of average net assets.
Annual Report
6. Fees and Other Transactions with Affiliates - continued
Accounting and Security Lending Fees. FSC maintains the Fund's accounting records. The accounting fee is based on the level of average net assets for the month. Under a separate contract, FSC administers the security lending program. The security lending fee is based on the number and duration of lending transactions.
Brokerage Commissions. The Fund placed a portion of its portfolio transactions with brokerage firms which are affiliates of the investment adviser. The commissions paid to these affiliated firms were $18 for the period.
7. Committed Line of Credit.
The Fund participates with other funds managed by FMR in a $4.2 billion credit facility (the "line of credit") to be utilized for temporary or emergency purposes to fund shareholder redemptions or for other short-term liquidity purposes. The Fund has agreed to pay commitment fees on its pro rata portion of the line of credit, which amounted to $9 and is reflected in Miscellaneous Expense on the Statement of Operations. During the period, there were no borrowings on this line of credit.
8. Security Lending.
The Fund lends portfolio securities from time to time in order to earn additional income. On the settlement date of the loan, the Fund receives collateral (in the form of U.S. Treasury obligations, letters of credit and/or cash) against the loaned securities and maintains collateral in an amount not less than 100% of the market value of the loaned securities during the period of the loan. The market value of the loaned securities is determined at the close of business of the Fund and any additional required collateral is delivered to the Fund on the next business day. If the borrower defaults on its obligation to return the securities loaned because of insolvency or other reasons, a fund could experience delays and costs in recovering the securities loaned or in gaining access to the collateral. Any cash collateral received is invested in the Fidelity Securities Lending Cash Central Fund. The value of loaned securities and cash collateral at period end are disclosed on the Fund's Statement of Assets and Liabilities. Security lending income represents the income earned on investing cash collateral, less fees and expenses associated with the loan, plus any premium payments that may be received on the loan of certain types of securities. Security lending income is presented in the Statement of Operations as a component of income from Fidelity Central Funds. Net income from lending portfolio securities during the period amounted to $2,817.
Annual Report
Notes to Financial Statements - continued
(Amounts in thousands except ratios)
9. Expense Reductions.
Many of the brokers with whom FMR places trades on behalf of the Fund provided services to the Fund in addition to trade execution. These services included payments of certain expenses on behalf of the Fund totaling $47 for the period. In addition, through arrangements with the Fund's custodian and transfer agent, credits realized as a result of uninvested cash balances were used to reduce the Fund's expenses. During the period, these credits reduced the Fund's custody and transfer agent expenses by $9 and $94, respectively.
10. Other.
The Fund's organizational documents provide former and current trustees and officers with a limited indemnification against liabilities arising in connection with the performance of their duties to the Fund. In the normal course of business, the Fund may also enter into contracts that provide general indemnifications. The Fund's maximum exposure under these arrangements is unknown as this would be dependent on future claims that may be made against the Fund. The risk of material loss from such claims is considered remote.
The United States Securities and Exchange Commission ("SEC") is conducting an investigation of FMR (covering the years 2002 to 2004) arising from gifts, gratuities and business entertainment provided by certain brokers to certain individuals who were employed on FMR's domestic equity trading desk during that period. FMR is in discussions with the SEC staff regarding the possible resolution of the matter, but as of period-end no final resolution has been reached.
In December 2006, the Independent Trustees completed their own investigation of the matter with the assistance of independent counsel. The Independent Trustees and FMR agree that, despite the absence of proof that the Fidelity mutual funds experienced diminished execution quality as a result of the improper receipt of gifts and business entertainment, the conduct at issue was serious and is worthy of redress. Accordingly, the Independent Trustees have requested and FMR has agreed to pay $42 million to Fidelity mutual funds, plus interest to be determined at the time that payment is made. A method of allocating this payment among the funds has not yet been determined. The total payment to the Fund is not anticipated to have a material impact on the Fund's net assets. In addition, FMR reimbursed related legal expenses which are recorded in the accompanying Statement of Operations as an expense reduction.
Annual Report
Report of Independent Registered Public Accounting Firm
To the Trustees of Fidelity Securities Fund and the Shareholders of Fidelity Leveraged Company Stock Fund:
In our opinion, the accompanying statement of assets and liabilities, including the schedule of investments, and the related statements of operations and of changes in net assets and the financial highlights present fairly, in all material respects, the financial position of Fidelity Leveraged Company Stock Fund (a fund of Fidelity Securities Fund) at July 31, 2007, the results of its operations for the year then ended, the changes in its net assets for each of the two years in the period then ended and the financial highlights for each of the five years in the period then ended, in conformity with accounting principles generally accepted in the United States of America. These financial statements and financial highlights (hereafter referred to as "financial statements") are the responsibility of the Fidelity Leveraged Company Stock Fund's management. Our responsibility is to express an opinion on these financial statements based on our audits. We conducted our audits of these financial statements in accordance with the standards of the Public Company Accounting Oversight Board (United States). Those standards require that we plan and perform the audit to obtain reasonable assurance about whether the financial statements are free of material misstatement. An audit includes examining, on a test basis, evidence supporting the amounts and disclosures in the financial statements, assessing the accounting principles used and significant estimates made by management, and evaluating the overall financial statement presentation. We believe that our audits, which included confirmation of securities at July 31, 2007 by correspondence with the custodian and brokers, provide a reasonable basis for our opinion.
/s/ PricewaterhouseCoopers LLP
PricewaterhouseCoopers LLP
Boston, Massachusetts
September 20, 2007
Annual Report
Trustees and Officers
The Trustees, Members of the Advisory Board, and executive officers of the trust and fund, as applicable, are listed below. The Board of Trustees governs the fund and is responsible for protecting the interests of shareholders. The Trustees are experienced executives who meet periodically throughout the year to oversee the fund's activities, review contractual arrangements with companies that provide services to the fund, and review the fund's performance. Except for James C. Curvey, each of the Trustees oversees 353 funds advised by FMR or an affiliate. Mr. Curvey oversees 317 funds advised by FMR or an affiliate.
The Trustees hold office without limit in time except that (a) any Trustee may resign; (b) any Trustee may be removed by written instrument, signed by at least two-thirds of the number of Trustees prior to such removal; (c) any Trustee who requests to be retired or who has become incapacitated by illness or injury may be retired by written instrument signed by a majority of the other Trustees; and (d) any Trustee may be removed at any special meeting of shareholders by a two-thirds vote of the outstanding voting securities of the trust. Each Trustee who is not an interested person (as defined in the 1940 Act) (Independent Trustee), shall retire not later than the last day of the calendar year in which his or her 72nd birthday occurs. The Independent Trustees may waive this mandatory retirement age policy with respect to individual Trustees. The executive officers and Advisory Board Members hold office without limit in time, except that any officer and Advisory Board Member may resign or may be removed by a vote of a majority of the Trustees at any regular meeting or any special meeting of the Trustees. Except as indicated, each individual has held the office shown or other offices in the same company for the past five years.
The fund's Statement of Additional Information (SAI) includes more information about the Trustees. To request a free copy, call Fidelity at 1-800-544-8544.
Interested Trustees*:
Correspondence intended for each Trustee who is an interested person may be sent to Fidelity Investments, 82 Devonshire Street, Boston, Massachusetts 02109.
Name, Age; Principal Occupation |
Edward C. Johnson 3d (77) |
| Year of Election or Appointment: 1984 Mr. Johnson is Chairman of the Board of Trustees. Mr. Johnson serves as President (2006-present), Chief Executive Officer, Chairman, and a Director of FMR Corp.; Chairman and a Director of FMR; Chairman and a Director of Fidelity Research & Analysis Company (FRAC); Chairman and a Director of Fidelity Investments Money Management, Inc.; and Chairman (2001-present) and a Director of FMR Co., Inc. In addition, Mr. Johnson serves as Chairman and Director of Fidelity International Limited (FIL). |
James C. Curvey (72) |
| Year of Election or Appointment: 2007 Mr. Curvey also serves as Trustee (2007-present) or Member of the Advisory Board (2007-present) of other investment companies advised by FMR. Mr. Curvey is Vice Chairman (2006-present) and Director of FMR Corp. Mr. Curvey joined Fidelity in 1982 and served in numerous senior management positions, including President and Chief Operating Officer of FMR Corp. (1997-2000) and President of Fidelity Strategic Investments (2000-2002). In addition, he serves as a member of the Board of Directors of Geerlings & Wade, Inc. (wine distribution). |
* Trustees have been determined to be "Interested Trustees" by virtue of, among other things, their affiliation with the trust or various entities under common control with FMR.
Independent Trustees:
Correspondence intended for each Independent Trustee (that is, the Trustees other than the Interested Trustees) may be sent to Fidelity Investments, P.O. Box 55235, Boston, Massachusetts 02205-5235.
Name, Age; Principal Occupation |
Dennis J. Dirks (59) |
| Year of Election or Appointment: 2005 Prior to his retirement in May 2003, Mr. Dirks was Chief Operating Officer and a member of the Board of The Depository Trust & Clearing Corporation (DTCC) (1999-2003). He also served as President, Chief Operating Officer, and Board member of The Depository Trust Company (DTC) (1999-2003) and President and Board member of the National Securities Clearing Corporation (NSCC) (1999-2003). In addition, Mr. Dirks served as Chief Executive Officer and Board member of the Government Securities Clearing Corporation (2001-2003) and Chief Executive Officer and Board member of the Mortgage-Backed Securities Clearing Corporation (2001-2003). Mr. Dirks also serves as a Trustee and a member of the Finance Committee of Manhattan College (2005-present) and a Trustee and a member of the Finance Committee of AHRC of Nassau County (2006-present). |
Albert R. Gamper, Jr. (65) |
| Year of Election or Appointment: 2006 Prior to his retirement in December 2004, Mr. Gamper served as Chairman of the Board of CIT Group Inc. (commercial finance). During his tenure with CIT Group Inc. Mr. Gamper served in numerous senior management positions, including Chairman (1987-1989; 1999-2001; 2002-2004), Chief Executive Officer (1987-2004), and President (1989-2002). He currently serves as a member of the Board of Directors of Public Service Enterprise Group (utilities, 2001-present), Chairman of the Board of Governors, Rutgers University (2004-present), and Chairman of the Board of Saint Barnabas Health Care System. |
George H. Heilmeier (71) |
| Year of Election or Appointment: 2004 Dr. Heilmeier is Chairman Emeritus of Telcordia Technologies (communication software and systems), where prior to his retirement, he served as company Chairman and Chief Executive Officer. He currently serves on the Boards of Directors of The Mitre Corporation (systems engineering and information technology support for the government), and HRL Laboratories (private research and development, 2004-present). He is Chairman of the General Motors Science & Technology Advisory Board and a Life Fellow of the Institute of Electrical and Electronics Engineers (IEEE). Dr. Heilmeier is a member of the Defense Science Board and the National Security Agency Advisory Board. He is also a member of the National Academy of Engineering, the American Academy of Arts and Sciences, and the Board of Overseers of the School of Engineering and Applied Science of the University of Pennsylvania. Previously, Dr. Heilmeier served as a Director of TRW Inc. (automotive, space, defense, and information technology, 1992-2002), Compaq (1994-2002), Automatic Data Processing, Inc. (ADP) (technology-based business outsourcing, 1995-2002), INET Technologies Inc. (telecommunications network surveillance, 2001-2004), and Teletech Holdings (customer management services). He is the recipient of the 2005 Kyoto Prize in Advanced Technology for his invention of the liquid crystal display, and a member of the Consumer Electronics Hall of Fame. |
James H. Keyes (66) |
| Year of Election or Appointment: 2007 Prior to his retirement in 2003, Mr. Keyes was Chairman, President, and Chief Executive Officer of Johnson Controls, Inc. (automotive supplier, 1993-2003). He currently serves as a member of the boards of LSI Logic Corporation (semiconductor technologies), Navistar International Corporation (manufacture and sale of trucks, buses, and diesel engines, 2002-present), and Pitney Bowes, Inc. (integrated mail, messaging, and document management solutions). |
Marie L. Knowles (60) |
| Year of Election or Appointment: 2001 Prior to Ms. Knowles' retirement in June 2000, she served as Executive Vice President and Chief Financial Officer of Atlantic Richfield Company (ARCO) (diversified energy, 1996-2000). From 1993 to 1996, she was a Senior Vice President of ARCO and President of ARCO Transportation Company. She served as a Director of ARCO from 1996 to 1998. She currently serves as a Director of Phelps Dodge Corporation (copper mining and manufacturing) and McKesson Corporation (healthcare service, 2002-present). Ms. Knowles is a Trustee of the Brookings Institution and the Catalina Island Conservancy and also serves as a member of the Advisory Board for the School of Engineering of the University of Southern California. |
Ned C. Lautenbach (63) |
| Year of Election or Appointment: 2000 Mr. Lautenbach is Chairman of the Independent Trustees (2006-present). Mr. Lautenbach has been a partner of Clayton, Dubilier & Rice, Inc. (private equity investment firm) since September 1998. Previously, Mr. Lautenbach was with the International Business Machines Corporation (IBM) from 1968 until his retirement in 1998. Mr. Lautenbach serves as a Director of Sony Corporation (2006-present) and Eaton Corporation (diversified industrial) as well as the Philharmonic Center for the Arts in Naples, Florida. He also is a member of the Board of Trustees of Fairfield University (2005-present), as well as a member of the Council on Foreign Relations. |
Cornelia M. Small (63) |
| Year of Election or Appointment: 2005 Ms. Small is a member (2000-present) and Chairperson (2002-present) of the Investment Committee, and a member (2002-present) of the Board of Trustees of Smith College. Previously, she served as Chief Investment Officer (1999-2000), Director of Global Equity Investments (1996-1999), and a member of the Board of Directors of Scudder, Stevens & Clark (1990-1997) and Scudder Kemper Investments (1997-1999). In addition, Ms. Small served as Co-Chair (2000-2003) of the Annual Fund for the Fletcher School of Law and Diplomacy. |
William S. Stavropoulos (68) |
| Year of Election or Appointment: 2002 Mr. Stavropoulos is Chairman Emeritus of the Board of Directors of The Dow Chemical Company. Since joining The Dow Chemical Company in 1967, Mr. Stavropoulos served in numerous senior management positions, including President (1993-2000; 2002-2003), CEO (1995-2000; 2002-2004), and Chairman of the Executive Committee (2000-2004). Currently, he is a Director of NCR Corporation (data warehousing and technology solutions), Chemical Financial Corporation, Maersk Inc. (industrial conglomerate, 2002-present), Tyco International, Inc. (multinational manufacturing and services, 2007-present), and a member of the Advisory Board for Metalmark Capital (private equity investment firm, 2005-present). He is a special advisor to Clayton, Dubilier & Rice, Inc., a private equity investment firm. He also serves as a member of the Board of Trustees of the American Enterprise Institute for Public Policy Research. In addition, Mr. Stavropoulos is a member of The Business Council, J.P. Morgan International Council and the University of Notre Dame Advisory Council for the College of Science. |
Kenneth L. Wolfe (68) |
| Year of Election or Appointment: 2005 Prior to his retirement in 2001, Mr. Wolfe was Chairman and Chief Executive Officer of Hershey Foods Corporation (1993-2001). He currently serves as a member of the boards of Adelphia Communications Corporation (2003-present), Bausch & Lomb, Inc., and Revlon Inc. (2004-present). |
Advisory Board Members and Executive Officers:
Correspondence intended for Mr. Mauriello may be sent to Fidelity Investments, P.O. Box 55235, Boston, Massachusetts 02205-5235. Correspondence intended for each executive officer and Mr. Lynch may be sent to Fidelity Investments, 82 Devonshire Street, Boston, Massachusetts 02109.
Name, Age; Principal Occupation |
Peter S. Lynch (63) |
| Year of Election or Appointment: 2003 Member of the Advisory Board of Fidelity Securities Fund. Mr. Lynch is Vice Chairman and a Director of FMR, and Vice Chairman (2001- present) and a Director of FMR Co., Inc. Previously, Mr. Lynch served as a Trustee of the Fidelity funds (1990-2003). In addition, he serves as a Trustee of Boston College and as the Chairman of the Inner-City Scholarship Fund. |
Joseph Mauriello (62) |
| Year of Election or Appointment: 2007 Member of the Advisory Board of Fidelity Securities Fund. Prior to his retirement in January 2006, Mr. Mauriello served in numerous senior management positions including Deputy Chairman and Chief Operating Officer (2004-2005), and Vice Chairman of Financial Services (2002-2004) of KPMG LLP US (professional services firm, 1965-2005). Mr. Mauriello currently serves as a member of the Board of Directors of XL Capital Ltd., (global insurance and re-insurance company, 2006-present) and of Arcadia Resources Inc., (health care services and products, 2007-present). He also served as a Director of the Hamilton Funds of the Bank of New York (2006-2007). |
Kimberley H. Monasterio (43) |
| Year of Election or Appointment: 2007 President and Treasurer of Leveraged Company Stock. Ms. Monasterio also serves as President and Treasurer of other Fidelity funds (2007-present) and is an employee of FMR (2004-present). Previously, Ms. Monasterio served as Deputy Treasurer of the Fidelity funds (2004-2006). Before joining Fidelity Investments, Ms. Monasterio served as Treasurer (2000-2004) and Chief Financial Officer (2002-2004) of the Franklin Templeton Funds and Senior Vice President of Franklin Templeton Services, LLC (2000-2004). |
Walter C. Donovan (45) |
| Year of Election or Appointment: 2005 Vice President of Leveraged Company Stock. Mr. Donovan also serves as Vice President of Fidelity's High Income Funds (2005-present). Mr. Donovan also serves as Executive Vice President of FMR (2005-present) and FMR Co., Inc. (2005-present). Previously, Mr. Donovan served as Vice President of Fidelity's Fixed-Income Funds (2005-2006), certain Asset Allocation Funds (2005-2006), certain Balanced Funds (2005-2006), and as Vice President and Director of Fidelity's International Equity Trading group (1998-2005). |
Robert A. Lawrence (54) |
| Year of Election or Appointment: 2006 Vice President of Leveraged Company Stock. Mr. Lawrence also serves as Vice President of the High Income Funds. Mr. Lawrence is Senior Vice President of FMR (2006-present) and FMR Co., Inc. (2006-present). Previously, Mr. Lawrence served as President of Fidelity Strategic Investments (2002-2005). |
Thomas Soviero (43) |
| Year of Election or Appointment: 2003 Vice President of Leveraged Company Stock. Mr. Soviero also serves as Vice President of other funds advised by FMR. Prior to assuming his current responsibilities, Mr. Soviero worked as a research analyst, manager, and director of high-yield research. Mr. Soviero also serves as Senior Vice President of FMR and FMR Co., (2005). |
Eric D. Roiter (58) |
| Year of Election or Appointment: 2000 Secretary of Leveraged Company Stock. He also serves as Secretary of other Fidelity funds; Vice President, General Counsel, and Secretary of FMR Co., Inc. (2001-present) and FMR; Assistant Secretary of Fidelity Management & Research (U.K.) Inc. (2001-present), Fidelity Research & Analysis Company (2001-present), and Fidelity Investments Money Management, Inc. (2001-present). Mr. Roiter is an Adjunct Member, Faculty of Law, at Boston College Law School (2003-present). Previously, Mr. Roiter served as Vice President and Secretary of Fidelity Distributors Corporation (FDC) (1998-2005). |
Scott C. Goebel (39) |
| Year of Election or Appointment: 2007 Assistant Secretary of Leveraged Company Stock. Mr. Goebel also serves as Assistant Secretary of other Fidelity funds (2007-present), Vice President and Secretary of FDC (2006-present), and is an employee of FMR. |
R. Stephen Ganis (41) |
| Year of Election or Appointment: 2006 Anti-Money Laundering (AML) officer of Leveraged Company Stock. Mr. Ganis also serves as AML officer of other Fidelity funds (2006-
present) and FMR Corp. (2003-present). Before joining Fidelity Investments, Mr. Ganis practiced law at Goodwin Procter, LLP (2000-2002). |
Joseph B. Hollis (59) |
| Year of Election or Appointment: 2006 Chief Financial Officer of Leveraged Company Stock. Mr. Hollis also serves as Chief Financial Officer of other Fidelity funds. Mr. Hollis is President of Fidelity Pricing and Cash Management Services (FPCMS) (2005-present). Mr. Hollis also serves as President and Director of Fidelity Service Company, Inc. (2006-present). Previously, Mr. Hollis served as Senior Vice President of Cash Management Services (1999-2002) and Investment Management Operations (2002-2005). |
Kenneth A. Rathgeber (60) |
| Year of Election or Appointment: 2004 Chief Compliance Officer of Leveraged Company Stock. Mr. Rathgeber also serves as Chief Compliance Officer of other Fidelity funds (2004-present) and Executive Vice President of Risk Oversight for Fidelity Investments (2002-present). He is Chief Compliance Officer of FMR (2005-present), FMR Co., Inc. (2005-present), Fidelity Management & Research (U.K.) Inc. (2005-present), Fidelity Research & Analysis Company (2005-present), Fidelity Investments Money Management, Inc. (2005-present), and Strategic Advisers, Inc. (2005-present). Previously, Mr. Rathgeber served as Executive Vice President and Chief Operating Officer for Fidelity Investments Institutional Services Company, Inc. (1998-2002). |
Bryan A. Mehrmann (46) |
| Year of Election or Appointment: 2005 Deputy Treasurer of Leveraged Company Stock. Mr. Mehrmann also serves as Deputy Treasurer of other Fidelity funds (2005-present) and is an employee of FMR. Previously, Mr. Mehrmann served as Vice President of Fidelity Investments Institutional Services Group (FIIS)/Fidelity Investments Institutional Operations Corporation, Inc. (FIIOC) Client Services (1998-2004). |
Kenneth B. Robins (37) |
| Year of Election or Appointment: 2005 Deputy Treasurer of Leveraged Company Stock. Mr. Robins also serves as Deputy Treasurer of other Fidelity funds (2005-present) and is an employee of FMR (2004-present). Before joining Fidelity Investments, Mr. Robins worked at KPMG LLP, where he was a partner in KPMG's department of professional practice (2002-2004) and a Senior Manager (1999-2000). In addition, Mr. Robins served as Assistant Chief Accountant, United States Securities and Exchange Commission (2000-2002). |
Robert G. Byrnes (40) |
| Year of Election or Appointment: 2005 Assistant Treasurer of Leveraged Company Stock. Mr. Byrnes also serves as Assistant Treasurer of other Fidelity funds (2005-present) and is an employee of FMR (2005-present). Previously, Mr. Byrnes served as Vice President of FPCMS (2003-2005). Before joining Fidelity Investments, Mr. Byrnes worked at Deutsche Asset Management where he served as Vice President of the Investment Operations Group (2000-2003). |
Peter L. Lydecker (53) |
| Year of Election or Appointment: 2004 Assistant Treasurer of Leveraged Company Stock. Mr. Lydecker also serves as Assistant Treasurer of other Fidelity funds (2004) and is an employee of FMR. |
Gary W. Ryan (48) |
| Year of Election or Appointment: 2005 Assistant Treasurer of Leveraged Company Stock. Mr. Ryan also serves as Assistant Treasurer of other Fidelity funds (2005-present) and is an employee of FMR (2005-present). Previously, Mr. Ryan served as Vice President of Fund Reporting in FPCMS (1999-2005). |
Annual Report
Distributions
The Board of Trustees of Fidelity Leveraged Company Stock Fund voted to pay on September 10, 2007, to shareholders of record at the opening of business on September 7, 2007, a distribution of $1.09 per share derived from capital gains realized from sales of portfolio securities and a dividend of $0.29 per share from net investment income.
The fund hereby designates as a capital gain dividend with respect to the taxable year ended July 31, 2007, $313,377,672, or, if subsequently determined to be different, the net capital gain of such year.
The fund designates 44% and 100% of the dividends distributed in months of September 06 and December 06, respectively during the fiscal year as qualifying for the dividends-received deduction for corporate shareholders.
The fund designates 100% of the dividends distributed during the fiscal year as amounts which may be taken into account as a dividend for the purposes of the maximum rate under section 1(h)(11) of the Internal Revenue Code.
The fund will notify shareholders in January 2008 of amounts for use in preparing 2007 income tax returns.
Annual Report
Board Approval of Investment Advisory Contracts and Management Fees
Fidelity Leveraged Company Stock Fund
Each year, typically in July, the Board of Trustees, including the Independent Trustees (together, the Board), votes on the renewal of the management contract and sub-advisory agreements (together, the Advisory Contracts) for the fund. The Board, assisted by the advice of fund counsel and Independent Trustees' counsel, requests and considers a broad range of information throughout the year.
The Board meets regularly each month except August and takes into account throughout the year matters bearing on Advisory Contracts. The Board, acting directly and through its separate committees, considers at each of its meetings factors that are relevant to the annual renewal of the fund's Advisory Contracts, including the services and support provided to the fund and its shareholders. At the time of the renewal, the Board had 12 standing committees, each composed of Independent Trustees with varying backgrounds, to which the Board has assigned specific subject matter responsibilities in order to enhance effective decision-making by the Board. Each committee has adopted a written charter outlining the structure and purposes of the committee. One such committee, the Equity Contract Committee, meets periodically as needed throughout the year to consider matters specifically related to the annual renewal of Advisory Contracts. The committee requests and receives information on, and makes recommendations to the Independent Trustees concerning, the approval and annual review of the Advisory Contracts.
At its July 2007 meeting, the Board of Trustees, including the Independent Trustees, unanimously determined to renew the Advisory Contracts for the fund. In reaching its determination, the Board considered all factors it believed relevant, including (i) the nature, extent, and quality of the services to be provided to the fund and its shareholders (including the investment performance of the fund); (ii) the competitiveness of the management fee and total expenses of the fund; (iii) the total costs of the services to be provided by and the profits to be realized by the investment adviser and its affiliates from the relationship with the fund; (iv) the extent to which economies of scale would be realized as the fund grows; and (v) whether fee levels reflect these economies of scale, if any, for the benefit of fund shareholders. The Board also approved amendments to the fund's agreements with foreign sub-advisers to clarify that each sub-adviser provides services as an independent contractor.
In determining whether to renew the Advisory Contracts for the fund, the Board ultimately reached a determination, with the assistance of fund counsel and Independent Trustees' counsel, that the renewal of the Advisory Contracts and the compensation to be received by Fidelity under the management contract is consistent with Fidelity's fiduciary duty under applicable law. In addition to evaluating the specific factors noted above, the Board, in reaching its determination, is aware that shareholders in the fund have a broad range of investment choices available to them, including a wide choice among mutual funds offered by competitors to Fidelity, and that the fund's shareholders, with the opportunity to review and weigh the disclosure provided by the fund in its prospectus and other public disclosures, have chosen to invest in this fund, managed by Fidelity.
Annual Report
Nature, Extent, and Quality of Services Provided. The Board considered staffing within the investment adviser, FMR, and the sub-advisers (together, the Investment Advisers), including the background of the fund's portfolio manager and the fund's investment objective and discipline. The Independent Trustees also had discussions with senior management of Fidelity's investment operations and investment groups. The Board considered the structure of the portfolio manager compensation program and whether this structure provides appropriate incentives.
Resources Dedicated to Investment Management and Support Services. The Board reviewed the size, education, and experience of the Investment Advisers' investment staff, their use of technology, and the Investment Advisers' approach to recruiting, training, and retaining portfolio managers and other research, advisory, and management personnel. The Board considered Fidelity's extensive global research capabilities that enable the Investment Advisers to aggregate data from various sources in an effort to produce positive investment results. The Board noted that Fidelity's analysts have access to a variety of technological tools that enable them to perform both fundamental and quantitative analysis and to specialize in various disciplines. The Board also considered that Fidelity's portfolio managers and analysts have access to daily portfolio attribution that allows for monitoring of a fund's portfolio, as well as an electronic communication system that provides immediate real-time access to research concerning issuers and credit enhancers.
Shareholder and Administrative Services. The Board considered (i) the nature, extent, quality, and cost of advisory, administrative, distribution, and shareholder services performed by the Investment Advisers and their affiliates under the Advisory Contracts and under separate agreements covering transfer agency, pricing and bookkeeping, and securities lending services for the fund; (ii) the nature and extent of the Investment Advisers' supervision of third party service providers, principally custodians and subcustodians; and (iii) the resources devoted to, and the record of compliance with, the fund's compliance policies and procedures. The Board reviewed the allocation of fund brokerage, including allocations to brokers affiliated with the Investment Advisers, the use of brokerage commissions to pay fund expenses, and the use of "soft" commission dollars to pay for research services. The Board also considered that Fidelity voluntarily pays for market data out of its own resources. The Board also considered the agreement reached between the Independent Trustees and Fidelity in December 2006 following an independent review of matters relating to receipt of travel, entertainment, gifts and gratuities in violation of Fidelity policies.
Annual Report
Board Approval of Investment Advisory Contracts and
Management Fees - continued
The Board noted that the growth of fund assets across the complex allows Fidelity to reinvest in the development of services designed to enhance the value or convenience of the Fidelity funds as investment vehicles. These services include 24-hour access to account information and market information through phone representatives and over the Internet, and investor education materials and asset allocation tools.
Investment in a Large Fund Family. The Board considered the benefits to shareholders of investing in a Fidelity fund, including the benefits of investing in a fund that is part of a large family of funds offering a variety of investment disciplines and providing for a large variety of mutual fund investor services. For example, fund shareholders are offered the privilege of exchanging shares of the fund for shares of other Fidelity funds, as set forth in the fund's prospectus, without paying a sales charge. The Board noted that, since the last Advisory Contract renewals in July 2006, Fidelity has taken a number of actions that benefited particular funds, including (i) dedicating additional resources to investment research and to restructure the investment research teams; (ii) contractually agreeing to reduce the management fee on Fidelity Advisor Floating Rate High Income Fund; (iii) contractually agreeing to reduce the management fees on Fidelity's California, Massachusetts, New Jersey, and New York AMT Tax-Free Money Market Funds, launching new Institutional Classes and Service Classes of these funds, and contractually agreeing to impose expense limitations on these funds; (iv) eliminating the exchange fee on the Fidelity Select Portfolios and reducing the pricing and bookkeeping fee rates for these funds; (v) reducing the maximum transfer agency fee rates on high income funds and certain equity funds; (vi) proposing amended management contracts that, if approved by shareholders, will add a performance adjustment component to the management fees paid by 18 Fidelity Advisor equity funds; (vii) contractually agreeing to reduce fees for Ultra-Short Central Fund and the money market Central Funds; (viii) waiving the Fidelity Advisor funds' contingent deferred sales charge on certain redemptions made through systematic withdrawal programs; and (ix) amending the management contracts for equity and fixed-income funds whose management contracts incorporate a "group fee" structure by adding four new fee "breakpoints" to the group fee rate schedules.
Investment Performance and Compliance. The Board considered whether the fund has operated within its investment objective, as well as its record of compliance with its investment restrictions. It also reviewed the fund's absolute investment performance, as well as the fund's relative investment performance measured against (i) a broad-based securities market index, and (ii) a custom peer group of mutual funds deemed appropriate by the Board over multiple periods. The following charts considered by the Board show, over the one-, three-, and five-year periods ended December 31, 2006, the fund's cumulative total returns, the cumulative total returns of a broad-based securities market index ("benchmark"), and a range of cumulative total returns of a custom peer group of mutual funds defined by FMR based on categories assigned by Morningstar, Inc. The box within each chart shows the 25th percentile return (bottom of box) and the 75th percentile return (top of box) of the peer group. Returns shown above the box are in the first quartile and returns shown below the box are in the fourth quartile. The percentage beaten number noted below each chart corresponds to the percentile box and represents the percentage of funds in the peer group whose performance was equal to or lower than that of the fund. The fund's custom peer group, defined by FMR, is a peer group that FMR believes provides a more meaningful performance comparison than the peer group assigned by Morningstar, Inc. Morningstar, Inc. assigns mutual funds to categories based on their investment styles as measured by their underlying portfolio holdings.
Annual Report
Fidelity Leveraged Company Stock Fund
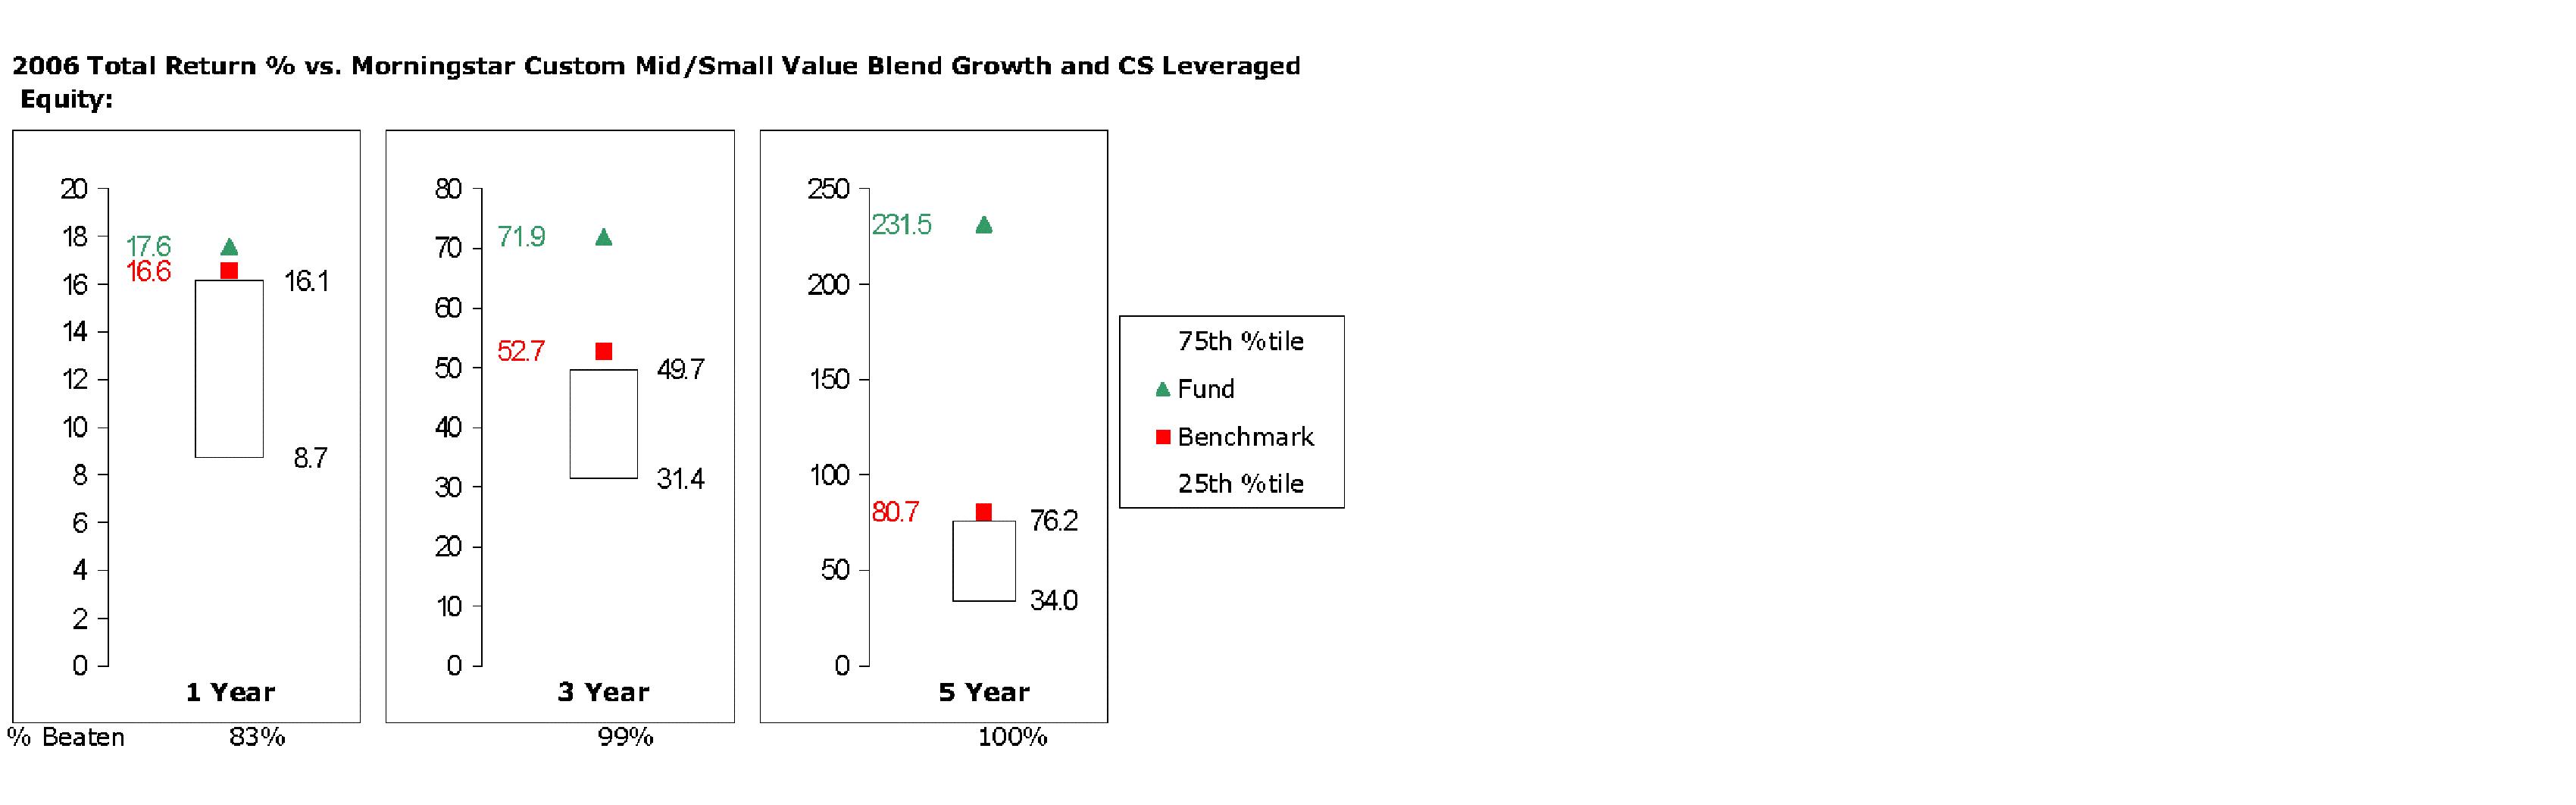
The Board reviewed the fund's relative investment performance against its peer group and stated that the performance of the fund was in the first quartile for all the periods shown. The Board also stated that the investment performance of the fund compared favorably to its benchmark for all the periods shown.
The Board considered that FMR has taken steps to refocus and strengthen equity research, equity portfolio management, and compliance.
Based on its review, and giving particular weight to the nature and quality of the resources dedicated by the Investment Advisers to maintain and improve relative performance, the Board concluded that the nature, extent, and quality of the services provided to the fund will benefit the fund's shareholders, particularly in light of the Board's view that the fund's shareholders benefit from investing in a fund that is part of a large family of funds offering a variety of investment disciplines and services.
Annual Report
Board Approval of Investment Advisory Contracts and
Management Fees - continued
Competitiveness of Management Fee and Total Fund Expenses. The Board considered the fund's management fee and total expenses compared to "mapped groups" of competitive funds and classes. Fidelity creates "mapped groups" by combining similar Lipper investment objective categories that have comparable management fee characteristics. Combining Lipper investment objective categories aids the Board's management fee and total expense comparisons by broadening the competitive group used for comparison and by reducing the number of universes to which various Fidelity funds are compared. The Board also considered supplemental information about how the fund's management fee and total expenses ranked relative to groups based on Lipper classifications, which take into account a fund's market capitalization and style.
The Board considered two proprietary management fee comparisons for the 12-month periods shown in the chart below. The group of Lipper funds used by the Board for management fee comparisons is referred to below as the "Total Mapped Group." The Total Mapped Group comparison focuses on a fund's standing relative to the total universe of comparable funds available to investors, in terms of gross management fees before expense reimbursements or caps. "TMG %" represents the percentage of funds in the Total Mapped Group that had management fees that were lower than the fund's. For example, a TMG % of 15% means that 85% of the funds in the Total Mapped Group had higher management fees than the fund. The "Asset-Size Peer Group" (ASPG) comparison focuses on a fund's standing relative to non-Fidelity funds similar in size to the fund within the Total Mapped Group. The ASPG represents at least 15% of the funds in the Total Mapped Group with comparable asset size and management fee characteristics, subject to a minimum of 50 funds (or all funds in the Total Mapped Group if fewer than 50). Additional information, such as the ASPG quartile in which the fund's management fee ranked, is also included in the chart and considered by the Board.
Annual Report
Fidelity Leveraged Company Stock Fund
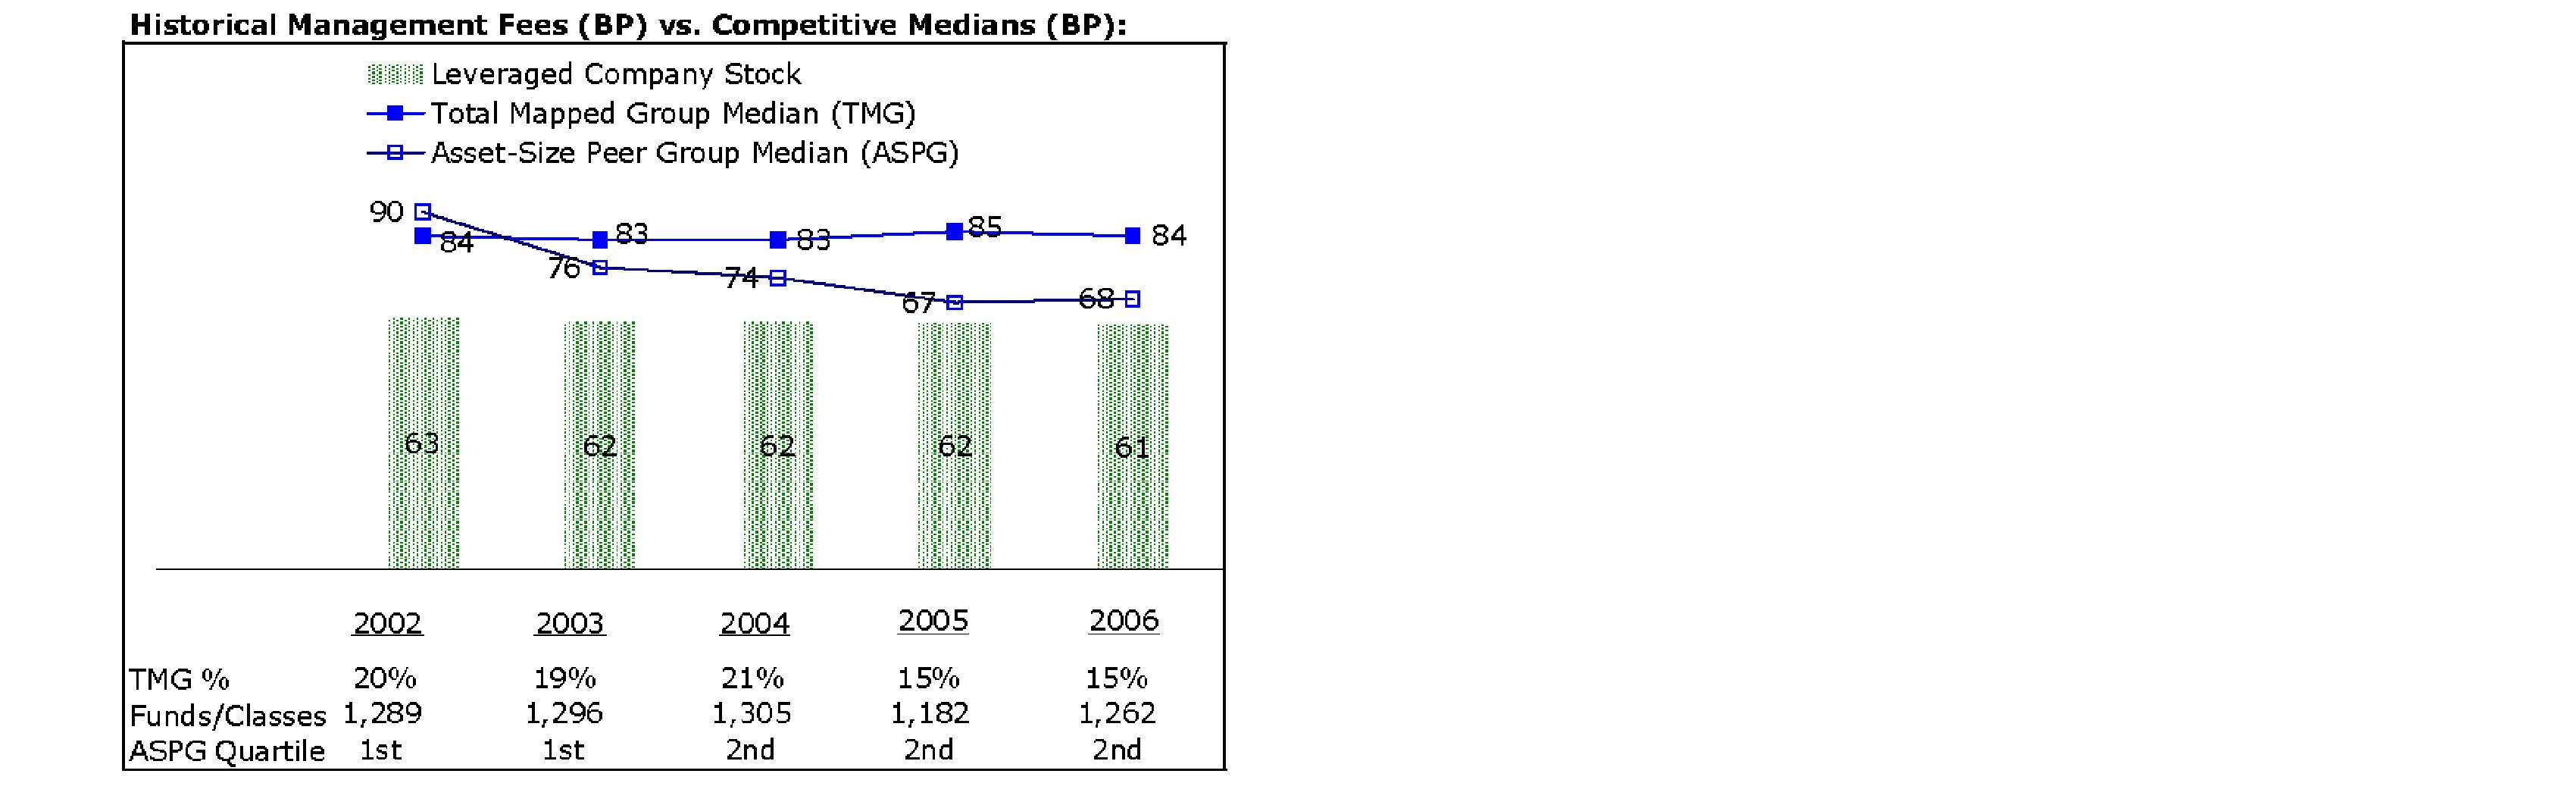
The Board noted that the fund's management fee ranked below the median of its Total Mapped Group and below the median of its ASPG for 2006.
Based on its review, the Board concluded that the fund's management fee was fair and reasonable in light of the services that the fund receives and the other factors considered.
In its review of the fund's total expenses, the Board considered the fund's management fee as well as other fund expenses, such as transfer agent fees, pricing and bookkeeping fees, and custodial, legal, and audit fees. The Board also noted the effects of any waivers and reimbursements on fees and expenses. As part of its review, the Board also considered current and historical total expenses of the fund compared to competitive fund median expenses. The fund is compared to those funds and classes in the Total Mapped Group (used by the Board for management fee comparisons) that have a similar sales load structure.
The Board noted that the fund's total expenses ranked below its competitive median for 2006.
In its review of total expenses, the Board also considered Fidelity fee structures and other information on clients that FMR and its affiliates service in other competitive markets, such as other mutual funds advised or subadvised by FMR or its affiliates, pension plan clients, and other institutional clients.
Annual Report
Board Approval of Investment Advisory Contracts and
Management Fees - continued
Based on its review, the Board concluded that the fund's total expenses were reasonable in light of the services that the fund and its shareholders receive and the other factors considered.
Costs of the Services and Profitability. The Board considered the revenues earned and the expenses incurred by Fidelity in conducting the business of developing, marketing, distributing, managing, administering and servicing the fund and its shareholders. The Board also considered the level of Fidelity's profits in respect of all the Fidelity funds.
On an annual basis, FMR presents to the Board Fidelity's profitability for the fund. Fidelity calculates the profitability for each fund, as well as aggregate profitability for groups of Fidelity funds and all Fidelity funds, using a series of detailed revenue and cost allocation methodologies which originate with the audited books and records of Fidelity. The Audit Committee of the Board reviews any significant changes from the prior year's methodologies.
PricewaterhouseCoopers LLP (PwC), independent registered public accounting firm and auditor to Fidelity and certain Fidelity funds, has been engaged annually by the Board as part of the Board's assessment of the results of Fidelity's profitability analysis. PwC's engagement includes the review and assessment of Fidelity's methodologies used in determining the revenues and expenses attributable to Fidelity's mutual fund business, and completion of agreed-upon procedures surrounding the mathematical accuracy of fund profitability and its conformity to allocation methodologies. After considering PwC's reports issued under the engagement and information provided by Fidelity, the Board believes that while other allocation methods may also be reasonable, Fidelity's profitability methodologies are reasonable in all material respects.
The Board has also reviewed Fidelity's non-fund businesses and any fall-out benefits related to the mutual fund business as well as cases where Fidelity's affiliates may benefit from or be related to the fund's business.
The Board considered the costs of the services provided by and the profits realized by Fidelity in connection with the operation of the fund and determined that the amount of profit is a fair entrepreneurial profit for the management of the fund.
Economies of Scale. The Board considered whether there have been economies of scale in respect of the management of the Fidelity funds, whether the Fidelity funds (including the fund) have appropriately benefited from any such economies of scale, and whether there is potential for realization of any further economies of scale. The Board considered the extent to which the fund will benefit from economies of scale through increased services to the fund, through waivers or reimbursements, or through fee or expense reductions, including reductions that occur through operation of the transfer agent agreement. The transfer agent fee varies in part based on the number of accounts in the fund. If the number of accounts decreases or the average account size increases, the overall transfer agent fee rate decreases.
Annual Report
The Board recognized that the fund's management contract incorporates a "group fee" structure, which provides for lower group fee rates as total fund assets under FMR's management increase, and for higher group fee rates as total fund assets under FMR's management decrease. FMR determines the group fee rates based on a tiered asset "breakpoint" schedule. In connection with the renewal of the fund's management contract, the Board approved amendments to the fund's management contract that added four new fee breakpoints to the group fee rate schedule for assets under FMR's management above $1,386 billion. The Board considered that the group fee rate declines under both the present and amended schedules, but that under the amended schedule, the group fee rate declines faster as assets under FMR's management exceed $1,386 billion. The Board considered that the group fee is designed to deliver the benefits of economies of scale to fund shareholders when total fund assets increase, even if assets of any particular fund are unchanged or have declined, because some portion of Fidelity's costs are attributable to services provided to all Fidelity funds, and all funds benefit if those costs can be allocated among more assets. The Board concluded that, given the group fee structure, fund shareholders will achieve a certain level of economies of scale as assets under FMR's management increase at the fund complex level, regardless of whether Fidelity achieves any such economies of scale.
The Board further concluded that any potential economies of scale are being shared between fund shareholders and Fidelity in an appropriate manner.
Additional Information Requested by the Board. In order to develop fully the factual basis for consideration of the Fidelity funds' Advisory Contracts, the Board requested and received additional information on several topics, including (i) fund performance trends and actions to be taken by FMR to improve certain funds' overall performance; (ii) Fidelity's portfolio manager compensation structure, including its effects on fund profitability and the extent to which portfolio manager compensation is linked to fund performance; (iii) Fidelity's fee structures; (iv) the funds' sub-advisory arrangements; and (v) accounts managed by Fidelity other than the Fidelity funds.
Based on its evaluation of all of the conclusions noted above, and after considering all material factors, the Board ultimately concluded that the advisory fee structures are fair and reasonable, and that the fund's Advisory Contracts should be renewed.
Annual Report
Managing Your Investments
Fidelity offers several ways to conveniently manage your personal investments via your telephone or PC. You can access your account information, conduct trades and research your investments 24 hours a day.
By Phone
Fidelity Automated Service Telephone provides a single toll-free number to access account balances, positions, quotes and trading. It's easy to navigate the service, and on your first call, the system will help you create a personal identification number (PIN) for security.
(phone_graphic)
Fidelity Automated
Service Telephone (FAST®)
1-800-544-5555
Press
1 For mutual fund and brokerage trading.
2 For quotes.*
3 For account balances and holdings.
4 To review orders and mutual
fund activity.
5 To change your PIN.
*0 To speak to a Fidelity representative.
By PC
Fidelity's web site on the Internet provides a wide range of information, including daily financial news, fund performance, interactive planning tools and news about Fidelity products and services.
(computer_graphic)
Fidelity's Web Site
www.fidelity.com
* When you call the quotes line, please remember that a fund's yield and return will vary and, except for money market funds, share price will also vary. This means that you may have a gain or loss when you sell your shares. There is no assurance that money market funds will be able to maintain a stable $1 share price; an investment in a money market fund is not insured or guaranteed by the U.S. government. Total returns are historical and include changes in share price, reinvestment of dividends and capital gains, and the effects of any sales charges.
Annual Report
To Write Fidelity
We'll give your correspondence immediate attention and send you written confirmation upon completion of your request.
(letter_graphic)
Making Changes
To Your Account
(such as changing name, address, bank, etc.)
Fidelity Investments
P.O. Box 770001
Cincinnati, OH 45277-0002
(letter_graphic)
For Non-Retirement
Accounts
Buying shares
Fidelity Investments
P.O. Box 770001
Cincinnati, OH 45277-0003
Overnight Express
Fidelity Investments
Attn: Distribution Services
100 Crosby Parkway - KC1H
Covington, KY 41015
Selling shares
Fidelity Investments
P.O. Box 770001
Cincinnati, OH 45277-0035
Overnight Express
Fidelity Investments
Attn: Distribution Services
100 Crosby Parkway - KC1H
Covington, KY 41015
General Correspondence
Fidelity Investments
P.O. Box 500
Merrimack, NH 03054-0500
(letter_graphic)
For Retirement
Accounts
Buying shares
Fidelity Investments
P.O. Box 770001
Cincinnati, OH 45277-0003
Selling shares
Fidelity Investments
P.O. Box 770001
Cincinnati, OH 45277-0035
Overnight Express
Fidelity Investments
Attn: Distribution Services
100 Crosby Parkway - KC1H
Covington, KY 41015
General Correspondence
Fidelity Investments
P.O. Box 500
Merrimack, NH 03054-0500
Annual Report
Investment Adviser
Fidelity Management & Research Company
Boston, MA
Investment Sub-Adviser
FMR Co., Inc.
Fidelity Research & Analysis Company
Fidelity Management & Research
(U.K.) Inc.
Fidelity Investments Japan Limited
Fidelity International Investment
Advisors
Fidelity International Investment
Advisors (U.K.) Limited
General Distributor
Fidelity Distributors Corporation
Boston, MA
Transfer and Service Agent
Fidelity Service Company, Inc.
Boston, MA
Custodian
JPMorgan Chase Bank
New York, NY
The Fidelity Telephone Connection
Mutual Fund 24-Hour Service
Exchanges/Redemptions
and Account Assistance 1-800-544-6666
Product Information 1-800-544-6666
Retirement Accounts 1-800-544-4774
(8 a.m. - 9 p.m.)
TDD Service 1-800-544-0118
for the deaf and hearing impaired
(9 a.m. - 9 p.m. Eastern time)
Fidelity Automated Service
Telephone (FAST ®) (automated graphic) 1-800-544-5555
(automated graphic) Automated line for quickest service
LSF-UANN-0907
1.789248.104
(Fidelity Investment logo)(registered trademark)
Corporate Headquarters
82 Devonshire St., Boston, MA 02109
www.fidelity.com
Fidelity®
OTC
Portfolio
Annual Report
July 31, 2007
(2_fidelity_logos) (Registered_Trademark)
Contents
Chairman's Message | <Click Here> | Ned Johnson's message to shareholders. |
Performance | <Click Here> | How the fund has done over time. |
Management's Discussion | <Click Here> | The manager's review of fund performance, strategy and outlook. |
Shareholder Expense Example | <Click Here> | An example of shareholder expenses. |
Investment Changes | <Click Here> | A summary of major shifts in the fund's investments over the past six months. |
Investments | <Click Here> | A complete list of the fund's investments with their market values. |
Financial Statements | <Click Here> | Statements of assets and liabilities, operations, and changes in net assets, as well as financial highlights. |
Notes | <Click Here> | Notes to the financial statements. |
Report of Independent Registered Public Accounting Firm | <Click Here> | |
Trustees and Officers | <Click Here> | |
Board Approval of Investment Advisory Contracts and Management Fees | <Click Here> | |
To view a fund's proxy voting guidelines and proxy voting record for the 12-month period ended June 30, visit http://www.fidelity.com (search for "proxy voting guidelines") or visit the Securities and Exchange Commission's (SEC) web site at http://www.sec.gov. You may also call 1-800-544-8544 to request a free copy of the proxy voting guidelines.
Standard & Poor's, S&P and S&P 500 are registered service marks of The McGraw-Hill Companies, Inc. and have been licensed for use by Fidelity Distributors Corporation.
Other third party marks appearing herein are the property of their respective owners.
All other marks appearing herein are registered or unregistered trademarks or service marks of FMR Corp. or an affiliated company.
Annual Report
This report and the financial statements contained herein are submitted for the general information of the shareholders of the fund. This report is not authorized for distribution to prospective investors in the fund unless preceded or accompanied by an effective prospectus.
A fund files its complete schedule of portfolio holdings with the SEC for the first and third quarters of each fiscal year on Form N-Q. Forms N-Q are available on the SEC's web site at http://www.sec.gov. A fund's Forms N-Q may be reviewed and copied at the SEC's Public Reference Room in Washington, DC. Information regarding the operation of the SEC's Public Reference Room may be obtained by calling 1-800-SEC-0330. For a complete list of a fund's portfolio holdings, view the most recent holdings listing, semiannual report, or annual report on Fidelity's web site at http://www.fidelity.com or http://www.advisor.fidelity.com, as applicable.
NOT FDIC INSURED · MAY LOSE VALUE · NO BANK GUARANTEE
Neither the fund nor Fidelity Distributors Corporation is a bank.
Annual Report
Chairman's Message
(photo_of_Edward_C_Johnson_3d)
Dear Shareholder:
Stocks are currently on pace to register their fifth straight year of positive returns, although gains could be trimmed if the U.S. economy continues to slow. While financial markets are always unpredictable, there are a number of time-tested principles that can put the historical odds in your favor.
One of the basic tenets is to invest for the long term. Over time, riding out the markets' inevitable ups and downs has proven much more effective than selling into panic or chasing the hottest trend. Even missing only a few of the markets' best days can significantly diminish investor returns. Patience also affords the benefits of compounding - of earning interest on additional income or reinvested dividends and capital gains. There are tax advantages and cost benefits to consider as well. The more you sell, the more taxes you pay, and the more you trade, the higher the costs. While staying the course doesn't eliminate risk, it can considerably lessen the effect of short-term declines.
You can further manage your investing risk through diversification. And today, more than ever, geographic diversification should be taken into account. Studies indicate that asset allocation is the single most important determinant of a portfolio's long-term success. The right mix of stocks, bonds and cash - aligned to your particular risk tolerance and investment objective - is very important. Age-appropriate rebalancing is also an essential aspect of asset allocation. For younger investors, an emphasis on equities - which historically have been the best-performing asset class over time - is encouraged. As investors near their specific goal, such as retirement or sending a child to college, consideration may be given to replacing volatile assets (e.g. common stocks) with more-stable fixed investments (bonds or savings plans).
A third investment principle - investing regularly - can help lower the average cost of your purchases. Investing a certain amount of money each month or quarter helps ensure you won't pay for all your shares at market highs. This strategy - known as dollar cost averaging - also reduces unconstructive "emotion" from investing, helping shareholders avoid selling weak performers just prior to an upswing, or chasing a hot performer just before a correction.
We invite you to contact us via the Internet, through our Investor Centers or over the phone. It is our privilege to provide you the information you need to make the investments that are right for you.
Sincerely,
/s/Edward C. Johnson 3d
Edward C. Johnson 3d
Annual Report
Performance: The Bottom Line
Average annual total return reflects the change in the value of an investment, assuming reinvestment of the fund's dividend income and capital gains (the profits earned upon the sale of securities that have grown in value) and assuming a constant rate of performance each year. The $10,000 table and the fund's returns do not reflect the deduction of taxes that a shareholder would pay on fund distributions or the redemption of fund shares. During periods of reimbursement by Fidelity, a fund's total return will be greater than it would be had the reimbursement not occurred. How a fund did yesterday is no guarantee of how it will do tomorrow.
Average Annual Total Returns
Periods ended July 31, 2007 | Past 1
year | Past 5
years | Past 10
years |
Fidelity® OTC Portfolio | 35.71% | 15.23% | 6.76% |
$10,000 Over 10 Years
Let's say hypothetically that $10,000 was invested in Fidelity ® OTC Portfolio on July 31, 1997. The chart shows how the value of your investment would have changed, and also shows how the NASDAQ Composite® Index performed over the same period.
Annual Report
Management's Discussion of Fund Performance
Comments from Sonu Kalra, Portfolio Manager of Fidelity® OTC Portfolio
Major U.S. equity benchmarks approached or exceeded gains of 20% and several set record highs during the 12-month period ending July 31, 2007. In that time, the Dow Jones Industrial AverageSM rose 20.84%, the Standard & Poor's 500SM Index advanced 16.13% and the NASDAQ Composite® Index gained 22.67%. The small-cap Russell 2000® Index fared less well after falling nearly 7% in July, but still returned 12.12% for the year overall. The first half of the period featured six consecutive months of positive returns spurred by the more relaxed monetary policy of the Federal Reserve Board and falling energy prices, which softened inflationary pressures on the U.S. economy. Stocks slipped in February, however, as energy prices crept higher, the housing market slumped, subprime mortgage woes mounted and the Chinese stock market declined 9% in a single day. But equities soared again from March through May, as reflected by the Dow and the S&P 500®, which climbed nearly 12% and more than 9%, respectively. In June and July, though, stocks sank again on inflation concerns and a worsening subprime loan crisis.
During the past year, the fund returned 35.71%, far surpassing the NASDAQ Composite Index. The information technology sector provided most of the outperformance, mainly due to effective stock selection in the software and services segment and the technology hardware and equipment area. Underweighting financials also helped. Japan's Nintendo, an out-of-index holding and the fund's largest position at period end, was its top contributor by a wide margin, riding the explosive success of its Wii video-game hardware platform. I added to the position, which increased the fund's stake in foreign stocks as well. Other contributors from the technology sector included Canada-based Research In Motion (RIM), which makes the BlackBerry handheld messaging unit; Apple, maker of personal computers and other consumer electronics devices; and network equipment provider Juniper Networks. Lastly, the fund was helped by Deckers Outdoor, which saw strong sales of its UGG brand boots. On the negative side, stock selection worked against the fund in the consumer discretionary sector, and underweighting industrials detracted modestly from our results. At the stock level, underweighting major index component Cisco Systems was a drawback, as the same trends in Internet usage that helped Juniper Networks also benefited Cisco. Marvell Technology Group, a supplier of semiconductors for hard-disk drives and cellular phones, also detracted, as did underweighting Internet retailer Amazon.com.
The views expressed above reflect those of the portfolio manager(s) only through the end of the period as stated on the cover of this report and do not necessarily represent the views of Fidelity or any other person in the Fidelity organization. Any such views are subject to change at any time based upon market or other conditions and Fidelity disclaims any responsibility to update such views. These views may not be relied on as investment advice and, because investment decisions for a Fidelity fund are based on numerous factors, may not be relied on as an indication of trading intent on behalf of any Fidelity fund.
Annual Report
Shareholder Expense Example
As a shareholder of the Fund, you incur two types of costs: (1) transaction costs, and (2) ongoing costs, including management fees and other Fund expenses. This Example is intended to help you understand your ongoing costs (in dollars) of investing in the Fund and to compare these costs with the ongoing costs of investing in other mutual funds.
The Example is based on an investment of $1,000 invested at the beginning of the period and held for the entire period (February 1, 2007 to July 31, 2007).
Actual Expenses
The first line of the accompanying table provides information about actual account values and actual expenses. You may use the information in this line, together with the amount you invested, to estimate the expenses that you paid over the period. Simply divide your account value by $1,000.00 (for example, an $8,600 account value divided by $1,000.00 = 8.6), then multiply the result by the number in the first line under the heading entitled "Expenses Paid During Period" to estimate the expenses you paid on your account during this period. A small balance maintenance fee of $12.00 that is charged once a year may apply for certain accounts with a value of less than $2,000. This fee is not included in the table below. If it was, the estimate of expenses you paid during the period would be higher, and your ending account value lower, by this amount. In addition, the Fund, as a shareholder in the underlying Fidelity Central Funds, will indirectly bear its pro rata share of the fees and expenses incurred by the underlying Fidelity Central Funds. These fees and expenses are not included in the Fund's annualized expense ratio used to calculate the expense estimate in the table below.
Hypothetical Example for Comparison Purposes
The second line of the accompanying table provides information about hypothetical account values and hypothetical expenses based on the Fund's actual expense ratio and an assumed rate of return of 5% per year before expenses, which is not the Fund's actual return. The hypothetical account values and expenses may not be used to estimate the actual ending account balance or expenses you paid for the period. You may use this information to compare the ongoing costs of investing in the Fund and other funds. To do so, compare this 5% hypothetical example with the 5% hypothetical examples that appear in the shareholder reports of the other funds. A small balance maintenance fee of $12.00 that is charged once a year may apply for certain accounts with a value of less than $2,000. This fee is not included in the table below. If it was, the estimate of expenses you paid during the period would be higher, and your ending account value lower, by this amount. In addition, the Fund, as a shareholder in the underlying Fidelity Central Funds, will indirectly bear its pro rata share of the fees and expenses incurred by the underlying Fidelity Central Funds. These fees and expenses are not included in the Fund's annualized expense ratio used to calculate the expense estimate in the table below.
Annual Report
Shareholder Expense Example - continued
Please note that the expenses shown in the table are meant to highlight your ongoing costs only and do not reflect any transaction costs. Therefore, the second line of the table is useful in comparing ongoing costs only, and will not help you determine the relative total costs of owning different funds.
| Beginning
Account Value
February 1, 2007 | Ending
Account Value
July 31, 2007 | Expenses Paid
During Period*
February 1, 2007
to July 31, 2007 |
Actual | $ 1,000.00 | $ 1,114.30 | $ 5.03 |
Hypothetical (5% return per year before expenses) | $ 1,000.00 | $ 1,020.03 | $ 4.81 |
* Expenses are equal to the Fund's annualized expense ratio of .96%; multiplied by the average account value over the period, multiplied by 181/365 (to reflect the one-half year period).
Annual Report
Investment Changes
Top Ten Stocks as of July 31, 2007 |
| % of fund's
net assets | % of fund's net assets
6 months ago |
Nintendo Co. Ltd. | 9.7 | 5.6 |
Google, Inc. Class A (sub. vtg.) | 7.7 | 7.7 |
Apple, Inc. | 4.3 | 4.1 |
Cisco Systems, Inc. | 3.4 | 2.9 |
Broadcom Corp. Class A | 3.0 | 1.5 |
Research In Motion Ltd. | 2.9 | 2.4 |
Juniper Networks, Inc. | 2.6 | 2.4 |
SanDisk Corp. | 2.5 | 1.5 |
Celgene Corp. | 2.3 | 1.8 |
Intel Corp. | 2.1 | 1.8 |
| 40.5 | |
Top Five Market Sectors as of July 31, 2007 |
| % of fund's
net assets | % of fund's net assets
6 months ago |
Information Technology | 68.0 | 65.7 |
Health Care | 13.2 | 14.0 |
Consumer Discretionary | 8.3 | 8.9 |
Financials | 3.1 | 2.1 |
Industrials | 2.9 | 2.5 |
Asset Allocation (% of fund's net assets) |
As of July 31, 2007 * | As of January 31, 2007 ** |
| Stocks 99.6% | | | Stocks 99.4% | |
| Short-Term
Investments and
Net Other Assets 0.4% | | | Short-Term
Investments and
Net Other Assets 0.6% | |
* Foreign investments | 19.0% | | ** Foreign investments | 15.8% | |

Annual Report
Investments July 31, 2007
Showing Percentage of Net Assets
Common Stocks - 99.6% |
| Shares | | Value (000s) |
CONSUMER DISCRETIONARY - 8.3% |
Diversified Consumer Services - 0.0% |
New Oriental Education & Technology Group, Inc. sponsored ADR | 32,900 | | $ 1,703 |
Hotels, Restaurants & Leisure - 1.4% |
BJ's Restaurants, Inc. (a)(d) | 512,408 | | 10,248 |
Burger King Holdings, Inc. | 500,000 | | 12,145 |
Carrols Restaurant Group, Inc. | 545,551 | | 6,492 |
Home Inns & Hotels Management, Inc. ADR (d) | 126,100 | | 3,831 |
Indian Hotels Co. Ltd. | 1,290,000 | | 4,476 |
Morgans Hotel Group Co. (a) | 1,329,300 | | 25,642 |
P.F. Chang's China Bistro, Inc. (a) | 50,000 | | 1,637 |
Starbucks Corp. (a) | 2,165,300 | | 57,770 |
| | 122,241 |
Internet & Catalog Retail - 0.8% |
Amazon.com, Inc. (a) | 929,900 | | 73,034 |
Leisure Equipment & Products - 0.2% |
Callaway Golf Co. | 1,104,500 | | 17,926 |
Media - 2.5% |
Charter Communications, Inc. Class A (a)(d) | 3,656,700 | | 14,846 |
Comcast Corp. Class A (a) | 5,838,700 | | 153,383 |
EchoStar Communications Corp. Class A (a) | 244,900 | | 10,357 |
Focus Media Holding Ltd. ADR (a) | 112,200 | | 4,635 |
National CineMedia, Inc. | 562,500 | | 14,006 |
TiVo, Inc. (a)(d) | 3,854,075 | | 21,197 |
| | 218,424 |
Multiline Retail - 1.1% |
Sears Holdings Corp. (a) | 709,300 | | 97,025 |
Specialty Retail - 1.2% |
Citi Trends, Inc. (a) | 358,449 | | 11,793 |
Coldwater Creek, Inc. (a) | 238,600 | | 4,698 |
Gamestop Corp. Class A (a) | 667,700 | | 26,942 |
Lululemon Athletica, Inc. | 620,000 | | 19,927 |
Ross Stores, Inc. | 370,400 | | 10,716 |
Staples, Inc. | 588,000 | | 13,536 |
Urban Outfitters, Inc. (a)(d) | 938,300 | | 18,822 |
| | 106,434 |
Textiles, Apparel & Luxury Goods - 1.1% |
Crocs, Inc. (a) | 160,700 | | 9,533 |
Deckers Outdoor Corp. (a)(e) | 675,500 | | 69,644 |
Gitanjali Gems Ltd. | 200,000 | | 1,291 |
Common Stocks - continued |
| Shares | | Value (000s) |
CONSUMER DISCRETIONARY - continued |
Textiles, Apparel & Luxury Goods - continued |
Provogue (India) Ltd. | 400,000 | | $ 5,586 |
Provogue (India) Ltd. (a)(f) | 700,000 | | 9,232 |
| | 95,286 |
TOTAL CONSUMER DISCRETIONARY | | 732,073 |
CONSUMER STAPLES - 0.5% |
Food & Staples Retailing - 0.3% |
Winn-Dixie Stores, Inc. (a)(d) | 1,152,500 | | 30,783 |
Food Products - 0.2% |
Nestle SA sponsored ADR | 154,300 | | 14,890 |
TOTAL CONSUMER STAPLES | | 45,673 |
ENERGY - 1.5% |
Energy Equipment & Services - 0.3% |
Trico Marine Services, Inc. (a)(d) | 165,000 | | 5,849 |
Weatherford International Ltd. (a) | 314,800 | | 17,418 |
| | 23,267 |
Oil, Gas & Consumable Fuels - 1.2% |
CONSOL Energy, Inc. | 322,200 | | 13,420 |
Copano Energy LLC | 97,000 | | 4,067 |
Petronet LNG Ltd. | 3,440,000 | | 5,422 |
Valero Energy Corp. | 1,313,500 | | 88,018 |
| | 110,927 |
TOTAL ENERGY | | 134,194 |
FINANCIALS - 3.1% |
Capital Markets - 1.2% |
Charles Schwab Corp. | 3,504,700 | | 70,550 |
GFI Group, Inc. (a) | 58,700 | | 4,374 |
T. Rowe Price Group, Inc. | 533,800 | | 27,827 |
| | 102,751 |
Commercial Banks - 1.0% |
Commerce Bancorp, Inc. | 1,409,900 | | 47,161 |
East West Bancorp, Inc. | 212,350 | | 7,785 |
Common Stocks - continued |
| Shares | | Value (000s) |
FINANCIALS - continued |
Commercial Banks - continued |
SVB Financial Group (a) | 427,900 | | $ 22,542 |
UCBH Holdings, Inc. | 706,800 | | 11,620 |
| | 89,108 |
Consumer Finance - 0.7% |
Capital One Financial Corp. | 839,000 | | 59,368 |
Diversified Financial Services - 0.1% |
MarketAxess Holdings, Inc. (a) | 448,698 | | 7,453 |
Insurance - 0.1% |
Universal American Financial Corp. (a) | 580,700 | | 11,562 |
Real Estate Management & Development - 0.0% |
DLF Ltd. | 141,397 | | 2,154 |
TOTAL FINANCIALS | | 272,396 |
HEALTH CARE - 13.2% |
Biotechnology - 8.5% |
Acadia Pharmaceuticals, Inc. (a) | 267,800 | | 3,760 |
Alexion Pharmaceuticals, Inc. (a) | 217,880 | | 12,672 |
Alkermes, Inc. (a) | 1,547,741 | | 22,040 |
Amgen, Inc. (a) | 576,200 | | 30,965 |
Amylin Pharmaceuticals, Inc. (a)(d) | 1,301,300 | | 60,523 |
ARIAD Pharmaceuticals, Inc. (a)(d) | 1,000,000 | | 4,390 |
Biogen Idec, Inc. (a) | 2,463,600 | | 139,292 |
Celgene Corp. (a) | 3,283,192 | | 198,830 |
Cephalon, Inc. (a)(d) | 751,700 | | 56,483 |
Cougar Biotechnology, Inc. (a) | 203,500 | | 4,833 |
Cougar Biotechnology, Inc. (a)(f) | 500,000 | | 11,875 |
CytRx Corp. (a) | 1,558,467 | | 4,722 |
Gilead Sciences, Inc. (a) | 3,134,200 | | 116,686 |
GTx, Inc. (a) | 264,100 | | 4,059 |
Myriad Genetics, Inc. (a) | 300,000 | | 11,214 |
ONYX Pharmaceuticals, Inc. (a)(d) | 582,200 | | 16,191 |
Regeneron Pharmaceuticals, Inc. (a) | 1,258,100 | | 18,733 |
Seattle Genetics, Inc. (a) | 377,200 | | 3,595 |
Transition Therapeutics, Inc. (a) | 460,633 | | 6,015 |
Vertex Pharmaceuticals, Inc. (a) | 721,588 | | 23,307 |
| | 750,185 |
Health Care Equipment & Supplies - 1.3% |
Align Technology, Inc. (a) | 355,800 | | 9,286 |
Common Stocks - continued |
| Shares | | Value (000s) |
HEALTH CARE - continued |
Health Care Equipment & Supplies - continued |
Gen-Probe, Inc. (a) | 500,500 | | $ 31,537 |
I-Flow Corp. (a) | 300,000 | | 5,313 |
Respironics, Inc. (a) | 1,074,800 | | 49,172 |
Zoll Medical Corp. (a) | 788,200 | | 21,171 |
| | 116,479 |
Health Care Providers & Services - 0.6% |
Express Scripts, Inc. (a) | 1,040,400 | | 52,155 |
Health Care Technology - 0.5% |
Cerner Corp. (a) | 490,200 | | 25,917 |
Health Corp. (a) | 1,064,350 | | 13,475 |
| | 39,392 |
Life Sciences Tools & Services - 1.2% |
Affymetrix, Inc. (a) | 787,341 | | 19,195 |
AMAG Pharmaceuticals, Inc. (a) | 309,000 | | 16,590 |
Exelixis, Inc. (a) | 328,800 | | 3,186 |
Illumina, Inc. (a)(d) | 1,026,146 | | 46,761 |
Illumina, Inc.: | | | |
warrants 11/22/10 (a)(f) | 354,776 | | 3,372 |
warrants 1/19/11 (a)(f) | 452,917 | | 4,334 |
Medivation, Inc. (a)(d) | 578,600 | | 9,495 |
Sequenom, Inc. | 200,000 | | 1,062 |
| | 103,995 |
Pharmaceuticals - 1.1% |
Elan Corp. PLC sponsored ADR (a) | 2,295,000 | | 42,985 |
Perrigo Co. | 150,000 | | 2,798 |
Sepracor, Inc. (a) | 1,319,800 | | 37,126 |
Shire PLC sponsored ADR | 162,100 | | 11,961 |
| | 94,870 |
TOTAL HEALTH CARE | | 1,157,076 |
INDUSTRIALS - 2.9% |
Airlines - 0.8% |
Allegiant Travel Co. | 281,600 | | 8,276 |
JetBlue Airways Corp. (a)(d) | 3,715,775 | | 36,600 |
UAL Corp. (a) | 509,800 | | 22,503 |
| | 67,379 |
Commercial Services & Supplies - 0.1% |
Corporate Executive Board Co. | 165,200 | | 11,138 |
Common Stocks - continued |
| Shares | | Value (000s) |
INDUSTRIALS - continued |
Construction & Engineering - 0.2% |
Great Lakes Dredge & Dock Corp. (a) | 90,800 | | $ 757 |
Washington Group International, Inc. (a) | 235,700 | | 18,931 |
| | 19,688 |
Electrical Equipment - 1.0% |
American Superconductor Corp. (a)(d) | 404,200 | | 7,716 |
Crompton Greaves Ltd. | 1,010,000 | | 7,373 |
Energy Conversion Devices, Inc. (a)(d) | 300,000 | | 8,955 |
First Solar, Inc. | 50,000 | | 5,629 |
Neo-Neon Holdings Ltd. | 5,850,000 | | 11,952 |
Nexans SA | 25,300 | | 4,522 |
Prysmian SpA | 270,300 | | 7,405 |
Renewable Energy Corp. AS | 271,100 | | 10,837 |
Sunpower Corp. Class A (a)(d) | 356,100 | | 25,116 |
| | 89,505 |
Industrial Conglomerates - 0.1% |
Siemens India Ltd. | 170,000 | | 5,426 |
Machinery - 0.4% |
Bucyrus International, Inc. Class A | 162,000 | | 10,297 |
Cummins, Inc. | 20,000 | | 2,374 |
TurboChef Technologies, Inc. (a)(d) | 1,448,094 | | 20,273 |
| | 32,944 |
Trading Companies & Distributors - 0.3% |
Rush Enterprises, Inc. Class A (a) | 157,300 | | 4,397 |
UAP Holding Corp. | 700,000 | | 19,019 |
| | 23,416 |
TOTAL INDUSTRIALS | | 249,496 |
INFORMATION TECHNOLOGY - 68.0% |
Communications Equipment - 12.2% |
Airvana, Inc. | 500,000 | | 3,530 |
Balda AG | 1,147,479 | | 13,645 |
Blue Coat Systems, Inc. (a) | 341,000 | | 16,617 |
Cisco Systems, Inc. (a) | 10,318,900 | | 298,319 |
F5 Networks, Inc. (a) | 122,000 | | 10,576 |
Harmonic, Inc. (a) | 481,000 | | 4,266 |
Infinera Corp. | 441,342 | | 10,063 |
Juniper Networks, Inc. (a) | 7,615,787 | | 228,169 |
ORBCOMM, Inc. (d) | 654,100 | | 10,034 |
Common Stocks - continued |
| Shares | | Value (000s) |
INFORMATION TECHNOLOGY - continued |
Communications Equipment - continued |
Powerwave Technologies, Inc. (a)(d) | 3,221,400 | | $ 21,068 |
QUALCOMM, Inc. | 3,880,600 | | 161,627 |
Research In Motion Ltd. (a) | 1,198,722 | | 256,527 |
Riverbed Technology, Inc. | 316,400 | | 13,972 |
Sonus Networks, Inc. (a) | 2,671,200 | | 18,271 |
Starent Networks Corp. | 111,100 | | 2,013 |
| | 1,068,697 |
Computers & Peripherals - 11.7% |
Apple, Inc. (a) | 2,841,400 | | 374,383 |
Dell, Inc. (a) | 5,935,800 | | 166,024 |
EMC Corp. (a) | 3,038,000 | | 56,233 |
Hewlett-Packard Co. | 2,070,200 | | 95,291 |
Netezza Corp. | 634,000 | | 9,669 |
Network Appliance, Inc. (a) | 407,671 | | 11,553 |
Palm, Inc. (a)(d) | 5,013,159 | | 74,796 |
Rackable Systems, Inc. (a)(d) | 1,016,500 | | 12,300 |
SanDisk Corp. (a) | 4,084,802 | | 219,068 |
Voltaire Ltd. | 670,645 | | 5,432 |
| | 1,024,749 |
Electronic Equipment & Instruments - 1.2% |
AU Optronics Corp. sponsored ADR (d) | 1,614,700 | | 27,321 |
Comverge, Inc. | 260,300 | | 8,184 |
Hon Hai Precision Industry Co. Ltd. (Foxconn) | 6,620,450 | | 54,886 |
Ibiden Co. Ltd. | 83,000 | | 6,085 |
Motech Industries, Inc. | 601,000 | | 7,510 |
| | 103,986 |
Internet Software & Services - 10.8% |
Akamai Technologies, Inc. (a)(d) | 1,644,475 | | 55,846 |
Blinkx PLC (a) | 4,390,080 | | 3,746 |
CyberSource Corp. (a)(d) | 1,448,088 | | 16,667 |
eBay, Inc. (a) | 2,315,487 | | 75,022 |
Equinix, Inc. (a)(d) | 556,500 | | 48,365 |
Google, Inc. Class A (sub. vtg.) (a) | 1,331,500 | | 679,068 |
Internet Capital Group, Inc. (a) | 1,070,196 | | 12,222 |
LoopNet, Inc. | 611,100 | | 12,638 |
TheStreet.com, Inc. | 217,108 | | 2,412 |
United Internet AG | 149,146 | | 2,684 |
Yahoo!, Inc. (a) | 1,733,116 | | 40,295 |
| | 948,965 |
Common Stocks - continued |
| Shares | | Value (000s) |
INFORMATION TECHNOLOGY - continued |
IT Services - 2.6% |
Cognizant Technology Solutions Corp. Class A (a) | 1,907,875 | | $ 154,500 |
Infosys Technologies Ltd. sponsored ADR | 1,097,100 | | 54,416 |
Sapient Corp. (a) | 2,982,000 | | 21,262 |
| | 230,178 |
Semiconductors & Semiconductor Equipment - 13.1% |
Advanced Micro Devices, Inc. (a) | 4,235,200 | | 57,345 |
Altera Corp. | 1,249,500 | | 28,988 |
ANADIGICS, Inc. (a)(d) | 2,052,300 | | 29,820 |
Applied Materials, Inc. | 1,408,400 | | 31,041 |
ASML Holding NV (NY Shares) (a) | 90,600 | | 2,678 |
Atheros Communications, Inc. (a) | 441,325 | | 12,304 |
Broadcom Corp. Class A (a) | 8,069,109 | | 264,747 |
Cree, Inc. (a)(d) | 1,063,000 | | 27,234 |
Cypress Semiconductor Corp. (a) | 1,385,150 | | 34,712 |
Hittite Microwave Corp. (a) | 319,000 | | 12,830 |
Infineon Technologies AG sponsored ADR (a) | 1,202,300 | | 19,682 |
Intel Corp. | 7,722,200 | | 182,398 |
Marvell Technology Group Ltd. (a) | 7,569,074 | | 136,243 |
Maxim Integrated Products, Inc. | 2,809,800 | | 89,071 |
MEMC Electronic Materials, Inc. (a) | 731,900 | | 44,880 |
Microsemi Corp. (a)(d) | 1,030,400 | | 24,019 |
Omnivision Technologies, Inc. (a)(d)(e) | 3,946,948 | | 67,769 |
PMC-Sierra, Inc. (a) | 1,970,396 | | 15,014 |
Richtek Technology Corp. | 541,650 | | 7,768 |
Saifun Semiconductors Ltd. (a) | 421,059 | | 5,027 |
Silicon Image, Inc. (a) | 2,129,500 | | 14,523 |
Silicon Laboratories, Inc. (a) | 596,700 | | 20,783 |
Varian Semiconductor Equipment Associates, Inc. (a) | 280,600 | | 13,188 |
Veeco Instruments, Inc. (a) | 254,200 | | 4,652 |
Xilinx, Inc. | 176,800 | | 4,420 |
| | 1,151,136 |
Software - 16.4% |
Activision, Inc. (a) | 1,833,600 | | 31,373 |
Adobe Systems, Inc. (a) | 1,778,856 | | 71,670 |
Blackboard, Inc. (a) | 100,000 | | 4,423 |
BladeLogic, Inc. | 7,000 | | 180 |
Callidus Software, Inc. (a) | 1,000,000 | | 9,800 |
Electronic Arts, Inc. (a) | 2,185,900 | | 106,322 |
Jack Henry & Associates, Inc. | 100,000 | | 2,402 |
Microsoft Corp. | 5,345,800 | | 154,975 |
Common Stocks - continued |
| Shares | | Value (000s) |
INFORMATION TECHNOLOGY - continued |
Software - continued |
Nintendo Co. Ltd. | 1,273,100 | | $ 623,819 |
Nintendo Co. Ltd. ADR | 3,675,200 | | 225,106 |
Oracle Corp. (a) | 1,637,500 | | 31,309 |
Perfect World Co. Ltd. sponsored ADR Class B | 243,700 | | 5,873 |
PROS Holdings, Inc. | 47,900 | | 599 |
Quest Software, Inc. (a) | 1,584,921 | | 23,457 |
Red Hat, Inc. (a) | 2,963,710 | | 61,704 |
Salesforce.com, Inc. (a) | 518,700 | | 20,157 |
Symantec Corp. (a) | 225,600 | | 4,332 |
Take-Two Interactive Software, Inc. (a)(d) | 2,825,720 | | 49,817 |
Ubisoft Entertainment SA (a) | 202,000 | | 13,254 |
| | 1,440,572 |
TOTAL INFORMATION TECHNOLOGY | | 5,968,283 |
MATERIALS - 1.0% |
Chemicals - 0.5% |
Monsanto Co. | 472,000 | | 30,420 |
Zoltek Companies, Inc. (a)(d) | 221,200 | | 10,374 |
| | 40,794 |
Metals & Mining - 0.5% |
Century Aluminum Co. (a)(d) | 315,300 | | 16,251 |
Mercator Minerals Ltd. (a) | 1,050,900 | | 8,748 |
Steel Dynamics, Inc. | 243,900 | | 10,227 |
Thompson Creek Metals Co., Inc. (a) | 558,900 | | 10,882 |
| | 46,108 |
TOTAL MATERIALS | | 86,902 |
TELECOMMUNICATION SERVICES - 1.1% |
Wireless Telecommunication Services - 1.1% |
NII Holdings, Inc. (a) | 1,044,800 | | 87,784 |
SBA Communications Corp. Class A (a) | 274,000 | | 9,130 |
| | 96,914 |
TOTAL COMMON STOCKS (Cost $7,062,089) | 8,743,007 |
Money Market Funds - 2.7% |
| Shares | | Value (000s) |
Fidelity Cash Central Fund, 5.38% (b) | 47,754,640 | | $ 47,755 |
Fidelity Securities Lending Cash Central Fund, 5.39% (b)(c) | 190,458,325 | | 190,458 |
TOTAL MONEY MARKET FUNDS (Cost $238,213) | 238,213 |
TOTAL INVESTMENT PORTFOLIO - 102.3% (Cost $7,300,302) | | 8,981,220 |
NET OTHER ASSETS - (2.3)% | | (203,307) |
NET ASSETS - 100% | $ 8,777,913 |
Legend |
(a) Non-income producing |
(b) Affiliated fund that is available only to investment companies and other accounts managed by Fidelity Investments. The rate quoted is the annualized seven-day yield of the fund at period end. A complete unaudited listing of the fund's holdings as of its most recent quarter end is available upon request. |
(c) Investment made with cash collateral received from securities on loan. |
(d) Security or a portion of the security is on loan at period end. |
(e) Affiliated company |
(f) Restricted securities - Investment in securities not registered under the Securities Act of 1933 (excluding 144A issues). At the end of the period, the value of restricted securities (excluding 144A issues) amounted to $28,813,000 or 0.3% of net assets. |
Additional information on each holding is as follows: |
Security | Acquisition Date | Acquisition Cost (000s) |
Cougar Biotechnology, Inc. | 5/3/07 | $ 10,000 |
Illumina, Inc. warrants 11/22/10 | 11/21/05 | $ 0 |
Illumina, Inc. warrants 1/19/11 | 1/18/06 | $ 0 |
Provogue (India) Ltd. | 2/21/07 | $ 7,157 |
Affiliated Central Funds |
Information regarding fiscal year to date income earned by the Fund from investments in Fidelity Central Funds is as follows: |
Fund | Income earned (Amounts in thousands) |
Fidelity Cash Central Fund | $ 1,914 |
Fidelity Securities Lending Cash Central Fund | 2,564 |
Total | $ 4,478 |
Other Affiliated Issuers |
An affiliated company is a company in which the fund has ownership of at least 5% of the voting securities. Fiscal year to date transactions with companies which are or were affiliates are as follows: |
Affiliates
(Amounts in thousands) | Value, beginning of period | Purchases | Sales Proceeds | Dividend Income | Value,
end of
period |
Deckers Outdoor Corp. | $ 28,803 | $ - | $ - | $ - | $ 69,644 |
Omnivision Technologies, Inc. | 14,003 | 68,743 | 10,976 | - | 67,769 |
Palm, Inc. | - | 110,102 | 30,912 | - | - |
Red Robin Gourmet Burgers, Inc. | 53,592 | - | 46,854 | - | - |
Total | $ 96,398 | $ 178,845 | $ 88,742 | $ - | $ 137,413 |
Other Information |
Distribution of investments by country of issue, as a percentage of total net assets, is as follows: |
United States of America | 81.0% |
Japan | 9.8% |
Canada | 3.2% |
Bermuda | 1.6% |
India | 1.2% |
Taiwan | 1.1% |
Others (individually less than 1%) | 2.1% |
| 100.0% |
Income Tax Information |
At July 31, 2007, the fund had a capital loss carryforward of approximately $3,019,619,000 of which $1,769,724,000 and $1,249,895,000 will expire on July 31, 2010 and 2011, respectively. |
See accompanying notes which are an integral part of the financial statements.
Annual Report
Financial Statements
Statement of Assets and Liabilities
Amounts in thousands (except per-share amount) | July 31, 2007 |
Assets | | |
Investment in securities, at value (including securities loaned of $180,302) - See accompanying schedule: Unaffiliated issuers (cost $6,974,578) | $ 8,605,594 | |
Fidelity Central Funds (cost $238,213) | 238,213 | |
Other affiliated issuers (cost $87,511) | 137,413 | |
Total Investments (cost $7,300,302) | | $ 8,981,220 |
Cash | | 245 |
Receivable for investments sold | | 149,618 |
Receivable for fund shares sold | | 9,726 |
Dividends receivable | | 3,828 |
Distributions receivable from Fidelity Central Funds | | 459 |
Prepaid expenses | | 14 |
Other receivables | | 219 |
Total assets | | 9,145,329 |
| | |
Liabilities | | |
Payable for investments purchased | $ 156,754 | |
Payable for fund shares redeemed | 11,762 | |
Accrued management fee | 5,924 | |
Other affiliated payables | 1,667 | |
Other payables and accrued expenses | 851 | |
Collateral on securities loaned, at value | 190,458 | |
Total liabilities | | 367,416 |
| | |
Net Assets | | $ 8,777,913 |
Net Assets consist of: | | |
Paid in capital | | $ 10,149,676 |
Accumulated net investment loss | | (92) |
Accumulated undistributed net realized gain (loss) on investments and foreign currency transactions | | (3,051,909) |
Net unrealized appreciation (depreciation) on investments and assets and liabilities in foreign currencies | | 1,680,238 |
Net Assets, for 186,392 shares outstanding | | $ 8,777,913 |
Net Asset Value, offering price and redemption price per share ($8,777,913 ÷ 186,392 shares) | | $ 47.09 |
See accompanying notes which are an integral part of the financial statements.
Annual Report
Statement of Operations
Amounts in thousands | Year ended July 31, 2007 |
Investment Income | | |
Dividends | | $ 37,626 |
Interest | | 198 |
Income from Fidelity Central Funds (including $2,564 from security lending) | | 4,478 |
Total income | | 42,302 |
| | |
Expenses | | |
Management fee
Basic fee | $ 52,789 | |
Performance adjustment | 8,579 | |
Transfer agent fees | 18,904 | |
Accounting and security lending fees | 1,245 | |
Custodian fees and expenses | 382 | |
Independent trustees' compensation | 28 | |
Appreciation in deferred trustee compensation account | 1 | |
Registration fees | 64 | |
Audit | 96 | |
Legal | 115 | |
Interest | 140 | |
Miscellaneous | 159 | |
Total expenses before reductions | 82,502 | |
Expense reductions | (996) | 81,506 |
Net investment income (loss) | | (39,204) |
Realized and Unrealized Gain (Loss) Net realized gain (loss) on: | | |
Investment securities: | | |
Unaffiliated issuers (net of foreign taxes of $183) | 838,566 | |
Other affiliated issuers | (20,638) | |
Foreign currency transactions | (393) | |
Total net realized gain (loss) | | 817,535 |
Change in net unrealized appreciation (depreciation) on: Investment securities (net of increase in deferred foreign taxes of $583) | 1,785,068 | |
Assets and liabilities in foreign currencies | (96) | |
Total change in net unrealized appreciation (depreciation) | | 1,784,972 |
Net gain (loss) | | 2,602,507 |
Net increase (decrease) in net assets resulting from operations | | $ 2,563,303 |
See accompanying notes which are an integral part of the financial statements.
Annual Report
Financial Statements - continued
Statement of Changes in Net Assets
Amounts in thousands | Year ended
July 31,
2007 | Year ended
July 31,
2006 |
Increase (Decrease) in Net Assets | | |
Operations | | |
Net investment income (loss) | $ (39,204) | $ (20,781) |
Net realized gain (loss) | 817,535 | 603,052 |
Change in net unrealized appreciation (depreciation) | 1,784,972 | (840,851) |
Net increase (decrease) in net assets resulting from operations | 2,563,303 | (258,580) |
Share transactions
Proceeds from sales of shares | 1,230,037 | 1,366,517 |
Cost of shares redeemed | (2,384,937) | (1,801,274) |
Net increase (decrease) in net assets resulting from share transactions | (1,154,900) | (434,757) |
Total increase (decrease) in net assets | 1,408,403 | (693,337) |
| | |
Net Assets | | |
Beginning of period | 7,369,510 | 8,062,847 |
End of period (including accumulated net investment loss of $92 and accumulated net investment loss of $165, respectively) | $ 8,777,913 | $ 7,369,510 |
Other Information Shares | | |
Sold | 29,892 | 36,636 |
Redeemed | (55,876) | (48,306) |
Net increase (decrease) | (25,984) | (11,670) |
See accompanying notes which are an integral part of the financial statements.
Annual Report
Financial Highlights
Years ended July 31, | 2007 | 2006 | 2005 | 2004 | 2003 |
Selected Per-Share Data | | | | | |
Net asset value, beginning of period | $ 34.70 | $ 35.99 | $ 30.43 | $ 28.33 | $ 23.46 |
Income from Investment Operations | | | | | |
Net investment income (loss) B | (.19) | (.10) E | .37 F | (.17) | (.17) |
Net realized and unrealized gain (loss) | 12.58 | (1.19) | 5.60 | 2.27 | 5.04 |
Total from investment operations | 12.39 | (1.29) | 5.97 | 2.10 | 4.87 |
Distributions from net investment income | - | - | (.41) | - | - |
Net asset value, end of period | $ 47.09 | $ 34.70 | $ 35.99 | $ 30.43 | $ 28.33 |
Total Return A | 35.71% | (3.58)% | 19.70% | 7.41% | 20.76% |
Ratios to Average Net Assets C, G | | | | | |
Expenses before reductions | .96% | .80% | .81% | .91% | 1.18% |
Expenses net of fee waivers, if any | .96% | .80% | .81% | .91% | 1.18% |
Expenses net of all reductions | .95% | .75% | .75% | .89% | 1.12% |
Net investment income (loss) | (.45)% | (.26)% E | 1.13% F | (.53)% | (.71)% |
Supplemental Data | | | | | |
Net assets, end of period (in millions) | $ 8,778 | $ 7,370 | $ 8,063 | $ 7,322 | $ 7,041 |
Portfolio turnover rate D | 121% | 149% | 117% | 61% | 116% |
A Total returns would have been lower had certain expenses not been reduced during the periods shown.
B Calculated based on average shares outstanding during the period.
C Fees and expenses of the underlying Fidelity Central Funds are not included in the Fund's expense ratio. The Fund indirectly bears its proportionate share of the expenses of any underlying Fidelity Central Funds.
D Amount does not include the portfolio activity of any underlying Fidelity Central Funds.
E Investment income per share reflects a special dividend which amounted to $.03 per share. Excluding the special dividend, the ratio of net investment income (loss) to average net assets would have been (.34)%.
F Investment income per share reflects a special dividend which amounted to $.46 per share. Excluding the special dividend, the ratio of net investment income (loss) to average net assets would have been (.27)%.
G Expense ratios reflect operating expenses of the Fund. Expenses before reductions do not reflect amounts reimbursed by the investment adviser or reductions from brokerage service arrangements or other expense offset arrangements and do not represent the amount paid by the Fund during periods when reimbursements or reductions occur. Expenses net of fee waivers reflect expenses after reimbursement by the investment adviser but prior to reductions from brokerage service arrangements or other expense offset arrangements. Expenses net of all reductions represent the net expenses paid by the Fund.
See accompanying notes which are an integral part of the financial statements.
Annual Report
Notes to Financial Statements
For the period ended July 31, 2007
(Amounts in thousands except ratios)
1. Organization.
Fidelity OTC Portfolio (the Fund) is a non-diversified fund of Fidelity Securities Fund (the trust) and is authorized to issue an unlimited number of shares. The trust is registered under the Investment Company Act of 1940, as amended (the 1940 Act), as an open-end management investment company organized as a Massachusetts business trust.
2. Investments in Fidelity Central Funds.
The Fund may invest in Fidelity Central Funds which are open-end investment companies available only to other investment companies and accounts managed by Fidelity Management & Research Company (FMR) and its affiliates. The Fund's Schedule of Investments lists each of the Fidelity Central Funds as an investment of the Fund, but does not include the underlying holdings of each Fidelity Central Fund. As an Investing Fund, the Fund indirectly bears its proportionate share of the expenses of the underlying Fidelity Central Funds.
The Money Market Central Funds seek preservation of capital and current income and are managed by Fidelity Investments Money Management, Inc. (FIMM), an affiliate of FMR.
A complete list of holdings for each Fidelity Central Fund is available upon request or at the SEC's web site at www.sec.gov. In addition, the financial statements of the Fidelity Central Funds, which are not covered by the Fund's Report of Independent Registered Public Accounting Firm, are available on the on the SEC's web site, or upon request.
3. Significant Accounting Policies.
The financial statements have been prepared in conformity with accounting principles generally accepted in the United States of America, which require management to make certain estimates and assumptions at the date of the financial statements. The following summarizes the significant accounting policies of the Fund:
Security Valuation. Investments are valued and net asset value (NAV) per share is calculated (NAV calculation) as of the close of business of the New York Stock Exchange (NYSE), normally 4:00 p.m. Eastern time. Wherever possible, the Fund uses independent pricing services approved by the Board of Trustees to value its investments.
Equity securities, including restricted securities, for which market quotations are readily available, are valued at the last reported sale price or official closing price as reported by an independent pricing service on the primary market or exchange on which they are traded. In the event there were no sales during the day or closing prices are not available, securities are valued at the last quoted bid price. Investments in open-end mutual funds, including the Fidelity Central Funds, are valued at their closing net asset value each
Annual Report
3. Significant Accounting Policies - continued
Security Valuation - continued
business day. Short-term securities with remaining maturities of sixty days or less for which quotations are not readily available are valued at amortized cost, which approximates value.
When current market prices or quotations are not readily available or do not accurately reflect fair value, valuations may be determined in accordance with procedures adopted by the Board of Trustees. For example, when developments occur between the close of a market and the close of the NYSE that may materially affect the value of some or all of the securities, or when trading in a security is halted, those securities may be fair valued. Factors used in the determination of fair value may include monitoring news to identify significant market or security specific events such as changes in the value of U.S. securities markets, reviewing developments in foreign markets and evaluating the performance of ADRs, futures contracts and exchange-traded funds. Because the Fund's utilization of fair value pricing depends on market activity, the frequency with which fair value pricing is used cannot be predicted and may be utilized to a significant extent. The value of securities used for NAV calculation under fair value pricing may differ from published prices for the same securities.
Foreign Currency. The Fund uses foreign currency contracts to facilitate transactions in foreign-denominated securities. Losses from these transactions may arise from changes in the value of the foreign currency or if the counterparties do not perform under the contracts' terms.
Foreign-denominated assets, including investment securities, and liabilities are translated into U.S. dollars at the exchange rate at period end. Purchases and sales of investment securities, income and dividends received and expenses denominated in foreign currencies are translated into U.S. dollars at the exchange rate in effect on the transaction date.
The effects of exchange rate fluctuations on investments are included with the net realized and unrealized gain (loss) on investment securities. Other foreign currency transactions resulting in realized and unrealized gain (loss) are disclosed separately.
Investment Transactions and Income. For financial reporting purposes, the Fund's investment holdings and NAV include trades executed through the end of the last business day of the period. The NAV for processing shareholder transactions includes trades executed through the end of the prior business day. Gains and losses on securities sold are determined on the basis of identified cost and may include proceeds received from litigation. Dividend income is recorded on the ex-dividend date, except for certain dividends from foreign securities where the ex-dividend date may have passed, which are recorded as soon as the Fund is informed of the ex-dividend date. Non-cash dividends
Annual Report
Notes to Financial Statements - continued
(Amounts in thousands except ratios)
3. Significant Accounting Policies - continued
Investment Transactions and Income - continued
included in dividend income, if any, are recorded at the fair market value of the securities received. Distributions received on securities that represent a return of capital or capital gain are recorded as a reduction of cost of investments and/or as a realized gain. The Fund estimates the components of distributions received that may be considered return of capital distributions or capital gain distributions. Interest income and income distributions from the Fidelity Central Funds are accrued as earned. Interest income includes coupon interest and amortization of premium and accretion of discount on debt securities. Investment income is recorded net of foreign taxes withheld where recovery of such taxes is uncertain.
Expenses. Most expenses of the trust can be directly attributed to a fund. Expenses which cannot be directly attributed are apportioned among each Fund in the trust. Expense estimates are accrued in the period to which they relate and adjustments are made when actual amounts are known.
Deferred Trustee Compensation. Under a Deferred Compensation Plan (the Plan), Independent Trustees must defer receipt of a portion of, and may elect to defer receipt of an additional portion of, their annual compensation. Deferred amounts are invested in a cross-section of Fidelity funds, are marked-to-market and remain in the Fund until distributed in accordance with the Plan. The investment of deferred amounts and the offsetting payable to the Trustees are included in the accompanying Statement of Assets and Liabilities.
Income Tax Information and Distributions to Shareholders. Each year, the Fund intends to qualify as a regulated investment company by distributing all of its taxable income and realized gains under Subchapter M of the Internal Revenue Code. As a result, no provision for income taxes is required in the accompanying financial statements. Foreign taxes are provided for based on the Fund's understanding of the tax rules and rates that exist in the foreign markets in which it invests.
Distributions are recorded on the ex-dividend date. Income and capital gain distributions are determined in accordance with income tax regulations, which may differ from generally accepted accounting principles.
Capital accounts within the financial statements are adjusted for permanent book-tax differences. These adjustments have no impact on net assets or the results of operations. Temporary book-tax differences will reverse in a subsequent period.
Book-tax differences are primarily due to foreign currency transactions, certain foreign taxes, passive foreign investment companies (PFIC), partnerships, deferred trustees
Annual Report
3. Significant Accounting Policies - continued
Income Tax Information and Distributions to Shareholders - continued
compensation, net operating losses, capital loss carry forwards and losses deferred due to wash sales.
The tax-basis components of distributable earnings and the federal tax cost as of period end were as follows:
Unrealized appreciation | $ 2,073,704 | |
Unrealized depreciation | (425,673) | |
Net unrealized appreciation (depreciation) | 1,648,031 | |
Capital loss carryforward | (3,019,619) | |
| | |
Cost for federal income tax purposes | $ 7,333,189 | |
New Accounting Pronouncements. In July 2006, Financial Accounting Standards Board Interpretation No. 48, Accounting for Uncertainty in Income Taxes - an interpretation of FASB Statement 109 (FIN 48), was issued and is effective on the last business day of the semiannual reporting period for fiscal years beginning after December 15, 2006. FIN 48 sets forth a threshold for financial statement recognition, measurement and disclosure of a tax position taken or expected to be taken on a tax return. Management has concluded that the adoption of FIN 48 will not result in a material impact on the Fund's net assets, results of operations and financial statement disclosures.
In addition, in September 2006, Statement of Financial Accounting Standards No. 157, Fair Value Measurements (SFAS 157), was issued and is effective for fiscal years beginning after November 15, 2007. SFAS 157 defines fair value, establishes a framework for measuring fair value and expands disclosures about fair value measurements. Management is currently evaluating the impact the adoption of SFAS 157 will have on the Fund's financial statement disclosures.
4. Operating Policies.
Repurchase Agreements. FMR has received an Exemptive Order from the Securities and Exchange Commission (the SEC) which permits the Fund and other affiliated entities of FMR to transfer uninvested cash balances into joint trading accounts which are then invested in repurchase agreements. The Fund may also invest directly with institutions in repurchase agreements. Repurchase agreements are collateralized by government or non-government securities. Upon settlement date, collateral is held in segregated accounts with custodian banks and may be obtained in the event of a default of the counterparty. The Fund monitors, on a daily basis, the value of the collateral to ensure it is at least equal to the principal amount of the repurchase agreement (including accrued interest). In the event of a default by the counterparty, realization of the
Annual Report
Notes to Financial Statements - continued
(Amounts in thousands except ratios)
4. Operating Policies - continued
Repurchase Agreements - continued
collateral proceeds could be delayed, during which time the value of the collateral may decline.
Restricted Securities. The Fund may invest in securities that are subject to legal or contractual restrictions on resale. These securities generally may be resold in transactions exempt from registration or to the public if the securities are registered. Disposal of these securities may involve time-consuming negotiations and expense, and prompt sale at an acceptable price may be difficult. Information regarding restricted securities is included at the end of the Fund's Schedule of Investments.
5. Purchases and Sales of Investments.
Purchases and sales of securities, other than short-term securities, aggregated $10,310,850 and $11,429,250, respectively.
6. Fees and Other Transactions with Affiliates.
Management Fee. FMR and its affiliates provide the Fund with investment management related services for which the Fund pays a monthly management fee. The management fee is the sum of an individual fund fee rate that is based on an annual rate of .35% of the Fund's average net assets and a group fee rate that averaged ..26% during the period. The group fee rate is based upon the average net assets of all the mutual funds advised by FMR. The group fee rate decreases as assets under management increase and increases as assets under management decrease. In addition, the management fee is subject to a performance adjustment (up to a maximum of ± .20% of the Fund's average net assets over a 36 month performance period). The upward or downward adjustment to the management fee is based on the Fund's relative investment performance as compared to an appropriate benchmark index. For the period, the total annual management fee rate, including the performance adjustment, was .71% of the Fund's average net assets.
Transfer Agent Fees. Fidelity Service Company, Inc. (FSC), an affiliate of FMR, is the Fund's transfer, dividend disbursing and shareholder servicing agent. FSC receives account fees and asset-based fees that vary according to account size and type of account. FSC pays for typesetting, printing and mailing of shareholder reports, except proxy statements. For the period the transfer agent fees were equivalent to an annual rate of .22% of average net assets.
Accounting and Security Lending Fees. FSC maintains the Fund's accounting records. The accounting fee is based on the level of average net assets for the month.
Annual Report
6. Fees and Other Transactions with Affiliates - continued
Accounting and Security Lending Fees - continued
Under a separate contract, FSC administers the security lending program. The security lending fee is based on the number and duration of lending transactions.
Brokerage Commissions. The Fund placed a portion of its portfolio transactions with brokerage firms which are affiliates of the investment adviser. The commissions paid to these affiliated firms were $140 for the period.
Interfund Lending Program. Pursuant to an Exemptive Order issued by the SEC, the Fund, along with other registered investment companies having management contracts with FMR, may participate in an interfund lending program. This program provides an alternative credit facility allowing the funds to borrow from, or lend money to, other participating affiliated funds. At period end, there were no interfund loans outstanding. The Fund's activity in this program during the period for which loans were outstanding was as follows:
Borrower or Lender | Average Daily
Loan Balance | Weighted Average Interest Rate | Interest
Expense |
Borrower | $ 13,318 | 5.40% | $ 92 |
7. Committed Line of Credit.
The Fund participates with other funds managed by FMR in a $4.2 billion credit facility (the "line of credit") to be utilized for temporary or emergency purposes to fund shareholder redemptions or for other short-term liquidity purposes. The Fund has agreed to pay commitment fees on its pro rata portion of the line of credit, which amounted to $16 and is reflected in Miscellaneous Expense on the Statement of Operations. During the period, there were no borrowings on this line of credit.
8. Security Lending.
The Fund lends portfolio securities from time to time in order to earn additional income. On the settlement date of the loan, the Fund receives collateral (in the form of U.S. Treasury obligations, letters of credit and/or cash) against the loaned securities and maintains collateral in an amount not less than 100% of the market value of the loaned securities during the period of the loan. The market value of the loaned securities is determined at the close of business of the Fund and any additional required collateral is delivered to the Fund on the next business day. If the borrower defaults on its obligation to return the securities loaned because of insolvency or other reasons, a fund could experience delays and costs in recovering the securities loaned or in gaining access to the collateral. Any cash collateral received is invested in the Fidelity Securities Lending Cash Central Fund. The value of loaned securities and cash collateral at period end are
Annual Report
Notes to Financial Statements - continued
(Amounts in thousands except ratios)
8. Security Lending - continued
disclosed on the Fund's Statement of Assets and Liabilities. Security lending income represents the income earned on investing cash collateral, less fees and expenses associated with the loan, plus any premium payments that may be received on the loan of certain types of securities. Security lending income is presented in the Statement of Operations as a component of income from Fidelity Central Funds.
9. Bank Borrowings.
The Fund is permitted to have bank borrowings for temporary or emergency purposes to fund shareholder redemptions. The Fund has established borrowing arrangements with certain banks. The interest rate on the borrowings is the bank's base rate, as revised from time to time. The average daily loan balance during the period for which loans were outstanding amounted to $19,949. The weighted average interest rate was 5.52%. The interest expense amounted to $48 under the bank borrowing program. At period end, there were no bank borrowings outstanding.
10. Expense Reductions.
Many of the brokers with whom FMR places trades on behalf of the Fund provided services to the Fund in addition to trade execution. These services included payments of certain expenses on behalf of the Fund totaling $241 for the period. In addition, through arrangements with the Fund's custodian and transfer agent, credits realized as a result of uninvested cash balances were used to reduce the Fund's expenses. During the period, these credits reduced the Fund's custody and transfer agent expenses by $15 and $615, respectively.
11. Other.
The Fund's organizational documents provide former and current trustees and officers with a limited indemnification against liabilities arising in connection with the performance of their duties to the Fund. In the normal course of business, the Fund may also enter into contracts that provide general indemnifications. The Fund's maximum exposure under these arrangements is unknown as this would be dependent on future claims that may be made against the Fund. The risk of material loss from such claims is considered remote.
The United States Securities and Exchange Commission ("SEC") is conducting an investigation of FMR (covering the years 2002 to 2004) arising from gifts, gratuities and business entertainment provided by certain brokers to certain individuals who were employed on FMR's domestic equity trading desk during that period. FMR is in discussions with the SEC staff regarding the possible resolution of the matter, but as of period-end no final resolution has been reached.
Annual Report
11. Other - continued
In December 2006, the Independent Trustees completed their own investigation of the matter with the assistance of independent counsel. The Independent Trustees and FMR agree that, despite the absence of proof that the Fidelity mutual funds experienced diminished execution quality as a result of the improper receipt of gifts and business entertainment, the conduct at issue was serious and is worthy of redress. Accordingly, the Independent Trustees have requested and FMR has agreed to pay $42 million to Fidelity mutual funds, plus interest to be determined at the time that payment is made. A method of allocating this payment among the funds has not yet been determined. The total payment to the Fund is not anticipated to have a material impact on the Fund's net assets. In addition, FMR reimbursed related legal expenses which are recorded in the accompanying Statement of Operations as an expense reduction.
Annual Report
Report of Independent Registered Public Accounting Firm
To the Trustees of Fidelity Securities Fund and Shareholders of Fidelity OTC Portfolio:
We have audited the accompanying statement of assets and liabilities of Fidelity OTC Portfolio (the Fund), a fund of Fidelity Securities Fund, including the schedule of investments as of July 31, 2007, and the related statement of operations for the year then ended, the statement of changes in net assets for each of the two years in the period then ended, and the financial highlights for each of the five years in the period then ended. These financial statements and financial highlights are the responsibility of the Fund's management. Our responsibility is to express an opinion on these financial statements and financial highlights based on our audits.
We conducted our audits in accordance with standards of the Public Company Accounting Oversight Board (United States). Those standards require that we plan and perform the audit to obtain reasonable assurance about whether the financial statements and financial highlights are free of material misstatement. The Fund is not required to have, nor were we engaged to perform, an audit of its internal control over financial reporting. Our audits included consideration of internal control over financial reporting as a basis for designing audit procedures that are appropriate in the circumstances, but not for the purpose of expressing an opinion on the effectiveness of the Fund's internal control over financial reporting. Accordingly, we express no such opinion. An audit also includes examining, on a test basis, evidence supporting the amounts and disclosures in the financial statements, assessing the accounting principles used and significant estimates made by management, as well as evaluating the overall financial statement presentation. Our procedures included confirmation of securities owned as of July 31, 2007, by correspondence with the custodians and brokers; where replies were not received from brokers, we performed other auditing procedures. We believe that our audits provide a reasonable basis for our opinion.
In our opinion, the financial statements and financial highlights referred to above present fairly, in all material respects, the financial position of Fidelity OTC Portfolio as of July 31, 2007, the results of its operations for the year then ended, the changes in its net assets for each of the two years in the period then ended, and its financial highlights for each of the five years in the period then ended, in conformity with accounting principles generally accepted in the United States of America.
/s/ Deloitte & Touche LLP
DELOITTE & TOUCHE LLP
Boston, Massachusetts
September 14, 2007
Annual Report
Trustees and Officers
The Trustees, Members of the Advisory Board, and executive officers of the trust and fund, as applicable, are listed below. The Board of Trustees governs the fund and is responsible for protecting the interests of shareholders. The Trustees are experienced executives who meet periodically throughout the year to oversee the fund's activities, review contractual arrangements with companies that provide services to each fund, and review each fund's performance. Except for James C. Curvey, each of the Trustees oversees 353 funds advised by FMR or an affiliate. Mr. Curvey oversees 317 funds advised by FMR or an affiliate.
The Trustees hold office without limit in time except that (a) any Trustee may resign; (b) any Trustee may be removed by written instrument, signed by at least two-thirds of the number of Trustees prior to such removal; (c) any Trustee who requests to be retired or who has become incapacitated by illness or injury may be retired by written instrument signed by a majority of the other Trustees; and (d) any Trustee may be removed at any special meeting of shareholders by a two-thirds vote of the outstanding voting securities of the trust. Each Trustee who is not an interested person (as defined in the 1940 Act) (Independent Trustee), shall retire not later than the last day of the calendar year in which his or her 72nd birthday occurs. The Independent Trustees may waive this mandatory retirement age policy with respect to individual Trustees. The executive officers and Advisory Board Members hold office without limit in time, except that any officer and Advisory Board Member may resign or may be removed by a vote of a majority of the Trustees at any regular meeting or any special meeting of the Trustees. Except as indicated, each individual has held the office shown or other offices in the same company for the past five years.
The fund's Statement of Additional Information (SAI) includes more information about the Trustees. To request a free copy, call Fidelity at 1-800-544-8544.
Interested Trustees*:
Correspondence intended for each Trustee who is an interested person may be sent to Fidelity Investments, 82 Devonshire Street, Boston, Massachusetts 02109.
Name, Age; Principal Occupation |
Edward C. Johnson 3d (77) |
| Year of Election or Appointment: 1984 Mr. Johnson is Chairman of the Board of Trustees. Mr. Johnson serves as President (2006-present), Chief Executive Officer, Chairman, and a Director of FMR Corp.; Chairman and a Director of FMR; Chairman and a Director of Fidelity Research & Analysis Company (FRAC); Chairman and a Director of Fidelity Investments Money Management, Inc.; and Chairman (2001-present) and a Director of FMR Co., Inc. In addition, Mr. Johnson serves as Chairman and Director of Fidelity International Limited (FIL). |
James C. Curvey (72) |
| Year of Election or Appointment: 2007 Mr. Curvey also serves as Trustee (2007-present) or Member of the Advisory Board (2007-present) of other investment companies advised by FMR. Mr. Curvey is Vice Chairman (2006-present) and Director of FMR Corp. Mr. Curvey joined Fidelity in 1982 and served in numerous senior management positions, including President and Chief Operating Officer of FMR Corp. (1997-2000) and President of Fidelity Strategic Investments (2000-2002). In addition, he serves as a member of the Board of Directors of Geerlings & Wade, Inc. (wine distribution). |
* Trustees have been determined to be "Interested Trustees" by virtue of, among other things, their affiliation with the trust or various entities under common control with FMR.
Independent Trustees:
Correspondence intended for each Independent Trustee (that is, the Trustees other than the Interested Trustees) may be sent to Fidelity Investments, P.O. Box 55235, Boston, Massachusetts 02205-5235.
Name, Age; Principal Occupation |
Dennis J. Dirks (59) |
| Year of Election or Appointment: 2005 Prior to his retirement in May 2003, Mr. Dirks was Chief Operating Officer and a member of the Board of The Depository Trust & Clearing Corporation (DTCC) (1999-2003). He also served as President, Chief Operating Officer, and Board member of The Depository Trust Company (DTC) (1999-2003) and President and Board member of the National Securities Clearing Corporation (NSCC) (1999-2003). In addition, Mr. Dirks served as Chief Executive Officer and Board member of the Government Securities Clearing Corporation (2001-2003) and Chief Executive Officer and Board member of the Mortgage-Backed Securities Clearing Corporation (2001-2003). Mr. Dirks also serves as a Trustee and a member of the Finance Committee of Manhattan College (2005-present) and a Trustee and a member of the Finance Committee of AHRC of Nassau County (2006-present). |
Albert R. Gamper, Jr. (65) |
| Year of Election or Appointment: 2006 Prior to his retirement in December 2004, Mr. Gamper served as Chairman of the Board of CIT Group Inc. (commercial finance). During his tenure with CIT Group Inc. Mr. Gamper served in numerous senior management positions, including Chairman (1987-1989; 1999-2001; 2002-2004), Chief Executive Officer (1987-2004), and President (1989-2002). He currently serves as a member of the Board of Directors of Public Service Enterprise Group (utilities, 2001-present), Chairman of the Board of Governors, Rutgers University (2004-present), and Chairman of the Board of Saint Barnabas Health Care System. |
George H. Heilmeier (71) |
| Year of Election or Appointment: 2004 Dr. Heilmeier is Chairman Emeritus of Telcordia Technologies (communication software and systems), where prior to his retirement, he served as company Chairman and Chief Executive Officer. He currently serves on the Boards of Directors of The Mitre Corporation (systems engineering and information technology support for the government), and HRL Laboratories (private research and development, 2004-present). He is Chairman of the General Motors Science & Technology Advisory Board and a Life Fellow of the Institute of Electrical and Electronics Engineers (IEEE). Dr. Heilmeier is a member of the Defense Science Board and the National Security Agency Advisory Board. He is also a member of the National Academy of Engineering, the American Academy of Arts and Sciences, and the Board of Overseers of the School of Engineering and Applied Science of the University of Pennsylvania. Previously, Dr. Heilmeier served as a Director of TRW Inc. (automotive, space, defense, and information technology, 1992-2002), Compaq (1994-2002), Automatic Data Processing, Inc. (ADP) (technology-based business outsourcing, 1995-2002), INET Technologies Inc. (telecommunications network surveillance, 2001-2004), and Teletech Holdings (customer management services). He is the recipient of the 2005 Kyoto Prize in Advanced Technology for his invention of the liquid crystal display, and a member of the Consumer Electronics Hall of Fame. |
James H. Keyes (66) |
| Year of Election or Appointment: 2007 Prior to his retirement in 2003, Mr. Keyes was Chairman, President, and Chief Executive Officer of Johnson Controls, Inc. (automotive supplier, 1993-2003). He currently serves as a member of the boards of LSI Logic Corporation (semiconductor technologies), Navistar International Corporation (manufacture and sale of trucks, buses, and diesel engines, 2002-present), and Pitney Bowes, Inc. (integrated mail, messaging, and document management solutions). |
Marie L. Knowles (60) |
| Year of Election or Appointment: 2001 Prior to Ms. Knowles' retirement in June 2000, she served as Executive Vice President and Chief Financial Officer of Atlantic Richfield Company (ARCO) (diversified energy, 1996-2000). From 1993 to 1996, she was a Senior Vice President of ARCO and President of ARCO Transportation Company. She served as a Director of ARCO from 1996 to 1998. She currently serves as a Director of Phelps Dodge Corporation (copper mining and manufacturing) and McKesson Corporation (healthcare service, 2002-present). Ms. Knowles is a Trustee of the Brookings Institution and the Catalina Island Conservancy and also serves as a member of the Advisory Board for the School of Engineering of the University of Southern California. |
Ned C. Lautenbach (63) |
| Year of Election or Appointment: 2000 Mr. Lautenbach is Chairman of the Independent Trustees (2006-present). Mr. Lautenbach has been a partner of Clayton, Dubilier & Rice, Inc. (private equity investment firm) since September 1998. Previously, Mr. Lautenbach was with the International Business Machines Corporation (IBM) from 1968 until his retirement in 1998. Mr. Lautenbach serves as a Director of Sony Corporation (2006-present) and Eaton Corporation (diversified industrial) as well as the Philharmonic Center for the Arts in Naples, Florida. He also is a member of the Board of Trustees of Fairfield University (2005-present), as well as a member of the Council on Foreign Relations. |
Cornelia M. Small (63) |
| Year of Election or Appointment: 2005 Ms. Small is a member (2000-present) and Chairperson (2002-present) of the Investment Committee, and a member (2002-present) of the Board of Trustees of Smith College. Previously, she served as Chief Investment Officer (1999-2000), Director of Global Equity Investments (1996-1999), and a member of the Board of Directors of Scudder, Stevens & Clark (1990-1997) and Scudder Kemper Investments (1997-1999). In addition, Ms. Small served as Co-Chair (2000-2003) of the Annual Fund for the Fletcher School of Law and Diplomacy. |
William S. Stavropoulos (68) |
| Year of Election or Appointment: 2002 Mr. Stavropoulos is Chairman Emeritus of the Board of Directors of The Dow Chemical Company. Since joining The Dow Chemical Company in 1967, Mr. Stavropoulos served in numerous senior management positions, including President (1993-2000; 2002-2003), CEO (1995-2000; 2002-2004), and Chairman of the Executive Committee (2000-2004). Currently, he is a Director of NCR Corporation (data warehousing and technology solutions), Chemical Financial Corporation, Maersk Inc. (industrial conglomerate, 2002-present), Tyco International, Inc. (multinational manufacturing and services, 2007-present), and a member of the Advisory Board for Metalmark Capital (private equity investment firm, 2005-present). He is a special advisor to Clayton, Dubilier & Rice, Inc., a private equity investment firm. He also serves as a member of the Board of Trustees of the American Enterprise Institute for Public Policy Research. In addition, Mr. Stavropoulos is a member of The Business Council, J.P. Morgan International Council and the University of Notre Dame Advisory Council for the College of Science. |
Kenneth L. Wolfe (68) |
| Year of Election or Appointment: 2005 Prior to his retirement in 2001, Mr. Wolfe was Chairman and Chief Executive Officer of Hershey Foods Corporation (1993-2001). He currently serves as a member of the boards of Adelphia Communications Corporation (2003-present), Bausch & Lomb, Inc., and Revlon Inc. (2004-present). |
Advisory Board Members and Executive Officers:
Correspondence intended for Mr. Mauriello may be sent to Fidelity Investments, P.O. Box 55235, Boston, Massachusetts 02205-5235. Correspondence intended for each executive officer and Mr. Lynch may be sent to Fidelity Investments, 82 Devonshire Street, Boston, Massachusetts 02109.
Name, Age; Principal Occupation |
Peter S. Lynch (63) |
| Year of Election or Appointment: 2003 Member of the Advisory Board of Fidelity Securities Fund. Mr. Lynch is Vice Chairman and a Director of FMR, and Vice Chairman (2001-present) and a Director of FMR Co., Inc. Previously, Mr. Lynch served as a Trustee of the Fidelity funds (1990-2003). In addition, he serves as a Trustee of Boston College and as the Chairman of the Inner-City Scholarship Fund. |
Joseph Mauriello (62) |
| Year of Election or Appointment: 2007 Member of the Advisory Board of Fidelity Securities Fund. Prior to his retirement in January 2006, Mr. Mauriello served in numerous senior management positions including Deputy Chairman and Chief Operating Officer (2004-2005), and Vice Chairman of Financial Services (2002-2004) of KPMG LLP US (professional services firm, 1965-2005). Mr. Mauriello currently serves as a member of the Board of Directors of XL Capital Ltd., (global insurance and re-insurance company, 2006-present) and of Arcadia Resources Inc., (health care services and products, 2007-present). He also served as a Director of the Hamilton Funds of the Bank of New York (2006-2007). |
Kimberley H. Monasterio (43) |
| Year of Election or Appointment: 2007 President and Treasurer of OTC. Ms. Monasterio also serves as President and Treasurer of other Fidelity funds (2007-present) and is an employee of FMR (2004-present). Previously, Ms. Monasterio served as Deputy Treasurer of the Fidelity funds (2004-2006). Before joining Fidelity Investments, Ms. Monasterio served as Treasurer (2000-2004) and Chief Financial Officer (2002-2004) of the Franklin Templeton Funds and Senior Vice President of Franklin Templeton Services, LLC (2000-2004). |
Dwight D. Churchill (53) |
| Year of Election or Appointment: 2005 Vice President of OTC. Mr. Churchill also serves as Vice President of certain Equity Funds (2005-present). Mr. Churchill is Executive Vice President of FMR (2005-present) and FMR Co., Inc. (2005-present). Previously, Mr. Churchill served as Senior Vice President of Fidelity Investments Money Management, Inc. (2005-2006), Head of Fidelity's Fixed-Income Division (2000-2005), Vice President of Fidelity's Money Market Funds (2000-2005), Vice President of Fidelity's Bond Funds, and Senior Vice President of FMR. |
Bruce T. Herring (41) |
| Year of Election or Appointment: 2006 Vice President of OTC. Mr. Herring also serves as Vice President of certain Equity Funds (2006-present). Mr. Herring is Senior Vice President of FMR (2006-present) and Vice President of FMR Co., Inc. (2001-present). Previously, Mr. Herring served as a portfolio manager for Fidelity U.S. Equity Funds (2001-2005). |
Sonu Kalra (36) |
| Year of Election or Appointment: 2006 Vice President of OTC. Prior to assuming his current responsibilities, Mr. Kalra worked as a research analyst. |
Eric D. Roiter (58) |
| Year of Election or Appointment: 1998 Secretary of OTC. He also serves as Secretary of other Fidelity funds; Vice President, General Counsel, and Secretary of FMR Co., Inc. (2001-present) and FMR; Assistant Secretary of Fidelity Management & Research (U.K.) Inc. (2001-present), Fidelity Research & Analysis Company (2001-present), and Fidelity Investments Money Management, Inc. (2001-present). Mr. Roiter is an Adjunct Member, Faculty of Law, at Boston College Law School (2003-present). Previously, Mr. Roiter served as Vice President and Secretary of Fidelity Distributors Corporation (FDC) (1998-2005). |
Scott C. Goebel (39) |
| Year of Election or Appointment: 2007 Assistant Secretary of OTC. Mr. Goebel also serves as Assistant Secretary of other Fidelity funds (2007-present), Vice President and Secretary of FDC (2006-present), and is an employee of FMR. |
R. Stephen Ganis (41) |
| Year of Election or Appointment: 2006 Anti-Money Laundering (AML) officer of OTC. Mr. Ganis also serves as AML officer of other Fidelity funds (2006-present) and FMR Corp. (2003-present). Before joining Fidelity Investments, Mr. Ganis practiced law at Goodwin Procter, LLP (2000-2002). |
Joseph B. Hollis (59) |
| Year of Election or Appointment: 2006 Chief Financial Officer of OTC. Mr. Hollis also serves as Chief Financial Officer of other Fidelity funds. Mr. Hollis is President of Fidelity Pricing and Cash Management Services (FPCMS) (2005-present). Mr. Hollis also serves as President and Director of Fidelity Service Company, Inc. (2006-present). Previously, Mr. Hollis served as Senior Vice President of Cash Management Services (1999-2002) and Investment Management Operations (2002-2005). |
Kenneth A. Rathgeber (60) |
| Year of Election or Appointment: 2004 Chief Compliance Officer of OTC. Mr. Rathgeber also serves as Chief Compliance Officer of other Fidelity funds (2004-present) and Executive Vice President of Risk Oversight for Fidelity Investments (2002-present). He is Chief Compliance Officer of FMR (2005-present), FMR Co., Inc. (2005-present), Fidelity Management & Research (U.K.) Inc. (2005-present), Fidelity Research & Analysis Company (2005-present), Fidelity Investments Money Management, Inc. (2005-present), and Strategic Advisers, Inc. (2005-present). Previously, Mr. Rathgeber served as Executive Vice President and Chief Operating Officer for Fidelity Investments Institutional Services Company, Inc. (1998-2002). |
Bryan A. Mehrmann (46) |
| Year of Election or Appointment: 2005 Deputy Treasurer of OTC. Mr. Mehrmann also serves as Deputy Treasurer of other Fidelity funds (2005-present) and is an employee of FMR. Previously, Mr. Mehrmann served as Vice President of Fidelity Investments Institutional Services Group (FIIS)/Fidelity Investments Institutional Operations Corporation, Inc. (FIIOC) Client Services (1998-2004). |
Kenneth B. Robins (37) |
| Year of Election or Appointment: 2005 Deputy Treasurer of OTC. Mr. Robins also serves as Deputy Treasurer of other Fidelity funds (2005-present) and is an employee of FMR (2004-present). Before joining Fidelity Investments, Mr. Robins worked at KPMG LLP, where he was a partner in KPMG's department of professional practice (2002-2004) and a Senior Manager (1999-2000). In addition, Mr. Robins served as Assistant Chief Accountant, United States Securities and Exchange Commission (2000-2002). |
Robert G. Byrnes (40) |
| Year of Election or Appointment: 2005 Assistant Treasurer of OTC. Mr. Byrnes also serves as Assistant Treasurer of other Fidelity funds (2005-present) and is an employee of FMR (2005-present). Previously, Mr. Byrnes served as Vice President of FPCMS (2003-2005). Before joining Fidelity Investments, Mr. Byrnes worked at Deutsche Asset Management where he served as Vice President of the Investment Operations Group (2000-2003). |
Peter L. Lydecker (53) |
| Year of Election or Appointment: 2004 Assistant Treasurer of OTC. Mr. Lydecker also serves as Assistant Treasurer of other Fidelity funds (2004) and is an employee of FMR. |
Gary W. Ryan (48) |
| Year of Election or Appointment: 2005 Assistant Treasurer of OTC. Mr. Ryan also serves as Assistant Treasurer of other Fidelity funds (2005-present) and is an employee of FMR (2005-present). Previously, Mr. Ryan served as Vice President of Fund Reporting in FPCMS (1999-2005). |
Annual Report
Board Approval of Investment Advisory Contracts and Management Fees
Fidelity OTC Portfolio
Each year, typically in July, the Board of Trustees, including the Independent Trustees (together, the Board), votes on the renewal of the management contract and sub-advisory agreements (together, the Advisory Contracts) for the fund. The Board, assisted by the advice of fund counsel and Independent Trustees' counsel, requests and considers a broad range of information throughout the year.
The Board meets regularly each month except August and takes into account throughout the year matters bearing on Advisory Contracts. The Board, acting directly and through its separate committees, considers at each of its meetings factors that are relevant to the annual renewal of the fund's Advisory Contracts, including the services and support provided to the fund and its shareholders. At the time of the renewal, the Board had 12 standing committees, each composed of Independent Trustees with varying backgrounds, to which the Board has assigned specific subject matter responsibilities in order to enhance effective decision-making by the Board. Each committee has adopted a written charter outlining the structure and purposes of the committee. One such committee, the Equity Contract Committee, meets periodically as needed throughout the year to consider matters specifically related to the annual renewal of Advisory Contracts. The committee requests and receives information on, and makes recommendations to the Independent Trustees concerning, the approval and annual review of the Advisory Contracts.
At its July 2007 meeting, the Board of Trustees, including the Independent Trustees, unanimously determined to renew the Advisory Contracts for the fund. In reaching its determination, the Board considered all factors it believed relevant, including (i) the nature, extent, and quality of the services to be provided to the fund and its shareholders (including the investment performance of the fund); (ii) the competitiveness of the management fee and total expenses of the fund; (iii) the total costs of the services to be provided by and the profits to be realized by the investment adviser and its affiliates from the relationship with the fund; (iv) the extent to which economies of scale would be realized as the fund grows; and (v) whether fee levels reflect these economies of scale, if any, for the benefit of fund shareholders. The Board also approved amendments to the fund's agreements with foreign sub-advisers to clarify that each sub-adviser provides services as an independent contractor.
In determining whether to renew the Advisory Contracts for the fund, the Board ultimately reached a determination, with the assistance of fund counsel and Independent Trustees' counsel, that the renewal of the Advisory Contracts and the compensation to be received by Fidelity under the management contract is consistent with Fidelity's fiduciary duty under applicable law. In addition to evaluating the specific factors noted above, the Board, in reaching its determination, is aware that shareholders in the fund have a broad range of investment choices available to them, including a wide choice among mutual funds offered by competitors to Fidelity, and that the fund's shareholders, with the opportunity to review and weigh the disclosure provided by the fund in its prospectus and other public disclosures, have chosen to invest in this fund, managed by Fidelity.
Annual Report
Nature, Extent, and Quality of Services Provided. The Board considered staffing within the investment adviser, FMR, and the sub-advisers (together, the Investment Advisers), including the background of the fund's portfolio manager and the fund's investment objective and discipline. The Independent Trustees also had discussions with senior management of Fidelity's investment operations and investment groups. The Board considered the structure of the portfolio manager compensation program and whether this structure provides appropriate incentives.
Resources Dedicated to Investment Management and Support Services. The Board reviewed the size, education, and experience of the Investment Advisers' investment staff, their use of technology, and the Investment Advisers' approach to recruiting, training, and retaining portfolio managers and other research, advisory, and management personnel. The Board considered Fidelity's extensive global research capabilities that enable the Investment Advisers to aggregate data from various sources in an effort to produce positive investment results. The Board noted that Fidelity's analysts have access to a variety of technological tools that enable them to perform both fundamental and quantitative analysis and to specialize in various disciplines. The Board also considered that Fidelity's portfolio managers and analysts have access to daily portfolio attribution that allows for monitoring of a fund's portfolio, as well as an electronic communication system that provides immediate real-time access to research concerning issuers and credit enhancers.
Shareholder and Administrative Services. The Board considered (i) the nature, extent, quality, and cost of advisory, administrative, distribution, and shareholder services performed by the Investment Advisers and their affiliates under the Advisory Contracts and under separate agreements covering transfer agency, pricing and bookkeeping, and securities lending services for the fund; (ii) the nature and extent of the Investment Advisers' supervision of third party service providers, principally custodians and subcustodians; and (iii) the resources devoted to, and the record of compliance with, the fund's compliance policies and procedures. The Board reviewed the allocation of fund brokerage, including allocations to brokers affiliated with the Investment Advisers, the use of brokerage commissions to pay fund expenses, and the use of "soft" commission dollars to pay for research services. The Board also considered that Fidelity voluntarily pays for market data out of its own resources. The Board also considered the agreement reached between the Independent Trustees and Fidelity in December 2006 following an independent review of matters relating to receipt of travel, entertainment, gifts and gratuities in violation of Fidelity policies.
The Board noted that the growth of fund assets across the complex allows Fidelity to reinvest in the development of services designed to enhance the value or convenience of the Fidelity funds as investment vehicles. These services include 24-hour access to account information and market information through phone representatives and over the Internet, and investor education materials and asset allocation tools.
Annual Report
Board Approval of Investment Advisory Contracts and
Management Fees - continued
Investment in a Large Fund Family. The Board considered the benefits to shareholders of investing in a Fidelity fund, including the benefits of investing in a fund that is part of a large family of funds offering a variety of investment disciplines and providing for a large variety of mutual fund investor services. For example, fund shareholders are offered the privilege of exchanging shares of the fund for shares of other Fidelity funds, as set forth in the fund's prospectus, without paying a sales charge. The Board noted that, since the last Advisory Contract renewals in July 2006, Fidelity has taken a number of actions that benefited particular funds, including (i) dedicating additional resources to investment research and to restructure the investment research teams; (ii) contractually agreeing to reduce the management fee on Fidelity Advisor Floating Rate High Income Fund; (iii) contractually agreeing to reduce the management fees on Fidelity's California, Massachusetts, New Jersey, and New York AMT Tax-Free Money Market Funds, launching new Institutional Classes and Service Classes of these funds, and contractually agreeing to impose expense limitations on these funds; (iv) eliminating the exchange fee on the Fidelity Select Portfolios and reducing the pricing and bookkeeping fee rates for these funds; (v) reducing the maximum transfer agency fee rates on high income funds and certain equity funds; (vi) proposing amended management contracts that, if approved by shareholders, will add a performance adjustment component to the management fees paid by 18 Fidelity Advisor equity funds; (vii) contractually agreeing to reduce fees for Ultra-Short Central Fund and the money market Central Funds; (viii) waiving the Fidelity Advisor funds' contingent deferred sales charge on certain redemptions made through systematic withdrawal programs; and (ix) amending the management contracts for equity and fixed-income funds whose management contracts incorporate a "group fee" structure by adding four new fee "breakpoints" to the group fee rate schedules.
Investment Performance and Compliance. The Board considered whether the fund has operated within its investment objective, as well as its record of compliance with its investment restrictions. It also reviewed the fund's absolute investment performance, as well as the fund's relative investment performance measured against a broad-based securities market index over multiple periods. The Board noted that FMR does not believe that a meaningful peer group exists against which to compare the fund's performance. The following charts considered by the Board show, over the one-, three-, and five-year periods ended December 31, 2006, the fund's cumulative total returns and the cumulative total returns of a broad-based securities market index ("benchmark").
Annual Report
Fidelity OTC Portfolio
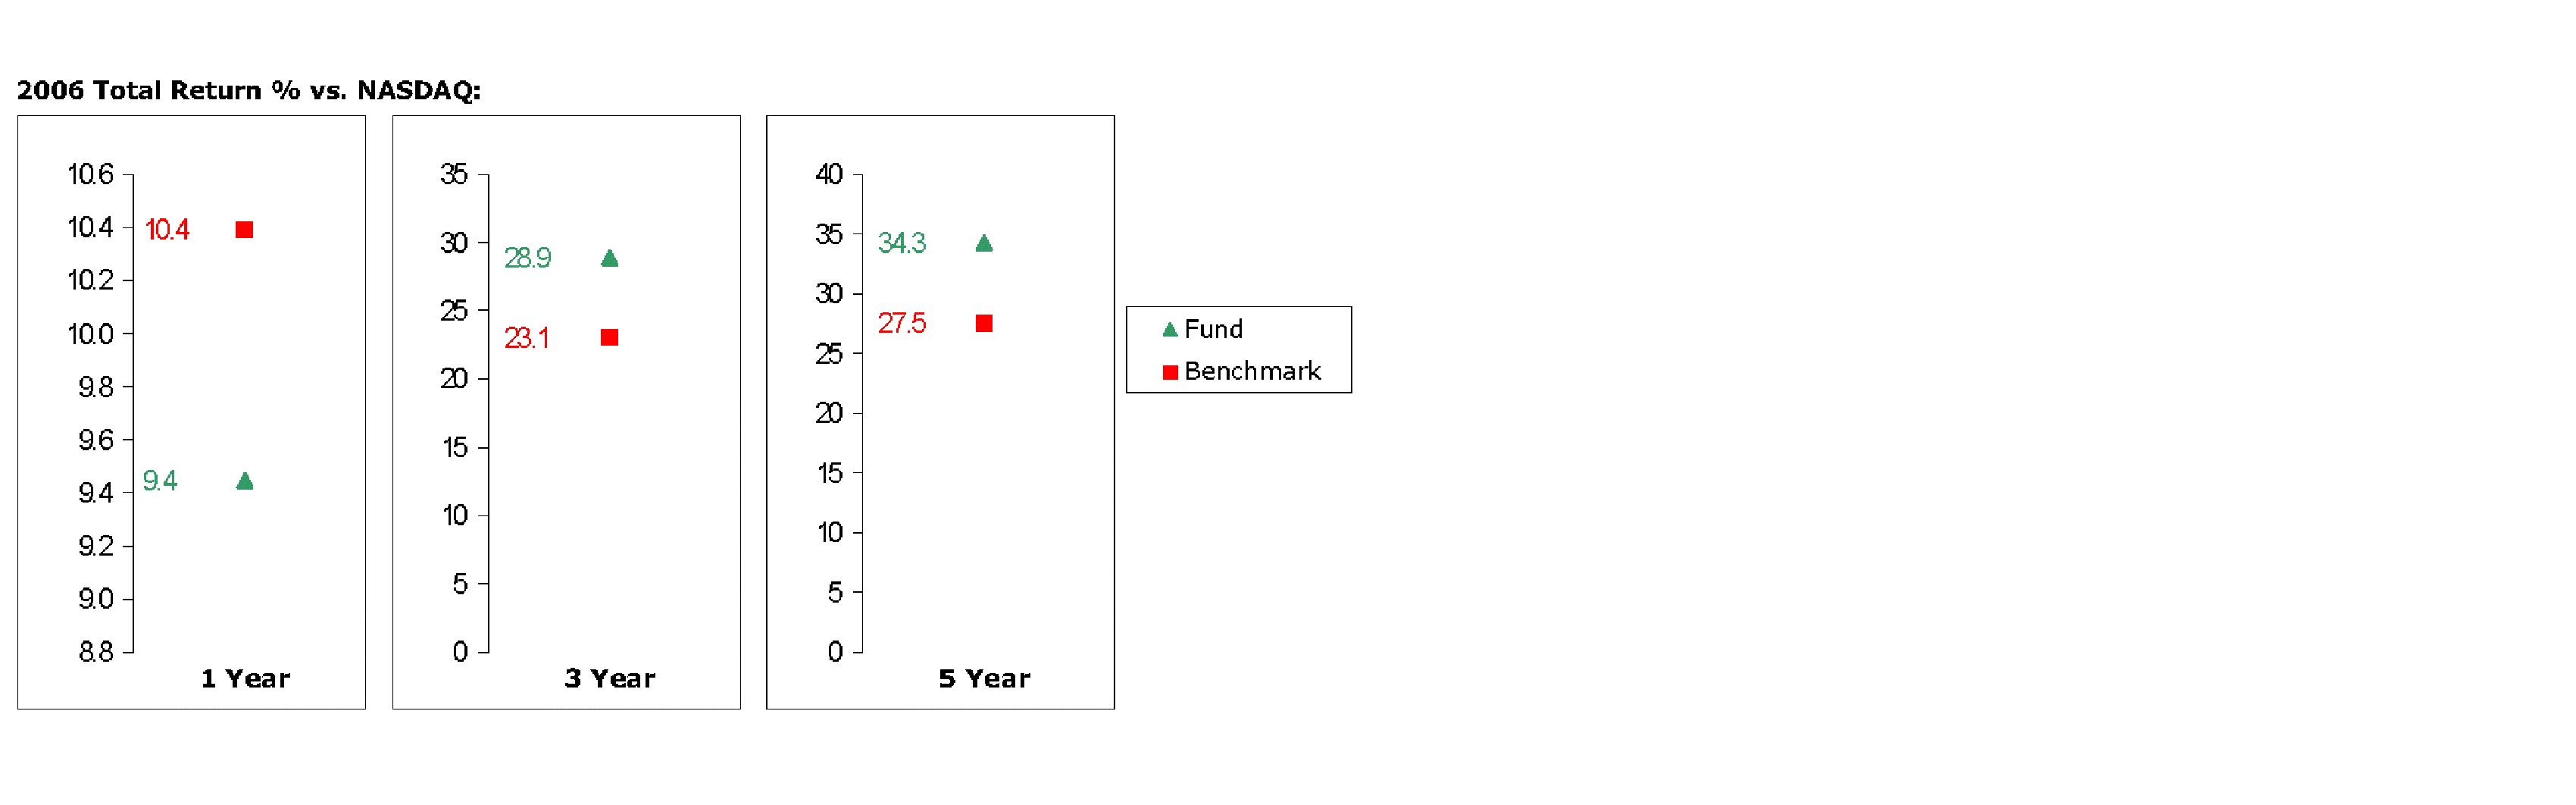
The Board stated that the relative investment performance of the fund compared favorably to its benchmark for the three- and five-year periods, although the fund's one-year cumulative total return was lower than its benchmark.
The Board also considered that the fund's management fee is subject to upward or downward adjustment depending upon whether, and to what extent, the fund's investment performance for the performance period exceeds, or is exceeded by, the record (over the same period) of a Board-approved performance adjustment index. The Board realizes that the performance adjustment provides FMR with a strong economic incentive to seek to achieve superior performance for the fund's shareholders and helps to more closely align the interests of FMR and the fund's shareholders.
The Board considered that FMR has taken steps to refocus and strengthen equity research, equity portfolio management, and compliance.
Based on its review, and giving particular weight to the nature and quality of the resources dedicated by the Investment Advisers to maintain and improve relative performance, the Board concluded that the nature, extent, and quality of the services provided to the fund will benefit the fund's shareholders, particularly in light of the Board's view that the fund's shareholders benefit from investing in a fund that is part of a large family of funds offering a variety of investment disciplines and services.
Competitiveness of Management Fee and Total Fund Expenses. The Board considered the fund's management fee and total expenses compared to "mapped groups" of competitive funds and classes. Fidelity creates "mapped groups" by combining similar Lipper investment objective categories that have comparable management fee characteristics. Combining Lipper investment objective categories aids the Board's management fee and total expense comparisons by broadening the competitive group used for comparison and by reducing the number of universes to which various Fidelity funds are compared. The Board also considered supplemental information about how the fund's management fee and total expenses ranked relative to groups based on Lipper classifications, which take into account a fund's market capitalization and style.
Annual Report
Board Approval of Investment Advisory Contracts and
Management Fees - continued
The Board considered two proprietary management fee comparisons for the 12-month periods shown in the chart below. The group of Lipper funds used by the Board for management fee comparisons is referred to below as the "Total Mapped Group." The Total Mapped Group comparison focuses on a fund's standing relative to the total universe of comparable funds available to investors, in terms of gross management fees before expense reimbursements or caps, and without giving effect to the fund's performance adjustment. "TMG %" represents the percentage of funds in the Total Mapped Group that had management fees that were lower than the fund's. For example, a TMG % of 16% means that 84% of the funds in the Total Mapped Group had higher management fees than the fund. The "Asset-Size Peer Group" (ASPG) comparison focuses on a fund's standing relative to non-Fidelity funds similar in size to the fund within the Total Mapped Group. The ASPG represents at least 15% of the funds in the Total Mapped Group with comparable asset size and management fee characteristics, subject to a minimum of 50 funds (or all funds in the Total Mapped Group if fewer than 50). Additional information, such as the ASPG quartile in which the fund's management fee ranked and the impact of the fund's performance adjustment, is also included in the chart and considered by the Board.
Fidelity OTC Portfolio
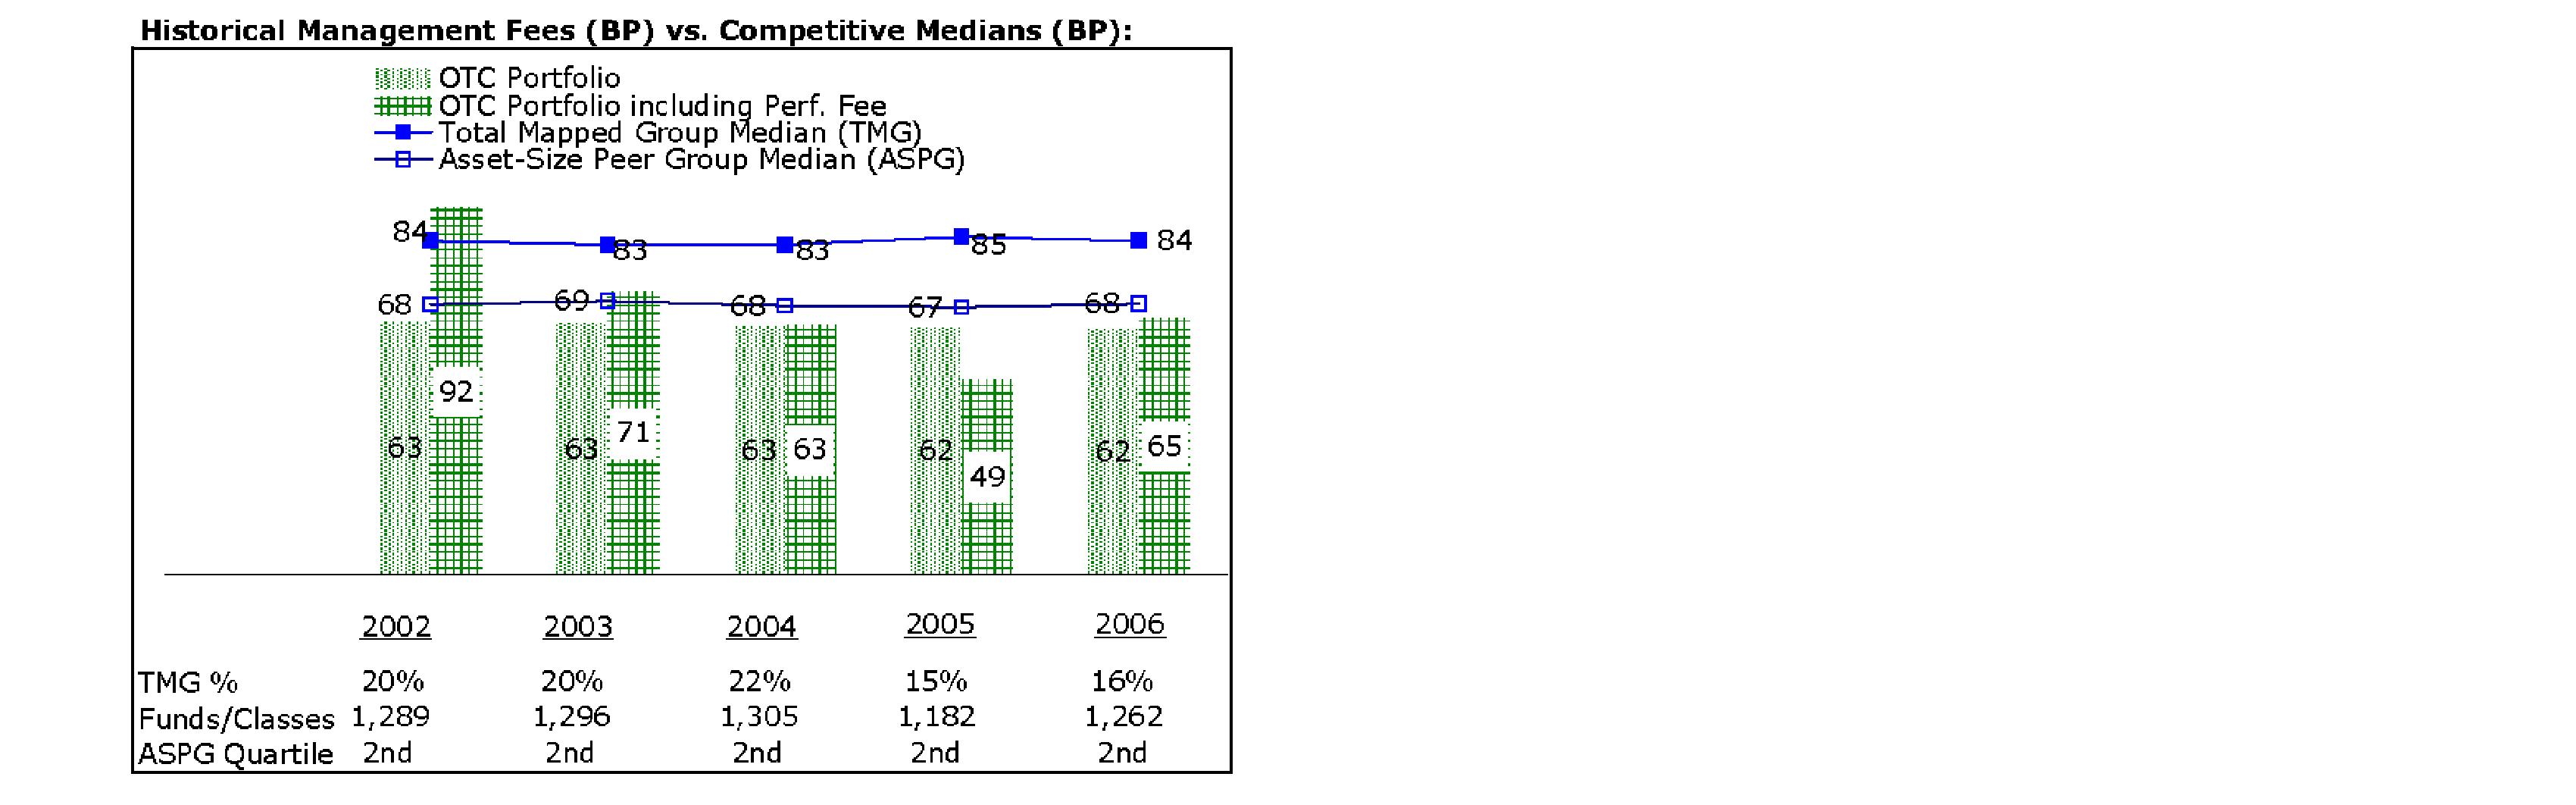
Annual Report
The Board noted that the fund's management fee ranked below the median of its Total Mapped Group and below the median of its ASPG for 2006. The Board also noted the effect of the fund's positive performance adjustment on the fund's management fee ranking. The Board noted that the performance adjustment for each year represents calculations for performance periods that differ from the periods shown in the performance charts above.
Based on its review, the Board concluded that the fund's management fee was fair and reasonable in light of the services that the fund receives and the other factors considered.
In its review of the fund's total expenses, the Board considered the fund's management fee as well as other fund expenses, such as transfer agent fees, pricing and bookkeeping fees, and custodial, legal, and audit fees. The Board also noted the effects of any waivers and reimbursements on fees and expenses, as well as the fund's positive performance adjustment. As part of its review, the Board also considered current and historical total expenses of the fund compared to competitive fund median expenses. The fund is compared to those funds and classes in the Total Mapped Group (used by the Board for management fee comparisons) that have a similar sales load structure.
The Board noted that the fund's total expenses ranked below its competitive median for 2006.
In its review of total expenses, the Board also considered Fidelity fee structures and other information on clients that FMR and its affiliates service in other competitive markets, such as other mutual funds advised or subadvised by FMR or its affiliates, pension plan clients, and other institutional clients.
Based on its review, the Board concluded that the fund's total expenses were reasonable in light of the services that the fund and its shareholders receive and the other factors considered.
Costs of the Services and Profitability. The Board considered the revenues earned and the expenses incurred by Fidelity in conducting the business of developing, marketing, distributing, managing, administering and servicing the fund and its shareholders. The Board also considered the level of Fidelity's profits in respect of all the Fidelity funds.
On an annual basis, FMR presents to the Board Fidelity's profitability for the fund. Fidelity calculates the profitability for each fund, as well as aggregate profitability for groups of Fidelity funds and all Fidelity funds, using a series of detailed revenue and cost allocation methodologies which originate with the audited books and records of Fidelity. The Audit Committee of the Board reviews any significant changes from the prior year's methodologies.
PricewaterhouseCoopers LLP (PwC), independent registered public accounting firm and auditor to Fidelity and certain Fidelity funds, has been engaged annually by the Board as part of the Board's assessment of the results of Fidelity's profitability analysis. PwC's engagement includes the review and assessment of Fidelity's methodologies used in determining the revenues and expenses attributable to Fidelity's mutual fund business, and completion of agreed-upon procedures surrounding the mathematical accuracy of fund profitability and its conformity to allocation methodologies. After considering PwC's reports issued under the engagement and information provided by Fidelity, the Board believes that while other allocation methods may also be reasonable, Fidelity's profitability methodologies are reasonable in all material respects.
Annual Report
Board Approval of Investment Advisory Contracts and
Management Fees - continued
The Board has also reviewed Fidelity's non-fund businesses and any fall-out benefits related to the mutual fund business as well as cases where Fidelity's affiliates may benefit from or be related to the fund's business.
The Board considered the costs of the services provided by and the profits realized by Fidelity in connection with the operation of the fund and determined that the amount of profit is a fair entrepreneurial profit for the management of the fund.
Economies of Scale. The Board considered whether there have been economies of scale in respect of the management of the Fidelity funds, whether the Fidelity funds (including the fund) have appropriately benefited from any such economies of scale, and whether there is potential for realization of any further economies of scale. The Board considered the extent to which the fund will benefit from economies of scale through increased services to the fund, through waivers or reimbursements, or through fee or expense reductions, including reductions that occur through operation of the transfer agent agreement. The transfer agent fee varies in part based on the number of accounts in the fund. If the number of accounts decreases or the average account size increases, the overall transfer agent fee rate decreases.
The Board recognized that the fund's management contract incorporates a "group fee" structure, which provides for lower group fee rates as total fund assets under FMR's management increase, and for higher group fee rates as total fund assets under FMR's management decrease. FMR determines the group fee rates based on a tiered asset "breakpoint" schedule. In connection with the renewal of the fund's management contract, the Board approved amendments to the fund's management contract that added four new fee breakpoints to the group fee rate schedule for assets under FMR's management above $1,386 billion. The Board considered that the group fee rate declines under both the present and amended schedules, but that under the amended schedule, the group fee rate declines faster as assets under FMR's management exceed $1,386 billion. The Board considered that the group fee is designed to deliver the benefits of economies of scale to fund shareholders when total fund assets increase, even if assets of any particular fund are unchanged or have declined, because some portion of Fidelity's costs are attributable to services provided to all Fidelity funds, and all funds benefit if those costs can be allocated among more assets. The Board concluded that, given the group fee structure, fund shareholders will achieve a certain level of economies of scale as assets under FMR's management increase at the fund complex level, regardless of whether Fidelity achieves any such economies of scale.
Annual Report
The Board further concluded that any potential economies of scale are being shared between fund shareholders and Fidelity in an appropriate manner.
Additional Information Requested by the Board. In order to develop fully the factual basis for consideration of the Fidelity funds' Advisory Contracts, the Board requested and received additional information on several topics, including (i) fund performance trends and actions to be taken by FMR to improve certain funds' overall performance; (ii) Fidelity's portfolio manager compensation structure, including its effects on fund profitability and the extent to which portfolio manager compensation is linked to fund performance; (iii) Fidelity's fee structures; (iv) the funds' sub-advisory arrangements; and (v) accounts managed by Fidelity other than the Fidelity funds.
Based on its evaluation of all of the conclusions noted above, and after considering all material factors, the Board ultimately concluded that the advisory fee structures are fair and reasonable, and that the fund's Advisory Contracts should be renewed.
Annual Report
Managing Your Investments
Fidelity offers several ways to conveniently manage your personal investments via your telephone or PC. You can access your account information, conduct trades and research your investments 24 hours a day.
By Phone
Fidelity Automated Service Telephone provides a single toll-free number to access account balances, positions, quotes and trading. It's easy to navigate the service, and on your first call, the system will help you create a personal identification number (PIN) for security.
(phone_graphic)
Fidelity Automated
Service Telephone (FAST®)
1-800-544-5555
Press
1 For mutual fund and brokerage trading.
2 For quotes.*
3 For account balances and holdings.
4 To review orders and mutual
fund activity.
5 To change your PIN.
*0 To speak to a Fidelity representative.
By PC
Fidelity's web site on the Internet provides a wide range of information, including daily financial news, fund performance, interactive planning tools and news about Fidelity products and services.
(computer_graphic)
Fidelity's Web Site
www.fidelity.com
* When you call the quotes line, please remember that a fund's yield and return will vary and, except for money market funds, share price will also vary. This means that you may have a gain or loss when you sell your shares. There is no assurance that money market funds will be able to maintain a stable $1 share price; an investment in a money market fund is not insured or guaranteed by the U.S. government. Total returns are historical and include changes in share price, reinvestment of dividends and capital gains, and the effects of any sales charges.
Annual Report
To Write Fidelity
We'll give your correspondence immediate attention and send you written confirmation upon completion of your request.
(letter_graphic)
Making Changes
To Your Account
(such as changing name, address, bank, etc.)
Fidelity Investments
P.O. Box 770001
Cincinnati, OH 45277-0002
(letter_graphic)
For Non-Retirement
Accounts
Buying shares
Fidelity Investments
P.O. Box 770001
Cincinnati, OH 45277-0003
Overnight Express
Fidelity Investments
Attn: Distribution Services
100 Crosby Parkway - KC1H
Covington, KY 41015
Selling shares
Fidelity Investments
P.O. Box 770001
Cincinnati, OH 45277-0035
Overnight Express
Fidelity Investments
Attn: Distribution Services
100 Crosby Parkway - KC1H
Covington, KY 41015
General Correspondence
Fidelity Investments
P.O. Box 500
Merrimack, NH 03054-0500
(letter_graphic)
For Retirement
Accounts
Buying shares
Fidelity Investments
P.O. Box 770001
Cincinnati, OH 45277-0003
Selling shares
Fidelity Investments
P.O. Box 770001
Cincinnati, OH 45277-0035
Overnight Express
Fidelity Investments
Attn: Distribution Services
100 Crosby Parkway - KC1H
Covington, KY 41015
General Correspondence
Fidelity Investments
P.O. Box 500
Merrimack, NH 03054-0500
Annual Report
To Visit Fidelity
For directions and hours,
please call 1-800-544-9797.
Arizona
7001 West Ray Road
Chandler, AZ
15445 N. Scottsdale Road
Scottsdale, AZ
California
815 East Birch Street
Brea, CA
1411 Chapin Avenue
Burlingame, CA
851 East Hamilton Avenue
Campbell, CA
19200 Von Karman Avenue
Irvine, CA
601 Larkspur Landing Circle
Larkspur, CA
10100 Santa Monica Blvd.
Los Angeles, CA
27101 Puerta Real
Mission Viejo, CA
73-575 El Paseo
Palm Desert, CA
251 University Avenue
Palo Alto, CA
123 South Lake Avenue
Pasadena, CA
16995 Bernardo Ctr. Drive
Rancho Bernardo, CA
1220 Roseville Parkway
Roseville, CA
1740 Arden Way
Sacramento, CA
7676 Hazard Center Drive
San Diego, CA
11943 El Camino Real
San Diego, CA
8 Montgomery Street
San Francisco, CA
3793 State Street
Santa Barbara, CA
1200 Wilshire Boulevard
Santa Monica, CA
21701 Hawthorne Boulevard
Torrance, CA
2001 North Main Street
Walnut Creek, CA
6300 Canoga Avenue
Woodland Hills, CA
Colorado
1625 Broadway
Denver, CO
9185 Westview Road
Lone Tree, CO
Connecticut
48 West Putnam Avenue
Greenwich, CT
265 Church Street
New Haven, CT
300 Atlantic Street
Stamford, CT
29 South Main Street
West Hartford, CT
Delaware
400 Delaware Avenue
Wilmington, DE
Florida
4400 N. Federal Highway
Boca Raton, FL
121 Alhambra Plaza
Coral Gables, FL
2948 N. Federal Highway
Ft. Lauderdale, FL
4671 Town Center Parkway
Jacksonville, FL
1907 West State Road 434
Longwood, FL
8880 Tamiami Trail, North
Naples, FL
3501 PGA Boulevard
Palm Beach Gardens, FL
3550 Tamiami Trail, South
Sarasota, FL
1502 N. Westshore Blvd.
Tampa, FL
2465 State Road 7
Wellington, FL
Georgia
3445 Peachtree Road, N.E.
Atlanta, GA
1000 Abernathy Road
Atlanta, GA
Illinois
One North LaSalle Street
Chicago, IL
875 North Michigan Ave.
Chicago, IL
1415 West 22nd Street
Oak Brook, IL
1572 East Golf Road
Schaumburg, IL
3232 Lake Avenue
Wilmette, IL
Indiana
4729 East 82nd Street
Indianapolis, IN
Kansas
5400 College Boulevard
Overland Park, KS
Maine
Three Canal Plaza
Portland, ME
Maryland
7315 Wisconsin Avenue
Bethesda, MD
One W. Pennsylvania Ave.
Towson, MD
Massachusetts
801 Boylston Street
Boston, MA
155 Congress Street
Boston, MA
300 Granite Street
Braintree, MA
44 Mall Road
Burlington, MA
238 Main Street
Cambridge, MA
405 Cochituate Road
Framingham, MA
416 Belmont Street
Worcester, MA
Annual Report
Michigan
500 E. Eisenhower Pkwy.
Ann Arbor, MI
280 Old N. Woodward Ave.
Birmingham, MI
43420 Grand River Avenue
Novi, MI
29155 Northwestern Hwy.
Southfield, MI
Minnesota
7600 France Avenue South
Edina, MN
Missouri
1524 South Lindbergh Blvd.
St. Louis, MO
Nevada
2225 Village Walk Drive
Henderson, NV
New Jersey
150 Essex Street
Millburn, NJ
56 South Street
Morristown, NJ
396 Route 17, North
Paramus, NJ
3518 Route 1 North
Princeton, NJ
530 Broad Street
Shrewsbury, NJ
New York
1055 Franklin Avenue
Garden City, NY
37 West Jericho Turnpike
Huntington Station, NY
1271 Avenue of the Americas
New York, NY
980 Madison Avenue
New York, NY
61 Broadway
New York, NY
350 Park Avenue
New York, NY
200 Fifth Avenue
New York, NY
733 Third Avenue
New York, NY
11 Penn Plaza
New York, NY
2070 Broadway
New York, NY
1075 Northern Blvd.
Roslyn, NY
799 Central Park Avenue
Scarsdale, NY
North Carolina
4611 Sharon Road
Charlotte, NC
7011 Fayetteville Road
Durham, NC
Ohio
3805 Edwards Road
Cincinnati, OH
1324 Polaris Parkway
Columbus, OH
28699 Chagrin Boulevard
Woodmere Village, OH
Oregon
7493 SW Bridgeport Road
Tigard, OR
Pennsylvania
600 West DeKalb Pike
King of Prussia, PA
1735 Market Street
Philadelphia, PA
12001 Perry Highway
Wexford, PA
Rhode Island
47 Providence Place
Providence, RI
Tennessee
6150 Poplar Avenue
Memphis, TN
Texas
10000 Research Boulevard
Austin, TX
4001 Northwest Parkway
Dallas, TX
12532 Memorial Drive
Houston, TX
2701 Drexel Drive
Houston, TX
6560 Fannin Street
Houston, TX
6500 N. MacArthur Blvd.
Irving, TX
6005 West Park Boulevard
Plano, TX
14100 San Pedro
San Antonio, TX
1576 East Southlake Blvd.
Southlake, TX
19740 IH 45 North
Spring, TX
Utah
279 West South Temple
Salt Lake City, UT
Virginia
1861 International Drive
McLean, VA
Washington
411 108th Avenue, N.E.
Bellevue, WA
1518 6th Avenue
Seattle, WA
Washington, DC
1900 K Street, N.W.
Washington, DC
Wisconsin
595 North Barker Road
Brookfield, WI
Fidelity Brokerage Services, Inc., 100 Summer St., Boston, MA 02110 Member NYSE/SIPC
Annual Report
Annual Report
Annual Report
Investment Adviser
Fidelity Management & Research Company
Boston, MA
Investment Sub-Advisers
FMR Co., Inc.
Fidelity Research & Analysis Company
Fidelity Management & Research
(U.K.) Inc.
Fidelity Investments Japan Limited
Fidelity International Investments
Advisors
Fidelity International Investments
Advisors (U.K.) Limited
General Distributor
Fidelity Distributors Corporation
Boston, MA
Transfer and Service Agent
Fidelity Service Company, Inc.
Boston, MA
Custodian
The Northern Trust Company
Chicago, IL
The Fidelity Telephone Connection
Mutual Fund 24-Hour Service
Exchanges/Redemptions
and Account Assistance 1-800-544-6666
Product Information 1-800-544-6666
Retirement Accounts 1-800-544-4774
(8 a.m. - 9 p.m.)
TDD Service 1-800-544-0118
for the deaf and hearing impaired
(9 a.m. - 9 p.m. Eastern time)
Fidelity Automated Service
Telephone (FAST®) (automated graphic) 1-800-544-5555
(automated graphic) Automated line for quickest service
OTC-UANN-0907
1.789250.104
Fidelity®
Real Estate Income
Fund
Annual Report
July 31, 2007
(2_fidelity_logos) (Registered_Trademark)
Contents
Chairman's Message | <Click Here> | Ned Johnson's message to shareholders. |
Performance | <Click Here> | How the fund has done over time. |
Management's Discussion | <Click Here> | The manager's review of fund performance, strategy and outlook. |
Shareholder Expense Example | <Click Here> | An example of shareholder expenses. |
Investment Changes | <Click Here> | A summary of major shifts in the fund's investments over the past six months. |
Investments | <Click Here> | A complete list of the fund's investments with their market values. |
Financial Statements | <Click Here> | Statements of assets and liabilities, operations, and changes in net assets,
as well as financial highlights. |
Notes | <Click Here> | Notes to the financial statements. |
Report of Independent Registered Public Accounting Firm | <Click Here> | |
Trustees and Officers | <Click Here> | |
Distributions | <Click Here> | |
Board Approval of Investment Advisory Contracts and Management Fees | <Click Here> | |
To view a fund's proxy voting guidelines and proxy voting record for the 12-month period ended June 30, visit http://www.fidelity.com (search for "proxy voting guidelines") or visit the Securities and Exchange Commission's (SEC) web site at http://www.sec.gov. You may also call 1-800-544-8544 to request a free copy of the proxy voting guidelines.
Standard & Poor's, S&P and S&P 500 are registered service marks of The McGraw-Hill Companies, Inc. and have been licensed for use by Fidelity Distributors Corporation.
Other third party marks appearing herein are the property of their respective owners.
All other marks appearing herein are registered or unregistered trademarks or service marks of FMR Corp. or an affiliated company.
Annual Report
This report and the financial statements contained herein are submitted for the general information of the shareholders of the fund. This report is not authorized for distribution to prospective investors in the fund unless preceded or accompanied by an effective prospectus.
A fund files its complete schedule of portfolio holdings with the SEC for the first and third quarters of each fiscal year on Form N-Q. Forms N-Q are available on the SEC's web site at http://www.sec.gov. A fund's Forms N-Q may be reviewed and copied at the SEC's Public Reference Room in Washington, DC. Information regarding the operation of the SEC's Public Reference Room may be obtained by calling 1-800-SEC-0330. For a complete list of a fund's portfolio holdings, view the most recent holdings listing, semiannual report, or annual report on Fidelity's web site at http://www.fidelity.com or http://www.advisor.fidelity.com, as applicable.
NOT FDIC INSURED · MAY LOSE VALUE · NO BANK GUARANTEE
Neither the fund nor Fidelity Distributors Corporation is a bank.
Annual Report
Chairman's Message
(photo_of_Edward_C_Johnson_3d)
Dear Shareholder:
Stocks are currently on pace to register their fifth straight year of positive returns, although gains could be trimmed if the U.S. economy continues to slow. While financial markets are always unpredictable, there are a number of time-tested principles that can put the historical odds in your favor.
One of the basic tenets is to invest for the long term. Over time, riding out the markets' inevitable ups and downs has proven much more effective than selling into panic or chasing the hottest trend. Even missing only a few of the markets' best days can significantly diminish investor returns. Patience also affords the benefits of compounding - of earning interest on additional income or reinvested dividends and capital gains. There are tax advantages and cost benefits to consider as well. The more you sell, the more taxes you pay, and the more you trade, the higher the costs. While staying the course doesn't eliminate risk, it can considerably lessen the effect of short-term declines.
You can further manage your investing risk through diversification. And today, more than ever, geographic diversification should be taken into account. Studies indicate that asset allocation is the single most important determinant of a portfolio's long-term success. The right mix of stocks, bonds and cash - aligned to your particular risk tolerance and investment objective - is very important. Age-appropriate rebalancing is also an essential aspect of asset allocation. For younger investors, an emphasis on equities - which historically have been the best-performing asset class over time - is encouraged. As investors near their specific goal, such as retirement or sending a child to college, consideration may be given to replacing volatile assets (e.g. common stocks) with more-stable fixed investments (bonds or savings plans).
A third investment principle - investing regularly - can help lower the average cost of your purchases. Investing a certain amount of money each month or quarter helps ensure you won't pay for all your shares at market highs. This strategy - known as dollar cost averaging - also reduces unconstructive "emotion" from investing, helping shareholders avoid selling weak performers just prior to an upswing, or chasing a hot performer just before a correction.
We invite you to contact us via the Internet, through our Investor Centers or over the phone. It is our privilege to provide you the information you need to make the investments that are right for you.
Sincerely,
/s/Edward C. Johnson 3d
Edward C. Johnson 3d
Annual Report
Performance: The Bottom Line
Average annual total return reflects the change in the value of an investment, assuming reinvestment of the fund's dividend income and capital gains (the profits earned upon the sale of securities that have grown in value) and assuming a constant rate of performance each year. The $10,000 table and the fund's returns do not reflect the deduction of taxes that a shareholder would pay on fund distributions or the redemption of fund shares. During periods of reimbursement by Fidelity, a fund's total return will be greater than it would be had the reimbursement not occurred. How a fund did yesterday is no guarantee of how it will do tomorrow.
Average Annual Total Returns
Periods ended July 31, 2007 | Past 1
year | Life of
Fund A |
Fidelity Real Estate Income Fund | 2.00% | 9.06% |
A From February 4, 2003.
$10,000 Over Life of Fund
Let's say hypothetically that $10,000 was invested in Fidelity® Real Estate Income Fund on February 4, 2003, when the fund started. The chart shows how the value of your investment would have changed, and also shows how the Standard and Poor's 500SM Index (S&P 500®)performed over the same period.
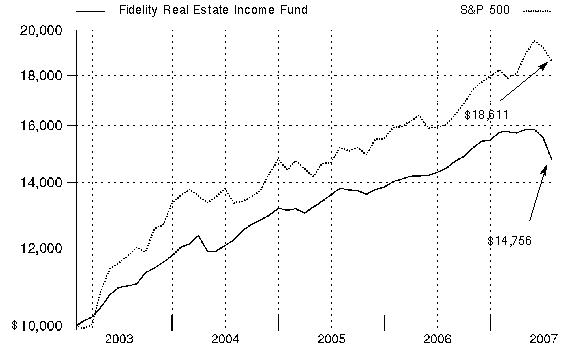
Annual Report
Management's Discussion of Fund Performance
Comments from Mark Snyderman, Portfolio Manager of Fidelity® Real Estate Income Fund
The overall fundamentals for commercial property remained favorable and relatively stable throughout the 12 months ending July 31, 2007. The demand for the use of properties such as office buildings, apartments and shopping centers continued to grow steadily in line with the economy, and relatively modest new supply was being built. Nevertheless, volatility in the capital markets increased substantially toward period end, as lenders began to tighten their credit standards. Until recently the strongest-performing securities in the real estate market, real estate investment trust (REIT) common stocks were disappointments during the period. Bonds did better. The U.S. REIT market, as measured by the FTSE NAREIT All REIT index (NAREIT index), lost 1.82%, significantly lagging the 16.13% gain of the Standard & Poor's 500SM Index. The Merrill Lynch® Real Estate Corporate Bond Index - a market-capitalization-weighted index that measures the performance of investment-grade public debt of corporate issuers in the domestic real estate sector - gained 5.60%, as compared with the Lehman Brothers® U.S. Aggregate Index's return of 5.58%.
During the year, the fund returned 2.00%. The fund's benchmark, the Fidelity Real Estate Income Composite Index - a 40/40/20 blend of the Morgan Stanley® REIT Preferred Index, the Merrill Lynch Real Estate Corporate Bond Index and the NAREIT index, respectively - returned 3.67%, while the S&P 500® rose 16.13%. In absolute terms, the fund saw modestly positive results from its real estate common stocks. The fund's preferred stocks lost some ground. My high-yield bond holdings gained only modestly because of increased concerns about credit quality, while investment-grade bonds did the best. Overall, the fund's residential mortgage lender preferred stock investments detracted the most, including American Home Mortgage, HomeBanc Mortgage and Accredited Mortgage - which originates and owns subprime loans - all of which faced serious liquidity problems. Also detracting was RAIT Financial Trust. In contrast, positions in the convertible preferred stocks of Mills, a shopping center REIT, was helpful. These shares provided a relatively high yield and further helped after the company agreed to be acquired. Mortgage REIT Annaly Capital Management also did well, benefiting from its extremely defensive portfolio of agency mortgage securities. A convertible preferred securities position in Equity Office Properties Trust helped after the office REIT was bought out, while my common stock holdings in mall operator General Growth Properties also contributed.
The views expressed above reflect those of the portfolio manager(s) only through the end of the period as stated on the cover of this report and do not necessarily represent the views of Fidelity or any other person in the Fidelity organization. Any such views are subject to change at any time based upon market or other conditions and Fidelity disclaims any responsibility to update such views. These views may not be relied on as investment advice and, because investment decisions for a Fidelity fund are based on numerous factors, may not be relied on as an indication of trading intent on behalf of any Fidelity fund.
Annual Report
Shareholder Expense Example
As a shareholder of the Fund, you incur two types of costs: (1) transaction costs, including redemption fees, and (2) ongoing costs, including management fees and other Fund expenses. This Example is intended to help you understand your ongoing costs (in dollars) of investing in the Fund and to compare these costs with the ongoing costs of investing in other mutual funds.
The Example is based on an investment of $1,000 invested at the beginning of the period and held for the entire period (February 1, 2007 to July 31, 2007).
Actual Expenses
The first line of the accompanying table provides information about actual account values and actual expenses. You may use the information in this line, together with the amount you invested, to estimate the expenses that you paid over the period. Simply divide your account value by $1,000.00 (for example, an $8,600 account value divided by $1,000.00 = 8.6), then multiply the result by the number in the first line under the heading entitled "Expenses Paid During Period" to estimate the expenses you paid on your account during this period. A small balance maintenance fee of $12.00 that is charged once a year may apply for certain accounts with a value of less than $2,000. This fee is not included in the table below. If it was, the estimate of expenses you paid during the period would be higher, and your ending account value lower, by this amount. In addition, the Fund, as a shareholder in the underlying Fidelity Central Funds, will indirectly bear its pro rata share of the fees and expenses incurred by the underlying Fidelity Central Funds. These fees and expenses are not included in the Fund's annualized expense ratio used to calculate the expense estimate in the table below.
Hypothetical Example for Comparison Purposes
The second line of the accompanying table provides information about hypothetical account values and hypothetical expenses based on the Fund's actual expense ratio and an assumed rate of return of 5% per year before expenses, which is not the Fund's actual return. The hypothetical account values and expenses may not be used to estimate the actual ending account balance or expenses you paid for the period. You may use this information to compare the ongoing costs of investing in the Fund and other funds. To do so, compare this 5% hypothetical example with the 5% hypothetical examples that appear in the shareholder reports of the other funds. A small balance maintenance fee of $12.00 that is charged once a year may apply for certain accounts with a value of less than $2,000. This fee is not included in the table below. If it was, the estimate of expenses you paid during the period would be higher, and your ending account value lower, by this amount. In addition, the Fund, as a shareholder in the underlying Fidelity Central Funds, will indirectly bear its pro rata share of the fees and expenses incurred by the underlying Fidelity Central Funds. These fees and expenses are not included in the Fund's annualized expense ratio used to calculate the expense estimate in the table below.
Annual Report
Shareholder Expense Example - continued
Please note that the expenses shown in the table are meant to highlight your ongoing costs only and do not reflect any transaction costs. Therefore, the second line of the table is useful in comparing ongoing costs only, and will not help you determine the relative total costs of owning different funds. In addition, if these transactional costs were included, your costs would have been higher.
| Beginning
Account Value
February 1, 2007 | Ending
Account Value
July 31, 2007 | Expenses Paid
During Period*
February 1, 2007
to July 31, 2007 |
Actual | $ 1,000.00 | $ 936.50 | $ 4.18 |
Hypothetical (5% return per year before expenses) | $ 1,000.00 | $ 1,020.48 | $ 4.36 |
* Expenses are equal to the Fund's annualized expense ratio of .87%; multiplied by the average account value over the period, multiplied by 181/365 (to reflect the one-half year period). The fees and expenses of the underlying Fidelity Central Funds in which the Fund invests are not included in the Fund's annualized expense ratio.
Annual Report
Investment Changes
The information in the following tables is based on the combined investments of the Fund and its pro-rata share of the investments in each Fidelity Central Fund. |
Top Five Stocks as of July 31, 2007 |
| % of fund's
net assets | % of fund's net assets
6 months ago |
Annaly Capital Management, Inc. | 1.7 | 0.8 |
MFA Mortgage Investments, Inc. Series A, 8.50% | 1.3 | 0.9 |
Anworth Mortgage Asset Corp. Series A, 8.625% | 1.0 | 0.8 |
Annaly Capital Management, Inc. Series A, 7.875% | 0.9 | 0.6 |
Newcastle Investment Corp. Series B, 9.75% | 0.9 | 0.8 |
| 5.8 | |
Top 5 Bonds as of July 31, 2007 |
| % of fund's
net assets | % of fund's net assets
6 months ago |
American Financial Realty Trust 4.375% 7/15/24 | 1.9 | 1.5 |
Thornburg Mortgage, Inc. 8% 5/15/13 | 1.3 | 1.1 |
Senior Housing Properties Trust 8.625% 1/15/12 | 1.2 | 1.0 |
Ventas Realty LP 9% 5/1/12 | 1.1 | 0.9 |
Health Care Property Investors, Inc. 6.3% 9/15/16 | 0.9 | 0.7 |
| 6.4 | |
Asset Allocation (% of fund's net assets) |
As of July 31, 2007* | As of January 31, 2007** |
 | Common Stocks 17.0% | | | Common Stocks 21.9% | |
 | Preferred Stocks 20.2% | | | Preferred Stocks 20.1% | |
 | Bonds 49.3% | | | Bonds 45.6% | |
 | Convertible
Securities 3.7% | | | Convertible
Securities 4.8% | |
 | Other Investments 4.3% | | | Other Investments 3.7% | |
 | Short-Term
Investments and
Net Other Assets 5.5% | | | Short-Term
Investments and
Net Other Assets 3.9% | |
* Foreign investments | 6.1% | | ** Foreign investments | 1.0% | |

Percentages are adjusted for the effect of futures and swap contacts, if applicable. |
A holdings listing for the Fund, which presents direct holdings as well as the pro rata share of any securities and other investments held indirectly through its investment in underlying non-money market Fidelity Central Funds, is available at fidelity.com. |
Annual Report
Investments July 31, 2007
Showing Percentage of Net Assets
Common Stocks - 17.0% |
| Shares | | Value |
CONSUMER DISCRETIONARY - 0.7% |
Hotels, Restaurants & Leisure - 0.7% |
Red Lion Hotels Corp. (a) | 89,500 | | $ 966,600 |
Starwood Hotels & Resorts Worldwide, Inc. | 44,300 | | 2,789,128 |
| | 3,755,728 |
FINANCIALS - 15.0% |
Real Estate Investment Trusts - 14.8% |
Acadia Realty Trust (SBI) | 94,200 | | 2,169,426 |
Alexandria Real Estate Equities, Inc. | 50,600 | | 4,358,178 |
AMB Property Corp. (SBI) | 17,700 | | 943,056 |
American Financial Realty Trust (SBI) | 222,100 | | 1,947,817 |
Annaly Capital Management, Inc. | 595,600 | | 8,606,420 |
Anworth Mortgage Asset Corp. | 414,300 | | 3,272,970 |
AvalonBay Communities, Inc. | 25,000 | | 2,699,250 |
Boston Properties, Inc. | 11,500 | | 1,086,635 |
Capital Lease Funding, Inc. | 225,700 | | 2,092,239 |
CBRE Realty Finance, Inc. | 30,000 | | 278,100 |
Corporate Office Properties Trust (SBI) | 9,800 | | 369,362 |
Cousins Properties, Inc. | 25,300 | | 650,463 |
Cypress Sharpridge Investments, Inc. (d) | 335,000 | | 3,015,000 |
DCT Industrial Trust, Inc. | 188,000 | | 1,842,400 |
Developers Diversified Realty Corp. | 69,600 | | 3,340,800 |
EastGroup Properties, Inc. | 4,700 | | 193,828 |
Education Realty Trust, Inc. | 32,300 | | 424,745 |
Equity Lifestyle Properties, Inc. | 55,430 | | 2,514,305 |
Equity Residential (SBI) | 61,100 | | 2,432,391 |
Federal Realty Investment Trust (SBI) | 5,000 | | 375,700 |
General Growth Properties, Inc. | 66,940 | | 3,211,781 |
GMH Communities Trust | 80,900 | | 679,560 |
Health Care Property Investors, Inc. | 108,600 | | 2,958,264 |
Hersha Hospitality Trust | 112,900 | | 1,185,450 |
Host Hotels & Resorts, Inc. | 52,949 | | 1,118,283 |
Inland Real Estate Corp. | 201,800 | | 3,051,216 |
Kilroy Realty Corp. | 9,900 | | 637,857 |
Kimco Realty Corp. | 33,200 | | 1,239,356 |
LTC Properties, Inc. | 25,000 | | 501,750 |
MFA Mortgage Investments, Inc. | 462,400 | | 3,246,048 |
National Retail Properties, Inc. | 15,000 | | 324,900 |
Nationwide Health Properties, Inc. | 68,600 | | 1,634,738 |
Newcastle Investment Corp. | 100,200 | | 1,804,602 |
Common Stocks - continued |
| Shares | | Value |
FINANCIALS - continued |
Real Estate Investment Trusts - continued |
Potlatch Corp. | 17,100 | | $ 747,099 |
ProLogis Trust | 12,966 | | 737,765 |
Quadra Realty Trust, Inc. | 53,900 | | 478,093 |
Simon Property Group, Inc. | 7,804 | | 675,280 |
Spirit Finance Corp. | 229,200 | | 3,330,276 |
Strategic Hotel & Resorts, Inc. | 28,200 | | 600,096 |
UDR, Inc. | 43,900 | | 1,013,651 |
Ventas, Inc. | 43,800 | | 1,428,756 |
Vornado Realty Trust | 28,700 | | 3,071,761 |
| | 76,289,667 |
Real Estate Management & Development - 0.1% |
Meruelo Maddux Properties, Inc. | 103,600 | | 664,076 |
Thrifts & Mortgage Finance - 0.1% |
BFC Financial Corp. Class A (a) | 50,000 | | 156,500 |
TOTAL FINANCIALS | | 77,110,243 |
HEALTH CARE - 1.3% |
Health Care Providers & Services - 1.3% |
Capital Senior Living Corp. (a) | 173,000 | | 1,532,780 |
Emeritus Corp. (a) | 141,900 | | 3,476,550 |
Sun Healthcare Group, Inc. (a) | 130,000 | | 1,757,600 |
| | 6,766,930 |
TOTAL COMMON STOCKS (Cost $83,556,725) | 87,632,901 |
Preferred Stocks - 21.2% |
| | | |
Convertible Preferred Stocks - 1.0% |
FINANCIALS - 1.0% |
Real Estate Investment Trusts - 1.0% |
Annaly Capital Management, Inc. Series B, 6.00% | 20,000 | | 590,140 |
Crescent Real Estate Equities Co. Series A, 6.75% | 17,700 | | 445,155 |
Health Care REIT, Inc. 7.50% | 73,000 | | 2,033,050 |
HRPT Properties Trust 6.50% | 80,000 | | 1,800,480 |
Lexington Corporate Properties Trust Series C 6.50% | 2,800 | | 126,840 |
| | 4,995,665 |
Preferred Stocks - continued |
| Shares | | Value |
Nonconvertible Preferred Stocks - 20.2% |
CONSUMER DISCRETIONARY - 0.0% |
Hotels, Restaurants & Leisure - 0.0% |
Hilton Hotels Corp. 8.00% | 4,800 | | $ 119,280 |
FINANCIALS - 20.2% |
Diversified Financial Services - 0.6% |
DRA CRT Acquisition Corp. Series A, 8.50% | 25,000 | | 582,500 |
Red Lion Hotels Capital Trust 9.50% | 87,750 | | 2,270,093 |
| | 2,852,593 |
Real Estate Investment Trusts - 18.6% |
Accredited Mortgage Loan Trust Series A, 9.75% | 248,395 | | 3,850,123 |
Alexandria Real Estate Equities, Inc. Series C, 8.375% | 65,000 | | 1,654,250 |
American Home Mortgage Investment Corp.: | | | |
Series A, 9.375% | 120,300 | | 421,050 |
Series B, 9.25% | 124,100 | | 415,735 |
Annaly Capital Management, Inc. Series A, 7.875% | 182,900 | | 4,572,500 |
Anthracite Capital, Inc. Series C, 9.375% | 46,000 | | 924,600 |
Anworth Mortgage Asset Corp. Series A, 8.625% | 229,327 | | 5,136,925 |
Apartment Investment & Management Co.: | | | |
Series G, 9.375% | 66,600 | | 1,696,302 |
Series T, 8.00% | 57,500 | | 1,437,500 |
Ashford Hospitality Trust, Inc. Series A, 8.55% | 95,000 | | 2,382,600 |
Capital Lease Funding, Inc. Series A, 8.125% | 2,000 | | 49,800 |
Cedar Shopping Centers, Inc. 8.875% | 89,500 | | 2,286,725 |
CenterPoint Properties Trust Series D, 5.377% | 3,575 | | 2,967,250 |
Colonial Properties Trust (depositary shares) Series D, 8.125% | 28,500 | | 710,505 |
Cousins Properties, Inc. Series A, 7.75% | 81,700 | | 2,103,775 |
Crescent Real Estate Equities Co. Series B, 9.50% | 33,900 | | 861,060 |
Developers Diversified Realty Corp. (depositary shares)
Series G, 8.00% | 20,000 | | 504,200 |
Digital Realty Trust, Inc. Series A, 8.50% | 89,700 | | 2,291,835 |
Duke Realty LP (depositary shares) Series B, 7.99% | 74,700 | | 3,749,940 |
Eagle Hospitality Properties Trust, Inc. Series A, 8.25% | 24,000 | | 456,000 |
EastGroup Properties, Inc. Series D, 7.95% | 103,900 | | 2,545,550 |
Equity Inns, Inc. Series B, 8.75% | 35,300 | | 767,775 |
Glimcher Realty Trust Series F, 8.75% | 32,000 | | 793,600 |
Gramercy Capital Corp. Series A, 8.125% | 20,000 | | 450,000 |
Highwoods Properties, Inc. Series A, 8.625% | 214 | | 220,420 |
HomeBanc Mortgage Corp., Series A, 10.00% | 111,085 | | 777,595 |
Hospitality Properties Trust: | | | |
Series B, 8.875% | 67,975 | | 1,706,173 |
Preferred Stocks - continued |
| Shares | | Value |
Nonconvertible Preferred Stocks - continued |
FINANCIALS - continued |
Real Estate Investment Trusts - continued |
Hospitality Properties Trust: - continued | | | |
Series C, 7.00% | 55,000 | | $ 1,223,750 |
Host Hotels & Resorts, Inc. Series E, 8.875% | 50,000 | | 1,285,500 |
HRPT Properties Trust Series B, 8.75% | 41,200 | | 1,025,880 |
Innkeepers USA Trust Series C, 8.00% | 52,400 | | 995,600 |
LaSalle Hotel Properties Series B, 8.375% | 19,400 | | 488,880 |
LBA Realty Fund II: | | | |
Series A, 8.75% (a)(d) | 69,000 | | 3,139,500 |
Series B, 7.625% (a) | 31,240 | | 609,180 |
Lexington Corporate Properties Trust Series B, 8.05% | 44,500 | | 1,092,030 |
Lexington Realty Trust 7.55% | 40,000 | | 924,000 |
MFA Mortgage Investments, Inc. Series A, 8.50% | 274,400 | | 6,645,968 |
Mid-America Apartment Communities, Inc. Series H, 8.30% | 27,800 | | 694,166 |
Nationwide Health Properties, Inc. 7.677% | 39,539 | | 3,934,131 |
Newcastle Investment Corp.: | | | |
Series B, 9.75% | 199,700 | | 4,413,370 |
Series D, 8.375% | 51,300 | | 1,267,110 |
NorthStar Realty Finance Corp. Series A 8.75% | 900 | | 17,055 |
Omega Healthcare Investors, Inc. Series D, 8.375% | 79,800 | | 1,995,000 |
Prime Group Realty Trust Series B, 9.00% | 50,300 | | 780,153 |
ProLogis Trust Series C, 8.54% | 6,478 | | 362,768 |
RAIT Financial Trust: | | | |
Series A, 7.75% | 24,200 | | 276,364 |
Series B, 8.375% | 81,300 | | 947,145 |
Realty Income Corp. 8.25% | 76,800 | | 1,950,720 |
Saul Centers, Inc. 8.00% | 113,300 | | 2,832,500 |
Simon Property Group, Inc.: | | | |
Series G, 7.89% | 29,600 | | 1,481,480 |
Series J, 8.375% | 9,100 | | 609,700 |
Strategic Hotel & Resorts, Inc. 8.50% (d) | 119,500 | | 2,930,140 |
The Mills Corp.: | | | |
Series B, 9.00% | 40,120 | | 1,043,120 |
Series C, 9.00% | 157,300 | | 4,089,800 |
Series E, 8.75% | 101,020 | | 2,626,520 |
Series G, 7.875% | 20,767 | | 539,942 |
| | 95,955,260 |
Real Estate Management & Development - 0.4% |
Affordable Residential Communties, Inc. Series A, 8.25% | 89,900 | | 2,090,175 |
Preferred Stocks - continued |
| Shares | | Value |
Nonconvertible Preferred Stocks - continued |
FINANCIALS - continued |
Thrifts & Mortgage Finance - 0.6% |
Fannie Mae 7.00% | 20,000 | | $ 1,067,000 |
MFH Financial Trust I 9.50% (a)(d) | 22,660 | | 2,266,000 |
| | 3,333,000 |
TOTAL FINANCIALS | | 104,231,028 |
TOTAL NONCONVERTIBLE PREFERRED STOCKS | | 104,350,308 |
TOTAL PREFERRED STOCKS (Cost $123,638,398) | 109,345,973 |
Corporate Bonds - 35.4% |
| Principal
Amount (c) | | |
Convertible Bonds - 2.7% |
FINANCIALS - 2.7% |
Real Estate Investment Trusts - 2.5% |
American Financial Realty Trust 4.375% 7/15/24 | $ 10,250,000 | | 9,788,740 |
BioMed Realty LP 4.5% 10/1/26 (d) | 1,000,000 | | 920,000 |
Ventas, Inc. 3.875% 11/15/11 (d) | 1,500,000 | | 1,461,600 |
Washington Real Estate Investment Trust 3.875% 9/15/26 | 750,000 | | 693,675 |
| | 12,864,015 |
Real Estate Management & Development - 0.2% |
ERP Operating LP 3.85% 8/15/26 | 1,000,000 | | 962,440 |
TOTAL FINANCIALS | | 13,826,455 |
Nonconvertible Bonds - 32.7% |
CONSUMER DISCRETIONARY - 6.0% |
Hotels, Restaurants & Leisure - 0.6% |
FelCor Lodging LP 9% 6/1/11 (e) | 1,500,000 | | 1,560,000 |
Host Marriott LP 7% 8/15/12 | 2,000,000 | | 1,965,000 |
| | 3,525,000 |
Household Durables - 5.4% |
Beazer Homes USA, Inc.: | | | |
8.125% 6/15/16 | 1,000,000 | | 810,000 |
Corporate Bonds - continued |
| Principal
Amount (c) | | Value |
Nonconvertible Bonds - continued |
CONSUMER DISCRETIONARY - continued |
Household Durables - continued |
Beazer Homes USA, Inc.: - continued | | | |
8.375% 4/15/12 | $ 1,000,000 | | $ 810,000 |
D.R. Horton, Inc. 4.875% 1/15/10 | 1,000,000 | | 947,500 |
K. Hovnanian Enterprises, Inc.: | | | |
6% 1/15/10 | 420,000 | | 348,600 |
6.25% 1/15/16 | 1,000,000 | | 760,000 |
7.5% 5/15/16 | 1,000,000 | | 810,000 |
7.75% 5/15/13 | 4,000,000 | | 3,040,000 |
KB Home: | | | |
5.875% 1/15/15 | 2,000,000 | | 1,600,000 |
6.25% 6/15/15 | 3,500,000 | | 2,905,000 |
7.75% 2/1/10 | 1,500,000 | | 1,451,250 |
Kimball Hill, Inc. 10.5% 12/15/12 | 5,225,000 | | 4,180,000 |
M/I Homes, Inc. 6.875% 4/1/12 | 1,400,000 | | 1,211,000 |
Meritage Homes Corp. 6.25% 3/15/15 | 2,500,000 | | 1,975,000 |
Standard Pacific Corp.: | | | |
6.5% 8/15/10 | 500,000 | | 470,000 |
9.25% 4/15/12 | 2,000,000 | | 1,680,000 |
Stanley-Martin Communities LLC 9.75% 8/15/15 | 4,620,000 | | 3,418,800 |
WCI Communities, Inc.: | | | |
7.875% 10/1/13 | 500,000 | | 390,000 |
9.125% 5/1/12 | 1,250,000 | | 1,012,500 |
| | 27,819,650 |
TOTAL CONSUMER DISCRETIONARY | | 31,344,650 |
CONSUMER STAPLES - 0.3% |
Food & Staples Retailing - 0.3% |
Ahold Lease Series 2001 A1 pass thru trust certificates
7.82% 1/2/20 | 1,425,527 | | 1,546,697 |
FINANCIALS - 25.5% |
Diversified Financial Services - 0.1% |
Prime Property Funding, Inc. 5.7% 4/15/17 (d) | 500,000 | | 494,156 |
Real Estate Investment Trusts - 21.8% |
AMB Property LP 3.5% 3/1/09 | 2,000,000 | | 1,941,838 |
Archstone-Smith Trust 5% 8/15/07 | 1,020,000 | | 1,019,822 |
Corporate Bonds - continued |
| Principal
Amount (c) | | Value |
Nonconvertible Bonds - continued |
FINANCIALS - continued |
Real Estate Investment Trusts - continued |
Arden Realty LP: | | | |
5.2% 9/1/11 | $ 740,000 | | $ 737,050 |
5.25% 3/1/15 | 400,000 | | 388,706 |
7% 11/15/07 | 1,000,000 | | 1,004,294 |
8.5% 11/15/10 | 1,000,000 | | 1,100,670 |
AvalonBay Communities, Inc. 5.5% 1/15/12 | 1,000,000 | | 997,288 |
Bay Apartment Communities, Inc. 6.625% 1/15/08 | 840,000 | | 843,394 |
Brandywine Operating Partnership LP 4.5% 11/1/09 | 1,000,000 | | 978,470 |
BRE Properties, Inc. 5.75% 9/1/09 | 1,800,000 | | 1,804,745 |
Camden Property Trust: | | | |
4.375% 1/15/10 | 2,370,000 | | 2,306,712 |
4.7% 7/15/09 | 500,000 | | 493,023 |
Commercial Net Lease Realty, Inc.: | | | |
6.15% 12/15/15 | 100,000 | | 99,846 |
6.25% 6/15/14 | 500,000 | | 505,962 |
Crescent Real Estate Equities LP/Crescent Finance Co.
9.25% 4/15/09 | 2,500,000 | | 2,525,000 |
Developers Diversified Realty Corp.: | | | |
5% 5/3/10 | 1,000,000 | | 984,809 |
6.625% 1/15/08 | 550,000 | | 552,136 |
7.5% 7/15/18 | 200,000 | | 217,335 |
Duke Realty LP: | | | |
5.25% 1/15/10 | 200,000 | | 198,754 |
6.8% 2/12/09 | 1,500,000 | | 1,530,755 |
Federal Realty Investment Trust 6.125% 11/15/07 | 1,200,000 | | 1,201,135 |
Health Care Property Investors, Inc.: | | | |
6% 3/1/15 | 500,000 | | 489,032 |
6% 1/30/17 | 1,000,000 | | 973,238 |
6.3% 9/15/16 | 4,500,000 | | 4,476,501 |
Health Care REIT, Inc.: | | | |
6% 11/15/13 | 1,000,000 | | 993,010 |
6.2% 6/1/16 | 1,500,000 | | 1,485,455 |
7.5% 8/15/07 | 450,000 | | 450,216 |
8% 9/12/12 | 2,450,000 | | 2,662,535 |
Healthcare Realty Trust, Inc. 8.125% 5/1/11 | 1,790,000 | | 1,930,193 |
Highwoods/Forsyth LP: | | | |
5.85% 3/15/17 | 1,000,000 | | 940,000 |
7.125% 2/1/08 | 950,000 | | 955,216 |
HMB Capital Trust V 8.99% 12/15/36 (d)(e) | 2,530,000 | | 657,800 |
Corporate Bonds - continued |
| Principal
Amount (c) | | Value |
Nonconvertible Bonds - continued |
FINANCIALS - continued |
Real Estate Investment Trusts - continued |
Hospitality Properties Trust: | | | |
5.625% 3/15/17 | $ 915,000 | | $ 874,457 |
6.75% 2/15/13 | 610,000 | | 630,464 |
Host Hotels & Resorts LP 6.875% 11/1/14 | 1,000,000 | | 957,500 |
HRPT Properties Trust: | | | |
5.96% 3/16/11 (e) | 787,000 | | 786,696 |
6.25% 6/15/17 | 870,000 | | 875,117 |
6.5% 1/15/13 | 200,000 | | 206,396 |
iStar Financial, Inc.: | | | |
5.125% 4/1/11 | 1,000,000 | | 943,670 |
5.47% 3/16/09 (e) | 500,000 | | 502,526 |
5.7% 9/15/09 (e) | 1,000,000 | | 1,001,660 |
6.5% 12/15/13 | 1,000,000 | | 957,500 |
7% 3/15/08 | 1,800,000 | | 1,800,000 |
Kimco Realty Corp. 6.875% 2/10/09 | 1,000,000 | | 1,017,872 |
Liberty Property LP 7.25% 8/15/07 | 1,500,000 | | 1,500,522 |
Mack-Cali Realty LP 7.25% 3/15/09 | 180,000 | | 184,499 |
Nationwide Health Properties, Inc.: | | | |
6% 5/20/15 | 1,000,000 | | 994,844 |
6.5% 7/15/11 | 1,500,000 | | 1,541,693 |
8.25% 7/1/12 | 1,300,000 | | 1,407,866 |
Omega Healthcare Investors, Inc. 7% 4/1/14 | 3,970,000 | | 3,751,650 |
ProLogis Trust 7.1% 4/15/08 | 775,000 | | 779,290 |
Reckson Operating Partnership LP 7.75% 3/15/09 | 2,600,000 | | 2,695,584 |
Rouse Co.: | | | |
5.375% 11/26/13 | 2,000,000 | | 1,839,638 |
7.2% 9/15/12 | 3,220,000 | | 3,337,382 |
Rouse Co. LP/TRC, Inc. 6.75% 5/1/13 (d) | 500,000 | | 481,250 |
Security Capital Industrial Trust 7.95% 5/15/08 | 32,000 | | 32,212 |
Senior Housing Properties Trust: | | | |
7.875% 4/15/15 | 355,000 | | 361,213 |
8.625% 1/15/12 | 6,050,000 | | 6,337,375 |
Shurgard Storage Centers, Inc.: | | | |
5.875% 3/15/13 | 1,000,000 | | 1,020,690 |
7.75% 2/22/11 | 500,000 | | 539,046 |
Simon Property Group LP: | | | |
5% 3/1/12 | 1,000,000 | | 974,839 |
5.375% 8/28/08 | 550,000 | | 546,520 |
Simon Property Group, Inc. 3.75% 1/30/09 | 500,000 | | 487,913 |
Corporate Bonds - continued |
| Principal
Amount (c) | | Value |
Nonconvertible Bonds - continued |
FINANCIALS - continued |
Real Estate Investment Trusts - continued |
Tanger Properties LP 9.125% 2/15/08 | $ 300,000 | | $ 306,000 |
Thornburg Mortgage, Inc. 8% 5/15/13 | 6,995,000 | | 6,715,200 |
Trustreet Properties, Inc. 7.5% 4/1/15 | 3,500,000 | | 3,753,750 |
UDR, Inc. 5.5% 4/1/14 | 500,000 | | 495,380 |
United Dominion Realty Trust, Inc.: | | | |
4.5% 3/3/08 | 2,250,000 | | 2,237,897 |
5% 1/15/12 | 1,000,000 | | 987,011 |
5.13% 1/15/14 | 500,000 | | 484,101 |
6.05% 6/1/13 | 2,500,000 | | 2,541,893 |
6.5% 6/15/09 | 325,000 | | 333,329 |
Ventas Realty LP: | | | |
6.5% 6/1/16 | 2,730,000 | | 2,521,838 |
6.625% 10/15/14 | 3,920,000 | | 3,704,400 |
6.75% 6/1/10 | 2,100,000 | | 2,084,250 |
6.75% 4/1/17 | 2,000,000 | | 1,870,000 |
8.75% 5/1/09 | 800,000 | | 816,000 |
9% 5/1/12 | 5,511,000 | | 5,814,105 |
Vornado Realty LP 4.5% 8/15/09 | 1,000,000 | | 981,820 |
| | 112,459,798 |
Real Estate Management & Development - 2.9% |
American Real Estate Partners/American Real Estate
Finance Corp.: | | | |
7.125% 2/15/13 | 1,000,000 | | 915,000 |
8.125% 6/1/12 | 3,190,000 | | 3,062,400 |
Colonial Realty LP 6.05% 9/1/16 | 1,000,000 | | 962,830 |
ERP Operating LP 5.2% 4/1/13 | 1,000,000 | | 970,995 |
First Industrial LP: | | | |
5.25% 6/15/09 | 1,000,000 | | 993,679 |
7.375% 3/15/11 | 2,100,000 | | 2,219,379 |
Post Apartment Homes LP: | | | |
5.125% 10/12/11 | 2,500,000 | | 2,440,500 |
7.7% 12/20/10 | 2,500,000 | | 2,668,975 |
Price Development Co. LP 7.29% 3/11/08 | 550,000 | | 552,063 |
| | 14,785,821 |
Thrifts & Mortgage Finance - 0.7% |
Wrightwood Capital LLC 9% 6/1/14 (g) | 4,000,000 | | 3,900,000 |
TOTAL FINANCIALS | | 131,639,775 |
Corporate Bonds - continued |
| Principal
Amount (c) | | Value |
Nonconvertible Bonds - continued |
HEALTH CARE - 0.4% |
Health Care Providers & Services - 0.4% |
Sun Healthcare Group, Inc. 9.125% 4/15/15 (d) | $ 2,150,000 | | $ 2,133,875 |
TELECOMMUNICATION SERVICES - 0.5% |
Wireless Telecommunication Services - 0.5% |
American Tower Corp. 7.125% 10/15/12 | 2,500,000 | | 2,537,500 |
TOTAL NONCONVERTIBLE BONDS | | 169,202,497 |
TOTAL CORPORATE BONDS (Cost $191,669,901) | 183,028,952 |
Asset-Backed Securities - 4.6% |
|
American Tower Trust I Series 2007-1A Class D, 5.9568% 4/15/37 (d) | 3,000,000 | | 2,828,320 |
Ameriquest Mortgage Securities, Inc. Series 2004-R9 Class M9, 7.82% 10/25/34 (d)(e) | 2,000,000 | | 1,800,000 |
Capital Trust RE CDO Ltd. Series 2005-1A Class D, 6.82% 3/20/50 (d)(e) | 2,250,000 | | 2,127,600 |
Concord Real Estate CDO Ltd./LLC Series 2006-1A Class F, 7.07% 12/25/46 (d)(e) | 750,000 | | 670,042 |
Conseco Finance Securitizations Corp. Series 2002-2 Class M2, 9.163% 3/1/33 | 500,000 | | 452,058 |
Crest Clarendon Street Ltd./Crest Clarendon Corp. Series 2002-1A Class D, 9% 12/28/35 (d) | 500,000 | | 527,985 |
Crest Dartmouth Street Ltd./Crest Dartmouth Street Corp. Series 2003-1A Class D, 9% 6/28/38 (d) | 850,000 | | 889,101 |
Crown Castle Towers LLC/Crown Atlantic Holdings
Sub LLC/Crown Communication, Inc. Series 2005-1 Class D, 5.612% 6/15/35 (d) | 2,000,000 | | 1,951,083 |
Fairfield Street Solar Corp. Series 2004-1A Class E1, 8.725% 11/28/39 (d)(e) | 550,000 | | 539,802 |
Gramercy Real Estate CDO Ltd. Series 2005-1A Class H, 7.36% 7/25/35 (d)(e) | 2,000,000 | | 1,921,903 |
Green Tree Financial Corp. Series 1996-4 Class M1, 7.75% 6/15/27 | 1,788,179 | | 1,519,952 |
GSR Mortgage Loan Trust Series 2005-HE3 Class B3, 7.82% 6/25/35 (e)(g) | 1,259,000 | | 440,650 |
Asset-Backed Securities - continued |
| Principal
Amount (c) | | Value |
Guggenheim Structured Real Estate Funding Ltd./Guggenheim Structured Real Estate Funding LLC Series 2005-2A: | | | | |
Class D, 6.87% 8/26/30 (d)(e) | $ 735,000 | | $ 733,677 |
Class E, 7.32% 8/26/30 (d)(e) | 1,420,000 | | 1,418,296 |
Merit Securities Corp. Series 13 Class M1, 8.63% 12/28/33 | 1,923,000 | | 1,682,625 |
Park Place Securities NIMS Trust Series 2004-WCW1, 5.65% 9/25/34 (d) | 56,719 | | 53,883 |
Park Place Securities, Inc. Series 2004-WHQ2
Class M10, 7.82% 2/25/35 (d)(e) | 1,500,000 | | 1,263,759 |
Taberna Preferred Funding III Ltd. Series 2005-3A
Class D, 8.0056% 2/5/36 (d)(e) | 3,000,000 | | 2,775,000 |
Wrightwood Capital Real Estate CDO Ltd. Series 2005-1A Class F, 7.31% 11/21/40 (d)(e) | 250,000 | | 240,303 |
TOTAL ASSET-BACKED SECURITIES (Cost $25,622,289) | 23,836,039 |
Collateralized Mortgage Obligations - 3.9% |
|
Private Sponsor - 3.7% |
Countrywide Home Loans, Inc.: | | | | |
Series 2002-38 Class B3, 5% 2/25/18 (d) | 189,647 | | 172,818 |
Series 2002-R2 Class 2B3, 6.3616% 7/25/33 (d)(e) | 261,840 | | 165,933 |
Series 2003-40 Class B3, 4.5% 10/25/18 (d) | 240,812 | | 210,038 |
Series 2003-R2 Class B3, 5.5% 5/25/43 (d) | 570,490 | | 291,659 |
Series 2003-R3: | | | | |
Class B2, 5.5% 11/25/33 (d) | 1,800,463 | | 1,079,498 |
Class B3, 5.5% 11/25/33 (d) | 539,117 | | 179,043 |
Series 2004-R1 Class 1B3, 5.5% 11/25/34 (d)(e) | 594,792 | | 143,334 |
Diversified REIT Trust: | | | | |
Series 1999-1A Class H, 6.78% 3/18/11 (d)(e) | 1,785,000 | | 1,759,545 |
Series 2000-1A: | | | | |
Class F, 6.971% 3/8/10 (d) | 1,512,000 | | 1,547,772 |
Class G, 6.971% 3/8/10 (d) | 1,720,000 | | 1,740,069 |
RESI Finance LP/RESI Finance DE Corp. floater: | | | | |
Series 2003-B Class B9, 17.27% 7/10/35 (d)(e) | 924,646 | | 987,060 |
Series 2004-C Class B5, 6.67% 9/10/36 (d)(e) | 383,546 | | 387,381 |
Series 2005-A Class B6, 7.32% 3/10/37 (d)(e) | 1,930,290 | | 1,930,290 |
Series 2005-B Class B6, 6.92% 6/10/37 (d)(e) | 959,226 | | 971,217 |
Series 2005-D Class B6, 7.57% 12/15/37 (d)(e) | 484,352 | | 486,774 |
Series 2006-B Class B6, 7.02% 6/15/38 (d)(e) | 992,925 | | 992,925 |
Collateralized Mortgage Obligations - continued |
| Principal
Amount (c) | | Value |
Private Sponsor - continued |
Residential Funding Mortgage Securities I, Inc.
Series 2002-S20 Class M3, 5.25% 12/25/17 | $ 77,389 | | $ 75,365 |
Residential Funding Securities Corp. Series 2002-RM1 Class BI1, 5.5% 12/25/17 (d) | 160,379 | | 156,528 |
RESIX Finance Ltd. floater: | | | | |
Series 2003-D Class B8, 11.82% 12/10/35 (d)(e) | 698,968 | | 726,927 |
Series 2004-A Class B7, 9.57% 2/10/36 (d)(e) | 663,857 | | 683,773 |
Series 2004-B Class B7, 9.32% 2/10/36 (d)(e) | 797,699 | | 809,665 |
Series 2005-C Class B7, 8.42% 9/10/37 (d)(e) | 1,947,950 | | 1,952,820 |
Series 2006-B Class B7, 9.17% 7/15/38 (d)(e) | 992,925 | | 992,925 |
Series 2007-A Class BB, 8.67% 2/15/39 (d)(e) | 796,840 | | 792,856 |
TOTAL PRIVATE SPONSOR | 19,236,215 |
U.S. Government Agency - 0.2% |
Fannie Mae REMIC Trust: | | | | |
Series 2001-W3 subordinate REMIC pass thru certificates, Class B3, 7% 9/25/41 (g) | 262,987 | | 199,449 |
Series 2002-W1 subordinate REMIC pass thru certificates, Class 3B3, 6.1331% 2/25/42 (d)(e) | 159,039 | | 105,761 |
Series 2003-W1 subordinate REMIC pass thru certificates, Class B3, 5.75% 12/25/42 (g) | 322,906 | | 206,031 |
Series 2003-W10 subordinate REMIC pass thru certificates, Class 2B3, 6.1789% 6/25/43 (e) | 187,703 | | 113,898 |
Series 2003-W4 subordinate REMIC pass thru certificates, Class 2B3, 6.4447% 10/25/42 (d)(e) | 80,844 | | 49,861 |
TOTAL U.S. GOVERNMENT AGENCY | 675,000 |
TOTAL COLLATERALIZED MORTGAGE OBLIGATIONS (Cost $21,296,618) | 19,911,215 |
Commercial Mortgage Securities - 8.1% |
|
Asset Securitization Corp. Series 1997-D4 Class B2, 7.525% 4/14/29 | 515,000 | | 550,072 |
Banc of America Commercial Mortgage, Inc.
Series 2003-2: | | | | |
Class BWF, 7.55% 10/11/37 (d) | 502,372 | | 556,641 |
Class BWG, 8.155% 10/11/37 (d) | 486,885 | | 554,401 |
Class BWK, 10.676% 10/11/37 (d) | 330,075 | | 417,993 |
Class BWL, 10.1596% 10/11/37 (d) | 556,578 | | 690,269 |
Commercial Mortgage Securities - continued |
| Principal
Amount (c) | | Value |
Banc of America Large Loan, Inc. floater Series 2005-MIB1 Class K, 7.32% 3/15/22 (d)(e) | | $ 700,000 | | $ 698,456 |
Credit Suisse First Boston Mortgage Securities Corp.: | | | | |
Series 1997-C2 Class F, 7.46% 1/17/35 (e) | | 2,000,000 | | 2,117,652 |
Series 2004-TF2A Class AX, 0% 11/15/19 (d)(e)(f) | | 4,742,624 | | 0 |
Crest Ltd. Series 2001-1A Class C, 9% 2/25/34 (d) | | 1,000,000 | | 1,133,477 |
First Chicago/Lennar Trust I weighted average coupon Series 1997-CHL1 Class E, 8.0514% 4/29/39 (d)(e) | | 1,533,414 | | 1,406,684 |
Global Signal Trust III Series 2006-1 Class F, 7.036% 2/15/36 | | 1,015,000 | | 1,021,560 |
Global Towers Partners Acquisition Partners I LLC Series 2007-1A Class G, 7.8737% 5/15/37 (d) | | 1,000,000 | | 995,603 |
GMAC Commercial Mortgage Securities, Inc.: | | | | |
Series 1997-C2 Class F, 6.75% 4/15/29 (e) | | 2,767,000 | | 2,842,228 |
Series 1999-C3 Class J, 6.974% 8/15/36 (d) | | 1,500,000 | | 1,482,656 |
Series 2000-C1 Class K, 7% 3/15/33 (d) | | 1,100,000 | | 1,020,766 |
Series 2003-J10 Class B2, 6.75% 4/15/29 (e) | | 1,000,000 | | 982,500 |
GS Mortgage Securities Corp. II floater Series 2007-EOP Class L, 6.62% 3/1/20 (d)(e) | | 1,400,000 | | 1,386,000 |
J.P. Morgan Commercial Mortgage Finance Corp.: | | | | |
Series 1997-C5 Class F, 7.5605% 9/15/29 | | 2,000,000 | | 2,149,858 |
Series 1999-C7 Class F, 6% 10/15/35 (d) | | 350,000 | | 352,557 |
Series 1999-C8: | | | | |
Class G, 6% 7/15/31 (d) | | 1,385,000 | | 1,369,197 |
Class H, 6% 7/15/31 (d) | | 2,638,000 | | 2,455,820 |
JPMorgan Chase Commercial Mortgage Securities Corp. Series 2001-A: | | | | |
Class G, 6% 10/15/32 (d)(e) | | 2,895,000 | | 2,837,563 |
Class X, 1.8752% 10/15/32 (d)(e)(f) | | 19,580,393 | | 420,293 |
Merrill Lynch Financial Asset, Inc. Series 2005-CA16: | | | | |
Class F, 4.384% 7/12/15 | CAD | 710,000 | | 563,083 |
Class G, 4.384% 7/12/15 | CAD | 355,000 | | 272,739 |
Class H, 4.384% 7/12/15 | CAD | 236,000 | | 160,496 |
Class J, 4.384% 7/12/15 | CAD | 355,000 | | 223,661 |
Class K, 4.384% 7/12/15 | CAD | 355,000 | | 210,590 |
Class L, 4.384% 7/12/15 | CAD | 236,000 | | 131,923 |
Class M, 4.384% 7/12/15 | CAD | 995,000 | | 390,134 |
Merrill Lynch Mortgage Investors, Inc. Series 1999-C1 Class G, 6.71% 11/15/31 (d) | | 3,359,000 | | 3,089,239 |
Mezz Capital Commercial Mortgage Trust Series 2004-C1: | | | | |
Class D, 6.988% 9/15/13 | | 750,000 | | 748,613 |
Class E, 7.983% 10/15/13 | | 1,453,000 | | 1,482,231 |
Commercial Mortgage Securities - continued |
| Principal
Amount (c) | | Value |
Mezz Capital Commercial Mortgage Trust
Series 2004-C1: - continued | | | | |
Class X, 8.0091% 1/15/18 (e)(f) | | $ 6,888,328 | | $ 2,206,687 |
SBA CMBS Trust Series 2006-1A Class J, 7.825% 11/15/36 (d) | | 1,000,000 | | 987,188 |
TimberStar Trust I Series 2006-1 Class F, 7.5296% 10/15/36 (d) | | 2,000,000 | | 1,974,766 |
Wachovia Ltd./Wachovia LLC Series 2006-1 Class 1Ml, 10.86% 9/25/26 (d)(e) | | 2,000,000 | | 1,903,702 |
TOTAL COMMERCIAL MORTGAGE SECURITIES (Cost $40,069,243) | 41,787,298 |
Floating Rate Loans - 3.5% |
|
CONSUMER DISCRETIONARY - 0.8% |
Hotels, Restaurants & Leisure - 0.1% |
Intrawest Resorts term loan 7.34% 10/25/07 (e) | | 446,792 | | 428,920 |
Landry's Seafood Restaurants, Inc. term loan 7.0805% 12/28/10 (e) | | 264,463 | | 259,174 |
| | 688,094 |
Specialty Retail - 0.7% |
The Pep Boys - Manny, Moe & Jack term loan 7.36% 10/27/13 (e) | | 60,094 | | 57,690 |
Toys 'R' US, Inc. term loan 8.32% 12/9/08 (e) | | 3,600,000 | | 3,600,000 |
| | 3,657,690 |
TOTAL CONSUMER DISCRETIONARY | | 4,345,784 |
CONSUMER STAPLES - 0.3% |
Food & Staples Retailing - 0.3% |
Cumberland Farms, Inc. term loan 7.3648% 9/29/13 (e) | | 1,487,506 | | 1,435,444 |
FINANCIALS - 2.1% |
Diversified Financial Services - 0.9% |
LandSource Communities Development LLC: | | | | |
Tranche 2LN, term loan 9.86% 2/27/14 (e) | | 2,880,000 | | 2,620,800 |
Tranche B 1LN, term loan 8.1147% 2/27/13 (e) | | 1,970,100 | | 1,832,193 |
| | 4,452,993 |
Floating Rate Loans - continued |
| Principal
Amount (c) | | Value |
FINANCIALS - continued |
Real Estate Investment Trusts - 0.6% |
Apartment Investment & Management Co. term loan 6.86% 3/22/11 (e) | | $ 2,200,000 | | $ 2,145,000 |
Capital Automotive (REIT) Tranche B, term loan 7.07% 12/16/10 (e) | | 593,026 | | 569,305 |
General Growth Properties, Inc. Tranche A1, term loan 6.57% 2/24/10 (e) | | 697,368 | | 667,730 |
| | 3,382,035 |
Real Estate Management & Development - 0.3% |
MDS Realty Holdings LLC Tranche M3, term loan 8.82% 1/8/08 (e) | | 365,238 | | 365,238 |
Realogy Corp.: | | | | |
Tranche B, term loan 8.36% 10/10/13 (e) | | 787,879 | | 728,788 |
8.32% 10/10/13 (e) | | 212,121 | | 196,212 |
Tishman Speyer Properties term loan 7.07% 12/27/12 (e) | | 210,000 | | 201,600 |
| | 1,491,838 |
Thrifts & Mortgage Finance - 0.3% |
Charter Municipal Mortgage Acceptance Co. term loan 7.86% 8/15/12 (e) | | 1,488,750 | | 1,369,650 |
TOTAL FINANCIALS | | 10,696,516 |
HEALTH CARE - 0.3% |
Health Care Providers & Services - 0.3% |
HealthSouth Corp. term loan 7.86% 3/10/13 (e) | | 1,719,410 | | 1,650,633 |
TELECOMMUNICATION SERVICES - 0.0% |
Wireless Telecommunication Services - 0.0% |
Crown Castle International Corp. Tranche B, term loan 6.838% 3/6/14 (e) | | 169,575 | | 159,401 |
TOTAL FLOATING RATE LOANS (Cost $19,146,115) | 18,287,778 |
Preferred Securities - 0.8% |
| | Principal
Amount (c) | | Value |
FINANCIALS - 0.8% |
Diversified Financial Services - 0.8% |
Cairn High Grade ABS CDO PLC Series 2006-2A Class SUB, 1/13/47 (d) | | $ 1,000,000 | | $ 650,000 |
Crest Clarendon Street 2002-1 Ltd. Series 2002-1A Class PS, 12/28/35 (d) | | 500,000 | | 494,729 |
Crest Dartmouth Street 2003 1 Ltd. Series 2003-1A Class PS, 6/28/38 (d) | | 590,000 | | 662,745 |
Harp High Grade CDO I Ltd. Series 2006-1, 7/8/46 (d) | | 810,000 | | 550,800 |
Ipswich Street CDO Series 2006-1, 6/27/46 (d) | | 1,350,000 | | 1,012,500 |
Kent Funding III Ltd. 11/5/47 (d) | | 1,650,000 | | 660,000 |
| | | 4,030,774 |
TOTAL PREFERRED SECURITIES (Cost $5,665,694) | | 4,030,774 |
Money Market Funds - 4.9% |
| | Shares | | |
Fidelity Cash Central Fund, 5.38% (b)
(Cost $25,355,745) | | 25,355,745 | | 25,355,745 |
TOTAL INVESTMENT PORTFOLIO - 99.4% (Cost $536,020,728) | | | 513,216,675 |
NET OTHER ASSETS - 0.6% | | | 3,050,950 |
NET ASSETS - 100% | | $ 516,267,625 |
Currency Abbreviation |
CAD | - | Canadian dollar |
Legend |
(a) Non-income producing |
(b) Affiliated fund that is available only to investment companies and other accounts managed by Fidelity Investments. The rate quoted is the annualized seven-day yield of the fund at period end. A complete unaudited listing of the fund's holdings as of its most recent quarter end is available upon request. |
(c) Principal amount is stated in United States dollars unless otherwise noted. |
(d) Security exempt from registration under Rule 144A of the Securities Act of 1933. These securities may be resold in transactions exempt from registration, normally to qualified institutional buyers. At the end of the period, the value of these securities amounted to $86,320,592 or 16.7% of net assets. |
(e) The coupon rate shown on floating or adjustable rate securities represents the rate at period end. |
(f) Security represents right to receive monthly interest payments on an underlying pool of mortgages or assets. Principal shown is the outstanding par amount of the pool held as of the end of the period. |
(g) Restricted securities - Investment in securities not registered under the Securities Act of 1933 (excluding 144A issues). At the end of the period, the value of restricted securities (excluding 144A issues) amounted to $4,746,130 or 0.9% of net assets. |
Additional information on each holding is as follows: |
Security | Acquisition
Date | Acquisition Cost |
Fannie Mae
REMIC Trust:
Series 2001-W3 subordinate REMIC pass thru certificates,
Class B3, 7% 9/25/41 | 5/21/03 | $ 222,864 |
Series 2003-W1 subordinate REMIC pass thru certificates,
Class B3, 5.75% 12/25/42 | 3/25/03 | $ 239,053 |
GSR Mortgage Loan Trust Series 2005-HE3 Class B3, 7.82% 6/25/35 | 6/3/05 | $ 1,110,697 |
Wrightwood Capital LLC 9% 6/1/14 | 1/1/05 | $ 4,000,000 |
Affiliated Central Funds |
Information regarding fiscal year to date income earned by the Fund from investments in Fidelity Central Funds is as follows: |
Fund | Income earned |
Fidelity Cash Central Fund | $ 1,141,003 |
Fidelity Ultra-Short Central Fund | 1,098,138 |
Total | $ 2,239,141 |
Additional information regarding the Fund's fiscal year to date purchases and sales, including the ownership percentage, of the non Money Market Central Funds is as follows: |
Fund | Value, beginning of period | Purchases | Sales
Proceeds | Value, end of period | % ownership, end of period |
Fidelity Ultra-Short Central Fund | $ 19,983,940 | $ - | $ 19,706,720 | $ - | 0.0% |
Other Information |
The composition of credit quality ratings as a percentage of net assets is as follows (ratings are unaudited): |
U.S.Government and U.S.Government Agency Obligations | 0.2% |
AAA,AA,A | 3.2% |
BBB | 17.9% |
BB | 19.5% |
B | 7.0% |
CCC,CC,C | 2.0% |
Not Rated | 6.5% |
Equities | 38.2% |
Short-Term Investments and Net Other Assets | 5.5% |
| 100% |
We have used ratings from Moody's® Investors Services, Inc. Where Moody's ratings are not available, we have used S&P® ratings. |
See accompanying notes which are an integral part of the financial statements.
Annual Report
Financial Statements
Statement of Assets and Liabilities
| July 31, 2007 |
| | |
Assets | | |
Investment in securities, at value -
See accompanying schedule: Unaffiliated issuers (cost $510,664,983) | $ 487,860,930 | |
Fidelity Central Funds (cost $25,355,745) | 25,355,745 | |
Total Investments (cost $536,020,728) | | $ 513,216,675 |
Cash | | 170,078 |
Receivable for investments sold | | 4,100,755 |
Receivable for fund shares sold | | 1,576,482 |
Dividends receivable | | 228,529 |
Interest receivable | | 4,053,491 |
Distributions receivable from Fidelity Central Funds | | 143,848 |
Prepaid expenses | | 969 |
Other receivables | | 147,211 |
Total assets | | 523,638,038 |
| | |
Liabilities | | |
Payable for investments purchased | $ 2,325,795 | |
Payable for fund shares redeemed | 4,581,217 | |
Accrued management fee | 260,409 | |
Other affiliated payables | 142,015 | |
Other payables and accrued expenses | 60,977 | |
Total liabilities | | 7,370,413 |
| | |
Net Assets | | $ 516,267,625 |
Net Assets consist of: | | |
Paid in capital | | $ 516,248,430 |
Undistributed net investment income | | 8,186,585 |
Accumulated undistributed net realized gain (loss) on investments and foreign currency transactions | | 14,636,815 |
Net unrealized appreciation (depreciation) on investments and assets and liabilities in foreign currencies | | (22,804,205) |
Net Assets, for 45,999,566 shares outstanding | | $ 516,267,625 |
Net Asset Value, offering price and redemption price per share ($516,267,625 ÷ 45,999,566 shares) | | $ 11.22 |
See accompanying notes which are an integral part of the financial statements.
Annual Report
Statement of Operations
| Year ended July 31, 2007 |
| | |
Investment Income | | |
Dividends | | $ 13,848,678 |
Interest | | 21,996,281 |
Income from Fidelity Central Funds | | 2,239,141 |
Total income | | 38,084,100 |
| | |
Expenses | | |
Management fee | $ 3,470,716 | |
Transfer agent fees | 1,468,805 | |
Accounting fees and expenses | 283,509 | |
Custodian fees and expenses | 18,125 | |
Independent trustees' compensation | 2,017 | |
Registration fees | 56,274 | |
Audit | 112,390 | |
Legal | 12,267 | |
Miscellaneous | 10,900 | |
Total expenses before reductions | 5,435,003 | |
Expense reductions | (30,073) | 5,404,930 |
Net investment income (loss) | | 32,679,170 |
Realized and Unrealized Gain (Loss) Net realized gain (loss) on: | | |
Investment securities: | | |
Unaffiliated issuers | 16,329,788 | |
Fidelity Central Funds | (288,769) | |
Foreign currency transactions | (2,272) | |
Capital Gain distributions from Fidelity Central Funds | 2,812 | |
Total net realized gain (loss) | | 16,041,559 |
Change in net unrealized appreciation (depreciation) on: Investment securities | (32,410,356) | |
Assets and liabilities in foreign currencies | (115) | |
Total change in net unrealized appreciation (depreciation) | | (32,410,471) |
Net gain (loss) | | (16,368,912) |
Net increase (decrease) in net assets resulting from operations | | $ 16,310,258 |
See accompanying notes which are an integral part of the financial statements.
Annual Report
Financial Statements - continued
Statement of Changes in Net Assets
| Year ended
July 31,
2007 | Year ended
July 31,
2006 |
Increase (Decrease) in Net Assets | | |
Operations | | |
Net investment income (loss) | $ 32,679,170 | $ 33,001,424 |
Net realized gain (loss) | 16,041,559 | 19,669,354 |
Change in net unrealized appreciation (depreciation) | (32,410,471) | (26,604,573) |
Net increase (decrease) in net assets resulting
from operations | 16,310,258 | 26,066,205 |
Distributions to shareholders from net investment income | (30,097,730) | (33,588,262) |
Distributions to shareholders from net realized gain | (12,079,504) | (14,457,481) |
Total distributions | (42,177,234) | (48,045,743) |
Share transactions
Proceeds from sales of shares | 234,666,945 | 146,568,380 |
Reinvestment of distributions | 36,245,899 | 41,687,679 |
Cost of shares redeemed | (250,130,676) | (312,491,302) |
Net increase (decrease) in net assets resulting from share transactions | 20,782,168 | (124,235,243) |
Redemption fees | 87,744 | 76,862 |
Total increase (decrease) in net assets | (4,997,064) | (146,137,919) |
| | |
Net Assets | | |
Beginning of period | 521,264,689 | 667,402,608 |
End of period (including undistributed net investment income of $8,186,585 and undistributed net investment income of $6,570,783, respectively) | $ 516,267,625 | $ 521,264,689 |
Other Information Shares | | |
Sold | 19,631,419 | 12,465,060 |
Issued in reinvestment of distributions | 3,063,466 | 3,575,296 |
Redeemed | (20,928,409) | (26,652,681) |
Net increase (decrease) | 1,766,476 | (10,612,325) |
See accompanying notes which are an integral part of the financial statements.
Annual Report
Financial Highlights
Years ended July 31, | 2007 | 2006 | 2005 | 2004 | 2003 G |
Selected Per-Share Data | | | | | |
Net asset value,
beginning of period | $ 11.78 | $ 12.17 | $ 11.49 | $ 10.91 | $ 10.00 |
Income from Investment Operations | | | | | |
Net investment income (loss) D | .63 | .66 | .60 | .59 | .27 |
Net realized and unrealized gain (loss) | (.37) | (.11) | .83 | .60 | .71 |
Total from investment operations | .26 | .55 | 1.43 | 1.19 | .98 |
Distributions from net investment income | (.58) | (.67) | (.57) | (.55) | (.07) |
Distributions from net realized gain | (.24) | (.27) | (.18) | (.07) | - |
Total distributions | (.82) | (.94) | (.75) | (.62) | (.07) |
Redemption fees added to paid
in capital D | - I | - I | - I | .01 | - I |
Net asset value,
end of period | $ 11.22 | $ 11.78 | $ 12.17 | $ 11.49 | $ 10.91 |
Total Return B, C | 2.00% | 4.82% | 12.90% | 11.31% | 9.83% |
Ratios to Average Net Assets E, H | | | | | |
Expenses before reductions | .88% | .85% | .85% | .85% | .97% A |
Expenses net of fee waivers,
if any | .88% | .85% | .85% | .85% | .97% A |
Expenses net of all reductions | .88% | .85% | .85% | .85% | .94% A |
Net investment income (loss) | 5.30% | 5.61% | 5.13% | 5.25% | 5.10% A |
Supplemental Data | | | | | |
Net assets, end of period
(000 omitted) | $ 516,268 | $ 521,265 | $ 667,403 | $ 422,551 | $ 228,545 |
Portfolio turnover rate F | 45% | 27% | 30% | 61% | 41% A |
A Annualized
B Total returns for periods of less than one year are not annualized.
C Total returns would have been lower had certain expenses not been reduced during the periods shown.
D Calculated based on average shares outstanding during the period.
E Fees and expenses of the underlying Fidelity Central Funds are not included in the Fund's expense ratio. The Fund indirectly bears its proportionate share of the expenses of any underlying Fidelity Central Funds.
F Amount does not include the portfolio activity of any underlying Fidelity Central Funds.
G For the period February 4, 2003 (commencement of operations) to July 31, 2003.
H Expense ratios reflect operating expenses of the Fund. Expenses before reductions do not reflect amounts reimbursed by the investment adviser or reductions from brokerage service arrangements or other expense offset arrangements and do not represent the amount paid by the Fund during periods when reimbursements or reductions occur. Expense ratios before reductions for start-up periods may not be representative of longer term operating periods. Expenses net of fee waivers reflect expenses after reimbursement by the investment adviser but prior to reductions from brokerage service arrangements or other expense offset arrangements. Expenses net of all reductions represent the net expenses paid by the Fund.
I Amount represents less than $.01 per share.
See accompanying notes which are an integral part of the financial statements.
Annual Report
Notes to Financial Statements
For the period ended July 31, 2007
1. Organization.
Fidelity Real Estate Income Fund (the Fund) is a fund of Fidelity Securities Fund (the trust) and is authorized to issue an unlimited number of shares. The trust is registered under the Investment Company Act of 1940, as amended (the 1940 Act), as an open-end management investment company organized as a Massachusetts business trust.
2. Investments in Fidelity Central Funds.
The Fund may invest in Fidelity Central Funds which are open-end investment companies available only to other investment companies and accounts managed by Fidelity Management & Research Company (FMR) and its affiliates. The Fund's Schedule of Investments lists each of the Fidelity Central Funds as an investment of the Fund, but does not include the underlying holdings of each Fidelity Central Fund. As an Investing Fund, the Fund indirectly bears its proportionate share of the expenses of the underlying Fidelity Central Funds.
Based on their investment objective, each Fidelity Central Fund may invest or participate in various investment vehicles or strategies that are similar to those of the Fund. These strategies are consistent with the investment objectives of the Fund and may involve certain economic risks which may cause a decline in value of each of the Fidelity Central Funds and thus a decline in the value of the Fund. The Money Market Central Funds seek preservation of capital and current income and are managed by Fidelity Investments Money Management, Inc. (FIMM), an affiliate of FMR. The following summarizes the Fund's investment in each Fidelity Central Fund.
Fidelity Central Fund | Investment Manager | Investment Objective | Investment Practices |
Fidelity Ultra-Short Central Fund | FIMM | Seeks to obtain a high level of current income consistent with preservation of capital by investing in U.S. dollar denominated money market and investment-grade debt securities. | Delayed Delivery &
When Issued Securities Futures Mortgage Dollar Rolls Repurchase Agreements Restricted Securities Swap Agreements |
A holdings listing for the Fund, which presents direct holdings as well as the pro rata share of any securities and other investments held indirectly through its investment in underlying non-money market Fidelity Central Funds, is available at fidelity.com. A complete list of holdings for each Fidelity Central Fund is available upon request or at the SEC's web site at www.sec.gov. In addition, the financial statements of the Fidelity Central Funds, which are not covered by the Fund's Report of Independent Registered Public Accounting Firm, are available on the SEC's web site or upon request.
Annual Report
3. Significant Accounting Policies.
The financial statements have been prepared in conformity with accounting principles generally accepted in the United States of America, which require management to make certain estimates and assumptions at the date of the financial statements. The following summarizes the significant accounting policies of the Fund:
Security Valuation. Investments are valued and net asset value (NAV) per share is calculated (NAV calculation) as of the close of business of the New York Stock Exchange (NYSE), normally 4:00 p.m. Eastern time. Wherever possible, the Fund uses independent pricing services approved by the Board of Trustees to value its investments.
Equity securities, including restricted securities, for which market quotations are readily available, are valued at the last reported sale price or official closing price as reported by an independent pricing service on the primary market or exchange on which they are traded. In the event there were no sales during the day or closing prices are not available, securities are valued at the last quoted bid price. Debt securities, including restricted securities, for which quotations are readily available, are valued by independent pricing services or by dealers who make markets in such securities. Pricing services consider yield or price of bonds of comparable quality, coupon, maturity and type as well as dealer supplied prices. Investments in open-end mutual funds, including the Fidelity Central Funds, are valued at their closing net asset value each business day. Short-term securities with remaining maturities of sixty days or less for which quotations are not readily available are valued at amortized cost, which approximates value.
When current market prices or quotations are not readily available or do not accurately reflect fair value, valuations may be determined in accordance with procedures adopted by the Board of Trustees. For example, when developments occur between the close of a market and the close of the NYSE that may materially affect the value of some or all of the securities, or when trading in a security is halted, those securities may be fair valued.
Factors used in the determination of fair value may include monitoring news to identify significant market or security specific events such as changes in the value of U.S. securities markets, reviewing developments in foreign markets and evaluating the performance of ADRs, futures contracts and exchange-traded funds. Because the Fund's utilization of fair value pricing depends on market activity, the frequency with which fair value pricing is used cannot be predicted and may be utilized to a significant extent. The value of securities used for NAV calculation under fair value pricing may differ from published prices for the same securities.
Foreign Currency. The Fund uses foreign currency contracts to facilitate transactions in foreign-denominated securities. Losses from these transactions may arise from changes in the value of the foreign currency or if the counterparties do not perform under the contracts' terms.
Annual Report
Notes to Financial Statements - continued
3. Significant Accounting Policies - continued
Foreign Currency - continued
Foreign-denominated assets, including investment securities, and liabilities are translated into U.S. dollars at the exchange rate at period end. Purchases and sales of investment securities, income and dividends received and expenses denominated in foreign currencies are translated into U.S. dollars at the exchange rate in effect on the transaction date.
The effects of exchange rate fluctuations on investments are included with the net realized and unrealized gain (loss) on investment securities. Other foreign currency transactions resulting in realized and unrealized gain (loss) are disclosed separately.
Investment Transactions and Income. For financial reporting purposes, the Fund's investment holdings and NAV include trades executed through the end of the last business day of the period. The NAV for processing shareholder transactions includes trades executed through the end of the prior business day. Gains and losses on securities sold are determined on the basis of identified cost. Dividend income is recorded on the ex-dividend date, except for certain dividends from foreign securities where the ex-dividend date may have passed, which are recorded as soon as the Fund is informed of the ex-dividend date. Non-cash dividends included in dividend income, if any, are recorded at the fair market value of the securities received. Distributions received on securities that represent a return of capital or capital gain are recorded as a reduction of cost of investments and/or as a realized gain. The Fund estimates the components of distributions received that may be considered return of capital distributions or capital gain distributions. Interest income and income distributions from the Fidelity Central Funds are accrued as earned. Interest income includes coupon interest and amortization of premium and accretion of discount on debt securities. The Fund follows the provisions of Emerging Issues Task Force Issue No. 99-20 (EITF 99-20), "Recognition of Interest Income and Impairment on Purchased and Retained Beneficial Interests in Securitized Financial Assets" for certain lower credit quality securitized assets that have contractual cash flows (for example, asset backed securities, collateralized mortgage obligations and commercial mortgage-backed securities). Under EITF 99-20, if there is a change in the estimated cash flows for any of these securities, based on an evaluation of current information, then the estimated yield is adjusted on a prospective basis over the remaining life of the security. Investment income is recorded net of foreign taxes withheld where recovery of such taxes is uncertain.
Expenses. Most expenses of the trust can be directly attributed to a fund. Expenses which cannot be directly attributed are apportioned among each Fund in the trust. Expense estimates are accrued in the period to which they relate and adjustments are made when actual amounts are known.
Annual Report
3. Significant Accounting Policies - continued
Income Tax Information and Distributions to Shareholders. Each year, the Fund intends to qualify as a regulated investment company by distributing all of its taxable income and realized gains under Subchapter M of the Internal Revenue Code. As a result, no provision for income taxes is required in the accompanying financial statements. Foreign taxes are provided for based on the Fund's understanding of the tax rules and rates that exist in the foreign markets in which it invests.
Distributions are recorded on the ex-dividend date. Income and capital gain distributions are determined in accordance with income tax regulations, which may differ from generally accepted accounting principles. In addition, the Fund will claim a portion of the payment made to redeeming shareholders as a distribution for income tax purposes.
Capital accounts within the financial statements are adjusted for permanent book-tax differences. These adjustments have no impact on net assets or the results of operations. Temporary book-tax differences will reverse in a subsequent period.
Book-tax differences are primarily due to the short-term gain distributions from the Fidelity Central Funds, foreign currency transactions, passive foreign investment companies (PFIC), market discount, and losses deferred due to wash sales.
The tax-basis components of distributable earnings and the federal tax cost as of period end were as follows:
Unrealized appreciation | $ 16,772,205 | |
Unrealized depreciation | (39,362,241) | |
Net unrealized appreciation (depreciation) | (22,590,036) | |
Undistributed ordinary income | 7,836,154 | |
Undistributed long-term capital gain | 9,951,538 | |
| | |
Cost for federal income tax purposes | $ 535,806,711 | |
The tax character of distributions paid was as follows:
| July 31, 2007 | July 31, 2006 |
Ordinary Income | $ 30,097,730 | $ 35,223,101 |
Long-term Capital Gains | 12,079,504 | 12,822,642 |
Total | $ 42,177,234 | $ 48,045,743 |
Short-Term Trading (Redemption) Fees. Shares held in the Fund less than 90 days are subject to a redemption fee equal to .75% of the proceeds of the redeemed shares. All redemption fees, including any estimated redemption fees paid by FMR, are retained by the Fund and accounted for as an addition to paid in capital.
Annual Report
Notes to Financial Statements - continued
3. Significant Accounting Policies - continued
New Accounting Pronouncements. In July 2006, Financial Accounting Standards Board Interpretation No. 48, Accounting for Uncertainty in Income Taxes - an interpretation of FASB Statement 109 (FIN 48), was issued and is effective on the last business day of the semiannual reporting period for fiscal years beginning after December 15, 2006. FIN 48 sets forth a threshold for financial statement recognition, measurement and disclosure of a tax position taken or expected to be taken on a tax return. Management has concluded that the adoption of FIN 48 will not result in a material impact on the Fund's net assets, results of operations and financial statement disclosures.
In addition, in September 2006, Statement of Financial Accounting Standards No. 157, Fair Value Measurements (SFAS 157), was issued and is effective for fiscal years beginning after November 15, 2007. SFAS 157 defines fair value, establishes a framework for measuring fair value and expands disclosures about fair value measurements. Management is currently evaluating the impact the adoption of SFAS 157 will have on the Fund's financial statement disclosures.
4. Operating Policies.
Repurchase Agreements. FMR has received an Exemptive Order from the Securities and Exchange Commission (the SEC) which permits the Fund and other affiliated entities of FMR to transfer uninvested cash balances into joint trading accounts which are then invested in repurchase agreements. The Fund may also invest directly with institutions in repurchase agreements. Repurchase agreements are collateralized by government or non-government securities. Upon settlement date, collateral is held in segregated accounts with custodian banks and may be obtained in the event of a default of the counterparty. The Fund monitors, on a daily basis, the value of the collateral to ensure it is at least equal to the principal amount of the repurchase agreement (including accrued interest). In the event of a default by the counterparty, realization of the collateral proceeds could be delayed, during which time the value of the collateral may decline.
Restricted Securities. The Fund may invest in securities that are subject to legal or contractual restrictions on resale. These securities generally may be resold in transactions exempt from registration or to the public if the securities are registered. Disposal of these securities may involve time-consuming negotiations and expense, and prompt sale at an acceptable price may be difficult. Information regarding restricted securities is included at the end of the Fund's Schedule of Investments.
Loans and Other Direct Debt Instruments. The Fund may invest in loans and loan participations, trade claims or other receivables. These investments may include standby financing commitments, including revolving credit facilities, that obligate the Fund to supply additional cash to the borrower on demand. Loan participations involve a risk of
Annual Report
4. Operating Policies - continued
Loans and Other Direct Debt Instruments - continued
insolvency of the lending bank or other financial intermediary. The Fund may be contractually obligated to receive approval from the agent bank and/or borrower prior to the sale of these investments.
5. Purchases and Sales of Investments.
Purchases and sales of securities, other than short-term securities, aggregated $262,240,105 and $262,194,481, respectively.
6. Fees and Other Transactions with Affiliates.
Management Fee. FMR and its affiliates provide the Fund with investment management related services for which the Fund pays a monthly management fee. The management fee is the sum of an individual fund fee rate that is based on an annual rate of .30% of the Fund's average net assets and a group fee rate that averaged ..26% during the period. The group fee rate is based upon the average net assets of all the mutual funds advised by FMR. The group fee rate decreases as assets under management increase and increases as assets under management decrease. For the period, the total annual management fee rate was .56% of the Fund's average net assets.
Transfer Agent Fees. Fidelity Service Company, Inc. (FSC), an affiliate of FMR, is the Fund's transfer, dividend disbursing and shareholder servicing agent. FSC receives account fees and asset-based fees that vary according to account size and type of account. FSC pays for typesetting, printing and mailing of shareholder reports, except proxy statements. For the period the transfer agent fees were equivalent to an annual rate of .24% of average net assets.
Accounting Fees. FSC maintains the Fund's accounting records. The fee is based on the level of average net assets for the month.
Brokerage Commissions. The Fund placed a portion of its portfolio transactions with brokerage firms which are affiliates of the investment adviser. The commissions paid to these affiliated firms were $2,331 for the period.
7. Committed Line of Credit.
The Fund participates with other funds managed by FMR in a $4.2 billion credit facility (the "line of credit") to be utilized for temporary or emergency purposes to fund shareholder redemptions or for other short-term liquidity purposes. The Fund has agreed to pay commitment fees on its pro rata portion of the line of credit, which amounted to $1,151 and is reflected in Miscellaneous Expense on the Statement of Operations. During the period, there were no borrowings on this line of credit.
Annual Report
Notes to Financial Statements - continued
8. Expense Reductions.
Many of the brokers with whom FMR places trades on behalf of the Fund provided services to the Fund in addition to trade execution. These services included payments of certain expenses on behalf of the Fund totaling $346 for the period. In addition, through arrangements with the Fund's custodian and transfer agent, credits realized as a result of uninvested cash balances were used to reduce the Fund's expenses. During the period, these credits reduced the Fund's custody and transfer agent expenses by $17,334 and $3,279, respectively.
9. Other.
The Fund's organizational documents provide former and current trustees and officers with a limited indemnification against liabilities arising in connection with the performance of their duties to the Fund. In the normal course of business, the Fund may also enter into contracts that provide general indemnifications. The Fund's maximum exposure under these arrangements is unknown as this would be dependent on future claims that may be made against the Fund. The risk of material loss from such claims is considered remote.
The United States Securities and Exchange Commission ("SEC") is conducting an investigation of FMR (covering the years 2002 to 2004) arising from gifts, gratuities and business entertainment provided by certain brokers to certain individuals who were employed on FMR's domestic equity trading desk during that period. FMR is in discussions with the SEC staff regarding the possible resolution of the matter, but as of period-end no final resolution has been reached.
In December 2006, the Independent Trustees completed their own investigation of the matter with the assistance of independent counsel. The Independent Trustees and FMR agree that, despite the absence of proof that the Fidelity mutual funds experienced diminished execution quality as a result of the improper receipt of gifts and business entertainment, the conduct at issue was serious and is worthy of redress. Accordingly, the Independent Trustees have requested and FMR has agreed to pay $42 million to Fidelity mutual funds, plus interest to be determined at the time that payment is made. A method of allocating this payment among the funds has not yet been determined. The total payment to the Fund is not anticipated to have a material impact on the Fund's net assets. In addition, FMR reimbursed related legal expenses which are recorded in the accompanying Statement of Operations as an expense reduction.
Annual Report
Report of Independent Registered Public Accounting Firm
To the Trustees of Fidelity Securities Fund and Shareholders of Fidelity Real Estate Income Fund:
We have audited the accompanying statement of assets and liabilities of Fidelity Real Estate Income Fund (the Fund), a fund of Fidelity Securities Fund, including the schedule of investments as of July 31, 2007, and the related statement of operations for the year then ended, the statement of changes in net assets for each of the two years in the period then ended, and the financial highlights for each of the four years in the period then ended and for the period from February 4, 2003 (commencement of operations) to July 31, 2003. These financial statements and financial highlights are the responsibility of the Fund's management. Our responsibility is to express an opinion on these financial statements and financial highlights based on our audits.
We conducted our audits in accordance with standards of the Public Company Accounting Oversight Board (United States). Those standards require that we plan and perform the audit to obtain reasonable assurance about whether the financial statements and financial highlights are free of material misstatement. The Fund is not required to have, nor were we engaged to perform, an audit of its internal control over financial reporting. Our audits included consideration of internal control over financial reporting as a basis for designing audit procedures that are appropriate in the circumstances, but not for the purpose of expressing an opinion on the effectiveness of the Fund's internal control over financial reporting. Accordingly, we express no such opinion. An audit also includes examining, on a test basis, evidence supporting the amounts and disclosures in the financial statements, assessing the accounting principles used and significant estimates made by management, as well as evaluating the overall financial statement presentation. Our procedures included confirmation of securities owned as of July 31, 2007, by correspondence with the custodians and brokers; where replies were not received from brokers, we performed other auditing procedures. We believe that our audits provide a reasonable basis for our opinion.
In our opinion, the financial statements and financial highlights referred to above present fairly, in all material respects, the financial position of Fidelity Real Estate Income Fund as of July 31, 2007, the results of its operations for the year then ended, the changes in its net assets for each of the two years in the period then ended, and its financial highlights for each of the four years in the period then ended and for the period from February 4, 2003 (commencement of operations) to July 31, 2003, in conformity with accounting principles generally accepted in the United States of America.
/s/ Deloitte & Touche LLP
DELOITTE & TOUCHE LLP
Boston, Massachusetts
September 17, 2007
Annual Report
Trustees and Officers
The Trustees, Members of the Advisory Board, and executive officers of the trust and fund, as applicable, are listed below. The Board of Trustees governs the fund and is responsible for protecting the interests of shareholders. The Trustees are experienced executives who meet periodically throughout the year to oversee the fund's activities, review contractual arrangements with companies that provide services to the fund, and review the fund's performance. Except for James C. Curvey, each of the Trustees oversees 353 funds advised by FMR or an affiliate. Mr. Curvey oversees 317 funds advised by FMR or an affiliate.
The Trustees hold office without limit in time except that (a) any Trustee may resign; (b) any Trustee may be removed by written instrument, signed by at least two-thirds of the number of Trustees prior to such removal; (c) any Trustee who requests to be retired or who has become incapacitated by illness or injury may be retired by written instrument signed by a majority of the other Trustees; and (d) any Trustee may be removed at any special meeting of shareholders by a two-thirds vote of the outstanding voting securities of the trust. Each Trustee who is not an interested person (as defined in the 1940 Act) (Independent Trustee), shall retire not later than the last day of the calendar year in which his or her 72nd birthday occurs. The Independent Trustees may waive this mandatory retirement age policy with respect to individual Trustees. The executive officers and Advisory Board Members hold office without limit in time, except that any officer and Advisory Board Member may resign or may be removed by a vote of a majority of the Trustees at any regular meeting or any special meeting of the Trustees. Except as indicated, each individual has held the office shown or other offices in the same company for the past five years.
The fund's Statement of Additional Information (SAI) includes more information about the Trustees. To request a free copy, call Fidelity at 1-800-544-8544.
Interested Trustees*:
Correspondence intended for each Trustee who is an interested person may be sent to Fidelity Investments, 82 Devonshire Street, Boston, Massachusetts 02109.
Name, Age; Principal Occupation |
Edward C. Johnson 3d (77) |
| Year of Election or Appointment: 1984 Mr. Johnson is Chairman of the Board of Trustees. Mr. Johnson serves as President (2006-present), Chief Executive Officer, Chairman, and a Director of FMR Corp.; Chairman and a Director of FMR; Chairman and a Director of Fidelity Research & Analysis Company (FRAC); Chairman and a Director of Fidelity Investments Money Management, Inc.; and Chairman (2001-present) and a Director of FMR Co., Inc. In addition, Mr. Johnson serves as Chairman and Director of Fidelity International Limited (FIL). |
James C. Curvey (72) |
| Year of Election or Appointment: 2007 Mr. Curvey also serves as Trustee (2007-present) or Member of the Advisory Board (2007-present) of other investment companies advised by FMR. Mr. Curvey is Vice Chairman (2006-present) and Director of FMR Corp. Mr. Curvey joined Fidelity in 1982 and served in numerous senior management positions, including President and Chief Operating Officer of FMR Corp. (1997-2000) and President of Fidelity Strategic Investments (2000-2002). In addition, he serves as a member of the Board of Directors of Geerlings & Wade, Inc. (wine distribution). |
* Trustees have been determined to be "Interested Trustees" by virtue of, among other things, their affiliation with the trust or various entities under common control with FMR.
Independent Trustees:
Correspondence intended for each Independent Trustee (that is, the Trustees other than the Interested Trustees) may be sent to Fidelity Investments, P.O. Box 55235, Boston, Massachusetts 02205-5235.
Name, Age; Principal Occupation |
Dennis J. Dirks (59) |
| Year of Election or Appointment: 2005 Prior to his retirement in May 2003, Mr. Dirks was Chief Operating Officer and a member of the Board of The Depository Trust & Clearing Corporation (DTCC) (1999-2003). He also served as President, Chief Operating Officer, and Board member of The Depository Trust Company (DTC) (1999-2003) and President and Board member of the National Securities Clearing Corporation (NSCC) (1999-2003). In addition, Mr. Dirks served as Chief Executive Officer and Board member of the Government Securities Clearing Corporation (2001-2003) and Chief Executive Officer and Board member of the Mortgage-Backed Securities Clearing Corporation (2001-2003). Mr. Dirks also serves as a Trustee and a member of the Finance Committee of Manhattan College (2005-present) and a Trustee and a member of the Finance Committee of AHRC of Nassau County (2006-present). |
Albert R. Gamper, Jr. (65) |
| Year of Election or Appointment: 2006 Prior to his retirement in December 2004, Mr. Gamper served as Chairman of the Board of CIT Group Inc. (commercial finance). During his tenure with CIT Group Inc. Mr. Gamper served in numerous senior management positions, including Chairman (1987-1989; 1999-2001; 2002-2004), Chief Executive Officer (1987-2004), and President (1989-2002). He currently serves as a member of the Board of Directors of Public Service Enterprise Group (utilities, 2001-present), Chairman of the Board of Governors, Rutgers University (2004-present), and Chairman of the Board of Saint Barnabas Health Care System. |
George H. Heilmeier (71) |
| Year of Election or Appointment: 2004 Dr. Heilmeier is Chairman Emeritus of Telcordia Technologies (communication software and systems), where prior to his retirement, he served as company Chairman and Chief Executive Officer. He currently serves on the Boards of Directors of The Mitre Corporation (systems engineering and information technology support for the government), and HRL Laboratories (private research and development, 2004-present). He is Chairman of the General Motors Science & Technology Advisory Board and a Life Fellow of the Institute of Electrical and Electronics Engineers (IEEE). Dr. Heilmeier is a member of the Defense Science Board and the National Security Agency Advisory Board. He is also a member of the National Academy of Engineering, the American Academy of Arts and Sciences, and the Board of Overseers of the School of Engineering and Applied Science of the University of Pennsylvania. Previously, Dr. Heilmeier served as a Director of TRW Inc. (automotive, space, defense, and information technology, 1992-2002), Compaq (1994-2002), Automatic Data Processing, Inc. (ADP) (technology-based business outsourcing, 1995-2002), INET Technologies Inc. (telecommunications network surveillance, 2001-2004), and Teletech Holdings (customer management services). He is the recipient of the 2005 Kyoto Prize in Advanced Technology for his invention of the liquid crystal display, and a member of the Consumer Electronics Hall of Fame. |
James H. Keyes (66) |
| Year of Election or Appointment: 2007 Prior to his retirement in 2003, Mr. Keyes was Chairman, President, and Chief Executive Officer of Johnson Controls, Inc. (automotive supplier, 1993-2003). He currently serves as a member of the boards of LSI Logic Corporation (semiconductor technologies), Navistar International Corporation (manufacture and sale of trucks, buses, and diesel engines, 2002-present), and Pitney Bowes, Inc. (integrated mail, messaging, and document management solutions). |
Marie L. Knowles (60) |
| Year of Election or Appointment: 2001 Prior to Ms. Knowles' retirement in June 2000, she served as Executive Vice President and Chief Financial Officer of Atlantic Richfield Company (ARCO) (diversified energy, 1996-2000). From 1993 to 1996, she was a Senior Vice President of ARCO and President of ARCO Transportation Company. She served as a Director of ARCO from 1996 to 1998. She currently serves as a Director of Phelps Dodge Corporation (copper mining and manufacturing) and McKesson Corporation (healthcare service, 2002-present). Ms. Knowles is a Trustee of the Brookings Institution and the Catalina Island Conservancy and also serves as a member of the Advisory Board for the School of Engineering of the University of Southern California. |
Ned C. Lautenbach (63) |
| Year of Election or Appointment: 2000 Mr. Lautenbach is Chairman of the Independent Trustees (2006-present). Mr. Lautenbach has been a partner of Clayton, Dubilier & Rice, Inc. (private equity investment firm) since September 1998. Previously, Mr. Lautenbach was with the International Business Machines Corporation (IBM) from 1968 until his retirement in 1998. Mr. Lautenbach serves as a Director of Sony Corporation (2006-present) and Eaton Corporation (diversified industrial) as well as the Philharmonic Center for the Arts in Naples, Florida. He also is a member of the Board of Trustees of Fairfield University (2005-present), as well as a member of the Council on Foreign Relations. |
Cornelia M. Small (63) |
| Year of Election or Appointment: 2005 Ms. Small is a member (2000-present) and Chairperson (2002-present) of the Investment Committee, and a member (2002-present) of the Board of Trustees of Smith College. Previously, she served as Chief Investment Officer (1999-2000), Director of Global Equity Investments (1996-1999), and a member of the Board of Directors of Scudder, Stevens & Clark (1990-1997) and Scudder Kemper Investments (1997-1999). In addition, Ms. Small served as Co-Chair (2000-2003) of the Annual Fund for the Fletcher School of Law and Diplomacy. |
William S. Stavropoulos (68) |
| Year of Election or Appointment: 2002 Mr. Stavropoulos is Chairman Emeritus of the Board of Directors of The Dow Chemical Company. Since joining The Dow Chemical Company in 1967, Mr. Stavropoulos served in numerous senior management positions, including President (1993-2000; 2002-2003), CEO (1995-2000; 2002-2004), and Chairman of the Executive Committee (2000-2004). Currently, he is a Director of NCR Corporation (data warehousing and technology solutions), Chemical Financial Corporation, Maersk Inc. (industrial conglomerate, 2002-present), Tyco International, Inc. (multinational manufacturing and services, 2007-present), and a member of the Advisory Board for Metalmark Capital (private equity investment firm, 2005-present). He is a special advisor to Clayton, Dubilier & Rice, Inc., a private equity investment firm. He also serves as a member of the Board of Trustees of the American Enterprise Institute for Public Policy Research. In addition, Mr. Stavropoulos is a member of The Business Council, J.P. Morgan International Council and the University of Notre Dame Advisory Council for the College of Science. |
Kenneth L. Wolfe (68) |
| Year of Election or Appointment: 2005 Prior to his retirement in 2001, Mr. Wolfe was Chairman and Chief Executive Officer of Hershey Foods Corporation (1993-2001). He currently serves as a member of the boards of Adelphia Communications Corporation (2003-present), Bausch & Lomb, Inc., and Revlon Inc. (2004-present). |
Advisory Board Members and Executive Officers:
Correspondence intended for Mr. Mauriello may be sent to Fidelity Investments, P.O. Box 55235, Boston, Massachusetts 02205-5235. Correspondence intended for each executive officer and Mr. Lynch may be sent to Fidelity Investments, 82 Devonshire Street, Boston, Massachusetts 02109.
Name, Age; Principal Occupation |
Peter S. Lynch (63) |
| Year of Election or Appointment: 2003 Member of the Advisory Board of Fidelity Securities Fund. Mr. Lynch is Vice Chairman and a Director of FMR, and Vice Chairman (2001-present) and a Director of FMR Co., Inc. Previously, Mr. Lynch served as a Trustee of the Fidelity funds (1990-2003). In addition, he serves as a Trustee of Boston College and as the Chairman of the Inner-City Scholarship Fund. |
Joseph Mauriello (62) |
| Year of Election or Appointment: 2007 Member of the Advisory Board of Fidelity Securities Fund. Prior to his retirement in January 2006, Mr. Mauriello served in numerous senior management positions including Deputy Chairman and Chief Operating Officer (2004-2005), and Vice Chairman of Financial Services (2002-2004) of KPMG LLP US (professional services firm, 1965-2005). Mr. Mauriello currently serves as a member of the Board of Directors of XL Capital Ltd., (global insurance and re-insurance company, 2006-present) and of Arcadia Resources Inc., (health care services and products, 2007-present). He also served as a Director of the Hamilton Funds of the Bank of New York (2006-2007). |
Kimberley H. Monasterio (43) |
| Year of Election or Appointment: 2007 President and Treasurer of Real Estate Income. Ms. Monasterio also serves as President and Treasurer of other Fidelity funds (2007-present) and is an employee of FMR (2004-present). Previously, Ms. Monasterio served as Deputy Treasurer of the Fidelity funds (2004-2006). Before joining Fidelity Investments, Ms. Monasterio served as Treasurer (2000-2004) and Chief Financial Officer (2002-2004) of the Franklin Templeton Funds and Senior Vice President of Franklin Templeton Services, LLC (2000-2004). |
Dwight D. Churchill (53) |
| Year of Election or Appointment: 2005 Vice President of Real Estate Income. Mr. Churchill also serves as Vice President of certain Equity Funds (2005-present). Mr. Churchill is Executive Vice President of FMR (2005-present) and FMR Co., Inc. (2005-present). Previously, Mr. Churchill served as Senior Vice President of Fidelity Investments Money Management, Inc. (2005-2006), Head of Fidelity's Fixed-Income Division (2000-2005), Vice President of Fidelity's Money Market Funds (2000-2005), Vice President of Fidelity's Bond Funds, and Senior Vice President of FMR. |
Mark P. Snyderman (50) |
| Year of Election or Appointment: 2003 Vice President of Real Estate Income. Mr. Snyderman also serves as Vice President of other funds advised by FMR. Prior to assuming his current responsibilities, Mr. Snyderman worked as an investment officer and portfolio manager. Mr. Snyderman also serves as Vice President of FMR and FMR Co., Inc. (2004). |
Eric D. Roiter (58) |
| Year of Election or Appointment: 2003 Secretary of Real Estate Income. He also serves as Secretary of other Fidelity funds; Vice President, General Counsel, and Secretary of FMR Co., Inc. (2001-present) and FMR; Assistant Secretary of Fidelity Management & Research (U.K.) Inc. (2001-present), Fidelity Research & Analysis Company (2001-present), and Fidelity Investments Money Management, Inc. (2001-present). Mr. Roiter is an Adjunct Member, Faculty of Law, at Boston College Law School (2003-present). Previously, Mr. Roiter served as Vice President and Secretary of Fidelity Distributors Corporation (FDC) (1998-2005). |
Scott C. Goebel (39) |
| Year of Election or Appointment: 2007 Assistant Secretary of Real Estate Income. Mr. Goebel also serves as Assistant Secretary of other Fidelity funds (2007-present), Vice President and Secretary of FDC (2006-present), and is an employee of FMR. |
R. Stephen Ganis (41) |
| Year of Election or Appointment: 2006 Anti-Money Laundering (AML) officer of Real Estate Income. Mr. Ganis also serves as AML officer of other Fidelity funds (2006-present) and FMR Corp. (2003-present). Before joining Fidelity Investments, Mr. Ganis practiced law at Goodwin Procter, LLP (2000-2002). |
Joseph B. Hollis (59) |
| Year of Election or Appointment: 2006 Chief Financial Officer of Real Estate Income. Mr. Hollis also serves as Chief Financial Officer of other Fidelity funds. Mr. Hollis is President of Fidelity Pricing and Cash Management Services (FPCMS) (2005-present). Mr. Hollis also serves as President and Director of Fidelity Service Company, Inc. (2006-present). Previously, Mr. Hollis served as Senior Vice President of Cash Management Services (1999-2002) and Investment Management Operations (2002-2005). |
Kenneth A. Rathgeber (60) |
| Year of Election or Appointment: 2004 Chief Compliance Officer of Real Estate Income. Mr. Rathgeber also serves as Chief Compliance Officer of other Fidelity funds (2004-present) and Executive Vice President of Risk Oversight for Fidelity Investments (2002-present). He is Chief Compliance Officer of FMR (2005-present), FMR Co., Inc. (2005-present), Fidelity Management & Research (U.K.) Inc. (2005-present), Fidelity Research & Analysis Company (2005-present), Fidelity Investments Money Management, Inc. (2005-present), and Strategic Advisers, Inc. (2005-present). Previously, Mr. Rathgeber served as Executive Vice President and Chief Operating Officer for Fidelity Investments Institutional Services Company, Inc. (1998-2002). |
Bryan A. Mehrmann (46) |
| Year of Election or Appointment: 2005 Deputy Treasurer of Real Estate Income. Mr. Mehrmann also serves as Deputy Treasurer of other Fidelity funds (2005-present) and is an employee of FMR. Previously, Mr. Mehrmann served as Vice President of Fidelity Investments Institutional Services Group (FIIS)/Fidelity Investments Institutional Operations Corporation, Inc. (FIIOC) Client Services (1998-2004). |
Kenneth B. Robins (37) |
| Year of Election or Appointment: 2005 Deputy Treasurer of Real Estate Income. Mr. Robins also serves as Deputy Treasurer of other Fidelity funds (2005-present) and is an employee of FMR (2004-present). Before joining Fidelity Investments, Mr. Robins worked at KPMG LLP, where he was a partner in KPMG's department of professional practice (2002-2004) and a Senior Manager (1999-2000). In addition, Mr. Robins served as Assistant Chief Accountant, United States Securities and Exchange Commission (2000-2002). |
Robert G. Byrnes (40) |
| Year of Election or Appointment: 2005 Assistant Treasurer of Real Estate Income. Mr. Byrnes also serves as Assistant Treasurer of other Fidelity funds (2005-present) and is an employee of FMR (2005-present). Previously, Mr. Byrnes served as Vice President of FPCMS (2003-2005). Before joining Fidelity Investments, Mr. Byrnes worked at Deutsche Asset Management where he served as Vice President of the Investment Operations Group (2000-2003). |
Peter L. Lydecker (53) |
| Year of Election or Appointment: 2004 Assistant Treasurer of Real Estate Income. Mr. Lydecker also serves as Assistant Treasurer of other Fidelity funds (2004) and is an employee of FMR. |
Gary W. Ryan (48) |
| Year of Election or Appointment: 2005 Assistant Treasurer of Real Estate Income. Mr. Ryan also serves as Assistant Treasurer of other Fidelity funds (2005-present) and is an employee of FMR (2005-present). Previously, Mr. Ryan served as Vice President of Fund Reporting in FPCMS (1999-2005). |
Annual Report
Distributions
The Board of Trustees of Fidelity Real Estate Income voted to pay on September 10, 2007, to shareholders of record at the opening of business on September 7, 2007, a distribution of $.24 per share derived from capital gains realized from sales of portfolio securities and a dividend of $.22 per share from net investment income.
The fund hereby designates as a capital gain dividend with respect to the taxable year ended July 31, 2007, $11,290,626, or, if subsequently determined to be different, the net capital gain of such year.
A total of 0.06% of the dividends distributed during the fiscal year was derived from interest on U.S. Government securities which is generally exempt from state income tax.
The fund will notify shareholders in January 2008 of amounts for use in preparing 2007 income tax returns.
Annual Report
Board Approval of Investment Advisory Contracts and Management Fees
Fidelity Real Estate Income Fund
Each year, typically in July, the Board of Trustees, including the Independent Trustees (together, the Board), votes on the renewal of the management contract and sub-advisory agreements (together, the Advisory Contracts) for the fund. The Board, assisted by the advice of fund counsel and Independent Trustees' counsel, requests and considers a broad range of information throughout the year.
The Board meets regularly each month except August and takes into account throughout the year matters bearing on Advisory Contracts. The Board, acting directly and through its separate committees, considers at each of its meetings factors that are relevant to the annual renewal of the fund's Advisory Contracts, including the services and support provided to the fund and its shareholders. At the time of the renewal, the Board had 12 standing committees, each composed of Independent Trustees with varying backgrounds, to which the Board has assigned specific subject matter responsibilities in order to enhance effective decision-making by the Board. Each committee has adopted a written charter outlining the structure and purposes of the committee. One such committee, the Equity Contract Committee, meets periodically as needed throughout the year to consider matters specifically related to the annual renewal of Advisory Contracts. The committee requests and receives information on, and makes recommendations to the Independent Trustees concerning, the approval and annual review of the Advisory Contracts.
At its July 2007 meeting, the Board of Trustees, including the Independent Trustees, unanimously determined to renew the Advisory Contracts for the fund. In reaching its determination, the Board considered all factors it believed relevant, including (i) the nature, extent, and quality of the services to be provided to the fund and its shareholders (including the investment performance of the fund); (ii) the competitiveness of the management fee and total expenses of the fund; (iii) the total costs of the services to be provided by and the profits to be realized by the investment adviser and its affiliates from the relationship with the fund; (iv) the extent to which economies of scale would be realized as the fund grows; and (v) whether fee levels reflect these economies of scale, if any, for the benefit of fund shareholders. The Board also approved amendments to the fund's agreements with foreign sub-advisers to clarify that each sub-adviser provides services as an independent contractor.
In determining whether to renew the Advisory Contracts for the fund, the Board ultimately reached a determination, with the assistance of fund counsel and Independent Trustees' counsel, that the renewal of the Advisory Contracts and the compensation to be received by Fidelity under the management contract is consistent with Fidelity's fiduciary duty under applicable law. In addition to evaluating the specific factors noted above, the Board, in reaching its determination, is aware that shareholders in the fund have a broad range of investment choices available to them, including a wide choice among mutual funds offered by competitors to Fidelity, and that the fund's shareholders, with the opportunity to review and weigh the disclosure provided by the fund in its prospectus and other public disclosures, have chosen to invest in this fund, managed by Fidelity.
Annual Report
Nature, Extent, and Quality of Services Provided. The Board considered staffing within the investment adviser, FMR, and the sub-advisers (together, the Investment Advisers), including the background of the fund's portfolio manager and the fund's investment objective and discipline. The Independent Trustees also had discussions with senior management of Fidelity's investment operations and investment groups. The Board considered the structure of the portfolio manager compensation program and whether this structure provides appropriate incentives.
Resources Dedicated to Investment Management and Support Services. The Board reviewed the size, education, and experience of the Investment Advisers' investment staff, their use of technology, and the Investment Advisers' approach to recruiting, training, and retaining portfolio managers and other research, advisory, and management personnel. The Board considered Fidelity's extensive global research capabilities that enable the Investment Advisers to aggregate data from various sources in an effort to produce positive investment results. The Board noted that Fidelity's analysts have access to a variety of technological tools that enable them to perform both fundamental and quantitative analysis and to specialize in various disciplines. The Board also considered that Fidelity's portfolio managers and analysts have access to daily portfolio attribution that allows for monitoring of a fund's portfolio, as well as an electronic communication system that provides immediate real-time access to research concerning issuers and credit enhancers.
Shareholder and Administrative Services. The Board considered (i) the nature, extent, quality, and cost of advisory, administrative, distribution, and shareholder services performed by the Investment Advisers and their affiliates under the Advisory Contracts and under separate agreements covering transfer agency, pricing and bookkeeping, and securities lending services for the fund; (ii) the nature and extent of the Investment Advisers' supervision of third party service providers, principally custodians and subcustodians; and (iii) the resources devoted to, and the record of compliance with, the fund's compliance policies and procedures. The Board reviewed the allocation of fund brokerage, including allocations to brokers affiliated with the Investment Advisers, the use of brokerage commissions to pay fund expenses, and the use of "soft" commission dollars to pay for research services. The Board also considered that Fidelity voluntarily pays for market data out of its own resources. The Board also considered the agreement reached between the Independent Trustees and Fidelity in December 2006 following an independent review of matters relating to receipt of travel, entertainment, gifts and gratuities in violation of Fidelity policies.
Annual Report
Board Approval of Investment Advisory Contracts and
Management Fees - continued
The Board noted that the growth of fund assets across the complex allows Fidelity to reinvest in the development of services designed to enhance the value or convenience of the Fidelity funds as investment vehicles. These services include 24-hour access to account information and market information through phone representatives and over the Internet, and investor education materials and asset allocation tools.
Investment in a Large Fund Family. The Board considered the benefits to shareholders of investing in a Fidelity fund, including the benefits of investing in a fund that is part of a large family of funds offering a variety of investment disciplines and providing for a large variety of mutual fund investor services. For example, fund shareholders are offered the privilege of exchanging shares of the fund for shares of other Fidelity funds, as set forth in the fund's prospectus, without paying a sales charge. The Board noted that, since the last Advisory Contract renewals in July 2006, Fidelity has taken a number of actions that benefited particular funds, including (i) dedicating additional resources to investment research and to restructure the investment research teams; (ii) contractually agreeing to reduce the management fee on Fidelity Advisor Floating Rate High Income Fund; (iii) contractually agreeing to reduce the management fees on Fidelity's California, Massachusetts, New Jersey, and New York AMT Tax-Free Money Market Funds, launching new Institutional Classes and Service Classes of these funds, and contractually agreeing to impose expense limitations on these funds; (iv) eliminating the exchange fee on the Fidelity Select Portfolios and reducing the pricing and bookkeeping fee rates for these funds; (v) reducing the maximum transfer agency fee rates on high income funds and certain equity funds; (vi) proposing amended management contracts that, if approved by shareholders, will add a performance adjustment component to the management fees paid by 18 Fidelity Advisor equity funds; (vii) contractually agreeing to reduce fees for Ultra-Short Central Fund and the money market Central Funds; (viii) waiving the Fidelity Advisor funds' contingent deferred sales charge on certain redemptions made through systematic withdrawal programs; and (ix) amending the management contracts for equity and fixed-income funds whose management contracts incorporate a "group fee" structure by adding four new fee "breakpoints" to the group fee rate schedules.
Investment Performance and Compliance. The Board considered whether the fund has operated within its investment objective, as well as its record of compliance with its investment restrictions. It also reviewed the fund's absolute investment performance, as well as the fund's relative investment performance measured against (i) a proprietary custom index, and (ii) a peer group of mutual funds over multiple periods. Because the fund had been in existence less than five calendar years, the following charts considered by the Board show, over the one- and three-year periods ended December 31, 2006, the fund's cumulative total returns, the cumulative total returns of a proprietary custom index ("benchmark"), and a range of cumulative total returns of a peer group of mutual funds identified by Lipper Inc. as having an investment objective similar to that of the fund. The box within each chart shows the 25th percentile return (bottom of box) and the 75th percentile return (top of box) of the peer group. Returns shown above the box are in the first quartile and returns shown below the box are in the fourth quartile. The percentage beaten number noted below each chart corresponds to the percentile box and represents the percentage of funds in the peer group whose performance was equal to or lower than that of the fund. The fund's proprietary custom index is an index developed by FMR that represents the performance of the fund's unmanaged indexes.
Annual Report
Fidelity Real Estate Income Fund
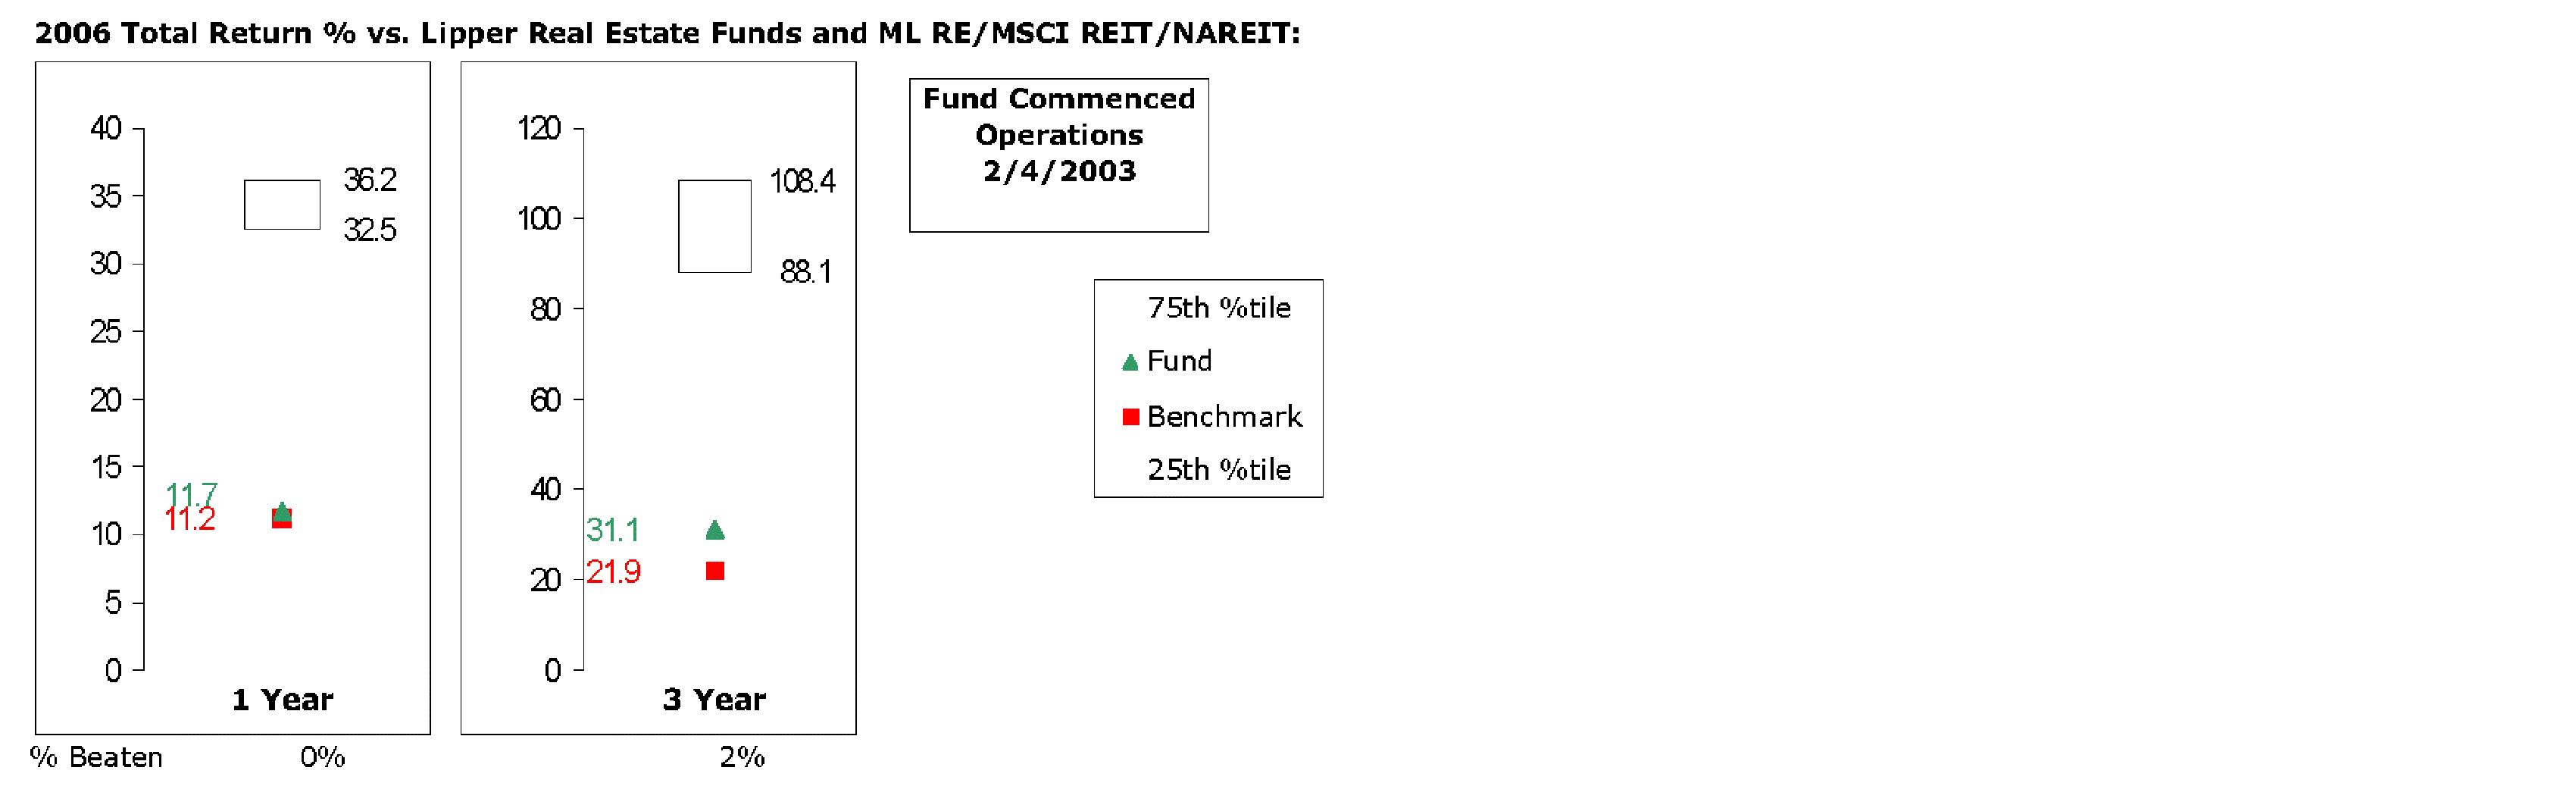
The Board reviewed the fund's relative investment performance against its peer group and stated that the performance of the fund was in the fourth quartile for all the periods shown. The Board noted that FMR does not consider that peer group to be a meaningful comparison for the fund, however, because unlike many of its peers, which invest primarily in common stocks of real estate companies, the fund invests primarily in common, preferred and debt securities of real estate entities. The Board also stated that the investment performance of the fund compared favorably to its benchmark for all the periods shown.
The Board considered that FMR has taken steps to refocus and strengthen equity research, equity portfolio management, and compliance.
Based on its review, and giving particular weight to the nature and quality of the resources dedicated by the Investment Advisers to maintain and improve relative performance, the Board concluded that the nature, extent, and quality of the services provided to the fund will benefit the fund's shareholders, particularly in light of the Board's view that the
Annual Report
Board Approval of Investment Advisory Contracts and
Management Fees - continued
fund's shareholders benefit from investing in a fund that is part of a large family of funds offering a variety of investment disciplines and services.
Competitiveness of Management Fee and Total Fund Expenses. The Board considered the fund's management fee and total expenses compared to "mapped groups" of competitive funds and classes. Fidelity creates "mapped groups" by combining similar Lipper investment objective categories that have comparable management fee characteristics. Combining Lipper investment objective categories aids the Board's management fee and total expense comparisons by broadening the competitive group used for comparison and by reducing the number of universes to which various Fidelity funds are compared. The Board also considered supplemental information about how the fund's management fee and total expenses ranked relative to groups based on Lipper classifications, which take into account a fund's market capitalization and style.
The Board considered two proprietary management fee comparisons for the 12-month (or shorter) periods shown in the chart below. The group of Lipper funds used by the Board for management fee comparisons is referred to below as the "Total Mapped Group" and, for the reasons explained above, is broader than the Lipper peer group used by the Board for performance comparisons. The Total Mapped Group comparison focuses on a fund's standing relative to the total universe of comparable funds available to investors, in terms of gross management fees before expense reimbursements or caps. "TMG %" represents the percentage of funds in the Total Mapped Group that had management fees that were lower than the fund's. For example, a TMG % of 10% means that 90% of the funds in the Total Mapped Group had higher management fees than the fund. The "Asset-Size Peer Group" (ASPG) comparison focuses on a fund's standing relative to non-Fidelity funds similar in size to the fund within the Total Mapped Group. The ASPG represents at least 15% of the funds in the Total Mapped Group with comparable asset size and management fee characteristics, subject to a minimum of 50 funds (or all funds in the Total Mapped Group if fewer than 50). Additional information, such as the ASPG quartile in which the fund's management fee ranked, is also included in the chart and considered by the Board.
Annual Report
Fidelity Real Estate Income Fund

The Board noted that the fund's management fee ranked below the median of its Total Mapped Group and below the median of its ASPG for 2006.
Based on its review, the Board concluded that the fund's management fee was fair and reasonable in light of the services that the fund receives and the other factors considered.
In its review of the fund's total expenses, the Board considered the fund's management fee as well as other fund expenses, such as transfer agent fees, pricing and bookkeeping fees, and custodial, legal, and audit fees. The Board also noted the effects of any waivers and reimbursements on fees and expenses. As part of its review, the Board also considered current and historical total expenses of the fund compared to competitive fund median expenses. The fund is compared to those funds and classes in the Total Mapped Group (used by the Board for management fee comparisons) that have a similar sales load structure.
The Board noted that the fund's total expenses ranked below its competitive median for 2006.
In its review of total expenses, the Board also considered Fidelity fee structures and other information on clients that FMR and its affiliates service in other competitive markets, such as other mutual funds advised or subadvised by FMR or its affiliates, pension plan clients, and other institutional clients.
Based on its review, the Board concluded that the fund's total expenses were reasonable in light of the services that the fund and its shareholders receive and the other factors considered.
Annual Report
Board Approval of Investment Advisory Contracts and
Management Fees - continued
Costs of the Services and Profitability. The Board considered the revenues earned and the expenses incurred by Fidelity in conducting the business of developing, marketing, distributing, managing, administering and servicing the fund and its shareholders. The Board also considered the level of Fidelity's profits in respect of all the Fidelity funds.
On an annual basis, FMR presents to the Board Fidelity's profitability for the fund. Fidelity calculates the profitability for each fund, as well as aggregate profitability for groups of Fidelity funds and all Fidelity funds, using a series of detailed revenue and cost allocation methodologies which originate with the audited books and records of Fidelity. The Audit Committee of the Board reviews any significant changes from the prior year's methodologies.
PricewaterhouseCoopers LLP (PwC), independent registered public accounting firm and auditor to Fidelity and certain Fidelity funds, has been engaged annually by the Board as part of the Board's assessment of the results of Fidelity's profitability analysis. PwC's engagement includes the review and assessment of Fidelity's methodologies used in determining the revenues and expenses attributable to Fidelity's mutual fund business, and completion of agreed-upon procedures surrounding the mathematical accuracy of fund profitability and its conformity to allocation methodologies. After considering PwC's reports issued under the engagement and information provided by Fidelity, the Board believes that while other allocation methods may also be reasonable, Fidelity's profitability methodologies are reasonable in all material respects.
The Board has also reviewed Fidelity's non-fund businesses and any fall-out benefits related to the mutual fund business as well as cases where Fidelity's affiliates may benefit from or be related to the fund's business.
The Board considered the costs of the services provided by and the profits realized by Fidelity in connection with the operation of the fund and determined that the amount of profit is a fair entrepreneurial profit for the management of the fund.
Economies of Scale. The Board considered whether there have been economies of scale in respect of the management of the Fidelity funds, whether the Fidelity funds (including the fund) have appropriately benefited from any such economies of scale, and whether there is potential for realization of any further economies of scale. The Board considered the extent to which the fund will benefit from economies of scale through increased services to the fund, through waivers or reimbursements, or through fee or expense reductions, including reductions that occur through operation of the transfer agent agreement. The transfer agent fee varies in part based on the number of accounts in the fund. If the number of accounts decreases or the average account size increases, the overall transfer agent fee rate decreases.
The Board recognized that the fund's management contract incorporates a "group fee" structure, which provides for lower group fee rates as total fund assets under FMR's management increase, and for higher group fee rates as total fund assets under FMR's management decrease. FMR determines the group fee rates based on a tiered asset "breakpoint" schedule. In connection with the renewal of the fund's management contract, the Board approved amendments to the fund's management contract that added four new fee breakpoints to the group fee rate schedule for assets under FMR's management above $1,386 billion. The Board considered that the group fee rate declines under both the present and amended schedules, but that under the amended schedule, the group fee rate declines faster as assets under FMR's management exceed $1,386 billion. The Board considered that the group fee is designed to deliver the benefits of economies of scale to fund shareholders when total fund assets increase, even if assets of any particular fund are unchanged or have declined, because some portion of Fidelity's costs are attributable to services provided to all Fidelity funds, and all funds benefit if those costs can be allocated among more assets. The Board concluded that, given the group fee structure, fund shareholders will achieve a certain level of economies of scale as assets under FMR's management increase at the fund complex level, regardless of whether Fidelity achieves any such economies of scale.
Annual Report
The Board further concluded that any potential economies of scale are being shared between fund shareholders and Fidelity in an appropriate manner.
Additional Information Requested by the Board. In order to develop fully the factual basis for consideration of the Fidelity funds' Advisory Contracts, the Board requested and received additional information on several topics, including (i) fund performance trends and actions to be taken by FMR to improve certain funds' overall performance; (ii) Fidelity's portfolio manager compensation structure, including its effects on fund profitability and the extent to which portfolio manager compensation is linked to fund performance; (iii) Fidelity's fee structures; (iv) the funds' sub-advisory arrangements; and (v) accounts managed by Fidelity other than the Fidelity funds.
Based on its evaluation of all of the conclusions noted above, and after considering all material factors, the Board ultimately concluded that the advisory fee structures are fair and reasonable, and that the fund's Advisory Contracts should be renewed.
Annual Report
Managing Your Investments
Fidelity offers several ways to conveniently manage your personal investments via your telephone or PC. You can access your account information, conduct trades and research your investments 24 hours a day.
By Phone
Fidelity Automated Service Telephone provides a single toll-free number to access account balances, positions, quotes and trading. It's easy to navigate the service, and on your first call, the system will help you create a personal identification number (PIN) for security.
(phone_graphic)
Fidelity Automated
Service Telephone (FAST®)
1-800-544-5555
Press
1 For mutual fund and brokerage trading.
2 For quotes.*
3 For account balances and holdings.
4 To review orders and mutual
fund activity.
5 To change your PIN.
*0 To speak to a Fidelity representative.
By PC
Fidelity's web site on the Internet provides a wide range of information, including daily financial news, fund performance, interactive planning tools and news about Fidelity products and services.
(computer_graphic)
Fidelity's Web Site
www.fidelity.com
* When you call the quotes line, please remember that a fund's yield and return will vary and, except for money market funds, share price will also vary. This means that you may have a gain or loss when you sell your shares. There is no assurance that money market funds will be able to maintain a stable $1 share price; an investment in a money market fund is not insured or guaranteed by the U.S. government. Total returns are historical and include changes in share price, reinvestment of dividends and capital gains, and the effects of any sales charges.
Annual Report
To Write Fidelity
We'll give your correspondence immediate attention and send you written confirmation upon completion of your request.
(letter_graphic)
Making Changes
To Your Account
(such as changing name, address, bank, etc.)
Fidelity Investments
P.O. Box 770001
Cincinnati, OH 45277-0002
(letter_graphic)
For Non-Retirement
Accounts
Buying shares
Fidelity Investments
P.O. Box 770001
Cincinnati, OH 45277-0003
Overnight Express
Fidelity Investments
Attn: Distribution Services
100 Crosby Parkway - KC1H
Covington, KY 41015
Selling shares
Fidelity Investments
P.O. Box 770001
Cincinnati, OH 45277-0035
Overnight Express
Fidelity Investments
Attn: Distribution Services
100 Crosby Parkway - KC1H
Covington, KY 41015
General Correspondence
Fidelity Investments
P.O. Box 500
Merrimack, NH 03054-0500
(letter_graphic)
For Retirement
Accounts
Buying shares
Fidelity Investments
P.O. Box 770001
Cincinnati, OH 45277-0003
Selling shares
Fidelity Investments
P.O. Box 770001
Cincinnati, OH 45277-0035
Overnight Express
Fidelity Investments
Attn: Distribution Services
100 Crosby Parkway - KC1H
Covington, KY 41015
General Correspondence
Fidelity Investments
P.O. Box 500
Merrimack, NH 03054-0500
Annual Report
To Visit Fidelity
For directions and hours,
please call 1-800-544-9797.
Arizona
7001 West Ray Road
Chandler, AZ
15445 N. Scottsdale Road
Scottsdale, AZ
California
815 East Birch Street
Brea, CA
1411 Chapin Avenue
Burlingame, CA
851 East Hamilton Avenue
Campbell, CA
19200 Von Karman Avenue
Irvine, CA
601 Larkspur Landing Circle
Larkspur, CA
10100 Santa Monica Blvd.
Los Angeles, CA
27101 Puerta Real
Mission Viejo, CA
73-575 El Paseo
Palm Desert, CA
251 University Avenue
Palo Alto, CA
123 South Lake Avenue
Pasadena, CA
16995 Bernardo Ctr. Drive
Rancho Bernardo, CA
1220 Roseville Parkway
Roseville, CA
1740 Arden Way
Sacramento, CA
7676 Hazard Center Drive
San Diego, CA
11943 El Camino Real
San Diego, CA
8 Montgomery Street
San Francisco, CA
3793 State Street
Santa Barbara, CA
1200 Wilshire Boulevard
Santa Monica, CA
21701 Hawthorne Boulevard
Torrance, CA
2001 North Main Street
Walnut Creek, CA
6300 Canoga Avenue
Woodland Hills, CA
Colorado
1625 Broadway
Denver, CO
9185 Westview Road
Lone Tree, CO
Connecticut
48 West Putnam Avenue
Greenwich, CT
265 Church Street
New Haven, CT
300 Atlantic Street
Stamford, CT
29 South Main Street
West Hartford, CT
Delaware
400 Delaware Avenue
Wilmington, DE
Florida
4400 N. Federal Highway
Boca Raton, FL
121 Alhambra Plaza
Coral Gables, FL
2948 N. Federal Highway
Ft. Lauderdale, FL
4671 Town Center Parkway
Jacksonville, FL
1907 West State Road 434
Longwood, FL
8880 Tamiami Trail, North
Naples, FL
3501 PGA Boulevard
Palm Beach Gardens, FL
3550 Tamiami Trail, South
Sarasota, FL
1502 N. Westshore Blvd.
Tampa, FL
2465 State Road 7
Wellington, FL
Georgia
3445 Peachtree Road, N.E.
Atlanta, GA
1000 Abernathy Road
Atlanta, GA
Illinois
One North LaSalle Street
Chicago, IL
875 North Michigan Ave.
Chicago, IL
1415 West 22nd Street
Oak Brook, IL
1572 East Golf Road
Schaumburg, IL
3232 Lake Avenue
Wilmette, IL
Indiana
4729 East 82nd Street
Indianapolis, IN
Kansas
5400 College Boulevard
Overland Park, KS
Maine
Three Canal Plaza
Portland, ME
Maryland
7315 Wisconsin Avenue
Bethesda, MD
One W. Pennsylvania Ave.
Towson, MD
Massachusetts
801 Boylston Street
Boston, MA
155 Congress Street
Boston, MA
300 Granite Street
Braintree, MA
44 Mall Road
Burlington, MA
238 Main Street
Cambridge, MA
405 Cochituate Road
Framingham, MA
416 Belmont Street
Worcester, MA
Annual Report
Michigan
500 E. Eisenhower Pkwy.
Ann Arbor, MI
280 Old N. Woodward Ave.
Birmingham, MI
43420 Grand River Avenue
Novi, MI
29155 Northwestern Hwy.
Southfield, MI
Minnesota
7600 France Avenue South
Edina, MN
Missouri
1524 South Lindbergh Blvd.
St. Louis, MO
Nevada
2225 Village Walk Drive
Henderson, NV
New Jersey
150 Essex Street
Millburn, NJ
56 South Street
Morristown, NJ
396 Route 17, North
Paramus, NJ
3518 Route 1 North
Princeton, NJ
530 Broad Street
Shrewsbury, NJ
New York
1055 Franklin Avenue
Garden City, NY
37 West Jericho Turnpike
Huntington Station, NY
1271 Avenue of the Americas
New York, NY
980 Madison Avenue
New York, NY
61 Broadway
New York, NY
350 Park Avenue
New York, NY
200 Fifth Avenue
New York, NY
733 Third Avenue
New York, NY
11 Penn Plaza
New York, NY
2070 Broadway
New York, NY
1075 Northern Blvd.
Roslyn, NY
799 Central Park Avenue
Scarsdale, NY
North Carolina
4611 Sharon Road
Charlotte, NC
7011 Fayetteville Road
Durham, NC
Ohio
3805 Edwards Road
Cincinnati, OH
1324 Polaris Parkway
Columbus, OH
28699 Chagrin Boulevard
Woodmere Village, OH
Oregon
7493 SW Bridgeport Road
Tigard, OR
Pennsylvania
600 West DeKalb Pike
King of Prussia, PA
1735 Market Street
Philadelphia, PA
12001 Perry Highway
Wexford, PA
Rhode Island
47 Providence Place
Providence, RI
Tennessee
6150 Poplar Avenue
Memphis, TN
Texas
10000 Research Boulevard
Austin, TX
4001 Northwest Parkway
Dallas, TX
12532 Memorial Drive
Houston, TX
2701 Drexel Drive
Houston, TX
6560 Fannin Street
Houston, TX
6500 N. MacArthur Blvd.
Irving, TX
6005 West Park Boulevard
Plano, TX
14100 San Pedro
San Antonio, TX
1576 East Southlake Blvd.
Southlake, TX
19740 IH 45 North
Spring, TX
Utah
279 West South Temple
Salt Lake City, UT
Virginia
1861 International Drive
McLean, VA
Washington
411 108th Avenue, N.E.
Bellevue, WA
1518 6th Avenue
Seattle, WA
Washington, DC
1900 K Street, N.W.
Washington, DC
Wisconsin
595 North Barker Road
Brookfield, WI
Fidelity Brokerage Services, Inc., 100 Summer St., Boston, MA 02110 Member NYSE/SIPC
Annual Report
Annual Report
Annual Report
Investment Adviser
Fidelity Management & Research Company
Boston, MA
Investment Sub-Advisers
FMR Co., Inc.
Fidelity Research & Analysis Company
Fidelity Management & Research
(U.K.) Inc.
Fidelity Investments Japan Limited
Fidelity International Investment
Advisers
Fidelity International Investment
Advisers (U.K.) Limited
General Distributor
Fidelity Distributors Corporation
Boston, MA
Transfer and Service Agent
Fidelity Service Company, Inc.
Boston, MA
Custodian
Citibank, N.A.
New York, NY
The Fidelity Telephone Connection
Mutual Fund 24-Hour Service
Exchanges/Redemptions
and Account Assistance 1-800-544-6666
Product Information 1-800-544-6666
Retirement Accounts 1-800-544-4774
(8 a.m. - 9 p.m.)
TDD Service 1-800-544-0118
for the deaf and hearing impaired
(9 a.m. - 9 p.m. Eastern time)
Fidelity Automated Service
Telephone (FAST®) (automated graphic) 1-800-544-5555
(automated graphic) Automated line for quickest service
REI-UANN-0907
1.789710.104
(Fidelity Investment logo)(registered trademark)
Corporate Headquarters
82 Devonshire St., Boston, MA 02109
www.fidelity.com
Fidelity®
Small Cap Growth
Fund
Annual Report
July 31, 2007
(2_fidelity_logos) (Registered_Trademark)
Contents
Chairman's Message | <Click Here> | Ned Johnson's message to shareholders. |
Performance | <Click Here> | How the fund has done over time. |
Management's Discussion | <Click Here> | The manager's review of fund performance, strategy and outlook. |
Shareholder Expense Example | <Click Here> | An example of shareholder expenses. |
Investment Changes | <Click Here> | A summary of major shifts in the fund's investments over the past six months. |
Investments | <Click Here> | A complete list of the fund's investments with their market values. |
Financial Statements | <Click Here> | Statements of assets and liabilities, operations, and changes in net assets,
as well as financial highlights. |
Notes | <Click Here> | Notes to the financial statements. |
Report of Independent Registered Public Accounting Firm | <Click Here> | |
Trustees and Officers | <Click Here> | |
Distributions | <Click Here> | |
Board Approval of Investment Advisory Contracts and Management Fees | <Click Here> | |
To view a fund's proxy voting guidelines and proxy voting record for the 12-month period ended June 30, visit http://www.fidelity.com (search for "proxy voting guidelines.") or visit the Securities and Exchange Commission's (SEC) web site at http://www.sec.gov. You may also call 1-800-544-8544 to request a free copy of the proxy voting guidelines.
Standard & Poor's, S&P and S&P 500 are registered service marks of The McGraw-Hill Companies, Inc. and have been licensed for use by Fidelity Distributors Corporation.
Other third party marks appearing herein are the property of their respective owners.
All other marks appearing herein are registered or unregistered trademarks or service marks of FMR Corp. or an affiliated company.
Annual Report
This report and the financial statements contained herein are submitted for the general information of the shareholders of the fund. This report is not authorized for distribution to prospective investors in the fund unless preceded or accompanied by an effective prospectus.
A fund files its complete schedule of portfolio holdings with the SEC for the first and third quarters of each fiscal year on Form N-Q. Forms N-Q are available on the SEC's web site at http://www.sec.gov. A fund's Forms N-Q may be reviewed and copied at the SEC's Public Reference Room in Washington, DC. Information regarding the operation of the SEC's Public Reference Room may be obtained by calling 1-800-SEC-0330. For a complete list of a fund's portfolio holdings, view the fund's most recent holdings listing, semiannual report, or annual report on Fidelity's web site at http://www.fidelity.com or http://www.advisor.fidelity.com, as applicable.
NOT FDIC INSURED · MAY LOSE VALUE · NO BANK GUARANTEE
Neither the fund nor Fidelity Distributors Corporation is a bank.
Annual Report
Chairman's Message
(photo_of_Edward_C_Johnson_3d)
Dear Shareholder:
Stocks are currently on pace to register their fifth-straight year of positive returns, although gains could be trimmed if the U.S. economy continues to slow. While financial markets are always unpredictable, there are a number of time-tested principles that can put the historical odds in your favor.
One of the basic tenets is to invest for the long term. Over time, riding out the markets' inevitable ups and downs has proven much more effective than selling into panic or chasing the hottest trend. Even missing only a few of the markets' best days can significantly diminish investor returns. Patience also affords the benefits of compounding - of earning interest on additional income or reinvested dividends and capital gains. There are tax advantages and cost benefits to consider as well. The more you sell, the more taxes you pay, and the more you trade, the higher the costs. While staying the course doesn't eliminate risk, it can considerably lessen the effect of short-term declines.
You can further manage your investing risk through diversification. And today, more than ever, geographic diversification should be taken into account. Studies indicate that asset allocation is the single most important determinant of a portfolio's long-term success. The right mix of stocks, bonds and cash - aligned to your particular risk tolerance and investment objective - is very important. Age-appropriate rebalancing is also an essential aspect of asset allocation. For younger investors, an emphasis on equities - which historically have been the best-performing asset class over time - is encouraged. As investors near their specific goal, such as retirement or sending a child to college, consideration may be given to replacing volatile assets (e.g. common stocks) with more-stable fixed investments (bonds or savings plans).
A third investment principle - investing regularly - can help lower the average cost of your purchases. Investing a certain amount of money each month or quarter helps ensure you won't pay for all your shares at market highs. This strategy - known as dollar cost averaging - also reduces unconstructive "emotion" from investing, helping shareholders avoid selling weak performers just prior to an upswing, or chasing a hot performer just before a correction.
We invite you to contact us via the Internet, through our Investor Centers or over the phone. It is our privilege to provide you the information you need to make the investments that are right for you.
Sincerely,
/s/Edward C. Johnson 3d
Edward C. Johnson 3d
Annual Report
Performance: The Bottom Line
Average annual total return reflects the change in the value of an investment, assuming reinvestment of Small Cap Growth's dividend income and capital gains (the profits earned upon the sale of securities that have grown in value) and assuming a constant rate of performance each year. The $10,000 table and the fund's returns do not reflect the deduction of taxes that a shareholder would pay on fund distributions or the redemption of fund shares. During periods of reimbursement by Fidelity, a fund's total return will be greater than it would be had the reimbursement not occurred. How a fund did yesterday is no guarantee of how it will do tomorrow.
Average Annual Total Returns
Periods ended July 31, 2007 | Past 1
year | Life of
FundA |
Small Cap Growth | 25.84% | 20.05% |
A From November 3, 2004.
$10,000 Over Life of Fund
Let's say hypothetically that $10,000 was invested in Small Cap Growth on November 3, 2004, when the fund started. The chart shows how the value of your investment would have changed, and also shows how the Russell 2000® Growth Index performed over the same period.
Annual Report
Management's Discussion of Fund Performance
Comments from Lionel Harris, Portfolio Manager of Fidelity® Small Cap Growth Fund
Major U.S. equity benchmarks approached or exceeded gains of 20% and several set record highs during the 12-month period ending July 31, 2007. In that time, the Dow Jones Industrial AverageSM rose 20.84%, the Standard & Poor's 500SM Index advanced 16.13% and the NASDAQ Composite® Index gained 22.67%. The small-cap Russell 2000® Index fared less well after falling nearly 7% in July, but still returned 12.12% for the year overall. The first half of the period featured six consecutive months of positive returns spurred by the more relaxed monetary policy of the Federal Reserve Board and falling energy prices, which softened inflationary pressures on the U.S. economy. Stocks slipped in February, however, as energy prices crept higher, the housing market slumped, subprime mortgage woes mounted and the Chinese stock market declined 9% in a single day. But equities soared again from March through May, as reflected by the Dow and the S&P 500®, which climbed nearly 12% and more than 9%, respectively. In June and July, though, stocks sank again on inflation concerns and a worsening subprime loan crisis.
For the 12 months that ended July 31, 2007, Small Cap Growth returned 25.84%, beating its benchmark, the Russell 2000 Growth Index, which rose 16.83%. Security selection in industrials - especially among capital goods stocks - was a huge positive, as was security selection in energy, which made up for an unhelpful overweighting there. In health care, the fund benefited from successful stock picks along with a significant underweighting in the pharmaceuticals/biotechnology/life science industry. My choices within financials also contributed. In contrast, very few sectors detracted, with some underperformance from consumer staples and utilities stocks. A modest cash allocation also hampered results. The portfolio's best-performing stock by far was an out-of-benchmark position in Western Refining. The backdrop for oil refiners such as Western remained extremely strong during the past year. Also outperforming was health care and non-benchmark stock Kos Pharmaceuticals - bought out before period end - and risk-management consultant Huron Consulting. An out-of-benchmark position in Omnicare was my biggest disappointment. The company struggled to overcome a variety of challenges, and I sold my position before period end. A missed opportunity was not owning benchmark component AK Steel, whose shares soared as steel prices continued to rise. Another recent laggard I sold was Sierra Health Services.
The views expressed above reflect those of the portfolio manager(s) only through the end of the period as stated on the cover of this report and do not necessarily represent the views of Fidelity or any other person in the Fidelity organization. Any such views are subject to change at any time based upon market or other conditions and Fidelity disclaims any responsibility to update such views. These views may not be relied on as investment advice and, because investment decisions for a Fidelity fund are based on numerous factors, may not be relied on as an indication of trading intent on behalf of any Fidelity fund.
Annual Report
Shareholder Expense Example
As a shareholder of the Fund, you incur two types of costs: (1) transaction costs, including sales charges (loads) on purchase payments or redemption proceeds, redemption fees, and (2) ongoing costs, including management fees, distribution and/or service (12b-1) fees and other Fund expenses. This Example is intended to help you understand your ongoing costs (in dollars) of investing in the Fund and to compare these costs with the ongoing costs of investing in other mutual funds.
The Example is based on an investment of $1,000 invested at the beginning of the period and held for the entire period (February 1, 2007 to July 31, 2007).
Actual Expenses
The first line of the accompanying table for each class of the Fund provides information about actual account values and actual expenses. You may use the information in this line, together with the amount you invested, to estimate the expenses that you paid over the period. Simply divide your account value by $1,000.00 (for example, an $8,600 account value divided by $1,000.00 = 8.6), then multiply the result by the number in the first line for a class of the Fund under the heading entitled "Expenses Paid During Period" to estimate the expenses you paid on your account during this period. A small balance maintenance fee of $12.00 that is charged once a year may apply for certain accounts with a value of less than $2,000. This fee is not included in the table below. If it was, the estimate of expenses you paid during the period would be higher, and your ending account value lower, by this amount. In addition, the Fund, as a shareholder in the underlying Fidelity Central Funds, will indirectly bear its pro rata share of the fees and expenses incurred by the underlying Fidelity Central Funds. These fees and expenses are not included in the Fund's annualized expense ratio used to calculate the expense estimate in the table below.
Hypothetical Example for Comparison Purposes
The second line of the accompanying table for each class of the Fund provides information about hypothetical account values and hypothetical expenses based on a Class' actual expense ratio and an assumed rate of return of 5% per year before expenses, which is not the Class' actual return. The hypothetical account values and expenses may not be used to estimate the actual ending account balance or expenses you paid for the period. You may use this information to compare the ongoing costs of investing in the Fund and other funds. To do so, compare this 5% hypothetical example with the 5% hypothetical examples that appear in the shareholder reports of the other funds. A small balance maintenance fee of $12.00 that is charged once a year may apply for certain accounts with a value of less than $2,000. This fee is not included in the table below. If it was, the estimate of expenses you paid during the period would be higher, and your ending account value lower, by this amount. In addition, the Fund, as a shareholder in the underlying Fidelity Central Funds, will indirectly bear its pro rata share of the fees and expenses incurred by the underlying Fidelity Central Funds. These fees and expenses are not included in the Fund's annualized expense ratio used to calculate the expense estimate in the table below.
Annual Report
Shareholder Expense Example - continued
Please note that the expenses shown in the table are meant to highlight your ongoing costs only and do not reflect any transaction costs. Therefore, the second line of the table is useful in comparing ongoing costs only, and will not help you determine the relative total costs of owning different funds. In addition, if these transactional costs were included, your costs would have been higher.
| Beginning
Account Value
February 1, 2007 | Ending
Account Value
July 31, 2007 | Expenses Paid
During Period*
February 1, 2007
to July 31, 2007 |
Class A | | | |
Actual | $ 1,000.00 | $ 1,081.50 | $ 7.23 |
HypotheticalA | $ 1,000.00 | $ 1,017.85 | $ 7.00 |
Class T | | | |
Actual | $ 1,000.00 | $ 1,080.30 | $ 8.51 |
HypotheticalA | $ 1,000.00 | $ 1,016.61 | $ 8.25 |
Class B | | | |
Actual | $ 1,000.00 | $ 1,078.20 | $ 11.08 |
HypotheticalA | $ 1,000.00 | $ 1,014.13 | $ 10.74 |
Class C | | | |
Actual | $ 1,000.00 | $ 1,077.60 | $ 11.08 |
HypotheticalA | $ 1,000.00 | $ 1,014.13 | $ 10.74 |
Small Cap Growth | | | |
Actual | $ 1,000.00 | $ 1,083.20 | $ 5.58 |
HypotheticalA | $ 1,000.00 | $ 1,019.44 | $ 5.41 |
Institutional Class | | | |
Actual | $ 1,000.00 | $ 1,083.90 | $ 5.27 |
HypotheticalA | $ 1,000.00 | $ 1,019.74 | $ 5.11 |
A 5% return per year before expenses
* Expenses are equal to each Class' annualized expense ratio (shown in the table below); multiplied by the average account value over the period, multiplied by 181/365 (to reflect the one-half year period).
| Annualized
Expense Ratio |
Class A | 1.40% |
Class T | 1.65% |
Class B | 2.15% |
Class C | 2.15% |
Small Cap Growth | 1.08% |
Institutional Class | 1.02% |
Annual Report
Investment Changes
Top Ten Stocks as of July 31, 2007 |
| % of fund's
net assets | % of fund's net assets
6 months ago |
Harris Corp. | 1.5 | 1.4 |
Satyam Computer Services Ltd. sponsored ADR | 1.5 | 1.1 |
Trimble Navigation Ltd. | 1.4 | 1.0 |
Respironics, Inc. | 1.3 | 1.1 |
Titanium Metals Corp. | 1.3 | 0.9 |
j2 Global Communications, Inc. | 1.3 | 1.4 |
Chattem, Inc. | 1.3 | 0.8 |
VCA Antech, Inc. | 1.3 | 1.1 |
Huron Consulting Group, Inc. | 1.2 | 1.3 |
Flowserve Corp. | 1.2 | 1.0 |
| 13.3 | |
Top Five Market Sectors as of July 31, 2007 |
| % of fund's
net assets | % of fund's net assets
6 months ago |
Information Technology | 24.4 | 27.5 |
Industrials | 18.0 | 21.2 |
Health Care | 16.9 | 13.6 |
Energy | 10.7 | 9.0 |
Consumer Discretionary | 9.3 | 11.5 |
Asset Allocation (% of fund's net assets) |
As of July 31, 2007 * | As of January 31, 2007 ** |
| Stocks 95.9% | | | Stocks 96.2% | |
| Short-Term
Investments and
Net Other Assets 4.1% | | | Short-Term
Investments and
Net Other Assets 3.8% | |
* Foreign
investments | 10.2% | | ** Foreign
investments | 9.6% | |

Annual Report
Investments July 31, 2007
Showing Percentage of Net Assets
Common Stocks - 95.9% |
| Shares | | Value |
CONSUMER DISCRETIONARY - 9.3% |
Auto Components - 0.6% |
WABCO Holdings, Inc. (f) | 152,800 | | $ 7,334,400 |
Diversified Consumer Services - 0.8% |
Apollo Group, Inc. Class A (non-vtg.) (a) | 162,000 | | 9,575,820 |
Hotels, Restaurants & Leisure - 1.9% |
Life Time Fitness, Inc. (a)(d) | 131,900 | | 6,782,298 |
McCormick & Schmick's Seafood Restaurants (a) | 295,100 | | 7,194,538 |
Ruth's Chris Steak House, Inc. (a) | 602,700 | | 10,077,144 |
| | 24,053,980 |
Media - 1.6% |
Arbitron, Inc. | 80,700 | | 4,018,860 |
New Frontier Media, Inc. | 643,044 | | 5,459,444 |
R.H. Donnelley Corp. (a) | 180,800 | | 11,305,424 |
| | 20,783,728 |
Specialty Retail - 2.4% |
Hibbett Sports, Inc. (a) | 383,200 | | 9,821,416 |
Payless ShoeSource, Inc. (a) | 390,300 | | 10,389,786 |
The Men's Wearhouse, Inc. | 193,400 | | 9,553,960 |
| | 29,765,162 |
Textiles, Apparel & Luxury Goods - 2.0% |
Iconix Brand Group, Inc. (a)(d) | 510,600 | | 10,099,668 |
Skechers U.S.A., Inc. Class A (sub. vtg.) (a) | 214,475 | | 4,458,935 |
Volcom, Inc. (a) | 293,900 | | 10,427,572 |
| | 24,986,175 |
TOTAL CONSUMER DISCRETIONARY | | 116,499,265 |
CONSUMER STAPLES - 2.3% |
Personal Products - 2.3% |
Bare Escentuals, Inc. | 240,000 | | 6,770,400 |
Chattem, Inc. (a) | 287,500 | | 16,146,000 |
Physicians Formula Holdings, Inc. | 389,805 | | 5,827,585 |
| | 28,743,985 |
ENERGY - 10.7% |
Energy Equipment & Services - 3.5% |
Hanover Compressor Co. (a) | 475,400 | | 11,328,782 |
Hornbeck Offshore Services, Inc. (a)(d) | 170,600 | | 7,344,330 |
Common Stocks - continued |
| Shares | | Value |
ENERGY - continued |
Energy Equipment & Services - continued |
NATCO Group, Inc. Class A (a) | 235,800 | | $ 10,915,182 |
Superior Energy Services, Inc. (a) | 361,500 | | 14,575,680 |
| | 44,163,974 |
Oil, Gas & Consumable Fuels - 7.2% |
Cabot Oil & Gas Corp. | 231,100 | | 7,903,620 |
EXCO Resources, Inc. (a) | 550,000 | | 9,603,000 |
Forest Oil Corp. (a) | 353,033 | | 14,287,246 |
Foundation Coal Holdings, Inc. | 175,800 | | 6,126,630 |
Mariner Energy, Inc. (a) | 456,210 | | 9,639,717 |
Petrohawk Energy Corp. (a) | 749,100 | | 11,229,009 |
Range Resources Corp. | 216,350 | | 8,035,239 |
Tesoro Corp. | 280,600 | | 13,973,880 |
Western Refining, Inc. | 175,700 | | 9,751,350 |
| | 90,549,691 |
TOTAL ENERGY | | 134,713,665 |
FINANCIALS - 7.9% |
Commercial Banks - 0.8% |
UMB Financial Corp. | 277,724 | | 10,370,214 |
Consumer Finance - 1.1% |
Cash America International, Inc. | 175,400 | | 6,423,148 |
Dollar Financial Corp. (a) | 282,378 | | 7,076,393 |
| | 13,499,541 |
Diversified Financial Services - 0.2% |
Endeavor Acquisition Corp. (a) | 225,700 | | 2,493,985 |
Insurance - 4.5% |
Aspen Insurance Holdings Ltd. | 318,800 | | 7,794,660 |
Max Capital Group Ltd. | 312,075 | | 8,148,278 |
National Financial Partners Corp. | 275,200 | | 12,758,272 |
StanCorp Financial Group, Inc. | 186,982 | | 8,780,675 |
Universal American Financial Corp. (a) | 450,831 | | 8,976,045 |
Willis Group Holdings Ltd. | 252,600 | | 10,253,034 |
| | 56,710,964 |
Real Estate Management & Development - 1.0% |
CB Richard Ellis Group, Inc. Class A (a) | 348,100 | | 12,155,652 |
Common Stocks - continued |
| Shares | | Value |
FINANCIALS - continued |
Thrifts & Mortgage Finance - 0.3% |
Triad Guaranty, Inc. (a) | 155,600 | | $ 4,289,892 |
TOTAL FINANCIALS | | 99,520,248 |
HEALTH CARE - 16.9% |
Biotechnology - 0.2% |
Cephalon, Inc. (a) | 35,000 | | 2,629,900 |
Health Care Equipment & Supplies - 7.1% |
American Medical Systems Holdings, Inc. (a)(d) | 579,700 | | 10,596,916 |
ArthroCare Corp. (a) | 155,700 | | 7,881,534 |
Immucor, Inc. (a) | 328,400 | | 10,232,944 |
Integra LifeSciences Holdings Corp. (a)(d) | 163,600 | | 8,122,740 |
Inverness Medical Innovations, Inc. (a) | 197,500 | | 9,560,975 |
Mentor Corp. (d) | 187,200 | | 7,366,320 |
Meridian Bioscience, Inc. | 285,000 | | 6,364,050 |
Respironics, Inc. (a) | 361,400 | | 16,534,050 |
Shandong Weigao Group Medical Polymer Co. Ltd.
(H shares) | 1,440,000 | | 3,576,205 |
Sirona Dental Systems, Inc. (a)(d) | 245,500 | | 8,680,880 |
| | 88,916,614 |
Health Care Providers & Services - 5.2% |
Healthways, Inc. (a)(d) | 207,418 | | 9,064,167 |
Henry Schein, Inc. (a) | 211,700 | | 11,503,778 |
Humana, Inc. (a) | 167,900 | | 10,760,711 |
PSS World Medical, Inc. (a) | 543,399 | | 9,362,765 |
Sun Healthcare Group, Inc. (a) | 610,800 | | 8,258,016 |
VCA Antech, Inc. (a) | 408,600 | | 16,074,324 |
| | 65,023,761 |
Health Care Technology - 1.0% |
Allscripts Healthcare Solutions, Inc. (a)(d) | 300,000 | | 6,825,000 |
Cerner Corp. (a) | 123,500 | | 6,529,445 |
| | 13,354,445 |
Life Sciences Tools & Services - 1.7% |
Harvard Bioscience, Inc. (a) | 448,000 | | 2,302,720 |
ICON PLC sponsored ADR | 149,890 | | 7,010,355 |
Pharmaceutical Product Development, Inc. | 353,400 | | 11,838,900 |
| | 21,151,975 |
Common Stocks - continued |
| Shares | | Value |
HEALTH CARE - continued |
Pharmaceuticals - 1.7% |
Adams Respiratory Therapeutics, Inc. (a)(d) | 263,100 | | $ 9,737,331 |
Medicis Pharmaceutical Corp. Class A | 410,500 | | 11,711,565 |
| | 21,448,896 |
TOTAL HEALTH CARE | | 212,525,591 |
INDUSTRIALS - 18.0% |
Aerospace & Defense - 2.0% |
Hexcel Corp. (a)(d) | 604,200 | | 13,135,308 |
Ladish Co., Inc. (a) | 255,300 | | 12,379,497 |
| | 25,514,805 |
Airlines - 0.5% |
Delta Air Lines, Inc. (a) | 359,700 | | 6,409,854 |
Commercial Services & Supplies - 6.1% |
American Reprographics Co. (a)(d) | 256,300 | | 6,386,996 |
CDI Corp. | 399,200 | | 11,293,368 |
Clean Harbors, Inc. (a) | 187,500 | | 9,005,625 |
CoStar Group, Inc. (a)(d) | 181,736 | | 9,268,536 |
Huron Consulting Group, Inc. (a) | 229,000 | | 15,555,970 |
InnerWorkings, Inc. (d) | 424,300 | | 5,664,405 |
Kenexa Corp. (a) | 239,000 | | 8,551,420 |
Navigant Consulting, Inc. (a) | 691,500 | | 10,891,125 |
| | 76,617,445 |
Construction & Engineering - 3.0% |
Chicago Bridge & Iron Co. NV (NY Shares) | 247,700 | | 10,056,620 |
Fluor Corp. | 113,200 | | 13,075,732 |
Infrasource Services, Inc. (a) | 233,200 | | 8,073,384 |
Washington Group International, Inc. (a) | 70,300 | | 5,646,496 |
| | 36,852,232 |
Electrical Equipment - 1.9% |
EnerSys (a) | 482,200 | | 8,727,820 |
Genlyte Group, Inc. (a) | 117,300 | | 8,160,561 |
Q-Cells AG (a)(d) | 76,100 | | 6,737,304 |
| | 23,625,685 |
Industrial Conglomerates - 0.7% |
Raven Industries, Inc. | 261,600 | | 8,899,632 |
Machinery - 3.1% |
Bucyrus International, Inc. Class A (d) | 222,400 | | 14,135,744 |
Common Stocks - continued |
| Shares | | Value |
INDUSTRIALS - continued |
Machinery - continued |
Flowserve Corp. | 211,000 | | $ 15,248,970 |
IDEX Corp. | 271,953 | | 9,847,418 |
| | 39,232,132 |
Transportation Infrastructure - 0.7% |
Quixote Corp. (e) | 459,900 | | 8,618,526 |
TOTAL INDUSTRIALS | | 225,770,311 |
INFORMATION TECHNOLOGY - 24.4% |
Communications Equipment - 3.8% |
F5 Networks, Inc. (a) | 111,600 | | 9,674,604 |
Harris Corp. (d) | 356,700 | | 19,575,693 |
Nice Systems Ltd. sponsored ADR (a) | 216,500 | | 7,192,130 |
Polycom, Inc. (a) | 367,500 | | 11,381,475 |
| | 47,823,902 |
Electronic Equipment & Instruments - 2.6% |
Cogent, Inc. (a)(d) | 578,000 | | 7,693,180 |
ScanSource, Inc. (a) | 285,600 | | 7,662,648 |
Trimble Navigation Ltd. (a) | 525,300 | | 17,350,659 |
| | 32,706,487 |
Internet Software & Services - 3.5% |
CyberSource Corp. (a)(d) | 351,060 | | 4,040,701 |
Equinix, Inc. (a)(d) | 166,200 | | 14,444,442 |
j2 Global Communications, Inc. (a)(d) | 497,800 | | 16,248,192 |
ValueClick, Inc. (a) | 431,700 | | 9,229,746 |
| | 43,963,081 |
IT Services - 6.0% |
Authorize.Net Holdings, Inc. (a) | 420,900 | | 7,294,197 |
CACI International, Inc. Class A (a) | 231,700 | | 10,296,748 |
Datacash Group PLC | 1,590,400 | | 8,690,687 |
MoneyGram International, Inc. | 389,400 | | 9,964,746 |
Satyam Computer Services Ltd. sponsored ADR (d) | 710,100 | | 18,931,266 |
SI International, Inc. (a) | 225,547 | | 6,570,184 |
SRA International, Inc. Class A (a) | 287,200 | | 6,841,104 |
WNS Holdings Ltd. ADR (a) | 310,500 | | 7,762,500 |
| | 76,351,432 |
Common Stocks - continued |
| Shares | | Value |
INFORMATION TECHNOLOGY - continued |
Semiconductors & Semiconductor Equipment - 5.2% |
California Micro Devices Corp. (a) | 837,900 | | $ 3,753,792 |
Entegris, Inc. (a) | 944,800 | | 10,184,944 |
FormFactor, Inc. (a) | 313,900 | | 12,050,621 |
Hittite Microwave Corp. (a) | 340,521 | | 13,695,755 |
Microsemi Corp. (a)(d) | 373,400 | | 8,703,954 |
Rudolph Technologies, Inc. (a) | 288,744 | | 4,518,844 |
Tessera Technologies, Inc. (a) | 297,900 | | 12,252,627 |
| | 65,160,537 |
Software - 3.3% |
Ansys, Inc. (a) | 384,000 | | 9,999,360 |
Blackbaud, Inc. | 717,459 | | 15,023,591 |
Business Objects SA sponsored ADR (a) | 186,000 | | 8,370,000 |
Fair Isaac Corp. | 202,400 | | 7,946,224 |
| | 41,339,175 |
TOTAL INFORMATION TECHNOLOGY | | 307,344,614 |
MATERIALS - 4.7% |
Metals & Mining - 4.7% |
Carpenter Technology Corp. | 110,300 | | 13,091,507 |
Meridian Gold, Inc. (a) | 511,400 | | 14,436,826 |
Reliance Steel & Aluminum Co. | 275,700 | | 14,485,278 |
Titanium Metals Corp. (a)(d) | 493,500 | | 16,492,770 |
| | 58,506,381 |
TELECOMMUNICATION SERVICES - 0.6% |
Diversified Telecommunication Services - 0.6% |
Cbeyond, Inc. (a) | 230,500 | | 8,152,785 |
UTILITIES - 1.1% |
Multi-Utilities - 1.1% |
AEM SpA | 2,153,700 | | 7,211,347 |
CMS Energy Corp. | 413,200 | | 6,677,312 |
| | 13,888,659 |
TOTAL COMMON STOCKS (Cost $1,133,658,256) | 1,205,665,504 |
Money Market Funds - 12.4% |
| Shares | | Value |
Fidelity Cash Central Fund, 5.38% (b) | 63,874,490 | | $ 63,874,490 |
Fidelity Securities Lending Cash Central Fund, 5.39% (b)(c) | 92,012,535 | | 92,012,535 |
TOTAL MONEY MARKET FUNDS (Cost $155,887,025) | 155,887,025 |
TOTAL INVESTMENT PORTFOLIO - 108.3% (Cost $1,289,545,281) | | 1,361,552,529 |
NET OTHER ASSETS - (8.3)% | | (104,475,734) |
NET ASSETS - 100% | $ 1,257,076,795 |
Legend |
(a) Non-income producing |
(b) Affiliated fund that is available only to investment companies and other accounts managed by Fidelity Investments. The rate quoted is the annualized seven-day yield of the fund at period end. A complete unaudited listing of the fund's holdings as of its most recent quarter end is available upon request. |
(c) Investment made with cash collateral received from securities on loan. |
(d) Security or a portion of the security is on loan at period end. |
(e) Affiliated company |
(f) Security or a portion of the security purchased on a delayed delivery or when-issued basis. |
Affiliated Central Funds |
Information regarding fiscal year to date income earned by the Fund from investments in Fidelity Central Funds is as follows: |
Fund | Income earned |
Fidelity Cash Central Fund | $ 1,506,865 |
Fidelity Securities Lending Cash Central Fund | 198,991 |
Total | $ 1,705,856 |
Other Affiliated Issuers |
An affiliated company is a company in which the fund has ownership of at least 5% of the voting securities. Fiscal year to date transactions with companies which are or were affiliates are as follows: |
Affiliate | Value, beginning of period | Purchases | Sale
Proceeds | Dividend
Income | Value,
end of
period |
Quixote Corp. | $ - | $ 9,171,364 | $ - | $ 76,046 | $ 8,618,526 |
Other Information |
Distribution of investments by country of issue, as a percentage of total net assets, is as follows: |
United States of America | 89.8% |
Bermuda | 2.1% |
India | 1.5% |
United Kingdom | 1.3% |
Canada | 1.2% |
Others (individually less than 1%) | 4.1% |
| 100.0% |
See accompanying notes which are an integral part of the financial statements.
Annual Report
Financial Statements
Statement of Assets and Liabilities
| July 31, 2007 |
Assets | | |
Investment in securities, at value (including securities loaned of $88,633,500) - See accompanying schedule: Unaffiliated issuers (cost $1,124,486,892) | $ 1,197,046,978 | |
Fidelity Central Funds (cost $155,887,025) | 155,887,025 | |
Other affiliated issuers (cost $9,171,364) | 8,618,526 | |
Total Investments (cost $1,289,545,281) | | $ 1,361,552,529 |
Cash | | 1,722,189 |
Receivable for investments sold | | 10,792,738 |
Receivable for fund shares sold | | 2,386,230 |
Dividends receivable | | 11,578 |
Distributions receivable from Fidelity Central Funds | | 253,144 |
Prepaid expenses | | 888 |
Other receivables | | 11,831 |
Total assets | | 1,376,731,127 |
| | |
Liabilities | | |
Payable for investments purchased
Regular delivery | $ 17,678,327 | |
Delayed delivery | 8,029,181 | |
Payable for fund shares redeemed | 782,233 | |
Accrued management fee | 801,876 | |
Distribution fees payable | 43,739 | |
Other affiliated payables | 256,045 | |
Other payables and accrued expenses | 50,396 | |
Collateral on securities loaned, at value | 92,012,535 | |
Total liabilities | | 119,654,332 |
| | |
Net Assets | | $ 1,257,076,795 |
Net Assets consist of: | | |
Paid in capital | | $ 1,103,854,866 |
Accumulated undistributed net realized gain (loss) on investments and foreign currency transactions | | 81,214,930 |
Net unrealized appreciation (depreciation) on investments and assets and liabilities in foreign currencies | | 72,006,999 |
Net Assets | | $ 1,257,076,795 |
See accompanying notes which are an integral part of the financial statements.
Annual Report
Statement of Assets and Liabilities - continued
| July 31, 2007 |
Calculation of Maximum Offering Price Class A:
Net Asset Value and redemption price per share ($33,587,517 ÷
2,090,838 shares) | $ 16.06 |
| |
Maximum offering price per share (100/94.25 of $16.06) | $ 17.04 |
Class T:
Net Asset Value and redemption price per share ($26,418,676 ÷ 1,649,872 shares) | $ 16.01 |
| |
Maximum offering price per share (100/96.50 of $16.01) | $ 16.59 |
Class B:
Net Asset Value and offering price per share ($6,242,258 ÷ 393,886 shares)A | $ 15.85 |
| |
Class C:
Net Asset Value and offering price per share ($22,347,810 ÷ 1,410,730 shares)A | $ 15.84 |
| |
| |
Small Cap Growth:
Net Asset Value, offering price and redemption price per share ($1,149,809,489 ÷ 71,180,036 shares) | $ 16.15 |
| |
Institutional Class:
Net Asset Value, offering price and redemption price per share ($18,671,045 ÷ 1,156,200 shares) | $ 16.15 |
A Redemption price per share is equal to net asset value less any applicable contingent deferred sales charge.
See accompanying notes which are an integral part of the financial statements.
Annual Report
Financial Statements - continued
Statement of Operations
| Year ended July 31, 2007 |
Investment Income | | |
Dividends (including $76,046 earned from other affiliated issuers) | | $ 2,689,721 |
Special dividends | | 308,003 |
Interest | | 6,819 |
Income from Fidelity Central Funds | | 1,705,856 |
Total income | | 4,710,399 |
| | |
Expenses | | |
Management fee
Basic fee | $ 5,656,543 | |
Performance adjustment | 721,094 | |
Transfer agent fees | 1,956,268 | |
Distribution fees | 434,374 | |
Accounting and security lending fees | 286,522 | |
Custodian fees and expenses | 29,858 | |
Independent trustees' compensation | 2,307 | |
Registration fees | 111,021 | |
Audit | 52,611 | |
Legal | 5,687 | |
Miscellaneous | 12,571 | |
Total expenses before reductions | 9,268,856 | |
Expense reductions | (120,825) | 9,148,031 |
Net investment income (loss) | | (4,437,632) |
Realized and Unrealized Gain (Loss) Net realized gain (loss) on: | | |
Investment securities: | | |
Unaffiliated issuers | 87,838,465 | |
Foreign currency transactions | 24,427 | |
Total net realized gain (loss) | | 87,862,892 |
Change in net unrealized appreciation (depreciation) on: Investment securities | 65,703,013 | |
Assets and liabilities in foreign currencies | (249) | |
Total change in net unrealized appreciation (depreciation) | | 65,702,764 |
Net gain (loss) | | 153,565,656 |
Net increase (decrease) in net assets resulting from operations | | $ 149,128,024 |
See accompanying notes which are an integral part of the financial statements.
Annual Report
Statement of Changes in Net Assets
| Year ended
July 31,
2007 | Year ended
July 31,
2006 |
Increase (Decrease) in Net Assets | | |
Operations | | |
Net investment income (loss) | $ (4,437,632) | $ (2,229,695) |
Net realized gain (loss) | 87,862,892 | 5,473,930 |
Change in net unrealized appreciation (depreciation) | 65,702,764 | (13,283,719) |
Net increase (decrease) in net assets resulting
from operations | 149,128,024 | (10,039,484) |
Distributions to shareholders from net realized gain | (3,591,980) | (3,779,478) |
Share transactions - net increase (decrease) | 637,612,035 | 259,409,742 |
Redemption fees | 160,118 | 233,448 |
Total increase (decrease) in net assets | 783,308,197 | 245,824,228 |
| | |
Net Assets | | |
Beginning of period | 473,768,598 | 227,944,370 |
End of period | $ 1,257,076,795 | $ 473,768,598 |
See accompanying notes which are an integral part of the financial statements.
Annual Report
Financial Highlights - Class A
Years ended July 31, | 2007 | 2006 | 2005K |
Selected Per-Share Data | | | |
Net asset value, beginning of period | $ 12.88 | $ 12.95 | $ 10.00 |
Income from Investment Operations | | | |
Net investment income (loss)E | (.12)H | (.10)I | (.07) |
Net realized and unrealized gain (loss) | 3.39 | .18J | 3.01 |
Total from investment operations | 3.27 | .08 | 2.94 |
Distributions from net realized gain | (.09) | (.16) | - |
Redemption fees added to paid in capitalE | -M | .01 | .01 |
Net asset value, end of period | $ 16.06 | $ 12.88 | $ 12.95 |
Total ReturnB,C,D | 25.52% | .70% | 29.50% |
Ratios to Average Net AssetsF,L | | | |
Expenses before reductions | 1.44% | 1.53% | 1.55%A |
Expenses net of fee waivers, if any | 1.40% | 1.40% | 1.45%A |
Expenses net of all reductions | 1.39% | 1.35% | 1.36%A |
Net investment income (loss) | (.80)%H | (.79)%I | (.78)%A |
Supplemental Data | | | |
Net assets, end of period (000 omitted) | $ 33,588 | $ 18,104 | $ 4,719 |
Portfolio turnover rateG | 91% | 129% | 93%A |
A Annualized
B Total returns for periods of less than one year are not annualized.
C Total returns would have been lower had certain expenses not been reduced during the periods shown.
D Total returns do not include the effect of the sales charges.
E Calculated based on average shares outstanding during the period.
F Fees and expenses of the underlying Fidelity Central Funds are not included in the Fund's expense ratio. The Fund indirectly bears its proportionate share of the expenses of any underlying Fidelity Central Funds.
G Amount does not include the portfolio activity of any underlying Fidelity Central Funds.
H Investment income per share reflects a special dividend which amounted to $.01 per share. Excluding the special dividend, the ratio of net investment income (loss) to average net assets would have been (.84)%.
I Investment income per share reflects a special dividend which amounted to $.01 per share. Excluding the special dividend, the ratio of net investment income (loss) to average net assets would have been (.85)%.
J The amount shown for a share outstanding does not correspond with the aggregate net gain (loss) on investments for the period due to the timing of sales and repurchases of shares in relation to fluctuating market values of the investments of the Fund.
K For the period November 3, 2004 (commencement of operations) to July 31, 2005.
L Expense ratios reflect operating expenses of the class. Expenses before reductions do not reflect amounts reimbursed by the investment adviser or reductions from brokerage service arrangements or other expense offset arrangements and do not represent the amount paid by the class during periods when reimbursements or reductions occur. Expense ratios before reductions for start-up periods may not be representative of longer-term operating periods. Expenses net of fee waivers reflect expenses after reimbursement by the investment adviser but prior to reductions from brokerage service arrangements or other expense offset arrangements. Expenses net of all reductions represent the net expenses paid by the class.
M Amount represents less than $.01 per share.
See accompanying notes which are an integral part of the financial statements.
Annual Report
Financial Highlights - Class T
Years ended July 31, | 2007 | 2006 | 2005K |
Selected Per-Share Data | | | |
Net asset value, beginning of period | $ 12.86 | $ 12.93 | $ 10.00 |
Income from Investment Operations | | | |
Net investment income (loss)E | (.16)H | (.14)I | (.09) |
Net realized and unrealized gain (loss) | 3.38 | .19J | 3.01 |
Total from investment operations | 3.22 | .05 | 2.92 |
Distributions from net realized gain | (.07) | (.13) | - |
Redemption fees added to paid in capitalE | -M | .01 | .01 |
Net asset value, end of period | $ 16.01 | $ 12.86 | $ 12.93 |
Total ReturnB,C,D | 25.18% | .48% | 29.30% |
Ratios to Average Net AssetsF,L | | | |
Expenses before reductions | 1.67% | 1.73% | 1.79%A |
Expenses net of fee waivers, if any | 1.65% | 1.65% | 1.70%A |
Expenses net of all reductions | 1.65% | 1.60% | 1.61%A |
Net investment income (loss) | (1.05)%H | (1.04)%I | (1.03)%A |
Supplemental Data | | | |
Net assets, end of period (000 omitted) | $ 26,419 | $ 19,205 | $ 5,240 |
Portfolio turnover rateG | 91% | 129% | 93%A |
A Annualized
B Total returns for periods of less than one year are not annualized.
C Total returns would have been lower had certain expenses not been reduced during the periods shown.
D Total returns do not include the effect of the sales charges.
E Calculated based on average shares outstanding during the period.
F Fees and expenses of the underlying Fidelity Central Funds are not included in the Fund's expense ratio. The Fund indirectly bears its proportionate share of the expenses of any underlying Fidelity Central Funds.
G Amount does not include the portfolio activity of any underlying Fidelity Central Funds.
H Investment income per share reflects a special dividend which amounted to $.01 per share. Excluding the special dividend, the ratio of net investment income (loss) to average net assets would have been (1.09)%.
I Investment income per share reflects a special dividend which amounted to $.01 per share. Excluding the special dividend, the ratio of net investment income (loss) to average net assets would have been (1.10)%.
J The amount shown for a share outstanding does not correspond with the aggregate net gain (loss) on investments for the period due to the timing of sales and repurchases of shares in relation to fluctuating market values of the investments of the Fund.
K For the period November 3, 2004 (commencement of operations) to July 31, 2005.
L Expense ratios reflect operating expenses of the class. Expenses before reductions do not reflect amounts reimbursed by the investment adviser or reductions from brokerage service arrangements or other expense offset arrangements and do not represent the amount paid by the class during periods when reimbursements or reductions occur. Expense ratios before reductions for start-up periods may not be representative of longer-term operating periods. Expenses net of fee waivers reflect expenses after reimbursement by the investment adviser but prior to reductions from brokerage service arrangements or other expense offset arrangements. Expenses net of all reductions represent the net expenses paid by the class.
M Amount represents less than $.01 per share.
See accompanying notes which are an integral part of the financial statements.
Annual Report
Financial Highlights - Class B
Years ended July 31, | 2007 | 2006 | 2005K |
Selected Per-Share Data | | | |
Net asset value, beginning of period | $ 12.78 | $ 12.87 | $ 10.00 |
Income from Investment Operations | | | |
Net investment income (loss)E | (.23)H | (.20)I | (.13) |
Net realized and unrealized gain (loss) | 3.36 | .19J | 2.99 |
Total from investment operations | 3.13 | (.01) | 2.86 |
Distributions from net realized gain | (.06) | (.09) | - |
Redemption fees added to paid in capitalE | -M | .01 | .01 |
Net asset value, end of period | $ 15.85 | $ 12.78 | $ 12.87 |
Total ReturnB,C,D | 24.57% | (.03)% | 28.70% |
Ratios to Average Net AssetsF,L | | | |
Expenses before reductions | 2.20% | 2.28% | 2.33%A |
Expenses net of fee waivers, if any | 2.15% | 2.15% | 2.20%A |
Expenses net of all reductions | 2.15% | 2.10% | 2.11%A |
Net investment income (loss) | (1.55)%H | (1.54)%I | (1.53)%A |
Supplemental Data | | | |
Net assets, end of period (000 omitted) | $ 6,242 | $ 5,191 | $ 2,055 |
Portfolio turnover rateG | 91% | 129% | 93%A |
A Annualized
B Total returns for periods of less than one year are not annualized.
C Total returns would have been lower had certain expenses not been reduced during the periods shown.
D Total returns do not include the effect of the contingent deferred sales charge.
E Calculated based on average shares outstanding during the period.
F Fees and expenses of the underlying Fidelity Central Funds are not included in the Fund's expense ratio. The Fund indirectly bears its proportionate share of the expenses of any underlying Fidelity Central Funds.
G Amount does not include the portfolio activity of any underlying Fidelity Central Funds.
H Investment income per share reflects a special dividend which amounted to $.01 per share. Excluding the special dividend, the ratio of net investment income (loss) to average net assets would have been (1.59)%.
I Investment income per share reflects a special dividend which amounted to $.01 per share. Excluding the special dividend, the ratio of net investment income (loss) to average net assets would have been (1.60)%.
J The amount shown for a share outstanding does not correspond with the aggregate net gain (loss) on investments for the period due to the timing of sales and repurchases of shares in relation to fluctuating market values of the investments of the Fund.
K For the period November 3, 2004 (commencement of operations) to July 31, 2005.
L Expense ratios reflect operating expenses of the class. Expenses before reductions do not reflect amounts reimbursed by the investment adviser or reductions from brokerage service arrangements or other expense offset arrangements and do not represent the amount paid by the class during periods when reimbursements or reductions occur. Expense ratios before reductions for start-up periods may not be representative of longer-term operating periods. Expenses net of fee waivers reflect expenses after reimbursement by the investment adviser but prior to reductions from brokerage service arrangements or other expense offset arrangements. Expenses net of all reductions represent the net expenses paid by the class.
M Amount represents less than $.01 per share.
See accompanying notes which are an integral part of the financial statements.
Annual Report
Financial Highlights - Class C
Years ended July 31, | 2007 | 2006 | 2005K |
Selected Per-Share Data | | | |
Net asset value, beginning of period | $ 12.77 | $ 12.88 | $ 10.00 |
Income from Investment Operations | | | |
Net investment income (loss)E | (.23)H | (.20)I | (.13) |
Net realized and unrealized gain (loss) | 3.36 | .18J | 3.00 |
Total from investment operations | 3.13 | (.02) | 2.87 |
Distributions from net realized gain | (.06) | (.10) | - |
Redemption fees added to paid in capitalE | -M | .01 | .01 |
Net asset value, end of period | $ 15.84 | $ 12.77 | $ 12.88 |
Total ReturnB,C,D | 24.59% | (.08)% | 28.80% |
Ratios to Average Net AssetsF,L | | | |
Expenses before reductions | 2.20% | 2.25% | 2.24%A |
Expenses net of fee waivers, if any | 2.15% | 2.15% | 2.17%A |
Expenses net of all reductions | 2.14% | 2.10% | 2.09%A |
Net investment income (loss) | (1.55)%H | (1.54)%I | (1.50)%A |
Supplemental Data | | | |
Net assets, end of period (000 omitted) | $ 22,348 | $ 14,682 | $ 8,372 |
Portfolio turnover rateG | 91% | 129% | 93%A |
A Annualized
B Total returns for periods of less than one year are not annualized.
C Total returns would have been lower had certain expenses not been reduced during the periods shown.
D Total returns do not include the effect of the contingent deferred sales charge.
E Calculated based on average shares outstanding during the period.
F Fees and expenses of the underlying Fidelity Central Funds are not included in the Fund's expense ratio. The Fund indirectly bears its proportionate share of the expenses of any underlying Fidelity Central Funds.
G Amount does not include the portfolio activity of any underlying Fidelity Central Funds.
H Investment income per share reflects a special dividend which amounted to $.01 per share. Excluding the special dividend, the ratio of net investment income (loss) to average net assets would have been (1.59)%.
I Investment income per share reflects a special dividend which amounted to $.01 per share. Excluding the special dividend, the ratio of net investment income (loss) to average net assets would have been (1.60)%.
J The amount shown for a share outstanding does not correspond with the aggregate net gain (loss) on investments for the period due to the timing of sales and repurchases of shares in relation to fluctuating market values of the investments of the Fund.
K For the period November 3, 2004 (commencement of operations) to July 31, 2005.
L Expense ratios reflect operating expenses of the class. Expenses before reductions do not reflect amounts reimbursed by the investment adviser or reductions from brokerage service arrangements or other expense offset arrangements and do not represent the amount paid by the class during periods when reimbursements or reductions occur. Expense ratios before reductions for start-up periods may not be representative of longer-term operating periods. Expenses net of fee waivers reflect expenses after reimbursement by the investment adviser but prior to reductions from brokerage service arrangements or other expense offset arrangements. Expenses net of all reductions represent the net expenses paid by the class.
M Amount represents less than $.01 per share.
See accompanying notes which are an integral part of the financial statements.
Annual Report
Financial Highlights - Small Cap Growth
Years ended July 31, | 2007 | 2006 | 2005J |
Selected Per-Share Data | | | |
Net asset value, beginning of period | $ 12.93 | $ 12.98 | $ 10.00 |
Income from Investment Operations | | | |
Net investment income (loss)D | (.08)G | (.07)H | (.04) |
Net realized and unrealized gain (loss) | 3.40 | .19I | 3.01 |
Total from investment operations | 3.32 | .12 | 2.97 |
Distributions from net realized gain | (.10) | (.18) | - |
Redemption fees added to paid in capitalD | -L | .01 | .01 |
Net asset value, end of period | $ 16.15 | $ 12.93 | $ 12.98 |
Total ReturnB,C | 25.84% | 1.01% | 29.80% |
Ratios to Average Net AssetsE,K | | | |
Expenses before reductions | 1.10% | 1.13% | 1.16%A |
Expenses net of fee waivers, if any | 1.10% | 1.13% | 1.16%A |
Expenses net of all reductions | 1.09% | 1.08% | 1.08%A |
Net investment income (loss) | (.50)%G | (.52)%H | (.49)%A |
Supplemental Data | | | |
Net assets, end of period (000 omitted) | $ 1,149,809 | $ 402,353 | $ 205,652 |
Portfolio turnover rateF | 91% | 129% | 93%A |
A Annualized
B Total returns for periods of less than one year are not annualized.
C Total returns would have been lower had certain expenses not been reduced during the periods shown.
D Calculated based on average shares outstanding during the period.
E Fees and expenses of the underlying Fidelity Central Funds are not included in the Fund's expense ratio. The Fund indirectly bears its proportionate share of the expenses of any underlying Fidelity Central Funds.
F Amount does not include the portfolio activity of any underlying Fidelity Central Funds.
G Investment income per share reflects a special dividend which amounted to $.01 per share. Excluding the special dividend, the ratio of net investment income (loss) to average net assets would have been (.54)%.
H Investment income per share reflects a special dividend which amounted to $.01 per share. Excluding the special dividend, the ratio of net investment income (loss) to average net assets would have been (.58)%.
I The amount shown for a share outstanding does not correspond with the aggregate net gain (loss) on investments for the period due to the timing of sales and repurchases of shares in relation to fluctuating market values of the investments of the Fund.
J For the period November 3, 2004 (commencement of operations) to July 31, 2005.
K Expense ratios reflect operating expenses of the class. Expenses before reductions do not reflect amounts reimbursed by the investment adviser or reductions from brokerage service arrangements or other expense offset arrangements and do not represent the amount paid by the class during periods when reimbursements or reductions occur. Expense ratios before reductions for start-up periods may not be representative of longer-term operating periods. Expenses net of fee waivers reflect expenses after reimbursement by the investment adviser but prior to reductions from brokerage service arrangements or other expense offset arrangements. Expenses net of all reductions represent the net expenses paid by the class.
L Amount represents less than $.01 per share.
See accompanying notes which are an integral part of the financial statements.
Annual Report
Financial Highlights - Institutional Class
Years ended July 31, | 2007 | 2006 | 2005J |
Selected Per-Share Data | | | |
Net asset value, beginning of period | $ 12.92 | $ 12.97 | $ 10.00 |
Income from Investment Operations | | | |
Net investment income (loss)D | (.07)G | (.07)H | (.04) |
Net realized and unrealized gain (loss) | 3.41 | .19I | 3.00 |
Total from investment operations | 3.34 | .12 | 2.96 |
Distributions from net realized gain | (.11) | (.18) | - |
Redemption fees added to paid in capitalD | -L | .01 | .01 |
Net asset value, end of period | $ 16.15 | $ 12.92 | $ 12.97 |
Total ReturnB,C | 25.99% | .97% | 29.70% |
Ratios to Average Net AssetsE,K | | | |
Expenses before reductions | 1.05% | 1.10% | 1.20%A |
Expenses net of fee waivers, if any | 1.05% | 1.10% | 1.18%A |
Expenses net of all reductions | 1.05% | 1.05% | 1.10%A |
Net investment income (loss) | (.46)%G | (.49)%H | (.51)%A |
Supplemental Data | | | |
Net assets, end of period (000 omitted) | $ 18,671 | $ 14,233 | $ 1,906 |
Portfolio turnover rateF | 91% | 129% | 93%A |
A Annualized
B Total returns for periods of less than one year are not annualized.
C Total returns would have been lower had certain expenses not been reduced during the periods shown.
D Calculated based on average shares outstanding during the period.
E Fees and expenses of the underlying Fidelity Central Funds are not included in the Fund's expense ratio. The Fund indirectly bears its proportionate share of the expenses of any underlying Fidelity Central Funds.
F Amount does not include the portfolio activity of any underlying Fidelity Central Funds.
G Investment income per share reflects a special dividend which amounted to $.01 per share. Excluding the special dividend, the ratio of net investment income (loss) to average net assets would have been (.50)%.
H Investment income per share reflects a special dividend which amounted to $.01 per share. Excluding the special dividend, the ratio of net investment income (loss) to average net assets would have been (.55)%.
I The amount shown for a share outstanding does not correspond with the aggregate net gain (loss) on investments for the period due to the timing of sales and repurchases of shares in relation to fluctuating market values of the investments of the Fund.
J For the period November 3, 2004 (commencement of operations) to July 31, 2005.
K Expense ratios reflect operating expenses of the class. Expenses before reductions do not reflect amounts reimbursed by the investment adviser or reductions from brokerage service arrangements or other expense offset arrangements and do not represent the amount paid by the class during periods when reimbursements or reductions occur. Expense ratios before reductions for start-up periods may not be representative of longer-term operating periods. Expenses net of fee waivers reflect expenses after reimbursement by the investment adviser but prior to reductions from brokerage service arrangements or other expense offset arrangements. Expenses net of all reductions represent the net expenses paid by the class.
L Amount represents less than $.01 per share.
See accompanying notes which are an integral part of the financial statements.
Annual Report
Notes to Financial Statements
For the period ended July 31, 2007
1. Organization.
Fidelity Small Cap Growth Fund (the Fund) is a non-diversified fund of Fidelity Securities Fund (the trust) and is authorized to issue an unlimited number of shares. The trust is registered under the Investment Company Act of 1940, as amended (the 1940 Act), as an open-end management investment company organized as a Massachusetts business trust. The Fund offers Class A, Class T, Class B, Class C, Small Cap Growth, and Institutional Class shares, each of which has equal rights as to assets and voting privileges. Each class has exclusive voting rights with respect to matters that affect that class. Class B shares will automatically convert to Class A shares after a holding period of seven years from the initial date of purchase. Investment income, realized and unrealized capital gains and losses, the common expenses of the Fund, and certain fund-level expense reductions, if any, are allocated on a pro rata basis to each class based on the relative net assets of each class to the total net assets of the Fund. Each class differs with respect to transfer agent and distribution and service plan fees incurred. Certain expense reductions also differ by class.
2. Investments in Fidelity Central Funds.
The Fund may invest in Fidelity Central Funds which are open-end investment companies available only to other investment companies and accounts managed by Fidelity Management & Research Company (FMR) and its affiliates. The Fund's Schedule of Investments lists each of the Fidelity Central Funds as an investment of the Fund, but does not include the underlying holdings of each Fidelity Central Fund. As an Investing Fund, the Fund indirectly bears its proportionate share of the expenses of the underlying Fidelity Central Funds.
The Money Market Central Funds seek preservation of capital and current income and are managed by Fidelity Investments Money Management, Inc. (FIMM), an affiliate of FMR.
A complete list of holdings for each Fidelity Central Fund is available upon request or at the SEC's website at www.sec.gov. In addition, the financial statements of the Fidelity Central Funds, which are not covered by the Fund's Report of Independent Registered Public Accounting Firm, are available on the SEC's web site, or upon request.
3. Significant Accounting Policies.
The financial statements have been prepared in conformity with accounting principles generally accepted in the United States of America, which require management to make certain estimates and assumptions at the date of the financial statements. The following summarizes the significant accounting policies of the Fund:
Security Valuation. Investments are valued and net asset value (NAV) per share is calculated (NAV calculation) as of the close of business of the New York Stock Exchange
Annual Report
3. Significant Accounting Policies - continued
Security Valuation - continued
(NYSE), normally 4:00 p.m. Eastern time. Wherever possible, the Fund uses independent pricing services approved by the Board of Trustees to value its investments.
Equity securities, including restricted securities, for which market quotations are readily available, are valued at the last reported sale price or official closing price as reported by an independent pricing service on the primary market or exchange on which they are traded. In the event there were no sales during the day or closing prices are not available, securities are valued at the last quoted bid price. Investments in open-end mutual funds, including the Fidelity Central Funds, are valued at their closing net asset value each business day. Short-term securities with remaining maturities of sixty days or less for which quotations are not readily available are valued at amortized cost, which approximates value.
When current market prices or quotations are not readily available or do not accurately reflect fair value, valuations may be determined in accordance with procedures adopted by the Board of Trustees. For example, when developments occur between the close of a market and the close of the NYSE that may materially affect the value of some or all of the securities, or when trading in a security is halted, those securities may be fair valued. Factors used in the determination of fair value may include monitoring news to identify significant market or security specific events such as changes in the value of U.S. securities markets, reviewing developments in foreign markets and evaluating the performance of ADRs, futures contracts and exchange-traded funds. Because the Fund's utilization of fair value pricing depends on market activity, the frequency with which fair value pricing is used cannot be predicted and may be utilized to a significant extent. The value of securities used for NAV calculation under fair value pricing may differ from published prices for the same securities.
Foreign Currency. The Fund uses foreign currency contracts to facilitate transactions in foreign-denominated securities. Losses from these transactions may arise from changes in the value of the foreign currency or if the counterparties do not perform under the contracts' terms.
Foreign-denominated assets, including investment securities, and liabilities are translated into U.S. dollars at the exchange rate at period end. Purchases and sales of investment securities, income and dividends received and expenses denominated in foreign currencies are translated into U.S. dollars at the exchange rate in effect on the transaction date.
The effects of exchange rate fluctuations on investments are included with the net realized and unrealized gain (loss) on investment securities. Other foreign currency transactions resulting in realized and unrealized gain (loss) are disclosed separately.
Annual Report
Notes to Financial Statements - continued
3. Significant Accounting Policies - continued
Investment Transactions and Income. For financial reporting purposes, the Fund's investment holdings and NAV include trades executed through the end of the last business day of the period. The NAV for processing shareholder transactions includes trades executed through the end of the prior business day. Gains and losses on securities sold are determined on the basis of identified cost. Dividend income is recorded on the ex-dividend date, except for certain dividends from foreign securities where the ex-dividend date may have passed, which are recorded as soon as the Fund is informed of the ex-dividend date. Non-cash dividends included in dividend income, if any, are recorded at the fair market value of the securities received. Distributions received on securities that represent a return of capital or capital gain are recorded as a reduction of cost of investments and/or as a realized gain. The Fund estimates the components of distributions received that may be considered return of capital distributions or capital gain distributions. Large, non-recurring dividends recognized by the Fund are presented separately on the Statement of Operations as "Special Dividends" and the impact of these dividends is presented in the Financial Highlights. Interest income and distributions from the Fidelity Central Funds are accrued as earned. Interest income includes coupon interest and amortization of premium and accretion of discount on debt securities. Investment income is recorded net of foreign taxes withheld where recovery of such taxes is uncertain.
Expenses. Most expenses of the trust can be directly attributed to a fund. Expenses which cannot be directly attributed are apportioned among each Fund in the trust. Expense estimates are accrued in the period to which they relate and adjustments are made when actual amounts are known.
Income Tax Information and Distributions to Shareholders. Each year, the Fund intends to qualify as a regulated investment company by distributing all of its taxable income and realized gains under Subchapter M of the Internal Revenue Code. As a result, no provision for income taxes is required in the accompanying financial statements. Foreign taxes are provided for based on the Fund's understanding of the tax rules and rates that exist in the foreign markets in which it invests.
Distributions are recorded on the ex-dividend date. Income dividends and capital gain distributions are declared separately for each class. Income and capital gain distributions are determined in accordance with income tax regulations, which may differ from generally accepted accounting principles. In addition, the Fund will claim a portion of the payment made to redeeming shareholders as a distribution for income tax purposes.
Capital accounts within the financial statements are adjusted for permanent book-tax differences. These adjustments have no impact on net assets or the results of operations. Temporary book-tax differences will reverse in a subsequent period.
Annual Report
3. Significant Accounting Policies - continued
Income Tax Information and Distributions to Shareholders - continued
Book-tax differences are primarily due to foreign currency transactions, net operating losses and losses deferred due to wash sales.
The tax-basis components of distributable earnings and the federal tax cost as of period end were as follows:
Unrealized appreciation | $ 129,971,651 | |
Unrealized depreciation | (58,828,862) | |
Net unrealized appreciation (depreciation) | 71,142,789 | |
Undistributed ordinary income | 57,565,363 | |
Undistributed long-term capital gain | 21,937,701 | |
| | |
Cost for federal income tax purposes | $ 1,290,409,740 | |
The tax character of distributions paid was as follows:
| July 31, 2007 | July 31, 2006 |
Ordinary Income | $ 1,338,128 | $ 3,779,478 |
Long-term Capital Gains | 2,253,852 | - |
Total | $ 3,591,980 | $ 3,779,478 |
Short-Term Trading (Redemption) Fees. Shares held in the Fund less than 90 days are subject to a redemption fee equal to 1.50% of the proceeds of the redeemed shares. All redemption fees, including any estimated redemption fees paid by FMR, are retained by the Fund and accounted for as an addition to paid in capital.
New Accounting Pronouncements. In July 2006, Financial Accounting Standards Board Interpretation No. 48, Accounting for Uncertainty in Income Taxes - an interpretation of FASB Statement 109 (FIN 48), was issued and is effective on the last business day of the semiannual reporting period for fiscal years beginning after December 15, 2006. FIN 48 sets forth a threshold for financial statement recognition, measurement and disclosure of a tax position taken or expected to be taken on a tax return. Management has concluded that the adoption of FIN 48 will not result in a material impact on the Fund's net assets, results of operations and financial statement disclosures.
In addition, in September 2006, Statement of Financial Accounting Standards No. 157, Fair Value Measurements (SFAS 157), was issued and is effective for fiscal years beginning after November 15, 2007. SFAS 157 defines fair value, establishes a framework for measuring fair value and expands disclosures about fair value measurements. Management is currently evaluating the impact the adoption of SFAS 157 will have on the Fund's financial statement disclosures.
Annual Report
Notes to Financial Statements - continued
4. Operating Policies.
Repurchase Agreements. FMR has received an Exemptive Order from the Securities and Exchange Commission (the SEC) which permits the Fund and other affiliated entities of FMR to transfer uninvested cash balances into joint trading accounts which are then invested in repurchase agreements. The Fund may also invest directly with institutions in repurchase agreements. Repurchase agreements are collateralized by government or non-government securities. Upon settlement date, collateral is held in segregated accounts with custodian banks and may be obtained in the event of a default of the counterparty. The Fund monitors, on a daily basis, the value of the collateral to ensure it is at least equal to the principal amount of the repurchase agreement (including accrued interest). In the event of a default by the counterparty, realization of the collateral proceeds could be delayed, during which time the value of the collateral may decline.
Delayed Delivery Transactions and When-Issued Securities. The Fund may purchase or sell securities on a delayed delivery or when-issued basis. Payment and delivery may take place after the customary settlement period for that security. The price of the underlying securities and the date when the securities will be delivered and paid for are fixed at the time the transaction is negotiated. During the time a delayed delivery sell is outstanding, the contract is marked-to-market daily and equivalent deliverable securities are held for the transaction. The value of the securities purchased on a delayed delivery or when-issued basis are identified as such in the Fund's Schedule of Investments. The Fund may receive compensation for interest forgone in the purchase of a delayed delivery or when-issued security. With respect to purchase commitments, the Fund identifies securities as segregated in its records with a value at least equal to the amount of the commitment. Losses may arise due to changes in the value of the underlying securities or if the counterparty does not perform under the contract's terms, or if the issuer does not issue the securities due to political, economic, or other factors.
5. Purchases and Sales of Investments.
Purchases and sales of securities, other than short-term securities, aggregated $1,308,851,948 and $702,065,964, respectively.
6. Fees and Other Transactions with Affiliates.
Management Fee. FMR and its affiliates provide the Fund with investment management related services for which the Fund pays a monthly management fee. The management fee is the sum of an individual fund fee rate that is based on an annual rate of .45% of the Fund's average net assets and a group fee rate that averaged ..26% during the period. The group fee rate is based upon the average net assets of all the mutual funds advised by FMR. The group fee rate decreases as assets under management increase and
Annual Report
6. Fees and Other Transactions with Affiliates - continued
Management Fee - continued
increases as assets under management decrease. In addition, the management fee is subject to a performance adjustment (up to a maximum of ±.20% of the Fund's average net assets over a 36 month performance period). The upward or downward adjustment to the management fee is based on the relative investment performance of the retail class of the Fund, Small Cap Growth, as compared to an appropriate benchmark index. For the period, the total annual management fee rate, including the performance adjustment, was .80% of the Fund's average net assets.
Distribution and Service Plan. In accordance with Rule 12b-1 of the 1940 Act, the Fund has adopted separate Distribution and Service Plans for each class of shares. Certain classes pay Fidelity Distributors Corporation (FDC), an affiliate of FMR, separate Distribution and Service Fees, each of which is based on an annual percentage of each class' average net assets. In addition, FDC may pay financial intermediaries for selling shares of the Fund and providing shareholder support services. For the period, the Distribution and Service Fee rates and the total amounts paid to and retained by FDC were as follows:
| Distribution
Fee | Service
Fee | Paid to
FDC | Retained
by FDC |
Class A | 0% | .25% | $ 61,375 | $ 5,550 |
Class T | 25% | .25% | 122,504 | 2,290 |
Class B | .75% | .25% | 58,534 | 44,526 |
Class C | .75% | .25% | 191,961 | 66,624 |
| | | $ 434,374 | $ 118,990 |
Sales Load. FDC receives a front-end sales charge of up to 5.75% for selling Class A shares, and 3.50% for selling Class T shares, some of which is paid to financial intermediaries for selling shares of the Fund. FDC receives the proceeds of contingent deferred sales charges levied on Class A, Class T, Class B, and Class C redemptions. These charges depend on the holding period. The deferred sales charges range from 5% to 1% forClass B, 1% for Class C, 1.00% to .50% for certain purchases of Class A shares and .25% for certain purchases of Class T shares.
For the period, sales charge amounts retained by FDC were as follows:
| Retained
by FDC |
Class A | $ 35,221 |
Class T | 8,842 |
Class B* | 10,153 |
Class C* | 3,347 |
| $ 57,563 |
* When Class B and Class C shares are initially sold, FDC pays commissions from its own resources to financial intermediaries through which the sales are made.
Annual Report
Notes to Financial Statements - continued
6. Fees and Other Transactions with Affiliates - continued
Transfer Agent Fees. Fidelity Investments Institutional Operations Company, Inc. (FIIOC), an affiliate of FMR, is the transfer, dividend disbursing and shareholder servicing agent for each class of the Fund, except for Small Cap Growth. Fidelity Service Company, Inc. (FSC), an affiliate of FMR, is the transfer agent for Small Cap Growth shares. FIIOC and FSC receive account fees and asset-based fees that vary according to the account size and type of account of the shareholders of the respective classes of the Fund. FIIOC and FSC pay for typesetting, printing and mailing of shareholder reports, except proxy statements. For the period, the total transfer agent fees paid by each class to FIIOC or FSC, were as follows:
| Amount | % of
Average
Net Assets |
Class A | $ 77,693 | .32 |
Class T | 72,782 | .30 |
Class B | 18,857 | .32 |
Class C | 61,455 | .32 |
Small Cap Growth | 1,696,137 | .24 |
Institutional Class | 29,344 | .18 |
| $ 1,956,268 | |
Accounting and Security Lending Fees. FSC maintains the Fund's accounting records. The accounting fee is based on the level of average net assets for the month. Under a separate contract, FSC administers the security lending program. The security lending fee is based on the number and duration of lending transactions.
Brokerage Commissions. The Fund placed a portion of its portfolio transactions with brokerage firms which are affiliates of the investment adviser. The commissions paid to these affiliated firms were $12,881 for the period.
7. Committed Line of Credit.
The Fund participates with other funds managed by FMR in a $4.2 billion credit facility (the "line of credit") to be utilized for temporary or emergency purposes to fund shareholder redemptions or for other short-term liquidity purposes. The Fund has agreed to pay commitment fees on its pro rata portion of the line of credit, which amounted to $1,129 and is reflected in Miscellaneous Expense on the Statement of Operations. During the period, there were no borrowings on this line of credit.
Annual Report
8. Security Lending.
The Fund lends portfolio securities from time to time in order to earn additional income. On the settlement date of the loan, the Fund receives collateral (in the form of U.S. Treasury obligations, letters of credit and/or cash) against the loaned securities and maintains collateral in an amount not less than 100% of the market value of the loaned securities during the period of the loan. The market value of the loaned securities is determined at the close of business of the Fund and any additional required collateral is delivered to the Fund on the next business day. If the borrower defaults on its obligation to return the securities loaned because of insolvency or other reasons, a fund could experience delays and costs in recovering the securities loaned or in gaining access to the collateral. Any cash collateral received is invested in the Fidelity Securities Lending Cash Central Fund. The value of loaned securities and cash collateral at period end are disclosed on the Fund's Statement of Assets and Liabilities. Security lending income represents the income earned on investing cash collateral, less fees and expenses associated with the loan, plus any premium payments that may be received on the loan of certain types of securities. Security lending income is presented in the Statement of Operations as a component of income from Fidelity Central Funds. Net income from lending portfolio securities during the period amounted to $198,991.
9. Expense Reductions.
FMR voluntarily agreed to reimburse each class to the extent annual operating expenses exceeded certain levels of average net assets as noted in the table below. Some expenses, for example interest expense, including commitment fees, are excluded from this reimbursement.
The following classes were in reimbursement during the period:
| Expense
Limitations | Reimbursement
from adviser |
Class A | 1.40% | $ 10,000 |
Class T | 1.65% | 5,786 |
Class B | 2.15% | 2,944 |
Class C | 2.15% | 9,325 |
Small Cap Growth | 1.15% | 26,889 |
| | $ 54,944 |
Effective March 1, 2007 the expense limitation for Small Cap Growth class was eliminated.
Many of the brokers with whom FMR places trades on behalf of the Fund provided services to the Fund in addition to trade execution. These services included payments of certain expenses on behalf of the Fund totaling $12,839 for the period. In addition,
Annual Report
Notes to Financial Statements - continued
9. Expense Reductions - continued
through arrangements with the Fund's custodian and each class' transfer agent, credits realized as a result of uninvested cash balances were used to reduce the Fund's expenses. During the period, these credits reduced the Fund's custody expenses by $8,868. During the period, credits reduced each class' transfer agent expense as noted in the table below.
| Transfer Agent
expense reduction | |
Class C | $ 50 | |
Small Cap Growth | 42,971 | |
Institutional Class | 85 | |
| $ 43,106 | |
10. Other.
The Fund's organizational documents provide former and current trustees and officers with a limited indemnification against liabilities arising in connection with the performance of their duties to the Fund. In the normal course of business, the Fund may also enter into contracts that provide general indemnifications. The Fund's maximum exposure under these arrangements is unknown as this would be dependent on future claims that may be made against the Fund. The risk of material loss from such claims is considered remote.
In September 2006, FIIOC, the Fund's transfer agent, notified the Fund that the Fund's books and records did not reflect a conversion of certain Class B to Class A shares upon their conversion date. In March 2007, FIIOC converted the relevant Class B shares to Class A shares and recorded the conversion in the books and records of the Fund which did not result in a material impact to the Fund's reported net assets or results of operations in the accompanying financial statements. FIIOC has remediated affected shareholders and reimbursed the Fund for all related audit and legal expenses.
11. Distributions to Shareholders.
Distributions to shareholders of each class were as follows:
Years ended July 31, | 2007 | 2006 |
From net realized gain | | |
Class A | $ 130,212 | $ 79,077 |
Class T | 118,024 | 63,628 |
Class B | 24,691 | 16,300 |
Class C | 74,047 | 71,634 |
Small Cap Growth | 3,129,487 | 3,518,781 |
Institutional Class | 115,519 | 30,058 |
Total | $ 3,591,980 | $ 3,779,478 |
Annual Report
12. Share Transactions.
Transactions for each class of shares were as follows:
| Shares | Dollars |
Years ended July 31, | 2007 | 2006 | 2007 | 2006 |
Class A | | | | |
Shares sold | 1,113,110 | 1,304,587 | $ 17,060,734 | $ 17,497,379 |
Reinvestment of distributions | 8,925 | 5,381 | 119,928 | 70,354 |
Shares redeemed | (436,417) | (269,198) | (6,456,393) | (3,602,873) |
Net increase (decrease) | 685,618 | 1,040,770 | $ 10,724,269 | $ 13,964,860 |
Class T | | | | |
Shares sold | 607,092 | 1,397,985 | $ 8,822,874 | $ 18,995,409 |
Reinvestment of distributions | 8,530 | 4,866 | 115,213 | 63,445 |
Shares redeemed | (459,339) | (314,634) | (6,905,798) | (4,188,261) |
Net increase (decrease) | 156,283 | 1,088,217 | $ 2,032,289 | $ 14,870,593 |
Class B | | | | |
Shares sold | 121,826 | 392,448 | $ 1,800,582 | $ 5,275,913 |
Reinvestment of distributions | 1,705 | 1,204 | 23,112 | 15,614 |
Shares redeemed | (135,943) | (146,977) | (1,994,978) | (1,954,748) |
Net increase (decrease) | (12,412) | 246,675 | $ (171,284) | $ 3,336,779 |
Class C | | | | |
Shares sold | 546,198 | 952,568 | $ 8,014,853 | $ 12,739,552 |
Reinvestment of distributions | 5,178 | 5,289 | 70,286 | 68,594 |
Shares redeemed | (290,387) | (458,174) | (4,244,042) | (5,878,013) |
Net increase (decrease) | 260,989 | 499,683 | $ 3,841,097 | $ 6,930,133 |
Small Cap Growth | | | | |
Shares sold | 47,884,601 | 23,125,895 | $ 736,795,086 | $ 310,607,480 |
Reinvestment of distributions | 213,315 | 226,620 | 2,867,099 | 2,968,828 |
Shares redeemed | (8,042,099) | (8,070,732) | (119,410,062) | (106,295,770) |
Net increase (decrease) | 40,055,817 | 15,281,783 | $ 620,252,123 | $ 207,280,538 |
Institutional Class | | | | |
Shares sold | 404,996 | 1,082,924 | $ 6,086,460 | $ 14,760,969 |
Reinvestment of distributions | 7,296 | 1,705 | 97,691 | 22,327 |
Shares redeemed | (357,460) | (130,215) | (5,250,610) | (1,756,457) |
Net increase (decrease) | 54,832 | 954,414 | $ 933,541 | $ 13,026,839 |
Annual Report
Report of Independent Registered Public Accounting Firm
To the Trustees of Fidelity Securities Fund and the Shareholders of Fidelity Small Cap Growth Fund:
In our opinion, the accompanying statement of assets and liabilities, including the schedule of investments, and the related statements of operations and of changes in net assets and the financial highlights present fairly, in all material respects, the financial position of Fidelity Small Cap Growth Fund (a fund of Fidelity Securities Fund) at July 31, 2007, the results of its operations for the year then ended, the changes in its net assets for each of the two years in the period then ended and the financial highlights for each of the periods indicated, in conformity with accounting principles generally accepted in the United States of America. These financial statements and financial highlights (hereafter referred to as "financial statements") are the responsibility of the Fidelity Small Cap Growth Fund's management. Our responsibility is to express an opinion on these financial statements based on our audits. We conducted our audits of these financial statements in accordance with the standards of the Public Company Accounting Oversight Board (United States). Those standards require that we plan and perform the audit to obtain reasonable assurance about whether the financial statements are free of material misstatement. An audit includes examining, on a test basis, evidence supporting the amounts and disclosures in the financial statements, assessing the accounting principles used and significant estimates made by management, and evaluating the overall financial statement presentation. We believe that our audits, which included confirmation of securities at July 31, 2007 by correspondence with the custodian and brokers, provide a reasonable basis for our opinion.
/s/ PricewaterhouseCoopers LLP
PricewaterhouseCoopers LLP
Boston, Massachusetts
September 18, 2007
Annual Report
Trustees and Officers
The Trustees, Members of the Advisory Board, and executive officers of the trust and fund, as applicable, are listed below. The Board of Trustees governs the fund and is responsible for protecting the interests of shareholders. The Trustees are experienced executives who meet periodically throughout the year to oversee the fund's activities, review contractual arrangements with companies that provide services to the fund, and review the fund's performance. Except for James C. Curvey, each of the Trustees oversees 353 funds advised by FMR or an affiliate. Mr. Curvey oversees 317 funds advised by FMR or an affiliate.
The Trustees hold office without limit in time except that (a) any Trustee may resign; (b) any Trustee may be removed by written instrument, signed by at least two-thirds of the number of Trustees prior to such removal; (c) any Trustee who requests to be retired or who has become incapacitated by illness or injury may be retired by written instrument signed by a majority of the other Trustees; and (d) any Trustee may be removed at any special meeting of shareholders by a two-thirds vote of the outstanding voting securities of the trust. Each Trustee who is not an interested person (as defined in the 1940 Act) (Independent Trustee), shall retire not later than the last day of the calendar year in which his or her 72nd birthday occurs. The Independent Trustees may waive this mandatory retirement age policy with respect to individual Trustees. The executive officers and Advisory Board Members hold office without limit in time, except that any officer and Advisory Board Member may resign or may be removed by a vote of a majority of the Trustees at any regular meeting or any special meeting of the Trustees. Except as indicated, each individual has held the office shown or other offices in the same company for the past five years.
The fund's Statement of Additional Information (SAI) includes more information about the Trustees. To request a free copy, call Fidelity at 1-800-544-8544.
Interested Trustees*:
Correspondence intended for each Trustee who is an interested person may be sent to Fidelity Investments, 82 Devonshire Street, Boston, Massachusetts 02109.
Name, Age; Principal Occupation |
Edward C. Johnson 3d (77) |
| Year of Election or Appointment: 1984 Mr. Johnson is Chairman of the Board of Trustees. Mr. Johnson serves as President (2006-present), Chief Executive Officer, Chairman, and a Director of FMR Corp.; Chairman and a Director of FMR; Chairman and a Director of Fidelity Research & Analysis Company (FRAC); Chairman and a Director of Fidelity Investments Money Management, Inc.; and Chairman (2001-present) and a Director of FMR Co., Inc. In addition, Mr. Johnson serves as Chairman and Director of Fidelity International Limited (FIL). |
James C. Curvey (72) |
| Year of Election or Appointment: 2007 Mr. Curvey also serves as Trustee (2007-present) or Member of the Advisory Board (2007-present) of other investment companies advised by FMR. Mr. Curvey is Vice Chairman (2006-present) and Director of FMR Corp. Mr. Curvey joined Fidelity in 1982 and served in numerous senior management positions, including President and Chief Operating Officer of FMR Corp. (1997-2000) and President of Fidelity Strategic Investments (2000-2002). In addition, he serves as a member of the Board of Directors of Geerlings & Wade, Inc. (wine distribution). |
* Trustees have been determined to be "Interested Trustees" by virtue of, among other things, their affiliation with the trust or various entities under common control with FMR.
Independent Trustees:
Correspondence intended for each Independent Trustee (that is, the Trustees other than the Interested Trustees) may be sent to Fidelity Investments, P.O. Box 55235, Boston, Massachusetts 02205-5235.
Name, Age; Principal Occupation |
Dennis J. Dirks (59) |
| Year of Election or Appointment: 2005 Prior to his retirement in May 2003, Mr. Dirks was Chief Operating Officer and a member of the Board of The Depository Trust & Clearing Corporation (DTCC) (1999-2003). He also served as President, Chief Operating Officer, and Board member of The Depository Trust Company (DTC) (1999-2003) and President and Board member of the National Securities Clearing Corporation (NSCC) (1999-2003). In addition, Mr. Dirks served as Chief Executive Officer and Board member of the Government Securities Clearing Corporation (2001-2003) and Chief Executive Officer and Board member of the Mortgage-Backed Securities Clearing Corporation (2001-2003). Mr. Dirks also serves as a Trustee and a member of the Finance Committee of Manhattan College (2005-present) and a Trustee and a member of the Finance Committee of AHRC of Nassau County (2006-present). |
Albert R. Gamper, Jr. (65) |
| Year of Election or Appointment: 2006 Prior to his retirement in December 2004, Mr. Gamper served as Chairman of the Board of CIT Group Inc. (commercial finance). During his tenure with CIT Group Inc. Mr. Gamper served in numerous senior management positions, including Chairman (1987-1989; 1999-2001; 2002-2004), Chief Executive Officer (1987-2004), and President (1989-2002). He currently serves as a member of the Board of Directors of Public Service Enterprise Group (utilities, 2001-present), Chairman of the Board of Governors, Rutgers University (2004-present), and Chairman of the Board of Saint Barnabas Health Care System. |
George H. Heilmeier (71) |
| Year of Election or Appointment: 2004 Dr. Heilmeier is Chairman Emeritus of Telcordia Technologies (communication software and systems), where prior to his retirement, he served as company Chairman and Chief Executive Officer. He currently serves on the Boards of Directors of The Mitre Corporation (systems engineering and information technology support for the government), and HRL Laboratories (private research and development, 2004-present). He is Chairman of the General Motors Science & Technology Advisory Board and a Life Fellow of the Institute of Electrical and Electronics Engineers (IEEE). Dr. Heilmeier is a member of the Defense Science Board and the National Security Agency Advisory Board. He is also a member of the National Academy of Engineering, the American Academy of Arts and Sciences, and the Board of Overseers of the School of Engineering and Applied Science of the University of Pennsylvania. Previously, Dr. Heilmeier served as a Director of TRW Inc. (automotive, space, defense, and information technology, 1992-2002), Compaq (1994-2002), Automatic Data Processing, Inc. (ADP) (technology-based business outsourcing, 1995-2002), INET Technologies Inc. (telecommunications network surveillance, 2001-2004), and Teletech Holdings (customer management services). He is the recipient of the 2005 Kyoto Prize in Advanced Technology for his invention of the liquid crystal display, and a member of the Consumer Electronics Hall of Fame. |
James H. Keyes (66) |
| Year of Election or Appointment: 2007 Prior to his retirement in 2003, Mr. Keyes was Chairman, President, and Chief Executive Officer of Johnson Controls, Inc. (automotive supplier, 1993-2003). He currently serves as a member of the boards of LSI Logic Corporation (semiconductor technologies), Navistar International Corporation (manufacture and sale of trucks, buses, and diesel engines, 2002-present), and Pitney Bowes, Inc. (integrated mail, messaging, and document management solutions). |
Marie L. Knowles (60) |
| Year of Election or Appointment: 2001 Prior to Ms. Knowles' retirement in June 2000, she served as Executive Vice President and Chief Financial Officer of Atlantic Richfield Company (ARCO) (diversified energy, 1996-2000). From 1993 to 1996, she was a Senior Vice President of ARCO and President of ARCO Transportation Company. She served as a Director of ARCO from 1996 to 1998. She currently serves as a Director of Phelps Dodge Corporation (copper mining and manufacturing) and McKesson Corporation (healthcare service, 2002-present). Ms. Knowles is a Trustee of the Brookings Institution and the Catalina Island Conservancy and also serves as a member of the Advisory Board for the School of Engineering of the University of Southern California. |
Ned C. Lautenbach (63) |
| Year of Election or Appointment: 2000 Mr. Lautenbach is Chairman of the Independent Trustees (2006-present). Mr. Lautenbach has been a partner of Clayton, Dubilier & Rice, Inc. (private equity investment firm) since September 1998. Previously, Mr. Lautenbach was with the International Business Machines Corporation (IBM) from 1968 until his retirement in 1998. Mr. Lautenbach serves as a Director of Sony Corporation (2006-present) and Eaton Corporation (diversified industrial) as well as the Philharmonic Center for the Arts in Naples, Florida. He also is a member of the Board of Trustees of Fairfield University (2005-present), as well as a member of the Council on Foreign Relations. |
Cornelia M. Small (63) |
| Year of Election or Appointment: 2005 Ms. Small is a member (2000-present) and Chairperson (2002-present) of the Investment Committee, and a member (2002-present) of the Board of Trustees of Smith College. Previously, she served as Chief Investment Officer (1999-2000), Director of Global Equity Investments (1996-1999), and a member of the Board of Directors of Scudder, Stevens & Clark (1990-1997) and Scudder Kemper Investments (1997-1999). In addition, Ms. Small served as Co-Chair (2000-2003) of the Annual Fund for the Fletcher School of Law and Diplomacy. |
William S. Stavropoulos (68) |
| Year of Election or Appointment: 2002 Mr. Stavropoulos is Chairman Emeritus of the Board of Directors of The Dow Chemical Company. Since joining The Dow Chemical Company in 1967, Mr. Stavropoulos served in numerous senior management positions, including President (1993-2000; 2002-2003), CEO (1995-2000; 2002-2004), and Chairman of the Executive Committee (2000-2004). Currently, he is a Director of NCR Corporation (data warehousing and technology solutions), Chemical Financial Corporation, Maersk Inc. (industrial conglomerate, 2002-present), Tyco International, Inc. (multinational manufacturing and services, 2007-present), and a member of the Advisory Board for Metalmark Capital (private equity investment firm, 2005-present). He is a special advisor to Clayton, Dubilier & Rice, Inc., a private equity investment firm. He also serves as a member of the Board of Trustees of the American Enterprise Institute for Public Policy Research. In addition, Mr. Stavropoulos is a member of The Business Council, J.P. Morgan International Council and the University of Notre Dame Advisory Council for the College of Science. |
Kenneth L. Wolfe (68) |
| Year of Election or Appointment: 2005 Prior to his retirement in 2001, Mr. Wolfe was Chairman and Chief Executive Officer of Hershey Foods Corporation (1993-2001). He currently serves as a member of the boards of Adelphia Communications Corporation (2003-present), Bausch & Lomb, Inc., and Revlon Inc. (2004-present). |
Advisory Board Members and Executive Officers:
Correspondence intended for Mr. Mauriello may be sent to Fidelity Investments, P.O. Box 55235, Boston, Massachusetts 02205-5235. Correspondence intended for each executive officer and Mr. Lynch may be sent to Fidelity Investments, 82 Devonshire Street, Boston, Massachusetts 02109.
Name, Age; Principal Occupation |
Peter S. Lynch (63) |
| Year of Election or Appointment: 2003 Member of the Advisory Board of Fidelity Securities Fund. Mr. Lynch is Vice Chairman and a Director of FMR, and Vice Chairman (2001-present) and a Director of FMR Co., Inc. Previously, Mr. Lynch served as a Trustee of the Fidelity funds (1990-2003). In addition, he serves as a Trustee of Boston College and as the Chairman of the Inner-City Scholarship Fund. |
Joseph Mauriello (62) |
| Year of Election or Appointment: 2007 Member of the Advisory Board of Fidelity Securities Fund. Prior to his retirement in January 2006, Mr. Mauriello served in numerous senior management positions including Deputy Chairman and Chief Operating Officer (2004-2005), and Vice Chairman of Financial Services (2002-2004) of KPMG LLP US (professional services firm, 1965-2005). Mr. Mauriello currently serves as a member of the Board of Directors of XL Capital Ltd., (global insurance and re-insurance company, 2006-present) and of Arcadia Resources Inc., (health care services and products, 2007-present). He also served as a Director of the Hamilton Funds of the Bank of New York (2006-2007). |
Kimberley H. Monasterio (43) |
| Year of Election or Appointment: 2007 President and Treasurer of Small Cap Growth. Ms. Monasterio also serves as President and Treasurer of other Fidelity funds (2007-present) and is an employee of FMR (2004-present). Previously, Ms. Monasterio served as Deputy Treasurer of the Fidelity funds (2004-2006). Before joining Fidelity Investments, Ms. Monasterio served as Treasurer (2000-2004) and Chief Financial Officer (2002-2004) of the Franklin Templeton Funds and Senior Vice President of Franklin Templeton Services, LLC (2000-2004). |
Dwight D. Churchill (53) |
| Year of Election or Appointment: 2005 Vice President of Small Cap Growth. Mr. Churchill also serves as Vice President of certain Equity Funds (2005-present). Mr. Churchill is Executive Vice President of FMR (2005-present) and FMR Co., Inc. (2005-present). Previously, Mr. Churchill served as Senior Vice President of Fidelity Investments Money Management, Inc. (2005-2006), Head of Fidelity's Fixed-Income Division (2000-2005), Vice President of Fidelity's Money Market Funds (2000-2005), Vice President of Fidelity's Bond Funds, and Senior Vice President of FMR. |
Bruce T. Herring (41) |
| Year of Election or Appointment: 2006 Vice President of Small Cap Growth. Mr. Herring also serves as Vice President of certain Equity Funds (2006-present). Mr. Herring is Senior Vice President of FMR (2006-present) and Vice President of FMR Co., Inc. (2001-present). Previously, Mr. Herring served as a portfolio manager for Fidelity U.S. Equity Funds (2001-2005). |
Lionel Harris (40) |
| Year of Election or Appointment: 2006
Vice President of Small Cap Growth. Mr. Harris also serves as Vice President of another fund advised by FMR. Prior to assuming his current responsibilities, Mr. Harris worked as a research analyst, high-income director of research, and portfolio manager. |
Eric D. Roiter (58) |
| Year of Election or Appointment: 2004 Secretary of Small Cap Growth. He also serves as Secretary of other Fidelity funds; Vice President, General Counsel, and Secretary of FMR Co., Inc. (2001-present) and FMR; Assistant Secretary of Fidelity Management & Research (U.K.) Inc. (2001-present), Fidelity Research & Analysis Company (2001-present), and Fidelity Investments Money Management, Inc. (2001-present). Mr. Roiter is an Adjunct Member, Faculty of Law, at Boston College Law School (2003-present). Previously, Mr. Roiter served as Vice President and Secretary of Fidelity Distributors Corporation (FDC) (1998-2005). |
Scott C. Goebel (39) |
| Year of Election or Appointment: 2007 Assistant Secretary of Small Cap Growth. Mr. Goebel also serves as Assistant Secretary of other Fidelity funds (2007-present), Vice President and Secretary of FDC (2006-present), and is an employee of FMR. |
R. Stephen Ganis (41) |
| Year of Election or Appointment: 2006 Anti-Money Laundering (AML) officer of Small Cap Growth. Mr. Ganis also serves as AML officer of other Fidelity funds (2006-present) and FMR Corp. (2003-present). Before joining Fidelity Investments, Mr. Ganis practiced law at Goodwin Procter, LLP (2000-2002). |
Joseph B. Hollis (59) |
| Year of Election or Appointment: 2006 Chief Financial Officer of Small Cap Growth. Mr. Hollis also serves as Chief Financial Officer of other Fidelity funds. Mr. Hollis is President of Fidelity Pricing and Cash Management Services (FPCMS) (2005-present). Mr. Hollis also serves as President and Director of Fidelity Service Company, Inc. (2006-present). Previously, Mr. Hollis served as Senior Vice President of Cash Management Services (1999-2002) and Investment Management Operations (2002-2005). |
Kenneth A. Rathgeber (60) |
| Year of Election or Appointment: 2004 Chief Compliance Officer of Small Cap Growth. Mr. Rathgeber also serves as Chief Compliance Officer of other Fidelity funds (2004-present) and Executive Vice President of Risk Oversight for Fidelity Investments (2002-present). He is Chief Compliance Officer of FMR (2005-present), FMR Co., Inc. (2005-present), Fidelity Management & Research (U.K.) Inc. (2005-present), Fidelity Research & Analysis Company (2005-present), Fidelity Investments Money Management, Inc. (2005-present), and Strategic Advisers, Inc. (2005-present). Previously, Mr. Rathgeber served as Executive Vice President and Chief Operating Officer for Fidelity Investments Institutional Services Company, Inc. (1998-2002). |
Bryan A. Mehrmann (46) |
| Year of Election or Appointment: 2005 Deputy Treasurer of Small Cap Growth. Mr. Mehrmann also serves as Deputy Treasurer of other Fidelity funds (2005-present) and is an employee of FMR. Previously, Mr. Mehrmann served as Vice President of Fidelity Investments Institutional Services Group (FIIS)/Fidelity Investments Institutional Operations Corporation, Inc. (FIIOC) Client Services (1998-2004). |
Kenneth B. Robins (37) |
| Year of Election or Appointment: 2005 Deputy Treasurer of Small Cap Growth. Mr. Robins also serves as Deputy Treasurer of other Fidelity funds (2005-present) and is an employee of FMR (2004-present). Before joining Fidelity Investments, Mr. Robins worked at KPMG LLP, where he was a partner in KPMG's department of professional practice (2002-2004) and a Senior Manager (1999-2000). In addition, Mr. Robins served as Assistant Chief Accountant, United States Securities and Exchange Commission (2000-2002). |
Robert G. Byrnes (40) |
| Year of Election or Appointment: 2005 Assistant Treasurer of Small Cap Growth. Mr. Byrnes also serves as Assistant Treasurer of other Fidelity funds (2005-present) and is an employee of FMR (2005-present). Previously, Mr. Byrnes served as Vice President of FPCMS (2003-2005). Before joining Fidelity Investments, Mr. Byrnes worked at Deutsche Asset Management where he served as Vice President of the Investment Operations Group (2000-2003). |
Peter L. Lydecker (53) |
| Year of Election or Appointment: 2004 Assistant Treasurer of Small Cap Growth. Mr. Lydecker also serves as Assistant Treasurer of other Fidelity funds (2004) and is an employee of FMR. |
Gary W. Ryan (48) |
| Year of Election or Appointment: 2005 Assistant Treasurer of Small Cap Growth. Mr. Ryan also serves as Assistant Treasurer of other Fidelity funds (2005-present) and is an employee of FMR (2005-present). Previously, Mr. Ryan served as Vice President of Fund Reporting in FPCMS (1999-2005). |
Annual Report
Distributions
The Board of Trustees of Advisor Small Cap Growth Fund voted to pay on September 10, 2007, to shareholders of record at the opening of business on September 7, 2007, a distribution of $1.044 per share derived from capital gains realized from sales of portfolio securities and a dividend of $.00 per share from net investment income.
The fund hereby designates as a capital gain dividend with respect to the taxable year ended July 31, 2007, $23,164,051, or, if subsequently determined to be different, the net capital gain of such year.
The fund designates 33% of the dividend distributed during the fiscal year as qualifying for the dividends-received deduction for corporate shareholders.
The fund designates 47%, of the dividend distributed in September 2006 as amounts which may be taken into account as a dividend for the purposes of the maximum rate under section 1(h)(11) of the Internal Revenue Code.
The fund will notify shareholders in January 2008 of amounts for use in preparing 2007 income tax returns.
Annual Report
Board Approval of Investment Advisory Contracts and Management Fees
Fidelity Small Cap Growth Fund
Each year, typically in July, the Board of Trustees, including the Independent Trustees (together, the Board), votes on the renewal of the management contract and sub-advisory agreements (together, the Advisory Contracts) for the fund. The Board, assisted by the advice of fund counsel and Independent Trustees' counsel, requests and considers a broad range of information throughout the year.
The Board meets regularly each month except August and takes into account throughout the year matters bearing on Advisory Contracts. The Board, acting directly and through its separate committees, considers at each of its meetings factors that are relevant to the annual renewal of the fund's Advisory Contracts, including the services and support provided to the fund and its shareholders. At the time of the renewal, the Board had 12 standing committees, each composed of Independent Trustees with varying backgrounds, to which the Board has assigned specific subject matter responsibilities in order to enhance effective decision-making by the Board. Each committee has adopted a written charter outlining the structure and purposes of the committee. One such committee, the Equity Contract Committee, meets periodically as needed throughout the year to consider matters specifically related to the annual renewal of Advisory Contracts. The committee requests and receives information on, and makes recommendations to the Independent Trustees concerning, the approval and annual review of the Advisory Contracts.
At its July 2007 meeting, the Board of Trustees, including the Independent Trustees, unanimously determined to renew the Advisory Contracts for the fund. In reaching its determination, the Board considered all factors it believed relevant, including (i) the nature, extent, and quality of the services to be provided to the fund and its shareholders (including the investment performance of the fund); (ii) the competitiveness of the management fee and total expenses of the fund; (iii) the total costs of the services to be provided by and the profits to be realized by the investment adviser and its affiliates from the relationship with the fund; (iv) the extent to which economies of scale would be realized as the fund grows; and (v) whether fee levels reflect these economies of scale, if any, for the benefit of fund shareholders. The Board also approved amendments to the fund's agreements with foreign sub-advisers to clarify that each sub-adviser provides services as an independent contractor.
In determining whether to renew the Advisory Contracts for the fund, the Board ultimately reached a determination, with the assistance of fund counsel and Independent Trustees' counsel, that the renewal of the Advisory Contracts and the compensation to be received by Fidelity under the management contract is consistent with Fidelity's fiduciary duty under applicable law. In addition to evaluating the specific factors noted above, the Board, in reaching its determination, is aware that shareholders in the fund have a broad range of investment choices available to them, including a wide choice among mutual funds offered by competitors to Fidelity, and that the fund's shareholders, with the opportunity to review and weigh the disclosure provided by the fund in its prospectus and other public disclosures, have chosen to invest in this fund, managed by Fidelity.
Annual Report
Board Approval of Investment Advisory Contracts and
Management Fees - continued
Nature, Extent, and Quality of Services Provided. The Board considered staffing within the investment adviser, FMR, and the sub-advisers (together, the Investment Advisers), including the background of the fund's portfolio manager and the fund's investment objective and discipline. The Independent Trustees also had discussions with senior management of Fidelity's investment operations and investment groups. The Board considered the structure of the portfolio manager compensation program and whether this structure provides appropriate incentives.
Resources Dedicated to Investment Management and Support Services. The Board reviewed the size, education, and experience of the Investment Advisers' investment staff, their use of technology, and the Investment Advisers' approach to recruiting, training, and retaining portfolio managers and other research, advisory, and management personnel. The Board considered Fidelity's extensive global research capabilities that enable the Investment Advisers to aggregate data from various sources in an effort to produce positive investment results. The Board noted that Fidelity's analysts have access to a variety of technological tools that enable them to perform both fundamental and quantitative analysis and to specialize in various disciplines. The Board also considered that Fidelity's portfolio managers and analysts have access to daily portfolio attribution that allows for monitoring of a fund's portfolio, as well as an electronic communication system that provides immediate real-time access to research concerning issuers and credit enhancers.
Shareholder and Administrative Services. The Board considered (i) the nature, extent, quality, and cost of advisory, administrative, distribution, and shareholder services performed by the Investment Advisers and their affiliates under the Advisory Contracts and under separate agreements covering transfer agency, pricing and bookkeeping, and securities lending services for the fund; (ii) the nature and extent of the Investment Advisers' supervision of third party service providers, principally custodians and subcustodians; and (iii) the resources devoted to, and the record of compliance with, the fund's compliance policies and procedures. The Board reviewed the allocation of fund brokerage, including allocations to brokers affiliated with the Investment Advisers, the use of brokerage commissions to pay fund expenses, and the use of "soft" commission dollars to pay for research services. The Board also considered that Fidelity voluntarily pays for market data out of its own resources.
The Board noted that the growth of fund assets across the complex allows Fidelity to reinvest in the development of services designed to enhance the value or convenience of the Fidelity funds as investment vehicles. These services include 24 hour access to account information and market information through phone representatives and over the Internet, and investor education materials and asset allocation tools.
Annual Report
Investment in a Large Fund Family. The Board considered the benefits to shareholders of investing in a Fidelity fund, including the benefits of investing in a fund that is part of a large family of funds offering a variety of investment disciplines and providing for a large variety of mutual fund investor services. For example, fund shareholders are offered the privilege of exchanging shares of the fund for shares of other Fidelity funds, as set forth in the fund's prospectus, without paying a sales charge. The Board noted that, since the last Advisory Contract renewals in July 2006, Fidelity has taken a number of actions that benefited particular funds, including (i) dedicating additional resources to investment research and to restructure the investment research teams; (ii) contractually agreeing to reduce the management fee on Fidelity Advisor Floating Rate High Income Fund; (iii) contractually agreeing to reduce the management fees on Fidelity's California, Massachusetts, New Jersey, and New York AMT Tax-Free Money Market Funds, launching new Institutional Classes and Service Classes of these funds, and contractually agreeing to impose expense limitations on these funds; (iv) eliminating the exchange fee on the Fidelity Select Portfolios and reducing the pricing and bookkeeping fee rates for these funds; (v) reducing the maximum transfer agency fee rates on high income funds and certain equity funds; (vi) proposing amended management contracts that, if approved by shareholders, will add a performance adjustment component to the management fees paid by 18 Fidelity Advisor equity funds; (vii) contractually agreeing to reduce fees for Ultra-Short Central Fund and the money market Central Funds; (viii) waiving the Fidelity Advisor funds' contingent deferred sales charge on certain redemptions made through systematic withdrawal programs; and (ix) amending the management contracts for equity and fixed-income funds whose management contracts incorporate a "group fee" structure by adding four new fee "breakpoints" to the group fee rate schedules.
Investment Performance and Compliance. The Board considered whether the fund has operated within its investment objective, as well as its record of compliance with its investment restrictions. It also reviewed the fund's absolute investment performance for each class, as well as the fund's relative investment performance for each class measured against (i) a broad-based securities market index, and (ii) a peer group of mutual funds deemed appropriate by the Board. Because the fund had been in existence less than three calendar years, the following chart considered by the Board shows, for the one-year period ended December 31, 2006, the total returns of Institutional Class (Class I) and Class B of the fund, the total return of a broad-based securities market index ("benchmark"), and a range of total returns of a peer group of mutual funds identified by Morningstar, Inc. as having an investment style similar to that of the fund based on underlying portfolio holdings. The returns of Institutional Class (Class I) and Class B show the performance of the highest and lowest performing classes, respectively. The box within the chart shows the 25th percentile return (bottom of box) and the 75th percentile return (top of box) of the peer group. Returns shown above the box are in the first quartile and returns shown below the box are in the fourth quartile. The percentage beaten numbers noted below the chart correspond to the percentile box and represent the percentage of funds in the peer group whose performance was equal to or lower than that of the class indicated.
Annual Report
Board Approval of Investment Advisory Contracts and
Management Fees - continued
Fidelity Small Cap Growth Fund
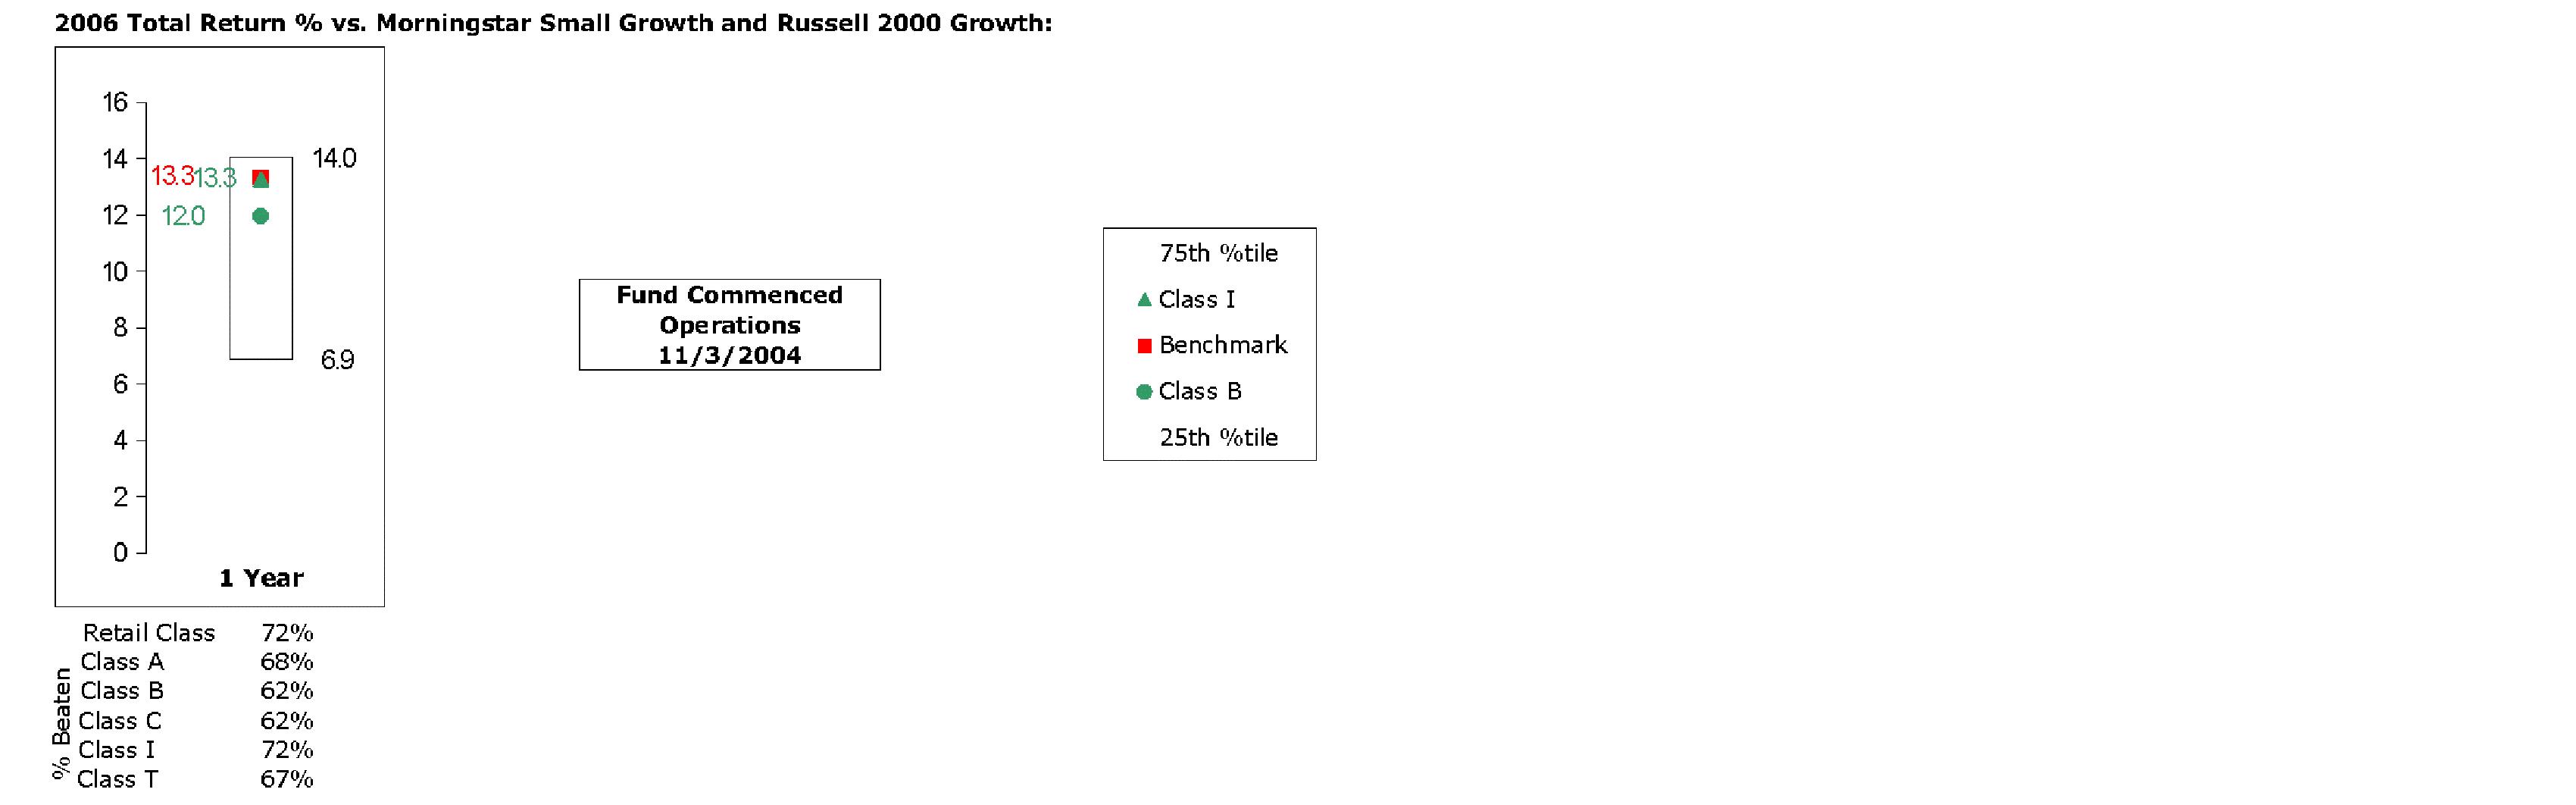
The Board reviewed the fund's relative investment performance against its peer group and stated that the performance of Institutional Class (Class I) of the fund was in the second quartile for the period shown. The Board also stated that the investment performance of Institutional Class (Class I) of the fund compared favorably to its benchmark for the period shown. The Board considered that the variations in performance among the fund's classes reflect the variations in class expenses, which result in lower performance for higher expense classes. The Board stated that it is difficult to evaluate in any comprehensive fashion the performance of the fund, in light of its relatively recent commencement of operations.
The Board also considered that the fund's management fee is subject to upward or downward adjustment depending upon whether, and to what extent, the fund's investment performance for the performance period exceeds, or is exceeded by, the record (over the same period) of a Board-approved performance adjustment index. The Board realizes that the performance adjustment provides FMR with a strong economic incentive to seek to achieve superior performance for the fund's shareholders and helps to more closely align the interests of FMR and the fund's shareholders.
Annual Report
The Board considered that FMR has taken steps to refocus and strengthen equity research, equity portfolio management, and compliance.
Based on its review, and giving particular weight to the nature and quality of the resources dedicated by the Investment Advisers to maintain and improve relative performance, the Board concluded that the nature, extent, and quality of the services provided to the fund will benefit the fund's shareholders, particularly in light of the Board's view that the fund's shareholders benefit from investing in a fund that is part of a large family of funds offering a variety of investment disciplines and services.
Competitiveness of Management Fee and Total Fund Expenses. The Board considered the fund's management fee and total expenses compared to "mapped groups" of competitive funds and classes. Fidelity creates "mapped groups" by combining similar Lipper investment objective categories that have comparable management fee characteristics. Combining Lipper investment objective categories aids the Board's management fee and total expense comparisons by broadening the competitive group used for comparison and by reducing the number of universes to which various Fidelity funds are compared. The Board also considered supplemental information about how the fund's management fee and total expenses ranked relative to groups based on Lipper classifications, which take into account a fund's market capitalization and style.
The Board considered two proprietary management fee comparisons for the 12-month (or shorter) periods shown in the chart below. The group of Lipper funds used by the Board for management fee comparisons is referred to below as the "Total Mapped Group." The Total Mapped Group comparison focuses on a fund's standing relative to the total universe of comparable funds available to investors, in terms of gross management fees before expense reimbursements or caps, and without giving effect to the fund's performance adjustment. "TMG %" represents the percentage of funds in the Total Mapped Group that had management fees that were lower than the fund's. For example, a TMG % of 13% means that 87% of the funds in the Total Mapped Group had higher management fees than the fund. The "Asset-Size Peer Group" (ASPG) comparison focuses on a fund's standing relative to non-Fidelity funds similar in size to the fund within the Total Mapped Group. The ASPG represents at least 15% of the funds in the Total Mapped Group with comparable asset size and management fee characteristics, subject to a minimum of 50 funds (or all funds in the Total Mapped Group if fewer than 50). Additional information, such as the ASPG quartile in which the fund's management fee ranked and the impact of the fund's performance adjustment, is also included in the chart and considered by the Board.
Annual Report
Board Approval of Investment Advisory Contracts and
Management Fees - continued
Fidelity Small Cap Growth Fund

The Board noted that the fund's management fee ranked below the median of its Total Mapped Group and below the median of its ASPG for 2006. The Board also noted the effect of the fund's positive performance adjustment on the fund's management fee ranking. The Board noted that the performance adjustment for each year represents calculations for performance periods that differ from the period shown in the performance chart above.
Based on its review, the Board concluded that the fund's management fee was fair and reasonable in light of the services that the fund receives and the other factors considered.
In its review of each class's total expenses, the Board considered the fund's management fee as well as other fund or class expenses, as applicable, such as transfer agent fees, pricing and bookkeeping fees, fund-paid 12b-1 fees, and custodial, legal, and audit fees. The Board also noted the effects of any waivers and reimbursements on fees and expenses, as well as the fund's positive performance adjustment. As part of its review, the Board also considered current and historical total expenses of each class of the fund compared to competitive fund median expenses. Each class of the fund is compared to those funds and classes in the Total Mapped Group (used by the Board for management fee comparisons) that have a similar sales load structure.
The Board noted that the total expenses of each of Class A, Institutional Class, and Fidelity Small Cap Growth (retail class) ranked below its competitive median for 2006, the total expenses of Class B ranked equal to its competitive median for 2006, and the total expenses of each of Class T and Class C ranked above its competitive median for 2006. The Board considered that the total expenses of Class C were above the median because of its higher transfer agent fee due to small average account size. The Board noted that the fund offers multiple classes, each of which has a different sales load and 12b-1 fee structure, and that the multiple structures are intended to offer a range of pricing options for the intermediary market. The Board also noted that the total expenses of the classes vary primarily by the level of their 12b-1 fees, although differences in transfer agent fees may also cause expenses to vary from class to class.
Annual Report
In its review of total expenses, the Board also considered Fidelity fee structures and other information on clients that FMR and its affiliates service in other competitive markets, such as other mutual funds advised or subadvised by FMR or its affiliates, pension plan clients, and other institutional clients.
Based on its review, the Board concluded that the total expenses of each class of the fund were reasonable, although in some cases above the median of the universe presented for comparison, in light of the services that the fund and its shareholders receive and the other factors considered.
Costs of the Services and Profitability. The Board considered the revenues earned and the expenses incurred by Fidelity in conducting the business of developing, marketing, distributing, managing, administering and servicing the fund and its shareholders. The Board also considered the level of Fidelity's profits in respect of all the Fidelity funds.
On an annual basis, FMR presents to the Board Fidelity's profitability for the fund. Fidelity calculates the profitability for each fund, as well as aggregate profitability for groups of Fidelity funds and all Fidelity funds, using a series of detailed revenue and cost allocation methodologies which originate with the audited books and records of Fidelity. The Audit Committee of the Board reviews any significant changes from the prior year's methodologies.
PricewaterhouseCoopers LLP (PwC), independent registered public accounting firm and auditor to Fidelity and certain Fidelity funds, has been engaged annually by the Board as part of the Board's assessment of the results of Fidelity's profitability analysis. PwC's engagement includes the review and assessment of Fidelity's methodologies used in determining the revenues and expenses attributable to Fidelity's mutual fund business, and completion of agreed-upon procedures surrounding the mathematical accuracy of fund profitability and its conformity to allocation methodologies. After considering PwC's reports issued under the engagement and information provided by Fidelity, the Board believes that while other allocation methods may also be reasonable, Fidelity's profitability methodologies are reasonable in all material respects.
Annual Report
Board Approval of Investment Advisory Contracts and
Management Fees - continued
The Board has also reviewed Fidelity's non-fund businesses and any fall-out benefits related to the mutual fund business as well as cases where Fidelity's affiliates may benefit from or be related to the fund's business.
The Board considered the costs of the services provided by and the profits realized by Fidelity in connection with the operation of the fund and determined that the amount of profit is a fair entrepreneurial profit for the management of the fund.
Economies of Scale. The Board considered whether there have been economies of scale in respect of the management of the Fidelity funds, whether the Fidelity funds (including the fund) have appropriately benefited from any such economies of scale, and whether there is potential for realization of any further economies of scale. The Board considered the extent to which the fund will benefit from economies of scale through increased services to the fund, through waivers or reimbursements, or through fee or expense reductions, including reductions that occur through operation of the transfer agent agreement. The transfer agent fee varies in part based on the number of accounts in the fund. If the number of accounts decreases or the average account size increases, the overall transfer agent fee rate decreases.
The Board recognized that the fund's management contract incorporates a "group fee" structure, which provides for lower group fee rates as total fund assets under FMR's management increase, and for higher group fee rates as total fund assets under FMR's management decrease. FMR determines the group fee rates based on a tiered asset "breakpoint" schedule. In connection with the renewal of the fund's management contract, the Board approved amendments to the fund's management contract that added four new fee breakpoints to the group fee rate schedule for assets under FMR's management above $1,386 billion. The Board considered that the group fee rate declines under both the present and amended schedules, but that under the amended schedule, the group fee rate declines faster as assets under FMR's management exceed $1,386 billion. The Board considered that the group fee is designed to deliver the benefits of economies of scale to fund shareholders when total fund assets increase, even if assets of any particular fund are unchanged or have declined, because some portion of Fidelity's costs are attributable to services provided to all Fidelity funds, and all funds benefit if those costs can be allocated among more assets. The Board concluded that, given the group fee structure, fund shareholders will achieve a certain level of economies of scale as assets under FMR's management increase at the fund complex level, regardless of whether Fidelity achieves any such economies of scale.
The Board further concluded that any potential economies of scale are being shared between fund shareholders and Fidelity in an appropriate manner.
Additional Information Requested by the Board. In order to develop fully the factual basis for consideration of the Fidelity funds' Advisory Contracts, the Board requested and received additional information on several topics, including (i) fund performance trends and actions to be taken by FMR to improve certain funds' overall performance; (ii) Fidelity's portfolio manager compensation structure, including its effects on fund profitability and the extent to which portfolio manager compensation is linked to fund performance; (iii) Fidelity's fee structures; (iv) the funds' sub-advisory arrangements; and (v) accounts managed by Fidelity other than the Fidelity funds.
Annual Report
Based on its evaluation of all of the conclusions noted above, and after considering all material factors, the Board ultimately concluded that the advisory fee structures are fair and reasonable, and that the fund's Advisory Contracts should be renewed.
Annual Report
Managing Your Investments
Fidelity offers several ways to conveniently manage your personal investments via your telephone or PC. You can access your account information, conduct trades and research your investments 24 hours a day.
By Phone
Fidelity Automated Service Telephone provides a single toll-free number to access account balances, positions, quotes and trading. It's easy to navigate the service, and on your first call, the system will help you create a personal identification number (PIN) for security.
(phone_graphic)
Fidelity Automated
Service Telephone (FAST®)
1-800-544-5555
Press
1 For mutual fund and brokerage trading.
2 For quotes.*
3 For account balances and holdings.
4 To review orders and mutual
fund activity.
5 To change your PIN.
*0 To speak to a Fidelity representative.
By PC
Fidelity's web site on the Internet provides a wide range of information, including daily financial news, fund performance, interactive planning tools and news about Fidelity products and services.
(computer_graphic)
Fidelity's Web Site
www.fidelity.com
* When you call the quotes line, please remember that a fund's yield and return will vary and, except for money market funds, share price will also vary. This means that you may have a gain or loss when you sell your shares. There is no assurance that money market funds will be able to maintain a stable $1 share price; an investment in a money market fund is not insured or guaranteed by the U.S. government. Total returns are historical and include changes in share price, reinvestment of dividends and capital gains, and the effects of any sales charges.
Annual Report
To Write Fidelity
We'll give your correspondence immediate attention and send you written confirmation upon completion of your request.
(letter_graphic)
Making Changes
To Your Account
(such as changing name, address, bank, etc.)
Fidelity Investments
P.O. Box 770001
Cincinnati, OH 45277-0002
(letter_graphic)
For Non-Retirement
Accounts
Buying shares
Fidelity Investments
P.O. Box 770001
Cincinnati, OH 45277-0003
Overnight Express
Fidelity Investments
Attn: Distribution Services
100 Crosby Parkway - KC1H
Covington, KY 41015
Selling shares
Fidelity Investments
P.O. Box 770001
Cincinnati, OH 45277-0035
Overnight Express
Fidelity Investments
Attn: Distribution Services
100 Crosby Parkway - KC1H
Covington, KY 41015
General Correspondence
Fidelity Investments
P.O. Box 500
Merrimack, NH 03054-0500
(letter_graphic)
For Retirement
Accounts
Buying shares
Fidelity Investments
P.O. Box 770001
Cincinnati, OH 45277-0003
Selling shares
Fidelity Investments
P.O. Box 770001
Cincinnati, OH 45277-0035
Overnight Express
Fidelity Investments
Attn: Distribution Services
100 Crosby Parkway - KC1H
Covington, KY 41015
General Correspondence
Fidelity Investments
P.O. Box 500
Merrimack, NH 03054-0500
Annual Report
To Visit Fidelity
For directions and hours,
please call 1-800-544-9797.
Arizona
7001 West Ray Road
Chandler, AZ
15445 N. Scottsdale Road
Scottsdale, AZ
California
815 East Birch Street
Brea, CA
1411 Chapin Avenue
Burlingame, CA
851 East Hamilton Avenue
Campbell, CA
19200 Von Karman Avenue
Irvine, CA
601 Larkspur Landing Circle
Larkspur, CA
10100 Santa Monica Blvd.
Los Angeles, CA
27101 Puerta Real
Mission Viejo, CA
73-575 El Paseo
Palm Desert, CA
251 University Avenue
Palo Alto, CA
123 South Lake Avenue
Pasadena, CA
16995 Bernardo Ctr. Drive
Rancho Bernardo, CA
1220 Roseville Parkway
Roseville, CA
1740 Arden Way
Sacramento, CA
7676 Hazard Center Drive
San Diego, CA
11943 El Camino Real
San Diego, CA
8 Montgomery Street
San Francisco, CA
3793 State Street
Santa Barbara, CA
1200 Wilshire Boulevard
Santa Monica, CA
21701 Hawthorne Boulevard
Torrance, CA
2001 North Main Street
Walnut Creek, CA
6300 Canoga Avenue
Woodland Hills, CA
Colorado
1625 Broadway
Denver, CO
9185 Westview Road
Lone Tree, CO
Connecticut
48 West Putnam Avenue
Greenwich, CT
265 Church Street
New Haven, CT
300 Atlantic Street
Stamford, CT
29 South Main Street
West Hartford, CT
Delaware
400 Delaware Avenue
Wilmington, DE
Florida
4400 N. Federal Highway
Boca Raton, FL
121 Alhambra Plaza
Coral Gables, FL
2948 N. Federal Highway
Ft. Lauderdale, FL
4671 Town Center Parkway
Jacksonville, FL
1907 West State Road 434
Longwood, FL
8880 Tamiami Trail, North
Naples, FL
3501 PGA Boulevard
Palm Beach Gardens, FL
3550 Tamiami Trail, South
Sarasota, FL
1502 N. Westshore Blvd.
Tampa, FL
2465 State Road 7
Wellington, FL
Georgia
3445 Peachtree Road, N.E.
Atlanta, GA
1000 Abernathy Road
Atlanta, GA
Illinois
One North LaSalle Street
Chicago, IL
875 North Michigan Ave.
Chicago, IL
1415 West 22nd Street
Oak Brook, IL
1572 East Golf Road
Schaumburg, IL
3232 Lake Avenue
Wilmette, IL
Indiana
4729 East 82nd Street
Indianapolis, IN
Kansas
5400 College Boulevard
Overland Park, KS
Maine
Three Canal Plaza
Portland, ME
Maryland
7315 Wisconsin Avenue
Bethesda, MD
One W. Pennsylvania Ave.
Towson, MD
Massachusetts
801 Boylston Street
Boston, MA
155 Congress Street
Boston, MA
300 Granite Street
Braintree, MA
44 Mall Road
Burlington, MA
238 Main Street
Cambridge, MA
405 Cochituate Road
Framingham, MA
416 Belmont Street
Worcester, MA
Annual Report
Michigan
500 E. Eisenhower Pkwy.
Ann Arbor, MI
280 Old N. Woodward Ave.
Birmingham, MI
43420 Grand River Avenue
Novi, MI
29155 Northwestern Hwy.
Southfield, MI
Minnesota
7600 France Avenue South
Edina, MN
Missouri
1524 South Lindbergh Blvd.
St. Louis, MO
Nevada
2225 Village Walk Drive
Henderson, NV
New Jersey
150 Essex Street
Millburn, NJ
56 South Street
Morristown, NJ
396 Route 17, North
Paramus, NJ
3518 Route 1 North
Princeton, NJ
530 Broad Street
Shrewsbury, NJ
New York
1055 Franklin Avenue
Garden City, NY
37 West Jericho Turnpike
Huntington Station, NY
1271 Avenue of the Americas
New York, NY
980 Madison Avenue
New York, NY
61 Broadway
New York, NY
350 Park Avenue
New York, NY
200 Fifth Avenue
New York, NY
733 Third Avenue
New York, NY
11 Penn Plaza
New York, NY
2070 Broadway
New York, NY
1075 Northern Blvd.
Roslyn, NY
799 Central Park Avenue
Scarsdale, NY
North Carolina
4611 Sharon Road
Charlotte, NC
7011 Fayetteville Road
Durham, NC
Ohio
3805 Edwards Road
Cincinnati, OH
1324 Polaris Parkway
Columbus, OH
28699 Chagrin Boulevard
Woodmere Village, OH
Oregon
7493 SW Bridgeport Road
Tigard, OR
Pennsylvania
600 West DeKalb Pike
King of Prussia, PA
1735 Market Street
Philadelphia, PA
12001 Perry Highway
Wexford, PA
Rhode Island
47 Providence Place
Providence, RI
Tennessee
6150 Poplar Avenue
Memphis, TN
Texas
10000 Research Boulevard
Austin, TX
4001 Northwest Parkway
Dallas, TX
12532 Memorial Drive
Houston, TX
2701 Drexel Drive
Houston, TX
6560 Fannin Street
Houston, TX
6500 N. MacArthur Blvd.
Irving, TX
6005 West Park Boulevard
Plano, TX
14100 San Pedro
San Antonio, TX
1576 East Southlake Blvd.
Southlake, TX
19740 IH 45 North
Spring, TX
Utah
279 West South Temple
Salt Lake City, UT
Virginia
1861 International Drive
McLean, VA
Washington
411 108th Avenue, N.E.
Bellevue, WA
1518 6th Avenue
Seattle, WA
Washington, DC
1900 K Street, N.W.
Washington, DC
Wisconsin
595 North Barker Road
Brookfield, WI
Fidelity Brokerage Services, Inc., 100 Summer St., Boston, MA 02110 Member NYSE/SIPC
Annual Report
Annual Report
Annual Report
Investment Adviser
Fidelity Management & Research Company
Boston, MA
Investment Sub-Advisers
FMR Co., Inc.
Fidelity Research & Analysis Company
Fidelity Management & Research
(U.K.) Inc.
Fidelity Investments Japan Limited
Fidelity International Investment
Advisors
Fidelity International Investment
Advisors (U.K.) Limited
General Distributor
Fidelity Distributors Corporation
Boston, MA
Transfer and Service Agent
Fidelity Service Company, Inc.
Boston, MA
Custodian
Citibank, N.A.
New York, NY
The Fidelity Telephone Connection
Mutual Fund 24-Hour Service
Exchanges/Redemptions
and Account Assistance 1-800-544-6666
Product Information 1-800-544-6666
Retirement Accounts 1-800-544-4774
(8 a.m. - 9 p.m.)
TDD Service 1-800-544-0118
for the deaf and hearing impaired
(9 a.m. - 9 p.m. Eastern time)
Fidelity Automated Service
Telephone (FAST®) (automated graphic) 1-800-544-5555
(automated graphic) Automated line for quickest service
SCP-UANN-0907
1.803694.102
(Fidelity Investment logo)(registered trademark)
Corporate Headquarters
82 Devonshire St., Boston, MA 02109
www.fidelity.com
(Fidelity Investment logo)(registered trademark)
FidelityAdvisor
Small Cap Growth
Fund - Class A, Class T,
Class B and Class C
Annual Report
July 31, 2007
Class A, Class T, Class B,
and Class C are classes
of Fidelity® Small Cap
Growth Fund
(2_fidelity_logos) (Registered_Trademark)
Contents
Chairman's Message | <Click Here> | Ned Johnson's message to shareholders. |
Performance | <Click Here> | How the fund has done over time. |
Management's Discussion | <Click Here> | The manager's review of fund performance, strategy and outlook. |
Shareholder Expense Example | <Click Here> | An example of shareholder expenses. |
Investment Changes | <Click Here> | A summary of major shifts in the fund's investments over the past six months. |
Investments | <Click Here> | A complete list of the fund's investments with their market values. |
Financial Statements | <Click Here> | Statements of assets and liabilities, operations, and changes in net assets,
as well as financial highlights. |
Notes | <Click Here> | Notes to the financial statements. |
Report of Independent Registered Public Accounting Firm | <Click Here> | |
Trustees and Officers | <Click Here> | |
Distributions | <Click Here> | |
Board Approval of Investment Advisory Contracts and Management Fees | <Click Here> | |
To view a fund's proxy voting guidelines and proxy voting record for the 12-month period ended June 30, visit http://www.fidelity.com (search for "proxy voting guidelines") or visit the Securities and Exchange Commission's (SEC) web site at http://www.sec.gov. You may also call 1-877-208-0098 to request a free copy of the proxy voting guidelines.
Standard & Poor's, S&P and S&P 500 are registered service marks of The McGraw-Hill Companies, Inc. and have been licensed for use by Fidelity Distributors Corporation.
Other third party marks appearing herein are the property of their respective owners.
All other marks appearing herein are registered or unregistered trademarks or service marks of FMR Corp. or an affiliated company.
Annual Report
This report and the financial statements contained herein are submitted for the general information of the shareholders of the fund. This report is not authorized for distribution to prospective investors in the fund unless preceded or accompanied by an effective prospectus.
A fund files its complete schedule of portfolio holdings with the SEC for the first and third quarters of each fiscal year on Form N-Q. Forms N-Q are available on the SEC's web site at http://www.sec.gov. A fund's Forms N-Q may be reviewed and copied at the SEC's Public Reference Room in Washington, DC. Information regarding the operation of the SEC's Public Reference Room may be obtained by calling 1-800-SEC-0330. For a complete list of a fund's portfolio holdings, view the most recent holdings listing, semiannual report, or annual report on Fidelity's web site at http://www.fidelity.com or http://www.advisor.fidelity.com, as applicable.
NOT FDIC INSURED · MAY LOSE VALUE · NO BANK GUARANTEE
Neither the fund nor Fidelity Distributors Corporation is a bank.
Annual Report
Chairman's Message
(photo_of_Edward_C_Johnson_3d)
Dear Shareholder:
Stocks are currently on pace to register their fifth-straight year of positive returns, although gains could be trimmed if the U.S. economy continues to slow. While financial markets are always unpredictable, there are a number of time-tested principles that can put the historical odds in your favor.
One of the basic tenets is to invest for the long term. Over time, riding out the markets' inevitable ups and downs has proven much more effective than selling into panic or chasing the hottest trend. Even missing only a few of the markets' best days can significantly diminish investor returns. Patience also affords the benefits of compounding - of earning interest on additional income or reinvested dividends and capital gains. There are tax advantages and cost benefits to consider as well. The more you sell, the more taxes you pay, and the more you trade, the higher the costs. While staying the course doesn't eliminate risk, it can considerably lessen the effect of short-term declines.
You can further manage your investing risk through diversification. And today, more than ever, geographic diversification should be taken into account. Studies indicate that asset allocation is the single most important determinant of a portfolio's long-term success. The right mix of stocks, bonds and cash - aligned to your particular risk tolerance and investment objective - is very important. Age-appropriate rebalancing is also an essential aspect of asset allocation. For younger investors, an emphasis on equities - which historically have been the best-performing asset class over time - is encouraged. As investors near their specific goal, such as retirement or sending a child to college, consideration may be given to replacing volatile assets (e.g. common stocks) with more-stable fixed investments (bonds or savings plans).
A third investment principle - investing regularly - can help lower the average cost of your purchases. Investing a certain amount of money each month or quarter helps ensure you won't pay for all your shares at market highs. This strategy - known as dollar cost averaging - also reduces unconstructive "emotion" from investing, helping shareholders avoid selling weak performers just prior to an upswing, or chasing a hot performer just before a correction.
We invite you to contact us via the Internet, through our Investor Centers or over the phone. It is our privilege to provide you the information you need to make the investments that are right for you.
Sincerely,
/s/Edward C. Johnson 3d
Edward C. Johnson 3d
Annual Report
Fidelity Advisor Small Cap Growth Fund - Class A, T, B, and C
Performance: The Bottom Line
Average annual total return reflects the change in the value of an investment, assuming reinvestment of the class' dividend income and capital gains (the profits earned upon the sale of securities that have grown in value) and assuming a constant rate of performance each year. The $10,000 table and the fund's returns do not reflect the deduction of taxes that a shareholder would pay on fund distributions or the redemption of fund shares. During periods of reimbursement by Fidelity, a fund's total return will be greater than it would be had the reimbursement not occurred. How a fund did yesterday is no guarantee of how it will do tomorrow.
Average Annual Total Returns
Periods ended July 31, 2007 | Past 1
year | Life of
FundA |
Class A (incl. 5.75% sales charge) | 18.30% | 17.14% |
Class T (incl. 3.50% sales charge) | 20.80% | 17.88% |
Class B (incl. contingent deferred sales charge) B | 19.57% | 17.97% |
Class C (incl. contingent deferred sales charge) C | 23.59% | 18.80% |
A From November 3, 2004.
B Class B shares' contingent deferred sales charges included in the past one year and life of fund total return figures are 5% and 3%, respectively.
C Class C shares' contingent deferred sales charges included in the past one year and life of fund total return figures are 1% and 0%, respectively.
Annual Report
Performance - continued
$10,000 Over Life of Fund
Let's say hypothetically that $10,000 was invested in Fidelity Advisor Small Cap Growth Fund - Class T on November 3, 2004, when the fund started, and the current 3.50% sales charge was paid. The chart shows how the value of your investment would have changed, and also shows how the Russell 2000® Growth Index performed over the same period.
Annual Report
Management's Discussion of Fund Performance
Comments from Lionel Harris, Portfolio Manager of Fidelity Advisor Small Cap Growth Fund
Major U.S. equity benchmarks approached or exceeded gains of 20% and several set record highs during the 12-month period ending July 31, 2007. In that time, the Dow Jones Industrial AverageSM rose 20.84%, the Standard & Poor's 500SM Index advanced 16.13% and the NASDAQ Composite® Index gained 22.67%. The small-cap Russell 2000® Index fared less well after falling nearly 7% in July, but still returned 12.12% for the year overall. The first half of the period featured six consecutive months of positive returns spurred by the more relaxed monetary policy of the Federal Reserve Board and falling energy prices, which softened inflationary pressures on the U.S. economy. Stocks slipped in February, however, as energy prices crept higher, the housing market slumped, subprime mortgage woes mounted and the Chinese stock market declined 9% in a single day. But equities soared again from March through May, as reflected by the Dow and the S&P 500®, which climbed nearly 12% and more than 9%, respectively. In June and July, though, stocks sank again on inflation concerns and a worsening subprime loan crisis.
During the past year, the fund's Class A, Class T, Class B and Class C shares returned 25.52%, 25.18%, 24.57% and 24.59%, respectively (excluding sales charges), beating its benchmark, the Russell 2000 Growth Index, which rose 16.83%. Security selection in industrials - especially among capital goods stocks - was a huge positive, as was security selection in energy, which made up for an unhelpful overweighting there. In health care, the fund benefited from successful stock picks along with a significant underweighting in the pharmaceuticals/biotechnology/life science industry. My choices within financials also contributed. In contrast, very few sectors detracted, with some underperformance from consumer staples and utilities stocks. A modest cash allocation also hampered results. The portfolio's best-performing stock by far was an out-of-benchmark position in Western Refining. The backdrop for oil refiners such as Western remained extremely strong during the past year. Also outperforming was health care and non-benchmark stock Kos Pharmaceuticals - bought out before period end - and risk-management consultant Huron Consulting. An out-of-benchmark position in Omnicare was my biggest disappointment. The company struggled to overcome a variety of challenges, and I sold my position before period end. A missed opportunity was not owning benchmark component AK Steel, whose shares soared as steel prices continued to rise. Another recent laggard I sold was Sierra Health Services.
The views expressed above reflect those of the portfolio manager(s) only through the end of the period as stated on the cover of this report and do not necessarily represent the views of Fidelity or any other person in the Fidelity organization. Any such views are subject to change at any time based upon market or other conditions and Fidelity disclaims any responsibility to update such views. These views may not be relied on as investment advice and, because investment decisions for a Fidelity fund are based on numerous factors, may not be relied on as an indication of trading intent on behalf of any Fidelity fund.
Annual Report
Shareholder Expense Example
As a shareholder of the Fund, you incur two types of costs: (1) transaction costs, including sales charges (loads) on purchase payments or redemption proceeds, redemption fees, and (2) ongoing costs, including management fees, distribution and/or service (12b-1) fees and other Fund expenses. This Example is intended to help you understand your ongoing costs (in dollars) of investing in the Fund and to compare these costs with the ongoing costs of investing in other mutual funds.
The Example is based on an investment of $1,000 invested at the beginning of the period and held for the entire period (February 1, 2007 to July 31, 2007).
Actual Expenses
The first line of the accompanying table for each class of the Fund provides information about actual account values and actual expenses. You may use the information in this line, together with the amount you invested, to estimate the expenses that you paid over the period. Simply divide your account value by $1,000.00 (for example, an $8,600 account value divided by $1,000.00 = 8.6), then multiply the result by the number in the first line for a class of the Fund under the heading entitled "Expenses Paid During Period" to estimate the expenses you paid on your account during this period. A small balance maintenance fee of $12.00 that is charged once a year may apply for certain accounts with a value of less than $2,000. This fee is not included in the table below. If it was, the estimate of expenses you paid during the period would be higher, and your ending account value lower, by this amount. In addition, the Fund, as a shareholder in the underlying Fidelity Central Funds, will indirectly bear its pro rata share of the fees and expenses incurred by the underlying Fidelity Central Funds. These fees and expenses are not included in the Fund's annualized expense ratio used to calculate the expense estimate in the table below.
Hypothetical Example for Comparison Purposes
The second line of the accompanying table for each class of the Fund provides information about hypothetical account values and hypothetical expenses based on a Class' actual expense ratio and an assumed rate of return of 5% per year before expenses, which is not the Class' actual return. The hypothetical account values and expenses may not be used to estimate the actual ending account balance or expenses you paid for the period. You may use this information to compare the ongoing costs of investing in the Fund and other funds. To do so, compare this 5% hypothetical example with the 5% hypothetical examples that appear in the shareholder reports of the other funds. A small balance maintenance fee of $12.00 that is charged once a year may apply for certain accounts with a value of less than $2,000. This fee is not included in the table below. If it was, the estimate of expenses you paid during the period would be higher, and your ending account value lower, by this amount. In addition, the Fund, as a shareholder in the underlying Fidelity Central Funds, will indirectly bear its pro rata share of the fees and expenses incurred by the underlying Fidelity Central Funds. These fees and expenses are not included in the Fund's annualized expense ratio used to calculate the expense estimate in the table below.
Annual Report
Please note that the expenses shown in the table are meant to highlight your ongoing costs only and do not reflect any transaction costs. Therefore, the second line of the table is useful in comparing ongoing costs only, and will not help you determine the relative total costs of owning different funds. In addition, if these transactional costs were included, your costs would have been higher.
| Beginning
Account Value
February 1, 2007 | Ending
Account Value
July 31, 2007 | Expenses Paid
During Period*
February 1, 2007
to July 31, 2007 |
Class A | | | |
Actual | $ 1,000.00 | $ 1,081.50 | $ 7.23 |
HypotheticalA | $ 1,000.00 | $ 1,017.85 | $ 7.00 |
Class T | | | |
Actual | $ 1,000.00 | $ 1,080.30 | $ 8.51 |
HypotheticalA | $ 1,000.00 | $ 1,016.61 | $ 8.25 |
Class B | | | |
Actual | $ 1,000.00 | $ 1,078.20 | $ 11.08 |
HypotheticalA | $ 1,000.00 | $ 1,014.13 | $ 10.74 |
Class C | | | |
Actual | $ 1,000.00 | $ 1,077.60 | $ 11.08 |
HypotheticalA | $ 1,000.00 | $ 1,014.13 | $ 10.74 |
Small Cap Growth | | | |
Actual | $ 1,000.00 | $ 1,083.20 | $ 5.58 |
HypotheticalA | $ 1,000.00 | $ 1,019.44 | $ 5.41 |
Institutional Class | | | |
Actual | $ 1,000.00 | $ 1,083.90 | $ 5.27 |
HypotheticalA | $ 1,000.00 | $ 1,019.74 | $ 5.11 |
A 5% return per year before expenses
* Expenses are equal to each Class' annualized expense ratio (shown in the table below); multiplied by the average account value over the period, multiplied by 181/365 (to reflect the one-half year period).
| Annualized
Expense Ratio |
Class A | 1.40% |
Class T | 1.65% |
Class B | 2.15% |
Class C | 2.15% |
Small Cap Growth | 1.08% |
Institutional Class | 1.02% |
Annual Report
Investment Changes
Top Ten Stocks as of July 31, 2007 |
| % of fund's
net assets | % of fund's net assets
6 months ago |
Harris Corp. | 1.5 | 1.4 |
Satyam Computer Services Ltd. sponsored ADR | 1.5 | 1.1 |
Trimble Navigation Ltd. | 1.4 | 1.0 |
Respironics, Inc. | 1.3 | 1.1 |
Titanium Metals Corp. | 1.3 | 0.9 |
j2 Global Communications, Inc. | 1.3 | 1.4 |
Chattem, Inc. | 1.3 | 0.8 |
VCA Antech, Inc. | 1.3 | 1.1 |
Huron Consulting Group, Inc. | 1.2 | 1.3 |
Flowserve Corp. | 1.2 | 1.0 |
| 13.3 | |
Top Five Market Sectors as of July 31, 2007 |
| % of fund's
net assets | % of fund's net assets
6 months ago |
Information Technology | 24.4 | 27.5 |
Industrials | 18.0 | 21.2 |
Health Care | 16.9 | 13.6 |
Energy | 10.7 | 9.0 |
Consumer Discretionary | 9.3 | 11.5 |
Asset Allocation (% of fund's net assets) |
As of July 31, 2007 * | As of January 31, 2007 ** |
| Stocks 95.9% | | | Stocks 96.2% | |
| Short-Term
Investments and
Net Other Assets 4.1% | | | Short-Term
Investments and
Net Other Assets 3.8% | |
* Foreign
investments | 10.2% | | ** Foreign
investments | 9.6% | |

Annual Report
Investments July 31, 2007
Showing Percentage of Net Assets
Common Stocks - 95.9% |
| Shares | | Value |
CONSUMER DISCRETIONARY - 9.3% |
Auto Components - 0.6% |
WABCO Holdings, Inc. (f) | 152,800 | | $ 7,334,400 |
Diversified Consumer Services - 0.8% |
Apollo Group, Inc. Class A (non-vtg.) (a) | 162,000 | | 9,575,820 |
Hotels, Restaurants & Leisure - 1.9% |
Life Time Fitness, Inc. (a)(d) | 131,900 | | 6,782,298 |
McCormick & Schmick's Seafood Restaurants (a) | 295,100 | | 7,194,538 |
Ruth's Chris Steak House, Inc. (a) | 602,700 | | 10,077,144 |
| | 24,053,980 |
Media - 1.6% |
Arbitron, Inc. | 80,700 | | 4,018,860 |
New Frontier Media, Inc. | 643,044 | | 5,459,444 |
R.H. Donnelley Corp. (a) | 180,800 | | 11,305,424 |
| | 20,783,728 |
Specialty Retail - 2.4% |
Hibbett Sports, Inc. (a) | 383,200 | | 9,821,416 |
Payless ShoeSource, Inc. (a) | 390,300 | | 10,389,786 |
The Men's Wearhouse, Inc. | 193,400 | | 9,553,960 |
| | 29,765,162 |
Textiles, Apparel & Luxury Goods - 2.0% |
Iconix Brand Group, Inc. (a)(d) | 510,600 | | 10,099,668 |
Skechers U.S.A., Inc. Class A (sub. vtg.) (a) | 214,475 | | 4,458,935 |
Volcom, Inc. (a) | 293,900 | | 10,427,572 |
| | 24,986,175 |
TOTAL CONSUMER DISCRETIONARY | | 116,499,265 |
CONSUMER STAPLES - 2.3% |
Personal Products - 2.3% |
Bare Escentuals, Inc. | 240,000 | | 6,770,400 |
Chattem, Inc. (a) | 287,500 | | 16,146,000 |
Physicians Formula Holdings, Inc. | 389,805 | | 5,827,585 |
| | 28,743,985 |
ENERGY - 10.7% |
Energy Equipment & Services - 3.5% |
Hanover Compressor Co. (a) | 475,400 | | 11,328,782 |
Hornbeck Offshore Services, Inc. (a)(d) | 170,600 | | 7,344,330 |
Common Stocks - continued |
| Shares | | Value |
ENERGY - continued |
Energy Equipment & Services - continued |
NATCO Group, Inc. Class A (a) | 235,800 | | $ 10,915,182 |
Superior Energy Services, Inc. (a) | 361,500 | | 14,575,680 |
| | 44,163,974 |
Oil, Gas & Consumable Fuels - 7.2% |
Cabot Oil & Gas Corp. | 231,100 | | 7,903,620 |
EXCO Resources, Inc. (a) | 550,000 | | 9,603,000 |
Forest Oil Corp. (a) | 353,033 | | 14,287,246 |
Foundation Coal Holdings, Inc. | 175,800 | | 6,126,630 |
Mariner Energy, Inc. (a) | 456,210 | | 9,639,717 |
Petrohawk Energy Corp. (a) | 749,100 | | 11,229,009 |
Range Resources Corp. | 216,350 | | 8,035,239 |
Tesoro Corp. | 280,600 | | 13,973,880 |
Western Refining, Inc. | 175,700 | | 9,751,350 |
| | 90,549,691 |
TOTAL ENERGY | | 134,713,665 |
FINANCIALS - 7.9% |
Commercial Banks - 0.8% |
UMB Financial Corp. | 277,724 | | 10,370,214 |
Consumer Finance - 1.1% |
Cash America International, Inc. | 175,400 | | 6,423,148 |
Dollar Financial Corp. (a) | 282,378 | | 7,076,393 |
| | 13,499,541 |
Diversified Financial Services - 0.2% |
Endeavor Acquisition Corp. (a) | 225,700 | | 2,493,985 |
Insurance - 4.5% |
Aspen Insurance Holdings Ltd. | 318,800 | | 7,794,660 |
Max Capital Group Ltd. | 312,075 | | 8,148,278 |
National Financial Partners Corp. | 275,200 | | 12,758,272 |
StanCorp Financial Group, Inc. | 186,982 | | 8,780,675 |
Universal American Financial Corp. (a) | 450,831 | | 8,976,045 |
Willis Group Holdings Ltd. | 252,600 | | 10,253,034 |
| | 56,710,964 |
Real Estate Management & Development - 1.0% |
CB Richard Ellis Group, Inc. Class A (a) | 348,100 | | 12,155,652 |
Common Stocks - continued |
| Shares | | Value |
FINANCIALS - continued |
Thrifts & Mortgage Finance - 0.3% |
Triad Guaranty, Inc. (a) | 155,600 | | $ 4,289,892 |
TOTAL FINANCIALS | | 99,520,248 |
HEALTH CARE - 16.9% |
Biotechnology - 0.2% |
Cephalon, Inc. (a) | 35,000 | | 2,629,900 |
Health Care Equipment & Supplies - 7.1% |
American Medical Systems Holdings, Inc. (a)(d) | 579,700 | | 10,596,916 |
ArthroCare Corp. (a) | 155,700 | | 7,881,534 |
Immucor, Inc. (a) | 328,400 | | 10,232,944 |
Integra LifeSciences Holdings Corp. (a)(d) | 163,600 | | 8,122,740 |
Inverness Medical Innovations, Inc. (a) | 197,500 | | 9,560,975 |
Mentor Corp. (d) | 187,200 | | 7,366,320 |
Meridian Bioscience, Inc. | 285,000 | | 6,364,050 |
Respironics, Inc. (a) | 361,400 | | 16,534,050 |
Shandong Weigao Group Medical Polymer Co. Ltd.
(H shares) | 1,440,000 | | 3,576,205 |
Sirona Dental Systems, Inc. (a)(d) | 245,500 | | 8,680,880 |
| | 88,916,614 |
Health Care Providers & Services - 5.2% |
Healthways, Inc. (a)(d) | 207,418 | | 9,064,167 |
Henry Schein, Inc. (a) | 211,700 | | 11,503,778 |
Humana, Inc. (a) | 167,900 | | 10,760,711 |
PSS World Medical, Inc. (a) | 543,399 | | 9,362,765 |
Sun Healthcare Group, Inc. (a) | 610,800 | | 8,258,016 |
VCA Antech, Inc. (a) | 408,600 | | 16,074,324 |
| | 65,023,761 |
Health Care Technology - 1.0% |
Allscripts Healthcare Solutions, Inc. (a)(d) | 300,000 | | 6,825,000 |
Cerner Corp. (a) | 123,500 | | 6,529,445 |
| | 13,354,445 |
Life Sciences Tools & Services - 1.7% |
Harvard Bioscience, Inc. (a) | 448,000 | | 2,302,720 |
ICON PLC sponsored ADR | 149,890 | | 7,010,355 |
Pharmaceutical Product Development, Inc. | 353,400 | | 11,838,900 |
| | 21,151,975 |
Common Stocks - continued |
| Shares | | Value |
HEALTH CARE - continued |
Pharmaceuticals - 1.7% |
Adams Respiratory Therapeutics, Inc. (a)(d) | 263,100 | | $ 9,737,331 |
Medicis Pharmaceutical Corp. Class A | 410,500 | | 11,711,565 |
| | 21,448,896 |
TOTAL HEALTH CARE | | 212,525,591 |
INDUSTRIALS - 18.0% |
Aerospace & Defense - 2.0% |
Hexcel Corp. (a)(d) | 604,200 | | 13,135,308 |
Ladish Co., Inc. (a) | 255,300 | | 12,379,497 |
| | 25,514,805 |
Airlines - 0.5% |
Delta Air Lines, Inc. (a) | 359,700 | | 6,409,854 |
Commercial Services & Supplies - 6.1% |
American Reprographics Co. (a)(d) | 256,300 | | 6,386,996 |
CDI Corp. | 399,200 | | 11,293,368 |
Clean Harbors, Inc. (a) | 187,500 | | 9,005,625 |
CoStar Group, Inc. (a)(d) | 181,736 | | 9,268,536 |
Huron Consulting Group, Inc. (a) | 229,000 | | 15,555,970 |
InnerWorkings, Inc. (d) | 424,300 | | 5,664,405 |
Kenexa Corp. (a) | 239,000 | | 8,551,420 |
Navigant Consulting, Inc. (a) | 691,500 | | 10,891,125 |
| | 76,617,445 |
Construction & Engineering - 3.0% |
Chicago Bridge & Iron Co. NV (NY Shares) | 247,700 | | 10,056,620 |
Fluor Corp. | 113,200 | | 13,075,732 |
Infrasource Services, Inc. (a) | 233,200 | | 8,073,384 |
Washington Group International, Inc. (a) | 70,300 | | 5,646,496 |
| | 36,852,232 |
Electrical Equipment - 1.9% |
EnerSys (a) | 482,200 | | 8,727,820 |
Genlyte Group, Inc. (a) | 117,300 | | 8,160,561 |
Q-Cells AG (a)(d) | 76,100 | | 6,737,304 |
| | 23,625,685 |
Industrial Conglomerates - 0.7% |
Raven Industries, Inc. | 261,600 | | 8,899,632 |
Machinery - 3.1% |
Bucyrus International, Inc. Class A (d) | 222,400 | | 14,135,744 |
Common Stocks - continued |
| Shares | | Value |
INDUSTRIALS - continued |
Machinery - continued |
Flowserve Corp. | 211,000 | | $ 15,248,970 |
IDEX Corp. | 271,953 | | 9,847,418 |
| | 39,232,132 |
Transportation Infrastructure - 0.7% |
Quixote Corp. (e) | 459,900 | | 8,618,526 |
TOTAL INDUSTRIALS | | 225,770,311 |
INFORMATION TECHNOLOGY - 24.4% |
Communications Equipment - 3.8% |
F5 Networks, Inc. (a) | 111,600 | | 9,674,604 |
Harris Corp. (d) | 356,700 | | 19,575,693 |
Nice Systems Ltd. sponsored ADR (a) | 216,500 | | 7,192,130 |
Polycom, Inc. (a) | 367,500 | | 11,381,475 |
| | 47,823,902 |
Electronic Equipment & Instruments - 2.6% |
Cogent, Inc. (a)(d) | 578,000 | | 7,693,180 |
ScanSource, Inc. (a) | 285,600 | | 7,662,648 |
Trimble Navigation Ltd. (a) | 525,300 | | 17,350,659 |
| | 32,706,487 |
Internet Software & Services - 3.5% |
CyberSource Corp. (a)(d) | 351,060 | | 4,040,701 |
Equinix, Inc. (a)(d) | 166,200 | | 14,444,442 |
j2 Global Communications, Inc. (a)(d) | 497,800 | | 16,248,192 |
ValueClick, Inc. (a) | 431,700 | | 9,229,746 |
| | 43,963,081 |
IT Services - 6.0% |
Authorize.Net Holdings, Inc. (a) | 420,900 | | 7,294,197 |
CACI International, Inc. Class A (a) | 231,700 | | 10,296,748 |
Datacash Group PLC | 1,590,400 | | 8,690,687 |
MoneyGram International, Inc. | 389,400 | | 9,964,746 |
Satyam Computer Services Ltd. sponsored ADR (d) | 710,100 | | 18,931,266 |
SI International, Inc. (a) | 225,547 | | 6,570,184 |
SRA International, Inc. Class A (a) | 287,200 | | 6,841,104 |
WNS Holdings Ltd. ADR (a) | 310,500 | | 7,762,500 |
| | 76,351,432 |
Common Stocks - continued |
| Shares | | Value |
INFORMATION TECHNOLOGY - continued |
Semiconductors & Semiconductor Equipment - 5.2% |
California Micro Devices Corp. (a) | 837,900 | | $ 3,753,792 |
Entegris, Inc. (a) | 944,800 | | 10,184,944 |
FormFactor, Inc. (a) | 313,900 | | 12,050,621 |
Hittite Microwave Corp. (a) | 340,521 | | 13,695,755 |
Microsemi Corp. (a)(d) | 373,400 | | 8,703,954 |
Rudolph Technologies, Inc. (a) | 288,744 | | 4,518,844 |
Tessera Technologies, Inc. (a) | 297,900 | | 12,252,627 |
| | 65,160,537 |
Software - 3.3% |
Ansys, Inc. (a) | 384,000 | | 9,999,360 |
Blackbaud, Inc. | 717,459 | | 15,023,591 |
Business Objects SA sponsored ADR (a) | 186,000 | | 8,370,000 |
Fair Isaac Corp. | 202,400 | | 7,946,224 |
| | 41,339,175 |
TOTAL INFORMATION TECHNOLOGY | | 307,344,614 |
MATERIALS - 4.7% |
Metals & Mining - 4.7% |
Carpenter Technology Corp. | 110,300 | | 13,091,507 |
Meridian Gold, Inc. (a) | 511,400 | | 14,436,826 |
Reliance Steel & Aluminum Co. | 275,700 | | 14,485,278 |
Titanium Metals Corp. (a)(d) | 493,500 | | 16,492,770 |
| | 58,506,381 |
TELECOMMUNICATION SERVICES - 0.6% |
Diversified Telecommunication Services - 0.6% |
Cbeyond, Inc. (a) | 230,500 | | 8,152,785 |
UTILITIES - 1.1% |
Multi-Utilities - 1.1% |
AEM SpA | 2,153,700 | | 7,211,347 |
CMS Energy Corp. | 413,200 | | 6,677,312 |
| | 13,888,659 |
TOTAL COMMON STOCKS (Cost $1,133,658,256) | 1,205,665,504 |
Money Market Funds - 12.4% |
| Shares | | Value |
Fidelity Cash Central Fund, 5.38% (b) | 63,874,490 | | $ 63,874,490 |
Fidelity Securities Lending Cash Central Fund, 5.39% (b)(c) | 92,012,535 | | 92,012,535 |
TOTAL MONEY MARKET FUNDS (Cost $155,887,025) | 155,887,025 |
TOTAL INVESTMENT PORTFOLIO - 108.3% (Cost $1,289,545,281) | | 1,361,552,529 |
NET OTHER ASSETS - (8.3)% | | (104,475,734) |
NET ASSETS - 100% | $ 1,257,076,795 |
Legend |
(a) Non-income producing |
(b) Affiliated fund that is available only to investment companies and other accounts managed by Fidelity Investments. The rate quoted is the annualized seven-day yield of the fund at period end. A complete unaudited listing of the fund's holdings as of its most recent quarter end is available upon request. |
(c) Investment made with cash collateral received from securities on loan. |
(d) Security or a portion of the security is on loan at period end. |
(e) Affiliated company |
(f) Security or a portion of the security purchased on a delayed delivery or when-issued basis. |
Affiliated Central Funds |
Information regarding fiscal year to date income earned by the Fund from investments in Fidelity Central Funds is as follows: |
Fund | Income earned |
Fidelity Cash Central Fund | $ 1,506,865 |
Fidelity Securities Lending Cash Central Fund | 198,991 |
Total | $ 1,705,856 |
Other Affiliated Issuers |
An affiliated company is a company in which the fund has ownership of at least 5% of the voting securities. Fiscal year to date transactions with companies which are or were affiliates are as follows: |
Affiliate | Value, beginning of period | Purchases | Sale
Proceeds | Dividend
Income | Value,
end of
period |
Quixote Corp. | $ - | $ 9,171,364 | $ - | $ 76,046 | $ 8,618,526 |
Other Information |
Distribution of investments by country of issue, as a percentage of total net assets, is as follows: |
United States of America | 89.8% |
Bermuda | 2.1% |
India | 1.5% |
United Kingdom | 1.3% |
Canada | 1.2% |
Others (individually less than 1%) | 4.1% |
| 100.0% |
See accompanying notes which are an integral part of the financial statements.
Annual Report
Financial Statements
Statement of Assets and Liabilities
| July 31, 2007 |
Assets | | |
Investment in securities, at value (including securities loaned of $88,633,500) - See accompanying schedule: Unaffiliated issuers (cost $1,124,486,892) | $ 1,197,046,978 | |
Fidelity Central Funds (cost $155,887,025) | 155,887,025 | |
Other affiliated issuers (cost $9,171,364) | 8,618,526 | |
Total Investments (cost $1,289,545,281) | | $ 1,361,552,529 |
Cash | | 1,722,189 |
Receivable for investments sold | | 10,792,738 |
Receivable for fund shares sold | | 2,386,230 |
Dividends receivable | | 11,578 |
Distributions receivable from Fidelity Central Funds | | 253,144 |
Prepaid expenses | | 888 |
Other receivables | | 11,831 |
Total assets | | 1,376,731,127 |
| | |
Liabilities | | |
Payable for investments purchased
Regular delivery | $ 17,678,327 | |
Delayed delivery | 8,029,181 | |
Payable for fund shares redeemed | 782,233 | |
Accrued management fee | 801,876 | |
Distribution fees payable | 43,739 | |
Other affiliated payables | 256,045 | |
Other payables and accrued expenses | 50,396 | |
Collateral on securities loaned, at value | 92,012,535 | |
Total liabilities | | 119,654,332 |
| | |
Net Assets | | $ 1,257,076,795 |
Net Assets consist of: | | |
Paid in capital | | $ 1,103,854,866 |
Accumulated undistributed net realized gain (loss) on investments and foreign currency transactions | | 81,214,930 |
Net unrealized appreciation (depreciation) on investments and assets and liabilities in foreign currencies | | 72,006,999 |
Net Assets | | $ 1,257,076,795 |
See accompanying notes which are an integral part of the financial statements.
Annual Report
Financial Statements - continued
Statement of Assets and Liabilities - continued
| July 31, 2007 |
Calculation of Maximum Offering Price Class A:
Net Asset Value and redemption price per share ($33,587,517 ÷
2,090,838 shares) | $ 16.06 |
| |
Maximum offering price per share (100/94.25 of $16.06) | $ 17.04 |
Class T:
Net Asset Value and redemption price per share ($26,418,676 ÷ 1,649,872 shares) | $ 16.01 |
| |
Maximum offering price per share (100/96.50 of $16.01) | $ 16.59 |
Class B:
Net Asset Value and offering price per share ($6,242,258 ÷ 393,886 shares)A | $ 15.85 |
| |
Class C:
Net Asset Value and offering price per share ($22,347,810 ÷ 1,410,730 shares)A | $ 15.84 |
| |
| |
Small Cap Growth:
Net Asset Value, offering price and redemption price per share ($1,149,809,489 ÷ 71,180,036 shares) | $ 16.15 |
| |
Institutional Class:
Net Asset Value, offering price and redemption price per share ($18,671,045 ÷ 1,156,200 shares) | $ 16.15 |
A Redemption price per share is equal to net asset value less any applicable contingent deferred sales charge.
See accompanying notes which are an integral part of the financial statements.
Annual Report
Statement of Operations
| Year ended July 31, 2007 |
Investment Income | | |
Dividends (including $76,046 earned from other affiliated issuers) | | $ 2,689,721 |
Special dividends | | 308,003 |
Interest | | 6,819 |
Income from Fidelity Central Funds | | 1,705,856 |
Total income | | 4,710,399 |
| | |
Expenses | | |
Management fee
Basic fee | $ 5,656,543 | |
Performance adjustment | 721,094 | |
Transfer agent fees | 1,956,268 | |
Distribution fees | 434,374 | |
Accounting and security lending fees | 286,522 | |
Custodian fees and expenses | 29,858 | |
Independent trustees' compensation | 2,307 | |
Registration fees | 111,021 | |
Audit | 52,611 | |
Legal | 5,687 | |
Miscellaneous | 12,571 | |
Total expenses before reductions | 9,268,856 | |
Expense reductions | (120,825) | 9,148,031 |
Net investment income (loss) | | (4,437,632) |
Realized and Unrealized Gain (Loss) Net realized gain (loss) on: | | |
Investment securities: | | |
Unaffiliated issuers | 87,838,465 | |
Foreign currency transactions | 24,427 | |
Total net realized gain (loss) | | 87,862,892 |
Change in net unrealized appreciation (depreciation) on: Investment securities | 65,703,013 | |
Assets and liabilities in foreign currencies | (249) | |
Total change in net unrealized appreciation (depreciation) | | 65,702,764 |
Net gain (loss) | | 153,565,656 |
Net increase (decrease) in net assets resulting from operations | | $ 149,128,024 |
See accompanying notes which are an integral part of the financial statements.
Annual Report
Financial Statements - continued
Statement of Changes in Net Assets
| Year ended
July 31,
2007 | Year ended
July 31,
2006 |
Increase (Decrease) in Net Assets | | |
Operations | | |
Net investment income (loss) | $ (4,437,632) | $ (2,229,695) |
Net realized gain (loss) | 87,862,892 | 5,473,930 |
Change in net unrealized appreciation (depreciation) | 65,702,764 | (13,283,719) |
Net increase (decrease) in net assets resulting
from operations | 149,128,024 | (10,039,484) |
Distributions to shareholders from net realized gain | (3,591,980) | (3,779,478) |
Share transactions - net increase (decrease) | 637,612,035 | 259,409,742 |
Redemption fees | 160,118 | 233,448 |
Total increase (decrease) in net assets | 783,308,197 | 245,824,228 |
| | |
Net Assets | | |
Beginning of period | 473,768,598 | 227,944,370 |
End of period | $ 1,257,076,795 | $ 473,768,598 |
See accompanying notes which are an integral part of the financial statements.
Annual Report
Financial Highlights - Class A
Years ended July 31, | 2007 | 2006 | 2005K |
Selected Per-Share Data | | | |
Net asset value, beginning of period | $ 12.88 | $ 12.95 | $ 10.00 |
Income from Investment Operations | | | |
Net investment income (loss)E | (.12)H | (.10)I | (.07) |
Net realized and unrealized gain (loss) | 3.39 | .18J | 3.01 |
Total from investment operations | 3.27 | .08 | 2.94 |
Distributions from net realized gain | (.09) | (.16) | - |
Redemption fees added to paid in capitalE | -M | .01 | .01 |
Net asset value, end of period | $ 16.06 | $ 12.88 | $ 12.95 |
Total ReturnB,C,D | 25.52% | .70% | 29.50% |
Ratios to Average Net AssetsF,L | | | |
Expenses before reductions | 1.44% | 1.53% | 1.55%A |
Expenses net of fee waivers, if any | 1.40% | 1.40% | 1.45%A |
Expenses net of all reductions | 1.39% | 1.35% | 1.36%A |
Net investment income (loss) | (.80)%H | (.79)%I | (.78)%A |
Supplemental Data | | | |
Net assets, end of period (000 omitted) | $ 33,588 | $ 18,104 | $ 4,719 |
Portfolio turnover rateG | 91% | 129% | 93%A |
A Annualized
B Total returns for periods of less than one year are not annualized.
C Total returns would have been lower had certain expenses not been reduced during the periods shown.
D Total returns do not include the effect of the sales charges.
E Calculated based on average shares outstanding during the period.
F Fees and expenses of the underlying Fidelity Central Funds are not included in the Fund's expense ratio. The Fund indirectly bears its proportionate share of the expenses of any underlying Fidelity Central Funds.
G Amount does not include the portfolio activity of any underlying Fidelity Central Funds.
H Investment income per share reflects a special dividend which amounted to $.01 per share. Excluding the special dividend, the ratio of net investment income (loss) to average net assets would have been (.84)%.
I Investment income per share reflects a special dividend which amounted to $.01 per share. Excluding the special dividend, the ratio of net investment income (loss) to average net assets would have been (.85)%.
J The amount shown for a share outstanding does not correspond with the aggregate net gain (loss) on investments for the period due to the timing of sales and repurchases of shares in relation to fluctuating market values of the investments of the Fund.
K For the period November 3, 2004 (commencement of operations) to July 31, 2005.
L Expense ratios reflect operating expenses of the class. Expenses before reductions do not reflect amounts reimbursed by the investment adviser or reductions from brokerage service arrangements or other expense offset arrangements and do not represent the amount paid by the class during periods when reimbursements or reductions occur. Expense ratios before reductions for start-up periods may not be representative of longer-term operating periods. Expenses net of fee waivers reflect expenses after reimbursement by the investment adviser but prior to reductions from brokerage service arrangements or other expense offset arrangements. Expenses net of all reductions represent the net expenses paid by the class.
M Amount represents less than $.01 per share.
See accompanying notes which are an integral part of the financial statements.
Annual Report
Financial Highlights - Class T
Years ended July 31, | 2007 | 2006 | 2005K |
Selected Per-Share Data | | | |
Net asset value, beginning of period | $ 12.86 | $ 12.93 | $ 10.00 |
Income from Investment Operations | | | |
Net investment income (loss)E | (.16)H | (.14)I | (.09) |
Net realized and unrealized gain (loss) | 3.38 | .19J | 3.01 |
Total from investment operations | 3.22 | .05 | 2.92 |
Distributions from net realized gain | (.07) | (.13) | - |
Redemption fees added to paid in capitalE | -M | .01 | .01 |
Net asset value, end of period | $ 16.01 | $ 12.86 | $ 12.93 |
Total ReturnB,C,D | 25.18% | .48% | 29.30% |
Ratios to Average Net AssetsF,L | | | |
Expenses before reductions | 1.67% | 1.73% | 1.79%A |
Expenses net of fee waivers, if any | 1.65% | 1.65% | 1.70%A |
Expenses net of all reductions | 1.65% | 1.60% | 1.61%A |
Net investment income (loss) | (1.05)%H | (1.04)%I | (1.03)%A |
Supplemental Data | | | |
Net assets, end of period (000 omitted) | $ 26,419 | $ 19,205 | $ 5,240 |
Portfolio turnover rateG | 91% | 129% | 93%A |
A Annualized
B Total returns for periods of less than one year are not annualized.
C Total returns would have been lower had certain expenses not been reduced during the periods shown.
D Total returns do not include the effect of the sales charges.
E Calculated based on average shares outstanding during the period.
F Fees and expenses of the underlying Fidelity Central Funds are not included in the Fund's expense ratio. The Fund indirectly bears its proportionate share of the expenses of any underlying Fidelity Central Funds.
G Amount does not include the portfolio activity of any underlying Fidelity Central Funds.
H Investment income per share reflects a special dividend which amounted to $.01 per share. Excluding the special dividend, the ratio of net investment income (loss) to average net assets would have been (1.09)%.
I Investment income per share reflects a special dividend which amounted to $.01 per share. Excluding the special dividend, the ratio of net investment income (loss) to average net assets would have been (1.10)%.
J The amount shown for a share outstanding does not correspond with the aggregate net gain (loss) on investments for the period due to the timing of sales and repurchases of shares in relation to fluctuating market values of the investments of the Fund.
K For the period November 3, 2004 (commencement of operations) to July 31, 2005.
L Expense ratios reflect operating expenses of the class. Expenses before reductions do not reflect amounts reimbursed by the investment adviser or reductions from brokerage service arrangements or other expense offset arrangements and do not represent the amount paid by the class during periods when reimbursements or reductions occur. Expense ratios before reductions for start-up periods may not be representative of longer-term operating periods. Expenses net of fee waivers reflect expenses after reimbursement by the investment adviser but prior to reductions from brokerage service arrangements or other expense offset arrangements. Expenses net of all reductions represent the net expenses paid by the class.
M Amount represents less than $.01 per share.
See accompanying notes which are an integral part of the financial statements.
Annual Report
Financial Highlights - Class B
Years ended July 31, | 2007 | 2006 | 2005K |
Selected Per-Share Data | | | |
Net asset value, beginning of period | $ 12.78 | $ 12.87 | $ 10.00 |
Income from Investment Operations | | | |
Net investment income (loss)E | (.23)H | (.20)I | (.13) |
Net realized and unrealized gain (loss) | 3.36 | .19J | 2.99 |
Total from investment operations | 3.13 | (.01) | 2.86 |
Distributions from net realized gain | (.06) | (.09) | - |
Redemption fees added to paid in capitalE | -M | .01 | .01 |
Net asset value, end of period | $ 15.85 | $ 12.78 | $ 12.87 |
Total ReturnB,C,D | 24.57% | (.03)% | 28.70% |
Ratios to Average Net AssetsF,L | | | |
Expenses before reductions | 2.20% | 2.28% | 2.33%A |
Expenses net of fee waivers, if any | 2.15% | 2.15% | 2.20%A |
Expenses net of all reductions | 2.15% | 2.10% | 2.11%A |
Net investment income (loss) | (1.55)%H | (1.54)%I | (1.53)%A |
Supplemental Data | | | |
Net assets, end of period (000 omitted) | $ 6,242 | $ 5,191 | $ 2,055 |
Portfolio turnover rateG | 91% | 129% | 93%A |
A Annualized
B Total returns for periods of less than one year are not annualized.
C Total returns would have been lower had certain expenses not been reduced during the periods shown.
D Total returns do not include the effect of the contingent deferred sales charge.
E Calculated based on average shares outstanding during the period.
F Fees and expenses of the underlying Fidelity Central Funds are not included in the Fund's expense ratio. The Fund indirectly bears its proportionate share of the expenses of any underlying Fidelity Central Funds.
G Amount does not include the portfolio activity of any underlying Fidelity Central Funds.
H Investment income per share reflects a special dividend which amounted to $.01 per share. Excluding the special dividend, the ratio of net investment income (loss) to average net assets would have been (1.59)%.
I Investment income per share reflects a special dividend which amounted to $.01 per share. Excluding the special dividend, the ratio of net investment income (loss) to average net assets would have been (1.60)%.
J The amount shown for a share outstanding does not correspond with the aggregate net gain (loss) on investments for the period due to the timing of sales and repurchases of shares in relation to fluctuating market values of the investments of the Fund.
K For the period November 3, 2004 (commencement of operations) to July 31, 2005.
L Expense ratios reflect operating expenses of the class. Expenses before reductions do not reflect amounts reimbursed by the investment adviser or reductions from brokerage service arrangements or other expense offset arrangements and do not represent the amount paid by the class during periods when reimbursements or reductions occur. Expense ratios before reductions for start-up periods may not be representative of longer-term operating periods. Expenses net of fee waivers reflect expenses after reimbursement by the investment adviser but prior to reductions from brokerage service arrangements or other expense offset arrangements. Expenses net of all reductions represent the net expenses paid by the class.
M Amount represents less than $.01 per share.
See accompanying notes which are an integral part of the financial statements.
Annual Report
Financial Highlights - Class C
Years ended July 31, | 2007 | 2006 | 2005K |
Selected Per-Share Data | | | |
Net asset value, beginning of period | $ 12.77 | $ 12.88 | $ 10.00 |
Income from Investment Operations | | | |
Net investment income (loss)E | (.23)H | (.20)I | (.13) |
Net realized and unrealized gain (loss) | 3.36 | .18J | 3.00 |
Total from investment operations | 3.13 | (.02) | 2.87 |
Distributions from net realized gain | (.06) | (.10) | - |
Redemption fees added to paid in capitalE | -M | .01 | .01 |
Net asset value, end of period | $ 15.84 | $ 12.77 | $ 12.88 |
Total ReturnB,C,D | 24.59% | (.08)% | 28.80% |
Ratios to Average Net AssetsF,L | | | |
Expenses before reductions | 2.20% | 2.25% | 2.24%A |
Expenses net of fee waivers, if any | 2.15% | 2.15% | 2.17%A |
Expenses net of all reductions | 2.14% | 2.10% | 2.09%A |
Net investment income (loss) | (1.55)%H | (1.54)%I | (1.50)%A |
Supplemental Data | | | |
Net assets, end of period (000 omitted) | $ 22,348 | $ 14,682 | $ 8,372 |
Portfolio turnover rateG | 91% | 129% | 93%A |
A Annualized
B Total returns for periods of less than one year are not annualized.
C Total returns would have been lower had certain expenses not been reduced during the periods shown.
D Total returns do not include the effect of the contingent deferred sales charge.
E Calculated based on average shares outstanding during the period.
F Fees and expenses of the underlying Fidelity Central Funds are not included in the Fund's expense ratio. The Fund indirectly bears its proportionate share of the expenses of any underlying Fidelity Central Funds.
G Amount does not include the portfolio activity of any underlying Fidelity Central Funds.
H Investment income per share reflects a special dividend which amounted to $.01 per share. Excluding the special dividend, the ratio of net investment income (loss) to average net assets would have been (1.59)%.
I Investment income per share reflects a special dividend which amounted to $.01 per share. Excluding the special dividend, the ratio of net investment income (loss) to average net assets would have been (1.60)%.
J The amount shown for a share outstanding does not correspond with the aggregate net gain (loss) on investments for the period due to the timing of sales and repurchases of shares in relation to fluctuating market values of the investments of the Fund.
K For the period November 3, 2004 (commencement of operations) to July 31, 2005.
L Expense ratios reflect operating expenses of the class. Expenses before reductions do not reflect amounts reimbursed by the investment adviser or reductions from brokerage service arrangements or other expense offset arrangements and do not represent the amount paid by the class during periods when reimbursements or reductions occur. Expense ratios before reductions for start-up periods may not be representative of longer-term operating periods. Expenses net of fee waivers reflect expenses after reimbursement by the investment adviser but prior to reductions from brokerage service arrangements or other expense offset arrangements. Expenses net of all reductions represent the net expenses paid by the class.
M Amount represents less than $.01 per share.
See accompanying notes which are an integral part of the financial statements.
Annual Report
Financial Highlights - Small Cap Growth
Years ended July 31, | 2007 | 2006 | 2005J |
Selected Per-Share Data | | | |
Net asset value, beginning of period | $ 12.93 | $ 12.98 | $ 10.00 |
Income from Investment Operations | | | |
Net investment income (loss)D | (.08)G | (.07)H | (.04) |
Net realized and unrealized gain (loss) | 3.40 | .19I | 3.01 |
Total from investment operations | 3.32 | .12 | 2.97 |
Distributions from net realized gain | (.10) | (.18) | - |
Redemption fees added to paid in capitalD | -L | .01 | .01 |
Net asset value, end of period | $ 16.15 | $ 12.93 | $ 12.98 |
Total ReturnB,C | 25.84% | 1.01% | 29.80% |
Ratios to Average Net AssetsE,K | | | |
Expenses before reductions | 1.10% | 1.13% | 1.16%A |
Expenses net of fee waivers, if any | 1.10% | 1.13% | 1.16%A |
Expenses net of all reductions | 1.09% | 1.08% | 1.08%A |
Net investment income (loss) | (.50)%G | (.52)%H | (.49)%A |
Supplemental Data | | | |
Net assets, end of period (000 omitted) | $ 1,149,809 | $ 402,353 | $ 205,652 |
Portfolio turnover rateF | 91% | 129% | 93%A |
A Annualized
B Total returns for periods of less than one year are not annualized.
C Total returns would have been lower had certain expenses not been reduced during the periods shown.
D Calculated based on average shares outstanding during the period.
E Fees and expenses of the underlying Fidelity Central Funds are not included in the Fund's expense ratio. The Fund indirectly bears its proportionate share of the expenses of any underlying Fidelity Central Funds.
F Amount does not include the portfolio activity of any underlying Fidelity Central Funds.
G Investment income per share reflects a special dividend which amounted to $.01 per share. Excluding the special dividend, the ratio of net investment income (loss) to average net assets would have been (.54)%.
H Investment income per share reflects a special dividend which amounted to $.01 per share. Excluding the special dividend, the ratio of net investment income (loss) to average net assets would have been (.58)%.
I The amount shown for a share outstanding does not correspond with the aggregate net gain (loss) on investments for the period due to the timing of sales and repurchases of shares in relation to fluctuating market values of the investments of the Fund.
J For the period November 3, 2004 (commencement of operations) to July 31, 2005.
K Expense ratios reflect operating expenses of the class. Expenses before reductions do not reflect amounts reimbursed by the investment adviser or reductions from brokerage service arrangements or other expense offset arrangements and do not represent the amount paid by the class during periods when reimbursements or reductions occur. Expense ratios before reductions for start-up periods may not be representative of longer-term operating periods. Expenses net of fee waivers reflect expenses after reimbursement by the investment adviser but prior to reductions from brokerage service arrangements or other expense offset arrangements. Expenses net of all reductions represent the net expenses paid by the class.
L Amount represents less than $.01 per share.
See accompanying notes which are an integral part of the financial statements.
Annual Report
Financial Highlights - Institutional Class
Years ended July 31, | 2007 | 2006 | 2005J |
Selected Per-Share Data | | | |
Net asset value, beginning of period | $ 12.92 | $ 12.97 | $ 10.00 |
Income from Investment Operations | | | |
Net investment income (loss)D | (.07)G | (.07)H | (.04) |
Net realized and unrealized gain (loss) | 3.41 | .19I | 3.00 |
Total from investment operations | 3.34 | .12 | 2.96 |
Distributions from net realized gain | (.11) | (.18) | - |
Redemption fees added to paid in capitalD | -L | .01 | .01 |
Net asset value, end of period | $ 16.15 | $ 12.92 | $ 12.97 |
Total ReturnB,C | 25.99% | .97% | 29.70% |
Ratios to Average Net AssetsE,K | | | |
Expenses before reductions | 1.05% | 1.10% | 1.20%A |
Expenses net of fee waivers, if any | 1.05% | 1.10% | 1.18%A |
Expenses net of all reductions | 1.05% | 1.05% | 1.10%A |
Net investment income (loss) | (.46)%G | (.49)%H | (.51)%A |
Supplemental Data | | | |
Net assets, end of period (000 omitted) | $ 18,671 | $ 14,233 | $ 1,906 |
Portfolio turnover rateF | 91% | 129% | 93%A |
A Annualized
B Total returns for periods of less than one year are not annualized.
C Total returns would have been lower had certain expenses not been reduced during the periods shown.
D Calculated based on average shares outstanding during the period.
E Fees and expenses of the underlying Fidelity Central Funds are not included in the Fund's expense ratio. The Fund indirectly bears its proportionate share of the expenses of any underlying Fidelity Central Funds.
F Amount does not include the portfolio activity of any underlying Fidelity Central Funds.
G Investment income per share reflects a special dividend which amounted to $.01 per share. Excluding the special dividend, the ratio of net investment income (loss) to average net assets would have been (.50)%.
H Investment income per share reflects a special dividend which amounted to $.01 per share. Excluding the special dividend, the ratio of net investment income (loss) to average net assets would have been (.55)%.
I The amount shown for a share outstanding does not correspond with the aggregate net gain (loss) on investments for the period due to the timing of sales and repurchases of shares in relation to fluctuating market values of the investments of the Fund.
J For the period November 3, 2004 (commencement of operations) to July 31, 2005.
K Expense ratios reflect operating expenses of the class. Expenses before reductions do not reflect amounts reimbursed by the investment adviser or reductions from brokerage service arrangements or other expense offset arrangements and do not represent the amount paid by the class during periods when reimbursements or reductions occur. Expense ratios before reductions for start-up periods may not be representative of longer-term operating periods. Expenses net of fee waivers reflect expenses after reimbursement by the investment adviser but prior to reductions from brokerage service arrangements or other expense offset arrangements. Expenses net of all reductions represent the net expenses paid by the class.
L Amount represents less than $.01 per share.
See accompanying notes which are an integral part of the financial statements.
Annual Report
Notes to Financial Statements
For the period ended July 31, 2007
1. Organization.
Fidelity Small Cap Growth Fund (the Fund) is a non-diversified fund of Fidelity Securities Fund (the trust) and is authorized to issue an unlimited number of shares. The trust is registered under the Investment Company Act of 1940, as amended (the 1940 Act), as an open-end management investment company organized as a Massachusetts business trust. The Fund offers Class A, Class T, Class B, Class C, Small Cap Growth, and Institutional Class shares, each of which has equal rights as to assets and voting privileges. Each class has exclusive voting rights with respect to matters that affect that class. Class B shares will automatically convert to Class A shares after a holding period of seven years from the initial date of purchase. Investment income, realized and unrealized capital gains and losses, the common expenses of the Fund, and certain fund-level expense reductions, if any, are allocated on a pro rata basis to each class based on the relative net assets of each class to the total net assets of the Fund. Each class differs with respect to transfer agent and distribution and service plan fees incurred. Certain expense reductions also differ by class.
2. Investments in Fidelity Central Funds.
The Fund may invest in Fidelity Central Funds which are open-end investment companies available only to other investment companies and accounts managed by Fidelity Management & Research Company (FMR) and its affiliates. The Fund's Schedule of Investments lists each of the Fidelity Central Funds as an investment of the Fund, but does not include the underlying holdings of each Fidelity Central Fund. As an Investing Fund, the Fund indirectly bears its proportionate share of the expenses of the underlying Fidelity Central Funds.
The Money Market Central Funds seek preservation of capital and current income and are managed by Fidelity Investments Money Management, Inc. (FIMM), an affiliate of FMR.
A complete list of holdings for each Fidelity Central Fund is available upon request or at the SEC's website at www.sec.gov. In addition, the financial statements of the Fidelity Central Funds, which are not covered by the Fund's Report of Independent Registered Public Accounting Firm, are available on the SEC's web site, or upon request.
3. Significant Accounting Policies.
The financial statements have been prepared in conformity with accounting principles generally accepted in the United States of America, which require management to make certain estimates and assumptions at the date of the financial statements. The following summarizes the significant accounting policies of the Fund:
Security Valuation. Investments are valued and net asset value (NAV) per share is calculated (NAV calculation) as of the close of business of the New York Stock Exchange
Annual Report
Notes to Financial Statements - continued
3. Significant Accounting Policies - continued
Security Valuation - continued
(NYSE), normally 4:00 p.m. Eastern time. Wherever possible, the Fund uses independent pricing services approved by the Board of Trustees to value its investments.
Equity securities, including restricted securities, for which market quotations are readily available, are valued at the last reported sale price or official closing price as reported by an independent pricing service on the primary market or exchange on which they are traded. In the event there were no sales during the day or closing prices are not available, securities are valued at the last quoted bid price. Investments in open-end mutual funds, including the Fidelity Central Funds, are valued at their closing net asset value each business day. Short-term securities with remaining maturities of sixty days or less for which quotations are not readily available are valued at amortized cost, which approximates value.
When current market prices or quotations are not readily available or do not accurately reflect fair value, valuations may be determined in accordance with procedures adopted by the Board of Trustees. For example, when developments occur between the close of a market and the close of the NYSE that may materially affect the value of some or all of the securities, or when trading in a security is halted, those securities may be fair valued. Factors used in the determination of fair value may include monitoring news to identify significant market or security specific events such as changes in the value of U.S. securities markets, reviewing developments in foreign markets and evaluating the performance of ADRs, futures contracts and exchange-traded funds. Because the Fund's utilization of fair value pricing depends on market activity, the frequency with which fair value pricing is used cannot be predicted and may be utilized to a significant extent. The value of securities used for NAV calculation under fair value pricing may differ from published prices for the same securities.
Foreign Currency. The Fund uses foreign currency contracts to facilitate transactions in foreign-denominated securities. Losses from these transactions may arise from changes in the value of the foreign currency or if the counterparties do not perform under the contracts' terms.
Foreign-denominated assets, including investment securities, and liabilities are translated into U.S. dollars at the exchange rate at period end. Purchases and sales of investment securities, income and dividends received and expenses denominated in foreign currencies are translated into U.S. dollars at the exchange rate in effect on the transaction date.
The effects of exchange rate fluctuations on investments are included with the net realized and unrealized gain (loss) on investment securities. Other foreign currency transactions resulting in realized and unrealized gain (loss) are disclosed separately.
Annual Report
3. Significant Accounting Policies - continued
Investment Transactions and Income. For financial reporting purposes, the Fund's investment holdings and NAV include trades executed through the end of the last business day of the period. The NAV for processing shareholder transactions includes trades executed through the end of the prior business day. Gains and losses on securities sold are determined on the basis of identified cost. Dividend income is recorded on the ex-dividend date, except for certain dividends from foreign securities where the ex-dividend date may have passed, which are recorded as soon as the Fund is informed of the ex-dividend date. Non-cash dividends included in dividend income, if any, are recorded at the fair market value of the securities received. Distributions received on securities that represent a return of capital or capital gain are recorded as a reduction of cost of investments and/or as a realized gain. The Fund estimates the components of distributions received that may be considered return of capital distributions or capital gain distributions. Large, non-recurring dividends recognized by the Fund are presented separately on the Statement of Operations as "Special Dividends" and the impact of these dividends is presented in the Financial Highlights. Interest income and distributions from the Fidelity Central Funds are accrued as earned. Interest income includes coupon interest and amortization of premium and accretion of discount on debt securities. Investment income is recorded net of foreign taxes withheld where recovery of such taxes is uncertain.
Expenses. Most expenses of the trust can be directly attributed to a fund. Expenses which cannot be directly attributed are apportioned among each Fund in the trust. Expense estimates are accrued in the period to which they relate and adjustments are made when actual amounts are known.
Income Tax Information and Distributions to Shareholders. Each year, the Fund intends to qualify as a regulated investment company by distributing all of its taxable income and realized gains under Subchapter M of the Internal Revenue Code. As a result, no provision for income taxes is required in the accompanying financial statements. Foreign taxes are provided for based on the Fund's understanding of the tax rules and rates that exist in the foreign markets in which it invests.
Distributions are recorded on the ex-dividend date. Income dividends and capital gain distributions are declared separately for each class. Income and capital gain distributions are determined in accordance with income tax regulations, which may differ from generally accepted accounting principles. In addition, the Fund will claim a portion of the payment made to redeeming shareholders as a distribution for income tax purposes.
Capital accounts within the financial statements are adjusted for permanent book-tax differences. These adjustments have no impact on net assets or the results of operations. Temporary book-tax differences will reverse in a subsequent period.
Annual Report
Notes to Financial Statements - continued
3. Significant Accounting Policies - continued
Income Tax Information and Distributions to Shareholders - continued
Book-tax differences are primarily due to foreign currency transactions, net operating losses and losses deferred due to wash sales.
The tax-basis components of distributable earnings and the federal tax cost as of period end were as follows:
Unrealized appreciation | $ 129,971,651 | |
Unrealized depreciation | (58,828,862) | |
Net unrealized appreciation (depreciation) | 71,142,789 | |
Undistributed ordinary income | 57,565,363 | |
Undistributed long-term capital gain | 21,937,701 | |
| | |
Cost for federal income tax purposes | $ 1,290,409,740 | |
The tax character of distributions paid was as follows:
| July 31, 2007 | July 31, 2006 |
Ordinary Income | $ 1,338,128 | $ 3,779,478 |
Long-term Capital Gains | 2,253,852 | - |
Total | $ 3,591,980 | $ 3,779,478 |
Short-Term Trading (Redemption) Fees. Shares held in the Fund less than 90 days are subject to a redemption fee equal to 1.50% of the proceeds of the redeemed shares. All redemption fees, including any estimated redemption fees paid by FMR, are retained by the Fund and accounted for as an addition to paid in capital.
New Accounting Pronouncements. In July 2006, Financial Accounting Standards Board Interpretation No. 48, Accounting for Uncertainty in Income Taxes - an interpretation of FASB Statement 109 (FIN 48), was issued and is effective on the last business day of the semiannual reporting period for fiscal years beginning after December 15, 2006. FIN 48 sets forth a threshold for financial statement recognition, measurement and disclosure of a tax position taken or expected to be taken on a tax return. Management has concluded that the adoption of FIN 48 will not result in a material impact on the Fund's net assets, results of operations and financial statement disclosures.
In addition, in September 2006, Statement of Financial Accounting Standards No. 157, Fair Value Measurements (SFAS 157), was issued and is effective for fiscal years beginning after November 15, 2007. SFAS 157 defines fair value, establishes a framework for measuring fair value and expands disclosures about fair value measurements. Management is currently evaluating the impact the adoption of SFAS 157 will have on the Fund's financial statement disclosures.
Annual Report
4. Operating Policies.
Repurchase Agreements. FMR has received an Exemptive Order from the Securities and Exchange Commission (the SEC) which permits the Fund and other affiliated entities of FMR to transfer uninvested cash balances into joint trading accounts which are then invested in repurchase agreements. The Fund may also invest directly with institutions in repurchase agreements. Repurchase agreements are collateralized by government or non-government securities. Upon settlement date, collateral is held in segregated accounts with custodian banks and may be obtained in the event of a default of the counterparty. The Fund monitors, on a daily basis, the value of the collateral to ensure it is at least equal to the principal amount of the repurchase agreement (including accrued interest). In the event of a default by the counterparty, realization of the collateral proceeds could be delayed, during which time the value of the collateral may decline.
Delayed Delivery Transactions and When-Issued Securities. The Fund may purchase or sell securities on a delayed delivery or when-issued basis. Payment and delivery may take place after the customary settlement period for that security. The price of the underlying securities and the date when the securities will be delivered and paid for are fixed at the time the transaction is negotiated. During the time a delayed delivery sell is outstanding, the contract is marked-to-market daily and equivalent deliverable securities are held for the transaction. The value of the securities purchased on a delayed delivery or when-issued basis are identified as such in the Fund's Schedule of Investments. The Fund may receive compensation for interest forgone in the purchase of a delayed delivery or when-issued security. With respect to purchase commitments, the Fund identifies securities as segregated in its records with a value at least equal to the amount of the commitment. Losses may arise due to changes in the value of the underlying securities or if the counterparty does not perform under the contract's terms, or if the issuer does not issue the securities due to political, economic, or other factors.
5. Purchases and Sales of Investments.
Purchases and sales of securities, other than short-term securities, aggregated $1,308,851,948 and $702,065,964, respectively.
6. Fees and Other Transactions with Affiliates.
Management Fee. FMR and its affiliates provide the Fund with investment management related services for which the Fund pays a monthly management fee. The management fee is the sum of an individual fund fee rate that is based on an annual rate of .45% of the Fund's average net assets and a group fee rate that averaged ..26% during the period. The group fee rate is based upon the average net assets of all the mutual funds advised by FMR. The group fee rate decreases as assets under management increase and
Annual Report
Notes to Financial Statements - continued
6. Fees and Other Transactions with Affiliates - continued
Management Fee - continued
increases as assets under management decrease. In addition, the management fee is subject to a performance adjustment (up to a maximum of ±.20% of the Fund's average net assets over a 36 month performance period). The upward or downward adjustment to the management fee is based on the relative investment performance of the retail class of the Fund, Small Cap Growth, as compared to an appropriate benchmark index. For the period, the total annual management fee rate, including the performance adjustment, was .80% of the Fund's average net assets.
Distribution and Service Plan. In accordance with Rule 12b-1 of the 1940 Act, the Fund has adopted separate Distribution and Service Plans for each class of shares. Certain classes pay Fidelity Distributors Corporation (FDC), an affiliate of FMR, separate Distribution and Service Fees, each of which is based on an annual percentage of each class' average net assets. In addition, FDC may pay financial intermediaries for selling shares of the Fund and providing shareholder support services. For the period, the Distribution and Service Fee rates and the total amounts paid to and retained by FDC were as follows:
| Distribution
Fee | Service
Fee | Paid to
FDC | Retained
by FDC |
Class A | 0% | .25% | $ 61,375 | $ 5,550 |
Class T | 25% | .25% | 122,504 | 2,290 |
Class B | .75% | .25% | 58,534 | 44,526 |
Class C | .75% | .25% | 191,961 | 66,624 |
| | | $ 434,374 | $ 118,990 |
Sales Load. FDC receives a front-end sales charge of up to 5.75% for selling Class A shares, and 3.50% for selling Class T shares, some of which is paid to financial intermediaries for selling shares of the Fund. FDC receives the proceeds of contingent deferred sales charges levied on Class A, Class T, Class B, and Class C redemptions. These charges depend on the holding period. The deferred sales charges range from 5% to 1% forClass B, 1% for Class C, 1.00% to .50% for certain purchases of Class A shares and .25% for certain purchases of Class T shares.
For the period, sales charge amounts retained by FDC were as follows:
| Retained
by FDC |
Class A | $ 35,221 |
Class T | 8,842 |
Class B* | 10,153 |
Class C* | 3,347 |
| $ 57,563 |
* When Class B and Class C shares are initially sold, FDC pays commissions from its own resources to financial intermediaries through which the sales are made.
Annual Report
6. Fees and Other Transactions with Affiliates - continued
Transfer Agent Fees. Fidelity Investments Institutional Operations Company, Inc. (FIIOC), an affiliate of FMR, is the transfer, dividend disbursing and shareholder servicing agent for each class of the Fund, except for Small Cap Growth. Fidelity Service Company, Inc. (FSC), an affiliate of FMR, is the transfer agent for Small Cap Growth shares. FIIOC and FSC receive account fees and asset-based fees that vary according to the account size and type of account of the shareholders of the respective classes of the Fund. FIIOC and FSC pay for typesetting, printing and mailing of shareholder reports, except proxy statements. For the period, the total transfer agent fees paid by each class to FIIOC or FSC, were as follows:
| Amount | % of
Average
Net Assets |
Class A | $ 77,693 | .32 |
Class T | 72,782 | .30 |
Class B | 18,857 | .32 |
Class C | 61,455 | .32 |
Small Cap Growth | 1,696,137 | .24 |
Institutional Class | 29,344 | .18 |
| $ 1,956,268 | |
Accounting and Security Lending Fees. FSC maintains the Fund's accounting records. The accounting fee is based on the level of average net assets for the month. Under a separate contract, FSC administers the security lending program. The security lending fee is based on the number and duration of lending transactions.
Brokerage Commissions. The Fund placed a portion of its portfolio transactions with brokerage firms which are affiliates of the investment adviser. The commissions paid to these affiliated firms were $12,881 for the period.
7. Committed Line of Credit.
The Fund participates with other funds managed by FMR in a $4.2 billion credit facility (the "line of credit") to be utilized for temporary or emergency purposes to fund shareholder redemptions or for other short-term liquidity purposes. The Fund has agreed to pay commitment fees on its pro rata portion of the line of credit, which amounted to $1,129 and is reflected in Miscellaneous Expense on the Statement of Operations. During the period, there were no borrowings on this line of credit.
Annual Report
Notes to Financial Statements - continued
8. Security Lending.
The Fund lends portfolio securities from time to time in order to earn additional income. On the settlement date of the loan, the Fund receives collateral (in the form of U.S. Treasury obligations, letters of credit and/or cash) against the loaned securities and maintains collateral in an amount not less than 100% of the market value of the loaned securities during the period of the loan. The market value of the loaned securities is determined at the close of business of the Fund and any additional required collateral is delivered to the Fund on the next business day. If the borrower defaults on its obligation to return the securities loaned because of insolvency or other reasons, a fund could experience delays and costs in recovering the securities loaned or in gaining access to the collateral. Any cash collateral received is invested in the Fidelity Securities Lending Cash Central Fund. The value of loaned securities and cash collateral at period end are disclosed on the Fund's Statement of Assets and Liabilities. Security lending income represents the income earned on investing cash collateral, less fees and expenses associated with the loan, plus any premium payments that may be received on the loan of certain types of securities. Security lending income is presented in the Statement of Operations as a component of income from Fidelity Central Funds. Net income from lending portfolio securities during the period amounted to $198,991.
9. Expense Reductions.
FMR voluntarily agreed to reimburse each class to the extent annual operating expenses exceeded certain levels of average net assets as noted in the table below. Some expenses, for example interest expense, including commitment fees, are excluded from this reimbursement.
The following classes were in reimbursement during the period:
| Expense
Limitations | Reimbursement
from adviser |
Class A | 1.40% | $ 10,000 |
Class T | 1.65% | 5,786 |
Class B | 2.15% | 2,944 |
Class C | 2.15% | 9,325 |
Small Cap Growth | 1.15% | 26,889 |
| | $ 54,944 |
Effective March 1, 2007 the expense limitation for Small Cap Growth class was eliminated.
Many of the brokers with whom FMR places trades on behalf of the Fund provided services to the Fund in addition to trade execution. These services included payments of certain expenses on behalf of the Fund totaling $12,839 for the period. In addition,
Annual Report
9. Expense Reductions - continued
through arrangements with the Fund's custodian and each class' transfer agent, credits realized as a result of uninvested cash balances were used to reduce the Fund's expenses. During the period, these credits reduced the Fund's custody expenses by $8,868. During the period, credits reduced each class' transfer agent expense as noted in the table below.
| Transfer Agent
expense reduction | |
Class C | $ 50 | |
Small Cap Growth | 42,971 | |
Institutional Class | 85 | |
| $ 43,106 | |
10. Other.
The Fund's organizational documents provide former and current trustees and officers with a limited indemnification against liabilities arising in connection with the performance of their duties to the Fund. In the normal course of business, the Fund may also enter into contracts that provide general indemnifications. The Fund's maximum exposure under these arrangements is unknown as this would be dependent on future claims that may be made against the Fund. The risk of material loss from such claims is considered remote.
In September 2006, FIIOC, the Fund's transfer agent, notified the Fund that the Fund's books and records did not reflect a conversion of certain Class B to Class A shares upon their conversion date. In March 2007, FIIOC converted the relevant Class B shares to Class A shares and recorded the conversion in the books and records of the Fund which did not result in a material impact to the Fund's reported net assets or results of operations in the accompanying financial statements. FIIOC has remediated affected shareholders and reimbursed the Fund for all related audit and legal expenses.
11. Distributions to Shareholders.
Distributions to shareholders of each class were as follows:
Years ended July 31, | 2007 | 2006 |
From net realized gain | | |
Class A | $ 130,212 | $ 79,077 |
Class T | 118,024 | 63,628 |
Class B | 24,691 | 16,300 |
Class C | 74,047 | 71,634 |
Small Cap Growth | 3,129,487 | 3,518,781 |
Institutional Class | 115,519 | 30,058 |
Total | $ 3,591,980 | $ 3,779,478 |
Annual Report
Notes to Financial Statements - continued
12. Share Transactions.
Transactions for each class of shares were as follows:
| Shares | Dollars |
Years ended July 31, | 2007 | 2006 | 2007 | 2006 |
Class A | | | | |
Shares sold | 1,113,110 | 1,304,587 | $ 17,060,734 | $ 17,497,379 |
Reinvestment of distributions | 8,925 | 5,381 | 119,928 | 70,354 |
Shares redeemed | (436,417) | (269,198) | (6,456,393) | (3,602,873) |
Net increase (decrease) | 685,618 | 1,040,770 | $ 10,724,269 | $ 13,964,860 |
Class T | | | | |
Shares sold | 607,092 | 1,397,985 | $ 8,822,874 | $ 18,995,409 |
Reinvestment of distributions | 8,530 | 4,866 | 115,213 | 63,445 |
Shares redeemed | (459,339) | (314,634) | (6,905,798) | (4,188,261) |
Net increase (decrease) | 156,283 | 1,088,217 | $ 2,032,289 | $ 14,870,593 |
Class B | | | | |
Shares sold | 121,826 | 392,448 | $ 1,800,582 | $ 5,275,913 |
Reinvestment of distributions | 1,705 | 1,204 | 23,112 | 15,614 |
Shares redeemed | (135,943) | (146,977) | (1,994,978) | (1,954,748) |
Net increase (decrease) | (12,412) | 246,675 | $ (171,284) | $ 3,336,779 |
Class C | | | | |
Shares sold | 546,198 | 952,568 | $ 8,014,853 | $ 12,739,552 |
Reinvestment of distributions | 5,178 | 5,289 | 70,286 | 68,594 |
Shares redeemed | (290,387) | (458,174) | (4,244,042) | (5,878,013) |
Net increase (decrease) | 260,989 | 499,683 | $ 3,841,097 | $ 6,930,133 |
Small Cap Growth | | | | |
Shares sold | 47,884,601 | 23,125,895 | $ 736,795,086 | $ 310,607,480 |
Reinvestment of distributions | 213,315 | 226,620 | 2,867,099 | 2,968,828 |
Shares redeemed | (8,042,099) | (8,070,732) | (119,410,062) | (106,295,770) |
Net increase (decrease) | 40,055,817 | 15,281,783 | $ 620,252,123 | $ 207,280,538 |
Institutional Class | | | | |
Shares sold | 404,996 | 1,082,924 | $ 6,086,460 | $ 14,760,969 |
Reinvestment of distributions | 7,296 | 1,705 | 97,691 | 22,327 |
Shares redeemed | (357,460) | (130,215) | (5,250,610) | (1,756,457) |
Net increase (decrease) | 54,832 | 954,414 | $ 933,541 | $ 13,026,839 |
Annual Report
Report of Independent Registered Public Accounting Firm
To the Trustees of Fidelity Securities Fund and the Shareholders of Fidelity Small Cap Growth Fund:
In our opinion, the accompanying statement of assets and liabilities, including the schedule of investments, and the related statements of operations and of changes in net assets and the financial highlights present fairly, in all material respects, the financial position of Fidelity Small Cap Growth Fund (a fund of Fidelity Securities Fund) at July 31, 2007, the results of its operations for the year then ended, the changes in its net assets for each of the two years in the period then ended and the financial highlights for each of the periods indicated, in conformity with accounting principles generally accepted in the United States of America. These financial statements and financial highlights (hereafter referred to as "financial statements") are the responsibility of the Fidelity Small Cap Growth Fund's management. Our responsibility is to express an opinion on these financial statements based on our audits. We conducted our audits of these financial statements in accordance with the standards of the Public Company Accounting Oversight Board (United States). Those standards require that we plan and perform the audit to obtain reasonable assurance about whether the financial statements are free of material misstatement. An audit includes examining, on a test basis, evidence supporting the amounts and disclosures in the financial statements, assessing the accounting principles used and significant estimates made by management, and evaluating the overall financial statement presentation. We believe that our audits, which included confirmation of securities at July 31, 2007 by correspondence with the custodian and brokers, provide a reasonable basis for our opinion.
/s/ PricewaterhouseCoopers LLP
PricewaterhouseCoopers LLP
Boston, Massachusetts
September 18, 2007
Annual Report
Trustees and Officers
The Trustees, Members of the Advisory Board, and executive officers of the trust and fund, as applicable, are listed below. The Board of Trustees governs the fund and is responsible for protecting the interests of shareholders. The Trustees are experienced executives who meet periodically throughout the year to oversee the fund's activities, review contractual arrangements with companies that provide services to the fund, and review the fund's performance. Except for James C. Curvey, each of the Trustees oversees 353 funds advised by FMR or an affiliate. Mr. Curvey oversees 317 funds advised by FMR or an affiliate.
The Trustees hold office without limit in time except that (a) any Trustee may resign; (b) any Trustee may be removed by written instrument, signed by at least two-thirds of the number of Trustees prior to such removal; (c) any Trustee who requests to be retired or who has become incapacitated by illness or injury may be retired by written instrument signed by a majority of the other Trustees; and (d) any Trustee may be removed at any special meeting of shareholders by a two-thirds vote of the outstanding voting securities of the trust. Each Trustee who is not an interested person (as defined in the 1940 Act) (Independent Trustee), shall retire not later than the last day of the calendar year in which his or her 72nd birthday occurs. The Independent Trustees may waive this mandatory retirement age policy with respect to individual Trustees. The executive officers and Advisory Board Members hold office without limit in time, except that any officer and Advisory Board Member may resign or may be removed by a vote of a majority of the Trustees at any regular meeting or any special meeting of the Trustees. Except as indicated, each individual has held the office shown or other offices in the same company for the past five years.
The fund's Statement of Additional Information (SAI) includes more information about the Trustees. To request a free copy, call Fidelity at 1-877-208-0098.
Interested Trustees*:
Correspondence intended for each Trustee who is an interested person may be sent to Fidelity Investments, 82 Devonshire Street, Boston, Massachusetts 02109.
Name, Age; Principal Occupation |
Edward C. Johnson 3d (77) |
| Year of Election or Appointment: 1984 Mr. Johnson is Chairman of the Board of Trustees. Mr. Johnson serves as President (2006-present), Chief Executive Officer, Chairman, and a Director of FMR Corp.; Chairman and a Director of FMR; Chairman and a Director of Fidelity Research & Analysis Company (FRAC); Chairman and a Director of Fidelity Investments Money Management, Inc.; and Chairman (2001-present) and a Director of FMR Co., Inc. In addition, Mr. Johnson serves as Chairman and Director of Fidelity International Limited (FIL). |
|
James C. Curvey (72) |
| Year of Election or Appointment: 2007 Mr. Curvey also serves as Trustee (2007-present) or Member of the Advisory Board (2007-present) of other investment companies advised by FMR. Mr. Curvey is Vice Chairman (2006-present) and Director of FMR Corp. Mr. Curvey joined Fidelity in 1982 and served in numerous senior management positions, including President and Chief Operating Officer of FMR Corp. (1997-2000) and President of Fidelity Strategic Investments (2000-2002). In addition, he serves as a member of the Board of Directors of Geerlings & Wade, Inc. (wine distribution). |
* Trustees have been determined to be "Interested Trustees" by virtue of, among other things, their affiliation with the trust or various entities under common control with FMR.
Independent Trustees:
Correspondence intended for each Independent Trustee (that is, the Trustees other than the Interested Trustees) may be sent to Fidelity Investments, P.O. Box 55235, Boston, Massachusetts 02205-5235.
Name, Age; Principal Occupation |
Dennis J. Dirks (59) |
| Year of Election or Appointment: 2005 Prior to his retirement in May 2003, Mr. Dirks was Chief Operating Officer and a member of the Board of The Depository Trust & Clearing Corporation (DTCC) (1999-2003). He also served as President, Chief Operating Officer, and Board member of The Depository Trust Company (DTC) (1999-2003) and President and Board member of the National Securities Clearing Corporation (NSCC) (1999-2003). In addition, Mr. Dirks served as Chief Executive Officer and Board member of the Government Securities Clearing Corporation (2001-2003) and Chief Executive Officer and Board member of the Mortgage-Backed Securities Clearing Corporation (2001-2003). Mr. Dirks also serves as a Trustee and a member of the Finance Committee of Manhattan College (2005-present) and a Trustee and a member of the Finance Committee of AHRC of Nassau County (2006-present). |
Albert R. Gamper, Jr. (65) |
| Year of Election or Appointment: 2006 Prior to his retirement in December 2004, Mr. Gamper served as Chairman of the Board of CIT Group Inc. (commercial finance). During his tenure with CIT Group Inc. Mr. Gamper served in numerous senior management positions, including Chairman (1987-1989; 1999-2001; 2002-2004), Chief Executive Officer (1987-2004), and President (1989-2002). He currently serves as a member of the Board of Directors of Public Service Enterprise Group (utilities, 2001-present), Chairman of the Board of Governors, Rutgers University (2004-present), and Chairman of the Board of Saint Barnabas Health Care System. |
George H. Heilmeier (71) |
| Year of Election or Appointment: 2004 Dr. Heilmeier is Chairman Emeritus of Telcordia Technologies (communication software and systems), where prior to his retirement, he served as company Chairman and Chief Executive Officer. He currently serves on the Boards of Directors of The Mitre Corporation (systems engineering and information technology support for the government), and HRL Laboratories (private research and development, 2004-present). He is Chairman of the General Motors Science & Technology Advisory Board and a Life Fellow of the Institute of Electrical and Electronics Engineers (IEEE). Dr. Heilmeier is a member of the Defense Science Board and the National Security Agency Advisory Board. He is also a member of the National Academy of Engineering, the American Academy of Arts and Sciences, and the Board of Overseers of the School of Engineering and Applied Science of the University of Pennsylvania. Previously, Dr. Heilmeier served as a Director of TRW Inc. (automotive, space, defense, and information technology, 1992-2002), Compaq (1994-2002), Automatic Data Processing, Inc. (ADP) (technology-based business outsourcing, 1995-2002), INET Technologies Inc. (telecommunications network surveillance, 2001-2004), and Teletech Holdings (customer management services). He is the recipient of the 2005 Kyoto Prize in Advanced Technology for his invention of the liquid crystal display, and a member of the Consumer Electronics Hall of Fame. |
James H. Keyes (66) |
| Year of Election or Appointment: 2007 Prior to his retirement in 2003, Mr. Keyes was Chairman, President, and Chief Executive Officer of Johnson Controls, Inc. (automotive supplier, 1993-2003). He currently serves as a member of the boards of LSI Logic Corporation (semiconductor technologies), Navistar International Corporation (manufacture and sale of trucks, buses, and diesel engines, 2002-present), and Pitney Bowes, Inc. (integrated mail, messaging, and document management solutions). |
Marie L. Knowles (60) |
| Year of Election or Appointment: 2001 Prior to Ms. Knowles' retirement in June 2000, she served as Executive Vice President and Chief Financial Officer of Atlantic Richfield Company (ARCO) (diversified energy, 1996-2000). From 1993 to 1996, she was a Senior Vice President of ARCO and President of ARCO Transportation Company. She served as a Director of ARCO from 1996 to 1998. She currently serves as a Director of Phelps Dodge Corporation (copper mining and manufacturing) and McKesson Corporation (healthcare service, 2002-present). Ms. Knowles is a Trustee of the Brookings Institution and the Catalina Island Conservancy and also serves as a member of the Advisory Board for the School of Engineering of the University of Southern California. |
Ned C. Lautenbach (63) |
| Year of Election or Appointment: 2000 Mr. Lautenbach is Chairman of the Independent Trustees (2006-present). Mr. Lautenbach has been a partner of Clayton, Dubilier & Rice, Inc. (private equity investment firm) since September 1998. Previously, Mr. Lautenbach was with the International Business Machines Corporation (IBM) from 1968 until his retirement in 1998. Mr. Lautenbach serves as a Director of Sony Corporation (2006-present) and Eaton Corporation (diversified industrial) as well as the Philharmonic Center for the Arts in Naples, Florida. He also is a member of the Board of Trustees of Fairfield University (2005-present), as well as a member of the Council on Foreign Relations. |
Cornelia M. Small (63) |
| Year of Election or Appointment: 2005 Ms. Small is a member (2000-present) and Chairperson (2002-present) of the Investment Committee, and a member (2002-present) of the Board of Trustees of Smith College. Previously, she served as Chief Investment Officer (1999-2000), Director of Global Equity Investments (1996-1999), and a member of the Board of Directors of Scudder, Stevens & Clark (1990-1997) and Scudder Kemper Investments (1997-1999). In addition, Ms. Small served as Co-Chair (2000-2003) of the Annual Fund for the Fletcher School of Law and Diplomacy. |
William S. Stavropoulos (68) |
| Year of Election or Appointment: 2002 Mr. Stavropoulos is Chairman Emeritus of the Board of Directors of The Dow Chemical Company. Since joining The Dow Chemical Company in 1967, Mr. Stavropoulos served in numerous senior management positions, including President (1993-2000; 2002-2003), CEO (1995-2000; 2002-2004), and Chairman of the Executive Committee (2000-2004). Currently, he is a Director of NCR Corporation (data warehousing and technology solutions), Chemical Financial Corporation, Maersk Inc. (industrial conglomerate, 2002-present), Tyco International, Inc. (multinational manufacturing and services, 2007-present), and a member of the Advisory Board for Metalmark Capital (private equity investment firm, 2005-present). He is a special advisor to Clayton, Dubilier & Rice, Inc., a private equity investment firm. He also serves as a member of the Board of Trustees of the American Enterprise Institute for Public Policy Research. In addition, Mr. Stavropoulos is a member of The Business Council, J.P. Morgan International Council and the University of Notre Dame Advisory Council for the College of Science. |
Kenneth L. Wolfe (68) |
| Year of Election or Appointment: 2005 Prior to his retirement in 2001, Mr. Wolfe was Chairman and Chief Executive Officer of Hershey Foods Corporation (1993-2001). He currently serves as a member of the boards of Adelphia Communications Corporation (2003-present), Bausch & Lomb, Inc., and Revlon Inc. (2004-present). |
Advisory Board Members and Executive Officers:
Correspondence intended for Mr. Mauriello may be sent to Fidelity Investments, P.O. Box 55235, Boston, Massachusetts 02205-5235. Correspondence intended for each executive officer and Mr. Lynch may be sent to Fidelity Investments, 82 Devonshire Street, Boston, Massachusetts 02109.
Name, Age; Principal Occupation |
Peter S. Lynch (63) |
| Year of Election or Appointment: 2003 Member of the Advisory Board of Fidelity Securities Fund. Mr. Lynch is Vice Chairman and a Director of FMR, and Vice Chairman (2001-present) and a Director of FMR Co., Inc. Previously, Mr. Lynch served as a Trustee of the Fidelity funds (1990-2003). In addition, he serves as a Trustee of Boston College and as the Chairman of the Inner-City Scholarship Fund. |
Joseph Mauriello (62) |
| Year of Election or Appointment: 2007 Member of the Advisory Board of Fidelity Securities Fund. Prior to his retirement in January 2006, Mr. Mauriello served in numerous senior management positions including Deputy Chairman and Chief Operating Officer (2004-2005), and Vice Chairman of Financial Services (2002-2004) of KPMG LLP US (professional services firm, 1965-2005). Mr. Mauriello currently serves as a member of the Board of Directors of XL Capital Ltd., (global insurance and re-insurance company, 2006-present) and of Arcadia Resources Inc., (health care services and products, 2007-present). He also served as a Director of the Hamilton Funds of the Bank of New York (2006-2007). |
Kimberley H. Monasterio (43) |
| Year of Election or Appointment: 2007 President and Treasurer of the fund. Ms. Monasterio also serves as President and Treasurer of other Fidelity funds (2007-present) and is an employee of FMR (2004-present). Previously, Ms. Monasterio served as Deputy Treasurer of the Fidelity funds (2004-2006). Before joining Fidelity Investments, Ms. Monasterio served as Treasurer (2000-2004) and Chief Financial Officer (2002-2004) of the Franklin Templeton Funds and Senior Vice President of Franklin Templeton Services, LLC (2000-2004). |
Dwight D. Churchill (53) |
| Year of Election or Appointment: 2005 Vice President of the fund. Mr. Churchill also serves as Vice President of certain Equity Funds (2005-present). Mr. Churchill is Executive Vice President of FMR (2005-present) and FMR Co., Inc. (2005-present). Previously, Mr. Churchill served as Senior Vice President of Fidelity Investments Money Management, Inc. (2005-2006), Head of Fidelity's Fixed-Income Division (2000-2005), Vice President of Fidelity's Money Market Funds (2000-2005), Vice President of Fidelity's Bond Funds, and Senior Vice President of FMR. |
Bruce T. Herring (41) |
| Year of Election or Appointment: 2006 Vice President of the fund. Mr. Herring also serves as Vice President of certain Equity Funds (2006-present). Mr. Herring is Senior Vice President of FMR (2006-present) and Vice President of FMR Co., Inc. (2001-present). Previously, Mr. Herring served as a portfolio manager for Fidelity U.S. Equity Funds (2001-2005). |
Lionel Harris (40) |
| Year of Election or Appointment: 2005 Vice President of the fund. Mr. Harris also serves as Vice President of other funds advised by FMR. Prior to his current responsibilities, Mr. Harris worked as a research analyst, a high-income director of research, and portfolio manager. |
Eric D. Roiter (58) |
| Year of Election or Appointment: 2004 Secretary of the fund. He also serves as Secretary of other Fidelity funds; Vice President, General Counsel, and Secretary of FMR Co., Inc. (2001-present) and FMR; Assistant Secretary of Fidelity Management & Research (U.K.) Inc. (2001-present), Fidelity Research & Analysis Company (2001-present), and Fidelity Investments Money Management, Inc. (2001-present). Mr. Roiter is an Adjunct Member, Faculty of Law, at Boston College Law School (2003-present). Previously, Mr. Roiter served as Vice President and Secretary of Fidelity Distributors Corporation (FDC) (1998-2005). |
Scott C. Goebel (39) |
| Year of Election or Appointment: 2007 Assistant Secretary of the fund. Mr. Goebel also serves as Assistant Secretary of other Fidelity funds (2007-present), Vice President and Secretary of FDC (2006-present), and is an employee of FMR. |
R. Stephen Ganis (41) |
| Year of Election or Appointment: 2006 Anti-Money Laundering (AML) officer of the fund. Mr. Ganis also serves as AML officer of other Fidelity funds (2006-present) and FMR Corp. (2003-present). Before joining Fidelity Investments, Mr. Ganis practiced law at Goodwin Procter, LLP (2000-2002). |
Joseph B. Hollis (59) |
| Year of Election or Appointment: 2006 Chief Financial Officer of the fund. Mr. Hollis also serves as Chief Financial Officer of other Fidelity funds. Mr. Hollis is President of Fidelity Pricing and Cash Management Services (FPCMS) (2005-present). Mr. Hollis also serves as President and Director of Fidelity Service Company, Inc. (2006-present). Previously, Mr. Hollis served as Senior Vice President of Cash Management Services (1999-2002) and Investment Management Operations (2002-2005). |
Kenneth A. Rathgeber (60) |
| Year of Election or Appointment: 2004 Chief Compliance Officer of the fund. Mr. Rathgeber also serves as Chief Compliance Officer of other Fidelity funds (2004-present) and Executive Vice President of Risk Oversight for Fidelity Investments (2002-present). He is Chief Compliance Officer of FMR (2005-present), FMR Co., Inc. (2005-present), Fidelity Management & Research (U.K.) Inc. (2005-present), Fidelity Research & Analysis Company (2005-present), Fidelity Investments Money Management, Inc. (2005-present), and Strategic Advisers, Inc. (2005-present). Previously, Mr. Rathgeber served as Executive Vice President and Chief Operating Officer for Fidelity Investments Institutional Services Company, Inc. (1998-2002). |
Bryan A. Mehrmann (46) |
| Year of Election or Appointment: 2005 Deputy Treasurer of the fund. Mr. Mehrmann also serves as Deputy Treasurer of other Fidelity funds (2005-present) and is an employee of FMR. Previously, Mr. Mehrmann served as Vice President of Fidelity Investments Institutional Services Group (FIIS)/Fidelity Investments Institutional Operations Corporation, Inc. (FIIOC) Client Services (1998-2004). |
Kenneth B. Robins (37) |
| Year of Election or Appointment: 2005 Deputy Treasurer of the fund. Mr. Robins also serves as Deputy Treasurer of other Fidelity funds (2005-present) and is an employee of FMR (2004-present). Before joining Fidelity Investments, Mr. Robins worked at KPMG LLP, where he was a partner in KPMG's department of professional practice (2002-2004) and a Senior Manager (1999-2000). In addition, Mr. Robins served as Assistant Chief Accountant, United States Securities and Exchange Commission (2000-2002). |
Robert G. Byrnes (40) |
| Year of Election or Appointment: 2005 Assistant Treasurer of the fund. Mr. Byrnes also serves as Assistant Treasurer of other Fidelity funds (2005-present) and is an employee of FMR (2005-present). Previously, Mr. Byrnes served as Vice President of FPCMS (2003-2005). Before joining Fidelity Investments, Mr. Byrnes worked at Deutsche Asset Management where he served as Vice President of the Investment Operations Group (2000-2003). |
Name, Age; Principal Occupation |
Peter L. Lydecker (53) |
| Year of Election or Appointment: 2004 Assistant Treasurer of the fund. Mr. Lydecker also serves as Assistant Treasurer of other Fidelity funds (2004) and is an employee of FMR. |
Gary W. Ryan (48) |
| Year of Election or Appointment: 2005 Assistant Treasurer of the fund. Mr. Ryan also serves as Assistant Treasurer of other Fidelity funds (2005-present) and is an employee of FMR (2005-present). Previously, Mr. Ryan served as Vice President of Fund Reporting in FPCMS (1999-2005). |
Annual Report
Distributions
The Board of Trustees of Advisor Small Cap Growth Fund voted to pay to shareholders of record at the opening of business on record date, the following distributions per share derived from capital gains realized from sales of portfolio securities, and dividends derived from net investment income:
| Pay Date | Record Date | Dividends | Capital Gains |
Class A | 9/10/2007 | 9/7/2007 | $0.00 | $1.008 |
Class T | 9/10/2007 | 9/7/2007 | $0.00 | $0.951 |
Class B | 9/10/2007 | 9/7/2007 | $0.00 | $0.877 |
Class C | 9/10/2007 | 9/7/2007 | $0.00 | $0.898 |
The fund hereby designates as a capital gain dividend with respect to the taxable year ended July 31, 2007, $23,164,051, or, if subsequently determined to be different, the net capital gain of such year.
Class A designates 45% and Class T designates 94% of the dividend distributed in September 2006 as qualifying for the dividends-received deduction for corporate shareholders.
Class A designates 65% and Class T designates 100% of the dividend distributed in September 2006 as amounts which may be taken into account as a dividend for purposes of the maximum rate under section 1(h)(11) of the Internal Revenue Code.
The fund will notify shareholders in January 2008 of amounts for use in preparing 2007 income tax returns.
Annual Report
Board Approval of Investment Advisory Contracts and Management Fees
Fidelity Small Cap Growth Fund
Each year, typically in July, the Board of Trustees, including the Independent Trustees (together, the Board), votes on the renewal of the management contract and sub-advisory agreements (together, the Advisory Contracts) for the fund. The Board, assisted by the advice of fund counsel and Independent Trustees' counsel, requests and considers a broad range of information throughout the year.
The Board meets regularly each month except August and takes into account throughout the year matters bearing on Advisory Contracts. The Board, acting directly and through its separate committees, considers at each of its meetings factors that are relevant to the annual renewal of the fund's Advisory Contracts, including the services and support provided to the fund and its shareholders. At the time of the renewal, the Board had 12 standing committees, each composed of Independent Trustees with varying backgrounds, to which the Board has assigned specific subject matter responsibilities in order to enhance effective decision-making by the Board. Each committee has adopted a written charter outlining the structure and purposes of the committee. One such committee, the Equity Contract Committee, meets periodically as needed throughout the year to consider matters specifically related to the annual renewal of Advisory Contracts. The committee requests and receives information on, and makes recommendations to the Independent Trustees concerning, the approval and annual review of the Advisory Contracts.
At its July 2007 meeting, the Board of Trustees, including the Independent Trustees, unanimously determined to renew the Advisory Contracts for the fund. In reaching its determination, the Board considered all factors it believed relevant, including (i) the nature, extent, and quality of the services to be provided to the fund and its shareholders (including the investment performance of the fund); (ii) the competitiveness of the management fee and total expenses of the fund; (iii) the total costs of the services to be provided by and the profits to be realized by the investment adviser and its affiliates from the relationship with the fund; (iv) the extent to which economies of scale would be realized as the fund grows; and (v) whether fee levels reflect these economies of scale, if any, for the benefit of fund shareholders. The Board also approved amendments to the fund's agreements with foreign sub-advisers to clarify that each sub-adviser provides services as an independent contractor.
In determining whether to renew the Advisory Contracts for the fund, the Board ultimately reached a determination, with the assistance of fund counsel and Independent Trustees' counsel, that the renewal of the Advisory Contracts and the compensation to be received by Fidelity under the management contract is consistent with Fidelity's fiduciary duty under applicable law. In addition to evaluating the specific factors noted above, the Board, in reaching its determination, is aware that shareholders in the fund have a broad range of investment choices available to them, including a wide choice among mutual funds offered by competitors to Fidelity, and that the fund's shareholders, with the opportunity to review and weigh the disclosure provided by the fund in its prospectus and other public disclosures, have chosen to invest in this fund, managed by Fidelity.
Annual Report
Nature, Extent, and Quality of Services Provided. The Board considered staffing within the investment adviser, FMR, and the sub-advisers (together, the Investment Advisers), including the background of the fund's portfolio manager and the fund's investment objective and discipline. The Independent Trustees also had discussions with senior management of Fidelity's investment operations and investment groups. The Board considered the structure of the portfolio manager compensation program and whether this structure provides appropriate incentives.
Resources Dedicated to Investment Management and Support Services. The Board reviewed the size, education, and experience of the Investment Advisers' investment staff, their use of technology, and the Investment Advisers' approach to recruiting, training, and retaining portfolio managers and other research, advisory, and management personnel. The Board considered Fidelity's extensive global research capabilities that enable the Investment Advisers to aggregate data from various sources in an effort to produce positive investment results. The Board noted that Fidelity's analysts have access to a variety of technological tools that enable them to perform both fundamental and quantitative analysis and to specialize in various disciplines. The Board also considered that Fidelity's portfolio managers and analysts have access to daily portfolio attribution that allows for monitoring of a fund's portfolio, as well as an electronic communication system that provides immediate real-time access to research concerning issuers and credit enhancers.
Shareholder and Administrative Services. The Board considered (i) the nature, extent, quality, and cost of advisory, administrative, distribution, and shareholder services performed by the Investment Advisers and their affiliates under the Advisory Contracts and under separate agreements covering transfer agency, pricing and bookkeeping, and securities lending services for the fund; (ii) the nature and extent of the Investment Advisers' supervision of third party service providers, principally custodians and subcustodians; and (iii) the resources devoted to, and the record of compliance with, the fund's compliance policies and procedures. The Board reviewed the allocation of fund brokerage, including allocations to brokers affiliated with the Investment Advisers, the use of brokerage commissions to pay fund expenses, and the use of "soft" commission dollars to pay for research services. The Board also considered that Fidelity voluntarily pays for market data out of its own resources.
The Board noted that the growth of fund assets across the complex allows Fidelity to reinvest in the development of services designed to enhance the value or convenience of the Fidelity funds as investment vehicles. These services include 24 hour access to account information and market information through phone representatives and over the Internet, and investor education materials and asset allocation tools.
Annual Report
Board Approval of Investment Advisory Contracts and
Management Fees - continued
Investment in a Large Fund Family. The Board considered the benefits to shareholders of investing in a Fidelity fund, including the benefits of investing in a fund that is part of a large family of funds offering a variety of investment disciplines and providing for a large variety of mutual fund investor services. For example, fund shareholders are offered the privilege of exchanging shares of the fund for shares of other Fidelity funds, as set forth in the fund's prospectus, without paying a sales charge. The Board noted that, since the last Advisory Contract renewals in July 2006, Fidelity has taken a number of actions that benefited particular funds, including (i) dedicating additional resources to investment research and to restructure the investment research teams; (ii) contractually agreeing to reduce the management fee on Fidelity Advisor Floating Rate High Income Fund; (iii) contractually agreeing to reduce the management fees on Fidelity's California, Massachusetts, New Jersey, and New York AMT Tax-Free Money Market Funds, launching new Institutional Classes and Service Classes of these funds, and contractually agreeing to impose expense limitations on these funds; (iv) eliminating the exchange fee on the Fidelity Select Portfolios and reducing the pricing and bookkeeping fee rates for these funds; (v) reducing the maximum transfer agency fee rates on high income funds and certain equity funds; (vi) proposing amended management contracts that, if approved by shareholders, will add a performance adjustment component to the management fees paid by 18 Fidelity Advisor equity funds; (vii) contractually agreeing to reduce fees for Ultra-Short Central Fund and the money market Central Funds; (viii) waiving the Fidelity Advisor funds' contingent deferred sales charge on certain redemptions made through systematic withdrawal programs; and (ix) amending the management contracts for equity and fixed-income funds whose management contracts incorporate a "group fee" structure by adding four new fee "breakpoints" to the group fee rate schedules.
Investment Performance and Compliance. The Board considered whether the fund has operated within its investment objective, as well as its record of compliance with its investment restrictions. It also reviewed the fund's absolute investment performance for each class, as well as the fund's relative investment performance for each class measured against (i) a broad-based securities market index, and (ii) a peer group of mutual funds deemed appropriate by the Board. Because the fund had been in existence less than three calendar years, the following chart considered by the Board shows, for the one-year period ended December 31, 2006, the total returns of Institutional Class (Class I) and Class B of the fund, the total return of a broad-based securities market index ("benchmark"), and a range of total returns of a peer group of mutual funds identified by Morningstar, Inc. as having an investment style similar to that of the fund based on underlying portfolio holdings. The returns of Institutional Class (Class I) and Class B show the performance of the highest and lowest performing classes, respectively. The box within the chart shows the 25th percentile return (bottom of box) and the 75th percentile return (top of box) of the peer group. Returns shown above the box are in the first quartile and returns shown below the box are in the fourth quartile. The percentage beaten numbers noted below the chart correspond to the percentile box and represent the percentage of funds in the peer group whose performance was equal to or lower than that of the class indicated.
Annual Report
Fidelity Small Cap Growth Fund

The Board reviewed the fund's relative investment performance against its peer group and stated that the performance of Institutional Class (Class I) of the fund was in the second quartile for the period shown. The Board also stated that the investment performance of Institutional Class (Class I) of the fund compared favorably to its benchmark for the period shown. The Board considered that the variations in performance among the fund's classes reflect the variations in class expenses, which result in lower performance for higher expense classes. The Board stated that it is difficult to evaluate in any comprehensive fashion the performance of the fund, in light of its relatively recent commencement of operations.
The Board also considered that the fund's management fee is subject to upward or downward adjustment depending upon whether, and to what extent, the fund's investment performance for the performance period exceeds, or is exceeded by, the record (over the same period) of a Board-approved performance adjustment index. The Board realizes that the performance adjustment provides FMR with a strong economic incentive to seek to achieve superior performance for the fund's shareholders and helps to more closely align the interests of FMR and the fund's shareholders.
Annual Report
Board Approval of Investment Advisory Contracts and
Management Fees - continued
The Board considered that FMR has taken steps to refocus and strengthen equity research, equity portfolio management, and compliance.
Based on its review, and giving particular weight to the nature and quality of the resources dedicated by the Investment Advisers to maintain and improve relative performance, the Board concluded that the nature, extent, and quality of the services provided to the fund will benefit the fund's shareholders, particularly in light of the Board's view that the fund's shareholders benefit from investing in a fund that is part of a large family of funds offering a variety of investment disciplines and services.
Competitiveness of Management Fee and Total Fund Expenses. The Board considered the fund's management fee and total expenses compared to "mapped groups" of competitive funds and classes. Fidelity creates "mapped groups" by combining similar Lipper investment objective categories that have comparable management fee characteristics. Combining Lipper investment objective categories aids the Board's management fee and total expense comparisons by broadening the competitive group used for comparison and by reducing the number of universes to which various Fidelity funds are compared. The Board also considered supplemental information about how the fund's management fee and total expenses ranked relative to groups based on Lipper classifications, which take into account a fund's market capitalization and style.
The Board considered two proprietary management fee comparisons for the 12-month (or shorter) periods shown in the chart below. The group of Lipper funds used by the Board for management fee comparisons is referred to below as the "Total Mapped Group." The Total Mapped Group comparison focuses on a fund's standing relative to the total universe of comparable funds available to investors, in terms of gross management fees before expense reimbursements or caps, and without giving effect to the fund's performance adjustment. "TMG %" represents the percentage of funds in the Total Mapped Group that had management fees that were lower than the fund's. For example, a TMG % of 13% means that 87% of the funds in the Total Mapped Group had higher management fees than the fund. The "Asset-Size Peer Group" (ASPG) comparison focuses on a fund's standing relative to non-Fidelity funds similar in size to the fund within the Total Mapped Group. The ASPG represents at least 15% of the funds in the Total Mapped Group with comparable asset size and management fee characteristics, subject to a minimum of 50 funds (or all funds in the Total Mapped Group if fewer than 50). Additional information, such as the ASPG quartile in which the fund's management fee ranked and the impact of the fund's performance adjustment, is also included in the chart and considered by the Board.
Annual Report
Fidelity Small Cap Growth Fund
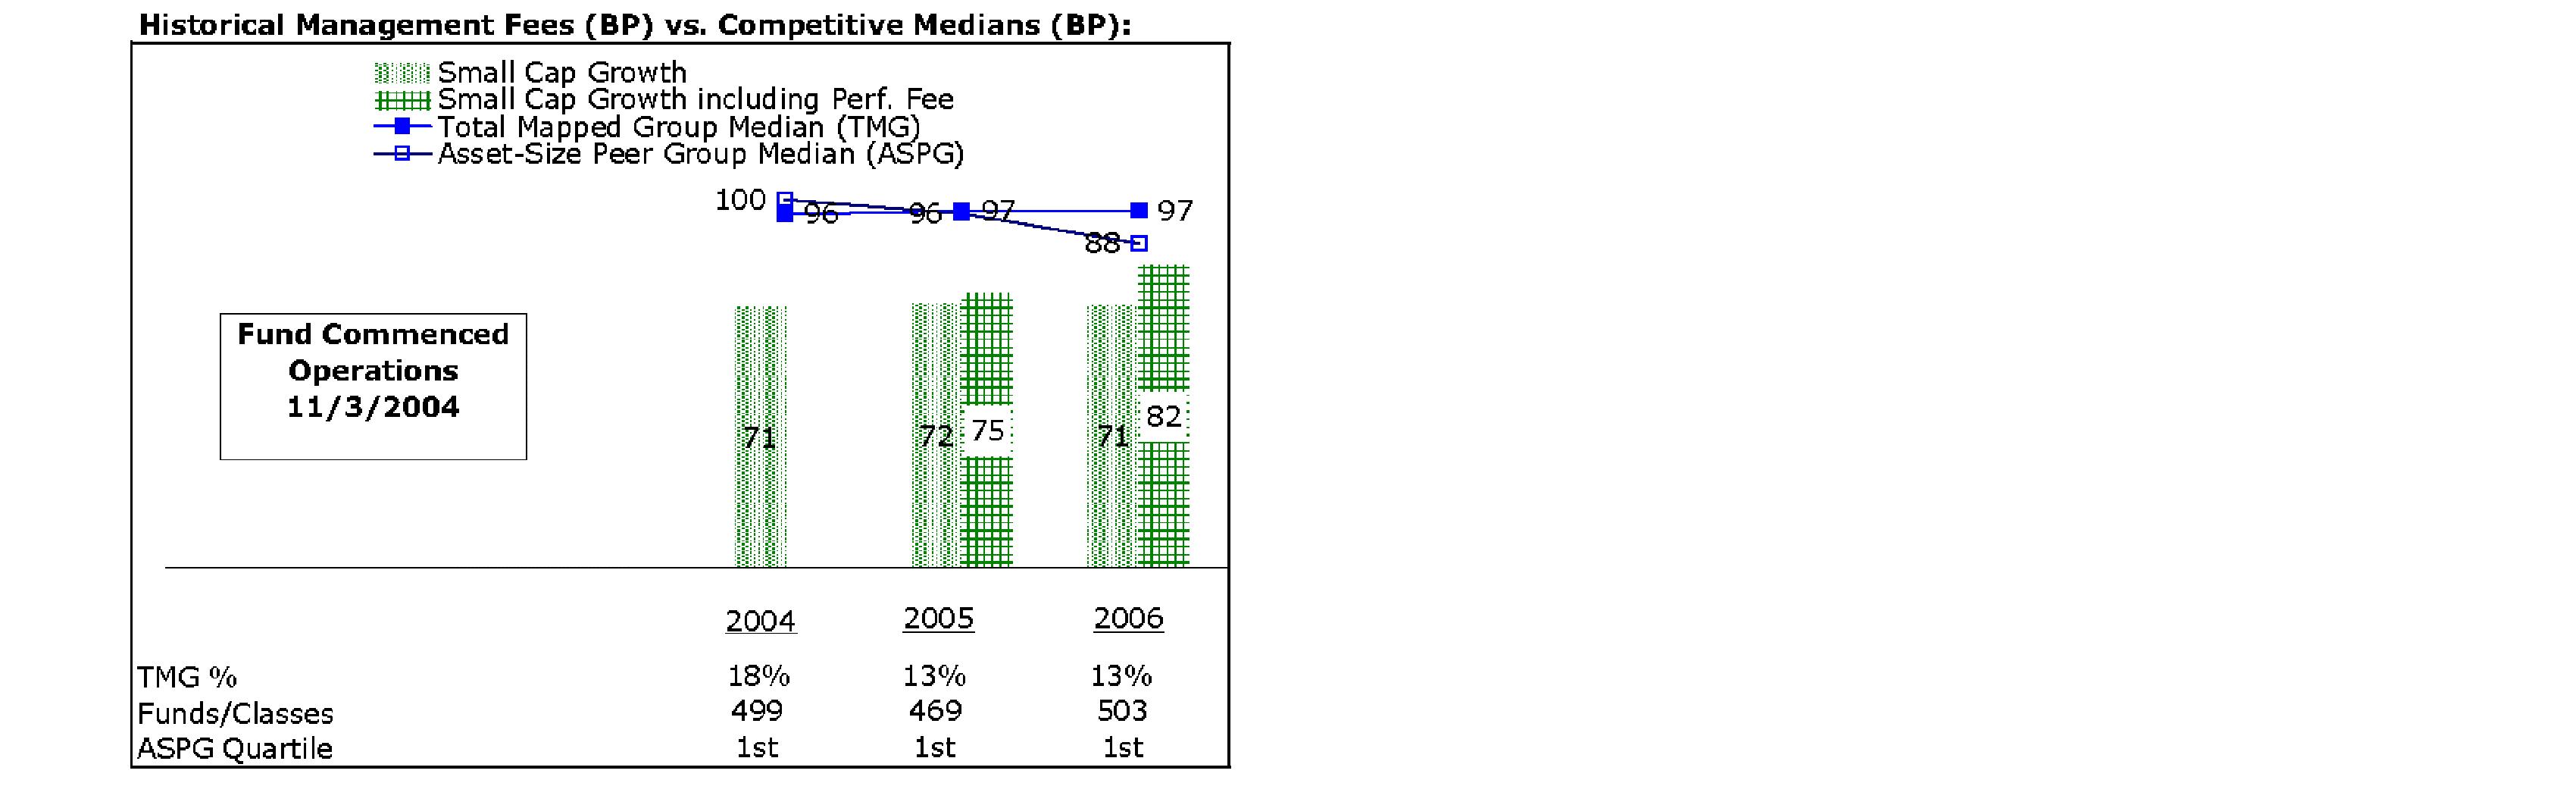
The Board noted that the fund's management fee ranked below the median of its Total Mapped Group and below the median of its ASPG for 2006. The Board also noted the effect of the fund's positive performance adjustment on the fund's management fee ranking. The Board noted that the performance adjustment for each year represents calculations for performance periods that differ from the period shown in the performance chart above.
Based on its review, the Board concluded that the fund's management fee was fair and reasonable in light of the services that the fund receives and the other factors considered.
In its review of each class's total expenses, the Board considered the fund's management fee as well as other fund or class expenses, as applicable, such as transfer agent fees, pricing and bookkeeping fees, fund-paid 12b-1 fees, and custodial, legal, and audit fees. The Board also noted the effects of any waivers and reimbursements on fees and expenses, as well as the fund's positive performance adjustment. As part of its review, the Board also considered current and historical total expenses of each class of the fund compared to competitive fund median expenses. Each class of the fund is compared to those funds and classes in the Total Mapped Group (used by the Board for management fee comparisons) that have a similar sales load structure.
The Board noted that the total expenses of each of Class A, Institutional Class, and Fidelity Small Cap Growth (retail class) ranked below its competitive median for 2006, the total expenses of Class B ranked equal to its competitive median for 2006, and the total expenses of each of Class T and Class C ranked above its competitive median for 2006. The Board considered that the total expenses of Class C were above the median because of its higher transfer agent fee due to small average account size. The Board noted that the fund offers multiple classes, each of which has a different sales load and 12b-1 fee structure, and that the multiple structures are intended to offer a range of pricing options for the intermediary market. The Board also noted that the total expenses of the classes vary primarily by the level of their 12b-1 fees, although differences in transfer agent fees may also cause expenses to vary from class to class.
Annual Report
Board Approval of Investment Advisory Contracts and
Management Fees - continued
In its review of total expenses, the Board also considered Fidelity fee structures and other information on clients that FMR and its affiliates service in other competitive markets, such as other mutual funds advised or subadvised by FMR or its affiliates, pension plan clients, and other institutional clients.
Based on its review, the Board concluded that the total expenses of each class of the fund were reasonable, although in some cases above the median of the universe presented for comparison, in light of the services that the fund and its shareholders receive and the other factors considered.
Costs of the Services and Profitability. The Board considered the revenues earned and the expenses incurred by Fidelity in conducting the business of developing, marketing, distributing, managing, administering and servicing the fund and its shareholders. The Board also considered the level of Fidelity's profits in respect of all the Fidelity funds.
On an annual basis, FMR presents to the Board Fidelity's profitability for the fund. Fidelity calculates the profitability for each fund, as well as aggregate profitability for groups of Fidelity funds and all Fidelity funds, using a series of detailed revenue and cost allocation methodologies which originate with the audited books and records of Fidelity. The Audit Committee of the Board reviews any significant changes from the prior year's methodologies.
PricewaterhouseCoopers LLP (PwC), independent registered public accounting firm and auditor to Fidelity and certain Fidelity funds, has been engaged annually by the Board as part of the Board's assessment of the results of Fidelity's profitability analysis. PwC's engagement includes the review and assessment of Fidelity's methodologies used in determining the revenues and expenses attributable to Fidelity's mutual fund business, and completion of agreed-upon procedures surrounding the mathematical accuracy of fund profitability and its conformity to allocation methodologies. After considering PwC's reports issued under the engagement and information provided by Fidelity, the Board believes that while other allocation methods may also be reasonable, Fidelity's profitability methodologies are reasonable in all material respects.
Annual Report
The Board has also reviewed Fidelity's non-fund businesses and any fall-out benefits related to the mutual fund business as well as cases where Fidelity's affiliates may benefit from or be related to the fund's business.
The Board considered the costs of the services provided by and the profits realized by Fidelity in connection with the operation of the fund and determined that the amount of profit is a fair entrepreneurial profit for the management of the fund.
Economies of Scale. The Board considered whether there have been economies of scale in respect of the management of the Fidelity funds, whether the Fidelity funds (including the fund) have appropriately benefited from any such economies of scale, and whether there is potential for realization of any further economies of scale. The Board considered the extent to which the fund will benefit from economies of scale through increased services to the fund, through waivers or reimbursements, or through fee or expense reductions, including reductions that occur through operation of the transfer agent agreement. The transfer agent fee varies in part based on the number of accounts in the fund. If the number of accounts decreases or the average account size increases, the overall transfer agent fee rate decreases.
The Board recognized that the fund's management contract incorporates a "group fee" structure, which provides for lower group fee rates as total fund assets under FMR's management increase, and for higher group fee rates as total fund assets under FMR's management decrease. FMR determines the group fee rates based on a tiered asset "breakpoint" schedule. In connection with the renewal of the fund's management contract, the Board approved amendments to the fund's management contract that added four new fee breakpoints to the group fee rate schedule for assets under FMR's management above $1,386 billion. The Board considered that the group fee rate declines under both the present and amended schedules, but that under the amended schedule, the group fee rate declines faster as assets under FMR's management exceed $1,386 billion. The Board considered that the group fee is designed to deliver the benefits of economies of scale to fund shareholders when total fund assets increase, even if assets of any particular fund are unchanged or have declined, because some portion of Fidelity's costs are attributable to services provided to all Fidelity funds, and all funds benefit if those costs can be allocated among more assets. The Board concluded that, given the group fee structure, fund shareholders will achieve a certain level of economies of scale as assets under FMR's management increase at the fund complex level, regardless of whether Fidelity achieves any such economies of scale.
The Board further concluded that any potential economies of scale are being shared between fund shareholders and Fidelity in an appropriate manner.
Additional Information Requested by the Board. In order to develop fully the factual basis for consideration of the Fidelity funds' Advisory Contracts, the Board requested and received additional information on several topics, including (i) fund performance trends and actions to be taken by FMR to improve certain funds' overall performance; (ii) Fidelity's portfolio manager compensation structure, including its effects on fund profitability and the extent to which portfolio manager compensation is linked to fund performance; (iii) Fidelity's fee structures; (iv) the funds' sub-advisory arrangements; and (v) accounts managed by Fidelity other than the Fidelity funds.
Annual Report
Board Approval of Investment Advisory Contracts and
Management Fees - continued
Based on its evaluation of all of the conclusions noted above, and after considering all material factors, the Board ultimately concluded that the advisory fee structures are fair and reasonable, and that the fund's Advisory Contracts should be renewed.
Annual Report
Annual Report
Annual Report
Annual Report
Investment Adviser
Fidelity Management & Research Company
Boston, MA
Investment Sub-Advisers
FMR Co., Inc.
Fidelity Management & Research
(U.K.) Inc.
Fidelity Research & Analysis Company
Fidelity International Investment Advisors
Fidelity Investments Japan Limited
Fidelity International Investment Advisors (U.K.) Limited
General Distributor
Fidelity Distributors Corporation
Boston, MA
Transfer and Service Agents
Fidelity Investments Institutional
Operations Company, Inc.
Boston, MA
Fidelity Service Company, Inc.
Boston, MA
Custodian
Citibank, N.A.
New York, NY
ASCP-UANN-0907
1.803713.102
(Fidelity Investment logo)(registered trademark)
(Fidelity Investment logo)(registered trademark)
Fidelity Advisor
Small Cap Growth
Fund - Institutional Class
Annual Report
July 31, 2007
Institutional Class
is a class of Fidelity®
Small Cap Growth
Fund
(2_fidelity_logos) (Registered_Trademark)
Contents
Chairman's Message | <Click Here> | Ned Johnson's message to shareholders. |
Performance | <Click Here> | How the fund has done over time. |
Management's Discussion | <Click Here> | The manager's review of fund performance, strategy and outlook. |
Shareholder Expense Example | <Click Here> | An example of shareholder expenses. |
Investment Changes | <Click Here> | A summary of major shifts in the fund's investments over the past six months. |
Investments | <Click Here> | A complete list of the fund's investments with their market values. |
Financial Statements | <Click Here> | Statements of assets and liabilities, operations, and changes in net assets,
as well as financial highlights. |
Notes | <Click Here> | Notes to the financial statements. |
Report of Independent Registered Public Accounting Firm | <Click Here> | |
Trustees and Officers | <Click Here> | |
Distributions | <Click Here> | |
Board Approval of Investment Advisory Contracts and Management Fees | <Click Here> | |
To view a fund's proxy voting guidelines and proxy voting record for the 12-month period ended June 30, visit http://www.fidelity.com (search for "proxy voting guidelines") or visit the Securities and Exchange Commission's (SEC) web site at http://www.sec.gov. You may also call 1-877-208-0098 to request a free copy of the proxy voting guidelines.
Standard & Poor's, S&P and S&P 500 are registered service marks of The McGraw-Hill Companies, Inc. and have been licensed for use by Fidelity Distributors Corporation.
Other third party marks appearing herein are the property of their respective owners.
All other marks appearing herein are registered or unregistered trademarks or service marks of FMR Corp. or an affiliated company.
Annual Report
This report and the financial statements contained herein are submitted for the general information of the shareholders of the fund. This report is not authorized for distribution to prospective investors in the fund unless preceded or accompanied by an effective prospectus.
A fund files its complete schedule of portfolio holdings with the SEC for the first and third quarters of each fiscal year on Form N-Q. Forms N-Q are available on the SEC's web site at http://www.sec.gov. A fund's Forms N-Q may be reviewed and copied at the SEC's Public Reference Room in Washington, DC. Information regarding the operation of the SEC's Public Reference Room may be obtained by calling 1-800-SEC-0330. For a complete list of a fund's portfolio holdings, view the most recent holdings listing, semiannual report, or annual report on Fidelity's web site at http://www.fidelity.com or http://www.advisor.fidelity.com, as applicable.
NOT FDIC INSURED · MAY LOSE VALUE · NO BANK GUARANTEE
Neither the fund nor Fidelity Distributors Corporation is a bank.
Annual Report
Chairman's Message
(photo_of_Edward_C_Johnson_3d)
Dear Shareholder:
Stocks are currently on pace to register their fifth-straight year of positive returns, although gains could be trimmed if the U.S. economy continues to slow. While financial markets are always unpredictable, there are a number of time-tested principles that can put the historical odds in your favor.
One of the basic tenets is to invest for the long term. Over time, riding out the markets' inevitable ups and downs has proven much more effective than selling into panic or chasing the hottest trend. Even missing only a few of the markets' best days can significantly diminish investor returns. Patience also affords the benefits of compounding - of earning interest on additional income or reinvested dividends and capital gains. There are tax advantages and cost benefits to consider as well. The more you sell, the more taxes you pay, and the more you trade, the higher the costs. While staying the course doesn't eliminate risk, it can considerably lessen the effect of short-term declines.
You can further manage your investing risk through diversification. And today, more than ever, geographic diversification should be taken into account. Studies indicate that asset allocation is the single most important determinant of a portfolio's long-term success. The right mix of stocks, bonds and cash - aligned to your particular risk tolerance and investment objective - is very important. Age-appropriate rebalancing is also an essential aspect of asset allocation. For younger investors, an emphasis on equities - which historically have been the best-performing asset class over time - is encouraged. As investors near their specific goal, such as retirement or sending a child to college, consideration may be given to replacing volatile assets (e.g. common stocks) with more-stable fixed investments (bonds or savings plans).
A third investment principle - investing regularly - can help lower the average cost of your purchases. Investing a certain amount of money each month or quarter helps ensure you won't pay for all your shares at market highs. This strategy - known as dollar cost averaging - also reduces unconstructive "emotion" from investing, helping shareholders avoid selling weak performers just prior to an upswing, or chasing a hot performer just before a correction.
We invite you to contact us via the Internet, through our Investor Centers or over the phone. It is our privilege to provide you the information you need to make the investments that are right for you.
Sincerely,
/s/Edward C. Johnson 3d
Edward C. Johnson 3d
Annual Report
Fidelity Advisor Small Cap Growth Fund - Institutional Class
Performance: The Bottom Line
Average annual total return reflects the change in the value of an investment, assuming reinvestment of the class' dividend income and capital gains (the profits earned upon the sale of securities that have grown in value) and assuming a constant rate of performance each year. The $10,000 table and the fund's returns do not reflect the deduction of taxes that a shareholder would pay on fund distributions or the redemption of fund shares. During periods of reimbursement by Fidelity, a fund's total return will be greater than it would be had the reimbursement not occurred. How a fund did yesterday is no guarantee of how it will do tomorrow.
Average Annual Total Returns
Periods ended July 31, 2007 | Past 1
year | Life of
FundA |
Institutional Class | 25.99% | 20.05% |
A From November 3, 2004.
$10,000 Over Life of Fund
Let's say hypothetically that $10,000 was invested in Fidelity Advisor Small Cap Growth Fund - Institutional Class on November 3, 2004, when the fund started. The chart shows how the value of your investment would have changed, and also shows how the Russell 2000® Growth Index performed over the same period.
Annual Report
Management's Discussion of Fund Performance
Comments from Lionel Harris, Portfolio Manager of Fidelity Advisor Small Cap Growth Fund
Major U.S. equity benchmarks approached or exceeded gains of 20% and several set record highs during the 12-month period ending July 31, 2007. In that time, the Dow Jones Industrial AverageSM rose 20.84%, the Standard & Poor's 500SM Index advanced 16.13% and the NASDAQ Composite® Index gained 22.67%. The small-cap Russell 2000® Index fared less well after falling nearly 7% in July, but still returned 12.12% for the year overall. The first half of the period featured six consecutive months of positive returns spurred by the more relaxed monetary policy of the Federal Reserve Board and falling energy prices, which softened inflationary pressures on the U.S. economy. Stocks slipped in February, however, as energy prices crept higher, the housing market slumped, subprime mortgage woes mounted and the Chinese stock market declined 9% in a single day. But equities soared again from March through May, as reflected by the Dow and the S&P 500®, which climbed nearly 12% and more than 9%, respectively. In June and July, though, stocks sank again on inflation concerns and a worsening subprime loan crisis.
During the past year, the fund's Institutional Class shares returned 25.99%, beating its benchmark, the Russell 2000 Growth Index, which rose 16.83%. Security selection in industrials - especially among capital goods stocks - was a huge positive, as was security selection in energy, which made up for an unhelpful overweighting there. In health care, the fund benefited from successful stock picks along with a significant underweighting in the pharmaceuticals/biotechnology/life science industry. My choices within financials also contributed. In contrast, very few sectors detracted, with some underperformance from consumer staples and utilities stocks. A modest cash allocation also hampered results. The portfolio's best-performing stock by far was an out-of-benchmark position in Western Refining. The backdrop for oil refiners such as Western remained extremely strong during the past year. Also outperforming was health care and non-benchmark stock Kos Pharmaceuticals - bought out before period end - and risk-management consultant Huron Consulting. An out-of-benchmark position in Omnicare was my biggest disappointment. The company struggled to overcome a variety of challenges, and I sold my position before period end. A missed opportunity was not owning benchmark component AK Steel, whose shares soared as steel prices continued to rise. Another recent laggard I sold was Sierra Health Services.
The views expressed above reflect those of the portfolio manager(s) only through the end of the period as stated on the cover of this report and do not necessarily represent the views of Fidelity or any other person in the Fidelity organization. Any such views are subject to change at any time based upon market or other conditions and Fidelity disclaims any responsibility to update such views. These views may not be relied on as investment advice and, because investment decisions for a Fidelity fund are based on numerous factors, may not be relied on as an indication of trading intent on behalf of any Fidelity fund.
Annual Report
Shareholder Expense Example
As a shareholder of the Fund, you incur two types of costs: (1) transaction costs, including sales charges (loads) on purchase payments or redemption proceeds, redemption fees, and (2) ongoing costs, including management fees, distribution and/or service (12b-1) fees and other Fund expenses. This Example is intended to help you understand your ongoing costs (in dollars) of investing in the Fund and to compare these costs with the ongoing costs of investing in other mutual funds.
The Example is based on an investment of $1,000 invested at the beginning of the period and held for the entire period (February 1, 2007 to July 31, 2007).
Actual Expenses
The first line of the accompanying table for each class of the Fund provides information about actual account values and actual expenses. You may use the information in this line, together with the amount you invested, to estimate the expenses that you paid over the period. Simply divide your account value by $1,000.00 (for example, an $8,600 account value divided by $1,000.00 = 8.6), then multiply the result by the number in the first line for a class of the Fund under the heading entitled "Expenses Paid During Period" to estimate the expenses you paid on your account during this period. A small balance maintenance fee of $12.00 that is charged once a year may apply for certain accounts with a value of less than $2,000. This fee is not included in the table below. If it was, the estimate of expenses you paid during the period would be higher, and your ending account value lower, by this amount. In addition, the Fund, as a shareholder in the underlying Fidelity Central Funds, will indirectly bear its pro rata share of the fees and expenses incurred by the underlying Fidelity Central Funds. These fees and expenses are not included in the Fund's annualized expense ratio used to calculate the expense estimate in the table below.
Hypothetical Example for Comparison Purposes
The second line of the accompanying table for each class of the Fund provides information about hypothetical account values and hypothetical expenses based on a Class' actual expense ratio and an assumed rate of return of 5% per year before expenses, which is not the Class' actual return. The hypothetical account values and expenses may not be used to estimate the actual ending account balance or expenses you paid for the period. You may use this information to compare the ongoing costs of investing in the Fund and other funds. To do so, compare this 5% hypothetical example with the 5% hypothetical examples that appear in the shareholder reports of the other funds. A small balance maintenance fee of $12.00 that is charged once a year may apply for certain accounts with a value of less than $2,000. This fee is not included in the table below. If it was, the estimate of expenses you paid during the period would be higher, and your ending account value lower, by this amount. In addition, the Fund, as a shareholder in the underlying Fidelity Central Funds, will indirectly bear its pro rata share of the fees and expenses incurred by the underlying Fidelity Central Funds. These fees and expenses are not included in the Fund's annualized expense ratio used to calculate the expense estimate in the table below.
Annual Report
Shareholder Expense Example - continued
Please note that the expenses shown in the table are meant to highlight your ongoing costs only and do not reflect any transaction costs. Therefore, the second line of the table is useful in comparing ongoing costs only, and will not help you determine the relative total costs of owning different funds. In addition, if these transactional costs were included, your costs would have been higher.
| Beginning
Account Value
February 1, 2007 | Ending
Account Value
July 31, 2007 | Expenses Paid
During Period*
February 1, 2007
to July 31, 2007 |
Class A | | | |
Actual | $ 1,000.00 | $ 1,081.50 | $ 7.23 |
HypotheticalA | $ 1,000.00 | $ 1,017.85 | $ 7.00 |
Class T | | | |
Actual | $ 1,000.00 | $ 1,080.30 | $ 8.51 |
HypotheticalA | $ 1,000.00 | $ 1,016.61 | $ 8.25 |
Class B | | | |
Actual | $ 1,000.00 | $ 1,078.20 | $ 11.08 |
HypotheticalA | $ 1,000.00 | $ 1,014.13 | $ 10.74 |
Class C | | | |
Actual | $ 1,000.00 | $ 1,077.60 | $ 11.08 |
HypotheticalA | $ 1,000.00 | $ 1,014.13 | $ 10.74 |
Small Cap Growth | | | |
Actual | $ 1,000.00 | $ 1,083.20 | $ 5.58 |
HypotheticalA | $ 1,000.00 | $ 1,019.44 | $ 5.41 |
Institutional Class | | | |
Actual | $ 1,000.00 | $ 1,083.90 | $ 5.27 |
HypotheticalA | $ 1,000.00 | $ 1,019.74 | $ 5.11 |
A 5% return per year before expenses
* Expenses are equal to each Class' annualized expense ratio (shown in the table below); multiplied by the average account value over the period, multiplied by 181/365 (to reflect the one-half year period).
| Annualized
Expense Ratio |
Class A | 1.40% |
Class T | 1.65% |
Class B | 2.15% |
Class C | 2.15% |
Small Cap Growth | 1.08% |
Institutional Class | 1.02% |
Annual Report
Investment Changes
Top Ten Stocks as of July 31, 2007 |
| % of fund's
net assets | % of fund's net assets
6 months ago |
Harris Corp. | 1.5 | 1.4 |
Satyam Computer Services Ltd. sponsored ADR | 1.5 | 1.1 |
Trimble Navigation Ltd. | 1.4 | 1.0 |
Respironics, Inc. | 1.3 | 1.1 |
Titanium Metals Corp. | 1.3 | 0.9 |
j2 Global Communications, Inc. | 1.3 | 1.4 |
Chattem, Inc. | 1.3 | 0.8 |
VCA Antech, Inc. | 1.3 | 1.1 |
Huron Consulting Group, Inc. | 1.2 | 1.3 |
Flowserve Corp. | 1.2 | 1.0 |
| 13.3 | |
Top Five Market Sectors as of July 31, 2007 |
| % of fund's
net assets | % of fund's net assets
6 months ago |
Information Technology | 24.4 | 27.5 |
Industrials | 18.0 | 21.2 |
Health Care | 16.9 | 13.6 |
Energy | 10.7 | 9.0 |
Consumer Discretionary | 9.3 | 11.5 |
Asset Allocation (% of fund's net assets) |
As of July 31, 2007 * | As of January 31, 2007 ** |
| Stocks 95.9% | | | Stocks 96.2% | |
| Short-Term
Investments and
Net Other Assets 4.1% | | | Short-Term
Investments and
Net Other Assets 3.8% | |
* Foreign
investments | 10.2% | | ** Foreign
investments | 9.6% | |

Annual Report
Investments July 31, 2007
Showing Percentage of Net Assets
Common Stocks - 95.9% |
| Shares | | Value |
CONSUMER DISCRETIONARY - 9.3% |
Auto Components - 0.6% |
WABCO Holdings, Inc. (f) | 152,800 | | $ 7,334,400 |
Diversified Consumer Services - 0.8% |
Apollo Group, Inc. Class A (non-vtg.) (a) | 162,000 | | 9,575,820 |
Hotels, Restaurants & Leisure - 1.9% |
Life Time Fitness, Inc. (a)(d) | 131,900 | | 6,782,298 |
McCormick & Schmick's Seafood Restaurants (a) | 295,100 | | 7,194,538 |
Ruth's Chris Steak House, Inc. (a) | 602,700 | | 10,077,144 |
| | 24,053,980 |
Media - 1.6% |
Arbitron, Inc. | 80,700 | | 4,018,860 |
New Frontier Media, Inc. | 643,044 | | 5,459,444 |
R.H. Donnelley Corp. (a) | 180,800 | | 11,305,424 |
| | 20,783,728 |
Specialty Retail - 2.4% |
Hibbett Sports, Inc. (a) | 383,200 | | 9,821,416 |
Payless ShoeSource, Inc. (a) | 390,300 | | 10,389,786 |
The Men's Wearhouse, Inc. | 193,400 | | 9,553,960 |
| | 29,765,162 |
Textiles, Apparel & Luxury Goods - 2.0% |
Iconix Brand Group, Inc. (a)(d) | 510,600 | | 10,099,668 |
Skechers U.S.A., Inc. Class A (sub. vtg.) (a) | 214,475 | | 4,458,935 |
Volcom, Inc. (a) | 293,900 | | 10,427,572 |
| | 24,986,175 |
TOTAL CONSUMER DISCRETIONARY | | 116,499,265 |
CONSUMER STAPLES - 2.3% |
Personal Products - 2.3% |
Bare Escentuals, Inc. | 240,000 | | 6,770,400 |
Chattem, Inc. (a) | 287,500 | | 16,146,000 |
Physicians Formula Holdings, Inc. | 389,805 | | 5,827,585 |
| | 28,743,985 |
ENERGY - 10.7% |
Energy Equipment & Services - 3.5% |
Hanover Compressor Co. (a) | 475,400 | | 11,328,782 |
Hornbeck Offshore Services, Inc. (a)(d) | 170,600 | | 7,344,330 |
Common Stocks - continued |
| Shares | | Value |
ENERGY - continued |
Energy Equipment & Services - continued |
NATCO Group, Inc. Class A (a) | 235,800 | | $ 10,915,182 |
Superior Energy Services, Inc. (a) | 361,500 | | 14,575,680 |
| | 44,163,974 |
Oil, Gas & Consumable Fuels - 7.2% |
Cabot Oil & Gas Corp. | 231,100 | | 7,903,620 |
EXCO Resources, Inc. (a) | 550,000 | | 9,603,000 |
Forest Oil Corp. (a) | 353,033 | | 14,287,246 |
Foundation Coal Holdings, Inc. | 175,800 | | 6,126,630 |
Mariner Energy, Inc. (a) | 456,210 | | 9,639,717 |
Petrohawk Energy Corp. (a) | 749,100 | | 11,229,009 |
Range Resources Corp. | 216,350 | | 8,035,239 |
Tesoro Corp. | 280,600 | | 13,973,880 |
Western Refining, Inc. | 175,700 | | 9,751,350 |
| | 90,549,691 |
TOTAL ENERGY | | 134,713,665 |
FINANCIALS - 7.9% |
Commercial Banks - 0.8% |
UMB Financial Corp. | 277,724 | | 10,370,214 |
Consumer Finance - 1.1% |
Cash America International, Inc. | 175,400 | | 6,423,148 |
Dollar Financial Corp. (a) | 282,378 | | 7,076,393 |
| | 13,499,541 |
Diversified Financial Services - 0.2% |
Endeavor Acquisition Corp. (a) | 225,700 | | 2,493,985 |
Insurance - 4.5% |
Aspen Insurance Holdings Ltd. | 318,800 | | 7,794,660 |
Max Capital Group Ltd. | 312,075 | | 8,148,278 |
National Financial Partners Corp. | 275,200 | | 12,758,272 |
StanCorp Financial Group, Inc. | 186,982 | | 8,780,675 |
Universal American Financial Corp. (a) | 450,831 | | 8,976,045 |
Willis Group Holdings Ltd. | 252,600 | | 10,253,034 |
| | 56,710,964 |
Real Estate Management & Development - 1.0% |
CB Richard Ellis Group, Inc. Class A (a) | 348,100 | | 12,155,652 |
Common Stocks - continued |
| Shares | | Value |
FINANCIALS - continued |
Thrifts & Mortgage Finance - 0.3% |
Triad Guaranty, Inc. (a) | 155,600 | | $ 4,289,892 |
TOTAL FINANCIALS | | 99,520,248 |
HEALTH CARE - 16.9% |
Biotechnology - 0.2% |
Cephalon, Inc. (a) | 35,000 | | 2,629,900 |
Health Care Equipment & Supplies - 7.1% |
American Medical Systems Holdings, Inc. (a)(d) | 579,700 | | 10,596,916 |
ArthroCare Corp. (a) | 155,700 | | 7,881,534 |
Immucor, Inc. (a) | 328,400 | | 10,232,944 |
Integra LifeSciences Holdings Corp. (a)(d) | 163,600 | | 8,122,740 |
Inverness Medical Innovations, Inc. (a) | 197,500 | | 9,560,975 |
Mentor Corp. (d) | 187,200 | | 7,366,320 |
Meridian Bioscience, Inc. | 285,000 | | 6,364,050 |
Respironics, Inc. (a) | 361,400 | | 16,534,050 |
Shandong Weigao Group Medical Polymer Co. Ltd.
(H shares) | 1,440,000 | | 3,576,205 |
Sirona Dental Systems, Inc. (a)(d) | 245,500 | | 8,680,880 |
| | 88,916,614 |
Health Care Providers & Services - 5.2% |
Healthways, Inc. (a)(d) | 207,418 | | 9,064,167 |
Henry Schein, Inc. (a) | 211,700 | | 11,503,778 |
Humana, Inc. (a) | 167,900 | | 10,760,711 |
PSS World Medical, Inc. (a) | 543,399 | | 9,362,765 |
Sun Healthcare Group, Inc. (a) | 610,800 | | 8,258,016 |
VCA Antech, Inc. (a) | 408,600 | | 16,074,324 |
| | 65,023,761 |
Health Care Technology - 1.0% |
Allscripts Healthcare Solutions, Inc. (a)(d) | 300,000 | | 6,825,000 |
Cerner Corp. (a) | 123,500 | | 6,529,445 |
| | 13,354,445 |
Life Sciences Tools & Services - 1.7% |
Harvard Bioscience, Inc. (a) | 448,000 | | 2,302,720 |
ICON PLC sponsored ADR | 149,890 | | 7,010,355 |
Pharmaceutical Product Development, Inc. | 353,400 | | 11,838,900 |
| | 21,151,975 |
Common Stocks - continued |
| Shares | | Value |
HEALTH CARE - continued |
Pharmaceuticals - 1.7% |
Adams Respiratory Therapeutics, Inc. (a)(d) | 263,100 | | $ 9,737,331 |
Medicis Pharmaceutical Corp. Class A | 410,500 | | 11,711,565 |
| | 21,448,896 |
TOTAL HEALTH CARE | | 212,525,591 |
INDUSTRIALS - 18.0% |
Aerospace & Defense - 2.0% |
Hexcel Corp. (a)(d) | 604,200 | | 13,135,308 |
Ladish Co., Inc. (a) | 255,300 | | 12,379,497 |
| | 25,514,805 |
Airlines - 0.5% |
Delta Air Lines, Inc. (a) | 359,700 | | 6,409,854 |
Commercial Services & Supplies - 6.1% |
American Reprographics Co. (a)(d) | 256,300 | | 6,386,996 |
CDI Corp. | 399,200 | | 11,293,368 |
Clean Harbors, Inc. (a) | 187,500 | | 9,005,625 |
CoStar Group, Inc. (a)(d) | 181,736 | | 9,268,536 |
Huron Consulting Group, Inc. (a) | 229,000 | | 15,555,970 |
InnerWorkings, Inc. (d) | 424,300 | | 5,664,405 |
Kenexa Corp. (a) | 239,000 | | 8,551,420 |
Navigant Consulting, Inc. (a) | 691,500 | | 10,891,125 |
| | 76,617,445 |
Construction & Engineering - 3.0% |
Chicago Bridge & Iron Co. NV (NY Shares) | 247,700 | | 10,056,620 |
Fluor Corp. | 113,200 | | 13,075,732 |
Infrasource Services, Inc. (a) | 233,200 | | 8,073,384 |
Washington Group International, Inc. (a) | 70,300 | | 5,646,496 |
| | 36,852,232 |
Electrical Equipment - 1.9% |
EnerSys (a) | 482,200 | | 8,727,820 |
Genlyte Group, Inc. (a) | 117,300 | | 8,160,561 |
Q-Cells AG (a)(d) | 76,100 | | 6,737,304 |
| | 23,625,685 |
Industrial Conglomerates - 0.7% |
Raven Industries, Inc. | 261,600 | | 8,899,632 |
Machinery - 3.1% |
Bucyrus International, Inc. Class A (d) | 222,400 | | 14,135,744 |
Common Stocks - continued |
| Shares | | Value |
INDUSTRIALS - continued |
Machinery - continued |
Flowserve Corp. | 211,000 | | $ 15,248,970 |
IDEX Corp. | 271,953 | | 9,847,418 |
| | 39,232,132 |
Transportation Infrastructure - 0.7% |
Quixote Corp. (e) | 459,900 | | 8,618,526 |
TOTAL INDUSTRIALS | | 225,770,311 |
INFORMATION TECHNOLOGY - 24.4% |
Communications Equipment - 3.8% |
F5 Networks, Inc. (a) | 111,600 | | 9,674,604 |
Harris Corp. (d) | 356,700 | | 19,575,693 |
Nice Systems Ltd. sponsored ADR (a) | 216,500 | | 7,192,130 |
Polycom, Inc. (a) | 367,500 | | 11,381,475 |
| | 47,823,902 |
Electronic Equipment & Instruments - 2.6% |
Cogent, Inc. (a)(d) | 578,000 | | 7,693,180 |
ScanSource, Inc. (a) | 285,600 | | 7,662,648 |
Trimble Navigation Ltd. (a) | 525,300 | | 17,350,659 |
| | 32,706,487 |
Internet Software & Services - 3.5% |
CyberSource Corp. (a)(d) | 351,060 | | 4,040,701 |
Equinix, Inc. (a)(d) | 166,200 | | 14,444,442 |
j2 Global Communications, Inc. (a)(d) | 497,800 | | 16,248,192 |
ValueClick, Inc. (a) | 431,700 | | 9,229,746 |
| | 43,963,081 |
IT Services - 6.0% |
Authorize.Net Holdings, Inc. (a) | 420,900 | | 7,294,197 |
CACI International, Inc. Class A (a) | 231,700 | | 10,296,748 |
Datacash Group PLC | 1,590,400 | | 8,690,687 |
MoneyGram International, Inc. | 389,400 | | 9,964,746 |
Satyam Computer Services Ltd. sponsored ADR (d) | 710,100 | | 18,931,266 |
SI International, Inc. (a) | 225,547 | | 6,570,184 |
SRA International, Inc. Class A (a) | 287,200 | | 6,841,104 |
WNS Holdings Ltd. ADR (a) | 310,500 | | 7,762,500 |
| | 76,351,432 |
Common Stocks - continued |
| Shares | | Value |
INFORMATION TECHNOLOGY - continued |
Semiconductors & Semiconductor Equipment - 5.2% |
California Micro Devices Corp. (a) | 837,900 | | $ 3,753,792 |
Entegris, Inc. (a) | 944,800 | | 10,184,944 |
FormFactor, Inc. (a) | 313,900 | | 12,050,621 |
Hittite Microwave Corp. (a) | 340,521 | | 13,695,755 |
Microsemi Corp. (a)(d) | 373,400 | | 8,703,954 |
Rudolph Technologies, Inc. (a) | 288,744 | | 4,518,844 |
Tessera Technologies, Inc. (a) | 297,900 | | 12,252,627 |
| | 65,160,537 |
Software - 3.3% |
Ansys, Inc. (a) | 384,000 | | 9,999,360 |
Blackbaud, Inc. | 717,459 | | 15,023,591 |
Business Objects SA sponsored ADR (a) | 186,000 | | 8,370,000 |
Fair Isaac Corp. | 202,400 | | 7,946,224 |
| | 41,339,175 |
TOTAL INFORMATION TECHNOLOGY | | 307,344,614 |
MATERIALS - 4.7% |
Metals & Mining - 4.7% |
Carpenter Technology Corp. | 110,300 | | 13,091,507 |
Meridian Gold, Inc. (a) | 511,400 | | 14,436,826 |
Reliance Steel & Aluminum Co. | 275,700 | | 14,485,278 |
Titanium Metals Corp. (a)(d) | 493,500 | | 16,492,770 |
| | 58,506,381 |
TELECOMMUNICATION SERVICES - 0.6% |
Diversified Telecommunication Services - 0.6% |
Cbeyond, Inc. (a) | 230,500 | | 8,152,785 |
UTILITIES - 1.1% |
Multi-Utilities - 1.1% |
AEM SpA | 2,153,700 | | 7,211,347 |
CMS Energy Corp. | 413,200 | | 6,677,312 |
| | 13,888,659 |
TOTAL COMMON STOCKS (Cost $1,133,658,256) | 1,205,665,504 |
Money Market Funds - 12.4% |
| Shares | | Value |
Fidelity Cash Central Fund, 5.38% (b) | 63,874,490 | | $ 63,874,490 |
Fidelity Securities Lending Cash Central Fund, 5.39% (b)(c) | 92,012,535 | | 92,012,535 |
TOTAL MONEY MARKET FUNDS (Cost $155,887,025) | 155,887,025 |
TOTAL INVESTMENT PORTFOLIO - 108.3% (Cost $1,289,545,281) | | 1,361,552,529 |
NET OTHER ASSETS - (8.3)% | | (104,475,734) |
NET ASSETS - 100% | $ 1,257,076,795 |
Legend |
(a) Non-income producing |
(b) Affiliated fund that is available only to investment companies and other accounts managed by Fidelity Investments. The rate quoted is the annualized seven-day yield of the fund at period end. A complete unaudited listing of the fund's holdings as of its most recent quarter end is available upon request. |
(c) Investment made with cash collateral received from securities on loan. |
(d) Security or a portion of the security is on loan at period end. |
(e) Affiliated company |
(f) Security or a portion of the security purchased on a delayed delivery or when-issued basis. |
Affiliated Central Funds |
Information regarding fiscal year to date income earned by the Fund from investments in Fidelity Central Funds is as follows: |
Fund | Income earned |
Fidelity Cash Central Fund | $ 1,506,865 |
Fidelity Securities Lending Cash Central Fund | 198,991 |
Total | $ 1,705,856 |
Other Affiliated Issuers |
An affiliated company is a company in which the fund has ownership of at least 5% of the voting securities. Fiscal year to date transactions with companies which are or were affiliates are as follows: |
Affiliate | Value, beginning of period | Purchases | Sale
Proceeds | Dividend
Income | Value,
end of
period |
Quixote Corp. | $ - | $ 9,171,364 | $ - | $ 76,046 | $ 8,618,526 |
Other Information |
Distribution of investments by country of issue, as a percentage of total net assets, is as follows: |
United States of America | 89.8% |
Bermuda | 2.1% |
India | 1.5% |
United Kingdom | 1.3% |
Canada | 1.2% |
Others (individually less than 1%) | 4.1% |
| 100.0% |
See accompanying notes which are an integral part of the financial statements.
Annual Report
Financial Statements
Statement of Assets and Liabilities
| July 31, 2007 |
Assets | | |
Investment in securities, at value (including securities loaned of $88,633,500) - See accompanying schedule: Unaffiliated issuers (cost $1,124,486,892) | $ 1,197,046,978 | |
Fidelity Central Funds (cost $155,887,025) | 155,887,025 | |
Other affiliated issuers (cost $9,171,364) | 8,618,526 | |
Total Investments (cost $1,289,545,281) | | $ 1,361,552,529 |
Cash | | 1,722,189 |
Receivable for investments sold | | 10,792,738 |
Receivable for fund shares sold | | 2,386,230 |
Dividends receivable | | 11,578 |
Distributions receivable from Fidelity Central Funds | | 253,144 |
Prepaid expenses | | 888 |
Other receivables | | 11,831 |
Total assets | | 1,376,731,127 |
| | |
Liabilities | | |
Payable for investments purchased
Regular delivery | $ 17,678,327 | |
Delayed delivery | 8,029,181 | |
Payable for fund shares redeemed | 782,233 | |
Accrued management fee | 801,876 | |
Distribution fees payable | 43,739 | |
Other affiliated payables | 256,045 | |
Other payables and accrued expenses | 50,396 | |
Collateral on securities loaned, at value | 92,012,535 | |
Total liabilities | | 119,654,332 |
| | |
Net Assets | | $ 1,257,076,795 |
Net Assets consist of: | | |
Paid in capital | | $ 1,103,854,866 |
Accumulated undistributed net realized gain (loss) on investments and foreign currency transactions | | 81,214,930 |
Net unrealized appreciation (depreciation) on investments and assets and liabilities in foreign currencies | | 72,006,999 |
Net Assets | | $ 1,257,076,795 |
See accompanying notes which are an integral part of the financial statements.
Annual Report
Statement of Assets and Liabilities - continued
| July 31, 2007 |
Calculation of Maximum Offering Price Class A:
Net Asset Value and redemption price per share ($33,587,517 ÷
2,090,838 shares) | $ 16.06 |
| |
Maximum offering price per share (100/94.25 of $16.06) | $ 17.04 |
Class T:
Net Asset Value and redemption price per share ($26,418,676 ÷ 1,649,872 shares) | $ 16.01 |
| |
Maximum offering price per share (100/96.50 of $16.01) | $ 16.59 |
Class B:
Net Asset Value and offering price per share ($6,242,258 ÷ 393,886 shares)A | $ 15.85 |
| |
Class C:
Net Asset Value and offering price per share ($22,347,810 ÷ 1,410,730 shares)A | $ 15.84 |
| |
| |
Small Cap Growth:
Net Asset Value, offering price and redemption price per share ($1,149,809,489 ÷ 71,180,036 shares) | $ 16.15 |
| |
Institutional Class:
Net Asset Value, offering price and redemption price per share ($18,671,045 ÷ 1,156,200 shares) | $ 16.15 |
A Redemption price per share is equal to net asset value less any applicable contingent deferred sales charge.
See accompanying notes which are an integral part of the financial statements.
Annual Report
Financial Statements - continued
Statement of Operations
| Year ended July 31, 2007 |
Investment Income | | |
Dividends (including $76,046 earned from other affiliated issuers) | | $ 2,689,721 |
Special dividends | | 308,003 |
Interest | | 6,819 |
Income from Fidelity Central Funds | | 1,705,856 |
Total income | | 4,710,399 |
| | |
Expenses | | |
Management fee
Basic fee | $ 5,656,543 | |
Performance adjustment | 721,094 | |
Transfer agent fees | 1,956,268 | |
Distribution fees | 434,374 | |
Accounting and security lending fees | 286,522 | |
Custodian fees and expenses | 29,858 | |
Independent trustees' compensation | 2,307 | |
Registration fees | 111,021 | |
Audit | 52,611 | |
Legal | 5,687 | |
Miscellaneous | 12,571 | |
Total expenses before reductions | 9,268,856 | |
Expense reductions | (120,825) | 9,148,031 |
Net investment income (loss) | | (4,437,632) |
Realized and Unrealized Gain (Loss) Net realized gain (loss) on: | | |
Investment securities: | | |
Unaffiliated issuers | 87,838,465 | |
Foreign currency transactions | 24,427 | |
Total net realized gain (loss) | | 87,862,892 |
Change in net unrealized appreciation (depreciation) on: Investment securities | 65,703,013 | |
Assets and liabilities in foreign currencies | (249) | |
Total change in net unrealized appreciation (depreciation) | | 65,702,764 |
Net gain (loss) | | 153,565,656 |
Net increase (decrease) in net assets resulting from operations | | $ 149,128,024 |
See accompanying notes which are an integral part of the financial statements.
Annual Report
Statement of Changes in Net Assets
| Year ended
July 31,
2007 | Year ended
July 31,
2006 |
Increase (Decrease) in Net Assets | | |
Operations | | |
Net investment income (loss) | $ (4,437,632) | $ (2,229,695) |
Net realized gain (loss) | 87,862,892 | 5,473,930 |
Change in net unrealized appreciation (depreciation) | 65,702,764 | (13,283,719) |
Net increase (decrease) in net assets resulting
from operations | 149,128,024 | (10,039,484) |
Distributions to shareholders from net realized gain | (3,591,980) | (3,779,478) |
Share transactions - net increase (decrease) | 637,612,035 | 259,409,742 |
Redemption fees | 160,118 | 233,448 |
Total increase (decrease) in net assets | 783,308,197 | 245,824,228 |
| | |
Net Assets | | |
Beginning of period | 473,768,598 | 227,944,370 |
End of period | $ 1,257,076,795 | $ 473,768,598 |
See accompanying notes which are an integral part of the financial statements.
Annual Report
Financial Highlights - Class A
Years ended July 31, | 2007 | 2006 | 2005K |
Selected Per-Share Data | | | |
Net asset value, beginning of period | $ 12.88 | $ 12.95 | $ 10.00 |
Income from Investment Operations | | | |
Net investment income (loss)E | (.12)H | (.10)I | (.07) |
Net realized and unrealized gain (loss) | 3.39 | .18J | 3.01 |
Total from investment operations | 3.27 | .08 | 2.94 |
Distributions from net realized gain | (.09) | (.16) | - |
Redemption fees added to paid in capitalE | -M | .01 | .01 |
Net asset value, end of period | $ 16.06 | $ 12.88 | $ 12.95 |
Total ReturnB,C,D | 25.52% | .70% | 29.50% |
Ratios to Average Net AssetsF,L | | | |
Expenses before reductions | 1.44% | 1.53% | 1.55%A |
Expenses net of fee waivers, if any | 1.40% | 1.40% | 1.45%A |
Expenses net of all reductions | 1.39% | 1.35% | 1.36%A |
Net investment income (loss) | (.80)%H | (.79)%I | (.78)%A |
Supplemental Data | | | |
Net assets, end of period (000 omitted) | $ 33,588 | $ 18,104 | $ 4,719 |
Portfolio turnover rateG | 91% | 129% | 93%A |
A Annualized
B Total returns for periods of less than one year are not annualized.
C Total returns would have been lower had certain expenses not been reduced during the periods shown.
D Total returns do not include the effect of the sales charges.
E Calculated based on average shares outstanding during the period.
F Fees and expenses of the underlying Fidelity Central Funds are not included in the Fund's expense ratio. The Fund indirectly bears its proportionate share of the expenses of any underlying Fidelity Central Funds.
G Amount does not include the portfolio activity of any underlying Fidelity Central Funds.
H Investment income per share reflects a special dividend which amounted to $.01 per share. Excluding the special dividend, the ratio of net investment income (loss) to average net assets would have been (.84)%.
I Investment income per share reflects a special dividend which amounted to $.01 per share. Excluding the special dividend, the ratio of net investment income (loss) to average net assets would have been (.85)%.
J The amount shown for a share outstanding does not correspond with the aggregate net gain (loss) on investments for the period due to the timing of sales and repurchases of shares in relation to fluctuating market values of the investments of the Fund.
K For the period November 3, 2004 (commencement of operations) to July 31, 2005.
L Expense ratios reflect operating expenses of the class. Expenses before reductions do not reflect amounts reimbursed by the investment adviser or reductions from brokerage service arrangements or other expense offset arrangements and do not represent the amount paid by the class during periods when reimbursements or reductions occur. Expense ratios before reductions for start-up periods may not be representative of longer-term operating periods. Expenses net of fee waivers reflect expenses after reimbursement by the investment adviser but prior to reductions from brokerage service arrangements or other expense offset arrangements. Expenses net of all reductions represent the net expenses paid by the class.
M Amount represents less than $.01 per share.
See accompanying notes which are an integral part of the financial statements.
Annual Report
Financial Highlights - Class T
Years ended July 31, | 2007 | 2006 | 2005K |
Selected Per-Share Data | | | |
Net asset value, beginning of period | $ 12.86 | $ 12.93 | $ 10.00 |
Income from Investment Operations | | | |
Net investment income (loss)E | (.16)H | (.14)I | (.09) |
Net realized and unrealized gain (loss) | 3.38 | .19J | 3.01 |
Total from investment operations | 3.22 | .05 | 2.92 |
Distributions from net realized gain | (.07) | (.13) | - |
Redemption fees added to paid in capitalE | -M | .01 | .01 |
Net asset value, end of period | $ 16.01 | $ 12.86 | $ 12.93 |
Total ReturnB,C,D | 25.18% | .48% | 29.30% |
Ratios to Average Net AssetsF,L | | | |
Expenses before reductions | 1.67% | 1.73% | 1.79%A |
Expenses net of fee waivers, if any | 1.65% | 1.65% | 1.70%A |
Expenses net of all reductions | 1.65% | 1.60% | 1.61%A |
Net investment income (loss) | (1.05)%H | (1.04)%I | (1.03)%A |
Supplemental Data | | | |
Net assets, end of period (000 omitted) | $ 26,419 | $ 19,205 | $ 5,240 |
Portfolio turnover rateG | 91% | 129% | 93%A |
A Annualized
B Total returns for periods of less than one year are not annualized.
C Total returns would have been lower had certain expenses not been reduced during the periods shown.
D Total returns do not include the effect of the sales charges.
E Calculated based on average shares outstanding during the period.
F Fees and expenses of the underlying Fidelity Central Funds are not included in the Fund's expense ratio. The Fund indirectly bears its proportionate share of the expenses of any underlying Fidelity Central Funds.
G Amount does not include the portfolio activity of any underlying Fidelity Central Funds.
H Investment income per share reflects a special dividend which amounted to $.01 per share. Excluding the special dividend, the ratio of net investment income (loss) to average net assets would have been (1.09)%.
I Investment income per share reflects a special dividend which amounted to $.01 per share. Excluding the special dividend, the ratio of net investment income (loss) to average net assets would have been (1.10)%.
J The amount shown for a share outstanding does not correspond with the aggregate net gain (loss) on investments for the period due to the timing of sales and repurchases of shares in relation to fluctuating market values of the investments of the Fund.
K For the period November 3, 2004 (commencement of operations) to July 31, 2005.
L Expense ratios reflect operating expenses of the class. Expenses before reductions do not reflect amounts reimbursed by the investment adviser or reductions from brokerage service arrangements or other expense offset arrangements and do not represent the amount paid by the class during periods when reimbursements or reductions occur. Expense ratios before reductions for start-up periods may not be representative of longer-term operating periods. Expenses net of fee waivers reflect expenses after reimbursement by the investment adviser but prior to reductions from brokerage service arrangements or other expense offset arrangements. Expenses net of all reductions represent the net expenses paid by the class.
M Amount represents less than $.01 per share.
See accompanying notes which are an integral part of the financial statements.
Annual Report
Financial Highlights - Class B
Years ended July 31, | 2007 | 2006 | 2005K |
Selected Per-Share Data | | | |
Net asset value, beginning of period | $ 12.78 | $ 12.87 | $ 10.00 |
Income from Investment Operations | | | |
Net investment income (loss)E | (.23)H | (.20)I | (.13) |
Net realized and unrealized gain (loss) | 3.36 | .19J | 2.99 |
Total from investment operations | 3.13 | (.01) | 2.86 |
Distributions from net realized gain | (.06) | (.09) | - |
Redemption fees added to paid in capitalE | -M | .01 | .01 |
Net asset value, end of period | $ 15.85 | $ 12.78 | $ 12.87 |
Total ReturnB,C,D | 24.57% | (.03)% | 28.70% |
Ratios to Average Net AssetsF,L | | | |
Expenses before reductions | 2.20% | 2.28% | 2.33%A |
Expenses net of fee waivers, if any | 2.15% | 2.15% | 2.20%A |
Expenses net of all reductions | 2.15% | 2.10% | 2.11%A |
Net investment income (loss) | (1.55)%H | (1.54)%I | (1.53)%A |
Supplemental Data | | | |
Net assets, end of period (000 omitted) | $ 6,242 | $ 5,191 | $ 2,055 |
Portfolio turnover rateG | 91% | 129% | 93%A |
A Annualized
B Total returns for periods of less than one year are not annualized.
C Total returns would have been lower had certain expenses not been reduced during the periods shown.
D Total returns do not include the effect of the contingent deferred sales charge.
E Calculated based on average shares outstanding during the period.
F Fees and expenses of the underlying Fidelity Central Funds are not included in the Fund's expense ratio. The Fund indirectly bears its proportionate share of the expenses of any underlying Fidelity Central Funds.
G Amount does not include the portfolio activity of any underlying Fidelity Central Funds.
H Investment income per share reflects a special dividend which amounted to $.01 per share. Excluding the special dividend, the ratio of net investment income (loss) to average net assets would have been (1.59)%.
I Investment income per share reflects a special dividend which amounted to $.01 per share. Excluding the special dividend, the ratio of net investment income (loss) to average net assets would have been (1.60)%.
J The amount shown for a share outstanding does not correspond with the aggregate net gain (loss) on investments for the period due to the timing of sales and repurchases of shares in relation to fluctuating market values of the investments of the Fund.
K For the period November 3, 2004 (commencement of operations) to July 31, 2005.
L Expense ratios reflect operating expenses of the class. Expenses before reductions do not reflect amounts reimbursed by the investment adviser or reductions from brokerage service arrangements or other expense offset arrangements and do not represent the amount paid by the class during periods when reimbursements or reductions occur. Expense ratios before reductions for start-up periods may not be representative of longer-term operating periods. Expenses net of fee waivers reflect expenses after reimbursement by the investment adviser but prior to reductions from brokerage service arrangements or other expense offset arrangements. Expenses net of all reductions represent the net expenses paid by the class.
M Amount represents less than $.01 per share.
See accompanying notes which are an integral part of the financial statements.
Annual Report
Financial Highlights - Class C
Years ended July 31, | 2007 | 2006 | 2005K |
Selected Per-Share Data | | | |
Net asset value, beginning of period | $ 12.77 | $ 12.88 | $ 10.00 |
Income from Investment Operations | | | |
Net investment income (loss)E | (.23)H | (.20)I | (.13) |
Net realized and unrealized gain (loss) | 3.36 | .18J | 3.00 |
Total from investment operations | 3.13 | (.02) | 2.87 |
Distributions from net realized gain | (.06) | (.10) | - |
Redemption fees added to paid in capitalE | -M | .01 | .01 |
Net asset value, end of period | $ 15.84 | $ 12.77 | $ 12.88 |
Total ReturnB,C,D | 24.59% | (.08)% | 28.80% |
Ratios to Average Net AssetsF,L | | | |
Expenses before reductions | 2.20% | 2.25% | 2.24%A |
Expenses net of fee waivers, if any | 2.15% | 2.15% | 2.17%A |
Expenses net of all reductions | 2.14% | 2.10% | 2.09%A |
Net investment income (loss) | (1.55)%H | (1.54)%I | (1.50)%A |
Supplemental Data | | | |
Net assets, end of period (000 omitted) | $ 22,348 | $ 14,682 | $ 8,372 |
Portfolio turnover rateG | 91% | 129% | 93%A |
A Annualized
B Total returns for periods of less than one year are not annualized.
C Total returns would have been lower had certain expenses not been reduced during the periods shown.
D Total returns do not include the effect of the contingent deferred sales charge.
E Calculated based on average shares outstanding during the period.
F Fees and expenses of the underlying Fidelity Central Funds are not included in the Fund's expense ratio. The Fund indirectly bears its proportionate share of the expenses of any underlying Fidelity Central Funds.
G Amount does not include the portfolio activity of any underlying Fidelity Central Funds.
H Investment income per share reflects a special dividend which amounted to $.01 per share. Excluding the special dividend, the ratio of net investment income (loss) to average net assets would have been (1.59)%.
I Investment income per share reflects a special dividend which amounted to $.01 per share. Excluding the special dividend, the ratio of net investment income (loss) to average net assets would have been (1.60)%.
J The amount shown for a share outstanding does not correspond with the aggregate net gain (loss) on investments for the period due to the timing of sales and repurchases of shares in relation to fluctuating market values of the investments of the Fund.
K For the period November 3, 2004 (commencement of operations) to July 31, 2005.
L Expense ratios reflect operating expenses of the class. Expenses before reductions do not reflect amounts reimbursed by the investment adviser or reductions from brokerage service arrangements or other expense offset arrangements and do not represent the amount paid by the class during periods when reimbursements or reductions occur. Expense ratios before reductions for start-up periods may not be representative of longer-term operating periods. Expenses net of fee waivers reflect expenses after reimbursement by the investment adviser but prior to reductions from brokerage service arrangements or other expense offset arrangements. Expenses net of all reductions represent the net expenses paid by the class.
M Amount represents less than $.01 per share.
See accompanying notes which are an integral part of the financial statements.
Annual Report
Financial Highlights - Small Cap Growth
Years ended July 31, | 2007 | 2006 | 2005J |
Selected Per-Share Data | | | |
Net asset value, beginning of period | $ 12.93 | $ 12.98 | $ 10.00 |
Income from Investment Operations | | | |
Net investment income (loss)D | (.08)G | (.07)H | (.04) |
Net realized and unrealized gain (loss) | 3.40 | .19I | 3.01 |
Total from investment operations | 3.32 | .12 | 2.97 |
Distributions from net realized gain | (.10) | (.18) | - |
Redemption fees added to paid in capitalD | -L | .01 | .01 |
Net asset value, end of period | $ 16.15 | $ 12.93 | $ 12.98 |
Total ReturnB,C | 25.84% | 1.01% | 29.80% |
Ratios to Average Net AssetsE,K | | | |
Expenses before reductions | 1.10% | 1.13% | 1.16%A |
Expenses net of fee waivers, if any | 1.10% | 1.13% | 1.16%A |
Expenses net of all reductions | 1.09% | 1.08% | 1.08%A |
Net investment income (loss) | (.50)%G | (.52)%H | (.49)%A |
Supplemental Data | | | |
Net assets, end of period (000 omitted) | $ 1,149,809 | $ 402,353 | $ 205,652 |
Portfolio turnover rateF | 91% | 129% | 93%A |
A Annualized
B Total returns for periods of less than one year are not annualized.
C Total returns would have been lower had certain expenses not been reduced during the periods shown.
D Calculated based on average shares outstanding during the period.
E Fees and expenses of the underlying Fidelity Central Funds are not included in the Fund's expense ratio. The Fund indirectly bears its proportionate share of the expenses of any underlying Fidelity Central Funds.
F Amount does not include the portfolio activity of any underlying Fidelity Central Funds.
G Investment income per share reflects a special dividend which amounted to $.01 per share. Excluding the special dividend, the ratio of net investment income (loss) to average net assets would have been (.54)%.
H Investment income per share reflects a special dividend which amounted to $.01 per share. Excluding the special dividend, the ratio of net investment income (loss) to average net assets would have been (.58)%.
I The amount shown for a share outstanding does not correspond with the aggregate net gain (loss) on investments for the period due to the timing of sales and repurchases of shares in relation to fluctuating market values of the investments of the Fund.
J For the period November 3, 2004 (commencement of operations) to July 31, 2005.
K Expense ratios reflect operating expenses of the class. Expenses before reductions do not reflect amounts reimbursed by the investment adviser or reductions from brokerage service arrangements or other expense offset arrangements and do not represent the amount paid by the class during periods when reimbursements or reductions occur. Expense ratios before reductions for start-up periods may not be representative of longer-term operating periods. Expenses net of fee waivers reflect expenses after reimbursement by the investment adviser but prior to reductions from brokerage service arrangements or other expense offset arrangements. Expenses net of all reductions represent the net expenses paid by the class.
L Amount represents less than $.01 per share.
See accompanying notes which are an integral part of the financial statements.
Annual Report
Financial Highlights - Institutional Class
Years ended July 31, | 2007 | 2006 | 2005J |
Selected Per-Share Data | | | |
Net asset value, beginning of period | $ 12.92 | $ 12.97 | $ 10.00 |
Income from Investment Operations | | | |
Net investment income (loss)D | (.07)G | (.07)H | (.04) |
Net realized and unrealized gain (loss) | 3.41 | .19I | 3.00 |
Total from investment operations | 3.34 | .12 | 2.96 |
Distributions from net realized gain | (.11) | (.18) | - |
Redemption fees added to paid in capitalD | -L | .01 | .01 |
Net asset value, end of period | $ 16.15 | $ 12.92 | $ 12.97 |
Total ReturnB,C | 25.99% | .97% | 29.70% |
Ratios to Average Net AssetsE,K | | | |
Expenses before reductions | 1.05% | 1.10% | 1.20%A |
Expenses net of fee waivers, if any | 1.05% | 1.10% | 1.18%A |
Expenses net of all reductions | 1.05% | 1.05% | 1.10%A |
Net investment income (loss) | (.46)%G | (.49)%H | (.51)%A |
Supplemental Data | | | |
Net assets, end of period (000 omitted) | $ 18,671 | $ 14,233 | $ 1,906 |
Portfolio turnover rateF | 91% | 129% | 93%A |
A Annualized
B Total returns for periods of less than one year are not annualized.
C Total returns would have been lower had certain expenses not been reduced during the periods shown.
D Calculated based on average shares outstanding during the period.
E Fees and expenses of the underlying Fidelity Central Funds are not included in the Fund's expense ratio. The Fund indirectly bears its proportionate share of the expenses of any underlying Fidelity Central Funds.
F Amount does not include the portfolio activity of any underlying Fidelity Central Funds.
G Investment income per share reflects a special dividend which amounted to $.01 per share. Excluding the special dividend, the ratio of net investment income (loss) to average net assets would have been (.50)%.
H Investment income per share reflects a special dividend which amounted to $.01 per share. Excluding the special dividend, the ratio of net investment income (loss) to average net assets would have been (.55)%.
I The amount shown for a share outstanding does not correspond with the aggregate net gain (loss) on investments for the period due to the timing of sales and repurchases of shares in relation to fluctuating market values of the investments of the Fund.
J For the period November 3, 2004 (commencement of operations) to July 31, 2005.
K Expense ratios reflect operating expenses of the class. Expenses before reductions do not reflect amounts reimbursed by the investment adviser or reductions from brokerage service arrangements or other expense offset arrangements and do not represent the amount paid by the class during periods when reimbursements or reductions occur. Expense ratios before reductions for start-up periods may not be representative of longer-term operating periods. Expenses net of fee waivers reflect expenses after reimbursement by the investment adviser but prior to reductions from brokerage service arrangements or other expense offset arrangements. Expenses net of all reductions represent the net expenses paid by the class.
L Amount represents less than $.01 per share.
See accompanying notes which are an integral part of the financial statements.
Annual Report
Notes to Financial Statements
For the period ended July 31, 2007
1. Organization.
Fidelity Small Cap Growth Fund (the Fund) is a non-diversified fund of Fidelity Securities Fund (the trust) and is authorized to issue an unlimited number of shares. The trust is registered under the Investment Company Act of 1940, as amended (the 1940 Act), as an open-end management investment company organized as a Massachusetts business trust. The Fund offers Class A, Class T, Class B, Class C, Small Cap Growth, and Institutional Class shares, each of which has equal rights as to assets and voting privileges. Each class has exclusive voting rights with respect to matters that affect that class. Class B shares will automatically convert to Class A shares after a holding period of seven years from the initial date of purchase. Investment income, realized and unrealized capital gains and losses, the common expenses of the Fund, and certain fund-level expense reductions, if any, are allocated on a pro rata basis to each class based on the relative net assets of each class to the total net assets of the Fund. Each class differs with respect to transfer agent and distribution and service plan fees incurred. Certain expense reductions also differ by class.
2. Investments in Fidelity Central Funds.
The Fund may invest in Fidelity Central Funds which are open-end investment companies available only to other investment companies and accounts managed by Fidelity Management & Research Company (FMR) and its affiliates. The Fund's Schedule of Investments lists each of the Fidelity Central Funds as an investment of the Fund, but does not include the underlying holdings of each Fidelity Central Fund. As an Investing Fund, the Fund indirectly bears its proportionate share of the expenses of the underlying Fidelity Central Funds.
The Money Market Central Funds seek preservation of capital and current income and are managed by Fidelity Investments Money Management, Inc. (FIMM), an affiliate of FMR.
A complete list of holdings for each Fidelity Central Fund is available upon request or at the SEC's website at www.sec.gov. In addition, the financial statements of the Fidelity Central Funds, which are not covered by the Fund's Report of Independent Registered Public Accounting Firm, are available on the SEC's web site, or upon request.
3. Significant Accounting Policies.
The financial statements have been prepared in conformity with accounting principles generally accepted in the United States of America, which require management to make certain estimates and assumptions at the date of the financial statements. The following summarizes the significant accounting policies of the Fund:
Security Valuation. Investments are valued and net asset value (NAV) per share is calculated (NAV calculation) as of the close of business of the New York Stock Exchange
Annual Report
3. Significant Accounting Policies - continued
Security Valuation - continued
(NYSE), normally 4:00 p.m. Eastern time. Wherever possible, the Fund uses independent pricing services approved by the Board of Trustees to value its investments.
Equity securities, including restricted securities, for which market quotations are readily available, are valued at the last reported sale price or official closing price as reported by an independent pricing service on the primary market or exchange on which they are traded. In the event there were no sales during the day or closing prices are not available, securities are valued at the last quoted bid price. Investments in open-end mutual funds, including the Fidelity Central Funds, are valued at their closing net asset value each business day. Short-term securities with remaining maturities of sixty days or less for which quotations are not readily available are valued at amortized cost, which approximates value.
When current market prices or quotations are not readily available or do not accurately reflect fair value, valuations may be determined in accordance with procedures adopted by the Board of Trustees. For example, when developments occur between the close of a market and the close of the NYSE that may materially affect the value of some or all of the securities, or when trading in a security is halted, those securities may be fair valued. Factors used in the determination of fair value may include monitoring news to identify significant market or security specific events such as changes in the value of U.S. securities markets, reviewing developments in foreign markets and evaluating the performance of ADRs, futures contracts and exchange-traded funds. Because the Fund's utilization of fair value pricing depends on market activity, the frequency with which fair value pricing is used cannot be predicted and may be utilized to a significant extent. The value of securities used for NAV calculation under fair value pricing may differ from published prices for the same securities.
Foreign Currency. The Fund uses foreign currency contracts to facilitate transactions in foreign-denominated securities. Losses from these transactions may arise from changes in the value of the foreign currency or if the counterparties do not perform under the contracts' terms.
Foreign-denominated assets, including investment securities, and liabilities are translated into U.S. dollars at the exchange rate at period end. Purchases and sales of investment securities, income and dividends received and expenses denominated in foreign currencies are translated into U.S. dollars at the exchange rate in effect on the transaction date.
The effects of exchange rate fluctuations on investments are included with the net realized and unrealized gain (loss) on investment securities. Other foreign currency transactions resulting in realized and unrealized gain (loss) are disclosed separately.
Annual Report
Notes to Financial Statements - continued
3. Significant Accounting Policies - continued
Investment Transactions and Income. For financial reporting purposes, the Fund's investment holdings and NAV include trades executed through the end of the last business day of the period. The NAV for processing shareholder transactions includes trades executed through the end of the prior business day. Gains and losses on securities sold are determined on the basis of identified cost. Dividend income is recorded on the ex-dividend date, except for certain dividends from foreign securities where the ex-dividend date may have passed, which are recorded as soon as the Fund is informed of the ex-dividend date. Non-cash dividends included in dividend income, if any, are recorded at the fair market value of the securities received. Distributions received on securities that represent a return of capital or capital gain are recorded as a reduction of cost of investments and/or as a realized gain. The Fund estimates the components of distributions received that may be considered return of capital distributions or capital gain distributions. Large, non-recurring dividends recognized by the Fund are presented separately on the Statement of Operations as "Special Dividends" and the impact of these dividends is presented in the Financial Highlights. Interest income and distributions from the Fidelity Central Funds are accrued as earned. Interest income includes coupon interest and amortization of premium and accretion of discount on debt securities. Investment income is recorded net of foreign taxes withheld where recovery of such taxes is uncertain.
Expenses. Most expenses of the trust can be directly attributed to a fund. Expenses which cannot be directly attributed are apportioned among each Fund in the trust. Expense estimates are accrued in the period to which they relate and adjustments are made when actual amounts are known.
Income Tax Information and Distributions to Shareholders. Each year, the Fund intends to qualify as a regulated investment company by distributing all of its taxable income and realized gains under Subchapter M of the Internal Revenue Code. As a result, no provision for income taxes is required in the accompanying financial statements. Foreign taxes are provided for based on the Fund's understanding of the tax rules and rates that exist in the foreign markets in which it invests.
Distributions are recorded on the ex-dividend date. Income dividends and capital gain distributions are declared separately for each class. Income and capital gain distributions are determined in accordance with income tax regulations, which may differ from generally accepted accounting principles. In addition, the Fund will claim a portion of the payment made to redeeming shareholders as a distribution for income tax purposes.
Capital accounts within the financial statements are adjusted for permanent book-tax differences. These adjustments have no impact on net assets or the results of operations. Temporary book-tax differences will reverse in a subsequent period.
Annual Report
3. Significant Accounting Policies - continued
Income Tax Information and Distributions to Shareholders - continued
Book-tax differences are primarily due to foreign currency transactions, net operating losses and losses deferred due to wash sales.
The tax-basis components of distributable earnings and the federal tax cost as of period end were as follows:
Unrealized appreciation | $ 129,971,651 | |
Unrealized depreciation | (58,828,862) | |
Net unrealized appreciation (depreciation) | 71,142,789 | |
Undistributed ordinary income | 57,565,363 | |
Undistributed long-term capital gain | 21,937,701 | |
| | |
Cost for federal income tax purposes | $ 1,290,409,740 | |
The tax character of distributions paid was as follows:
| July 31, 2007 | July 31, 2006 |
Ordinary Income | $ 1,338,128 | $ 3,779,478 |
Long-term Capital Gains | 2,253,852 | - |
Total | $ 3,591,980 | $ 3,779,478 |
Short-Term Trading (Redemption) Fees. Shares held in the Fund less than 90 days are subject to a redemption fee equal to 1.50% of the proceeds of the redeemed shares. All redemption fees, including any estimated redemption fees paid by FMR, are retained by the Fund and accounted for as an addition to paid in capital.
New Accounting Pronouncements. In July 2006, Financial Accounting Standards Board Interpretation No. 48, Accounting for Uncertainty in Income Taxes - an interpretation of FASB Statement 109 (FIN 48), was issued and is effective on the last business day of the semiannual reporting period for fiscal years beginning after December 15, 2006. FIN 48 sets forth a threshold for financial statement recognition, measurement and disclosure of a tax position taken or expected to be taken on a tax return. Management has concluded that the adoption of FIN 48 will not result in a material impact on the Fund's net assets, results of operations and financial statement disclosures.
In addition, in September 2006, Statement of Financial Accounting Standards No. 157, Fair Value Measurements (SFAS 157), was issued and is effective for fiscal years beginning after November 15, 2007. SFAS 157 defines fair value, establishes a framework for measuring fair value and expands disclosures about fair value measurements. Management is currently evaluating the impact the adoption of SFAS 157 will have on the Fund's financial statement disclosures.
Annual Report
Notes to Financial Statements - continued
4. Operating Policies.
Repurchase Agreements. FMR has received an Exemptive Order from the Securities and Exchange Commission (the SEC) which permits the Fund and other affiliated entities of FMR to transfer uninvested cash balances into joint trading accounts which are then invested in repurchase agreements. The Fund may also invest directly with institutions in repurchase agreements. Repurchase agreements are collateralized by government or non-government securities. Upon settlement date, collateral is held in segregated accounts with custodian banks and may be obtained in the event of a default of the counterparty. The Fund monitors, on a daily basis, the value of the collateral to ensure it is at least equal to the principal amount of the repurchase agreement (including accrued interest). In the event of a default by the counterparty, realization of the collateral proceeds could be delayed, during which time the value of the collateral may decline.
Delayed Delivery Transactions and When-Issued Securities. The Fund may purchase or sell securities on a delayed delivery or when-issued basis. Payment and delivery may take place after the customary settlement period for that security. The price of the underlying securities and the date when the securities will be delivered and paid for are fixed at the time the transaction is negotiated. During the time a delayed delivery sell is outstanding, the contract is marked-to-market daily and equivalent deliverable securities are held for the transaction. The value of the securities purchased on a delayed delivery or when-issued basis are identified as such in the Fund's Schedule of Investments. The Fund may receive compensation for interest forgone in the purchase of a delayed delivery or when-issued security. With respect to purchase commitments, the Fund identifies securities as segregated in its records with a value at least equal to the amount of the commitment. Losses may arise due to changes in the value of the underlying securities or if the counterparty does not perform under the contract's terms, or if the issuer does not issue the securities due to political, economic, or other factors.
5. Purchases and Sales of Investments.
Purchases and sales of securities, other than short-term securities, aggregated $1,308,851,948 and $702,065,964, respectively.
6. Fees and Other Transactions with Affiliates.
Management Fee. FMR and its affiliates provide the Fund with investment management related services for which the Fund pays a monthly management fee. The management fee is the sum of an individual fund fee rate that is based on an annual rate of .45% of the Fund's average net assets and a group fee rate that averaged ..26% during the period. The group fee rate is based upon the average net assets of all the mutual funds advised by FMR. The group fee rate decreases as assets under management increase and
Annual Report
6. Fees and Other Transactions with Affiliates - continued
Management Fee - continued
increases as assets under management decrease. In addition, the management fee is subject to a performance adjustment (up to a maximum of ±.20% of the Fund's average net assets over a 36 month performance period). The upward or downward adjustment to the management fee is based on the relative investment performance of the retail class of the Fund, Small Cap Growth, as compared to an appropriate benchmark index. For the period, the total annual management fee rate, including the performance adjustment, was .80% of the Fund's average net assets.
Distribution and Service Plan. In accordance with Rule 12b-1 of the 1940 Act, the Fund has adopted separate Distribution and Service Plans for each class of shares. Certain classes pay Fidelity Distributors Corporation (FDC), an affiliate of FMR, separate Distribution and Service Fees, each of which is based on an annual percentage of each class' average net assets. In addition, FDC may pay financial intermediaries for selling shares of the Fund and providing shareholder support services. For the period, the Distribution and Service Fee rates and the total amounts paid to and retained by FDC were as follows:
| Distribution
Fee | Service
Fee | Paid to
FDC | Retained
by FDC |
Class A | 0% | .25% | $ 61,375 | $ 5,550 |
Class T | 25% | .25% | 122,504 | 2,290 |
Class B | .75% | .25% | 58,534 | 44,526 |
Class C | .75% | .25% | 191,961 | 66,624 |
| | | $ 434,374 | $ 118,990 |
Sales Load. FDC receives a front-end sales charge of up to 5.75% for selling Class A shares, and 3.50% for selling Class T shares, some of which is paid to financial intermediaries for selling shares of the Fund. FDC receives the proceeds of contingent deferred sales charges levied on Class A, Class T, Class B, and Class C redemptions. These charges depend on the holding period. The deferred sales charges range from 5% to 1% forClass B, 1% for Class C, 1.00% to .50% for certain purchases of Class A shares and .25% for certain purchases of Class T shares.
For the period, sales charge amounts retained by FDC were as follows:
| Retained
by FDC |
Class A | $ 35,221 |
Class T | 8,842 |
Class B* | 10,153 |
Class C* | 3,347 |
| $ 57,563 |
* When Class B and Class C shares are initially sold, FDC pays commissions from its own resources to financial intermediaries through which the sales are made.
Annual Report
Notes to Financial Statements - continued
6. Fees and Other Transactions with Affiliates - continued
Transfer Agent Fees. Fidelity Investments Institutional Operations Company, Inc. (FIIOC), an affiliate of FMR, is the transfer, dividend disbursing and shareholder servicing agent for each class of the Fund, except for Small Cap Growth. Fidelity Service Company, Inc. (FSC), an affiliate of FMR, is the transfer agent for Small Cap Growth shares. FIIOC and FSC receive account fees and asset-based fees that vary according to the account size and type of account of the shareholders of the respective classes of the Fund. FIIOC and FSC pay for typesetting, printing and mailing of shareholder reports, except proxy statements. For the period, the total transfer agent fees paid by each class to FIIOC or FSC, were as follows:
| Amount | % of
Average
Net Assets |
Class A | $ 77,693 | .32 |
Class T | 72,782 | .30 |
Class B | 18,857 | .32 |
Class C | 61,455 | .32 |
Small Cap Growth | 1,696,137 | .24 |
Institutional Class | 29,344 | .18 |
| $ 1,956,268 | |
Accounting and Security Lending Fees. FSC maintains the Fund's accounting records. The accounting fee is based on the level of average net assets for the month. Under a separate contract, FSC administers the security lending program. The security lending fee is based on the number and duration of lending transactions.
Brokerage Commissions. The Fund placed a portion of its portfolio transactions with brokerage firms which are affiliates of the investment adviser. The commissions paid to these affiliated firms were $12,881 for the period.
7. Committed Line of Credit.
The Fund participates with other funds managed by FMR in a $4.2 billion credit facility (the "line of credit") to be utilized for temporary or emergency purposes to fund shareholder redemptions or for other short-term liquidity purposes. The Fund has agreed to pay commitment fees on its pro rata portion of the line of credit, which amounted to $1,129 and is reflected in Miscellaneous Expense on the Statement of Operations. During the period, there were no borrowings on this line of credit.
Annual Report
8. Security Lending.
The Fund lends portfolio securities from time to time in order to earn additional income. On the settlement date of the loan, the Fund receives collateral (in the form of U.S. Treasury obligations, letters of credit and/or cash) against the loaned securities and maintains collateral in an amount not less than 100% of the market value of the loaned securities during the period of the loan. The market value of the loaned securities is determined at the close of business of the Fund and any additional required collateral is delivered to the Fund on the next business day. If the borrower defaults on its obligation to return the securities loaned because of insolvency or other reasons, a fund could experience delays and costs in recovering the securities loaned or in gaining access to the collateral. Any cash collateral received is invested in the Fidelity Securities Lending Cash Central Fund. The value of loaned securities and cash collateral at period end are disclosed on the Fund's Statement of Assets and Liabilities. Security lending income represents the income earned on investing cash collateral, less fees and expenses associated with the loan, plus any premium payments that may be received on the loan of certain types of securities. Security lending income is presented in the Statement of Operations as a component of income from Fidelity Central Funds. Net income from lending portfolio securities during the period amounted to $198,991.
9. Expense Reductions.
FMR voluntarily agreed to reimburse each class to the extent annual operating expenses exceeded certain levels of average net assets as noted in the table below. Some expenses, for example interest expense, including commitment fees, are excluded from this reimbursement.
The following classes were in reimbursement during the period:
| Expense
Limitations | Reimbursement
from adviser |
Class A | 1.40% | $ 10,000 |
Class T | 1.65% | 5,786 |
Class B | 2.15% | 2,944 |
Class C | 2.15% | 9,325 |
Small Cap Growth | 1.15% | 26,889 |
| | $ 54,944 |
Effective March 1, 2007 the expense limitation for Small Cap Growth class was eliminated.
Many of the brokers with whom FMR places trades on behalf of the Fund provided services to the Fund in addition to trade execution. These services included payments of certain expenses on behalf of the Fund totaling $12,839 for the period. In addition,
Annual Report
Notes to Financial Statements - continued
9. Expense Reductions - continued
through arrangements with the Fund's custodian and each class' transfer agent, credits realized as a result of uninvested cash balances were used to reduce the Fund's expenses. During the period, these credits reduced the Fund's custody expenses by $8,868. During the period, credits reduced each class' transfer agent expense as noted in the table below.
| Transfer Agent
expense reduction | |
Class C | $ 50 | |
Small Cap Growth | 42,971 | |
Institutional Class | 85 | |
| $ 43,106 | |
10. Other.
The Fund's organizational documents provide former and current trustees and officers with a limited indemnification against liabilities arising in connection with the performance of their duties to the Fund. In the normal course of business, the Fund may also enter into contracts that provide general indemnifications. The Fund's maximum exposure under these arrangements is unknown as this would be dependent on future claims that may be made against the Fund. The risk of material loss from such claims is considered remote.
In September 2006, FIIOC, the Fund's transfer agent, notified the Fund that the Fund's books and records did not reflect a conversion of certain Class B to Class A shares upon their conversion date. In March 2007, FIIOC converted the relevant Class B shares to Class A shares and recorded the conversion in the books and records of the Fund which did not result in a material impact to the Fund's reported net assets or results of operations in the accompanying financial statements. FIIOC has remediated affected shareholders and reimbursed the Fund for all related audit and legal expenses.
11. Distributions to Shareholders.
Distributions to shareholders of each class were as follows:
Years ended July 31, | 2007 | 2006 |
From net realized gain | | |
Class A | $ 130,212 | $ 79,077 |
Class T | 118,024 | 63,628 |
Class B | 24,691 | 16,300 |
Class C | 74,047 | 71,634 |
Small Cap Growth | 3,129,487 | 3,518,781 |
Institutional Class | 115,519 | 30,058 |
Total | $ 3,591,980 | $ 3,779,478 |
Annual Report
12. Share Transactions.
Transactions for each class of shares were as follows:
| Shares | Dollars |
Years ended July 31, | 2007 | 2006 | 2007 | 2006 |
Class A | | | | |
Shares sold | 1,113,110 | 1,304,587 | $ 17,060,734 | $ 17,497,379 |
Reinvestment of distributions | 8,925 | 5,381 | 119,928 | 70,354 |
Shares redeemed | (436,417) | (269,198) | (6,456,393) | (3,602,873) |
Net increase (decrease) | 685,618 | 1,040,770 | $ 10,724,269 | $ 13,964,860 |
Class T | | | | |
Shares sold | 607,092 | 1,397,985 | $ 8,822,874 | $ 18,995,409 |
Reinvestment of distributions | 8,530 | 4,866 | 115,213 | 63,445 |
Shares redeemed | (459,339) | (314,634) | (6,905,798) | (4,188,261) |
Net increase (decrease) | 156,283 | 1,088,217 | $ 2,032,289 | $ 14,870,593 |
Class B | | | | |
Shares sold | 121,826 | 392,448 | $ 1,800,582 | $ 5,275,913 |
Reinvestment of distributions | 1,705 | 1,204 | 23,112 | 15,614 |
Shares redeemed | (135,943) | (146,977) | (1,994,978) | (1,954,748) |
Net increase (decrease) | (12,412) | 246,675 | $ (171,284) | $ 3,336,779 |
Class C | | | | |
Shares sold | 546,198 | 952,568 | $ 8,014,853 | $ 12,739,552 |
Reinvestment of distributions | 5,178 | 5,289 | 70,286 | 68,594 |
Shares redeemed | (290,387) | (458,174) | (4,244,042) | (5,878,013) |
Net increase (decrease) | 260,989 | 499,683 | $ 3,841,097 | $ 6,930,133 |
Small Cap Growth | | | | |
Shares sold | 47,884,601 | 23,125,895 | $ 736,795,086 | $ 310,607,480 |
Reinvestment of distributions | 213,315 | 226,620 | 2,867,099 | 2,968,828 |
Shares redeemed | (8,042,099) | (8,070,732) | (119,410,062) | (106,295,770) |
Net increase (decrease) | 40,055,817 | 15,281,783 | $ 620,252,123 | $ 207,280,538 |
Institutional Class | | | | |
Shares sold | 404,996 | 1,082,924 | $ 6,086,460 | $ 14,760,969 |
Reinvestment of distributions | 7,296 | 1,705 | 97,691 | 22,327 |
Shares redeemed | (357,460) | (130,215) | (5,250,610) | (1,756,457) |
Net increase (decrease) | 54,832 | 954,414 | $ 933,541 | $ 13,026,839 |
Annual Report
Report of Independent Registered Public Accounting Firm
To the Trustees of Fidelity Securities Fund and the Shareholders of Fidelity Small Cap Growth Fund:
In our opinion, the accompanying statement of assets and liabilities, including the schedule of investments, and the related statements of operations and of changes in net assets and the financial highlights present fairly, in all material respects, the financial position of Fidelity Small Cap Growth Fund (a fund of Fidelity Securities Fund) at July 31, 2007, the results of its operations for the year then ended, the changes in its net assets for each of the two years in the period then ended and the financial highlights for each of the periods indicated, in conformity with accounting principles generally accepted in the United States of America. These financial statements and financial highlights (hereafter referred to as "financial statements") are the responsibility of the Fidelity Small Cap Growth Fund's management. Our responsibility is to express an opinion on these financial statements based on our audits. We conducted our audits of these financial statements in accordance with the standards of the Public Company Accounting Oversight Board (United States). Those standards require that we plan and perform the audit to obtain reasonable assurance about whether the financial statements are free of material misstatement. An audit includes examining, on a test basis, evidence supporting the amounts and disclosures in the financial statements, assessing the accounting principles used and significant estimates made by management, and evaluating the overall financial statement presentation. We believe that our audits, which included confirmation of securities at July 31, 2007 by correspondence with the custodian and brokers, provide a reasonable basis for our opinion.
/s/ PricewaterhouseCoopers LLP
PricewaterhouseCoopers LLP
Boston, Massachusetts
September 18, 2007
Annual Report
Trustees and Officers
The Trustees, Members of the Advisory Board, and executive officers of the trust and fund, as applicable, are listed below. The Board of Trustees governs the fund and is responsible for protecting the interests of shareholders. The Trustees are experienced executives who meet periodically throughout the year to oversee the fund's activities, review contractual arrangements with companies that provide services to the fund, and review the fund's performance. Except for James C. Curvey, each of the Trustees oversees 353 funds advised by FMR or an affiliate. Mr. Curvey oversees 317 funds advised by FMR or an affiliate.
The Trustees hold office without limit in time except that (a) any Trustee may resign; (b) any Trustee may be removed by written instrument, signed by at least two-thirds of the number of Trustees prior to such removal; (c) any Trustee who requests to be retired or who has become incapacitated by illness or injury may be retired by written instrument signed by a majority of the other Trustees; and (d) any Trustee may be removed at any special meeting of shareholders by a two-thirds vote of the outstanding voting securities of the trust. Each Trustee who is not an interested person (as defined in the 1940 Act) (Independent Trustee), shall retire not later than the last day of the calendar year in which his or her 72nd birthday occurs. The Independent Trustees may waive this mandatory retirement age policy with respect to individual Trustees. The executive officers and Advisory Board Members hold office without limit in time, except that any officer and Advisory Board Member may resign or may be removed by a vote of a majority of the Trustees at any regular meeting or any special meeting of the Trustees. Except as indicated, each individual has held the office shown or other offices in the same company for the past five years.
The fund's Statement of Additional Information (SAI) includes more information about the Trustees. To request a free copy, call Fidelity at 1-877-208-0098.
Interested Trustees*:
Correspondence intended for each Trustee who is an interested person may be sent to Fidelity Investments, 82 Devonshire Street, Boston, Massachusetts 02109.
Name, Age; Principal Occupation |
Edward C. Johnson 3d (77) |
| Year of Election or Appointment: 1984 Mr. Johnson is Chairman of the Board of Trustees. Mr. Johnson serves as President (2006-present), Chief Executive Officer, Chairman, and a Director of FMR Corp.; Chairman and a Director of FMR; Chairman and a Director of Fidelity Research & Analysis Company (FRAC); Chairman and a Director of Fidelity Investments Money Management, Inc.; and Chairman (2001-present) and a Director of FMR Co., Inc. In addition, Mr. Johnson serves as Chairman and Director of Fidelity International Limited (FIL). |
|
James C. Curvey (72) |
| Year of Election or Appointment: 2007 Mr. Curvey also serves as Trustee (2007-present) or Member of the Advisory Board (2007-present) of other investment companies advised by FMR. Mr. Curvey is Vice Chairman (2006-present) and Director of FMR Corp. Mr. Curvey joined Fidelity in 1982 and served in numerous senior management positions, including President and Chief Operating Officer of FMR Corp. (1997-2000) and President of Fidelity Strategic Investments (2000-2002). In addition, he serves as a member of the Board of Directors of Geerlings & Wade, Inc. (wine distribution). |
* Trustees have been determined to be "Interested Trustees" by virtue of, among other things, their affiliation with the trust or various entities under common control with FMR.
Independent Trustees:
Correspondence intended for each Independent Trustee (that is, the Trustees other than the Interested Trustees) may be sent to Fidelity Investments, P.O. Box 55235, Boston, Massachusetts 02205-5235.
Name, Age; Principal Occupation |
Dennis J. Dirks (59) |
| Year of Election or Appointment: 2005 Prior to his retirement in May 2003, Mr. Dirks was Chief Operating Officer and a member of the Board of The Depository Trust & Clearing Corporation (DTCC) (1999-2003). He also served as President, Chief Operating Officer, and Board member of The Depository Trust Company (DTC) (1999-2003) and President and Board member of the National Securities Clearing Corporation (NSCC) (1999-2003). In addition, Mr. Dirks served as Chief Executive Officer and Board member of the Government Securities Clearing Corporation (2001-2003) and Chief Executive Officer and Board member of the Mortgage-Backed Securities Clearing Corporation (2001-2003). Mr. Dirks also serves as a Trustee and a member of the Finance Committee of Manhattan College (2005-present) and a Trustee and a member of the Finance Committee of AHRC of Nassau County (2006-present). |
Albert R. Gamper, Jr. (65) |
| Year of Election or Appointment: 2006 Prior to his retirement in December 2004, Mr. Gamper served as Chairman of the Board of CIT Group Inc. (commercial finance). During his tenure with CIT Group Inc. Mr. Gamper served in numerous senior management positions, including Chairman (1987-1989; 1999-2001; 2002-2004), Chief Executive Officer (1987-2004), and President (1989-2002). He currently serves as a member of the Board of Directors of Public Service Enterprise Group (utilities, 2001-present), Chairman of the Board of Governors, Rutgers University (2004-present), and Chairman of the Board of Saint Barnabas Health Care System. |
George H. Heilmeier (71) |
| Year of Election or Appointment: 2004 Dr. Heilmeier is Chairman Emeritus of Telcordia Technologies (communication software and systems), where prior to his retirement, he served as company Chairman and Chief Executive Officer. He currently serves on the Boards of Directors of The Mitre Corporation (systems engineering and information technology support for the government), and HRL Laboratories (private research and development, 2004-present). He is Chairman of the General Motors Science & Technology Advisory Board and a Life Fellow of the Institute of Electrical and Electronics Engineers (IEEE). Dr. Heilmeier is a member of the Defense Science Board and the National Security Agency Advisory Board. He is also a member of the National Academy of Engineering, the American Academy of Arts and Sciences, and the Board of Overseers of the School of Engineering and Applied Science of the University of Pennsylvania. Previously, Dr. Heilmeier served as a Director of TRW Inc. (automotive, space, defense, and information technology, 1992-2002), Compaq (1994-2002), Automatic Data Processing, Inc. (ADP) (technology-based business outsourcing, 1995-2002), INET Technologies Inc. (telecommunications network surveillance, 2001-2004), and Teletech Holdings (customer management services). He is the recipient of the 2005 Kyoto Prize in Advanced Technology for his invention of the liquid crystal display, and a member of the Consumer Electronics Hall of Fame. |
James H. Keyes (66) |
| Year of Election or Appointment: 2007 Prior to his retirement in 2003, Mr. Keyes was Chairman, President, and Chief Executive Officer of Johnson Controls, Inc. (automotive supplier, 1993-2003). He currently serves as a member of the boards of LSI Logic Corporation (semiconductor technologies), Navistar International Corporation (manufacture and sale of trucks, buses, and diesel engines, 2002-present), and Pitney Bowes, Inc. (integrated mail, messaging, and document management solutions). |
Marie L. Knowles (60) |
| Year of Election or Appointment: 2001 Prior to Ms. Knowles' retirement in June 2000, she served as Executive Vice President and Chief Financial Officer of Atlantic Richfield Company (ARCO) (diversified energy, 1996-2000). From 1993 to 1996, she was a Senior Vice President of ARCO and President of ARCO Transportation Company. She served as a Director of ARCO from 1996 to 1998. She currently serves as a Director of Phelps Dodge Corporation (copper mining and manufacturing) and McKesson Corporation (healthcare service, 2002-present). Ms. Knowles is a Trustee of the Brookings Institution and the Catalina Island Conservancy and also serves as a member of the Advisory Board for the School of Engineering of the University of Southern California. |
Ned C. Lautenbach (63) |
| Year of Election or Appointment: 2000 Mr. Lautenbach is Chairman of the Independent Trustees (2006-present). Mr. Lautenbach has been a partner of Clayton, Dubilier & Rice, Inc. (private equity investment firm) since September 1998. Previously, Mr. Lautenbach was with the International Business Machines Corporation (IBM) from 1968 until his retirement in 1998. Mr. Lautenbach serves as a Director of Sony Corporation (2006-present) and Eaton Corporation (diversified industrial) as well as the Philharmonic Center for the Arts in Naples, Florida. He also is a member of the Board of Trustees of Fairfield University (2005-present), as well as a member of the Council on Foreign Relations. |
Cornelia M. Small (63) |
| Year of Election or Appointment: 2005 Ms. Small is a member (2000-present) and Chairperson (2002-present) of the Investment Committee, and a member (2002-present) of the Board of Trustees of Smith College. Previously, she served as Chief Investment Officer (1999-2000), Director of Global Equity Investments (1996-1999), and a member of the Board of Directors of Scudder, Stevens & Clark (1990-1997) and Scudder Kemper Investments (1997-1999). In addition, Ms. Small served as Co-Chair (2000-2003) of the Annual Fund for the Fletcher School of Law and Diplomacy. |
William S. Stavropoulos (68) |
| Year of Election or Appointment: 2002 Mr. Stavropoulos is Chairman Emeritus of the Board of Directors of The Dow Chemical Company. Since joining The Dow Chemical Company in 1967, Mr. Stavropoulos served in numerous senior management positions, including President (1993-2000; 2002-2003), CEO (1995-2000; 2002-2004), and Chairman of the Executive Committee (2000-2004). Currently, he is a Director of NCR Corporation (data warehousing and technology solutions), Chemical Financial Corporation, Maersk Inc. (industrial conglomerate, 2002-present), Tyco International, Inc. (multinational manufacturing and services, 2007-present), and a member of the Advisory Board for Metalmark Capital (private equity investment firm, 2005-present). He is a special advisor to Clayton, Dubilier & Rice, Inc., a private equity investment firm. He also serves as a member of the Board of Trustees of the American Enterprise Institute for Public Policy Research. In addition, Mr. Stavropoulos is a member of The Business Council, J.P. Morgan International Council and the University of Notre Dame Advisory Council for the College of Science. |
Kenneth L. Wolfe (68) |
| Year of Election or Appointment: 2005 Prior to his retirement in 2001, Mr. Wolfe was Chairman and Chief Executive Officer of Hershey Foods Corporation (1993-2001). He currently serves as a member of the boards of Adelphia Communications Corporation (2003-present), Bausch & Lomb, Inc., and Revlon Inc. (2004-present). |
Advisory Board Members and Executive Officers:
Correspondence intended for Mr. Mauriello may be sent to Fidelity Investments, P.O. Box 55235, Boston, Massachusetts 02205-5235. Correspondence intended for each executive officer and Mr. Lynch may be sent to Fidelity Investments, 82 Devonshire Street, Boston, Massachusetts 02109.
Name, Age; Principal Occupation |
Peter S. Lynch (63) |
| Year of Election or Appointment: 2003 Member of the Advisory Board of Fidelity Securities Fund. Mr. Lynch is Vice Chairman and a Director of FMR, and Vice Chairman (2001-present) and a Director of FMR Co., Inc. Previously, Mr. Lynch served as a Trustee of the Fidelity funds (1990-2003). In addition, he serves as a Trustee of Boston College and as the Chairman of the Inner-City Scholarship Fund. |
Joseph Mauriello (62) |
| Year of Election or Appointment: 2007 Member of the Advisory Board of Fidelity Securities Fund. Prior to his retirement in January 2006, Mr. Mauriello served in numerous senior management positions including Deputy Chairman and Chief Operating Officer (2004-2005), and Vice Chairman of Financial Services (2002-2004) of KPMG LLP US (professional services firm, 1965-2005). Mr. Mauriello currently serves as a member of the Board of Directors of XL Capital Ltd., (global insurance and re-insurance company, 2006-present) and of Arcadia Resources Inc., (health care services and products, 2007-present). He also served as a Director of the Hamilton Funds of the Bank of New York (2006-2007). |
Kimberley H. Monasterio (43) |
| Year of Election or Appointment: 2007 President and Treasurer of the fund. Ms. Monasterio also serves as President and Treasurer of other Fidelity funds (2007-present) and is an employee of FMR (2004-present). Previously, Ms. Monasterio served as Deputy Treasurer of the Fidelity funds (2004-2006). Before joining Fidelity Investments, Ms. Monasterio served as Treasurer (2000-2004) and Chief Financial Officer (2002-2004) of the Franklin Templeton Funds and Senior Vice President of Franklin Templeton Services, LLC (2000-2004). |
Dwight D. Churchill (53) |
| Year of Election or Appointment: 2005 Vice President of the fund. Mr. Churchill also serves as Vice President of certain Equity Funds (2005-present). Mr. Churchill is Executive Vice President of FMR (2005-present) and FMR Co., Inc. (2005-present). Previously, Mr. Churchill served as Senior Vice President of Fidelity Investments Money Management, Inc. (2005-2006), Head of Fidelity's Fixed-Income Division (2000-2005), Vice President of Fidelity's Money Market Funds (2000-2005), Vice President of Fidelity's Bond Funds, and Senior Vice President of FMR. |
Bruce T. Herring (41) |
| Year of Election or Appointment: 2006 Vice President of the fund. Mr. Herring also serves as Vice President of certain Equity Funds (2006-present). Mr. Herring is Senior Vice President of FMR (2006-present) and Vice President of FMR Co., Inc. (2001-present). Previously, Mr. Herring served as a portfolio manager for Fidelity U.S. Equity Funds (2001-2005). |
Lionel Harris (40) |
| Year of Election or Appointment: 2005 Vice President of the fund. Mr. Harris also serves as Vice President of other funds advised by FMR. Prior to his current responsibilities, Mr. Harris worked as a research analyst, a high-income director of research, and portfolio manager. |
Eric D. Roiter (58) |
| Year of Election or Appointment: 2004 Secretary of the fund. He also serves as Secretary of other Fidelity funds; Vice President, General Counsel, and Secretary of FMR Co., Inc. (2001-present) and FMR; Assistant Secretary of Fidelity Management & Research (U.K.) Inc. (2001-present), Fidelity Research & Analysis Company (2001-present), and Fidelity Investments Money Management, Inc. (2001-present). Mr. Roiter is an Adjunct Member, Faculty of Law, at Boston College Law School (2003-present). Previously, Mr. Roiter served as Vice President and Secretary of Fidelity Distributors Corporation (FDC) (1998-2005). |
Scott C. Goebel (39) |
| Year of Election or Appointment: 2007 Assistant Secretary of the fund. Mr. Goebel also serves as Assistant Secretary of other Fidelity funds (2007-present), Vice President and Secretary of FDC (2006-present), and is an employee of FMR. |
R. Stephen Ganis (41) |
| Year of Election or Appointment: 2006 Anti-Money Laundering (AML) officer of the fund. Mr. Ganis also serves as AML officer of other Fidelity funds (2006-present) and FMR Corp. (2003-present). Before joining Fidelity Investments, Mr. Ganis practiced law at Goodwin Procter, LLP (2000-2002). |
Joseph B. Hollis (59) |
| Year of Election or Appointment: 2006 Chief Financial Officer of the fund. Mr. Hollis also serves as Chief Financial Officer of other Fidelity funds. Mr. Hollis is President of Fidelity Pricing and Cash Management Services (FPCMS) (2005-present). Mr. Hollis also serves as President and Director of Fidelity Service Company, Inc. (2006-present). Previously, Mr. Hollis served as Senior Vice President of Cash Management Services (1999-2002) and Investment Management Operations (2002-2005). |
Kenneth A. Rathgeber (60) |
| Year of Election or Appointment: 2004 Chief Compliance Officer of the fund. Mr. Rathgeber also serves as Chief Compliance Officer of other Fidelity funds (2004-present) and Executive Vice President of Risk Oversight for Fidelity Investments (2002-present). He is Chief Compliance Officer of FMR (2005-present), FMR Co., Inc. (2005-present), Fidelity Management & Research (U.K.) Inc. (2005-present), Fidelity Research & Analysis Company (2005-present), Fidelity Investments Money Management, Inc. (2005-present), and Strategic Advisers, Inc. (2005-present). Previously, Mr. Rathgeber served as Executive Vice President and Chief Operating Officer for Fidelity Investments Institutional Services Company, Inc. (1998-2002). |
Bryan A. Mehrmann (46) |
| Year of Election or Appointment: 2005 Deputy Treasurer of the fund. Mr. Mehrmann also serves as Deputy Treasurer of other Fidelity funds (2005-present) and is an employee of FMR. Previously, Mr. Mehrmann served as Vice President of Fidelity Investments Institutional Services Group (FIIS)/Fidelity Investments Institutional Operations Corporation, Inc. (FIIOC) Client Services (1998-2004). |
Kenneth B. Robins (37) |
| Year of Election or Appointment: 2005 Deputy Treasurer of the fund. Mr. Robins also serves as Deputy Treasurer of other Fidelity funds (2005-present) and is an employee of FMR (2004-present). Before joining Fidelity Investments, Mr. Robins worked at KPMG LLP, where he was a partner in KPMG's department of professional practice (2002-2004) and a Senior Manager (1999-2000). In addition, Mr. Robins served as Assistant Chief Accountant, United States Securities and Exchange Commission (2000-2002). |
Robert G. Byrnes (40) |
| Year of Election or Appointment: 2005 Assistant Treasurer of the fund. Mr. Byrnes also serves as Assistant Treasurer of other Fidelity funds (2005-present) and is an employee of FMR (2005-present). Previously, Mr. Byrnes served as Vice President of FPCMS (2003-2005). Before joining Fidelity Investments, Mr. Byrnes worked at Deutsche Asset Management where he served as Vice President of the Investment Operations Group (2000-2003). |
Name, Age; Principal Occupation |
Peter L. Lydecker (53) |
| Year of Election or Appointment: 2004 Assistant Treasurer of the fund. Mr. Lydecker also serves as Assistant Treasurer of other Fidelity funds (2004) and is an employee of FMR. |
Gary W. Ryan (48) |
| Year of Election or Appointment: 2005 Assistant Treasurer of the fund. Mr. Ryan also serves as Assistant Treasurer of other Fidelity funds (2005-present) and is an employee of FMR (2005-present). Previously, Mr. Ryan served as Vice President of Fund Reporting in FPCMS (1999-2005). |
Annual Report
Distributions
The Board of Trustees of Advisor Small Cap Growth Fund voted to pay on September 10, 2007, to shareholders of record at the opening of business on September 7, 2007, a distribution of $1.04 per share derived from capital gains realized from sales of portfolio securities and a dividend of $.00 per share from net investment income.
The fund hereby designates as a capital gain dividend with respect to the taxable year ended July 31, 2007, $23,164,051, or, if subsequently determined to be different, the net capital gain of such year.
The fund designates 29% of the dividend distributed during the fiscal year as qualifying for the dividends-received deduction for corporate shareholders.
The fund designates 41% of the dividend distributed in September 2006 as amounts which may be taken into account as a dividend for the purposes of the maximum rate under section 1(h)(11) of the Internal Revenue Code.
The fund will notify shareholders in January 2008 of amounts for use in preparing 2007 income tax returns.
Annual Report
Board Approval of Investment Advisory Contracts and Management Fees
Fidelity Small Cap Growth Fund
Each year, typically in July, the Board of Trustees, including the Independent Trustees (together, the Board), votes on the renewal of the management contract and sub-advisory agreements (together, the Advisory Contracts) for the fund. The Board, assisted by the advice of fund counsel and Independent Trustees' counsel, requests and considers a broad range of information throughout the year.
The Board meets regularly each month except August and takes into account throughout the year matters bearing on Advisory Contracts. The Board, acting directly and through its separate committees, considers at each of its meetings factors that are relevant to the annual renewal of the fund's Advisory Contracts, including the services and support provided to the fund and its shareholders. At the time of the renewal, the Board had 12 standing committees, each composed of Independent Trustees with varying backgrounds, to which the Board has assigned specific subject matter responsibilities in order to enhance effective decision-making by the Board. Each committee has adopted a written charter outlining the structure and purposes of the committee. One such committee, the Equity Contract Committee, meets periodically as needed throughout the year to consider matters specifically related to the annual renewal of Advisory Contracts. The committee requests and receives information on, and makes recommendations to the Independent Trustees concerning, the approval and annual review of the Advisory Contracts.
At its July 2007 meeting, the Board of Trustees, including the Independent Trustees, unanimously determined to renew the Advisory Contracts for the fund. In reaching its determination, the Board considered all factors it believed relevant, including (i) the nature, extent, and quality of the services to be provided to the fund and its shareholders (including the investment performance of the fund); (ii) the competitiveness of the management fee and total expenses of the fund; (iii) the total costs of the services to be provided by and the profits to be realized by the investment adviser and its affiliates from the relationship with the fund; (iv) the extent to which economies of scale would be realized as the fund grows; and (v) whether fee levels reflect these economies of scale, if any, for the benefit of fund shareholders. The Board also approved amendments to the fund's agreements with foreign sub-advisers to clarify that each sub-adviser provides services as an independent contractor.
In determining whether to renew the Advisory Contracts for the fund, the Board ultimately reached a determination, with the assistance of fund counsel and Independent Trustees' counsel, that the renewal of the Advisory Contracts and the compensation to be received by Fidelity under the management contract is consistent with Fidelity's fiduciary duty under applicable law. In addition to evaluating the specific factors noted above, the Board, in reaching its determination, is aware that shareholders in the fund have a broad range of investment choices available to them, including a wide choice among mutual funds offered by competitors to Fidelity, and that the fund's shareholders, with the opportunity to review and weigh the disclosure provided by the fund in its prospectus and other public disclosures, have chosen to invest in this fund, managed by Fidelity.
Annual Report
Board Approval of Investment Advisory Contracts and
Management Fees - continued
Nature, Extent, and Quality of Services Provided. The Board considered staffing within the investment adviser, FMR, and the sub-advisers (together, the Investment Advisers), including the background of the fund's portfolio manager and the fund's investment objective and discipline. The Independent Trustees also had discussions with senior management of Fidelity's investment operations and investment groups. The Board considered the structure of the portfolio manager compensation program and whether this structure provides appropriate incentives.
Resources Dedicated to Investment Management and Support Services. The Board reviewed the size, education, and experience of the Investment Advisers' investment staff, their use of technology, and the Investment Advisers' approach to recruiting, training, and retaining portfolio managers and other research, advisory, and management personnel. The Board considered Fidelity's extensive global research capabilities that enable the Investment Advisers to aggregate data from various sources in an effort to produce positive investment results. The Board noted that Fidelity's analysts have access to a variety of technological tools that enable them to perform both fundamental and quantitative analysis and to specialize in various disciplines. The Board also considered that Fidelity's portfolio managers and analysts have access to daily portfolio attribution that allows for monitoring of a fund's portfolio, as well as an electronic communication system that provides immediate real-time access to research concerning issuers and credit enhancers.
Shareholder and Administrative Services. The Board considered (i) the nature, extent, quality, and cost of advisory, administrative, distribution, and shareholder services performed by the Investment Advisers and their affiliates under the Advisory Contracts and under separate agreements covering transfer agency, pricing and bookkeeping, and securities lending services for the fund; (ii) the nature and extent of the Investment Advisers' supervision of third party service providers, principally custodians and subcustodians; and (iii) the resources devoted to, and the record of compliance with, the fund's compliance policies and procedures. The Board reviewed the allocation of fund brokerage, including allocations to brokers affiliated with the Investment Advisers, the use of brokerage commissions to pay fund expenses, and the use of "soft" commission dollars to pay for research services. The Board also considered that Fidelity voluntarily pays for market data out of its own resources.
The Board noted that the growth of fund assets across the complex allows Fidelity to reinvest in the development of services designed to enhance the value or convenience of the Fidelity funds as investment vehicles. These services include 24 hour access to account information and market information through phone representatives and over the Internet, and investor education materials and asset allocation tools.
Annual Report
Investment in a Large Fund Family. The Board considered the benefits to shareholders of investing in a Fidelity fund, including the benefits of investing in a fund that is part of a large family of funds offering a variety of investment disciplines and providing for a large variety of mutual fund investor services. For example, fund shareholders are offered the privilege of exchanging shares of the fund for shares of other Fidelity funds, as set forth in the fund's prospectus, without paying a sales charge. The Board noted that, since the last Advisory Contract renewals in July 2006, Fidelity has taken a number of actions that benefited particular funds, including (i) dedicating additional resources to investment research and to restructure the investment research teams; (ii) contractually agreeing to reduce the management fee on Fidelity Advisor Floating Rate High Income Fund; (iii) contractually agreeing to reduce the management fees on Fidelity's California, Massachusetts, New Jersey, and New York AMT Tax-Free Money Market Funds, launching new Institutional Classes and Service Classes of these funds, and contractually agreeing to impose expense limitations on these funds; (iv) eliminating the exchange fee on the Fidelity Select Portfolios and reducing the pricing and bookkeeping fee rates for these funds; (v) reducing the maximum transfer agency fee rates on high income funds and certain equity funds; (vi) proposing amended management contracts that, if approved by shareholders, will add a performance adjustment component to the management fees paid by 18 Fidelity Advisor equity funds; (vii) contractually agreeing to reduce fees for Ultra-Short Central Fund and the money market Central Funds; (viii) waiving the Fidelity Advisor funds' contingent deferred sales charge on certain redemptions made through systematic withdrawal programs; and (ix) amending the management contracts for equity and fixed-income funds whose management contracts incorporate a "group fee" structure by adding four new fee "breakpoints" to the group fee rate schedules.
Investment Performance and Compliance. The Board considered whether the fund has operated within its investment objective, as well as its record of compliance with its investment restrictions. It also reviewed the fund's absolute investment performance for each class, as well as the fund's relative investment performance for each class measured against (i) a broad-based securities market index, and (ii) a peer group of mutual funds deemed appropriate by the Board. Because the fund had been in existence less than three calendar years, the following chart considered by the Board shows, for the one-year period ended December 31, 2006, the total returns of Institutional Class (Class I) and Class B of the fund, the total return of a broad-based securities market index ("benchmark"), and a range of total returns of a peer group of mutual funds identified by Morningstar, Inc. as having an investment style similar to that of the fund based on underlying portfolio holdings. The returns of Institutional Class (Class I) and Class B show the performance of the highest and lowest performing classes, respectively. The box within the chart shows the 25th percentile return (bottom of box) and the 75th percentile return (top of box) of the peer group. Returns shown above the box are in the first quartile and returns shown below the box are in the fourth quartile. The percentage beaten numbers noted below the chart correspond to the percentile box and represent the percentage of funds in the peer group whose performance was equal to or lower than that of the class indicated.
Annual Report
Board Approval of Investment Advisory Contracts and
Management Fees - continued
Fidelity Small Cap Growth Fund

The Board reviewed the fund's relative investment performance against its peer group and stated that the performance of Institutional Class (Class I) of the fund was in the second quartile for the period shown. The Board also stated that the investment performance of Institutional Class (Class I) of the fund compared favorably to its benchmark for the period shown. The Board considered that the variations in performance among the fund's classes reflect the variations in class expenses, which result in lower performance for higher expense classes. The Board stated that it is difficult to evaluate in any comprehensive fashion the performance of the fund, in light of its relatively recent commencement of operations.
The Board also considered that the fund's management fee is subject to upward or downward adjustment depending upon whether, and to what extent, the fund's investment performance for the performance period exceeds, or is exceeded by, the record (over the same period) of a Board-approved performance adjustment index. The Board realizes that the performance adjustment provides FMR with a strong economic incentive to seek to achieve superior performance for the fund's shareholders and helps to more closely align the interests of FMR and the fund's shareholders.
Annual Report
The Board considered that FMR has taken steps to refocus and strengthen equity research, equity portfolio management, and compliance.
Based on its review, and giving particular weight to the nature and quality of the resources dedicated by the Investment Advisers to maintain and improve relative performance, the Board concluded that the nature, extent, and quality of the services provided to the fund will benefit the fund's shareholders, particularly in light of the Board's view that the fund's shareholders benefit from investing in a fund that is part of a large family of funds offering a variety of investment disciplines and services.
Competitiveness of Management Fee and Total Fund Expenses. The Board considered the fund's management fee and total expenses compared to "mapped groups" of competitive funds and classes. Fidelity creates "mapped groups" by combining similar Lipper investment objective categories that have comparable management fee characteristics. Combining Lipper investment objective categories aids the Board's management fee and total expense comparisons by broadening the competitive group used for comparison and by reducing the number of universes to which various Fidelity funds are compared. The Board also considered supplemental information about how the fund's management fee and total expenses ranked relative to groups based on Lipper classifications, which take into account a fund's market capitalization and style.
The Board considered two proprietary management fee comparisons for the 12-month (or shorter) periods shown in the chart below. The group of Lipper funds used by the Board for management fee comparisons is referred to below as the "Total Mapped Group." The Total Mapped Group comparison focuses on a fund's standing relative to the total universe of comparable funds available to investors, in terms of gross management fees before expense reimbursements or caps, and without giving effect to the fund's performance adjustment. "TMG %" represents the percentage of funds in the Total Mapped Group that had management fees that were lower than the fund's. For example, a TMG % of 13% means that 87% of the funds in the Total Mapped Group had higher management fees than the fund. The "Asset-Size Peer Group" (ASPG) comparison focuses on a fund's standing relative to non-Fidelity funds similar in size to the fund within the Total Mapped Group. The ASPG represents at least 15% of the funds in the Total Mapped Group with comparable asset size and management fee characteristics, subject to a minimum of 50 funds (or all funds in the Total Mapped Group if fewer than 50). Additional information, such as the ASPG quartile in which the fund's management fee ranked and the impact of the fund's performance adjustment, is also included in the chart and considered by the Board.
Annual Report
Board Approval of Investment Advisory Contracts and
Management Fees - continued
Fidelity Small Cap Growth Fund

The Board noted that the fund's management fee ranked below the median of its Total Mapped Group and below the median of its ASPG for 2006. The Board also noted the effect of the fund's positive performance adjustment on the fund's management fee ranking. The Board noted that the performance adjustment for each year represents calculations for performance periods that differ from the period shown in the performance chart above.
Based on its review, the Board concluded that the fund's management fee was fair and reasonable in light of the services that the fund receives and the other factors considered.
In its review of each class's total expenses, the Board considered the fund's management fee as well as other fund or class expenses, as applicable, such as transfer agent fees, pricing and bookkeeping fees, fund-paid 12b-1 fees, and custodial, legal, and audit fees. The Board also noted the effects of any waivers and reimbursements on fees and expenses, as well as the fund's positive performance adjustment. As part of its review, the Board also considered current and historical total expenses of each class of the fund compared to competitive fund median expenses. Each class of the fund is compared to those funds and classes in the Total Mapped Group (used by the Board for management fee comparisons) that have a similar sales load structure.
The Board noted that the total expenses of each of Class A, Institutional Class, and Fidelity Small Cap Growth (retail class) ranked below its competitive median for 2006, the total expenses of Class B ranked equal to its competitive median for 2006, and the total expenses of each of Class T and Class C ranked above its competitive median for 2006. The Board considered that the total expenses of Class C were above the median because of its higher transfer agent fee due to small average account size. The Board noted that the fund offers multiple classes, each of which has a different sales load and 12b-1 fee structure, and that the multiple structures are intended to offer a range of pricing options for the intermediary market. The Board also noted that the total expenses of the classes vary primarily by the level of their 12b-1 fees, although differences in transfer agent fees may also cause expenses to vary from class to class.
Annual Report
In its review of total expenses, the Board also considered Fidelity fee structures and other information on clients that FMR and its affiliates service in other competitive markets, such as other mutual funds advised or subadvised by FMR or its affiliates, pension plan clients, and other institutional clients.
Based on its review, the Board concluded that the total expenses of each class of the fund were reasonable, although in some cases above the median of the universe presented for comparison, in light of the services that the fund and its shareholders receive and the other factors considered.
Costs of the Services and Profitability. The Board considered the revenues earned and the expenses incurred by Fidelity in conducting the business of developing, marketing, distributing, managing, administering and servicing the fund and its shareholders. The Board also considered the level of Fidelity's profits in respect of all the Fidelity funds.
On an annual basis, FMR presents to the Board Fidelity's profitability for the fund. Fidelity calculates the profitability for each fund, as well as aggregate profitability for groups of Fidelity funds and all Fidelity funds, using a series of detailed revenue and cost allocation methodologies which originate with the audited books and records of Fidelity. The Audit Committee of the Board reviews any significant changes from the prior year's methodologies.
PricewaterhouseCoopers LLP (PwC), independent registered public accounting firm and auditor to Fidelity and certain Fidelity funds, has been engaged annually by the Board as part of the Board's assessment of the results of Fidelity's profitability analysis. PwC's engagement includes the review and assessment of Fidelity's methodologies used in determining the revenues and expenses attributable to Fidelity's mutual fund business, and completion of agreed-upon procedures surrounding the mathematical accuracy of fund profitability and its conformity to allocation methodologies. After considering PwC's reports issued under the engagement and information provided by Fidelity, the Board believes that while other allocation methods may also be reasonable, Fidelity's profitability methodologies are reasonable in all material respects.
Annual Report
Board Approval of Investment Advisory Contracts and
Management Fees - continued
The Board has also reviewed Fidelity's non-fund businesses and any fall-out benefits related to the mutual fund business as well as cases where Fidelity's affiliates may benefit from or be related to the fund's business.
The Board considered the costs of the services provided by and the profits realized by Fidelity in connection with the operation of the fund and determined that the amount of profit is a fair entrepreneurial profit for the management of the fund.
Economies of Scale. The Board considered whether there have been economies of scale in respect of the management of the Fidelity funds, whether the Fidelity funds (including the fund) have appropriately benefited from any such economies of scale, and whether there is potential for realization of any further economies of scale. The Board considered the extent to which the fund will benefit from economies of scale through increased services to the fund, through waivers or reimbursements, or through fee or expense reductions, including reductions that occur through operation of the transfer agent agreement. The transfer agent fee varies in part based on the number of accounts in the fund. If the number of accounts decreases or the average account size increases, the overall transfer agent fee rate decreases.
The Board recognized that the fund's management contract incorporates a "group fee" structure, which provides for lower group fee rates as total fund assets under FMR's management increase, and for higher group fee rates as total fund assets under FMR's management decrease. FMR determines the group fee rates based on a tiered asset "breakpoint" schedule. In connection with the renewal of the fund's management contract, the Board approved amendments to the fund's management contract that added four new fee breakpoints to the group fee rate schedule for assets under FMR's management above $1,386 billion. The Board considered that the group fee rate declines under both the present and amended schedules, but that under the amended schedule, the group fee rate declines faster as assets under FMR's management exceed $1,386 billion. The Board considered that the group fee is designed to deliver the benefits of economies of scale to fund shareholders when total fund assets increase, even if assets of any particular fund are unchanged or have declined, because some portion of Fidelity's costs are attributable to services provided to all Fidelity funds, and all funds benefit if those costs can be allocated among more assets. The Board concluded that, given the group fee structure, fund shareholders will achieve a certain level of economies of scale as assets under FMR's management increase at the fund complex level, regardless of whether Fidelity achieves any such economies of scale.
The Board further concluded that any potential economies of scale are being shared between fund shareholders and Fidelity in an appropriate manner.
Additional Information Requested by the Board. In order to develop fully the factual basis for consideration of the Fidelity funds' Advisory Contracts, the Board requested and received additional information on several topics, including (i) fund performance trends and actions to be taken by FMR to improve certain funds' overall performance; (ii) Fidelity's portfolio manager compensation structure, including its effects on fund profitability and the extent to which portfolio manager compensation is linked to fund performance; (iii) Fidelity's fee structures; (iv) the funds' sub-advisory arrangements; and (v) accounts managed by Fidelity other than the Fidelity funds.
Annual Report
Based on its evaluation of all of the conclusions noted above, and after considering all material factors, the Board ultimately concluded that the advisory fee structures are fair and reasonable, and that the fund's Advisory Contracts should be renewed.
Annual Report
Annual Report
Annual Report
Annual Report
Annual Report
Annual Report
Annual Report
Investment Adviser
Fidelity Management & Research Company
Boston, MA
Investment Sub-Advisers
FMR Co., Inc.
Fidelity Management & Research
(U.K.) Inc.
Fidelity Research & Analysis Company
Fidelity International Investment Advisors
Fidelity Investments Japan Limited
Fidelity International Investment Advisors (U.K.) Limited
General Distributor
Fidelity Distributors Corporation
Boston, MA
Transfer and Service Agents
Fidelity Investments Institutional
Operations Company, Inc.
Boston, MA
Fidelity Service Company, Inc.
Boston, MA
Custodian
Citibank, N.A.
New York, NY
ASCPI-UANN-0907
1.803721.102
(Fidelity Investment logo)(registered trademark)
Fidelity®
Small Cap Value
Fund
Annual Report
July 31, 2007
(2_fidelity_logos) (Registered_Trademark)
Contents
Chairman's Message | <Click Here> | Ned Johnson's message to shareholders. |
Performance | <Click Here> | How the fund has done over time. |
Management's Discussion | <Click Here> | The manager's review of fund performance, strategy and outlook. |
Shareholder Expense Example | <Click Here> | An example of shareholder expenses. |
Investment Changes | <Click Here> | A summary of major shifts in the fund's investments over the past six months. |
Investments | <Click Here> | A complete list of the fund's investments with their market values. |
Financial Statements | <Click Here> | Statements of assets and liabilities, operations, and changes in net assets,
as well as financial highlights. |
Notes | <Click Here> | Notes to the financial statements. |
Report of Independent Registered Public Accounting Firm | <Click Here> | |
Trustees and Officers | <Click Here> | |
Distributions | <Click Here> | |
Board Approval of Investment Advisory Contracts and Management Fees | <Click Here> | |
To view a fund's proxy voting guidelines and proxy voting record for the 12-month period ended June 30, visit http://www.fidelity.com (search for "proxy voting results") or visit the Securities and Exchange Commission's (SEC) web site at http://www.sec.gov. You may also call 1-800-544-8544 to request a free copy of the proxy voting guidelines.
Standard & Poor's, S&P and S&P 500 are registered service marks of The McGraw-Hill Companies, Inc. and have been licensed for use by Fidelity Distributors Corporation.
Other third party marks appearing herein are the property of their respective owners.
All other marks appearing herein are registered or unregistered trademarks or service marks of FMR Corp. or an affiliated company.
Annual Report
This report and the financial statements contained herein are submitted for the general information of the shareholders of the fund. This report is not authorized for distribution to prospective investors in the fund unless preceded or accompanied by an effective prospectus.
A fund files its complete schedule of portfolio holdings with the SEC for the first and third quarters of each fiscal year on Form N-Q. Forms N-Q are available on the SEC's web site at http://www.sec.gov. A fund's Forms N-Q may be reviewed and copied at the SEC's Public Reference Room in Washington, DC. Information regarding the operation of the SEC's Public Reference Room may be obtained by calling 1-800-SEC-0330. For a complete list of a fund's portfolio holdings, view the most recent holdings report, semiannual report, or annual report on Fidelity's web site at http://www.fidelity.com or http://www.advisor.fidelity.com, as applicable.
NOT FDIC INSURED · MAY LOSE VALUE · NO BANK GUARANTEE
Neither the fund nor Fidelity Distributors Corporation is a bank.
Annual Report
Chairman's Message
(photo_of_Edward_C_Johnson_3d)
Dear Shareholder:
Stocks are currently on pace to register their fifth straight year of positive returns, although gains could be trimmed if the U.S. economy continues to slow. While financial markets are always unpredictable, there are a number of time-tested principles that can put the historical odds in your favor.
One of the basic tenets is to invest for the long term. Over time, riding out the markets' inevitable ups and downs has proven much more effective than selling into panic or chasing the hottest trend. Even missing only a few of the markets' best days can significantly diminish investor returns. Patience also affords the benefits of compounding - of earning interest on additional income or reinvested dividends and capital gains. There are tax advantages and cost benefits to consider as well. The more you sell, the more taxes you pay, and the more you trade, the higher the costs. While staying the course doesn't eliminate risk, it can considerably lessen the effect of short-term declines.
You can further manage your investing risk through diversification. And today, more than ever, geographic diversification should be taken into account. Studies indicate that asset allocation is the single most important determinant of a portfolio's long-term success. The right mix of stocks, bonds and cash - aligned to your particular risk tolerance and investment objective - is very important. Age-appropriate rebalancing is also an essential aspect of asset allocation. For younger investors, an emphasis on equities - which historically have been the best-performing asset class over time - is encouraged. As investors near their specific goal, such as retirement or sending a child to college, consideration may be given to replacing volatile assets (e.g. common stocks) with more-stable fixed investments (bonds or savings plans).
A third investment principle - investing regularly - can help lower the average cost of your purchases. Investing a certain amount of money each month or quarter helps ensure you won't pay for all your shares at market highs. This strategy - known as dollar cost averaging - also reduces unconstructive "emotion" from investing, helping shareholders avoid selling weak performers just prior to an upswing, or chasing a hot performer just before a correction.
We invite you to contact us via the Internet, through our Investor Centers or over the phone. It is our privilege to provide you the information you need to make the investments that are right for you.
Sincerely,
/s/Edward C. Johnson 3d
Edward C. Johnson 3d
Annual Report
Performance: The Bottom Line
Average annual total return reflects the change in the value of an investment, assuming reinvestment of Small Cap Value's dividend income and capital gains (the profits earned upon the sale of securities that have grown in value) and assuming a constant rate of performance each year. The $10,000 table and the fund's returns do not reflect the deduction of taxes that a shareholder would pay on fund distributions or the redemption of fund shares. During periods of reimbursement by Fidelity, a fund's total return will be greater than it would be had the reimbursement not occurred. How a fund did yesterday is no guarantee of how it will do tomorrow.
Average Annual Total Returns
Periods ended July 31, 2007 | Past 1
year | Life of
FundA |
Small Cap Value | 14.96% | 17.76% |
A From November 3, 2004.
$10,000 Over Life of Fund
Let's say hypothetically that $10,000 was invested in Small Cap Value on November 3, 2004, when the fund started. The chart shows how the value of your investment would have changed, and also shows how the Russell 2000® Value Index performed over the same period.
Annual Report
Management's Discussion of Fund Performance
Comments from Thomas Hense, Portfolio Manager of Fidelity® Small Cap Value Fund
Major U.S. equity benchmarks approached or exceeded gains of 20% and several set record highs during the 12-month period ending July 31, 2007. In that time, the Dow Jones Industrial AverageSM rose 20.84%, the Standard & Poor's 500SM Index advanced 16.13% and the NASDAQ Composite® Index gained 22.67%. The small-cap Russell 2000® Index fared less well after falling nearly 7% in July, but still returned 12.12% for the year overall. The first half of the period featured six consecutive months of positive returns spurred by the more relaxed monetary policy of the Federal Reserve Board and falling energy prices, which softened inflationary pressures on the U.S. economy. Stocks slipped in February, however, as energy prices crept higher, the housing market slumped, subprime mortgage woes mounted and the Chinese stock market declined 9% in a single day. But equities soared again from March through May, as reflected by the Dow and the S&P 500®, which climbed nearly 12% and more than 9%, respectively. In June and July, though, stocks sank again on inflation concerns and a worsening subprime loan crisis.
Small Cap Value was up 14.96% for the 12-month period ending July 31, 2007, significantly outperforming the Russell 2000 Value Index, which returned 7.67%. The fund was helped by holding an underweighting in banks and real estate investment trusts during the past six months when these stocks performed poorly. The fund also got a boost from good stock selection in the strong-performing industrials and energy sectors. On the other hand, poor security selection in the materials, health care and telecommunication services sectors dragged down performance. Underweighting the strong-performing telecommunication services sector hurt as well. Among the fund's top performers were real estate services provider Jones Lang LaSalle, engineering and construction firm Shaw Group, oil refinery Tesoro and Spanish systems integration and consulting firm Telvent. UAP Holding, a distributor of seeds and agricultural chemicals, also did well. In terms of individual detractors, pharmacy benefit management company Omnicare and Pantry, which owns convenience stores combined with gas stations, held back the fund's return. Center Financial, a bank that caters to the Chinese-American community, also hurt performance.
The views expressed above reflect those of the portfolio manager(s) only through the end of the period as stated on the cover of this report and do not necessarily represent the views of Fidelity or any other person in the Fidelity organization. Any such views are subject to change at any time based upon market or other conditions and Fidelity disclaims any responsibility to update such views. These views may not be relied on as investment advice and, because investment decisions for a Fidelity fund are based on numerous factors, may not be relied on as an indication of trading intent on behalf of any Fidelity fund.
Annual Report
Shareholder Expense Example
As a shareholder of the Fund, you incur two types of costs: (1) transaction costs, including sales charges (loads) on purchase payments or redemption proceeds, redemption fees, and (2) ongoing costs, including management fees, distribution and/or service (12b-1) fees and other Fund expenses. This Example is intended to help you understand your ongoing costs (in dollars) of investing in the Fund and to compare these costs with the ongoing costs of investing in other mutual funds.
The Example is based on an investment of $1,000 invested at the beginning of the period and held for the entire period (February 1, 2007 to July 31, 2007).
Actual Expenses
The first line of the accompanying table for each class of the Fund provides information about actual account values and actual expenses. You may use the information in this line, together with the amount you invested, to estimate the expenses that you paid over the period. Simply divide your account value by $1,000.00 (for example, an $8,600 account value divided by $1,000.00 = 8.6), then multiply the result by the number in the first line for a class of the Fund under the heading entitled "Expenses Paid During Period" to estimate the expenses you paid on your account during this period. A small balance maintenance fee of $12.00 that is charged once a year may apply for certain accounts with a value of less than $2,000. This fee is not included in the table below. If it was, the estimate of expenses you paid during the period would be higher, and your ending account value lower, by this amount. In addition, the Fund, as a shareholder in the underlying Fidelity Central Funds, will indirectly bear its pro rata share of the fees and expenses incurred by the underlying Fidelity Central Funds. These fees and expenses are not included in the Fund's annualized expense ratio used to calculate the expense estimate in the table below.
Hypothetical Example for Comparison Purposes
The second line of the accompanying table for each class of the Fund provides information about hypothetical account values and hypothetical expenses based on a Class' actual expense ratio and an assumed rate of return of 5% per year before expenses, which is not the Class' actual return. The hypothetical account values and expenses may not be used to estimate the actual ending account balance or expenses you paid for the period. You may use this information to compare the ongoing costs of investing in the Fund and other funds. To do so, compare this 5% hypothetical example with the 5% hypothetical examples that appear in the shareholder reports of the other funds. A small balance maintenance fee of $12.00 that is charged once a year may apply for certain accounts with a value of less than $2,000. This fee is not included in the table below. If it was, the estimate of expenses you paid during the period would be higher, and your ending account value lower, by this amount. In addition, the Fund, as a shareholder in the underlying Fidelity Central Funds, will indirectly bear its pro rata share of the fees and expenses incurred by the underlying Fidelity Central Funds. These fees and expenses are not included in the Fund's annualized expense ratio used to calculate the expense estimate in the table below.
Annual Report
Shareholder Expense Example - continued
Please note that the expenses shown in the table are meant to highlight your ongoing costs only and do not reflect any transaction costs. Therefore, the second line of the table is useful in comparing ongoing costs only, and will not help you determine the relative total costs of owning different funds. In addition, if these transactional costs were included, your costs would have been higher.
| Beginning
Account Value
February 1, 2007 | Ending
Account Value
July 31, 2007 | Expenses Paid
During Period*
February 1, 2007
to July 31, 2007 |
Class A | | | |
Actual | $ 1,000.00 | $ 1,012.00 | $ 6.98 |
Hypothetical A | $ 1,000.00 | $ 1,017.85 | $ 7.00 |
Class T | | | |
Actual | $ 1,000.00 | $ 1,010.60 | $ 8.23 |
Hypothetical A | $ 1,000.00 | $ 1,016.61 | $ 8.25 |
Class B | | | |
Actual | $ 1,000.00 | $ 1,008.50 | $ 10.71 |
Hypothetical A | $ 1,000.00 | $ 1,014.13 | $ 10.74 |
Class C | | | |
Actual | $ 1,000.00 | $ 1,007.80 | $ 10.70 |
Hypothetical A | $ 1,000.00 | $ 1,014.13 | $ 10.74 |
Small Cap Value | | | |
Actual | $ 1,000.00 | $ 1,013.30 | $ 5.54 |
Hypothetical A | $ 1,000.00 | $ 1,019.29 | $ 5.56 |
Institutional Class | | | |
Actual | $ 1,000.00 | $ 1,013.30 | $ 5.44 |
Hypothetical A | $ 1,000.00 | $ 1,019.39 | $ 5.46 |
A 5% return per year before expenses
* Expenses are equal to each Class' annualized expense ratio (shown in the table below); multiplied by the average account value over the period, multiplied by 181/365 (to reflect the one-half year period).
| Annualized
Expense Ratio |
Class A | 1.40% |
Class T | 1.65% |
Class B | 2.15% |
Class C | 2.15% |
Small Cap Value | 1.11% |
Institutional Class | 1.09% |
Annual Report
Investment Changes
Top Ten Stocks as of July 31, 2007 |
| % of fund's
net assets | % of fund's net assets
6 months ago |
Tesoro Corp. | 3.2 | 2.4 |
Carpenter Technology Corp. | 2.4 | 2.2 |
UAP Holding Corp. | 1.9 | 1.8 |
Arris Group, Inc. | 1.8 | 1.5 |
Jarden Corp. | 1.8 | 1.9 |
Jones Lang LaSalle, Inc. | 1.7 | 1.8 |
AAR Corp. | 1.7 | 1.9 |
RC2 Corp. | 1.7 | 1.7 |
Washington Group International, Inc. | 1.6 | 1.0 |
Telvent GIT SA | 1.6 | 1.1 |
| 19.4 | |
Top Five Market Sectors as of July 31, 2007 |
| % of fund's
net assets | % of fund's net assets
6 months ago |
Financials | 23.1 | 23.6 |
Information Technology | 17.1 | 15.0 |
Industrials | 17.0 | 15.3 |
Consumer Discretionary | 11.9 | 13.0 |
Energy | 10.6 | 8.0 |
Asset Allocation (% of fund's net assets) |
As of July 31, 2007 * | As of January 31, 2007 ** |
| Stocks 98.1% | | | Stocks 92.1% | |
| Short-Term
Investments and
Net Other Assets 1.9% | | | Short-Term
Investments and
Net Other Assets 7.9% | |
* Foreign investments | 7.6% | | ** Foreign investments | 6.5% | |

Annual Report
Investments July 31, 2007
Showing Percentage of Net Assets
Common Stocks - 98.1% |
| Shares | | Value |
CONSUMER DISCRETIONARY - 11.9% |
Auto Components - 0.8% |
Aftermarket Technology Corp. (a) | 150,000 | | $ 4,552,500 |
ArvinMeritor, Inc. | 175,000 | | 3,470,250 |
Hawk Corp. Class A (a) | 223,100 | | 3,257,260 |
| | 11,280,010 |
Distributors - 0.4% |
Building Materials Holding Corp. (d) | 439,100 | | 6,099,099 |
Hotels, Restaurants & Leisure - 1.5% |
Pinnacle Entertainment, Inc. (a) | 412,700 | | 10,940,677 |
Red Robin Gourmet Burgers, Inc. (a) | 140,000 | | 5,399,800 |
Wyndham Worldwide Corp. (a) | 150,000 | | 5,047,500 |
| | 21,387,977 |
Household Durables - 2.7% |
Directed Electronics, Inc. (a) | 180,886 | | 1,365,689 |
Ethan Allen Interiors, Inc. (d) | 285,300 | | 9,745,848 |
Jarden Corp. (a)(d) | 684,600 | | 24,734,598 |
Ryland Group, Inc. | 55,000 | | 1,828,750 |
| | 37,674,885 |
Leisure Equipment & Products - 1.7% |
MarineMax, Inc. (a) | 30,000 | | 561,000 |
RC2 Corp. (a) | 669,555 | | 23,708,943 |
| | 24,269,943 |
Media - 1.0% |
Charter Communications, Inc. Class A (a) | 1,000,000 | | 4,060,000 |
Sinclair Broadcast Group, Inc. Class A | 720,500 | | 9,395,320 |
| | 13,455,320 |
Multiline Retail - 0.0% |
Retail Ventures, Inc. (a) | 23,100 | | 300,762 |
Specialty Retail - 2.3% |
Asbury Automotive Group, Inc. | 250,000 | | 5,530,000 |
Gymboree Corp. (a) | 270,000 | | 11,623,500 |
Lithia Motors, Inc. Class A (sub. vtg.) | 54,000 | | 1,111,860 |
Mothers Work, Inc. (a) | 78,600 | | 1,744,920 |
Payless ShoeSource, Inc. (a) | 200,000 | | 5,324,000 |
Select Comfort Corp. (a)(d) | 390,000 | | 6,216,600 |
| | 31,550,880 |
Textiles, Apparel & Luxury Goods - 1.5% |
Skechers U.S.A., Inc. Class A (sub. vtg.) (a) | 505,000 | | 10,498,950 |
Common Stocks - continued |
| Shares | | Value |
CONSUMER DISCRETIONARY - continued |
Textiles, Apparel & Luxury Goods - continued |
Steven Madden Ltd. | 265,000 | | $ 7,473,000 |
Warnaco Group, Inc. (a) | 90,000 | | 3,249,900 |
| | 21,221,850 |
TOTAL CONSUMER DISCRETIONARY | | 167,240,726 |
CONSUMER STAPLES - 5.2% |
Food & Staples Retailing - 1.1% |
The Pantry, Inc. (a) | 451,000 | | 15,712,840 |
Food Products - 1.6% |
Chiquita Brands International, Inc. | 171,000 | | 3,002,760 |
Diamond Foods, Inc. | 395,400 | | 6,496,422 |
Hain Celestial Group, Inc. (a) | 140,000 | | 3,792,600 |
Marine Harvest ASA (a) | 7,155,000 | | 9,046,862 |
| | 22,338,644 |
Household Products - 0.7% |
Central Garden & Pet Co. Class A (non-vtg.) (a) | 788,300 | | 9,648,792 |
Personal Products - 1.8% |
Physicians Formula Holdings, Inc. | 68,100 | | 1,018,095 |
Playtex Products, Inc. (a) | 771,600 | | 13,819,356 |
Prestige Brands Holdings, Inc. (a) | 892,631 | | 11,166,814 |
| | 26,004,265 |
TOTAL CONSUMER STAPLES | | 73,704,541 |
ENERGY - 10.6% |
Energy Equipment & Services - 2.1% |
Hornbeck Offshore Services, Inc. (a) | 154,100 | | 6,634,005 |
Oil States International, Inc. (a) | 244,760 | | 10,705,802 |
Superior Energy Services, Inc. (a) | 290,000 | | 11,692,800 |
| | 29,032,607 |
Oil, Gas & Consumable Fuels - 8.5% |
Alpha Natural Resources, Inc. (a) | 114,600 | | 2,045,610 |
Cabot Oil & Gas Corp. | 320,000 | | 10,944,000 |
Forest Oil Corp. (a) | 260,300 | | 10,534,341 |
Mariner Energy, Inc. (a) | 530,000 | | 11,198,900 |
Petrohawk Energy Corp. (a) | 790,000 | | 11,842,100 |
Petroleum Development Corp. (a) | 127,622 | | 5,148,271 |
Southwestern Energy Co. (a) | 320,000 | | 13,001,600 |
Common Stocks - continued |
| Shares | | Value |
ENERGY - continued |
Oil, Gas & Consumable Fuels - continued |
Tesoro Corp. | 907,600 | | $ 45,198,478 |
USEC, Inc. (a) | 230,000 | | 3,861,700 |
Western Refining, Inc. | 110,000 | | 6,105,000 |
| | 119,880,000 |
TOTAL ENERGY | | 148,912,607 |
FINANCIALS - 23.1% |
Capital Markets - 1.6% |
ACA Capital Holdings, Inc. (d) | 88,600 | | 518,310 |
American Capital Strategies Ltd. (d) | 78,700 | | 2,988,239 |
KBW, Inc. (d) | 175,000 | | 4,394,250 |
MF Global Ltd. | 54,600 | | 1,361,178 |
Penson Worldwide, Inc. | 80,000 | | 1,412,000 |
Piper Jaffray Companies (a)(d) | 75,000 | | 3,594,000 |
TradeStation Group, Inc. (a) | 718,300 | | 7,592,431 |
| | 21,860,408 |
Commercial Banks - 5.2% |
Boston Private Financial Holdings, Inc. (d) | 610,200 | | 15,553,998 |
Cathay General Bancorp | 266,520 | | 8,158,177 |
Center Financial Corp., California | 354,052 | | 5,261,213 |
Colonial Bancgroup, Inc. | 130,000 | | 2,835,300 |
East West Bancorp, Inc. | 28,800 | | 1,055,808 |
First State Bancorp. | 280,368 | | 4,839,152 |
Hanmi Financial Corp. | 195,040 | | 2,828,080 |
Investors Bancorp, Inc. (a)(d) | 190,000 | | 2,285,700 |
Nara Bancorp, Inc. | 183,270 | | 2,705,065 |
South Financial Group, Inc. | 340,000 | | 7,330,400 |
Sterling Bancshares, Inc. | 235,000 | | 2,446,350 |
UCBH Holdings, Inc. | 150,000 | | 2,466,000 |
UMB Financial Corp. | 195,000 | | 7,281,300 |
Wintrust Financial Corp. | 197,360 | | 7,777,958 |
| | 72,824,501 |
Consumer Finance - 0.9% |
Advanta Corp. Class B | 97,500 | | 2,501,850 |
Cash America International, Inc. | 90,000 | | 3,295,800 |
CompuCredit Corp. (a)(d) | 55,000 | | 1,443,750 |
Dollar Financial Corp. (a) | 210,000 | | 5,262,600 |
| | 12,504,000 |
Common Stocks - continued |
| Shares | | Value |
FINANCIALS - continued |
Diversified Financial Services - 1.1% |
Endeavor Acquisition Corp. (a)(d) | 341,000 | | $ 3,768,050 |
MarketAxess Holdings, Inc. (a) | 450,000 | | 7,474,500 |
Marlin Business Services Corp. (a) | 220,779 | | 4,302,983 |
| | 15,545,533 |
Insurance - 11.2% |
American Equity Investment Life Holding Co. | 1,039,506 | | 11,798,393 |
Aspen Insurance Holdings Ltd. | 360,200 | | 8,806,890 |
Delphi Financial Group, Inc. Class A | 172,850 | | 6,943,385 |
HCC Insurance Holdings, Inc. | 670,920 | | 19,644,538 |
Infinity Property & Casualty Corp. | 90,000 | | 3,963,600 |
IPC Holdings Ltd. | 573,740 | | 14,234,489 |
Max Capital Group Ltd. | 175,000 | | 4,569,250 |
National Financial Partners Corp. (d) | 456,300 | | 21,154,068 |
Navigators Group, Inc. (a) | 104,862 | | 5,485,331 |
Ohio Casualty Corp. | 80,500 | | 3,494,505 |
PartnerRe Ltd. | 30,000 | | 2,130,900 |
Philadelphia Consolidated Holdings Corp. (a) | 59,140 | | 2,137,320 |
Platinum Underwriters Holdings Ltd. | 329,700 | | 10,946,040 |
Tower Group, Inc. | 305,000 | | 8,082,500 |
United America Indemnity Ltd. Class A (a) | 91,022 | | 1,955,153 |
Universal American Financial Corp. (a) | 150,000 | | 2,986,500 |
Willis Group Holdings Ltd. | 195,000 | | 7,915,050 |
Zenith National Insurance Corp. | 524,000 | | 21,148,640 |
| | 157,396,552 |
Real Estate Investment Trusts - 0.3% |
Education Realty Trust, Inc. | 158,300 | | 2,081,645 |
GMH Communities Trust | 264,100 | | 2,218,440 |
| | 4,300,085 |
Real Estate Management & Development - 1.7% |
Jones Lang LaSalle, Inc. | 223,000 | | 24,480,940 |
Thrifts & Mortgage Finance - 1.1% |
BankAtlantic Bancorp, Inc. Class A (non-vtg.) | 59,125 | | 518,526 |
Downey Financial Corp. (d) | 20,000 | | 1,063,800 |
Farmer Mac Class C (non-vtg.) | 140,000 | | 3,917,200 |
Provident Financial Services, Inc. | 100,000 | | 1,410,000 |
Radian Group, Inc. | 65,000 | | 2,191,150 |
Common Stocks - continued |
| Shares | | Value |
FINANCIALS - continued |
Thrifts & Mortgage Finance - continued |
Triad Guaranty, Inc. (a) | 50,000 | | $ 1,378,500 |
Washington Federal, Inc. | 210,000 | | 4,731,300 |
| | 15,210,476 |
TOTAL FINANCIALS | | 324,122,495 |
HEALTH CARE - 3.3% |
Health Care Equipment & Supplies - 0.2% |
Zoll Medical Corp. (a) | 100,000 | | 2,686,000 |
Health Care Providers & Services - 1.2% |
Air Methods Corp. (a) | 209,167 | | 7,969,263 |
Capital Senior Living Corp. (a) | 111,185 | | 985,099 |
Omnicare, Inc. | 50,000 | | 1,658,000 |
Pediatrix Medical Group, Inc. (a) | 100,000 | | 5,396,000 |
| | 16,008,362 |
Life Sciences Tools & Services - 0.6% |
ICON PLC sponsored ADR | 178,720 | | 8,358,734 |
Pharmaceuticals - 1.3% |
Adams Respiratory Therapeutics, Inc. (a) | 135,000 | | 4,996,350 |
Valeant Pharmaceuticals International | 880,000 | | 13,807,200 |
| | 18,803,550 |
TOTAL HEALTH CARE | | 45,856,646 |
INDUSTRIALS - 17.0% |
Aerospace & Defense - 3.1% |
AAR Corp. (a) | 802,300 | | 23,932,609 |
DRS Technologies, Inc. | 144,000 | | 7,539,840 |
Hexcel Corp. (a) | 250,200 | | 5,439,348 |
Orbital Sciences Corp. (a) | 325,000 | | 6,886,750 |
| | 43,798,547 |
Air Freight & Logistics - 1.4% |
Hub Group, Inc. Class A (a) | 180,000 | | 6,123,600 |
Park-Ohio Holdings Corp. (a) | 401,646 | | 9,976,887 |
UTI Worldwide, Inc. | 160,000 | | 4,020,800 |
| | 20,121,287 |
Airlines - 0.2% |
AirTran Holdings, Inc. (a)(d) | 310,000 | | 3,050,400 |
Common Stocks - continued |
| Shares | | Value |
INDUSTRIALS - continued |
Commercial Services & Supplies - 2.8% |
FTI Consulting, Inc. (a) | 360,000 | | $ 14,770,800 |
IKON Office Solutions, Inc. | 200,000 | | 2,772,000 |
Interface, Inc. Class A | 328,590 | | 6,055,914 |
Navigant Consulting, Inc. (a) | 125,000 | | 1,968,750 |
Team, Inc. (a) | 279,628 | | 13,145,312 |
| | 38,712,776 |
Construction & Engineering - 3.6% |
Infrasource Services, Inc. (a) | 175,000 | | 6,058,500 |
Shaw Group, Inc. (a) | 418,000 | | 22,245,960 |
Washington Group International, Inc. (a) | 285,000 | | 22,891,200 |
| | 51,195,660 |
Electrical Equipment - 1.3% |
Belden, Inc. | 320,000 | | 17,529,600 |
Machinery - 1.2% |
AGCO Corp. (a) | 85,000 | | 3,266,550 |
Bucyrus International, Inc. Class A | 8,300 | | 527,548 |
Force Protection, Inc. (a)(d) | 470,000 | | 7,379,000 |
Manitowoc Co., Inc. | 76,520 | | 5,943,308 |
| | 17,116,406 |
Road & Rail - 0.4% |
YRC Worldwide, Inc. (a) | 175,000 | | 5,621,000 |
Trading Companies & Distributors - 3.0% |
Kaman Corp. | 223,822 | | 7,495,799 |
Rush Enterprises, Inc. Class A (a) | 90,000 | | 2,515,500 |
UAP Holding Corp. | 980,980 | | 26,653,227 |
WESCO International, Inc. (a) | 88,000 | | 4,712,400 |
| | 41,376,926 |
TOTAL INDUSTRIALS | | 238,522,602 |
INFORMATION TECHNOLOGY - 17.1% |
Communications Equipment - 2.8% |
Andrew Corp. (a) | 330,000 | | 4,639,800 |
Arris Group, Inc. (a) | 1,685,000 | | 24,971,700 |
Avocent Corp. (a) | 80,000 | | 2,188,000 |
Polycom, Inc. (a) | 245,000 | | 7,587,650 |
| | 39,387,150 |
Common Stocks - continued |
| Shares | | Value |
INFORMATION TECHNOLOGY - continued |
Computers & Peripherals - 0.9% |
Brocade Communications Systems, Inc. (a) | 1,385,000 | | $ 9,750,400 |
Diebold, Inc. | 50,000 | | 2,533,500 |
| | 12,283,900 |
Electronic Equipment & Instruments - 5.7% |
Amphenol Corp. Class A | 40,000 | | 1,370,400 |
Benchmark Electronics, Inc. (a) | 167,900 | | 3,727,380 |
CTS Corp. | 190,000 | | 2,420,600 |
Ingram Micro, Inc. Class A (a) | 837,700 | | 16,795,885 |
Insight Enterprises, Inc. (a) | 680,600 | | 15,354,336 |
Mettler-Toledo International, Inc. (a) | 113,700 | | 10,819,692 |
SYNNEX Corp. (a) | 85,000 | | 1,727,200 |
Tektronix, Inc. | 551,000 | | 18,100,350 |
Vishay Intertechnology, Inc. (a) | 677,491 | | 10,507,885 |
| | 80,823,728 |
Internet Software & Services - 1.0% |
j2 Global Communications, Inc. (a) | 430,800 | | 14,061,312 |
IT Services - 2.7% |
CACI International, Inc. Class A (a) | 135,000 | | 5,999,400 |
ManTech International Corp. Class A (a) | 105,000 | | 3,429,300 |
MoneyGram International, Inc. | 80,000 | | 2,047,200 |
Ness Technologies, Inc. (a) | 265,200 | | 3,118,752 |
Telvent GIT SA | 971,000 | | 22,828,210 |
| | 37,422,862 |
Semiconductors & Semiconductor Equipment - 2.4% |
ANADIGICS, Inc. (a)(d) | 425,000 | | 6,175,250 |
California Micro Devices Corp. (a) | 253,000 | | 1,133,440 |
Entegris, Inc. (a) | 500,000 | | 5,390,000 |
FormFactor, Inc. (a) | 195,900 | | 7,520,601 |
Integrated Device Technology, Inc. (a) | 195,400 | | 3,179,158 |
Microsemi Corp. (a)(d) | 141,400 | | 3,296,034 |
MKS Instruments, Inc. (a) | 173,900 | | 3,947,530 |
Rudolph Technologies, Inc. (a) | 165,244 | | 2,586,069 |
| | 33,228,082 |
Software - 1.6% |
Blackbaud, Inc. | 340,000 | | 7,119,600 |
Quest Software, Inc. (a) | 730,000 | | 10,804,000 |
Common Stocks - continued |
| Shares | | Value |
INFORMATION TECHNOLOGY - continued |
Software - continued |
Sonic Solutions, Inc. (a) | 255,000 | | $ 2,850,900 |
THQ, Inc. (a) | 70,000 | | 2,013,200 |
| | 22,787,700 |
TOTAL INFORMATION TECHNOLOGY | | 239,994,734 |
MATERIALS - 6.1% |
Chemicals - 1.4% |
Airgas, Inc. | 155,000 | | 7,238,500 |
CF Industries Holdings, Inc. | 115,000 | | 6,610,200 |
H.B. Fuller Co. | 175,000 | | 4,835,250 |
OMNOVA Solutions, Inc. (a) | 125,000 | | 707,500 |
Tronox, Inc. Class A | 47,900 | | 569,531 |
| | 19,960,981 |
Containers & Packaging - 0.2% |
Smurfit-Stone Container Corp. (a) | 190,000 | | 2,240,100 |
Metals & Mining - 4.5% |
Carpenter Technology Corp. | 280,000 | | 33,233,200 |
Compass Minerals International, Inc. | 441,466 | | 14,497,743 |
Meridian Gold, Inc. (a) | 428,400 | | 12,093,736 |
Titanium Metals Corp. (a) | 120,000 | | 4,010,400 |
| | 63,835,079 |
TOTAL MATERIALS | | 86,036,160 |
TELECOMMUNICATION SERVICES - 0.9% |
Diversified Telecommunication Services - 0.9% |
General Communications, Inc. Class A (a) | 290,000 | | 3,337,900 |
Level 3 Communications, Inc. (a) | 800,000 | | 4,184,000 |
Time Warner Telecom, Inc. Class A (sub. vtg.) (a) | 230,000 | | 4,496,500 |
| | 12,018,400 |
UTILITIES - 2.9% |
Electric Utilities - 1.1% |
ITC Holdings Corp. | 358,400 | | 15,070,720 |
Maine & Maritimes Corp. (a) | 10,170 | | 275,912 |
| | 15,346,632 |
Independent Power Producers & Energy Traders - 0.5% |
NRG Energy, Inc. (a) | 168,000 | | 6,476,400 |
Common Stocks - continued |
| Shares | | Value |
UTILITIES - continued |
Multi-Utilities - 1.3% |
CMS Energy Corp. | 707,500 | | $ 11,433,200 |
Integrys Energy Group, Inc. | 155,000 | | 7,670,950 |
| | 19,104,150 |
TOTAL UTILITIES | | 40,927,182 |
TOTAL COMMON STOCKS (Cost $1,243,321,810) | 1,377,336,093 |
Money Market Funds - 6.6% |
| | | |
Fidelity Cash Central Fund, 5.38% (b) | 29,921,812 | | 29,921,812 |
Fidelity Securities Lending Cash Central Fund, 5.39% (b)(c) | 63,626,700 | | 63,626,700 |
TOTAL MONEY MARKET FUNDS (Cost $93,548,512) | 93,548,512 |
TOTAL INVESTMENT PORTFOLIO - 104.7% (Cost $1,336,870,322) | | 1,470,884,605 |
NET OTHER ASSETS - (4.7)% | | (66,376,569) |
NET ASSETS - 100% | $ 1,404,508,036 |
Legend |
(a) Non-income producing |
(b) Affiliated fund that is available only to investment companies and other accounts managed by Fidelity Investments. The rate quoted is the annualized seven-day yield of the fund at period end. A complete unaudited listing of the fund's holdings as of its most recent quarter end is available upon request. |
(c) Investment made with cash collateral received from securities on loan. |
(d) Security or a portion of the security is on loan at period end. |
Affiliated Central Funds |
Information regarding fiscal year to date income earned by the Fund from investments in Fidelity Central Funds is as follows: |
Fund | Income earned |
Fidelity Cash Central Fund | $ 2,332,676 |
Fidelity Securities Lending Cash Central Fund | 574,407 |
Total | $ 2,907,083 |
See accompanying notes which are an integral part of the financial statements.
Annual Report
Financial Statements
Statement of Assets and Liabilities
| July 31, 2007 |
Assets | | |
Investment in securities, at value (including securities loaned of $61,245,338) - See accompanying schedule: Unaffiliated issuers (cost $1,243,321,810) | $ 1,377,336,093 | |
Fidelity Central Funds (cost $93,548,512) | 93,548,512 | |
Total Investments (cost $1,336,870,322) | | $ 1,470,884,605 |
Receivable for investments sold | | 4,800,185 |
Receivable for fund shares sold | | 2,028,784 |
Dividends receivable | | 420,385 |
Distributions receivable from Fidelity Central Funds | | 215,151 |
Prepaid expenses | | 2,044 |
Receivable from investment adviser for expense reductions | | 2,556 |
Other receivables | | 1,456 |
Total assets | | 1,478,355,166 |
| | |
Liabilities | | |
Payable for investments purchased | $ 5,969,420 | |
Payable for fund shares redeemed | 2,729,587 | |
Accrued management fee | 1,050,191 | |
Distribution fees payable | 77,896 | |
Other affiliated payables | 342,208 | |
Other payables and accrued expenses | 51,128 | |
Collateral on securities loaned, at value | 63,626,700 | |
Total liabilities | | 73,847,130 |
| | |
Net Assets | | $ 1,404,508,036 |
Net Assets consist of: | | |
Paid in capital | | $ 1,227,191,980 |
Accumulated undistributed net realized gain (loss) on investments and foreign currency transactions | | 43,301,773 |
Net unrealized appreciation (depreciation) on investments | | 134,014,283 |
Net Assets | | $ 1,404,508,036 |
See accompanying notes which are an integral part of the financial statements.
Annual Report
Statement of Assets and Liabilities - continued
| July 31, 2007 |
| | |
Calculation of Maximum Offering Price
Class A:
Net Asset Value and redemption price per share ($61,356,936 ÷ 4,278,520 shares) | | $ 14.34 |
| | |
Maximum offering price per share (100/94.25 of $14.34) | | $ 15.21 |
Class T:
Net Asset Value and redemption price per share ($51,518,120 ÷ 3,607,221 shares) | | $ 14.28 |
| | |
Maximum offering price per share (100/96.50 of $14.28) | | $ 14.80 |
Class B:
Net Asset Value and offering price per share ($12,075,406 ÷ 851,177 shares)A | | $ 14.19 |
| | |
Class C:
Net Asset Value and offering price per share ($34,155,119 ÷ 2,407,204 shares)A | | $ 14.19 |
| | |
Small Cap Value:
Net Asset Value, offering price and redemption price per share ($1,233,808,057 ÷ 85,510,937 shares) | | $ 14.43 |
| | |
Institutional Class:
Net Asset Value, offering price and redemption price per share ($11,594,398 ÷ 803,667 shares) | | $ 14.43 |
A Redemption price per share is equal to net asset value less any applicable contingent deferred sales charge.
See accompanying notes which are an integral part of the financial statements.
Annual Report
Financial Statements - continued
Statement of Operations
| Year ended July 31, 2007 |
Investment Income | | |
Dividends | | $ 9,751,207 |
Interest | | 1,960 |
Income from Fidelity Central Funds | | 2,907,083 |
Total income | | 12,660,250 |
| | |
Expenses | | |
Management fee
Basic fee | $ 9,391,047 | |
Performance adjustment | 1,453,969 | |
Transfer agent fees | 3,238,967 | |
Distribution fees | 826,786 | |
Accounting and security lending fees | 435,846 | |
Custodian fees and expenses | 39,260 | |
Independent trustees' compensation | 4,149 | |
Registration fees | 121,175 | |
Audit | 55,232 | |
Legal | 11,142 | |
Miscellaneous | 28,936 | |
Total expenses before reductions | 15,606,509 | |
Expense reductions | (124,894) | 15,481,615 |
Net investment income (loss) | | (2,821,365) |
Realized and Unrealized Gain (Loss) Net realized gain (loss) on: | | |
Investment securities: | | |
Unaffiliated issuers | 58,292,629 | |
Foreign currency transactions | 8,949 | |
Total net realized gain (loss) | | 58,301,578 |
Change in net unrealized appreciation (depreciation) on: Investment securities | 108,216,200 | |
Assets and liabilities in foreign currencies | 372 | |
Total change in net unrealized appreciation (depreciation) | | 108,216,572 |
Net gain (loss) | | 166,518,150 |
Net increase (decrease) in net assets resulting from operations | | $ 163,696,785 |
See accompanying notes which are an integral part of the financial statements.
Annual Report
Statement of Changes in Net Assets
| Year ended
July 31,
2007 | Year ended
July 31,
2006 |
Increase (Decrease) in Net Assets | | |
Operations | | |
Net investment income (loss) | $ (2,821,365) | $ 38,256 |
Net realized gain (loss) | 58,301,578 | 59,284,810 |
Change in net unrealized appreciation (depreciation) | 108,216,572 | (30,701,367) |
Net increase (decrease) in net assets resulting
from operations | 163,696,785 | 28,621,699 |
Distributions to shareholders from net investment income | - | (633,037) |
Distributions to shareholders from net realized gain | (55,419,267) | (20,371,695) |
Total distributions | (55,419,267) | (21,004,732) |
Share transactions - net increase (decrease) | 206,517,786 | 457,176,942 |
Redemption fees | 174,668 | 517,538 |
Total increase (decrease) in net assets | 314,969,972 | 465,311,447 |
| | |
Net Assets | | |
Beginning of period | 1,089,538,064 | 624,226,617 |
End of period | $ 1,404,508,036 | $ 1,089,538,064 |
See accompanying notes which are an integral part of the financial statements.
Annual Report
Financial Highlights - Class A
Years ended July 31, | 2007 | 2006 | 2005 H |
Selected Per-Share Data | | | |
Net asset value, beginning of period | $ 13.17 | $ 12.80 | $ 10.00 |
Income from Investment Operations | | | |
Net investment income (loss) E | (.06) | (.03) | (.04) |
Net realized and unrealized gain (loss) | 1.90 | .74 | 2.84 |
Total from investment operations | 1.84 | .71 | 2.80 |
Distributions from net investment income | - | - | (.01) |
Distributions from net realized gain | (.67) | (.35) | - |
Total distributions | (.67) | (.35) | (.01) |
Redemption fees added to paid in capital E | - J | .01 | .01 |
Net asset value, end of period | $ 14.34 | $ 13.17 | $ 12.80 |
Total Return B, C, D | 14.59% | 5.72% | 28.06% |
Ratios to Average Net Assets F, I | | | |
Expenses before reductions | 1.45% | 1.51% | 1.46% A |
Expenses net of fee waivers, if any | 1.40% | 1.40% | 1.44% A |
Expenses net of all reductions | 1.40% | 1.36% | 1.38% A |
Net investment income (loss) | (.44)% | (.24)% | (.46)% A |
Supplemental Data | | | |
Net assets, end of period (000 omitted) | $ 61,357 | $ 39,931 | $ 9,390 |
Portfolio turnover rate G | 67% | 93% | 60% A |
A Annualized
B Total returns for periods of less than one year are not annualized.
C Total returns would have been lower had certain expenses not been reduced during the periods shown.
D Total returns do not include the effect of the sales charges.
E Calculated based on average shares outstanding during the period.
F Fees and expenses of the underlying Fidelity Central Funds are not included in the Fund's expense ratio. The Fund indirectly bears its proportionate share of the expenses of any underlying Fidelity Central Funds.
G Amount does not include the portfolio activity of any underlying Fidelity Central Funds.
H For the period November 3, 2004 (commencement of operations) to July 31, 2005.
I Expense ratios reflect operating expenses of the class. Expenses before reductions do not reflect amounts reimbursed by the investment adviser or reductions from brokerage service arrangements or other expense offset arrangements and do not represent the amount paid by the class during periods when reimbursements or reductions occur. Expense ratios before reductions for start-up periods may not be representative of longer-term operating periods. Expenses net of fee waivers reflect expenses after reimbursement by the investment adviser but prior to reductions from brokerage service arrangements or other expense offset arrangements. Expenses net of all reductions represent the net expenses paid by the class.
J Amount represents less than $.01 per share.
See accompanying notes which are an integral part of the financial statements.
Annual Report
Financial Highlights - Class T
Years ended July 31, | 2007 | 2006 | 2005 H |
Selected Per-Share Data | | | |
Net asset value, beginning of period | $ 13.13 | $ 12.78 | $ 10.00 |
Income from Investment Operations | | | |
Net investment income (loss) E | (.10) | (.07) | (.06) |
Net realized and unrealized gain (loss) | 1.90 | .74 | 2.83 |
Total from investment operations | 1.80 | .67 | 2.77 |
Distributions from net realized gain | (.65) | (.33) | - |
Redemption fees added to paid in capital E | - J | .01 | .01 |
Net asset value, end of period | $ 14.28 | $ 13.13 | $ 12.78 |
Total Return B, C, D | 14.34% | 5.47% | 27.80% |
Ratios to Average Net Assets F, I | | | |
Expenses before reductions | 1.66% | 1.67% | 1.72% A |
Expenses net of fee waivers, if any | 1.65% | 1.65% | 1.68% A |
Expenses net of all reductions | 1.65% | 1.61% | 1.62% A |
Net investment income (loss) | (.69)% | (.49)% | (.70)% A |
Supplemental Data | | | |
Net assets, end of period (000 omitted) | $ 51,518 | $ 45,460 | $ 12,725 |
Portfolio turnover rate G | 67% | 93% | 60% A |
A Annualized
B Total returns for periods of less than one year are not annualized.
C Total returns would have been lower had certain expenses not been reduced during the periods shown.
D Total returns do not include the effect of the sales charges.
E Calculated based on average shares outstanding during the period.
F Fees and expenses of the underlying Fidelity Central Funds are not included in the Fund's expense ratio. The Fund indirectly bears its proportionate share of the expenses of any underlying Fidelity Central Funds.
G Amount does not include the portfolio activity of any underlying Fidelity Central Funds.
H For the period November 3, 2004 (commencement of operations) to July 31, 2005.
I Expense ratios reflect operating expenses of the class. Expenses before reductions do not reflect amounts reimbursed by the investment adviser or reductions from brokerage service arrangements or other expense offset arrangements and do not represent the amount paid by the class during periods when reimbursements or reductions occur. Expense ratios before reductions for start-up periods may not be representative of longer-term operating periods. Expenses net of fee waivers reflect expenses after reimbursement by the investment adviser but prior to reductions from brokerage service arrangements or other expense offset arrangements. Expenses net of all reductions represent the net expenses paid by the class.
J Amount represents less than $.01 per share.
See accompanying notes which are an integral part of the financial statements.
Annual Report
Financial Highlights - Class B
Years ended July 31, | 2007 | 2006 | 2005 H |
Selected Per-Share Data | | | |
Net asset value, beginning of period | $ 13.07 | $ 12.73 | $ 10.00 |
Income from Investment Operations | | | |
Net investment income (loss) E | (.17) | (.13) | (.10) |
Net realized and unrealized gain (loss) | 1.90 | .74 | 2.82 |
Total from investment operations | 1.73 | .61 | 2.72 |
Distributions from net realized gain | (.61) | (.28) | - |
Redemption fees added to paid in capital E | - J | .01 | .01 |
Net asset value, end of period | $ 14.19 | $ 13.07 | $ 12.73 |
Total Return B, C, D | 13.78% | 4.97% | 27.30% |
Ratios to Average Net Assets F, I | | | |
Expenses before reductions | 2.20% | 2.26% | 2.24% A |
Expenses net of fee waivers, if any | 2.15% | 2.15% | 2.19% A |
Expenses net of all reductions | 2.15% | 2.11% | 2.13% A |
Net investment income (loss) | (1.19)% | (.99)% | (1.21)% A |
Supplemental Data | | | |
Net assets, end of period (000 omitted) | $ 12,075 | $ 10,214 | $ 3,931 |
Portfolio turnover rate G | 67% | 93% | 60% A |
A Annualized
B Total returns for periods of less than one year are not annualized.
C Total returns would have been lower had certain expenses not been reduced during the periods shown.
D Total returns do not include the effect of the contingent deferred sales charge.
E Calculated based on average shares outstanding during the period.
F Fees and expenses of the underlying Fidelity Central Funds are not included in the Fund's expense ratio. The Fund indirectly bears its proportionate share of the expenses of any underlying Fidelity Central Funds.
G Amount does not include the portfolio activity of any underlying Fidelity Central Funds.
H For the period November 3, 2004 (commencement of operations) to July 31, 2005.
I Expense ratios reflect operating expenses of the class. Expenses before reductions do not reflect amounts reimbursed by the investment adviser or reductions from brokerage service arrangements or other expense offset arrangements and do not represent the amount paid by the class during periods when reimbursements or reductions occur. Expense ratios before reductions for start-up periods may not be representative of longer-term operating periods. Expenses net of fee waivers reflect expenses after reimbursement by the investment adviser but prior to reductions from brokerage service arrangements or other expense offset arrangements. Expenses net of all reductions represent the net expenses paid by the class.
J Amount represents less than $.01 per share.
See accompanying notes which are an integral part of the financial statements.
Annual Report
Financial Highlights - Class C
Years ended July 31, | 2007 | 2006 | 2005 H |
Selected Per-Share Data | | | |
Net asset value, beginning of period | $ 13.07 | $ 12.74 | $ 10.00 |
Income from Investment Operations | | | |
Net investment income (loss) E | (.17) | (.13) | (.10) |
Net realized and unrealized gain (loss) | 1.90 | .74 | 2.83 |
Total from investment operations | 1.73 | .61 | 2.73 |
Distributions from net realized gain | (.61) | (.29) | - |
Redemption fees added to paid in capital E | - J | .01 | .01 |
Net asset value, end of period | $ 14.19 | $ 13.07 | $ 12.74 |
Total Return B, C, D | 13.77% | 4.92% | 27.40% |
Ratios to Average Net Assets F, I | | | |
Expenses before reductions | 2.20% | 2.22% | 2.17% A |
Expenses net of fee waivers, if any | 2.15% | 2.15% | 2.17% A |
Expenses net of all reductions | 2.15% | 2.11% | 2.11% A |
Net investment income (loss) | (1.19)% | (.99)% | (1.19)% A |
Supplemental Data | | | |
Net assets, end of period (000 omitted) | $ 34,155 | $ 26,791 | $ 11,732 |
Portfolio turnover rate G | 67% | 93% | 60% A |
A Annualized
B Total returns for periods of less than one year are not annualized.
C Total returns would have been lower had certain expenses not been reduced during the periods shown.
D Total returns do not include the effect of the contingent deferred sales charge.
E Calculated based on average shares outstanding during the period.
F Fees and expenses of the underlying Fidelity Central Funds are not included in the Fund's expense ratio. The Fund indirectly bears its proportionate share of the expenses of any underlying Fidelity Central Funds.
G Amount does not include the portfolio activity of any underlying Fidelity Central Funds.
H For the period November 3, 2004 (commencement of operations) to July 31, 2005.
I Expense ratios reflect operating expenses of the class. Expenses before reductions do not reflect amounts reimbursed by the investment adviser or reductions from brokerage service arrangements or other expense offset arrangements and do not represent the amount paid by the class during periods when reimbursements or reductions occur. Expense ratios before reductions for start-up periods may not be representative of longer-term operating periods. Expenses net of fee waivers reflect expenses after reimbursement by the investment adviser but prior to reductions from brokerage service arrangements or other expense offset arrangements. Expenses net of all reductions represent the net expenses paid by the class.
J Amount represents less than $.01 per share.
See accompanying notes which are an integral part of the financial statements.
Annual Report
Financial Highlights - Small Cap Value
Years ended July 31, | 2007 | 2006 | 2005 G |
Selected Per-Share Data | | | |
Net asset value, beginning of period | $ 13.22 | $ 12.83 | $ 10.00 |
Income from Investment Operations | | | |
Net investment income (loss) D | (.02) | .01 | (.01) |
Net realized and unrealized gain (loss) | 1.91 | .74 | 2.84 |
Total from investment operations | 1.89 | .75 | 2.83 |
Distributions from net investment income | - | (.01) | (.01) |
Distributions from net realized gain | (.68) | (.36) | - |
Total distributions | (.68) | (.37) | (.01) |
Redemption fees added to paid in capital D | - I | .01 | .01 |
Net asset value, end of period | $ 14.43 | $ 13.22 | $ 12.83 |
Total Return B, C | 14.96% | 6.07% | 28.36% |
Ratios to Average Net Assets E, H | | | |
Expenses before reductions | 1.11% | 1.09% | 1.05% A |
Expenses net of fee waivers, if any | 1.11% | 1.09% | 1.05% A |
Expenses net of all reductions | 1.11% | 1.06% | .99% A |
Net investment income (loss) | (.15)% | .06% | (.08)% A |
Supplemental Data | | | |
Net assets, end of period (000 omitted) | $ 1,233,808 | $ 957,720 | $ 582,689 |
Portfolio turnover rate F | 67% | 93% | 60% A |
A Annualized
B Total returns for periods of less than one year are not annualized.
C Total returns would have been lower had certain expenses not been reduced during the periods shown.
D Calculated based on average shares outstanding during the period.
E Fees and expenses of the underlying Fidelity Central Funds are not included in the Fund's expense ratio. The Fund indirectly bears its proportionate share of the expenses of any underlying Fidelity Central Funds.
F Amount does not include the portfolio activity of any underlying Fidelity Central Funds.
G For the period November 3, 2004 (commencement of operations) to July 31, 2005.
H Expense ratios reflect operating expenses of the class. Expenses before reductions do not reflect amounts reimbursed by the investment adviser or reductions from brokerage service arrangements or other expense offset arrangements and do not represent the amount paid by the class during periods when reimbursements or reductions occur. Expense ratios before reductions for start-up periods may not be representative of longer-term operating periods. Expenses net of fee waivers reflect expenses after reimbursement by the investment adviser but prior to reductions from brokerage service arrangements or other expense offset arrangements. Expenses net of all reductions represent the net expenses paid by the class.
I Amount represents less than $.01 per share.
See accompanying notes which are an integral part of the financial statements.
Annual Report
Financial Highlights - Institutional Class
Years ended July 31, | 2007 | 2006 | 2005 G |
Selected Per-Share Data | | | |
Net asset value, beginning of period | $ 13.22 | $ 12.83 | $ 10.00 |
Income from Investment Operations | | | |
Net investment income (loss) D | (.02) | .01 | (.01) |
Net realized and unrealized gain (loss) | 1.91 | .74 | 2.84 |
Total from investment operations | 1.89 | .75 | 2.83 |
Distributions from net investment income | - | (.01) | (.01) |
Distributions from net realized gain | (.68) | (.36) | - |
Total distributions | (.68) | (.37) | (.01) |
Redemption fees added to paid in capital D | - I | .01 | .01 |
Net asset value, end of period | $ 14.43 | $ 13.22 | $ 12.83 |
Total Return B, C | 14.99% | 6.08% | 28.36% |
Ratios to Average Net Assets E, H | | | |
Expenses before reductions | 1.10% | 1.08% | 1.07% A |
Expenses net of fee waivers, if any | 1.10% | 1.08% | 1.07% A |
Expenses net of all reductions | 1.10% | 1.05% | 1.01% A |
Net investment income (loss) | (.13)% | .08% | (.10)% A |
Supplemental Data | | | |
Net assets, end of period (000 omitted) | $ 11,594 | $ 9,422 | $ 3,761 |
Portfolio turnover rate F | 67% | 93% | 60% A |
A Annualized
B Total returns for periods of less than one year are not annualized.
C Total returns would have been lower had certain expenses not been reduced during the periods shown.
D Calculated based on average shares outstanding during the period.
E Fees and expenses of the underlying Fidelity Central Funds are not included in the Fund's expense ratio. The Fund indirectly bears its proportionate share of the expenses of any underlying Fidelity Central Funds.
F Amount does not include the portfolio activity of any underlying Fidelity Central Funds.
G For the period November 3, 2004 (commencement of operations) to July 31, 2005..
H Expense ratios reflect operating expenses of the class. Expenses before reductions do not reflect amounts reimbursed by the investment adviser or reductions from brokerage service arrangements or other expense offset arrangements and do not represent the amount paid by the class during periods when reimbursements or reductions occur. Expense ratios before reductions for start-up periods may not be representative of longer-term operating periods. Expenses net of fee waivers reflect expenses after reimbursement by the investment adviser but prior to reductions from brokerage service arrangements or other expense offset arrangements. Expenses net of all reductions represent the net expenses paid by the class.
I Amount represents less than $.01 per share.
See accompanying notes which are an integral part of the financial statements.
Annual Report
Notes to Financial Statements
For the period ended July 31, 2007
1. Organization.
Fidelity Small Cap Value Fund (the Fund) is a non-diversified fund of Fidelity Securities Fund (the trust) and is authorized to issue an unlimited number of shares. The trust is registered under the Investment Company Act of 1940, as amended (the 1940 Act), as an open-end management investment company organized as a Massachusetts business trust. The Fund offers Class A, Class T, Class B, Class C, Small Cap Value and Institutional Class shares, each of which has equal rights as to assets and voting privileges. Each class has exclusive voting rights with respect to matters that affect that class. Class B shares will automatically convert to Class A shares after a holding period of seven years from the initial date of purchase. Investment income, realized and unrealized capital gains and losses, the common expenses of the Fund, and certain fund-level expense reductions, if any, are allocated on a pro rata basis to each class based on the relative net assets of each class to the total net assets of the Fund. Each class differs with respect to transfer agent and distribution and service plan fees incurred. Certain expense reductions also differ by class.
2. Investments in Fidelity Central Funds.
The Fund may invest in Fidelity Central Funds which are open-end investment companies available only to other investment companies and accounts managed by Fidelity Management & Research Company (FMR) and its affiliates. The Fund's Schedule of Investments lists each of the Fidelity Central Funds as an investment of the Fund, but does not include the underlying holdings of each Fidelity Central Fund. As an Investing Fund, the Fund indirectly bears its proportionate share of the expenses of the underlying Fidelity Central Funds.
The Money Market Central Funds seek preservation of capital and current income and are managed by Fidelity Investments Money Management, Inc. (FIMM), an affiliate of FMR.
A complete list of holdings for each Fidelity Central Fund is available upon request or at the SEC's website at www.sec.gov. In addition, the financial statements of the Fidelity Central Funds, which are not covered by the Fund's Report of Independent Registered Public Accounting Firm, are available on the SEC's web site, or upon request.
3. Significant Accounting Policies.
The financial statements have been prepared in conformity with accounting principles generally accepted in the United States of America, which require management to make certain estimates and assumptions at the date of the financial statements. The following summarizes the significant accounting policies of the Fund:
Annual Report
3. Significant Accounting Policies - continued
Security Valuation. Investments are valued and net asset value (NAV) per share is calculated (NAV calculation) as of the close of business of the New York Stock Exchange (NYSE), normally 4:00 p.m. Eastern time. Wherever possible, the Fund uses independent pricing services approved by the Board of Trustees to value its investments.
Equity securities, including restricted securities, for which market quotations are readily available, are valued at the last reported sale price or official closing price as reported by an independent pricing service on the primary market or exchange on which they are traded. In the event there were no sales during the day or closing prices are not available, securities are valued at the last quoted bid price. Investments in open-end mutual funds, including the Fidelity Central Funds, are valued at their closing net asset value each business day. Short-term securities with remaining maturities of sixty days or less for which quotations are not readily available are valued at amortized cost, which approximates value.
When current market prices or quotations are not readily available or do not accurately reflect fair value, valuations may be determined in accordance with procedures adopted by the Board of Trustees. For example, when developments occur between the close of a market and the close of the NYSE that may materially affect the value of some or all of the securities, or when trading in a security is halted, those securities may be fair valued. Factors used in the determination of fair value may include monitoring news to identify significant market or security specific events such as changes in the value of U.S. securities markets, reviewing developments in foreign markets and evaluating the performance of ADRs, futures contracts and exchange-traded funds. Because the Fund's utilization of fair value pricing depends on market activity, the frequency with which fair value pricing is used cannot be predicted and may be utilized to a significant extent. The value of securities used for NAV calculation under fair value pricing may differ from published prices for the same securities.
Foreign Currency. The Fund uses foreign currency contracts to facilitate transactions in foreign-denominated securities. Losses from these transactions may arise from changes in the value of the foreign currency or if the counterparties do not perform under the contracts' terms.
Foreign-denominated assets, including investment securities, and liabilities are translated into U.S. dollars at the exchange rate at period end. Purchases and sales of investment securities, income and dividends received and expenses denominated in foreign currencies are translated into U.S. dollars at the exchange rate in effect on the transaction date.
Annual Report
Notes to Financial Statements - continued
3. Significant Accounting Policies - continued
Foreign Currency - continued
The effects of exchange rate fluctuations on investments are included with the net realized and unrealized gain (loss) on investment securities. Other foreign currency transactions resulting in realized and unrealized gain (loss) are disclosed separately.
Investment Transactions and Income. For financial reporting purposes, the Fund's investment holdings and NAV include trades executed through the end of the last business day of the period. The NAV for processing shareholder transactions includes trades executed through the end of the prior business day. Gains and losses on securities sold are determined on the basis of identified cost. Dividend income is recorded on the ex-dividend date, except for certain dividends from foreign securities where the ex-dividend date may have passed, which are recorded as soon as the Fund is informed of the ex-dividend date. Non-cash dividends included in dividend income, if any, are recorded at the fair market value of the securities received. Distributions received on securities that represent a return of capital or capital gain are recorded as a reduction of cost of investments and/or as a realized gain. The Fund estimates the components of distributions received that may be considered return of capital distributions or capital gain distributions. Interest income and distributions from the Fidelity Central Funds are accrued as earned. Interest income includes coupon interest and amortization of premium and accretion of discount on debt securities. Investment income is recorded net of foreign taxes withheld where recovery of such taxes is uncertain.
Expenses. Most expenses of the trust can be directly attributed to a fund. Expenses which cannot be directly attributed are apportioned among each Fund in the trust. Expense estimates are accrued in the period to which they relate and adjustments are made when actual amounts are known.
Income Tax Information and Distributions to Shareholders. Each year, the Fund intends to qualify as a regulated investment company by distributing all of its taxable income and realized gains under Subchapter M of the Internal Revenue Code. As a result, no provision for income taxes is required in the accompanying financial statements. Foreign taxes are provided for based on the Fund's understanding of the tax rules and rates that exist in the foreign markets in which it invests.
Distributions are recorded on the ex-dividend date. Income dividends and capital gain distributions are declared separately for each class. Income and capital gain distributions are determined in accordance with income tax regulations, which may differ from generally accepted accounting principles. In addition, the Fund will claim a portion of the payment made to redeeming shareholders as a distribution for income tax purposes.
Annual Report
3. Significant Accounting Policies - continued
Income Tax Information and Distributions to Shareholders - continued
Capital accounts within the financial statements are adjusted for permanent book-tax differences. These adjustments have no impact on net assets or the results of operations. Temporary book-tax differences will reverse in a subsequent period.
Book-tax differences are primarily due to foreign currency transactions and losses deferred due to wash sales.
The tax-basis components of distributable earnings and the federal tax cost as of period end were as follows:
Unrealized appreciation | $ 221,224,167 | |
Unrealized depreciation | (87,439,775) | |
Net unrealized appreciation (depreciation) | 133,784,392 | |
Undistributed ordinary income | 1,429,895 | |
Undistributed long-term capital gain | 35,852,159 | |
| | |
Cost for federal income tax purposes | $ 1,337,100,213 | |
The tax character of distributions paid was as follows:
| July 31, 2007 | July 31, 2006 |
Ordinary Income | $ 15,936,394 | $ 21,004,732 |
Long-term Capital Gains | 39,482,873 | - |
Total | $ 55,419,267 | $ 21,004,732 |
Short-Term Trading (Redemption) Fees. Shares held in the Fund less than 90 days are subject to a redemption fee equal to 1.50% of the proceeds of the redeemed shares. All redemption fees, including any estimated redemption fees paid by FMR, are retained by the Fund and accounted for as an addition to paid in capital.
New Accounting Pronouncements. In July 2006, Financial Accounting Standards Board Interpretation No. 48, Accounting for Uncertainty in Income Taxes - an interpretation of FASB Statement 109 (FIN 48), was issued and is effective on the last business day of the semiannual reporting period for fiscal years beginning after December 15, 2006. FIN 48 sets forth a threshold for financial statement recognition, measurement and disclosure of a tax position taken or expected to be taken on a tax return. Management has concluded that the adoption of FIN 48 will not result in a material impact on the Fund's net assets, results of operations and financial statement disclosures.
In addition, in September 2006, Statement of Financial Accounting Standards No. 157, Fair Value Measurements (SFAS 157), was issued and is effective for fiscal years beginning after November 15, 2007. SFAS 157 defines fair value, establishes a framework for
Annual Report
Notes to Financial Statements - continued
3. Significant Accounting Policies - continued
New Accounting Pronouncements - continued
measuring fair value and expands disclosures about fair value measurements. Management is currently evaluating the impact the adoption of SFAS 157 will have on the Fund's financial statement disclosures.
4. Operating Policies.
Repurchase Agreements. FMR has received an Exemptive Order from the Securities and Exchange Commission (the SEC) which permits the Fund and other affiliated entities of FMR to transfer uninvested cash balances into joint trading accounts which are then invested in repurchase agreements. The Fund may also invest directly with institutions in repurchase agreements. Repurchase agreements are collateralized by government or non-government securities. Upon settlement date, collateral is held in segregated accounts with custodian banks and may be obtained in the event of a default of the counterparty. The Fund monitors, on a daily basis, the value of the collateral to ensure it is at least equal to the principal amount of the repurchase agreement (including accrued interest). In the event of a default by the counterparty, realization of the collateral proceeds could be delayed, during which time the value of the collateral may decline.
5. Purchases and Sales of Investments.
Purchases and sales of securities, other than short-term securities, aggregated $1,035,796,031 and $851,598,507, respectively.
6. Fees and Other Transactions with Affiliates.
Management Fee. FMR and its affiliates provide the Fund with investment management related services for which the Fund pays a monthly management fee. The management fee is the sum of an individual fund fee rate that is based on an annual rate of .45% of the Fund's average net assets and a group fee rate that averaged ..26% during the period. The group fee rate is based upon the average net assets of all the mutual funds advised by FMR. The group fee rate decreases as assets under management increase and increases as assets under management decrease. In addition, the management fee is subject to a performance adjustment (up to a maximum of ±.20% of the Fund's average net assets over a 36 month performance period). The upward or downward adjustment to the management fee is based on the relative investment performance of the retail class of the Fund, Small Cap Value as compared to an appropriate benchmark index. For the period, the total annual management fee rate, including the performance adjustment, was .82% of the Fund's average net assets.
Annual Report
6. Fees and Other Transactions with Affiliates - continued
Distribution and Service Plan. In accordance with Rule 12b-1 of the 1940 Act, the Fund has adopted separate Distribution and Service Plans for each class of shares. Certain classes pay Fidelity Distributors Corporation (FDC), an affiliate of FMR, separate Distribution and Service Fees, each of which is based on an annual percentage of each class' average net assets. In addition, FDC may pay financial intermediaries for selling shares of the Fund and providing shareholder support services. For the period, the Distribution and Service Fee rates and the total amounts paid to and retained by FDC were as follows:
| Distribution
Fee | Service
Fee | Paid to
FDC | Retained
by FDC |
Class A | 0% | .25% | $ 132,888 | $ 15,618 |
Class T | .25% | .25% | 255,228 | 3,596 |
Class B | .75% | .25% | 119,704 | 90,112 |
Class C | .75% | .25% | 318,966 | 118,809 |
| | | $ 826,786 | $ 228,135 |
Sales Load. FDC receives a front-end sales charge of up to 5.75% for selling Class A shares, and 3.50% for selling Class T shares, some of which is paid to financial intermediaries for selling shares of the Fund. FDC receives the proceeds of contingent deferred sales charges levied on Class A, Class T, Class B, and Class C redemptions. These charges depend on the holding period. The deferred sales charges range from 5% to 1% for Class B, 1% for Class C, 1.00% to .50% for certain purchases of Class A shares and .25% for certain purchases of Class T shares.
For the period, sales charge amounts retained by FDC were as follows:
| Retained
by FDC |
Class A | $ 78,420 |
Class T | 20,737 |
Class B* | 20,164 |
Class C* | 6,183 |
| $ 125,504 |
* When Class B and Class C shares are initially sold, FDC pays commissions from its own resources to financial intermediaries through which the sales are made.
Transfer Agent Fees. Fidelity Investments Institutional Operations Company, Inc. (FIIOC), an affiliate of FMR, is the transfer, dividend disbursing and shareholder servicing agent for each class of the Fund, except for Small Cap Value. Fidelity Service Company, Inc. (FSC), an affiliate of FMR, is the transfer agent for Small Cap Value shares. FIIOC and FSC receive account fees and asset-based fees that vary according to
Annual Report
Notes to Financial Statements - continued
6. Fees and Other Transactions with Affiliates - continued
Transfer Agent Fees - continued
the account size and type of account of the shareholders of the respective classes of the Fund. FIIOC and FSC pay for typesetting, printing and mailing of shareholder reports, except proxy statements. For the period, the total transfer agent fees paid by each class to FIIOC or FSC, were as follows:
| Amount | % of
Average
Net Assets |
Class A | $ 169,502 | .32 |
Class T | 142,472 | .28 |
Class B | 38,602 | .32 |
Class C | 102,201 | .32 |
Small Cap Value | 2,761,176 | .24 |
Institutional Class | 25,014 | .22 |
| $ 3,238,967 | |
Accounting and Security Lending Fees. FSC maintains the Fund's accounting records. The accounting fee is based on the level of average net assets for the month. Under a separate contract, FSC administers the security lending program. The security lending fee is based on the number and duration of lending transactions.
Brokerage Commissions. The Fund placed a portion of its portfolio transactions with brokerage firms which are affiliates of the investment adviser. The commissions paid to these affiliated firms were $15,149 for the period.
7. Committed Line of Credit.
The Fund participates with other funds managed by FMR in a $4.2 billion credit facility (the "line of credit") to be utilized for temporary or emergency purposes to fund shareholder redemptions or for other short-term liquidity purposes. The Fund has agreed to pay commitment fees on its pro rata portion of the line of credit, which amounted to $2,273 and is reflected in Miscellaneous Expense on the Statement of Operations. During the period, there were no borrowings on this line of credit.
8. Security Lending.
The Fund lends portfolio securities from time to time in order to earn additional income. On the settlement date of the loan, the Fund receives collateral (in the form of U.S. Treasury obligations, letters of credit and/or cash) against the loaned securities and maintains collateral in an amount not less than 100% of the market value of the loaned securities during the period of the loan. The market value of the loaned securities is determined at the close of business of the Fund and any additional required collateral is
Annual Report
8. Security Lending - continued
delivered to the Fund on the next business day. If the borrower defaults on its obligation to return the securities loaned because of insolvency or other reasons, a fund could experience delays and costs in recovering the securities loaned or in gaining access to the collateral. Any cash collateral received is invested in the Fidelity Securities Lending Cash Central Fund. The value of loaned securities and cash collateral at period end are disclosed on the Fund's Statement of Assets and Liabilities. Security lending income represents the income earned on investing cash collateral, less fees and expenses associated with the loan, plus any premium payments that may be received on the loan of certain types of securities. Security lending income is presented in the Statement of Operations as a component of income from Fidelity Central Funds Net income from lending portfolio securities during the period amounted to $574,407.
9. Expense Reductions.
FMR voluntarily agreed to reimburse each class to the extent annual operating expenses exceeded certain levels of average net assets as noted in the table below. Some expenses, for example interest expense, including commitment fees, are excluded from this reimbursement.
The following classes were in reimbursement during the period:
| Expense
Limitations | Reimbursement
from adviser |
| | |
Class A | 1.40% | $ 25,098 |
Class T | 1.65% | 3,109 |
Class B | 2.15% | 6,125 |
Class C | 2.15% | 15,677 |
| | $ 50,009 |
Many of the brokers with whom FMR places trades on behalf of the Fund provided services to the Fund in addition to trade execution. These services included payments of certain expenses on behalf of the Fund totaling $15,697 for the period. In addition, through arrangements with the Fund's custodian and each class' transfer agent, credits realized as a result of uninvested cash balances were used to reduce the Fund's expenses.
Annual Report
Notes to Financial Statements - continued
9. Expense Reductions - continued
During the period, these credits reduced the Fund's custody expenses by $799. During the period, credits reduced each class' transfer agent expense as noted in the table below.
| Transfer Agent
expense reduction | |
Class A | $ 472 | |
Small Cap Value | 55,667 | |
Institutional Class | 27 | |
| $ 56,166 | |
10. Other.
The Fund's organizational documents provide former and current trustees and officers with a limited indemnification against liabilities arising in connection with the performance of their duties to the Fund. In the normal course of business, the Fund may also enter into contracts that provide general indemnifications. The Fund's maximum exposure under these arrangements is unknown as this would be dependent on future claims that may be made against the Fund. The risk of material loss from such claims is considered remote.
In September 2006, FIIOC, a transfer agent of the Fund, notified the Fund that the Fund's books and records did not reflect a conversion of certain Class B to Class A shares upon their conversion date. In March 2007, FIIOC converted the relevant Class B shares to Class A shares and recorded the conversion in the books and records of the Fund which did not result in a material impact to the Fund's reported net assets or results of operations in the accompanying financial statements. FIIOC has reimbursed the Fund for related audit and legal expenses and, beginning in June 2007, remediated affected shareholders.
11. Distributions to Shareholders.
Distributions to shareholders of each class were as follows:
Years ended July 31, | 2007 | 2006 |
From net investment income | | |
Small Cap Value | - | 627,853 |
Institutional Class | - | 5,184 |
Total | $ - | $ 633,037 |
Annual Report
11. Distributions to Shareholders - continued
Distributions to shareholders of each class were as follows - continued
Years ended July 31, | 2007 | 2006 |
From net realized gain | | |
Class A | $ 2,137,128 | $ 349,740 |
Class T | 2,317,701 | 411,098 |
Class B | 493,632 | 108,502 |
Class C | 1,276,323 | 314,711 |
Small Cap Value | 48,691,674 | 19,037,825 |
Institutional Class | 502,809 | 149,819 |
Total | $ 55,419,267 | $ 20,371,695 |
12. Share Transactions.
Transactions for each class of shares were as follows:
| Shares | Dollars |
Years ended July 31, | 2007 | 2006 | 2007 | 2006 |
Class A | | | | |
Shares sold | 2,083,427 | 2,792,696 | $ 29,477,855 | $ 37,292,766 |
Reinvestment of distributions | 153,067 | 23,154 | 1,967,811 | 292,886 |
Shares redeemed | (990,255) | (517,416) | (13,986,913) | (6,894,256) |
Net increase (decrease) | 1,246,239 | 2,298,434 | $ 17,458,753 | $ 30,691,396 |
Class T | | | | |
Shares sold | 1,416,878 | 2,906,186 | $ 19,764,686 | $ 38,920,414 |
Reinvestment of distributions | 158,416 | 20,934 | 2,031,495 | 264,080 |
Shares redeemed | (1,429,554) | (461,271) | (20,059,646) | (6,059,837) |
Net increase (decrease) | 145,740 | 2,465,849 | $ 1,736,535 | $ 33,124,657 |
Class B | | | | |
Shares sold | 297,938 | 646,292 | $ 4,153,087 | $ 8,494,362 |
Reinvestment of distributions | 34,686 | 7,808 | 444,445 | 98,271 |
Shares redeemed | (263,033) | (181,273) | (3,714,165) | (2,424,583) |
Net increase (decrease) | 69,591 | 472,827 | $ 883,367 | $ 6,168,050 |
Class C | | | | |
Shares sold | 834,910 | 1,647,798 | $ 11,698,988 | $ 21,781,876 |
Reinvestment of distributions | 84,926 | 23,044 | 1,089,287 | 289,929 |
Shares redeemed | (562,438) | (542,172) | (7,834,552) | (7,009,701) |
Net increase (decrease) | 357,398 | 1,128,670 | $ 4,953,723 | $ 15,062,104 |
Annual Report
Notes to Financial Statements - continued
12. Share Transactions - continued
Transactions for each class of shares were as follows - continued
| Shares | Dollars |
Years ended July 31, | 2007 | 2006 | 2007 | 2006 |
Small Cap Value | | | | |
Shares sold | 42,235,359 | 53,704,430 | $ 595,504,607 | $ 714,692,056 |
Reinvestment of distributions | 3,617,365 | 1,502,190 | 46,609,140 | 19,027,647 |
Shares redeemed | (32,779,622) | (28,179,009) | (461,808,869) | (367,110,557) |
Net increase (decrease) | 13,073,102 | 27,027,611 | $ 180,304,878 | $ 366,609,146 |
Institutional Class | | | | |
Shares sold | 309,983 | 585,637 | $ 4,413,286 | $ 7,784,992 |
Reinvestment of distributions | 23,286 | 4,421 | 300,279 | 56,037 |
Shares redeemed | (242,217) | (170,544) | (3,533,035) | (2,319,440) |
Net increase (decrease) | 91,052 | 419,514 | $ 1,180,530 | $ 5,521,589 |
Annual Report
Report of Independent Registered Public Accounting Firm
To the Trustees of Fidelity Securities Fund and the Shareholders of Fidelity Small Cap Value Fund:
In our opinion, the accompanying statement of assets and liabilities, including the schedule of investments, and the related statements of operations and of changes in net assets and the financial highlights present fairly, in all material respects, the financial position of Fidelity Small Cap Value Fund (a fund of Fidelity Securities Fund) at July 31, 2007, the results of its operations for the year then ended, the changes in its net assets for each of the two years in the period then ended and the financial highlights for each of the periods indicated, in conformity with accounting principles generally accepted in the United States of America. These financial statements and financial highlights (hereafter referred to as "financial statements") are the responsibility of the Fidelity Small Cap Value Fund's management. Our responsibility is to express an opinion on these financial statements based on our audits. We conducted our audits of these financial statements in accordance with the standards of the Public Company Accounting Oversight Board (United States). Those standards require that we plan and perform the audit to obtain reasonable assurance about whether the financial statements are free of material misstatement. An audit includes examining, on a test basis, evidence supporting the amounts and disclosures in the financial statements, assessing the accounting principles used and significant estimates made by management, and evaluating the overall financial statement presentation. We believe that our audits, which included confirmation of securities at July 31, 2007 by correspondence with the custodian and brokers, provide a reasonable basis for our opinion.
/s/ PricewaterhouseCoopers LLP
PricewaterhouseCoopers LLP
Boston, Massachusetts
September 18, 2007
Annual Report
Trustees and Officers
The Trustees, Members of the Advisory Board, and executive officers of the trust and fund, as applicable, are listed below. The Board of Trustees governs the fund and is responsible for protecting the interests of shareholders. The Trustees are experienced executives who meet periodically throughout the year to oversee the fund's activities, review contractual arrangements with companies that provide services to the fund, and review the fund's performance. Except for James C. Curvey, each of the Trustees oversees 353 funds advised by FMR or an affiliate. Mr. Curvey oversees 317 funds advised by FMR or an affiliate.
The Trustees hold office without limit in time except that (a) any Trustee may resign; (b) any Trustee may be removed by written instrument, signed by at least two-thirds of the number of Trustees prior to such removal; (c) any Trustee who requests to be retired or who has become incapacitated by illness or injury may be retired by written instrument signed by a majority of the other Trustees; and (d) any Trustee may be removed at any special meeting of shareholders by a two-thirds vote of the outstanding voting securities of the trust. Each Trustee who is not an interested person (as defined in the 1940 Act) (Independent Trustee), shall retire not later than the last day of the calendar year in which his or her 72nd birthday occurs. The Independent Trustees may waive this mandatory retirement age policy with respect to individual Trustees. The executive officers and Advisory Board Members hold office without limit in time, except that any officer and Advisory Board Member may resign or may be removed by a vote of a majority of the Trustees at any regular meeting or any special meeting of the Trustees. Except as indicated, each individual has held the office shown or other offices in the same company for the past five years.
The fund's Statement of Additional Information (SAI) includes more information about the Trustees. To request a free copy, call Fidelity at 1-800-544-8544.
Interested Trustees*:
Correspondence intended for each Trustee who is an interested person may be sent to Fidelity Investments, 82 Devonshire Street, Boston, Massachusetts 02109.
Name, Age; Principal Occupation |
Edward C. Johnson 3d (77) |
| Year of Election or Appointment: 1984 Mr. Johnson is Chairman of the Board of Trustees. Mr. Johnson serves as President (2006-present), Chief Executive Officer, Chairman, and a Director of FMR Corp.; Chairman and a Director of FMR; Chairman and a Director of Fidelity Research & Analysis Company (FRAC); Chairman and a Director of Fidelity Investments Money Management, Inc.; and Chairman (2001-present) and a Director of FMR Co., Inc. In addition, Mr. Johnson serves as Chairman and Director of Fidelity International Limited (FIL). |
James C. Curvey (72) |
| Year of Election or Appointment: 2007 Mr. Curvey also serves as Trustee (2007-present) or Member of the Advisory Board (2007-present) of other investment companies advised by FMR. Mr. Curvey is Vice Chairman (2006-present) and Director of FMR Corp. Mr. Curvey joined Fidelity in 1982 and served in numerous senior management positions, including President and Chief Operating Officer of FMR Corp. (1997-2000) and President of Fidelity Strategic Investments (2000-2002). In addition, he serves as a member of the Board of Directors of Geerlings & Wade, Inc. (wine distribution). |
* Trustees have been determined to be "Interested Trustees" by virtue of, among other things, their affiliation with the trust or various entities under common control with FMR.
Independent Trustees:
Correspondence intended for each Independent Trustee (that is, the Trustees other than the Interested Trustees) may be sent to Fidelity Investments, P.O. Box 55235, Boston, Massachusetts 02205-5235.
Name, Age; Principal Occupation |
Dennis J. Dirks (59) |
| Year of Election or Appointment: 2005 Prior to his retirement in May 2003, Mr. Dirks was Chief Operating Officer and a member of the Board of The Depository Trust & Clearing Corporation (DTCC) (1999-2003). He also served as President, Chief Operating Officer, and Board member of The Depository Trust Company (DTC) (1999-2003) and President and Board member of the National Securities Clearing Corporation (NSCC) (1999-2003). In addition, Mr. Dirks served as Chief Executive Officer and Board member of the Government Securities Clearing Corporation (2001-2003) and Chief Executive Officer and Board member of the Mortgage-Backed Securities Clearing Corporation (2001-2003). Mr. Dirks also serves as a Trustee and a member of the Finance Committee of Manhattan College (2005-present) and a Trustee and a member of the Finance Committee of AHRC of Nassau County (2006-present). |
Albert R. Gamper, Jr. (65) |
| Year of Election or Appointment: 2006 Prior to his retirement in December 2004, Mr. Gamper served as Chairman of the Board of CIT Group Inc. (commercial finance). During his tenure with CIT Group Inc. Mr. Gamper served in numerous senior management positions, including Chairman (1987-1989; 1999-2001; 2002-2004), Chief Executive Officer (1987-2004), and President (1989-2002). He currently serves as a member of the Board of Directors of Public Service Enterprise Group (utilities, 2001-present), Chairman of the Board of Governors, Rutgers University (2004-present), and Chairman of the Board of Saint Barnabas Health Care System. |
George H. Heilmeier (71) |
| Year of Election or Appointment: 2004 Dr. Heilmeier is Chairman Emeritus of Telcordia Technologies (communication software and systems), where prior to his retirement, he served as company Chairman and Chief Executive Officer. He currently serves on the Boards of Directors of The Mitre Corporation (systems engineering and information technology support for the government), and HRL Laboratories (private research and development, 2004-present). He is Chairman of the General Motors Science & Technology Advisory Board and a Life Fellow of the Institute of Electrical and Electronics Engineers (IEEE). Dr. Heilmeier is a member of the Defense Science Board and the National Security Agency Advisory Board. He is also a member of the National Academy of Engineering, the American Academy of Arts and Sciences, and the Board of Overseers of the School of Engineering and Applied Science of the University of Pennsylvania. Previously, Dr. Heilmeier served as a Director of TRW Inc. (automotive, space, defense, and information technology, 1992-2002), Compaq (1994-2002), Automatic Data Processing, Inc. (ADP) (technology-based business outsourcing, 1995-2002), INET Technologies Inc. (telecommunications network surveillance, 2001-2004), and Teletech Holdings (customer management services). He is the recipient of the 2005 Kyoto Prize in Advanced Technology for his invention of the liquid crystal display, and a member of the Consumer Electronics Hall of Fame. |
James H. Keyes (66) |
| Year of Election or Appointment: 2007 Prior to his retirement in 2003, Mr. Keyes was Chairman, President, and Chief Executive Officer of Johnson Controls, Inc. (automotive supplier, 1993-2003). He currently serves as a member of the boards of LSI Logic Corporation (semiconductor technologies), Navistar International Corporation (manufacture and sale of trucks, buses, and diesel engines, 2002-present), and Pitney Bowes, Inc. (integrated mail, messaging, and document management solutions). |
Marie L. Knowles (60) |
| Year of Election or Appointment: 2001 Prior to Ms. Knowles' retirement in June 2000, she served as Executive Vice President and Chief Financial Officer of Atlantic Richfield Company (ARCO) (diversified energy, 1996-2000). From 1993 to 1996, she was a Senior Vice President of ARCO and President of ARCO Transportation Company. She served as a Director of ARCO from 1996 to 1998. She currently serves as a Director of Phelps Dodge Corporation (copper mining and manufacturing) and McKesson Corporation (healthcare service, 2002-present). Ms. Knowles is a Trustee of the Brookings Institution and the Catalina Island Conservancy and also serves as a member of the Advisory Board for the School of Engineering of the University of Southern California. |
Ned C. Lautenbach (63) |
| Year of Election or Appointment: 2000 Mr. Lautenbach is Chairman of the Independent Trustees (2006-present). Mr. Lautenbach has been a partner of Clayton, Dubilier & Rice, Inc. (private equity investment firm) since September 1998. Previously, Mr. Lautenbach was with the International Business Machines Corporation (IBM) from 1968 until his retirement in 1998. Mr. Lautenbach serves as a Director of Sony Corporation (2006-present) and Eaton Corporation (diversified industrial) as well as the Philharmonic Center for the Arts in Naples, Florida. He also is a member of the Board of Trustees of Fairfield University (2005-present), as well as a member of the Council on Foreign Relations. |
Cornelia M. Small (63) |
| Year of Election or Appointment: 2005 Ms. Small is a member (2000-present) and Chairperson (2002-present) of the Investment Committee, and a member (2002-present) of the Board of Trustees of Smith College. Previously, she served as Chief Investment Officer (1999-2000), Director of Global Equity Investments (1996-1999), and a member of the Board of Directors of Scudder, Stevens & Clark (1990-1997) and Scudder Kemper Investments (1997-1999). In addition, Ms. Small served as Co-Chair (2000-2003) of the Annual Fund for the Fletcher School of Law and Diplomacy. |
William S. Stavropoulos (68) |
| Year of Election or Appointment: 2002 Mr. Stavropoulos is Chairman Emeritus of the Board of Directors of The Dow Chemical Company. Since joining The Dow Chemical Company in 1967, Mr. Stavropoulos served in numerous senior management positions, including President (1993-2000; 2002-2003), CEO (1995-2000; 2002-2004), and Chairman of the Executive Committee (2000-2004). Currently, he is a Director of NCR Corporation (data warehousing and technology solutions), Chemical Financial Corporation, Maersk Inc. (industrial conglomerate, 2002-present), Tyco International, Inc. (multinational manufacturing and services, 2007-present), and a member of the Advisory Board for Metalmark Capital (private equity investment firm, 2005-present). He is a special advisor to Clayton, Dubilier & Rice, Inc., a private equity investment firm. He also serves as a member of the Board of Trustees of the American Enterprise Institute for Public Policy Research. In addition, Mr. Stavropoulos is a member of The Business Council, J.P. Morgan International Council and the University of Notre Dame Advisory Council for the College of Science. |
Kenneth L. Wolfe (68) |
| Year of Election or Appointment: 2005 Prior to his retirement in 2001, Mr. Wolfe was Chairman and Chief Executive Officer of Hershey Foods Corporation (1993-2001). He currently serves as a member of the boards of Adelphia Communications Corporation (2003-present), Bausch & Lomb, Inc., and Revlon Inc. (2004-present). |
Advisory Board Members and Executive Officers:
Correspondence intended for Mr. Mauriello may be sent to Fidelity Investments, P.O. Box 55235, Boston, Massachusetts 02205-5235. Correspondence intended for each executive officer and Mr. Lynch may be sent to Fidelity Investments, 82 Devonshire Street, Boston, Massachusetts 02109.
Name, Age; Principal Occupation |
Peter S. Lynch (63) |
| Year of Election or Appointment: 2003 Member of the Advisory Board of Fidelity Securities Fund. Mr. Lynch is Vice Chairman and a Director of FMR, and Vice Chairman (2001-present) and a Director of FMR Co., Inc. Previously, Mr. Lynch served as a Trustee of the Fidelity funds (1990-2003). In addition, he serves as a Trustee of Boston College and as the Chairman of the Inner-City Scholarship Fund. |
Joseph Mauriello (62) |
| Year of Election or Appointment: 2007 Member of the Advisory Board of Fidelity Securities Fund. Prior to his retirement in January 2006, Mr. Mauriello served in numerous senior management positions including Deputy Chairman and Chief Operating Officer (2004-2005), and Vice Chairman of Financial Services (2002-2004) of KPMG LLP US (professional services firm, 1965-2005). Mr. Mauriello currently serves as a member of the Board of Directors of XL Capital Ltd., (global insurance and re-insurance company, 2006-present) and of Arcadia Resources Inc., (health care services and products, 2007-present). He also served as a Director of the Hamilton Funds of the Bank of New York (2006-2007). |
Kimberley H. Monasterio (43) |
| Year of Election or Appointment: 2007 President and Treasurer of Small Cap Value. Ms. Monasterio also serves as President and Treasurer of other Fidelity funds (2007-present) and is an employee of FMR (2004-present). Previously, Ms. Monasterio served as Deputy Treasurer of the Fidelity funds (2004-2006). Before joining Fidelity Investments, Ms. Monasterio served as Treasurer (2000-2004) and Chief Financial Officer (2002-2004) of the Franklin Templeton Funds and Senior Vice President of Franklin Templeton Services, LLC (2000-2004). |
Dwight D. Churchill (53) |
| Year of Election or Appointment: 2005 Vice President of Small Cap Value. Mr. Churchill also serves as Vice President of certain Equity Funds (2005-present). Mr. Churchill is Executive Vice President of FMR (2005-present) and FMR Co., Inc. (2005-present). Previously, Mr. Churchill served as Senior Vice President of Fidelity Investments Money Management, Inc. (2005-2006), Head of Fidelity's Fixed-Income Division (2000-2005), Vice President of Fidelity's Money Market Funds (2000-2005), Vice President of Fidelity's Bond Funds, and Senior Vice President of FMR. |
Bruce T. Herring (41) |
| Year of Election or Appointment: 2006 Vice President of Small Cap Value. Mr. Herring also serves as Vice President of certain Equity Funds (2006-present). Mr. Herring is Senior Vice President of FMR (2006-present) and Vice President of FMR Co., Inc. (2001-present). Previously, Mr. Herring served as a portfolio manager for Fidelity U.S. Equity Funds (2001-2005). |
Thomas Hense (43) |
| Year of Election or Appointment: 2006
Vice President of Small Cap Value. Prior to assuming his current responsibilities, Mr. Hense worked as a research analyst, co-director of equity research, and a portfolio manager. |
Eric D. Roiter (58) |
| Year of Election or Appointment: 2004 Secretary of Small Cap Value. He also serves as Secretary of other Fidelity funds; Vice President, General Counsel, and Secretary of FMR Co., Inc. (2001-present) and FMR; Assistant Secretary of Fidelity Management & Research (U.K.) Inc. (2001-present), Fidelity Research & Analysis Company (2001-present), and Fidelity Investments Money Management, Inc. (2001-present). Mr. Roiter is an Adjunct Member, Faculty of Law, at Boston College Law School (2003-present). Previously, Mr. Roiter served as Vice President and Secretary of Fidelity Distributors Corporation (FDC) (1998-2005). |
Scott C. Goebel (39) |
| Year of Election or Appointment: 2007 Assistant Secretary of Small Cap Value. Mr. Goebel also serves as Assistant Secretary of other Fidelity funds (2007-present), Vice President and Secretary of FDC (2006-present), and is an employee of FMR. |
R. Stephen Ganis (41) |
| Year of Election or Appointment: 2006 Anti-Money Laundering (AML) officer of Small Cap Value. Mr. Ganis also serves as AML officer of other Fidelity funds (2006-present) and FMR Corp. (2003-present). Before joining Fidelity Investments, Mr. Ganis practiced law at Goodwin Procter, LLP (2000-2002). |
Joseph B. Hollis (59) |
| Year of Election or Appointment: 2006 Chief Financial Officer of Small Cap Value. Mr. Hollis also serves as Chief Financial Officer of other Fidelity funds. Mr. Hollis is President of Fidelity Pricing and Cash Management Services (FPCMS) (2005-present). Mr. Hollis also serves as President and Director of Fidelity Service Company, Inc. (2006-present). Previously, Mr. Hollis served as Senior Vice President of Cash Management Services (1999-2002) and Investment Management Operations (2002-2005). |
Kenneth A. Rathgeber (60) |
| Year of Election or Appointment: 2004 Chief Compliance Officer of Small Cap Value. Mr. Rathgeber also serves as Chief Compliance Officer of other Fidelity funds (2004-present) and Executive Vice President of Risk Oversight for Fidelity Investments (2002-present). He is Chief Compliance Officer of FMR (2005-present), FMR Co., Inc. (2005-present), Fidelity Management & Research (U.K.) Inc. (2005-present), Fidelity Research & Analysis Company (2005-present), Fidelity Investments Money Management, Inc. (2005-present), and Strategic Advisers, Inc. (2005-present). Previously, Mr. Rathgeber served as Executive Vice President and Chief Operating Officer for Fidelity Investments Institutional Services Company, Inc. (1998-2002). |
Bryan A. Mehrmann (46) |
| Year of Election or Appointment: 2005 Deputy Treasurer of Small Cap Value. Mr. Mehrmann also serves as Deputy Treasurer of other Fidelity funds (2005-present) and is an employee of FMR. Previously, Mr. Mehrmann served as Vice President of Fidelity Investments Institutional Services Group (FIIS)/Fidelity Investments Institutional Operations Corporation, Inc. (FIIOC) Client Services (1998-2004). |
Kenneth B. Robins (37) |
| Year of Election or Appointment: 2005 Deputy Treasurer of Small Cap Value. Mr. Robins also serves as Deputy Treasurer of other Fidelity funds (2005-present) and is an employee of FMR (2004-present). Before joining Fidelity Investments, Mr. Robins worked at KPMG LLP, where he was a partner in KPMG's department of professional practice (2002-2004) and a Senior Manager (1999-2000). In addition, Mr. Robins served as Assistant Chief Accountant, United States Securities and Exchange Commission (2000-2002). |
Robert G. Byrnes (40) |
| Year of Election or Appointment: 2005 Assistant Treasurer of Small Cap Value. Mr. Byrnes also serves as Assistant Treasurer of other Fidelity funds (2005-present) and is an employee of FMR (2005-present). Previously, Mr. Byrnes served as Vice President of FPCMS (2003-2005). Before joining Fidelity Investments, Mr. Byrnes worked at Deutsche Asset Management where he served as Vice President of the Investment Operations Group (2000-2003). |
Peter L. Lydecker (53) |
| Year of Election or Appointment: 2004 Assistant Treasurer of Small Cap Value. Mr. Lydecker also serves as Assistant Treasurer of other Fidelity funds (2004) and is an employee of FMR. |
Gary W. Ryan (48) |
| Year of Election or Appointment: 2005 Assistant Treasurer of Small Cap Value. Mr. Ryan also serves as Assistant Treasurer of other Fidelity funds (2005-present) and is an employee of FMR (2005-present). Previously, Mr. Ryan served as Vice President of Fund Reporting in FPCMS (1999-2005). |
Annual Report
Distributions
The Board of Trustees of Advisor Small Cap Value Fund voted to pay on September 10, 2007, to shareholders of record at the opening of business on September 7, 2007, a distribution of $0.398 per share derived from capital gains realized from sales of portfolio securities.
The fund hereby designates as a capital gain dividend with respect to the taxable year ended July 31, 2007 $47,404,920, or, if subsequently determined to be different, the net capital gain of such year.
The fund designates 24% of the dividends distributed during the fiscal year as qualifying for the dividends-received deduction for corporate shareholders.
The fund designates 26% of the dividends distributed during the fiscal year as amounts which may be taken into account as a dividend for the purposes of the maximum rate under section 1(h)(11) of the Internal Revenue Code.
The fund will notify shareholders in January 2008 of amounts for use in preparing 2007 income tax returns.
Annual Report
Board Approval of Investment Advisory Contracts and Management Fees
Fidelity Small Cap Value Fund
Each year, typically in July, the Board of Trustees, including the Independent Trustees (together, the Board), votes on the renewal of the management contract and sub-advisory agreements (together, the Advisory Contracts) for the fund. The Board, assisted by the advice of fund counsel and Independent Trustees' counsel, requests and considers a broad range of information throughout the year.
The Board meets regularly each month except August and takes into account throughout the year matters bearing on Advisory Contracts. The Board, acting directly and through its separate committees, considers at each of its meetings factors that are relevant to the annual renewal of the fund's Advisory Contracts, including the services and support provided to the fund and its shareholders. At the time of the renewal, the Board had 12 standing committees, each composed of Independent Trustees with varying backgrounds, to which the Board has assigned specific subject matter responsibilities in order to enhance effective decision-making by the Board. Each committee has adopted a written charter outlining the structure and purposes of the committee. One such committee, the Equity Contract Committee, meets periodically as needed throughout the year to consider matters specifically related to the annual renewal of Advisory Contracts. The committee requests and receives information on, and makes recommendations to the Independent Trustees concerning, the approval and annual review of the Advisory Contracts.
At its July 2007 meeting, the Board of Trustees, including the Independent Trustees, unanimously determined to renew the Advisory Contracts for the fund. In reaching its determination, the Board considered all factors it believed relevant, including (i) the nature, extent, and quality of the services to be provided to the fund and its shareholders (including the investment performance of the fund); (ii) the competitiveness of the management fee and total expenses of the fund; (iii) the total costs of the services to be provided by and the profits to be realized by the investment adviser and its affiliates from the relationship with the fund; (iv) the extent to which economies of scale would be realized as the fund grows; and (v) whether fee levels reflect these economies of scale, if any, for the benefit of fund shareholders. The Board also approved amendments to the fund's agreements with foreign sub-advisers to clarify that each sub-adviser provides services as an independent contractor.
In determining whether to renew the Advisory Contracts for the fund, the Board ultimately reached a determination, with the assistance of fund counsel and Independent Trustees' counsel, that the renewal of the Advisory Contracts and the compensation to be received by Fidelity under the management contract is consistent with Fidelity's fiduciary duty under applicable law. In addition to evaluating the specific factors noted above, the Board, in reaching its determination, is aware that shareholders in the fund have a broad range of investment choices available to them, including a wide choice among mutual funds offered by competitors to Fidelity, and that the fund's shareholders, with the opportunity to review and weigh the disclosure provided by the fund in its prospectus and other public disclosures, have chosen to invest in this fund, managed by Fidelity.
Annual Report
Nature, Extent, and Quality of Services Provided. The Board considered staffing within the investment adviser, FMR, and the sub-advisers (together, the Investment Advisers), including the background of the fund's portfolio manager and the fund's investment objective and discipline. The Independent Trustees also had discussions with senior management of Fidelity's investment operations and investment groups. The Board considered the structure of the portfolio manager compensation program and whether this structure provides appropriate incentives.
Resources Dedicated to Investment Management and Support Services. The Board reviewed the size, education, and experience of the Investment Advisers' investment staff, their use of technology, and the Investment Advisers' approach to recruiting, training, and retaining portfolio managers and other research, advisory, and management personnel. The Board considered Fidelity's extensive global research capabilities that enable the Investment Advisers to aggregate data from various sources in an effort to produce positive investment results. The Board noted that Fidelity's analysts have access to a variety of technological tools that enable them to perform both fundamental and quantitative analysis and to specialize in various disciplines. The Board also considered that Fidelity's portfolio managers and analysts have access to daily portfolio attribution that allows for monitoring of a fund's portfolio, as well as an electronic communication system that provides immediate real-time access to research concerning issuers and credit enhancers.
Shareholder and Administrative Services. The Board considered (i) the nature, extent, quality, and cost of advisory, administrative, distribution, and shareholder services performed by the Investment Advisers and their affiliates under the Advisory Contracts and under separate agreements covering transfer agency, pricing and bookkeeping, and securities lending services for the fund; (ii) the nature and extent of the Investment Advisers' supervision of third party service providers, principally custodians and subcustodians; and (iii) the resources devoted to, and the record of compliance with, the fund's compliance policies and procedures. The Board reviewed the allocation of fund brokerage, including allocations to brokers affiliated with the Investment Advisers, the use of brokerage commissions to pay fund expenses, and the use of "soft" commission dollars to pay for research services. The Board also considered that Fidelity voluntarily pays for market data out of its own resources.
The Board noted that the growth of fund assets across the complex allows Fidelity to reinvest in the development of services designed to enhance the value or convenience of the Fidelity funds as investment vehicles. These services include 24-hour access to account information and market information through phone representatives and over the Internet, and investor education materials and asset allocation tools.
Annual Report
Board Approval of Investment Advisory Contracts and
Management Fees - continued
Investment in a Large Fund Family. The Board considered the benefits to shareholders of investing in a Fidelity fund, including the benefits of investing in a fund that is part of a large family of funds offering a variety of investment disciplines and providing for a large variety of mutual fund investor services. For example, fund shareholders are offered the privilege of exchanging shares of the fund for shares of other Fidelity funds, as set forth in the fund's prospectus, without paying a sales charge. The Board noted that, since the last Advisory Contract renewals in July 2006, Fidelity has taken a number of actions that benefited particular funds, including (i) dedicating additional resources to investment research and to restructure the investment research teams; (ii) contractually agreeing to reduce the management fee on Fidelity Advisor Floating Rate High Income Fund; (iii) contractually agreeing to reduce the management fees on Fidelity's California, Massachusetts, New Jersey, and New York AMT Tax-Free Money Market Funds, launching new Institutional Classes and Service Classes of these funds, and contractually agreeing to impose expense limitations on these funds; (iv) eliminating the exchange fee on the Fidelity Select Portfolios and reducing the pricing and bookkeeping fee rates for these funds; (v) reducing the maximum transfer agency fee rates on high income funds and certain equity funds; (vi) proposing amended management contracts that, if approved by shareholders, will add a performance adjustment component to the management fees paid by 18 Fidelity Advisor equity funds; (vii) contractually agreeing to reduce fees for Ultra-Short Central Fund and the money market Central Funds; (viii) waiving the Fidelity Advisor funds' contingent deferred sales charge on certain redemptions made through systematic withdrawal programs; and (ix) amending the management contracts for equity and fixed-income funds whose management contracts incorporate a "group fee" structure by adding four new fee "breakpoints" to the group fee rate schedules.
Investment Performance and Compliance. The Board considered whether the fund has operated within its investment objective, as well as its record of compliance with its investment restrictions. It also reviewed the fund's absolute investment performance for each class, as well as the fund's relative investment performance for each class measured against (i) a broad-based securities market index, and (ii) a peer group of mutual funds deemed appropriate by the Board. Because the fund had been in existence less than three calendar years, the following chart considered by the Board shows, for the one-year period ended December 31, 2006, the total returns of Institutional Class (Class I) and Class C of the fund, the total return of a broad-based securities market index ("benchmark"), and a range of total returns of a peer group of mutual funds identified by Morningstar, Inc. as having an investment style similar to that of the fund based on underlying portfolio holdings. The returns of Institutional Class (Class I) and Class C show the performance of the highest and lowest performing classes, respectively. The box within the chart shows the 25th percentile return (bottom of box) and the 75th percentile return (top of box) of the peer group. Returns shown above the box are in the first quartile and returns shown below the box are in the fourth quartile. The percentage beaten numbers noted below the chart correspond to the percentile box and represent the percentage of funds in the peer group whose performance was equal to or lower than that of the class indicated.
Annual Report
Fidelity Small Cap Value Fund

The Board reviewed the fund's relative investment performance against its peer group and stated that the performance of Institutional Class (Class I) of the fund was in the third quartile for the period shown. The Board also stated that the investment performance of the fund was lower than its benchmark for the period shown. The Board considered that the variations in performance among the fund's classes reflect the variations in class expenses, which result in lower performance for higher expense classes. The Board stated that it is difficult to evaluate in any comprehensive fashion the performance of the fund, in light of its relatively recent commencement of operations.
The Board also considered that the fund's management fee is subject to upward or downward adjustment depending upon whether, and to what extent, the fund's investment performance for the performance period exceeds, or is exceeded by, the record (over the same period) of a Board-approved performance adjustment index. The Board realizes that the performance adjustment provides FMR with a strong economic incentive to seek to achieve superior performance for the fund's shareholders and helps to more closely align the interests of FMR and the fund's shareholders.
The Board considered that FMR has taken steps to refocus and strengthen equity research, equity portfolio management, and compliance.
Annual Report
Board Approval of Investment Advisory Contracts and
Management Fees - continued
Based on its review, and giving particular weight to the nature and quality of the resources dedicated by the Investment Advisers to maintain and improve relative performance, the Board concluded that the nature, extent, and quality of the services provided to the fund will benefit the fund's shareholders, particularly in light of the Board's view that the fund's shareholders benefit from investing in a fund that is part of a large family of funds offering a variety of investment disciplines and services.
Competitiveness of Management Fee and Total Fund Expenses. The Board considered the fund's management fee and total expenses compared to "mapped groups" of competitive funds and classes. Fidelity creates "mapped groups" by combining similar Lipper investment objective categories that have comparable management fee characteristics. Combining Lipper investment objective categories aids the Board's management fee and total expense comparisons by broadening the competitive group used for comparison and by reducing the number of universes to which various Fidelity funds are compared. The Board also considered supplemental information about how the fund's management fee and total expenses ranked relative to groups based on Lipper classifications, which take into account a fund's market capitalization and style.
The Board considered two proprietary management fee comparisons for the 12-month (or shorter) periods shown in the chart below. The group of Lipper funds used by the Board for management fee comparisons is referred to below as the "Total Mapped Group." The Total Mapped Group comparison focuses on a fund's standing relative to the total universe of comparable funds available to investors, in terms of gross management fees before expense reimbursements or caps, and without giving effect to the fund's performance adjustment. "TMG %" represents the percentage of funds in the Total Mapped Group that had management fees that were lower than the fund's. For example, a TMG % of 13% means that 87% of the funds in the Total Mapped Group had higher management fees than the fund. The "Asset-Size Peer Group" (ASPG) comparison focuses on a fund's standing relative to non-Fidelity funds similar in size to the fund within the Total Mapped Group. The ASPG represents at least 15% of the funds in the Total Mapped Group with comparable asset size and management fee characteristics, subject to a minimum of 50 funds (or all funds in the Total Mapped Group if fewer than 50). Additional information, such as the ASPG quartile in which the fund's management fee ranked and the impact of the fund's performance adjustment, is also included in the chart and considered by the Board.
Annual Report
Fidelity Small Cap Value Fund
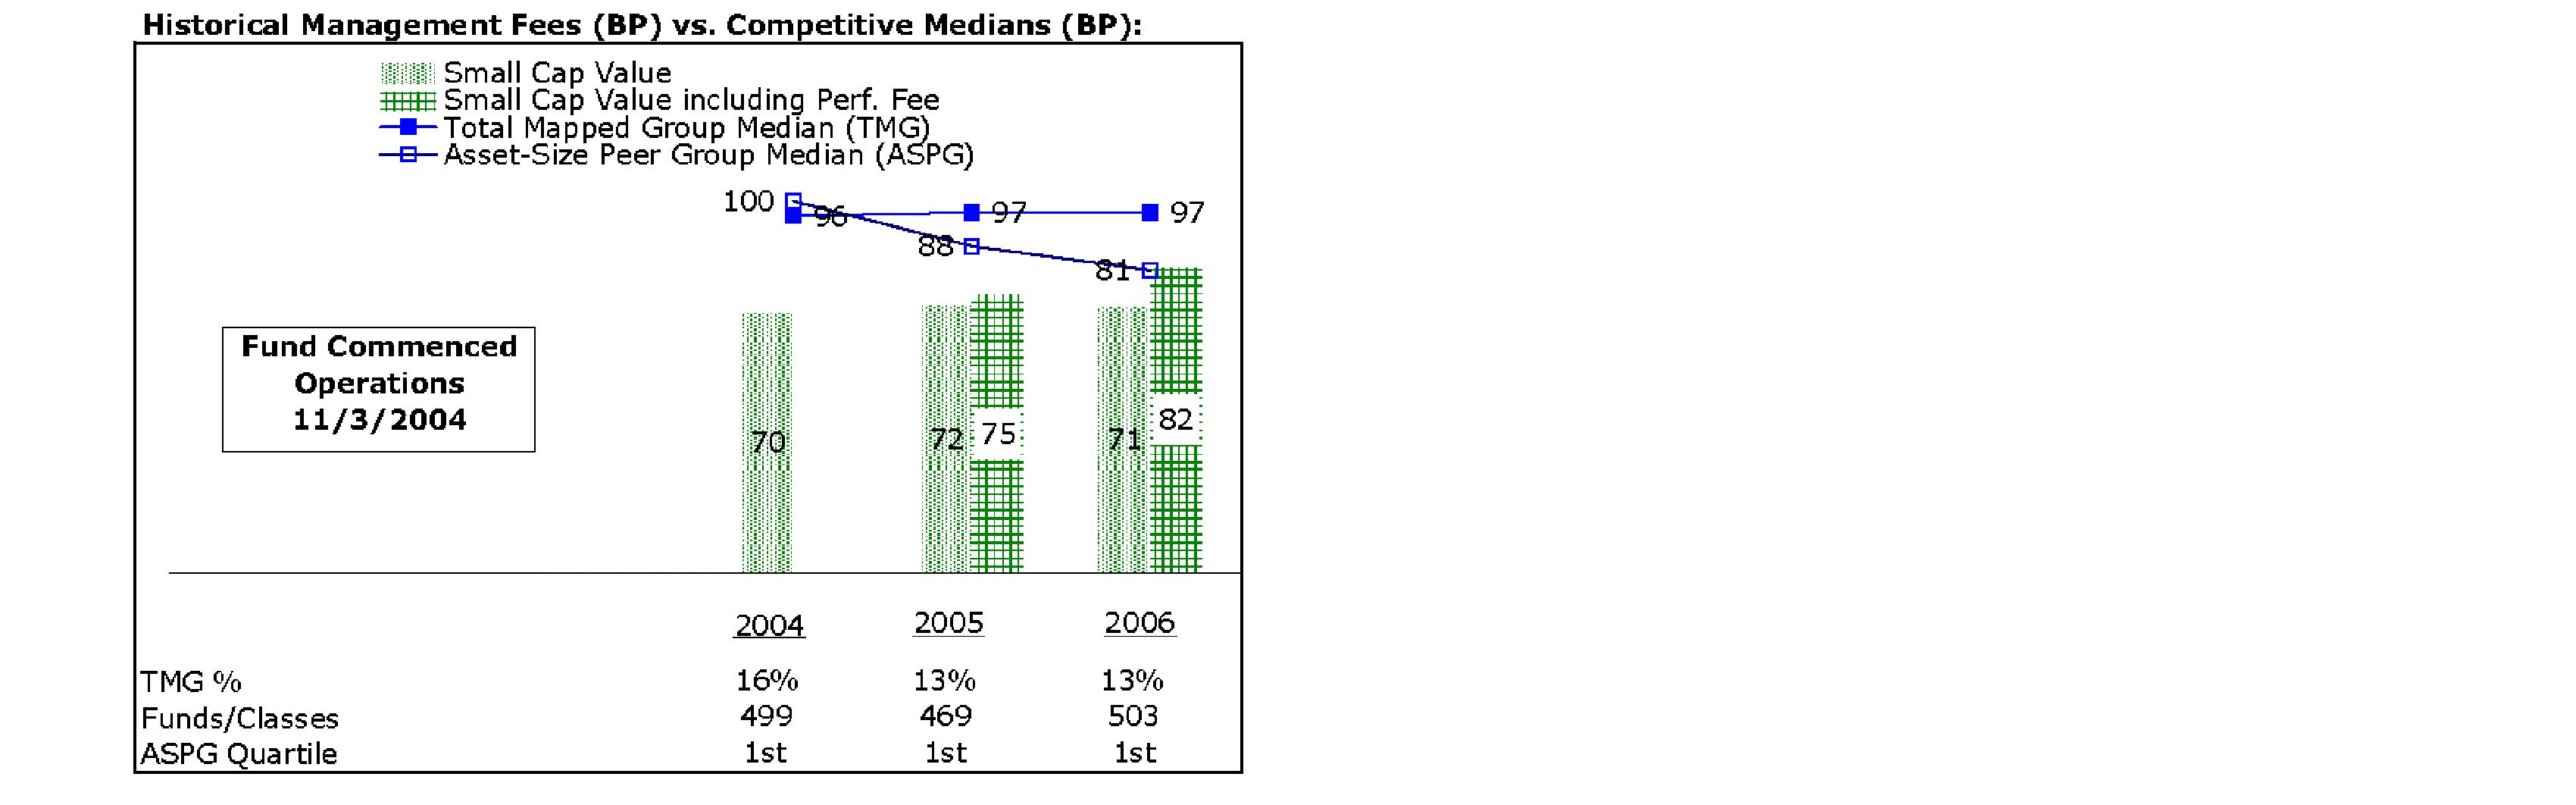
The Board noted that the fund's management fee ranked below the median of its Total Mapped Group and below the median of its ASPG for 2006. The Board also noted the effect of the fund's positive performance adjustment on the fund's management fee ranking. The Board noted that the performance adjustment for each year represents calculations for performance periods that differ from the period shown in the performance chart above.
Based on its review, the Board concluded that the fund's management fee was fair and reasonable in light of the services that the fund receives and the other factors considered.
In its review of each class's total expenses, the Board considered the fund's management fee as well as other fund or class expenses, as applicable, such as transfer agent fees, pricing and bookkeeping fees, fund-paid 12b-1 fees, and custodial, legal, and audit fees. The Board also noted the effects of any waivers and reimbursements on fees and expenses, as well as the fund's positive performance adjustment. As part of its review, the Board also considered current and historical total expenses of each class of the fund compared to competitive fund median expenses. Each class of the fund is compared to those funds and classes in the Total Mapped Group (used by the Board for management fee comparisons) that have a similar sales load structure.
The Board noted that the total expenses of each of Class A, Institutional Class, and Fidelity Small Cap Value (retail class) ranked below its competitive median for 2006, the total expenses of Class B ranked equal to its competitive median for 2006, and the total expenses of each of Class T and Class C ranked above its competitive median for 2006. The Board considered that the total expenses of Class C were above the median because of its higher transfer agent fee due to small average account size. The Board noted that the fund offers multiple classes, each of which has a different sales load and 12b-1 fee structure, and that the multiple structures are intended to offer a range of pricing options for the intermediary market. The Board also noted that the total expenses of the classes vary primarily by the level of their 12b-1 fees, although differences in transfer agent fees may also cause expenses to vary from class to class.
Annual Report
Board Approval of Investment Advisory Contracts and
Management Fees - continued
In its review of total expenses, the Board also considered Fidelity fee structures and other information on clients that FMR and its affiliates service in other competitive markets, such as other mutual funds advised or subadvised by FMR or its affiliates, pension plan clients, and other institutional clients.
Based on its review, the Board concluded that the total expenses of each class of the fund were reasonable, although in some cases above the median of the universe presented for comparison, in light of the services that the fund and its shareholders receive and the other factors considered.
Costs of the Services and Profitability. The Board considered the revenues earned and the expenses incurred by Fidelity in conducting the business of developing, marketing, distributing, managing, administering and servicing the fund and its shareholders. The Board also considered the level of Fidelity's profits in respect of all the Fidelity funds.
On an annual basis, FMR presents to the Board Fidelity's profitability for the fund. Fidelity calculates the profitability for each fund, as well as aggregate profitability for groups of Fidelity funds and all Fidelity funds, using a series of detailed revenue and cost allocation methodologies which originate with the audited books and records of Fidelity. The Audit Committee of the Board reviews any significant changes from the prior year's methodologies.
PricewaterhouseCoopers LLP (PwC), independent registered public accounting firm and auditor to Fidelity and certain Fidelity funds, has been engaged annually by the Board as part of the Board's assessment of the results of Fidelity's profitability analysis. PwC's engagement includes the review and assessment of Fidelity's methodologies used in determining the revenues and expenses attributable to Fidelity's mutual fund business, and completion of agreed-upon procedures surrounding the mathematical accuracy of fund profitability and its conformity to allocation methodologies. After considering PwC's reports issued under the engagement and information provided by Fidelity, the Board believes that while other allocation methods may also be reasonable, Fidelity's profitability methodologies are reasonable in all material respects.
Annual Report
The Board has also reviewed Fidelity's non-fund businesses and any fall-out benefits related to the mutual fund business as well as cases where Fidelity's affiliates may benefit from or be related to the fund's business.
The Board considered the costs of the services provided by and the profits realized by Fidelity in connection with the operation of the fund and determined that the amount of profit is a fair entrepreneurial profit for the management of the fund.
Economies of Scale. The Board considered whether there have been economies of scale in respect of the management of the Fidelity funds, whether the Fidelity funds (including the fund) have appropriately benefited from any such economies of scale, and whether there is potential for realization of any further economies of scale. The Board considered the extent to which the fund will benefit from economies of scale through increased services to the fund, through waivers or reimbursements, or through fee or expense reductions, including reductions that occur through operation of the transfer agent agreement. The transfer agent fee varies in part based on the number of accounts in the fund. If the number of accounts decreases or the average account size increases, the overall transfer agent fee rate decreases.
The Board recognized that the fund's management contract incorporates a "group fee" structure, which provides for lower group fee rates as total fund assets under FMR's management increase, and for higher group fee rates as total fund assets under FMR's management decrease. FMR determines the group fee rates based on a tiered asset "breakpoint" schedule. In connection with the renewal of the fund's management contract, the Board approved amendments to the fund's management contract that added four new fee breakpoints to the group fee rate schedule for assets under FMR's management above $1,386 billion. The Board considered that the group fee rate declines under both the present and amended schedules, but that under the amended schedule, the group fee rate declines faster as assets under FMR's management exceed $1,386 billion. The Board considered that the group fee is designed to deliver the benefits of economies of scale to fund shareholders when total fund assets increase, even if assets of any particular fund are unchanged or have declined, because some portion of Fidelity's costs are attributable to services provided to all Fidelity funds, and all funds benefit if those costs can be allocated among more assets. The Board concluded that, given the group fee structure, fund shareholders will achieve a certain level of economies of scale as assets under FMR's management increase at the fund complex level, regardless of whether Fidelity achieves any such economies of scale.
The Board further concluded that any potential economies of scale are being shared between fund shareholders and Fidelity in an appropriate manner.
Additional Information Requested by the Board. In order to develop fully the factual basis for consideration of the Fidelity funds' Advisory Contracts, the Board requested and received additional information on several topics, including (i) fund performance trends and actions to be taken by FMR to improve certain funds' overall performance; (ii) Fidelity's portfolio manager compensation structure, including its effects on fund profitability and the extent to which portfolio manager compensation is linked to fund performance; (iii) Fidelity's fee structures; (iv) the funds' sub-advisory arrangements; and (v) accounts managed by Fidelity other than the Fidelity funds.
Annual Report
Board Approval of Investment Advisory Contracts and
Management Fees - continued
Based on its evaluation of all of the conclusions noted above, and after considering all material factors, the Board ultimately concluded that the advisory fee structures are fair and reasonable, and that the fund's Advisory Contracts should be renewed.
Annual Report
Managing Your Investments
Fidelity offers several ways to conveniently manage your personal investments via your telephone or PC. You can access your account information, conduct trades and research your investments 24 hours a day.
By Phone
Fidelity Automated Service Telephone provides a single toll-free number to access account balances, positions, quotes and trading. It's easy to navigate the service, and on your first call, the system will help you create a personal identification number (PIN) for security.
(phone_graphic)
Fidelity Automated
Service Telephone (FAST®)
1-800-544-5555
Press
1 For mutual fund and brokerage trading.
2 For quotes.*
3 For account balances and holdings.
4 To review orders and mutual
fund activity.
5 To change your PIN.
*0 To speak to a Fidelity representative.
By PC
Fidelity's web site on the Internet provides a wide range of information, including daily financial news, fund performance, interactive planning tools and news about Fidelity products and services.
(computer_graphic)
Fidelity's Web Site
www.fidelity.com
* When you call the quotes line, please remember that a fund's yield and return will vary and, except for money market funds, share price will also vary. This means that you may have a gain or loss when you sell your shares. There is no assurance that money market funds will be able to maintain a stable $1 share price; an investment in a money market fund is not insured or guaranteed by the U.S. government. Total returns are historical and include changes in share price, reinvestment of dividends and capital gains, and the effects of any sales charges.
Annual Report
To Visit Fidelity
For directions and hours,
please call 1-800-544-9797.
Arizona
7001 West Ray Road
Chandler, AZ
15445 N. Scottsdale Road
Scottsdale, AZ
California
815 East Birch Street
Brea, CA
1411 Chapin Avenue
Burlingame, CA
851 East Hamilton Avenue
Campbell, CA
19200 Von Karman Avenue
Irvine, CA
601 Larkspur Landing Circle
Larkspur, CA
10100 Santa Monica Blvd.
Los Angeles, CA
27101 Puerta Real
Mission Viejo, CA
73-575 El Paseo
Palm Desert, CA
251 University Avenue
Palo Alto, CA
123 South Lake Avenue
Pasadena, CA
16995 Bernardo Ctr. Drive
Rancho Bernardo, CA
1220 Roseville Parkway
Roseville, CA
1740 Arden Way
Sacramento, CA
7676 Hazard Center Drive
San Diego, CA
11943 El Camino Real
San Diego, CA
8 Montgomery Street
San Francisco, CA
3793 State Street
Santa Barbara, CA
1200 Wilshire Boulevard
Santa Monica, CA
21701 Hawthorne Boulevard
Torrance, CA
2001 North Main Street
Walnut Creek, CA
6300 Canoga Avenue
Woodland Hills, CA
Colorado
1625 Broadway
Denver, CO
9185 Westview Road
Lone Tree, CO
Connecticut
48 West Putnam Avenue
Greenwich, CT
265 Church Street
New Haven, CT
300 Atlantic Street
Stamford, CT
29 South Main Street
West Hartford, CT
Delaware
400 Delaware Avenue
Wilmington, DE
Florida
4400 N. Federal Highway
Boca Raton, FL
121 Alhambra Plaza
Coral Gables, FL
2948 N. Federal Highway
Ft. Lauderdale, FL
4671 Town Center Parkway
Jacksonville, FL
1907 West State Road 434
Longwood, FL
8880 Tamiami Trail, North
Naples, FL
3501 PGA Boulevard
Palm Beach Gardens, FL
3550 Tamiami Trail, South
Sarasota, FL
1502 N. Westshore Blvd.
Tampa, FL
2465 State Road 7
Wellington, FL
Georgia
3445 Peachtree Road, N.E.
Atlanta, GA
1000 Abernathy Road
Atlanta, GA
Illinois
One North LaSalle Street
Chicago, IL
875 North Michigan Ave.
Chicago, IL
1415 West 22nd Street
Oak Brook, IL
1572 East Golf Road
Schaumburg, IL
3232 Lake Avenue
Wilmette, IL
Indiana
4729 East 82nd Street
Indianapolis, IN
Kansas
5400 College Boulevard
Overland Park, KS
Maine
Three Canal Plaza
Portland, ME
Maryland
7315 Wisconsin Avenue
Bethesda, MD
One W. Pennsylvania Ave.
Towson, MD
Massachusetts
801 Boylston Street
Boston, MA
155 Congress Street
Boston, MA
300 Granite Street
Braintree, MA
44 Mall Road
Burlington, MA
238 Main Street
Cambridge, MA
405 Cochituate Road
Framingham, MA
416 Belmont Street
Worcester, MA
Annual Report
Michigan
500 E. Eisenhower Pkwy.
Ann Arbor, MI
280 Old N. Woodward Ave.
Birmingham, MI
43420 Grand River Avenue
Novi, MI
29155 Northwestern Hwy.
Southfield, MI
Minnesota
7600 France Avenue South
Edina, MN
Missouri
1524 South Lindbergh Blvd.
St. Louis, MO
Nevada
2225 Village Walk Drive
Henderson, NV
New Jersey
150 Essex Street
Millburn, NJ
56 South Street
Morristown, NJ
396 Route 17, North
Paramus, NJ
3518 Route 1 North
Princeton, NJ
530 Broad Street
Shrewsbury, NJ
New York
1055 Franklin Avenue
Garden City, NY
37 West Jericho Turnpike
Huntington Station, NY
1271 Avenue of the Americas
New York, NY
980 Madison Avenue
New York, NY
61 Broadway
New York, NY
350 Park Avenue
New York, NY
200 Fifth Avenue
New York, NY
733 Third Avenue
New York, NY
11 Penn Plaza
New York, NY
2070 Broadway
New York, NY
1075 Northern Blvd.
Roslyn, NY
799 Central Park Avenue
Scarsdale, NY
North Carolina
4611 Sharon Road
Charlotte, NC
7011 Fayetteville Road
Durham, NC
Ohio
3805 Edwards Road
Cincinnati, OH
1324 Polaris Parkway
Columbus, OH
28699 Chagrin Boulevard
Woodmere Village, OH
Oregon
7493 SW Bridgeport Road
Tigard, OR
Pennsylvania
600 West DeKalb Pike
King of Prussia, PA
1735 Market Street
Philadelphia, PA
12001 Perry Highway
Wexford, PA
Rhode Island
47 Providence Place
Providence, RI
Tennessee
6150 Poplar Avenue
Memphis, TN
Texas
10000 Research Boulevard
Austin, TX
4001 Northwest Parkway
Dallas, TX
12532 Memorial Drive
Houston, TX
2701 Drexel Drive
Houston, TX
6560 Fannin Street
Houston, TX
6500 N. MacArthur Blvd.
Irving, TX
6005 West Park Boulevard
Plano, TX
14100 San Pedro
San Antonio, TX
1576 East Southlake Blvd.
Southlake, TX
19740 IH 45 North
Spring, TX
Utah
279 West South Temple
Salt Lake City, UT
Virginia
1861 International Drive
McLean, VA
Washington
411 108th Avenue, N.E.
Bellevue, WA
1518 6th Avenue
Seattle, WA
Washington, DC
1900 K Street, N.W.
Washington, DC
Wisconsin
595 North Barker Road
Brookfield, WI
Fidelity Brokerage Services, Inc., 100 Summer St., Boston, MA 02110 Member NYSE/SIPC
Annual Report
Investment Adviser
Fidelity Management & Research Company
Boston, MA
Investment Sub-Advisers
FMR Co., Inc.
Fidelity Research & Analysis Company
Fidelity Management & Research
(U.K.) Inc.
Fidelity Investments Japan Limited
Fidelity International Investment
Advisors
Fidelity International Investment
Advisors (U.K.) Limited
General Distributor
Fidelity Distributors Corporation
Boston, MA
Transfer and Service Agent
Fidelity Service Company, Inc.
Boston, MA
Custodian
Citibank, N.A.
New York, NY
The Fidelity Telephone Connection
Mutual Fund 24-Hour Service
Exchanges/Redemptions
and Account Assistance 1-800-544-6666
Product Information 1-800-544-6666
Retirement Accounts 1-800-544-4774
(8 a.m. - 9 p.m.)
TDD Service 1-800-544-0118
for the deaf and hearing impaired
(9 a.m. - 9 p.m. Eastern time)
Fidelity Automated Service
Telephone (FAST®) (automated graphic) 1-800-544-5555
(automated graphic) Automated line for quickest service
SCV-UANN-0907
1.803705.102
(Fidelity Investment logo)(registered trademark)
Corporate Headquarters
82 Devonshire St., Boston, MA 02109
www.fidelity.com
(Fidelity Investment logo)(registered trademark)
Fidelity Advisor
Small Cap Value
Fund - Class A, Class T,
Class B and Class C
Annual Report
July 31, 2007
Class A, Class T, Class B
and Class C are classes of
Fidelity® Small Cap Value Fund
(2_fidelity_logos) (Registered_Trademark)
Contents
Chairman's Message | <Click Here> | Ned Johnson's message to shareholders. |
Performance | <Click Here> | How the fund has done over time. |
Management's Discussion | <Click Here> | The manager's review of fund performance, strategy and outlook. |
Shareholder Expense Example | <Click Here> | An example of shareholder expenses. |
Investment Changes | <Click Here> | A summary of major shifts in the fund's investments over the past six months. |
Investments | <Click Here> | A complete list of the fund's investments with their market values. |
Financial Statements | <Click Here> | Statements of assets and liabilities, operations, and changes in net assets,
as well as financial highlights. |
Notes | <Click Here> | Notes to the financial statements. |
Report of Independent Registered Public Accounting Firm | <Click Here> | |
Trustees and Officers | <Click Here> | |
Distributions | <Click Here> | |
Board Approval of Investment Advisory Contracts and Management Fees | <Click Here> | |
To view a fund's proxy voting guidelines and proxy voting record for the 12-month period ended June 30, visit http://www.fidelity.com (search for "proxy voting guidelines") or visit the Securities and Exchange Commission's (SEC) web site at http://www.sec.gov. You may also call 1-877-208-0098 to request a free copy of the proxy voting guidelines.
Standard & Poor's, S&P and S&P 500 are registered service marks of The McGraw-Hill Companies, Inc. and have been licensed for use by Fidelity Distributors Corporation.
Other third party marks appearing herein are the property of their respective owners.
All other marks appearing herein are registered or unregistered trademarks or service marks of FMR Corp. or an affiliated company.
Annual Report
This report and the financial statements contained herein are submitted for the general information of the shareholders of the fund. This report is not authorized for distribution to prospective investors in the fund unless preceded or accompanied by an effective prospectus.
A fund files its complete schedule of portfolio holdings with the SEC for the first and third quarters of each fiscal year on Form N-Q. Forms N-Q are available on the SEC's web site at http://www.sec.gov. A fund's Forms N-Q may be reviewed and copied at the SEC's Public Reference Room in Washington, DC. Information regarding the operation of the SEC's Public Reference Room may be obtained by calling 1-800-SEC-0330. For a complete list of a fund's portfolio holdings, view the most recent holdings listing, semiannual report, or annual report on Fidelity's web site at http://www.fidelity.com or http://www.advisor.fidelity.com, as applicable.
NOT FDIC INSURED · MAY LOSE VALUE · NO BANK GUARANTEE
Neither the fund nor Fidelity Distributors Corporation is a bank.
Annual Report
Chairman's Message
(photo_of_Edward_C_Johnson_3d)
Dear Shareholder:
Stocks are currently on pace to register their fifth straight year of positive returns, although gains could be trimmed if the U.S. economy continues to slow. While financial markets are always unpredictable, there are a number of time-tested principles that can put the historical odds in your favor.
One of the basic tenets is to invest for the long term. Over time, riding out the markets' inevitable ups and downs has proven much more effective than selling into panic or chasing the hottest trend. Even missing only a few of the markets' best days can significantly diminish investor returns. Patience also affords the benefits of compounding - of earning interest on additional income or reinvested dividends and capital gains. There are tax advantages and cost benefits to consider as well. The more you sell, the more taxes you pay, and the more you trade, the higher the costs. While staying the course doesn't eliminate risk, it can considerably lessen the effect of short-term declines.
You can further manage your investing risk through diversification. And today, more than ever, geographic diversification should be taken into account. Studies indicate that asset allocation is the single most important determinant of a portfolio's long-term success. The right mix of stocks, bonds and cash - aligned to your particular risk tolerance and investment objective - is very important. Age-appropriate rebalancing is also an essential aspect of asset allocation. For younger investors, an emphasis on equities - which historically have been the best-performing asset class over time - is encouraged. As investors near their specific goal, such as retirement or sending a child to college, consideration may be given to replacing volatile assets (e.g. common stocks) with more-stable fixed investments (bonds or savings plans).
A third investment principle - investing regularly - can help lower the average cost of your purchases. Investing a certain amount of money each month or quarter helps ensure you won't pay for all your shares at market highs. This strategy - known as dollar cost averaging - also reduces unconstructive "emotion" from investing, helping shareholders avoid selling weak performers just prior to an upswing, or chasing a hot performer just before a correction.
We invite you to contact us via the Internet, through our Investor Centers or over the phone. It is our privilege to provide you the information you need to make the investments that are right for you.
Sincerely,
/s/Edward C. Johnson 3d
Edward C. Johnson 3d
Annual Report
Fidelity Advisor Small Cap Value Fund - Class A, T, B, and C
Performance: The Bottom Line
Average annual total return reflects the change in the value of an investment, assuming reinvestment of the class' dividend income and capital gains (the profits earned upon the sale of securities that have grown in value) and assuming a constant rate of performance each year. The $10,000 table and the fund's returns do not reflect the deduction of taxes that a shareholder would pay on fund distributions or the redemption of fund shares. During periods of reimbursement by Fidelity, a fund's total return will be greater than it would be had the reimbursement not occurred. How a fund did yesterday is no guarantee of how it will do tomorrow.
Average Annual Total Returns
Periods ended July 31, 2007 | Past 1
year | Life of
FundA |
Class A (incl. 5.75% sales charge) | 8.00% | 14.87% |
Class T (incl. 3.50% sales charge) | 10.34% | 15.59% |
Class B (incl. contingent deferred sales charge) B | 8.78% | 15.68% |
Class C (incl. contingent deferred sales charge) C | 12.77% | 16.53% |
A From November 3, 2004.
B Class B shares' contingent deferred sales charges included in the past one year and life of fund total return figures are 5% and 3%, respectively.
C Class C shares' contingent deferred sales charges included in the past one year and life of fund total return figures are 1% and 0%, respectively.
Annual Report
Fidelity Advisor Small Cap Value Fund - Class A, T, B, and C
Performance - continued
$10,000 Over Life of Fund
Let's say hypothetically that $10,000 was invested in Fidelity Advisor Small Cap Value Fund - Class T on November 3, 2004, when the fund started, and the current 3.50% sales charge was paid. The chart shows how the value of your investment would have changed, and also shows how the Russell 2000® Value Index performed over the same period.
Annual Report
Management's Discussion of Fund Performance
Comments from Thomas Hense, Portfolio Manager of Fidelity Advisor Small Cap Value Fund
Major U.S. equity benchmarks approached or exceeded gains of 20% and several set record highs during the 12-month period ending July 31, 2007. In that time, the Dow Jones Industrial AverageSM rose 20.84%, the Standard & Poor's 500SM Index advanced 16.13% and the NASDAQ Composite® Index gained 22.67%. The small-cap Russell 2000® Index fared less well after falling nearly 7% in July, but still returned 12.12% for the year overall. The first half of the period featured six consecutive months of positive returns spurred by the more relaxed monetary policy of the Federal Reserve Board and falling energy prices, which softened inflationary pressures on the U.S. economy. Stocks slipped in February, however, as energy prices crept higher, the housing market slumped, subprime mortgage woes mounted and the Chinese stock market declined 9% in a single day. But equities soared again from March through May, as reflected by the Dow and the S&P 500®, which climbed nearly 12% and more than 9%, respectively. In June and July, though, stocks sank again on inflation concerns and a worsening subprime loan crisis.
During the past year, the fund's Class A, Class T, Class B and Class C shares gained 14.59%, 14.34%, 13.78% and 13.77%, respectively (excluding sales charges), significantly outperforming the Russell 2000 Value Index, which returned 7.67%. The fund was helped by holding an underweighting in banks and real estate investment trusts during the past six months when these stocks performed poorly. The fund also got a boost from good stock selection in the strong-performing industrials and energy sectors. On the other hand, poor security selection in the materials, health care and telecommunication services sectors dragged down performance. Underweighting the strong-performing telecommunication services sector hurt as well. Among the fund's top performers were real estate services provider Jones Lang LaSalle, engineering and construction firm Shaw Group, oil refinery Tesoro and Spanish systems integration and consulting firm Telvent. UAP Holding, a distributor of seeds and agricultural chemicals, also did well. In terms of individual detractors, pharmacy benefit management company Omnicare and Pantry, which owns convenience stores combined with gas stations, held back the fund's return. Center Financial, a bank that caters to the Chinese-American community, also hurt performance.
The views expressed above reflect those of the portfolio manager(s) only through the end of the period as stated on the cover of this report and do not necessarily represent the views of Fidelity or any other person in the Fidelity organization. Any such views are subject to change at any time based upon market or other conditions and Fidelity disclaims any responsibility to update such views. These views may not be relied on as investment advice and, because investment decisions for a Fidelity fund are based on numerous factors, may not be relied on as an indication of trading intent on behalf of any Fidelity fund.
Annual Report
Shareholder Expense Example
As a shareholder of the Fund, you incur two types of costs: (1) transaction costs, including sales charges (loads) on purchase payments or redemption proceeds, redemption fees, and (2) ongoing costs, including management fees, distribution and/or service (12b-1) fees and other Fund expenses. This Example is intended to help you understand your ongoing costs (in dollars) of investing in the Fund and to compare these costs with the ongoing costs of investing in other mutual funds.
The Example is based on an investment of $1,000 invested at the beginning of the period and held for the entire period (February 1, 2007 to July 31, 2007).
Actual Expenses
The first line of the accompanying table for each class of the Fund provides information about actual account values and actual expenses. You may use the information in this line, together with the amount you invested, to estimate the expenses that you paid over the period. Simply divide your account value by $1,000.00 (for example, an $8,600 account value divided by $1,000.00 = 8.6), then multiply the result by the number in the first line for a class of the Fund under the heading entitled "Expenses Paid During Period" to estimate the expenses you paid on your account during this period. A small balance maintenance fee of $12.00 that is charged once a year may apply for certain accounts with a value of less than $2,000. This fee is not included in the table below. If it was, the estimate of expenses you paid during the period would be higher, and your ending account value lower, by this amount. In addition, the Fund, as a shareholder in the underlying Fidelity Central Funds, will indirectly bear its pro rata share of the fees and expenses incurred by the underlying Fidelity Central Funds. These fees and expenses are not included in the Fund's annualized expense ratio used to calculate the expense estimate in the table below.
Hypothetical Example for Comparison Purposes
The second line of the accompanying table for each class of the Fund provides information about hypothetical account values and hypothetical expenses based on a Class' actual expense ratio and an assumed rate of return of 5% per year before expenses, which is not the Class' actual return. The hypothetical account values and expenses may not be used to estimate the actual ending account balance or expenses you paid for the period. You may use this information to compare the ongoing costs of investing in the Fund and other funds. To do so, compare this 5% hypothetical example with the 5% hypothetical examples that appear in the shareholder reports of the other funds. A small balance maintenance fee of $12.00 that is charged once a year may apply for certain accounts with a value of less than $2,000. This fee is not included in the table below. If it was, the estimate of expenses you paid during the period would be higher, and your ending account value lower, by this amount. In addition, the Fund, as a shareholder in the underlying Fidelity Central Funds, will indirectly bear its pro rata share of the fees and expenses incurred by the underlying Fidelity Central Funds. These fees and expenses are not included in the Fund's annualized expense ratio used to calculate the expense estimate in the table below.
Annual Report
Please note that the expenses shown in the table are meant to highlight your ongoing costs only and do not reflect any transaction costs. Therefore, the second line of the table is useful in comparing ongoing costs only, and will not help you determine the relative total costs of owning different funds. In addition, if these transactional costs were included, your costs would have been higher.
| Beginning
Account Value
February 1, 2007 | Ending
Account Value
July 31, 2007 | Expenses Paid
During Period*
February 1, 2007
to July 31, 2007 |
Class A | | | |
Actual | $ 1,000.00 | $ 1,012.00 | $ 6.98 |
Hypothetical A | $ 1,000.00 | $ 1,017.85 | $ 7.00 |
Class T | | | |
Actual | $ 1,000.00 | $ 1,010.60 | $ 8.23 |
Hypothetical A | $ 1,000.00 | $ 1,016.61 | $ 8.25 |
Class B | | | |
Actual | $ 1,000.00 | $ 1,008.50 | $ 10.71 |
Hypothetical A | $ 1,000.00 | $ 1,014.13 | $ 10.74 |
Class C | | | |
Actual | $ 1,000.00 | $ 1,007.80 | $ 10.70 |
Hypothetical A | $ 1,000.00 | $ 1,014.13 | $ 10.74 |
Small Cap Value | | | |
Actual | $ 1,000.00 | $ 1,013.30 | $ 5.54 |
Hypothetical A | $ 1,000.00 | $ 1,019.29 | $ 5.56 |
Institutional Class | | | |
Actual | $ 1,000.00 | $ 1,013.30 | $ 5.44 |
Hypothetical A | $ 1,000.00 | $ 1,019.39 | $ 5.46 |
A 5% return per year before expenses
* Expenses are equal to each Class' annualized expense ratio (shown in the table below); multiplied by the average account value over the period, multiplied by 181/365 (to reflect the one-half year period).
| Annualized
Expense Ratio |
Class A | 1.40% |
Class T | 1.65% |
Class B | 2.15% |
Class C | 2.15% |
Small Cap Value | 1.11% |
Institutional Class | 1.09% |
Annual Report
Investment Changes
Top Ten Stocks as of July 31, 2007 |
| % of fund's
net assets | % of fund's net assets
6 months ago |
Tesoro Corp. | 3.2 | 2.4 |
Carpenter Technology Corp. | 2.4 | 2.2 |
UAP Holding Corp. | 1.9 | 1.8 |
Arris Group, Inc. | 1.8 | 1.5 |
Jarden Corp. | 1.8 | 1.9 |
Jones Lang LaSalle, Inc. | 1.7 | 1.8 |
AAR Corp. | 1.7 | 1.9 |
RC2 Corp. | 1.7 | 1.7 |
Washington Group International, Inc. | 1.6 | 1.0 |
Telvent GIT SA | 1.6 | 1.1 |
| 19.4 | |
Top Five Market Sectors as of July 31, 2007 |
| % of fund's
net assets | % of fund's net assets
6 months ago |
Financials | 23.1 | 23.6 |
Information Technology | 17.1 | 15.0 |
Industrials | 17.0 | 15.3 |
Consumer Discretionary | 11.9 | 13.0 |
Energy | 10.6 | 8.0 |
Asset Allocation (% of fund's net assets) |
As of July 31, 2007 * | As of January 31, 2007 ** |
| Stocks 98.1% | | | Stocks 92.1% | |
| Short-Term
Investments and
Net Other Assets 1.9% | | | Short-Term
Investments and
Net Other Assets 7.9% | |
* Foreign investments | 7.6% | | ** Foreign investments | 6.5% | |

Annual Report
Investments July 31, 2007
Showing Percentage of Net Assets
Common Stocks - 98.1% |
| Shares | | Value |
CONSUMER DISCRETIONARY - 11.9% |
Auto Components - 0.8% |
Aftermarket Technology Corp. (a) | 150,000 | | $ 4,552,500 |
ArvinMeritor, Inc. | 175,000 | | 3,470,250 |
Hawk Corp. Class A (a) | 223,100 | | 3,257,260 |
| | 11,280,010 |
Distributors - 0.4% |
Building Materials Holding Corp. (d) | 439,100 | | 6,099,099 |
Hotels, Restaurants & Leisure - 1.5% |
Pinnacle Entertainment, Inc. (a) | 412,700 | | 10,940,677 |
Red Robin Gourmet Burgers, Inc. (a) | 140,000 | | 5,399,800 |
Wyndham Worldwide Corp. (a) | 150,000 | | 5,047,500 |
| | 21,387,977 |
Household Durables - 2.7% |
Directed Electronics, Inc. (a) | 180,886 | | 1,365,689 |
Ethan Allen Interiors, Inc. (d) | 285,300 | | 9,745,848 |
Jarden Corp. (a)(d) | 684,600 | | 24,734,598 |
Ryland Group, Inc. | 55,000 | | 1,828,750 |
| | 37,674,885 |
Leisure Equipment & Products - 1.7% |
MarineMax, Inc. (a) | 30,000 | | 561,000 |
RC2 Corp. (a) | 669,555 | | 23,708,943 |
| | 24,269,943 |
Media - 1.0% |
Charter Communications, Inc. Class A (a) | 1,000,000 | | 4,060,000 |
Sinclair Broadcast Group, Inc. Class A | 720,500 | | 9,395,320 |
| | 13,455,320 |
Multiline Retail - 0.0% |
Retail Ventures, Inc. (a) | 23,100 | | 300,762 |
Specialty Retail - 2.3% |
Asbury Automotive Group, Inc. | 250,000 | | 5,530,000 |
Gymboree Corp. (a) | 270,000 | | 11,623,500 |
Lithia Motors, Inc. Class A (sub. vtg.) | 54,000 | | 1,111,860 |
Mothers Work, Inc. (a) | 78,600 | | 1,744,920 |
Payless ShoeSource, Inc. (a) | 200,000 | | 5,324,000 |
Select Comfort Corp. (a)(d) | 390,000 | | 6,216,600 |
| | 31,550,880 |
Textiles, Apparel & Luxury Goods - 1.5% |
Skechers U.S.A., Inc. Class A (sub. vtg.) (a) | 505,000 | | 10,498,950 |
Common Stocks - continued |
| Shares | | Value |
CONSUMER DISCRETIONARY - continued |
Textiles, Apparel & Luxury Goods - continued |
Steven Madden Ltd. | 265,000 | | $ 7,473,000 |
Warnaco Group, Inc. (a) | 90,000 | | 3,249,900 |
| | 21,221,850 |
TOTAL CONSUMER DISCRETIONARY | | 167,240,726 |
CONSUMER STAPLES - 5.2% |
Food & Staples Retailing - 1.1% |
The Pantry, Inc. (a) | 451,000 | | 15,712,840 |
Food Products - 1.6% |
Chiquita Brands International, Inc. | 171,000 | | 3,002,760 |
Diamond Foods, Inc. | 395,400 | | 6,496,422 |
Hain Celestial Group, Inc. (a) | 140,000 | | 3,792,600 |
Marine Harvest ASA (a) | 7,155,000 | | 9,046,862 |
| | 22,338,644 |
Household Products - 0.7% |
Central Garden & Pet Co. Class A (non-vtg.) (a) | 788,300 | | 9,648,792 |
Personal Products - 1.8% |
Physicians Formula Holdings, Inc. | 68,100 | | 1,018,095 |
Playtex Products, Inc. (a) | 771,600 | | 13,819,356 |
Prestige Brands Holdings, Inc. (a) | 892,631 | | 11,166,814 |
| | 26,004,265 |
TOTAL CONSUMER STAPLES | | 73,704,541 |
ENERGY - 10.6% |
Energy Equipment & Services - 2.1% |
Hornbeck Offshore Services, Inc. (a) | 154,100 | | 6,634,005 |
Oil States International, Inc. (a) | 244,760 | | 10,705,802 |
Superior Energy Services, Inc. (a) | 290,000 | | 11,692,800 |
| | 29,032,607 |
Oil, Gas & Consumable Fuels - 8.5% |
Alpha Natural Resources, Inc. (a) | 114,600 | | 2,045,610 |
Cabot Oil & Gas Corp. | 320,000 | | 10,944,000 |
Forest Oil Corp. (a) | 260,300 | | 10,534,341 |
Mariner Energy, Inc. (a) | 530,000 | | 11,198,900 |
Petrohawk Energy Corp. (a) | 790,000 | | 11,842,100 |
Petroleum Development Corp. (a) | 127,622 | | 5,148,271 |
Southwestern Energy Co. (a) | 320,000 | | 13,001,600 |
Common Stocks - continued |
| Shares | | Value |
ENERGY - continued |
Oil, Gas & Consumable Fuels - continued |
Tesoro Corp. | 907,600 | | $ 45,198,478 |
USEC, Inc. (a) | 230,000 | | 3,861,700 |
Western Refining, Inc. | 110,000 | | 6,105,000 |
| | 119,880,000 |
TOTAL ENERGY | | 148,912,607 |
FINANCIALS - 23.1% |
Capital Markets - 1.6% |
ACA Capital Holdings, Inc. (d) | 88,600 | | 518,310 |
American Capital Strategies Ltd. (d) | 78,700 | | 2,988,239 |
KBW, Inc. (d) | 175,000 | | 4,394,250 |
MF Global Ltd. | 54,600 | | 1,361,178 |
Penson Worldwide, Inc. | 80,000 | | 1,412,000 |
Piper Jaffray Companies (a)(d) | 75,000 | | 3,594,000 |
TradeStation Group, Inc. (a) | 718,300 | | 7,592,431 |
| | 21,860,408 |
Commercial Banks - 5.2% |
Boston Private Financial Holdings, Inc. (d) | 610,200 | | 15,553,998 |
Cathay General Bancorp | 266,520 | | 8,158,177 |
Center Financial Corp., California | 354,052 | | 5,261,213 |
Colonial Bancgroup, Inc. | 130,000 | | 2,835,300 |
East West Bancorp, Inc. | 28,800 | | 1,055,808 |
First State Bancorp. | 280,368 | | 4,839,152 |
Hanmi Financial Corp. | 195,040 | | 2,828,080 |
Investors Bancorp, Inc. (a)(d) | 190,000 | | 2,285,700 |
Nara Bancorp, Inc. | 183,270 | | 2,705,065 |
South Financial Group, Inc. | 340,000 | | 7,330,400 |
Sterling Bancshares, Inc. | 235,000 | | 2,446,350 |
UCBH Holdings, Inc. | 150,000 | | 2,466,000 |
UMB Financial Corp. | 195,000 | | 7,281,300 |
Wintrust Financial Corp. | 197,360 | | 7,777,958 |
| | 72,824,501 |
Consumer Finance - 0.9% |
Advanta Corp. Class B | 97,500 | | 2,501,850 |
Cash America International, Inc. | 90,000 | | 3,295,800 |
CompuCredit Corp. (a)(d) | 55,000 | | 1,443,750 |
Dollar Financial Corp. (a) | 210,000 | | 5,262,600 |
| | 12,504,000 |
Common Stocks - continued |
| Shares | | Value |
FINANCIALS - continued |
Diversified Financial Services - 1.1% |
Endeavor Acquisition Corp. (a)(d) | 341,000 | | $ 3,768,050 |
MarketAxess Holdings, Inc. (a) | 450,000 | | 7,474,500 |
Marlin Business Services Corp. (a) | 220,779 | | 4,302,983 |
| | 15,545,533 |
Insurance - 11.2% |
American Equity Investment Life Holding Co. | 1,039,506 | | 11,798,393 |
Aspen Insurance Holdings Ltd. | 360,200 | | 8,806,890 |
Delphi Financial Group, Inc. Class A | 172,850 | | 6,943,385 |
HCC Insurance Holdings, Inc. | 670,920 | | 19,644,538 |
Infinity Property & Casualty Corp. | 90,000 | | 3,963,600 |
IPC Holdings Ltd. | 573,740 | | 14,234,489 |
Max Capital Group Ltd. | 175,000 | | 4,569,250 |
National Financial Partners Corp. (d) | 456,300 | | 21,154,068 |
Navigators Group, Inc. (a) | 104,862 | | 5,485,331 |
Ohio Casualty Corp. | 80,500 | | 3,494,505 |
PartnerRe Ltd. | 30,000 | | 2,130,900 |
Philadelphia Consolidated Holdings Corp. (a) | 59,140 | | 2,137,320 |
Platinum Underwriters Holdings Ltd. | 329,700 | | 10,946,040 |
Tower Group, Inc. | 305,000 | | 8,082,500 |
United America Indemnity Ltd. Class A (a) | 91,022 | | 1,955,153 |
Universal American Financial Corp. (a) | 150,000 | | 2,986,500 |
Willis Group Holdings Ltd. | 195,000 | | 7,915,050 |
Zenith National Insurance Corp. | 524,000 | | 21,148,640 |
| | 157,396,552 |
Real Estate Investment Trusts - 0.3% |
Education Realty Trust, Inc. | 158,300 | | 2,081,645 |
GMH Communities Trust | 264,100 | | 2,218,440 |
| | 4,300,085 |
Real Estate Management & Development - 1.7% |
Jones Lang LaSalle, Inc. | 223,000 | | 24,480,940 |
Thrifts & Mortgage Finance - 1.1% |
BankAtlantic Bancorp, Inc. Class A (non-vtg.) | 59,125 | | 518,526 |
Downey Financial Corp. (d) | 20,000 | | 1,063,800 |
Farmer Mac Class C (non-vtg.) | 140,000 | | 3,917,200 |
Provident Financial Services, Inc. | 100,000 | | 1,410,000 |
Radian Group, Inc. | 65,000 | | 2,191,150 |
Common Stocks - continued |
| Shares | | Value |
FINANCIALS - continued |
Thrifts & Mortgage Finance - continued |
Triad Guaranty, Inc. (a) | 50,000 | | $ 1,378,500 |
Washington Federal, Inc. | 210,000 | | 4,731,300 |
| | 15,210,476 |
TOTAL FINANCIALS | | 324,122,495 |
HEALTH CARE - 3.3% |
Health Care Equipment & Supplies - 0.2% |
Zoll Medical Corp. (a) | 100,000 | | 2,686,000 |
Health Care Providers & Services - 1.2% |
Air Methods Corp. (a) | 209,167 | | 7,969,263 |
Capital Senior Living Corp. (a) | 111,185 | | 985,099 |
Omnicare, Inc. | 50,000 | | 1,658,000 |
Pediatrix Medical Group, Inc. (a) | 100,000 | | 5,396,000 |
| | 16,008,362 |
Life Sciences Tools & Services - 0.6% |
ICON PLC sponsored ADR | 178,720 | | 8,358,734 |
Pharmaceuticals - 1.3% |
Adams Respiratory Therapeutics, Inc. (a) | 135,000 | | 4,996,350 |
Valeant Pharmaceuticals International | 880,000 | | 13,807,200 |
| | 18,803,550 |
TOTAL HEALTH CARE | | 45,856,646 |
INDUSTRIALS - 17.0% |
Aerospace & Defense - 3.1% |
AAR Corp. (a) | 802,300 | | 23,932,609 |
DRS Technologies, Inc. | 144,000 | | 7,539,840 |
Hexcel Corp. (a) | 250,200 | | 5,439,348 |
Orbital Sciences Corp. (a) | 325,000 | | 6,886,750 |
| | 43,798,547 |
Air Freight & Logistics - 1.4% |
Hub Group, Inc. Class A (a) | 180,000 | | 6,123,600 |
Park-Ohio Holdings Corp. (a) | 401,646 | | 9,976,887 |
UTI Worldwide, Inc. | 160,000 | | 4,020,800 |
| | 20,121,287 |
Airlines - 0.2% |
AirTran Holdings, Inc. (a)(d) | 310,000 | | 3,050,400 |
Common Stocks - continued |
| Shares | | Value |
INDUSTRIALS - continued |
Commercial Services & Supplies - 2.8% |
FTI Consulting, Inc. (a) | 360,000 | | $ 14,770,800 |
IKON Office Solutions, Inc. | 200,000 | | 2,772,000 |
Interface, Inc. Class A | 328,590 | | 6,055,914 |
Navigant Consulting, Inc. (a) | 125,000 | | 1,968,750 |
Team, Inc. (a) | 279,628 | | 13,145,312 |
| | 38,712,776 |
Construction & Engineering - 3.6% |
Infrasource Services, Inc. (a) | 175,000 | | 6,058,500 |
Shaw Group, Inc. (a) | 418,000 | | 22,245,960 |
Washington Group International, Inc. (a) | 285,000 | | 22,891,200 |
| | 51,195,660 |
Electrical Equipment - 1.3% |
Belden, Inc. | 320,000 | | 17,529,600 |
Machinery - 1.2% |
AGCO Corp. (a) | 85,000 | | 3,266,550 |
Bucyrus International, Inc. Class A | 8,300 | | 527,548 |
Force Protection, Inc. (a)(d) | 470,000 | | 7,379,000 |
Manitowoc Co., Inc. | 76,520 | | 5,943,308 |
| | 17,116,406 |
Road & Rail - 0.4% |
YRC Worldwide, Inc. (a) | 175,000 | | 5,621,000 |
Trading Companies & Distributors - 3.0% |
Kaman Corp. | 223,822 | | 7,495,799 |
Rush Enterprises, Inc. Class A (a) | 90,000 | | 2,515,500 |
UAP Holding Corp. | 980,980 | | 26,653,227 |
WESCO International, Inc. (a) | 88,000 | | 4,712,400 |
| | 41,376,926 |
TOTAL INDUSTRIALS | | 238,522,602 |
INFORMATION TECHNOLOGY - 17.1% |
Communications Equipment - 2.8% |
Andrew Corp. (a) | 330,000 | | 4,639,800 |
Arris Group, Inc. (a) | 1,685,000 | | 24,971,700 |
Avocent Corp. (a) | 80,000 | | 2,188,000 |
Polycom, Inc. (a) | 245,000 | | 7,587,650 |
| | 39,387,150 |
Common Stocks - continued |
| Shares | | Value |
INFORMATION TECHNOLOGY - continued |
Computers & Peripherals - 0.9% |
Brocade Communications Systems, Inc. (a) | 1,385,000 | | $ 9,750,400 |
Diebold, Inc. | 50,000 | | 2,533,500 |
| | 12,283,900 |
Electronic Equipment & Instruments - 5.7% |
Amphenol Corp. Class A | 40,000 | | 1,370,400 |
Benchmark Electronics, Inc. (a) | 167,900 | | 3,727,380 |
CTS Corp. | 190,000 | | 2,420,600 |
Ingram Micro, Inc. Class A (a) | 837,700 | | 16,795,885 |
Insight Enterprises, Inc. (a) | 680,600 | | 15,354,336 |
Mettler-Toledo International, Inc. (a) | 113,700 | | 10,819,692 |
SYNNEX Corp. (a) | 85,000 | | 1,727,200 |
Tektronix, Inc. | 551,000 | | 18,100,350 |
Vishay Intertechnology, Inc. (a) | 677,491 | | 10,507,885 |
| | 80,823,728 |
Internet Software & Services - 1.0% |
j2 Global Communications, Inc. (a) | 430,800 | | 14,061,312 |
IT Services - 2.7% |
CACI International, Inc. Class A (a) | 135,000 | | 5,999,400 |
ManTech International Corp. Class A (a) | 105,000 | | 3,429,300 |
MoneyGram International, Inc. | 80,000 | | 2,047,200 |
Ness Technologies, Inc. (a) | 265,200 | | 3,118,752 |
Telvent GIT SA | 971,000 | | 22,828,210 |
| | 37,422,862 |
Semiconductors & Semiconductor Equipment - 2.4% |
ANADIGICS, Inc. (a)(d) | 425,000 | | 6,175,250 |
California Micro Devices Corp. (a) | 253,000 | | 1,133,440 |
Entegris, Inc. (a) | 500,000 | | 5,390,000 |
FormFactor, Inc. (a) | 195,900 | | 7,520,601 |
Integrated Device Technology, Inc. (a) | 195,400 | | 3,179,158 |
Microsemi Corp. (a)(d) | 141,400 | | 3,296,034 |
MKS Instruments, Inc. (a) | 173,900 | | 3,947,530 |
Rudolph Technologies, Inc. (a) | 165,244 | | 2,586,069 |
| | 33,228,082 |
Software - 1.6% |
Blackbaud, Inc. | 340,000 | | 7,119,600 |
Quest Software, Inc. (a) | 730,000 | | 10,804,000 |
Common Stocks - continued |
| Shares | | Value |
INFORMATION TECHNOLOGY - continued |
Software - continued |
Sonic Solutions, Inc. (a) | 255,000 | | $ 2,850,900 |
THQ, Inc. (a) | 70,000 | | 2,013,200 |
| | 22,787,700 |
TOTAL INFORMATION TECHNOLOGY | | 239,994,734 |
MATERIALS - 6.1% |
Chemicals - 1.4% |
Airgas, Inc. | 155,000 | | 7,238,500 |
CF Industries Holdings, Inc. | 115,000 | | 6,610,200 |
H.B. Fuller Co. | 175,000 | | 4,835,250 |
OMNOVA Solutions, Inc. (a) | 125,000 | | 707,500 |
Tronox, Inc. Class A | 47,900 | | 569,531 |
| | 19,960,981 |
Containers & Packaging - 0.2% |
Smurfit-Stone Container Corp. (a) | 190,000 | | 2,240,100 |
Metals & Mining - 4.5% |
Carpenter Technology Corp. | 280,000 | | 33,233,200 |
Compass Minerals International, Inc. | 441,466 | | 14,497,743 |
Meridian Gold, Inc. (a) | 428,400 | | 12,093,736 |
Titanium Metals Corp. (a) | 120,000 | | 4,010,400 |
| | 63,835,079 |
TOTAL MATERIALS | | 86,036,160 |
TELECOMMUNICATION SERVICES - 0.9% |
Diversified Telecommunication Services - 0.9% |
General Communications, Inc. Class A (a) | 290,000 | | 3,337,900 |
Level 3 Communications, Inc. (a) | 800,000 | | 4,184,000 |
Time Warner Telecom, Inc. Class A (sub. vtg.) (a) | 230,000 | | 4,496,500 |
| | 12,018,400 |
UTILITIES - 2.9% |
Electric Utilities - 1.1% |
ITC Holdings Corp. | 358,400 | | 15,070,720 |
Maine & Maritimes Corp. (a) | 10,170 | | 275,912 |
| | 15,346,632 |
Independent Power Producers & Energy Traders - 0.5% |
NRG Energy, Inc. (a) | 168,000 | | 6,476,400 |
Common Stocks - continued |
| Shares | | Value |
UTILITIES - continued |
Multi-Utilities - 1.3% |
CMS Energy Corp. | 707,500 | | $ 11,433,200 |
Integrys Energy Group, Inc. | 155,000 | | 7,670,950 |
| | 19,104,150 |
TOTAL UTILITIES | | 40,927,182 |
TOTAL COMMON STOCKS (Cost $1,243,321,810) | 1,377,336,093 |
Money Market Funds - 6.6% |
| | | |
Fidelity Cash Central Fund, 5.38% (b) | 29,921,812 | | 29,921,812 |
Fidelity Securities Lending Cash Central Fund, 5.39% (b)(c) | 63,626,700 | | 63,626,700 |
TOTAL MONEY MARKET FUNDS (Cost $93,548,512) | 93,548,512 |
TOTAL INVESTMENT PORTFOLIO - 104.7% (Cost $1,336,870,322) | | 1,470,884,605 |
NET OTHER ASSETS - (4.7)% | | (66,376,569) |
NET ASSETS - 100% | $ 1,404,508,036 |
Legend |
(a) Non-income producing |
(b) Affiliated fund that is available only to investment companies and other accounts managed by Fidelity Investments. The rate quoted is the annualized seven-day yield of the fund at period end. A complete unaudited listing of the fund's holdings as of its most recent quarter end is available upon request. |
(c) Investment made with cash collateral received from securities on loan. |
(d) Security or a portion of the security is on loan at period end. |
Affiliated Central Funds |
Information regarding fiscal year to date income earned by the Fund from investments in Fidelity Central Funds is as follows: |
Fund | Income earned |
Fidelity Cash Central Fund | $ 2,332,676 |
Fidelity Securities Lending Cash Central Fund | 574,407 |
Total | $ 2,907,083 |
See accompanying notes which are an integral part of the financial statements.
Annual Report
Financial Statements
Statement of Assets and Liabilities
| July 31, 2007 |
Assets | | |
Investment in securities, at value (including securities loaned of $61,245,338) - See accompanying schedule: Unaffiliated issuers (cost $1,243,321,810) | $ 1,377,336,093 | |
Fidelity Central Funds (cost $93,548,512) | 93,548,512 | |
Total Investments (cost $1,336,870,322) | | $ 1,470,884,605 |
Receivable for investments sold | | 4,800,185 |
Receivable for fund shares sold | | 2,028,784 |
Dividends receivable | | 420,385 |
Distributions receivable from Fidelity Central Funds | | 215,151 |
Prepaid expenses | | 2,044 |
Receivable from investment adviser for expense reductions | | 2,556 |
Other receivables | | 1,456 |
Total assets | | 1,478,355,166 |
| | |
Liabilities | | |
Payable for investments purchased | $ 5,969,420 | |
Payable for fund shares redeemed | 2,729,587 | |
Accrued management fee | 1,050,191 | |
Distribution fees payable | 77,896 | |
Other affiliated payables | 342,208 | |
Other payables and accrued expenses | 51,128 | |
Collateral on securities loaned, at value | 63,626,700 | |
Total liabilities | | 73,847,130 |
| | |
Net Assets | | $ 1,404,508,036 |
Net Assets consist of: | | |
Paid in capital | | $ 1,227,191,980 |
Accumulated undistributed net realized gain (loss) on investments and foreign currency transactions | | 43,301,773 |
Net unrealized appreciation (depreciation) on investments | | 134,014,283 |
Net Assets | | $ 1,404,508,036 |
See accompanying notes which are an integral part of the financial statements.
Annual Report
Financial Statements - continued
Statement of Assets and Liabilities - continued
| July 31, 2007 |
| | |
Calculation of Maximum Offering Price
Class A:
Net Asset Value and redemption price per share ($61,356,936 ÷ 4,278,520 shares) | | $ 14.34 |
| | |
Maximum offering price per share (100/94.25 of $14.34) | | $ 15.21 |
Class T:
Net Asset Value and redemption price per share ($51,518,120 ÷ 3,607,221 shares) | | $ 14.28 |
| | |
Maximum offering price per share (100/96.50 of $14.28) | | $ 14.80 |
Class B:
Net Asset Value and offering price per share ($12,075,406 ÷ 851,177 shares)A | | $ 14.19 |
| | |
Class C:
Net Asset Value and offering price per share ($34,155,119 ÷ 2,407,204 shares)A | | $ 14.19 |
| | |
Small Cap Value:
Net Asset Value, offering price and redemption price per share ($1,233,808,057 ÷ 85,510,937 shares) | | $ 14.43 |
| | |
Institutional Class:
Net Asset Value, offering price and redemption price per share ($11,594,398 ÷ 803,667 shares) | | $ 14.43 |
A Redemption price per share is equal to net asset value less any applicable contingent deferred sales charge.
See accompanying notes which are an integral part of the financial statements.
Annual Report
Statement of Operations
| Year ended July 31, 2007 |
Investment Income | | |
Dividends | | $ 9,751,207 |
Interest | | 1,960 |
Income from Fidelity Central Funds | | 2,907,083 |
Total income | | 12,660,250 |
| | |
Expenses | | |
Management fee
Basic fee | $ 9,391,047 | |
Performance adjustment | 1,453,969 | |
Transfer agent fees | 3,238,967 | |
Distribution fees | 826,786 | |
Accounting and security lending fees | 435,846 | |
Custodian fees and expenses | 39,260 | |
Independent trustees' compensation | 4,149 | |
Registration fees | 121,175 | |
Audit | 55,232 | |
Legal | 11,142 | |
Miscellaneous | 28,936 | |
Total expenses before reductions | 15,606,509 | |
Expense reductions | (124,894) | 15,481,615 |
Net investment income (loss) | | (2,821,365) |
Realized and Unrealized Gain (Loss) Net realized gain (loss) on: | | |
Investment securities: | | |
Unaffiliated issuers | 58,292,629 | |
Foreign currency transactions | 8,949 | |
Total net realized gain (loss) | | 58,301,578 |
Change in net unrealized appreciation (depreciation) on: Investment securities | 108,216,200 | |
Assets and liabilities in foreign currencies | 372 | |
Total change in net unrealized appreciation (depreciation) | | 108,216,572 |
Net gain (loss) | | 166,518,150 |
Net increase (decrease) in net assets resulting from operations | | $ 163,696,785 |
See accompanying notes which are an integral part of the financial statements.
Annual Report
Financial Statements - continued
Statement of Changes in Net Assets
| Year ended
July 31,
2007 | Year ended
July 31,
2006 |
Increase (Decrease) in Net Assets | | |
Operations | | |
Net investment income (loss) | $ (2,821,365) | $ 38,256 |
Net realized gain (loss) | 58,301,578 | 59,284,810 |
Change in net unrealized appreciation (depreciation) | 108,216,572 | (30,701,367) |
Net increase (decrease) in net assets resulting
from operations | 163,696,785 | 28,621,699 |
Distributions to shareholders from net investment income | - | (633,037) |
Distributions to shareholders from net realized gain | (55,419,267) | (20,371,695) |
Total distributions | (55,419,267) | (21,004,732) |
Share transactions - net increase (decrease) | 206,517,786 | 457,176,942 |
Redemption fees | 174,668 | 517,538 |
Total increase (decrease) in net assets | 314,969,972 | 465,311,447 |
| | |
Net Assets | | |
Beginning of period | 1,089,538,064 | 624,226,617 |
End of period | $ 1,404,508,036 | $ 1,089,538,064 |
See accompanying notes which are an integral part of the financial statements.
Annual Report
Financial Highlights - Class A
Years ended July 31, | 2007 | 2006 | 2005 H |
Selected Per-Share Data | | | |
Net asset value, beginning of period | $ 13.17 | $ 12.80 | $ 10.00 |
Income from Investment Operations | | | |
Net investment income (loss) E | (.06) | (.03) | (.04) |
Net realized and unrealized gain (loss) | 1.90 | .74 | 2.84 |
Total from investment operations | 1.84 | .71 | 2.80 |
Distributions from net investment income | - | - | (.01) |
Distributions from net realized gain | (.67) | (.35) | - |
Total distributions | (.67) | (.35) | (.01) |
Redemption fees added to paid in capital E | - J | .01 | .01 |
Net asset value, end of period | $ 14.34 | $ 13.17 | $ 12.80 |
Total Return B, C, D | 14.59% | 5.72% | 28.06% |
Ratios to Average Net Assets F, I | | | |
Expenses before reductions | 1.45% | 1.51% | 1.46% A |
Expenses net of fee waivers, if any | 1.40% | 1.40% | 1.44% A |
Expenses net of all reductions | 1.40% | 1.36% | 1.38% A |
Net investment income (loss) | (.44)% | (.24)% | (.46)% A |
Supplemental Data | | | |
Net assets, end of period (000 omitted) | $ 61,357 | $ 39,931 | $ 9,390 |
Portfolio turnover rate G | 67% | 93% | 60% A |
A Annualized
B Total returns for periods of less than one year are not annualized.
C Total returns would have been lower had certain expenses not been reduced during the periods shown.
D Total returns do not include the effect of the sales charges.
E Calculated based on average shares outstanding during the period.
F Fees and expenses of the underlying Fidelity Central Funds are not included in the Fund's expense ratio. The Fund indirectly bears its proportionate share of the expenses of any underlying Fidelity Central Funds.
G Amount does not include the portfolio activity of any underlying Fidelity Central Funds.
H For the period November 3, 2004 (commencement of operations) to July 31, 2005.
I Expense ratios reflect operating expenses of the class. Expenses before reductions do not reflect amounts reimbursed by the investment adviser or reductions from brokerage service arrangements or other expense offset arrangements and do not represent the amount paid by the class during periods when reimbursements or reductions occur. Expense ratios before reductions for start-up periods may not be representative of longer-term operating periods. Expenses net of fee waivers reflect expenses after reimbursement by the investment adviser but prior to reductions from brokerage service arrangements or other expense offset arrangements. Expenses net of all reductions represent the net expenses paid by the class.
J Amount represents less than $.01 per share.
See accompanying notes which are an integral part of the financial statements.
Annual Report
Financial Highlights - Class T
Years ended July 31, | 2007 | 2006 | 2005 H |
Selected Per-Share Data | | | |
Net asset value, beginning of period | $ 13.13 | $ 12.78 | $ 10.00 |
Income from Investment Operations | | | |
Net investment income (loss) E | (.10) | (.07) | (.06) |
Net realized and unrealized gain (loss) | 1.90 | .74 | 2.83 |
Total from investment operations | 1.80 | .67 | 2.77 |
Distributions from net realized gain | (.65) | (.33) | - |
Redemption fees added to paid in capital E | - J | .01 | .01 |
Net asset value, end of period | $ 14.28 | $ 13.13 | $ 12.78 |
Total Return B, C, D | 14.34% | 5.47% | 27.80% |
Ratios to Average Net Assets F, I | | | |
Expenses before reductions | 1.66% | 1.67% | 1.72% A |
Expenses net of fee waivers, if any | 1.65% | 1.65% | 1.68% A |
Expenses net of all reductions | 1.65% | 1.61% | 1.62% A |
Net investment income (loss) | (.69)% | (.49)% | (.70)% A |
Supplemental Data | | | |
Net assets, end of period (000 omitted) | $ 51,518 | $ 45,460 | $ 12,725 |
Portfolio turnover rate G | 67% | 93% | 60% A |
A Annualized
B Total returns for periods of less than one year are not annualized.
C Total returns would have been lower had certain expenses not been reduced during the periods shown.
D Total returns do not include the effect of the sales charges.
E Calculated based on average shares outstanding during the period.
F Fees and expenses of the underlying Fidelity Central Funds are not included in the Fund's expense ratio. The Fund indirectly bears its proportionate share of the expenses of any underlying Fidelity Central Funds.
G Amount does not include the portfolio activity of any underlying Fidelity Central Funds.
H For the period November 3, 2004 (commencement of operations) to July 31, 2005.
I Expense ratios reflect operating expenses of the class. Expenses before reductions do not reflect amounts reimbursed by the investment adviser or reductions from brokerage service arrangements or other expense offset arrangements and do not represent the amount paid by the class during periods when reimbursements or reductions occur. Expense ratios before reductions for start-up periods may not be representative of longer-term operating periods. Expenses net of fee waivers reflect expenses after reimbursement by the investment adviser but prior to reductions from brokerage service arrangements or other expense offset arrangements. Expenses net of all reductions represent the net expenses paid by the class.
J Amount represents less than $.01 per share.
See accompanying notes which are an integral part of the financial statements.
Annual Report
Financial Highlights - Class B
Years ended July 31, | 2007 | 2006 | 2005 H |
Selected Per-Share Data | | | |
Net asset value, beginning of period | $ 13.07 | $ 12.73 | $ 10.00 |
Income from Investment Operations | | | |
Net investment income (loss) E | (.17) | (.13) | (.10) |
Net realized and unrealized gain (loss) | 1.90 | .74 | 2.82 |
Total from investment operations | 1.73 | .61 | 2.72 |
Distributions from net realized gain | (.61) | (.28) | - |
Redemption fees added to paid in capital E | - J | .01 | .01 |
Net asset value, end of period | $ 14.19 | $ 13.07 | $ 12.73 |
Total Return B, C, D | 13.78% | 4.97% | 27.30% |
Ratios to Average Net Assets F, I | | | |
Expenses before reductions | 2.20% | 2.26% | 2.24% A |
Expenses net of fee waivers, if any | 2.15% | 2.15% | 2.19% A |
Expenses net of all reductions | 2.15% | 2.11% | 2.13% A |
Net investment income (loss) | (1.19)% | (.99)% | (1.21)% A |
Supplemental Data | | | |
Net assets, end of period (000 omitted) | $ 12,075 | $ 10,214 | $ 3,931 |
Portfolio turnover rate G | 67% | 93% | 60% A |
A Annualized
B Total returns for periods of less than one year are not annualized.
C Total returns would have been lower had certain expenses not been reduced during the periods shown.
D Total returns do not include the effect of the contingent deferred sales charge.
E Calculated based on average shares outstanding during the period.
F Fees and expenses of the underlying Fidelity Central Funds are not included in the Fund's expense ratio. The Fund indirectly bears its proportionate share of the expenses of any underlying Fidelity Central Funds.
G Amount does not include the portfolio activity of any underlying Fidelity Central Funds.
H For the period November 3, 2004 (commencement of operations) to July 31, 2005.
I Expense ratios reflect operating expenses of the class. Expenses before reductions do not reflect amounts reimbursed by the investment adviser or reductions from brokerage service arrangements or other expense offset arrangements and do not represent the amount paid by the class during periods when reimbursements or reductions occur. Expense ratios before reductions for start-up periods may not be representative of longer-term operating periods. Expenses net of fee waivers reflect expenses after reimbursement by the investment adviser but prior to reductions from brokerage service arrangements or other expense offset arrangements. Expenses net of all reductions represent the net expenses paid by the class.
J Amount represents less than $.01 per share.
See accompanying notes which are an integral part of the financial statements.
Annual Report
Financial Highlights - Class C
Years ended July 31, | 2007 | 2006 | 2005 H |
Selected Per-Share Data | | | |
Net asset value, beginning of period | $ 13.07 | $ 12.74 | $ 10.00 |
Income from Investment Operations | | | |
Net investment income (loss) E | (.17) | (.13) | (.10) |
Net realized and unrealized gain (loss) | 1.90 | .74 | 2.83 |
Total from investment operations | 1.73 | .61 | 2.73 |
Distributions from net realized gain | (.61) | (.29) | - |
Redemption fees added to paid in capital E | - J | .01 | .01 |
Net asset value, end of period | $ 14.19 | $ 13.07 | $ 12.74 |
Total Return B, C, D | 13.77% | 4.92% | 27.40% |
Ratios to Average Net Assets F, I | | | |
Expenses before reductions | 2.20% | 2.22% | 2.17% A |
Expenses net of fee waivers, if any | 2.15% | 2.15% | 2.17% A |
Expenses net of all reductions | 2.15% | 2.11% | 2.11% A |
Net investment income (loss) | (1.19)% | (.99)% | (1.19)% A |
Supplemental Data | | | |
Net assets, end of period (000 omitted) | $ 34,155 | $ 26,791 | $ 11,732 |
Portfolio turnover rate G | 67% | 93% | 60% A |
A Annualized
B Total returns for periods of less than one year are not annualized.
C Total returns would have been lower had certain expenses not been reduced during the periods shown.
D Total returns do not include the effect of the contingent deferred sales charge.
E Calculated based on average shares outstanding during the period.
F Fees and expenses of the underlying Fidelity Central Funds are not included in the Fund's expense ratio. The Fund indirectly bears its proportionate share of the expenses of any underlying Fidelity Central Funds.
G Amount does not include the portfolio activity of any underlying Fidelity Central Funds.
H For the period November 3, 2004 (commencement of operations) to July 31, 2005.
I Expense ratios reflect operating expenses of the class. Expenses before reductions do not reflect amounts reimbursed by the investment adviser or reductions from brokerage service arrangements or other expense offset arrangements and do not represent the amount paid by the class during periods when reimbursements or reductions occur. Expense ratios before reductions for start-up periods may not be representative of longer-term operating periods. Expenses net of fee waivers reflect expenses after reimbursement by the investment adviser but prior to reductions from brokerage service arrangements or other expense offset arrangements. Expenses net of all reductions represent the net expenses paid by the class.
J Amount represents less than $.01 per share.
See accompanying notes which are an integral part of the financial statements.
Annual Report
Financial Highlights - Small Cap Value
Years ended July 31, | 2007 | 2006 | 2005 G |
Selected Per-Share Data | | | |
Net asset value, beginning of period | $ 13.22 | $ 12.83 | $ 10.00 |
Income from Investment Operations | | | |
Net investment income (loss) D | (.02) | .01 | (.01) |
Net realized and unrealized gain (loss) | 1.91 | .74 | 2.84 |
Total from investment operations | 1.89 | .75 | 2.83 |
Distributions from net investment income | - | (.01) | (.01) |
Distributions from net realized gain | (.68) | (.36) | - |
Total distributions | (.68) | (.37) | (.01) |
Redemption fees added to paid in capital D | - I | .01 | .01 |
Net asset value, end of period | $ 14.43 | $ 13.22 | $ 12.83 |
Total Return B, C | 14.96% | 6.07% | 28.36% |
Ratios to Average Net Assets E, H | | | |
Expenses before reductions | 1.11% | 1.09% | 1.05% A |
Expenses net of fee waivers, if any | 1.11% | 1.09% | 1.05% A |
Expenses net of all reductions | 1.11% | 1.06% | .99% A |
Net investment income (loss) | (.15)% | .06% | (.08)% A |
Supplemental Data | | | |
Net assets, end of period (000 omitted) | $ 1,233,808 | $ 957,720 | $ 582,689 |
Portfolio turnover rate F | 67% | 93% | 60% A |
A Annualized
B Total returns for periods of less than one year are not annualized.
C Total returns would have been lower had certain expenses not been reduced during the periods shown.
D Calculated based on average shares outstanding during the period.
E Fees and expenses of the underlying Fidelity Central Funds are not included in the Fund's expense ratio. The Fund indirectly bears its proportionate share of the expenses of any underlying Fidelity Central Funds.
F Amount does not include the portfolio activity of any underlying Fidelity Central Funds.
G For the period November 3, 2004 (commencement of operations) to July 31, 2005.
H Expense ratios reflect operating expenses of the class. Expenses before reductions do not reflect amounts reimbursed by the investment adviser or reductions from brokerage service arrangements or other expense offset arrangements and do not represent the amount paid by the class during periods when reimbursements or reductions occur. Expense ratios before reductions for start-up periods may not be representative of longer-term operating periods. Expenses net of fee waivers reflect expenses after reimbursement by the investment adviser but prior to reductions from brokerage service arrangements or other expense offset arrangements. Expenses net of all reductions represent the net expenses paid by the class.
I Amount represents less than $.01 per share.
See accompanying notes which are an integral part of the financial statements.
Annual Report
Financial Highlights - Institutional Class
Years ended July 31, | 2007 | 2006 | 2005 G |
Selected Per-Share Data | | | |
Net asset value, beginning of period | $ 13.22 | $ 12.83 | $ 10.00 |
Income from Investment Operations | | | |
Net investment income (loss) D | (.02) | .01 | (.01) |
Net realized and unrealized gain (loss) | 1.91 | .74 | 2.84 |
Total from investment operations | 1.89 | .75 | 2.83 |
Distributions from net investment income | - | (.01) | (.01) |
Distributions from net realized gain | (.68) | (.36) | - |
Total distributions | (.68) | (.37) | (.01) |
Redemption fees added to paid in capital D | - I | .01 | .01 |
Net asset value, end of period | $ 14.43 | $ 13.22 | $ 12.83 |
Total Return B, C | 14.99% | 6.08% | 28.36% |
Ratios to Average Net Assets E, H | | | |
Expenses before reductions | 1.10% | 1.08% | 1.07% A |
Expenses net of fee waivers, if any | 1.10% | 1.08% | 1.07% A |
Expenses net of all reductions | 1.10% | 1.05% | 1.01% A |
Net investment income (loss) | (.13)% | .08% | (.10)% A |
Supplemental Data | | | |
Net assets, end of period (000 omitted) | $ 11,594 | $ 9,422 | $ 3,761 |
Portfolio turnover rate F | 67% | 93% | 60% A |
A Annualized
B Total returns for periods of less than one year are not annualized.
C Total returns would have been lower had certain expenses not been reduced during the periods shown.
D Calculated based on average shares outstanding during the period.
E Fees and expenses of the underlying Fidelity Central Funds are not included in the Fund's expense ratio. The Fund indirectly bears its proportionate share of the expenses of any underlying Fidelity Central Funds.
F Amount does not include the portfolio activity of any underlying Fidelity Central Funds.
G For the period November 3, 2004 (commencement of operations) to July 31, 2005..
H Expense ratios reflect operating expenses of the class. Expenses before reductions do not reflect amounts reimbursed by the investment adviser or reductions from brokerage service arrangements or other expense offset arrangements and do not represent the amount paid by the class during periods when reimbursements or reductions occur. Expense ratios before reductions for start-up periods may not be representative of longer-term operating periods. Expenses net of fee waivers reflect expenses after reimbursement by the investment adviser but prior to reductions from brokerage service arrangements or other expense offset arrangements. Expenses net of all reductions represent the net expenses paid by the class.
I Amount represents less than $.01 per share.
See accompanying notes which are an integral part of the financial statements.
Annual Report
Notes to Financial Statements
For the period ended July 31, 2007
1. Organization.
Fidelity Small Cap Value Fund (the Fund) is a non-diversified fund of Fidelity Securities Fund (the trust) and is authorized to issue an unlimited number of shares. The trust is registered under the Investment Company Act of 1940, as amended (the 1940 Act), as an open-end management investment company organized as a Massachusetts business trust. The Fund offers Class A, Class T, Class B, Class C, Small Cap Value and Institutional Class shares, each of which has equal rights as to assets and voting privileges. Each class has exclusive voting rights with respect to matters that affect that class. Class B shares will automatically convert to Class A shares after a holding period of seven years from the initial date of purchase. Investment income, realized and unrealized capital gains and losses, the common expenses of the Fund, and certain fund-level expense reductions, if any, are allocated on a pro rata basis to each class based on the relative net assets of each class to the total net assets of the Fund. Each class differs with respect to transfer agent and distribution and service plan fees incurred. Certain expense reductions also differ by class.
2. Investments in Fidelity Central Funds.
The Fund may invest in Fidelity Central Funds which are open-end investment companies available only to other investment companies and accounts managed by Fidelity Management & Research Company (FMR) and its affiliates. The Fund's Schedule of Investments lists each of the Fidelity Central Funds as an investment of the Fund, but does not include the underlying holdings of each Fidelity Central Fund. As an Investing Fund, the Fund indirectly bears its proportionate share of the expenses of the underlying Fidelity Central Funds.
The Money Market Central Funds seek preservation of capital and current income and are managed by Fidelity Investments Money Management, Inc. (FIMM), an affiliate of FMR.
A complete list of holdings for each Fidelity Central Fund is available upon request or at the SEC's website at www.sec.gov. In addition, the financial statements of the Fidelity Central Funds, which are not covered by the Fund's Report of Independent Registered Public Accounting Firm, are available on the SEC's web site, or upon request.
3. Significant Accounting Policies.
The financial statements have been prepared in conformity with accounting principles generally accepted in the United States of America, which require management to make certain estimates and assumptions at the date of the financial statements. The following summarizes the significant accounting policies of the Fund:
Annual Report
Notes to Financial Statements - continued
3. Significant Accounting Policies - continued
Security Valuation. Investments are valued and net asset value (NAV) per share is calculated (NAV calculation) as of the close of business of the New York Stock Exchange (NYSE), normally 4:00 p.m. Eastern time. Wherever possible, the Fund uses independent pricing services approved by the Board of Trustees to value its investments.
Equity securities, including restricted securities, for which market quotations are readily available, are valued at the last reported sale price or official closing price as reported by an independent pricing service on the primary market or exchange on which they are traded. In the event there were no sales during the day or closing prices are not available, securities are valued at the last quoted bid price. Investments in open-end mutual funds, including the Fidelity Central Funds, are valued at their closing net asset value each business day. Short-term securities with remaining maturities of sixty days or less for which quotations are not readily available are valued at amortized cost, which approximates value.
When current market prices or quotations are not readily available or do not accurately reflect fair value, valuations may be determined in accordance with procedures adopted by the Board of Trustees. For example, when developments occur between the close of a market and the close of the NYSE that may materially affect the value of some or all of the securities, or when trading in a security is halted, those securities may be fair valued. Factors used in the determination of fair value may include monitoring news to identify significant market or security specific events such as changes in the value of U.S. securities markets, reviewing developments in foreign markets and evaluating the performance of ADRs, futures contracts and exchange-traded funds. Because the Fund's utilization of fair value pricing depends on market activity, the frequency with which fair value pricing is used cannot be predicted and may be utilized to a significant extent. The value of securities used for NAV calculation under fair value pricing may differ from published prices for the same securities.
Foreign Currency. The Fund uses foreign currency contracts to facilitate transactions in foreign-denominated securities. Losses from these transactions may arise from changes in the value of the foreign currency or if the counterparties do not perform under the contracts' terms.
Foreign-denominated assets, including investment securities, and liabilities are translated into U.S. dollars at the exchange rate at period end. Purchases and sales of investment securities, income and dividends received and expenses denominated in foreign currencies are translated into U.S. dollars at the exchange rate in effect on the transaction date.
Annual Report
3. Significant Accounting Policies - continued
Foreign Currency - continued
The effects of exchange rate fluctuations on investments are included with the net realized and unrealized gain (loss) on investment securities. Other foreign currency transactions resulting in realized and unrealized gain (loss) are disclosed separately.
Investment Transactions and Income. For financial reporting purposes, the Fund's investment holdings and NAV include trades executed through the end of the last business day of the period. The NAV for processing shareholder transactions includes trades executed through the end of the prior business day. Gains and losses on securities sold are determined on the basis of identified cost. Dividend income is recorded on the ex-dividend date, except for certain dividends from foreign securities where the ex-dividend date may have passed, which are recorded as soon as the Fund is informed of the ex-dividend date. Non-cash dividends included in dividend income, if any, are recorded at the fair market value of the securities received. Distributions received on securities that represent a return of capital or capital gain are recorded as a reduction of cost of investments and/or as a realized gain. The Fund estimates the components of distributions received that may be considered return of capital distributions or capital gain distributions. Interest income and distributions from the Fidelity Central Funds are accrued as earned. Interest income includes coupon interest and amortization of premium and accretion of discount on debt securities. Investment income is recorded net of foreign taxes withheld where recovery of such taxes is uncertain.
Expenses. Most expenses of the trust can be directly attributed to a fund. Expenses which cannot be directly attributed are apportioned among each Fund in the trust. Expense estimates are accrued in the period to which they relate and adjustments are made when actual amounts are known.
Income Tax Information and Distributions to Shareholders. Each year, the Fund intends to qualify as a regulated investment company by distributing all of its taxable income and realized gains under Subchapter M of the Internal Revenue Code. As a result, no provision for income taxes is required in the accompanying financial statements. Foreign taxes are provided for based on the Fund's understanding of the tax rules and rates that exist in the foreign markets in which it invests.
Distributions are recorded on the ex-dividend date. Income dividends and capital gain distributions are declared separately for each class. Income and capital gain distributions are determined in accordance with income tax regulations, which may differ from generally accepted accounting principles. In addition, the Fund will claim a portion of the payment made to redeeming shareholders as a distribution for income tax purposes.
Annual Report
Notes to Financial Statements - continued
3. Significant Accounting Policies - continued
Income Tax Information and Distributions to Shareholders - continued
Capital accounts within the financial statements are adjusted for permanent book-tax differences. These adjustments have no impact on net assets or the results of operations. Temporary book-tax differences will reverse in a subsequent period.
Book-tax differences are primarily due to foreign currency transactions and losses deferred due to wash sales.
The tax-basis components of distributable earnings and the federal tax cost as of period end were as follows:
Unrealized appreciation | $ 221,224,167 | |
Unrealized depreciation | (87,439,775) | |
Net unrealized appreciation (depreciation) | 133,784,392 | |
Undistributed ordinary income | 1,429,895 | |
Undistributed long-term capital gain | 35,852,159 | |
| | |
Cost for federal income tax purposes | $ 1,337,100,213 | |
The tax character of distributions paid was as follows:
| July 31, 2007 | July 31, 2006 |
Ordinary Income | $ 15,936,394 | $ 21,004,732 |
Long-term Capital Gains | 39,482,873 | - |
Total | $ 55,419,267 | $ 21,004,732 |
Short-Term Trading (Redemption) Fees. Shares held in the Fund less than 90 days are subject to a redemption fee equal to 1.50% of the proceeds of the redeemed shares. All redemption fees, including any estimated redemption fees paid by FMR, are retained by the Fund and accounted for as an addition to paid in capital.
New Accounting Pronouncements. In July 2006, Financial Accounting Standards Board Interpretation No. 48, Accounting for Uncertainty in Income Taxes - an interpretation of FASB Statement 109 (FIN 48), was issued and is effective on the last business day of the semiannual reporting period for fiscal years beginning after December 15, 2006. FIN 48 sets forth a threshold for financial statement recognition, measurement and disclosure of a tax position taken or expected to be taken on a tax return. Management has concluded that the adoption of FIN 48 will not result in a material impact on the Fund's net assets, results of operations and financial statement disclosures.
In addition, in September 2006, Statement of Financial Accounting Standards No. 157, Fair Value Measurements (SFAS 157), was issued and is effective for fiscal years beginning after November 15, 2007. SFAS 157 defines fair value, establishes a framework for
Annual Report
3. Significant Accounting Policies - continued
New Accounting Pronouncements - continued
measuring fair value and expands disclosures about fair value measurements. Management is currently evaluating the impact the adoption of SFAS 157 will have on the Fund's financial statement disclosures.
4. Operating Policies.
Repurchase Agreements. FMR has received an Exemptive Order from the Securities and Exchange Commission (the SEC) which permits the Fund and other affiliated entities of FMR to transfer uninvested cash balances into joint trading accounts which are then invested in repurchase agreements. The Fund may also invest directly with institutions in repurchase agreements. Repurchase agreements are collateralized by government or non-government securities. Upon settlement date, collateral is held in segregated accounts with custodian banks and may be obtained in the event of a default of the counterparty. The Fund monitors, on a daily basis, the value of the collateral to ensure it is at least equal to the principal amount of the repurchase agreement (including accrued interest). In the event of a default by the counterparty, realization of the collateral proceeds could be delayed, during which time the value of the collateral may decline.
5. Purchases and Sales of Investments.
Purchases and sales of securities, other than short-term securities, aggregated $1,035,796,031 and $851,598,507, respectively.
6. Fees and Other Transactions with Affiliates.
Management Fee. FMR and its affiliates provide the Fund with investment management related services for which the Fund pays a monthly management fee. The management fee is the sum of an individual fund fee rate that is based on an annual rate of .45% of the Fund's average net assets and a group fee rate that averaged ..26% during the period. The group fee rate is based upon the average net assets of all the mutual funds advised by FMR. The group fee rate decreases as assets under management increase and increases as assets under management decrease. In addition, the management fee is subject to a performance adjustment (up to a maximum of ±.20% of the Fund's average net assets over a 36 month performance period). The upward or downward adjustment to the management fee is based on the relative investment performance of the retail class of the Fund, Small Cap Value as compared to an appropriate benchmark index. For the period, the total annual management fee rate, including the performance adjustment, was .82% of the Fund's average net assets.
Annual Report
Notes to Financial Statements - continued
6. Fees and Other Transactions with Affiliates - continued
Distribution and Service Plan. In accordance with Rule 12b-1 of the 1940 Act, the Fund has adopted separate Distribution and Service Plans for each class of shares. Certain classes pay Fidelity Distributors Corporation (FDC), an affiliate of FMR, separate Distribution and Service Fees, each of which is based on an annual percentage of each class' average net assets. In addition, FDC may pay financial intermediaries for selling shares of the Fund and providing shareholder support services. For the period, the Distribution and Service Fee rates and the total amounts paid to and retained by FDC were as follows:
| Distribution
Fee | Service
Fee | Paid to
FDC | Retained
by FDC |
Class A | 0% | .25% | $ 132,888 | $ 15,618 |
Class T | .25% | .25% | 255,228 | 3,596 |
Class B | .75% | .25% | 119,704 | 90,112 |
Class C | .75% | .25% | 318,966 | 118,809 |
| | | $ 826,786 | $ 228,135 |
Sales Load. FDC receives a front-end sales charge of up to 5.75% for selling Class A shares, and 3.50% for selling Class T shares, some of which is paid to financial intermediaries for selling shares of the Fund. FDC receives the proceeds of contingent deferred sales charges levied on Class A, Class T, Class B, and Class C redemptions. These charges depend on the holding period. The deferred sales charges range from 5% to 1% for Class B, 1% for Class C, 1.00% to .50% for certain purchases of Class A shares and .25% for certain purchases of Class T shares.
For the period, sales charge amounts retained by FDC were as follows:
| Retained
by FDC |
Class A | $ 78,420 |
Class T | 20,737 |
Class B* | 20,164 |
Class C* | 6,183 |
| $ 125,504 |
* When Class B and Class C shares are initially sold, FDC pays commissions from its own resources to financial intermediaries through which the sales are made.
Transfer Agent Fees. Fidelity Investments Institutional Operations Company, Inc. (FIIOC), an affiliate of FMR, is the transfer, dividend disbursing and shareholder servicing agent for each class of the Fund, except for Small Cap Value. Fidelity Service Company, Inc. (FSC), an affiliate of FMR, is the transfer agent for Small Cap Value shares. FIIOC and FSC receive account fees and asset-based fees that vary according to
Annual Report
6. Fees and Other Transactions with Affiliates - continued
Transfer Agent Fees - continued
the account size and type of account of the shareholders of the respective classes of the Fund. FIIOC and FSC pay for typesetting, printing and mailing of shareholder reports, except proxy statements. For the period, the total transfer agent fees paid by each class to FIIOC or FSC, were as follows:
| Amount | % of
Average
Net Assets |
Class A | $ 169,502 | .32 |
Class T | 142,472 | .28 |
Class B | 38,602 | .32 |
Class C | 102,201 | .32 |
Small Cap Value | 2,761,176 | .24 |
Institutional Class | 25,014 | .22 |
| $ 3,238,967 | |
Accounting and Security Lending Fees. FSC maintains the Fund's accounting records. The accounting fee is based on the level of average net assets for the month. Under a separate contract, FSC administers the security lending program. The security lending fee is based on the number and duration of lending transactions.
Brokerage Commissions. The Fund placed a portion of its portfolio transactions with brokerage firms which are affiliates of the investment adviser. The commissions paid to these affiliated firms were $15,149 for the period.
7. Committed Line of Credit.
The Fund participates with other funds managed by FMR in a $4.2 billion credit facility (the "line of credit") to be utilized for temporary or emergency purposes to fund shareholder redemptions or for other short-term liquidity purposes. The Fund has agreed to pay commitment fees on its pro rata portion of the line of credit, which amounted to $2,273 and is reflected in Miscellaneous Expense on the Statement of Operations. During the period, there were no borrowings on this line of credit.
8. Security Lending.
The Fund lends portfolio securities from time to time in order to earn additional income. On the settlement date of the loan, the Fund receives collateral (in the form of U.S. Treasury obligations, letters of credit and/or cash) against the loaned securities and maintains collateral in an amount not less than 100% of the market value of the loaned securities during the period of the loan. The market value of the loaned securities is determined at the close of business of the Fund and any additional required collateral is
Annual Report
Notes to Financial Statements - continued
8. Security Lending - continued
delivered to the Fund on the next business day. If the borrower defaults on its obligation to return the securities loaned because of insolvency or other reasons, a fund could experience delays and costs in recovering the securities loaned or in gaining access to the collateral. Any cash collateral received is invested in the Fidelity Securities Lending Cash Central Fund. The value of loaned securities and cash collateral at period end are disclosed on the Fund's Statement of Assets and Liabilities. Security lending income represents the income earned on investing cash collateral, less fees and expenses associated with the loan, plus any premium payments that may be received on the loan of certain types of securities. Security lending income is presented in the Statement of Operations as a component of income from Fidelity Central Funds Net income from lending portfolio securities during the period amounted to $574,407.
9. Expense Reductions.
FMR voluntarily agreed to reimburse each class to the extent annual operating expenses exceeded certain levels of average net assets as noted in the table below. Some expenses, for example interest expense, including commitment fees, are excluded from this reimbursement.
The following classes were in reimbursement during the period:
| Expense
Limitations | Reimbursement
from adviser |
| | |
Class A | 1.40% | $ 25,098 |
Class T | 1.65% | 3,109 |
Class B | 2.15% | 6,125 |
Class C | 2.15% | 15,677 |
| | $ 50,009 |
Many of the brokers with whom FMR places trades on behalf of the Fund provided services to the Fund in addition to trade execution. These services included payments of certain expenses on behalf of the Fund totaling $15,697 for the period. In addition, through arrangements with the Fund's custodian and each class' transfer agent, credits realized as a result of uninvested cash balances were used to reduce the Fund's expenses.
Annual Report
9. Expense Reductions - continued
During the period, these credits reduced the Fund's custody expenses by $799. During the period, credits reduced each class' transfer agent expense as noted in the table below.
| Transfer Agent
expense reduction | |
Class A | $ 472 | |
Small Cap Value | 55,667 | |
Institutional Class | 27 | |
| $ 56,166 | |
10. Other.
The Fund's organizational documents provide former and current trustees and officers with a limited indemnification against liabilities arising in connection with the performance of their duties to the Fund. In the normal course of business, the Fund may also enter into contracts that provide general indemnifications. The Fund's maximum exposure under these arrangements is unknown as this would be dependent on future claims that may be made against the Fund. The risk of material loss from such claims is considered remote.
In September 2006, FIIOC, a transfer agent of the Fund, notified the Fund that the Fund's books and records did not reflect a conversion of certain Class B to Class A shares upon their conversion date. In March 2007, FIIOC converted the relevant Class B shares to Class A shares and recorded the conversion in the books and records of the Fund which did not result in a material impact to the Fund's reported net assets or results of operations in the accompanying financial statements. FIIOC has reimbursed the Fund for related audit and legal expenses and, beginning in June 2007, remediated affected shareholders.
11. Distributions to Shareholders.
Distributions to shareholders of each class were as follows:
Years ended July 31, | 2007 | 2006 |
From net investment income | | |
Small Cap Value | - | 627,853 |
Institutional Class | - | 5,184 |
Total | $ - | $ 633,037 |
Annual Report
Notes to Financial Statements - continued
11. Distributions to Shareholders - continued
Distributions to shareholders of each class were as follows - continued
Years ended July 31, | 2007 | 2006 |
From net realized gain | | |
Class A | $ 2,137,128 | $ 349,740 |
Class T | 2,317,701 | 411,098 |
Class B | 493,632 | 108,502 |
Class C | 1,276,323 | 314,711 |
Small Cap Value | 48,691,674 | 19,037,825 |
Institutional Class | 502,809 | 149,819 |
Total | $ 55,419,267 | $ 20,371,695 |
12. Share Transactions.
Transactions for each class of shares were as follows:
| Shares | Dollars |
Years ended July 31, | 2007 | 2006 | 2007 | 2006 |
Class A | | | | |
Shares sold | 2,083,427 | 2,792,696 | $ 29,477,855 | $ 37,292,766 |
Reinvestment of distributions | 153,067 | 23,154 | 1,967,811 | 292,886 |
Shares redeemed | (990,255) | (517,416) | (13,986,913) | (6,894,256) |
Net increase (decrease) | 1,246,239 | 2,298,434 | $ 17,458,753 | $ 30,691,396 |
Class T | | | | |
Shares sold | 1,416,878 | 2,906,186 | $ 19,764,686 | $ 38,920,414 |
Reinvestment of distributions | 158,416 | 20,934 | 2,031,495 | 264,080 |
Shares redeemed | (1,429,554) | (461,271) | (20,059,646) | (6,059,837) |
Net increase (decrease) | 145,740 | 2,465,849 | $ 1,736,535 | $ 33,124,657 |
Class B | | | | |
Shares sold | 297,938 | 646,292 | $ 4,153,087 | $ 8,494,362 |
Reinvestment of distributions | 34,686 | 7,808 | 444,445 | 98,271 |
Shares redeemed | (263,033) | (181,273) | (3,714,165) | (2,424,583) |
Net increase (decrease) | 69,591 | 472,827 | $ 883,367 | $ 6,168,050 |
Class C | | | | |
Shares sold | 834,910 | 1,647,798 | $ 11,698,988 | $ 21,781,876 |
Reinvestment of distributions | 84,926 | 23,044 | 1,089,287 | 289,929 |
Shares redeemed | (562,438) | (542,172) | (7,834,552) | (7,009,701) |
Net increase (decrease) | 357,398 | 1,128,670 | $ 4,953,723 | $ 15,062,104 |
Annual Report
12. Share Transactions - continued
Transactions for each class of shares were as follows - continued
| Shares | Dollars |
Years ended July 31, | 2007 | 2006 | 2007 | 2006 |
Small Cap Value | | | | |
Shares sold | 42,235,359 | 53,704,430 | $ 595,504,607 | $ 714,692,056 |
Reinvestment of distributions | 3,617,365 | 1,502,190 | 46,609,140 | 19,027,647 |
Shares redeemed | (32,779,622) | (28,179,009) | (461,808,869) | (367,110,557) |
Net increase (decrease) | 13,073,102 | 27,027,611 | $ 180,304,878 | $ 366,609,146 |
Institutional Class | | | | |
Shares sold | 309,983 | 585,637 | $ 4,413,286 | $ 7,784,992 |
Reinvestment of distributions | 23,286 | 4,421 | 300,279 | 56,037 |
Shares redeemed | (242,217) | (170,544) | (3,533,035) | (2,319,440) |
Net increase (decrease) | 91,052 | 419,514 | $ 1,180,530 | $ 5,521,589 |
Annual Report
Report of Independent Registered Public Accounting Firm
To the Trustees of Fidelity Securities Fund and the Shareholders of Fidelity Small Cap Value Fund:
In our opinion, the accompanying statement of assets and liabilities, including the schedule of investments, and the related statements of operations and of changes in net assets and the financial highlights present fairly, in all material respects, the financial position of Fidelity Small Cap Value Fund (a fund of Fidelity Securities Fund) at July 31, 2007, the results of its operations for the year then ended, the changes in its net assets for each of the two years in the period then ended and the financial highlights for each of the periods indicated, in conformity with accounting principles generally accepted in the United States of America. These financial statements and financial highlights (hereafter referred to as "financial statements") are the responsibility of the Fidelity Small Cap Value Fund's management. Our responsibility is to express an opinion on these financial statements based on our audits. We conducted our audits of these financial statements in accordance with the standards of the Public Company Accounting Oversight Board (United States). Those standards require that we plan and perform the audit to obtain reasonable assurance about whether the financial statements are free of material misstatement. An audit includes examining, on a test basis, evidence supporting the amounts and disclosures in the financial statements, assessing the accounting principles used and significant estimates made by management, and evaluating the overall financial statement presentation. We believe that our audits, which included confirmation of securities at July 31, 2007 by correspondence with the custodian and brokers, provide a reasonable basis for our opinion.
/s/ PricewaterhouseCoopers LLP
PricewaterhouseCoopers LLP
Boston, Massachusetts
September 18, 2007
Annual Report
Trustees and Officers
The Trustees, Members of the Advisory Board, and executive officers of the trust and fund, as applicable, are listed below. The Board of Trustees governs the fund and is responsible for protecting the interests of shareholders. The Trustees are experienced executives who meet periodically throughout the year to oversee the fund's activities, review contractual arrangements with companies that provide services to the fund, and review the fund's performance. Except for James C. Curvey, each of the Trustees oversees 353 funds advised by FMR or an affiliate. Mr. Curvey oversees 317 funds advised by FMR or an affiliate.
The Trustees hold office without limit in time except that (a) any Trustee may resign; (b) any Trustee may be removed by written instrument, signed by at least two-thirds of the number of Trustees prior to such removal; (c) any Trustee who requests to be retired or who has become incapacitated by illness or injury may be retired by written instrument signed by a majority of the other Trustees; and (d) any Trustee may be removed at any special meeting of shareholders by a two-thirds vote of the outstanding voting securities of the trust. Each Trustee who is not an interested person (as defined in the 1940 Act) (Independent Trustee), shall retire not later than the last day of the calendar year in which his or her 72nd birthday occurs. The Independent Trustees may waive this mandatory retirement age policy with respect to individual Trustees. The executive officers and Advisory Board Members hold office without limit in time, except that any officer and Advisory Board Member may resign or may be removed by a vote of a majority of the Trustees at any regular meeting or any special meeting of the Trustees. Except as indicated, each individual has held the office shown or other offices in the same company for the past five years.
The fund's Statement of Additional Information (SAI) includes more information about the Trustees. To request a free copy, call Fidelity at 1-800-544-8544.
Interested Trustees*:
Correspondence intended for each Trustee who is an interested person may be sent to Fidelity Investments, 82 Devonshire Street, Boston, Massachusetts 02109.
Name, Age; Principal Occupation |
Edward C. Johnson 3d (77) |
| Year of Election or Appointment: 1984 Mr. Johnson is Chairman of the Board of Trustees. Mr. Johnson serves as President (2006-present), Chief Executive Officer, Chairman, and a Director of FMR Corp.; Chairman and a Director of FMR; Chairman and a Director of Fidelity Research & Analysis Company (FRAC); Chairman and a Director of Fidelity Investments Money Management, Inc.; and Chairman (2001-present) and a Director of FMR Co., Inc. In addition, Mr. Johnson serves as Chairman and Director of Fidelity International Limited (FIL). |
James C. Curvey (72) |
| Year of Election or Appointment: 2007 Mr. Curvey also serves as Trustee (2007-present) or Member of the Advisory Board (2007-present) of other investment companies advised by FMR. Mr. Curvey is Vice Chairman (2006-present) and Director of FMR Corp. Mr. Curvey joined Fidelity in 1982 and served in numerous senior management positions, including President and Chief Operating Officer of FMR Corp. (1997-2000) and President of Fidelity Strategic Investments (2000-2002). In addition, he serves as a member of the Board of Directors of Geerlings & Wade, Inc. (wine distribution). |
* Trustees have been determined to be "Interested Trustees" by virtue of, among other things, their affiliation with the trust or various entities under common control with FMR.
Independent Trustees:
Correspondence intended for each Independent Trustee (that is, the Trustees other than the Interested Trustees) may be sent to Fidelity Investments, P.O. Box 55235, Boston, Massachusetts 02205-5235.
Name, Age; Principal Occupation |
Dennis J. Dirks (59) |
| Year of Election or Appointment: 2005 Prior to his retirement in May 2003, Mr. Dirks was Chief Operating Officer and a member of the Board of The Depository Trust & Clearing Corporation (DTCC) (1999-2003). He also served as President, Chief Operating Officer, and Board member of The Depository Trust Company (DTC) (1999-2003) and President and Board member of the National Securities Clearing Corporation (NSCC) (1999-2003). In addition, Mr. Dirks served as Chief Executive Officer and Board member of the Government Securities Clearing Corporation (2001-2003) and Chief Executive Officer and Board member of the Mortgage-Backed Securities Clearing Corporation (2001-2003). Mr. Dirks also serves as a Trustee and a member of the Finance Committee of Manhattan College (2005-present) and a Trustee and a member of the Finance Committee of AHRC of Nassau County (2006-present). |
Albert R. Gamper, Jr. (65) |
| Year of Election or Appointment: 2006 Prior to his retirement in December 2004, Mr. Gamper served as Chairman of the Board of CIT Group Inc. (commercial finance). During his tenure with CIT Group Inc. Mr. Gamper served in numerous senior management positions, including Chairman (1987-1989; 1999-2001; 2002-2004), Chief Executive Officer (1987-2004), and President (1989-2002). He currently serves as a member of the Board of Directors of Public Service Enterprise Group (utilities, 2001-present), Chairman of the Board of Governors, Rutgers University (2004-present), and Chairman of the Board of Saint Barnabas Health Care System. |
George H. Heilmeier (71) |
| Year of Election or Appointment: 2004 Dr. Heilmeier is Chairman Emeritus of Telcordia Technologies (communication software and systems), where prior to his retirement, he served as company Chairman and Chief Executive Officer. He currently serves on the Boards of Directors of The Mitre Corporation (systems engineering and information technology support for the government), and HRL Laboratories (private research and development, 2004-present). He is Chairman of the General Motors Science & Technology Advisory Board and a Life Fellow of the Institute of Electrical and Electronics Engineers (IEEE). Dr. Heilmeier is a member of the Defense Science Board and the National Security Agency Advisory Board. He is also a member of the National Academy of Engineering, the American Academy of Arts and Sciences, and the Board of Overseers of the School of Engineering and Applied Science of the University of Pennsylvania. Previously, Dr. Heilmeier served as a Director of TRW Inc. (automotive, space, defense, and information technology, 1992-2002), Compaq (1994-2002), Automatic Data Processing, Inc. (ADP) (technology-based business outsourcing, 1995-2002), INET Technologies Inc. (telecommunications network surveillance, 2001-2004), and Teletech Holdings (customer management services). He is the recipient of the 2005 Kyoto Prize in Advanced Technology for his invention of the liquid crystal display, and a member of the Consumer Electronics Hall of Fame. |
James H. Keyes (66) |
| Year of Election or Appointment: 2007 Prior to his retirement in 2003, Mr. Keyes was Chairman, President, and Chief Executive Officer of Johnson Controls, Inc. (automotive supplier, 1993-2003). He currently serves as a member of the boards of LSI Logic Corporation (semiconductor technologies), Navistar International Corporation (manufacture and sale of trucks, buses, and diesel engines, 2002-present), and Pitney Bowes, Inc. (integrated mail, messaging, and document management solutions). |
Marie L. Knowles (60) |
| Year of Election or Appointment: 2001 Prior to Ms. Knowles' retirement in June 2000, she served as Executive Vice President and Chief Financial Officer of Atlantic Richfield Company (ARCO) (diversified energy, 1996-2000). From 1993 to 1996, she was a Senior Vice President of ARCO and President of ARCO Transportation Company. She served as a Director of ARCO from 1996 to 1998. She currently serves as a Director of Phelps Dodge Corporation (copper mining and manufacturing) and McKesson Corporation (healthcare service, 2002-present). Ms. Knowles is a Trustee of the Brookings Institution and the Catalina Island Conservancy and also serves as a member of the Advisory Board for the School of Engineering of the University of Southern California. |
Ned C. Lautenbach (63) |
| Year of Election or Appointment: 2000 Mr. Lautenbach is Chairman of the Independent Trustees (2006-present). Mr. Lautenbach has been a partner of Clayton, Dubilier & Rice, Inc. (private equity investment firm) since September 1998. Previously, Mr. Lautenbach was with the International Business Machines Corporation (IBM) from 1968 until his retirement in 1998. Mr. Lautenbach serves as a Director of Sony Corporation (2006-present) and Eaton Corporation (diversified industrial) as well as the Philharmonic Center for the Arts in Naples, Florida. He also is a member of the Board of Trustees of Fairfield University (2005-present), as well as a member of the Council on Foreign Relations. |
Cornelia M. Small (63) |
| Year of Election or Appointment: 2005 Ms. Small is a member (2000-present) and Chairperson (2002-present) of the Investment Committee, and a member (2002-present) of the Board of Trustees of Smith College. Previously, she served as Chief Investment Officer (1999-2000), Director of Global Equity Investments (1996-1999), and a member of the Board of Directors of Scudder, Stevens & Clark (1990-1997) and Scudder Kemper Investments (1997-1999). In addition, Ms. Small served as Co-Chair (2000-2003) of the Annual Fund for the Fletcher School of Law and Diplomacy. |
William S. Stavropoulos (68) |
| Year of Election or Appointment: 2002 Mr. Stavropoulos is Chairman Emeritus of the Board of Directors of The Dow Chemical Company. Since joining The Dow Chemical Company in 1967, Mr. Stavropoulos served in numerous senior management positions, including President (1993-2000; 2002-2003), CEO (1995-2000; 2002-2004), and Chairman of the Executive Committee (2000-2004). Currently, he is a Director of NCR Corporation (data warehousing and technology solutions), Chemical Financial Corporation, Maersk Inc. (industrial conglomerate, 2002-present), Tyco International, Inc. (multinational manufacturing and services, 2007-present), and a member of the Advisory Board for Metalmark Capital (private equity investment firm, 2005-present). He is a special advisor to Clayton, Dubilier & Rice, Inc., a private equity investment firm. He also serves as a member of the Board of Trustees of the American Enterprise Institute for Public Policy Research. In addition, Mr. Stavropoulos is a member of The Business Council, J.P. Morgan International Council and the University of Notre Dame Advisory Council for the College of Science. |
Kenneth L. Wolfe (68) |
| Year of Election or Appointment: 2005 Prior to his retirement in 2001, Mr. Wolfe was Chairman and Chief Executive Officer of Hershey Foods Corporation (1993-2001). He currently serves as a member of the boards of Adelphia Communications Corporation (2003-present), Bausch & Lomb, Inc., and Revlon Inc. (2004-present). |
Advisory Board Members and Executive Officers:
Correspondence intended for Mr. Mauriello may be sent to Fidelity Investments, P.O. Box 55235, Boston, Massachusetts 02205-5235. Correspondence intended for each executive officer and Mr. Lynch may be sent to Fidelity Investments, 82 Devonshire Street, Boston, Massachusetts 02109.
Name, Age; Principal Occupation |
Peter S. Lynch (63) |
| Year of Election or Appointment: 2003 Member of the Advisory Board of Fidelity Securities Fund. Mr. Lynch is Vice Chairman and a Director of FMR, and Vice Chairman (2001-present) and a Director of FMR Co., Inc. Previously, Mr. Lynch served as a Trustee of the Fidelity funds (1990-2003). In addition, he serves as a Trustee of Boston College and as the Chairman of the Inner-City Scholarship Fund. |
Joseph Mauriello (62) |
| Year of Election or Appointment: 2007 Member of the Advisory Board of Fidelity Securities Fund. Prior to his retirement in January 2006, Mr. Mauriello served in numerous senior management positions including Deputy Chairman and Chief Operating Officer (2004-2005), and Vice Chairman of Financial Services (2002-2004) of KPMG LLP US (professional services firm, 1965-2005). Mr. Mauriello currently serves as a member of the Board of Directors of XL Capital Ltd., (global insurance and re-insurance company, 2006-present) and of Arcadia Resources Inc., (health care services and products, 2007-present). He also served as a Director of the Hamilton Funds of the Bank of New York (2006-2007). |
Kimberley H. Monasterio (43) |
| Year of Election or Appointment: 2007 President and Treasurer of Small Cap Value. Ms. Monasterio also serves as President and Treasurer of other Fidelity funds (2007-present) and is an employee of FMR (2004-present). Previously, Ms. Monasterio served as Deputy Treasurer of the Fidelity funds (2004-2006). Before joining Fidelity Investments, Ms. Monasterio served as Treasurer (2000-2004) and Chief Financial Officer (2002-2004) of the Franklin Templeton Funds and Senior Vice President of Franklin Templeton Services, LLC (2000-2004). |
Dwight D. Churchill (53) |
| Year of Election or Appointment: 2005 Vice President of Small Cap Value. Mr. Churchill also serves as Vice President of certain Equity Funds (2005-present). Mr. Churchill is Executive Vice President of FMR (2005-present) and FMR Co., Inc. (2005-present). Previously, Mr. Churchill served as Senior Vice President of Fidelity Investments Money Management, Inc. (2005-2006), Head of Fidelity's Fixed-Income Division (2000-2005), Vice President of Fidelity's Money Market Funds (2000-2005), Vice President of Fidelity's Bond Funds, and Senior Vice President of FMR. |
Bruce T. Herring (41) |
| Year of Election or Appointment: 2006 Vice President of Small Cap Value. Mr. Herring also serves as Vice President of certain Equity Funds (2006-present). Mr. Herring is Senior Vice President of FMR (2006-present) and Vice President of FMR Co., Inc. (2001-present). Previously, Mr. Herring served as a portfolio manager for Fidelity U.S. Equity Funds (2001-2005). |
Thomas Hense (43) |
| Year of Election or Appointment: 2006
Vice President of Small Cap Value. Prior to assuming his current responsibilities, Mr. Hense worked as a research analyst, co-director of equity research, and a portfolio manager. |
Eric D. Roiter (58) |
| Year of Election or Appointment: 2004 Secretary of Small Cap Value. He also serves as Secretary of other Fidelity funds; Vice President, General Counsel, and Secretary of FMR Co., Inc. (2001-present) and FMR; Assistant Secretary of Fidelity Management & Research (U.K.) Inc. (2001-present), Fidelity Research & Analysis Company (2001-present), and Fidelity Investments Money Management, Inc. (2001-present). Mr. Roiter is an Adjunct Member, Faculty of Law, at Boston College Law School (2003-present). Previously, Mr. Roiter served as Vice President and Secretary of Fidelity Distributors Corporation (FDC) (1998-2005). |
Scott C. Goebel (39) |
| Year of Election or Appointment: 2007 Assistant Secretary of Small Cap Value. Mr. Goebel also serves as Assistant Secretary of other Fidelity funds (2007-present), Vice President and Secretary of FDC (2006-present), and is an employee of FMR. |
R. Stephen Ganis (41) |
| Year of Election or Appointment: 2006 Anti-Money Laundering (AML) officer of Small Cap Value. Mr. Ganis also serves as AML officer of other Fidelity funds (2006-present) and FMR Corp. (2003-present). Before joining Fidelity Investments, Mr. Ganis practiced law at Goodwin Procter, LLP (2000-2002). |
Joseph B. Hollis (59) |
| Year of Election or Appointment: 2006 Chief Financial Officer of Small Cap Value. Mr. Hollis also serves as Chief Financial Officer of other Fidelity funds. Mr. Hollis is President of Fidelity Pricing and Cash Management Services (FPCMS) (2005-present). Mr. Hollis also serves as President and Director of Fidelity Service Company, Inc. (2006-present). Previously, Mr. Hollis served as Senior Vice President of Cash Management Services (1999-2002) and Investment Management Operations (2002-2005). |
Kenneth A. Rathgeber (60) |
| Year of Election or Appointment: 2004 Chief Compliance Officer of Small Cap Value. Mr. Rathgeber also serves as Chief Compliance Officer of other Fidelity funds (2004-present) and Executive Vice President of Risk Oversight for Fidelity Investments (2002-present). He is Chief Compliance Officer of FMR (2005-present), FMR Co., Inc. (2005-present), Fidelity Management & Research (U.K.) Inc. (2005-present), Fidelity Research & Analysis Company (2005-present), Fidelity Investments Money Management, Inc. (2005-present), and Strategic Advisers, Inc. (2005-present). Previously, Mr. Rathgeber served as Executive Vice President and Chief Operating Officer for Fidelity Investments Institutional Services Company, Inc. (1998-2002). |
Bryan A. Mehrmann (46) |
| Year of Election or Appointment: 2005 Deputy Treasurer of Small Cap Value. Mr. Mehrmann also serves as Deputy Treasurer of other Fidelity funds (2005-present) and is an employee of FMR. Previously, Mr. Mehrmann served as Vice President of Fidelity Investments Institutional Services Group (FIIS)/Fidelity Investments Institutional Operations Corporation, Inc. (FIIOC) Client Services (1998-2004). |
Kenneth B. Robins (37) |
| Year of Election or Appointment: 2005 Deputy Treasurer of Small Cap Value. Mr. Robins also serves as Deputy Treasurer of other Fidelity funds (2005-present) and is an employee of FMR (2004-present). Before joining Fidelity Investments, Mr. Robins worked at KPMG LLP, where he was a partner in KPMG's department of professional practice (2002-2004) and a Senior Manager (1999-2000). In addition, Mr. Robins served as Assistant Chief Accountant, United States Securities and Exchange Commission (2000-2002). |
Robert G. Byrnes (40) |
| Year of Election or Appointment: 2005 Assistant Treasurer of Small Cap Value. Mr. Byrnes also serves as Assistant Treasurer of other Fidelity funds (2005-present) and is an employee of FMR (2005-present). Previously, Mr. Byrnes served as Vice President of FPCMS (2003-2005). Before joining Fidelity Investments, Mr. Byrnes worked at Deutsche Asset Management where he served as Vice President of the Investment Operations Group (2000-2003). |
Peter L. Lydecker (53) |
| Year of Election or Appointment: 2004 Assistant Treasurer of Small Cap Value. Mr. Lydecker also serves as Assistant Treasurer of other Fidelity funds (2004) and is an employee of FMR. |
Gary W. Ryan (48) |
| Year of Election or Appointment: 2005 Assistant Treasurer of Small Cap Value. Mr. Ryan also serves as Assistant Treasurer of other Fidelity funds (2005-present) and is an employee of FMR (2005-present). Previously, Mr. Ryan served as Vice President of Fund Reporting in FPCMS (1999-2005). |
Annual Report
Distributions
The Board of Trustees of Advisor Small Cap Value Fund voted to pay to shareholders of record at the opening of business on record date, the following distributions per share derived from capital gains realized from sales of portfolio securities:
| Pay Date | Record Date | Capital Gains |
Class A | 09/10/07 | 09/07/07 | $0.374 |
Class T | 09/10/07 | 09/07/07 | $0.370 |
Class B | 09/10/07 | 09/07/07 | $0.370 |
Class C | 09/10/07 | 09/07/07 | $0.370 |
The fund hereby designates as a capital gain dividend with respect to the taxable year ended July 31, 2007 $47,404,920, or, if subsequently determined to be different, the net capital gain of such year.
Class A designates 25%; Class T designates 27%; Class B designates 36%; Class C designates 37% of the dividend distributed in during the fiscal year as qualifying for the dividends-received deduction for corporate shareholders.
Class A designates 28%; Class T designates 31%; Class B designates 41%; Class C designates 41% designates; of the dividend distributed during the fiscal year as amounts which may be taken into account as a dividend for purposes of the maximum rate under section 1(h)(11) of the Internal Revenue Code.
The fund will notify shareholders in January 2008 of amounts for use in preparing 2007 income tax returns.
Annual Report
Board Approval of Investment Advisory Contracts and Management Fees
Fidelity Small Cap Value Fund
Each year, typically in July, the Board of Trustees, including the Independent Trustees (together, the Board), votes on the renewal of the management contract and sub-advisory agreements (together, the Advisory Contracts) for the fund. The Board, assisted by the advice of fund counsel and Independent Trustees' counsel, requests and considers a broad range of information throughout the year.
The Board meets regularly each month except August and takes into account throughout the year matters bearing on Advisory Contracts. The Board, acting directly and through its separate committees, considers at each of its meetings factors that are relevant to the annual renewal of the fund's Advisory Contracts, including the services and support provided to the fund and its shareholders. At the time of the renewal, the Board had 12 standing committees, each composed of Independent Trustees with varying backgrounds, to which the Board has assigned specific subject matter responsibilities in order to enhance effective decision-making by the Board. Each committee has adopted a written charter outlining the structure and purposes of the committee. One such committee, the Equity Contract Committee, meets periodically as needed throughout the year to consider matters specifically related to the annual renewal of Advisory Contracts. The committee requests and receives information on, and makes recommendations to the Independent Trustees concerning, the approval and annual review of the Advisory Contracts.
At its July 2007 meeting, the Board of Trustees, including the Independent Trustees, unanimously determined to renew the Advisory Contracts for the fund. In reaching its determination, the Board considered all factors it believed relevant, including (i) the nature, extent, and quality of the services to be provided to the fund and its shareholders (including the investment performance of the fund); (ii) the competitiveness of the management fee and total expenses of the fund; (iii) the total costs of the services to be provided by and the profits to be realized by the investment adviser and its affiliates from the relationship with the fund; (iv) the extent to which economies of scale would be realized as the fund grows; and (v) whether fee levels reflect these economies of scale, if any, for the benefit of fund shareholders. The Board also approved amendments to the fund's agreements with foreign sub-advisers to clarify that each sub-adviser provides services as an independent contractor.
In determining whether to renew the Advisory Contracts for the fund, the Board ultimately reached a determination, with the assistance of fund counsel and Independent Trustees' counsel, that the renewal of the Advisory Contracts and the compensation to be received by Fidelity under the management contract is consistent with Fidelity's fiduciary duty under applicable law. In addition to evaluating the specific factors noted above, the Board, in reaching its determination, is aware that shareholders in the fund have a broad range of investment choices available to them, including a wide choice among mutual funds offered by competitors to Fidelity, and that the fund's shareholders, with the opportunity to review and weigh the disclosure provided by the fund in its prospectus and other public disclosures, have chosen to invest in this fund, managed by Fidelity.
Annual Report
Board Approval of Investment Advisory Contracts and
Management Fees - continued
Nature, Extent, and Quality of Services Provided. The Board considered staffing within the investment adviser, FMR, and the sub-advisers (together, the Investment Advisers), including the background of the fund's portfolio manager and the fund's investment objective and discipline. The Independent Trustees also had discussions with senior management of Fidelity's investment operations and investment groups. The Board considered the structure of the portfolio manager compensation program and whether this structure provides appropriate incentives.
Resources Dedicated to Investment Management and Support Services. The Board reviewed the size, education, and experience of the Investment Advisers' investment staff, their use of technology, and the Investment Advisers' approach to recruiting, training, and retaining portfolio managers and other research, advisory, and management personnel. The Board considered Fidelity's extensive global research capabilities that enable the Investment Advisers to aggregate data from various sources in an effort to produce positive investment results. The Board noted that Fidelity's analysts have access to a variety of technological tools that enable them to perform both fundamental and quantitative analysis and to specialize in various disciplines. The Board also considered that Fidelity's portfolio managers and analysts have access to daily portfolio attribution that allows for monitoring of a fund's portfolio, as well as an electronic communication system that provides immediate real-time access to research concerning issuers and credit enhancers.
Shareholder and Administrative Services. The Board considered (i) the nature, extent, quality, and cost of advisory, administrative, distribution, and shareholder services performed by the Investment Advisers and their affiliates under the Advisory Contracts and under separate agreements covering transfer agency, pricing and bookkeeping, and securities lending services for the fund; (ii) the nature and extent of the Investment Advisers' supervision of third party service providers, principally custodians and subcustodians; and (iii) the resources devoted to, and the record of compliance with, the fund's compliance policies and procedures. The Board reviewed the allocation of fund brokerage, including allocations to brokers affiliated with the Investment Advisers, the use of brokerage commissions to pay fund expenses, and the use of "soft" commission dollars to pay for research services. The Board also considered that Fidelity voluntarily pays for market data out of its own resources.
The Board noted that the growth of fund assets across the complex allows Fidelity to reinvest in the development of services designed to enhance the value or convenience of the Fidelity funds as investment vehicles. These services include 24-hour access to account information and market information through phone representatives and over the Internet, and investor education materials and asset allocation tools.
Annual Report
Investment in a Large Fund Family. The Board considered the benefits to shareholders of investing in a Fidelity fund, including the benefits of investing in a fund that is part of a large family of funds offering a variety of investment disciplines and providing for a large variety of mutual fund investor services. For example, fund shareholders are offered the privilege of exchanging shares of the fund for shares of other Fidelity funds, as set forth in the fund's prospectus, without paying a sales charge. The Board noted that, since the last Advisory Contract renewals in July 2006, Fidelity has taken a number of actions that benefited particular funds, including (i) dedicating additional resources to investment research and to restructure the investment research teams; (ii) contractually agreeing to reduce the management fee on Fidelity Advisor Floating Rate High Income Fund; (iii) contractually agreeing to reduce the management fees on Fidelity's California, Massachusetts, New Jersey, and New York AMT Tax-Free Money Market Funds, launching new Institutional Classes and Service Classes of these funds, and contractually agreeing to impose expense limitations on these funds; (iv) eliminating the exchange fee on the Fidelity Select Portfolios and reducing the pricing and bookkeeping fee rates for these funds; (v) reducing the maximum transfer agency fee rates on high income funds and certain equity funds; (vi) proposing amended management contracts that, if approved by shareholders, will add a performance adjustment component to the management fees paid by 18 Fidelity Advisor equity funds; (vii) contractually agreeing to reduce fees for Ultra-Short Central Fund and the money market Central Funds; (viii) waiving the Fidelity Advisor funds' contingent deferred sales charge on certain redemptions made through systematic withdrawal programs; and (ix) amending the management contracts for equity and fixed-income funds whose management contracts incorporate a "group fee" structure by adding four new fee "breakpoints" to the group fee rate schedules.
Investment Performance and Compliance. The Board considered whether the fund has operated within its investment objective, as well as its record of compliance with its investment restrictions. It also reviewed the fund's absolute investment performance for each class, as well as the fund's relative investment performance for each class measured against (i) a broad-based securities market index, and (ii) a peer group of mutual funds deemed appropriate by the Board. Because the fund had been in existence less than three calendar years, the following chart considered by the Board shows, for the one-year period ended December 31, 2006, the total returns of Institutional Class (Class I) and Class C of the fund, the total return of a broad-based securities market index ("benchmark"), and a range of total returns of a peer group of mutual funds identified by Morningstar, Inc. as having an investment style similar to that of the fund based on underlying portfolio holdings. The returns of Institutional Class (Class I) and Class C show the performance of the highest and lowest performing classes, respectively. The box within the chart shows the 25th percentile return (bottom of box) and the 75th percentile return (top of box) of the peer group. Returns shown above the box are in the first quartile and returns shown below the box are in the fourth quartile. The percentage beaten numbers noted below the chart correspond to the percentile box and represent the percentage of funds in the peer group whose performance was equal to or lower than that of the class indicated.
Annual Report
Board Approval of Investment Advisory Contracts and
Management Fees - continued
Fidelity Small Cap Value Fund

The Board reviewed the fund's relative investment performance against its peer group and stated that the performance of Institutional Class (Class I) of the fund was in the third quartile for the period shown. The Board also stated that the investment performance of the fund was lower than its benchmark for the period shown. The Board considered that the variations in performance among the fund's classes reflect the variations in class expenses, which result in lower performance for higher expense classes. The Board stated that it is difficult to evaluate in any comprehensive fashion the performance of the fund, in light of its relatively recent commencement of operations.
The Board also considered that the fund's management fee is subject to upward or downward adjustment depending upon whether, and to what extent, the fund's investment performance for the performance period exceeds, or is exceeded by, the record (over the same period) of a Board-approved performance adjustment index. The Board realizes that the performance adjustment provides FMR with a strong economic incentive to seek to achieve superior performance for the fund's shareholders and helps to more closely align the interests of FMR and the fund's shareholders.
The Board considered that FMR has taken steps to refocus and strengthen equity research, equity portfolio management, and compliance.
Annual Report
Based on its review, and giving particular weight to the nature and quality of the resources dedicated by the Investment Advisers to maintain and improve relative performance, the Board concluded that the nature, extent, and quality of the services provided to the fund will benefit the fund's shareholders, particularly in light of the Board's view that the fund's shareholders benefit from investing in a fund that is part of a large family of funds offering a variety of investment disciplines and services.
Competitiveness of Management Fee and Total Fund Expenses. The Board considered the fund's management fee and total expenses compared to "mapped groups" of competitive funds and classes. Fidelity creates "mapped groups" by combining similar Lipper investment objective categories that have comparable management fee characteristics. Combining Lipper investment objective categories aids the Board's management fee and total expense comparisons by broadening the competitive group used for comparison and by reducing the number of universes to which various Fidelity funds are compared. The Board also considered supplemental information about how the fund's management fee and total expenses ranked relative to groups based on Lipper classifications, which take into account a fund's market capitalization and style.
The Board considered two proprietary management fee comparisons for the 12-month (or shorter) periods shown in the chart below. The group of Lipper funds used by the Board for management fee comparisons is referred to below as the "Total Mapped Group." The Total Mapped Group comparison focuses on a fund's standing relative to the total universe of comparable funds available to investors, in terms of gross management fees before expense reimbursements or caps, and without giving effect to the fund's performance adjustment. "TMG %" represents the percentage of funds in the Total Mapped Group that had management fees that were lower than the fund's. For example, a TMG % of 13% means that 87% of the funds in the Total Mapped Group had higher management fees than the fund. The "Asset-Size Peer Group" (ASPG) comparison focuses on a fund's standing relative to non-Fidelity funds similar in size to the fund within the Total Mapped Group. The ASPG represents at least 15% of the funds in the Total Mapped Group with comparable asset size and management fee characteristics, subject to a minimum of 50 funds (or all funds in the Total Mapped Group if fewer than 50). Additional information, such as the ASPG quartile in which the fund's management fee ranked and the impact of the fund's performance adjustment, is also included in the chart and considered by the Board.
Annual Report
Board Approval of Investment Advisory Contracts and
Management Fees - continued
Fidelity Small Cap Value Fund

The Board noted that the fund's management fee ranked below the median of its Total Mapped Group and below the median of its ASPG for 2006. The Board also noted the effect of the fund's positive performance adjustment on the fund's management fee ranking. The Board noted that the performance adjustment for each year represents calculations for performance periods that differ from the period shown in the performance chart above.
Based on its review, the Board concluded that the fund's management fee was fair and reasonable in light of the services that the fund receives and the other factors considered.
In its review of each class's total expenses, the Board considered the fund's management fee as well as other fund or class expenses, as applicable, such as transfer agent fees, pricing and bookkeeping fees, fund-paid 12b-1 fees, and custodial, legal, and audit fees. The Board also noted the effects of any waivers and reimbursements on fees and expenses, as well as the fund's positive performance adjustment. As part of its review, the Board also considered current and historical total expenses of each class of the fund compared to competitive fund median expenses. Each class of the fund is compared to those funds and classes in the Total Mapped Group (used by the Board for management fee comparisons) that have a similar sales load structure.
The Board noted that the total expenses of each of Class A, Institutional Class, and Fidelity Small Cap Value (retail class) ranked below its competitive median for 2006, the total expenses of Class B ranked equal to its competitive median for 2006, and the total expenses of each of Class T and Class C ranked above its competitive median for 2006. The Board considered that the total expenses of Class C were above the median because of its higher transfer agent fee due to small average account size. The Board noted that the fund offers multiple classes, each of which has a different sales load and 12b-1 fee structure, and that the multiple structures are intended to offer a range of pricing options for the intermediary market. The Board also noted that the total expenses of the classes vary primarily by the level of their 12b-1 fees, although differences in transfer agent fees may also cause expenses to vary from class to class.
Annual Report
In its review of total expenses, the Board also considered Fidelity fee structures and other information on clients that FMR and its affiliates service in other competitive markets, such as other mutual funds advised or subadvised by FMR or its affiliates, pension plan clients, and other institutional clients.
Based on its review, the Board concluded that the total expenses of each class of the fund were reasonable, although in some cases above the median of the universe presented for comparison, in light of the services that the fund and its shareholders receive and the other factors considered.
Costs of the Services and Profitability. The Board considered the revenues earned and the expenses incurred by Fidelity in conducting the business of developing, marketing, distributing, managing, administering and servicing the fund and its shareholders. The Board also considered the level of Fidelity's profits in respect of all the Fidelity funds.
On an annual basis, FMR presents to the Board Fidelity's profitability for the fund. Fidelity calculates the profitability for each fund, as well as aggregate profitability for groups of Fidelity funds and all Fidelity funds, using a series of detailed revenue and cost allocation methodologies which originate with the audited books and records of Fidelity. The Audit Committee of the Board reviews any significant changes from the prior year's methodologies.
PricewaterhouseCoopers LLP (PwC), independent registered public accounting firm and auditor to Fidelity and certain Fidelity funds, has been engaged annually by the Board as part of the Board's assessment of the results of Fidelity's profitability analysis. PwC's engagement includes the review and assessment of Fidelity's methodologies used in determining the revenues and expenses attributable to Fidelity's mutual fund business, and completion of agreed-upon procedures surrounding the mathematical accuracy of fund profitability and its conformity to allocation methodologies. After considering PwC's reports issued under the engagement and information provided by Fidelity, the Board believes that while other allocation methods may also be reasonable, Fidelity's profitability methodologies are reasonable in all material respects.
Annual Report
Board Approval of Investment Advisory Contracts and
Management Fees - continued
The Board has also reviewed Fidelity's non-fund businesses and any fall-out benefits related to the mutual fund business as well as cases where Fidelity's affiliates may benefit from or be related to the fund's business.
The Board considered the costs of the services provided by and the profits realized by Fidelity in connection with the operation of the fund and determined that the amount of profit is a fair entrepreneurial profit for the management of the fund.
Economies of Scale. The Board considered whether there have been economies of scale in respect of the management of the Fidelity funds, whether the Fidelity funds (including the fund) have appropriately benefited from any such economies of scale, and whether there is potential for realization of any further economies of scale. The Board considered the extent to which the fund will benefit from economies of scale through increased services to the fund, through waivers or reimbursements, or through fee or expense reductions, including reductions that occur through operation of the transfer agent agreement. The transfer agent fee varies in part based on the number of accounts in the fund. If the number of accounts decreases or the average account size increases, the overall transfer agent fee rate decreases.
The Board recognized that the fund's management contract incorporates a "group fee" structure, which provides for lower group fee rates as total fund assets under FMR's management increase, and for higher group fee rates as total fund assets under FMR's management decrease. FMR determines the group fee rates based on a tiered asset "breakpoint" schedule. In connection with the renewal of the fund's management contract, the Board approved amendments to the fund's management contract that added four new fee breakpoints to the group fee rate schedule for assets under FMR's management above $1,386 billion. The Board considered that the group fee rate declines under both the present and amended schedules, but that under the amended schedule, the group fee rate declines faster as assets under FMR's management exceed $1,386 billion. The Board considered that the group fee is designed to deliver the benefits of economies of scale to fund shareholders when total fund assets increase, even if assets of any particular fund are unchanged or have declined, because some portion of Fidelity's costs are attributable to services provided to all Fidelity funds, and all funds benefit if those costs can be allocated among more assets. The Board concluded that, given the group fee structure, fund shareholders will achieve a certain level of economies of scale as assets under FMR's management increase at the fund complex level, regardless of whether Fidelity achieves any such economies of scale.
The Board further concluded that any potential economies of scale are being shared between fund shareholders and Fidelity in an appropriate manner.
Additional Information Requested by the Board. In order to develop fully the factual basis for consideration of the Fidelity funds' Advisory Contracts, the Board requested and received additional information on several topics, including (i) fund performance trends and actions to be taken by FMR to improve certain funds' overall performance; (ii) Fidelity's portfolio manager compensation structure, including its effects on fund profitability and the extent to which portfolio manager compensation is linked to fund performance; (iii) Fidelity's fee structures; (iv) the funds' sub-advisory arrangements; and (v) accounts managed by Fidelity other than the Fidelity funds.
Annual Report
Based on its evaluation of all of the conclusions noted above, and after considering all material factors, the Board ultimately concluded that the advisory fee structures are fair and reasonable, and that the fund's Advisory Contracts should be renewed.
Annual Report
Investment Adviser
Fidelity Management & Research Company
Boston, MA
Investment Sub-Advisers
FMR Co., Inc.
Fidelity Management & Research
(U.K.) Inc.
Fidelity Research & Analysis Company
Fidelity International Investment Advisors
Fidelity Investments Japan Limited
Fidelity International Investment Advisors (U.K.) Limited
General Distributor
Fidelity Distributors Corporation
Boston, MA
Transfer and Service Agents
Fidelity Investments Institutional
Operations Company, Inc.
Boston, MA
Fidelity Service Company, Inc.
Boston, MA
Custodian
Citibank, N.A.
New York, NY
ASCV-UANN-0907
1.803731.102
(Fidelity Investment logo)(registered trademark)
(Fidelity Investment logo)(registered trademark)
Fidelity Advisor
Small Cap Value
Fund - Institutional Class
Annual Report
July 31, 2007
Institutional Class
is a class of Fidelity®
Small Cap Value Fund
(2_fidelity_logos) (Registered_Trademark)
Contents
Chairman's Message | <Click Here> | Ned Johnson's message to shareholders. |
Performance | <Click Here> | How the fund has done over time. |
Management's Discussion | <Click Here> | The manager's review of fund performance, strategy and outlook. |
Shareholder Expense Example | <Click Here> | An example of shareholder expenses. |
Investment Changes | <Click Here> | A summary of major shifts in the fund's investments over the past six months. |
Investments | <Click Here> | A complete list of the fund's investments with their market values. |
Financial Statements | <Click Here> | Statements of assets and liabilities, operations, and changes in net assets,
as well as financial highlights. |
Notes | <Click Here> | Notes to the financial statements. |
Report of Independent Registered Public Accounting Firm | <Click Here> | |
Trustees and Officers | <Click Here> | |
Distributions | <Click Here> | |
Board Approval of Investment Advisory Contracts and Management Fees | <Click Here> | |
To view a fund's proxy voting guidelines and proxy voting record for the 12-month period ended June 30, visit http://www.fidelity.com (search for "proxy voting guidelines") or visit the Securities and Exchange Commission's (SEC) web site at http://www.sec.gov. You may also call 1-877-208-0098 to request a free copy of the proxy voting guidelines.
Standard & Poor's, S&P and S&P 500 are registered service marks of The McGraw-Hill Companies, Inc. and have been licensed for use by Fidelity Distributors Corporation.
Other third party marks appearing herein are the property of their respective owners.
All other marks appearing herein are registered or unregistered trademarks or service marks of FMR Corp. or an affiliated company.
Annual Report
This report and the financial statements contained herein are submitted for the general information of the shareholders of the fund. This report is not authorized for distribution to prospective investors in the fund unless preceded or accompanied by an effective prospectus.
A fund files its complete schedule of portfolio holdings with the SEC for the first and third quarters of each fiscal year on Form N-Q. Forms N-Q are available on the SEC's web site at http://www.sec.gov. A fund's Forms N-Q may be reviewed and copied at the SEC's Public Reference Room in Washington, DC. Information regarding the operation of the SEC's Public Reference Room may be obtained by calling 1-800-SEC-0330. For a complete list of a fund's portfolio holdings, view the most recent holdings listing, semiannual report, or annual report on Fidelity's web site at http://www.fidelity.com or http://www.advisor.fidelity.com, as applicable.
NOT FDIC INSURED · MAY LOSE VALUE · NO BANK GUARANTEE
Neither the fund nor Fidelity Distributors Corporation is a bank.
Annual Report
Chairman's Message
(photo_of_Edward_C_Johnson_3d)
Dear Shareholder:
Stocks are currently on pace to register their fifth straight year of positive returns, although gains could be trimmed if the U.S. economy continues to slow. While financial markets are always unpredictable, there are a number of time-tested principles that can put the historical odds in your favor.
One of the basic tenets is to invest for the long term. Over time, riding out the markets' inevitable ups and downs has proven much more effective than selling into panic or chasing the hottest trend. Even missing only a few of the markets' best days can significantly diminish investor returns. Patience also affords the benefits of compounding - of earning interest on additional income or reinvested dividends and capital gains. There are tax advantages and cost benefits to consider as well. The more you sell, the more taxes you pay, and the more you trade, the higher the costs. While staying the course doesn't eliminate risk, it can considerably lessen the effect of short-term declines.
You can further manage your investing risk through diversification. And today, more than ever, geographic diversification should be taken into account. Studies indicate that asset allocation is the single most important determinant of a portfolio's long-term success. The right mix of stocks, bonds and cash - aligned to your particular risk tolerance and investment objective - is very important. Age-appropriate rebalancing is also an essential aspect of asset allocation. For younger investors, an emphasis on equities - which historically have been the best-performing asset class over time - is encouraged. As investors near their specific goal, such as retirement or sending a child to college, consideration may be given to replacing volatile assets (e.g. common stocks) with more-stable fixed investments (bonds or savings plans).
A third investment principle - investing regularly - can help lower the average cost of your purchases. Investing a certain amount of money each month or quarter helps ensure you won't pay for all your shares at market highs. This strategy - known as dollar cost averaging - also reduces unconstructive "emotion" from investing, helping shareholders avoid selling weak performers just prior to an upswing, or chasing a hot performer just before a correction.
We invite you to contact us via the Internet, through our Investor Centers or over the phone. It is our privilege to provide you the information you need to make the investments that are right for you.
Sincerely,
/s/Edward C. Johnson 3d
Edward C. Johnson 3d
Annual Report
Fidelity Advisor Small Cap Value Fund - Institutional Class
Performance: The Bottom Line
Average annual total return reflects the change in the value of an investment, assuming reinvestment of the class' dividend income and capital gains (the profits earned upon the sale of securities that have grown in value) and assuming a constant rate of performance each year. The $10,000 table and the fund's returns do not reflect the deduction of taxes that a shareholder would pay on fund distributions or the redemption of fund shares. During periods of reimbursement by Fidelity, a fund's total return will be greater than it would be had the reimbursement not occurred. How a fund did yesterday is no guarantee of how it will do tomorrow.
Average Annual Total Returns
Periods ended July 31, 2007 | Past 1
year | Life of
FundA |
Institutional Class | 14.99% | 17.78% |
A From November 3, 2004.
$10,000 Over Life of Fund
Let's say hypothetically that $10,000 was invested in Fidelity Advisor Small Cap Value Fund - Institutional Class on November 3, 2004, when the fund started. The chart shows how the value of your investment would have changed, and also shows how the Russell 2000® Value Index performed over the same period.
Annual Report
Management's Discussion of Fund Performance
Comments from Thomas Hense, Portfolio Manager of Fidelity Advisor Small Cap Value Fund
Major U.S. equity benchmarks approached or exceeded gains of 20% and several set record highs during the 12-month period ending July 31, 2007. In that time, the Dow Jones Industrial AverageSM rose 20.84%, the Standard & Poor's 500SM Index advanced 16.13% and the NASDAQ Composite® Index gained 22.67%. The small-cap Russell 2000® Index fared less well after falling nearly 7% in July, but still returned 12.12% for the year overall. The first half of the period featured six consecutive months of positive returns spurred by the more relaxed monetary policy of the Federal Reserve Board and falling energy prices, which softened inflationary pressures on the U.S. economy. Stocks slipped in February, however, as energy prices crept higher, the housing market slumped, subprime mortgage woes mounted and the Chinese stock market declined 9% in a single day. But equities soared again from March through May, as reflected by the Dow and the S&P 500®, which climbed nearly 12% and more than 9%, respectively. In June and July, though, stocks sank again on inflation concerns and a worsening subprime loan crisis.
During the past year, the fund's Institutional Class shares gained 14.99%, significantly outperforming the Russell 2000 Value Index, which returned 7.67%. The fund was helped by holding an underweighting in banks and real estate investment trusts during the past six months when these stocks performed poorly. The fund also got a boost from good stock selection in the strong-performing industrials and energy sectors. On the other hand, poor security selection in the materials, health care and telecommunication services sectors dragged down performance. Underweighting the strong-performing telecommunication services sector hurt as well. Among the fund's top performers were real estate services provider Jones Lang LaSalle, engineering and construction firm Shaw Group, oil refinery Tesoro and Spanish systems integration and consulting firm Telvent. UAP Holding, a distributor of seeds and agricultural chemicals, also did well. In terms of individual detractors, pharmacy benefit management company Omnicare and Pantry, which owns convenience stores combined with gas stations, held back the fund's return. Center Financial, a bank that caters to the Chinese-American community, also hurt performance.
The views expressed above reflect those of the portfolio manager(s) only through the end of the period as stated on the cover of this report and do not necessarily represent the views of Fidelity or any other person in the Fidelity organization. Any such views are subject to change at any time based upon market or other conditions and Fidelity disclaims any responsibility to update such views. These views may not be relied on as investment advice and, because investment decisions for a Fidelity fund are based on numerous factors, may not be relied on as an indication of trading intent on behalf of any Fidelity fund.
Annual Report
Shareholder Expense Example
As a shareholder of the Fund, you incur two types of costs: (1) transaction costs, including sales charges (loads) on purchase payments or redemption proceeds, redemption fees, and (2) ongoing costs, including management fees, distribution and/or service (12b-1) fees and other Fund expenses. This Example is intended to help you understand your ongoing costs (in dollars) of investing in the Fund and to compare these costs with the ongoing costs of investing in other mutual funds.
The Example is based on an investment of $1,000 invested at the beginning of the period and held for the entire period (February 1, 2007 to July 31, 2007).
Actual Expenses
The first line of the accompanying table for each class of the Fund provides information about actual account values and actual expenses. You may use the information in this line, together with the amount you invested, to estimate the expenses that you paid over the period. Simply divide your account value by $1,000.00 (for example, an $8,600 account value divided by $1,000.00 = 8.6), then multiply the result by the number in the first line for a class of the Fund under the heading entitled "Expenses Paid During Period" to estimate the expenses you paid on your account during this period. A small balance maintenance fee of $12.00 that is charged once a year may apply for certain accounts with a value of less than $2,000. This fee is not included in the table below. If it was, the estimate of expenses you paid during the period would be higher, and your ending account value lower, by this amount. In addition, the Fund, as a shareholder in the underlying Fidelity Central Funds, will indirectly bear its pro rata share of the fees and expenses incurred by the underlying Fidelity Central Funds. These fees and expenses are not included in the Fund's annualized expense ratio used to calculate the expense estimate in the table below.
Hypothetical Example for Comparison Purposes
The second line of the accompanying table for each class of the Fund provides information about hypothetical account values and hypothetical expenses based on a Class' actual expense ratio and an assumed rate of return of 5% per year before expenses, which is not the Class' actual return. The hypothetical account values and expenses may not be used to estimate the actual ending account balance or expenses you paid for the period. You may use this information to compare the ongoing costs of investing in the Fund and other funds. To do so, compare this 5% hypothetical example with the 5% hypothetical examples that appear in the shareholder reports of the other funds. A small balance maintenance fee of $12.00 that is charged once a year may apply for certain accounts with a value of less than $2,000. This fee is not included in the table below. If it was, the estimate of expenses you paid during the period would be higher, and your ending account value lower, by this amount. In addition, the Fund, as a shareholder in the underlying Fidelity Central Funds, will indirectly bear its pro rata share of the fees and expenses incurred by the underlying Fidelity Central Funds. These fees and expenses are not included in the Fund's annualized expense ratio used to calculate the expense estimate in the table below.
Annual Report
Shareholder Expense Example - continued
Please note that the expenses shown in the table are meant to highlight your ongoing costs only and do not reflect any transaction costs. Therefore, the second line of the table is useful in comparing ongoing costs only, and will not help you determine the relative total costs of owning different funds. In addition, if these transactional costs were included, your costs would have been higher.
| Beginning
Account Value
February 1, 2007 | Ending
Account Value
July 31, 2007 | Expenses Paid
During Period*
February 1, 2007
to July 31, 2007 |
Class A | | | |
Actual | $ 1,000.00 | $ 1,012.00 | $ 6.98 |
Hypothetical A | $ 1,000.00 | $ 1,017.85 | $ 7.00 |
Class T | | | |
Actual | $ 1,000.00 | $ 1,010.60 | $ 8.23 |
Hypothetical A | $ 1,000.00 | $ 1,016.61 | $ 8.25 |
Class B | | | |
Actual | $ 1,000.00 | $ 1,008.50 | $ 10.71 |
Hypothetical A | $ 1,000.00 | $ 1,014.13 | $ 10.74 |
Class C | | | |
Actual | $ 1,000.00 | $ 1,007.80 | $ 10.70 |
Hypothetical A | $ 1,000.00 | $ 1,014.13 | $ 10.74 |
Small Cap Value | | | |
Actual | $ 1,000.00 | $ 1,013.30 | $ 5.54 |
Hypothetical A | $ 1,000.00 | $ 1,019.29 | $ 5.56 |
Institutional Class | | | |
Actual | $ 1,000.00 | $ 1,013.30 | $ 5.44 |
Hypothetical A | $ 1,000.00 | $ 1,019.39 | $ 5.46 |
A 5% return per year before expenses
* Expenses are equal to each Class' annualized expense ratio (shown in the table below); multiplied by the average account value over the period, multiplied by 181/365 (to reflect the one-half year period).
| Annualized
Expense Ratio |
Class A | 1.40% |
Class T | 1.65% |
Class B | 2.15% |
Class C | 2.15% |
Small Cap Value | 1.11% |
Institutional Class | 1.09% |
Annual Report
Investment Changes
Top Ten Stocks as of July 31, 2007 |
| % of fund's
net assets | % of fund's net assets
6 months ago |
Tesoro Corp. | 3.2 | 2.4 |
Carpenter Technology Corp. | 2.4 | 2.2 |
UAP Holding Corp. | 1.9 | 1.8 |
Arris Group, Inc. | 1.8 | 1.5 |
Jarden Corp. | 1.8 | 1.9 |
Jones Lang LaSalle, Inc. | 1.7 | 1.8 |
AAR Corp. | 1.7 | 1.9 |
RC2 Corp. | 1.7 | 1.7 |
Washington Group International, Inc. | 1.6 | 1.0 |
Telvent GIT SA | 1.6 | 1.1 |
| 19.4 | |
Top Five Market Sectors as of July 31, 2007 |
| % of fund's
net assets | % of fund's net assets
6 months ago |
Financials | 23.1 | 23.6 |
Information Technology | 17.1 | 15.0 |
Industrials | 17.0 | 15.3 |
Consumer Discretionary | 11.9 | 13.0 |
Energy | 10.6 | 8.0 |
Asset Allocation (% of fund's net assets) |
As of July 31, 2007 * | As of January 31, 2007 ** |
| Stocks 98.1% | | | Stocks 92.1% | |
| Short-Term
Investments and
Net Other Assets 1.9% | | | Short-Term
Investments and
Net Other Assets 7.9% | |
* Foreign investments | 7.6% | | ** Foreign investments | 6.5% | |

Annual Report
Investments July 31, 2007
Showing Percentage of Net Assets
Common Stocks - 98.1% |
| Shares | | Value |
CONSUMER DISCRETIONARY - 11.9% |
Auto Components - 0.8% |
Aftermarket Technology Corp. (a) | 150,000 | | $ 4,552,500 |
ArvinMeritor, Inc. | 175,000 | | 3,470,250 |
Hawk Corp. Class A (a) | 223,100 | | 3,257,260 |
| | 11,280,010 |
Distributors - 0.4% |
Building Materials Holding Corp. (d) | 439,100 | | 6,099,099 |
Hotels, Restaurants & Leisure - 1.5% |
Pinnacle Entertainment, Inc. (a) | 412,700 | | 10,940,677 |
Red Robin Gourmet Burgers, Inc. (a) | 140,000 | | 5,399,800 |
Wyndham Worldwide Corp. (a) | 150,000 | | 5,047,500 |
| | 21,387,977 |
Household Durables - 2.7% |
Directed Electronics, Inc. (a) | 180,886 | | 1,365,689 |
Ethan Allen Interiors, Inc. (d) | 285,300 | | 9,745,848 |
Jarden Corp. (a)(d) | 684,600 | | 24,734,598 |
Ryland Group, Inc. | 55,000 | | 1,828,750 |
| | 37,674,885 |
Leisure Equipment & Products - 1.7% |
MarineMax, Inc. (a) | 30,000 | | 561,000 |
RC2 Corp. (a) | 669,555 | | 23,708,943 |
| | 24,269,943 |
Media - 1.0% |
Charter Communications, Inc. Class A (a) | 1,000,000 | | 4,060,000 |
Sinclair Broadcast Group, Inc. Class A | 720,500 | | 9,395,320 |
| | 13,455,320 |
Multiline Retail - 0.0% |
Retail Ventures, Inc. (a) | 23,100 | | 300,762 |
Specialty Retail - 2.3% |
Asbury Automotive Group, Inc. | 250,000 | | 5,530,000 |
Gymboree Corp. (a) | 270,000 | | 11,623,500 |
Lithia Motors, Inc. Class A (sub. vtg.) | 54,000 | | 1,111,860 |
Mothers Work, Inc. (a) | 78,600 | | 1,744,920 |
Payless ShoeSource, Inc. (a) | 200,000 | | 5,324,000 |
Select Comfort Corp. (a)(d) | 390,000 | | 6,216,600 |
| | 31,550,880 |
Textiles, Apparel & Luxury Goods - 1.5% |
Skechers U.S.A., Inc. Class A (sub. vtg.) (a) | 505,000 | | 10,498,950 |
Common Stocks - continued |
| Shares | | Value |
CONSUMER DISCRETIONARY - continued |
Textiles, Apparel & Luxury Goods - continued |
Steven Madden Ltd. | 265,000 | | $ 7,473,000 |
Warnaco Group, Inc. (a) | 90,000 | | 3,249,900 |
| | 21,221,850 |
TOTAL CONSUMER DISCRETIONARY | | 167,240,726 |
CONSUMER STAPLES - 5.2% |
Food & Staples Retailing - 1.1% |
The Pantry, Inc. (a) | 451,000 | | 15,712,840 |
Food Products - 1.6% |
Chiquita Brands International, Inc. | 171,000 | | 3,002,760 |
Diamond Foods, Inc. | 395,400 | | 6,496,422 |
Hain Celestial Group, Inc. (a) | 140,000 | | 3,792,600 |
Marine Harvest ASA (a) | 7,155,000 | | 9,046,862 |
| | 22,338,644 |
Household Products - 0.7% |
Central Garden & Pet Co. Class A (non-vtg.) (a) | 788,300 | | 9,648,792 |
Personal Products - 1.8% |
Physicians Formula Holdings, Inc. | 68,100 | | 1,018,095 |
Playtex Products, Inc. (a) | 771,600 | | 13,819,356 |
Prestige Brands Holdings, Inc. (a) | 892,631 | | 11,166,814 |
| | 26,004,265 |
TOTAL CONSUMER STAPLES | | 73,704,541 |
ENERGY - 10.6% |
Energy Equipment & Services - 2.1% |
Hornbeck Offshore Services, Inc. (a) | 154,100 | | 6,634,005 |
Oil States International, Inc. (a) | 244,760 | | 10,705,802 |
Superior Energy Services, Inc. (a) | 290,000 | | 11,692,800 |
| | 29,032,607 |
Oil, Gas & Consumable Fuels - 8.5% |
Alpha Natural Resources, Inc. (a) | 114,600 | | 2,045,610 |
Cabot Oil & Gas Corp. | 320,000 | | 10,944,000 |
Forest Oil Corp. (a) | 260,300 | | 10,534,341 |
Mariner Energy, Inc. (a) | 530,000 | | 11,198,900 |
Petrohawk Energy Corp. (a) | 790,000 | | 11,842,100 |
Petroleum Development Corp. (a) | 127,622 | | 5,148,271 |
Southwestern Energy Co. (a) | 320,000 | | 13,001,600 |
Common Stocks - continued |
| Shares | | Value |
ENERGY - continued |
Oil, Gas & Consumable Fuels - continued |
Tesoro Corp. | 907,600 | | $ 45,198,478 |
USEC, Inc. (a) | 230,000 | | 3,861,700 |
Western Refining, Inc. | 110,000 | | 6,105,000 |
| | 119,880,000 |
TOTAL ENERGY | | 148,912,607 |
FINANCIALS - 23.1% |
Capital Markets - 1.6% |
ACA Capital Holdings, Inc. (d) | 88,600 | | 518,310 |
American Capital Strategies Ltd. (d) | 78,700 | | 2,988,239 |
KBW, Inc. (d) | 175,000 | | 4,394,250 |
MF Global Ltd. | 54,600 | | 1,361,178 |
Penson Worldwide, Inc. | 80,000 | | 1,412,000 |
Piper Jaffray Companies (a)(d) | 75,000 | | 3,594,000 |
TradeStation Group, Inc. (a) | 718,300 | | 7,592,431 |
| | 21,860,408 |
Commercial Banks - 5.2% |
Boston Private Financial Holdings, Inc. (d) | 610,200 | | 15,553,998 |
Cathay General Bancorp | 266,520 | | 8,158,177 |
Center Financial Corp., California | 354,052 | | 5,261,213 |
Colonial Bancgroup, Inc. | 130,000 | | 2,835,300 |
East West Bancorp, Inc. | 28,800 | | 1,055,808 |
First State Bancorp. | 280,368 | | 4,839,152 |
Hanmi Financial Corp. | 195,040 | | 2,828,080 |
Investors Bancorp, Inc. (a)(d) | 190,000 | | 2,285,700 |
Nara Bancorp, Inc. | 183,270 | | 2,705,065 |
South Financial Group, Inc. | 340,000 | | 7,330,400 |
Sterling Bancshares, Inc. | 235,000 | | 2,446,350 |
UCBH Holdings, Inc. | 150,000 | | 2,466,000 |
UMB Financial Corp. | 195,000 | | 7,281,300 |
Wintrust Financial Corp. | 197,360 | | 7,777,958 |
| | 72,824,501 |
Consumer Finance - 0.9% |
Advanta Corp. Class B | 97,500 | | 2,501,850 |
Cash America International, Inc. | 90,000 | | 3,295,800 |
CompuCredit Corp. (a)(d) | 55,000 | | 1,443,750 |
Dollar Financial Corp. (a) | 210,000 | | 5,262,600 |
| | 12,504,000 |
Common Stocks - continued |
| Shares | | Value |
FINANCIALS - continued |
Diversified Financial Services - 1.1% |
Endeavor Acquisition Corp. (a)(d) | 341,000 | | $ 3,768,050 |
MarketAxess Holdings, Inc. (a) | 450,000 | | 7,474,500 |
Marlin Business Services Corp. (a) | 220,779 | | 4,302,983 |
| | 15,545,533 |
Insurance - 11.2% |
American Equity Investment Life Holding Co. | 1,039,506 | | 11,798,393 |
Aspen Insurance Holdings Ltd. | 360,200 | | 8,806,890 |
Delphi Financial Group, Inc. Class A | 172,850 | | 6,943,385 |
HCC Insurance Holdings, Inc. | 670,920 | | 19,644,538 |
Infinity Property & Casualty Corp. | 90,000 | | 3,963,600 |
IPC Holdings Ltd. | 573,740 | | 14,234,489 |
Max Capital Group Ltd. | 175,000 | | 4,569,250 |
National Financial Partners Corp. (d) | 456,300 | | 21,154,068 |
Navigators Group, Inc. (a) | 104,862 | | 5,485,331 |
Ohio Casualty Corp. | 80,500 | | 3,494,505 |
PartnerRe Ltd. | 30,000 | | 2,130,900 |
Philadelphia Consolidated Holdings Corp. (a) | 59,140 | | 2,137,320 |
Platinum Underwriters Holdings Ltd. | 329,700 | | 10,946,040 |
Tower Group, Inc. | 305,000 | | 8,082,500 |
United America Indemnity Ltd. Class A (a) | 91,022 | | 1,955,153 |
Universal American Financial Corp. (a) | 150,000 | | 2,986,500 |
Willis Group Holdings Ltd. | 195,000 | | 7,915,050 |
Zenith National Insurance Corp. | 524,000 | | 21,148,640 |
| | 157,396,552 |
Real Estate Investment Trusts - 0.3% |
Education Realty Trust, Inc. | 158,300 | | 2,081,645 |
GMH Communities Trust | 264,100 | | 2,218,440 |
| | 4,300,085 |
Real Estate Management & Development - 1.7% |
Jones Lang LaSalle, Inc. | 223,000 | | 24,480,940 |
Thrifts & Mortgage Finance - 1.1% |
BankAtlantic Bancorp, Inc. Class A (non-vtg.) | 59,125 | | 518,526 |
Downey Financial Corp. (d) | 20,000 | | 1,063,800 |
Farmer Mac Class C (non-vtg.) | 140,000 | | 3,917,200 |
Provident Financial Services, Inc. | 100,000 | | 1,410,000 |
Radian Group, Inc. | 65,000 | | 2,191,150 |
Common Stocks - continued |
| Shares | | Value |
FINANCIALS - continued |
Thrifts & Mortgage Finance - continued |
Triad Guaranty, Inc. (a) | 50,000 | | $ 1,378,500 |
Washington Federal, Inc. | 210,000 | | 4,731,300 |
| | 15,210,476 |
TOTAL FINANCIALS | | 324,122,495 |
HEALTH CARE - 3.3% |
Health Care Equipment & Supplies - 0.2% |
Zoll Medical Corp. (a) | 100,000 | | 2,686,000 |
Health Care Providers & Services - 1.2% |
Air Methods Corp. (a) | 209,167 | | 7,969,263 |
Capital Senior Living Corp. (a) | 111,185 | | 985,099 |
Omnicare, Inc. | 50,000 | | 1,658,000 |
Pediatrix Medical Group, Inc. (a) | 100,000 | | 5,396,000 |
| | 16,008,362 |
Life Sciences Tools & Services - 0.6% |
ICON PLC sponsored ADR | 178,720 | | 8,358,734 |
Pharmaceuticals - 1.3% |
Adams Respiratory Therapeutics, Inc. (a) | 135,000 | | 4,996,350 |
Valeant Pharmaceuticals International | 880,000 | | 13,807,200 |
| | 18,803,550 |
TOTAL HEALTH CARE | | 45,856,646 |
INDUSTRIALS - 17.0% |
Aerospace & Defense - 3.1% |
AAR Corp. (a) | 802,300 | | 23,932,609 |
DRS Technologies, Inc. | 144,000 | | 7,539,840 |
Hexcel Corp. (a) | 250,200 | | 5,439,348 |
Orbital Sciences Corp. (a) | 325,000 | | 6,886,750 |
| | 43,798,547 |
Air Freight & Logistics - 1.4% |
Hub Group, Inc. Class A (a) | 180,000 | | 6,123,600 |
Park-Ohio Holdings Corp. (a) | 401,646 | | 9,976,887 |
UTI Worldwide, Inc. | 160,000 | | 4,020,800 |
| | 20,121,287 |
Airlines - 0.2% |
AirTran Holdings, Inc. (a)(d) | 310,000 | | 3,050,400 |
Common Stocks - continued |
| Shares | | Value |
INDUSTRIALS - continued |
Commercial Services & Supplies - 2.8% |
FTI Consulting, Inc. (a) | 360,000 | | $ 14,770,800 |
IKON Office Solutions, Inc. | 200,000 | | 2,772,000 |
Interface, Inc. Class A | 328,590 | | 6,055,914 |
Navigant Consulting, Inc. (a) | 125,000 | | 1,968,750 |
Team, Inc. (a) | 279,628 | | 13,145,312 |
| | 38,712,776 |
Construction & Engineering - 3.6% |
Infrasource Services, Inc. (a) | 175,000 | | 6,058,500 |
Shaw Group, Inc. (a) | 418,000 | | 22,245,960 |
Washington Group International, Inc. (a) | 285,000 | | 22,891,200 |
| | 51,195,660 |
Electrical Equipment - 1.3% |
Belden, Inc. | 320,000 | | 17,529,600 |
Machinery - 1.2% |
AGCO Corp. (a) | 85,000 | | 3,266,550 |
Bucyrus International, Inc. Class A | 8,300 | | 527,548 |
Force Protection, Inc. (a)(d) | 470,000 | | 7,379,000 |
Manitowoc Co., Inc. | 76,520 | | 5,943,308 |
| | 17,116,406 |
Road & Rail - 0.4% |
YRC Worldwide, Inc. (a) | 175,000 | | 5,621,000 |
Trading Companies & Distributors - 3.0% |
Kaman Corp. | 223,822 | | 7,495,799 |
Rush Enterprises, Inc. Class A (a) | 90,000 | | 2,515,500 |
UAP Holding Corp. | 980,980 | | 26,653,227 |
WESCO International, Inc. (a) | 88,000 | | 4,712,400 |
| | 41,376,926 |
TOTAL INDUSTRIALS | | 238,522,602 |
INFORMATION TECHNOLOGY - 17.1% |
Communications Equipment - 2.8% |
Andrew Corp. (a) | 330,000 | | 4,639,800 |
Arris Group, Inc. (a) | 1,685,000 | | 24,971,700 |
Avocent Corp. (a) | 80,000 | | 2,188,000 |
Polycom, Inc. (a) | 245,000 | | 7,587,650 |
| | 39,387,150 |
Common Stocks - continued |
| Shares | | Value |
INFORMATION TECHNOLOGY - continued |
Computers & Peripherals - 0.9% |
Brocade Communications Systems, Inc. (a) | 1,385,000 | | $ 9,750,400 |
Diebold, Inc. | 50,000 | | 2,533,500 |
| | 12,283,900 |
Electronic Equipment & Instruments - 5.7% |
Amphenol Corp. Class A | 40,000 | | 1,370,400 |
Benchmark Electronics, Inc. (a) | 167,900 | | 3,727,380 |
CTS Corp. | 190,000 | | 2,420,600 |
Ingram Micro, Inc. Class A (a) | 837,700 | | 16,795,885 |
Insight Enterprises, Inc. (a) | 680,600 | | 15,354,336 |
Mettler-Toledo International, Inc. (a) | 113,700 | | 10,819,692 |
SYNNEX Corp. (a) | 85,000 | | 1,727,200 |
Tektronix, Inc. | 551,000 | | 18,100,350 |
Vishay Intertechnology, Inc. (a) | 677,491 | | 10,507,885 |
| | 80,823,728 |
Internet Software & Services - 1.0% |
j2 Global Communications, Inc. (a) | 430,800 | | 14,061,312 |
IT Services - 2.7% |
CACI International, Inc. Class A (a) | 135,000 | | 5,999,400 |
ManTech International Corp. Class A (a) | 105,000 | | 3,429,300 |
MoneyGram International, Inc. | 80,000 | | 2,047,200 |
Ness Technologies, Inc. (a) | 265,200 | | 3,118,752 |
Telvent GIT SA | 971,000 | | 22,828,210 |
| | 37,422,862 |
Semiconductors & Semiconductor Equipment - 2.4% |
ANADIGICS, Inc. (a)(d) | 425,000 | | 6,175,250 |
California Micro Devices Corp. (a) | 253,000 | | 1,133,440 |
Entegris, Inc. (a) | 500,000 | | 5,390,000 |
FormFactor, Inc. (a) | 195,900 | | 7,520,601 |
Integrated Device Technology, Inc. (a) | 195,400 | | 3,179,158 |
Microsemi Corp. (a)(d) | 141,400 | | 3,296,034 |
MKS Instruments, Inc. (a) | 173,900 | | 3,947,530 |
Rudolph Technologies, Inc. (a) | 165,244 | | 2,586,069 |
| | 33,228,082 |
Software - 1.6% |
Blackbaud, Inc. | 340,000 | | 7,119,600 |
Quest Software, Inc. (a) | 730,000 | | 10,804,000 |
Common Stocks - continued |
| Shares | | Value |
INFORMATION TECHNOLOGY - continued |
Software - continued |
Sonic Solutions, Inc. (a) | 255,000 | | $ 2,850,900 |
THQ, Inc. (a) | 70,000 | | 2,013,200 |
| | 22,787,700 |
TOTAL INFORMATION TECHNOLOGY | | 239,994,734 |
MATERIALS - 6.1% |
Chemicals - 1.4% |
Airgas, Inc. | 155,000 | | 7,238,500 |
CF Industries Holdings, Inc. | 115,000 | | 6,610,200 |
H.B. Fuller Co. | 175,000 | | 4,835,250 |
OMNOVA Solutions, Inc. (a) | 125,000 | | 707,500 |
Tronox, Inc. Class A | 47,900 | | 569,531 |
| | 19,960,981 |
Containers & Packaging - 0.2% |
Smurfit-Stone Container Corp. (a) | 190,000 | | 2,240,100 |
Metals & Mining - 4.5% |
Carpenter Technology Corp. | 280,000 | | 33,233,200 |
Compass Minerals International, Inc. | 441,466 | | 14,497,743 |
Meridian Gold, Inc. (a) | 428,400 | | 12,093,736 |
Titanium Metals Corp. (a) | 120,000 | | 4,010,400 |
| | 63,835,079 |
TOTAL MATERIALS | | 86,036,160 |
TELECOMMUNICATION SERVICES - 0.9% |
Diversified Telecommunication Services - 0.9% |
General Communications, Inc. Class A (a) | 290,000 | | 3,337,900 |
Level 3 Communications, Inc. (a) | 800,000 | | 4,184,000 |
Time Warner Telecom, Inc. Class A (sub. vtg.) (a) | 230,000 | | 4,496,500 |
| | 12,018,400 |
UTILITIES - 2.9% |
Electric Utilities - 1.1% |
ITC Holdings Corp. | 358,400 | | 15,070,720 |
Maine & Maritimes Corp. (a) | 10,170 | | 275,912 |
| | 15,346,632 |
Independent Power Producers & Energy Traders - 0.5% |
NRG Energy, Inc. (a) | 168,000 | | 6,476,400 |
Common Stocks - continued |
| Shares | | Value |
UTILITIES - continued |
Multi-Utilities - 1.3% |
CMS Energy Corp. | 707,500 | | $ 11,433,200 |
Integrys Energy Group, Inc. | 155,000 | | 7,670,950 |
| | 19,104,150 |
TOTAL UTILITIES | | 40,927,182 |
TOTAL COMMON STOCKS (Cost $1,243,321,810) | 1,377,336,093 |
Money Market Funds - 6.6% |
| | | |
Fidelity Cash Central Fund, 5.38% (b) | 29,921,812 | | 29,921,812 |
Fidelity Securities Lending Cash Central Fund, 5.39% (b)(c) | 63,626,700 | | 63,626,700 |
TOTAL MONEY MARKET FUNDS (Cost $93,548,512) | 93,548,512 |
TOTAL INVESTMENT PORTFOLIO - 104.7% (Cost $1,336,870,322) | | 1,470,884,605 |
NET OTHER ASSETS - (4.7)% | | (66,376,569) |
NET ASSETS - 100% | $ 1,404,508,036 |
Legend |
(a) Non-income producing |
(b) Affiliated fund that is available only to investment companies and other accounts managed by Fidelity Investments. The rate quoted is the annualized seven-day yield of the fund at period end. A complete unaudited listing of the fund's holdings as of its most recent quarter end is available upon request. |
(c) Investment made with cash collateral received from securities on loan. |
(d) Security or a portion of the security is on loan at period end. |
Affiliated Central Funds |
Information regarding fiscal year to date income earned by the Fund from investments in Fidelity Central Funds is as follows: |
Fund | Income earned |
Fidelity Cash Central Fund | $ 2,332,676 |
Fidelity Securities Lending Cash Central Fund | 574,407 |
Total | $ 2,907,083 |
See accompanying notes which are an integral part of the financial statements.
Annual Report
Financial Statements
Statement of Assets and Liabilities
| July 31, 2007 |
Assets | | |
Investment in securities, at value (including securities loaned of $61,245,338) - See accompanying schedule: Unaffiliated issuers (cost $1,243,321,810) | $ 1,377,336,093 | |
Fidelity Central Funds (cost $93,548,512) | 93,548,512 | |
Total Investments (cost $1,336,870,322) | | $ 1,470,884,605 |
Receivable for investments sold | | 4,800,185 |
Receivable for fund shares sold | | 2,028,784 |
Dividends receivable | | 420,385 |
Distributions receivable from Fidelity Central Funds | | 215,151 |
Prepaid expenses | | 2,044 |
Receivable from investment adviser for expense reductions | | 2,556 |
Other receivables | | 1,456 |
Total assets | | 1,478,355,166 |
| | |
Liabilities | | |
Payable for investments purchased | $ 5,969,420 | |
Payable for fund shares redeemed | 2,729,587 | |
Accrued management fee | 1,050,191 | |
Distribution fees payable | 77,896 | |
Other affiliated payables | 342,208 | |
Other payables and accrued expenses | 51,128 | |
Collateral on securities loaned, at value | 63,626,700 | |
Total liabilities | | 73,847,130 |
| | |
Net Assets | | $ 1,404,508,036 |
Net Assets consist of: | | |
Paid in capital | | $ 1,227,191,980 |
Accumulated undistributed net realized gain (loss) on investments and foreign currency transactions | | 43,301,773 |
Net unrealized appreciation (depreciation) on investments | | 134,014,283 |
Net Assets | | $ 1,404,508,036 |
See accompanying notes which are an integral part of the financial statements.
Annual Report
Statement of Assets and Liabilities - continued
| July 31, 2007 |
| | |
Calculation of Maximum Offering Price
Class A:
Net Asset Value and redemption price per share ($61,356,936 ÷ 4,278,520 shares) | | $ 14.34 |
| | |
Maximum offering price per share (100/94.25 of $14.34) | | $ 15.21 |
Class T:
Net Asset Value and redemption price per share ($51,518,120 ÷ 3,607,221 shares) | | $ 14.28 |
| | |
Maximum offering price per share (100/96.50 of $14.28) | | $ 14.80 |
Class B:
Net Asset Value and offering price per share ($12,075,406 ÷ 851,177 shares)A | | $ 14.19 |
| | |
Class C:
Net Asset Value and offering price per share ($34,155,119 ÷ 2,407,204 shares)A | | $ 14.19 |
| | |
Small Cap Value:
Net Asset Value, offering price and redemption price per share ($1,233,808,057 ÷ 85,510,937 shares) | | $ 14.43 |
| | |
Institutional Class:
Net Asset Value, offering price and redemption price per share ($11,594,398 ÷ 803,667 shares) | | $ 14.43 |
A Redemption price per share is equal to net asset value less any applicable contingent deferred sales charge.
See accompanying notes which are an integral part of the financial statements.
Annual Report
Financial Statements - continued
Statement of Operations
| Year ended July 31, 2007 |
Investment Income | | |
Dividends | | $ 9,751,207 |
Interest | | 1,960 |
Income from Fidelity Central Funds | | 2,907,083 |
Total income | | 12,660,250 |
| | |
Expenses | | |
Management fee
Basic fee | $ 9,391,047 | |
Performance adjustment | 1,453,969 | |
Transfer agent fees | 3,238,967 | |
Distribution fees | 826,786 | |
Accounting and security lending fees | 435,846 | |
Custodian fees and expenses | 39,260 | |
Independent trustees' compensation | 4,149 | |
Registration fees | 121,175 | |
Audit | 55,232 | |
Legal | 11,142 | |
Miscellaneous | 28,936 | |
Total expenses before reductions | 15,606,509 | |
Expense reductions | (124,894) | 15,481,615 |
Net investment income (loss) | | (2,821,365) |
Realized and Unrealized Gain (Loss) Net realized gain (loss) on: | | |
Investment securities: | | |
Unaffiliated issuers | 58,292,629 | |
Foreign currency transactions | 8,949 | |
Total net realized gain (loss) | | 58,301,578 |
Change in net unrealized appreciation (depreciation) on: Investment securities | 108,216,200 | |
Assets and liabilities in foreign currencies | 372 | |
Total change in net unrealized appreciation (depreciation) | | 108,216,572 |
Net gain (loss) | | 166,518,150 |
Net increase (decrease) in net assets resulting from operations | | $ 163,696,785 |
See accompanying notes which are an integral part of the financial statements.
Annual Report
Statement of Changes in Net Assets
| Year ended
July 31,
2007 | Year ended
July 31,
2006 |
Increase (Decrease) in Net Assets | | |
Operations | | |
Net investment income (loss) | $ (2,821,365) | $ 38,256 |
Net realized gain (loss) | 58,301,578 | 59,284,810 |
Change in net unrealized appreciation (depreciation) | 108,216,572 | (30,701,367) |
Net increase (decrease) in net assets resulting
from operations | 163,696,785 | 28,621,699 |
Distributions to shareholders from net investment income | - | (633,037) |
Distributions to shareholders from net realized gain | (55,419,267) | (20,371,695) |
Total distributions | (55,419,267) | (21,004,732) |
Share transactions - net increase (decrease) | 206,517,786 | 457,176,942 |
Redemption fees | 174,668 | 517,538 |
Total increase (decrease) in net assets | 314,969,972 | 465,311,447 |
| | |
Net Assets | | |
Beginning of period | 1,089,538,064 | 624,226,617 |
End of period | $ 1,404,508,036 | $ 1,089,538,064 |
See accompanying notes which are an integral part of the financial statements.
Annual Report
Financial Highlights - Class A
Years ended July 31, | 2007 | 2006 | 2005 H |
Selected Per-Share Data | | | |
Net asset value, beginning of period | $ 13.17 | $ 12.80 | $ 10.00 |
Income from Investment Operations | | | |
Net investment income (loss) E | (.06) | (.03) | (.04) |
Net realized and unrealized gain (loss) | 1.90 | .74 | 2.84 |
Total from investment operations | 1.84 | .71 | 2.80 |
Distributions from net investment income | - | - | (.01) |
Distributions from net realized gain | (.67) | (.35) | - |
Total distributions | (.67) | (.35) | (.01) |
Redemption fees added to paid in capital E | - J | .01 | .01 |
Net asset value, end of period | $ 14.34 | $ 13.17 | $ 12.80 |
Total Return B, C, D | 14.59% | 5.72% | 28.06% |
Ratios to Average Net Assets F, I | | | |
Expenses before reductions | 1.45% | 1.51% | 1.46% A |
Expenses net of fee waivers, if any | 1.40% | 1.40% | 1.44% A |
Expenses net of all reductions | 1.40% | 1.36% | 1.38% A |
Net investment income (loss) | (.44)% | (.24)% | (.46)% A |
Supplemental Data | | | |
Net assets, end of period (000 omitted) | $ 61,357 | $ 39,931 | $ 9,390 |
Portfolio turnover rate G | 67% | 93% | 60% A |
A Annualized
B Total returns for periods of less than one year are not annualized.
C Total returns would have been lower had certain expenses not been reduced during the periods shown.
D Total returns do not include the effect of the sales charges.
E Calculated based on average shares outstanding during the period.
F Fees and expenses of the underlying Fidelity Central Funds are not included in the Fund's expense ratio. The Fund indirectly bears its proportionate share of the expenses of any underlying Fidelity Central Funds.
G Amount does not include the portfolio activity of any underlying Fidelity Central Funds.
H For the period November 3, 2004 (commencement of operations) to July 31, 2005.
I Expense ratios reflect operating expenses of the class. Expenses before reductions do not reflect amounts reimbursed by the investment adviser or reductions from brokerage service arrangements or other expense offset arrangements and do not represent the amount paid by the class during periods when reimbursements or reductions occur. Expense ratios before reductions for start-up periods may not be representative of longer-term operating periods. Expenses net of fee waivers reflect expenses after reimbursement by the investment adviser but prior to reductions from brokerage service arrangements or other expense offset arrangements. Expenses net of all reductions represent the net expenses paid by the class.
J Amount represents less than $.01 per share.
See accompanying notes which are an integral part of the financial statements.
Annual Report
Financial Highlights - Class T
Years ended July 31, | 2007 | 2006 | 2005 H |
Selected Per-Share Data | | | |
Net asset value, beginning of period | $ 13.13 | $ 12.78 | $ 10.00 |
Income from Investment Operations | | | |
Net investment income (loss) E | (.10) | (.07) | (.06) |
Net realized and unrealized gain (loss) | 1.90 | .74 | 2.83 |
Total from investment operations | 1.80 | .67 | 2.77 |
Distributions from net realized gain | (.65) | (.33) | - |
Redemption fees added to paid in capital E | - J | .01 | .01 |
Net asset value, end of period | $ 14.28 | $ 13.13 | $ 12.78 |
Total Return B, C, D | 14.34% | 5.47% | 27.80% |
Ratios to Average Net Assets F, I | | | |
Expenses before reductions | 1.66% | 1.67% | 1.72% A |
Expenses net of fee waivers, if any | 1.65% | 1.65% | 1.68% A |
Expenses net of all reductions | 1.65% | 1.61% | 1.62% A |
Net investment income (loss) | (.69)% | (.49)% | (.70)% A |
Supplemental Data | | | |
Net assets, end of period (000 omitted) | $ 51,518 | $ 45,460 | $ 12,725 |
Portfolio turnover rate G | 67% | 93% | 60% A |
A Annualized
B Total returns for periods of less than one year are not annualized.
C Total returns would have been lower had certain expenses not been reduced during the periods shown.
D Total returns do not include the effect of the sales charges.
E Calculated based on average shares outstanding during the period.
F Fees and expenses of the underlying Fidelity Central Funds are not included in the Fund's expense ratio. The Fund indirectly bears its proportionate share of the expenses of any underlying Fidelity Central Funds.
G Amount does not include the portfolio activity of any underlying Fidelity Central Funds.
H For the period November 3, 2004 (commencement of operations) to July 31, 2005.
I Expense ratios reflect operating expenses of the class. Expenses before reductions do not reflect amounts reimbursed by the investment adviser or reductions from brokerage service arrangements or other expense offset arrangements and do not represent the amount paid by the class during periods when reimbursements or reductions occur. Expense ratios before reductions for start-up periods may not be representative of longer-term operating periods. Expenses net of fee waivers reflect expenses after reimbursement by the investment adviser but prior to reductions from brokerage service arrangements or other expense offset arrangements. Expenses net of all reductions represent the net expenses paid by the class.
J Amount represents less than $.01 per share.
See accompanying notes which are an integral part of the financial statements.
Annual Report
Financial Highlights - Class B
Years ended July 31, | 2007 | 2006 | 2005 H |
Selected Per-Share Data | | | |
Net asset value, beginning of period | $ 13.07 | $ 12.73 | $ 10.00 |
Income from Investment Operations | | | |
Net investment income (loss) E | (.17) | (.13) | (.10) |
Net realized and unrealized gain (loss) | 1.90 | .74 | 2.82 |
Total from investment operations | 1.73 | .61 | 2.72 |
Distributions from net realized gain | (.61) | (.28) | - |
Redemption fees added to paid in capital E | - J | .01 | .01 |
Net asset value, end of period | $ 14.19 | $ 13.07 | $ 12.73 |
Total Return B, C, D | 13.78% | 4.97% | 27.30% |
Ratios to Average Net Assets F, I | | | |
Expenses before reductions | 2.20% | 2.26% | 2.24% A |
Expenses net of fee waivers, if any | 2.15% | 2.15% | 2.19% A |
Expenses net of all reductions | 2.15% | 2.11% | 2.13% A |
Net investment income (loss) | (1.19)% | (.99)% | (1.21)% A |
Supplemental Data | | | |
Net assets, end of period (000 omitted) | $ 12,075 | $ 10,214 | $ 3,931 |
Portfolio turnover rate G | 67% | 93% | 60% A |
A Annualized
B Total returns for periods of less than one year are not annualized.
C Total returns would have been lower had certain expenses not been reduced during the periods shown.
D Total returns do not include the effect of the contingent deferred sales charge.
E Calculated based on average shares outstanding during the period.
F Fees and expenses of the underlying Fidelity Central Funds are not included in the Fund's expense ratio. The Fund indirectly bears its proportionate share of the expenses of any underlying Fidelity Central Funds.
G Amount does not include the portfolio activity of any underlying Fidelity Central Funds.
H For the period November 3, 2004 (commencement of operations) to July 31, 2005.
I Expense ratios reflect operating expenses of the class. Expenses before reductions do not reflect amounts reimbursed by the investment adviser or reductions from brokerage service arrangements or other expense offset arrangements and do not represent the amount paid by the class during periods when reimbursements or reductions occur. Expense ratios before reductions for start-up periods may not be representative of longer-term operating periods. Expenses net of fee waivers reflect expenses after reimbursement by the investment adviser but prior to reductions from brokerage service arrangements or other expense offset arrangements. Expenses net of all reductions represent the net expenses paid by the class.
J Amount represents less than $.01 per share.
See accompanying notes which are an integral part of the financial statements.
Annual Report
Financial Highlights - Class C
Years ended July 31, | 2007 | 2006 | 2005 H |
Selected Per-Share Data | | | |
Net asset value, beginning of period | $ 13.07 | $ 12.74 | $ 10.00 |
Income from Investment Operations | | | |
Net investment income (loss) E | (.17) | (.13) | (.10) |
Net realized and unrealized gain (loss) | 1.90 | .74 | 2.83 |
Total from investment operations | 1.73 | .61 | 2.73 |
Distributions from net realized gain | (.61) | (.29) | - |
Redemption fees added to paid in capital E | - J | .01 | .01 |
Net asset value, end of period | $ 14.19 | $ 13.07 | $ 12.74 |
Total Return B, C, D | 13.77% | 4.92% | 27.40% |
Ratios to Average Net Assets F, I | | | |
Expenses before reductions | 2.20% | 2.22% | 2.17% A |
Expenses net of fee waivers, if any | 2.15% | 2.15% | 2.17% A |
Expenses net of all reductions | 2.15% | 2.11% | 2.11% A |
Net investment income (loss) | (1.19)% | (.99)% | (1.19)% A |
Supplemental Data | | | |
Net assets, end of period (000 omitted) | $ 34,155 | $ 26,791 | $ 11,732 |
Portfolio turnover rate G | 67% | 93% | 60% A |
A Annualized
B Total returns for periods of less than one year are not annualized.
C Total returns would have been lower had certain expenses not been reduced during the periods shown.
D Total returns do not include the effect of the contingent deferred sales charge.
E Calculated based on average shares outstanding during the period.
F Fees and expenses of the underlying Fidelity Central Funds are not included in the Fund's expense ratio. The Fund indirectly bears its proportionate share of the expenses of any underlying Fidelity Central Funds.
G Amount does not include the portfolio activity of any underlying Fidelity Central Funds.
H For the period November 3, 2004 (commencement of operations) to July 31, 2005.
I Expense ratios reflect operating expenses of the class. Expenses before reductions do not reflect amounts reimbursed by the investment adviser or reductions from brokerage service arrangements or other expense offset arrangements and do not represent the amount paid by the class during periods when reimbursements or reductions occur. Expense ratios before reductions for start-up periods may not be representative of longer-term operating periods. Expenses net of fee waivers reflect expenses after reimbursement by the investment adviser but prior to reductions from brokerage service arrangements or other expense offset arrangements. Expenses net of all reductions represent the net expenses paid by the class.
J Amount represents less than $.01 per share.
See accompanying notes which are an integral part of the financial statements.
Annual Report
Financial Highlights - Small Cap Value
Years ended July 31, | 2007 | 2006 | 2005 G |
Selected Per-Share Data | | | |
Net asset value, beginning of period | $ 13.22 | $ 12.83 | $ 10.00 |
Income from Investment Operations | | | |
Net investment income (loss) D | (.02) | .01 | (.01) |
Net realized and unrealized gain (loss) | 1.91 | .74 | 2.84 |
Total from investment operations | 1.89 | .75 | 2.83 |
Distributions from net investment income | - | (.01) | (.01) |
Distributions from net realized gain | (.68) | (.36) | - |
Total distributions | (.68) | (.37) | (.01) |
Redemption fees added to paid in capital D | - I | .01 | .01 |
Net asset value, end of period | $ 14.43 | $ 13.22 | $ 12.83 |
Total Return B, C | 14.96% | 6.07% | 28.36% |
Ratios to Average Net Assets E, H | | | |
Expenses before reductions | 1.11% | 1.09% | 1.05% A |
Expenses net of fee waivers, if any | 1.11% | 1.09% | 1.05% A |
Expenses net of all reductions | 1.11% | 1.06% | .99% A |
Net investment income (loss) | (.15)% | .06% | (.08)% A |
Supplemental Data | | | |
Net assets, end of period (000 omitted) | $ 1,233,808 | $ 957,720 | $ 582,689 |
Portfolio turnover rate F | 67% | 93% | 60% A |
A Annualized
B Total returns for periods of less than one year are not annualized.
C Total returns would have been lower had certain expenses not been reduced during the periods shown.
D Calculated based on average shares outstanding during the period.
E Fees and expenses of the underlying Fidelity Central Funds are not included in the Fund's expense ratio. The Fund indirectly bears its proportionate share of the expenses of any underlying Fidelity Central Funds.
F Amount does not include the portfolio activity of any underlying Fidelity Central Funds.
G For the period November 3, 2004 (commencement of operations) to July 31, 2005.
H Expense ratios reflect operating expenses of the class. Expenses before reductions do not reflect amounts reimbursed by the investment adviser or reductions from brokerage service arrangements or other expense offset arrangements and do not represent the amount paid by the class during periods when reimbursements or reductions occur. Expense ratios before reductions for start-up periods may not be representative of longer-term operating periods. Expenses net of fee waivers reflect expenses after reimbursement by the investment adviser but prior to reductions from brokerage service arrangements or other expense offset arrangements. Expenses net of all reductions represent the net expenses paid by the class.
I Amount represents less than $.01 per share.
See accompanying notes which are an integral part of the financial statements.
Annual Report
Financial Highlights - Institutional Class
Years ended July 31, | 2007 | 2006 | 2005 G |
Selected Per-Share Data | | | |
Net asset value, beginning of period | $ 13.22 | $ 12.83 | $ 10.00 |
Income from Investment Operations | | | |
Net investment income (loss) D | (.02) | .01 | (.01) |
Net realized and unrealized gain (loss) | 1.91 | .74 | 2.84 |
Total from investment operations | 1.89 | .75 | 2.83 |
Distributions from net investment income | - | (.01) | (.01) |
Distributions from net realized gain | (.68) | (.36) | - |
Total distributions | (.68) | (.37) | (.01) |
Redemption fees added to paid in capital D | - I | .01 | .01 |
Net asset value, end of period | $ 14.43 | $ 13.22 | $ 12.83 |
Total Return B, C | 14.99% | 6.08% | 28.36% |
Ratios to Average Net Assets E, H | | | |
Expenses before reductions | 1.10% | 1.08% | 1.07% A |
Expenses net of fee waivers, if any | 1.10% | 1.08% | 1.07% A |
Expenses net of all reductions | 1.10% | 1.05% | 1.01% A |
Net investment income (loss) | (.13)% | .08% | (.10)% A |
Supplemental Data | | | |
Net assets, end of period (000 omitted) | $ 11,594 | $ 9,422 | $ 3,761 |
Portfolio turnover rate F | 67% | 93% | 60% A |
A Annualized
B Total returns for periods of less than one year are not annualized.
C Total returns would have been lower had certain expenses not been reduced during the periods shown.
D Calculated based on average shares outstanding during the period.
E Fees and expenses of the underlying Fidelity Central Funds are not included in the Fund's expense ratio. The Fund indirectly bears its proportionate share of the expenses of any underlying Fidelity Central Funds.
F Amount does not include the portfolio activity of any underlying Fidelity Central Funds.
G For the period November 3, 2004 (commencement of operations) to July 31, 2005..
H Expense ratios reflect operating expenses of the class. Expenses before reductions do not reflect amounts reimbursed by the investment adviser or reductions from brokerage service arrangements or other expense offset arrangements and do not represent the amount paid by the class during periods when reimbursements or reductions occur. Expense ratios before reductions for start-up periods may not be representative of longer-term operating periods. Expenses net of fee waivers reflect expenses after reimbursement by the investment adviser but prior to reductions from brokerage service arrangements or other expense offset arrangements. Expenses net of all reductions represent the net expenses paid by the class.
I Amount represents less than $.01 per share.
See accompanying notes which are an integral part of the financial statements.
Annual Report
Notes to Financial Statements
For the period ended July 31, 2007
1. Organization.
Fidelity Small Cap Value Fund (the Fund) is a non-diversified fund of Fidelity Securities Fund (the trust) and is authorized to issue an unlimited number of shares. The trust is registered under the Investment Company Act of 1940, as amended (the 1940 Act), as an open-end management investment company organized as a Massachusetts business trust. The Fund offers Class A, Class T, Class B, Class C, Small Cap Value and Institutional Class shares, each of which has equal rights as to assets and voting privileges. Each class has exclusive voting rights with respect to matters that affect that class. Class B shares will automatically convert to Class A shares after a holding period of seven years from the initial date of purchase. Investment income, realized and unrealized capital gains and losses, the common expenses of the Fund, and certain fund-level expense reductions, if any, are allocated on a pro rata basis to each class based on the relative net assets of each class to the total net assets of the Fund. Each class differs with respect to transfer agent and distribution and service plan fees incurred. Certain expense reductions also differ by class.
2. Investments in Fidelity Central Funds.
The Fund may invest in Fidelity Central Funds which are open-end investment companies available only to other investment companies and accounts managed by Fidelity Management & Research Company (FMR) and its affiliates. The Fund's Schedule of Investments lists each of the Fidelity Central Funds as an investment of the Fund, but does not include the underlying holdings of each Fidelity Central Fund. As an Investing Fund, the Fund indirectly bears its proportionate share of the expenses of the underlying Fidelity Central Funds.
The Money Market Central Funds seek preservation of capital and current income and are managed by Fidelity Investments Money Management, Inc. (FIMM), an affiliate of FMR.
A complete list of holdings for each Fidelity Central Fund is available upon request or at the SEC's website at www.sec.gov. In addition, the financial statements of the Fidelity Central Funds, which are not covered by the Fund's Report of Independent Registered Public Accounting Firm, are available on the SEC's web site, or upon request.
3. Significant Accounting Policies.
The financial statements have been prepared in conformity with accounting principles generally accepted in the United States of America, which require management to make certain estimates and assumptions at the date of the financial statements. The following summarizes the significant accounting policies of the Fund:
Annual Report
3. Significant Accounting Policies - continued
Security Valuation. Investments are valued and net asset value (NAV) per share is calculated (NAV calculation) as of the close of business of the New York Stock Exchange (NYSE), normally 4:00 p.m. Eastern time. Wherever possible, the Fund uses independent pricing services approved by the Board of Trustees to value its investments.
Equity securities, including restricted securities, for which market quotations are readily available, are valued at the last reported sale price or official closing price as reported by an independent pricing service on the primary market or exchange on which they are traded. In the event there were no sales during the day or closing prices are not available, securities are valued at the last quoted bid price. Investments in open-end mutual funds, including the Fidelity Central Funds, are valued at their closing net asset value each business day. Short-term securities with remaining maturities of sixty days or less for which quotations are not readily available are valued at amortized cost, which approximates value.
When current market prices or quotations are not readily available or do not accurately reflect fair value, valuations may be determined in accordance with procedures adopted by the Board of Trustees. For example, when developments occur between the close of a market and the close of the NYSE that may materially affect the value of some or all of the securities, or when trading in a security is halted, those securities may be fair valued. Factors used in the determination of fair value may include monitoring news to identify significant market or security specific events such as changes in the value of U.S. securities markets, reviewing developments in foreign markets and evaluating the performance of ADRs, futures contracts and exchange-traded funds. Because the Fund's utilization of fair value pricing depends on market activity, the frequency with which fair value pricing is used cannot be predicted and may be utilized to a significant extent. The value of securities used for NAV calculation under fair value pricing may differ from published prices for the same securities.
Foreign Currency. The Fund uses foreign currency contracts to facilitate transactions in foreign-denominated securities. Losses from these transactions may arise from changes in the value of the foreign currency or if the counterparties do not perform under the contracts' terms.
Foreign-denominated assets, including investment securities, and liabilities are translated into U.S. dollars at the exchange rate at period end. Purchases and sales of investment securities, income and dividends received and expenses denominated in foreign currencies are translated into U.S. dollars at the exchange rate in effect on the transaction date.
Annual Report
Notes to Financial Statements - continued
3. Significant Accounting Policies - continued
Foreign Currency - continued
The effects of exchange rate fluctuations on investments are included with the net realized and unrealized gain (loss) on investment securities. Other foreign currency transactions resulting in realized and unrealized gain (loss) are disclosed separately.
Investment Transactions and Income. For financial reporting purposes, the Fund's investment holdings and NAV include trades executed through the end of the last business day of the period. The NAV for processing shareholder transactions includes trades executed through the end of the prior business day. Gains and losses on securities sold are determined on the basis of identified cost. Dividend income is recorded on the ex-dividend date, except for certain dividends from foreign securities where the ex-dividend date may have passed, which are recorded as soon as the Fund is informed of the ex-dividend date. Non-cash dividends included in dividend income, if any, are recorded at the fair market value of the securities received. Distributions received on securities that represent a return of capital or capital gain are recorded as a reduction of cost of investments and/or as a realized gain. The Fund estimates the components of distributions received that may be considered return of capital distributions or capital gain distributions. Interest income and distributions from the Fidelity Central Funds are accrued as earned. Interest income includes coupon interest and amortization of premium and accretion of discount on debt securities. Investment income is recorded net of foreign taxes withheld where recovery of such taxes is uncertain.
Expenses. Most expenses of the trust can be directly attributed to a fund. Expenses which cannot be directly attributed are apportioned among each Fund in the trust. Expense estimates are accrued in the period to which they relate and adjustments are made when actual amounts are known.
Income Tax Information and Distributions to Shareholders. Each year, the Fund intends to qualify as a regulated investment company by distributing all of its taxable income and realized gains under Subchapter M of the Internal Revenue Code. As a result, no provision for income taxes is required in the accompanying financial statements. Foreign taxes are provided for based on the Fund's understanding of the tax rules and rates that exist in the foreign markets in which it invests.
Distributions are recorded on the ex-dividend date. Income dividends and capital gain distributions are declared separately for each class. Income and capital gain distributions are determined in accordance with income tax regulations, which may differ from generally accepted accounting principles. In addition, the Fund will claim a portion of the payment made to redeeming shareholders as a distribution for income tax purposes.
Annual Report
3. Significant Accounting Policies - continued
Income Tax Information and Distributions to Shareholders - continued
Capital accounts within the financial statements are adjusted for permanent book-tax differences. These adjustments have no impact on net assets or the results of operations. Temporary book-tax differences will reverse in a subsequent period.
Book-tax differences are primarily due to foreign currency transactions and losses deferred due to wash sales.
The tax-basis components of distributable earnings and the federal tax cost as of period end were as follows:
Unrealized appreciation | $ 221,224,167 | |
Unrealized depreciation | (87,439,775) | |
Net unrealized appreciation (depreciation) | 133,784,392 | |
Undistributed ordinary income | 1,429,895 | |
Undistributed long-term capital gain | 35,852,159 | |
| | |
Cost for federal income tax purposes | $ 1,337,100,213 | |
The tax character of distributions paid was as follows:
| July 31, 2007 | July 31, 2006 |
Ordinary Income | $ 15,936,394 | $ 21,004,732 |
Long-term Capital Gains | 39,482,873 | - |
Total | $ 55,419,267 | $ 21,004,732 |
Short-Term Trading (Redemption) Fees. Shares held in the Fund less than 90 days are subject to a redemption fee equal to 1.50% of the proceeds of the redeemed shares. All redemption fees, including any estimated redemption fees paid by FMR, are retained by the Fund and accounted for as an addition to paid in capital.
New Accounting Pronouncements. In July 2006, Financial Accounting Standards Board Interpretation No. 48, Accounting for Uncertainty in Income Taxes - an interpretation of FASB Statement 109 (FIN 48), was issued and is effective on the last business day of the semiannual reporting period for fiscal years beginning after December 15, 2006. FIN 48 sets forth a threshold for financial statement recognition, measurement and disclosure of a tax position taken or expected to be taken on a tax return. Management has concluded that the adoption of FIN 48 will not result in a material impact on the Fund's net assets, results of operations and financial statement disclosures.
In addition, in September 2006, Statement of Financial Accounting Standards No. 157, Fair Value Measurements (SFAS 157), was issued and is effective for fiscal years beginning after November 15, 2007. SFAS 157 defines fair value, establishes a framework for
Annual Report
Notes to Financial Statements - continued
3. Significant Accounting Policies - continued
New Accounting Pronouncements - continued
measuring fair value and expands disclosures about fair value measurements. Management is currently evaluating the impact the adoption of SFAS 157 will have on the Fund's financial statement disclosures.
4. Operating Policies.
Repurchase Agreements. FMR has received an Exemptive Order from the Securities and Exchange Commission (the SEC) which permits the Fund and other affiliated entities of FMR to transfer uninvested cash balances into joint trading accounts which are then invested in repurchase agreements. The Fund may also invest directly with institutions in repurchase agreements. Repurchase agreements are collateralized by government or non-government securities. Upon settlement date, collateral is held in segregated accounts with custodian banks and may be obtained in the event of a default of the counterparty. The Fund monitors, on a daily basis, the value of the collateral to ensure it is at least equal to the principal amount of the repurchase agreement (including accrued interest). In the event of a default by the counterparty, realization of the collateral proceeds could be delayed, during which time the value of the collateral may decline.
5. Purchases and Sales of Investments.
Purchases and sales of securities, other than short-term securities, aggregated $1,035,796,031 and $851,598,507, respectively.
6. Fees and Other Transactions with Affiliates.
Management Fee. FMR and its affiliates provide the Fund with investment management related services for which the Fund pays a monthly management fee. The management fee is the sum of an individual fund fee rate that is based on an annual rate of .45% of the Fund's average net assets and a group fee rate that averaged ..26% during the period. The group fee rate is based upon the average net assets of all the mutual funds advised by FMR. The group fee rate decreases as assets under management increase and increases as assets under management decrease. In addition, the management fee is subject to a performance adjustment (up to a maximum of ±.20% of the Fund's average net assets over a 36 month performance period). The upward or downward adjustment to the management fee is based on the relative investment performance of the retail class of the Fund, Small Cap Value as compared to an appropriate benchmark index. For the period, the total annual management fee rate, including the performance adjustment, was .82% of the Fund's average net assets.
Annual Report
6. Fees and Other Transactions with Affiliates - continued
Distribution and Service Plan. In accordance with Rule 12b-1 of the 1940 Act, the Fund has adopted separate Distribution and Service Plans for each class of shares. Certain classes pay Fidelity Distributors Corporation (FDC), an affiliate of FMR, separate Distribution and Service Fees, each of which is based on an annual percentage of each class' average net assets. In addition, FDC may pay financial intermediaries for selling shares of the Fund and providing shareholder support services. For the period, the Distribution and Service Fee rates and the total amounts paid to and retained by FDC were as follows:
| Distribution
Fee | Service
Fee | Paid to
FDC | Retained
by FDC |
Class A | 0% | .25% | $ 132,888 | $ 15,618 |
Class T | .25% | .25% | 255,228 | 3,596 |
Class B | .75% | .25% | 119,704 | 90,112 |
Class C | .75% | .25% | 318,966 | 118,809 |
| | | $ 826,786 | $ 228,135 |
Sales Load. FDC receives a front-end sales charge of up to 5.75% for selling Class A shares, and 3.50% for selling Class T shares, some of which is paid to financial intermediaries for selling shares of the Fund. FDC receives the proceeds of contingent deferred sales charges levied on Class A, Class T, Class B, and Class C redemptions. These charges depend on the holding period. The deferred sales charges range from 5% to 1% for Class B, 1% for Class C, 1.00% to .50% for certain purchases of Class A shares and .25% for certain purchases of Class T shares.
For the period, sales charge amounts retained by FDC were as follows:
| Retained
by FDC |
Class A | $ 78,420 |
Class T | 20,737 |
Class B* | 20,164 |
Class C* | 6,183 |
| $ 125,504 |
* When Class B and Class C shares are initially sold, FDC pays commissions from its own resources to financial intermediaries through which the sales are made.
Transfer Agent Fees. Fidelity Investments Institutional Operations Company, Inc. (FIIOC), an affiliate of FMR, is the transfer, dividend disbursing and shareholder servicing agent for each class of the Fund, except for Small Cap Value. Fidelity Service Company, Inc. (FSC), an affiliate of FMR, is the transfer agent for Small Cap Value shares. FIIOC and FSC receive account fees and asset-based fees that vary according to
Annual Report
Notes to Financial Statements - continued
6. Fees and Other Transactions with Affiliates - continued
Transfer Agent Fees - continued
the account size and type of account of the shareholders of the respective classes of the Fund. FIIOC and FSC pay for typesetting, printing and mailing of shareholder reports, except proxy statements. For the period, the total transfer agent fees paid by each class to FIIOC or FSC, were as follows:
| Amount | % of
Average
Net Assets |
Class A | $ 169,502 | .32 |
Class T | 142,472 | .28 |
Class B | 38,602 | .32 |
Class C | 102,201 | .32 |
Small Cap Value | 2,761,176 | .24 |
Institutional Class | 25,014 | .22 |
| $ 3,238,967 | |
Accounting and Security Lending Fees. FSC maintains the Fund's accounting records. The accounting fee is based on the level of average net assets for the month. Under a separate contract, FSC administers the security lending program. The security lending fee is based on the number and duration of lending transactions.
Brokerage Commissions. The Fund placed a portion of its portfolio transactions with brokerage firms which are affiliates of the investment adviser. The commissions paid to these affiliated firms were $15,149 for the period.
7. Committed Line of Credit.
The Fund participates with other funds managed by FMR in a $4.2 billion credit facility (the "line of credit") to be utilized for temporary or emergency purposes to fund shareholder redemptions or for other short-term liquidity purposes. The Fund has agreed to pay commitment fees on its pro rata portion of the line of credit, which amounted to $2,273 and is reflected in Miscellaneous Expense on the Statement of Operations. During the period, there were no borrowings on this line of credit.
8. Security Lending.
The Fund lends portfolio securities from time to time in order to earn additional income. On the settlement date of the loan, the Fund receives collateral (in the form of U.S. Treasury obligations, letters of credit and/or cash) against the loaned securities and maintains collateral in an amount not less than 100% of the market value of the loaned securities during the period of the loan. The market value of the loaned securities is determined at the close of business of the Fund and any additional required collateral is
Annual Report
8. Security Lending - continued
delivered to the Fund on the next business day. If the borrower defaults on its obligation to return the securities loaned because of insolvency or other reasons, a fund could experience delays and costs in recovering the securities loaned or in gaining access to the collateral. Any cash collateral received is invested in the Fidelity Securities Lending Cash Central Fund. The value of loaned securities and cash collateral at period end are disclosed on the Fund's Statement of Assets and Liabilities. Security lending income represents the income earned on investing cash collateral, less fees and expenses associated with the loan, plus any premium payments that may be received on the loan of certain types of securities. Security lending income is presented in the Statement of Operations as a component of income from Fidelity Central Funds Net income from lending portfolio securities during the period amounted to $574,407.
9. Expense Reductions.
FMR voluntarily agreed to reimburse each class to the extent annual operating expenses exceeded certain levels of average net assets as noted in the table below. Some expenses, for example interest expense, including commitment fees, are excluded from this reimbursement.
The following classes were in reimbursement during the period:
| Expense
Limitations | Reimbursement
from adviser |
| | |
Class A | 1.40% | $ 25,098 |
Class T | 1.65% | 3,109 |
Class B | 2.15% | 6,125 |
Class C | 2.15% | 15,677 |
| | $ 50,009 |
Many of the brokers with whom FMR places trades on behalf of the Fund provided services to the Fund in addition to trade execution. These services included payments of certain expenses on behalf of the Fund totaling $15,697 for the period. In addition, through arrangements with the Fund's custodian and each class' transfer agent, credits realized as a result of uninvested cash balances were used to reduce the Fund's expenses.
Annual Report
Notes to Financial Statements - continued
9. Expense Reductions - continued
During the period, these credits reduced the Fund's custody expenses by $799. During the period, credits reduced each class' transfer agent expense as noted in the table below.
| Transfer Agent
expense reduction | |
Class A | $ 472 | |
Small Cap Value | 55,667 | |
Institutional Class | 27 | |
| $ 56,166 | |
10. Other.
The Fund's organizational documents provide former and current trustees and officers with a limited indemnification against liabilities arising in connection with the performance of their duties to the Fund. In the normal course of business, the Fund may also enter into contracts that provide general indemnifications. The Fund's maximum exposure under these arrangements is unknown as this would be dependent on future claims that may be made against the Fund. The risk of material loss from such claims is considered remote.
In September 2006, FIIOC, a transfer agent of the Fund, notified the Fund that the Fund's books and records did not reflect a conversion of certain Class B to Class A shares upon their conversion date. In March 2007, FIIOC converted the relevant Class B shares to Class A shares and recorded the conversion in the books and records of the Fund which did not result in a material impact to the Fund's reported net assets or results of operations in the accompanying financial statements. FIIOC has reimbursed the Fund for related audit and legal expenses and, beginning in June 2007, remediated affected shareholders.
11. Distributions to Shareholders.
Distributions to shareholders of each class were as follows:
Years ended July 31, | 2007 | 2006 |
From net investment income | | |
Small Cap Value | - | 627,853 |
Institutional Class | - | 5,184 |
Total | $ - | $ 633,037 |
Annual Report
11. Distributions to Shareholders - continued
Distributions to shareholders of each class were as follows - continued
Years ended July 31, | 2007 | 2006 |
From net realized gain | | |
Class A | $ 2,137,128 | $ 349,740 |
Class T | 2,317,701 | 411,098 |
Class B | 493,632 | 108,502 |
Class C | 1,276,323 | 314,711 |
Small Cap Value | 48,691,674 | 19,037,825 |
Institutional Class | 502,809 | 149,819 |
Total | $ 55,419,267 | $ 20,371,695 |
12. Share Transactions.
Transactions for each class of shares were as follows:
| Shares | Dollars |
Years ended July 31, | 2007 | 2006 | 2007 | 2006 |
Class A | | | | |
Shares sold | 2,083,427 | 2,792,696 | $ 29,477,855 | $ 37,292,766 |
Reinvestment of distributions | 153,067 | 23,154 | 1,967,811 | 292,886 |
Shares redeemed | (990,255) | (517,416) | (13,986,913) | (6,894,256) |
Net increase (decrease) | 1,246,239 | 2,298,434 | $ 17,458,753 | $ 30,691,396 |
Class T | | | | |
Shares sold | 1,416,878 | 2,906,186 | $ 19,764,686 | $ 38,920,414 |
Reinvestment of distributions | 158,416 | 20,934 | 2,031,495 | 264,080 |
Shares redeemed | (1,429,554) | (461,271) | (20,059,646) | (6,059,837) |
Net increase (decrease) | 145,740 | 2,465,849 | $ 1,736,535 | $ 33,124,657 |
Class B | | | | |
Shares sold | 297,938 | 646,292 | $ 4,153,087 | $ 8,494,362 |
Reinvestment of distributions | 34,686 | 7,808 | 444,445 | 98,271 |
Shares redeemed | (263,033) | (181,273) | (3,714,165) | (2,424,583) |
Net increase (decrease) | 69,591 | 472,827 | $ 883,367 | $ 6,168,050 |
Class C | | | | |
Shares sold | 834,910 | 1,647,798 | $ 11,698,988 | $ 21,781,876 |
Reinvestment of distributions | 84,926 | 23,044 | 1,089,287 | 289,929 |
Shares redeemed | (562,438) | (542,172) | (7,834,552) | (7,009,701) |
Net increase (decrease) | 357,398 | 1,128,670 | $ 4,953,723 | $ 15,062,104 |
Annual Report
Notes to Financial Statements - continued
12. Share Transactions - continued
Transactions for each class of shares were as follows - continued
| Shares | Dollars |
Years ended July 31, | 2007 | 2006 | 2007 | 2006 |
Small Cap Value | | | | |
Shares sold | 42,235,359 | 53,704,430 | $ 595,504,607 | $ 714,692,056 |
Reinvestment of distributions | 3,617,365 | 1,502,190 | 46,609,140 | 19,027,647 |
Shares redeemed | (32,779,622) | (28,179,009) | (461,808,869) | (367,110,557) |
Net increase (decrease) | 13,073,102 | 27,027,611 | $ 180,304,878 | $ 366,609,146 |
Institutional Class | | | | |
Shares sold | 309,983 | 585,637 | $ 4,413,286 | $ 7,784,992 |
Reinvestment of distributions | 23,286 | 4,421 | 300,279 | 56,037 |
Shares redeemed | (242,217) | (170,544) | (3,533,035) | (2,319,440) |
Net increase (decrease) | 91,052 | 419,514 | $ 1,180,530 | $ 5,521,589 |
Annual Report
Report of Independent Registered Public Accounting Firm
To the Trustees of Fidelity Securities Fund and the Shareholders of Fidelity Small Cap Value Fund:
In our opinion, the accompanying statement of assets and liabilities, including the schedule of investments, and the related statements of operations and of changes in net assets and the financial highlights present fairly, in all material respects, the financial position of Fidelity Small Cap Value Fund (a fund of Fidelity Securities Fund) at July 31, 2007, the results of its operations for the year then ended, the changes in its net assets for each of the two years in the period then ended and the financial highlights for each of the periods indicated, in conformity with accounting principles generally accepted in the United States of America. These financial statements and financial highlights (hereafter referred to as "financial statements") are the responsibility of the Fidelity Small Cap Value Fund's management. Our responsibility is to express an opinion on these financial statements based on our audits. We conducted our audits of these financial statements in accordance with the standards of the Public Company Accounting Oversight Board (United States). Those standards require that we plan and perform the audit to obtain reasonable assurance about whether the financial statements are free of material misstatement. An audit includes examining, on a test basis, evidence supporting the amounts and disclosures in the financial statements, assessing the accounting principles used and significant estimates made by management, and evaluating the overall financial statement presentation. We believe that our audits, which included confirmation of securities at July 31, 2007 by correspondence with the custodian and brokers, provide a reasonable basis for our opinion.
/s/ PricewaterhouseCoopers LLP
PricewaterhouseCoopers LLP
Boston, Massachusetts
September 18, 2007
Annual Report
Trustees and Officers
The Trustees, Members of the Advisory Board, and executive officers of the trust and fund, as applicable, are listed below. The Board of Trustees governs the fund and is responsible for protecting the interests of shareholders. The Trustees are experienced executives who meet periodically throughout the year to oversee the fund's activities, review contractual arrangements with companies that provide services to the fund, and review the fund's performance. Except for James C. Curvey, each of the Trustees oversees 353 funds advised by FMR or an affiliate. Mr. Curvey oversees 317 funds advised by FMR or an affiliate.
The Trustees hold office without limit in time except that (a) any Trustee may resign; (b) any Trustee may be removed by written instrument, signed by at least two-thirds of the number of Trustees prior to such removal; (c) any Trustee who requests to be retired or who has become incapacitated by illness or injury may be retired by written instrument signed by a majority of the other Trustees; and (d) any Trustee may be removed at any special meeting of shareholders by a two-thirds vote of the outstanding voting securities of the trust. Each Trustee who is not an interested person (as defined in the 1940 Act) (Independent Trustee), shall retire not later than the last day of the calendar year in which his or her 72nd birthday occurs. The Independent Trustees may waive this mandatory retirement age policy with respect to individual Trustees. The executive officers and Advisory Board Members hold office without limit in time, except that any officer and Advisory Board Member may resign or may be removed by a vote of a majority of the Trustees at any regular meeting or any special meeting of the Trustees. Except as indicated, each individual has held the office shown or other offices in the same company for the past five years.
The fund's Statement of Additional Information (SAI) includes more information about the Trustees. To request a free copy, call Fidelity at 1-800-544-8544.
Interested Trustees*:
Correspondence intended for each Trustee who is an interested person may be sent to Fidelity Investments, 82 Devonshire Street, Boston, Massachusetts 02109.
Name, Age; Principal Occupation |
Edward C. Johnson 3d (77) |
| Year of Election or Appointment: 1984 Mr. Johnson is Chairman of the Board of Trustees. Mr. Johnson serves as President (2006-present), Chief Executive Officer, Chairman, and a Director of FMR Corp.; Chairman and a Director of FMR; Chairman and a Director of Fidelity Research & Analysis Company (FRAC); Chairman and a Director of Fidelity Investments Money Management, Inc.; and Chairman (2001-present) and a Director of FMR Co., Inc. In addition, Mr. Johnson serves as Chairman and Director of Fidelity International Limited (FIL). |
James C. Curvey (72) |
| Year of Election or Appointment: 2007 Mr. Curvey also serves as Trustee (2007-present) or Member of the Advisory Board (2007-present) of other investment companies advised by FMR. Mr. Curvey is Vice Chairman (2006-present) and Director of FMR Corp. Mr. Curvey joined Fidelity in 1982 and served in numerous senior management positions, including President and Chief Operating Officer of FMR Corp. (1997-2000) and President of Fidelity Strategic Investments (2000-2002). In addition, he serves as a member of the Board of Directors of Geerlings & Wade, Inc. (wine distribution). |
* Trustees have been determined to be "Interested Trustees" by virtue of, among other things, their affiliation with the trust or various entities under common control with FMR.
Independent Trustees:
Correspondence intended for each Independent Trustee (that is, the Trustees other than the Interested Trustees) may be sent to Fidelity Investments, P.O. Box 55235, Boston, Massachusetts 02205-5235.
Name, Age; Principal Occupation |
Dennis J. Dirks (59) |
| Year of Election or Appointment: 2005 Prior to his retirement in May 2003, Mr. Dirks was Chief Operating Officer and a member of the Board of The Depository Trust & Clearing Corporation (DTCC) (1999-2003). He also served as President, Chief Operating Officer, and Board member of The Depository Trust Company (DTC) (1999-2003) and President and Board member of the National Securities Clearing Corporation (NSCC) (1999-2003). In addition, Mr. Dirks served as Chief Executive Officer and Board member of the Government Securities Clearing Corporation (2001-2003) and Chief Executive Officer and Board member of the Mortgage-Backed Securities Clearing Corporation (2001-2003). Mr. Dirks also serves as a Trustee and a member of the Finance Committee of Manhattan College (2005-present) and a Trustee and a member of the Finance Committee of AHRC of Nassau County (2006-present). |
Albert R. Gamper, Jr. (65) |
| Year of Election or Appointment: 2006 Prior to his retirement in December 2004, Mr. Gamper served as Chairman of the Board of CIT Group Inc. (commercial finance). During his tenure with CIT Group Inc. Mr. Gamper served in numerous senior management positions, including Chairman (1987-1989; 1999-2001; 2002-2004), Chief Executive Officer (1987-2004), and President (1989-2002). He currently serves as a member of the Board of Directors of Public Service Enterprise Group (utilities, 2001-present), Chairman of the Board of Governors, Rutgers University (2004-present), and Chairman of the Board of Saint Barnabas Health Care System. |
George H. Heilmeier (71) |
| Year of Election or Appointment: 2004 Dr. Heilmeier is Chairman Emeritus of Telcordia Technologies (communication software and systems), where prior to his retirement, he served as company Chairman and Chief Executive Officer. He currently serves on the Boards of Directors of The Mitre Corporation (systems engineering and information technology support for the government), and HRL Laboratories (private research and development, 2004-present). He is Chairman of the General Motors Science & Technology Advisory Board and a Life Fellow of the Institute of Electrical and Electronics Engineers (IEEE). Dr. Heilmeier is a member of the Defense Science Board and the National Security Agency Advisory Board. He is also a member of the National Academy of Engineering, the American Academy of Arts and Sciences, and the Board of Overseers of the School of Engineering and Applied Science of the University of Pennsylvania. Previously, Dr. Heilmeier served as a Director of TRW Inc. (automotive, space, defense, and information technology, 1992-2002), Compaq (1994-2002), Automatic Data Processing, Inc. (ADP) (technology-based business outsourcing, 1995-2002), INET Technologies Inc. (telecommunications network surveillance, 2001-2004), and Teletech Holdings (customer management services). He is the recipient of the 2005 Kyoto Prize in Advanced Technology for his invention of the liquid crystal display, and a member of the Consumer Electronics Hall of Fame. |
James H. Keyes (66) |
| Year of Election or Appointment: 2007 Prior to his retirement in 2003, Mr. Keyes was Chairman, President, and Chief Executive Officer of Johnson Controls, Inc. (automotive supplier, 1993-2003). He currently serves as a member of the boards of LSI Logic Corporation (semiconductor technologies), Navistar International Corporation (manufacture and sale of trucks, buses, and diesel engines, 2002-present), and Pitney Bowes, Inc. (integrated mail, messaging, and document management solutions). |
Marie L. Knowles (60) |
| Year of Election or Appointment: 2001 Prior to Ms. Knowles' retirement in June 2000, she served as Executive Vice President and Chief Financial Officer of Atlantic Richfield Company (ARCO) (diversified energy, 1996-2000). From 1993 to 1996, she was a Senior Vice President of ARCO and President of ARCO Transportation Company. She served as a Director of ARCO from 1996 to 1998. She currently serves as a Director of Phelps Dodge Corporation (copper mining and manufacturing) and McKesson Corporation (healthcare service, 2002-present). Ms. Knowles is a Trustee of the Brookings Institution and the Catalina Island Conservancy and also serves as a member of the Advisory Board for the School of Engineering of the University of Southern California. |
Ned C. Lautenbach (63) |
| Year of Election or Appointment: 2000 Mr. Lautenbach is Chairman of the Independent Trustees (2006-present). Mr. Lautenbach has been a partner of Clayton, Dubilier & Rice, Inc. (private equity investment firm) since September 1998. Previously, Mr. Lautenbach was with the International Business Machines Corporation (IBM) from 1968 until his retirement in 1998. Mr. Lautenbach serves as a Director of Sony Corporation (2006-present) and Eaton Corporation (diversified industrial) as well as the Philharmonic Center for the Arts in Naples, Florida. He also is a member of the Board of Trustees of Fairfield University (2005-present), as well as a member of the Council on Foreign Relations. |
Cornelia M. Small (63) |
| Year of Election or Appointment: 2005 Ms. Small is a member (2000-present) and Chairperson (2002-present) of the Investment Committee, and a member (2002-present) of the Board of Trustees of Smith College. Previously, she served as Chief Investment Officer (1999-2000), Director of Global Equity Investments (1996-1999), and a member of the Board of Directors of Scudder, Stevens & Clark (1990-1997) and Scudder Kemper Investments (1997-1999). In addition, Ms. Small served as Co-Chair (2000-2003) of the Annual Fund for the Fletcher School of Law and Diplomacy. |
William S. Stavropoulos (68) |
| Year of Election or Appointment: 2002 Mr. Stavropoulos is Chairman Emeritus of the Board of Directors of The Dow Chemical Company. Since joining The Dow Chemical Company in 1967, Mr. Stavropoulos served in numerous senior management positions, including President (1993-2000; 2002-2003), CEO (1995-2000; 2002-2004), and Chairman of the Executive Committee (2000-2004). Currently, he is a Director of NCR Corporation (data warehousing and technology solutions), Chemical Financial Corporation, Maersk Inc. (industrial conglomerate, 2002-present), Tyco International, Inc. (multinational manufacturing and services, 2007-present), and a member of the Advisory Board for Metalmark Capital (private equity investment firm, 2005-present). He is a special advisor to Clayton, Dubilier & Rice, Inc., a private equity investment firm. He also serves as a member of the Board of Trustees of the American Enterprise Institute for Public Policy Research. In addition, Mr. Stavropoulos is a member of The Business Council, J.P. Morgan International Council and the University of Notre Dame Advisory Council for the College of Science. |
Kenneth L. Wolfe (68) |
| Year of Election or Appointment: 2005 Prior to his retirement in 2001, Mr. Wolfe was Chairman and Chief Executive Officer of Hershey Foods Corporation (1993-2001). He currently serves as a member of the boards of Adelphia Communications Corporation (2003-present), Bausch & Lomb, Inc., and Revlon Inc. (2004-present). |
Advisory Board Members and Executive Officers:
Correspondence intended for Mr. Mauriello may be sent to Fidelity Investments, P.O. Box 55235, Boston, Massachusetts 02205-5235. Correspondence intended for each executive officer and Mr. Lynch may be sent to Fidelity Investments, 82 Devonshire Street, Boston, Massachusetts 02109.
Name, Age; Principal Occupation |
Peter S. Lynch (63) |
| Year of Election or Appointment: 2003 Member of the Advisory Board of Fidelity Securities Fund. Mr. Lynch is Vice Chairman and a Director of FMR, and Vice Chairman (2001-present) and a Director of FMR Co., Inc. Previously, Mr. Lynch served as a Trustee of the Fidelity funds (1990-2003). In addition, he serves as a Trustee of Boston College and as the Chairman of the Inner-City Scholarship Fund. |
Joseph Mauriello (62) |
| Year of Election or Appointment: 2007 Member of the Advisory Board of Fidelity Securities Fund. Prior to his retirement in January 2006, Mr. Mauriello served in numerous senior management positions including Deputy Chairman and Chief Operating Officer (2004-2005), and Vice Chairman of Financial Services (2002-2004) of KPMG LLP US (professional services firm, 1965-2005). Mr. Mauriello currently serves as a member of the Board of Directors of XL Capital Ltd., (global insurance and re-insurance company, 2006-present) and of Arcadia Resources Inc., (health care services and products, 2007-present). He also served as a Director of the Hamilton Funds of the Bank of New York (2006-2007). |
Kimberley H. Monasterio (43) |
| Year of Election or Appointment: 2007 President and Treasurer of Small Cap Value. Ms. Monasterio also serves as President and Treasurer of other Fidelity funds (2007-present) and is an employee of FMR (2004-present). Previously, Ms. Monasterio served as Deputy Treasurer of the Fidelity funds (2004-2006). Before joining Fidelity Investments, Ms. Monasterio served as Treasurer (2000-2004) and Chief Financial Officer (2002-2004) of the Franklin Templeton Funds and Senior Vice President of Franklin Templeton Services, LLC (2000-2004). |
Dwight D. Churchill (53) |
| Year of Election or Appointment: 2005 Vice President of Small Cap Value. Mr. Churchill also serves as Vice President of certain Equity Funds (2005-present). Mr. Churchill is Executive Vice President of FMR (2005-present) and FMR Co., Inc. (2005-present). Previously, Mr. Churchill served as Senior Vice President of Fidelity Investments Money Management, Inc. (2005-2006), Head of Fidelity's Fixed-Income Division (2000-2005), Vice President of Fidelity's Money Market Funds (2000-2005), Vice President of Fidelity's Bond Funds, and Senior Vice President of FMR. |
Bruce T. Herring (41) |
| Year of Election or Appointment: 2006 Vice President of Small Cap Value. Mr. Herring also serves as Vice President of certain Equity Funds (2006-present). Mr. Herring is Senior Vice President of FMR (2006-present) and Vice President of FMR Co., Inc. (2001-present). Previously, Mr. Herring served as a portfolio manager for Fidelity U.S. Equity Funds (2001-2005). |
Thomas Hense (43) |
| Year of Election or Appointment: 2006
Vice President of Small Cap Value. Prior to assuming his current responsibilities, Mr. Hense worked as a research analyst, co-director of equity research, and a portfolio manager. |
Eric D. Roiter (58) |
| Year of Election or Appointment: 2004 Secretary of Small Cap Value. He also serves as Secretary of other Fidelity funds; Vice President, General Counsel, and Secretary of FMR Co., Inc. (2001-present) and FMR; Assistant Secretary of Fidelity Management & Research (U.K.) Inc. (2001-present), Fidelity Research & Analysis Company (2001-present), and Fidelity Investments Money Management, Inc. (2001-present). Mr. Roiter is an Adjunct Member, Faculty of Law, at Boston College Law School (2003-present). Previously, Mr. Roiter served as Vice President and Secretary of Fidelity Distributors Corporation (FDC) (1998-2005). |
Scott C. Goebel (39) |
| Year of Election or Appointment: 2007 Assistant Secretary of Small Cap Value. Mr. Goebel also serves as Assistant Secretary of other Fidelity funds (2007-present), Vice President and Secretary of FDC (2006-present), and is an employee of FMR. |
R. Stephen Ganis (41) |
| Year of Election or Appointment: 2006 Anti-Money Laundering (AML) officer of Small Cap Value. Mr. Ganis also serves as AML officer of other Fidelity funds (2006-present) and FMR Corp. (2003-present). Before joining Fidelity Investments, Mr. Ganis practiced law at Goodwin Procter, LLP (2000-2002). |
Joseph B. Hollis (59) |
| Year of Election or Appointment: 2006 Chief Financial Officer of Small Cap Value. Mr. Hollis also serves as Chief Financial Officer of other Fidelity funds. Mr. Hollis is President of Fidelity Pricing and Cash Management Services (FPCMS) (2005-present). Mr. Hollis also serves as President and Director of Fidelity Service Company, Inc. (2006-present). Previously, Mr. Hollis served as Senior Vice President of Cash Management Services (1999-2002) and Investment Management Operations (2002-2005). |
Kenneth A. Rathgeber (60) |
| Year of Election or Appointment: 2004 Chief Compliance Officer of Small Cap Value. Mr. Rathgeber also serves as Chief Compliance Officer of other Fidelity funds (2004-present) and Executive Vice President of Risk Oversight for Fidelity Investments (2002-present). He is Chief Compliance Officer of FMR (2005-present), FMR Co., Inc. (2005-present), Fidelity Management & Research (U.K.) Inc. (2005-present), Fidelity Research & Analysis Company (2005-present), Fidelity Investments Money Management, Inc. (2005-present), and Strategic Advisers, Inc. (2005-present). Previously, Mr. Rathgeber served as Executive Vice President and Chief Operating Officer for Fidelity Investments Institutional Services Company, Inc. (1998-2002). |
Bryan A. Mehrmann (46) |
| Year of Election or Appointment: 2005 Deputy Treasurer of Small Cap Value. Mr. Mehrmann also serves as Deputy Treasurer of other Fidelity funds (2005-present) and is an employee of FMR. Previously, Mr. Mehrmann served as Vice President of Fidelity Investments Institutional Services Group (FIIS)/Fidelity Investments Institutional Operations Corporation, Inc. (FIIOC) Client Services (1998-2004). |
Kenneth B. Robins (37) |
| Year of Election or Appointment: 2005 Deputy Treasurer of Small Cap Value. Mr. Robins also serves as Deputy Treasurer of other Fidelity funds (2005-present) and is an employee of FMR (2004-present). Before joining Fidelity Investments, Mr. Robins worked at KPMG LLP, where he was a partner in KPMG's department of professional practice (2002-2004) and a Senior Manager (1999-2000). In addition, Mr. Robins served as Assistant Chief Accountant, United States Securities and Exchange Commission (2000-2002). |
Robert G. Byrnes (40) |
| Year of Election or Appointment: 2005 Assistant Treasurer of Small Cap Value. Mr. Byrnes also serves as Assistant Treasurer of other Fidelity funds (2005-present) and is an employee of FMR (2005-present). Previously, Mr. Byrnes served as Vice President of FPCMS (2003-2005). Before joining Fidelity Investments, Mr. Byrnes worked at Deutsche Asset Management where he served as Vice President of the Investment Operations Group (2000-2003). |
Peter L. Lydecker (53) |
| Year of Election or Appointment: 2004 Assistant Treasurer of Small Cap Value. Mr. Lydecker also serves as Assistant Treasurer of other Fidelity funds (2004) and is an employee of FMR. |
Gary W. Ryan (48) |
| Year of Election or Appointment: 2005 Assistant Treasurer of Small Cap Value. Mr. Ryan also serves as Assistant Treasurer of other Fidelity funds (2005-present) and is an employee of FMR (2005-present). Previously, Mr. Ryan served as Vice President of Fund Reporting in FPCMS (1999-2005). |
Annual Report
Distributions
The Board of Trustees of Advisor Small Cap Value Fund voted to pay on September 10, 2007, to shareholders of record at the opening of business on September 7, 2007, a distribution of $0.399 per share derived from capital gains realized from sales of portfolio securities.
The fund hereby designates as a capital gain dividend with respect to the taxable year ended July 31, 2007 $47,404,920, or, if subsequently determined to be different, the net capital gain of such year.
The fund designates 23% of the dividends distributed during the fiscal year as qualifying for the dividends-received deduction for corporate shareholders.
The fund designates 26% of the dividend distributed during the fiscal year as amounts which may be taken into account as a dividend for the purposes of the maximum rate under section 1(h)(11) of the Internal Revenue Code.
The fund will notify shareholders in January 2008 of amounts for use in preparing 2007 income tax returns.
Annual Report
Board Approval of Investment Advisory Contracts and Management Fees
Fidelity Small Cap Value Fund
Each year, typically in July, the Board of Trustees, including the Independent Trustees (together, the Board), votes on the renewal of the management contract and sub-advisory agreements (together, the Advisory Contracts) for the fund. The Board, assisted by the advice of fund counsel and Independent Trustees' counsel, requests and considers a broad range of information throughout the year.
The Board meets regularly each month except August and takes into account throughout the year matters bearing on Advisory Contracts. The Board, acting directly and through its separate committees, considers at each of its meetings factors that are relevant to the annual renewal of the fund's Advisory Contracts, including the services and support provided to the fund and its shareholders. At the time of the renewal, the Board had 12 standing committees, each composed of Independent Trustees with varying backgrounds, to which the Board has assigned specific subject matter responsibilities in order to enhance effective decision-making by the Board. Each committee has adopted a written charter outlining the structure and purposes of the committee. One such committee, the Equity Contract Committee, meets periodically as needed throughout the year to consider matters specifically related to the annual renewal of Advisory Contracts. The committee requests and receives information on, and makes recommendations to the Independent Trustees concerning, the approval and annual review of the Advisory Contracts.
At its July 2007 meeting, the Board of Trustees, including the Independent Trustees, unanimously determined to renew the Advisory Contracts for the fund. In reaching its determination, the Board considered all factors it believed relevant, including (i) the nature, extent, and quality of the services to be provided to the fund and its shareholders (including the investment performance of the fund); (ii) the competitiveness of the management fee and total expenses of the fund; (iii) the total costs of the services to be provided by and the profits to be realized by the investment adviser and its affiliates from the relationship with the fund; (iv) the extent to which economies of scale would be realized as the fund grows; and (v) whether fee levels reflect these economies of scale, if any, for the benefit of fund shareholders. The Board also approved amendments to the fund's agreements with foreign sub-advisers to clarify that each sub-adviser provides services as an independent contractor.
In determining whether to renew the Advisory Contracts for the fund, the Board ultimately reached a determination, with the assistance of fund counsel and Independent Trustees' counsel, that the renewal of the Advisory Contracts and the compensation to be received by Fidelity under the management contract is consistent with Fidelity's fiduciary duty under applicable law. In addition to evaluating the specific factors noted above, the Board, in reaching its determination, is aware that shareholders in the fund have a broad range of investment choices available to them, including a wide choice among mutual funds offered by competitors to Fidelity, and that the fund's shareholders, with the opportunity to review and weigh the disclosure provided by the fund in its prospectus and other public disclosures, have chosen to invest in this fund, managed by Fidelity.
Annual Report
Nature, Extent, and Quality of Services Provided. The Board considered staffing within the investment adviser, FMR, and the sub-advisers (together, the Investment Advisers), including the background of the fund's portfolio manager and the fund's investment objective and discipline. The Independent Trustees also had discussions with senior management of Fidelity's investment operations and investment groups. The Board considered the structure of the portfolio manager compensation program and whether this structure provides appropriate incentives.
Resources Dedicated to Investment Management and Support Services. The Board reviewed the size, education, and experience of the Investment Advisers' investment staff, their use of technology, and the Investment Advisers' approach to recruiting, training, and retaining portfolio managers and other research, advisory, and management personnel. The Board considered Fidelity's extensive global research capabilities that enable the Investment Advisers to aggregate data from various sources in an effort to produce positive investment results. The Board noted that Fidelity's analysts have access to a variety of technological tools that enable them to perform both fundamental and quantitative analysis and to specialize in various disciplines. The Board also considered that Fidelity's portfolio managers and analysts have access to daily portfolio attribution that allows for monitoring of a fund's portfolio, as well as an electronic communication system that provides immediate real-time access to research concerning issuers and credit enhancers.
Shareholder and Administrative Services. The Board considered (i) the nature, extent, quality, and cost of advisory, administrative, distribution, and shareholder services performed by the Investment Advisers and their affiliates under the Advisory Contracts and under separate agreements covering transfer agency, pricing and bookkeeping, and securities lending services for the fund; (ii) the nature and extent of the Investment Advisers' supervision of third party service providers, principally custodians and subcustodians; and (iii) the resources devoted to, and the record of compliance with, the fund's compliance policies and procedures. The Board reviewed the allocation of fund brokerage, including allocations to brokers affiliated with the Investment Advisers, the use of brokerage commissions to pay fund expenses, and the use of "soft" commission dollars to pay for research services. The Board also considered that Fidelity voluntarily pays for market data out of its own resources.
The Board noted that the growth of fund assets across the complex allows Fidelity to reinvest in the development of services designed to enhance the value or convenience of the Fidelity funds as investment vehicles. These services include 24-hour access to account information and market information through phone representatives and over the Internet, and investor education materials and asset allocation tools.
Annual Report
Board Approval of Investment Advisory Contracts and
Management Fees - continued
Investment in a Large Fund Family. The Board considered the benefits to shareholders of investing in a Fidelity fund, including the benefits of investing in a fund that is part of a large family of funds offering a variety of investment disciplines and providing for a large variety of mutual fund investor services. For example, fund shareholders are offered the privilege of exchanging shares of the fund for shares of other Fidelity funds, as set forth in the fund's prospectus, without paying a sales charge. The Board noted that, since the last Advisory Contract renewals in July 2006, Fidelity has taken a number of actions that benefited particular funds, including (i) dedicating additional resources to investment research and to restructure the investment research teams; (ii) contractually agreeing to reduce the management fee on Fidelity Advisor Floating Rate High Income Fund; (iii) contractually agreeing to reduce the management fees on Fidelity's California, Massachusetts, New Jersey, and New York AMT Tax-Free Money Market Funds, launching new Institutional Classes and Service Classes of these funds, and contractually agreeing to impose expense limitations on these funds; (iv) eliminating the exchange fee on the Fidelity Select Portfolios and reducing the pricing and bookkeeping fee rates for these funds; (v) reducing the maximum transfer agency fee rates on high income funds and certain equity funds; (vi) proposing amended management contracts that, if approved by shareholders, will add a performance adjustment component to the management fees paid by 18 Fidelity Advisor equity funds; (vii) contractually agreeing to reduce fees for Ultra-Short Central Fund and the money market Central Funds; (viii) waiving the Fidelity Advisor funds' contingent deferred sales charge on certain redemptions made through systematic withdrawal programs; and (ix) amending the management contracts for equity and fixed-income funds whose management contracts incorporate a "group fee" structure by adding four new fee "breakpoints" to the group fee rate schedules.
Investment Performance and Compliance. The Board considered whether the fund has operated within its investment objective, as well as its record of compliance with its investment restrictions. It also reviewed the fund's absolute investment performance for each class, as well as the fund's relative investment performance for each class measured against (i) a broad-based securities market index, and (ii) a peer group of mutual funds deemed appropriate by the Board. Because the fund had been in existence less than three calendar years, the following chart considered by the Board shows, for the one-year period ended December 31, 2006, the total returns of Institutional Class (Class I) and Class C of the fund, the total return of a broad-based securities market index ("benchmark"), and a range of total returns of a peer group of mutual funds identified by Morningstar, Inc. as having an investment style similar to that of the fund based on underlying portfolio holdings. The returns of Institutional Class (Class I) and Class C show the performance of the highest and lowest performing classes, respectively. The box within the chart shows the 25th percentile return (bottom of box) and the 75th percentile return (top of box) of the peer group. Returns shown above the box are in the first quartile and returns shown below the box are in the fourth quartile. The percentage beaten numbers noted below the chart correspond to the percentile box and represent the percentage of funds in the peer group whose performance was equal to or lower than that of the class indicated.
Annual Report
Fidelity Small Cap Value Fund
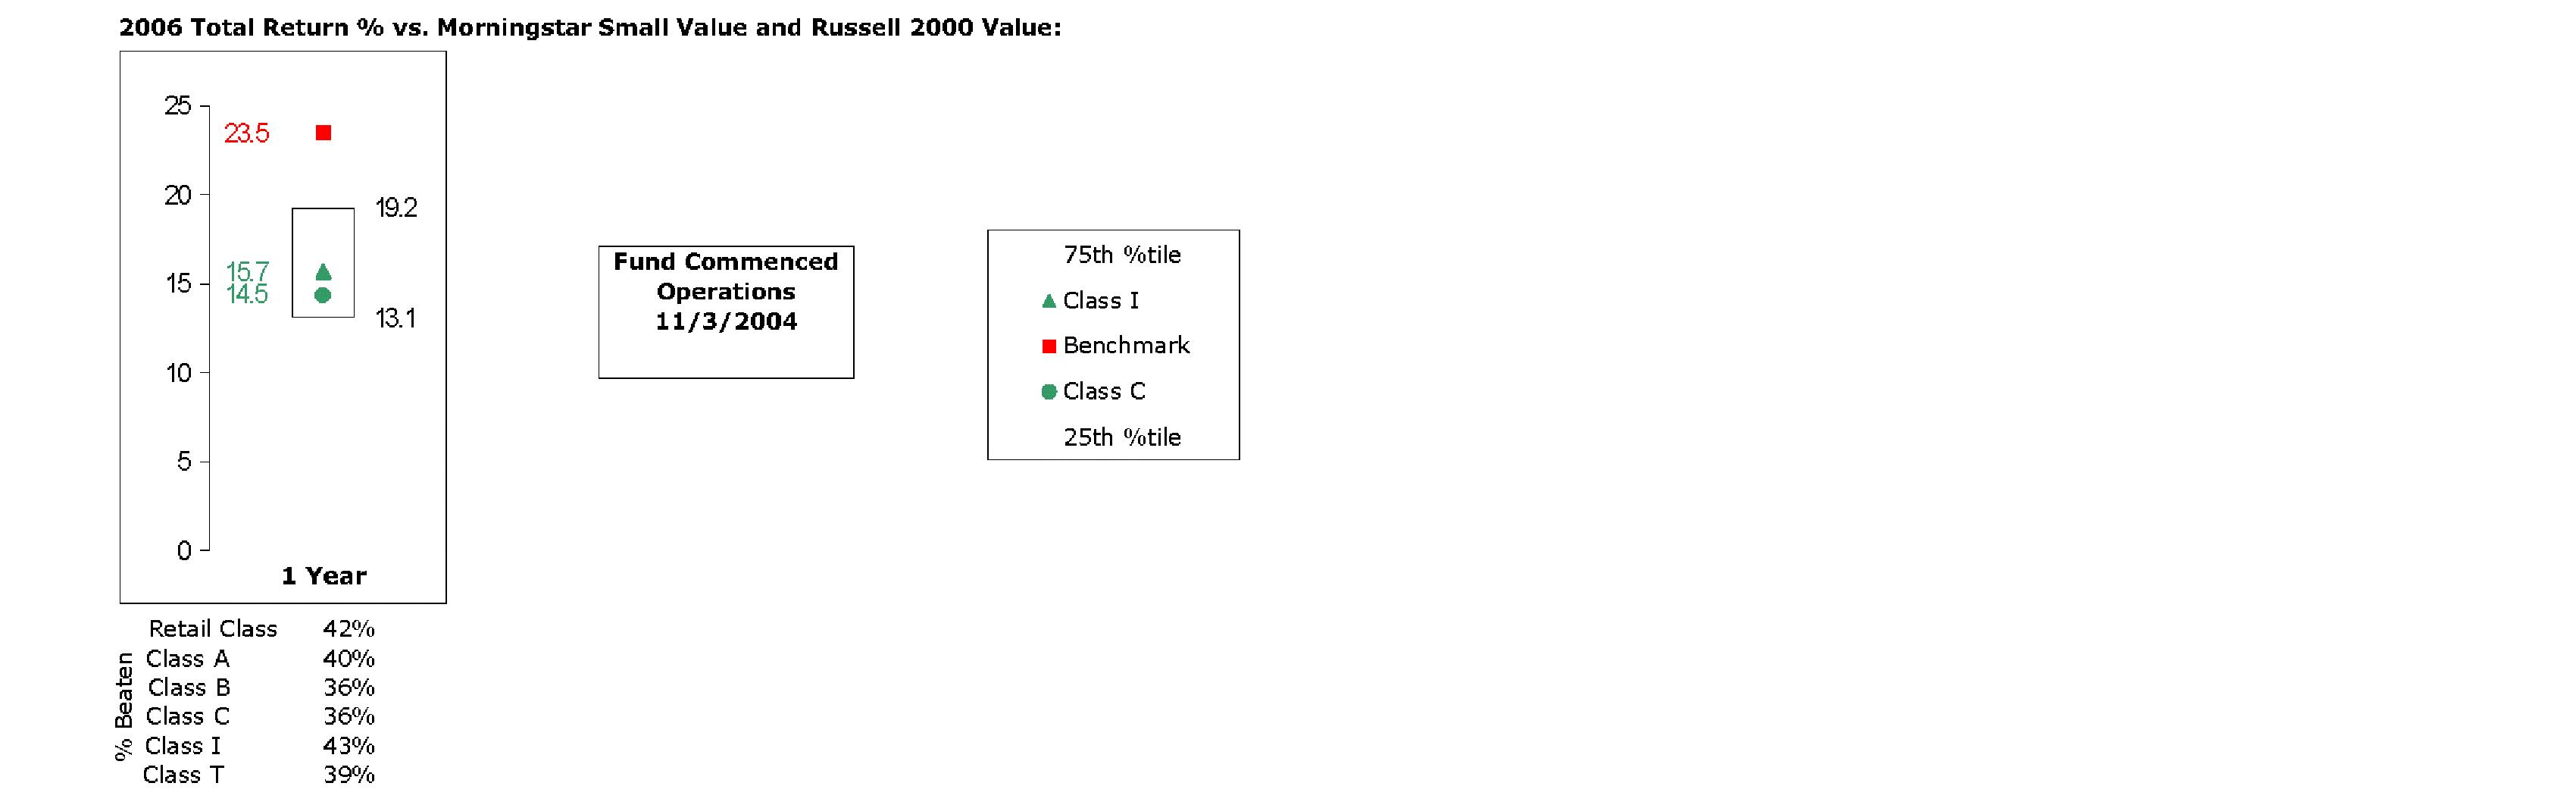
The Board reviewed the fund's relative investment performance against its peer group and stated that the performance of Institutional Class (Class I) of the fund was in the third quartile for the period shown. The Board also stated that the investment performance of the fund was lower than its benchmark for the period shown. The Board considered that the variations in performance among the fund's classes reflect the variations in class expenses, which result in lower performance for higher expense classes. The Board stated that it is difficult to evaluate in any comprehensive fashion the performance of the fund, in light of its relatively recent commencement of operations.
The Board also considered that the fund's management fee is subject to upward or downward adjustment depending upon whether, and to what extent, the fund's investment performance for the performance period exceeds, or is exceeded by, the record (over the same period) of a Board-approved performance adjustment index. The Board realizes that the performance adjustment provides FMR with a strong economic incentive to seek to achieve superior performance for the fund's shareholders and helps to more closely align the interests of FMR and the fund's shareholders.
The Board considered that FMR has taken steps to refocus and strengthen equity research, equity portfolio management, and compliance.
Annual Report
Board Approval of Investment Advisory Contracts and
Management Fees - continued
Based on its review, and giving particular weight to the nature and quality of the resources dedicated by the Investment Advisers to maintain and improve relative performance, the Board concluded that the nature, extent, and quality of the services provided to the fund will benefit the fund's shareholders, particularly in light of the Board's view that the fund's shareholders benefit from investing in a fund that is part of a large family of funds offering a variety of investment disciplines and services.
Competitiveness of Management Fee and Total Fund Expenses. The Board considered the fund's management fee and total expenses compared to "mapped groups" of competitive funds and classes. Fidelity creates "mapped groups" by combining similar Lipper investment objective categories that have comparable management fee characteristics. Combining Lipper investment objective categories aids the Board's management fee and total expense comparisons by broadening the competitive group used for comparison and by reducing the number of universes to which various Fidelity funds are compared. The Board also considered supplemental information about how the fund's management fee and total expenses ranked relative to groups based on Lipper classifications, which take into account a fund's market capitalization and style.
The Board considered two proprietary management fee comparisons for the 12-month (or shorter) periods shown in the chart below. The group of Lipper funds used by the Board for management fee comparisons is referred to below as the "Total Mapped Group." The Total Mapped Group comparison focuses on a fund's standing relative to the total universe of comparable funds available to investors, in terms of gross management fees before expense reimbursements or caps, and without giving effect to the fund's performance adjustment. "TMG %" represents the percentage of funds in the Total Mapped Group that had management fees that were lower than the fund's. For example, a TMG % of 13% means that 87% of the funds in the Total Mapped Group had higher management fees than the fund. The "Asset-Size Peer Group" (ASPG) comparison focuses on a fund's standing relative to non-Fidelity funds similar in size to the fund within the Total Mapped Group. The ASPG represents at least 15% of the funds in the Total Mapped Group with comparable asset size and management fee characteristics, subject to a minimum of 50 funds (or all funds in the Total Mapped Group if fewer than 50). Additional information, such as the ASPG quartile in which the fund's management fee ranked and the impact of the fund's performance adjustment, is also included in the chart and considered by the Board.
Annual Report
Fidelity Small Cap Value Fund

The Board noted that the fund's management fee ranked below the median of its Total Mapped Group and below the median of its ASPG for 2006. The Board also noted the effect of the fund's positive performance adjustment on the fund's management fee ranking. The Board noted that the performance adjustment for each year represents calculations for performance periods that differ from the period shown in the performance chart above.
Based on its review, the Board concluded that the fund's management fee was fair and reasonable in light of the services that the fund receives and the other factors considered.
In its review of each class's total expenses, the Board considered the fund's management fee as well as other fund or class expenses, as applicable, such as transfer agent fees, pricing and bookkeeping fees, fund-paid 12b-1 fees, and custodial, legal, and audit fees. The Board also noted the effects of any waivers and reimbursements on fees and expenses, as well as the fund's positive performance adjustment. As part of its review, the Board also considered current and historical total expenses of each class of the fund compared to competitive fund median expenses. Each class of the fund is compared to those funds and classes in the Total Mapped Group (used by the Board for management fee comparisons) that have a similar sales load structure.
The Board noted that the total expenses of each of Class A, Institutional Class, and Fidelity Small Cap Value (retail class) ranked below its competitive median for 2006, the total expenses of Class B ranked equal to its competitive median for 2006, and the total expenses of each of Class T and Class C ranked above its competitive median for 2006. The Board considered that the total expenses of Class C were above the median because of its higher transfer agent fee due to small average account size. The Board noted that the fund offers multiple classes, each of which has a different sales load and 12b-1 fee structure, and that the multiple structures are intended to offer a range of pricing options for the intermediary market. The Board also noted that the total expenses of the classes vary primarily by the level of their 12b-1 fees, although differences in transfer agent fees may also cause expenses to vary from class to class.
Annual Report
Board Approval of Investment Advisory Contracts and
Management Fees - continued
In its review of total expenses, the Board also considered Fidelity fee structures and other information on clients that FMR and its affiliates service in other competitive markets, such as other mutual funds advised or subadvised by FMR or its affiliates, pension plan clients, and other institutional clients.
Based on its review, the Board concluded that the total expenses of each class of the fund were reasonable, although in some cases above the median of the universe presented for comparison, in light of the services that the fund and its shareholders receive and the other factors considered.
Costs of the Services and Profitability. The Board considered the revenues earned and the expenses incurred by Fidelity in conducting the business of developing, marketing, distributing, managing, administering and servicing the fund and its shareholders. The Board also considered the level of Fidelity's profits in respect of all the Fidelity funds.
On an annual basis, FMR presents to the Board Fidelity's profitability for the fund. Fidelity calculates the profitability for each fund, as well as aggregate profitability for groups of Fidelity funds and all Fidelity funds, using a series of detailed revenue and cost allocation methodologies which originate with the audited books and records of Fidelity. The Audit Committee of the Board reviews any significant changes from the prior year's methodologies.
PricewaterhouseCoopers LLP (PwC), independent registered public accounting firm and auditor to Fidelity and certain Fidelity funds, has been engaged annually by the Board as part of the Board's assessment of the results of Fidelity's profitability analysis. PwC's engagement includes the review and assessment of Fidelity's methodologies used in determining the revenues and expenses attributable to Fidelity's mutual fund business, and completion of agreed-upon procedures surrounding the mathematical accuracy of fund profitability and its conformity to allocation methodologies. After considering PwC's reports issued under the engagement and information provided by Fidelity, the Board believes that while other allocation methods may also be reasonable, Fidelity's profitability methodologies are reasonable in all material respects.
Annual Report
The Board has also reviewed Fidelity's non-fund businesses and any fall-out benefits related to the mutual fund business as well as cases where Fidelity's affiliates may benefit from or be related to the fund's business.
The Board considered the costs of the services provided by and the profits realized by Fidelity in connection with the operation of the fund and determined that the amount of profit is a fair entrepreneurial profit for the management of the fund.
Economies of Scale. The Board considered whether there have been economies of scale in respect of the management of the Fidelity funds, whether the Fidelity funds (including the fund) have appropriately benefited from any such economies of scale, and whether there is potential for realization of any further economies of scale. The Board considered the extent to which the fund will benefit from economies of scale through increased services to the fund, through waivers or reimbursements, or through fee or expense reductions, including reductions that occur through operation of the transfer agent agreement. The transfer agent fee varies in part based on the number of accounts in the fund. If the number of accounts decreases or the average account size increases, the overall transfer agent fee rate decreases.
The Board recognized that the fund's management contract incorporates a "group fee" structure, which provides for lower group fee rates as total fund assets under FMR's management increase, and for higher group fee rates as total fund assets under FMR's management decrease. FMR determines the group fee rates based on a tiered asset "breakpoint" schedule. In connection with the renewal of the fund's management contract, the Board approved amendments to the fund's management contract that added four new fee breakpoints to the group fee rate schedule for assets under FMR's management above $1,386 billion. The Board considered that the group fee rate declines under both the present and amended schedules, but that under the amended schedule, the group fee rate declines faster as assets under FMR's management exceed $1,386 billion. The Board considered that the group fee is designed to deliver the benefits of economies of scale to fund shareholders when total fund assets increase, even if assets of any particular fund are unchanged or have declined, because some portion of Fidelity's costs are attributable to services provided to all Fidelity funds, and all funds benefit if those costs can be allocated among more assets. The Board concluded that, given the group fee structure, fund shareholders will achieve a certain level of economies of scale as assets under FMR's management increase at the fund complex level, regardless of whether Fidelity achieves any such economies of scale.
The Board further concluded that any potential economies of scale are being shared between fund shareholders and Fidelity in an appropriate manner.
Additional Information Requested by the Board. In order to develop fully the factual basis for consideration of the Fidelity funds' Advisory Contracts, the Board requested and received additional information on several topics, including (i) fund performance trends and actions to be taken by FMR to improve certain funds' overall performance; (ii) Fidelity's portfolio manager compensation structure, including its effects on fund profitability and the extent to which portfolio manager compensation is linked to fund performance; (iii) Fidelity's fee structures; (iv) the funds' sub-advisory arrangements; and (v) accounts managed by Fidelity other than the Fidelity funds.
Annual Report
Board Approval of Investment Advisory Contracts and
Management Fees - continued
Based on its evaluation of all of the conclusions noted above, and after considering all material factors, the Board ultimately concluded that the advisory fee structures are fair and reasonable, and that the fund's Advisory Contracts should be renewed.
Annual Report
Annual Report
Annual Report
Annual Report
Investment Adviser
Fidelity Management & Research Company
Boston, MA
Investment Sub-Advisers
FMR Co., Inc.
Fidelity Management & Research
(U.K.) Inc.
Fidelity Research & Analysis Company
Fidelity International Investment Advisors
Fidelity Investments Japan Limited
Fidelity International Investment Advisors (U.K.) Limited
General Distributor
Fidelity Distributors Corporation
Boston, MA
Transfer and Service Agents
Fidelity Investments Institutional
Operations Company, Inc.
Boston, MA
Fidelity Service Company, Inc.
Boston, MA
Custodian
Citibank, N.A.
New York, NY
ASCVI-UANN-0907
1.803743.102
(Fidelity Investment logo)(registered trademark)
Fidelity®
Small Cap Opportunities
Fund
Annual Report
July 31, 2007
(2_fidelity_logos) (Registered_Trademark)
Contents
Chairman's Message | <Click Here> | Ned Johnson's message to shareholders. |
Shareholder Expense Example | <Click Here> | An example of shareholder expenses. |
Investment Summary | <Click Here> | A summary of the fund's investments. |
Investments | <Click Here> | A complete list of the fund's investments with their market values. |
Financial Statements | <Click Here> | Statements of assets and liabilities, operations, and changes in net assets,
as well as financial highlights. |
Notes | <Click Here> | Notes to the financial statements. |
Report of Independent Registered Public Accounting Firm | <Click Here> | |
Trustees and Officers | <Click Here> | |
Distributions | <Click Here> | |
Board Approval of Investment Advisory Contracts and Management Fees | <Click Here> | |
To view a fund's proxy voting guidelines and proxy voting record for the 12-month period ended June 30, visit http://www.fidelity.com (search for "proxy voting guidelines") or visit the Securities and Exchange Commission's (SEC) web site at http://www.sec.gov. You may also call 1-800-544-8544 to request a free copy of the proxy voting guidelines.
Standard & Poor's, S&P and S&P 500 are registered service marks of The McGraw-Hill Companies, Inc. and have been licensed for use by Fidelity Distributors Corporation.
Other third party marks appearing herein are the property of their respective owners.
All other marks appearing herein are registered or unregistered trademarks or service marks of FMR Corp. or an affiliated company.
This report and the financial statements contained herein are submitted for the general information of the shareholders of the fund. This report is not authorized for distribution to prospective investors in the fund unless preceded or accompanied by an effective prospectus.
A fund files its complete schedule of portfolio holdings with the SEC for the first and third quarters of each fiscal year on Form N-Q. Forms N-Q are available on the SEC's web site at http://www.sec.gov. A fund's Forms N-Q may be reviewed and copied at the SEC's Public Reference Room in Washington, DC. Information regarding the operation of the SEC's Public Reference Room may be obtained by calling 1-800-SEC-0330. For a complete list of a fund's portfolio holdings, view the most recent holdings listing, semiannual report, or annual report on Fidelity's web site at http://www.fidelity.com or http://www.advisor.fidelity.com, as applicable.
NOT FDIC INSURED · MAY LOSE VALUE · NO BANK GUARANTEE
Neither the fund nor Fidelity Distributors Corporation is a bank.
Annual Report
Chairman's Message
(photo_of_Edward_C_Johnson_3d)
Dear Shareholder:
Stocks are currently on pace to register their fifth straight year of positive returns, although gains could be trimmed if the U.S. economy continues to slow. While financial markets are always unpredictable, there are a number of time-tested principles that can put the historical odds in your favor.
One of the basic tenets is to invest for the long term. Over time, riding out the markets' inevitable ups and downs has proven much more effective than selling into panic or chasing the hottest trend. Even missing only a few of the markets' best days can significantly diminish investor returns. Patience also affords the benefits of compounding - of earning interest on additional income or reinvested dividends and capital gains. There are tax advantages and cost benefits to consider as well. The more you sell, the more taxes you pay, and the more you trade, the higher the costs. While staying the course doesn't eliminate risk, it can considerably lessen the effect of short-term declines.
You can further manage your investing risk through diversification. And today, more than ever, geographic diversification should be taken into account. Studies indicate that asset allocation is the single most important determinant of a portfolio's long-term success. The right mix of stocks, bonds and cash - aligned to your particular risk tolerance and investment objective - is very important. Age-appropriate rebalancing is also an essential aspect of asset allocation. For younger investors, an emphasis on equities - which historically have been the best-performing asset class over time - is encouraged. As investors near their specific goal, such as retirement or sending a child to college, consideration may be given to replacing volatile assets (e.g. common stocks) with more-stable fixed investments (bonds or savings plans).
A third investment principle - investing regularly - can help lower the average cost of your purchases. Investing a certain amount of money each month or quarter helps ensure you won't pay for all your shares at market highs. This strategy - known as dollar cost averaging - also reduces unconstructive "emotion" from investing, helping shareholders avoid selling weak performers just prior to an upswing, or chasing a hot performer just before a correction.
We invite you to contact us via the Internet, through our Investor Centers or over the phone. It is our privilege to provide you the information you need to make the investments that are right for you.
Sincerely,
/s/Edward C. Johnson 3d
Edward C. Johnson 3d
Annual Report
Shareholder Expense Example
As a shareholder of the Fund, you incur two types of costs: (1) transaction costs, including redemption fees, and (2) ongoing costs, including management fees and other Fund expenses. This Example is intended to help you understand your ongoing costs (in dollars) of investing in the Fund and to compare these costs with the ongoing costs of investing in other mutual funds.
The actual expense Example is based on an investment of $1,000 invested at the beginning of the period and held for the entire period (March 22, 2007 to July 31, 2007). The hypothetical expense Example is based on an investment of $1,000 invested for the one-half year period (February 1, 2007 to July 31, 2007).
Actual Expenses
The first line of the accompanying table provides information about actual account values and actual expenses. You may use the information in this line, together with the amount you invested, to estimate the expenses that you paid over the period. Simply divide your account value by $1,000.00 (for example, an $8,600 account value divided by $1,000.00 = 8.6), then multiply the result by the number in the first line under the heading entitled "Expenses Paid During Period" to estimate the expenses you paid on your account during this period. A small balance maintenance fee of $12.00 that is charged once a year may apply for certain accounts with a value of less than $2,000. This fee is not included in the table below. If it was, the estimate of expenses you paid during the period would be higher, and your ending account value lower, by this amount. In addition, the Fund, as a shareholder in the underlying Fidelity Central Funds, will indirectly bear its pro rata share of the fees and expenses incurred by the underlying Fidelity Central Funds. These fees and expenses are not included in the Fund's annualized expense ratio used to calculate the expense estimate in the table below.
Hypothetical Example for Comparison Purposes
The second line of the accompanying table provides information about hypothetical account values and hypothetical expenses based on the Fund's actual expense ratio and an assumed rate of return of 5% per year before expenses, which is not the Fund's actual return. The hypothetical account values and expenses may not be used to estimate the actual ending account balance or expenses you paid for the period. You may use this information to compare the ongoing costs of investing in the Fund and other funds. To do so, compare this 5% hypothetical example with the 5% hypothetical examples that appear in the shareholder reports of the other funds. A small balance maintenance fee of $12.00 that is charged once a year may apply for certain accounts with a value of less than $2,000. This fee is not included in the table below. If it was, the estimate of expenses you paid during the period would be higher, and your ending account value lower, by this amount. In addition, the Fund, as a shareholder in the underlying Fidelity Central Funds, will indirectly bear its pro rata share of the fees and expenses incurred by the underlying Fidelity Central Funds. These fees and expenses are not included in the Fund's annualized expense ratio used to calculate the expense estimate in the table below.
Annual Report
Please note that the expenses shown in the table are meant to highlight your ongoing costs only and do not reflect any transaction costs. Therefore, the second line of the table is useful in comparing ongoing costs only, and will not help you determine the relative total costs of owning different funds. In addition, if these transactional costs were included, your costs would have been higher.
| Beginning
Account Value | Ending
Account Value
July 31, 2007 | Expenses Paid
During Period |
Actual | $ 1,000.00 | $ 965.00 | $ 3.55 A |
Hypothetical (5% return per year before expenses) | $ 1,000.00 | $ 1,019.84 | $ 5.01 B |
A Actual expenses are equal to the Fund's annualized expense ratio of 1.00%; multiplied by the average account value over the period, multiplied by 132/365 (to reflect the period March 22, 2007 to July 31, 2007).
B Hypothetical expenses are equal to the Fund's annualized expense ratio of 1.00%; multiplied by the average account value over the period, multiplied by 181/365 (to reflect the one-half year period).
Annual Report
Investment Summary
Top Ten Stocks as of July 31, 2007 |
| % of fund's
net assets |
Blackbaud, Inc. | 2.1 |
j2 Global Communications, Inc. | 2.0 |
The Geo Group, Inc. | 1.7 |
Payless ShoeSource, Inc. | 1.3 |
Casual Male Retail Group, Inc. | 1.2 |
Air Methods Corp. | 1.2 |
Chattem, Inc. | 1.0 |
Zoll Medical Corp. | 1.0 |
PSS World Medical, Inc. | 0.9 |
EXCO Resources, Inc. | 0.9 |
| 13.3 |
Top Five Market Sectors as of July 31, 2007 |
| % of fund's
net assets |
Information Technology | 18.5 |
Financials | 18.2 |
Consumer Discretionary | 15.6 |
Industrials | 14.0 |
Health Care | 11.1 |
Asset Allocation (% of fund's net assets) |
As of July 31, 2007* |
 | Stocks and Equity Futures 97.0% | |
 | Short-Term Investments
and Net Other Assets 3.0% | |
* Foreign investments | 6.5% | |

Annual Report
Investments July 31, 2007
Showing Percentage of Net Assets
Common Stocks - 94.5% |
| Shares | | Value |
CONSUMER DISCRETIONARY - 15.6% |
Auto Components - 1.4% |
Aftermarket Technology Corp. (a) | 244,900 | | $ 7,432,715 |
Amerigon, Inc. (a) | 399,600 | | 6,421,572 |
| | 13,854,287 |
Distributors - 0.5% |
DXP Enterprises, Inc. (a) | 147,900 | | 4,797,876 |
Hotels, Restaurants & Leisure - 1.7% |
Life Time Fitness, Inc. (a)(d) | 105,500 | | 5,424,810 |
MTR Gaming Group, Inc. (a) | 447,700 | | 5,703,698 |
Ruth's Chris Steak House, Inc. (a) | 363,300 | | 6,074,376 |
| | 17,202,884 |
Internet & Catalog Retail - 0.7% |
Gaiam, Inc. Class A (a) | 440,400 | | 7,081,632 |
Media - 1.4% |
Martha Stewart Living Omnimedia, Inc. Class A (d) | 279,599 | | 3,777,382 |
TiVo, Inc. (a) | 706,600 | | 3,886,300 |
World Wrestling Entertainment, Inc. Class A | 383,400 | | 5,751,000 |
| | 13,414,682 |
Specialty Retail - 6.9% |
Casual Male Retail Group, Inc. (a) | 1,147,900 | | 11,731,538 |
Charlotte Russe Holding, Inc. (a) | 343,100 | | 6,096,887 |
Citi Trends, Inc. (a) | 257,500 | | 8,471,750 |
Dick's Sporting Goods, Inc. (a)(d) | 135,100 | | 7,596,673 |
Lululemon Athletica, Inc. | 1,700 | | 54,638 |
Payless ShoeSource, Inc. (a) | 495,400 | | 13,187,548 |
Shoe Carnival, Inc. (a) | 274,200 | | 6,007,722 |
The Men's Wearhouse, Inc. | 151,200 | | 7,469,280 |
Tween Brands, Inc. (a) | 192,200 | | 7,353,572 |
| | 67,969,608 |
Textiles, Apparel & Luxury Goods - 3.0% |
Delta Apparel, Inc. | 204,989 | | 3,962,437 |
G-III Apparel Group Ltd. (a) | 465,900 | | 7,514,967 |
Skechers U.S.A., Inc. Class A (sub. vtg.) (a) | 186,300 | | 3,873,177 |
Steven Madden Ltd. | 292,400 | | 8,245,680 |
Under Armour, Inc. Class A (sub. vtg.) (a)(d) | 90,200 | | 5,539,182 |
| | 29,135,443 |
TOTAL CONSUMER DISCRETIONARY | | 153,456,412 |
Common Stocks - continued |
| Shares | | Value |
CONSUMER STAPLES - 2.9% |
Food & Staples Retailing - 0.2% |
The Great Atlantic & Pacific Tea Co. (a)(d) | 82,300 | | $ 2,399,045 |
Food Products - 0.4% |
Fresh Del Monte Produce, Inc. | 136,800 | | 3,508,920 |
Personal Products - 2.3% |
Bare Escentuals, Inc. | 161,300 | | 4,550,273 |
Chattem, Inc. (a) | 177,190 | | 9,950,990 |
Physicians Formula Holdings, Inc. | 149,826 | | 2,239,899 |
Prestige Brands Holdings, Inc. (a) | 496,200 | | 6,207,462 |
| | 22,948,624 |
TOTAL CONSUMER STAPLES | | 28,856,589 |
ENERGY - 5.9% |
Energy Equipment & Services - 2.7% |
Hanover Compressor Co. (a) | 223,800 | | 5,333,154 |
NATCO Group, Inc. Class A (a) | 125,600 | | 5,814,024 |
Oceaneering International, Inc. (a) | 111,600 | | 6,267,456 |
Superior Energy Services, Inc. (a) | 219,650 | | 8,856,288 |
| | 26,270,922 |
Oil, Gas & Consumable Fuels - 3.2% |
EXCO Resources, Inc. (a) | 516,900 | | 9,025,074 |
Kodiak Oil & Gas Corp. (a) | 940,200 | | 4,324,920 |
Petrohawk Energy Corp. (a) | 583,140 | | 8,741,269 |
Uranium One, Inc. (a)(d) | 394,200 | | 4,571,345 |
Western Refining, Inc. | 88,000 | | 4,884,000 |
| | 31,546,608 |
TOTAL ENERGY | | 57,817,530 |
FINANCIALS - 18.2% |
Capital Markets - 1.2% |
Ares Capital Corp. | 189,504 | | 2,954,367 |
GFI Group, Inc. (a) | 5,800 | | 432,216 |
Lazard Ltd. Class A | 68,000 | | 2,518,040 |
Penson Worldwide, Inc. | 338,370 | | 5,972,231 |
| | 11,876,854 |
Commercial Banks - 4.3% |
Boston Private Financial Holdings, Inc. | 51,900 | | 1,322,931 |
City National Corp. | 17,800 | | 1,260,062 |
Columbia Banking Systems, Inc. | 128,900 | | 3,274,060 |
Common Stocks - continued |
| Shares | | Value |
FINANCIALS - continued |
Commercial Banks - continued |
First Community Bancorp, California | 106,770 | | $ 5,361,989 |
Intervest Bancshares Corp. Class A | 254,400 | | 6,298,944 |
Mercantile Bank Corp. | 15,400 | | 316,316 |
Prosperity Bancshares, Inc. | 111,600 | | 3,160,512 |
Renasant Corp. | 225,000 | | 4,315,500 |
Security Bank Corp., Georgia (d) | 282,100 | | 3,988,894 |
Sterling Financial Corp., Washington | 221,900 | | 5,039,349 |
Virginia Commerce Bancorp, Inc. | 378,530 | | 5,522,753 |
Whitney Holding Corp. | 74,000 | | 1,849,260 |
| | 41,710,570 |
Consumer Finance - 1.0% |
Cash America International, Inc. | 72,100 | | 2,640,302 |
Dollar Financial Corp. (a) | 281,300 | | 7,049,378 |
| | 9,689,680 |
Diversified Financial Services - 1.6% |
Endeavor Acquisition Corp. (a) | 33,100 | | 365,755 |
Freedom Acquisition Holdings, Inc. warrants 12/28/11 | 691,900 | | 2,075,700 |
Genesis Lease Ltd. ADR | 234,500 | | 6,028,995 |
Marlin Business Services Corp. (a) | 390,636 | | 7,613,496 |
| | 16,083,946 |
Insurance - 4.9% |
Affirmative Insurance Holdings, Inc. | 192,518 | | 2,697,177 |
Allied World Assurance Co. Holdings Ltd. | 56,200 | | 2,666,690 |
American Equity Investment Life Holding Co. | 671,700 | | 7,623,795 |
American Safety Insurance Group Ltd. (a) | 394,700 | | 8,564,990 |
Argonaut Group, Inc. | 72,100 | | 1,984,913 |
First Mercury Financial Corp. | 300,700 | | 5,947,846 |
Hilb Rogal & Hobbs Co. | 61,100 | | 2,645,630 |
IPC Holdings Ltd. | 175,000 | | 4,341,750 |
Montpelier Re Holdings Ltd. | 142,100 | | 2,252,285 |
PartnerRe Ltd. | 35,800 | | 2,542,874 |
ProAssurance Corp. (a) | 79,700 | | 3,935,586 |
United America Indemnity Ltd. Class A (a) | 154,800 | | 3,325,104 |
| | 48,528,640 |
Real Estate Investment Trusts - 3.6% |
American Campus Communities, Inc. | 149,900 | | 3,829,945 |
Annaly Capital Management, Inc. | 426,700 | | 6,165,815 |
Arbor Realty Trust, Inc. | 42,500 | | 839,375 |
BioMed Realty Trust, Inc. | 129,400 | | 2,826,096 |
Common Stocks - continued |
| Shares | | Value |
FINANCIALS - continued |
Real Estate Investment Trusts - continued |
Cedar Shopping Centers, Inc. | 74,100 | | $ 931,437 |
Entertainment Properties Trust (SBI) | 62,200 | | 2,771,010 |
FelCor Lodging Trust, Inc. | 55,800 | | 1,225,368 |
First Industrial Realty Trust, Inc. | 91,000 | | 3,522,610 |
Home Properties, Inc. | 19,500 | | 902,850 |
Medical Properties Trust, Inc. | 344,400 | | 3,857,280 |
National Retail Properties, Inc. | 231,700 | | 5,018,622 |
RAIT Financial Trust (SBI) (d) | 54,500 | | 564,620 |
Senior Housing Properties Trust (SBI) | 80,500 | | 1,391,040 |
Sovran Self Storage, Inc. | 33,900 | | 1,461,090 |
| | 35,307,158 |
Real Estate Management & Development - 0.2% |
CB Richard Ellis Group, Inc. Class A (a) | 61,300 | | 2,140,596 |
Thrifts & Mortgage Finance - 1.4% |
BankUnited Financial Corp. Class A | 166,200 | | 2,798,808 |
Encore Bancshares, Inc. | 27,000 | | 609,390 |
MGIC Investment Corp. | 11,100 | | 429,126 |
Radian Group, Inc. | 115,100 | | 3,880,021 |
Washington Federal, Inc. | 246,100 | | 5,544,633 |
| | 13,261,978 |
TOTAL FINANCIALS | | 178,599,422 |
HEALTH CARE - 11.1% |
Biotechnology - 1.3% |
Indevus Pharmaceuticals, Inc. (a) | 317,000 | | 2,247,530 |
ONYX Pharmaceuticals, Inc. (a) | 231,000 | | 6,424,110 |
Theravance, Inc. (a) | 164,800 | | 4,411,696 |
| | 13,083,336 |
Health Care Equipment & Supplies - 4.7% |
Align Technology, Inc. (a) | 286,500 | | 7,477,650 |
American Medical Systems Holdings, Inc. (a)(d) | 313,700 | | 5,734,436 |
Lifecore Biomedical, Inc. (a) | 472,100 | | 7,218,409 |
Meridian Bioscience, Inc. | 323,900 | | 7,232,687 |
Quidel Corp. (a) | 154,946 | | 2,305,596 |
West Pharmaceutical Services, Inc. | 151,600 | | 7,016,048 |
Zoll Medical Corp. (a) | 344,900 | | 9,264,014 |
| | 46,248,840 |
Common Stocks - continued |
| Shares | | Value |
HEALTH CARE - continued |
Health Care Providers & Services - 4.0% |
Air Methods Corp. (a) | 291,500 | | $ 11,106,150 |
Healthways, Inc. (a) | 132,000 | | 5,768,400 |
MWI Veterinary Supply, Inc. (a) | 183,300 | | 7,088,211 |
Pediatrix Medical Group, Inc. (a) | 108,000 | | 5,827,680 |
PSS World Medical, Inc. (a) | 528,600 | | 9,107,778 |
| | 38,898,219 |
Life Sciences Tools & Services - 1.1% |
PAREXEL International Corp. (a) | 116,700 | | 4,718,181 |
Pharmaceutical Product Development, Inc. | 187,400 | | 6,277,900 |
| | 10,996,081 |
TOTAL HEALTH CARE | | 109,226,476 |
INDUSTRIALS - 14.0% |
Aerospace & Defense - 1.0% |
Alliant Techsystems, Inc. (a) | 52,000 | | 5,153,720 |
BE Aerospace, Inc. (a) | 113,300 | | 4,595,448 |
| | 9,749,168 |
Building Products - 0.7% |
Goodman Global, Inc. (a) | 304,300 | | 7,339,716 |
Commercial Services & Supplies - 5.9% |
Advisory Board Co. (a) | 81,100 | | 4,175,839 |
American Reprographics Co. (a) | 211,600 | | 5,273,072 |
CoStar Group, Inc. (a) | 22,853 | | 1,165,503 |
Diamond Management & Technology Consultants, Inc. | 328,300 | | 3,548,923 |
eTelecare Global Solutions, Inc. ADR | 282,400 | | 4,312,248 |
Huron Consulting Group, Inc. (a) | 117,200 | | 7,961,396 |
InnerWorkings, Inc. (d) | 349,300 | | 4,663,155 |
Navigant Consulting, Inc. (a) | 298,100 | | 4,695,075 |
The Geo Group, Inc. (a) | 620,800 | | 17,171,328 |
Waste Services, Inc. (a) | 545,300 | | 5,562,060 |
| | 58,528,599 |
Construction & Engineering - 0.7% |
Granite Construction, Inc. | 103,200 | | 6,706,968 |
Electrical Equipment - 0.6% |
Genlyte Group, Inc. (a) | 79,300 | | 5,516,901 |
Machinery - 3.8% |
Astec Industries, Inc. (a) | 120,600 | | 6,291,702 |
Bucyrus International, Inc. Class A | 127,900 | | 8,129,324 |
Common Stocks - continued |
| Shares | | Value |
INDUSTRIALS - continued |
Machinery - continued |
CIRCOR International, Inc. | 147,800 | | $ 5,894,264 |
Columbus McKinnon Corp. (NY Shares) (a) | 239,200 | | 6,135,480 |
Force Protection, Inc. (a) | 275,600 | | 4,326,920 |
Manitowoc Co., Inc. | 48,900 | | 3,798,063 |
Titan International, Inc. | 103,300 | | 3,051,482 |
| | 37,627,235 |
Trading Companies & Distributors - 1.3% |
Beacon Roofing Supply, Inc. (a)(d) | 251,800 | | 3,766,928 |
H&E Equipment Services, Inc. (a) | 238,100 | | 6,469,177 |
Rush Enterprises, Inc. Class A (a) | 75,566 | | 2,112,070 |
| | 12,348,175 |
TOTAL INDUSTRIALS | | 137,816,762 |
INFORMATION TECHNOLOGY - 18.5% |
Communications Equipment - 3.3% |
Airspan Networks, Inc. (a) | 939,800 | | 3,063,748 |
Airvana, Inc. | 110,200 | | 778,012 |
Arris Group, Inc. (a) | 179,300 | | 2,657,226 |
ECI Telecom Ltd. (a) | 445,000 | | 4,151,850 |
NETGEAR, Inc. (a) | 271,158 | | 7,500,230 |
Optium Corp. (d) | 131,200 | | 969,568 |
ORBCOMM, Inc. | 187,980 | | 2,883,613 |
Plantronics, Inc. | 237,300 | | 6,649,146 |
Sirenza Microdevices, Inc. (a) | 297,500 | | 3,379,600 |
| | 32,032,993 |
Computers & Peripherals - 0.0% |
STEC, Inc. (a) | 41,300 | | 303,555 |
Electronic Equipment & Instruments - 1.3% |
Gerber Scientific, Inc. (a) | 560,200 | | 5,814,876 |
IPG Photonics Corp. | 351,200 | | 6,732,504 |
| | 12,547,380 |
Internet Software & Services - 4.3% |
Digital River, Inc. (a) | 71,900 | | 3,236,219 |
DivX, Inc. (d) | 328,400 | | 4,436,684 |
Equinix, Inc. (a) | 25,880 | | 2,249,231 |
Goldleaf Financial Solutions, Inc. (a)(e) | 884,547 | | 4,599,644 |
j2 Global Communications, Inc. (a) | 602,100 | | 19,652,544 |
SAVVIS, Inc. (a) | 83,300 | | 3,128,748 |
Common Stocks - continued |
| Shares | | Value |
INFORMATION TECHNOLOGY - continued |
Internet Software & Services - continued |
ValueClick, Inc. (a) | 79,700 | | $ 1,703,986 |
VistaPrint Ltd. (a) | 99,858 | | 3,410,151 |
| | 42,417,207 |
IT Services - 1.0% |
Iron Mountain, Inc. (a) | 140,600 | | 3,766,674 |
Perot Systems Corp. Class A (a) | 365,400 | | 5,561,388 |
| | 9,328,062 |
Semiconductors & Semiconductor Equipment - 4.3% |
Axcelis Technologies, Inc. (a) | 606,700 | | 3,367,185 |
California Micro Devices Corp. (a)(e) | 1,207,693 | | 5,410,465 |
EMCORE Corp. (a)(d) | 536,000 | | 4,148,640 |
Entegris, Inc. (a) | 419,800 | | 4,525,444 |
FormFactor, Inc. (a) | 45,900 | | 1,762,101 |
Hittite Microwave Corp. (a) | 63,500 | | 2,553,970 |
MIPS Technologies, Inc. (a) | 100 | | 885 |
Netlogic Microsystems, Inc. (a)(d) | 225,900 | | 6,885,432 |
Varian Semiconductor Equipment Associates, Inc. (a) | 96,000 | | 4,512,000 |
Volterra Semiconductor Corp. (a)(d) | 255,980 | | 2,941,210 |
Zoran Corp. (a) | 353,000 | | 6,654,050 |
| | 42,761,382 |
Software - 4.3% |
Blackbaud, Inc. | 1,001,500 | | 20,971,411 |
CommVault Systems, Inc. | 458,100 | | 7,778,538 |
Jack Henry & Associates, Inc. | 46,100 | | 1,107,322 |
OpenTV Corp. Class A (a) | 450,100 | | 855,190 |
Sonic Solutions, Inc. (a) | 507,600 | | 5,674,968 |
SourceForge, Inc. (a) | 1,286,000 | | 4,771,060 |
Unica Corp. (a) | 123,400 | | 1,445,014 |
| | 42,603,503 |
TOTAL INFORMATION TECHNOLOGY | | 181,994,082 |
MATERIALS - 4.4% |
Chemicals - 1.8% |
Airgas, Inc. | 101,400 | | 4,735,380 |
Hercules, Inc. (a) | 298,000 | | 6,186,480 |
Rockwood Holdings, Inc. (a) | 197,100 | | 6,817,689 |
| | 17,739,549 |
Common Stocks - continued |
| Shares | | Value |
MATERIALS - continued |
Metals & Mining - 2.6% |
Breakwater Resources Ltd. (a) | 2,294,500 | | $ 7,227,449 |
Carpenter Technology Corp. | 27,870 | | 3,307,890 |
Compass Minerals International, Inc. | 209,800 | | 6,889,832 |
Haynes International, Inc. (a) | 54,700 | | 4,912,607 |
Stillwater Mining Co. (a) | 323,000 | | 2,939,300 |
| | 25,277,078 |
TOTAL MATERIALS | | 43,016,627 |
TELECOMMUNICATION SERVICES - 0.9% |
Diversified Telecommunication Services - 0.7% |
Cbeyond, Inc. (a) | 95,870 | | 3,390,922 |
Cincinnati Bell, Inc. | 684,690 | | 3,533,000 |
| | 6,923,922 |
Wireless Telecommunication Services - 0.2% |
SBA Communications Corp. Class A (a) | 70,160 | | 2,337,731 |
TOTAL TELECOMMUNICATION SERVICES | | 9,261,653 |
UTILITIES - 3.0% |
Electric Utilities - 1.7% |
Allete, Inc. | 143,000 | | 6,269,120 |
ITC Holdings Corp. | 123,250 | | 5,182,663 |
Pepco Holdings, Inc. | 191,700 | | 5,189,319 |
| | 16,641,102 |
Independent Power Producers & Energy Traders - 0.4% |
Clipper Windpower PLC (a) | 296,300 | | 4,297,593 |
Multi-Utilities - 0.9% |
AEM SpA | 382,600 | | 1,281,080 |
CMS Energy Corp. | 468,900 | | 7,577,424 |
| | 8,858,504 |
TOTAL UTILITIES | | 29,797,199 |
TOTAL COMMON STOCKS (Cost $993,279,104) | 929,842,752 |
U.S. Treasury Obligations - 0.3% |
| Principal
Amount | | Value |
U.S. Treasury Bills, yield at date of purchase 4.57% to 4.87% 8/2/07 to 10/4/07 (f)
(Cost $2,845,580) | $ 2,865,000 | | $ 2,845,679 |
Money Market Funds - 8.0% |
| Shares | | |
Fidelity Cash Central Fund, 5.38% (b) | 42,450,541 | | 42,450,541 |
Fidelity Securities Lending Cash Central Fund, 5.39% (b)(c) | 36,760,680 | | 36,760,680 |
TOTAL MONEY MARKET FUNDS (Cost $79,211,221) | 79,211,221 |
Cash Equivalents - 0.5% |
| Maturity
Amount | | |
Investments in repurchase agreements in a joint trading account at 5.09%, dated 7/31/07 due 8/1/07 (Collateralized by U.S. Treasury Obligations) #
(Cost $4,880,000) | $ 4,880,690 | | 4,880,000 |
TOTAL INVESTMENT PORTFOLIO - 103.3% (Cost $1,080,215,905) | | 1,016,779,652 |
NET OTHER ASSETS - (3.3)% | | (32,309,283) |
NET ASSETS - 100% | $ 984,470,369 |
Futures Contracts |
| Expiration Date | | Underlying Face Amount at Value | | Unrealized
Appreciation/
(Depreciation) |
Purchased |
Equity Index Contracts |
321 Mini-Russell 2000 Index Contracts | Sept. 2007 | | $ 25,070,100 | | $ (622,389) |
|
The face value of futures purchased as a percentage of net assets - 2.5% |
Legend |
(a) Non-income producing |
(b) Affiliated fund that is available only to investment companies and other accounts managed by Fidelity Investments. The rate quoted is the annualized seven-day yield of the fund at period end. A complete unaudited listing of the fund's holdings as of its most recent quarter end is available upon request. |
(c) Investment made with cash collateral received from securities on loan. |
(d) Security or a portion of the security is on loan at period end. |
(e) Affiliated company |
(f) Security or a portion of the security was pledged to cover margin requirements for futures contracts. At the period end, the value of securities pledged amounted to $1,953,335. |
# Additional Information on each counterparty to the repurchase agreement is as follows: |
Repurchase Agreement / Counterparty | Value |
$4,880,000 due 8/01/07 at 5.09% |
Banc of America Securities LLC | $ 876,130 |
Merrill Lynch Government Securities, Inc. | 4,003,870 |
| $ 4,880,000 |
Affiliated Central Funds |
Information regarding fiscal year to date income earned by the Fund from investments in Fidelity Central Funds is as follows: |
Fund | Income earned |
Fidelity Cash Central Fund | $ 1,039,431 |
Fidelity Securities Lending Cash Central Fund | 14,150 |
Total | $ 1,053,581 |
Other Affiliated Issuers |
An affiliated company is a company in which the fund has ownership of at least 5% of the voting securities. Fiscal year to date transactions with companies which are or were affiliates are as follows: |
Affiliates | Value, beginning of period | Purchases | Sales Proceeds | Dividend Income | Value, end of period |
California Micro Devices Corp. | $ - | $ 5,892,031 | $ - | $ - | $ 5,410,465 |
Goldleaf Financial Solutions, Inc. | - | 5,602,603 | - | - | 4,599,644 |
Total | $ - | $ 11,494,634 | $ - | $ - | $ 10,010,109 |
Income Tax Information |
At July 31, 2007, the fund had a capital loss carryforward of approximately $4,033,651 all of which will expire on July 31, 2015. |
See accompanying notes which are an integral part of the financial statements.
Annual Report
Financial Statements
Statement of Assets and Liabilities
| July 31, 2007 |
| | |
Assets | | |
Investment in securities, at value (including securities loaned of $35,275,620 and repurchase agreements of $4,880,000) - See accompanying schedule: Unaffiliated issuers (cost $989,510,050) | $ 927,558,322 | |
Fidelity Central Funds (cost $79,211,221) | 79,211,221 | |
Other affiliated issuers (cost $11,494,634) | 10,010,109 | |
Total Investments (cost $1,080,215,905) | | $ 1,016,779,652 |
Cash | | 1,173,576 |
Foreign currency held at value (cost $64,005) | | 65,036 |
Receivable for investments sold | | 19,709,338 |
Receivable for fund shares sold | | 6,838,626 |
Dividends receivable | | 287,133 |
Distributions receivable from Fidelity Central Funds | | 246,020 |
Other receivables | | 32,456 |
Total assets | | 1,045,131,837 |
| | |
Liabilities | | |
Payable for investments purchased | $ 22,779,187 | |
Payable for fund shares redeemed | 41,334 | |
Accrued management fee | 590,842 | |
Payable for daily variation on futures contracts | 235,498 | |
Other affiliated payables | 199,679 | |
Other payables and accrued expenses | 54,248 | |
Collateral on securities loaned, at value | 36,760,680 | |
Total liabilities | | 60,661,468 |
| | |
Net Assets | | $ 984,470,369 |
Net Assets consist of: | | |
Paid in capital | | $ 1,050,842,408 |
Undistributed net investment income | | 406,930 |
Accumulated undistributed net realized gain (loss) on investments and foreign currency transactions | | (2,720,310) |
Net unrealized appreciation (depreciation) on investments and assets and liabilities in foreign currencies | | (64,058,659) |
Net Assets, for 102,060,835 shares outstanding | | $ 984,470,369 |
Net Asset Value, offering price and redemption price per share ($984,470,369 ÷ 102,060,835 shares) | | $ 9.65 |
See accompanying notes which are an integral part of the financial statements.
Annual Report
Statement of Operations
| For the period March 22, 2007 (commencement of operations) to July 31, 2007 |
| | |
Investment Income | | |
Dividends | | $ 1,619,536 |
Interest | | 77,674 |
Income from Fidelity Central Funds | | 1,053,581 |
Total income | | 2,750,791 |
| | |
Expenses | | |
Management fee | $ 1,642,872 | |
Transfer agent fees | 544,478 | |
Accounting and security lending fees | 80,525 | |
Custodian fees and expenses | 15,113 | |
Independent trustees' compensation | 408 | |
Audit | 48,206 | |
Legal | 16 | |
Miscellaneous | 2,006 | |
Total expenses before reductions | 2,333,624 | |
Expense reductions | (55,241) | 2,278,383 |
Net investment income (loss) | | 472,408 |
Realized and Unrealized Gain (Loss) Net realized gain (loss) on: | | |
Investment securities: | | |
Unaffiliated issuers | (2,502,893) | |
Foreign currency transactions | (31,653) | |
Futures contracts | (251,242) | |
Total net realized gain (loss) | | (2,785,788) |
Change in net unrealized appreciation (depreciation) on: Investment securities | (63,436,253) | |
Assets and liabilities in foreign currencies | (17) | |
Futures contracts | (622,389) | |
Total change in net unrealized appreciation (depreciation) | | (64,058,659) |
Net gain (loss) | | (66,844,447) |
Net increase (decrease) in net assets resulting from operations | | $ (66,372,039) |
See accompanying notes which are an integral part of the financial statements.
Annual Report
Financial Statements - continued
Statement of Changes in Net Assets
| For the period March 22, 2007
(commencement of operations) to
July 31, 2007 |
Increase (Decrease) in Net Assets | |
Operations | |
Net investment income (loss) | $ 472,408 |
Net realized gain (loss) | (2,785,788) |
Change in net unrealized appreciation (depreciation) | (64,058,659) |
Net increase (decrease) in net assets resulting
from operations | (66,372,039) |
Share transactions
Proceeds from sales of shares | 1,051,452,555 |
Cost of shares redeemed | (614,291) |
Net increase (decrease) in net assets resulting from share transactions | 1,050,838,264 |
Redemption fees | 4,144 |
Total increase (decrease) in net assets | 984,470,369 |
| |
Net Assets | |
Beginning of period | - |
End of period (including undistributed net investment income of $406,930) | $ 984,470,369 |
Other Information Shares | |
Sold | 102,120,347 |
Redeemed | (59,512) |
Net increase (decrease) | 102,060,835 |
See accompanying notes which are an integral part of the financial statements.
Annual Report
Financial Highlights
| Year ended
July 31,
2007 G |
Selected Per-Share Data | |
Net asset value, beginning of period | $ 10.00 |
Income from Investment Operations | |
Net investment income (loss) D | .01 |
Net realized and unrealized gain (loss) | (.36) |
Total from investment operations | (.35) |
Redemption fees added to paid in capital D | - I |
Net asset value, end of period | $ 9.65 |
Total Return B, C | (3.50)% |
Ratios to Average Net Assets E, H | |
Expenses before reductions | 1.00% A |
Expenses net of fee waivers, if any | 1.00% A |
Expenses net of all reductions | .98% A |
Net investment income (loss) | .20% A |
Supplemental Data | |
Net assets, end of period (000 omitted) | $ 984,470 |
Portfolio turnover rate F | 176% A |
A Annualized
B Total returns for periods of less than one year are not annualized.
C Total returns would have been lower had certain expenses not been reduced during the periods shown.
D Calculated based on average shares outstanding during the period.
E Fees and expenses of the underlying Fidelity Central Funds are not included in the Fund's expense ratio. The Fund indirectly bears its proportionate share of the expenses of any underlying Fidelity Central Funds.
F Amount does not include the portfolio activity of any underlying Fidelity Central Funds.
G For the period March 22, 2007 (commencement of operations) to July 31, 2007.
H Expense ratios reflect operating expenses of the Fund. Expenses before reductions do not reflect amounts reimbursed by the investment adviser or reductions from brokerage service arrangements or other expense offset arrangements and do not represent the amount paid by the Fund during periods when reimbursements or reductions occur. Expense ratios before reductions for start-up periods may not be representative of longer term operating periods. Expenses net of fee waivers reflect expenses after reimbursement by the investment adviser but prior to reductions from brokerage service arrangements or other expense offset arrangements. Expenses net of all reductions represent the net expenses paid by the Fund.
I Amount represents less than $.01 per share.
See accompanying notes which are an integral part of the financial statements.
Annual Report
Notes to Financial Statements
For the period ended July 31, 2007
1. Organization.
Fidelity Small Cap Opportunities Fund (the Fund) is a fund of Fidelity Securities Fund (the trust) and is authorized to issue an unlimited number of shares. Shares of the Fund are only available for purchase by authorized intermediaries and mutual funds for which Fidelity Management & Research Company (FMR) or an affiliate serves as an investment manager and FMR investment professionals. The trust is registered under the Investment Company Act of 1940, as amended (the 1940 Act), as an open-end management investment company organized as a Massachusetts business trust.
2. Investments in Fidelity Central Funds.
The Fund may invest in Fidelity Central Funds which are open-end investment companies available only to other investment companies and accounts managed by FMR and its affiliates. The Fund's Schedule of Investments lists each of the Fidelity Central Funds as an investment of the Fund, but does not include the underlying holdings of each Fidelity Central Fund. As an Investing Fund, the Fund indirectly bears its proportionate share of the expenses of the underlying Fidelity Central Funds.
The Money Market Central Funds seek preservation of capital and current income and are managed by Fidelity Investments Money Management, Inc. (FIMM), an affiliate of FMR.
A complete list of holdings for each Fidelity Central Fund is available upon request or at the SEC's web site at www.sec.gov. In addition, the financial statements of the Fidelity Central Funds, which are not covered by the Fund's Report of Independent Registered Public Accounting Firm, are available on the SEC's web site or upon request.
3. Significant Accounting Policies.
The financial statements have been prepared in conformity with accounting principles generally accepted in the United States of America, which require management to make certain estimates and assumptions at the date of the financial statements. The following summarizes the significant accounting policies of the Fund:
Security Valuation. Investments are valued and net asset value (NAV) per share is calculated (NAV calculation) as of the close of business of the New York Stock Exchange (NYSE), normally 4:00 p.m. Eastern time. Wherever possible, the Fund uses independent pricing services approved by the Board of Trustees to value its investments.
Equity securities, including restricted securities, for which market quotations are readily available, are valued at the last reported sale price or official closing price as reported by an independent pricing service on the primary market or exchange on which they are traded. In the event there were no sales during the day or closing prices are not available,
Annual Report
3. Significant Accounting Policies - continued
Security Valuation - continued
securities are valued at the last quoted bid price. Investments in open-end mutual funds, including the Fidelity Central Funds, are valued at their closing net asset value each business day. Short-term securities with remaining maturities of sixty days or less for which quotations are not readily available are valued at amortized cost, which approximates value.
When current market prices or quotations are not readily available or do not accurately reflect fair value, valuations may be determined in accordance with procedures adopted by the Board of Trustees. For example, when developments occur between the close of a market and the close of the NYSE that may materially affect the value of some or all of the securities, or when trading in a security is halted, those securities may be fair valued. Factors used in the determination of fair value may include monitoring news to identify significant market or security specific events such as changes in the value of U.S. securities markets, reviewing developments in foreign markets and evaluating the performance of ADRs, futures contracts and exchange-traded funds. Because the Fund's utilization of fair value pricing depends on market activity, the frequency with which fair value pricing is used cannot be predicted and may be utilized to a significant extent. The value of securities used for NAV calculation under fair value pricing may differ from published prices for the same securities.
Foreign Currency. The Fund uses foreign currency contracts to facilitate transactions in foreign-denominated securities. Losses from these transactions may arise from changes in the value of the foreign currency or if the counterparties do not perform under the contracts' terms.
Foreign-denominated assets, including investment securities, and liabilities are translated into U.S. dollars at the exchange rate at period end. Purchases and sales of investment securities, income and dividends received and expenses denominated in foreign currencies are translated into U.S. dollars at the exchange rate in effect on the transaction date.
The effects of exchange rate fluctuations on investments are included with the net realized and unrealized gain (loss) on investment securities. Other foreign currency transactions resulting in realized and unrealized gain (loss) are disclosed separately.
Investment Transactions and Income. For financial reporting purposes, the Fund's investment holdings and NAV include trades executed through the end of the last business day of the period. The NAV for processing shareholder transactions includes trades executed through the end of the prior business day. Gains and losses on securities sold are determined on the basis of identified cost. Dividend income is recorded on the ex-dividend date, except for certain dividends from foreign securities where the ex-dividend date may have passed, which are recorded as soon as the Fund is informed of the
Annual Report
Notes to Financial Statements - continued
3. Significant Accounting Policies - continued
Investment Transactions and Income - continued
ex-dividend date. Non-cash dividends included in the dividend income, if any, are recorded at the fair market value of the securities received. Distributions received on securities that represent a return of capital or capital gain are recorded as a reduction of cost of investments and/or as a realized gain. The Fund estimates the components of distributions received that may be considered return of capital distributions or capital gain distributions. Interest income and distributions from the Fidelity Central Funds are accrued as earned. Interest income includes coupon interest and amortization of premium and accretion of discount on debt securities. Investment income is recorded net of foreign taxes withheld where recovery of such taxes is uncertain.
Expenses. Most expenses of the trust can be directly attributed to a fund. Expenses which cannot be directly attributed are apportioned among each Fund in the trust. Expense estimates are accrued in the period to which they relate and adjustments are made when actual amounts are known.
Income Tax Information and Distributions to Shareholders. Each year, the Fund intends to qualify as a regulated investment company by distributing all of its taxable income and realized gains under Subchapter M of the Internal Revenue Code. As a result, no provision for income taxes is required in the accompanying financial statements. The Fund adopted the provisions of FASB Interpretation No. 48, Accounting for Uncertainties in Income Taxes (FIN 48), on June 29, 2007. FIN 48 sets forth a minimum threshold for financial statement recognition of the benefit of a tax position taken or expected to be taken in a tax return. The implementation of FIN 48 did not result in any unrecognized tax benefits in the accompanying financial statements. Each of the tax years in the three year period ended June 29, 2007, if applicable, remains subject to examination by the Internal Revenue Service. Foreign taxes are provided for based on the Fund's understanding of the tax rules and rates that exist in the foreign markets in which it invests.
Distributions are recorded on the ex-dividend date. Income and capital gain distributions are determined in accordance with income tax regulations, which may differ from generally accepted accounting principles. In addition, the Fund will claim a portion of the payment made to redeeming shareholders as a distribution for income tax purposes.
Capital accounts within the financial statements are adjusted for permanent book-tax differences. These adjustments have no impact on net assets or the results of operations. Temporary book-tax differences will reverse in a subsequent period.
Book-tax differences are primarily due to foreign currency transactions, passive foreign investment companies (PFIC), partnerships, capital loss carryforwards, losses deferred due to wash sales and futures transactions.
Annual Report
3. Significant Accounting Policies - continued
Income Tax Information and Distributions to Shareholders - continued
The tax-basis components of distributable earnings and the federal tax cost as of period end were as follows:
Unrealized appreciation | $ 28,678,459 | |
Unrealized depreciation | (93,232,072) | |
Net unrealized appreciation (depreciation) | (64,553,613) | |
Undistributed ordinary income | 2,215,155 | |
Capital loss carryforward | (4,033,651) | |
| | |
Cost for federal income tax purposes | $ 1,081,333,265 | |
Short-Term Trading (Redemption) Fees. Shares held in the Fund less than 90 days are subject to a redemption fee equal to 1.50% of the proceeds of the redeemed shares. All redemption fees, including any estimated redemption fees paid by FMR, are retained by the Fund and accounted for as an addition to paid in capital.
New Accounting Pronouncement. In September 2006, Statement of Financial Accounting Standards No. 157, Fair Value Measurements (SFAS 157), was issued and is effective for fiscal years beginning after November 15, 2007. SFAS 157 defines fair value, establishes a framework for measuring fair value and expands disclosures about fair value measurements. Management is currently evaluating the impact the adoption of SFAS 157 will have on the Fund's financial statement disclosures.
4. Operating Policies.
Repurchase Agreements. FMR has received an Exemptive Order from the Securities and Exchange Commission (the SEC) which permits the Fund and other affiliated entities of FMR to transfer uninvested cash balances into joint trading accounts which are then invested in repurchase agreements. The Fund may also invest directly with institutions in repurchase agreements. Repurchase agreements are collateralized by government or non-government securities. Upon settlement date, collateral is held in segregated accounts with custodian banks and may be obtained in the event of a default
Annual Report
Notes to Financial Statements - continued
4. Operating Policies - continued
Repurchase Agreements - continued
of the counterparty. The Fund monitors, on a daily basis, the value of the collateral to ensure it is at least equal to the principal amount of the repurchase agreement (including accrued interest). In the event of a default by the counterparty, realization of the collateral proceeds could be delayed, during which time the value of the collateral may decline.
Futures Contracts. The Fund may use futures contracts to manage its exposure to the stock market. Buying futures tends to increase a fund's exposure to the underlying instrument, while selling futures tends to decrease a fund's exposure to the underlying instrument or hedge other fund investments. Upon entering into a futures contract, a fund is required to deposit with a clearing broker, no later than the following business day, an amount ("initial margin") equal to a certain percentage of the face value of the contract. The initial margin may be in the form of cash or securities and is transferred to a segregated account on settlement date. Subsequent payments ("variation margin") are made or received by a fund depending on the daily fluctuations in the value of the futures contract and are accounted for as unrealized gains or losses. Realized gains (losses) are recorded upon the expiration or closing of the futures contract. Securities deposited to meet margin requirements are identified in the Schedule of Investments. Futures contracts involve, to varying degrees, risk of loss in excess of any futures variation margin reflected in the Statement of Assets and Liabilities. The underlying face amount at value of any open futures contracts at period end is shown in the Schedule of Investments under the caption "Futures Contracts." This amount reflects each contract's exposure to the underlying instrument at period end. Losses may arise from changes in the value of the underlying instruments or if the counterparties do not perform under the contract's terms. Futures contracts are valued at the settlement price established each day by the board of trade or exchange on which they are traded.
5. Purchases and Sales of Investments.
Purchases and sales of securities, other than short-term securities, aggregated $1,389,670,168 and $393,070,103, respectively.
6. Fees and Other Transactions with Affiliates.
Management Fee. FMR and its affiliates provide the Fund with investment management related services for which the Fund pays a monthly management fee. The management fee is the sum of an individual fund fee rate that is based on an annual rate of .45% of the Fund's average net assets and a group fee rate that averaged ..26% during the period. The group fee rate is based upon the average net assets of all the mutual funds advised by FMR. The group fee rate decreases as assets under management increase and
Annual Report
6. Fees and Other Transactions with Affiliates - continued
Management Fee - continued
increases as assets under management decrease. In addition, the management fee is subject to a performance adjustment (up to a maximum of ± .20% of the Fund's average net assets over a 36 month performance period). The upward or downward adjustment to the management fee is based on the Fund's relative investment performance as compared to an appropriate benchmark index. The performance period began April 1, 2007, with the performance adjustment not taking effect until the twelfth month of the performance period (March 2008). Subsequent months will be added until the performance period includes 36 months. For the period, the total annualized management fee rate was .71% of the Fund's average net assets.
Transfer Agent Fees. Fidelity Service Company, Inc. (FSC), an affiliate of FMR, is the Fund's transfer, dividend disbursing and shareholder servicing agent. FSC receives account fees and asset-based fees that vary according to account size and type of account. FSC pays for typesetting, printing and mailing of shareholder reports, except proxy statements. For the period the transfer agent fees were equivalent to an annualized rate of .23% of average net assets.
Accounting and Security Lending Fees. FSC maintains the Fund's accounting records. The accounting fee is based on the level of average net assets for the month. Under a separate contract, FSC administers the security lending program. The security lending fee is based on the number and duration of lending transactions.
Brokerage Commissions. The Fund placed a portion of its portfolio transactions with brokerage firms which are affiliates of the investment adviser. The commissions paid to these affiliated firms were $10,960 for the period.
7. Security Lending.
The Fund lends portfolio securities from time to time in order to earn additional income. On the settlement date of the loan, the Fund receives collateral (in the form of U.S. Treasury obligations, letters of credit and/or cash) against the loaned securities and maintains collateral in an amount not less than 100% of the market value of the loaned securities during the period of the loan. The market value of the loaned securities is determined at the close of business of the Fund and any additional required collateral is delivered to the Fund on the next business day. If the borrower defaults on its obligation to return the securities loaned because of insolvency or other reasons, a fund could experience delays and costs in recovering the securities loaned or in gaining access to the collateral. Any cash collateral received is invested in the Fidelity Securities Lending Cash Central Fund. The value of loaned securities and cash collateral at period end are
Annual Report
Notes to Financial Statements - continued
7. Security Lending - continued
disclosed on the Fund's Statement of Assets and Liabilities. Security lending income represents the income earned on investing cash collateral, less fees and expenses associated with the loan, plus any premium payments that may be received on the loan of certain types of securities. Security lending income is presented in the Statement of Operations as a component of income from Fidelity Central Funds. Net income from lending portfolio securities during the period amounted to $14,150.
8. Expense Reductions.
Many of the brokers with whom FMR places trades on behalf of the Fund provided services to the Fund in addition to trade execution. These services included payments of certain expenses on behalf of the Fund totaling $32,476 for the period. In addition, through arrangements with the Fund's custodian and transfer agent, credits realized as a result of uninvested cash balances were used to reduce the Fund's expenses. During the period, these credits reduced the Fund's custody and transfer agent expenses by $1,857 and $20,908, respectively.
9. Other.
The Fund's organizational documents provide former and current trustees and officers with a limited indemnification against liabilities arising in connection with the performance of their duties to the Fund. In the normal course of business, the Fund may also enter into contracts that provide general indemnifications. The Fund's maximum exposure under these arrangements is unknown as this would be dependent on future claims that may be made against the Fund. The risk of material loss from such claims is considered remote.
At the end of the period mutual funds managed by FMR or an FMR affiliate were the owners of record of substantially all of the outstanding shares of the Fund.
Annual Report
Report of Independent Registered Public Accounting Firm
To the Trustees of Fidelity Securities Fund and Shareholders of Fidelity Small Cap Opportunities Fund:
We have audited the accompanying statement of assets and liabilities of Fidelity Small Cap Opportunities Fund (the Fund), a fund of Fidelity Securities Fund, including the schedule of investments as of July 31, 2007, and the related statement of operations, the statement of changes in net assets and the financial highlights for the period from March 22, 2007 (commencement of operations) to July 31, 2007. These financial statements and financial highlights are the responsibility of the Fund's management. Our responsibility is to express an opinion on these financial statements and financial highlights based on our audit.
We conducted our audit in accordance with standards of the Public Company Accounting Oversight Board (United States). Those standards require that we plan and perform the audit to obtain reasonable assurance about whether the financial statements and financial highlights are free of material misstatement. The Fund is not required to have, nor were we engaged to perform, an audit of its internal control over financial reporting. Our audit included consideration of internal control over financial reporting as a basis for designing audit procedures that are appropriate in the circumstances, but not for the purpose of expressing an opinion on the effectiveness of the Fund's internal control over financial reporting. Accordingly, we express no such opinion. An audit also includes examining, on a test basis, evidence supporting the amounts and disclosures in the financial statements, assessing the accounting principles used and significant estimates made by management, as well as evaluating the overall financial statement presentation. Our procedures included confirmation of securities owned as of July 31, 2007, by correspondence with the custodians and brokers; where replies were not received from brokers, we performed other auditing procedures. We believe that our audit provides a reasonable basis for our opinion.
In our opinion, the financial statements and financial highlights referred to above present fairly, in all material respects, the financial position of Fidelity Small Cap Opportunities Fund as of July 31, 2007, the results of its operations, the changes in its net assets and its financial highlights for the period from March 22, 2007 (commencement of operations) to July 31, 2007, in conformity with accounting principles generally accepted in the United States of America.
/s/ Deloitte & Touche LLP
DELOITTE & TOUCHE LLP
Boston, Massachusetts
September 17, 2007
Annual Report
Trustees and Officers
The Trustees, Members of the Advisory Board, and executive officers of the trust and fund, as applicable, are listed below. The Board of Trustees governs the fund and is responsible for protecting the interests of shareholders. The Trustees are experienced executives who meet periodically throughout the year to oversee the fund's activities, review contractual arrangements with companies that provide services to the fund, and review the fund's performance. Except for James C. Curvey, each of the Trustees oversees 353 funds advised by FMR or an affiliate. Mr. Curvey oversees 317 funds advised by FMR or an affiliate.
The Trustees hold office without limit in time except that (a) any Trustee may resign; (b) any Trustee may be removed by written instrument, signed by at least two-thirds of the number of Trustees prior to such removal; (c) any Trustee who requests to be retired or who has become incapacitated by illness or injury may be retired by written instrument signed by a majority of the other Trustees; and (d) any Trustee may be removed at any special meeting of shareholders by a two-thirds vote of the outstanding voting securities of the trust. Each Trustee who is not an interested person (as defined in the 1940 Act) (Independent Trustee), shall retire not later than the last day of the calendar year in which his or her 72nd birthday occurs. The Independent Trustees may waive this mandatory retirement age policy with respect to individual Trustees. The executive officers and Advisory Board Members hold office without limit in time, except that any officer and Advisory Board Member may resign or may be removed by a vote of a majority of the Trustees at any regular meeting or any special meeting of the Trustees. Except as indicated, each individual has held the office shown or other offices in the same company for the past five years.
The fund's Statement of Additional Information (SAI) includes more information about the Trustees. To request a free copy, call Fidelity at 1-800-544-8544.
Interested Trustees*:
Correspondence intended for each Trustee who is an interested person may be sent to Fidelity Investments, 82 Devonshire Street, Boston, Massachusetts 02109.
Name, Age; Principal Occupation |
Edward C. Johnson 3d (77) |
| Year of Election or Appointment: 1984 Mr. Johnson is Chairman of the Board of Trustees. Mr. Johnson serves as President (2006-present), Chief Executive Officer, Chairman, and a Director of FMR Corp.; Chairman and a Director of FMR; Chairman and a Director of Fidelity Research & Analysis Company (FRAC); Chairman and a Director of Fidelity Investments Money Management, Inc.; and Chairman (2001-present) and a Director of FMR Co., Inc. In addition, Mr. Johnson serves as Chairman and Director of Fidelity International Limited (FIL). |
James C. Curvey (72) |
| Year of Election or Appointment: 2007 Mr. Curvey also serves as Trustee (2007-present) or Member of the Advisory Board (2007-present) of other investment companies advised by FMR. Mr. Curvey is Vice Chairman (2006-present) and Director of FMR Corp. Mr. Curvey joined Fidelity in 1982 and served in numerous senior management positions, including President and Chief Operating Officer of FMR Corp. (1997-2000) and President of Fidelity Strategic Investments (2000-2002). In addition, he serves as a member of the Board of Directors of Geerlings & Wade, Inc. (wine distribution). |
* Trustees have been determined to be "Interested Trustees" by virtue of, among other things, their affiliation with the trust or various entities under common control with FMR.
Independent Trustees:
Correspondence intended for each Independent Trustee (that is, the Trustees other than the Interested Trustees) may be sent to Fidelity Investments, P.O. Box 55235, Boston, Massachusetts 02205-5235.
Name, Age; Principal Occupation |
Dennis J. Dirks (59) |
| Year of Election or Appointment: 2005 Prior to his retirement in May 2003, Mr. Dirks was Chief Operating Officer and a member of the Board of The Depository Trust & Clearing Corporation (DTCC) (1999-2003). He also served as President, Chief Operating Officer, and Board member of The Depository Trust Company (DTC) (1999-2003) and President and Board member of the National Securities Clearing Corporation (NSCC) (1999-2003). In addition, Mr. Dirks served as Chief Executive Officer and Board member of the Government Securities Clearing Corporation (2001-2003) and Chief Executive Officer and Board member of the Mortgage-Backed Securities Clearing Corporation (2001-2003). Mr. Dirks also serves as a Trustee and a member of the Finance Committee of Manhattan College (2005-present) and a Trustee and a member of the Finance Committee of AHRC of Nassau County (2006-present). |
Albert R. Gamper, Jr. (65) |
| Year of Election or Appointment: 2006 Prior to his retirement in December 2004, Mr. Gamper served as Chairman of the Board of CIT Group Inc. (commercial finance). During his tenure with CIT Group Inc. Mr. Gamper served in numerous senior management positions, including Chairman (1987-1989; 1999-2001; 2002-2004), Chief Executive Officer (1987-2004), and President (1989-2002). He currently serves as a member of the Board of Directors of Public Service Enterprise Group (utilities, 2001-present), Chairman of the Board of Governors, Rutgers University (2004-present), and Chairman of the Board of Saint Barnabas Health Care System. |
George H. Heilmeier (71) |
| Year of Election or Appointment: 2004 Dr. Heilmeier is Chairman Emeritus of Telcordia Technologies (communication software and systems), where prior to his retirement, he served as company Chairman and Chief Executive Officer. He currently serves on the Boards of Directors of The Mitre Corporation (systems engineering and information technology support for the government), and HRL Laboratories (private research and development, 2004-present). He is Chairman of the General Motors Science & Technology Advisory Board and a Life Fellow of the Institute of Electrical and Electronics Engineers (IEEE). Dr. Heilmeier is a member of the Defense Science Board and the National Security Agency Advisory Board. He is also a member of the National Academy of Engineering, the American Academy of Arts and Sciences, and the Board of Overseers of the School of Engineering and Applied Science of the University of Pennsylvania. Previously, Dr. Heilmeier served as a Director of TRW Inc. (automotive, space, defense, and information technology, 1992-2002), Compaq (1994-2002), Automatic Data Processing, Inc. (ADP) (technology-based business outsourcing, 1995-2002), INET Technologies Inc. (telecommunications network surveillance, 2001-2004), and Teletech Holdings (customer management services). He is the recipient of the 2005 Kyoto Prize in Advanced Technology for his invention of the liquid crystal display, and a member of the Consumer Electronics Hall of Fame. |
James H. Keyes (66) |
| Year of Election or Appointment: 2007 Prior to his retirement in 2003, Mr. Keyes was Chairman, President, and Chief Executive Officer of Johnson Controls, Inc. (automotive supplier, 1993-2003). He currently serves as a member of the boards of LSI Logic Corporation (semiconductor technologies), Navistar International Corporation (manufacture and sale of trucks, buses, and diesel engines, 2002-present), and Pitney Bowes, Inc. (integrated mail, messaging, and document management solutions). |
Marie L. Knowles (60) |
| Year of Election or Appointment: 2001 Prior to Ms. Knowles' retirement in June 2000, she served as Executive Vice President and Chief Financial Officer of Atlantic Richfield Company (ARCO) (diversified energy, 1996-2000). From 1993 to 1996, she was a Senior Vice President of ARCO and President of ARCO Transportation Company. She served as a Director of ARCO from 1996 to 1998. She currently serves as a Director of Phelps Dodge Corporation (copper mining and manufacturing) and McKesson Corporation (healthcare service, 2002-present). Ms. Knowles is a Trustee of the Brookings Institution and the Catalina Island Conservancy and also serves as a member of the Advisory Board for the School of Engineering of the University of Southern California. |
Ned C. Lautenbach (63) |
| Year of Election or Appointment: 2000 Mr. Lautenbach is Chairman of the Independent Trustees (2006-present). Mr. Lautenbach has been a partner of Clayton, Dubilier & Rice, Inc. (private equity investment firm) since September 1998. Previously, Mr. Lautenbach was with the International Business Machines Corporation (IBM) from 1968 until his retirement in 1998. Mr. Lautenbach serves as a Director of Sony Corporation (2006-present) and Eaton Corporation (diversified industrial) as well as the Philharmonic Center for the Arts in Naples, Florida. He also is a member of the Board of Trustees of Fairfield University (2005-present), as well as a member of the Council on Foreign Relations. |
Cornelia M. Small (63) |
| Year of Election or Appointment: 2005 Ms. Small is a member (2000-present) and Chairperson (2002-present) of the Investment Committee, and a member (2002-present) of the Board of Trustees of Smith College. Previously, she served as Chief Investment Officer (1999-2000), Director of Global Equity Investments (1996-1999), and a member of the Board of Directors of Scudder, Stevens & Clark (1990-1997) and Scudder Kemper Investments (1997-1999). In addition, Ms. Small served as Co-Chair (2000-2003) of the Annual Fund for the Fletcher School of Law and Diplomacy. |
William S. Stavropoulos (68) |
| Year of Election or Appointment: 2002 Mr. Stavropoulos is Chairman Emeritus of the Board of Directors of The Dow Chemical Company. Since joining The Dow Chemical Company in 1967, Mr. Stavropoulos served in numerous senior management positions, including President (1993-2000; 2002-2003), CEO (1995-2000; 2002-2004), and Chairman of the Executive Committee (2000-2004). Currently, he is a Director of NCR Corporation (data warehousing and technology solutions), Chemical Financial Corporation, Maersk Inc. (industrial conglomerate, 2002-present), Tyco International, Inc. (multinational manufacturing and services, 2007-present), and a member of the Advisory Board for Metalmark Capital (private equity investment firm, 2005-present). He is a special advisor to Clayton, Dubilier & Rice, Inc., a private equity investment firm. He also serves as a member of the Board of Trustees of the American Enterprise Institute for Public Policy Research. In addition, Mr. Stavropoulos is a member of The Business Council, J.P. Morgan International Council and the University of Notre Dame Advisory Council for the College of Science. |
Kenneth L. Wolfe (68) |
| Year of Election or Appointment: 2005 Prior to his retirement in 2001, Mr. Wolfe was Chairman and Chief Executive Officer of Hershey Foods Corporation (1993-2001). He currently serves as a member of the boards of Adelphia Communications Corporation (2003-present), Bausch & Lomb, Inc., and Revlon Inc. (2004-present). |
Advisory Board Members and Executive Officers:
Correspondence intended for Mr. Mauriello may be sent to Fidelity Investments, P.O. Box 55235, Boston, Massachusetts 02205-5235. Correspondence intended for each executive officer and Mr. Lynch may be sent to Fidelity Investments, 82 Devonshire Street, Boston, Massachusetts 02109.
Name, Age; Principal Occupation |
Peter S. Lynch (63) |
| Year of Election or Appointment: 2003 Member of the Advisory Board of Fidelity Securities Fund. Mr. Lynch is Vice Chairman and a Director of FMR, and Vice Chairman (2001-present) and a Director of FMR Co., Inc. Previously, Mr. Lynch served as a Trustee of the Fidelity funds (1990-2003). In addition, he serves as a Trustee of Boston College and as the Chairman of the Inner-City Scholarship Fund. |
Joseph Mauriello (62) |
| Year of Election or Appointment: 2007 Member of the Advisory Board of Fidelity Securities Fund. Prior to his retirement in January 2006, Mr. Mauriello served in numerous senior management positions including Deputy Chairman and Chief Operating Officer (2004-2005), and Vice Chairman of Financial Services (2002-2004) of KPMG LLP US (professional services firm, 1965-2005). Mr. Mauriello currently serves as a member of the Board of Directors of XL Capital Ltd., (global insurance and re-insurance company, 2006-present) and of Arcadia Resources Inc., (health care services and products, 2007-present). He also served as a Director of the Hamilton Funds of the Bank of New York (2006-2007). |
Kimberley H. Monasterio (43) |
| Year of Election or Appointment: 2007 President and Treasurer of Small Cap Opportunities. Ms. Monasterio also serves as President and Treasurer of other Fidelity funds (2007-present) and is an employee of FMR (2004-present). Previously, Ms. Monasterio served as Deputy Treasurer of the Fidelity funds (2004-2006). Before joining Fidelity Investments, Ms. Monasterio served as Treasurer (2000-2004) and Chief Financial Officer (2002-2004) of the Franklin Templeton Funds and Senior Vice President of Franklin Templeton Services, LLC (2000-2004). |
Dwight D. Churchill (53) |
| Year of Election or Appointment: 2007 Vice President of Small Cap Opportunities. Mr. Churchill also serves as Vice President of certain Equity Funds (2005-present). Mr. Churchill is Executive Vice President of FMR (2005-present) and FMR Co., Inc. (2005-present). Previously, Mr. Churchill served as Senior Vice President of Fidelity Investments Money Management, Inc. (2005-2006), Head of Fidelity's Fixed-Income Division (2000-2005), Vice President of Fidelity's Money Market Funds (2000-2005), Vice President of Fidelity's Bond Funds, and Senior Vice President of FMR. |
Bruce T. Herring (41) |
| Year of Election or Appointment: 2007 Vice President of Small Cap Opportunities. Mr. Herring also serves as Vice President of certain Equity Funds (2006-present). Mr. Herring is Senior Vice President of FMR (2006-present) and Vice President of FMR Co., Inc. (2001-present). Previously, Mr. Herring served as a portfolio manager for Fidelity U.S. Equity Funds (2001-2005). |
Lionel Harris (40) |
| Year of Election or Appointment: 2007 Vice President of Small Cap Opportunities. Mr. Harris also serves as Vice President of another fund advised by FMR. Prior to assuming his current responsibilities, Mr. Harris worked as a research analyst, high-income director of research, and portfolio manager. |
Eric D. Roiter (58) |
| Year of Election or Appointment: 2007 Secretary of Small Cap Opportunities. He also serves as Secretary of other Fidelity funds; Vice President, General Counsel, and Secretary of FMR Co., Inc. (2001-present) and FMR; Assistant Secretary of Fidelity Management & Research (U.K.) Inc. (2001-present), Fidelity Research & Analysis Company (2001-present), and Fidelity Investments Money Management, Inc. (2001-present). Mr. Roiter is an Adjunct Member, Faculty of Law, at Boston College Law School (2003-present). Previously, Mr. Roiter served as Vice President and Secretary of Fidelity Distributors Corporation (FDC) (1998-2005). |
Scott C. Goebel (39) |
| Year of Election or Appointment: 2007 Assistant Secretary of Small Cap Opportunities. Mr. Goebel also serves as Assistant Secretary of other Fidelity funds (2007-present), Vice President and Secretary of FDC (2006-present), and is an employee of FMR. |
R. Stephen Ganis (41) |
| Year of Election or Appointment: 2007 Anti-Money Laundering (AML) officer of Small Cap Opportunities. Mr. Ganis also serves as AML officer of other Fidelity funds (2006-present) and FMR Corp. (2003-present). Before joining Fidelity Investments, Mr. Ganis practiced law at Goodwin Procter, LLP (2000-2002). |
Joseph B. Hollis (59) |
| Year of Election or Appointment: 2007 Chief Financial Officer of Small Cap Opportunities. Mr. Hollis also serves as Chief Financial Officer of other Fidelity funds. Mr. Hollis is President of Fidelity Pricing and Cash Management Services (FPCMS) (2005-present). Mr. Hollis also serves as President and Director of Fidelity Service Company, Inc. (2006-present). Previously, Mr. Hollis served as Senior Vice President of Cash Management Services (1999-2002) and Investment Management Operations (2002-2005). |
Kenneth A. Rathgeber (60) |
| Year of Election or Appointment: 2007 Chief Compliance Officer of Small Cap Opportunities. Mr. Rathgeber also serves as Chief Compliance Officer of other Fidelity funds (2004-present) and Executive Vice President of Risk Oversight for Fidelity Investments (2002-present). He is Chief Compliance Officer of FMR (2005-present), FMR Co., Inc. (2005-present), Fidelity Management & Research (U.K.) Inc. (2005-present), Fidelity Research & Analysis Company (2005-present), Fidelity Investments Money Management, Inc. (2005-present), and Strategic Advisers, Inc. (2005-present). Previously, Mr. Rathgeber served as Executive Vice President and Chief Operating Officer for Fidelity Investments Institutional Services Company, Inc. (1998-2002). |
Bryan A. Mehrmann (46) |
| Year of Election or Appointment: 2007 Deputy Treasurer of Small Cap Opportunities. Mr. Mehrmann also serves as Deputy Treasurer of other Fidelity funds (2005-present) and is an employee of FMR. Previously, Mr. Mehrmann served as Vice President of Fidelity Investments Institutional Services Group (FIIS)/Fidelity Investments Institutional Operations Corporation, Inc. (FIIOC) Client Services (1998-2004). |
Kenneth B. Robins (37) |
| Year of Election or Appointment: 2007 Deputy Treasurer of Small Cap Opportunities. Mr. Robins also serves as Deputy Treasurer of other Fidelity funds (2005-present) and is an employee of FMR (2004-present). Before joining Fidelity Investments, Mr. Robins worked at KPMG LLP, where he was a partner in KPMG's department of professional practice (2002-2004) and a Senior Manager (1999-2000). In addition, Mr. Robins served as Assistant Chief Accountant, United States Securities and Exchange Commission (2000-2002). |
Robert G. Byrnes (40) |
| Year of Election or Appointment: 2007 Assistant Treasurer of Small Cap Opportunities. Mr. Byrnes also serves as Assistant Treasurer of other Fidelity funds (2005-present) and is an employee of FMR (2005-present). Previously, Mr. Byrnes served as Vice President of FPCMS (2003-2005). Before joining Fidelity Investments, Mr. Byrnes worked at Deutsche Asset Management where he served as Vice President of the Investment Operations Group (2000-2003). |
Peter L. Lydecker (53) |
| Year of Election or Appointment: 2007 Assistant Treasurer of Small Cap Opportunities. Mr. Lydecker also serves as Assistant Treasurer of other Fidelity funds (2004) and is an employee of FMR. |
Gary W. Ryan (48) |
| Year of Election or Appointment: 2007 Assistant Treasurer of Small Cap Opportunities. Mr. Ryan also serves as Assistant Treasurer of other Fidelity funds (2005-present) and is an employee of FMR (2005-present). Previously, Mr. Ryan served as Vice President of Fund Reporting in FPCMS (1999-2005). |
Annual Report
Distributions
The Board of Trustees of Fidelity Small Cap Opportunities Fund voted to pay on September 10, 2007, to shareholders of record at the opening of business on September 7, 2007, a distribution of $.02 per share derived from capital gains realized from sales of portfolio securities and a dividend of $.005 per share from net investment income.
Annual Report
Board Approval of Investment Advisory Contracts and Management Fees
Fidelity Small Cap Opportunities Fund
On January 18, 2007, the Board of Trustees, including the Independent Trustees (together, the Board), voted to approve the management contract and subadvisory agreements (together, the Advisory Contracts) for the fund. The Board, assisted by the advice of fund counsel and Independent Trustees' counsel, considered a broad range of information.
In determining whether to approve the Advisory Contracts for the fund, the Board was aware that shareholders have a broad range of investment choices available to them, including a wide choice among mutual funds offered by competitors to Fidelity, and that shareholders, with the opportunity to review and weigh the disclosure provided by the fund in its prospectus and other public disclosures, may choose to invest in this fund, managed by Fidelity.
Nature, Extent, and Quality of Services Provided. The Board considered staffing within the investment adviser, FMR, and the sub-advisers (together, the Investment Advisers), including the background of the fund's portfolio manager and the fund's investment objective and discipline.
Resources Dedicated to Investment Management and Support Services. The Board considered the size, education, and experience of the Investment Advisers' investment staff, their use of technology, and the Investment Advisers' approach to recruiting, training, and retaining portfolio managers and other research, advisory, and management personnel. The Board considered Fidelity's extensive global research capabilities that enable the Investment Advisers to aggregate data from various sources in an effort to produce positive investment results. The Board noted that Fidelity's analysts have access to a variety of technological tools that enable them to perform both fundamental and quantitative analysis and to specialize in various disciplines. The Board also considered that Fidelity's portfolio managers and analysts have access to daily portfolio attribution that allows for monitoring of a fund's portfolio, as well as an electronic communication system that provides immediate real-time access to research concerning issuers and credit enhancers.
Shareholder and Administrative Services. The Board considered the nature, extent, quality, and cost of administrative, distribution, and shareholder services performed by the Investment Advisers and their affiliates under the Advisory Contracts and under separate agreements covering transfer agency, pricing and bookkeeping, and securities lending services for the fund. The Board also considered the nature and extent of the Investment Advisers' supervision of third party service providers, principally custodians and subcustodians.
The Board noted that the growth of fund assets across the complex allows Fidelity to reinvest in the development of services designed to enhance the value or convenience of the Fidelity funds as investment vehicles. These services include 24-hour access to account information and market information through phone representatives and over the Internet, and investor education materials and asset allocation tools.
Annual Report
Investment in a Large Fund Family. The Board considered the benefits to shareholders of investing in a Fidelity fund, including the benefits of investing in a fund that is part of a large family of funds offering a variety of investment disciplines and providing for a large variety of mutual fund investor services. For example, fund shareholders are offered the privilege of exchanging shares of the fund for shares of other Fidelity funds, as set forth in the fund's prospectus, without paying an additional sales charge.
Investment Performance. Fidelity Small Cap Opportunities is a new fund and therefore had no historical performance for the Board to review at the time it approved the fund's Advisory Contracts. Once the fund has been in operation for at least one calendar year, the Board will review the fund's absolute investment performance for each class, as well as the fund's relative investment performance for each class measured against (i) a broad-based securities market index and (ii) a peer group of mutual funds deemed appropriate by the Board.
The Board considered that the fund's management fee is subject to upward or downward adjustment depending upon whether, and to what extent, the fund's investment performance for the performance period exceeds, or is exceeded by, the record (over the same period) of a Board-approved performance adjustment index. The Board realizes that the performance adjustment provides FMR with a strong economic incentive to seek to achieve superior performance for the fund's shareholders and helps to more closely align the interests of FMR and the fund's shareholders. The Board considered that the fund's performance adjustment fee is calculated based on the results of the retail class and does not take into account the performance of the Advisor classes. The Board considered FMR's belief that the retail class is the appropriate class on which to base the performance fee because: (i) the class does not have a 12b-1 fee; and (ii) distribution-related expenses should be excluded from the calculation because they are not related to evaluating an adviser's investment management skills.
Based on its review, the Board concluded that the nature, extent, and quality of the services provided to the fund will benefit the fund's shareholders, particularly in light of the Board's view that the fund's shareholders benefit from investing in a fund that is part of a large family of funds offering a variety of investment disciplines and services.
Competitiveness of Management Fee and Total Fund Expenses. The Board considered the fund's proposed management fee and projected operating expenses in reviewing the Advisory Contracts. The Board noted that the fund's management fee and projected expenses are comparable to those of similar funds that Fidelity offers to shareholders. The Board noted that the fund's proposed management fee rate is lower than the median fee rate of funds with similar Lipper investment objective categories and comparable management fee characteristics. The Board also considered that the projected total operating expenses are comparable to those of similar classes and funds that Fidelity offers to shareholders.
Annual Report
Board Approval of Investment Advisory Contracts and
Management Fees - continued
Based on its review, the Board concluded that the fund's management fee and the total expenses for each class of the fund were fair and reasonable in light of the services that the fund and its shareholders receive and the other factors considered.
Costs of the Services and Profitability. The fund is a new fund and therefore no revenue, cost, or profitability data was available for the Board to review in respect of the fund at the time it approved the Advisory Contracts. In connection with its future renewal of the fund's management contract and sub-advisory agreements, the Board will consider the revenues earned and the expenses incurred by Fidelity in conducting the business of developing, marketing, distributing, managing, administering and servicing the fund and its shareholders.
Economies of Scale. The Board considered the extent to which the fund will benefit from economies of scale through increased services to the fund, through waivers or reimbursements, or through fee or expense reductions, including reductions that occur through operation of the transfer agent agreement. The transfer agent fee varies in part based on the number of accounts in the fund. If the number of accounts decreases or the average account size increases, the overall transfer agent fee rate decreases.
The Board recognized that the fund's management contract incorporates a "group fee" structure, which provides for lower fee rates as total fund assets under FMR's management increase, and for higher fee rates as total fund assets under FMR's management decrease. The Board considered that the group fee is designed to deliver the benefits of economies of scale to fund shareholders when total fund assets increase, even if assets of any particular fund are unchanged or have declined, because some portion of Fidelity's costs are attributable to services provided to all Fidelity funds, and all funds benefit if those costs can be allocated among more assets.
The Board concluded that, given the group fee structure, fund shareholders will achieve a certain level of economies of scale as assets under FMR's management increase at the fund complex level, regardless of whether Fidelity achieves any such economies of scale.
Based on its evaluation of all of the conclusions noted above, and after considering all material factors, the Board ultimately concluded that the advisory fee structures are fair and reasonable, and that the fund's Advisory Contracts should be approved.
Annual Report
Managing Your Investments
Fidelity offers several ways to conveniently manage your personal investments via your telephone or PC. You can access your account information, conduct trades and research your investments 24 hours a day.
By Phone
Fidelity Automated Service Telephone provides a single toll-free number to access account balances, positions, quotes and trading. It's easy to navigate the service, and on your first call, the system will help you create a personal identification number (PIN) for security.
(phone_graphic)
Fidelity Automated
Service Telephone (FAST®)
1-800-544-5555
Press
1 For mutual fund and brokerage trading.
2 For quotes.*
3 For account balances and holdings.
4 To review orders and mutual
fund activity.
5 To change your PIN.
*0 To speak to a Fidelity representative.
By PC
Fidelity's web site on the Internet provides a wide range of information, including daily financial news, fund performance, interactive planning tools and news about Fidelity products and services.
(computer_graphic)
Fidelity's Web Site
www.fidelity.com
* When you call the quotes line, please remember that a fund's yield and return will vary and, except for money market funds, share price will also vary. This means that you may have a gain or loss when you sell your shares. There is no assurance that money market funds will be able to maintain a stable $1 share price; an investment in a money market fund is not insured or guaranteed by the U.S. government. Total returns are historical and include changes in share price, reinvestment of dividends and capital gains, and the effects of any sales charges.
Annual Report
To Visit Fidelity
For directions and hours,
please call 1-800-544-9797.
Arizona
7001 West Ray Road
Chandler, AZ
15445 N. Scottsdale Road
Scottsdale, AZ
California
815 East Birch Street
Brea, CA
1411 Chapin Avenue
Burlingame, CA
851 East Hamilton Avenue
Campbell, CA
19200 Von Karman Avenue
Irvine, CA
601 Larkspur Landing Circle
Larkspur, CA
10100 Santa Monica Blvd.
Los Angeles, CA
27101 Puerta Real
Mission Viejo, CA
73-575 El Paseo
Palm Desert, CA
251 University Avenue
Palo Alto, CA
123 South Lake Avenue
Pasadena, CA
16995 Bernardo Ctr. Drive
Rancho Bernardo, CA
1220 Roseville Parkway
Roseville, CA
1740 Arden Way
Sacramento, CA
7676 Hazard Center Drive
San Diego, CA
11943 El Camino Real
San Diego, CA
8 Montgomery Street
San Francisco, CA
3793 State Street
Santa Barbara, CA
1200 Wilshire Boulevard
Santa Monica, CA
21701 Hawthorne Boulevard
Torrance, CA
2001 North Main Street
Walnut Creek, CA
6300 Canoga Avenue
Woodland Hills, CA
Colorado
1625 Broadway
Denver, CO
9185 Westview Road
Lone Tree, CO
Connecticut
48 West Putnam Avenue
Greenwich, CT
265 Church Street
New Haven, CT
300 Atlantic Street
Stamford, CT
29 South Main Street
West Hartford, CT
Delaware
400 Delaware Avenue
Wilmington, DE
Florida
4400 N. Federal Highway
Boca Raton, FL
121 Alhambra Plaza
Coral Gables, FL
2948 N. Federal Highway
Ft. Lauderdale, FL
4671 Town Center Parkway
Jacksonville, FL
1907 West State Road 434
Longwood, FL
8880 Tamiami Trail, North
Naples, FL
3501 PGA Boulevard
Palm Beach Gardens, FL
3550 Tamiami Trail, South
Sarasota, FL
1502 N. Westshore Blvd.
Tampa, FL
2465 State Road 7
Wellington, FL
Georgia
3445 Peachtree Road, N.E.
Atlanta, GA
1000 Abernathy Road
Atlanta, GA
Illinois
One North LaSalle Street
Chicago, IL
875 North Michigan Ave.
Chicago, IL
1415 West 22nd Street
Oak Brook, IL
1572 East Golf Road
Schaumburg, IL
3232 Lake Avenue
Wilmette, IL
Indiana
4729 East 82nd Street
Indianapolis, IN
Kansas
5400 College Boulevard
Overland Park, KS
Maine
Three Canal Plaza
Portland, ME
Maryland
7315 Wisconsin Avenue
Bethesda, MD
One W. Pennsylvania Ave.
Towson, MD
Massachusetts
801 Boylston Street
Boston, MA
155 Congress Street
Boston, MA
300 Granite Street
Braintree, MA
44 Mall Road
Burlington, MA
238 Main Street
Cambridge, MA
405 Cochituate Road
Framingham, MA
416 Belmont Street
Worcester, MA
Annual Report
Michigan
500 E. Eisenhower Pkwy.
Ann Arbor, MI
280 Old N. Woodward Ave.
Birmingham, MI
43420 Grand River Avenue
Novi, MI
29155 Northwestern Hwy.
Southfield, MI
Minnesota
7600 France Avenue South
Edina, MN
Missouri
1524 South Lindbergh Blvd.
St. Louis, MO
Nevada
2225 Village Walk Drive
Henderson, NV
New Jersey
150 Essex Street
Millburn, NJ
56 South Street
Morristown, NJ
396 Route 17, North
Paramus, NJ
3518 Route 1 North
Princeton, NJ
530 Broad Street
Shrewsbury, NJ
New York
1055 Franklin Avenue
Garden City, NY
37 West Jericho Turnpike
Huntington Station, NY
1271 Avenue of the Americas
New York, NY
980 Madison Avenue
New York, NY
61 Broadway
New York, NY
350 Park Avenue
New York, NY
200 Fifth Avenue
New York, NY
733 Third Avenue
New York, NY
11 Penn Plaza
New York, NY
2070 Broadway
New York, NY
1075 Northern Blvd.
Roslyn, NY
799 Central Park Avenue
Scarsdale, NY
North Carolina
4611 Sharon Road
Charlotte, NC
7011 Fayetteville Road
Durham, NC
Ohio
3805 Edwards Road
Cincinnati, OH
1324 Polaris Parkway
Columbus, OH
28699 Chagrin Boulevard
Woodmere Village, OH
Oregon
7493 SW Bridgeport Road
Tigard, OR
Pennsylvania
600 West DeKalb Pike
King of Prussia, PA
1735 Market Street
Philadelphia, PA
12001 Perry Highway
Wexford, PA
Rhode Island
47 Providence Place
Providence, RI
Tennessee
6150 Poplar Avenue
Memphis, TN
Texas
10000 Research Boulevard
Austin, TX
4001 Northwest Parkway
Dallas, TX
12532 Memorial Drive
Houston, TX
2701 Drexel Drive
Houston, TX
6560 Fannin Street
Houston, TX
6500 N. MacArthur Blvd.
Irving, TX
6005 West Park Boulevard
Plano, TX
14100 San Pedro
San Antonio, TX
1576 East Southlake Blvd.
Southlake, TX
19740 IH 45 North
Spring, TX
Utah
279 West South Temple
Salt Lake City, UT
Virginia
1861 International Drive
McLean, VA
Washington
411 108th Avenue, N.E.
Bellevue, WA
1518 6th Avenue
Seattle, WA
Washington, DC
1900 K Street, N.W.
Washington, DC
Wisconsin
595 North Barker Road
Brookfield, WI
Fidelity Brokerage Services, Inc., 100 Summer St., Boston, MA 02110 Member NYSE/SIPC
Annual Report
To Write Fidelity
We'll give your correspondence immediate attention and send you written confirmation upon completion of your request.
(letter_graphic)
Making Changes
To Your Account
(such as changing name, address, bank, etc.)
Fidelity Investments
P.O. Box 770001
Cincinnati, OH 45277-0002
(letter_graphic)
For Non-Retirement
Accounts
Buying shares
Fidelity Investments
P.O. Box 770001
Cincinnati, OH 45277-0003
Overnight Express
Fidelity Investments
Attn: Distribution Services
100 Crosby Parkway - KC1H
Covington, KY 41015
Selling shares
Fidelity Investments
P.O. Box 770001
Cincinnati, OH 45277-0035
Overnight Express
Fidelity Investments
Attn: Distribution Services
100 Crosby Parkway - KC1H
Covington, KY 41015
General Correspondence
Fidelity Investments
P.O. Box 500
Merrimack, NH 03054-0500
(letter_graphic)
For Retirement
Accounts
Buying shares
Fidelity Investments
P.O. Box 770001
Cincinnati, OH 45277-0003
Selling shares
Fidelity Investments
P.O. Box 770001
Cincinnati, OH 45277-0035
Overnight Express
Fidelity Investments
Attn: Distribution Services
100 Crosby Parkway - KC1H
Covington, KY 41015
General Correspondence
Fidelity Investments
P.O. Box 500
Merrimack, NH 03054-0500
Annual Report
Annual Report
Investment Adviser
Fidelity Management & Research Company
Boston, MA
Investment Sub-Advisers
FMR Co., Inc.
Fidelity Management & Research (U.K.) Inc.
Fidelity Research & Analysis Company
Fidelity Investments Japan Limited
Fidelity International Investment Advisors
Fidelity International Investment Advisors (U.K.) Limited
General Distributor
Fidelity Distributors Corporation
Boston, MA
Transfer and Service Agent
Fidelity Service Company, Inc.
Boston, MA
Custodian
Citibank, N.A.
New York, NY
The Fidelity Telephone Connection
Mutual Fund 24-Hour Service
Exchanges/Redemptions
and Account Assistance 1-800-544-6666
Product Information 1-800-544-6666
Retirement Accounts 1-800-544-4774
(8 a.m. - 9 p.m.)
TDD Service 1-800-544-0118
for the deaf and hearing impaired
(9 a.m. - 9 p.m. Eastern time)
Fidelity Automated Service
Telephone (FAST®) (automated graphic) 1-800-544-5555
(automated graphic) Automated line for quickest service
SMO-ANN-0907
1.839807.100
(Fidelity Investment logo)(registered trademark)
Corporate Headquarters
82 Devonshire St., Boston, MA 02109
www.fidelity.com
Item 2. Code of Ethics
As of the end of the period, July 31, 2007, Fidelity Securities Fund (the trust) has adopted a code of ethics, as defined in Item 2 of Form N-CSR, that applies to its President and Treasurer and its Chief Financial Officer. A copy of the code of ethics is filed as an exhibit to this Form N-CSR.
Item 3. Audit Committee Financial Expert
The Board of Trustees of the trust has determined that Marie L. Knowles is an audit committee financial expert, as defined in Item 3 of Form N-CSR. Ms. Knowles is independent for purposes of Item 3 of Form N-CSR.
Item 4. Principal Accountant Fees and Services
(a) Audit Fees.
For the fiscal years ended July 31, 2007 and July 31, 2006, the aggregate Audit Fees billed by PricewaterhouseCoopers LLP (PwC) for professional services rendered for the audits of the financial statements, or services that are normally provided in connection with statutory and regulatory filings or engagements for those fiscal years, for Fidelity Blue Chip Value Fund, Fidelity Dividend Growth Fund, Fidelity Growth & Income Portfolio, Fidelity International Real Estate Fund, Fidelity Leveraged Company Stock Fund, Fidelity Small Cap Growth Fund and Fidelity Small Cap Value Fund (the funds) and for all funds in the Fidelity Group of Funds are shown in the table below.
Fund | 2007A | 2006A |
Fidelity Blue Chip Value Fund | $46,000 | $38,000 |
Fidelity Dividend Growth Fund | $98,000 | $102,000 |
Fidelity Growth & Income Portfolio | $150,000 | $168,000 |
Fidelity International Real Estate Fund | $55,000 | $51,000 |
Fidelity Leveraged Company Stock Fund | $59,000 | $54,000 |
Fidelity Small Cap Growth Fund | $46,000 | $37,000 |
Fidelity Small Cap Value Fund | $47,000 | $38,000 |
All funds in the Fidelity Group of Funds audited by PwC | $13,800,000 | $12,800,000 |
A | Aggregate amounts may reflect rounding. |
For the fiscal years ended July 31, 2007 and July 31, 2006, the aggregate Audit Fees billed by Deloitte & Touche LLP, the member firms of Deloitte Touche Tohmatsu, and their respective affiliates (collectively, "Deloitte Entities") for professional services rendered for the audits of the financial statements, or services that are normally provided in connection with statutory and regulatory filings or engagements for those fiscal years, for Fidelity Blue Chip Growth Fund, Fidelity OTC Portfolio, Fidelity Real Estate Income Fund and Fidelity Small Cap Opportunities Fund (the funds) and for all funds in the Fidelity Group of Funds are shown in the table below.
Fund | 2007A | 2006A,B |
Fidelity Blue Chip Growth Fund | $73,000 | $69,000 |
Fidelity OTC Portfolio | $54,000 | $48,000 |
Fidelity Real Estate Income Fund | $94,000 | $69,000 |
Fidelity Small Cap Opportunities Fund | $42,000 | $0 |
All funds in the Fidelity Group of Funds audited by Deloitte Entities | $7,100,000 | $5,900,000 |
A | Aggregate amounts may reflect rounding. |
B | No Audit Fees were billed by Deloitte Entities for professional services rendered for the audit of the annual financial statements, or services that are normally provided in connection with statutory and regulatory filings or engagements to Fidelity Small Cap Opportunities Fund, as the fund did not commence operations until March 22, 2007 . |
(b) Audit-Related Fees.
In each of the fiscal years ended July 31, 2007 and July 31, 2006, the aggregate Audit-Related Fees billed by PwC for services rendered for assurance and related services to each fund that are reasonably related to the performance of the audit or review of the fund's financial statements, but not reported as Audit Fees, are shown in the table below.
Fund | 2007A | 2006 A |
Fidelity Blue Chip Value Fund | $0 | $0 |
Fidelity Dividend Growth Fund | $0 | $0 |
Fidelity Growth & Income Portfolio | $0 | $0 |
Fidelity International Real Estate Fund | $0 | $0 |
Fidelity Leveraged Company Stock Fund | $0 | $0 |
Fidelity Small Cap Growth Fund | $0 | $0 |
Fidelity Small Cap Value Fund | $0 | $0 |
A | Aggregate amounts may reflect rounding. |
In each of the fiscal years ended July 31, 2007 and July 31, 2006, the aggregate Audit-Related Fees billed by Deloitte Entities for services rendered for assurance and related services to each fund that are reasonably related to the performance of the audit or review of the fund's financial statements, but not reported as Audit Fees, are shown in the table below.
Fund | 2007A | 2006 A,B |
Fidelity Blue Chip Growth Fund | $0 | $0 |
Fidelity OTC Portfolio | $0 | $0 |
Fidelity Real Estate Income Fund | $0 | $0 |
Fidelity Small Cap Opportunities Fund | $0 | $0 |
A | Aggregate amounts may reflect rounding. |
B | No Audit-Related Fees were billed by Deloitte Entities for services rendered for assurance and related services to Fidelity Small Cap Opportunities Fund, as the fund did not commence operations until March 22, 2007. |
In each of the fiscal years ended July 31, 2007 and July 31, 2006, the aggregate Audit-Related Fees that were billed by PwC and Deloitte Entities that were required to be approved by the Audit Committee for services rendered on behalf of Fidelity Management & Research Company (FMR) and entities controlling, controlled by, or under common control with FMR (not including any sub-adviser whose role is primarily portfolio management and is subcontracted with or overseen by another investment adviser) that provide ongoing services to the funds ("Fund Service Providers") for assurance and related services that relate directly to the operations and financial reporting of each fund that are reasonably related to the performance of the audit or review of the fund's financial statements, but not reported as Audit Fees, are shown in the table below.
Billed By | 2007 A | 2006A |
PwC | $0 | $0 |
Deloitte Entities | $0 | $0 |
A | Aggregate amounts may reflect rounding. |
Fees included in the audit-related category comprise assurance and related services (e.g., due diligence services) that are traditionally performed by the independent registered public accounting firm. These audit-related services include due diligence related to mergers and acquisitions, accounting consultations and audits in connection with acquisitions, internal control reviews, attest services that are not required by statute or regulation and consultation concerning financial accounting and reporting standards.
(c) Tax Fees.
In each of the fiscal years ended July 31, 2007 and July 31, 2006, the aggregate Tax Fees billed by PwC for professional services rendered for tax compliance, tax advice, and tax planning for each fund is shown in the table below.
Fund | 2007A | 2006A |
Fidelity Blue Chip Value Fund | $2,900 | $2,700 |
Fidelity Dividend Growth Fund | $2,900 | $2,700 |
Fidelity Growth & Income Portfolio | $4,800 | $4,600 |
Fidelity International Real Estate Fund | $2,900 | $2,700 |
Fidelity Leveraged Company Stock Fund | $2,900 | $2,700 |
Fidelity Small Cap Growth Fund | $2,900 | $2,700 |
Fidelity Small Cap Value Fund | $2,900 | $2,700 |
A | Aggregate amounts may reflect rounding. |
In each of the fiscal years ended July 31, 2007 and July 31, 2006, the aggregate Tax Fees billed by Deloitte Entities for professional services rendered for tax compliance, tax advice, and tax planning for each fund is shown in the table below.
Fund | 2007A | 2006A,B |
Fidelity Blue Chip Growth Fund | $4,200 | $4,500 |
Fidelity OTC Portfolio | $5,200 | $4,500 |
Fidelity Real Estate Income Fund | $5,200 | $4,000 |
Fidelity Small Cap Opportunities Fund | $4,200 | $0 |
A | Aggregate amounts may reflect rounding. |
B | No Tax Fees were billed by Deloitte Entities for services rendered for tax compliance, tax advice, and tax planning for Fidelity Small Cap Opportunities Fund as the fund did not commence operations until March 22, 2007. |
In each of the fiscal years ended July 31, 2007 and July 31, 2006, the aggregate Tax Fees billed by PwC and Deloitte Entities that were required to be approved by the Audit Committee for professional services rendered on behalf of the Fund Service Providers for tax compliance, tax advice, and tax planning that relate directly to the operations and financial reporting of each fund is shown in the table below.
Billed By | 2007A | 2006A |
PwC | $0 | $0 |
Deloitte Entities | $0 | $0 |
A | Aggregate amounts may reflect rounding. |
Fees included in the Tax Fees category comprise all services performed by professional staff in the independent registered public accounting firm's tax division except those services related to the audit. Typically, this category would include fees for tax compliance, tax planning, and tax advice. Tax compliance, tax advice, and tax planning services include preparation of original and amended tax returns, claims for refund and tax payment-planning services, assistance with tax audits and appeals, tax advice related to mergers and acquisitions and requests for rulings or technical advice from taxing authorities.
(d) All Other Fees.
In each of the fiscal years ended July 31, 2007 and July 31, 2006, the aggregate Other Fees billed by PwC for all other non-audit services rendered to the funds is shown in the table below.
Fund | 2007 | 2006A |
Fidelity Blue Chip Value Fund | $1,400 | $1,500 |
Fidelity Dividend Growth Fund | $11,800 | $15,600 |
Fidelity Growth & Income Portfolio | $19,900 | $27,900 |
Fidelity International Real Estate Fund | $1,800 | $1,600 |
Fidelity Leveraged Company Stock Fund | $4,600 | $4,500 |
Fidelity Small Cap Growth Fund | $1,600 | $1,700 |
Fidelity Small Cap Value Fund | $2,000 | $2,100 |
A | Aggregate amounts may reflect rounding. |
In each of the fiscal years ended July 31, 2007 and July 31, 2006, the aggregate Other Fees billed by Deloitte Entities for all other non-audit services rendered to the funds is shown in the table below.
Fund | 2007A | 2006A,B |
Fidelity Blue Chip Growth Fund | $0 | $0 |
Fidelity OTC Portfolio | $0 | $0 |
Fidelity Real Estate Income Fund | $0 | $0 |
Fidelity Small Cap Opportunities Fund | $0 | $0 |
A | Aggregate amounts may reflect rounding. |
B | No Other Fees were billed by Deloitte Entities for all other non-audit services rendered to Fidelity Small Cap Opportunities Fund as the fund did not commence operations until March 22, 2007. |
In each of the fiscal years ended July 31, 2007 and July 31, 2006, the aggregate Other Fees billed by PwC and Deloitte Entities that were required to be approved by the Audit Committee for all other non-audit services rendered on behalf of the Fund Service Providers that relate directly to the operations and financial reporting of each fund is shown in the table below.
Billed By | 2007A | 2006A |
PwC | $225,000 | $155,000 |
Deloitte Entities | $180,000 | $255,000 |
A | Aggregate amounts may reflect rounding. |
Fees included in the All Other Fees category include services related to internal control reviews, strategy and other consulting, financial information systems design and implementation, consulting on other information systems, and other tax services unrelated to the fund.
(e) (1) | Audit Committee Pre-Approval Policies and Procedures: |
The trust's Audit Committee must pre-approve all audit and non-audit services provided by the independent registered public accounting firm relating to the operations or financial reporting of the funds. Prior to the commencement of any audit or non-audit services to a fund, the Audit Committee reviews the services to determine whether they are appropriate and permissible under applicable law.
The trust's Audit Committee has adopted policies and procedures to, among other purposes, provide a framework for the Committee's consideration of non-audit services by the audit firms that audit the Fidelity funds. The policies and procedures require that any non-audit service provided by a fund audit firm to a Fidelity Fund and any non-audit service provided by a fund auditor to a Fund Service Provider that relates directly to the operations and financial reporting of a Fidelity fund (Covered Service) are subject to approval by the Audit Committee before such service is provided. Non-audit services provided by a fund audit firm for a Fund Service Provider that do not relate directly to the operations and financial reporting of a Fidelity fund (Non-Covered Service) but that are expected to exceed $50,000 are also subject to pre-approval by the Audit Committee.
All Covered Services, as well as Non-Covered Services that are expected to exceed $50,000, must be approved in advance of provision of the service either: (i) by formal resolution of the Audit Committee, or (ii) by oral or written approval of the service by the Chair of the Audit Committee (or if the Chair is unavailable, such other member of the Audit Committee as may be designated by the Chair to act in the Chair's absence). The approval contemplated by (ii) above is permitted where the Treasurer determines that action on such an engagement is necessary before the next meeting of the Audit Committee. Neither pre-approval nor advance notice of Non-Covered Service engagements for which fees are not expected to exceed $50,000 is required; such engagements are to be reported to the Audit Committee monthly.
(e) (2) | Services approved pursuant to paragraph (c)(7)(i)(C) of Rule 2-01 of Regulation S-X: |
Audit-Related Fees:
There were no amounts that were approved by the Audit Committee pursuant to the de minimis exception for the fiscal years ended July 31, 2007 and July 31, 2006 on behalf of each fund.
There were no amounts that were required to be approved by the Audit Committee pursuant to the de minimis exception for the fiscal years ended July 31, 2007 and July 31, 2006 on behalf of the Fund Service Providers that relate directly to the operations and financial reporting of each fund.
Tax Fees:
There were no amounts that were approved by the Audit Committee pursuant to the de minimis exception for the fiscal years ended July 31, 2007 and July 31, 2006 on behalf of each fund.
There were no amounts that were required to be approved by the Audit Committee pursuant to the de minimis exception for the fiscal years ended July 31, 2007 and July 31, 2006 on behalf of the Fund Service Providers that relate directly to the operations and financial reporting of each fund.
All Other Fees:
There were no amounts that were approved by the Audit Committee pursuant to the de minimis exception for the fiscal years ended July 31, 2007 and July 31, 2006 on behalf of each fund.
There were no amounts that were required to be approved by the Audit Committee pursuant to the de minimis exception for the fiscal years ended July 31, 2007 and July 31, 2006 on behalf of the Fund Service Providers that relate directly to the operations and financial reporting of each fund.
(f) Not applicable.
(g) For the fiscal years ended July 31, 2007 and July 31, 2006, the aggregate fees billed by PwC of $1,390,000A and $1,230,000A for non-audit services rendered on behalf of the funds, FMR (not including any sub-adviser whose role is primarily portfolio management and is subcontracted with or overseen by another investment adviser) and Fund Service Providers relating to Covered Services and Non-Covered Services are shown in the table below.
| 2007A | 2006A |
Covered Services | $290,000 | $230,000 |
Non-Covered Services | $1,100,000 | $1,000,000 |
A | Aggregate amounts may reflect rounding. |
For the fiscal years ended July 31, 2007 and July 31, 2006, the aggregate fees billed by Deloitte Entities of $575,000A and $640,000A for non-audit services rendered on behalf of the fund, FMR (not including any sub-adviser whose role is primarily portfolio management and is subcontracted with or overseen by another investment adviser) and Fund Service Providers relating to Covered Services and Non-Covered Services are shown in the table below.
| 2007A | 2006A |
Covered Services | $200,000 | $270,000 |
Non-Covered Services | $375,000 | $370,000 |
A | Aggregate amounts may reflect rounding. |
(h) The trust's Audit Committee has considered Non-Covered Services that were not pre-approved that were provided by PwC and Deloitte Entities to Fund Service Providers to be compatible with maintaining the independence of PwC and Deloitte Entities in their audit of the funds, taking into account representations from PwC and Deloitte Entities, in accordance with Independence Standards Board Standard No.1, regarding their independence from the funds and their related entities.
Item 5. Audit Committee of Listed Registrants
Not applicable.
Item 6. Schedule of Investments
Not applicable.
Item 7. Disclosure of Proxy Voting Policies and Procedures for Closed-End Management Investment Companies
Not applicable.
Item 8. Portfolio Managers of Closed-End Management Investment Companies
Not applicable.
Item 9. Purchase of Equity Securities by Closed-End Management Investment Company and Affiliated Purchasers
Not applicable.
Item 10. Submission of Matters to a Vote of Security Holders
There were no material changes to the procedures by which shareholders may recommend nominees to the trust's Board of Trustees.
Item 11. Controls and Procedures
(a)(i) The President and Treasurer and the Chief Financial Officer have concluded that the trust's disclosure controls and procedures (as defined in Rule 30a-3(c) under the Investment Company Act) provide reasonable assurances that material information relating to the trust is made known to them by the appropriate persons, based on their evaluation of these controls and procedures as of a date within 90 days of the filing date of this report.
(a)(ii) There was no change in the trust's internal control over financial reporting (as defined in Rule 30a-3(d) under the Investment Company Act) that occurred during the second fiscal quarter of the period covered by this report that has materially affected, or is reasonably likely to materially affect, the trust's internal control over financial reporting.
Item 12. Exhibits
(a) | (1) | Code of Ethics pursuant to Item 2 of Form N-CSR is filed and attached hereto as EX-99.CODE ETH. |
(a) | (2) | Certification pursuant to Rule 30a-2(a) under the Investment Company Act of 1940 (17 CFR 270.30a-2(a)) is filed and attached hereto as Exhibit 99.CERT. |
(a) | (3) | Not applicable. |
(b) | | Certification pursuant to Rule 30a-2(b) under the Investment Company Act of 1940 (17 CFR 270.30a-2(b)) is furnished and attached hereto as Exhibit 99.906CERT. |
SIGNATURES
Pursuant to the requirements of the Securities Exchange Act of 1934 and the Investment Company Act of 1940, the registrant has duly caused this report to be signed on its behalf by the undersigned, thereunto duly authorized.
Fidelity Securities Fund
By: | /s/ Kimberley Monasterio |
| Kimberley Monasterio |
| President and Treasurer |
| |
Date: | September 27, 2007 |
Pursuant to the requirements of the Securities Exchange Act of 1934 and the Investment Company Act of 1940, this report has been signed below by the following persons on behalf of the registrant and in the capacities and on the dates indicated.
By: | /s/ Kimberley Monasterio |
| Kimberley Monasterio |
| President and Treasurer |
| |
Date: | September 27, 2007 |
By: | /s/Joseph B. Hollis |
| Joseph B. Hollis |
| Chief Financial Officer |
| |
Date: | September 27, 2007 |