UNITED STATES
SECURITIES AND EXCHANGE COMMISSION
Washington, D.C. 20549
FORM N-CSR
CERTIFIED SHAREHOLDER REPORT OF REGISTERED
MANAGEMENT INVESTMENT COMPANIES
Investment Company Act file number 811-04118
Fidelity Securities Fund
(Exact name of registrant as specified in charter)
245 Summer St., Boston, MA 02210
(Address of principal executive offices) (Zip code)
Cynthia Lo Bessette, Secretary
245 Summer St.
Boston, Massachusetts 02210
(Name and address of agent for service)
Registrant's telephone number, including area code:
617-563-7000
Date of fiscal year end: | July 31 |
Date of reporting period: | January 31, 2023 |
Item 1.
Reports to Stockholders


Contents
Top Holdings (% of Fund's net assets) | ||
| Tempur Sealy International, Inc. | 3.2 | |
| TechnipFMC PLC | 2.4 | |
| KB Home | 2.3 | |
| Univar Solutions, Inc. | 2.2 | |
| FirstCash Holdings, Inc. | 2.2 | |
| Light & Wonder, Inc. Class A | 2.2 | |
| Insight Enterprises, Inc. | 2.1 | |
| U.S. Foods Holding Corp. | 2.1 | |
| Old Republic International Corp. | 1.9 | |
| Churchill Downs, Inc. | 1.9 | |
| 22.5 | ||
| Market Sectors (% of Fund's net assets) | ||
| Financials | 28.6 | |
| Consumer Discretionary | 16.0 | |
| Industrials | 15.1 | |
| Real Estate | 8.7 | |
| Information Technology | 6.7 | |
| Health Care | 6.5 | |
| Energy | 5.4 | |
| Materials | 5.3 | |
| Utilities | 3.1 | |
| Consumer Staples | 2.1 | |
| Communication Services | 1.7 | |
Asset Allocation (% of Fund's net assets) |
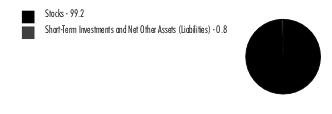 |
Foreign investments - 15.2% |
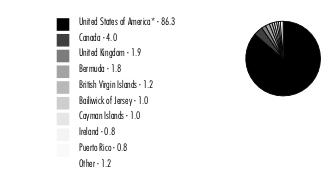
Geographic Diversification (% of Fund's net assets) |
 |
* Includes Short-Term investments and Net Other Assets (Liabilities). Percentages are based on country or territory of incorporation and are adjusted for the effect of derivatives, if applicable. |
| Common Stocks - 99.2% | |||
| Shares | Value ($) | ||
| COMMUNICATION SERVICES - 1.7% | |||
| Media - 1.7% | |||
| Nexstar Broadcasting Group, Inc. Class A | 426,800 | 87,395,836 | |
| CONSUMER DISCRETIONARY - 16.0% | |||
| Auto Components - 1.8% | |||
| Adient PLC (a) | 2,060,000 | 92,741,200 | |
| Hotels, Restaurants & Leisure - 5.5% | |||
| Brinker International, Inc. (a) | 1,860,036 | 73,397,021 | |
| Churchill Downs, Inc. | 397,700 | 98,669,370 | |
| Light & Wonder, Inc. Class A (a) | 1,735,200 | 113,221,800 | |
| 285,288,191 | |||
| Household Durables - 6.0% | |||
| KB Home | 3,065,000 | 117,849,250 | |
| Tempur Sealy International, Inc. | 4,095,000 | 166,871,248 | |
| Traeger, Inc. (a)(b)(c) | 6,605,000 | 23,976,150 | |
| 308,696,648 | |||
| Specialty Retail - 2.7% | |||
| Rent-A-Center, Inc. (b)(c) | 3,155,100 | 84,840,639 | |
| Williams-Sonoma, Inc. (b) | 430,100 | 58,037,694 | |
| 142,878,333 | |||
TOTAL CONSUMER DISCRETIONARY | 829,604,372 | ||
| CONSUMER STAPLES - 2.1% | |||
| Food & Staples Retailing - 2.1% | |||
| U.S. Foods Holding Corp. (a) | 2,830,000 | 107,907,900 | |
| ENERGY - 5.4% | |||
| Energy Equipment & Services - 2.4% | |||
| TechnipFMC PLC (a) | 9,000,000 | 125,010,000 | |
| Oil, Gas & Consumable Fuels - 3.0% | |||
| Antero Resources Corp. (a) | 737,000 | 21,255,080 | |
| Parkland Corp. | 1,750,000 | 41,114,577 | |
| Sitio Royalties Corp. | 3,546,403 | 94,227,928 | |
| 156,597,585 | |||
TOTAL ENERGY | 281,607,585 | ||
| FINANCIALS - 28.6% | |||
| Banks - 13.3% | |||
| BOK Financial Corp. | 440,000 | 44,220,000 | |
| Cadence Bank | 2,700,000 | 69,066,000 | |
| Comerica, Inc. | 608,300 | 44,594,473 | |
| Cullen/Frost Bankers, Inc. | 250,000 | 32,570,000 | |
| Eastern Bankshares, Inc. (b) | 5,870,100 | 94,919,517 | |
| First Foundation, Inc. | 2,280,975 | 35,423,542 | |
| First Interstate Bancsystem, Inc. | 1,300,000 | 46,644,000 | |
| Independent Bank Group, Inc. (b) | 1,141,196 | 69,955,315 | |
| Synovus Financial Corp. | 1,156,700 | 48,523,565 | |
| The Bank of NT Butterfield & Son Ltd. | 1,760,000 | 56,249,600 | |
| Trico Bancshares | 1,309,400 | 66,190,170 | |
| Webster Financial Corp. | 998,829 | 52,588,347 | |
| Western Alliance Bancorp. | 379,700 | 28,617,989 | |
| 689,562,518 | |||
| Capital Markets - 1.7% | |||
| AllianceBernstein Holding LP | 1,238,200 | 46,940,162 | |
| Lazard Ltd. Class A (b) | 1,029,300 | 41,254,344 | |
| 88,194,506 | |||
| Consumer Finance - 3.6% | |||
| Encore Capital Group, Inc. (a)(b)(c) | 1,250,200 | 69,661,144 | |
| FirstCash Holdings, Inc. | 1,237,300 | 114,054,314 | |
| 183,715,458 | |||
| Diversified Financial Services - 0.4% | |||
| ECN Capital Corp. | 9,283,651 | 20,373,726 | |
| Insurance - 9.6% | |||
| Assurant, Inc. | 541,800 | 71,837,262 | |
| Enstar Group Ltd. (a) | 271,049 | 65,675,173 | |
| First American Financial Corp. | 1,133,000 | 70,098,710 | |
| Old Republic International Corp. | 3,758,700 | 99,192,093 | |
| Primerica, Inc. (b) | 512,424 | 82,884,582 | |
| Reinsurance Group of America, Inc. | 348,200 | 52,846,314 | |
| Selective Insurance Group, Inc. | 580,000 | 55,100,000 | |
| 497,634,134 | |||
TOTAL FINANCIALS | 1,479,480,342 | ||
| HEALTH CARE - 6.5% | |||
| Biotechnology - 1.8% | |||
| ALX Oncology Holdings, Inc. (a) | 970,000 | 9,021,000 | |
| Blueprint Medicines Corp. (a) | 200,000 | 9,348,000 | |
| Celldex Therapeutics, Inc. (a) | 200,000 | 8,812,000 | |
| Cytokinetics, Inc. (a) | 175,000 | 7,434,000 | |
| Day One Biopharmaceuticals, Inc. (a) | 510,000 | 11,102,700 | |
| Exelixis, Inc. (a) | 720,000 | 12,686,400 | |
| Instil Bio, Inc. (a) | 534,701 | 435,193 | |
| Janux Therapeutics, Inc. (a) | 375,000 | 8,328,750 | |
| Keros Therapeutics, Inc. (a) | 265,000 | 15,521,050 | |
| Vaxcyte, Inc. (a) | 242,096 | 10,979,054 | |
| 93,668,147 | |||
| Health Care Equipment & Supplies - 1.5% | |||
| Envista Holdings Corp. (a) | 1,920,000 | 74,860,800 | |
| Health Care Providers & Services - 1.7% | |||
| Owens & Minor, Inc. | 2,689,000 | 53,080,860 | |
| Premier, Inc. | 1,000,000 | 33,360,000 | |
| 86,440,860 | |||
| Pharmaceuticals - 1.5% | |||
| Arvinas Holding Co. LLC (a) | 179,000 | 5,865,830 | |
| Edgewise Therapeutics, Inc. (a) | 600,000 | 6,138,000 | |
| Jazz Pharmaceuticals PLC (a) | 133,600 | 20,929,776 | |
| Prestige Brands Holdings, Inc. (a) | 710,000 | 46,689,600 | |
| 79,623,206 | |||
TOTAL HEALTH CARE | 334,593,013 | ||
| INDUSTRIALS - 15.1% | |||
| Aerospace & Defense - 1.3% | |||
| Curtiss-Wright Corp. | 407,000 | 67,480,600 | |
| Building Products - 3.1% | |||
| Builders FirstSource, Inc. (a)(b) | 1,200,000 | 95,640,000 | |
| Hayward Holdings, Inc. (a)(b) | 4,744,560 | 64,004,114 | |
| 159,644,114 | |||
| Commercial Services & Supplies - 0.4% | |||
| KAR Auction Services, Inc. (a)(b) | 1,350,600 | 19,664,736 | |
| Machinery - 2.6% | |||
| EnPro Industries, Inc. | 497,000 | 60,171,790 | |
| ITT, Inc. | 800,000 | 73,272,000 | |
| 133,443,790 | |||
| Professional Services - 4.3% | |||
| ASGN, Inc. (a) | 550,000 | 50,022,500 | |
| CACI International, Inc. Class A (a) | 145,000 | 44,673,050 | |
| First Advantage Corp. (a)(b) | 2,430,000 | 33,728,400 | |
| KBR, Inc. | 1,160,000 | 59,426,800 | |
| Science Applications International Corp. | 350,000 | 36,323,000 | |
| 224,173,750 | |||
| Trading Companies & Distributors - 3.4% | |||
| Beacon Roofing Supply, Inc. (a) | 1,111,000 | 63,193,680 | |
| Univar Solutions, Inc. (a) | 3,340,000 | 115,163,200 | |
| 178,356,880 | |||
TOTAL INDUSTRIALS | 782,763,870 | ||
| INFORMATION TECHNOLOGY - 6.7% | |||
| Electronic Equipment & Components - 3.8% | |||
| Insight Enterprises, Inc. (a) | 968,000 | 109,112,960 | |
| TD SYNNEX Corp. | 865,000 | 88,359,750 | |
| 197,472,710 | |||
| IT Services - 2.9% | |||
| Concentrix Corp. | 650,800 | 92,289,948 | |
| Genpact Ltd. | 1,250,000 | 59,100,000 | |
| 151,389,948 | |||
TOTAL INFORMATION TECHNOLOGY | 348,862,658 | ||
| MATERIALS - 5.3% | |||
| Chemicals - 2.3% | |||
| Tronox Holdings PLC | 2,125,000 | 36,443,750 | |
| Valvoline, Inc. | 2,170,800 | 79,581,528 | |
| 116,025,278 | |||
| Construction Materials - 1.6% | |||
| RHI Magnesita NV | 583,441 | 19,349,042 | |
| Summit Materials, Inc. | 1,932,300 | 63,495,378 | |
| 82,844,420 | |||
| Containers & Packaging - 1.4% | |||
| O-I Glass, Inc. (a) | 3,800,000 | 73,150,000 | |
TOTAL MATERIALS | 272,019,698 | ||
| REAL ESTATE - 8.7% | |||
| Equity Real Estate Investment Trusts (REITs) - 4.0% | |||
| Corporate Office Properties Trust (SBI) | 1,320,000 | 37,052,400 | |
| Douglas Emmett, Inc. | 3,078,000 | 51,556,500 | |
| LXP Industrial Trust (REIT) | 5,850,000 | 67,567,500 | |
| National Storage Affiliates Trust | 1,200,000 | 48,960,000 | |
| 205,136,400 | |||
| Real Estate Management & Development - 4.7% | |||
| Anywhere Real Estate, Inc. (a) | 4,133,900 | 35,055,472 | |
| Cushman & Wakefield PLC (a)(b) | 5,690,779 | 82,117,941 | |
| DIC Asset AG | 3,000,000 | 28,765,989 | |
| Jones Lang LaSalle, Inc. (a) | 525,000 | 97,056,750 | |
| 242,996,152 | |||
TOTAL REAL ESTATE | 448,132,552 | ||
| UTILITIES - 3.1% | |||
| Gas Utilities - 1.9% | |||
| Brookfield Infrastructure Corp. A Shares (b) | 2,167,850 | 95,862,327 | |
| Independent Power and Renewable Electricity Producers - 1.2% | |||
| NextEra Energy Partners LP | 841,600 | 61,689,280 | |
TOTAL UTILITIES | 157,551,607 | ||
| TOTAL COMMON STOCKS (Cost $4,541,188,592) | 5,129,919,433 | ||
| Money Market Funds - 6.9% | |||
| Shares | Value ($) | ||
| Fidelity Cash Central Fund 4.38% (d) | 44,170,984 | 44,179,818 | |
| Fidelity Securities Lending Cash Central Fund 4.38% (d)(e) | 312,064,418 | 312,095,624 | |
| TOTAL MONEY MARKET FUNDS (Cost $356,275,442) | 356,275,442 | ||
| TOTAL INVESTMENT IN SECURITIES - 106.1% (Cost $4,897,464,034) | 5,486,194,875 |
NET OTHER ASSETS (LIABILITIES) - (6.1)% | (314,474,207) |
| NET ASSETS - 100.0% | 5,171,720,668 |
| (a) | Non-income producing |
| (b) | Security or a portion of the security is on loan at period end. |
| (c) | Affiliated company |
| (d) | Affiliated fund that is generally available only to investment companies and other accounts managed by Fidelity Investments. The rate quoted is the annualized seven-day yield of the fund at period end. A complete unaudited listing of the fund's holdings as of its most recent quarter end is available upon request. In addition, each Fidelity Central Fund's financial statements are available on the SEC's website or upon request. |
| (e) | Investment made with cash collateral received from securities on loan. |
| Affiliate | Value, beginning of period ($) | Purchases ($) | Sales Proceeds ($) | Dividend Income ($) | Realized Gain (loss) ($) | Change in Unrealized appreciation (depreciation) ($) | Value, end of period ($) | % ownership, end of period |
| Fidelity Cash Central Fund 4.38% | 55,623,648 | 546,427,076 | 557,870,906 | 873,843 | - | - | 44,179,818 | 0.1% |
| Fidelity Securities Lending Cash Central Fund 4.38% | 261,350,857 | 521,674,941 | 470,930,174 | 250,500 | - | - | 312,095,624 | 1.0% |
| Total | 316,974,505 | 1,068,102,017 | 1,028,801,080 | 1,124,343 | - | - | 356,275,442 | |
| Affiliate | Value, beginning of period ($) | Purchases ($) | Sales Proceeds ($) | Dividend Income ($) | Realized Gain (loss) ($) | Change in Unrealized appreciation (depreciation) ($) | Value, end of period ($) |
| Brigham Minerals, Inc. Class A | 83,104,155 | - | 52,421,693 | 4,945,558 | - | (30,682,462) | - |
| Encore Capital Group, Inc. | 90,551,986 | - | - | - | - | (20,890,842) | 69,661,144 |
| Rent-A-Center, Inc. | 78,943,150 | - | 4,710,177 | 2,213,434 | (5,055,615) | 15,663,281 | 84,840,639 |
| Traeger, Inc. | 16,132,850 | 4,825,050 | - | - | - | 3,018,250 | 23,976,150 |
| Total | 268,732,141 | 4,825,050 | 57,131,870 | 7,158,992 | (5,055,615) | (32,891,773) | 178,477,933 |
| Valuation Inputs at Reporting Date: | ||||
| Description | Total ($) | Level 1 ($) | Level 2 ($) | Level 3 ($) |
Investments in Securities: | ||||
| Equities: | ||||
Communication Services | 87,395,836 | 87,395,836 | - | - |
Consumer Discretionary | 829,604,372 | 829,604,372 | - | - |
Consumer Staples | 107,907,900 | 107,907,900 | - | - |
Energy | 281,607,585 | 281,607,585 | - | - |
Financials | 1,479,480,342 | 1,479,480,342 | - | - |
Health Care | 334,593,013 | 334,593,013 | - | - |
Industrials | 782,763,870 | 782,763,870 | - | - |
Information Technology | 348,862,658 | 348,862,658 | - | - |
Materials | 272,019,698 | 272,019,698 | - | - |
Real Estate | 448,132,552 | 448,132,552 | - | - |
Utilities | 157,551,607 | 157,551,607 | - | - |
| Money Market Funds | 356,275,442 | 356,275,442 | - | - |
| Total Investments in Securities: | 5,486,194,875 | 5,486,194,875 | - | - |
| Statement of Assets and Liabilities | ||||
January 31, 2023 (Unaudited) | ||||
| Assets | ||||
| Investment in securities, at value (including securities loaned of $312,583,062) - See accompanying schedule: | ||||
Unaffiliated issuers (cost $4,358,859,399) | $ | 4,951,441,500 | ||
Fidelity Central Funds (cost $356,275,442) | 356,275,442 | |||
Other affiliated issuers (cost $182,329,193) | 178,477,933 | |||
| Total Investment in Securities (cost $4,897,464,034) | $ | 5,486,194,875 | ||
| Foreign currency held at value (cost $356,126) | 383,820 | |||
| Receivable for investments sold | 20,061 | |||
| Receivable for fund shares sold | 9,120,317 | |||
| Dividends receivable | 1,163,333 | |||
| Distributions receivable from Fidelity Central Funds | 203,215 | |||
| Prepaid expenses | 4,524 | |||
Total assets | 5,497,090,145 | |||
| Liabilities | ||||
| Payable for fund shares redeemed | $ | 9,018,780 | ||
| Accrued management fee | 3,394,930 | |||
| Distribution and service plan fees payable | 121,745 | |||
| Other affiliated payables | 703,567 | |||
| Other payables and accrued expenses | 40,412 | |||
| Collateral on securities loaned | 312,090,043 | |||
| Total Liabilities | 325,369,477 | |||
| Net Assets | $ | 5,171,720,668 | ||
| Net Assets consist of: | ||||
| Paid in capital | $ | 4,610,729,214 | ||
| Total accumulated earnings (loss) | 560,991,454 | |||
| Net Assets | $ | 5,171,720,668 | ||
| Net Asset Value and Maximum Offering Price | ||||
| Class A : | ||||
Net Asset Value and redemption price per share ($278,238,385 ÷ 14,690,790 shares) (a) | $ | 18.94 | ||
| Maximum offering price per share (100/94.25 of $18.94) | $ | 20.10 | ||
| Class M : | ||||
Net Asset Value and redemption price per share ($86,642,560 ÷ 4,766,902 shares) (a) | $ | 18.18 | ||
| Maximum offering price per share (100/96.50 of $18.18) | $ | 18.84 | ||
| Class C : | ||||
Net Asset Value and offering price per share ($39,660,400 ÷ 2,479,527 shares) (a) | $ | 16.00 | ||
| Small Cap Value : | ||||
Net Asset Value , offering price and redemption price per share ($2,755,984,763 ÷ 140,968,380 shares) | $ | 19.55 | ||
| Class I : | ||||
Net Asset Value , offering price and redemption price per share ($1,363,119,748 ÷ 69,726,041 shares) | $ | 19.55 | ||
| Class Z : | ||||
Net Asset Value , offering price and redemption price per share ($648,074,812 ÷ 33,121,604 shares) | $ | 19.57 | ||
(a)Redemption price per share is equal to net asset value less any applicable contingent deferred sales charge. | ||||
| Statement of Operations | ||||
Six months ended January 31, 2023 (Unaudited) | ||||
| Investment Income | ||||
| Dividends (including $7,158,992 earned from affiliated issuers) | $ | 40,365,478 | ||
| Income from Fidelity Central Funds (including $250,500 from security lending) | 1,124,343 | |||
| Total Income | 41,489,821 | |||
| Expenses | ||||
| Management fee | ||||
| Basic fee | $ | 16,063,318 | ||
| Performance adjustment | 3,462,491 | |||
| Transfer agent fees | 3,766,157 | |||
| Distribution and service plan fees | 706,900 | |||
| Accounting fees | 473,987 | |||
| Custodian fees and expenses | 18,601 | |||
| Independent trustees' fees and expenses | 8,222 | |||
| Registration fees | 176,885 | |||
| Audit | 31,979 | |||
| Legal | 3,462 | |||
| Miscellaneous | 14,265 | |||
| Total expenses before reductions | 24,726,267 | |||
| Expense reductions | (88,942) | |||
| Total expenses after reductions | 24,637,325 | |||
| Net Investment income (loss) | 16,852,496 | |||
| Realized and Unrealized Gain (Loss) | ||||
| Net realized gain (loss) on: | ||||
| Investment Securities: | ||||
| Unaffiliated issuers | 9,384,453 | |||
| Affiliated issuers | (5,055,615) | |||
| Foreign currency transactions | (1,988) | |||
| Total net realized gain (loss) | 4,326,850 | |||
| Change in net unrealized appreciation (depreciation) on: | ||||
| Investment Securities: | ||||
| Unaffiliated issuers | 257,524,881 | |||
| Affiliated issuers | (32,891,773) | |||
| Assets and liabilities in foreign currencies | 62,615 | |||
| Total change in net unrealized appreciation (depreciation) | 224,695,723 | |||
| Net gain (loss) | 229,022,573 | |||
| Net increase (decrease) in net assets resulting from operations | $ | 245,875,069 | ||
| Statement of Changes in Net Assets | ||||
Six months ended January 31, 2023 (Unaudited) | Year ended July 31, 2022 | |||
| Increase (Decrease) in Net Assets | ||||
| Operations | ||||
| Net investment income (loss) | $ | 16,852,496 | $ | 55,544,775 |
| Net realized gain (loss) | 4,326,850 | 374,457,965 | ||
| Change in net unrealized appreciation (depreciation) | 224,695,723 | (540,117,107) | ||
| Net increase (decrease) in net assets resulting from operations | 245,875,069 | (110,114,367) | ||
| Distributions to shareholders | (265,224,226) | (359,250,603) | ||
| Share transactions - net increase (decrease) | 251,522,272 | 1,138,061,901 | ||
| Total increase (decrease) in net assets | 232,173,115 | 668,696,931 | ||
| Net Assets | ||||
| Beginning of period | 4,939,547,553 | 4,270,850,622 | ||
| End of period | $ | 5,171,720,668 | $ | 4,939,547,553 |
| Fidelity Advisor® Small Cap Value Fund Class A |
Six months ended (Unaudited) January 31, 2023 | Years ended July 31, 2022 | 2021 | 2020 | 2019 | 2018 | |||||||
Selected Per-Share Data | ||||||||||||
| Net asset value, beginning of period | $ | 19.13 | $ | 21.03 | $ | 12.33 | $ | 14.68 | $ | 20.33 | $ | 19.05 |
| Income from Investment Operations | ||||||||||||
Net investment income (loss) A,B | .04 | .18 C | .09 D | .11 | .14 E | .10 F | ||||||
| Net realized and unrealized gain (loss) | .82 | (.41) | 8.66 | (1.96) | (.98) | 1.87 | ||||||
| Total from investment operations | .86 | (.23) | 8.75 | (1.85) | (.84) | 1.97 | ||||||
| Distributions from net investment income | - | (.39) | (.05) | (.09) | (.10) | (.17) | ||||||
| Distributions from net realized gain | (1.05) | (1.28) | - | (.41) | (4.71) | (.52) | ||||||
| Total distributions | (1.05) | (1.67) | (.05) | (.50) | (4.81) | (.69) | ||||||
Redemption fees added to paid in capital A | - | - | - | - | - | - G | ||||||
| Net asset value, end of period | $ | 18.94 | $ | 19.13 | $ | 21.03 | $ | 12.33 | $ | 14.68 | $ | 20.33 |
Total Return H,I,J | 4.90% | (1.50)% | 71.07% | (13.09)% | (4.85)% | 10.65% | ||||||
Ratios to Average Net Assets B,K,L | ||||||||||||
| Expenses before reductions | 1.29% M | 1.26% | 1.24% | 1.22% | .92% | 1.18% | ||||||
| Expenses net of fee waivers, if any | 1.28% M | 1.25% | 1.24% | 1.22% | .92% | 1.17% | ||||||
| Expenses net of all reductions | 1.28% M | 1.25% | 1.23% | 1.20% | .91% | 1.17% | ||||||
| Net investment income (loss) | .47% M | .90% C | .50% D | .84% | .91% E | .49% F | ||||||
| Supplemental Data | ||||||||||||
| Net assets, end of period (000 omitted) | $ | 278,238 | $ | 267,854 | $ | 232,920 | $ | 101,675 | $ | 129,115 | $ | 162,572 |
Portfolio turnover rate N | 17% M | 40% | 54% | 109% | 79% | 55% |
| Fidelity Advisor® Small Cap Value Fund Class M |
Six months ended (Unaudited) January 31, 2023 | Years ended July 31, 2022 | 2021 | 2020 | 2019 | 2018 | |||||||
Selected Per-Share Data | ||||||||||||
| Net asset value, beginning of period | $ | 18.42 | $ | 20.31 | $ | 11.93 | $ | 14.22 | $ | 19.84 | $ | 18.61 |
| Income from Investment Operations | ||||||||||||
Net investment income (loss) A,B | .02 | .13 C | .05 D | .08 | .10 E | .05 F | ||||||
| Net realized and unrealized gain (loss) | .79 | (.40) | 8.37 | (1.91) | (.96) | 1.82 | ||||||
| Total from investment operations | .81 | (.27) | 8.42 | (1.83) | (.86) | 1.87 | ||||||
| Distributions from net investment income | - | (.35) | (.04) | (.05) | (.05) | (.13) | ||||||
| Distributions from net realized gain | (1.05) | (1.28) | - | (.41) | (4.71) | (.52) | ||||||
| Total distributions | (1.05) | (1.62) G | (.04) | (.46) | (4.76) | (.64) G | ||||||
Redemption fees added to paid in capital A | - | - | - | - | - | - H | ||||||
| Net asset value, end of period | $ | 18.18 | $ | 18.42 | $ | 20.31 | $ | 11.93 | $ | 14.22 | $ | 19.84 |
Total Return I,J,K | 4.82% | (1.74)% | 70.63% | (13.29)% | (5.08)% | 10.39% | ||||||
Ratios to Average Net Assets B,L,M | ||||||||||||
| Expenses before reductions | 1.53% N | 1.50% | 1.48% | 1.46% | 1.17% | 1.42% | ||||||
| Expenses net of fee waivers, if any | 1.53% N | 1.49% | 1.48% | 1.46% | 1.17% | 1.42% | ||||||
| Expenses net of all reductions | 1.53% N | 1.49% | 1.47% | 1.44% | 1.16% | 1.41% | ||||||
| Net investment income (loss) | .22% N | .66% C | .26% D | .59% | .66% E | .25% F | ||||||
| Supplemental Data | ||||||||||||
| Net assets, end of period (000 omitted) | $ | 86,643 | $ | 81,790 | $ | 80,182 | $ | 38,049 | $ | 53,612 | $ | 69,380 |
Portfolio turnover rate O | 17% N | 40% | 54% | 109% | 79% | 55% |
| Fidelity Advisor® Small Cap Value Fund Class C |
Six months ended (Unaudited) January 31, 2023 | Years ended July 31, 2022 | 2021 | 2020 | 2019 | 2018 | |||||||
Selected Per-Share Data | ||||||||||||
| Net asset value, beginning of period | $ | 16.38 | $ | 18.25 | $ | 10.76 | $ | 12.91 | $ | 18.50 | $ | 17.39 |
| Income from Investment Operations | ||||||||||||
Net investment income (loss) A,B | (.02) | .03 C | (.04) D | .01 | .02 E | (.05) F | ||||||
| Net realized and unrealized gain (loss) | .69 | (.36) | 7.55 | (1.72) | (.89) | 1.71 | ||||||
| Total from investment operations | .67 | (.33) | 7.51 | (1.71) | (.87) | 1.66 | ||||||
| Distributions from net investment income | - | (.31) | (.02) | (.03) | (.02) | (.03) | ||||||
| Distributions from net realized gain | (1.05) | (1.24) | - | (.41) | (4.71) | (.52) | ||||||
| Total distributions | (1.05) | (1.54) G | (.02) | (.44) | (4.72) G | (.55) | ||||||
Redemption fees added to paid in capital A | - | - | - | - | - | - H | ||||||
| Net asset value, end of period | $ | 16.00 | $ | 16.38 | $ | 18.25 | $ | 10.76 | $ | 12.91 | $ | 18.50 |
Total Return I,J,K | 4.55% | (2.27)% | 69.84% | (13.74)% | (5.63)% | 9.84% | ||||||
Ratios to Average Net Assets B,L,M | ||||||||||||
| Expenses before reductions | 2.05% N | 2.02% | 2.01% | 2.00% | 1.68% | 1.93% | ||||||
| Expenses net of fee waivers, if any | 2.05% N | 2.01% | 2.01% | 1.99% | 1.68% | 1.93% | ||||||
| Expenses net of all reductions | 2.05% N | 2.01% | 2.00% | 1.97% | 1.67% | 1.92% | ||||||
| Net investment income (loss) | (.30)% N | .14% C | (.26)% D | .06% | .15% E | (.26)% F | ||||||
| Supplemental Data | ||||||||||||
| Net assets, end of period (000 omitted) | $ | 39,660 | $ | 38,832 | $ | 32,469 | $ | 13,748 | $ | 22,187 | $ | 44,396 |
Portfolio turnover rate O | 17% N | 40% | 54% | 109% | 79% | 55% |
| Fidelity® Small Cap Value Fund |
Six months ended (Unaudited) January 31, 2023 | Years ended July 31, 2022 | 2021 | 2020 | 2019 | 2018 | |||||||
Selected Per-Share Data | ||||||||||||
| Net asset value, beginning of period | $ | 19.69 | $ | 21.59 | $ | 12.64 | $ | 15.04 | $ | 20.71 | $ | 19.41 |
| Income from Investment Operations | ||||||||||||
Net investment income (loss) A,B | .07 | .24 C | .14 D | .15 | .18 E | .15 F | ||||||
| Net realized and unrealized gain (loss) | .84 | (.42) | 8.89 | (2.01) | (1.00) | 1.89 | ||||||
| Total from investment operations | .91 | (.18) | 9.03 | (1.86) | (.82) | 2.04 | ||||||
| Distributions from net investment income | - | (.44) | (.08) | (.12) | (.15) | (.22) | ||||||
| Distributions from net realized gain | (1.05) | (1.28) | - | (.41) | (4.71) | (.52) | ||||||
| Total distributions | (1.05) | (1.72) | (.08) | (.54) G | (4.85) G | (.74) | ||||||
Redemption fees added to paid in capital A | - | - | - | - | - | - H | ||||||
| Net asset value, end of period | $ | 19.55 | $ | 19.69 | $ | 21.59 | $ | 12.64 | $ | 15.04 | $ | 20.71 |
Total Return I,J | 5.02% | (1.23)% | 71.64% | (12.88)% | (4.58)% | 10.88% | ||||||
Ratios to Average Net Assets B,K,L | ||||||||||||
| Expenses before reductions | 1.03% M | .99% | .97% | .96% | .66% | .91% | ||||||
| Expenses net of fee waivers, if any | 1.02% M | .98% | .97% | .96% | .66% | .91% | ||||||
| Expenses net of all reductions | 1.02% M | .98% | .96% | .94% | .64% | .91% | ||||||
| Net investment income (loss) | .72% M | 1.17% C | .77% D | 1.10% | 1.17% E | .76% F | ||||||
| Supplemental Data | ||||||||||||
| Net assets, end of period (000 omitted) | $ | 2,755,985 | $ | 2,691,063 | $ | 2,715,703 | $ | 1,231,427 | $ | 1,611,032 | $ | 2,052,664 |
Portfolio turnover rate N | 17% M | 40% | 54% | 109% | 79% | 55% |
| Fidelity Advisor® Small Cap Value Fund Class I |
Six months ended (Unaudited) January 31, 2023 | Years ended July 31, 2022 | 2021 | 2020 | 2019 | 2018 | |||||||
Selected Per-Share Data | ||||||||||||
| Net asset value, beginning of period | $ | 19.69 | $ | 21.59 | $ | 12.65 | $ | 15.04 | $ | 20.72 | $ | 19.41 |
| Income from Investment Operations | ||||||||||||
Net investment income (loss) A,B | .07 | .24 C | .15 D | .15 | .18 E | .15 F | ||||||
| Net realized and unrealized gain (loss) | .84 | (.42) | 8.87 | (2.01) | (1.01) | 1.90 | ||||||
| Total from investment operations | .91 | (.18) | 9.02 | (1.86) | (.83) | 2.05 | ||||||
| Distributions from net investment income | - | (.44) | (.08) | (.12) | (.15) | (.22) | ||||||
| Distributions from net realized gain | (1.05) | (1.28) | - | (.41) | (4.71) | (.52) | ||||||
| Total distributions | (1.05) | (1.72) | (.08) | (.53) | (4.85) G | (.74) | ||||||
Redemption fees added to paid in capital A | - | - | - | - | - | - H | ||||||
| Net asset value, end of period | $ | 19.55 | $ | 19.69 | $ | 21.59 | $ | 12.65 | $ | 15.04 | $ | 20.72 |
Total Return I,J | 5.02% | (1.22)% | 71.55% | (12.82)% | (4.63)% | 10.93% | ||||||
Ratios to Average Net Assets B,K,L | ||||||||||||
| Expenses before reductions | 1.02% M | .99% | .97% | .95% | .66% | .91% | ||||||
| Expenses net of fee waivers, if any | 1.02% M | .99% | .97% | .95% | .66% | .91% | ||||||
| Expenses net of all reductions | 1.02% M | .99% | .96% | .93% | .65% | .90% | ||||||
| Net investment income (loss) | .73% M | 1.17% C | .77% D | 1.10% | 1.17% E | .76% F | ||||||
| Supplemental Data | ||||||||||||
| Net assets, end of period (000 omitted) | $ | 1,363,120 | $ | 1,319,154 | $ | 845,012 | $ | 214,538 | $ | 243,571 | $ | 459,332 |
Portfolio turnover rate N | 17% M | 40% | 54% | 109% | 79% | 55% |
| Fidelity Advisor® Small Cap Value Fund Class Z |
Six months ended (Unaudited) January 31, 2023 | Years ended July 31, 2022 | 2021 | 2020 | 2019 A | ||||||
Selected Per-Share Data | ||||||||||
| Net asset value, beginning of period | $ | 19.69 | $ | 21.59 | $ | 12.65 | $ | 15.05 | $ | 16.90 |
| Income from Investment Operations | ||||||||||
Net investment income (loss) B,C | .08 | .27 D | .17 E | .17 | (.08) F | |||||
| Net realized and unrealized gain (loss) | .85 | (.43) | 8.87 | (2.01) | (.66) | |||||
| Total from investment operations | .93 | (.16) | 9.04 | (1.84) | (.74) | |||||
| Distributions from net investment income | - | (.47) | (.10) | (.15) | (.09) | |||||
| Distributions from net realized gain | (1.05) | (1.28) | - | (.41) | (1.02) | |||||
| Total distributions | (1.05) | (1.74) G | (.10) | (.56) | (1.11) | |||||
| Net asset value, end of period | $ | 19.57 | $ | 19.69 | $ | 21.59 | $ | 12.65 | $ | 15.05 |
Total Return H,I | 5.13% | (1.11)% | 71.75% | (12.73)% | (3.75)% | |||||
Ratios to Average Net Assets C,J,K | ||||||||||
| Expenses before reductions | .90% L | .86% | .84% | .81% | .52% L | |||||
| Expenses net of fee waivers, if any | .89% L | .86% | .84% | .81% | .52% L | |||||
| Expenses net of all reductions | .89% L | .86% | .83% | .79% | .51% L | |||||
| Net investment income (loss) | .86% L | 1.30% D | .90% E | 1.25% | (.63)% F,L | |||||
| Supplemental Data | ||||||||||
| Net assets, end of period (000 omitted) | $ | 648,075 | $ | 540,854 | $ | 364,564 | $ | 93,849 | $ | 26,006 |
Portfolio turnover rate M | 17% L | 40% | 54% | 109% | 79% L |
| Fidelity Central Fund | Investment Manager | Investment Objective | Investment Practices | Expense Ratio A |
| Fidelity Money Market Central Funds | Fidelity Management & Research Company LLC (FMR) | Each fund seeks to obtain a high level of current income consistent with the preservation of capital and liquidity. | Short-term Investments | Less than .005% |
| Gross unrealized appreciation | $946,260,576 |
| Gross unrealized depreciation | (358,752,363) |
| Net unrealized appreciation (depreciation) | $587,508,213 |
| Tax cost | $4,898,686,662 |
| Purchases ($) | Sales ($) | |
| Fidelity Small Cap Value Fund | 432,128,653 | 390,384,737 |
| Distribution Fee | Service Fee | Total Fees | Retained by FDC | |
| Class A | - % | .25% | $320,767 | $14,691 |
| Class M | .25% | .25% | 198,124 | - |
| Class C | .75% | .25% | 188,009 | 57,144 |
| $706,900 | $71,835 |
| Retained by FDC | |
| Class A | $39,822 |
| Class M | 1,735 |
Class C A | 518 |
| $42,075 |
| Amount | % of Class-Level Average Net Assets A | |
| Class A | $234,682 | .18 |
| Class M | 71,013 | .18 |
| Class C | 37,098 | .20 |
| Small Cap Value | 2,242,092 | .17 |
| Class I | 1,063,286 | .17 |
| Class Z | 117,986 | .04 |
| $3,766,157 |
| % of Average Net Assets | |
| Fidelity Small Cap Value Fund | .02 |
| Amount | |
| Fidelity Small Cap Value Fund | $20,466 |
| Purchases ($) | Sales ($) | Realized Gain (Loss) ($) | |
| Fidelity Small Cap Value Fund | 43,090,858 | 16,230,582 | (11,131,480) |
| Amount | |
| Fidelity Small Cap Value Fund | $6,360 |
| Total Security Lending Fees Paid to NFS | Security Lending Income From Securities Loaned to NFS | Value of Securities Loaned to NFS at Period End | |
| Fidelity Small Cap Value Fund | $25,972 | $1 | $- |
| Expense reduction | |
| Class M | $40 |
Six months ended January 31, 2023 | Year ended July 31, 2022 | |
| Fidelity Small Cap Value Fund | ||
| Distributions to shareholders | ||
| Class A | $14,784,241 | $19,708,729 |
| Class M | 4,753,937 | 6,431,794 |
| Class C | 2,573,149 | 2,894,329 |
| Small Cap Value | 143,553,970 | 219,284,330 |
| Class I | 70,449,681 | 78,004,957 |
| Class Z | 29,109,248 | 32,926,464 |
Total | $265,224,226 | $359,250,603 |
| Shares | Shares | Dollars | Dollars | |
Six months ended January 31, 2023 | Year ended July 31, 2022 | Six months ended January 31, 2023 | Year ended July 31, 2022 | |
| Fidelity Small Cap Value Fund | ||||
| Class A | ||||
| Shares sold | 1,601,791 | 5,298,721 | $28,299,466 | $108,496,696 |
| Reinvestment of distributions | 821,346 | 931,850 | 14,511,110 | 19,175,840 |
| Shares redeemed | (1,733,827) | (3,305,265) | (30,390,777) | (66,717,629) |
| Net increase (decrease) | 689,310 | 2,925,306 | $12,419,799 | $60,954,907 |
| Class M | ||||
| Shares sold | 509,240 | 1,378,126 | $8,690,308 | $27,066,436 |
| Reinvestment of distributions | 277,763 | 320,905 | 4,713,039 | 6,377,160 |
| Shares redeemed | (459,436) | (1,207,147) | (7,700,083) | (23,647,044) |
| Net increase (decrease) | 327,567 | 491,884 | $5,703,264 | $9,796,552 |
| Class C | ||||
| Shares sold | 352,099 | 1,199,095 | $5,284,731 | $21,139,005 |
| Reinvestment of distributions | 162,730 | 159,909 | 2,435,861 | 2,839,061 |
| Shares redeemed | (405,632) | (768,069) | (5,926,317) | (13,253,131) |
| Net increase (decrease) | 109,197 | 590,935 | $1,794,275 | $10,724,935 |
| Small Cap Value | ||||
| Shares sold | 14,282,318 | 47,561,130 | $258,858,279 | $1,004,315,420 |
| Reinvestment of distributions | 7,490,939 | 9,867,950 | 136,467,165 | 208,631,722 |
| Shares redeemed | (17,488,326) | (46,550,420) | (315,919,467) | (975,621,735) |
| Net increase (decrease) | 4,284,931 | 10,878,660 | $79,405,977 | $237,325,407 |
| Class I | ||||
| Shares sold | 18,780,867 | 50,555,646 | $340,932,726 | $1,058,311,814 |
| Reinvestment of distributions | 3,613,120 | 3,478,382 | 65,821,608 | 73,471,142 |
| Shares redeemed | (19,673,657) | (26,168,822) | (354,582,242) | (534,982,261) |
| Net increase (decrease) | 2,720,330 | 27,865,206 | $52,172,092 | $596,800,695 |
| Class Z | ||||
| Shares sold | 9,206,484 | 17,011,053 | $164,862,530 | $355,253,994 |
| Reinvestment of distributions | 1,366,081 | 1,279,957 | 24,883,951 | 27,023,961 |
| Shares redeemed | (4,918,002) | (7,709,768) | (89,719,616) | (159,818,550) |
| Net increase (decrease) | 5,654,563 | 10,581,242 | $100,026,865 | $222,459,405 |
| The Example is based on an investment of $1,000 invested at the beginning of the period and held for the entire period (August 1, 2022 to January 31, 2023). |
Annualized Expense Ratio- A | Beginning Account Value August 1, 2022 | Ending Account Value January 31, 2023 | Expenses Paid During Period- C August 1, 2022 to January 31, 2023 | |||||||
| Fidelity® Small Cap Value Fund | ||||||||||
| Class A | 1.28% | |||||||||
| Actual | $ 1,000 | $ 1,049.00 | $ 6.61 | |||||||
Hypothetical- B | $ 1,000 | $ 1,018.75 | $ 6.51 | |||||||
| Class M | 1.53% | |||||||||
| Actual | $ 1,000 | $ 1,048.20 | $ 7.90 | |||||||
Hypothetical- B | $ 1,000 | $ 1,017.49 | $ 7.78 | |||||||
| Class C | 2.05% | |||||||||
| Actual | $ 1,000 | $ 1,045.50 | $ 10.57 | |||||||
Hypothetical- B | $ 1,000 | $ 1,014.87 | $ 10.41 | |||||||
| Fidelity® Small Cap Value Fund | 1.02% | |||||||||
| Actual | $ 1,000 | $ 1,050.20 | $ 5.27 | |||||||
Hypothetical- B | $ 1,000 | $ 1,020.06 | $ 5.19 | |||||||
| Class I | 1.02% | |||||||||
| Actual | $ 1,000 | $ 1,050.20 | $ 5.27 | |||||||
Hypothetical- B | $ 1,000 | $ 1,020.06 | $ 5.19 | |||||||
| Class Z | .89% | |||||||||
| Actual | $ 1,000 | $ 1,051.30 | $ 4.60 | |||||||
Hypothetical- B | $ 1,000 | $ 1,020.72 | $ 4.53 | |||||||
- Highly liquid investments - cash or convertible to cash within three business days or less
- Moderately liquid investments - convertible to cash in three to seven calendar days
- Less liquid investments - can be sold or disposed of, but not settled, within seven calendar days
- Illiquid investments - cannot be sold or disposed of within seven calendar days
|


Contents
Top Holdings (% of Fund's net assets) | ||
| Academy Sports & Outdoors, Inc. | 1.6 | |
| Commercial Metals Co. | 1.5 | |
| Denbury, Inc. | 1.5 | |
| Atkore, Inc. | 1.5 | |
| ExlService Holdings, Inc. | 1.4 | |
| Northern Oil & Gas, Inc. | 1.3 | |
| Brookfield Infrastructure Corp. A Shares | 1.1 | |
| SPX Technologies, Inc. | 1.1 | |
| Axcelis Technologies, Inc. | 1.1 | |
| WNS Holdings Ltd. sponsored ADR | 1.0 | |
| 13.1 | ||
| Market Sectors (% of Fund's net assets) | ||
| Industrials | 17.5 | |
| Financials | 15.5 | |
| Health Care | 15.3 | |
| Consumer Discretionary | 12.8 | |
| Information Technology | 12.7 | |
| Energy | 7.2 | |
| Materials | 5.5 | |
| Real Estate | 5.4 | |
| Consumer Staples | 3.5 | |
| Utilities | 2.1 | |
| Communication Services | 1.6 | |
Asset Allocation (% of Fund's net assets) |
 |
Foreign investments - 13.7% |
Geographic Diversification (% of Fund's net assets) |
 |
* Includes Short-Term investments and Net Other Assets (Liabilities). Percentages are based on country or territory of incorporation and are adjusted for the effect of derivatives, if applicable. |
| Common Stocks - 98.9% | |||
| Shares | Value ($) | ||
| COMMUNICATION SERVICES - 1.6% | |||
| Interactive Media & Services - 0.3% | |||
| Ziff Davis, Inc. (a) | 173,300 | 15,506,884 | |
| Media - 1.2% | |||
| Nexstar Broadcasting Group, Inc. Class A | 133,600 | 27,357,272 | |
| TechTarget, Inc. (a) | 302,329 | 14,974,355 | |
| Thryv Holdings, Inc. (a)(b) | 697,500 | 15,603,075 | |
| 57,934,702 | |||
| Wireless Telecommunication Services - 0.1% | |||
| Gogo, Inc. (a) | 371,100 | 6,223,347 | |
TOTAL COMMUNICATION SERVICES | 79,664,933 | ||
| CONSUMER DISCRETIONARY - 12.8% | |||
| Auto Components - 2.5% | |||
| Adient PLC (a) | 880,500 | 39,640,110 | |
| Fox Factory Holding Corp. (a) | 275,079 | 32,484,079 | |
| Gentherm, Inc. (a) | 105,300 | 7,837,479 | |
| LCI Industries (b) | 188,900 | 21,198,358 | |
| Patrick Industries, Inc. | 298,000 | 21,149,060 | |
| 122,309,086 | |||
| Diversified Consumer Services - 0.4% | |||
| Laureate Education, Inc. Class A | 1,052,420 | 11,555,572 | |
| Strategic Education, Inc. | 110,500 | 10,315,175 | |
| 21,870,747 | |||
| Hotels, Restaurants & Leisure - 2.1% | |||
| Brinker International, Inc. (a) | 567,725 | 22,402,429 | |
| Churchill Downs, Inc. | 186,800 | 46,345,080 | |
| Everi Holdings, Inc. (a) | 724,800 | 12,589,776 | |
| Hilton Grand Vacations, Inc. (a) | 419,300 | 19,858,048 | |
| 101,195,333 | |||
| Household Durables - 1.5% | |||
| Green Brick Partners, Inc. (a) | 165,088 | 5,150,746 | |
| M.D.C. Holdings, Inc. | 349,550 | 13,199,008 | |
| Skyline Champion Corp. (a) | 594,798 | 35,063,342 | |
| Tempur Sealy International, Inc. | 525,600 | 21,418,200 | |
| 74,831,296 | |||
| Internet & Direct Marketing Retail - 0.3% | |||
| Vivid Seats, Inc. Class A (a)(b) | 1,715,316 | 14,597,339 | |
| Leisure Products - 0.5% | |||
| Acushnet Holdings Corp. (b) | 245,000 | 11,502,750 | |
| Clarus Corp. | 1,311,984 | 13,185,439 | |
| 24,688,189 | |||
| Specialty Retail - 3.2% | |||
| Academy Sports & Outdoors, Inc. (b) | 1,364,072 | 79,689,084 | |
| Dick's Sporting Goods, Inc. | 196,950 | 25,753,182 | |
| Murphy U.S.A., Inc. | 156,391 | 42,543,044 | |
| Rent-A-Center, Inc. | 342,052 | 9,197,778 | |
| 157,183,088 | |||
| Textiles, Apparel & Luxury Goods - 2.3% | |||
| Capri Holdings Ltd. (a) | 366,300 | 24,355,287 | |
| Crocs, Inc. (a) | 356,600 | 43,423,182 | |
| Deckers Outdoor Corp. (a) | 43,700 | 18,680,876 | |
| Kontoor Brands, Inc. (b) | 586,000 | 27,987,360 | |
| 114,446,705 | |||
TOTAL CONSUMER DISCRETIONARY | 631,121,783 | ||
| CONSUMER STAPLES - 3.5% | |||
| Beverages - 0.5% | |||
| Primo Water Corp. | 1,583,700 | 24,784,905 | |
| Food & Staples Retailing - 1.5% | |||
| BJ's Wholesale Club Holdings, Inc. (a) | 450,917 | 32,677,955 | |
| Performance Food Group Co. (a) | 450,400 | 27,618,528 | |
| Sprouts Farmers Market LLC (a) | 430,400 | 13,751,280 | |
| 74,047,763 | |||
| Food Products - 1.2% | |||
| Flowers Foods, Inc. | 373,700 | 10,347,753 | |
| Nomad Foods Ltd. (a) | 1,981,978 | 35,259,389 | |
| The Simply Good Foods Co. (a) | 418,300 | 15,184,290 | |
| 60,791,432 | |||
| Personal Products - 0.3% | |||
| BellRing Brands, Inc. (a) | 511,733 | 14,512,748 | |
TOTAL CONSUMER STAPLES | 174,136,848 | ||
| ENERGY - 7.2% | |||
| Energy Equipment & Services - 2.1% | |||
| Championx Corp. | 780,300 | 25,765,506 | |
| Liberty Oilfield Services, Inc. Class A | 2,940,654 | 46,550,553 | |
| TechnipFMC PLC (a) | 2,250,100 | 31,253,889 | |
| 103,569,948 | |||
| Oil, Gas & Consumable Fuels - 5.1% | |||
| Antero Resources Corp. (a) | 1,491,226 | 43,006,958 | |
| Denbury, Inc. (a) | 868,900 | 75,403,142 | |
| Enviva, Inc. (b) | 221,260 | 10,062,905 | |
| HF Sinclair Corp. | 602,890 | 34,304,441 | |
| Magnolia Oil & Gas Corp. Class A | 995,100 | 23,494,311 | |
| Northern Oil & Gas, Inc. (b) | 1,840,545 | 61,695,068 | |
| 247,966,825 | |||
TOTAL ENERGY | 351,536,773 | ||
| FINANCIALS - 15.5% | |||
| Banks - 8.4% | |||
| East West Bancorp, Inc. | 290,900 | 22,841,468 | |
| First Bancorp, Puerto Rico | 2,837,400 | 38,163,030 | |
| Glacier Bancorp, Inc. (b) | 435,750 | 19,865,843 | |
| Independent Bank Group, Inc. | 342,300 | 20,982,990 | |
| Metropolitan Bank Holding Corp. (a) | 205,900 | 12,226,342 | |
| PacWest Bancorp | 1,326,500 | 36,690,990 | |
| Pathward Financial, Inc. | 836,702 | 41,517,153 | |
| Pinnacle Financial Partners, Inc. | 247,900 | 19,517,167 | |
| Preferred Bank, Los Angeles | 274,750 | 19,542,968 | |
| ServisFirst Bancshares, Inc. | 199,542 | 13,604,774 | |
| Synovus Financial Corp. | 1,172,795 | 49,198,750 | |
| Trico Bancshares | 775,208 | 39,186,764 | |
| United Community Bank, Inc. | 1,447,800 | 47,111,412 | |
| Webster Financial Corp. | 370,171 | 19,489,503 | |
| Western Alliance Bancorp. | 164,650 | 12,409,671 | |
| 412,348,825 | |||
| Capital Markets - 3.1% | |||
| Focus Financial Partners, Inc. Class A (a) | 498,752 | 22,518,653 | |
| Houlihan Lokey (b) | 375,879 | 37,238,333 | |
| Lazard Ltd. Class A | 944,840 | 37,869,187 | |
| LPL Financial | 71,250 | 16,894,800 | |
| TMX Group Ltd. | 366,664 | 36,138,677 | |
| 150,659,650 | |||
| Consumer Finance - 0.6% | |||
| FirstCash Holdings, Inc. | 318,424 | 29,352,324 | |
| Insurance - 1.7% | |||
| First American Financial Corp. | 222,300 | 13,753,701 | |
| Primerica, Inc. | 267,700 | 43,300,475 | |
| Selective Insurance Group, Inc. | 270,957 | 25,740,915 | |
| 82,795,091 | |||
| Thrifts & Mortgage Finance - 1.7% | |||
| Essent Group Ltd. | 1,122,800 | 49,436,884 | |
| Walker & Dunlop, Inc. | 383,216 | 36,551,142 | |
| 85,988,026 | |||
TOTAL FINANCIALS | 761,143,916 | ||
| HEALTH CARE - 15.1% | |||
| Biotechnology - 6.9% | |||
| ALX Oncology Holdings, Inc. (a) | 337,600 | 3,139,680 | |
| Arcutis Biotherapeutics, Inc. (a) | 686,789 | 11,380,094 | |
| Argenx SE ADR (a) | 51,800 | 19,800,550 | |
| Ascendis Pharma A/S sponsored ADR (a) | 96,248 | 11,942,452 | |
| Astria Therapeutics, Inc. (a) | 620,500 | 8,531,875 | |
| BioCryst Pharmaceuticals, Inc. (a)(b) | 1,123,400 | 11,851,870 | |
| Blueprint Medicines Corp. (a) | 427,000 | 19,957,980 | |
| Celldex Therapeutics, Inc. (a) | 337,200 | 14,857,032 | |
| Cerevel Therapeutics Holdings (a) | 450,200 | 15,374,330 | |
| Cytokinetics, Inc. (a) | 572,400 | 24,315,552 | |
| Day One Biopharmaceuticals, Inc. (a) | 769,400 | 16,749,838 | |
| Exelixis, Inc. (a) | 789,600 | 13,912,752 | |
| Icosavax, Inc. (a)(b) | 803,800 | 8,480,090 | |
| Instil Bio, Inc. (a) | 533,407 | 434,140 | |
| Janux Therapeutics, Inc. (a)(b) | 579,800 | 12,877,358 | |
| Keros Therapeutics, Inc. (a) | 408,200 | 23,908,274 | |
| Madrigal Pharmaceuticals, Inc. (a) | 17,100 | 4,929,075 | |
| Morphic Holding, Inc. (a) | 288,262 | 9,434,815 | |
| PepGen, Inc. | 566,000 | 8,840,920 | |
| PTC Therapeutics, Inc. (a) | 355,300 | 16,304,717 | |
| Scholar Rock Holding Corp. warrants 12/31/25 (a)(c) | 18,825 | 122,870 | |
| Tango Therapeutics, Inc. (a) | 1,398,900 | 9,232,740 | |
| Tyra Biosciences, Inc. (a) | 1,030,200 | 10,940,724 | |
| Vaxcyte, Inc. (a) | 345,772 | 15,680,760 | |
| Vera Therapeutics, Inc. (a) | 619,682 | 5,254,903 | |
| Verve Therapeutics, Inc. (a)(b) | 543,200 | 12,357,800 | |
| Xenon Pharmaceuticals, Inc. (a) | 480,030 | 18,764,373 | |
| Zentalis Pharmaceuticals, Inc. (a) | 442,982 | 10,454,375 | |
| 339,831,939 | |||
| Health Care Equipment & Supplies - 2.7% | |||
| Envista Holdings Corp. (a) | 617,200 | 24,064,628 | |
| Globus Medical, Inc. (a) | 149,500 | 11,287,250 | |
| Haemonetics Corp. (a) | 397,400 | 33,620,040 | |
| Inspire Medical Systems, Inc. (a) | 100,843 | 25,519,330 | |
| Omnicell, Inc. (a) | 211,900 | 11,754,093 | |
| TransMedics Group, Inc. (a) | 393,124 | 24,774,674 | |
| 131,020,015 | |||
| Health Care Providers & Services - 2.9% | |||
| Acadia Healthcare Co., Inc. (a) | 360,300 | 30,272,406 | |
| agilon health, Inc. (a) | 1,055,200 | 22,961,152 | |
| Molina Healthcare, Inc. (a) | 103,400 | 32,243,222 | |
| Owens & Minor, Inc. | 580,040 | 11,449,990 | |
| R1 Rcm, Inc. (a) | 1,163,747 | 16,653,220 | |
| Surgery Partners, Inc. (a) | 645,392 | 21,427,014 | |
| Tenet Healthcare Corp. (a) | 115,500 | 6,335,175 | |
| The Oncology Institute, Inc. (a)(c) | 1,126,158 | 1,666,714 | |
| 143,008,893 | |||
| Health Care Technology - 0.6% | |||
| Evolent Health, Inc. (a) | 933,417 | 30,074,696 | |
| Life Sciences Tools & Services - 0.2% | |||
| Olink Holding AB ADR (a) | 555,595 | 10,878,550 | |
| Pharmaceuticals - 1.8% | |||
| Acelyrin, Inc. (d) | 541,165 | 3,366,100 | |
| Acelyrin, Inc. rights (a)(d) | 65,759 | 389,721 | |
| Axsome Therapeutics, Inc. (a)(b) | 154,500 | 11,587,500 | |
| DICE Therapeutics, Inc. (a) | 304,900 | 9,686,673 | |
| Edgewise Therapeutics, Inc. (a) | 1,271,900 | 13,011,537 | |
| Enliven Therapeutics, Inc. (e) | 895,300 | 3,722,657 | |
| Intra-Cellular Therapies, Inc. (a) | 334,000 | 16,005,280 | |
| Terns Pharmaceuticals, Inc. (a) | 1,029,500 | 9,337,565 | |
| Ventyx Biosciences, Inc. (a) | 437,907 | 18,392,094 | |
| Verona Pharma PLC ADR (a) | 208,512 | 4,595,604 | |
| 90,094,731 | |||
TOTAL HEALTH CARE | 744,908,824 | ||
| INDUSTRIALS - 17.5% | |||
| Building Products - 1.9% | |||
| Builders FirstSource, Inc. (a) | 439,549 | 35,032,055 | |
| Masonite International Corp. (a) | 268,034 | 24,450,061 | |
| Simpson Manufacturing Co. Ltd. | 334,799 | 35,860,321 | |
| 95,342,437 | |||
| Commercial Services & Supplies - 0.8% | |||
| Casella Waste Systems, Inc. Class A (a) | 260,332 | 20,857,800 | |
| The Brink's Co. | 247,500 | 16,236,000 | |
| 37,093,800 | |||
| Construction & Engineering - 3.5% | |||
| Comfort Systems U.S.A., Inc. | 249,822 | 30,238,455 | |
| Construction Partners, Inc. Class A (a) | 391,459 | 11,074,375 | |
| Dycom Industries, Inc. (a) | 221,010 | 21,077,724 | |
| EMCOR Group, Inc. | 300,760 | 44,587,670 | |
| Granite Construction, Inc. | 893,400 | 38,040,972 | |
| IES Holdings, Inc. (a) | 629,318 | 25,053,150 | |
| 170,072,346 | |||
| Electrical Equipment - 1.8% | |||
| Atkore, Inc. (a) | 548,924 | 71,497,351 | |
| Regal Rexnord Corp. | 72,400 | 10,078,080 | |
| Thermon Group Holdings, Inc. (a) | 303,446 | 7,015,672 | |
| 88,591,103 | |||
| Machinery - 3.9% | |||
| Federal Signal Corp. | 867,219 | 46,179,412 | |
| ITT, Inc. | 211,100 | 19,334,649 | |
| Kadant, Inc. | 101,356 | 20,653,312 | |
| Oshkosh Corp. | 159,300 | 16,054,254 | |
| SPX Technologies, Inc. (a) | 708,544 | 53,147,885 | |
| Terex Corp. | 429,200 | 21,876,324 | |
| Timken Co. | 189,700 | 15,621,795 | |
| 192,867,631 | |||
| Professional Services - 3.0% | |||
| ASGN, Inc. (a) | 518,392 | 47,147,752 | |
| CACI International, Inc. Class A (a) | 69,200 | 21,319,828 | |
| CRA International, Inc. | 165,074 | 19,617,394 | |
| KBR, Inc. | 426,600 | 21,854,718 | |
| NV5 Global, Inc. (a) | 175,195 | 23,351,742 | |
| TriNet Group, Inc. (a) | 198,500 | 14,976,825 | |
| 148,268,259 | |||
| Trading Companies & Distributors - 2.6% | |||
| Beacon Roofing Supply, Inc. (a) | 381,957 | 21,725,714 | |
| Finning International, Inc. | 562,350 | 15,866,085 | |
| GMS, Inc. (a) | 314,900 | 18,679,868 | |
| Rush Enterprises, Inc. Class A | 842,201 | 45,318,836 | |
| Univar Solutions, Inc. (a) | 797,954 | 27,513,454 | |
| 129,103,957 | |||
TOTAL INDUSTRIALS | 861,339,533 | ||
| INFORMATION TECHNOLOGY - 12.7% | |||
| Communications Equipment - 0.4% | |||
| Extreme Networks, Inc. (a) | 1,112,500 | 20,058,375 | |
| Electronic Equipment & Components - 3.6% | |||
| Advanced Energy Industries, Inc. | 500,599 | 46,425,551 | |
| Fabrinet (a) | 386,556 | 50,893,963 | |
| Insight Enterprises, Inc. (a) | 356,907 | 40,230,557 | |
| Napco Security Technologies, Inc. (a) | 613,000 | 17,758,610 | |
| TD SYNNEX Corp. | 193,600 | 19,776,240 | |
| 175,084,921 | |||
| IT Services - 3.6% | |||
| Cyxtera Technologies, Inc. Class A (a) | 1,625,595 | 5,234,416 | |
| Endava PLC ADR (a) | 273,803 | 24,059,070 | |
| ExlService Holdings, Inc. (a) | 395,776 | 67,519,386 | |
| Maximus, Inc. | 66,000 | 4,940,100 | |
| Perficient, Inc. (a) | 310,700 | 23,035,298 | |
| WNS Holdings Ltd. sponsored ADR (a) | 612,390 | 51,887,805 | |
| 176,676,075 | |||
| Semiconductors & Semiconductor Equipment - 2.5% | |||
| Axcelis Technologies, Inc. (a) | 478,000 | 52,556,100 | |
| MACOM Technology Solutions Holdings, Inc. (a) | 448,100 | 30,031,662 | |
| Onto Innovation, Inc. (a) | 298,092 | 23,444,936 | |
| Synaptics, Inc. (a) | 133,200 | 16,653,996 | |
| 122,686,694 | |||
| Software - 2.4% | |||
| Five9, Inc. (a) | 115,300 | 9,083,334 | |
| Intapp, Inc. (a) | 562,918 | 16,313,364 | |
| Manhattan Associates, Inc. (a) | 72,400 | 9,438,064 | |
| NCR Corp. (a) | 339,900 | 9,320,058 | |
| Qualys, Inc. (a) | 145,700 | 16,807,952 | |
| Rapid7, Inc. (a) | 166,600 | 6,642,342 | |
| SPS Commerce, Inc. (a) | 117,150 | 15,941,772 | |
| Tenable Holdings, Inc. (a) | 862,900 | 34,714,467 | |
| 118,261,353 | |||
| Technology Hardware, Storage & Peripherals - 0.2% | |||
| Avid Technology, Inc. (a) | 387,448 | 11,743,549 | |
TOTAL INFORMATION TECHNOLOGY | 624,510,967 | ||
| MATERIALS - 5.5% | |||
| Chemicals - 0.8% | |||
| Element Solutions, Inc. | 1,199,817 | 24,572,252 | |
| Tronox Holdings PLC | 999,647 | 17,143,946 | |
| 41,716,198 | |||
| Construction Materials - 0.9% | |||
| Eagle Materials, Inc. | 293,100 | 42,816,048 | |
| Containers & Packaging - 0.4% | |||
| O-I Glass, Inc. (a) | 1,039,000 | 20,000,750 | |
| Metals & Mining - 2.7% | |||
| Arconic Corp. (a) | 515,300 | 12,114,703 | |
| Commercial Metals Co. | 1,397,630 | 75,849,380 | |
| Constellium NV (a) | 1,427,300 | 20,738,669 | |
| Lundin Mining Corp. | 3,041,100 | 23,015,954 | |
| 131,718,706 | |||
| Paper & Forest Products - 0.7% | |||
| Louisiana-Pacific Corp. | 303,800 | 20,685,742 | |
| Sylvamo Corp. | 245,400 | 11,663,862 | |
| 32,349,604 | |||
TOTAL MATERIALS | 268,601,306 | ||
| REAL ESTATE - 5.4% | |||
| Equity Real Estate Investment Trusts (REITs) - 4.4% | |||
| EastGroup Properties, Inc. | 169,700 | 28,552,025 | |
| Elme Communities (SBI) | 1,653,700 | 31,751,040 | |
| Equity Commonwealth | 447,000 | 11,407,440 | |
| Essential Properties Realty Trust, Inc. | 1,855,100 | 47,267,948 | |
| Lamar Advertising Co. Class A | 195,400 | 20,817,916 | |
| LXP Industrial Trust (REIT) | 3,499,899 | 40,423,833 | |
| Sunstone Hotel Investors, Inc. | 2,074,200 | 22,795,458 | |
| Terreno Realty Corp. | 214,496 | 13,819,977 | |
| 216,835,637 | |||
| Real Estate Management & Development - 1.0% | |||
| Cushman & Wakefield PLC (a) | 1,249,200 | 18,025,956 | |
| Jones Lang LaSalle, Inc. (a) | 161,800 | 29,911,966 | |
| 47,937,922 | |||
TOTAL REAL ESTATE | 264,773,559 | ||
| UTILITIES - 2.1% | |||
| Electric Utilities - 0.3% | |||
| IDACORP, Inc. | 155,800 | 16,485,198 | |
| Gas Utilities - 1.5% | |||
| Brookfield Infrastructure Corp. A Shares | 1,263,900 | 55,889,658 | |
| ONE Gas, Inc. | 241,700 | 19,906,412 | |
| 75,796,070 | |||
| Independent Power and Renewable Electricity Producers - 0.3% | |||
| Clearway Energy, Inc. Class C | 382,575 | 12,927,209 | |
TOTAL UTILITIES | 105,208,477 | ||
| TOTAL COMMON STOCKS (Cost $3,809,914,588) | 4,866,946,919 | ||
| Convertible Preferred Stocks - 0.2% | |||
| Shares | Value ($) | ||
| HEALTH CARE - 0.2% | |||
| Biotechnology - 0.1% | |||
| Dianthus Therapeutics, Inc. Series A (c)(d) | 1,102,127 | 4,772,210 | |
| Pharmaceuticals - 0.1% | |||
| Aristea Therapeutics, Inc. Series B (a)(c)(d) | 733,075 | 4,039,243 | |
| TOTAL CONVERTIBLE PREFERRED STOCKS (Cost $8,832,351) | 8,811,453 | ||
| U.S. Treasury Obligations - 0.0% | |||
Principal Amount (f) | Value ($) | ||
U.S. Treasury Bills, yield at date of purchase 4.16% to 4.18% 2/16/23 (g) (Cost $1,337,698) | 1,340,000 | 1,337,601 | |
| Money Market Funds - 3.0% | |||
| Shares | Value ($) | ||
| Fidelity Cash Central Fund 4.38% (h) | 50,815,239 | 50,825,402 | |
| Fidelity Securities Lending Cash Central Fund 4.38% (h)(i) | 97,950,865 | 97,960,660 | |
| TOTAL MONEY MARKET FUNDS (Cost $148,786,062) | 148,786,062 | ||
| TOTAL INVESTMENT IN SECURITIES - 102.1% (Cost $3,968,870,699) | 5,025,882,035 |
NET OTHER ASSETS (LIABILITIES) - (2.1)% | (101,776,405) |
| NET ASSETS - 100.0% | 4,924,105,630 |
| Futures Contracts | |||||
Number of contracts | Expiration Date | Notional Amount ($) | Value ($) | Unrealized Appreciation/ (Depreciation) ($) | |
| Purchased | |||||
| Equity Index Contracts | |||||
| CME E-mini Russell 2000 Index Contracts (United States) | 324 | Mar 2023 | 31,418,280 | 1,701,591 | 1,701,591 |
| The notional amount of futures purchased as a percentage of Net Assets is 0.6% | |||||
| (a) | Non-income producing |
| (b) | Security or a portion of the security is on loan at period end. |
| (c) | Restricted securities (including private placements) - Investment in securities not registered under the Securities Act of 1933 (excluding 144A issues). At the end of the period, the value of restricted securities (excluding 144A issues) amounted to $10,601,037 or 0.2% of net assets. |
| (d) | Level 3 security |
| (e) | Security or a portion of the security purchased on a delayed delivery or when-issued basis. |
| (f) | Amount is stated in United States dollars unless otherwise noted. |
| (g) | Security or a portion of the security was pledged to cover margin requirements for futures contracts. At period end, the value of securities pledged amounted to $1,167,905. |
| (h) | Affiliated fund that is generally available only to investment companies and other accounts managed by Fidelity Investments. The rate quoted is the annualized seven-day yield of the fund at period end. A complete unaudited listing of the fund's holdings as of its most recent quarter end is available upon request. In addition, each Fidelity Central Fund's financial statements are available on the SEC's website or upon request. |
| (i) | Investment made with cash collateral received from securities on loan. |
| Additional information on each restricted holding is as follows: | ||
| Security | Acquisition Date | Acquisition Cost ($) |
| Aristea Therapeutics, Inc. Series B | 10/06/20 - 7/27/21 | 4,041,955 |
| Dianthus Therapeutics, Inc. Series A | 4/06/22 | 4,790,395 |
| Scholar Rock Holding Corp. warrants 12/31/25 | 6/17/22 | 0 |
| The Oncology Institute, Inc. | 6/28/21 | 11,261,580 |
| Affiliate | Value, beginning of period ($) | Purchases ($) | Sales Proceeds ($) | Dividend Income ($) | Realized Gain (loss) ($) | Change in Unrealized appreciation (depreciation) ($) | Value, end of period ($) | % ownership, end of period |
| Fidelity Cash Central Fund 4.38% | 56,163,679 | 739,489,339 | 744,827,615 | 939,696 | - | (1) | 50,825,402 | 0.1% |
| Fidelity Securities Lending Cash Central Fund 4.38% | 83,308,212 | 883,585,659 | 868,933,211 | 247,881 | - | - | 97,960,660 | 0.3% |
| Total | 139,471,891 | 1,623,074,998 | 1,613,760,826 | 1,187,577 | - | (1) | 148,786,062 | |
| Valuation Inputs at Reporting Date: | ||||
| Description | Total ($) | Level 1 ($) | Level 2 ($) | Level 3 ($) |
Investments in Securities: | ||||
| Equities: | ||||
Communication Services | 79,664,933 | 79,664,933 | - | - |
Consumer Discretionary | 631,121,783 | 631,121,783 | - | - |
Consumer Staples | 174,136,848 | 174,136,848 | - | - |
Energy | 351,536,773 | 351,536,773 | - | - |
Financials | 761,143,916 | 761,143,916 | - | - |
Health Care | 753,720,277 | 737,307,476 | 3,845,527 | 12,567,274 |
Industrials | 861,339,533 | 861,339,533 | - | - |
Information Technology | 624,510,967 | 624,510,967 | - | - |
Materials | 268,601,306 | 268,601,306 | - | - |
Real Estate | 264,773,559 | 264,773,559 | - | - |
Utilities | 105,208,477 | 105,208,477 | - | - |
| U.S. Government and Government Agency Obligations | 1,337,601 | - | 1,337,601 | - |
| Money Market Funds | 148,786,062 | 148,786,062 | - | - |
| Total Investments in Securities: | 5,025,882,035 | 5,008,131,633 | 5,183,128 | 12,567,274 |
Derivative Instruments: | ||||
| Assets | ||||
Futures Contracts | 1,701,591 | 1,701,591 | - | - |
| Total Assets | 1,701,591 | 1,701,591 | - | - |
| Total Derivative Instruments: | 1,701,591 | 1,701,591 | - | - |
Primary Risk Exposure / Derivative Type | Value | |
| Asset ($) | Liability ($) | |
| Equity Risk | ||
Futures Contracts (a) | 1,701,591 | 0 |
| Total Equity Risk | 1,701,591 | 0 |
| Total Value of Derivatives | 1,701,591 | 0 |
| Statement of Assets and Liabilities | ||||
January 31, 2023 (Unaudited) | ||||
| Assets | ||||
| Investment in securities, at value (including securities loaned of $97,919,622) - See accompanying schedule: | ||||
Unaffiliated issuers (cost $3,820,084,637) | $ | 4,877,095,973 | ||
Fidelity Central Funds (cost $148,786,062) | 148,786,062 | |||
| Total Investment in Securities (cost $3,968,870,699) | $ | 5,025,882,035 | ||
| Cash | 21,475 | |||
| Receivable for investments sold | 44,862,063 | |||
| Receivable for fund shares sold | 950,751 | |||
| Dividends receivable | 265,331 | |||
| Distributions receivable from Fidelity Central Funds | 201,686 | |||
| Receivable for daily variation margin on futures contracts | 521,778 | |||
| Other receivables | 50,568 | |||
Total assets | 5,072,755,687 | |||
| Liabilities | ||||
| Payable for investments purchased | ||||
Regular delivery | $ | 2,369,875 | ||
Delayed delivery | 3,438,829 | |||
| Payable for fund shares redeemed | 44,862,922 | |||
| Other payables and accrued expenses | 28,207 | |||
| Collateral on securities loaned | 97,950,224 | |||
| Total Liabilities | 148,650,057 | |||
| Net Assets | $ | 4,924,105,630 | ||
| Net Assets consist of: | ||||
| Paid in capital | $ | 4,103,768,003 | ||
| Total accumulated earnings (loss) | 820,337,627 | |||
| Net Assets | $ | 4,924,105,630 | ||
Net Asset Value , offering price and redemption price per share ($4,924,105,630 ÷ 385,747,999 shares) | $ | 12.77 | ||
| Statement of Operations | ||||
Six months ended January 31, 2023 (Unaudited) | ||||
| Investment Income | ||||
| Dividends | $ | 24,068,338 | ||
| Interest | 48,277 | |||
| Income from Fidelity Central Funds (including $247,881 from security lending) | 1,187,577 | |||
| Total Income | 25,304,192 | |||
| Expenses | ||||
| Custodian fees and expenses | $ | 18,926 | ||
| Independent trustees' fees and expenses | 8,284 | |||
| Interest | 3,767 | |||
| Total Expenses | 30,977 | |||
| Net Investment income (loss) | 25,273,215 | |||
| Realized and Unrealized Gain (Loss) | ||||
| Net realized gain (loss) on: | ||||
| Investment Securities: | ||||
| Unaffiliated issuers | (44,983,930) | |||
| Foreign currency transactions | 7,192 | |||
| Futures contracts | (3,745,796) | |||
| Total net realized gain (loss) | (48,722,534) | |||
| Change in net unrealized appreciation (depreciation) on: | ||||
| Investment Securities: | ||||
| Unaffiliated issuers | 326,285,233 | |||
| Fidelity Central Funds | (1) | |||
| Assets and liabilities in foreign currencies | (766) | |||
| Futures contracts | 537,022 | |||
| Total change in net unrealized appreciation (depreciation) | 326,821,488 | |||
| Net gain (loss) | 278,098,954 | |||
| Net increase (decrease) in net assets resulting from operations | $ | 303,372,169 | ||
| Statement of Changes in Net Assets | ||||
Six months ended January 31, 2023 (Unaudited) | Year ended July 31, 2022 | |||
| Increase (Decrease) in Net Assets | ||||
| Operations | ||||
| Net investment income (loss) | $ | 25,273,215 | $ | 48,514,660 |
| Net realized gain (loss) | (48,722,534) | 123,754,493 | ||
| Change in net unrealized appreciation (depreciation) | 326,821,488 | (570,952,732) | ||
| Net increase (decrease) in net assets resulting from operations | 303,372,169 | (398,683,579) | ||
| Distributions to shareholders | (230,929,095) | (1,511,145,723) | ||
| Share transactions | ||||
| Proceeds from sales of shares | 282,375,192 | 772,983,933 | ||
| Reinvestment of distributions | 230,929,095 | 1,511,145,723 | ||
| Cost of shares redeemed | (701,599,128) | (1,346,757,031) | ||
Net increase (decrease) in net assets resulting from share transactions | (188,294,841) | 937,372,625 | ||
| Total increase (decrease) in net assets | (115,851,767) | (972,456,677) | ||
| Net Assets | ||||
| Beginning of period | 5,039,957,397 | 6,012,414,074 | ||
| End of period | $ | 4,924,105,630 | $ | 5,039,957,397 |
| Other Information | ||||
| Shares | ||||
| Sold | 23,907,188 | 57,044,933 | ||
| Issued in reinvestment of distributions | 19,053,605 | 106,014,574 | ||
| Redeemed | (58,216,078) | (94,592,767) | ||
| Net increase (decrease) | (15,255,285) | 68,466,740 | ||
| Fidelity® Series Small Cap Opportunities Fund |
Six months ended (Unaudited) January 31, 2023 | Years ended July 31, 2022 | 2021 | 2020 | 2019 | 2018 | |||||||
Selected Per-Share Data | ||||||||||||
| Net asset value, beginning of period | $ | 12.57 | $ | 18.08 | $ | 12.66 | $ | 14.04 | $ | 15.46 | $ | 14.42 |
| Income from Investment Operations | ||||||||||||
Net investment income (loss) A,B | .06 | .12 | .12 | .15 | .15 | .16 | ||||||
| Net realized and unrealized gain (loss) | .74 | (1.03) | 5.62 | (.60) | .12 | 2.44 | ||||||
| Total from investment operations | .80 | (.91) | 5.74 | (.45) | .27 | 2.60 | ||||||
| Distributions from net investment income | (.14) | (.12) | (.14) | (.16) | (.14) | (.12) | ||||||
| Distributions from net realized gain | (.47) | (4.48) | (.19) | (.77) | (1.55) | (1.45) | ||||||
| Total distributions | (.60) C | (4.60) | (.32) C | (.93) | (1.69) | (1.56) C | ||||||
| Net asset value, end of period | $ | 12.77 | $ | 12.57 | $ | 18.08 | $ | 12.66 | $ | 14.04 | $ | 15.46 |
Total Return D,E | 6.67% | (7.62)% | 45.98% | (3.44)% | 1.98% | 19.84% | ||||||
Ratios to Average Net Assets B,F,G | ||||||||||||
Expenses before reductions H | -% I | -% | -% | -% | -% | -% | ||||||
Expenses net of fee waivers, if any H | -% I | -% | -% | -% | -% | -% | ||||||
Expenses net of all reductions H | -% I | -% | -% | -% | -% | -% | ||||||
| Net investment income (loss) | 1.07% I | .86% | .77% | 1.17% | 1.13% | 1.10% | ||||||
| Supplemental Data | ||||||||||||
| Net assets, end of period (000 omitted) | $ | 4,924,106 | $ | 5,039,957 | $ | 6,012,414 | $ | 4,931,192 | $ | 5,667,458 | $ | 5,997,330 |
Portfolio turnover rate J | 24% I | 39% | 96% | 61% K | 59% | 68% |
| Fidelity Central Fund | Investment Manager | Investment Objective | Investment Practices | Expense Ratio A |
| Fidelity Money Market Central Funds | Fidelity Management & Research Company LLC (FMR) | Each fund seeks to obtain a high level of current income consistent with the preservation of capital and liquidity. | Short-term Investments | Less than .005% |
| Gross unrealized appreciation | $1,361,034,225 |
| Gross unrealized depreciation | (310,598,264) |
| Net unrealized appreciation (depreciation) | $1,050,435,961 |
| Tax cost | $3,977,147,665 |
| Equity Risk | Equity risk relates to the fluctuations in the value of financial instruments as a result of changes in market prices (other than those arising from interest rate risk or foreign exchange risk), whether caused by factors specific to an individual investment, its issuer, or all factors affecting all instruments traded in a market or market segment. |
| Purchases ($) | Sales ($) | |
| Fidelity Series Small Cap Opportunities Fund | 570,223,488 | 980,898,357 |
| Amount | |
| Fidelity Series Small Cap Opportunities Fund | $28,362 |
| Borrower or Lender | Average Loan Balance | Weighted Average Interest Rate | Interest Expense | |
Fidelity Series Small Cap Opportunities Fund | Borrower | $ 52,969,000 | 2.56% | $3,767 |
| Purchases ($) | Sales ($) | Realized Gain (Loss) ($) | |
| Fidelity Series Small Cap Opportunities Fund | 16,394,851 | 72,787,641 | 392,646 |
| Total Security Lending Fees Paid to NFS | Security Lending Income From Securities Loaned to NFS | Value of Securities Loaned to NFS at Period End | |
| Fidelity Series Small Cap Opportunities Fund | $25,740 | $135 | $- |
| The Example is based on an investment of $1,000 invested at the beginning of the period and held for the entire period (August 1, 2022 to January 31, 2023). |
Annualized Expense Ratio- A | Beginning Account Value August 1, 2022 | Ending Account Value January 31, 2023 | Expenses Paid During Period- C August 1, 2022 to January 31, 2023 | |||||||
| Fidelity® Series Small Cap Opportunities Fund | -%- D | |||||||||
| Actual | $ 1,000 | $ 1,066.70 | $- E | |||||||
Hypothetical- B | $ 1,000 | $ 1,025.21 | $- E | |||||||
- Highly liquid investments - cash or convertible to cash within three business days or less
- Moderately liquid investments - convertible to cash in three to seven calendar days
- Less liquid investments - can be sold or disposed of, but not settled, within seven calendar days
- Illiquid investments - cannot be sold or disposed of within seven calendar days
|


Contents
Top Holdings (% of Fund's net assets) | ||
| Equity Lifestyle Properties, Inc. | 1.5 | |
| Great Ajax Corp. 7.25% | 1.4 | |
| American Tower Corp. | 1.3 | |
| iStar Financial, Inc. Series I, 7.50% | 1.3 | |
| Digitalbridge Group, Inc. Series I, 7.15% | 1.1 | |
| Crown Castle International Corp. | 1.0 | |
| Chimera Investment Corp. Series B, 8.00% | 0.9 | |
| Annaly Capital Management, Inc. Series F, 6.95% | 0.9 | |
| Digitalbridge Group, Inc. Series J, 7.15% | 0.9 | |
| Rithm Capital Corp. 7.125% | 0.9 | |
| 11.2 | ||
| Top Five REIT Sectors (% of Fund's net assets) | ||
| REITs - Mortgage | 15.3 | |
| REITs - Diversified | 15.1 | |
| REITs - Health Care | 6.1 | |
| REITs - Management/Investment | 4.8 | |
| REITs - Hotels | 4.5 | |
Quality Diversification (% of Fund's net assets) |
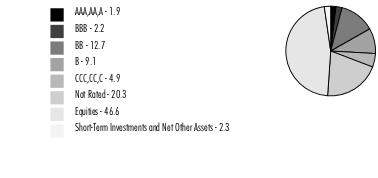 |
| We have used ratings from Moody's Investors Service, Inc. Where Moody's® ratings are not available, we have used S&P® ratings. All ratings are as of the date indicated and do not reflect subsequent changes. |
Asset Allocation (% of Fund's net assets) |
 |
Foreign investments - 0.9% |
| Common Stocks - 13.7% | |||
| Shares | Value ($) | ||
| FINANCIALS - 0.7% | |||
| Mortgage Real Estate Investment Trusts - 0.7% | |||
| Great Ajax Corp. | 256,346 | 2,248,154 | |
| MFA Financial, Inc. | 78,075 | 928,312 | |
| 3,176,466 | |||
| INFORMATION TECHNOLOGY - 0.0% | |||
| IT Services - 0.0% | |||
| Cyxtera Technologies, Inc. Class A (a) | 37,800 | 121,716 | |
| REAL ESTATE - 13.0% | |||
| Equity Real Estate Investment Trusts (REITs) - 12.9% | |||
| Acadia Realty Trust (SBI) | 300 | 4,659 | |
| American Homes 4 Rent Class A | 38,900 | 1,333,881 | |
| American Tower Corp. | 26,900 | 6,009,191 | |
| AvalonBay Communities, Inc. | 8,100 | 1,437,264 | |
| Crown Castle International Corp. | 30,700 | 4,546,977 | |
| CubeSmart | 22,500 | 1,030,275 | |
| Digital Realty Trust, Inc. | 2,200 | 252,164 | |
| Douglas Emmett, Inc. | 12,000 | 201,000 | |
| Easterly Government Properties, Inc. | 62,900 | 1,021,496 | |
| EastGroup Properties, Inc. | 500 | 84,125 | |
| Elme Communities (SBI) | 40,100 | 769,920 | |
| Equinix, Inc. | 3,600 | 2,657,268 | |
| Equity Lifestyle Properties, Inc. | 92,700 | 6,654,006 | |
| Essex Property Trust, Inc. | 9,700 | 2,192,879 | |
| Extra Space Storage, Inc. | 6,400 | 1,010,112 | |
| Farmland Partners, Inc. | 11,915 | 153,465 | |
| Gaming & Leisure Properties | 19,804 | 1,060,702 | |
| Healthcare Trust of America, Inc. | 3,250 | 69,973 | |
| Invitation Homes, Inc. | 27,100 | 880,750 | |
| iStar Financial, Inc. | 6,787 | 62,983 | |
| Lamar Advertising Co. Class A | 11,000 | 1,171,940 | |
| Life Storage, Inc. | 3,200 | 345,728 | |
| LXP Industrial Trust (REIT) | 317,022 | 3,661,604 | |
| Mid-America Apartment Communities, Inc. | 13,714 | 2,286,398 | |
| National Retail Properties, Inc. | 3,700 | 175,195 | |
| NexPoint Residential Trust, Inc. | 1,000 | 50,500 | |
| Postal Realty Trust, Inc. | 51,200 | 791,552 | |
| Prologis (REIT), Inc. | 15,420 | 1,993,498 | |
| Public Storage | 6,100 | 1,856,474 | |
| Retail Value, Inc. | 24,066 | 6,017 | |
| RLJ Lodging Trust | 14,700 | 184,779 | |
| Sabra Health Care REIT, Inc. | 33,800 | 456,300 | |
| Safehold, Inc. | 519 | 18,144 | |
| SITE Centers Corp. | 118,800 | 1,621,620 | |
| Spirit Realty Capital, Inc. | 39,800 | 1,746,424 | |
| Sunstone Hotel Investors, Inc. | 17,100 | 187,929 | |
| Terreno Realty Corp. | 25,980 | 1,673,891 | |
| UDR, Inc. | 5,600 | 238,504 | |
| UMH Properties, Inc. | 29,000 | 519,680 | |
| Ventas, Inc. | 62,555 | 3,240,975 | |
| VICI Properties, Inc. | 34,700 | 1,186,046 | |
| Welltower, Inc. | 40,900 | 3,069,136 | |
| Weyerhaeuser Co. | 13,700 | 471,691 | |
| 58,387,115 | |||
| Real Estate Management & Development - 0.1% | |||
| Cushman & Wakefield PLC (a) | 11,300 | 163,059 | |
| Digitalbridge Group, Inc. | 4,374 | 64,735 | |
| 227,794 | |||
TOTAL REAL ESTATE | 58,614,909 | ||
| TOTAL COMMON STOCKS (Cost $48,060,937) | 61,913,091 | ||
| Preferred Stocks - 32.9% | |||
| Shares | Value ($) | ||
| Convertible Preferred Stocks - 2.4% | |||
| FINANCIALS - 1.4% | |||
| Mortgage Real Estate Investment Trusts - 1.4% | |||
| Great Ajax Corp. 7.25% | 260,550 | 6,386,081 | |
| REAL ESTATE - 1.0% | |||
| Equity Real Estate Investment Trusts (REITs) - 1.0% | |||
| LXP Industrial Trust (REIT) Series C, 6.50% | 71,519 | 3,417,454 | |
| RLJ Lodging Trust Series A, 1.95% | 38,950 | 985,435 | |
| 4,402,889 | |||
| TOTAL CONVERTIBLE PREFERRED STOCKS | 10,788,970 | ||
| Nonconvertible Preferred Stocks - 30.5% | |||
| ENERGY - 1.6% | |||
| Oil, Gas & Consumable Fuels - 1.6% | |||
| DCP Midstream Partners LP: | |||
| 7.95%(b) | 36,975 | 928,073 | |
| Series B, 7.875%(b) | 34,150 | 858,873 | |
| Enbridge, Inc.: | |||
| Series 1, 5 year U.S. Treasury Index + 3.140% 5.949%(b)(c) | 97,425 | 2,189,140 | |
| Series L, 5 year U.S. Treasury Index + 3.150% 4.959%(b)(c) | 19,600 | 393,372 | |
| Energy Transfer LP 7.60% (b) | 98,525 | 2,359,674 | |
| Global Partners LP: | |||
| 9.75%(b) | 1,825 | 48,655 | |
| Series B, 9.50% | 12,200 | 307,688 | |
| 7,085,475 | |||
| FINANCIALS - 12.5% | |||
| Mortgage Real Estate Investment Trusts - 12.5% | |||
| AG Mortgage Investment Trust, Inc. 8.00% | 50,109 | 919,500 | |
| AGNC Investment Corp.: | |||
| 6.125%(b) | 102,400 | 2,207,744 | |
| 6.875%(b) | 85,750 | 1,896,790 | |
| Series C, 7.00%(b)(c) | 136,199 | 3,429,491 | |
| Series E, 6.50%(b) | 141,450 | 3,165,651 | |
| Annaly Capital Management, Inc.: | |||
| 6.75%(b) | 40,700 | 947,496 | |
| Series F, 6.95%(b)(c) | 164,300 | 4,091,070 | |
| Series G, 6.50%(b) | 149,490 | 3,593,740 | |
| Arbor Realty Trust, Inc.: | |||
| Series D, 6.375% | 12,400 | 254,820 | |
| Series F, 6.25%(b) | 14,100 | 287,358 | |
| Cherry Hill Mortgage Investment Corp.: | |||
| 8.25%(b) | 13,175 | 296,899 | |
| Series A, 8.20% | 16,350 | 372,780 | |
| Chimera Investment Corp.: | |||
| 8.00%(b) | 81,500 | 1,776,700 | |
| Series B, 8.00%(b) | 189,358 | 4,241,619 | |
| Series C, 7.75%(b) | 172,766 | 3,527,882 | |
| Dynex Capital, Inc. Series C 6.90% (b) | 89,500 | 2,057,605 | |
| Ellington Financial LLC 6.75% (b) | 73,722 | 1,621,884 | |
| Franklin BSP Realty Trust, Inc. 7.50% | 55,316 | 1,172,948 | |
| MFA Financial, Inc.: | |||
| 6.50%(b) | 179,800 | 3,480,928 | |
| Series B, 7.50% | 66,349 | 1,358,164 | |
| PennyMac Mortgage Investment Trust: | |||
| 6.75% | 26,000 | 515,840 | |
| 8.125%(b) | 66,075 | 1,601,658 | |
| Series B, 8.00%(b) | 119,505 | 2,837,049 | |
| Rithm Capital Corp.: | |||
| 7.125%(b) | 183,967 | 4,010,481 | |
| Series A, 7.50%(b) | 110,359 | 2,462,109 | |
| Series C, 6.375%(b) | 55,446 | 1,106,148 | |
| Series D, 7.00%(b) | 17,100 | 363,204 | |
| Two Harbors Investment Corp.: | |||
| Series A, 8.125%(b) | 41,635 | 920,550 | |
| Series B, 7.625%(b) | 89,612 | 1,855,865 | |
| 56,373,973 | |||
| Real Estate Management & Development - 0.0% | |||
| Brookfield Properties Corp. Series EE, 5.10% (b) | 7,675 | 107,233 | |
TOTAL FINANCIALS | 56,481,206 | ||
| REAL ESTATE - 16.4% | |||
| Equity Real Estate Investment Trusts (REITs) - 13.6% | |||
| Agree Realty Corp. 4.375% | 38,700 | 708,597 | |
| American Homes 4 Rent: | |||
| 6.25% | 18,925 | 477,856 | |
| Series G, 5.875% | 37,050 | 874,380 | |
| Armada Hoffler Properties, Inc. 6.75% | 33,250 | 759,098 | |
| Ashford Hospitality Trust, Inc.: | |||
| Series D, 8.45% | 50,274 | 1,168,669 | |
| Series F, 7.375% | 66,735 | 1,262,626 | |
| Series G, 7.375% | 9,129 | 188,796 | |
| Series H, 7.50% | 35,575 | 693,713 | |
| Series I, 7.50% | 28,111 | 538,326 | |
| Braemar Hotels & Resorts, Inc. Series D, 8.25% | 35,150 | 862,581 | |
| Cedar Realty Trust, Inc.: | |||
| 7.25% | 28,635 | 443,843 | |
| Series C, 6.50% | 53,500 | 658,585 | |
| Centerspace Series C, 6.625% | 57,700 | 1,540,590 | |
| City Office REIT, Inc. Series A, 6.625% | 27,525 | 605,825 | |
| CTO Realty Growth, Inc. 6.375% | 20,000 | 435,290 | |
| DiamondRock Hospitality Co. 8.25% | 34,900 | 899,024 | |
| Gladstone Commercial Corp.: | |||
| 6.625% | 41,125 | 966,438 | |
| Series G, 6.00% | 81,700 | 1,755,733 | |
| Gladstone Land Corp. Series D, 5.00% | 60,000 | 1,449,000 | |
| Global Medical REIT, Inc. Series A, 7.50% | 27,461 | 693,116 | |
| Global Net Lease, Inc.: | |||
| Series A, 7.25% | 129,625 | 3,088,964 | |
| Series B 6.875% | 47,200 | 1,118,640 | |
| Healthcare Trust, Inc.: | |||
| 7.125% | 48,000 | 1,041,120 | |
| Series A 7.375% | 33,000 | 766,590 | |
| Hersha Hospitality Trust: | |||
| Series C, 6.875% | 550 | 11,631 | |
| Series D, 6.50% | 42,250 | 869,928 | |
| Hudson Pacific Properties, Inc. Series C, 4.75% | 40,000 | 595,200 | |
| iStar Financial, Inc.: | |||
| Series D, 8.00% | 65,856 | 1,664,181 | |
| Series G, 7.65% | 141,700 | 3,563,755 | |
| Series I, 7.50% | 234,523 | 5,891,218 | |
| National Storage Affiliates Trust Series A, 6.00% | 12,325 | 310,344 | |
| Necessity Retail (REIT), Inc./The: | |||
| 7.50% | 143,698 | 3,418,575 | |
| Series C 7.375% | 145,000 | 3,393,000 | |
| Pebblebrook Hotel Trust: | |||
| 6.30% | 53,702 | 1,140,899 | |
| 6.375% | 55,192 | 1,159,032 | |
| 6.375% | 20,200 | 426,018 | |
| Series H, 5.70% | 104,200 | 1,976,674 | |
| Pennsylvania (REIT): | |||
| Series B, 7.375%(a) | 56,533 | 106,847 | |
| Series C, 7.20%(a) | 9,575 | 17,044 | |
| Series D, 6.875%(a) | 27,400 | 51,649 | |
| Plymouth Industrial REIT, Inc. Series A, 7.50% | 30,350 | 760,268 | |
| Prologis (REIT), Inc. Series Q, 8.54% | 16,850 | 968,707 | |
| Rexford Industrial Realty, Inc.: | |||
| Series B, 5.875% | 50,000 | 1,234,000 | |
| Series C, 5.625% | 11,775 | 286,250 | |
| Saul Centers, Inc.: | |||
| Series D, 6.125% | 15,958 | 374,375 | |
| Series E, 6.00% | 13,475 | 309,521 | |
| SITE Centers Corp. 6.375% | 15,100 | 377,047 | |
| Sotherly Hotels, Inc.: | |||
| Series B, 8.00% | 12,750 | 322,575 | |
| Series C, 7.875% | 19,300 | 492,150 | |
| Spirit Realty Capital, Inc. Series A, 6.00% | 16,575 | 400,784 | |
| Summit Hotel Properties, Inc.: | |||
| Series E, 6.25% | 60,784 | 1,390,118 | |
| Series F, 5.875% | 61,000 | 1,345,032 | |
| Sunstone Hotel Investors, Inc.: | |||
| Series H, 6.125% | 20,000 | 429,000 | |
| Series I, 5.70% | 38,700 | 797,607 | |
| UMH Properties, Inc. Series D, 6.375% | 63,875 | 1,478,706 | |
| Urstadt Biddle Properties, Inc.: | |||
| Series H, 6.25% | 51,175 | 1,166,790 | |
| Series K 5.875% | 28,775 | 631,324 | |
| Vornado Realty Trust: | |||
| Series N, 5.25% | 19,600 | 360,052 | |
| Series O, 4.45% | 55,300 | 896,413 | |
| 61,614,114 | |||
| Real Estate Management & Development - 2.8% | |||
| Brookfield Property Partners LP: | |||
| 5.75% | 7,000 | 127,750 | |
| 6.50% | 5,875 | 119,791 | |
| Digitalbridge Group, Inc.: | |||
| Series H, 7.125% | 147,310 | 3,310,056 | |
| Series I, 7.15% | 225,785 | 5,095,967 | |
| Series J, 7.15% | 185,049 | 4,078,480 | |
| Seritage Growth Properties Series A, 7.00% | 1,050 | 25,232 | |
| 12,757,276 | |||
TOTAL REAL ESTATE | 74,371,390 | ||
| TOTAL NONCONVERTIBLE PREFERRED STOCKS | 137,938,071 | ||
| TOTAL PREFERRED STOCKS (Cost $145,695,875) | 148,727,041 | ||
| Corporate Bonds - 19.4% | |||
Principal Amount (d) | Value ($) | ||
| Convertible Bonds - 1.6% | |||
| FINANCIALS - 0.9% | |||
| Mortgage Real Estate Investment Trusts - 0.9% | |||
| PennyMac Corp. 5.5% 11/1/24 | 1,728,000 | 1,598,400 | |
| Redwood Trust, Inc. 5.625% 7/15/24 | 1,847,000 | 1,747,724 | |
| Two Harbors Investment Corp. 6.25% 1/15/26 | 904,000 | 802,842 | |
| 4,148,966 | |||
| REAL ESTATE - 0.7% | |||
| Real Estate Management & Development - 0.7% | |||
| Digitalbridge Group, Inc. 5% 4/15/23 | 3,062,000 | 3,033,294 | |
| TOTAL CONVERTIBLE BONDS | 7,182,260 | ||
| Nonconvertible Bonds - 17.8% | |||
| COMMUNICATION SERVICES - 0.5% | |||
| Media - 0.5% | |||
| Clear Channel Outdoor Holdings, Inc.: | |||
| 7.5% 6/1/29(e) | 1,140,000 | 929,100 | |
| 7.75% 4/15/28(e) | 1,555,000 | 1,322,885 | |
| 2,251,985 | |||
| CONSUMER DISCRETIONARY - 2.6% | |||
| Hotels, Restaurants & Leisure - 0.8% | |||
| Hilton Grand Vacations Borrower Escrow LLC 4.875% 7/1/31 (e) | 925,000 | 802,142 | |
| Marriott Ownership Resorts, Inc. 4.5% 6/15/29 (e) | 2,000,000 | 1,741,018 | |
| Times Square Hotel Trust 8.528% 8/1/26 (e) | 1,103,479 | 1,098,979 | |
| 3,642,139 | |||
| Household Durables - 1.8% | |||
| Adams Homes, Inc. 7.5% 2/15/25 (e) | 1,550,000 | 1,333,096 | |
| Ashton Woods U.S.A. LLC/Ashton Woods Finance Co.: | |||
| 4.625% 8/1/29(e) | 605,000 | 505,175 | |
| 4.625% 4/1/30(e) | 930,000 | 772,284 | |
| Century Communities, Inc.: | |||
| 3.875% 8/15/29(e) | 1,930,000 | 1,622,464 | |
| 6.75% 6/1/27 | 1,330,000 | 1,311,546 | |
| M/I Homes, Inc. 3.95% 2/15/30 | 1,430,000 | 1,203,002 | |
| New Home Co., Inc. 7.25% 10/15/25 (e) | 1,495,000 | 1,296,913 | |
| 8,044,480 | |||
TOTAL CONSUMER DISCRETIONARY | 11,686,619 | ||
| ENERGY - 0.1% | |||
| Oil, Gas & Consumable Fuels - 0.1% | |||
| EG Global Finance PLC 8.5% 10/30/25 (e) | 305,000 | 287,463 | |
| FINANCIALS - 0.4% | |||
| Diversified Financial Services - 0.4% | |||
| Brixmor Operating Partnership LP 3.85% 2/1/25 | 1,753,000 | 1,698,660 | |
| HEALTH CARE - 1.4% | |||
| Health Care Providers & Services - 1.4% | |||
| Sabra Health Care LP 5.125% 8/15/26 | 6,615,000 | 6,397,993 | |
| INDUSTRIALS - 0.3% | |||
| Trading Companies & Distributors - 0.3% | |||
| Williams Scotsman International, Inc.: | |||
| 4.625% 8/15/28(e) | 750,000 | 694,916 | |
| 6.125% 6/15/25(e) | 648,000 | 651,188 | |
| 1,346,104 | |||
| REAL ESTATE - 12.5% | |||
| Equity Real Estate Investment Trusts (REITs) - 9.3% | |||
| American Finance Trust, Inc./American Finance Operating Partnership LP 4.5% 9/30/28 (e) | 450,000 | 341,819 | |
| American Homes 4 Rent LP 4.25% 2/15/28 | 2,000,000 | 1,916,975 | |
| CBL & Associates LP: | |||
| 4.6% 10/15/24(f)(g) | 3,930,000 | 0 | |
| 5.25% 12/1/23(f)(g) | 3,629,000 | 0 | |
| 5.95% 12/15/26(f)(g) | 2,551,000 | 0 | |
| CTR Partnership LP/CareTrust Capital Corp. 3.875% 6/30/28 (e) | 2,135,000 | 1,911,700 | |
| Global Net Lease, Inc. / Global Net Lease Operating Partnership LP 3.75% 12/15/27 (e) | 925,000 | 781,863 | |
| GLP Capital LP/GLP Financing II, Inc. 5.25% 6/1/25 | 2,375,000 | 2,357,378 | |
| iStar Financial, Inc.: | |||
| 4.25% 8/1/25 | 2,405,000 | 2,386,963 | |
| 5.5% 2/15/26 | 3,015,000 | 3,035,201 | |
| MPT Operating Partnership LP/MPT Finance Corp.: | |||
| 4.625% 8/1/29 | 1,506,000 | 1,170,915 | |
| 5% 10/15/27 | 4,237,000 | 3,581,684 | |
| Office Properties Income Trust: | |||
| 4.25% 5/15/24 | 946,000 | 918,073 | |
| 4.5% 2/1/25 | 3,695,000 | 3,437,662 | |
| Omega Healthcare Investors, Inc.: | |||
| 4.5% 4/1/27 | 483,000 | 465,961 | |
| 4.75% 1/15/28 | 1,616,000 | 1,551,484 | |
| 4.95% 4/1/24 | 659,000 | 653,819 | |
| 5.25% 1/15/26 | 22,000 | 21,868 | |
| Realty Income Corp.: | |||
| 3.1% 12/15/29 | 1,000,000 | 908,778 | |
| 4.6% 2/6/24 | 1,757,000 | 1,749,750 | |
| 4.875% 6/1/26 | 1,593,000 | 1,603,711 | |
| Senior Housing Properties Trust: | |||
| 4.75% 5/1/24 | 1,725,000 | 1,505,063 | |
| 4.75% 2/15/28 | 3,067,000 | 1,869,091 | |
| Service Properties Trust: | |||
| 4.65% 3/15/24 | 1,556,000 | 1,515,148 | |
| 7.5% 9/15/25 | 1,480,000 | 1,455,269 | |
| Uniti Group LP / Uniti Group Finance, Inc. 6.5% 2/15/29 (e) | 4,000,000 | 2,780,000 | |
| Uniti Group, Inc.: | |||
| 6% 1/15/30(e) | 1,040,000 | 689,356 | |
| 7.875% 2/15/25(e) | 1,000,000 | 986,921 | |
| VICI Properties LP / VICI Note Co. 4.625% 12/1/29 (e) | 1,095,000 | 1,019,706 | |
| WP Carey, Inc.: | |||
| 4% 2/1/25 | 422,000 | 412,997 | |
| 4.25% 10/1/26 | 459,000 | 449,757 | |
| XHR LP 6.375% 8/15/25 (e) | 750,000 | 738,807 | |
| 42,217,719 | |||
| Real Estate Management & Development - 3.2% | |||
| DTZ U.S. Borrower LLC 6.75% 5/15/28 (e) | 875,000 | 844,664 | |
| Forestar Group, Inc. 3.85% 5/15/26 (e) | 1,000,000 | 891,095 | |
| Greystar Real Estate Partners 5.75% 12/1/25 (e) | 2,025,000 | 1,991,446 | |
| Howard Hughes Corp.: | |||
| 4.125% 2/1/29(e) | 1,000,000 | 863,520 | |
| 4.375% 2/1/31(e) | 1,090,000 | 905,718 | |
| 5.375% 8/1/28(e) | 970,000 | 898,598 | |
| Kennedy-Wilson, Inc.: | |||
| 4.75% 3/1/29 | 3,800,000 | 3,192,000 | |
| 4.75% 2/1/30 | 3,170,000 | 2,600,145 | |
| Realogy Group LLC/Realogy Co-Issuer Corp. 5.75% 1/15/29 (e) | 2,500,000 | 1,956,250 | |
| Taylor Morrison Communities, Inc./Monarch Communities, Inc. 5.875% 6/15/27 (e) | 202,000 | 198,556 | |
| 14,341,992 | |||
TOTAL REAL ESTATE | 56,559,711 | ||
| TOTAL NONCONVERTIBLE BONDS | 80,228,535 | ||
| TOTAL CORPORATE BONDS (Cost $93,281,833) | 87,410,795 | ||
| Asset-Backed Securities - 4.5% | |||
Principal Amount (d) | Value ($) | ||
| American Homes 4 Rent: | |||
| Series 2014-SFR3 Class E, 6.418% 12/17/36 (e) | 1,841,000 | 1,826,280 | |
| Series 2015-SFR2: | |||
Class E, 6.07% 10/17/52 (e) | 1,624,000 | 1,600,399 | |
Class XS, 0% 10/17/52 (b)(e)(g)(h) | 892,434 | 9 | |
| Conseco Finance Securitizations Corp.: | |||
| Series 2002-1 Class M2, 9.546% 12/1/33 | 1,216,000 | 1,117,169 | |
| Series 2002-2 Class M2, 9.163% 3/1/33 | 1,552,682 | 1,427,511 | |
| FirstKey Homes Trust: | |||
| Series 2021-SFR1 Class F1, 3.238% 8/17/38 (e) | 1,250,000 | 1,077,312 | |
| Series 2021-SFR2 Class F1, 2.908% 9/17/38 (e) | 500,000 | 422,876 | |
| GPMT Ltd. Series 2019-FL2 Class D, 1 month U.S. LIBOR + 2.950% 7.4584% 2/22/36 (b)(c)(e) | 358,000 | 353,723 | |
| Green Tree Financial Corp.: | |||
| Series 1996-4 Class M1, 7.75% 6/15/27 (b) | 2,618 | 2,612 | |
| Series 1997-3 Class M1, 7.53% 3/15/28 | 25,200 | 23,756 | |
| Home Partners of America Trust: | |||
| Series 2021-1 Class F, 3.325% 9/17/41 (e) | 436,304 | 347,417 | |
| Series 2021-2 Class G, 4.505% 12/17/26 (e) | 970,583 | 815,232 | |
| Series 2021-3 Class F, 4.242% 1/17/41 (e) | 1,343,025 | 1,131,112 | |
| Lehman ABS Manufactured Housing Contract Trust Series 2001-B Class M2, 7.17% 4/15/40 | 1,698,364 | 1,200,440 | |
| Progress Residential Trust: | |||
| Series 2019-SFR3 Class F, 3.867% 9/17/36 (e) | 1,000,000 | 945,550 | |
| Series 2019-SFR4 Class F, 3.684% 10/17/36 (e) | 1,000,000 | 952,185 | |
| Series 2020-SFR1 Class H, 5.268% 4/17/37 (e) | 588,000 | 545,316 | |
| Series 2021-SFR2 Class H, 4.998% 4/19/38 (e) | 1,533,000 | 1,337,854 | |
| Series 2021-SFR6: | |||
Class F, 3.422% 7/17/38 (e) | 1,449,000 | 1,236,926 | |
Class G, 4.003% 7/17/38 (e) | 749,000 | 645,821 | |
| Series 2021-SFR8: | |||
Class F, 3.181% 10/17/38 (e) | 934,000 | 788,056 | |
Class G, 4.005% 10/17/38 (e) | 2,351,000 | 2,014,623 | |
| Tricon American Homes Series 2017-SFR2 Class F, 5.104% 1/17/36 (e) | 628,000 | 610,581 | |
| TOTAL ASSET-BACKED SECURITIES (Cost $22,772,925) | 20,422,760 | ||
| Commercial Mortgage Securities - 22.9% | |||
Principal Amount (d) | Value ($) | ||
| BANK: | |||
| Series 2017-BNK4 Class D, 3.357% 5/15/50 (e) | 625,000 | 449,135 | |
| Series 2017-BNK8 Class E, 2.8% 11/15/50 (e) | 1,848,000 | 1,048,454 | |
| Series 2018-BN12 Class D, 3% 5/15/61 (e) | 318,000 | 212,627 | |
| Benchmark Mortgage Trust: | |||
| sequential payer Series 2019-B14: | |||
Class 225D, 3.2943% 12/15/62 (b)(e)(g) | 573,000 | 477,930 | |
Class 225E, 3.2943% 12/15/62 (b)(e)(g) | 859,000 | 581,282 | |
| Series 2020-B18 Class AGNG, 4.3885% 7/15/53 (b)(e) | 2,058,000 | 1,737,053 | |
| Series 2022-B35 Class D, 2.5% 5/15/55 (e) | 1,000,000 | 565,324 | |
| BHP Trust floater Series 2019-BXHP Class F, 1 month U.S. LIBOR + 2.930% 7.397% 8/15/36 (b)(c)(e) | 1,050,000 | 980,507 | |
| BSREP Commercial Mortgage Trust floater Series 2021-DC: | |||
| Class F, 1 month U.S. LIBOR + 2.850% 7.31% 8/15/38 (b)(c)(e) | 107,000 | 87,637 | |
| Class G, 1 month U.S. LIBOR + 3.850% 8.31% 8/15/38 (b)(c)(e) | 250,000 | 202,467 | |
| Bx 2021-Xl2 floater Series 2021-XL2 Class J, 1 month U.S. LIBOR + 3.890% 8.349% 10/15/38 (b)(c)(e) | 570,856 | 532,452 | |
| BX Commercial Mortgage Trust: | |||
| floater Series 2021-VINO Class G, 1 month U.S. LIBOR + 3.950% 8.4113% 5/15/38 (b)(c)(e) | 2,499,000 | 2,334,902 | |
| Series 2020-VIVA: | |||
Class D, 3.5488% 3/11/44 (b)(e) | 1,505,000 | 1,201,498 | |
Class E, 3.5488% 3/11/44 (b)(e) | 2,018,000 | 1,553,863 | |
| BX Trust: | |||
| floater: | |||
Series 2019-IMC Class G, 1 month U.S. LIBOR + 3.600% 8.059% 4/15/34 (b)(c)(e) | 819,000 | 765,277 | |
Series 2019-XL Class J, CME Term SOFR 1 Month Index + 2.760% 7.2425% 10/15/36 (b)(c)(e) | 1,592,900 | 1,540,902 | |
Series 2021-21M Class H, 1 month U.S. LIBOR + 4.010% 8.469% 10/15/36 (b)(c)(e) | 745,012 | 685,285 | |
Series 2021-ACNT Class G, 1 month U.S. LIBOR + 3.290% 7.755% 11/15/38 (b)(c)(e) | 250,000 | 236,717 | |
Series 2021-SDMF Class F, 1 month U.S. LIBOR + 1.930% 6.396% 9/15/34 (b)(c)(e) | 73,000 | 68,432 | |
Series 2021-SOAR Class G, 7.26% 6/15/38 (b)(e) | 992,482 | 945,678 | |
Series 2022-LBA6: | |||
| Class F, CME Term SOFR 1 Month Index + 3.350% 7.828% 1/15/39 (b)(c)(e) | 700,000 | 648,704 | |
| Class G, CME Term SOFR 1 Month Index + 4.200% 8.678% 1/15/39 (b)(c)(e) | 1,491,000 | 1,392,749 | |
| floater sequential payer Series 2021-LGCY Class J, 1 month U.S. LIBOR + 3.190% 7.652% 10/15/36 (b)(c)(e) | 1,558,000 | 1,402,387 | |
| Series 2019-OC11 Class E, 3.944% 12/9/41 (b)(e) | 3,666,000 | 2,946,976 | |
| BXSC Commercial Mortgage Trust floater Series 2022-WSS Class F, 9.808% 3/15/35 (b)(e) | 2,384,000 | 2,300,436 | |
| CAMB Commercial Mortgage Trust floater Series 2019-LIFE Class G, 1 month U.S. LIBOR + 3.250% 7.709% 12/15/37 (b)(c)(e) | 1,021,000 | 956,725 | |
| COMM Mortgage Trust: | |||
| floater Series 2018-HCLV: | |||
Class F, 1 month U.S. LIBOR + 3.150% 7.609% 9/15/33 (b)(c)(e) | 735,000 | 576,526 | |
Class G, 1 month U.S. LIBOR + 5.150% 9.6153% 9/15/33 (b)(c)(e) | 735,000 | 561,736 | |
| sequential payer Series 2013-LC6 Class E, 3.5% 1/10/46 (e) | 1,299,000 | 1,112,752 | |
| Series 2012-CR1: | |||
Class C, 5.3527% 5/15/45 (b) | 3,011,000 | 2,679,543 | |
Class D, 5.3527% 5/15/45 (b)(e) | 1,917,000 | 1,403,540 | |
Class G, 2.462% 5/15/45 (e)(g) | 1,133,000 | 324,147 | |
| Series 2014-UBS2 Class D, 4.9814% 3/10/47 (b)(e) | 537,000 | 479,344 | |
| Series 2017-CD4 Class D, 3.3% 5/10/50 (e) | 1,192,000 | 884,431 | |
| COMM Trust Series 2017-COR2 Class D, 3% 9/10/50 (e) | 31,000 | 22,628 | |
| Commercial Mortgage Trust pass-thru certificates Series 2012-CR2: | |||
| Class D, 4.871% 8/15/45 (b)(e) | 335,313 | 309,349 | |
| Class F, 4.25% 8/15/45 (e) | 783,000 | 555,197 | |
| Credit Suisse Commercial Mortgage Trust floater Series 2021-SOP2 Class F, 1 month U.S. LIBOR + 4.210% 8.6759% 6/15/34 (c)(e) | 800,000 | 718,980 | |
| Credit Suisse Mortgage Trust: | |||
| floater Series 2021-4SZN Class A, CME Term SOFR 1 Month Index + 3.960% 8.4455% 11/15/23 (b)(c)(e) | 1,000,000 | 968,358 | |
| Series 2020-NET: | |||
Class E, 3.7042% 8/15/37 (b)(e) | 500,000 | 432,758 | |
Class F, 3.7042% 8/15/37 (b)(e) | 1,057,000 | 898,783 | |
| CSAIL Commercial Mortgage Trust Series 2017-C8 Class D, 4.4378% 6/15/50 (b)(e) | 1,766,000 | 1,291,327 | |
| DBGS Mortgage Trust Series 2018-C1 Class C, 4.6319% 10/15/51 (b) | 1,000,000 | 861,811 | |
| DBUBS Mortgage Trust Series 2011-LC3A Class D, 5.3553% 8/10/44 (b)(e)(g) | 539,622 | 505,850 | |
| GS Mortgage Securities Trust: | |||
| floater Series 2018-RIVR Class G, 1 month U.S. LIBOR + 2.600% 7.059% 7/15/35 (b)(c)(e)(g) | 669,000 | 443,939 | |
| Series 2011-GC5: | |||
Class C, 5.1538% 8/10/44 (b)(e) | 101,000 | 73,266 | |
Class D, 5.1538% 8/10/44 (b)(e) | 759,236 | 315,254 | |
Class E, 5.1538% 8/10/44 (b)(e)(g) | 848,000 | 76,507 | |
Class F, 4.5% 8/10/44 (e)(g) | 677,000 | 2,375 | |
| Series 2012-GCJ9: | |||
Class D, 4.8029% 11/10/45 (b)(e) | 1,388,758 | 1,284,740 | |
Class E, 4.8029% 11/10/45 (b)(e) | 355,000 | 305,290 | |
| Series 2013-GC16 Class F, 3.5% 11/10/46 (e) | 1,510,000 | 1,375,416 | |
| Series 2016-GS2 Class D, 2.753% 5/10/49 (e) | 1,964,000 | 1,512,066 | |
| Hilton U.S.A. Trust Series 2016-HHV Class F, 4.1935% 11/5/38 (b)(e) | 2,515,000 | 2,178,274 | |
| IMT Trust Series 2017-APTS Class EFX, 3.4966% 6/15/34 (b)(e) | 1,693,000 | 1,567,805 | |
| Independence Plaza Trust Series 2018-INDP Class E, 4.996% 7/10/35 (e) | 504,000 | 473,897 | |
| JPMBB Commercial Mortgage Securities Trust: | |||
| Series 2014-C23 Class UH5, 4.7094% 9/15/47 (e) | 1,624,000 | 1,190,954 | |
| Series 2014-C26 Class D, 3.8743% 1/15/48 (b)(e) | 602,000 | 488,668 | |
| JPMDB Commercial Mortgage Securities Trust Series 2018-C8 Class D, 3.3107% 6/15/51 (b)(e) | 302,000 | 206,198 | |
| JPMorgan Chase Commercial Mortgage Securities Trust: | |||
| sequential payer Series 2021-1MEM Class E, 2.6535% 10/9/42 (b)(e) | 500,000 | 316,355 | |
| Series 2011-C3: | |||
Class E, 5.5251% 2/15/46 (b)(e)(g) | 3,467,000 | 1,518,681 | |
Class G, 4.409% 2/15/46 (b)(e) | 1,680,000 | 143,244 | |
Class H, 4.409% 2/15/46 (b)(e)(g) | 1,320,000 | 115,343 | |
| Series 2012-CBX: | |||
Class E, 4.6896% 6/15/45 (b)(e)(g) | 906,367 | 753,566 | |
Class G 4% 6/15/45 (e) | 805,000 | 186,909 | |
| Series 2013-LC11: | |||
Class D, 4.2611% 4/15/46 (b)(g) | 1,316,000 | 1,102,995 | |
Class F, 3.25% 4/15/46 (b)(e)(g) | 482,000 | 66,805 | |
| Series 2014-DSTY Class E, 3.8046% 6/10/27 (b)(e)(g) | 924,000 | 2,278 | |
| Series 2018-AON Class F, 4.6132% 7/5/31 (b)(e) | 961,000 | 679,093 | |
| Series 2020-NNN Class FFX, 4.6254% 1/16/37 (e) | 1,406,000 | 1,162,465 | |
| LIFE Mortgage Trust floater Series 2021-BMR Class G, 1 month U.S. LIBOR + 2.950% 7.409% 3/15/38 (b)(c)(e) | 1,816,529 | 1,734,642 | |
| MED Trust floater Series 2021-MDLN Class G, 1 month U.S. LIBOR + 5.250% 9.71% 11/15/38 (b)(c)(e) | 1,236,327 | 1,150,068 | |
| Merit floater Series 2021-STOR Class G, 1 month U.S. LIBOR + 2.750% 7.209% 7/15/38 (b)(c)(e) | 250,000 | 237,482 | |
| MHC Commercial Mortgage Trust floater Series 2021-MHC: | |||
| Class F, 1 month U.S. LIBOR + 2.600% 7.06% 4/15/38 (b)(c)(e) | 694,000 | 669,690 | |
| Class G, 1 month U.S. LIBOR + 3.200% 7.66% 4/15/38 (b)(c)(e) | 846,000 | 810,016 | |
| MHP Commercial Mortgage Trust floater Series 2022-MHIL Class G, CME Term SOFR 1 Month Index + 3.950% 8.4355% 1/15/27 (b)(c)(e) | 2,489,389 | 2,323,622 | |
| Morgan Stanley BAML Trust: | |||
| Series 2012-C6 Class D, 4.5398% 11/15/45 (b)(e) | 2,000,000 | 1,760,549 | |
| Series 2012-C6, Class F, 4.5398% 11/15/45 (b)(e) | 1,000,000 | 775,085 | |
| Series 2013-C12 Class D, 4.7613% 10/15/46 (b)(e) | 1,500,000 | 1,335,775 | |
| Series 2013-C13: | |||
Class D, 4.8952% 11/15/46 (b)(e) | 2,994,000 | 2,768,055 | |
Class E, 4.8952% 11/15/46 (b)(e) | 659,000 | 574,870 | |
| Series 2013-C9 Class C, 4.014% 5/15/46 (b) | 625,000 | 563,161 | |
| Series 2016-C30 Class D, 3% 9/15/49 (e) | 522,000 | 339,359 | |
| Morgan Stanley Capital I Trust: | |||
| Series 1998-CF1 Class G, 7.35% 7/15/32 (b)(e) | 10,001 | 9,915 | |
| Series 2011-C2: | |||
Class D, 5.2113% 6/15/44 (b)(e) | 1,504,772 | 1,417,601 | |
Class F, 5.2113% 6/15/44 (b)(e)(g) | 1,467,000 | 941,084 | |
Class XB, 0.445% 6/15/44 (b)(e)(h) | 23,392,544 | 85,502 | |
| Series 2011-C3: | |||
Class C, 5.0825% 7/15/49 (b)(e) | 368,958 | 364,159 | |
Class D, 5.0825% 7/15/49 (b)(e) | 83,000 | 80,440 | |
Class E, 5.0825% 7/15/49 (b)(e)(g) | 652,000 | 562,161 | |
Class F, 5.0825% 7/15/49 (b)(e)(g) | 636,000 | 405,181 | |
Class G, 5.0825% 7/15/49 (b)(e)(g) | 979,600 | 546,438 | |
| Series 2015-MS1 Class D, 4.024% 5/15/48 (b)(e) | 2,045,000 | 1,690,282 | |
| Series 2016-BNK2 Class C, 3% 11/15/49 (e)(g) | 2,346,000 | 1,736,223 | |
| MSJP Commercial Securities Mortgage Trust Series 2015-HAUL Class E, 4.851% 9/5/47 (b)(e) | 1,000,000 | 693,016 | |
| Natixis Commercial Mortgage Securities Trust floater Series 2018-FL1 Class WAN2, 1 month U.S. LIBOR + 3.750% 8.209% 6/15/35 (b)(c)(e) | 113,725 | 87,020 | |
| OPG Trust floater Series 2021-PORT Class J, 1 month U.S. LIBOR + 3.340% 7.805% 10/15/36 (b)(c)(e) | 342,687 | 318,336 | |
| PKHL Commercial Mortgage Trust floater Series 2021-MF Class G, 1 month U.S. LIBOR + 4.350% 8.81% 7/15/38 (b)(c)(e) | 500,000 | 454,886 | |
| Prima Capital CRE Securitization Ltd. Series 2020-8A Class C, 3% 12/1/70 (e) | 250,000 | 188,896 | |
| Providence Place Group Ltd. Partnership Series 2000-C1 Class A2, 7.75% 7/20/28 (e) | 813,490 | 842,836 | |
| ReadyCap Commercial Mortgage Trust floater Series 2019-FL3 Class D, 1 month U.S. LIBOR + 2.900% 7.4059% 3/25/34 (b)(c)(e) | 599,000 | 588,412 | |
| SG Commercial Mortgage Securities Trust Series 2019-PREZ Class F, 3.4771% 9/15/39 (b)(e) | 2,000,000 | 1,468,735 | |
| SMRT Commercial Mortgage Trust floater Series 2022-MINI Class F, CME Term SOFR 1 Month Index + 3.350% 7.829% 1/15/39 (b)(c)(e) | 1,633,000 | 1,512,307 | |
| SREIT Trust floater: | |||
| Series 2021-IND Class G, 1 month U.S. LIBOR + 3.260% 7.7248% 10/15/38 (b)(c)(e) | 1,573,000 | 1,443,604 | |
| Series 2021-MFP2 Class J, 1 month U.S. LIBOR + 3.910% 8.3745% 11/15/36 (b)(c)(e) | 1,000,000 | 936,991 | |
| STWD Trust floater sequential payer Series 2021-LIH Class G, 1 month U.S. LIBOR + 4.200% 8.659% 11/15/36 (b)(c)(e) | 1,280,000 | 1,193,336 | |
| TPGI Trust floater Series 2021-DGWD Class G, 1 month U.S. LIBOR + 3.850% 8.31% 6/15/26 (b)(c)(e) | 1,176,000 | 1,114,783 | |
| UBS Commercial Mortgage Trust Series 2012-C1: | |||
| Class D, 6.6333% 5/10/45 (b)(e) | 68,841 | 62,574 | |
| Class E, 5% 5/10/45 (b)(e)(g) | 1,236,000 | 481,793 | |
| Class F, 5% 5/10/45 (b)(e)(g) | 399,000 | 19,083 | |
| UBS-BAMLL Trust Series 12-WRM Class D, 4.238% 6/10/30 (b)(e)(g) | 1,817,000 | 1,640,483 | |
| VMC Finance Ltd. floater Series 2021-HT1 Class B, 1 month U.S. LIBOR + 4.500% 8.97% 1/18/37 (b)(c)(e) | 2,528,000 | 2,381,829 | |
| Wells Fargo Commercial Mortgage Trust: | |||
| Series 2016-BNK1 Class D, 3% 8/15/49 (e) | 1,260,000 | 758,902 | |
| Series 2016-NXS6 Class D, 3.059% 11/15/49 (e) | 963,000 | 724,500 | |
| WF-RBS Commercial Mortgage Trust: | |||
| sequential payer Series 2011-C4I Class G, 5% 6/15/44 (b)(g) | 45,000 | 2,861 | |
| Series 2011-C3: | |||
Class D, 5.3781% 3/15/44 (b)(e) | 2,576,132 | 966,050 | |
Class E, 5% 3/15/44 (e)(g) | 34,000 | 169 | |
| Series 2011-C5: | |||
Class E, 5.5718% 11/15/44 (b)(e) | 365,213 | 346,372 | |
Class F, 5.25% 11/15/44 (b)(e) | 2,000,000 | 1,816,454 | |
Class G, 5.25% 11/15/44 (b)(e) | 1,000,000 | 867,820 | |
| Series 2013-C11 Class E, 4.2033% 3/15/45 (b)(e) | 53,000 | 42,930 | |
| Series 2013-C13 Class D, 4.2111% 5/15/45 (b)(e) | 45,000 | 43,909 | |
| WP Glimcher Mall Trust Series 2015-WPG: | |||
| Class PR1, 3.516% 6/5/35 (b)(e) | 1,168,000 | 947,260 | |
| Class PR2, 3.516% 6/5/35 (b)(e) | 459,000 | 350,172 | |
| TOTAL COMMERCIAL MORTGAGE SECURITIES (Cost $120,573,212) | 103,162,521 | ||
| Bank Loan Obligations - 4.3% | |||
Principal Amount (d) | Value ($) | ||
| CONSUMER DISCRETIONARY - 0.3% | |||
| Hotels, Restaurants & Leisure - 0.3% | |||
| BRE/Everbright M6 Borrower LLC Tranche B 1LN, term loan 1 month U.S. LIBOR + 5.000% 9.4299% 9/9/26 (b)(c)(i) | 1,155,000 | 1,145,379 | |
| Hilton Grand Vacations Borrower LLC Tranche B 1LN, term loan 1 month U.S. LIBOR + 3.000% 7.5697% 8/2/28 (b)(c)(i) | 354,733 | 354,669 | |
| 1,500,048 | |||
| FINANCIALS - 4.0% | |||
| Diversified Financial Services - 4.0% | |||
| Agellan Portfolio 9% 8/7/25 (g)(i) | 1,217,000 | 1,217,000 | |
| Mhp 2022-Mhil Mezz U.S. Secured Overnight Fin. Rate (SOFR) Index + 5.000% 9.478% 1/9/24 (b)(c)(g)(i) | 7,578,870 | 7,199,917 | |
| Sunbelt Mezz U.S. Secured Overnight Fin. Rate (SOFR) Index + 4.450% 8.8986% 1/21/27 (b)(c)(g)(i) | 4,575,631 | 4,575,631 | |
| Veritas Multifamily Portfolio 1 month U.S. LIBOR + 8.500% 12.8179% 11/15/23 (b)(c)(g)(i) | 5,305,035 | 4,827,581 | |
| 17,820,129 | |||
| TOTAL BANK LOAN OBLIGATIONS (Cost $20,178,074) | 19,320,177 | ||
| Money Market Funds - 1.7% | |||
| Shares | Value ($) | ||
Fidelity Cash Central Fund 4.38% (j) (Cost $7,851,469) | 7,849,899 | 7,851,469 | |
| TOTAL INVESTMENT IN SECURITIES - 99.4% (Cost $458,414,325) | 448,807,854 |
NET OTHER ASSETS (LIABILITIES) - 0.6% | 2,789,896 |
| NET ASSETS - 100.0% | 451,597,750 |
| (a) | Non-income producing |
| (b) | Coupon rates for floating and adjustable rate securities reflect the rates in effect at period end. |
| (c) | Coupon is indexed to a floating interest rate which may be multiplied by a specified factor and/or subject to caps or floors. |
| (d) | Amount is stated in United States dollars unless otherwise noted. |
| (e) | Security exempt from registration under Rule 144A of the Securities Act of 1933. These securities may be resold in transactions exempt from registration, normally to qualified institutional buyers. At the end of the period, the value of these securities amounted to $145,461,064 or 32.2% of net assets. |
| (f) | Non-income producing - Security is in default. |
| (g) | Level 3 security |
| (h) | Interest Only (IO) security represents the right to receive only monthly interest payments on an underlying pool of mortgages or assets. Principal shown is the outstanding par amount of the pool as of the end of the period. |
| (i) | Remaining maturities of bank loan obligations may be less than the stated maturities shown as a result of contractual or optional prepayments by the borrower. Such prepayments cannot be predicted with certainty. |
| (j) | Affiliated fund that is generally available only to investment companies and other accounts managed by Fidelity Investments. The rate quoted is the annualized seven-day yield of the fund at period end. A complete unaudited listing of the fund's holdings as of its most recent quarter end is available upon request. In addition, each Fidelity Central Fund's financial statements are available on the SEC's website or upon request. |
| Affiliate | Value, beginning of period ($) | Purchases ($) | Sales Proceeds ($) | Dividend Income ($) | Realized Gain (loss) ($) | Change in Unrealized appreciation (depreciation) ($) | Value, end of period ($) | % ownership, end of period |
| Fidelity Cash Central Fund 4.38% | 74,307,966 | 191,623,820 | 258,080,317 | 620,916 | - | - | 7,851,469 | 0.0% |
| Fidelity Securities Lending Cash Central Fund 4.38% | - | 61,616 | 61,616 | 2 | - | - | - | 0.0% |
| Total | 74,307,966 | 191,685,436 | 258,141,933 | 620,918 | - | - | 7,851,469 | |
| Valuation Inputs at Reporting Date: | ||||
| Description | Total ($) | Level 1 ($) | Level 2 ($) | Level 3 ($) |
Investments in Securities: | ||||
| Equities: | ||||
Energy | 7,085,475 | 7,085,475 | - | - |
Financials | 66,043,753 | 59,657,672 | 6,386,081 | - |
Information Technology | 121,716 | 121,716 | - | - |
Real Estate | 137,389,188 | 132,986,299 | 4,402,889 | - |
| Corporate Bonds | 87,410,795 | - | 87,410,795 | - |
| Asset-Backed Securities | 20,422,760 | - | 20,422,751 | 9 |
| Commercial Mortgage Securities | 103,162,521 | - | 90,855,347 | 12,307,174 |
| Bank Loan Obligations | 19,320,177 | - | 1,500,048 | 17,820,129 |
| Money Market Funds | 7,851,469 | 7,851,469 | - | - |
| Total Investments in Securities: | 448,807,854 | 207,702,631 | 210,977,911 | 30,127,312 |
| Investments in Securities: | |||
| Bank Loan Obligations | |||
| Beginning Balance | $ | 18,584,090 | |
| Net Realized Gain (Loss) on Investment Securities | 38 | ||
| Net Unrealized Gain (Loss) on Investment Securities | (543,428) | ||
| Cost of Purchases | - | ||
| Proceeds of Sales | (221,168) | ||
| Amortization/Accretion | 597 | ||
| Transfers into Level 3 | - | ||
| Transfers out of Level 3 | - | ||
| Ending Balance | $ | 17,820,129 | |
| The change in unrealized gain (loss) for the period attributable to Level 3 securities held at January 31, 2023 | $ | (543,428) | |
| Commercial Mortgage Securities | |||
| Beginning Balance | $ | 8,801,478 | |
| Net Realized Gain (Loss) on Investment Securities | (348,424) | ||
| Net Unrealized Gain (Loss) on Investment Securities | 579,001 | ||
| Cost of Purchases | - | ||
| Proceeds of Sales | (397,982) | ||
| Amortization/Accretion | (56,175) | ||
| Transfers into Level 3 | 7,712,672 | ||
| Transfers out of Level 3 | (3,983,396) | ||
| Ending Balance | $ | 12,307,174 | |
| The change in unrealized gain (loss) for the period attributable to Level 3 securities held at January 31, 2023 | $ | 298,932 | |
| Other Investments in Securities | |||
| Beginning Balance | $ | 9 | |
| Net Realized Gain (Loss) on Investment Securities | - | ||
| Net Unrealized Gain (Loss) on Investment Securities | - | ||
| Cost of Purchases | - | ||
| Proceeds of Sales | - | ||
| Amortization/Accretion | - | ||
| Transfers into Level 3 | - | ||
| Transfers out of Level 3 | - | ||
| Ending Balance | $ | 9 | |
| The change in unrealized gain (loss) for the period attributable to Level 3 securities held at January 31, 2023 | $ | - | |
| The information used in the above reconciliation represents fiscal year to date activity for any Investments in Securities identified as using Level 3 inputs at either the beginning or the end of the current fiscal period. Cost of purchases and proceeds of sales may include securities received and/or delivered through in-kind transactions. Transfers into Level 3 were attributable to a lack of observable market data resulting from decreases in market activity, decreases in liquidity, security restructurings or corporate actions. Transfers out of Level 3 were attributable to observable market data becoming available for those securities. Transfers in or out of Level 3 represent the beginning value of any Security or Instrument where a change in the pricing level occurred from the beginning to the end of the period. The cost of purchases and the proceeds of sales may include securities received or delivered through corporate actions or exchanges. Realized and unrealized gains (losses) disclosed in the reconciliation are included in Net Gain (Loss) on the Fund's Statement of Operations. | |||
| Statement of Assets and Liabilities | ||||
January 31, 2023 (Unaudited) | ||||
| Assets | ||||
| Investment in securities, at value - See accompanying schedule: | ||||
Unaffiliated issuers (cost $450,562,856) | $ | 440,956,385 | ||
Fidelity Central Funds (cost $7,851,469) | 7,851,469 | |||
| Total Investment in Securities (cost $458,414,325) | $ | 448,807,854 | ||
| Receivable for investments sold | 11,035 | |||
| Receivable for fund shares sold | 19,900,622 | |||
| Dividends receivable | 332,426 | |||
| Interest receivable | 2,564,086 | |||
| Distributions receivable from Fidelity Central Funds | 68,226 | |||
Total assets | 471,684,249 | |||
| Liabilities | ||||
| Payable for fund shares redeemed | $ | 20,085,876 | ||
| Other payables and accrued expenses | 623 | |||
| Total Liabilities | 20,086,499 | |||
| Net Assets | $ | 451,597,750 | ||
| Net Assets consist of: | ||||
| Paid in capital | $ | 475,734,848 | ||
| Total accumulated earnings (loss) | (24,137,098) | |||
| Net Assets | $ | 451,597,750 | ||
Net Asset Value , offering price and redemption price per share ($451,597,750 ÷ 45,245,689 shares) | $ | 9.98 | ||
| Statement of Operations | ||||
Six months ended January 31, 2023 (Unaudited) | ||||
| Investment Income | ||||
| Dividends | $ | 7,162,692 | ||
| Interest | 9,095,037 | |||
| Income from Fidelity Central Funds (including $2 from security lending) | 620,918 | |||
| Total Income | 16,878,647 | |||
| Expenses | ||||
| Custodian fees and expenses | $ | 5,336 | ||
| Independent trustees' fees and expenses | 1,041 | |||
| Total expenses before reductions | 6,377 | |||
| Expense reductions | (1,802) | |||
| Total expenses after reductions | 4,575 | |||
| Net Investment income (loss) | 16,874,072 | |||
| Realized and Unrealized Gain (Loss) | ||||
| Net realized gain (loss) on: | ||||
| Investment Securities: | ||||
| Unaffiliated issuers | (14,587,115) | |||
| Foreign currency transactions | (62) | |||
| Total net realized gain (loss) | (14,587,177) | |||
| Change in net unrealized appreciation (depreciation) on investment securities | (13,108,026) | |||
| Net gain (loss) | (27,695,203) | |||
| Net increase (decrease) in net assets resulting from operations | $ | (10,821,131) | ||
| Statement of Changes in Net Assets | ||||
Six months ended January 31, 2023 (Unaudited) | Year ended July 31, 2022 | |||
| Increase (Decrease) in Net Assets | ||||
| Operations | ||||
| Net investment income (loss) | $ | 16,874,072 | $ | 45,858,726 |
| Net realized gain (loss) | (14,587,177) | 23,716,854 | ||
| Change in net unrealized appreciation (depreciation) | (13,108,026) | (106,111,925) | ||
| Net increase (decrease) in net assets resulting from operations | (10,821,131) | (36,536,345) | ||
| Distributions to shareholders | (42,077,380) | (50,959,619) | ||
| Share transactions | ||||
| Proceeds from sales of shares | 59,127,646 | 53,121,264 | ||
| Reinvestment of distributions | 42,077,380 | 50,959,619 | ||
| Cost of shares redeemed | (278,350,531) | (382,144,760) | ||
Net increase (decrease) in net assets resulting from share transactions | (177,145,505) | (278,063,877) | ||
| Total increase (decrease) in net assets | (230,044,016) | (365,559,841) | ||
| Net Assets | ||||
| Beginning of period | 681,641,766 | 1,047,201,607 | ||
| End of period | $ | 451,597,750 | $ | 681,641,766 |
| Other Information | ||||
| Shares | ||||
| Sold | 6,027,689 | 4,694,984 | ||
| Issued in reinvestment of distributions | 4,251,729 | 4,460,414 | ||
| Redeemed | (28,495,465) | (34,667,147) | ||
| Net increase (decrease) | (18,216,047) | (25,511,749) | ||
| Fidelity® Series Real Estate Income Fund |
Six months ended (Unaudited) January 31, 2023 | Years ended July 31, 2022 | 2021 | 2020 | 2019 | 2018 | |||||||
Selected Per-Share Data | ||||||||||||
| Net asset value, beginning of period | $ | 10.74 | $ | 11.77 | $ | 9.94 | $ | 11.21 | $ | 10.97 | $ | 11.34 |
| Income from Investment Operations | ||||||||||||
Net investment income (loss) A,B | .30 | .55 | .45 | .56 | .61 | .59 | ||||||
| Net realized and unrealized gain (loss) | (.32) | (.97) | 1.90 | (1.16) | .42 | (.20) | ||||||
| Total from investment operations | (.02) | (.42) | 2.35 | (.60) | 1.03 | .39 | ||||||
| Distributions from net investment income | (.42) | (.52) | (.45) | (.55) | (.62) | (.60) | ||||||
| Distributions from net realized gain | (.32) | (.09) | (.07) | (.12) | (.17) | (.16) | ||||||
| Total distributions | (.74) | (.61) | (.52) | (.67) | (.79) | (.76) | ||||||
| Net asset value, end of period | $ | 9.98 | $ | 10.74 | $ | 11.77 | $ | 9.94 | $ | 11.21 | $ | 10.97 |
Total Return C,D | (.04)% | (3.78)% | 24.48% | (5.68)% | 9.91% | 3.61% | ||||||
Ratios to Average Net Assets B,E,F | ||||||||||||
Expenses before reductions G | -% H | -% | -% | -% | -% | -% | ||||||
Expenses net of fee waivers, if any G | -% H | -% | -% | -% | -% | -% | ||||||
Expenses net of all reductions G | -% H | -% | -% | -% | -% | -% | ||||||
| Net investment income (loss) | 6.11% H | 4.83% | 4.21% | 5.36% | 5.67% | 5.36% | ||||||
| Supplemental Data | ||||||||||||
| Net assets, end of period (000 omitted) | $ | 451,598 | $ | 681,642 | $ | 1,047,202 | $ | 935,054 | $ | 971,641 | $ | 907,388 |
Portfolio turnover rate I | -% H | 19% | 23% | 25% J | 16% | 27% |
| Fidelity Central Fund | Investment Manager | Investment Objective | Investment Practices | Expense Ratio A |
| Fidelity Money Market Central Funds | Fidelity Management & Research Company LLC (FMR) | Each fund seeks to obtain a high level of current income consistent with the preservation of capital and liquidity. | Short-term Investments | Less than .005% |
| Asset Type | Fair Value | Valuation Technique(s) | Unobservable Input | Amount or Range/Weighted Average | Impact to Valuation from an Increase in Input A |
| Corporate Bonds | $- | Recovery value | Recovery value | $0.00 | Increase |
| Asset-Backed Securities | $9 | Indicative market price | Evaluated bid | $0.00 | Increase |
| Commercial Mortgage Securities | $12,307,174 | Indicative market price | Evaluated bid | $0.25 - $93.74 / $69.08 | Increase |
| Bank Loan Obligations | $17,820,129 | Discounted cash flow | Yield | 8.4% - 20.7% / 12.7% | Decrease |
| Gross unrealized appreciation | $31,237,977 |
| Gross unrealized depreciation | (40,872,369) |
| Net unrealized appreciation (depreciation) | $(9,634,392) |
| Tax cost | $458,442,246 |
| Purchases ($) | Sales ($) | |
| Fidelity Series Real Estate Income Fund | 498,498 | 178,198,978 |
| Amount | |
| Fidelity Series Real Estate Income Fund | $168 |
| Purchases ($) | Sales ($) | Realized Gain (Loss) ($) | |
| Fidelity Series Real Estate Income Fund | - | 272,347 | 120,137 |
| Total Security Lending Fees Paid to NFS | Security Lending Income From Securities Loaned to NFS | Value of Securities Loaned to NFS at Period End | |
| Fidelity Series Real Estate Income Fund | $- A | $- | $- |
| The Example is based on an investment of $1,000 invested at the beginning of the period and held for the entire period (August 1, 2022 to January 31, 2023). |
Annualized Expense Ratio- A | Beginning Account Value August 1, 2022 | Ending Account Value January 31, 2023 | Expenses Paid During Period- C August 1, 2022 to January 31, 2023 | |||||||
| Fidelity® Series Real Estate Income Fund | -%- D | |||||||||
| Actual | $ 1,000 | $ 999.60 | $- E | |||||||
Hypothetical- B | $ 1,000 | $ 1,025.21 | $- E | |||||||
- Highly liquid investments - cash or convertible to cash within three business days or less
- Moderately liquid investments - convertible to cash in three to seven calendar days
- Less liquid investments - can be sold or disposed of, but not settled, within seven calendar days
- Illiquid investments - cannot be sold or disposed of within seven calendar days
|


Contents
Top Holdings (% of Fund's net assets) | ||
| Exxon Mobil Corp. | 6.8 | |
| Berkshire Hathaway, Inc. Class B | 4.7 | |
| Cigna Corp. | 4.7 | |
| Comcast Corp. Class A | 4.1 | |
| Alphabet, Inc. Class A | 3.8 | |
| JPMorgan Chase & Co. | 3.6 | |
| Activision Blizzard, Inc. | 3.5 | |
| Centene Corp. | 3.3 | |
| PG&E Corp. | 3.1 | |
| Samsung Electronics Co. Ltd. | 3.0 | |
| 40.6 | ||
| Market Sectors (% of Fund's net assets) | ||
| Financials | 19.7 | |
| Health Care | 19.0 | |
| Communication Services | 11.4 | |
| Energy | 11.4 | |
| Utilities | 8.4 | |
| Industrials | 8.2 | |
| Information Technology | 7.0 | |
| Consumer Discretionary | 4.7 | |
| Consumer Staples | 4.6 | |
| Materials | 3.3 | |
Asset Allocation (% of Fund's net assets) |
 |
Foreign investments - 17.3% |
Geographic Diversification (% of Fund's net assets) |
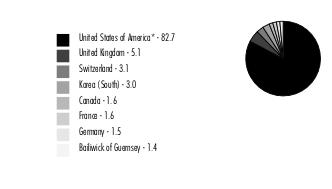 |
* Includes Short-Term investments and Net Other Assets (Liabilities). Percentages are based on country or territory of incorporation and are adjusted for the effect of derivatives, if applicable. |
| Common Stocks - 94.7% | |||
| Shares | Value ($) | ||
| COMMUNICATION SERVICES - 11.4% | |||
| Entertainment - 3.5% | |||
| Activision Blizzard, Inc. | 381,800 | 29,234,426 | |
| Interactive Media & Services - 3.8% | |||
| Alphabet, Inc. Class A (a) | 317,600 | 31,391,584 | |
| Media - 4.1% | |||
| Comcast Corp. Class A | 878,700 | 34,576,845 | |
TOTAL COMMUNICATION SERVICES | 95,202,855 | ||
| CONSUMER DISCRETIONARY - 4.7% | |||
| Diversified Consumer Services - 2.8% | |||
| H&R Block, Inc. | 613,720 | 23,922,806 | |
| Multiline Retail - 1.0% | |||
| Dollar General Corp. | 35,600 | 8,316,160 | |
| Specialty Retail - 0.9% | |||
| Ross Stores, Inc. | 62,400 | 7,375,056 | |
TOTAL CONSUMER DISCRETIONARY | 39,614,022 | ||
| CONSUMER STAPLES - 4.6% | |||
| Food Products - 2.8% | |||
| Mondelez International, Inc. | 230,800 | 15,103,552 | |
| Tyson Foods, Inc. Class A | 128,800 | 8,468,600 | |
| 23,572,152 | |||
| Household Products - 1.8% | |||
| Reckitt Benckiser Group PLC | 178,800 | 12,741,456 | |
| Spectrum Brands Holdings, Inc. | 27,200 | 1,846,336 | |
| 14,587,792 | |||
TOTAL CONSUMER STAPLES | 38,159,944 | ||
| ENERGY - 11.4% | |||
| Oil, Gas & Consumable Fuels - 11.4% | |||
| ConocoPhillips Co. | 202,800 | 24,715,236 | |
| Exxon Mobil Corp. | 490,400 | 56,891,304 | |
| Ovintiv, Inc. | 166,000 | 8,172,180 | |
| Parex Resources, Inc. | 317,300 | 5,401,409 | |
| 95,180,129 | |||
| FINANCIALS - 19.7% | |||
| Banks - 9.4% | |||
| Bank of America Corp. | 586,700 | 20,816,116 | |
| JPMorgan Chase & Co. | 216,800 | 30,343,328 | |
| M&T Bank Corp. | 73,900 | 11,528,400 | |
| PNC Financial Services Group, Inc. | 95,200 | 15,748,936 | |
| 78,436,780 | |||
| Diversified Financial Services - 4.7% | |||
| Berkshire Hathaway, Inc. Class B (a) | 127,100 | 39,594,192 | |
| Insurance - 5.6% | |||
| Chubb Ltd. | 73,800 | 16,788,762 | |
| The Travelers Companies, Inc. | 68,100 | 13,015,272 | |
| Willis Towers Watson PLC | 65,500 | 16,649,445 | |
| 46,453,479 | |||
TOTAL FINANCIALS | 164,484,451 | ||
| HEALTH CARE - 19.0% | |||
| Biotechnology - 1.0% | |||
| Regeneron Pharmaceuticals, Inc. (a) | 11,200 | 8,494,864 | |
| Health Care Providers & Services - 13.8% | |||
| Centene Corp. (a) | 360,200 | 27,461,648 | |
| Cigna Corp. | 123,100 | 38,982,077 | |
| Elevance Health, Inc. | 34,100 | 17,049,659 | |
| Humana, Inc. | 26,700 | 13,662,390 | |
| UnitedHealth Group, Inc. | 36,100 | 18,020,759 | |
| 115,176,533 | |||
| Pharmaceuticals - 4.2% | |||
| AstraZeneca PLC sponsored ADR | 186,667 | 12,202,422 | |
| Roche Holding AG (participation certificate) | 29,570 | 9,230,879 | |
| Sanofi SA sponsored ADR | 266,900 | 13,115,466 | |
| 34,548,767 | |||
TOTAL HEALTH CARE | 158,220,164 | ||
| INDUSTRIALS - 8.2% | |||
| Aerospace & Defense - 3.6% | |||
| Northrop Grumman Corp. | 29,500 | 13,217,180 | |
| The Boeing Co. (a) | 78,500 | 16,720,500 | |
| 29,937,680 | |||
| Electrical Equipment - 1.6% | |||
| Regal Rexnord Corp. | 96,600 | 13,446,720 | |
| Industrial Conglomerates - 1.5% | |||
| Siemens AG | 80,700 | 12,605,766 | |
| Machinery - 1.5% | |||
| Oshkosh Corp. | 123,900 | 12,486,642 | |
TOTAL INDUSTRIALS | 68,476,808 | ||
| INFORMATION TECHNOLOGY - 4.0% | |||
| IT Services - 2.4% | |||
| Amdocs Ltd. | 127,300 | 11,702,689 | |
| Cognizant Technology Solutions Corp. Class A | 133,400 | 8,904,450 | |
| 20,607,139 | |||
| Software - 1.6% | |||
| Gen Digital, Inc. | 570,300 | 13,122,603 | |
TOTAL INFORMATION TECHNOLOGY | 33,729,742 | ||
| MATERIALS - 3.3% | |||
| Chemicals - 2.3% | |||
| DuPont de Nemours, Inc. | 260,600 | 19,271,370 | |
| Metals & Mining - 1.0% | |||
| Lundin Mining Corp. | 1,117,600 | 8,458,331 | |
TOTAL MATERIALS | 27,729,701 | ||
| UTILITIES - 8.4% | |||
| Electric Utilities - 7.3% | |||
| Constellation Energy Corp. | 178,533 | 15,239,577 | |
| NextEra Energy, Inc. | 91,000 | 6,791,330 | |
| PG&E Corp. (a) | 1,617,200 | 25,713,480 | |
| Southern Co. | 200,800 | 13,590,144 | |
| 61,334,531 | |||
| Independent Power and Renewable Electricity Producers - 1.1% | |||
| The AES Corp. | 329,700 | 9,037,077 | |
TOTAL UTILITIES | 70,371,608 | ||
| TOTAL COMMON STOCKS (Cost $639,040,476) | 791,169,424 | ||
| Nonconvertible Preferred Stocks - 3.0% | |||
| Shares | Value ($) | ||
| INFORMATION TECHNOLOGY - 3.0% | |||
| Technology Hardware, Storage & Peripherals - 3.0% | |||
Samsung Electronics Co. Ltd. (Cost $24,360,771) | 555,470 | 24,895,795 | |
| Money Market Funds - 2.3% | |||
| Shares | Value ($) | ||
Fidelity Cash Central Fund 4.38% (b) (Cost $19,091,003) | 19,087,186 | 19,091,003 | |
| TOTAL INVESTMENT IN SECURITIES - 100.0% (Cost $682,492,250) | 835,156,222 |
NET OTHER ASSETS (LIABILITIES) - 0.0% | 90,058 |
| NET ASSETS - 100.0% | 835,246,280 |
| (a) | Non-income producing |
| (b) | Affiliated fund that is generally available only to investment companies and other accounts managed by Fidelity Investments. The rate quoted is the annualized seven-day yield of the fund at period end. A complete unaudited listing of the fund's holdings as of its most recent quarter end is available upon request. In addition, each Fidelity Central Fund's financial statements are available on the SEC's website or upon request. |
| Affiliate | Value, beginning of period ($) | Purchases ($) | Sales Proceeds ($) | Dividend Income ($) | Realized Gain (loss) ($) | Change in Unrealized appreciation (depreciation) ($) | Value, end of period ($) | % ownership, end of period |
| Fidelity Cash Central Fund 4.38% | 27,866,227 | 128,474,003 | 137,249,227 | 640,706 | - | - | 19,091,003 | 0.0% |
| Fidelity Securities Lending Cash Central Fund 4.38% | - | 61,719,668 | 61,719,668 | 4,585 | - | - | - | 0.0% |
| Total | 27,866,227 | 190,193,671 | 198,968,895 | 645,291 | - | - | 19,091,003 | |
| Valuation Inputs at Reporting Date: | ||||
| Description | Total ($) | Level 1 ($) | Level 2 ($) | Level 3 ($) |
Investments in Securities: | ||||
| Equities: | ||||
Communication Services | 95,202,855 | 95,202,855 | - | - |
Consumer Discretionary | 39,614,022 | 39,614,022 | - | - |
Consumer Staples | 38,159,944 | 25,418,488 | 12,741,456 | - |
Energy | 95,180,129 | 95,180,129 | - | - |
Financials | 164,484,451 | 164,484,451 | - | - |
Health Care | 158,220,164 | 148,989,285 | 9,230,879 | - |
Industrials | 68,476,808 | 55,871,042 | 12,605,766 | - |
Information Technology | 58,625,537 | 33,729,742 | 24,895,795 | - |
Materials | 27,729,701 | 27,729,701 | - | - |
Utilities | 70,371,608 | 70,371,608 | - | - |
| Money Market Funds | 19,091,003 | 19,091,003 | - | - |
| Total Investments in Securities: | 835,156,222 | 775,682,326 | 59,473,896 | - |
| Statement of Assets and Liabilities | ||||
January 31, 2023 (Unaudited) | ||||
| Assets | ||||
| Investment in securities, at value - See accompanying schedule: | ||||
Unaffiliated issuers (cost $663,401,247) | $ | 816,065,219 | ||
Fidelity Central Funds (cost $19,091,003) | 19,091,003 | |||
| Total Investment in Securities (cost $682,492,250) | $ | 835,156,222 | ||
| Receivable for fund shares sold | 512,383 | |||
| Dividends receivable | 668,704 | |||
| Distributions receivable from Fidelity Central Funds | 137,223 | |||
| Prepaid expenses | 690 | |||
| Other receivables | 5 | |||
Total assets | 836,475,227 | |||
| Liabilities | ||||
| Payable for fund shares redeemed | $ | 669,435 | ||
| Accrued management fee | 392,653 | |||
| Transfer agent fee payable | 111,291 | |||
| Other affiliated payables | 21,209 | |||
| Other payables and accrued expenses | 34,359 | |||
| Total Liabilities | 1,228,947 | |||
| Net Assets | $ | 835,246,280 | ||
| Net Assets consist of: | ||||
| Paid in capital | $ | 690,275,894 | ||
| Total accumulated earnings (loss) | 144,970,386 | |||
| Net Assets | $ | 835,246,280 | ||
Net Asset Value , offering price and redemption price per share ($835,246,280 ÷ 33,771,724 shares) | $ | 24.73 | ||
| Statement of Operations | ||||
Six months ended January 31, 2023 (Unaudited) | ||||
| Investment Income | ||||
| Dividends | $ | 6,321,617 | ||
| Income from Fidelity Central Funds (including $4,585 from security lending) | 645,291 | |||
| Total Income | 6,966,908 | |||
| Expenses | ||||
| Management fee | ||||
| Basic fee | $ | 2,009,612 | ||
| Performance adjustment | 93,540 | |||
| Transfer agent fees | 632,675 | |||
| Accounting fees | 119,964 | |||
| Custodian fees and expenses | 17,602 | |||
| Independent trustees' fees and expenses | 1,302 | |||
| Registration fees | 37,577 | |||
| Audit | 31,186 | |||
| Legal | 1,679 | |||
| Miscellaneous | 2,125 | |||
| Total expenses before reductions | 2,947,262 | |||
| Expense reductions | (14,590) | |||
| Total expenses after reductions | 2,932,672 | |||
| Net Investment income (loss) | 4,034,236 | |||
| Realized and Unrealized Gain (Loss) | ||||
| Net realized gain (loss) on: | ||||
| Investment Securities: | ||||
| Unaffiliated issuers | (7,740,418) | |||
| Foreign currency transactions | 24,910 | |||
| Total net realized gain (loss) | (7,715,508) | |||
| Change in net unrealized appreciation (depreciation) on: | ||||
| Investment Securities: | ||||
| Unaffiliated issuers | 52,288,006 | |||
| Assets and liabilities in foreign currencies | 13,538 | |||
| Total change in net unrealized appreciation (depreciation) | 52,301,544 | |||
| Net gain (loss) | 44,586,036 | |||
| Net increase (decrease) in net assets resulting from operations | $ | 48,620,272 | ||
| Statement of Changes in Net Assets | ||||
Six months ended January 31, 2023 (Unaudited) | Year ended July 31, 2022 | |||
| Increase (Decrease) in Net Assets | ||||
| Operations | ||||
| Net investment income (loss) | $ | 4,034,236 | $ | 8,269,156 |
| Net realized gain (loss) | (7,715,508) | 43,550,463 | ||
| Change in net unrealized appreciation (depreciation) | 52,301,544 | (27,921,066) | ||
| Net increase (decrease) in net assets resulting from operations | 48,620,272 | 23,898,553 | ||
| Distributions to shareholders | (19,890,909) | (7,053,848) | ||
| Share transactions | ||||
| Proceeds from sales of shares | 261,824,061 | 365,164,911 | ||
| Reinvestment of distributions | 12,947,154 | 5,127,250 | ||
| Cost of shares redeemed | (209,239,504) | (171,960,863) | ||
Net increase (decrease) in net assets resulting from share transactions | 65,531,711 | 198,331,298 | ||
| Total increase (decrease) in net assets | 94,261,074 | 215,176,003 | ||
| Net Assets | ||||
| Beginning of period | 740,985,206 | 525,809,203 | ||
| End of period | $ | 835,246,280 | $ | 740,985,206 |
| Other Information | ||||
| Shares | ||||
| Sold | 11,338,286 | 15,508,949 | ||
| Issued in reinvestment of distributions | 548,797 | 216,360 | ||
| Redeemed | (9,266,440) | (7,331,297) | ||
| Net increase (decrease) | 2,620,643 | 8,394,012 | ||
| Fidelity® Blue Chip Value Fund |
Six months ended (Unaudited) January 31, 2023 | Years ended July 31, 2022 | 2021 | 2020 | 2019 | 2018 | |||||||
Selected Per-Share Data | ||||||||||||
| Net asset value, beginning of period | $ | 23.79 | $ | 23.11 | $ | 17.02 | $ | 19.71 | $ | 19.90 | $ | 18.85 |
| Income from Investment Operations | ||||||||||||
Net investment income (loss) A,B | .13 | .33 | .27 | .31 | .32 | .26 | ||||||
| Net realized and unrealized gain (loss) | 1.43 | .66 | 6.03 | (2.63) | (.14) C | 1.01 | ||||||
| Total from investment operations | 1.56 | .99 | 6.30 | (2.32) | .18 | 1.27 | ||||||
| Distributions from net investment income | (.26) | (.31) | (.21) | (.31) | (.29) | (.21) | ||||||
| Distributions from net realized gain | (.37) | - | - | (.06) | (.09) | - D | ||||||
| Total distributions | (.62) E | (.31) | (.21) | (.37) | (.37) E | (.22) E | ||||||
| Net asset value, end of period | $ | 24.73 | $ | 23.79 | $ | 23.11 | $ | 17.02 | $ | 19.71 | $ | 19.90 |
Total Return F,G | 6.71% | 4.28% | 37.36% | (12.03)% | .99% C | 6.79% | ||||||
Ratios to Average Net Assets B,H,I | ||||||||||||
| Expenses before reductions | .77% J | .63% | .58% | .63% | .65% | .70% | ||||||
| Expenses net of fee waivers, if any | .77% J | .63% | .58% | .63% | .65% | .70% | ||||||
| Expenses net of all reductions | .77% J | .63% | .58% | .61% | .65% | .70% | ||||||
| Net investment income (loss) | 1.06% J | 1.38% | 1.35% | 1.71% | 1.67% | 1.34% | ||||||
| Supplemental Data | ||||||||||||
| Net assets, end of period (000 omitted) | $ | 835,246 | $ | 740,985 | $ | 525,809 | $ | 375,786 | $ | 477,706 | $ | 393,503 |
Portfolio turnover rate K | 28% J | 41% | 52% | 119% | 44% | 45% |
| Fidelity Central Fund | Investment Manager | Investment Objective | Investment Practices | Expense Ratio A |
| Fidelity Money Market Central Funds | Fidelity Management & Research Company LLC (FMR) | Each fund seeks to obtain a high level of current income consistent with the preservation of capital and liquidity. | Short-term Investments | Less than .005% |
| Gross unrealized appreciation | $163,481,097 |
| Gross unrealized depreciation | (12,094,966) |
| Net unrealized appreciation (depreciation) | $151,386,131 |
| Tax cost | $683,770,091 |
| Purchases ($) | Sales ($) | |
| Fidelity Blue Chip Value Fund | 164,290,248 | 103,911,411 |
| % of Average Net Assets | |
| Fidelity Blue Chip Value Fund | .03 |
| Amount | |
| Fidelity Blue Chip Value Fund | $1,439 |
| Purchases ($) | Sales ($) | Realized Gain (Loss) ($) | |
| Fidelity Blue Chip Value Fund | 12,683,606 | 2,187,546 | (438,921) |
| Amount | |
| Fidelity Blue Chip Value Fund | $953 |
| Total Security Lending Fees Paid to NFS | Security Lending Income From Securities Loaned to NFS | Value of Securities Loaned to NFS at Period End | |
| Fidelity Blue Chip Value Fund | $476 | $- | $- |
| The Example is based on an investment of $1,000 invested at the beginning of the period and held for the entire period (August 1, 2022 to January 31, 2023). |
Annualized Expense Ratio- A | Beginning Account Value August 1, 2022 | Ending Account Value January 31, 2023 | Expenses Paid During Period- C August 1, 2022 to January 31, 2023 | |||||||
| Fidelity® Blue Chip Value Fund | .77% | |||||||||
| Actual | $ 1,000 | $ 1,067.10 | $ 4.01 | |||||||
Hypothetical- B | $ 1,000 | $ 1,021.32 | $ 3.92 | |||||||
- Highly liquid investments - cash or convertible to cash within three business days or less
- Moderately liquid investments - convertible to cash in three to seven calendar days
- Less liquid investments - can be sold or disposed of, but not settled, within seven calendar days
- Illiquid investments - cannot be sold or disposed of within seven calendar days
|


Contents
Top Holdings (% of Fund's net assets) | ||
| Crocs, Inc. | 1.5 | |
| Performance Food Group Co. | 1.3 | |
| Applied Industrial Technologies, Inc. | 1.2 | |
| Fanatics, Inc. Class A | 1.2 | |
| Haemonetics Corp. | 1.1 | |
| Sprout Social, Inc. | 1.1 | |
| Avid Technology, Inc. | 1.0 | |
| U.S. Foods Holding Corp. | 1.0 | |
| Cabot Corp. | 1.0 | |
| Insulet Corp. | 1.0 | |
| 11.4 | ||
| Market Sectors (% of Fund's net assets) | ||
| Health Care | 22.3 | |
| Industrials | 21.1 | |
| Information Technology | 20.3 | |
| Consumer Discretionary | 13.7 | |
| Energy | 5.7 | |
| Consumer Staples | 4.7 | |
| Materials | 4.4 | |
| Financials | 3.5 | |
| Communication Services | 3.1 | |
| Utilities | 0.6 | |
| Real Estate | 0.0 | |
Asset Allocation (% of Fund's net assets) |
 |
Foreign investments - 9.2% |
| Common Stocks - 97.5% | |||
| Shares | Value ($) | ||
| COMMUNICATION SERVICES - 2.9% | |||
| Diversified Telecommunication Services - 0.3% | |||
| IDT Corp. Class B (a) | 327,514 | 9,625,636 | |
| Iridium Communications, Inc. | 61,511 | 3,680,818 | |
| 13,306,454 | |||
| Entertainment - 0.3% | |||
| World Wrestling Entertainment, Inc. Class A (b) | 195,346 | 16,530,179 | |
| Interactive Media & Services - 0.9% | |||
| Bumble, Inc. (a) | 612,161 | 15,763,146 | |
| Cars.com, Inc. (a) | 1,738,355 | 29,725,871 | |
| 45,489,017 | |||
| Media - 0.9% | |||
| Integral Ad Science Holding Corp. (a) | 996,943 | 10,248,574 | |
| TechTarget, Inc. (a)(b) | 769,013 | 38,089,214 | |
| 48,337,788 | |||
| Wireless Telecommunication Services - 0.5% | |||
| Gogo, Inc. (a) | 1,665,635 | 27,932,699 | |
TOTAL COMMUNICATION SERVICES | 151,596,137 | ||
| CONSUMER DISCRETIONARY - 13.7% | |||
| Auto Components - 0.9% | |||
| Autoliv, Inc. | 265,096 | 24,420,644 | |
| Gentherm, Inc. (a) | 295,665 | 22,006,346 | |
| 46,426,990 | |||
| Diversified Consumer Services - 1.8% | |||
| Duolingo, Inc. (a)(b) | 182,377 | 17,415,180 | |
| Grand Canyon Education, Inc. (a) | 341,713 | 39,830,067 | |
| H&R Block, Inc. | 600,534 | 23,408,815 | |
| Rover Group, Inc. Class A (a)(b)(c) | 3,665,901 | 14,993,535 | |
| 95,647,597 | |||
| Hotels, Restaurants & Leisure - 3.6% | |||
| Brinker International, Inc. (a) | 913,771 | 36,057,404 | |
| Churchill Downs, Inc. | 88,576 | 21,975,706 | |
| Dutch Bros, Inc. (a)(b) | 444,270 | 16,931,130 | |
| Everi Holdings, Inc. (a) | 844,290 | 14,665,317 | |
| Kura Sushi U.S.A., Inc. Class A (a)(b) | 203,782 | 12,663,013 | |
| Lindblad Expeditions Holdings (a)(c) | 3,772,274 | 44,890,061 | |
| SeaWorld Entertainment, Inc. (a) | 674,501 | 42,082,117 | |
| 189,264,748 | |||
| Household Durables - 1.2% | |||
| Helen of Troy Ltd. (a) | 262,977 | 29,745,328 | |
| LGI Homes, Inc. (a) | 201,511 | 22,942,027 | |
| Lovesac (a)(b) | 555,238 | 14,291,826 | |
| 66,979,181 | |||
| Internet & Direct Marketing Retail - 0.1% | |||
| BARK, Inc. warrants 8/29/25 (a) | 571,317 | 128,946 | |
| thredUP, Inc. (a)(b) | 2,621,385 | 4,534,996 | |
| 4,663,942 | |||
| Leisure Products - 0.6% | |||
| YETI Holdings, Inc. (a)(b) | 756,385 | 33,855,793 | |
| Specialty Retail - 3.6% | |||
| Aritzia, Inc. (a) | 575,626 | 20,761,559 | |
| Boot Barn Holdings, Inc. (a) | 139,800 | 11,671,902 | |
| Dick's Sporting Goods, Inc. (b) | 333,017 | 43,545,303 | |
| Fanatics, Inc. Class A (a)(d)(e) | 726,062 | 59,950,939 | |
| Floor & Decor Holdings, Inc. Class A (a)(b) | 400,907 | 36,390,328 | |
| Lithia Motors, Inc. Class A (sub. vtg.) (b) | 62,828 | 16,536,330 | |
| 188,856,361 | |||
| Textiles, Apparel & Luxury Goods - 1.9% | |||
| Crocs, Inc. (a)(b) | 632,679 | 77,041,307 | |
| Kontoor Brands, Inc. (b) | 505,605 | 24,147,695 | |
| 101,189,002 | |||
TOTAL CONSUMER DISCRETIONARY | 726,883,614 | ||
| CONSUMER STAPLES - 4.7% | |||
| Beverages - 0.6% | |||
| Boston Beer Co., Inc. Class A (a) | 78,458 | 30,489,563 | |
| Food & Staples Retailing - 3.6% | |||
| BJ's Wholesale Club Holdings, Inc. (a) | 213,771 | 15,491,984 | |
| Casey's General Stores, Inc. (b) | 86,646 | 20,440,658 | |
| Performance Food Group Co. (a) | 1,180,361 | 72,379,737 | |
| Sprouts Farmers Market LLC (a) | 986,785 | 31,527,781 | |
| U.S. Foods Holding Corp. (a) | 1,401,689 | 53,446,402 | |
| 193,286,562 | |||
| Food Products - 0.2% | |||
| Freshpet, Inc. (a)(b) | 93,610 | 5,928,321 | |
| Nomad Foods Ltd. (a) | 66,026 | 1,174,603 | |
| The Real Good Food Co. LLC: | |||
| Class B (e) | 248,958 | 2 | |
| Class B unit (f) | 248,958 | 1,384,206 | |
| 8,487,132 | |||
| Personal Products - 0.3% | |||
| BellRing Brands, Inc. (a) | 134,057 | 3,801,857 | |
| The Beauty Health Co. (a)(b) | 982,156 | 11,196,578 | |
| 14,998,435 | |||
TOTAL CONSUMER STAPLES | 247,261,692 | ||
| ENERGY - 5.7% | |||
| Energy Equipment & Services - 2.0% | |||
| Championx Corp. | 529,643 | 17,488,812 | |
| Liberty Oilfield Services, Inc. Class A | 1,510,800 | 23,915,964 | |
| Nextier Oilfield Solutions, Inc. (a) | 2,375,000 | 22,372,500 | |
| TechnipFMC PLC (a) | 3,054,974 | 42,433,589 | |
| 106,210,865 | |||
| Oil, Gas & Consumable Fuels - 3.7% | |||
| Antero Resources Corp. (a) | 928,128 | 26,767,212 | |
| Civitas Resources, Inc. | 221,058 | 14,711,410 | |
| Denbury, Inc. (a) | 540,592 | 46,912,574 | |
| Enviva, Inc. (b) | 178,618 | 8,123,547 | |
| Genesis Energy LP | 2,540,190 | 28,678,745 | |
| HF Sinclair Corp. | 25,815 | 1,468,874 | |
| Northern Oil & Gas, Inc. | 1,081,199 | 36,241,790 | |
| PDC Energy, Inc. | 149,552 | 10,129,157 | |
| Range Resources Corp. | 891,331 | 22,301,102 | |
| 195,334,411 | |||
TOTAL ENERGY | 301,545,276 | ||
| FINANCIALS - 3.5% | |||
| Banks - 1.0% | |||
| First Interstate Bancsystem, Inc. | 271,505 | 9,741,599 | |
| Glacier Bancorp, Inc. | 237,277 | 10,817,458 | |
| PacWest Bancorp | 375,924 | 10,398,058 | |
| Pinnacle Financial Partners, Inc. | 164,127 | 12,921,719 | |
| Starling Bank Ltd. Series D (a)(d)(e) | 1,942,800 | 8,095,712 | |
| 51,974,546 | |||
| Capital Markets - 1.1% | |||
| Impax Asset Management Group PLC | 4,681 | 44,783 | |
| Lazard Ltd. Class A | 375,208 | 15,038,337 | |
| Perella Weinberg Partners (a)(d) | 2,039,500 | 20,904,875 | |
| StepStone Group, Inc. Class A | 732,197 | 21,372,830 | |
| 57,360,825 | |||
| Consumer Finance - 0.3% | |||
| OneMain Holdings, Inc. | 334,400 | 14,426,016 | |
| Insurance - 0.8% | |||
| Assurant, Inc. | 58,568 | 7,765,531 | |
| BRP Group, Inc. (a) | 1,122,218 | 32,151,546 | |
| 39,917,077 | |||
| Thrifts & Mortgage Finance - 0.3% | |||
| Walker & Dunlop, Inc. | 194,600 | 18,560,948 | |
TOTAL FINANCIALS | 182,239,412 | ||
| HEALTH CARE - 21.8% | |||
| Biotechnology - 7.3% | |||
| Absci Corp. (a)(b) | 819,062 | 2,571,855 | |
| ALX Oncology Holdings, Inc. (a)(b) | 788,867 | 7,336,463 | |
| Arcellx, Inc. | 316,990 | 10,590,636 | |
| Argenx SE ADR (a) | 52,346 | 20,009,259 | |
| Ascendis Pharma A/S sponsored ADR (a) | 224,190 | 27,817,495 | |
| Blueprint Medicines Corp. (a) | 467,885 | 21,868,945 | |
| Celldex Therapeutics, Inc. (a) | 537,619 | 23,687,493 | |
| Cyteir Therapeutics, Inc. (a) | 632,443 | 967,638 | |
| Cytokinetics, Inc. (a) | 789,237 | 33,526,788 | |
| Day One Biopharmaceuticals, Inc. (a) | 695,347 | 15,137,704 | |
| Exelixis, Inc. (a) | 694,825 | 12,242,817 | |
| Halozyme Therapeutics, Inc. (a) | 394,563 | 20,426,527 | |
| Immunocore Holdings PLC ADR (a) | 316,681 | 19,403,045 | |
| Instil Bio, Inc. (a) | 765,800 | 623,285 | |
| Janux Therapeutics, Inc. (a) | 423,829 | 9,413,242 | |
| Keros Therapeutics, Inc. (a) | 263,576 | 15,437,646 | |
| Monte Rosa Therapeutics, Inc. (a)(b) | 632,927 | 4,683,660 | |
| Morphic Holding, Inc. (a) | 363,830 | 11,908,156 | |
| Nuvalent, Inc. Class A (a) | 555,728 | 16,810,772 | |
| PepGen, Inc. | 174,705 | 2,728,892 | |
| Prelude Therapeutics, Inc. (a) | 683,633 | 4,361,579 | |
| PTC Therapeutics, Inc. (a) | 457,130 | 20,977,696 | |
| Relay Therapeutics, Inc. (a)(b) | 447,517 | 9,603,715 | |
| Tango Therapeutics, Inc. (a) | 1,408,642 | 9,297,037 | |
| Tenaya Therapeutics, Inc. (a) | 801,045 | 2,739,574 | |
| Tyra Biosciences, Inc. (a) | 690,224 | 7,330,179 | |
| Vaxcyte, Inc. (a) | 513,759 | 23,298,971 | |
| Vericel Corp. (a)(b) | 293,174 | 8,053,490 | |
| Verve Therapeutics, Inc. (a)(b) | 541,601 | 12,321,423 | |
| Xenon Pharmaceuticals, Inc. (a) | 343,318 | 13,420,301 | |
| 388,596,283 | |||
| Health Care Equipment & Supplies - 5.3% | |||
| Envista Holdings Corp. (a) | 380,718 | 14,844,195 | |
| Figs, Inc. Class A (a)(b) | 1,990,781 | 17,817,490 | |
| Globus Medical, Inc. (a)(b) | 217,189 | 16,397,770 | |
| Haemonetics Corp. (a) | 695,578 | 58,845,899 | |
| Inspire Medical Systems, Inc. (a) | 153,704 | 38,896,334 | |
| Insulet Corp. (a) | 181,487 | 52,144,845 | |
| Neogen Corp. (a) | 545,800 | 11,685,578 | |
| NeuroPace, Inc. (a)(b) | 1,147,035 | 5,356,653 | |
| Nevro Corp. (a) | 261,122 | 9,588,400 | |
| PROCEPT BioRobotics Corp. (a) | 474,600 | 18,457,194 | |
| TransMedics Group, Inc. (a) | 566,243 | 35,684,634 | |
| 279,718,992 | |||
| Health Care Providers & Services - 4.8% | |||
| 1Life Healthcare, Inc. (a) | 642,572 | 10,274,726 | |
| Acadia Healthcare Co., Inc. (a) | 537,236 | 45,138,569 | |
| AdaptHealth Corp. (a) | 455,501 | 9,761,386 | |
| agilon health, Inc. (a)(b) | 1,709,614 | 37,201,201 | |
| Molina Healthcare, Inc. (a) | 159,008 | 49,583,465 | |
| Option Care Health, Inc. (a) | 1,114,875 | 32,186,441 | |
| Owens & Minor, Inc. | 533,639 | 10,534,034 | |
| R1 Rcm, Inc. (a) | 1,955,473 | 27,982,819 | |
| Surgery Partners, Inc. (a) | 903,876 | 30,008,683 | |
| 252,671,324 | |||
| Health Care Technology - 1.6% | |||
| Doximity, Inc. (a)(b) | 232,546 | 8,201,897 | |
| Evolent Health, Inc. (a) | 1,056,903 | 34,053,415 | |
| Phreesia, Inc. (a) | 985,618 | 36,950,819 | |
| Schrodinger, Inc. (a) | 218,778 | 5,290,052 | |
| 84,496,183 | |||
| Life Sciences Tools & Services - 0.6% | |||
| Olink Holding AB ADR (a)(b) | 812,794 | 15,914,507 | |
| Sotera Health Co. (a) | 300,300 | 5,177,172 | |
| Veterinary Emergency Group LLC Class A (a)(d)(e)(g) | 190,561 | 10,825,770 | |
| 31,917,449 | |||
| Pharmaceuticals - 2.2% | |||
| Arvinas Holding Co. LLC (a) | 408,138 | 13,374,682 | |
| Axsome Therapeutics, Inc. (a)(b) | 198,827 | 14,912,025 | |
| DICE Therapeutics, Inc. (a)(b) | 396,533 | 12,597,853 | |
| Edgewise Therapeutics, Inc. (a) | 1,376,795 | 14,084,613 | |
| Enliven Therapeutics, Inc. (c)(h) | 2,068,309 | 8,600,029 | |
| Ikena Oncology, Inc. (a) | 687,964 | 2,930,727 | |
| Intra-Cellular Therapies, Inc. (a) | 481,204 | 23,059,296 | |
| Pharvaris BV (a)(b) | 688,282 | 6,194,538 | |
| Terns Pharmaceuticals, Inc. (a) | 2,397,767 | 21,747,747 | |
| 117,501,510 | |||
TOTAL HEALTH CARE | 1,154,901,741 | ||
| INDUSTRIALS - 20.6% | |||
| Aerospace & Defense - 1.7% | |||
| BWX Technologies, Inc. | 394,078 | 23,983,587 | |
| Curtiss-Wright Corp. | 210,352 | 34,876,362 | |
| Dassault Aviation SA | 76,352 | 13,007,052 | |
| V2X, Inc. (a) | 406,465 | 17,949,494 | |
| 89,816,495 | |||
| Air Freight & Logistics - 0.5% | |||
| Air Transport Services Group, Inc. (a) | 510,830 | 14,461,597 | |
| Hub Group, Inc. Class A (a) | 137,904 | 11,759,074 | |
| 26,220,671 | |||
| Building Products - 1.8% | |||
| Builders FirstSource, Inc. (a) | 324,313 | 25,847,746 | |
| Carlisle Companies, Inc. | 53,411 | 13,398,683 | |
| The AZEK Co., Inc. (a)(b) | 829,154 | 20,007,486 | |
| UFP Industries, Inc. | 403,823 | 37,777,642 | |
| 97,031,557 | |||
| Commercial Services & Supplies - 0.9% | |||
| ACV Auctions, Inc. Class A (a) | 795,776 | 7,798,605 | |
| Driven Brands Holdings, Inc. (a) | 874,711 | 25,532,814 | |
| Montrose Environmental Group, Inc. (a) | 238,900 | 12,938,824 | |
| 46,270,243 | |||
| Construction & Engineering - 2.0% | |||
| Bowman Consulting Group Ltd. (a) | 120,049 | 3,060,049 | |
| EMCOR Group, Inc. | 164,877 | 24,443,015 | |
| Valmont Industries, Inc. (b) | 94,159 | 31,047,047 | |
| Willscot Mobile Mini Holdings (a) | 984,745 | 47,720,743 | |
| 106,270,854 | |||
| Electrical Equipment - 3.7% | |||
| Acuity Brands, Inc. | 97,498 | 18,380,323 | |
| Array Technologies, Inc. (a)(b) | 1,512,054 | 33,612,960 | |
| Atkore, Inc. (a) | 309,898 | 40,364,215 | |
| nVent Electric PLC | 660,278 | 26,246,051 | |
| Regal Rexnord Corp. | 344,011 | 47,886,331 | |
| Sensata Technologies, Inc. PLC | 261,700 | 13,307,445 | |
| Sunrun, Inc. (a)(b) | 561,512 | 14,756,535 | |
| 194,553,860 | |||
| Machinery - 3.7% | |||
| Chart Industries, Inc. (a)(b) | 149,595 | 20,042,738 | |
| Crane Holdings Co. | 324,669 | 37,632,384 | |
| EnPro Industries, Inc. | 141,039 | 17,075,592 | |
| Federal Signal Corp. | 767,782 | 40,884,392 | |
| ITT, Inc. | 225,160 | 20,622,404 | |
| Mueller Industries, Inc. | 367,752 | 24,106,144 | |
| Terex Corp. | 689,770 | 35,157,577 | |
| 195,521,231 | |||
| Marine - 0.4% | |||
| Kirby Corp. (a) | 305,325 | 21,610,904 | |
| Professional Services - 3.7% | |||
| ASGN, Inc. (a) | 338,685 | 30,803,401 | |
| CACI International, Inc. Class A (a) | 136,843 | 42,159,960 | |
| FTI Consulting, Inc. (a) | 152,985 | 24,404,167 | |
| ICF International, Inc. | 152,567 | 15,590,822 | |
| Insperity, Inc. | 234,651 | 25,940,668 | |
| KBR, Inc. | 839,673 | 43,016,448 | |
| NV5 Global, Inc. (a) | 103,571 | 13,804,979 | |
| 195,720,445 | |||
| Road & Rail - 0.5% | |||
| U-Haul Holding Co. (b) | 180,766 | 12,116,745 | |
| U-Haul Holding Co. (non-vtg.) | 208,734 | 12,897,674 | |
| 25,014,419 | |||
| Trading Companies & Distributors - 1.7% | |||
| Applied Industrial Technologies, Inc. | 441,519 | 63,229,936 | |
| Custom Truck One Source, Inc. Class A (a)(b) | 1,656,727 | 11,729,627 | |
| Hudson Technologies, Inc. (a) | 636,765 | 6,501,371 | |
| WESCO International, Inc. (a) | 80,267 | 11,960,586 | |
| 93,421,520 | |||
TOTAL INDUSTRIALS | 1,091,452,199 | ||
| INFORMATION TECHNOLOGY - 19.6% | |||
| Communications Equipment - 0.8% | |||
| Harmonic, Inc. (a) | 974,500 | 12,834,165 | |
| Lumentum Holdings, Inc. (a)(b) | 248,499 | 14,954,670 | |
| NetScout Systems, Inc. (a) | 358,281 | 11,500,820 | |
| 39,289,655 | |||
| Electronic Equipment & Components - 3.2% | |||
| Fabrinet (a) | 366,597 | 48,266,161 | |
| Flex Ltd. (a) | 871,000 | 20,337,850 | |
| Insight Enterprises, Inc. (a) | 338,487 | 38,154,255 | |
| Napco Security Technologies, Inc. (a) | 561,720 | 16,273,028 | |
| Richardson Electronics Ltd. (b) | 412,533 | 9,220,113 | |
| TD SYNNEX Corp. | 241,532 | 24,672,494 | |
| Vontier Corp. | 630,220 | 14,513,967 | |
| 171,437,868 | |||
| IT Services - 3.2% | |||
| Concentrix Corp. | 319,981 | 45,376,506 | |
| ExlService Holdings, Inc. (a) | 292,934 | 49,974,540 | |
| Flywire Corp. (a) | 204,186 | 5,506,896 | |
| Genpact Ltd. | 483,117 | 22,841,772 | |
| Maximus, Inc. | 389,489 | 29,153,252 | |
| Wix.com Ltd. (a)(b) | 196,939 | 17,129,754 | |
| 169,982,720 | |||
| Semiconductors & Semiconductor Equipment - 4.2% | |||
| AEHR Test Systems (a)(b) | 595,605 | 20,822,351 | |
| Allegro MicroSystems LLC (a) | 746,562 | 28,496,272 | |
| Axcelis Technologies, Inc. (a) | 251,842 | 27,690,028 | |
| Cirrus Logic, Inc. (a) | 269,925 | 24,398,521 | |
| eMemory Technology, Inc. | 278,000 | 15,229,111 | |
| Impinj, Inc. (a) | 124,926 | 16,212,896 | |
| Lattice Semiconductor Corp. (a) | 430,267 | 32,609,936 | |
| MACOM Technology Solutions Holdings, Inc. (a) | 503,718 | 33,759,180 | |
| Nova Ltd. (a) | 230,214 | 20,880,410 | |
| 220,098,705 | |||
| Software - 7.2% | |||
| Agilysys, Inc. (a) | 126,800 | 10,595,408 | |
| Algolia, Inc. (a)(d)(e) | 234,640 | 3,676,809 | |
| Alkami Technology, Inc. (a)(b) | 878,284 | 14,377,509 | |
| Braze, Inc. (a)(b) | 192,305 | 6,153,760 | |
| CCC Intelligent Solutions Holdings, Inc. (a)(d) | 48,511 | 448,484 | |
| Confluent, Inc. (a)(b) | 285,534 | 6,595,835 | |
| Coupa Software, Inc. (a)(b) | 587,373 | 46,942,850 | |
| Cvent Holding Corp. (a)(b) | 2,923,144 | 23,589,772 | |
| CyberArk Software Ltd. (a)(b) | 160,685 | 22,637,303 | |
| DoubleVerify Holdings, Inc. (a) | 1,213,622 | 32,998,382 | |
| Dynatrace, Inc. (a) | 782,021 | 30,053,067 | |
| Elastic NV (a) | 274,460 | 16,149,226 | |
| Five9, Inc. (a) | 141,198 | 11,123,578 | |
| Sprout Social, Inc. (a) | 909,277 | 58,166,450 | |
| TECSYS, Inc. (b) | 696,032 | 14,846,032 | |
| Tenable Holdings, Inc. (a) | 998,859 | 40,184,098 | |
| WalkMe Ltd. (a)(b) | 848,406 | 8,645,257 | |
| Workiva, Inc. (a) | 397,701 | 34,413,068 | |
| 381,596,888 | |||
| Technology Hardware, Storage & Peripherals - 1.0% | |||
| Avid Technology, Inc. (a) | 1,765,239 | 53,504,394 | |
TOTAL INFORMATION TECHNOLOGY | 1,035,910,230 | ||
| MATERIALS - 4.4% | |||
| Chemicals - 3.1% | |||
| Avient Corp. | 410,500 | 16,633,460 | |
| Axalta Coating Systems Ltd. (a) | 363,300 | 10,935,330 | |
| Cabot Corp. | 709,464 | 53,443,923 | |
| Element Solutions, Inc. | 728,450 | 14,918,656 | |
| Olin Corp. | 178,537 | 11,531,705 | |
| The Chemours Co. LLC | 707,716 | 25,753,785 | |
| Valvoline, Inc. | 867,710 | 31,810,249 | |
| 165,027,108 | |||
| Construction Materials - 0.3% | |||
| Eagle Materials, Inc. | 94,628 | 13,823,258 | |
| Containers & Packaging - 0.8% | |||
| Ardagh Metal Packaging SA (a)(d) | 1,634,000 | 9,183,080 | |
| O-I Glass, Inc. (a) | 1,757,098 | 33,824,137 | |
| 43,007,217 | |||
| Metals & Mining - 0.2% | |||
| Lynas Rare Earths Ltd. (a) | 1,677,428 | 11,228,928 | |
TOTAL MATERIALS | 233,086,511 | ||
| REAL ESTATE - 0.0% | |||
| Real Estate Management & Development - 0.0% | |||
| Compass, Inc. (a) | 13 | 52 | |
| UTILITIES - 0.6% | |||
| Independent Power and Renewable Electricity Producers - 0.6% | |||
| NextEra Energy Partners LP | 224,240 | 16,436,792 | |
| Sunnova Energy International, Inc. (a)(b) | 717,006 | 13,967,277 | |
| 30,404,069 | |||
| TOTAL COMMON STOCKS (Cost $4,567,679,649) | 5,155,280,933 | ||
| Convertible Preferred Stocks - 1.9% | |||
| Shares | Value ($) | ||
| COMMUNICATION SERVICES - 0.2% | |||
| Interactive Media & Services - 0.2% | |||
| Reddit, Inc. Series F (a)(d)(e) | 253,500 | 9,518,925 | |
| HEALTH CARE - 0.5% | |||
| Biotechnology - 0.4% | |||
| Bright Peak Therapeutics AG Series B (a)(d)(e) | 1,079,522 | 3,173,795 | |
| Caris Life Sciences, Inc. Series D (a)(d)(e) | 780,603 | 4,371,377 | |
| LifeMine Therapeutics, Inc. Series C (d)(e) | 2,048,403 | 3,769,062 | |
| Sonoma Biotherapeutics, Inc.: | |||
| Series B (a)(d)(e) | 2,370,360 | 3,958,501 | |
| Series B1 (a)(d)(e) | 1,264,171 | 2,566,267 | |
| T-Knife Therapeutics, Inc. Series B (a)(d)(e) | 1,097,257 | 4,202,494 | |
| Treeline Biosciences Series A (a)(d)(e) | 115,000 | 967,150 | |
| 23,008,646 | |||
| Health Care Providers & Services - 0.1% | |||
| Boundless Bio, Inc. Series B (a)(d)(e) | 3,017,761 | 2,746,163 | |
| Health Care Technology - 0.0% | |||
| Wugen, Inc. Series B (a)(d)(e) | 326,496 | 1,704,309 | |
TOTAL HEALTH CARE | 27,459,118 | ||
| INDUSTRIALS - 0.5% | |||
| Construction & Engineering - 0.5% | |||
| Beta Technologies, Inc.: | |||
| Series A (a)(d)(e) | 278,129 | 21,171,179 | |
| Series B, 6.00% (d)(e) | 85,106 | 6,675,715 | |
| 27,846,894 | |||
| INFORMATION TECHNOLOGY - 0.7% | |||
| Communications Equipment - 0.2% | |||
| Astranis Space Technologies Corp. Series C (a)(d)(e) | 557,717 | 7,138,778 | |
| IT Services - 0.2% | |||
| Yanka Industries, Inc.: | |||
| Series E (a)(d)(e) | 869,641 | 9,409,516 | |
| Series F (a)(d)(e) | 127,716 | 1,381,887 | |
| 10,791,403 | |||
| Software - 0.3% | |||
| Algolia, Inc. Series D (a)(d)(e) | 53,800 | 843,046 | |
| Convoy, Inc. Series D (a)(d)(e) | 913,444 | 6,558,528 | |
| Mountain Digital, Inc. Series D (a)(d)(e) | 729,676 | 8,216,152 | |
| Skyryse, Inc. Series B (a)(d)(e) | 62,100 | 1,255,662 | |
| 16,873,388 | |||
TOTAL INFORMATION TECHNOLOGY | 34,803,569 | ||
| TOTAL CONVERTIBLE PREFERRED STOCKS (Cost $140,835,839) | 99,628,506 | ||
| Investment Companies - 0.0% | |||
| Shares | Value ($) | ||
iShares Russell 2000 Growth Index ETF (Cost $238,480) | 1,100 | 259,556 | |
| Money Market Funds - 6.9% | |||
| Shares | Value ($) | ||
| Fidelity Cash Central Fund 4.38% (i) | 50,529,093 | 50,539,199 | |
| Fidelity Securities Lending Cash Central Fund 4.38% (i)(j) | 314,546,821 | 314,578,276 | |
| TOTAL MONEY MARKET FUNDS (Cost $365,117,475) | 365,117,475 | ||
| TOTAL INVESTMENT IN SECURITIES - 106.3% (Cost $5,073,871,443) | 5,620,286,470 |
NET OTHER ASSETS (LIABILITIES) - (6.3)% | (332,230,160) |
| NET ASSETS - 100.0% | 5,288,056,310 |
| ETF | - | EXCHANGE-TRADED FUND |
| (a) | Non-income producing |
| (b) | Security or a portion of the security is on loan at period end. |
| (c) | Affiliated company |
| (d) | Restricted securities (including private placements) - Investment in securities not registered under the Securities Act of 1933 (excluding 144A issues). At the end of the period, the value of restricted securities (excluding 144A issues) amounted to $212,714,175 or 4.0% of net assets. |
| (e) | Level 3 security |
| (f) | Security exempt from registration under Rule 144A of the Securities Act of 1933. These securities may be resold in transactions exempt from registration, normally to qualified institutional buyers. At the end of the period, the value of these securities amounted to $1,384,206 or 0.0% of net assets. |
| (g) | Investment is owned by a wholly-owned subsidiary (Subsidiary) that is treated as a corporation for U.S. tax purposes. |
| (h) | Security or a portion of the security purchased on a delayed delivery or when-issued basis. |
| (i) | Affiliated fund that is generally available only to investment companies and other accounts managed by Fidelity Investments. The rate quoted is the annualized seven-day yield of the fund at period end. A complete unaudited listing of the fund's holdings as of its most recent quarter end is available upon request. In addition, each Fidelity Central Fund's financial statements are available on the SEC's website or upon request. |
| (j) | Investment made with cash collateral received from securities on loan. |
| Additional information on each restricted holding is as follows: | ||
| Security | Acquisition Date | Acquisition Cost ($) |
| Algolia, Inc. | 10/27/21 | 6,862,059 |
| Algolia, Inc. Series D | 7/23/21 | 1,573,384 |
| Ardagh Metal Packaging SA | 2/22/21 | 16,340,000 |
| Astranis Space Technologies Corp. Series C | 3/19/21 | 12,225,675 |
| Beta Technologies, Inc. Series A | 4/09/21 | 20,378,512 |
| Beta Technologies, Inc. Series B, 6.00% | 4/04/22 | 8,780,386 |
| Boundless Bio, Inc. Series B | 4/23/21 | 4,073,977 |
| Bright Peak Therapeutics AG Series B | 5/14/21 | 4,216,613 |
| Caris Life Sciences, Inc. Series D | 5/11/21 | 6,322,884 |
| CCC Intelligent Solutions Holdings, Inc. | 2/02/21 | 485,110 |
| Convoy, Inc. Series D | 10/30/19 | 12,368,032 |
| Fanatics, Inc. Class A | 8/13/20 - 3/22/21 | 12,874,623 |
| LifeMine Therapeutics, Inc. Series C | 2/15/22 | 4,171,757 |
| Mountain Digital, Inc. Series D | 11/05/21 | 16,757,228 |
| Perella Weinberg Partners | 12/29/20 | 20,395,000 |
| Reddit, Inc. Series F | 8/11/21 | 15,664,880 |
| Skyryse, Inc. Series B | 10/21/21 | 1,532,626 |
| Sonoma Biotherapeutics, Inc. Series B | 7/26/21 | 4,684,542 |
| Sonoma Biotherapeutics, Inc. Series B1 | 7/26/21 | 3,747,635 |
| Starling Bank Ltd. Series D | 6/18/21 - 4/05/22 | 3,728,430 |
| T-Knife Therapeutics, Inc. Series B | 6/30/21 | 6,329,856 |
| Treeline Biosciences Series A | 7/30/21 | 900,163 |
| Veterinary Emergency Group LLC Class A | 9/16/21 - 3/17/22 | 9,331,366 |
| Wugen, Inc. Series B | 7/09/21 | 2,531,944 |
| Yanka Industries, Inc. Series E | 5/15/20 | 10,504,568 |
| Yanka Industries, Inc. Series F | 4/08/21 | 4,071,177 |
| Affiliate | Value, beginning of period ($) | Purchases ($) | Sales Proceeds ($) | Dividend Income ($) | Realized Gain (loss) ($) | Change in Unrealized appreciation (depreciation) ($) | Value, end of period ($) | % ownership, end of period |
| Fidelity Cash Central Fund 4.38% | 52,799,304 | 647,812,428 | 650,072,533 | 782,684 | - | - | 50,539,199 | 0.1% |
| Fidelity Securities Lending Cash Central Fund 4.38% | 400,159,025 | 594,445,368 | 680,026,117 | 1,843,393 | - | - | 314,578,276 | 1.0% |
| Total | 452,958,329 | 1,242,257,796 | 1,330,098,650 | 2,626,077 | - | - | 365,117,475 | |
| Affiliate | Value, beginning of period ($) | Purchases ($) | Sales Proceeds ($) | Dividend Income ($) | Realized Gain (loss) ($) | Change in Unrealized appreciation (depreciation) ($) | Value, end of period ($) |
| Avid Technology, Inc. | 65,716,436 | 3,491,053 | 18,829,832 | - | (5,048,754) | 8,175,491 | - |
| BARK, Inc. | 3,021,230 | - | 5,925,292 | - | (27,712,366) | 18,664,428 | - |
| BARK, Inc. | 1,709,136 | - | - | - | - | 10,242,864 | - |
| BARK, Inc. warrants 8/29/25 | 92,317 | - | 1,557 | - | (13,697) | 51,883 | - |
| Enliven Therapeutics, Inc. | - | 7,944,334 | - | - | - | 655,695 | 8,600,029 |
| Lindblad Expeditions Holdings | 25,014,078 | 9,158,370 | 3,046,545 | - | (2,301,502) | 16,065,660 | 44,890,061 |
| Rover Group, Inc. Class A | 10,653,724 | 6,035,100 | 172,319 | - | 5,520 | (1,528,490) | 14,993,535 |
| Total | 106,206,921 | 26,628,857 | 27,975,545 | - | (35,070,799) | 52,327,531 | 68,483,625 |
| Valuation Inputs at Reporting Date: | ||||
| Description | Total ($) | Level 1 ($) | Level 2 ($) | Level 3 ($) |
Investments in Securities: | ||||
| Equities: | ||||
Communication Services | 161,115,062 | 151,596,137 | - | 9,518,925 |
Consumer Discretionary | 726,883,614 | 666,932,675 | - | 59,950,939 |
Consumer Staples | 247,261,692 | 247,261,690 | - | 2 |
Energy | 301,545,276 | 301,545,276 | - | - |
Financials | 182,239,412 | 174,143,700 | - | 8,095,712 |
Health Care | 1,182,360,859 | 1,135,475,942 | 8,600,029 | 38,284,888 |
Industrials | 1,119,299,093 | 1,091,452,199 | - | 27,846,894 |
Information Technology | 1,070,713,799 | 1,017,004,310 | 15,229,111 | 38,480,378 |
Materials | 233,086,511 | 221,857,583 | 11,228,928 | - |
Real Estate | 52 | 52 | - | - |
Utilities | 30,404,069 | 30,404,069 | - | - |
| Investment Companies | 259,556 | 259,556 | - | - |
| Money Market Funds | 365,117,475 | 365,117,475 | - | - |
| Total Investments in Securities: | 5,620,286,470 | 5,403,050,664 | 35,058,068 | 182,177,738 |
| Investments in Securities: | |||
| Consumer Discretionary | |||
| Beginning Balance | $ | 52,216,769 | |
| Net Realized Gain (Loss) on Investment Securities | - | ||
| Net Unrealized Gain (Loss) on Investment Securities | 7,734,170 | ||
| Cost of Purchases | - | ||
| Proceeds of Sales | - | ||
| Amortization/Accretion | - | ||
| Transfers into Level 3 | - | ||
| Transfers out of Level 3 | - | ||
| Ending Balance | $ | 59,950,939 | |
| The change in unrealized gain (loss) for the period attributable to Level 3 securities held at January 31, 2023 | $ | 7,734,170 | |
| Other Investments in Securities | |||
| Beginning Balance | $ | 147,460,140 | |
| Net Realized Gain (Loss) on Investment Securities | - | ||
| Net Unrealized Gain (Loss) on Investment Securities | (25,237,471) | ||
| Cost of Purchases | 4,130 | ||
| Proceeds of Sales | - | ||
| Amortization/Accretion | - | ||
| Transfers into Level 3 | - | ||
| Transfers out of Level 3 | - | ||
| Ending Balance | $ | 122,226,799 | |
| The change in unrealized gain (loss) for the period attributable to Level 3 securities held at January 31, 2023 | $ | (25,237,471) | |
| The information used in the above reconciliation represents fiscal year to date activity for any Investments in Securities identified as using Level 3 inputs at either the beginning or the end of the current fiscal period. Cost of purchases and proceeds of sales may include securities received and/or delivered through in-kind transactions. Transfers into Level 3 were attributable to a lack of observable market data resulting from decreases in market activity, decreases in liquidity, security restructurings or corporate actions. Transfers out of Level 3 were attributable to observable market data becoming available for those securities. Transfers in or out of Level 3 represent the beginning value of any Security or Instrument where a change in the pricing level occurred from the beginning to the end of the period. The cost of purchases and the proceeds of sales may include securities received or delivered through corporate actions or exchanges. Realized and unrealized gains (losses) disclosed in the reconciliation are included in Net Gain (Loss) on the Fund's Statement of Operations. | |||
| Statement of Assets and Liabilities | ||||
January 31, 2023 (Unaudited) | ||||
| Assets | ||||
| Investment in securities, at value (including securities loaned of $317,937,416) - See accompanying schedule: | ||||
Unaffiliated issuers (cost $4,642,636,221) | $ | 5,186,685,371 | ||
Fidelity Central Funds (cost $365,117,474) | 365,117,474 | |||
Other affiliated issuers (cost $66,117,748) | 68,483,625 | |||
| Total Investment in Securities (cost $5,073,871,443) | $ | 5,620,286,470 | ||
| Receivable for investments sold | 31,289,905 | |||
| Receivable for fund shares sold | 2,599,949 | |||
| Dividends receivable | 701,013 | |||
| Distributions receivable from Fidelity Central Funds | 405,249 | |||
| Prepaid expenses | 4,824 | |||
Total assets | 5,655,287,410 | |||
| Liabilities | ||||
| Payable to custodian bank | $ | 621 | ||
| Payable for investments purchased | ||||
Regular delivery | 36,940,133 | |||
Delayed delivery | 7,944,334 | |||
| Payable for fund shares redeemed | 3,418,834 | |||
| Accrued management fee | 3,548,628 | |||
| Distribution and service plan fees payable | 129,237 | |||
| Other affiliated payables | 650,955 | |||
| Other payables and accrued expenses | 31,031 | |||
| Collateral on securities loaned | 314,567,327 | |||
| Total Liabilities | 367,231,100 | |||
| Net Assets | $ | 5,288,056,310 | ||
| Net Assets consist of: | ||||
| Paid in capital | $ | 5,156,719,115 | ||
| Total accumulated earnings (loss) | 131,337,195 | |||
| Net Assets | $ | 5,288,056,310 | ||
| Net Asset Value and Maximum Offering Price | ||||
| Class A : | ||||
Net Asset Value and redemption price per share ($281,740,267 ÷ 11,701,905 shares) (a) | $ | 24.08 | ||
| Maximum offering price per share (100/94.25 of $24.08) | $ | 25.55 | ||
| Class M : | ||||
Net Asset Value and redemption price per share ($72,028,902 ÷ 3,171,874 shares) (a) | $ | 22.71 | ||
| Maximum offering price per share (100/96.50 of $22.71) | $ | 23.53 | ||
| Class C : | ||||
Net Asset Value and offering price per share ($55,509,587 ÷ 2,830,306 shares) (a) | $ | 19.61 | ||
| Small Cap Growth : | ||||
Net Asset Value , offering price and redemption price per share ($2,739,835,066 ÷ 105,878,814 shares) | $ | 25.88 | ||
| Class I : | ||||
Net Asset Value , offering price and redemption price per share ($603,078,821 ÷ 23,230,283 shares) | $ | 25.96 | ||
| Class Z : | ||||
Net Asset Value , offering price and redemption price per share ($1,535,863,667 ÷ 58,768,634 shares) | $ | 26.13 | ||
(a)Redemption price per share is equal to net asset value less any applicable contingent deferred sales charge. | ||||
| Statement of Operations | ||||
Six months ended January 31, 2023 (Unaudited) | ||||
| Investment Income | ||||
| Dividends | $ | 12,912,061 | ||
| Income from Fidelity Central Funds (including $1,843,393 from security lending) | 2,626,077 | |||
| Total Income | 15,538,138 | |||
| Expenses | ||||
| Management fee | ||||
| Basic fee | $ | 17,031,857 | ||
| Performance adjustment | 4,644,264 | |||
| Transfer agent fees | 3,479,345 | |||
| Distribution and service plan fees | 790,506 | |||
| Accounting fees | 479,849 | |||
| Custodian fees and expenses | 18,734 | |||
| Independent trustees' fees and expenses | 8,790 | |||
| Registration fees | 113,687 | |||
| Audit | 47,240 | |||
| Legal | 7,823 | |||
| Interest | 16,876 | |||
| Miscellaneous | 16,168 | |||
| Total expenses before reductions | 26,655,139 | |||
| Expense reductions | (96,814) | |||
| Total expenses after reductions | 26,558,325 | |||
| Net Investment income (loss) | (11,020,187) | |||
| Realized and Unrealized Gain (Loss) | ||||
| Net realized gain (loss) on: | ||||
| Investment Securities: | ||||
| Unaffiliated issuers | (110,388,484) | |||
| Redemptions in-kind | 13,951,066 | |||
| Affiliated issuers | (35,070,799) | |||
| Foreign currency transactions | (206,583) | |||
| Total net realized gain (loss) | (131,714,800) | |||
| Change in net unrealized appreciation (depreciation) on: | ||||
| Investment Securities: | ||||
| Unaffiliated issuers | 302,873,037 | |||
| Affiliated issuers | 52,327,531 | |||
| Assets and liabilities in foreign currencies | 2,703 | |||
| Total change in net unrealized appreciation (depreciation) | 355,203,271 | |||
| Net gain (loss) | 223,488,471 | |||
| Net increase (decrease) in net assets resulting from operations | $ | 212,468,284 | ||
| Statement of Changes in Net Assets | ||||
Six months ended January 31, 2023 (Unaudited) | Year ended July 31, 2022 | |||
| Increase (Decrease) in Net Assets | ||||
| Operations | ||||
| Net investment income (loss) | $ | (11,020,187) | $ | (20,508,198) |
| Net realized gain (loss) | (131,714,800) | (11,495,189) | ||
| Change in net unrealized appreciation (depreciation) | 355,203,271 | (1,319,578,419) | ||
| Net increase (decrease) in net assets resulting from operations | 212,468,284 | (1,351,581,806) | ||
| Distributions to shareholders | - | (1,068,881,678) | ||
| Share transactions - net increase (decrease) | (161,002,369) | 1,399,956,604 | ||
| Total increase (decrease) in net assets | 51,465,915 | (1,020,506,880) | ||
| Net Assets | ||||
| Beginning of period | 5,236,590,395 | 6,257,097,275 | ||
| End of period | $ | 5,288,056,310 | $ | 5,236,590,395 |
| Fidelity Advisor® Small Cap Growth Fund Class A |
Six months ended (Unaudited) January 31, 2023 | Years ended July 31, 2022 | 2021 | 2020 | 2019 | 2018 | |||||||
Selected Per-Share Data | ||||||||||||
| Net asset value, beginning of period | $ | 23.12 | $ | 34.89 | $ | 26.64 | $ | 26.03 | $ | 27.45 | $ | 22.99 |
| Income from Investment Operations | ||||||||||||
Net investment income (loss) A,B | (.08) | (.17) | (.26) C | (.20) | (.21) | (.18) | ||||||
| Net realized and unrealized gain (loss) | 1.04 | (5.58) | 11.27 | 2.26 | 1.79 | 6.32 | ||||||
| Total from investment operations | .96 | (5.75) | 11.01 | 2.06 | 1.58 | 6.14 | ||||||
| Distributions from net realized gain | - | (6.02) | (2.76) | (1.45) | (3.00) | (1.68) | ||||||
| Total distributions | - | (6.02) | (2.76) | (1.45) | (3.00) | (1.68) | ||||||
Redemption fees added to paid in capital A | - | - | - | - | - | - D | ||||||
| Net asset value, end of period | $ | 24.08 | $ | 23.12 | $ | 34.89 | $ | 26.64 | $ | 26.03 | $ | 27.45 |
Total Return E,F,G | 4.15% | (20.62)% | 44.21% | 8.39% | 5.88% | 28.47% | ||||||
Ratios to Average Net Assets B,H,I | ||||||||||||
| Expenses before reductions | 1.33% J | 1.29% | 1.29% | 1.37% | 1.33% | 1.31% | ||||||
| Expenses net of fee waivers, if any | 1.33% J | 1.29% | 1.29% | 1.37% | 1.33% | 1.31% | ||||||
| Expenses net of all reductions | 1.33% J | 1.29% | 1.28% | 1.36% | 1.32% | 1.30% | ||||||
| Net investment income (loss) | (.71)% J | (.61)% | (.82)% C | (.80)% | (.85)% | (.74)% | ||||||
| Supplemental Data | ||||||||||||
| Net assets, end of period (000 omitted) | $ | 281,740 | $ | 287,905 | $ | 387,793 | $ | 268,448 | $ | 285,554 | $ | 315,894 |
Portfolio turnover rate K | 60% J,L | 79% L | 107% | 126% L | 91% L | 106% L |
| Fidelity Advisor® Small Cap Growth Fund Class M |
Six months ended (Unaudited) January 31, 2023 | Years ended July 31, 2022 | 2021 | 2020 | 2019 | 2018 | |||||||
Selected Per-Share Data | ||||||||||||
| Net asset value, beginning of period | $ | 21.83 | $ | 33.27 | $ | 25.56 | $ | 25.09 | $ | 26.59 | $ | 22.35 |
| Income from Investment Operations | ||||||||||||
Net investment income (loss) A,B | (.10) | (.22) | (.33) C | (.25) | (.26) | (.24) | ||||||
| Net realized and unrealized gain (loss) | .98 | (5.28) | 10.77 | 2.17 | 1.72 | 6.13 | ||||||
| Total from investment operations | .88 | (5.50) | 10.44 | 1.92 | 1.46 | 5.89 | ||||||
| Distributions from net realized gain | - | (5.94) | (2.73) | (1.45) | (2.96) | (1.65) | ||||||
| Total distributions | - | (5.94) | (2.73) | (1.45) | (2.96) | (1.65) | ||||||
Redemption fees added to paid in capital A | - | - | - | - | - | - D | ||||||
| Net asset value, end of period | $ | 22.71 | $ | 21.83 | $ | 33.27 | $ | 25.56 | $ | 25.09 | $ | 26.59 |
Total Return E,F,G | 4.03% | (20.85)% | 43.82% | 8.14% | 5.60% | 28.15% | ||||||
Ratios to Average Net Assets B,H,I | ||||||||||||
| Expenses before reductions | 1.58% J | 1.54% | 1.55% | 1.63% | 1.60% | 1.58% | ||||||
| Expenses net of fee waivers, if any | 1.58% J | 1.54% | 1.55% | 1.63% | 1.60% | 1.58% | ||||||
| Expenses net of all reductions | 1.58% J | 1.54% | 1.53% | 1.62% | 1.59% | 1.57% | ||||||
| Net investment income (loss) | (.96)% J | (.86)% | (1.08)% C | (1.06)% | (1.12)% | (1.01)% | ||||||
| Supplemental Data | ||||||||||||
| Net assets, end of period (000 omitted) | $ | 72,029 | $ | 70,182 | $ | 98,005 | $ | 70,605 | $ | 75,030 | $ | 82,567 |
Portfolio turnover rate K | 60% J,L | 79% L | 107% | 126% L | 91% L | 106% L |
| Fidelity Advisor® Small Cap Growth Fund Class C |
Six months ended (Unaudited) January 31, 2023 | Years ended July 31, 2022 | 2021 | 2020 | 2019 | 2018 | |||||||
Selected Per-Share Data | ||||||||||||
| Net asset value, beginning of period | $ | 18.90 | $ | 29.58 | $ | 23.07 | $ | 22.89 | $ | 24.56 | $ | 20.83 |
| Income from Investment Operations | ||||||||||||
Net investment income (loss) A,B | (.14) | (.31) | (.43) C | (.34) | (.35) | (.34) | ||||||
| Net realized and unrealized gain (loss) | .85 | (4.54) | 9.62 | 1.97 | 1.58 | 5.69 | ||||||
| Total from investment operations | .71 | (4.85) | 9.19 | 1.63 | 1.23 | 5.35 | ||||||
| Distributions from net realized gain | - | (5.83) | (2.68) | (1.45) | (2.90) | (1.62) | ||||||
| Total distributions | - | (5.83) | (2.68) | (1.45) | (2.90) | (1.62) | ||||||
Redemption fees added to paid in capital A | - | - | - | - | - | - D | ||||||
| Net asset value, end of period | $ | 19.61 | $ | 18.90 | $ | 29.58 | $ | 23.07 | $ | 22.89 | $ | 24.56 |
Total Return E,F,G | 3.76% | (21.24)% | 43.07% | 7.62% | 5.06% | 27.51% | ||||||
Ratios to Average Net Assets B,H,I | ||||||||||||
| Expenses before reductions | 2.09% J | 2.05% | 2.06% | 2.13% | 2.09% | 2.07% | ||||||
| Expenses net of fee waivers, if any | 2.09% J | 2.05% | 2.06% | 2.13% | 2.09% | 2.07% | ||||||
| Expenses net of all reductions | 2.09% J | 2.05% | 2.05% | 2.12% | 2.08% | 2.06% | ||||||
| Net investment income (loss) | (1.47)% J | (1.37)% | (1.59)% C | (1.56)% | (1.61)% | (1.50)% | ||||||
| Supplemental Data | ||||||||||||
| Net assets, end of period (000 omitted) | $ | 55,510 | $ | 59,768 | $ | 88,239 | $ | 77,850 | $ | 96,449 | $ | 139,375 |
Portfolio turnover rate K | 60% J,L | 79% L | 107% | 126% L | 91% L | 106% L |
| Fidelity® Small Cap Growth Fund |
Six months ended (Unaudited) January 31, 2023 | Years ended July 31, 2022 | 2021 | 2020 | 2019 | 2018 | |||||||
Selected Per-Share Data | ||||||||||||
| Net asset value, beginning of period | $ | 24.81 | $ | 37.02 | $ | 28.07 | $ | 27.27 | $ | 28.59 | $ | 23.84 |
| Income from Investment Operations | ||||||||||||
Net investment income (loss) A,B | (.05) | (.10) | (.18) C | (.13) | (.15) | (.12) | ||||||
| Net realized and unrealized gain (loss) | 1.12 | (6.00) | 11.92 | 2.38 | 1.87 | 6.57 | ||||||
| Total from investment operations | 1.07 | (6.10) | 11.74 | 2.25 | 1.72 | 6.45 | ||||||
| Distributions from net realized gain | - | (6.11) | (2.79) | (1.45) | (3.04) | (1.70) | ||||||
| Total distributions | - | (6.11) | (2.79) | (1.45) | (3.04) | (1.70) | ||||||
Redemption fees added to paid in capital B | - | - | - | - | - | - D | ||||||
| Net asset value, end of period | $ | 25.88 | $ | 24.81 | $ | 37.02 | $ | 28.07 | $ | 27.27 | $ | 28.59 |
Total Return E,F | 4.31% | (20.42)% | 44.60% | 8.72% | 6.17% | 28.81% | ||||||
Ratios to Average Net Assets A,G,H | ||||||||||||
| Expenses before reductions | 1.06% I | 1.02% | 1.00% | 1.08% | 1.05% | 1.02% | ||||||
| Expenses net of fee waivers, if any | 1.06% I | 1.01% | 1.00% | 1.08% | 1.05% | 1.02% | ||||||
| Expenses net of all reductions | 1.06% I | 1.01% | .99% | 1.07% | 1.04% | 1.01% | ||||||
| Net investment income (loss) | (.44)% I | (.33)% | (.53)% C | (.52)% | (.57)% | (.45)% | ||||||
| Supplemental Data | ||||||||||||
| Net assets, end of period (000 omitted) | $ | 2,739,835 | $ | 2,747,002 | $ | 4,540,695 | $ | 2,839,506 | $ | 2,888,038 | $ | 3,269,548 |
Portfolio turnover rate J | 60% I,K | 79% K | 107% | 126% K | 91% K | 106% K |
| Fidelity Advisor® Small Cap Growth Fund Class I |
Six months ended (Unaudited) January 31, 2023 | Years ended July 31, 2022 | 2021 | 2020 | 2019 | 2018 | |||||||
Selected Per-Share Data | ||||||||||||
| Net asset value, beginning of period | $ | 24.90 | $ | 37.13 | $ | 28.15 | $ | 27.35 | $ | 28.66 | $ | 23.90 |
| Income from Investment Operations | ||||||||||||
Net investment income (loss) A,B | (.06) | (.10) | (.19) C | (.14) | (.15) | (.12) | ||||||
| Net realized and unrealized gain (loss) | 1.12 | (6.03) | 11.96 | 2.39 | 1.88 | 6.58 | ||||||
| Total from investment operations | 1.06 | (6.13) | 11.77 | 2.25 | 1.73 | 6.46 | ||||||
| Distributions from net realized gain | - | (6.10) | (2.79) | (1.45) | (3.04) | (1.70) | ||||||
| Total distributions | - | (6.10) | (2.79) | (1.45) | (3.04) | (1.70) | ||||||
Redemption fees added to paid in capital A | - | - | - | - | - | - D | ||||||
| Net asset value, end of period | $ | 25.96 | $ | 24.90 | $ | 37.13 | $ | 28.15 | $ | 27.35 | $ | 28.66 |
Total Return E,F | 4.26% | (20.42)% | 44.57% | 8.70% | 6.18% | 28.78% | ||||||
Ratios to Average Net Assets B,G,H | ||||||||||||
| Expenses before reductions | 1.07% I | 1.04% | 1.04% | 1.11% | 1.06% | 1.03% | ||||||
| Expenses net of fee waivers, if any | 1.07% I | 1.03% | 1.04% | 1.11% | 1.06% | 1.03% | ||||||
| Expenses net of all reductions | 1.07% I | 1.03% | 1.03% | 1.10% | 1.06% | 1.02% | ||||||
| Net investment income (loss) | (.45)% I | (.35)% | (.57)% C | (.54)% | (.58)% | (.46)% | ||||||
| Supplemental Data | ||||||||||||
| Net assets, end of period (000 omitted) | $ | 603,079 | $ | 606,422 | $ | 775,746 | $ | 540,553 | $ | 590,311 | $ | 678,576 |
Portfolio turnover rate J | 60% I,K | 79% K | 107% | 126% K | 91% K | 106% K |
| Fidelity Advisor® Small Cap Growth Fund Class Z |
Six months ended (Unaudited) January 31, 2023 | Years ended July 31, 2022 | 2021 | 2020 | 2019 | 2018 | |||||||
Selected Per-Share Data | ||||||||||||
| Net asset value, beginning of period | $ | 25.04 | $ | 37.32 | $ | 28.26 | $ | 27.41 | $ | 28.71 | $ | 23.91 |
| Income from Investment Operations | ||||||||||||
Net investment income (loss) A,B | (.04) | (.06) | (.15) C | (.10) | (.11) | (.09) | ||||||
| Net realized and unrealized gain (loss) | 1.13 | (6.06) | 12.01 | 2.40 | 1.87 | 6.61 | ||||||
| Total from investment operations | 1.09 | (6.12) | 11.86 | 2.30 | 1.76 | 6.52 | ||||||
| Distributions from net realized gain | - | (6.16) | (2.80) | (1.45) | (3.06) | (1.72) | ||||||
| Total distributions | - | (6.16) | (2.80) | (1.45) | (3.06) | (1.72) | ||||||
Redemption fees added to paid in capital A | - | - | - | - | - | - D | ||||||
| Net asset value, end of period | $ | 26.13 | $ | 25.04 | $ | 37.32 | $ | 28.26 | $ | 27.41 | $ | 28.71 |
Total Return E,F | 4.35% | (20.33)% | 44.75% | 8.87% | 6.29% | 29.02% | ||||||
Ratios to Average Net Assets B,G,H | ||||||||||||
| Expenses before reductions | .93% I | .90% | .90% | .97% | .92% | .89% | ||||||
| Expenses net of fee waivers, if any | .93% I | .90% | .90% | .96% | .92% | .89% | ||||||
| Expenses net of all reductions | .93% I | .90% | .89% | .95% | .92% | .88% | ||||||
| Net investment income (loss) | (.31)% I | (.22)% | (.43)% C | (.40)% | (.44)% | (.32)% | ||||||
| Supplemental Data | ||||||||||||
| Net assets, end of period (000 omitted) | $ | 1,535,864 | $ | 1,465,312 | $ | 366,620 | $ | 197,764 | $ | 183,552 | $ | 132,928 |
Portfolio turnover rate J | 60% I,K | 79% K | 107% | 126% K | 91% K | 106% K |
| Fidelity Central Fund | Investment Manager | Investment Objective | Investment Practices | Expense Ratio A |
| Fidelity Money Market Central Funds | Fidelity Management & Research Company LLC (FMR) | Each fund seeks to obtain a high level of current income consistent with the preservation of capital and liquidity. | Short-term Investments | Less than .005% |
| Asset Type | Fair Value | Valuation Techniques | Unobservable Input | Amount or Range / Weighted Average | Impact to Valuation from an Increase in Input A |
| Equities | $ 182,177,738 | Market comparable | Enterprise value/EBITDA multiple (EV/EBITDA) | 6.0 - 6.5 / 6.3 | Increase |
| Enterprise value/Revenue multiple (EV/R) | 2.0 - 9.4 / 5.3 | Increase | |||
| Enterprise value/Net income multiple (EV/NI) | 16.8 | Increase | |||
| Recovery value | Recovery value | $0.00 | Increase | ||
| Market approach | Transaction price | $1.35 - $8.61 / $3.85 | Increase | ||
| Discount rate | 10.0% - 33.6% / 26.3% | Decrease | |||
| Black scholes | Discount rate | 3.9% | Increase | ||
| Volatility | 50.0% - 90.0% / 79.3% | Increase | |||
| Term | 3.0 | Increase |
| Gross unrealized appreciation | $1,050,722,227 |
| Gross unrealized depreciation | (519,082,378) |
| Net unrealized appreciation (depreciation) | $531,639,849 |
| Tax cost | $5,088,646,621 |
| $ Amount | % of Net Assets | |
| Fidelity Small Cap Growth Fund | 10,825,770 | .20 |
| Purchases ($) | Sales ($) | |
| Fidelity Small Cap Growth Fund | 1,503,143,878 | 1,607,228,984 |
| Shares | Total net realized gain or loss ($) | Total Proceeds ($) | Participating classes | |
| Fidelity Small Cap Growth Fund | 2,811,508 | 13,951,066 | 71,358,120 | Fidelity Small Cap Growth, and Class Z |
| Shares | Total net realized gain or loss ($) | Total Proceeds ($) | Participating classes | |
| Fidelity Small Cap Growth Fund | 1,267,055 | 6,413,331 | 32,229,577 | Fidelity Small Cap Growth and Class I |
| Distribution Fee | Service Fee | Total Fees | Retained by FDC | |
| Class A | - % | .25% | $342,647 | $12,993 |
| Class M | .25% | .25% | 171,062 | - |
| Class C | .75% | .25% | 276,797 | 28,866 |
| $790,506 | $41,859 |
| Retained by FDC | |
| Class A | $30,537 |
| Class M | 2,834 |
Class C A | 264 |
| $33,635 |
| Amount | % of Class-Level Average Net Assets A | |
| Class A | $261,974 | .19 |
| Class M | 67,043 | .20 |
| Class C | 56,206 | .20 |
| Small Cap Growth | 2,258,533 | .17 |
| Class I | 537,782 | .18 |
| Class Z | 297,807 | .04 |
| $3,479,345 |
| % of Average Net Assets | |
| Fidelity Small Cap Growth Fund | .02 |
| Amount | |
| Fidelity Small Cap Growth Fund | $47,065 |
| Borrower or Lender | Average Loan Balance | Weighted Average Interest Rate | Interest Expense | |
| Fidelity Small Cap Growth Fund | Borrower | $ 11,244,000 | 3.60% | $16,876 |
| Purchases ($) | Sales ($) | Realized Gain (Loss) ($) | |
| Fidelity Small Cap Growth Fund | 75,068,774 | 109,842,349 | 12,302,415 |
| Amount | |
| Fidelity Small Cap Growth Fund | $6,816 |
| Total Security Lending Fees Paid to NFS | Security Lending Income From Securities Loaned to NFS | Value of Securities Loaned to NFS at Period End | |
| Fidelity Small Cap Growth Fund | $185,925 | $47,626 | $4,052,847 |
| Expense reduction | |
| Class M | $398 |
Six months ended January 31, 2023 | Year ended July 31, 2022 | |
| Fidelity Small Cap Growth Fund | ||
| Distributions to shareholders | ||
| Class A | $- | $67,979,799 |
| Class M | - | 17,907,670 |
| Class C | - | 17,539,783 |
| Small Cap Growth | - | 638,250,356 |
| Class I | - | 130,451,281 |
| Class Z | - | 196,752,789 |
Total | $- | $1,068,881,678 |
| Shares | Shares | Dollars | Dollars | |
Six months ended January 31, 2023 | Year ended July 31, 2022 | Six months ended January 31, 2023 | Year ended July 31, 2022 | |
| Fidelity Small Cap Growth Fund | ||||
| Class A | ||||
| Shares sold | 904,138 | 2,718,612 | $20,418,551 | $74,995,450 |
| Reinvestment of distributions | - | 2,151,573 | - | 67,245,012 |
| Shares redeemed | (1,655,708) | (3,530,802) | (37,459,407) | (96,163,790) |
| Net increase (decrease) | (751,570) | 1,339,383 | $(17,040,856) | $46,076,672 |
| Class M | ||||
| Shares sold | 172,159 | 431,115 | $3,675,271 | $11,263,605 |
| Reinvestment of distributions | - | 597,527 | - | 17,701,076 |
| Shares redeemed | (214,908) | (760,045) | (4,568,356) | (19,559,813) |
| Net increase (decrease) | (42,749) | 268,597 | $(893,085) | $9,404,868 |
| Class C | ||||
| Shares sold | 137,009 | 571,841 | $2,531,726 | $13,494,292 |
| Reinvestment of distributions | - | 673,112 | - | 17,397,814 |
| Shares redeemed | (468,414) | (1,065,945) | (8,690,095) | (24,414,238) |
| Net increase (decrease) | (331,405) | 179,008 | $(6,158,369) | $6,477,868 |
| Small Cap Growth | ||||
| Shares sold | 7,139,644 | 20,198,332 | $175,058,226 | $601,187,332 |
| Reinvestment of distributions | - | 18,119,358 | - | 605,852,496 |
| Shares redeemed | (11,968,636) | (50,251,214) | (290,590,591) | (1,631,982,649) |
| Net increase (decrease) | (4,828,992) | (11,933,524) | $(115,532,365) | $(424,942,821) |
| Class I | ||||
| Shares sold | 3,387,761 | 9,200,827 | $82,797,579 | $260,264,783 |
| Reinvestment of distributions | - | 3,793,722 | - | 127,231,880 |
| Shares redeemed | (4,516,492) | (9,529,628) | (109,909,772) | (270,197,792) |
| Net increase (decrease) | (1,128,731) | 3,464,921 | $(27,112,193) | $117,298,871 |
| Class Z | ||||
| Shares sold | 5,290,876 | 47,704,858 | $130,706,411 | $1,587,489,270 |
| Reinvestment of distributions | - | 5,572,104 | - | 186,739,643 |
| Shares redeemed | (5,033,947) | (4,588,101) | (124,971,912) | (128,587,767) |
| Net increase (decrease) | 256,929 | 48,688,861 | $5,734,499 | $1,645,641,146 |
| Strategic Advisers Fidelity U.S. Total Stock Fund | |
| Fidelity Small Cap Growth Fund | 14% |
| Fund | % of shares held |
| Fidelity Small Cap Growth Fund | 22% |
| The Example is based on an investment of $1,000 invested at the beginning of the period and held for the entire period (August 1, 2022 to January 31, 2023). |
Annualized Expense Ratio- A | Beginning Account Value August 1, 2022 | Ending Account Value January 31, 2023 | Expenses Paid During Period- C August 1, 2022 to January 31, 2023 | |||||||
| Fidelity® Small Cap Growth Fund | ||||||||||
| Class A | 1.33% | |||||||||
| Actual | $ 1,000 | $ 1,041.50 | $ 6.84 | |||||||
Hypothetical- B | $ 1,000 | $ 1,018.50 | $ 6.77 | |||||||
| Class M | 1.58% | |||||||||
| Actual | $ 1,000 | $ 1,040.30 | $ 8.13 | |||||||
Hypothetical- B | $ 1,000 | $ 1,017.24 | $ 8.03 | |||||||
| Class C | 2.09% | |||||||||
| Actual | $ 1,000 | $ 1,037.60 | $ 10.73 | |||||||
Hypothetical- B | $ 1,000 | $ 1,014.67 | $ 10.61 | |||||||
| Fidelity® Small Cap Growth Fund | 1.06% | |||||||||
| Actual | $ 1,000 | $ 1,043.10 | $ 5.46 | |||||||
Hypothetical- B | $ 1,000 | $ 1,019.86 | $ 5.40 | |||||||
| Class I | 1.07% | |||||||||
| Actual | $ 1,000 | $ 1,042.60 | $ 5.51 | |||||||
Hypothetical- B | $ 1,000 | $ 1,019.81 | $ 5.45 | |||||||
| Class Z | .93% | |||||||||
| Actual | $ 1,000 | $ 1,043.50 | $ 4.79 | |||||||
Hypothetical- B | $ 1,000 | $ 1,020.52 | $ 4.74 | |||||||
- Highly liquid investments - cash or convertible to cash within three business days or less
- Moderately liquid investments - convertible to cash in three to seven calendar days
- Less liquid investments - can be sold or disposed of, but not settled, within seven calendar days
- Illiquid investments - cannot be sold or disposed of within seven calendar days
|


Contents
Top Holdings (% of Fund's net assets) | ||
| Apple, Inc. | 12.6 | |
| Microsoft Corp. | 11.4 | |
| Amazon.com, Inc. | 6.1 | |
| Alphabet, Inc. Class A | 4.9 | |
| Alphabet, Inc. Class C | 3.0 | |
| Meta Platforms, Inc. Class A | 2.8 | |
| Taiwan Semiconductor Manufacturing Co. Ltd. sponsored ADR | 2.3 | |
| Marvell Technology, Inc. | 2.1 | |
| Comcast Corp. Class A | 2.0 | |
| Regeneron Pharmaceuticals, Inc. | 2.0 | |
| 49.2 | ||
| Market Sectors (% of Fund's net assets) | ||
| Information Technology | 43.5 | |
| Communication Services | 18.1 | |
| Consumer Discretionary | 15.2 | |
| Health Care | 9.4 | |
| Energy | 5.7 | |
| Consumer Staples | 4.6 | |
| Financials | 2.4 | |
| Industrials | 1.2 | |
| Real Estate | 0.0 | |
Asset Allocation (% of Fund's net assets) |
 |
Short-Term Investments and Net Other Assets (Liabilities) - (0.1)%* |
Foreign investments - 12.4% |
Short-Term Investments and Net Other Assets (Liabilities) are not available in the pie chart. |
Geographic Diversification (% of Fund's net assets) |
 |
* Includes Short-Term investments and Net Other Assets (Liabilities). Percentages are based on country or territory of incorporation and are adjusted for the effect of derivatives, if applicable. |
| Common Stocks - 99.1% | |||
| Shares | Value ($) | ||
| COMMUNICATION SERVICES - 17.8% | |||
| Diversified Telecommunication Services - 0.0% | |||
| Starry Group Holdings, Inc. Class A (a) | 88 | 4 | |
| Entertainment - 2.2% | |||
| Activision Blizzard, Inc. | 50,517 | 3,868,087 | |
| Electronic Arts, Inc. | 166 | 21,361 | |
| NetEase, Inc. ADR | 1,097 | 97,205 | |
| Netflix, Inc. (a) | 88,771 | 31,412,506 | |
| Take-Two Interactive Software, Inc. (a) | 1,562 | 176,865 | |
| 35,576,024 | |||
| Interactive Media & Services - 11.8% | |||
| Alphabet, Inc.: | |||
| Class A (a) | 814,610 | 80,516,052 | |
| Class C (a) | 495,647 | 49,500,266 | |
| Epic Games, Inc. (a)(b)(c) | 5,200 | 4,398,524 | |
| Match Group, Inc. (a) | 19,157 | 1,036,777 | |
| Meta Platforms, Inc. Class A (a) | 304,679 | 45,388,031 | |
| Tencent Holdings Ltd. sponsored ADR | 226,076 | 11,021,205 | |
| Vimeo, Inc. (a) | 23,769 | 107,911 | |
| Yandex NV Series A (a)(c)(d) | 253,404 | 869,135 | |
| 192,837,901 | |||
| Media - 3.8% | |||
| Charter Communications, Inc. Class A (a) | 76,101 | 29,246,375 | |
| Comcast Corp. Class A | 833,714 | 32,806,646 | |
| 62,053,021 | |||
| Wireless Telecommunication Services - 0.0% | |||
| T-Mobile U.S., Inc. (a) | 5,200 | 776,412 | |
TOTAL COMMUNICATION SERVICES | 291,243,362 | ||
| CONSUMER DISCRETIONARY - 14.8% | |||
| Automobiles - 0.1% | |||
| Rivian Automotive, Inc. (a) | 1,192 | 23,125 | |
| Tesla, Inc. (a) | 7,283 | 1,261,561 | |
| 1,284,686 | |||
| Hotels, Restaurants & Leisure - 1.4% | |||
| Airbnb, Inc. Class A (a) | 1,449 | 160,998 | |
| Churchill Downs, Inc. | 82,839 | 20,552,356 | |
| Domino's Pizza, Inc. | 2,200 | 776,600 | |
| Marriott International, Inc. Class A | 3,813 | 664,148 | |
| Vail Resorts, Inc. | 1,569 | 411,611 | |
| Wynn Resorts Ltd. (a) | 10,561 | 1,094,542 | |
| 23,660,255 | |||
| Internet & Direct Marketing Retail - 7.3% | |||
| Alibaba Group Holding Ltd. sponsored ADR (a) | 20,127 | 2,217,995 | |
| Amazon.com, Inc. (a) | 964,896 | 99,509,724 | |
| ContextLogic, Inc. (a) | 16,321 | 11,227 | |
| Etsy, Inc. (a) | 10,846 | 1,492,193 | |
| Global-e Online Ltd. (a) | 24,503 | 734,355 | |
| JD.com, Inc. Class A | 703 | 20,874 | |
| Meituan Class B (a)(e) | 410,921 | 9,186,500 | |
| Pinduoduo, Inc. ADR (a) | 61,339 | 6,009,995 | |
| thredUP, Inc. (a) | 7,155 | 12,378 | |
| Zomato Ltd. (a) | 368,500 | 226,285 | |
| 119,421,526 | |||
| Multiline Retail - 0.2% | |||
| Dollar Tree, Inc. (a) | 22,546 | 3,385,958 | |
| Specialty Retail - 3.3% | |||
| Five Below, Inc. (a) | 72,237 | 14,240,080 | |
| Lowe's Companies, Inc. | 74,341 | 15,481,513 | |
| Ross Stores, Inc. | 192,303 | 22,728,292 | |
| TJX Companies, Inc. | 15,421 | 1,262,363 | |
| 53,712,248 | |||
| Textiles, Apparel & Luxury Goods - 2.5% | |||
| Kontoor Brands, Inc. | 451 | 21,540 | |
| lululemon athletica, Inc. (a) | 68,253 | 20,945,481 | |
| LVMH Moet Hennessy Louis Vuitton SE | 20,843 | 18,195,427 | |
| NIKE, Inc. Class B | 12,714 | 1,618,874 | |
| 40,781,322 | |||
TOTAL CONSUMER DISCRETIONARY | 242,245,995 | ||
| CONSUMER STAPLES - 4.6% | |||
| Beverages - 3.0% | |||
| Diageo PLC | 213,731 | 9,345,625 | |
| Keurig Dr. Pepper, Inc. | 557,847 | 19,680,842 | |
| Monster Beverage Corp. (a) | 198,988 | 20,710,671 | |
| 49,737,138 | |||
| Food & Staples Retailing - 0.3% | |||
| Costco Wholesale Corp. | 9,779 | 4,998,438 | |
| Food Products - 1.3% | |||
| Mondelez International, Inc. | 322,764 | 21,121,676 | |
| Personal Products - 0.0% | |||
| The Honest Co., Inc. (a) | 506 | 1,670 | |
TOTAL CONSUMER STAPLES | 75,858,922 | ||
| ENERGY - 5.7% | |||
| Energy Equipment & Services - 1.8% | |||
| Halliburton Co. | 281,845 | 11,617,651 | |
| Schlumberger Ltd. | 251,462 | 14,328,305 | |
| TGS ASA ADR | 186,860 | 2,989,760 | |
| 28,935,716 | |||
| Oil, Gas & Consumable Fuels - 3.9% | |||
| Cenovus Energy, Inc. (Canada) | 11,807 | 235,865 | |
| Diamondback Energy, Inc. | 108,499 | 15,853,874 | |
| EOG Resources, Inc. | 942 | 124,580 | |
| Hess Corp. | 78,338 | 11,763,234 | |
| Reliance Industries Ltd. | 987,613 | 28,550,626 | |
| Reliance Industries Ltd. sponsored GDR (e) | 141,765 | 8,123,135 | |
| 64,651,314 | |||
TOTAL ENERGY | 93,587,030 | ||
| FINANCIALS - 2.1% | |||
| Banks - 2.1% | |||
| Bank of America Corp. | 153,254 | 5,437,452 | |
| Fifth Third Bancorp | 236,052 | 8,566,327 | |
| Huntington Bancshares, Inc. | 1,026,556 | 15,572,855 | |
| Wells Fargo & Co. | 100,377 | 4,704,670 | |
| Wintrust Financial Corp. | 2,901 | 265,354 | |
| 34,546,658 | |||
| Capital Markets - 0.0% | |||
| S&P Global, Inc. | 146 | 54,741 | |
TOTAL FINANCIALS | 34,601,399 | ||
| HEALTH CARE - 9.4% | |||
| Biotechnology - 5.3% | |||
| Alnylam Pharmaceuticals, Inc. (a) | 91,455 | 20,705,412 | |
| Amgen, Inc. | 46,767 | 11,803,991 | |
| Arcutis Biotherapeutics, Inc. (a) | 68,061 | 1,127,771 | |
| Ascendis Pharma A/S sponsored ADR (a) | 20,988 | 2,604,191 | |
| GenSight Biologics SA (a) | 15,138 | 56,448 | |
| Ionis Pharmaceuticals, Inc. (a) | 2,295 | 91,502 | |
| Regeneron Pharmaceuticals, Inc. (a) | 42,716 | 32,398,805 | |
| Relay Therapeutics, Inc. (a)(d) | 86,456 | 1,855,346 | |
| Trevena, Inc. (a) | 1,273 | 2,113 | |
| Vertex Pharmaceuticals, Inc. (a) | 50,639 | 16,361,461 | |
| 87,007,040 | |||
| Health Care Equipment & Supplies - 1.4% | |||
| DexCom, Inc. (a) | 47,433 | 5,079,600 | |
| Figs, Inc. Class A (a) | 3,752 | 33,580 | |
| Insulet Corp. (a) | 58,238 | 16,732,942 | |
| Neuronetics, Inc. (a) | 2,758 | 16,217 | |
| Outset Medical, Inc. (a) | 3,001 | 84,388 | |
| Pulmonx Corp. (a) | 2,777 | 24,688 | |
| Tandem Diabetes Care, Inc. (a) | 14,467 | 589,386 | |
| 22,560,801 | |||
| Health Care Providers & Services - 1.1% | |||
| agilon health, Inc. (a) | 35,902 | 781,228 | |
| Cigna Corp. | 6,044 | 1,913,953 | |
| Guardant Health, Inc. (a) | 166,127 | 5,221,372 | |
| Humana, Inc. | 20,240 | 10,356,808 | |
| 18,273,361 | |||
| Health Care Technology - 0.0% | |||
| Certara, Inc. (a) | 20,173 | 391,356 | |
| Life Sciences Tools & Services - 1.1% | |||
| 10X Genomics, Inc. (a)(d) | 23,967 | 1,122,375 | |
| Bruker Corp. | 195,976 | 13,741,837 | |
| Illumina, Inc. (a) | 3,001 | 642,814 | |
| Olink Holding AB ADR (a) | 84,991 | 1,664,124 | |
| Seer, Inc. (a) | 35,614 | 162,044 | |
| 17,333,194 | |||
| Pharmaceuticals - 0.5% | |||
| AstraZeneca PLC sponsored ADR | 133,990 | 8,758,926 | |
| Elanco Animal Health, Inc. (a) | 6,317 | 86,732 | |
| TherapeuticsMD, Inc. (a)(d) | 490 | 2,582 | |
| 8,848,240 | |||
TOTAL HEALTH CARE | 154,413,992 | ||
| INDUSTRIALS - 1.2% | |||
| Airlines - 0.0% | |||
| Wheels Up Experience, Inc. Class A (a) | 67,407 | 82,911 | |
| Professional Services - 1.1% | |||
| Verisk Analytics, Inc. | 96,172 | 17,483,108 | |
| Road & Rail - 0.1% | |||
| Canadian Pacific Railway Ltd. | 11,198 | 883,522 | |
| CSX Corp. | 25,171 | 778,287 | |
| 1,661,809 | |||
TOTAL INDUSTRIALS | 19,227,828 | ||
| INFORMATION TECHNOLOGY - 43.5% | |||
| Communications Equipment - 0.4% | |||
| Cisco Systems, Inc. | 139,652 | 6,796,863 | |
| IT Services - 3.6% | |||
| Gartner, Inc. (a) | 84,828 | 28,683,740 | |
| MasterCard, Inc. Class A | 67,763 | 25,112,968 | |
| MongoDB, Inc. Class A (a) | 8,044 | 1,723,105 | |
| PayPal Holdings, Inc. (a) | 12,959 | 1,056,029 | |
| Twilio, Inc. Class A (a) | 129 | 7,719 | |
| X Holdings I, Inc. (b)(c) | 5,783 | 2,294,290 | |
| 58,877,851 | |||
| Semiconductors & Semiconductor Equipment - 12.1% | |||
| Advanced Micro Devices, Inc. (a) | 165,655 | 12,448,973 | |
| Analog Devices, Inc. | 17,340 | 2,973,290 | |
| Applied Materials, Inc. | 184,079 | 20,522,968 | |
| ASML Holding NV | 45,580 | 30,121,087 | |
| Lam Research Corp. | 38,271 | 19,139,327 | |
| Marvell Technology, Inc. | 788,781 | 34,035,900 | |
| NVIDIA Corp. | 128,219 | 25,050,146 | |
| NXP Semiconductors NV | 43,110 | 7,945,604 | |
| Skyworks Solutions, Inc. | 7,819 | 857,510 | |
| Taiwan Semiconductor Manufacturing Co. Ltd. sponsored ADR | 403,227 | 37,391,240 | |
| Texas Instruments, Inc. | 46,967 | 8,323,022 | |
| 198,809,067 | |||
| Software - 14.6% | |||
| Adobe, Inc. (a) | 10,807 | 4,002,264 | |
| ANSYS, Inc. (a) | 4,416 | 1,176,246 | |
| Aspen Technology, Inc. (a) | 66,937 | 13,303,729 | |
| Autodesk, Inc. (a) | 19,277 | 4,147,639 | |
| Cadence Design Systems, Inc. (a) | 69,794 | 12,760,437 | |
| Dropbox, Inc. Class A (a) | 18,113 | 420,765 | |
| Duck Creek Technologies, Inc. (a) | 1,791 | 33,904 | |
| Dynatrace, Inc. (a) | 2,995 | 115,098 | |
| Intuit, Inc. | 24,324 | 10,281,025 | |
| Microsoft Corp. | 753,679 | 186,769,193 | |
| Salesforce.com, Inc. (a) | 609 | 102,294 | |
| Stripe, Inc. Class B (a)(b)(c) | 7,800 | 209,586 | |
| Synopsys, Inc. (a) | 13,742 | 4,861,233 | |
| Workday, Inc. Class A (a) | 6,047 | 1,097,107 | |
| 239,280,520 | |||
| Technology Hardware, Storage & Peripherals - 12.8% | |||
| Apple, Inc. | 1,437,966 | 207,484,114 | |
| Samsung Electronics Co. Ltd. | 19,210 | 955,687 | |
| Western Digital Corp. (a) | 21,766 | 956,616 | |
| 209,396,417 | |||
TOTAL INFORMATION TECHNOLOGY | 713,160,718 | ||
| REAL ESTATE - 0.0% | |||
| Equity Real Estate Investment Trusts (REITs) - 0.0% | |||
| Equinix, Inc. | 749 | 552,859 | |
| TOTAL COMMON STOCKS (Cost $1,430,992,269) | 1,624,892,105 | ||
| Preferred Stocks - 0.7% | |||
| Shares | Value ($) | ||
| Convertible Preferred Stocks - 0.4% | |||
| COMMUNICATION SERVICES - 0.3% | |||
| Interactive Media & Services - 0.3% | |||
| ByteDance Ltd. Series E1 (a)(b)(c) | 6,135 | 1,214,239 | |
| Reddit, Inc.: | |||
| Series E(a)(b)(c) | 2,900 | 108,895 | |
| Series F(a)(b)(c) | 108,712 | 4,082,136 | |
| 5,405,270 | |||
| CONSUMER DISCRETIONARY - 0.1% | |||
| Hotels, Restaurants & Leisure - 0.0% | |||
| Discord, Inc. Series I (a)(b)(c) | 300 | 114,897 | |
| Internet & Direct Marketing Retail - 0.1% | |||
| Circle Internet Financial Ltd. Series F (b)(c) | 33,481 | 1,131,658 | |
TOTAL CONSUMER DISCRETIONARY | 1,246,555 | ||
| INFORMATION TECHNOLOGY - 0.0% | |||
| Software - 0.0% | |||
| Stripe, Inc. Series H (a)(b)(c) | 3,000 | 80,610 | |
| Tenstorrent, Inc. Series C1 (a)(b)(c) | 3,400 | 177,412 | |
| 258,022 | |||
| TOTAL CONVERTIBLE PREFERRED STOCKS | 6,909,847 | ||
| Nonconvertible Preferred Stocks - 0.3% | |||
| CONSUMER DISCRETIONARY - 0.3% | |||
| Automobiles - 0.1% | |||
| Waymo LLC: | |||
| Series A2(a)(b)(c) | 2,467 | 119,427 | |
| Series B2(a)(b)(c) | 15,200 | 769,272 | |
| 888,699 | |||
| Internet & Direct Marketing Retail - 0.2% | |||
| Circle Internet Financial Ltd. Series E (b)(c) | 108,317 | 3,661,115 | |
TOTAL CONSUMER DISCRETIONARY | 4,549,814 | ||
| TOTAL PREFERRED STOCKS (Cost $12,775,810) | 11,459,661 | ||
| Convertible Bonds - 0.3% | |||
Principal Amount (f) | Value ($) | ||
| FINANCIALS - 0.3% | |||
| Capital Markets - 0.3% | |||
Coinbase Global, Inc. 0.5% 6/1/26 (Cost $5,202,699) | 7,223,542 | 4,893,950 | |
| Preferred Securities - 0.0% | |||
Principal Amount (f) | Value ($) | ||
| INFORMATION TECHNOLOGY - 0.0% | |||
| Software - 0.0% | |||
Tenstorrent, Inc. 0% (b)(c)(g) (Cost $190,000) | 190,000 | 166,820 | |
| Money Market Funds - 0.5% | |||
| Shares | Value ($) | ||
| Fidelity Cash Central Fund 4.38% (h) | 2,405,238 | 2,405,719 | |
| Fidelity Securities Lending Cash Central Fund 4.38% (h)(i) | 5,823,163 | 5,823,745 | |
| TOTAL MONEY MARKET FUNDS (Cost $8,229,464) | 8,229,464 | ||
| TOTAL INVESTMENT IN SECURITIES - 100.6% (Cost $1,457,390,242) | 1,649,642,000 |
NET OTHER ASSETS (LIABILITIES) - (0.6)% | (9,291,209) |
| NET ASSETS - 100.0% | 1,640,350,791 |
| (a) | Non-income producing |
| (b) | Restricted securities (including private placements) - Investment in securities not registered under the Securities Act of 1933 (excluding 144A issues). At the end of the period, the value of restricted securities (excluding 144A issues) amounted to $18,528,881 or 1.1% of net assets. |
| (c) | Level 3 security |
| (d) | Security or a portion of the security is on loan at period end. |
| (e) | Security exempt from registration under Rule 144A of the Securities Act of 1933. These securities may be resold in transactions exempt from registration, normally to qualified institutional buyers. At the end of the period, the value of these securities amounted to $17,309,635 or 1.1% of net assets. |
| (f) | Amount is stated in United States dollars unless otherwise noted. |
| (g) | Security is perpetual in nature with no stated maturity date. |
| (h) | Affiliated fund that is generally available only to investment companies and other accounts managed by Fidelity Investments. The rate quoted is the annualized seven-day yield of the fund at period end. A complete unaudited listing of the fund's holdings as of its most recent quarter end is available upon request. In addition, each Fidelity Central Fund's financial statements are available on the SEC's website or upon request. |
| (i) | Investment made with cash collateral received from securities on loan. |
| Additional information on each restricted holding is as follows: | ||
| Security | Acquisition Date | Acquisition Cost ($) |
| ByteDance Ltd. Series E1 | 11/18/20 | 672,238 |
| Circle Internet Financial Ltd. Series E | 5/11/21 | 1,758,000 |
| Circle Internet Financial Ltd. Series F | 5/09/22 | 1,410,889 |
| Discord, Inc. Series I | 9/15/21 | 165,187 |
| Epic Games, Inc. | 7/13/20 - 3/29/21 | 4,292,000 |
| Reddit, Inc. Series E | 5/18/21 | 123,175 |
| Reddit, Inc. Series F | 8/11/21 | 6,717,793 |
| Stripe, Inc. Class B | 5/18/21 | 313,001 |
| Stripe, Inc. Series H | 3/15/21 | 120,375 |
| Tenstorrent, Inc. Series C1 | 4/23/21 | 202,145 |
| Tenstorrent, Inc. 0% | 4/23/21 | 190,000 |
| Waymo LLC Series A2 | 5/08/20 | 211,834 |
| Waymo LLC Series B2 | 6/11/21 | 1,394,174 |
| X Holdings I, Inc. | 10/27/21 | 5,743,370 |
| Affiliate | Value, beginning of period ($) | Purchases ($) | Sales Proceeds ($) | Dividend Income ($) | Realized Gain (loss) ($) | Change in Unrealized appreciation (depreciation) ($) | Value, end of period ($) | % ownership, end of period |
| Fidelity Cash Central Fund 4.38% | 25,867,719 | 97,722,423 | 121,184,423 | 144,527 | - | - | 2,405,719 | 0.0% |
| Fidelity Securities Lending Cash Central Fund 4.38% | 24,755,878 | 73,303,887 | 92,236,020 | 202,965 | - | - | 5,823,745 | 0.0% |
| Total | 50,623,597 | 171,026,310 | 213,420,443 | 347,492 | - | - | 8,229,464 | |
| Valuation Inputs at Reporting Date: | ||||
| Description | Total ($) | Level 1 ($) | Level 2 ($) | Level 3 ($) |
Investments in Securities: | ||||
| Equities: | ||||
Communication Services | 296,648,632 | 285,975,703 | - | 10,672,929 |
Consumer Discretionary | 248,042,364 | 214,616,909 | 27,629,086 | 5,796,369 |
Consumer Staples | 75,858,922 | 66,513,297 | 9,345,625 | - |
Energy | 93,587,030 | 65,036,404 | 28,550,626 | - |
Financials | 34,601,399 | 34,601,399 | - | - |
Health Care | 154,413,992 | 154,413,992 | - | - |
Industrials | 19,227,828 | 19,227,828 | - | - |
Information Technology | 713,418,740 | 709,701,155 | 955,687 | 2,761,898 |
Real Estate | 552,859 | 552,859 | - | - |
| Corporate Bonds | 4,893,950 | - | 4,893,950 | - |
| Preferred Securities | 166,820 | - | - | 166,820 |
| Money Market Funds | 8,229,464 | 8,229,464 | - | - |
| Total Investments in Securities: | 1,649,642,000 | 1,558,869,010 | 71,374,974 | 19,398,016 |
| Net Unrealized Depreciation on Unfunded Commitments | (152,895) | - | - | (152,895) |
| Total | (152,895) | - | - | (152,895) |
| Investments in Securities: | |||
| Beginning Balance | $ | 13,213,584 | |
| Net Realized Gain (Loss) on Investment Securities | 101,575 | ||
| Net Unrealized Gain (Loss) on Investment Securities | (6,205,454) | ||
| Cost of Purchases | - | ||
| Proceeds of Sales | (325,654) | ||
| Amortization/Accretion | - | ||
| Transfers into Level 3 | 12,613,965 | ||
| Transfers out of Level 3 | - | ||
| Ending Balance | $ | 19,398,016 | |
| The change in unrealized gain (loss) for the period attributable to Level 3 securities held at January 31, 2023 | $ | (6,205,454) | |
| The information used in the above reconciliation represents fiscal year to date activity for any Investments in Securities identified as using Level 3 inputs at either the beginning or the end of the current fiscal period. Cost of purchases and proceeds of sales may include securities received and/or delivered through in-kind transactions. Transfers into Level 3 were attributable to a lack of observable market data resulting from decreases in market activity, decreases in liquidity, security restructurings or corporate actions. Transfers out of Level 3 were attributable to observable market data becoming available for those securities. Transfers in or out of Level 3 represent the beginning value of any Security or Instrument where a change in the pricing level occurred from the beginning to the end of the period. The cost of purchases and the proceeds of sales may include securities received or delivered through corporate actions or exchanges. Realized and unrealized gains (losses) disclosed in the reconciliation are included in Net Gain (Loss) on the Fund's Statement of Operations. | |||
| Statement of Assets and Liabilities | ||||
January 31, 2023 (Unaudited) | ||||
| Assets | ||||
| Investment in securities, at value (including securities loaned of $4,896,661) - See accompanying schedule: | ||||
Unaffiliated issuers (cost $1,449,160,778) | $ | 1,641,412,536 | ||
Fidelity Central Funds (cost $8,229,464) | 8,229,464 | |||
| Total Investment in Securities (cost $1,457,390,242) | $ | 1,649,642,000 | ||
| Receivable for fund shares sold | 2,181,907 | |||
| Dividends receivable | 693,190 | |||
| Interest receivable | 6,151 | |||
| Distributions receivable from Fidelity Central Funds | 73,459 | |||
| Other receivables | 5 | |||
Total assets | 1,652,596,712 | |||
| Liabilities | ||||
| Payable to custodian bank | $ | 3 | ||
| Unrealized depreciation on unfunded commitments | 152,895 | |||
| Payable for fund shares redeemed | 5,524,945 | |||
| Accrued management fee | 656,126 | |||
| Other payables and accrued expenses | 87,926 | |||
| Collateral on securities loaned | 5,824,026 | |||
| Total Liabilities | 12,245,921 | |||
| Net Assets | $ | 1,640,350,791 | ||
| Net Assets consist of: | ||||
| Paid in capital | $ | 1,552,535,713 | ||
| Total accumulated earnings (loss) | 87,815,078 | |||
| Net Assets | $ | 1,640,350,791 | ||
Net Asset Value , offering price and redemption price per share ($1,640,350,791 ÷ 106,563,096 shares) | $ | 15.39 | ||
| Statement of Operations | ||||
Six months ended January 31, 2023 (Unaudited) | ||||
| Investment Income | ||||
| Dividends | $ | 6,750,764 | ||
| Interest | 263,322 | |||
| Income from Fidelity Central Funds (including $202,965 from security lending) | 347,492 | |||
| Total Income | 7,361,578 | |||
| Expenses | ||||
| Management fee | $ | 4,049,043 | ||
| Independent trustees' fees and expenses | 2,910 | |||
| Interest | 1,774 | |||
| Total expenses before reductions | 4,053,727 | |||
| Expense reductions | (1,068) | |||
| Total expenses after reductions | 4,052,659 | |||
| Net Investment income (loss) | 3,308,919 | |||
| Realized and Unrealized Gain (Loss) | ||||
| Net realized gain (loss) on: | ||||
| Investment Securities: | ||||
| Unaffiliated issuers (net of foreign taxes of $547,103) | (86,291,072) | |||
| Redemptions in-kind | 71,430,269 | |||
| Foreign currency transactions | 105,112 | |||
| Total net realized gain (loss) | (14,755,691) | |||
| Change in net unrealized appreciation (depreciation) on: | ||||
| Investment Securities: | ||||
| Unaffiliated issuers (net of decrease in deferred foreign taxes of $352,425) | (16,878,373) | |||
| Unfunded commitments | 29,530 | |||
| Assets and liabilities in foreign currencies | (99,932) | |||
| Total change in net unrealized appreciation (depreciation) | (16,948,775) | |||
| Net gain (loss) | (31,704,466) | |||
| Net increase (decrease) in net assets resulting from operations | $ | (28,395,547) | ||
| Statement of Changes in Net Assets | ||||
Six months ended January 31, 2023 (Unaudited) | Year ended July 31, 2022 | |||
| Increase (Decrease) in Net Assets | ||||
| Operations | ||||
| Net investment income (loss) | $ | 3,308,919 | $ | (1,238,319) |
| Net realized gain (loss) | (14,755,691) | (64,095,382) | ||
| Change in net unrealized appreciation (depreciation) | (16,948,775) | (428,382,919) | ||
| Net increase (decrease) in net assets resulting from operations | (28,395,547) | (493,716,620) | ||
| Distributions to shareholders | (1,170,775) | (102,430,536) | ||
| Share transactions | ||||
| Proceeds from sales of shares | 103,113,441 | 603,778,476 | ||
| Reinvestment of distributions | 1,170,775 | 102,430,536 | ||
| Cost of shares redeemed | (358,715,932) | (816,272,268) | ||
Net increase (decrease) in net assets resulting from share transactions | (254,431,716) | (110,063,256) | ||
| Total increase (decrease) in net assets | (283,998,038) | (706,210,412) | ||
| Net Assets | ||||
| Beginning of period | 1,924,348,829 | 2,630,559,241 | ||
| End of period | $ | 1,640,350,791 | $ | 1,924,348,829 |
| Other Information | ||||
| Shares | ||||
| Sold | 7,059,108 | 33,021,590 | ||
| Issued in reinvestment of distributions | 76,322 | 4,958,146 | ||
| Redeemed | (23,727,735) | (44,040,760) | ||
| Net increase (decrease) | (16,592,305) | (6,061,024) | ||
| Fidelity® OTC K6 Portfolio |
Six months ended (Unaudited) January 31, 2023 | Years ended July 31, 2022 | 2021 | 2020 | 2019 A | ||||||
Selected Per-Share Data | ||||||||||
| Net asset value, beginning of period | $ | 15.63 | $ | 20.36 | $ | 14.29 | $ | 10.50 | $ | 10.00 |
| Income from Investment Operations | ||||||||||
Net investment income (loss) B,C | .03 | (.01) | (.01) | .02 | - D | |||||
| Net realized and unrealized gain (loss) | (.26) | (3.93) | 6.15 | 3.81 | .50 | |||||
| Total from investment operations | (.23) | (3.94) | 6.14 | 3.83 | .50 | |||||
| Distributions from net investment income | (.01) | - | (.01) | (.01) | - | |||||
| Distributions from net realized gain | - | (.79) | (.06) | (.02) | - | |||||
| Total distributions | (.01) | (.79) | (.07) | (.04) E | - | |||||
| Net asset value, end of period | $ | 15.39 | $ | 15.63 | $ | 20.36 | $ | 14.29 | $ | 10.50 |
Total Return F,G | (1.46)% | (20.27)% | 43.11% | 36.54% | 5.00% | |||||
Ratios to Average Net Assets C,H,I | ||||||||||
| Expenses before reductions | .50% J | .50% | .50% | .50% | .50% J | |||||
| Expenses net of fee waivers, if any | .50% J | .50% | .50% | .50% | .50% J | |||||
| Expenses net of all reductions | .50% J | .50% | .50% | .49% | .50% J | |||||
| Net investment income (loss) | .41% J | (.05)% | (.05)% | .16% | .08% J | |||||
| Supplemental Data | ||||||||||
| Net assets, end of period (000 omitted) | $ | 1,640,351 | $ | 1,924,349 | $ | 2,630,559 | $ | 1,026,111 | $ | 1,050 |
Portfolio turnover rate K | 16% J,J,L | 39% L | 36% L | 102% L | 5% J,M |
| Fidelity Central Fund | Investment Manager | Investment Objective | Investment Practices | Expense Ratio A |
| Fidelity Money Market Central Funds | Fidelity Management & Research Company LLC (FMR) | Each fund seeks to obtain a high level of current income consistent with the preservation of capital and liquidity. | Short-term Investments | Less than .005% |
| Asset Type | Fair Value | Valuation Technique(s) | Unobservable Input | Amount or Range/Weighted Average | Impact to Valuation from an Increase in Input A |
| Equities | $19,231,196 | Market comparable | Enterprise value/EBITDA multiple (EV/EBITDA) | 19.3 | Increase |
| Enterprise value/Revenue multiple (EV/R) | 4.0 - 20.5 / 6.8 | Increase | |||
| Market approach | Transaction price | $59.45 - $91.72 / $86.35 | Increase | ||
| Discount rate | 15.0% - 50.0% / 46.8% | Decrease | |||
| Black scholes | Discount rate | 3.5% - 4.1% / 3.6% | Increase | ||
| Probability rate | 50.0% | Increase | |||
| Volatility | 65.0% - 80.0% / 78.3% | Increase | |||
| Term | 2.0 - 5.0 / 4.5 | Increase | |||
| Preferred Securities | $166,820 | Market approach | Transaction price | $100.00 | Increase |
| Discount rate | 15.0% | Decrease | |||
| Black scholes | Discount rate | 4.1% | Increase | ||
| Volatility | 70.0% | Increase | |||
| Term | 2.0 | Increase |
| Gross unrealized appreciation | $294,207,486 |
| Gross unrealized depreciation | (123,688,636) |
| Net unrealized appreciation (depreciation) | $170,518,850 |
| Tax cost | $1,479,123,150 |
| Investment to be Acquired | Commitment Amount | Unrealized Appreciation (Depreciation) | |
| Fidelity OTC K6 Portfolio | Stripe, Inc. | $152,895 | $(152,895) |
| Purchases ($) | Sales ($) | |
| Fidelity OTC K6 Portfolio | 132,591,102 | 161,496,696 |
| Shares | Total net realized gain or loss ($) | Total Proceeds ($) | |
| Fidelity OTC K6 Portfolio | 13,676,855 | 71,430,269 | 211,033,879 |
| Shares | Total Proceeds ($) | |
| Fidelity OTC K6 Portfolio | 354,291 | 4,952,989 |
| Shares | Total Proceeds ($) | |
| Fidelity OTC K6 Portfolio | 8,003,342 | 144,799,277 |
| Amount | |
| Fidelity OTC K6 Portfolio | $3,099 |
| Borrower or Lender | Average Loan Balance | Weighted Average Interest Rate | Interest Expense | |
| Fidelity OTC K6 Portfolio | Borrower | $2,652,143 | 3.32% | $1,710 |
| Purchases ($) | Sales ($) | Realized Gain (Loss) ($) | |
| Fidelity OTC K6 Portfolio | 3,789,257 | 8,613,019 | (5,204,649) |
| Total Security Lending Fees Paid to NFS | Security Lending Income From Securities Loaned to NFS | Value of Securities Loaned to NFS at Period End | |
| Fidelity OTC K6 Portfolio | $21,479 | $18 | $- |
| Average Loan Balance | Weighted Average Interest Rate | Interest Expense | |
| Fidelity OTC K6 Portfolio | $646,000 | 3.58% | $64 |
| The Example is based on an investment of $1,000 invested at the beginning of the period and held for the entire period (August 1, 2022 to January 31, 2023). |
Annualized Expense Ratio- A | Beginning Account Value August 1, 2022 | Ending Account Value January 31, 2023 | Expenses Paid During Period- C August 1, 2022 to January 31, 2023 | |||||||
| Fidelity® OTC K6 Portfolio | .50% | |||||||||
| Actual | $ 1,000 | $ 985.40 | $ 2.50 | |||||||
Hypothetical- B | $ 1,000 | $ 1,022.68 | $ 2.55 | |||||||
- Highly liquid investments - cash or convertible to cash within three business days or less
- Moderately liquid investments - convertible to cash in three to seven calendar days
- Less liquid investments - can be sold or disposed of, but not settled, within seven calendar days
- Illiquid investments - cannot be sold or disposed of within seven calendar days
|


Contents
Top Holdings (% of Fund's net assets) | ||
| Exxon Mobil Corp.* | 7.7 | |
| Microsoft Corp. | 5.6 | |
| Wells Fargo & Co. | 5.4 | |
| General Electric Co.* | 4.5 | |
| Apple, Inc. | 2.9 | |
| Bank of America Corp. | 2.8 | |
| Comcast Corp. Class A | 1.9 | |
| Visa, Inc. Class A | 1.9 | |
| Hess Corp.* | 1.8 | |
| Bristol-Myers Squibb Co. | 1.8 | |
| 36.3 | ||
| Market Sectors (% of Fund's net assets) | ||
| Information Technology | 18.2 | |
| Industrials | 16.3 | |
| Financials | 16.0 | |
| Health Care | 13.3 | |
| Energy | 12.8 | |
| Communication Services | 5.1 | |
| Consumer Staples | 5.0 | |
| Consumer Discretionary | 2.9 | |
| Materials | 2.8 | |
| Utilities | 1.5 | |
| Real Estate | 1.3 | |
Asset Allocation (% of Fund's net assets) |
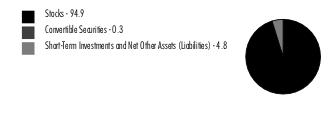 |
Foreign investments - 13.6% |
Written options - (0.1)% |
Geographic Diversification (% of Fund's net assets) |
 |
* Includes Short-Term investments and Net Other Assets (Liabilities). Percentages are based on country or territory of incorporation and are adjusted for the effect of derivatives, if applicable. |
| Common Stocks - 94.9% | |||
| Shares | Value ($) (000s) | ||
| COMMUNICATION SERVICES - 5.0% | |||
| Diversified Telecommunication Services - 0.8% | |||
| Cellnex Telecom SA (a) | 706,400 | 27,682 | |
| Elisa Corp. (A Shares) | 113,800 | 6,480 | |
| Verizon Communications, Inc. | 749,174 | 31,143 | |
| 65,305 | |||
| Entertainment - 1.6% | |||
| Activision Blizzard, Inc. | 131,350 | 10,057 | |
| Nintendo Co. Ltd. ADR | 1,036,800 | 11,166 | |
| The Walt Disney Co. (b) | 453,490 | 49,199 | |
| Universal Music Group NV | 1,751,900 | 44,783 | |
| Warner Music Group Corp. Class A | 411,600 | 15,003 | |
| 130,208 | |||
| Media - 2.6% | |||
| Comcast Corp. Class A | 4,001,612 | 157,463 | |
| Interpublic Group of Companies, Inc. | 1,606,331 | 58,567 | |
| 216,030 | |||
TOTAL COMMUNICATION SERVICES | 411,543 | ||
| CONSUMER DISCRETIONARY - 2.9% | |||
| Auto Components - 0.4% | |||
| BorgWarner, Inc. (c) | 673,452 | 31,841 | |
| Hotels, Restaurants & Leisure - 0.8% | |||
| Churchill Downs, Inc. | 111,500 | 27,663 | |
| Marriott International, Inc. Class A | 117,423 | 20,453 | |
| Starbucks Corp. | 143,260 | 15,635 | |
| 63,751 | |||
| Household Durables - 0.2% | |||
| Sony Group Corp. sponsored ADR | 128,714 | 11,515 | |
| Whirlpool Corp. | 31,894 | 4,962 | |
| 16,477 | |||
| Multiline Retail - 0.3% | |||
| Target Corp. | 122,300 | 21,053 | |
| Specialty Retail - 0.9% | |||
| Lowe's Companies, Inc. (c) | 357,814 | 74,515 | |
| TJX Companies, Inc. | 24,500 | 2,006 | |
| Williams-Sonoma, Inc. | 11,200 | 1,511 | |
| 78,032 | |||
| Textiles, Apparel & Luxury Goods - 0.3% | |||
| NIKE, Inc. Class B | 102,700 | 13,077 | |
| Puma AG | 158,954 | 10,776 | |
| Tapestry, Inc. | 3,700 | 169 | |
| 24,022 | |||
TOTAL CONSUMER DISCRETIONARY | 235,176 | ||
| CONSUMER STAPLES - 5.0% | |||
| Beverages - 2.3% | |||
| Diageo PLC sponsored ADR (d) | 221,511 | 39,174 | |
| Keurig Dr. Pepper, Inc. | 1,155,800 | 40,777 | |
| Pernod Ricard SA | 62,400 | 12,882 | |
| Remy Cointreau SA | 36,547 | 6,858 | |
| The Coca-Cola Co. | 1,406,710 | 86,259 | |
| 185,950 | |||
| Food & Staples Retailing - 1.2% | |||
| Alimentation Couche-Tard, Inc. Class A (multi-vtg.) | 44,400 | 2,028 | |
| Sysco Corp. | 708,136 | 54,852 | |
| Walmart, Inc. | 260,700 | 37,507 | |
| 94,387 | |||
| Food Products - 0.2% | |||
| Lamb Weston Holdings, Inc. (c) | 146,360 | 14,620 | |
| Household Products - 0.2% | |||
| Colgate-Palmolive Co. | 62,300 | 4,643 | |
| Kimberly-Clark Corp. | 12,500 | 1,625 | |
| Procter & Gamble Co. | 28,700 | 4,086 | |
| Spectrum Brands Holdings, Inc. | 139,983 | 9,502 | |
| 19,856 | |||
| Personal Products - 0.2% | |||
| Haleon PLC ADR (b) | 2,494,511 | 20,206 | |
| Tobacco - 0.9% | |||
| Altria Group, Inc. | 1,720,967 | 77,512 | |
TOTAL CONSUMER STAPLES | 412,531 | ||
| ENERGY - 12.8% | |||
| Energy Equipment & Services - 0.0% | |||
| Baker Hughes Co. Class A | 59,500 | 1,889 | |
| Oil, Gas & Consumable Fuels - 12.8% | |||
| Canadian Natural Resources Ltd. | 514,415 | 31,575 | |
| Cenovus Energy, Inc. (Canada) | 5,389,173 | 107,658 | |
| Energy Transfer LP | 323,500 | 4,296 | |
| Enterprise Products Partners LP | 190,200 | 4,869 | |
| Exxon Mobil Corp. (c) | 5,432,499 | 630,228 | |
| Hess Corp. (c) | 987,164 | 148,233 | |
| Imperial Oil Ltd. | 939,326 | 51,338 | |
| Kosmos Energy Ltd. (b) | 4,047,555 | 32,016 | |
| Phillips 66 Co. | 78,887 | 7,910 | |
| Tourmaline Oil Corp. | 644,400 | 30,032 | |
| 1,048,155 | |||
TOTAL ENERGY | 1,050,044 | ||
| FINANCIALS - 16.0% | |||
| Banks - 11.9% | |||
| Bank of America Corp. | 6,425,136 | 227,964 | |
| Comerica, Inc. | 36,100 | 2,646 | |
| JPMorgan Chase & Co. | 579,375 | 81,089 | |
| M&T Bank Corp. | 119,194 | 18,594 | |
| PNC Financial Services Group, Inc. | 509,701 | 84,320 | |
| Truist Financial Corp. | 1,395,932 | 68,945 | |
| U.S. Bancorp | 1,071,537 | 53,363 | |
| Wells Fargo & Co. | 9,452,070 | 443,019 | |
| 979,940 | |||
| Capital Markets - 2.6% | |||
| Ashmore Group PLC | 1,225,000 | 4,020 | |
| Brookfield Asset Management Ltd. Class A (b) | 75,747 | 2,473 | |
| Brookfield Corp. Class A | 324,202 | 12,060 | |
| CME Group, Inc. | 4,500 | 795 | |
| Intercontinental Exchange, Inc. | 12,600 | 1,355 | |
| KKR & Co. LP | 536,752 | 29,956 | |
| Morgan Stanley | 325,051 | 31,637 | |
| Northern Trust Corp. | 822,453 | 79,753 | |
| Raymond James Financial, Inc. | 386,170 | 43,548 | |
| S&P Global, Inc. | 1,100 | 412 | |
| State Street Corp. | 87,991 | 8,036 | |
| 214,045 | |||
| Consumer Finance - 0.2% | |||
| Discover Financial Services | 121,068 | 14,132 | |
| Insurance - 1.0% | |||
| American Financial Group, Inc. | 40,800 | 5,818 | |
| Brookfield Asset Management Reinsurance Partners Ltd. | 2,086 | 77 | |
| Chubb Ltd. | 109,856 | 24,991 | |
| Marsh & McLennan Companies, Inc. | 162,070 | 28,348 | |
| Old Republic International Corp. | 213,800 | 5,642 | |
| The Travelers Companies, Inc. | 72,627 | 13,880 | |
| 78,756 | |||
| Thrifts & Mortgage Finance - 0.3% | |||
| Essent Group Ltd. | 246,323 | 10,846 | |
| Radian Group, Inc. | 703,868 | 15,555 | |
| 26,401 | |||
TOTAL FINANCIALS | 1,313,274 | ||
| HEALTH CARE - 13.1% | |||
| Health Care Equipment & Supplies - 2.5% | |||
| Abbott Laboratories | 42,500 | 4,698 | |
| Becton, Dickinson & Co. | 102,086 | 25,748 | |
| Boston Scientific Corp. (b) | 1,274,696 | 58,955 | |
| GE HealthCare Technologies, Inc. (b)(c) | 1,282,336 | 89,148 | |
| GN Store Nord A/S | 48,000 | 1,177 | |
| Koninklijke Philips Electronics NV (depositary receipt) (NY Reg.) | 936,551 | 16,034 | |
| Sonova Holding AG | 24,692 | 6,147 | |
| 201,907 | |||
| Health Care Providers & Services - 5.7% | |||
| Cardinal Health, Inc. | 669,011 | 51,681 | |
| Cigna Corp. | 348,254 | 110,282 | |
| CVS Health Corp. | 739,712 | 65,257 | |
| Humana, Inc. | 37,100 | 18,984 | |
| McKesson Corp. | 264,634 | 100,212 | |
| UnitedHealth Group, Inc. | 239,187 | 119,400 | |
| 465,816 | |||
| Life Sciences Tools & Services - 0.4% | |||
| Danaher Corp. | 129,703 | 34,291 | |
| Pharmaceuticals - 4.5% | |||
| Bristol-Myers Squibb Co. | 1,982,436 | 144,024 | |
| Eli Lilly & Co. | 85,448 | 29,407 | |
| GSK PLC sponsored ADR | 1,599,128 | 56,385 | |
| Johnson & Johnson | 605,389 | 98,933 | |
| Perrigo Co. PLC | 126,800 | 4,745 | |
| Sanofi SA sponsored ADR | 202,097 | 9,931 | |
| UCB SA | 248,600 | 20,373 | |
| Viatris, Inc. | 86,400 | 1,051 | |
| Zoetis, Inc. Class A | 13,900 | 2,300 | |
| 367,149 | |||
TOTAL HEALTH CARE | 1,069,163 | ||
| INDUSTRIALS - 16.3% | |||
| Aerospace & Defense - 3.5% | |||
| Airbus Group NV | 356,400 | 44,680 | |
| General Dynamics Corp. | 138,461 | 32,270 | |
| Huntington Ingalls Industries, Inc. | 103,184 | 22,756 | |
| MTU Aero Engines AG | 51,500 | 12,810 | |
| Raytheon Technologies Corp. | 189,325 | 18,904 | |
| Safran SA | 123,300 | 17,730 | |
| Textron, Inc. | 46,400 | 3,380 | |
| The Boeing Co. (b) | 618,720 | 131,787 | |
| 284,317 | |||
| Air Freight & Logistics - 1.8% | |||
| DSV A/S | 48,200 | 7,932 | |
| Expeditors International of Washington, Inc. | 8,400 | 908 | |
| FedEx Corp. | 114,974 | 22,289 | |
| United Parcel Service, Inc. Class B | 636,199 | 117,843 | |
| 148,972 | |||
| Airlines - 0.1% | |||
| Copa Holdings SA Class A (b) | 30,400 | 2,799 | |
| Building Products - 0.5% | |||
| A.O. Smith Corp. | 177,500 | 12,017 | |
| Johnson Controls International PLC | 447,411 | 31,126 | |
| 43,143 | |||
| Commercial Services & Supplies - 0.6% | |||
| GFL Environmental, Inc. | 1,290,200 | 39,815 | |
| Healthcare Services Group, Inc. | 647,914 | 8,727 | |
| Ritchie Bros. Auctioneers, Inc. | 15,600 | 943 | |
| 49,485 | |||
| Electrical Equipment - 1.2% | |||
| Acuity Brands, Inc. | 133,315 | 25,133 | |
| Hubbell, Inc. Class B | 130,472 | 29,866 | |
| Regal Rexnord Corp. | 140,200 | 19,516 | |
| Rockwell Automation, Inc. | 19,318 | 5,448 | |
| Vertiv Holdings Co. | 1,153,300 | 16,400 | |
| 96,363 | |||
| Industrial Conglomerates - 4.6% | |||
| 3M Co. | 103,466 | 11,907 | |
| General Electric Co. (c) | 4,572,211 | 367,972 | |
| 379,879 | |||
| Machinery - 1.9% | |||
| Allison Transmission Holdings, Inc. | 287,900 | 12,979 | |
| Caterpillar, Inc. | 35,023 | 8,836 | |
| Cummins, Inc. | 54,176 | 13,519 | |
| Donaldson Co., Inc. | 604,812 | 37,710 | |
| Epiroc AB (A Shares) | 32,700 | 636 | |
| Flowserve Corp. | 342,178 | 11,778 | |
| Fortive Corp. | 273,088 | 18,578 | |
| Kardex AG | 6,600 | 1,282 | |
| Nordson Corp. | 97,427 | 23,704 | |
| Otis Worldwide Corp. | 87,573 | 7,201 | |
| Stanley Black & Decker, Inc. | 82,218 | 7,343 | |
| Westinghouse Air Brake Tech Co. | 120,047 | 12,462 | |
| 156,028 | |||
| Professional Services - 0.6% | |||
| Equifax, Inc. | 85,323 | 18,959 | |
| RELX PLC (London Stock Exchange) | 861,901 | 25,606 | |
| Robert Half International, Inc. | 9,500 | 798 | |
| 45,363 | |||
| Road & Rail - 0.5% | |||
| Knight-Swift Transportation Holdings, Inc. Class A | 727,509 | 42,996 | |
| Trading Companies & Distributors - 0.9% | |||
| Brenntag SE | 74,700 | 5,576 | |
| Fastenal Co. | 126,376 | 6,388 | |
| MSC Industrial Direct Co., Inc. Class A | 16,600 | 1,373 | |
| Watsco, Inc. (d) | 203,991 | 58,621 | |
| WESCO International, Inc. (b) | 27,500 | 4,098 | |
| 76,056 | |||
| Transportation Infrastructure - 0.1% | |||
| Aena SME SA (a)(b) | 49,200 | 7,392 | |
TOTAL INDUSTRIALS | 1,332,793 | ||
| INFORMATION TECHNOLOGY - 18.2% | |||
| Electronic Equipment & Components - 0.3% | |||
| CDW Corp. | 101,864 | 19,968 | |
| IT Services - 4.3% | |||
| Amadeus IT Holding SA Class A (b) | 575,300 | 36,246 | |
| DXC Technology Co. (b) | 112,900 | 3,244 | |
| Edenred SA | 610,100 | 33,157 | |
| Fidelity National Information Services, Inc. | 469,232 | 35,211 | |
| Genpact Ltd. | 525,271 | 24,835 | |
| Global Payments, Inc. | 121,500 | 13,695 | |
| IBM Corp. | 196,242 | 26,440 | |
| MasterCard, Inc. Class A | 52,867 | 19,593 | |
| Unisys Corp. (b) | 805,430 | 4,357 | |
| Visa, Inc. Class A | 676,475 | 155,731 | |
| 352,509 | |||
| Semiconductors & Semiconductor Equipment - 3.4% | |||
| Analog Devices, Inc. | 153,108 | 26,253 | |
| Applied Materials, Inc. | 163,900 | 18,273 | |
| Intel Corp. | 408,516 | 11,545 | |
| Lam Research Corp. | 38,430 | 19,219 | |
| Marvell Technology, Inc. | 776,451 | 33,504 | |
| Microchip Technology, Inc. | 23,700 | 1,840 | |
| NVIDIA Corp. | 124,800 | 24,382 | |
| NXP Semiconductors NV | 208,226 | 38,378 | |
| Qualcomm, Inc. | 656,472 | 87,449 | |
| Taiwan Semiconductor Manufacturing Co. Ltd. sponsored ADR | 135,200 | 12,537 | |
| Teradyne, Inc. | 78,000 | 7,933 | |
| 281,313 | |||
| Software - 7.2% | |||
| Intuit, Inc. | 120,700 | 51,016 | |
| Microsoft Corp. | 1,841,182 | 456,263 | |
| Open Text Corp. | 165,128 | 5,539 | |
| SAP SE sponsored ADR (d) | 569,745 | 67,532 | |
| Temenos Group AG | 123,020 | 8,732 | |
| 589,082 | |||
| Technology Hardware, Storage & Peripherals - 3.0% | |||
| Apple, Inc. | 1,647,512 | 237,720 | |
| FUJIFILM Holdings Corp. | 62,600 | 3,313 | |
| Samsung Electronics Co. Ltd. | 162,180 | 8,068 | |
| 249,101 | |||
TOTAL INFORMATION TECHNOLOGY | 1,491,973 | ||
| MATERIALS - 2.8% | |||
| Chemicals - 0.7% | |||
| DuPont de Nemours, Inc. | 635,998 | 47,032 | |
| PPG Industries, Inc. | 54,322 | 7,080 | |
| 54,112 | |||
| Metals & Mining - 2.1% | |||
| First Quantum Minerals Ltd. | 1,799,500 | 41,750 | |
| Freeport-McMoRan, Inc. | 1,998,212 | 89,160 | |
| Glencore PLC | 6,444,800 | 43,160 | |
| 174,070 | |||
| Paper & Forest Products - 0.0% | |||
| Louisiana-Pacific Corp. | 28,300 | 1,927 | |
TOTAL MATERIALS | 230,109 | ||
| REAL ESTATE - 1.3% | |||
| Equity Real Estate Investment Trusts (REITs) - 1.3% | |||
| American Tower Corp. | 174,278 | 38,932 | |
| Crown Castle International Corp. | 104,700 | 15,507 | |
| Equinix, Inc. | 1,100 | 812 | |
| Public Storage | 2,400 | 730 | |
| Simon Property Group, Inc. | 406,060 | 52,162 | |
| 108,143 | |||
| UTILITIES - 1.5% | |||
| Electric Utilities - 1.4% | |||
| Constellation Energy Corp. | 47,813 | 4,081 | |
| Duke Energy Corp. | 116,721 | 11,958 | |
| Entergy Corp. | 134,863 | 14,603 | |
| Exelon Corp. | 143,440 | 6,052 | |
| PG&E Corp. (b) | 1,045,700 | 16,627 | |
| Southern Co. | 854,166 | 57,810 | |
| 111,131 | |||
| Multi-Utilities - 0.1% | |||
| Sempra Energy | 68,596 | 10,998 | |
TOTAL UTILITIES | 122,129 | ||
| TOTAL COMMON STOCKS (Cost $5,005,916) | 7,776,878 | ||
| Convertible Preferred Stocks - 0.2% | |||
| Shares | Value ($) (000s) | ||
| HEALTH CARE - 0.2% | |||
| Health Care Equipment & Supplies - 0.2% | |||
| Becton, Dickinson & Co. 6.50% | 154,800 | 7,773 | |
| Boston Scientific Corp. Series A, 5.50% | 92,400 | 10,538 | |
| TOTAL CONVERTIBLE PREFERRED STOCKS (Cost $16,980) | 18,311 | ||
| Convertible Bonds - 0.1% | |||
Principal Amount (e) (000s) | Value ($) (000s) | ||
| COMMUNICATION SERVICES - 0.1% | |||
| Interactive Media & Services - 0.1% | |||
Snap, Inc. 0.125% 3/1/28 (a) (Cost $6,314) | 8,929 | 6,433 | |
| Money Market Funds - 5.9% | |||
| Shares | Value ($) (000s) | ||
| Fidelity Cash Central Fund 4.38% (f) | 399,296,894 | 399,377 | |
| Fidelity Securities Lending Cash Central Fund 4.38% (f)(g) | 86,873,863 | 86,883 | |
| TOTAL MONEY MARKET FUNDS (Cost $486,260) | 486,260 | ||
| TOTAL INVESTMENT IN SECURITIES - 101.1% (Cost $5,515,470) | 8,287,882 |
NET OTHER ASSETS (LIABILITIES) - (1.1)% | (87,050) |
| NET ASSETS - 100.0% | 8,200,832 |
| Written Options | ||||||
| Counterparty | Number of Contracts | Notional Amount ($) (000s) | Exercise Price ($) | Expiration Date | Value ($) (000s) | |
| Call Options | ||||||
| BorgWarner, Inc. | Chicago Board Options Exchange | 1,620 | 7,659 | 50.00 | 03/17/23 | (122) |
| Exxon Mobil Corp. | Chicago Board Options Exchange | 5,619 | 65,186 | 115.00 | 03/17/23 | (2,655) |
| GE HealthCare Technologies, Inc. | Chicago Board Options Exchange | 1,987 | 13,814 | 70.00 | 04/21/23 | (775) |
| GE HealthCare Technologies, Inc. | Chicago Board Options Exchange | 663 | 4,609 | 65.00 | 02/17/23 | (348) |
| GE HealthCare Technologies, Inc. | Chicago Board Options Exchange | 664 | 4,616 | 70.00 | 03/17/23 | (201) |
| GE HealthCare Technologies, Inc. | Chicago Board Options Exchange | 6 | 42 | 75.00 | 03/17/23 | (1) |
| General Electric Co. | Chicago Board Options Exchange | 4,515 | 36,337 | 75.00 | 03/17/23 | (3,172) |
| General Electric Co. | Chicago Board Options Exchange | 2,221 | 17,875 | 85.00 | 03/17/23 | (325) |
| General Electric Co. | Chicago Board Options Exchange | 2,221 | 17,875 | 80.00 | 02/24/23 | (600) |
| General Electric Co. | Chicago Board Options Exchange | 2,221 | 17,875 | 82.00 | 02/24/23 | (370) |
| Hess Corp. | Chicago Board Options Exchange | 961 | 14,430 | 150.00 | 03/17/23 | (783) |
| Lamb Weston Holdings, Inc. | Chicago Board Options Exchange | 872 | 8,710 | 90.00 | 02/17/23 | (824) |
| Lamb Weston Holdings, Inc. | Chicago Board Options Exchange | 295 | 2,947 | 105.00 | 04/21/23 | (83) |
| Lowe's Companies, Inc. | Chicago Board Options Exchange | 149 | 3,103 | 220.00 | 03/17/23 | (67) |
| Lowe's Companies, Inc. | Chicago Board Options Exchange | 149 | 3,103 | 230.00 | 03/17/23 | (30) |
| TOTAL WRITTEN OPTIONS | (10,356) | |||||
| (a) | Security exempt from registration under Rule 144A of the Securities Act of 1933. These securities may be resold in transactions exempt from registration, normally to qualified institutional buyers. At the end of the period, the value of these securities amounted to $41,507,000 or 0.5% of net assets. |
| (b) | Non-income producing |
| (c) | Security or a portion of the security is pledged as collateral for call options written. At period end, the value of securities pledged amounted to $218,181,000. |
| (d) | Security or a portion of the security is on loan at period end. |
| (e) | Amount is stated in United States dollars unless otherwise noted. |
| (f) | Affiliated fund that is generally available only to investment companies and other accounts managed by Fidelity Investments. The rate quoted is the annualized seven-day yield of the fund at period end. A complete unaudited listing of the fund's holdings as of its most recent quarter end is available upon request. In addition, each Fidelity Central Fund's financial statements are available on the SEC's website or upon request. |
| (g) | Investment made with cash collateral received from securities on loan. |
| Affiliate (Amounts in thousands) | Value, beginning of period ($) | Purchases ($) | Sales Proceeds ($) | Dividend Income ($) | Realized Gain (loss) ($) | Change in Unrealized appreciation (depreciation) ($) | Value, end of period ($) | % ownership, end of period |
| Fidelity Cash Central Fund 4.38% | 214,836 | 342,442 | 157,901 | 5,604 | - | - | 399,377 | 0.9% |
| Fidelity Securities Lending Cash Central Fund 4.38% | - | 301,799 | 214,916 | 31 | - | - | 86,883 | 0.3% |
| Total | 214,836 | 644,241 | 372,817 | 5,635 | - | - | 486,260 | |
| Valuation Inputs at Reporting Date: | ||||
Description (Amounts in thousands) | Total ($) | Level 1 ($) | Level 2 ($) | Level 3 ($) |
Investments in Securities: | ||||
| Equities: | ||||
Communication Services | 411,543 | 339,078 | 72,465 | - |
Consumer Discretionary | 235,176 | 235,176 | - | - |
Consumer Staples | 412,531 | 412,531 | - | - |
Energy | 1,050,044 | 1,050,044 | - | - |
Financials | 1,313,274 | 1,313,274 | - | - |
Health Care | 1,087,474 | 1,069,163 | 18,311 | - |
Industrials | 1,332,793 | 1,231,173 | 101,620 | - |
Information Technology | 1,491,973 | 1,444,346 | 47,627 | - |
Materials | 230,109 | 186,949 | 43,160 | - |
Real Estate | 108,143 | 108,143 | - | - |
Utilities | 122,129 | 122,129 | - | - |
| Corporate Bonds | 6,433 | - | 6,433 | - |
| Money Market Funds | 486,260 | 486,260 | - | - |
| Total Investments in Securities: | 8,287,882 | 7,998,266 | 289,616 | - |
Derivative Instruments: | ||||
| Liabilities | ||||
Written Options | (10,356) | (10,356) | - | - |
| Total Liabilities | (10,356) | (10,356) | - | - |
| Total Derivative Instruments: | (10,356) | (10,356) | - | - |
Primary Risk Exposure / Derivative Type | Value | |
| (Amounts in thousands) | Asset ($) | Liability ($) |
| Equity Risk | ||
Written Options (a) | 0 | (10,356) |
| Total Equity Risk | 0 | (10,356) |
| Total Value of Derivatives | 0 | (10,356) |
| Statement of Assets and Liabilities | ||||
| Amounts in thousands (except per-share amounts) | January 31, 2023 (Unaudited) | |||
| Assets | ||||
| Investment in securities, at value (including securities loaned of $88,276) - See accompanying schedule: | ||||
Unaffiliated issuers (cost $5,029,210) | $ | 7,801,622 | ||
Fidelity Central Funds (cost $486,260) | 486,260 | |||
| Total Investment in Securities (cost $5,515,470) | $ | 8,287,882 | ||
| Receivable for investments sold | ||||
Regular delivery | 10,465 | |||
Delayed delivery | 5,441 | |||
| Receivable for fund shares sold | 2,161 | |||
| Dividends receivable | 7,536 | |||
| Interest receivable | 5 | |||
| Distributions receivable from Fidelity Central Funds | 1,368 | |||
| Prepaid expenses | 7 | |||
| Other receivables | 334 | |||
Total assets | 8,315,199 | |||
| Liabilities | ||||
| Payable to custodian bank | $ | 56 | ||
| Payable for investments purchased | 9,977 | |||
| Payable for fund shares redeemed | 2,853 | |||
| Accrued management fee | 2,831 | |||
| Written options, at value (premium received $7,412) | 10,356 | |||
| Other affiliated payables | 926 | |||
| Other payables and accrued expenses | 485 | |||
| Collateral on securities loaned | 86,883 | |||
| Total Liabilities | 114,367 | |||
| Net Assets | $ | 8,200,832 | ||
| Net Assets consist of: | ||||
| Paid in capital | $ | 5,431,034 | ||
| Total accumulated earnings (loss) | 2,769,798 | |||
| Net Assets | $ | 8,200,832 | ||
| Net Asset Value and Maximum Offering Price | ||||
| Growth and Income : | ||||
Net Asset Value , offering price and redemption price per share ($7,804,389 ÷ 153,210 shares) | $ | 50.94 | ||
| Class K : | ||||
Net Asset Value , offering price and redemption price per share ($396,443 ÷ 7,791 shares) | $ | 50.88 | ||
| Statement of Operations | ||||
| Amounts in thousands | Six months ended January 31, 2023 (Unaudited) | |||
| Investment Income | ||||
| Dividends | $ | 80,962 | ||
| Interest | 188 | |||
| Income from Fidelity Central Funds (including $31 from security lending) | 5,635 | |||
| Total Income | 86,785 | |||
| Expenses | ||||
| Management fee | $ | 16,247 | ||
| Transfer agent fees | 4,938 | |||
| Accounting fees | 533 | |||
| Custodian fees and expenses | 126 | |||
| Independent trustees' fees and expenses | 13 | |||
| Registration fees | 50 | |||
| Audit | 52 | |||
| Legal | 7 | |||
| Miscellaneous | 22 | |||
| Total expenses before reductions | 21,988 | |||
| Expense reductions | (143) | |||
| Total expenses after reductions | 21,845 | |||
| Net Investment income (loss) | 64,940 | |||
| Realized and Unrealized Gain (Loss) | ||||
| Net realized gain (loss) on: | ||||
| Investment Securities: | ||||
| Unaffiliated issuers | 20,620 | |||
| Foreign currency transactions | 1,456 | |||
| Written options | 2,532 | |||
| Total net realized gain (loss) | 24,608 | |||
| Change in net unrealized appreciation (depreciation) on: | ||||
| Investment Securities: | ||||
| Unaffiliated issuers | 448,068 | |||
| Assets and liabilities in foreign currencies | 79 | |||
| Written options | (3,814) | |||
| Total change in net unrealized appreciation (depreciation) | 444,333 | |||
| Net gain (loss) | 468,941 | |||
| Net increase (decrease) in net assets resulting from operations | $ | 533,881 | ||
| Statement of Changes in Net Assets | ||||
| Amount in thousands | Six months ended January 31, 2023 (Unaudited) | Year ended July 31, 2022 | ||
| Increase (Decrease) in Net Assets | ||||
| Operations | ||||
| Net investment income (loss) | $ | 64,940 | $ | 119,515 |
| Net realized gain (loss) | 24,608 | 276,478 | ||
| Change in net unrealized appreciation (depreciation) | 444,333 | (392,829) | ||
| Net increase (decrease) in net assets resulting from operations | 533,881 | 3,164 | ||
| Distributions to shareholders | (198,350) | (483,440) | ||
| Share transactions - net increase (decrease) | 181,570 | 94,863 | ||
| Total increase (decrease) in net assets | 517,101 | (385,413) | ||
| Net Assets | ||||
| Beginning of period | 7,683,731 | 8,069,144 | ||
| End of period | $ | 8,200,832 | $ | 7,683,731 |
| Fidelity® Growth & Income Portfolio |
Six months ended (Unaudited) January 31, 2023 | Years ended July 31, 2022 | 2021 | 2020 | 2019 | 2018 | |||||||
Selected Per-Share Data | ||||||||||||
| Net asset value, beginning of period | $ | 48.92 | $ | 51.87 | $ | 38.15 | $ | 38.98 | $ | 39.34 | $ | 35.31 |
| Income from Investment Operations | ||||||||||||
Net investment income (loss) A,B | .41 | .76 | .78 | .83 | .87 | .65 | ||||||
| Net realized and unrealized gain (loss) | 2.87 | (.61) | 14.49 | (.37) | (.05) C | 4.12 | ||||||
| Total from investment operations | 3.28 | .15 | 15.27 | .46 | .82 | 4.77 | ||||||
| Distributions from net investment income | (.42) | (1.06) | (.79) | (.84) | (.77) | (.74) | ||||||
| Distributions from net realized gain | (.83) | (2.05) | (.75) | (.46) | (.42) | - | ||||||
| Total distributions | (1.26) D | (3.10) D | (1.55) D | (1.29) D | (1.18) D | (.74) | ||||||
| Net asset value, end of period | $ | 50.94 | $ | 48.92 | $ | 51.87 | $ | 38.15 | $ | 38.98 | $ | 39.34 |
Total Return E,F | 6.94% | .26% | 41.01% | 1.27% | 2.26% C | 13.66% | ||||||
Ratios to Average Net Assets B,G,H | ||||||||||||
| Expenses before reductions | .58% I | .57% | .58% | .60% | .61% | .61% | ||||||
| Expenses net of fee waivers, if any | .58% I | .57% | .58% | .60% | .61% | .61% | ||||||
| Expenses net of all reductions | .58% I | .57% | .58% | .60% | .61% | .61% | ||||||
| Net investment income (loss) | 1.70% I | 1.51% | 1.71% | 2.18% | 2.31% | 1.76% | ||||||
| Supplemental Data | ||||||||||||
| Net assets, end of period (in millions) | $ | 7,804 | $ | 7,360 | $ | 7,219 | $ | 5,451 | $ | 5,927 | $ | 6,280 |
Portfolio turnover rate J | 9% I | 12% | 16% | 32% | 36% | 38% |
| Fidelity® Growth & Income Portfolio Class K |
Six months ended (Unaudited) January 31, 2023 | Years ended July 31, 2022 | 2021 | 2020 | 2019 | 2018 | |||||||
Selected Per-Share Data | ||||||||||||
| Net asset value, beginning of period | $ | 48.86 | $ | 51.82 | $ | 38.11 | $ | 38.94 | $ | 39.31 | $ | 35.28 |
| Income from Investment Operations | ||||||||||||
Net investment income (loss) A,B | .43 | .81 | .81 | .86 | .91 | .69 | ||||||
| Net realized and unrealized gain (loss) | 2.87 | (.62) | 14.48 | (.35) | (.06) C | 4.12 | ||||||
| Total from investment operations | 3.30 | .19 | 15.29 | .51 | .85 | 4.81 | ||||||
| Distributions from net investment income | (.45) | (1.10) | (.83) | (.88) | (.81) | (.78) | ||||||
| Distributions from net realized gain | (.83) | (2.05) | (.75) | (.46) | (.42) | - | ||||||
| Total distributions | (1.28) | (3.15) | (1.58) | (1.34) | (1.22) D | (.78) | ||||||
| Net asset value, end of period | $ | 50.88 | $ | 48.86 | $ | 51.82 | $ | 38.11 | $ | 38.94 | $ | 39.31 |
Total Return E,F | 7.00% | .33% | 41.15% | 1.39% | 2.35% C | 13.79% | ||||||
Ratios to Average Net Assets B,G,H | ||||||||||||
| Expenses before reductions | .49% I | .49% | .49% | .50% | .51% | .51% | ||||||
| Expenses net of fee waivers, if any | .49% I | .48% | .49% | .50% | .51% | .51% | ||||||
| Expenses net of all reductions | .49% I | .48% | .49% | .50% | .50% | .50% | ||||||
| Net investment income (loss) | 1.80% I | 1.60% | 1.80% | 2.28% | 2.41% | 1.86% | ||||||
| Supplemental Data | ||||||||||||
| Net assets, end of period (in millions) | $ | 396 | $ | 323 | $ | 850 | $ | 1,020 | $ | 497 | $ | 591 |
Portfolio turnover rate J | 9% I | 12% | 16% | 32% | 36% | 38% |
| Fidelity Central Fund | Investment Manager | Investment Objective | Investment Practices | Expense Ratio A |
| Fidelity Money Market Central Funds | Fidelity Management & Research Company LLC (FMR) | Each fund seeks to obtain a high level of current income consistent with the preservation of capital and liquidity. | Short-term Investments | Less than .005% |
| Fidelity Growth & Income Portfolio | $334 |
| Gross unrealized appreciation | $2,935,088 |
| Gross unrealized depreciation | (213,847) |
| Net unrealized appreciation (depreciation) | $2,721,241 |
| Tax cost | $5,563,697 |
| Equity Risk | Equity risk relates to the fluctuations in the value of financial instruments as a result of changes in market prices (other than those arising from interest rate risk or foreign exchange risk), whether caused by factors specific to an individual investment, its issuer, or all factors affecting all instruments traded in a market or market segment. |
| Purchases ($) | Sales ($) | |
| Fidelity Growth & Income Portfolio | 315,409 | 429,857 |
| Amount | % of Class-Level Average Net Assets A | |
| Growth and Income | $4,865 | .13 |
| Class K | 73 | .04 |
| $4,938 |
| % of Average Net Assets | |
| Fidelity Growth & Income Portfolio | .01 |
| Amount | |
| Fidelity Growth & Income Portfolio | $5 |
| Purchases ($) | Sales ($) | Realized Gain (Loss) ($) | |
| Fidelity Growth & Income Portfolio | 23,979 | 23,482 | 4,228 |
| Amount | |
| Fidelity Growth & Income Portfolio | $10 |
| Total Security Lending Fees Paid to NFS | Security Lending Income From Securities Loaned to NFS | Value of Securities Loaned to NFS at Period End | |
| Fidelity Growth & Income Portfolio | $3 | $- | $- |
Six months ended January 31, 2023 | Year ended July 31, 2022 | |
| Fidelity Growth & Income Portfolio | ||
| Distributions to shareholders | ||
| Growth and Income | $189,638 | $441,736 |
| Class K | 8,712 | 41,704 |
Total | $198,350 | $483,440 |
| Shares | Shares | Dollars | Dollars | |
Six months ended January 31, 2023 | Year ended July 31, 2022 | Six months ended January 31, 2023 | Year ended July 31, 2022 | |
| Fidelity Growth & Income Portfolio | ||||
| Growth and Income | ||||
| Shares sold | 6,777 | 18,506 | $325,687 | $948,009 |
| Reinvestment of distributions | 3,778 | 8,279 | 176,749 | 415,917 |
| Shares redeemed | (7,818) | (15,495) | (371,460) | (779,035) |
| Net increase (decrease) | 2,737 | 11,290 | $130,976 | $584,891 |
| Class K | ||||
| Shares sold | 1,898 | 1,472 | $85,353 | $75,794 |
| Reinvestment of distributions | 187 | 827 | 8,712 | 41,704 |
| Shares redeemed | (910) | (12,089) | (43,471) | (607,526) |
| Net increase (decrease) | 1,175 | (9,790) | $50,594 | $(490,028) |
| The Example is based on an investment of $1,000 invested at the beginning of the period and held for the entire period (August 1, 2022 to January 31, 2023). |
Annualized Expense Ratio- A | Beginning Account Value August 1, 2022 | Ending Account Value January 31, 2023 | Expenses Paid During Period- C August 1, 2022 to January 31, 2023 | |||||||
| Fidelity® Growth & Income Portfolio | ||||||||||
| Fidelity® Growth & Income Portfolio | .58% | |||||||||
| Actual | $ 1,000 | $ 1,069.40 | $ 3.03 | |||||||
Hypothetical- B | $ 1,000 | $ 1,022.28 | $ 2.96 | |||||||
| Class K | .49% | |||||||||
| Actual | $ 1,000 | $ 1,070.00 | $ 2.56 | |||||||
Hypothetical- B | $ 1,000 | $ 1,022.74 | $ 2.50 | |||||||
- Highly liquid investments - cash or convertible to cash within three business days or less
- Moderately liquid investments - convertible to cash in three to seven calendar days
- Less liquid investments - can be sold or disposed of, but not settled, within seven calendar days
- Illiquid investments - cannot be sold or disposed of within seven calendar days
|


Contents
Top Holdings (% of Fund's net assets) | ||
| IQVIA Holdings, Inc. | 3.6 | |
| Boyd Gaming Corp. | 3.3 | |
| Caesars Entertainment, Inc. | 3.1 | |
| UnitedHealth Group, Inc. | 3.0 | |
| Nexstar Broadcasting Group, Inc. Class A | 2.8 | |
| Cheniere Energy, Inc. | 2.6 | |
| PG&E Corp. | 2.5 | |
| The Chemours Co. LLC | 2.5 | |
| Thermo Fisher Scientific, Inc. | 2.5 | |
| Microsoft Corp. | 2.4 | |
| 28.3 | ||
| Market Sectors (% of Fund's net assets) | ||
| Information Technology | 20.8 | |
| Consumer Discretionary | 16.7 | |
| Health Care | 14.4 | |
| Materials | 8.5 | |
| Communication Services | 7.9 | |
| Energy | 6.8 | |
| Financials | 6.7 | |
| Industrials | 6.1 | |
| Consumer Staples | 4.5 | |
| Utilities | 4.0 | |
| Real Estate | 0.5 | |
Asset Allocation (% of Fund's net assets) |
 |
Foreign investments - 5.7% |
| Common Stocks - 96.9% | |||
| Shares | Value ($) (000s) | ||
| COMMUNICATION SERVICES - 7.9% | |||
| Entertainment - 1.2% | |||
| Netflix, Inc. (a) | 64,500 | 22,824 | |
| Interactive Media & Services - 2.8% | |||
| Alphabet, Inc. Class A (a) | 294,000 | 29,059 | |
| Cars.com, Inc. (a) | 482,700 | 8,254 | |
| Meta Platforms, Inc. Class A (a) | 112,200 | 16,714 | |
| 54,027 | |||
| Media - 2.8% | |||
| Nexstar Broadcasting Group, Inc. Class A (b) | 272,363 | 55,772 | |
| Wireless Telecommunication Services - 1.1% | |||
| T-Mobile U.S., Inc. (a) | 150,100 | 22,411 | |
TOTAL COMMUNICATION SERVICES | 155,034 | ||
| CONSUMER DISCRETIONARY - 16.7% | |||
| Automobiles - 1.7% | |||
| Tesla, Inc. (a) | 195,100 | 33,795 | |
| Hotels, Restaurants & Leisure - 6.8% | |||
| Boyd Gaming Corp. | 1,026,299 | 63,949 | |
| Caesars Entertainment, Inc. (a) | 1,157,171 | 60,242 | |
| Studio City International Holdings Ltd.: | |||
| ADR (c) | 631,958 | 4,342 | |
| (NYSE) ADR (a) | 692,929 | 4,760 | |
| 133,293 | |||
| Household Durables - 1.6% | |||
| Tempur Sealy International, Inc. | 751,032 | 30,605 | |
| Multiline Retail - 0.9% | |||
| Dollar General Corp. | 76,700 | 17,917 | |
| Specialty Retail - 4.6% | |||
| Dick's Sporting Goods, Inc. (b) | 172,400 | 22,543 | |
| Lowe's Companies, Inc. | 166,000 | 34,570 | |
| Ulta Beauty, Inc. (a) | 40,100 | 20,610 | |
| Victoria's Secret & Co. (a) | 63,900 | 2,693 | |
| Williams-Sonoma, Inc. (b) | 67,200 | 9,068 | |
| 89,484 | |||
| Textiles, Apparel & Luxury Goods - 1.1% | |||
| Tapestry, Inc. | 493,000 | 22,466 | |
TOTAL CONSUMER DISCRETIONARY | 327,560 | ||
| CONSUMER STAPLES - 4.5% | |||
| Food & Staples Retailing - 1.5% | |||
| Albertsons Companies, Inc. | 346,200 | 7,339 | |
| BJ's Wholesale Club Holdings, Inc. (a) | 239,000 | 17,320 | |
| Performance Food Group Co. (a) | 77,000 | 4,722 | |
| 29,381 | |||
| Food Products - 3.0% | |||
| Darling Ingredients, Inc. (a) | 271,601 | 18,004 | |
| JBS SA | 10,149,000 | 40,146 | |
| 58,150 | |||
TOTAL CONSUMER STAPLES | 87,531 | ||
| ENERGY - 6.8% | |||
| Energy Equipment & Services - 0.3% | |||
| Halliburton Co. | 142,400 | 5,870 | |
| Oil, Gas & Consumable Fuels - 6.5% | |||
| Antero Resources Corp. (a) | 582,800 | 16,808 | |
| Cheniere Energy, Inc. | 340,400 | 52,010 | |
| Chesapeake Energy Corp. | 223,800 | 19,408 | |
| Denbury, Inc. (a) | 230,600 | 20,011 | |
| Diamondback Energy, Inc. | 76,500 | 11,178 | |
| Occidental Petroleum Corp. | 138,400 | 8,967 | |
| 128,382 | |||
TOTAL ENERGY | 134,252 | ||
| FINANCIALS - 6.7% | |||
| Banks - 3.5% | |||
| Bank of America Corp. | 916,499 | 32,517 | |
| JPMorgan Chase & Co. | 193,800 | 27,124 | |
| Wells Fargo & Co. | 193,200 | 9,055 | |
| 68,696 | |||
| Consumer Finance - 1.6% | |||
| OneMain Holdings, Inc. | 737,900 | 31,833 | |
| Insurance - 1.6% | |||
| Arthur J. Gallagher & Co. | 164,200 | 32,137 | |
TOTAL FINANCIALS | 132,666 | ||
| HEALTH CARE - 14.4% | |||
| Biotechnology - 0.9% | |||
| Regeneron Pharmaceuticals, Inc. (a) | 24,300 | 18,431 | |
| Health Care Providers & Services - 5.6% | |||
| HCA Holdings, Inc. | 43,700 | 11,147 | |
| Humana, Inc. | 58,400 | 29,883 | |
| Tenet Healthcare Corp. (a) | 167,709 | 9,199 | |
| UnitedHealth Group, Inc. | 118,200 | 59,004 | |
| 109,233 | |||
| Life Sciences Tools & Services - 6.7% | |||
| Charles River Laboratories International, Inc. (a) | 52,500 | 12,771 | |
| IQVIA Holdings, Inc. (a) | 306,600 | 70,340 | |
| Thermo Fisher Scientific, Inc. | 85,000 | 48,478 | |
| 131,589 | |||
| Pharmaceuticals - 1.2% | |||
| AstraZeneca PLC sponsored ADR | 136,200 | 8,903 | |
| Bristol-Myers Squibb Co. | 201,900 | 14,668 | |
| 23,571 | |||
TOTAL HEALTH CARE | 282,824 | ||
| INDUSTRIALS - 6.1% | |||
| Aerospace & Defense - 0.7% | |||
| Lockheed Martin Corp. | 28,900 | 13,388 | |
| Building Products - 1.5% | |||
| Builders FirstSource, Inc. (a) | 159,900 | 12,744 | |
| Carrier Global Corp. | 382,062 | 17,395 | |
| 30,139 | |||
| Electrical Equipment - 1.4% | |||
| Generac Holdings, Inc. (a) | 49,800 | 6,006 | |
| Regal Rexnord Corp. | 160,600 | 22,356 | |
| 28,362 | |||
| Marine - 0.0% | |||
| Genco Shipping & Trading Ltd. | 831 | 15 | |
| Professional Services - 1.3% | |||
| ASGN, Inc. (a) | 276,834 | 25,178 | |
| Trading Companies & Distributors - 1.2% | |||
| United Rentals, Inc. | 53,300 | 23,503 | |
TOTAL INDUSTRIALS | 120,585 | ||
| INFORMATION TECHNOLOGY - 20.8% | |||
| Electronic Equipment & Components - 2.0% | |||
| CDW Corp. | 200,000 | 39,206 | |
| IT Services - 6.0% | |||
| EPAM Systems, Inc. (a) | 50,100 | 16,666 | |
| Fiserv, Inc. (a) | 201,500 | 21,496 | |
| Global Payments, Inc. | 179,700 | 20,256 | |
| MasterCard, Inc. Class A | 30,100 | 11,155 | |
| SS&C Technologies Holdings, Inc. | 352,897 | 21,297 | |
| Visa, Inc. Class A | 115,900 | 26,681 | |
| 117,551 | |||
| Semiconductors & Semiconductor Equipment - 8.4% | |||
| Advanced Micro Devices, Inc. (a) | 66,300 | 4,982 | |
| ASML Holding NV | 19,600 | 12,952 | |
| Broadcom, Inc. | 17,200 | 10,062 | |
| Lam Research Corp. | 24,300 | 12,152 | |
| Marvell Technology, Inc. | 502,700 | 21,692 | |
| Microchip Technology, Inc. | 494,000 | 38,344 | |
| NXP Semiconductors NV | 138,600 | 25,545 | |
| onsemi (a) | 522,359 | 38,367 | |
| 164,096 | |||
| Software - 4.4% | |||
| Adobe, Inc. (a) | 30,000 | 11,110 | |
| Microsoft Corp. | 187,800 | 46,539 | |
| Palo Alto Networks, Inc. (a) | 186,100 | 29,523 | |
| 87,172 | |||
TOTAL INFORMATION TECHNOLOGY | 408,025 | ||
| MATERIALS - 8.5% | |||
| Chemicals - 3.8% | |||
| CF Industries Holdings, Inc. | 308,100 | 26,096 | |
| The Chemours Co. LLC | 1,346,928 | 49,015 | |
| 75,111 | |||
| Containers & Packaging - 2.8% | |||
| Berry Global Group, Inc. | 307,900 | 19,007 | |
| Graphic Packaging Holding Co. | 668,800 | 16,111 | |
| WestRock Co. | 483,700 | 18,980 | |
| 54,098 | |||
| Metals & Mining - 1.9% | |||
| ATI, Inc. (a) | 151,200 | 5,502 | |
| Cleveland-Cliffs, Inc. (a) | 349,800 | 7,468 | |
| First Quantum Minerals Ltd. | 648,800 | 15,053 | |
| Freeport-McMoRan, Inc. | 218,400 | 9,745 | |
| 37,768 | |||
TOTAL MATERIALS | 166,977 | ||
| REAL ESTATE - 0.5% | |||
| Equity Real Estate Investment Trusts (REITs) - 0.5% | |||
| Crown Castle International Corp. | 61,100 | 9,050 | |
| UTILITIES - 4.0% | |||
| Electric Utilities - 2.9% | |||
| NRG Energy, Inc. | 227,609 | 7,789 | |
| PG&E Corp. (a) | 3,118,902 | 49,591 | |
| 57,380 | |||
| Independent Power and Renewable Electricity Producers - 1.1% | |||
| Vistra Corp. | 927,700 | 21,393 | |
TOTAL UTILITIES | 78,773 | ||
| TOTAL COMMON STOCKS (Cost $1,240,176) | 1,903,277 | ||
| Money Market Funds - 5.8% | |||
| Shares | Value ($) (000s) | ||
| Fidelity Cash Central Fund 4.38% (d) | 44,276,640 | 44,285 | |
| Fidelity Securities Lending Cash Central Fund 4.38% (d)(e) | 68,491,176 | 68,498 | |
| TOTAL MONEY MARKET FUNDS (Cost $112,780) | 112,783 | ||
| TOTAL INVESTMENT IN SECURITIES - 102.7% (Cost $1,352,956) | 2,016,060 |
NET OTHER ASSETS (LIABILITIES) - (2.7)% | (52,320) |
| NET ASSETS - 100.0% | 1,963,740 |
| (a) | Non-income producing |
| (b) | Security or a portion of the security is on loan at period end. |
| (c) | Security exempt from registration under Rule 144A of the Securities Act of 1933. These securities may be resold in transactions exempt from registration, normally to qualified institutional buyers. At the end of the period, the value of these securities amounted to $4,342,000 or 0.2% of net assets. |
| (d) | Affiliated fund that is generally available only to investment companies and other accounts managed by Fidelity Investments. The rate quoted is the annualized seven-day yield of the fund at period end. A complete unaudited listing of the fund's holdings as of its most recent quarter end is available upon request. In addition, each Fidelity Central Fund's financial statements are available on the SEC's website or upon request. |
| (e) | Investment made with cash collateral received from securities on loan. |
| Affiliate (Amounts in thousands) | Value, beginning of period ($) | Purchases ($) | Sales Proceeds ($) | Dividend Income ($) | Realized Gain (loss) ($) | Change in Unrealized appreciation (depreciation) ($) | Value, end of period ($) | % ownership, end of period |
| Fidelity Cash Central Fund 4.38% | 129,463 | 390,335 | 475,513 | 1,281 | - | - | 44,285 | 0.1% |
| Fidelity Securities Lending Cash Central Fund 4.38% | 39,227 | 310,858 | 281,587 | 24 | - | - | 68,498 | 0.2% |
| Total | 168,690 | 701,193 | 757,100 | 1,305 | - | - | 112,783 | |
| Valuation Inputs at Reporting Date: | ||||
Description (Amounts in thousands) | Total ($) | Level 1 ($) | Level 2 ($) | Level 3 ($) |
Investments in Securities: | ||||
| Equities: | ||||
Communication Services | 155,034 | 155,034 | - | - |
Consumer Discretionary | 327,560 | 327,560 | - | - |
Consumer Staples | 87,531 | 87,531 | - | - |
Energy | 134,252 | 134,252 | - | - |
Financials | 132,666 | 132,666 | - | - |
Health Care | 282,824 | 282,824 | - | - |
Industrials | 120,585 | 120,585 | - | - |
Information Technology | 408,025 | 408,025 | - | - |
Materials | 166,977 | 166,977 | - | - |
Real Estate | 9,050 | 9,050 | - | - |
Utilities | 78,773 | 78,773 | - | - |
| Money Market Funds | 112,783 | 112,783 | - | - |
| Total Investments in Securities: | 2,016,060 | 2,016,060 | - | - |
| Statement of Assets and Liabilities | ||||
| Amounts in thousands (except per-share amounts) | January 31, 2023 (Unaudited) | |||
| Assets | ||||
| Investment in securities, at value (including securities loaned of $68,406) - See accompanying schedule: | ||||
Unaffiliated issuers (cost $1,240,176) | $ | 1,903,277 | ||
Fidelity Central Funds (cost $112,780) | 112,783 | |||
| Total Investment in Securities (cost $1,352,956) | $ | 2,016,060 | ||
| Receivable for investments sold | 26,116 | |||
| Receivable for fund shares sold | 224 | |||
| Dividends receivable | 619 | |||
| Distributions receivable from Fidelity Central Funds | 192 | |||
| Prepaid expenses | 2 | |||
| Other receivables | 94 | |||
Total assets | 2,043,307 | |||
| Liabilities | ||||
| Payable for investments purchased | $ | 8,445 | ||
| Payable for fund shares redeemed | 1,425 | |||
| Accrued management fee | 908 | |||
| Other affiliated payables | 253 | |||
| Other payables and accrued expenses | 38 | |||
| Collateral on securities loaned | 68,498 | |||
| Total Liabilities | 79,567 | |||
| Net Assets | $ | 1,963,740 | ||
| Net Assets consist of: | ||||
| Paid in capital | $ | 1,274,658 | ||
| Total accumulated earnings (loss) | 689,082 | |||
| Net Assets | $ | 1,963,740 | ||
| Net Asset Value and Maximum Offering Price | ||||
| Leveraged Company Stock : | ||||
Net Asset Value , offering price and redemption price per share ($1,828,223 ÷ 53,805 shares) | $ | 33.98 | ||
| Class K : | ||||
Net Asset Value , offering price and redemption price per share ($135,517 ÷ 3,968 shares) | $ | 34.15 | ||
| Statement of Operations | ||||
| Amounts in thousands | Six months ended January 31, 2023 (Unaudited) | |||
| Investment Income | ||||
| Dividends | $ | 16,173 | ||
| Interest | 1 | |||
| Income from Fidelity Central Funds (including $24 from security lending) | 1,305 | |||
| Total Income | 17,479 | |||
| Expenses | ||||
| Management fee | $ | 5,720 | ||
| Transfer agent fees | 1,294 | |||
| Accounting fees | 266 | |||
| Custodian fees and expenses | 14 | |||
| Independent trustees' fees and expenses | 4 | |||
| Registration fees | 28 | |||
| Audit | 33 | |||
| Legal | 3 | |||
| Miscellaneous | 6 | |||
| Total expenses before reductions | 7,368 | |||
| Expense reductions | (37) | |||
| Total expenses after reductions | 7,331 | |||
| Net Investment income (loss) | 10,148 | |||
| Realized and Unrealized Gain (Loss) | ||||
| Net realized gain (loss) on: | ||||
| Investment Securities: | ||||
| Unaffiliated issuers | 127,479 | |||
| Foreign currency transactions | 2 | |||
| Total net realized gain (loss) | 127,481 | |||
| Change in net unrealized appreciation (depreciation) on: | ||||
| Investment Securities: | ||||
| Unaffiliated issuers | (148,634) | |||
| Assets and liabilities in foreign currencies | 2 | |||
| Total change in net unrealized appreciation (depreciation) | (148,632) | |||
| Net gain (loss) | (21,151) | |||
| Net increase (decrease) in net assets resulting from operations | $ | (11,003) | ||
| Statement of Changes in Net Assets | ||||
| Amount in thousands | Six months ended January 31, 2023 (Unaudited) | Year ended July 31, 2022 | ||
| Increase (Decrease) in Net Assets | ||||
| Operations | ||||
| Net investment income (loss) | $ | 10,148 | $ | 10,222 |
| Net realized gain (loss) | 127,481 | 320,112 | ||
| Change in net unrealized appreciation (depreciation) | (148,632) | (607,754) | ||
| Net increase (decrease) in net assets resulting from operations | (11,003) | (277,420) | ||
| Distributions to shareholders | (321,039) | (239,412) | ||
| Share transactions - net increase (decrease) | 85,410 | (168,539) | ||
| Total increase (decrease) in net assets | (246,632) | (685,371) | ||
| Net Assets | ||||
| Beginning of period | 2,210,372 | 2,895,743 | ||
| End of period | $ | 1,963,740 | $ | 2,210,372 |
| Fidelity® Leveraged Company Stock Fund |
Six months ended (Unaudited) January 31, 2023 | Years ended July 31, 2022 | 2021 | 2020 | 2019 | 2018 | |||||||
Selected Per-Share Data | ||||||||||||
| Net asset value, beginning of period | $ | 39.65 | $ | 48.37 | $ | 30.88 | $ | 29.94 | $ | 34.31 | $ | 37.25 |
| Income from Investment Operations | ||||||||||||
Net investment income (loss) A,B | .17 | .17 | .03 C | .08 D | (.02) | .02 | ||||||
| Net realized and unrealized gain (loss) | (.07) E | (4.89) | 17.50 | .89 | .42 | 3.42 F | ||||||
| Total from investment operations | .10 | (4.72) | 17.53 | .97 | .40 | 3.44 | ||||||
| Distributions from net investment income | (.25) | (.12) | (.04) | (.03) | - | (.07) | ||||||
| Distributions from net realized gain | (5.52) | (3.89) | - | - | (4.77) | (6.32) | ||||||
| Total distributions | (5.77) | (4.00) G | (.04) | (.03) | (4.77) | (6.38) G | ||||||
| Net asset value, end of period | $ | 33.98 | $ | 39.65 | $ | 48.37 | $ | 30.88 | $ | 29.94 | $ | 34.31 |
Total Return H,I | .50% E | (10.85)% | 56.84% | 3.24% | 1.93% | 10.91% F | ||||||
Ratios to Average Net Assets A,J,K | ||||||||||||
| Expenses before reductions | .75% L | .74% | .75% | .78% | .78% | .78% | ||||||
| Expenses net of fee waivers, if any | .75% L | .74% | .75% | .78% | .78% | .78% | ||||||
| Expenses net of all reductions | .75% L | .74% | .75% | .77% | .78% | .77% | ||||||
| Net investment income (loss) | 1.01% L | .38% | .06% C | .27% D | (.06)% | .07% | ||||||
| Supplemental Data | ||||||||||||
| Net assets, end of period (in millions) | $ | 1,828 | $ | 1,937 | $ | 2,534 | $ | 1,631 | $ | 1,945 | $ | 2,372 |
Portfolio turnover rate M | 60% L | 26% | 15% | 31% | 53% | 67% |
| Fidelity® Leveraged Company Stock Fund Class K |
Six months ended (Unaudited) January 31, 2023 | Years ended July 31, 2022 | 2021 | 2020 | 2019 | 2018 | |||||||
Selected Per-Share Data | ||||||||||||
| Net asset value, beginning of period | $ | 39.84 | $ | 48.58 | $ | 31.01 | $ | 30.04 | $ | 34.40 | $ | 37.34 |
| Income from Investment Operations | ||||||||||||
Net investment income (loss) A,B | .19 | .21 | .06 C | .11 D | .01 | .06 | ||||||
| Net realized and unrealized gain (loss) | (.07) E | (4.91) | 17.59 | .91 | .42 | 3.42 F | ||||||
| Total from investment operations | .12 | (4.70) | 17.65 | 1.02 | .43 | 3.48 | ||||||
| Distributions from net investment income | (.28) | (.16) | (.08) | (.05) | - | (.11) | ||||||
| Distributions from net realized gain | (5.52) | (3.89) | - | - | (4.79) | (6.32) | ||||||
| Total distributions | (5.81) G | (4.04) G | (.08) | (.05) | (4.79) | (6.42) G | ||||||
| Net asset value, end of period | $ | 34.15 | $ | 39.84 | $ | 48.58 | $ | 31.01 | $ | 30.04 | $ | 34.40 |
Total Return H,I | .54% E | (10.77)% | 57.00% | 3.38% | 2.03% | 11.01% F | ||||||
Ratios to Average Net Assets B,J,K | ||||||||||||
| Expenses before reductions | .65% L | .65% | .66% | .67% | .67% | .67% | ||||||
| Expenses net of fee waivers, if any | .65% L | .65% | .66% | .67% | .67% | .67% | ||||||
| Expenses net of all reductions | .65% L | .65% | .66% | .66% | .67% | .66% | ||||||
| Net investment income (loss) | 1.11% L | .47% | .15% C | .38% D | .05% | .18% | ||||||
| Supplemental Data | ||||||||||||
| Net assets, end of period (in millions) | $ | 136 | $ | 274 | $ | 362 | $ | 285 | $ | 347 | $ | 431 |
Portfolio turnover rate M | 60% L | 26% | 15% | 31% | 53% | 67% |
| Fidelity Central Fund | Investment Manager | Investment Objective | Investment Practices | Expense Ratio A |
| Fidelity Money Market Central Funds | Fidelity Management & Research Company LLC (FMR) | Each fund seeks to obtain a high level of current income consistent with the preservation of capital and liquidity. | Short-term Investments | Less than .005% |
| Gross unrealized appreciation | $712,941 |
| Gross unrealized depreciation | (59,117) |
| Net unrealized appreciation (depreciation) | $653,824 |
| Tax cost | $1,362,236 |
| Purchases ($) | Sales ($) | |
| Fidelity Leveraged Company Stock Fund | 571,609 | 728,356 |
| Amount | % of Class-Level Average Net Assets A | |
| Leveraged Company Stock | $1,255 | .14 |
| Class K | 39 | .04 |
| $1,294 |
| % of Average Net Assets | |
| Fidelity Leveraged Company Stock Fund | .03 |
| Amount | |
| Fidelity Leveraged Company Stock Fund | $9 |
| Purchases ($) | Sales ($) | Realized Gain (Loss) ($) | |
| Fidelity Leveraged Company Stock Fund | 28,929 | 25,269 | 5,201 |
| Amount ($) | |
| Fidelity Leveraged Company Stock Fund | 21 |
| Amount | |
| Fidelity Leveraged Company Stock Fund | $3 |
| Total Security Lending Fees Paid to NFS | Security Lending Income From Securities Loaned to NFS | Value of Securities Loaned to NFS at Period End | |
| Fidelity Leveraged Company Stock Fund | $3 | $- | $- |
| Six months ended January 31, 2023 | Year ended July 31, 2022 | |
| Fidelity Leveraged Company Stock Fund | ||
| Distributions to shareholders | ||
| Leveraged Company Stock | $284,888 | $209,842 |
| Class K | 36,151 | 29,570 |
| Total | $321,039 | $239,412 |
| Shares | Shares | Dollars | Dollars | |
Six months ended January 31, 2023 | Year ended July 31, 2022 | Six months ended January 31, 2023 | Year ended July 31, 2022 | |
| Fidelity Leveraged Company Stock Fund | ||||
| Leveraged Company Stock | ||||
| Shares sold | 695 | 1,890 | $24,482 | $85,159 |
| Reinvestment of distributions | 7,834 | 4,268 | 268,740 | 199,167 |
| Shares redeemed | (3,564) | (9,699) | (120,688) | (427,361) |
| Net increase (decrease) | 4,965 | (3,541) | $172,534 | $(143,035) |
| Class K | ||||
| Shares sold | 160 | 517 | $5,473 | $23,487 |
| Reinvestment of distributions | 1,038 | 631 | 36,151 | 29,570 |
| Shares redeemed | (4,101) | (1,729) | (128,748) | (78,561) |
| Net increase (decrease) | (2,903) | (581) | $(87,124) | $(25,504) |
| The Example is based on an investment of $1,000 invested at the beginning of the period and held for the entire period (August 1, 2022 to January 31, 2023). |
Annualized Expense Ratio- A | Beginning Account Value August 1, 2022 | Ending Account Value January 31, 2023 | Expenses Paid During Period- C August 1, 2022 to January 31, 2023 | |||||||
| Fidelity® Leveraged Company Stock Fund | ||||||||||
| Fidelity® Leveraged Company Stock Fund | .75% | |||||||||
| Actual | $ 1,000 | $ 1,005.00 | $ 3.79 | |||||||
Hypothetical- B | $ 1,000 | $ 1,021.42 | $ 3.82 | |||||||
| Class K | .65% | |||||||||
| Actual | $ 1,000 | $ 1,005.40 | $ 3.29 | |||||||
Hypothetical- B | $ 1,000 | $ 1,021.93 | $ 3.31 | |||||||
- Highly liquid investments - cash or convertible to cash within three business days or less
- Moderately liquid investments - convertible to cash in three to seven calendar days
- Less liquid investments - can be sold or disposed of, but not settled, within seven calendar days
- Illiquid investments - cannot be sold or disposed of within seven calendar days
|


Contents
Top Holdings (% of Fund's net assets) | ||
| Equity Lifestyle Properties, Inc. | 2.7 | |
| American Tower Corp. | 2.5 | |
| Prologis (REIT), Inc. | 2.0 | |
| Crown Castle International Corp. | 1.8 | |
| Welltower, Inc. | 1.2 | |
| Equinix, Inc. | 1.1 | |
| Mid-America Apartment Communities, Inc. | 1.1 | |
| LXP Industrial Trust (REIT) | 1.1 | |
| Public Storage | 1.0 | |
| Ventas, Inc. | 1.0 | |
| 15.5 | ||
| Top Five REIT Sectors (% of Fund's net assets) | ||
| REITs - Diversified | 13.7 | |
| REITs - Mortgage | 10.1 | |
| REITs - Management/Investment | 5.5 | |
| REITs - Apartments | 5.1 | |
| REITs - Health Care | 4.8 | |
Quality Diversification (% of Fund's net assets) |
 |
Percentages shown as 0.0% may reflect amounts less than 0.05%. |
| We have used ratings from Moody's Investors Service, Inc. Where Moody's® ratings are not available, we have used S&P® ratings. All ratings are as of the date indicated and do not reflect subsequent changes. |
Asset Allocation (% of Fund's net assets) |
 |
Foreign investments - 0.5% |
| Common Stocks - 25.8% | |||
| Shares | Value ($) | ||
| FINANCIALS - 0.8% | |||
| Capital Markets - 0.0% | |||
| Brookfield Asset Management Ltd. Class A (a) | 21,775 | 710,914 | |
| Brookfield Corp. (Canada) Class A | 12,700 | 472,474 | |
| 1,183,388 | |||
| Mortgage Real Estate Investment Trusts - 0.8% | |||
| Great Ajax Corp. (b) | 1,663,364 | 14,587,702 | |
| MFA Financial, Inc. | 1,492,885 | 17,750,403 | |
| Rithm Capital Corp. | 500,199 | 4,706,873 | |
| 37,044,978 | |||
TOTAL FINANCIALS | 38,228,366 | ||
| INDUSTRIALS - 0.4% | |||
| Construction & Engineering - 0.4% | |||
| Willscot Mobile Mini Holdings (a) | 381,100 | 18,468,106 | |
| INFORMATION TECHNOLOGY - 0.0% | |||
| IT Services - 0.0% | |||
| Cyxtera Technologies, Inc. Class A (a) | 740,700 | 2,385,054 | |
| REAL ESTATE - 24.6% | |||
| Equity Real Estate Investment Trusts (REITs) - 24.4% | |||
| Acadia Realty Trust (SBI) | 510,426 | 7,926,916 | |
| American Homes 4 Rent Class A | 661,200 | 22,672,548 | |
| American Tower Corp. | 551,900 | 123,288,941 | |
| AvalonBay Communities, Inc. | 128,900 | 22,872,016 | |
| Crown Castle International Corp. | 603,310 | 89,356,244 | |
| CubeSmart | 378,600 | 17,336,094 | |
| Digital Realty Trust, Inc. | 83,900 | 9,616,618 | |
| Douglas Emmett, Inc. | 271,700 | 4,550,975 | |
| Easterly Government Properties, Inc. (c) | 1,062,300 | 17,251,752 | |
| EastGroup Properties, Inc. | 68,600 | 11,541,950 | |
| Elme Communities (SBI) | 807,347 | 15,501,062 | |
| Equinix, Inc. | 75,500 | 55,728,815 | |
| Equity Lifestyle Properties, Inc. | 1,850,596 | 132,835,768 | |
| Equity Residential (SBI) | 103,700 | 6,600,505 | |
| Essex Property Trust, Inc. | 169,800 | 38,386,686 | |
| Extra Space Storage, Inc. | 111,000 | 17,519,130 | |
| Farmland Partners, Inc. | 115,756 | 1,490,937 | |
| Gaming & Leisure Properties | 386,846 | 20,719,472 | |
| Healthcare Trust of America, Inc. | 186,360 | 4,012,331 | |
| Invitation Homes, Inc. | 611,100 | 19,860,750 | |
| iStar Financial, Inc. | 77,413 | 718,393 | |
| Lamar Advertising Co. Class A | 201,900 | 21,510,426 | |
| Life Storage, Inc. | 128,100 | 13,839,924 | |
| LXP Industrial Trust (REIT) | 4,593,174 | 53,051,160 | |
| Mid-America Apartment Communities, Inc. | 325,706 | 54,301,704 | |
| National Retail Properties, Inc. | 73,200 | 3,466,020 | |
| NexPoint Residential Trust, Inc. | 10,300 | 520,150 | |
| Postal Realty Trust, Inc. | 878,500 | 13,581,610 | |
| Prologis (REIT), Inc. | 764,330 | 98,812,582 | |
| Public Storage | 170,700 | 51,950,838 | |
| Retail Value, Inc. | 274,131 | 68,533 | |
| Rexford Industrial Realty, Inc. | 67,700 | 4,296,919 | |
| RLJ Lodging Trust | 607,000 | 7,629,990 | |
| Sabra Health Care REIT, Inc. | 604,175 | 8,156,363 | |
| Safehold, Inc. | 5,925 | 207,138 | |
| SITE Centers Corp. | 1,379,438 | 18,829,329 | |
| Spirit Realty Capital, Inc. | 676,600 | 29,689,208 | |
| Sunstone Hotel Investors, Inc. | 372,700 | 4,095,973 | |
| Terreno Realty Corp. | 346,628 | 22,333,242 | |
| UDR, Inc. | 414,200 | 17,640,778 | |
| UMH Properties, Inc. | 335,723 | 6,016,156 | |
| Ventas, Inc. | 987,086 | 51,140,926 | |
| VICI Properties, Inc. | 825,700 | 28,222,426 | |
| Welltower, Inc. | 828,300 | 62,155,632 | |
| Weyerhaeuser Co. | 178,300 | 6,138,869 | |
| 1,217,443,799 | |||
| Real Estate Management & Development - 0.2% | |||
| Cushman & Wakefield PLC (a) | 201,400 | 2,906,202 | |
| Digitalbridge Group, Inc. | 457,988 | 6,778,222 | |
| 9,684,424 | |||
TOTAL REAL ESTATE | 1,227,128,223 | ||
| TOTAL COMMON STOCKS (Cost $924,153,534) | 1,286,209,749 | ||
| Preferred Stocks - 19.7% | |||
| Shares | Value ($) | ||
| Convertible Preferred Stocks - 0.7% | |||
| FINANCIALS - 0.3% | |||
| Mortgage Real Estate Investment Trusts - 0.3% | |||
| Great Ajax Corp. 7.25% (b) | 611,442 | 14,986,443 | |
| REAL ESTATE - 0.4% | |||
| Equity Real Estate Investment Trusts (REITs) - 0.4% | |||
| LXP Industrial Trust (REIT) Series C, 6.50% | 440,102 | 21,029,772 | |
| RLJ Lodging Trust Series A, 1.95% | 31,585 | 799,101 | |
| 21,828,873 | |||
| TOTAL CONVERTIBLE PREFERRED STOCKS | 36,815,316 | ||
| Nonconvertible Preferred Stocks - 19.0% | |||
| ENERGY - 0.9% | |||
| Oil, Gas & Consumable Fuels - 0.9% | |||
| DCP Midstream Partners LP: | |||
| 7.95%(d) | 328,262 | 8,239,376 | |
| Series B, 7.875%(d) | 256,314 | 6,446,297 | |
| Enbridge, Inc.: | |||
| Series 1, 5 year U.S. Treasury Index + 3.140% 5.949%(d)(e) | 498,275 | 11,196,239 | |
| Series L, 5 year U.S. Treasury Index + 3.150% 4.959%(d)(e) | 111,400 | 2,235,798 | |
| Energy Transfer LP 7.60% (d) | 525,651 | 12,589,341 | |
| Global Partners LP: | |||
| 9.75%(d) | 161,507 | 4,305,793 | |
| Series B, 9.50% | 67,800 | 1,709,936 | |
| 46,722,780 | |||
| FINANCIALS - 9.3% | |||
| Mortgage Real Estate Investment Trusts - 9.1% | |||
| AG Mortgage Investment Trust, Inc.: | |||
| 8.00% | 256,862 | 4,713,418 | |
| Series C, 8.00%(d) | 467,638 | 8,702,743 | |
| AGNC Investment Corp.: | |||
| 6.125%(d) | 930,100 | 20,052,956 | |
| 6.875%(d) | 673,972 | 14,908,261 | |
| Series C, 7.00%(d)(e) | 653,202 | 16,447,626 | |
| Series E, 6.50%(d) | 1,424,834 | 31,887,785 | |
| Series G, 7.75%(d) | 320,000 | 7,433,600 | |
| Annaly Capital Management, Inc.: | |||
| 6.75%(d) | 192,992 | 4,492,854 | |
| Series F, 6.95%(d)(e) | 1,599,843 | 39,836,091 | |
| Series G, 6.50%(d) | 1,069,599 | 25,713,160 | |
| Arbor Realty Trust, Inc.: | |||
| Series D, 6.375% | 126,100 | 2,591,355 | |
| Series F, 6.25%(d) | 447,536 | 9,120,784 | |
| Cherry Hill Mortgage Investment Corp.: | |||
| 8.25%(d) | 58,325 | 1,314,354 | |
| Series A, 8.20% | 63,650 | 1,451,220 | |
| Chimera Investment Corp.: | |||
| 8.00%(d) | 672,531 | 14,661,176 | |
| Series B, 8.00%(d) | 1,484,504 | 33,252,890 | |
| Series C, 7.75%(d) | 1,962,186 | 40,067,838 | |
| Dynex Capital, Inc. Series C 6.90% (d) | 286,688 | 6,590,957 | |
| Ellington Financial LLC 6.75% (d) | 212,370 | 4,672,140 | |
| Franklin BSP Realty Trust, Inc. 7.50% | 240,633 | 5,102,502 | |
| KKR Real Estate Finance Trust, Inc. 6.50% | 188,372 | 3,663,835 | |
| MFA Financial, Inc.: | |||
| 6.50%(d) | 1,117,351 | 21,631,915 | |
| Series B, 7.50% | 447,732 | 9,165,074 | |
| PennyMac Mortgage Investment Trust: | |||
| 6.75% | 217,700 | 4,319,168 | |
| 8.125%(d) | 410,254 | 9,944,557 | |
| Series B, 8.00%(d) | 639,908 | 15,191,416 | |
| Ready Capital Corp. Series C, 6.20% | 214,250 | 4,962,030 | |
| Rithm Capital Corp.: | |||
| 7.125%(d) | 1,184,542 | 25,823,016 | |
| Series A, 7.50%(d) | 580,904 | 12,959,968 | |
| Series C, 6.375%(d) | 1,149,554 | 22,933,602 | |
| Series D, 7.00%(d) | 151,200 | 3,211,488 | |
| Two Harbors Investment Corp.: | |||
| Series A, 8.125%(d) | 363,526 | 8,037,560 | |
| Series B, 7.625%(d) | 776,859 | 16,088,750 | |
| 450,946,089 | |||
| Real Estate Management & Development - 0.2% | |||
| Brookfield Properties Corp. Series EE, 5.10% (d) | 679,025 | 9,487,110 | |
TOTAL FINANCIALS | 460,433,199 | ||
| REAL ESTATE - 8.8% | |||
| Equity Real Estate Investment Trusts (REITs) - 7.2% | |||
| Agree Realty Corp. 4.375% | 240,000 | 4,394,400 | |
| American Homes 4 Rent: | |||
| 6.25% | 98,905 | 2,497,351 | |
| Series G, 5.875% | 199,750 | 4,714,100 | |
| Armada Hoffler Properties, Inc. 6.75% | 255,050 | 5,822,792 | |
| Ashford Hospitality Trust, Inc.: | |||
| Series D, 8.45% | 190,073 | 4,418,437 | |
| Series F, 7.375% | 127,400 | 2,410,408 | |
| Series G, 7.375% | 63,168 | 1,306,371 | |
| Series H, 7.50% | 231,565 | 4,515,518 | |
| Series I, 7.50% | 154,709 | 2,962,677 | |
| Braemar Hotels & Resorts, Inc. Series D, 8.25% | 173,050 | 4,246,647 | |
| Cedar Realty Trust, Inc.: | |||
| 7.25% | 130,101 | 2,016,566 | |
| Series C, 6.50% | 291,600 | 3,589,596 | |
| Centerspace Series C, 6.625% | 317,300 | 8,471,910 | |
| City Office REIT, Inc. Series A, 6.625% | 178,475 | 3,928,235 | |
| CTO Realty Growth, Inc. 6.375% | 120,000 | 2,611,740 | |
| DiamondRock Hospitality Co. 8.25% | 448,231 | 11,546,431 | |
| Digital Realty Trust, Inc.: | |||
| 5.25% | 32,900 | 779,730 | |
| Series L, 5.20% | 33,700 | 795,657 | |
| Gladstone Commercial Corp.: | |||
| 6.625% | 145,116 | 3,410,226 | |
| Series G, 6.00% | 516,000 | 11,088,840 | |
| Gladstone Land Corp. Series D, 5.00% | 30,000 | 724,500 | |
| Global Medical REIT, Inc. Series A, 7.50% | 150,848 | 3,807,404 | |
| Global Net Lease, Inc.: | |||
| Series A, 7.25% | 531,595 | 12,667,909 | |
| Series B 6.875% | 294,000 | 6,967,800 | |
| Healthcare Trust, Inc.: | |||
| 7.125% | 190,000 | 4,121,100 | |
| Series A 7.375% | 364,800 | 8,474,304 | |
| Hersha Hospitality Trust: | |||
| Series C, 6.875% | 49,450 | 1,045,759 | |
| Series D, 6.50% | 197,750 | 4,071,673 | |
| Hudson Pacific Properties, Inc. Series C, 4.75% | 790,100 | 11,756,688 | |
| iStar Financial, Inc.: | |||
| Series D, 8.00% | 291,621 | 7,369,263 | |
| Series G, 7.65% | 305,973 | 7,695,221 | |
| Series I, 7.50% | 471,496 | 11,843,980 | |
| Kimco Realty Corp.: | |||
| 5.125% | 14,000 | 327,390 | |
| Series M, 5.25% | 48,100 | 1,137,565 | |
| National Storage Affiliates Trust Series A, 6.00% | 91,575 | 2,305,859 | |
| Necessity Retail (REIT), Inc./The: | |||
| 7.50% | 874,787 | 20,811,183 | |
| Series C 7.375% | 379,839 | 8,888,233 | |
| Pebblebrook Hotel Trust: | |||
| 6.30% | 281,697 | 5,984,653 | |
| 6.375% | 372,994 | 7,832,874 | |
| 6.375% | 666,800 | 14,062,812 | |
| Series H, 5.70% | 717,200 | 13,605,284 | |
| Pennsylvania (REIT): | |||
| Series B, 7.375%(a) | 99,385 | 187,838 | |
| Series C, 7.20%(a) | 50,325 | 89,579 | |
| Series D, 6.875%(a) | 150,100 | 282,939 | |
| Plymouth Industrial REIT, Inc. Series A, 7.50% | 171,625 | 4,299,206 | |
| Prologis (REIT), Inc. Series Q, 8.54% | 93,396 | 5,369,336 | |
| Public Storage: | |||
| 4.00% | 331,800 | 6,264,384 | |
| 4.00% | 37,000 | 708,180 | |
| Series F, 5.15% | 25,800 | 623,844 | |
| Series G, 5.05% | 43,800 | 1,048,572 | |
| Series I, 4.875% | 75,000 | 1,695,000 | |
| Series J, 4.70% | 303,800 | 6,577,270 | |
| Series K, 4.75% | 174,000 | 3,810,600 | |
| Series L, 4.625% | 139,600 | 2,986,044 | |
| Series S, 4.10% | 200,000 | 3,786,000 | |
| Rexford Industrial Realty, Inc.: | |||
| Series B, 5.875% | 88,600 | 2,186,648 | |
| Series C, 5.625% | 78,225 | 1,901,650 | |
| Saul Centers, Inc.: | |||
| Series D, 6.125% | 82,775 | 1,941,902 | |
| Series E, 6.00% | 76,841 | 1,765,038 | |
| SITE Centers Corp. 6.375% | 104,400 | 2,606,868 | |
| Sotherly Hotels, Inc.: | |||
| Series B, 8.00% | 67,250 | 1,701,425 | |
| Series C, 7.875% | 107,000 | 2,728,500 | |
| Spirit Realty Capital, Inc. Series A, 6.00% | 101,125 | 2,445,203 | |
| Summit Hotel Properties, Inc.: | |||
| Series E, 6.25% | 457,602 | 10,465,266 | |
| Series F, 5.875% | 377,000 | 8,312,737 | |
| Sunstone Hotel Investors, Inc.: | |||
| Series H, 6.125% | 180,000 | 3,861,000 | |
| Series I, 5.70% | 240,000 | 4,946,400 | |
| UMH Properties, Inc. Series D, 6.375% | 650,125 | 15,050,394 | |
| Urstadt Biddle Properties, Inc.: | |||
| Series H, 6.25% | 281,325 | 6,414,210 | |
| Series K 5.875% | 69,225 | 1,518,797 | |
| Vornado Realty Trust: | |||
| Series L, 5.40% | 30,100 | 572,803 | |
| Series M, 5.25% | 2,000 | 37,600 | |
| Series N, 5.25% | 147,400 | 2,707,738 | |
| Series O, 4.45% | 342,900 | 5,558,409 | |
| 355,480,466 | |||
| Real Estate Management & Development - 1.6% | |||
| Brookfield Property Partners LP: | |||
| 5.75% | 43,000 | 784,750 | |
| 6.50% | 34,125 | 695,809 | |
| Digitalbridge Group, Inc.: | |||
| Series H, 7.125% | 965,305 | 21,690,403 | |
| Series I, 7.15% | 1,074,492 | 24,251,284 | |
| Series J, 7.15% | 1,387,346 | 30,577,106 | |
| Seritage Growth Properties Series A, 7.00% | 91,986 | 2,210,424 | |
| 80,209,776 | |||
TOTAL REAL ESTATE | 435,690,242 | ||
| TOTAL NONCONVERTIBLE PREFERRED STOCKS | 942,846,221 | ||
| TOTAL PREFERRED STOCKS (Cost $1,078,172,406) | 979,661,537 | ||
| Corporate Bonds - 17.7% | |||
Principal Amount (f) | Value ($) | ||
| Convertible Bonds - 1.3% | |||
| FINANCIALS - 0.9% | |||
| Mortgage Real Estate Investment Trusts - 0.9% | |||
| MFA Financial, Inc. 6.25% 6/15/24 | 9,700,000 | 9,190,750 | |
| PennyMac Corp. 5.5% 11/1/24 | 18,167,000 | 16,804,475 | |
| Redwood Trust, Inc. 5.625% 7/15/24 | 8,631,000 | 8,167,084 | |
| RWT Holdings, Inc. 5.75% 10/1/25 | 4,474,000 | 3,961,277 | |
| Two Harbors Investment Corp. 6.25% 1/15/26 | 4,896,000 | 4,348,138 | |
| 42,471,724 | |||
| REAL ESTATE - 0.4% | |||
| Real Estate Management & Development - 0.4% | |||
| Digitalbridge Group, Inc. 5% 4/15/23 | 21,416,000 | 21,215,225 | |
| TOTAL CONVERTIBLE BONDS | 63,686,949 | ||
| Nonconvertible Bonds - 16.4% | |||
| COMMUNICATION SERVICES - 0.2% | |||
| Media - 0.2% | |||
| Clear Channel Outdoor Holdings, Inc. 7.5% 6/1/29 (g) | 13,965,000 | 11,381,475 | |
| CONSUMER DISCRETIONARY - 3.3% | |||
| Hotels, Restaurants & Leisure - 1.7% | |||
| Caesars Entertainment, Inc. 8.125% 7/1/27 (g) | 17,465,000 | 17,726,975 | |
| Hilton Domestic Operating Co., Inc.: | |||
| 3.625% 2/15/32(g) | 13,965,000 | 11,727,109 | |
| 4% 5/1/31(g) | 6,000,000 | 5,199,000 | |
| Hilton Grand Vacations Borrower Escrow LLC 4.875% 7/1/31 (g) | 22,890,000 | 19,849,750 | |
| Marriott Ownership Resorts, Inc. 4.5% 6/15/29 (g) | 20,315,000 | 17,684,394 | |
| Sugarhouse HSP Gaming Prop Mezz LP/Sugarhouse HSP Gaming Finance Corp. 5.875% 5/15/25 (g) | 8,000,000 | 7,500,187 | |
| Times Square Hotel Trust 8.528% 8/1/26 (g) | 3,387,595 | 3,373,780 | |
| 83,061,195 | |||
| Household Durables - 1.6% | |||
| Adams Homes, Inc. 7.5% 2/15/25 (g) | 7,530,000 | 6,476,266 | |
| Ashton Woods U.S.A. LLC/Ashton Woods Finance Co.: | |||
| 4.625% 8/1/29(g) | 4,015,000 | 3,352,525 | |
| 4.625% 4/1/30(g) | 6,840,000 | 5,680,026 | |
| 6.625% 1/15/28(g) | 7,925,000 | 7,229,185 | |
| Century Communities, Inc.: | |||
| 3.875% 8/15/29(g) | 13,005,000 | 10,932,718 | |
| 6.75% 6/1/27 | 4,670,000 | 4,605,203 | |
| LGI Homes, Inc. 4% 7/15/29 (g) | 13,310,000 | 10,781,100 | |
| M/I Homes, Inc. 3.95% 2/15/30 | 17,070,000 | 14,360,308 | |
| New Home Co., Inc. 7.25% 10/15/25 (g) | 6,180,000 | 5,361,150 | |
| TRI Pointe Homes, Inc. 5.25% 6/1/27 | 11,458,000 | 10,780,374 | |
| 79,558,855 | |||
TOTAL CONSUMER DISCRETIONARY | 162,620,050 | ||
| ENERGY - 0.1% | |||
| Oil, Gas & Consumable Fuels - 0.1% | |||
| EG Global Finance PLC 8.5% 10/30/25 (g) | 1,682,000 | 1,585,285 | |
| Global Partners LP/GLP Finance Corp. 7% 8/1/27 | 3,955,000 | 3,797,303 | |
| 5,382,588 | |||
| FINANCIALS - 0.2% | |||
| Diversified Financial Services - 0.2% | |||
| Brixmor Operating Partnership LP 4.05% 7/1/30 | 4,000,000 | 3,658,222 | |
| Icahn Enterprises LP/Icahn Enterprises Finance Corp. 5.25% 5/15/27 | 5,000,000 | 4,668,750 | |
| 8,326,972 | |||
| HEALTH CARE - 0.4% | |||
| Health Care Providers & Services - 0.4% | |||
| Sabra Health Care LP: | |||
| 3.9% 10/15/29 | 989,000 | 845,578 | |
| 5.125% 8/15/26 | 20,264,000 | 19,599,235 | |
| 20,444,813 | |||
| INDUSTRIALS - 0.1% | |||
| Trading Companies & Distributors - 0.1% | |||
| Williams Scotsman International, Inc.: | |||
| 4.625% 8/15/28(g) | 4,250,000 | 3,937,859 | |
| 6.125% 6/15/25(g) | 3,240,000 | 3,255,941 | |
| 7,193,800 | |||
| REAL ESTATE - 12.1% | |||
| Equity Real Estate Investment Trusts (REITs) - 9.3% | |||
| American Finance Trust, Inc./American Finance Operating Partnership LP 4.5% 9/30/28 (g) | 28,405,000 | 21,576,365 | |
| American Homes 4 Rent LP: | |||
| 2.375% 7/15/31 | 7,000,000 | 5,713,236 | |
| 3.625% 4/15/32 | 17,000,000 | 15,115,655 | |
| 4.9% 2/15/29 | 5,000,000 | 4,865,008 | |
| American Tower Corp.: | |||
| 2.7% 4/15/31 | 2,000,000 | 1,686,312 | |
| 3.8% 8/15/29 | 23,000,000 | 21,495,567 | |
| 4.05% 3/15/32 | 27,000,000 | 25,017,165 | |
| Boston Properties, Inc.: | |||
| 3.25% 1/30/31 | 11,000,000 | 9,456,812 | |
| 6.75% 12/1/27 | 37,000 | 39,175 | |
| CBL & Associates LP: | |||
| 4.6% 10/15/24(h)(i) | 18,229,000 | 2 | |
| 5.25% 12/1/23(h)(i) | 11,371,000 | 1 | |
| 5.95% 12/15/26(h)(i) | 10,317,000 | 1 | |
| Crown Castle International Corp.: | |||
| 2.25% 1/15/31 | 5,000,000 | 4,173,198 | |
| 2.5% 7/15/31 | 5,000,000 | 4,207,026 | |
| 3.8% 2/15/28 | 2,000,000 | 1,908,555 | |
| CTR Partnership LP/CareTrust Capital Corp. 3.875% 6/30/28 (g) | 26,490,000 | 23,719,411 | |
| EPR Properties: | |||
| 3.6% 11/15/31 | 2,000,000 | 1,546,153 | |
| 4.95% 4/15/28 | 8,000,000 | 7,233,956 | |
| Equinix, Inc.: | |||
| 3.2% 11/18/29 | 5,000,000 | 4,526,066 | |
| 3.9% 4/15/32 | 17,000,000 | 15,631,351 | |
| Global Net Lease, Inc. / Global Net Lease Operating Partnership LP 3.75% 12/15/27 (g) | 5,075,000 | 4,289,681 | |
| GLP Capital LP/GLP Financing II, Inc.: | |||
| 5.3% 1/15/29 | 19,193,000 | 18,713,367 | |
| 5.375% 4/15/26 | 3,000,000 | 2,996,940 | |
| Hudson Pacific Properties LP 4.65% 4/1/29 | 6,000,000 | 5,226,453 | |
| Invitation Homes Operating Partnership LP 4.15% 4/15/32 | 30,000,000 | 27,511,004 | |
| MPT Operating Partnership LP/MPT Finance Corp.: | |||
| 3.5% 3/15/31 | 6,000,000 | 4,199,926 | |
| 4.625% 8/1/29 | 19,835,000 | 15,421,713 | |
| 5% 10/15/27 | 5,000,000 | 4,226,675 | |
| Office Properties Income Trust: | |||
| 4.25% 5/15/24 | 4,974,000 | 4,827,162 | |
| 4.5% 2/1/25 | 21,056,000 | 19,589,557 | |
| Omega Healthcare Investors, Inc.: | |||
| 3.375% 2/1/31 | 2,000,000 | 1,618,199 | |
| 4.5% 4/1/27 | 2,434,000 | 2,348,135 | |
| 4.95% 4/1/24 | 2,866,000 | 2,843,469 | |
| Park Intermediate Holdings LLC 4.875% 5/15/29 (g) | 12,000,000 | 10,374,008 | |
| Realty Income Corp. 4.875% 6/1/26 | 436,000 | 438,932 | |
| RLJ Lodging Trust LP: | |||
| 3.75% 7/1/26(g) | 8,000,000 | 7,307,759 | |
| 4% 9/15/29(g) | 22,550,000 | 18,912,685 | |
| SBA Communications Corp. 3.125% 2/1/29 | 5,000,000 | 4,235,913 | |
| Senior Housing Properties Trust: | |||
| 4.75% 5/1/24 | 19,148,000 | 16,706,630 | |
| 4.75% 2/15/28 | 9,933,000 | 6,053,369 | |
| Service Properties Trust: | |||
| 4.65% 3/15/24 | 3,500,000 | 3,408,110 | |
| 7.5% 9/15/25 | 7,950,000 | 7,817,156 | |
| Sun Communities Operating LP 4.2% 4/15/32 | 439,000 | 402,299 | |
| Uniti Group LP / Uniti Group Finance, Inc. 6.5% 2/15/29 (g) | 31,820,000 | 22,114,900 | |
| Uniti Group, Inc.: | |||
| 6% 1/15/30(g) | 18,035,000 | 11,954,364 | |
| 7.875% 2/15/25(g) | 5,000,000 | 4,934,604 | |
| VICI Properties LP 5.125% 5/15/32 | 34,000,000 | 32,524,400 | |
| VICI Properties LP / VICI Note Co. 4.625% 12/1/29 (g) | 14,000,000 | 13,037,340 | |
| Vornado Realty LP 3.4% 6/1/31 | 6,000,000 | 4,597,230 | |
| Welltower, Inc. 4% 6/1/25 | 5,000,000 | 4,888,460 | |
| XHR LP: | |||
| 4.875% 6/1/29(g) | 10,000,000 | 8,875,000 | |
| 6.375% 8/15/25(g) | 4,250,000 | 4,186,572 | |
| 464,493,027 | |||
| Real Estate Management & Development - 2.8% | |||
| DTZ U.S. Borrower LLC 6.75% 5/15/28 (g) | 11,165,000 | 10,777,909 | |
| Five Point Operation Co. LP 7.875% 11/15/25 (g) | 6,133,000 | 5,512,723 | |
| Forestar Group, Inc.: | |||
| 3.85% 5/15/26(g) | 9,000,000 | 8,019,854 | |
| 5% 3/1/28(g) | 5,000,000 | 4,362,514 | |
| Greystar Real Estate Partners 5.75% 12/1/25 (g) | 6,885,000 | 6,770,915 | |
| Howard Hughes Corp.: | |||
| 4.125% 2/1/29(g) | 14,960,000 | 12,918,259 | |
| 4.375% 2/1/31(g) | 22,625,000 | 18,799,873 | |
| 5.375% 8/1/28(g) | 11,900,000 | 11,024,041 | |
| Kennedy-Wilson, Inc.: | |||
| 4.75% 3/1/29 | 19,075,000 | 16,023,000 | |
| 4.75% 2/1/30 | 26,715,000 | 21,912,578 | |
| 5% 3/1/31 | 6,960,000 | 5,677,307 | |
| Realogy Group LLC/Realogy Co-Issuer Corp. 5.75% 1/15/29 (g) | 4,965,000 | 3,885,113 | |
| Realogy Group LLC/Realogy Co.-Issuer Corp. 5.25% 4/15/30 (g) | 15,000,000 | 11,250,000 | |
| Taylor Morrison Communities, Inc./Monarch Communities, Inc. 5.875% 6/15/27 (g) | 1,798,000 | 1,767,344 | |
| 138,701,430 | |||
TOTAL REAL ESTATE | 603,194,457 | ||
| TOTAL NONCONVERTIBLE BONDS | 818,544,155 | ||
| TOTAL CORPORATE BONDS (Cost $974,802,263) | 882,231,104 | ||
| Asset-Backed Securities - 1.5% | |||
Principal Amount (f) | Value ($) | ||
| American Homes 4 Rent: | |||
| Series 2015-SFR1 Class F, 5.885% 4/17/52 (g) | 2,000,000 | 1,949,125 | |
| Series 2015-SFR2: | |||
Class E, 6.07% 10/17/52 (g) | 8,259,000 | 8,138,974 | |
Class XS, 0% 10/17/52 (d)(g)(i)(j) | 4,514,831 | 45 | |
| Capital Trust RE CDO Ltd. Series 2005-1A Class D, 1 month U.S. LIBOR + 1.500% 3.3464% 3/20/50 (d)(e)(g)(i) | 2,250,000 | 0 | |
| Conseco Finance Securitizations Corp. Series 2002-2 Class M2, 9.163% 3/1/33 | 377,473 | 347,043 | |
| GPMT Ltd. Series 2019-FL2 Class D, 1 month U.S. LIBOR + 2.950% 7.4584% 2/22/36 (d)(e)(g) | 2,142,000 | 2,116,412 | |
| Green Tree Financial Corp.: | |||
| Series 1996-4 Class M1, 7.75% 6/15/27 (d) | 235,351 | 234,821 | |
| Series 1997-3 Class M1, 7.53% 3/15/28 | 2,224,405 | 2,096,953 | |
| Home Partners of America Trust: | |||
| Series 2019-2 Class F, 3.866% 10/19/39 (g) | 2,769,158 | 2,364,616 | |
| Series 2021-1 Class F, 3.325% 9/17/41 (g) | 6,769,690 | 5,390,526 | |
| Series 2021-2 Class G, 4.505% 12/17/26 (g) | 27,963,465 | 23,487,655 | |
| Series 2021-3 Class F, 4.242% 1/17/41 (g) | 10,079,208 | 8,488,830 | |
| Lehman ABS Manufactured Housing Contract Trust Series 2001-B Class M2, 7.17% 4/15/40 | 497,467 | 351,620 | |
| Merit Securities Corp. Series 13 Class M1, 7.88% 12/28/33 (d) | 733,697 | 721,331 | |
| New Residential Mortgage Loan Trust Series 2022-SFR2 Class E1, 4% 9/4/39 (g) | 2,900,000 | 2,431,629 | |
| Progress Residential Trust Series 2019-SFR3 Class F, 3.867% 9/17/36 (g) | 1,000,000 | 945,550 | |
| Tricon American Homes: | |||
| Series 2017-SFR2 Class F, 5.104% 1/17/36 (g) | 3,785,000 | 3,680,014 | |
| Series 2018-SFR1 Class F, 4.96% 5/17/37 (g) | 8,282,000 | 7,835,998 | |
| Tricon Residential Trust Series 2021-SFR1 Class G, 4.133% 7/17/38 (g) | 3,000,000 | 2,559,292 | |
| TOTAL ASSET-BACKED SECURITIES (Cost $83,658,108) | 73,140,434 | ||
| Collateralized Mortgage Obligations - 0.0% | |||
Principal Amount (f) | Value ($) | ||
| U.S. Government Agency - 0.0% | |||
| Fannie Mae REMIC Trust: | |||
| Series 2002-W1 subordinate REMIC pass thru certificates, Class 3B3, 3.4962% 2/25/42 (d)(g)(i) | 24,467 | 8,028 | |
| Series 2003-W10 subordinate REMIC pass thru certificates, Class 2B3, 3.4293% 6/25/43 (d)(g) | 42,602 | 30,438 | |
| TOTAL COLLATERALIZED MORTGAGE OBLIGATIONS (Cost $48,668) | 38,466 | ||
| Commercial Mortgage Securities - 24.0% | |||
Principal Amount (f) | Value ($) | ||
| BANK sequential payer Series 2021-BN33 Class A5, 2.556% 5/15/64 | 14,931,000 | 12,773,926 | |
| Bank sequential payer Series 2021-BN36 Class A5, 2.47% 9/15/64 | 25,000,000 | 21,099,068 | |
| BANK: | |||
| sequential payer: | |||
Series 2022-BNK39 Class A4, 2.928% 2/15/55 | 13,750,000 | 12,020,518 | |
Series 2022-BNK42 Class D, 2.5% 6/15/55 (g) | 2,000,000 | 1,146,914 | |
Series 2022-BNK42, Class A5, 4.493% 6/15/55 (d) | 20,000,000 | 19,759,460 | |
Series 2022-BNK43 Class A5, 4.399% 8/15/55 | 10,485,000 | 10,269,706 | |
Series 2022-BNK44, Class A5, 5.7462% 11/15/55 | 10,000,000 | 10,821,301 | |
| Series 2017-BNK8 Class E, 2.8% 11/15/50 (g) | 11,374,393 | 6,453,207 | |
| Series 2018-BN12 Class D, 3% 5/15/61 (g) | 1,682,000 | 1,124,652 | |
| Series 2020-BN30 Class MCDG, 2.9182% 12/15/53 (d) | 2,000,000 | 1,174,947 | |
| Series 2021-BN38 Class C, 3.2171% 12/15/64 (d) | 3,505,000 | 2,535,100 | |
| Series 2022-BNK41, Class C, 3.79% 4/15/65 (d) | 4,433,000 | 3,338,486 | |
| Series 2022-BNK42 Class C, 4.7217% 6/15/55 (d) | 6,500,000 | 5,384,504 | |
| Series 2022-BNK43 Class D, 3% 8/15/55 (g) | 5,344,000 | 3,147,393 | |
| Bank of America Commercial Mortgage Trust Series 2016-UB10 Class C, 4.8383% 7/15/49 (d) | 3,030,000 | 2,763,748 | |
| Barclays Commercial Mortgage Securities sequential payer Series 2021-C12 Class A5, 2.689% 11/15/54 | 25,000,000 | 21,424,388 | |
| BBCMS Series 2022-C15 Class C, 3.8309% 4/15/55 (d) | 3,094,000 | 2,338,681 | |
| BBCMS Mortgage Trust: | |||
| sequential payer Series 2022-C17: | |||
Class C, 5.45% 9/15/55 | 2,000,000 | 1,708,372 | |
Class D, 2.5% 9/15/55 (g) | 2,000,000 | 1,128,823 | |
| Series 2019-C3 Class C, 4.178% 5/15/52 | 6,775,000 | 5,619,386 | |
| Series 2020-C6 Class C, 3.045% 2/15/53 | 1,129,000 | 847,643 | |
| Series 2020-C7 Class C, 3.6034% 4/15/53 (d) | 2,067,000 | 1,619,092 | |
| Series 2022-C16 Class C, 4.6% 6/15/55 (d) | 5,250,000 | 4,188,641 | |
| Benchmark Mortgage Trust: | |||
| sequential payer: | |||
Series 2019-B13 Class A4, 2.952% 8/15/57 | 19,715,000 | 17,679,949 | |
Series 2019-B14: | |||
| Class 225D, 3.2943% 12/15/62 (d)(g)(i) | 3,427,000 | 2,858,402 | |
| Class 225E, 3.2943% 12/15/62 (d)(g)(i) | 5,141,000 | 3,478,893 | |
Series 2021-B28 Class A5, 2.2237% 8/15/54 | 10,000,000 | 8,274,141 | |
Series 2021-B29, Class A5, 2.3879% 9/15/54 | 15,000,000 | 12,575,060 | |
Series 2022-B34 Class A5, 3.786% 4/15/55 | 22,168,402 | 20,615,592 | |
Series 2022-B35 Class A5, 4.4452% 5/15/55 (d) | 27,302,000 | 26,930,294 | |
| Series 2019-B13 Class D, 2.5% 8/15/57 (g) | 1,000,000 | 614,347 | |
| Series 2020-B18 Class AGNG, 4.3885% 7/15/53 (d)(g) | 11,379,000 | 9,604,434 | |
| Series 2022-B32 Class A5, 3.0019% 1/15/55 | 26,618,000 | 23,183,471 | |
| Series 2022-B35: | |||
Class C, 4.4452% 5/15/55 (d) | 9,500,000 | 7,662,954 | |
Class D, 2.5% 5/15/55 (g) | 3,500,000 | 1,978,632 | |
| Series 2022-B36: | |||
Class C, 5.1189% 7/15/55 (d) | 2,000,000 | 1,714,069 | |
Class D, 2.5% 7/15/55 (g) | 3,828,000 | 2,062,103 | |
| Bx 2021-Xl2 floater Series 2021-XL2 Class J, 1 month U.S. LIBOR + 3.890% 8.349% 10/15/38 (d)(e)(g) | 7,254,325 | 6,766,293 | |
| BX Commercial Mortgage Trust: | |||
| floater: | |||
Series 2021-CIP Class F, 1 month U.S. LIBOR + 3.210% 7.678% 12/15/38 (d)(e)(g) | 7,790,000 | 7,205,161 | |
Series 2021-PAC Class G, 1 month U.S. LIBOR + 2.940% 7.4061% 10/15/36 (d)(e)(g) | 17,232,000 | 16,170,974 | |
Series 2021-VINO Class G, 1 month U.S. LIBOR + 3.950% 8.4113% 5/15/38 (d)(e)(g) | 20,979,000 | 19,601,403 | |
| Series 2020-VIVA Class E, 3.5488% 3/11/44 (d)(g) | 20,898,990 | 16,092,258 | |
| Bx Commercial Mortgage Trust 2 floater Series 2022-LP2 Class G, CME Term SOFR 1 Month Index + 4.100% 8.5838% 2/15/39 (d)(e)(g) | 5,106,145 | 4,805,020 | |
| BX Trust: | |||
| floater: | |||
Series 2019-IMC Class G, 1 month U.S. LIBOR + 3.600% 8.059% 4/15/34 (d)(e)(g) | 5,181,000 | 4,841,147 | |
Series 2019-XL: | |||
| Class G, CME Term SOFR 1 Month Index + 2.410% 6.8925% 10/15/36 (d)(e)(g) | 13,391,750 | 13,030,814 | |
| Class J, CME Term SOFR 1 Month Index + 2.760% 7.2425% 10/15/36 (d)(e)(g) | 15,217,550 | 14,720,790 | |
Series 2021-21M Class H, 1 month U.S. LIBOR + 4.010% 8.469% 10/15/36 (d)(e)(g) | 2,172,454 | 1,998,290 | |
Series 2021-ACNT Class G, 1 month U.S. LIBOR + 3.290% 7.755% 11/15/38 (d)(e)(g) | 20,581,000 | 19,487,517 | |
Series 2021-BXMF Class G, 1 month U.S. LIBOR + 3.340% 7.8085% 10/15/26 (d)(e)(g) | 23,874,000 | 21,894,635 | |
Series 2021-SOAR Class J, 8.21% 6/15/38 (d)(g) | 18,862,116 | 17,741,966 | |
Series 2021-VOLT Class G, 1 month U.S. LIBOR + 2.850% 7.309% 9/15/36 (d)(e)(g) | 5,000,000 | 4,741,542 | |
Series 2022-LBA6: | |||
| Class F, CME Term SOFR 1 Month Index + 3.350% 7.828% 1/15/39 (d)(e)(g) | 6,200,000 | 5,745,667 | |
| Class G, CME Term SOFR 1 Month Index + 4.200% 8.678% 1/15/39 (d)(e)(g) | 11,340,000 | 10,592,742 | |
Series 2022-VAMF Class F, CME Term SOFR 1 Month Index + 3.290% 7.777% 1/15/39 (d)(e)(g) | 4,367,000 | 4,071,760 | |
| floater sequential payer Series 2021-LGCY Class J, 1 month U.S. LIBOR + 3.190% 7.652% 10/15/36 (d)(e)(g) | 19,151,000 | 17,238,196 | |
| Series 2019-OC11 Class E, 3.944% 12/9/41 (d)(g) | 22,521,000 | 18,103,884 | |
| BXP Trust Series 2021-601L Class E, 2.7755% 1/15/44 (d)(g) | 5,754,000 | 3,245,064 | |
| CAMB Commercial Mortgage Trust floater Series 2019-LIFE Class G, 1 month U.S. LIBOR + 3.250% 7.709% 12/15/37 (d)(e)(g) | 14,973,000 | 14,030,411 | |
| CD Mortgage Trust Series 2017-CD3 Class D, 3.25% 2/10/50 (g) | 3,353,000 | 2,226,397 | |
| Citigroup Commercial Mortgage Trust: | |||
| sequential payer Series 2019-C7 Class A4, 3.102% 12/15/72 | 14,820,000 | 13,283,702 | |
| Series 2016-C3 Class D, 3% 11/15/49 (g) | 7,010,000 | 4,396,784 | |
| Series 2022-GC48: | |||
Class D, 2.5% 6/15/55 (g) | 4,000,000 | 2,251,961 | |
Class E, 2.5% 6/15/55 (g) | 2,000,000 | 1,017,693 | |
| COMM Mortgage Trust: | |||
| floater Series 2018-HCLV: | |||
Class F, 1 month U.S. LIBOR + 3.150% 7.609% 9/15/33 (d)(e)(g) | 4,265,000 | 3,345,422 | |
Class G, 1 month U.S. LIBOR + 5.150% 9.6153% 9/15/33 (d)(e)(g) | 4,265,000 | 3,259,597 | |
| sequential payer Series 2013-LC6 Class E, 3.5% 1/10/46 (g) | 4,741,000 | 4,061,243 | |
| Series 2012-CR1: | |||
Class D, 5.3527% 5/15/45 (d)(g) | 5,550,000 | 4,063,457 | |
Class G, 2.462% 5/15/45 (g)(i) | 6,346,000 | 1,815,566 | |
| Series 2014-UBS2 Class D, 4.9814% 3/10/47 (d)(g) | 3,713,000 | 3,314,349 | |
| Series 2017-CD4 Class D, 3.3% 5/10/50 (g) | 2,769,000 | 2,054,520 | |
| Series 2019-CD4 Class C, 4.3497% 5/10/50 (d) | 3,000,000 | 2,458,110 | |
| COMM Trust Series 2017-COR2 Class D, 3% 9/10/50 (g) | 2,769,000 | 2,021,218 | |
| Commercial Mortgage Trust pass-thru certificates Series 2012-CR2: | |||
| Class D, 4.871% 8/15/45 (d)(g) | 1,804,916 | 1,665,157 | |
| Class E, 4.871% 8/15/45 (d)(g) | 8,000,000 | 6,632,354 | |
| Class F, 4.25% 8/15/45 (g) | 2,000,000 | 1,418,128 | |
| Credit Suisse Commercial Mortgage Trust floater Series 2021-SOP2 Class F, 1 month U.S. LIBOR + 4.210% 8.6759% 6/15/34 (e)(g) | 7,120,000 | 6,398,920 | |
| Credit Suisse Mortgage Trust: | |||
| floater: | |||
Series 2021-4SZN Class A, CME Term SOFR 1 Month Index + 3.960% 8.4455% 11/15/23 (d)(e)(g) | 906,000 | 877,332 | |
Series 2021-BPNY Class A, 1 month U.S. LIBOR + 3.710% 8.1744% 8/15/23 (d)(e)(g) | 18,000,000 | 17,385,615 | |
| Series 2020-NET: | |||
Class E, 3.7042% 8/15/37 (d)(g) | 9,400,000 | 8,135,841 | |
Class F, 3.7042% 8/15/37 (d)(g) | 7,050,000 | 5,994,718 | |
| Series 2021-BRIT Class A, CME Term SOFR 1 Month Index + 3.570% 8.0517% 5/15/23 (d)(e)(g) | 9,280,000 | 8,745,088 | |
| CSAIL Commercial Mortgage Trust: | |||
| sequential payer Series 2019-C15 Class A4, 4.0529% 3/15/52 | 9,425,000 | 8,948,741 | |
| Series 2017-C8 Class D, 4.4378% 6/15/50 (d)(g) | 4,297,000 | 3,142,035 | |
| DBUBS Mortgage Trust Series 2011-LC3A Class D, 5.3553% 8/10/44 (d)(g)(i) | 2,924,187 | 2,741,179 | |
| ELP Commercial Mortgage Trust floater Series 2021-ELP Class J, 1 month U.S. LIBOR + 3.610% 8.0749% 11/15/38 (d)(e)(g) | 15,448,000 | 14,490,433 | |
| GS Mortgage Securities Corp. Trust floater Series 2019-70P Class E, 1 month U.S. LIBOR + 2.200% 6.659% 10/15/36 (d)(e)(g) | 7,437,000 | 6,727,474 | |
| GS Mortgage Securities Trust: | |||
| floater Series 2018-RIVR Class G, 1 month U.S. LIBOR + 2.600% 7.059% 7/15/35 (d)(e)(g)(i) | 3,808,000 | 2,526,935 | |
| sequential payer: | |||
Series 2019-GSA1 Class A4, 3.0479% 11/10/52 | 25,860,000 | 23,194,426 | |
Series 2021-GSA3 Class A5, 2.6183% 12/15/54 | 12,657,000 | 10,647,981 | |
| Series 2011-GC5: | |||
Class C, 5.1538% 8/10/44 (d)(g) | 8,899,000 | 6,455,362 | |
Class D, 5.1538% 8/10/44 (d)(g) | 2,733,635 | 1,135,075 | |
Class E, 5.1538% 8/10/44 (d)(g)(i) | 8,138,000 | 734,219 | |
Class F, 4.5% 8/10/44 (g)(i) | 7,897,000 | 27,699 | |
| Series 2012-GCJ9: | |||
Class D, 4.8029% 11/10/45 (d)(g) | 4,870,833 | 4,506,008 | |
Class E, 4.8029% 11/10/45 (d)(g) | 1,908,000 | 1,640,828 | |
| Series 2013-GC16: | |||
Class D, 5.3111% 11/10/46 (d)(g) | 3,708,000 | 3,498,311 | |
Class F, 3.5% 11/10/46 (g) | 7,221,000 | 6,577,404 | |
| Series 2021-RENT Class G, 1 month U.S. LIBOR + 5.700% 10.2084% 11/21/35 (d)(e)(g)(i) | 6,938,114 | 5,810,524 | |
| Hilton U.S.A. Trust Series 2016-HHV Class F, 4.1935% 11/5/38 (d)(g) | 20,270,000 | 17,556,108 | |
| IMT Trust Series 2017-APTS Class EFX, 3.4966% 6/15/34 (d)(g) | 9,213,000 | 8,531,712 | |
| Independence Plaza Trust Series 2018-INDP Class E, 4.996% 7/10/35 (g) | 2,896,000 | 2,723,028 | |
| Intown Mortgage Trust floater Series 2022-STAY Class E, CME Term SOFR 1 Month Index + 5.030% 9.5094% 8/15/39 (d)(e)(g) | 2,000,000 | 1,978,110 | |
| JPMBB Commercial Mortgage Securities Trust: | |||
| Series 2014-C23 Class UH5, 4.7094% 9/15/47 (g) | 8,640,000 | 6,336,108 | |
| Series 2014-C26 Class D, 3.8743% 1/15/48 (d)(g) | 3,398,000 | 2,758,297 | |
| JPMDB Commercial Mortgage Securities Trust: | |||
| sequential payer Series 2019-COR6 Class A4, 3.0565% 11/13/52 | 13,000,000 | 11,342,010 | |
| Series 2018-C8 Class D, 3.3107% 6/15/51 (d)(g) | 1,698,000 | 1,159,352 | |
| JPMorgan Chase Commercial Mortgage Securities Trust: | |||
| sequential payer Series 2021-1MEM Class E, 2.6535% 10/9/42 (d)(g) | 9,552,000 | 6,043,653 | |
| Series 2011-C3: | |||
Class E, 5.5251% 2/15/46 (d)(g)(i) | 13,774,000 | 6,033,548 | |
Class G, 4.409% 2/15/46 (d)(g) | 4,671,000 | 398,270 | |
Class H, 4.409% 2/15/46 (d)(g)(i) | 7,077,000 | 618,398 | |
| Series 2012-CBX: | |||
Class E, 4.6896% 6/15/45 (d)(g)(i) | 4,953,910 | 4,118,749 | |
Class F, 4% 6/15/45 (g)(i) | 8,192,000 | 2,927,362 | |
Class G 4% 6/15/45 (g) | 4,044,000 | 938,958 | |
| Series 2013-LC11: | |||
Class D, 4.2611% 4/15/46 (d)(i) | 7,722,000 | 6,472,134 | |
Class E, 3.25% 4/15/46 (d)(g) | 472,000 | 221,795 | |
Class F, 3.25% 4/15/46 (d)(g)(i) | 2,518,000 | 348,995 | |
| Series 2014-DSTY Class E, 3.8046% 6/10/27 (d)(g)(i) | 8,161,000 | 20,120 | |
| Series 2018-AON Class F, 4.6132% 7/5/31 (d)(g) | 5,039,000 | 3,560,820 | |
| Series 2020-NNN Class FFX, 4.6254% 1/16/37 (g) | 2,000,000 | 1,653,578 | |
| KNDR Trust floater Series 2021-KIND Class F, 1 month U.S. LIBOR + 3.950% 8.409% 8/15/38 (d)(e)(g) | 7,103,659 | 6,380,613 | |
| MED Trust floater Series 2021-MDLN Class G, 1 month U.S. LIBOR + 5.250% 9.71% 11/15/38 (d)(e)(g) | 18,206,910 | 16,936,610 | |
| Merit floater Series 2021-STOR Class J, 1 month U.S. LIBOR + 3.950% 8.409% 7/15/38 (d)(e)(g) | 3,476,000 | 3,307,338 | |
| MHC Commercial Mortgage Trust floater Series 2021-MHC Class G, 1 month U.S. LIBOR + 3.200% 7.66% 4/15/38 (d)(e)(g) | 20,601,000 | 19,724,757 | |
| MHP Commercial Mortgage Trust floater Series 2022-MHIL: | |||
| Class F, CME Term SOFR 1 Month Index + 3.250% 7.7372% 1/15/27 (d)(e)(g) | 4,182,990 | 3,942,083 | |
| Class G, CME Term SOFR 1 Month Index + 3.950% 8.4355% 1/15/27 (d)(e)(g) | 18,873,495 | 17,616,723 | |
| Morgan Stanley BAML Trust: | |||
| Series 2012-C6 Class D, 4.5398% 11/15/45 (d)(g) | 2,000,000 | 1,760,549 | |
| Series 2012-C6, Class F, 4.5398% 11/15/45 (d)(g) | 2,500,000 | 1,937,712 | |
| Series 2013-C12 Class D, 4.7613% 10/15/46 (d)(g) | 7,164,000 | 6,379,659 | |
| Series 2013-C13: | |||
Class D, 4.8952% 11/15/46 (d)(g) | 6,218,000 | 5,748,752 | |
Class E, 4.8952% 11/15/46 (d)(g) | 3,341,000 | 2,914,476 | |
| Series 2013-C9: | |||
Class C, 4.014% 5/15/46 (d) | 3,302,000 | 2,975,291 | |
Class D, 4.102% 5/15/46 (d)(g) | 5,137,000 | 4,472,572 | |
| Series 2016-C30 Class D, 3% 9/15/49 (g) | 2,726,000 | 1,772,206 | |
| Morgan Stanley Capital I Trust: | |||
| Series 1998-CF1 Class G, 7.35% 7/15/32 (d)(g) | 14,270 | 14,147 | |
| Series 2011-C2: | |||
Class D, 5.2113% 6/15/44 (d)(g) | 3,403,110 | 3,205,968 | |
Class F, 5.2113% 6/15/44 (d)(g)(i) | 4,440,000 | 2,848,271 | |
Class XB, 0.445% 6/15/44 (d)(g)(j) | 28,858,802 | 105,482 | |
| Series 2011-C3: | |||
Class D, 5.0825% 7/15/49 (d)(g) | 7,317,000 | 7,091,301 | |
Class E, 5.0825% 7/15/49 (d)(g)(i) | 3,456,000 | 2,979,798 | |
Class F, 5.0825% 7/15/49 (d)(g)(i) | 5,624,050 | 3,582,955 | |
Class G, 5.0825% 7/15/49 (d)(g)(i) | 5,049,500 | 2,816,697 | |
| Series 2015-MS1 Class D, 4.024% 5/15/48 (d)(g) | 10,833,000 | 8,953,948 | |
| Series 2016-BNK2 Class C, 3% 11/15/49 (g)(i) | 2,966,000 | 2,195,071 | |
| Series 2017-H1: | |||
Class C, 4.281% 6/15/50 | 2,470,594 | 2,153,280 | |
Class D, 2.546% 6/15/50 (g) | 5,000,000 | 3,528,079 | |
| Series 2018-H4 Class A4, 4.31% 12/15/51 | 14,240,929 | 13,860,142 | |
| Series 2020-L4, Class C, 3.536% 2/15/53 | 2,765,000 | 2,137,093 | |
| MSC sequential payer Series 2021-L7 Class A5, 2.574% 10/15/54 | 10,055,000 | 8,403,015 | |
| MSJP Commercial Securities Mortgage Trust Series 2015-HAUL Class E, 4.851% 9/5/47 (d)(g) | 1,500,000 | 1,039,524 | |
| Natixis Commercial Mortgage Securities Trust: | |||
| floater Series 2018-FL1 Class WAN2, 1 month U.S. LIBOR + 3.750% 8.209% 6/15/35 (d)(e)(g) | 651,000 | 498,134 | |
| Series 2020-2PAC Class AMZ3, 3.5% 1/15/37 (d)(g) | 2,502,675 | 2,124,273 | |
| OPG Trust floater Series 2021-PORT: | |||
| Class G, 1 month U.S. LIBOR + 2.390% 6.857% 10/15/36 (d)(e)(g) | 4,776,372 | 4,501,406 | |
| Class J, 1 month U.S. LIBOR + 3.340% 7.805% 10/15/36 (d)(e)(g) | 8,554,840 | 7,946,935 | |
| PKHL Commercial Mortgage Trust floater Series 2021-MF: | |||
| Class E, 1 month U.S. LIBOR + 2.600% 7.06% 7/15/38 (d)(e)(g) | 500,000 | 460,841 | |
| Class G, 1 month U.S. LIBOR + 4.350% 8.81% 7/15/38 (d)(e)(g) | 5,944,000 | 5,407,687 | |
| Prima Capital CRE Securitization Ltd. Series 2020-8A Class C, 3% 12/1/70 (g) | 9,277,000 | 7,009,568 | |
| Prima Capital Ltd. floater Series 2021-9A Class C, 1 month U.S. LIBOR + 2.350% 6.8357% 12/15/37 (d)(e)(g) | 5,000,000 | 4,672,730 | |
| Providence Place Group Ltd. Partnership Series 2000-C1 Class A2, 7.75% 7/20/28 (g) | 2,961,734 | 3,068,579 | |
| ReadyCap Commercial Mortgage Trust floater Series 2019-FL3 Class D, 1 month U.S. LIBOR + 2.900% 7.4059% 3/25/34 (d)(e)(g) | 3,401,000 | 3,340,882 | |
| SG Commercial Mortgage Securities Trust Series 2020-COVE Class F, 3.7276% 3/15/37 (d)(g) | 5,000,000 | 4,370,250 | |
| SLG Office Trust: | |||
| sequential payer Series 2021-OVA Class A, 2.5854% 7/15/41 (g) | 13,377,000 | 11,156,434 | |
| Series 2021-OVA Class G, 2.8506% 7/15/41 (g) | 5,000,000 | 3,195,622 | |
| SMRT Commercial Mortgage Trust floater Series 2022-MINI Class F, CME Term SOFR 1 Month Index + 3.350% 7.829% 1/15/39 (d)(e)(g) | 19,615,000 | 18,165,283 | |
| SREIT Trust floater: | |||
| Series 2021-IND Class G, 1 month U.S. LIBOR + 3.260% 7.7248% 10/15/38 (d)(e)(g) | 12,754,000 | 11,704,844 | |
| Series 2021-MFP Class G, 1 month U.S. LIBOR + 2.970% 7.4328% 11/15/38 (d)(e)(g) | 3,874,000 | 3,628,217 | |
| Series 2021-MFP2 Class J, 1 month U.S. LIBOR + 3.910% 8.3745% 11/15/36 (d)(e)(g) | 10,872,000 | 10,186,963 | |
| STWD Trust floater sequential payer Series 2021-LIH: | |||
| Class E, 1 month U.S. LIBOR + 2.900% 7.362% 11/15/36 (d)(e)(g) | 4,985,000 | 4,673,404 | |
| Class F, 1 month U.S. LIBOR + 3.550% 8.01% 11/15/36 (d)(e)(g) | 15,282,000 | 14,315,247 | |
| Class G, 1 month U.S. LIBOR + 4.200% 8.659% 11/15/36 (d)(e)(g) | 9,177,000 | 8,555,661 | |
| SUMIT Mortgage Trust Series 2022-BVUE: | |||
| Class D, 2.8925% 2/12/41 (d)(g) | 6,000,000 | 4,306,920 | |
| Class F, 2.8925% 2/12/41 (d)(g) | 3,211,000 | 2,039,791 | |
| TPGI Trust floater Series 2021-DGWD Class G, 1 month U.S. LIBOR + 3.850% 8.31% 6/15/26 (d)(e)(g) | 7,308,000 | 6,927,581 | |
| UBS Commercial Mortgage Trust Series 2012-C1: | |||
| Class D, 6.6333% 5/10/45 (d)(g) | 321,258 | 292,011 | |
| Class E, 5% 5/10/45 (d)(g)(i) | 6,268,000 | 2,443,266 | |
| Class F, 5% 5/10/45 (d)(g)(i) | 2,221,350 | 106,242 | |
| UBS-BAMLL Trust Series 12-WRM Class D, 4.238% 6/10/30 (d)(g)(i) | 2,143,000 | 1,934,813 | |
| VASA Trust: | |||
| floater Series 2021-VASA Class G, 1 month U.S. LIBOR + 5.000% 9.459% 7/15/39 (d)(e)(g) | 800,000 | 712,607 | |
| floater sequential payer Series 2021-VASA Class F, 1 month U.S. LIBOR + 3.900% 8.359% 7/15/39 (d)(e)(g) | 6,685,000 | 6,009,851 | |
| VMC Finance Ltd. floater Series 2021-HT1 Class B, 1 month U.S. LIBOR + 4.500% 8.97% 1/18/37 (d)(e)(g) | 18,580,000 | 17,505,686 | |
| Wells Fargo Commercial Mortgage Trust: | |||
| Series 2016-BNK1 Class D, 3% 8/15/49 (g) | 6,979,000 | 4,203,473 | |
| Series 2016-NXS6 Class D, 3.059% 11/15/49 (g) | 5,037,000 | 3,789,516 | |
| Series 2019-C52 Class C, 3.561% 8/15/52 | 883,000 | 681,141 | |
| WF-RBS Commercial Mortgage Trust: | |||
| sequential payer Series 2011-C4I Class G, 5% 6/15/44 (d)(i) | 3,955,000 | 251,488 | |
| Series 2011-C3: | |||
Class D, 5.3781% 3/15/44 (d)(g) | 1,537,072 | 576,402 | |
Class E, 5% 3/15/44 (g)(i) | 2,966,000 | 14,726 | |
| Series 2011-C5: | |||
Class E, 5.5718% 11/15/44 (d)(g) | 2,061,452 | 1,955,100 | |
Class F, 5.25% 11/15/44 (d)(g) | 3,500,000 | 3,178,795 | |
Class G, 5.25% 11/15/44 (d)(g) | 2,000,000 | 1,735,640 | |
| Series 2013-C11 Class E, 4.2033% 3/15/45 (d)(g) | 4,727,000 | 3,828,856 | |
| Series 2013-C13 Class D, 4.2111% 5/15/45 (d)(g) | 3,955,000 | 3,859,085 | |
| WP Glimcher Mall Trust Series 2015-WPG: | |||
| Class PR1, 3.516% 6/5/35 (d)(g) | 6,725,000 | 5,454,043 | |
| Class PR2, 3.516% 6/5/35 (d)(g) | 2,541,000 | 1,938,534 | |
| TOTAL COMMERCIAL MORTGAGE SECURITIES (Cost $1,353,081,986) | 1,192,927,381 | ||
| Bank Loan Obligations - 1.8% | |||
Principal Amount (f) | Value ($) | ||
| CONSUMER DISCRETIONARY - 0.2% | |||
| Hotels, Restaurants & Leisure - 0.2% | |||
| BRE/Everbright M6 Borrower LLC Tranche B 1LN, term loan 1 month U.S. LIBOR + 5.000% 9.4299% 9/9/26 (d)(e)(k) | 8,341,200 | 8,271,718 | |
| FINANCIALS - 1.5% | |||
| Diversified Financial Services - 1.5% | |||
| Agellan Portfolio 9% 8/7/25 (i)(k) | 6,611,000 | 6,611,000 | |
| Mhp 2022-Mhil Mezz U.S. Secured Overnight Fin. Rate (SOFR) Index + 5.000% 9.478% 1/9/24 (d)(e)(i)(k) | 24,679,910 | 23,445,915 | |
| Sunbelt Mezz U.S. Secured Overnight Fin. Rate (SOFR) Index + 4.450% 8.8986% 1/21/27 (d)(e)(i)(k) | 18,837,337 | 18,837,337 | |
| Veritas Multifamily Portfolio 1 month U.S. LIBOR + 8.500% 12.8179% 11/15/23 (d)(e)(i)(k) | 29,336,049 | 26,695,805 | |
| 75,590,057 | |||
| REAL ESTATE - 0.1% | |||
| Real Estate Management & Development - 0.1% | |||
| DTZ U.S. Borrower LLC Tranche B 1LN, term loan 1 month U.S. LIBOR + 2.750% 7.1336% 8/21/25 (d)(e)(k) | 4,974,425 | 4,949,552 | |
| TOTAL BANK LOAN OBLIGATIONS (Cost $92,595,120) | 88,811,327 | ||
| Preferred Securities - 0.1% | |||
Principal Amount (f) | Value ($) | ||
| ENERGY - 0.1% | |||
| Oil, Gas & Consumable Fuels - 0.1% | |||
| Energy Transfer LP 7.125% (d)(l) | 6,000,000 | 5,573,113 | |
| FINANCIALS - 0.0% | |||
| Diversified Financial Services - 0.0% | |||
| Crest Dartmouth Street 2003-1 Ltd. Series 2003-1A Class PS, 6/28/38 (g)(i) | 1,220,000 | 12 | |
| Thrifts & Mortgage Finance - 0.0% | |||
| Crest Clarendon Street 2002-1 Ltd. Series 2002-1A Class PS, 12/28/35 (g)(i) | 500,000 | 0 | |
TOTAL FINANCIALS | 12 | ||
| TOTAL PREFERRED SECURITIES (Cost $7,297,768) | 5,573,125 | ||
| Money Market Funds - 8.8% | |||
| Shares | Value ($) | ||
| Fidelity Cash Central Fund 4.38% (m) | 437,328,412 | 437,415,878 | |
| Fidelity Securities Lending Cash Central Fund 4.38% (m)(n) | 680,807 | 680,875 | |
| TOTAL MONEY MARKET FUNDS (Cost $438,049,734) | 438,096,753 | ||
| TOTAL INVESTMENT IN SECURITIES - 99.4% (Cost $4,951,859,587) | 4,946,689,876 |
NET OTHER ASSETS (LIABILITIES) - 0.6% | 30,452,861 |
| NET ASSETS - 100.0% | 4,977,142,737 |
| (a) | Non-income producing |
| (b) | Affiliated company |
| (c) | Security or a portion of the security is on loan at period end. |
| (d) | Coupon rates for floating and adjustable rate securities reflect the rates in effect at period end. |
| (e) | Coupon is indexed to a floating interest rate which may be multiplied by a specified factor and/or subject to caps or floors. |
| (f) | Amount is stated in United States dollars unless otherwise noted. |
| (g) | Security exempt from registration under Rule 144A of the Securities Act of 1933. These securities may be resold in transactions exempt from registration, normally to qualified institutional buyers. At the end of the period, the value of these securities amounted to $1,296,629,433 or 26.1% of net assets. |
| (h) | Non-income producing - Security is in default. |
| (i) | Level 3 security |
| (j) | Interest Only (IO) security represents the right to receive only monthly interest payments on an underlying pool of mortgages or assets. Principal shown is the outstanding par amount of the pool as of the end of the period. |
| (k) | Remaining maturities of bank loan obligations may be less than the stated maturities shown as a result of contractual or optional prepayments by the borrower. Such prepayments cannot be predicted with certainty. |
| (l) | Security is perpetual in nature with no stated maturity date. |
| (m) | Affiliated fund that is generally available only to investment companies and other accounts managed by Fidelity Investments. The rate quoted is the annualized seven-day yield of the fund at period end. A complete unaudited listing of the fund's holdings as of its most recent quarter end is available upon request. In addition, each Fidelity Central Fund's financial statements are available on the SEC's website or upon request. |
| (n) | Investment made with cash collateral received from securities on loan. |
| Affiliate | Value, beginning of period ($) | Purchases ($) | Sales Proceeds ($) | Dividend Income ($) | Realized Gain (loss) ($) | Change in Unrealized appreciation (depreciation) ($) | Value, end of period ($) | % ownership, end of period |
| Fidelity Cash Central Fund 4.38% | 750,712,446 | 582,977,203 | 896,273,771 | 8,747,195 | - | - | 437,415,878 | 0.9% |
| Fidelity Securities Lending Cash Central Fund 4.38% | - | 18,212,485 | 17,531,610 | 279 | - | - | 680,875 | 0.0% |
| Total | 750,712,446 | 601,189,688 | 913,805,381 | 8,747,474 | - | - | 438,096,753 | |
| Affiliate | Value, beginning of period ($) | Purchases ($) | Sales Proceeds ($) | Dividend Income ($) | Realized Gain (loss) ($) | Change in Unrealized appreciation (depreciation) ($) | Value, end of period ($) |
| Great Ajax Corp. | 18,330,271 | - | - | 700,862 | 197,355 | (3,742,569) | 14,587,702 |
| Great Ajax Corp. 7.25% | 15,139,304 | - | - | 554,119 | - | (152,861) | 14,986,443 |
| Total | 33,469,575 | - | - | 1,254,981 | 197,355 | (3,895,430) | 29,574,145 |
| Valuation Inputs at Reporting Date: | ||||
| Description | Total ($) | Level 1 ($) | Level 2 ($) | Level 3 ($) |
Investments in Securities: | ||||
| Equities: | ||||
Energy | 46,722,780 | 46,722,780 | - | - |
Financials | 513,648,008 | 498,661,565 | 14,986,443 | - |
Industrials | 18,468,106 | 18,468,106 | - | - |
Information Technology | 2,385,054 | 2,385,054 | - | - |
Real Estate | 1,684,647,338 | 1,662,818,465 | 21,828,873 | - |
| Corporate Bonds | 882,231,104 | - | 882,231,100 | 4 |
| Asset-Backed Securities | 73,140,434 | - | 73,140,389 | 45 |
| Collateralized Mortgage Obligations | 38,466 | - | 30,438 | 8,028 |
| Commercial Mortgage Securities | 1,192,927,381 | - | 1,133,221,331 | 59,706,050 |
| Bank Loan Obligations | 88,811,327 | - | 13,221,270 | 75,590,057 |
| Preferred Securities | 5,573,125 | - | 5,573,113 | 12 |
| Money Market Funds | 438,096,753 | 438,096,753 | - | - |
| Total Investments in Securities: | 4,946,689,876 | 2,667,152,723 | 2,144,232,957 | 135,304,196 |
| Investments in Securities: | |||
| Bank Loan Obligations | |||
| Beginning Balance | $ | 78,982,346 | |
| Net Realized Gain (Loss) on Investment Securities | 38 | ||
| Net Unrealized Gain (Loss) on Investment Securities | (2,674,657) | ||
| Cost of Purchases | - | ||
| Proceeds of Sales | (720,128) | ||
| Amortization/Accretion | 2,458 | ||
| Transfers into Level 3 | - | ||
| Transfers out of Level 3 | - | ||
| Ending Balance | $ | 75,590,057 | |
| The change in unrealized gain (loss) for the period attributable to Level 3 securities held at January 31, 2023 | $ | (2,674,657) | |
| Commercial Mortgage Securities | |||
| Beginning Balance | $ | 43,384,637 | |
| Net Realized Gain (Loss) on Investment Securities | (2,510,037) | ||
| Net Unrealized Gain (Loss) on Investment Securities | 2,902,996 | ||
| Cost of Purchases | - | ||
| Proceeds of Sales | (4,908,131) | ||
| Amortization/Accretion | (291,287) | ||
| Transfers into Level 3 | 40,180,968 | ||
| Transfers out of Level 3 | (19,053,096) | ||
| Ending Balance | $ | 59,706,050 | |
| The change in unrealized gain (loss) for the period attributable to Level 3 securities held at January 31, 2023 | $ | 586,301 | |
| Other Investments in Securities | |||
| Beginning Balance | $ | 45,124 | |
| Net Realized Gain (Loss) on Investment Securities | - | ||
| Net Unrealized Gain (Loss) on Investment Securities | (7,043) | ||
| Cost of Purchases | - | ||
| Proceeds of Sales | (1,530) | ||
| Amortization/Accretion | (280) | ||
| Transfers into Level 3 | 6,546 | ||
| Transfers out of Level 3 | (34,728) | ||
| Ending Balance | $ | 8,089 | |
| The change in unrealized gain (loss) for the period attributable to Level 3 securities held at January 31, 2023 | $ | (7,043) | |
| The information used in the above reconciliation represents fiscal year to date activity for any Investments in Securities identified as using Level 3 inputs at either the beginning or the end of the current fiscal period. Cost of purchases and proceeds of sales may include securities received and/or delivered through in-kind transactions. Transfers into Level 3 were attributable to a lack of observable market data resulting from decreases in market activity, decreases in liquidity, security restructurings or corporate actions. Transfers out of Level 3 were attributable to observable market data becoming available for those securities. Transfers in or out of Level 3 represent the beginning value of any Security or Instrument where a change in the pricing level occurred from the beginning to the end of the period. The cost of purchases and the proceeds of sales may include securities received or delivered through corporate actions or exchanges. Realized and unrealized gains (losses) disclosed in the reconciliation are included in Net Gain (Loss) on the Fund's Statement of Operations. | |||
| Statement of Assets and Liabilities | ||||
January 31, 2023 (Unaudited) | ||||
| Assets | ||||
| Investment in securities, at value (including securities loaned of $680,456) - See accompanying schedule: | ||||
Unaffiliated issuers (cost $4,477,771,236) | $ | 4,479,018,978 | ||
Fidelity Central Funds (cost $438,049,734) | 438,096,753 | |||
Other affiliated issuers (cost $36,038,617) | 29,574,145 | |||
| Total Investment in Securities (cost $4,951,859,587) | $ | 4,946,689,876 | ||
| Cash | 41,564 | |||
| Foreign currency held at value (cost $41) | 41 | |||
| Receivable for investments sold | 41,458 | |||
| Receivable for fund shares sold | 12,728,858 | |||
| Dividends receivable | 3,037,507 | |||
| Interest receivable | 20,970,001 | |||
| Distributions receivable from Fidelity Central Funds | 1,532,917 | |||
| Prepaid expenses | 5,635 | |||
Total assets | 4,985,047,857 | |||
| Liabilities | ||||
| Payable for investments purchased | $ | 243,335 | ||
| Payable for fund shares redeemed | 4,002,638 | |||
| Accrued management fee | 2,134,606 | |||
| Transfer agent fee payable | 547,947 | |||
| Distribution and service plan fees payable | 134,212 | |||
| Other affiliated payables | 107,562 | |||
| Other payables and accrued expenses | 53,945 | |||
| Collateral on securities loaned | 680,875 | |||
| Total Liabilities | 7,905,120 | |||
| Net Assets | $ | 4,977,142,737 | ||
| Net Assets consist of: | ||||
| Paid in capital | $ | 5,041,510,053 | ||
| Total accumulated earnings (loss) | (64,367,316) | |||
| Net Assets | $ | 4,977,142,737 | ||
| Net Asset Value and Maximum Offering Price | ||||
| Class A : | ||||
Net Asset Value and redemption price per share ($322,252,996 ÷ 27,428,966 shares) (a) | $ | 11.75 | ||
| Maximum offering price per share (100/96.00 of $11.75) | $ | 12.24 | ||
| Class M : | ||||
Net Asset Value and redemption price per share ($46,004,029 ÷ 3,914,229 shares) (a) | $ | 11.75 | ||
| Maximum offering price per share (100/96.00 of $11.75) | $ | 12.24 | ||
| Class C : | ||||
Net Asset Value and offering price per share ($71,010,000 ÷ 6,149,714 shares) (a) | $ | 11.55 | ||
| Real Estate Income : | ||||
Net Asset Value , offering price and redemption price per share ($1,432,741,107 ÷ 121,040,684 shares) | $ | 11.84 | ||
| Class I : | ||||
Net Asset Value , offering price and redemption price per share ($1,622,014,991 ÷ 137,650,988 shares) | $ | 11.78 | ||
| Class Z : | ||||
Net Asset Value , offering price and redemption price per share ($1,483,119,614 ÷ 125,907,163 shares) | $ | 11.78 | ||
(a)Redemption price per share is equal to net asset value less any applicable contingent deferred sales charge. | ||||
| Statement of Operations | ||||
Six months ended January 31, 2023 (Unaudited) | ||||
| Investment Income | ||||
| Dividends (including $1,254,981 earned from affiliated issuers) | $ | 59,470,068 | ||
| Interest | 73,390,826 | |||
| Income from Fidelity Central Funds (including $279 from security lending) | 8,747,474 | |||
| Total Income | 141,608,368 | |||
| Expenses | ||||
| Management fee | $ | 13,532,509 | ||
| Transfer agent fees | 3,408,138 | |||
| Distribution and service plan fees | 857,074 | |||
| Accounting fees | 650,969 | |||
| Custodian fees and expenses | 15,039 | |||
| Independent trustees' fees and expenses | 9,264 | |||
| Registration fees | 84,995 | |||
| Audit | 51,998 | |||
| Legal | 4,158 | |||
| Miscellaneous | 39,536 | |||
| Total expenses before reductions | 18,653,680 | |||
| Expense reductions | (104,992) | |||
| Total expenses after reductions | 18,548,688 | |||
| Net Investment income (loss) | 123,059,680 | |||
| Realized and Unrealized Gain (Loss) | ||||
| Net realized gain (loss) on: | ||||
| Investment Securities: | ||||
| Unaffiliated issuers | (73,580,046) | |||
| Affiliated issuers | 197,355 | |||
| Foreign currency transactions | (3,825) | |||
| Total net realized gain (loss) | (73,386,516) | |||
| Change in net unrealized appreciation (depreciation) on: | ||||
| Investment Securities: | ||||
| Unaffiliated issuers | (171,516,228) | |||
| Affiliated issuers | (3,895,430) | |||
| Total change in net unrealized appreciation (depreciation) | (175,411,658) | |||
| Net gain (loss) | (248,798,174) | |||
| Net increase (decrease) in net assets resulting from operations | $ | (125,738,494) | ||
| Statement of Changes in Net Assets | ||||
Six months ended January 31, 2023 (Unaudited) | Year ended July 31, 2022 | |||
| Increase (Decrease) in Net Assets | ||||
| Operations | ||||
| Net investment income (loss) | $ | 123,059,680 | $ | 227,811,336 |
| Net realized gain (loss) | (73,386,516) | 117,976,313 | ||
| Change in net unrealized appreciation (depreciation) | (175,411,658) | (691,088,380) | ||
| Net increase (decrease) in net assets resulting from operations | (125,738,494) | (345,300,731) | ||
| Distributions to shareholders | (240,670,826) | (182,301,772) | ||
| Share transactions - net increase (decrease) | (615,604,918) | (582,517,493) | ||
| Total increase (decrease) in net assets | (982,014,238) | (1,110,119,996) | ||
| Net Assets | ||||
| Beginning of period | 5,959,156,975 | 7,069,276,971 | ||
| End of period | $ | 4,977,142,737 | $ | 5,959,156,975 |
| Fidelity Advisor® Real Estate Income Fund Class A |
Six months ended (Unaudited) January 31, 2023 | Years ended July 31, 2022 | 2021 | 2020 | 2019 | 2018 | |||||||
Selected Per-Share Data | ||||||||||||
| Net asset value, beginning of period | $ | 12.49 | $ | 13.43 | $ | 11.02 | $ | 12.43 | $ | 11.99 | $ | 12.32 |
| Income from Investment Operations | ||||||||||||
Net investment income (loss) A,B | .26 | .39 | .33 | .45 | .51 | .47 | ||||||
| Net realized and unrealized gain (loss) | (.48) | (1.03) | 2.53 | (1.25) | .65 | (.22) | ||||||
| Total from investment operations | (.22) | (.64) | 2.86 | (.80) | 1.16 | .25 | ||||||
| Distributions from net investment income | (.30) | (.28) | (.42) C | (.44) | (.51) | (.45) | ||||||
| Distributions from net realized gain | (.22) | (.02) | (.03) C | (.16) | (.21) | (.13) | ||||||
| Total distributions | (.52) | (.30) | (.45) | (.61) D | (.72) | (.58) | ||||||
Redemption fees added to paid in capital A | - | - | - | - | - | - E | ||||||
| Net asset value, end of period | $ | 11.75 | $ | 12.49 | $ | 13.43 | $ | 11.02 | $ | 12.43 | $ | 11.99 |
Total Return F,G,H | (1.68)% | (4.83)% | 26.64% | (6.88)% | 10.15% | 2.13% | ||||||
Ratios to Average Net Assets B,I,J | ||||||||||||
| Expenses before reductions | .99% K | .98% | .99% | 1.01% | 1.01% | 1.02% | ||||||
| Expenses net of fee waivers, if any | .98% K | .98% | .99% | 1.01% | 1.01% | 1.02% | ||||||
| Expenses net of all reductions | .98% K | .98% | .99% | 1.00% | 1.01% | 1.01% | ||||||
| Net investment income (loss) | 4.52% K | 2.97% | 2.75% | 3.85% | 4.29% | 3.98% | ||||||
| Supplemental Data | ||||||||||||
| Net assets, end of period (000 omitted) | $ | 322,253 | $ | 364,443 | $ | 384,382 | $ | 324,031 | $ | 325,296 | $ | 297,722 |
Portfolio turnover rate L | 17% K | 42% | 26% | 32% M | 17% | 27% |
| Fidelity Advisor® Real Estate Income Fund Class M |
Six months ended (Unaudited) January 31, 2023 | Years ended July 31, 2022 | 2021 | 2020 | 2019 | 2018 | |||||||
Selected Per-Share Data | ||||||||||||
| Net asset value, beginning of period | $ | 12.49 | $ | 13.43 | $ | 11.02 | $ | 12.43 | $ | 11.99 | $ | 12.32 |
| Income from Investment Operations | ||||||||||||
Net investment income (loss) A,B | .26 | .39 | .33 | .45 | .51 | .47 | ||||||
| Net realized and unrealized gain (loss) | (.48) | (1.03) | 2.53 | (1.26) | .65 | (.22) | ||||||
| Total from investment operations | (.22) | (.64) | 2.86 | (.81) | 1.16 | .25 | ||||||
| Distributions from net investment income | (.30) | (.28) | (.42) C | (.44) | (.51) | (.45) | ||||||
| Distributions from net realized gain | (.22) | (.02) | (.03) C | (.16) | (.21) | (.13) | ||||||
| Total distributions | (.52) | (.30) | (.45) | (.60) | (.72) | (.58) | ||||||
Redemption fees added to paid in capital A | - | - | - | - | - | - D | ||||||
| Net asset value, end of period | $ | 11.75 | $ | 12.49 | $ | 13.43 | $ | 11.02 | $ | 12.43 | $ | 11.99 |
Total Return E,F,G | (1.70)% | (4.85)% | 26.62% | (6.89)% | 10.12% | 2.10% | ||||||
Ratios to Average Net Assets B,H,I | ||||||||||||
| Expenses before reductions | 1.00% J | .99% | 1.01% | 1.03% | 1.04% | 1.04% | ||||||
| Expenses net of fee waivers, if any | 1.00% J | .99% | 1.01% | 1.03% | 1.04% | 1.04% | ||||||
| Expenses net of all reductions | 1.00% J | .99% | 1.01% | 1.03% | 1.04% | 1.04% | ||||||
| Net investment income (loss) | 4.51% J | 2.97% | 2.73% | 3.82% | 4.26% | 3.95% | ||||||
| Supplemental Data | ||||||||||||
| Net assets, end of period (000 omitted) | $ | 46,004 | $ | 52,919 | $ | 57,338 | $ | 49,387 | $ | 60,540 | $ | 55,175 |
Portfolio turnover rate K | 17% J | 42% | 26% | 32% L | 17% | 27% |
| Fidelity Advisor® Real Estate Income Fund Class C |
Six months ended (Unaudited) January 31, 2023 | Years ended July 31, 2022 | 2021 | 2020 | 2019 | 2018 | |||||||
Selected Per-Share Data | ||||||||||||
| Net asset value, beginning of period | $ | 12.27 | $ | 13.21 | $ | 10.88 | $ | 12.28 | $ | 11.85 | $ | 12.20 |
| Income from Investment Operations | ||||||||||||
Net investment income (loss) A,B | .21 | .29 | .24 | .36 | .42 | .38 | ||||||
| Net realized and unrealized gain (loss) | (.47) | (1.01) | 2.48 | (1.23) | .64 | (.22) | ||||||
| Total from investment operations | (.26) | (.72) | 2.72 | (.87) | 1.06 | .16 | ||||||
| Distributions from net investment income | (.25) | (.20) | (.36) C | (.36) | (.42) | (.37) | ||||||
| Distributions from net realized gain | (.22) | (.02) | (.03) C | (.16) | (.21) | (.13) | ||||||
| Total distributions | (.46) D | (.22) | (.39) | (.53) D | (.63) | (.51) D | ||||||
Redemption fees added to paid in capital A | - | - | - | - | - | - E | ||||||
| Net asset value, end of period | $ | 11.55 | $ | 12.27 | $ | 13.21 | $ | 10.88 | $ | 12.28 | $ | 11.85 |
Total Return F,G,H | (2.02)% | (5.54)% | 25.64% | (7.50)% | 9.34% | 1.31% | ||||||
Ratios to Average Net Assets B,I,J | ||||||||||||
| Expenses before reductions | 1.74% K | 1.72% | 1.74% | 1.76% | 1.76% | 1.76% | ||||||
| Expenses net of fee waivers, if any | 1.73% K | 1.72% | 1.74% | 1.76% | 1.76% | 1.76% | ||||||
| Expenses net of all reductions | 1.73% K | 1.72% | 1.74% | 1.76% | 1.76% | 1.76% | ||||||
| Net investment income (loss) | 3.77% K | 2.23% | 2.00% | 3.09% | 3.54% | 3.23% | ||||||
| Supplemental Data | ||||||||||||
| Net assets, end of period (000 omitted) | $ | 71,010 | $ | 89,135 | $ | 120,072 | $ | 150,653 | $ | 210,156 | $ | 227,458 |
Portfolio turnover rate L | 17% K | 42% | 26% | 32% M | 17% | 27% |
| Fidelity® Real Estate Income Fund |
Six months ended (Unaudited) January 31, 2023 | Years ended July 31, 2022 | 2021 | 2020 | 2019 | 2018 | |||||||
Selected Per-Share Data | ||||||||||||
| Net asset value, beginning of period | $ | 12.58 | $ | 13.52 | $ | 11.09 | $ | 12.50 | $ | 12.05 | $ | 12.38 |
| Income from Investment Operations | ||||||||||||
Net investment income (loss) A,B | .28 | .43 | .37 | .48 | .54 | .51 | ||||||
| Net realized and unrealized gain (loss) | (.48) | (1.03) | 2.53 | (1.25) | .66 | (.22) | ||||||
| Total from investment operations | (.20) | (.60) | 2.90 | (.77) | 1.20 | .29 | ||||||
| Distributions from net investment income | (.32) | (.32) | (.44) C | (.48) | (.54) | (.48) | ||||||
| Distributions from net realized gain | (.22) | (.02) | (.03) C | (.16) | (.21) | (.13) | ||||||
| Total distributions | (.54) | (.34) | (.47) | (.64) | (.75) | (.62) D | ||||||
Redemption fees added to paid in capital A | - | - | - | - | - | - E | ||||||
| Net asset value, end of period | $ | 11.84 | $ | 12.58 | $ | 13.52 | $ | 11.09 | $ | 12.50 | $ | 12.05 |
Total Return F,G | (1.51)% | (4.56)% | 26.88% | (6.58)% | 10.47% | 2.40% | ||||||
Ratios to Average Net Assets B,H,I | ||||||||||||
| Expenses before reductions | .73% J | .71% | .72% | .73% | .75% | .75% | ||||||
| Expenses net of fee waivers, if any | .72% J | .71% | .72% | .73% | .75% | .75% | ||||||
| Expenses net of all reductions | .72% J | .71% | .72% | .73% | .75% | .75% | ||||||
| Net investment income (loss) | 4.78% J | 3.24% | 3.02% | 4.12% | 4.55% | 4.24% | ||||||
| Supplemental Data | ||||||||||||
| Net assets, end of period (000 omitted) | $ | 1,432,741 | $ | 1,898,345 | $ | 2,777,243 | $ | 2,205,319 | $ | 2,691,820 | $ | 2,531,397 |
Portfolio turnover rate K | 17% J | 42% | 26% | 32% L | 17% | 27% |
| Fidelity Advisor® Real Estate Income Fund Class I |
Six months ended (Unaudited) January 31, 2023 | Years ended July 31, 2022 | 2021 | 2020 | 2019 | 2018 | |||||||
Selected Per-Share Data | ||||||||||||
| Net asset value, beginning of period | $ | 12.53 | $ | 13.47 | $ | 11.04 | $ | 12.45 | $ | 12.01 | $ | 12.34 |
| Income from Investment Operations | ||||||||||||
Net investment income (loss) A,B | .28 | .43 | .37 | .48 | .54 | .51 | ||||||
| Net realized and unrealized gain (loss) | (.49) | (1.03) | 2.53 | (1.25) | .65 | (.22) | ||||||
| Total from investment operations | (.21) | (.60) | 2.90 | (.77) | 1.19 | .29 | ||||||
| Distributions from net investment income | (.32) | (.32) | (.44) C | (.47) | (.54) | (.49) | ||||||
| Distributions from net realized gain | (.22) | (.02) | (.03) C | (.16) | (.21) | (.13) | ||||||
| Total distributions | (.54) | (.34) | (.47) | (.64) D | (.75) | (.62) | ||||||
Redemption fees added to paid in capital A | - | - | - | - | - | - E | ||||||
| Net asset value, end of period | $ | 11.78 | $ | 12.53 | $ | 13.47 | $ | 11.04 | $ | 12.45 | $ | 12.01 |
Total Return F,G | (1.59)% | (4.57)% | 27.03% | (6.62)% | 10.43% | 2.41% | ||||||
Ratios to Average Net Assets B,H,I | ||||||||||||
| Expenses before reductions | .72% J | .71% | .71% | .74% | .75% | .75% | ||||||
| Expenses net of fee waivers, if any | .72% J | .71% | .71% | .74% | .74% | .75% | ||||||
| Expenses net of all reductions | .72% J | .71% | .71% | .74% | .74% | .75% | ||||||
| Net investment income (loss) | 4.78% J | 3.24% | 3.03% | 4.11% | 4.55% | 4.25% | ||||||
| Supplemental Data | ||||||||||||
| Net assets, end of period (000 omitted) | $ | 1,622,015 | $ | 1,946,852 | $ | 2,810,475 | $ | 1,782,594 | $ | 2,386,308 | $ | 2,142,260 |
Portfolio turnover rate K | 17% J | 42% | 26% | 32% L | 17% | 27% |
| Fidelity Advisor® Real Estate Income Fund Class Z |
Six months ended (Unaudited) January 31, 2023 | Years ended July 31, 2022 | 2021 | 2020 | 2019 A | ||||||
Selected Per-Share Data | ||||||||||
| Net asset value, beginning of period | $ | 12.53 | $ | 13.47 | $ | 11.04 | $ | 12.45 | $ | 11.74 |
| Income from Investment Operations | ||||||||||
Net investment income (loss) B,C | .28 | .44 | .38 | .49 | .47 | |||||
| Net realized and unrealized gain (loss) | (.48) | (1.02) | 2.53 | (1.25) | .67 | |||||
| Total from investment operations | (.20) | (.58) | 2.91 | (.76) | 1.14 | |||||
| Distributions from net investment income | (.33) | (.34) | (.45) D | (.49) | (.42) | |||||
| Distributions from net realized gain | (.22) | (.02) | (.03) D | (.16) | (.02) | |||||
| Total distributions | (.55) | (.36) | (.48) | (.65) | (.43) E | |||||
| Net asset value, end of period | $ | 11.78 | $ | 12.53 | $ | 13.47 | $ | 11.04 | $ | 12.45 |
Total Return F,G | (1.51)% | (4.44)% | 27.15% | (6.50)% | 10.00% | |||||
Ratios to Average Net Assets C,H,I | ||||||||||
| Expenses before reductions | .60% J | .59% | .60% | .62% | .62% J | |||||
| Expenses net of fee waivers, if any | .60% J | .59% | .60% | .62% | .62% J | |||||
| Expenses net of all reductions | .60% J | .59% | .60% | .61% | .62% J | |||||
| Net investment income (loss) | 4.91% J | 3.36% | 3.14% | 4.24% | 4.71% J | |||||
| Supplemental Data | ||||||||||
| Net assets, end of period (000 omitted) | $ | 1,483,120 | $ | 1,607,463 | $ | 919,766 | $ | 793,220 | $ | 467,324 |
Portfolio turnover rate K | 17% J | 42% | 26% | 32% L | 17% |
| Fidelity Central Fund | Investment Manager | Investment Objective | Investment Practices | Expense Ratio A |
| Fidelity Money Market Central Funds | Fidelity Management & Research Company LLC (FMR) | Each fund seeks to obtain a high level of current income consistent with the preservation of capital and liquidity. | Short-term Investments | Less than .005% |
| Asset Type | Fair Value | Valuation Technique(s) | Unobservable Input | Amount or Range/Weighted Average | Impact to Valuation from an Increase in Input A |
| Corporate Bonds | $4 | Recovery value | Recovery value | $0.00 | Increase |
| Asset-Backed Securities | $45 | Recovery value | Recovery value | $0.00 | Increase |
| Indicative market price | Evaluated bid | $0.00 | Increase | ||
| Commercial Mortgage Securities | $59,706,050 | Indicative market price | Evaluated bid | $0.25 - $93.74 / $67.14 | Increase |
| Collateralized Mortgage Obligations | $8,028 | Indicative market price | Evaluated bid | $32.81 | Increase |
| Preferred Securities | $12 | Recovery value | Recovery value | $0.00 | Increase |
| Bank Loan Obligations | $75,590,057 | Discounted cash flow | Yield | 8.4% - 20.7% / 13.5% | Decrease |
| Gross unrealized appreciation | $429,208,307 |
| Gross unrealized depreciation | (436,664,210) |
| Net unrealized appreciation (depreciation) | $(7,455,903) |
| Tax cost | $4,954,145,779 |
| Purchases ($) | Sales ($) | |
| Fidelity Real Estate Income Fund | 402,843,355 | 823,346,156 |
| Distribution Fee | Service Fee | Total Fees | Retained by FDC | |
| Class A | - % | .25% | $415,311 | $5,403 |
| Class M | - % | .25% | 59,711 | - |
| Class C | .75% | .25% | 382,052 | 22,122 |
| $857,074 | $27,525 |
| Retained by FDC | |
| Class A | $6,998 |
| Class M | 901 |
Class C A | 135 |
| $8,034 |
| Amount | % of Class-Level Average Net Assets A | |
| Class A | $294,235 | .18 |
| Class M | 46,789 | .20 |
| Class C | 69,016 | .18 |
| Real Estate Income | 1,286,464 | .17 |
| Class I | 1,411,807 | .17 |
| Class Z | 299,827 | .04 |
| $3,408,138 |
| % of Average Net Assets | |
| Fidelity Real Estate Income Fund | .03 |
| Amount | |
| Fidelity Real Estate Income Fund | $3,453 |
| Purchases ($) | Sales ($) | Realized Gain (Loss) ($) | |
| Fidelity Real Estate Income Fund | 8,164,525 | 5,900,264 | 339,438 |
| Amount | |
| Fidelity Real Estate Income Fund | $7,593 |
| Total Security Lending Fees Paid to NFS | Security Lending Income From Securities Loaned to NFS | Value of Securities Loaned to NFS at Period End | |
| Fidelity Real Estate Income Fund | $234 | $- | $- |
| Expense reduction | |
| Class M | $42 |
Six months ended January 31, 2023 | Year ended July 31, 2022 | |
| Fidelity Real Estate Income Fund | ||
| Distributions to shareholders | ||
| Class A | $14,875,257 | $8,818,580 |
| Class M | 2,123,703 | 1,275,531 |
| Class C | 3,163,929 | 1,818,918 |
| Real Estate Income | 72,244,463 | 67,601,059 |
| Class I | 80,526,731 | 55,434,062 |
| Class Z | 67,736,743 | 47,353,622 |
Total | $240,670,826 | $182,301,772 |
| Shares | Shares | Dollars | Dollars | |
Six months ended January 31, 2023 | Year ended July 31, 2022 | Six months ended January 31, 2023 | Year ended July 31, 2022 | |
| Fidelity Real Estate Income Fund | ||||
| Class A | ||||
| Shares sold | 2,021,777 | 5,531,610 | $23,282,249 | $72,570,914 |
| Reinvestment of distributions | 974,318 | 513,437 | 11,332,251 | 6,723,485 |
| Shares redeemed | (4,744,972) | (5,497,840) | (54,145,833) | (71,617,823) |
| Net increase (decrease) | (1,748,877) | 547,207 | $(19,531,333) | $7,676,576 |
| Class M | ||||
| Shares sold | 89,937 | 573,436 | $1,039,250 | $7,485,522 |
| Reinvestment of distributions | 177,226 | 95,811 | 2,061,948 | 1,255,521 |
| Shares redeemed | (588,493) | (703,618) | (6,712,298) | (9,213,383) |
| Net increase (decrease) | (321,330) | (34,371) | $(3,611,100) | $(472,340) |
| Class C | ||||
| Shares sold | 165,037 | 795,990 | $1,875,015 | $10,421,747 |
| Reinvestment of distributions | 270,593 | 137,493 | 3,101,186 | 1,780,331 |
| Shares redeemed | (1,549,476) | (2,761,921) | (17,459,295) | (35,374,652) |
| Net increase (decrease) | (1,113,846) | (1,828,438) | $(12,483,094) | $(23,172,574) |
| Real Estate Income | ||||
| Shares sold | 9,963,218 | 45,578,678 | $115,009,514 | $609,828,801 |
| Reinvestment of distributions | 5,482,227 | 4,627,906 | 64,198,752 | 61,214,036 |
| Shares redeemed | (45,256,992) | (104,743,578) | (533,941,597) | (1,345,838,761) |
| Net increase (decrease) | (29,811,547) | (54,536,994) | $(354,733,331) | $(674,795,924) |
| Class I | ||||
| Shares sold | 15,750,048 | 51,885,027 | $181,425,611 | $688,287,283 |
| Reinvestment of distributions | 6,382,155 | 3,827,145 | 74,401,393 | 50,268,241 |
| Shares redeemed | (39,857,582) | (109,053,815) | (453,285,802) | (1,441,761,631) |
| Net increase (decrease) | (17,725,379) | (53,341,643) | $(197,458,798) | $(703,206,107) |
| Class Z | ||||
| Shares sold | 12,833,291 | 110,101,188 | $149,326,188 | $1,472,830,240 |
| Reinvestment of distributions | 5,150,187 | 3,202,845 | 59,988,226 | 42,119,423 |
| Shares redeemed | (20,378,564) | (53,304,114) | (237,101,676) | (703,496,787) |
| Net increase (decrease) | (2,395,086) | 59,999,919 | $(27,787,262) | $811,452,876 |
| Strategic Advisers Fidelity Core Income Fund | |
| Fidelity Real Estate Income Fund | 18% |
| The Example is based on an investment of $1,000 invested at the beginning of the period and held for the entire period (August 1, 2022 to January 31, 2023). |
Annualized Expense Ratio- A | Beginning Account Value August 1, 2022 | Ending Account Value January 31, 2023 | Expenses Paid During Period- C August 1, 2022 to January 31, 2023 | |||||||
| Fidelity® Real Estate Income Fund | ||||||||||
| Class A | .98% | |||||||||
| Actual | $ 1,000 | $ 983.20 | $ 4.90 | |||||||
Hypothetical- B | $ 1,000 | $ 1,020.27 | $ 4.99 | |||||||
| Class M | 1.00% | |||||||||
| Actual | $ 1,000 | $ 983.00 | $ 5.00 | |||||||
Hypothetical- B | $ 1,000 | $ 1,020.16 | $ 5.09 | |||||||
| Class C | 1.73% | |||||||||
| Actual | $ 1,000 | $ 979.80 | $ 8.63 | |||||||
Hypothetical- B | $ 1,000 | $ 1,016.48 | $ 8.79 | |||||||
| Fidelity® Real Estate Income Fund | .72% | |||||||||
| Actual | $ 1,000 | $ 984.90 | $ 3.60 | |||||||
Hypothetical- B | $ 1,000 | $ 1,021.58 | $ 3.67 | |||||||
| Class I | .72% | |||||||||
| Actual | $ 1,000 | $ 984.10 | $ 3.60 | |||||||
Hypothetical- B | $ 1,000 | $ 1,021.58 | $ 3.67 | |||||||
| Class Z | .60% | |||||||||
| Actual | $ 1,000 | $ 984.90 | $ 3.00 | |||||||
Hypothetical- B | $ 1,000 | $ 1,022.18 | $ 3.06 | |||||||
- Highly liquid investments - cash or convertible to cash within three business days or less
- Moderately liquid investments - convertible to cash in three to seven calendar days
- Less liquid investments - can be sold or disposed of, but not settled, within seven calendar days
- Illiquid investments - cannot be sold or disposed of within seven calendar days
|


Contents
Top Holdings (% of Fund's net assets) | ||
| Apple, Inc. | 12.4 | |
| Microsoft Corp. | 11.2 | |
| Amazon.com, Inc. | 5.9 | |
| Alphabet, Inc. Class A | 4.9 | |
| Alphabet, Inc. Class C | 2.9 | |
| Meta Platforms, Inc. Class A | 2.7 | |
| Taiwan Semiconductor Manufacturing Co. Ltd. sponsored ADR | 2.2 | |
| Marvell Technology, Inc. | 2.1 | |
| Comcast Corp. Class A | 2.0 | |
| Regeneron Pharmaceuticals, Inc. | 1.9 | |
| 48.2 | ||
| Market Sectors (% of Fund's net assets) | ||
| Information Technology | 42.6 | |
| Communication Services | 18.3 | |
| Consumer Discretionary | 15.0 | |
| Health Care | 9.2 | |
| Energy | 5.6 | |
| Consumer Staples | 4.5 | |
| Financials | 2.5 | |
| Industrials | 2.4 | |
| Real Estate | 0.0 | |
Asset Allocation (% of Fund's net assets) |
 |
Short-Term Investments and Net Other Assets (Liabilities) - (0.1)%* |
Foreign investments - 12.3% |
Short-Term Investments and Net Other Assets (Liabilities) are not available in the pie chart. |
Geographic Diversification (% of Fund's net assets) |
 |
* Includes Short-Term investments and Net Other Assets (Liabilities). Percentages are based on country or territory of incorporation and are adjusted for the effect of derivatives, if applicable. |
| Common Stocks - 98.1% | |||
| Shares | Value ($) (000s) | ||
| COMMUNICATION SERVICES - 17.5% | |||
| Diversified Telecommunication Services - 0.0% | |||
| Starry Group Holdings, Inc. Class A (a)(b) | 333,301 | 14 | |
| Entertainment - 2.1% | |||
| Activision Blizzard, Inc. | 645,221 | 49,405 | |
| Electronic Arts, Inc. | 2,332 | 300 | |
| NetEase, Inc. ADR | 14,659 | 1,299 | |
| Netflix, Inc. (a) | 1,128,410 | 399,299 | |
| Take-Two Interactive Software, Inc. (a) | 11,543 | 1,307 | |
| 451,610 | |||
| Interactive Media & Services - 11.6% | |||
| Alphabet, Inc.: | |||
| Class A (a) | 10,392,333 | 1,027,178 | |
| Class C (a) | 6,249,988 | 624,186 | |
| Epic Games, Inc. (a)(c)(d) | 77,600 | 65,640 | |
| Match Group, Inc. (a) | 231,952 | 12,553 | |
| Meta Platforms, Inc. Class A (a) | 3,841,111 | 572,210 | |
| Tencent Holdings Ltd. sponsored ADR (b) | 2,867,271 | 139,779 | |
| Vimeo, Inc. (a) | 282,379 | 1,282 | |
| Yandex NV Series A (a)(d) | 2,813,567 | 9,650 | |
| 2,452,478 | |||
| Media - 3.7% | |||
| Charter Communications, Inc. Class A (a) | 959,439 | 368,722 | |
| Comcast Corp. Class A | 10,511,951 | 413,645 | |
| 782,367 | |||
| Wireless Telecommunication Services - 0.1% | |||
| T-Mobile U.S., Inc. (a) | 62,638 | 9,352 | |
TOTAL COMMUNICATION SERVICES | 3,695,821 | ||
| CONSUMER DISCRETIONARY - 14.6% | |||
| Automobiles - 0.1% | |||
| Rivian Automotive, Inc. (a) | 13,054 | 253 | |
| Tesla, Inc. (a) | 90,868 | 15,740 | |
| 15,993 | |||
| Hotels, Restaurants & Leisure - 1.4% | |||
| Airbnb, Inc. Class A (a) | 19,083 | 2,120 | |
| Churchill Downs, Inc. | 1,044,694 | 259,189 | |
| Domino's Pizza, Inc. | 28,700 | 10,131 | |
| Marriott International, Inc. Class A | 42,680 | 7,434 | |
| Vail Resorts, Inc. | 19,929 | 5,228 | |
| Wynn Resorts Ltd. (a) | 122,302 | 12,675 | |
| 296,777 | |||
| Internet & Direct Marketing Retail - 7.1% | |||
| Alibaba Group Holding Ltd. sponsored ADR (a) | 258,918 | 28,533 | |
| Amazon.com, Inc. (a) | 12,166,538 | 1,254,735 | |
| ContextLogic, Inc. (a) | 147,465 | 101 | |
| Etsy, Inc. (a) | 137,258 | 18,884 | |
| Global-e Online Ltd. (a) | 250,087 | 7,495 | |
| JD.com, Inc. Class A | 8,611 | 256 | |
| Meituan Class B (a)(e) | 5,221,647 | 116,735 | |
| Pinduoduo, Inc. ADR (a) | 771,895 | 75,630 | |
| thredUP, Inc. (a) | 86,924 | 150 | |
| Zomato Ltd. (a) | 7,745,200 | 4,756 | |
| 1,507,275 | |||
| Multiline Retail - 0.2% | |||
| Dollar Tree, Inc. (a) | 288,600 | 43,342 | |
| Specialty Retail - 3.2% | |||
| Five Below, Inc. (a) | 909,771 | 179,343 | |
| Lowe's Companies, Inc. | 936,555 | 195,038 | |
| Ross Stores, Inc. | 2,424,715 | 286,577 | |
| TJX Companies, Inc. | 196,227 | 16,063 | |
| 677,021 | |||
| Textiles, Apparel & Luxury Goods - 2.6% | |||
| Kontoor Brands, Inc. | 5,843 | 279 | |
| lululemon athletica, Inc. (a) | 979,321 | 300,534 | |
| LVMH Moet Hennessy Louis Vuitton SE | 262,545 | 229,195 | |
| NIKE, Inc. Class B | 163,456 | 20,813 | |
| 550,821 | |||
TOTAL CONSUMER DISCRETIONARY | 3,091,229 | ||
| CONSUMER STAPLES - 4.5% | |||
| Beverages - 3.0% | |||
| Diageo PLC | 2,691,952 | 117,709 | |
| Keurig Dr. Pepper, Inc. | 7,033,884 | 248,155 | |
| Monster Beverage Corp. (a) | 2,508,898 | 261,126 | |
| 626,990 | |||
| Food & Staples Retailing - 0.3% | |||
| Costco Wholesale Corp. | 121,270 | 61,986 | |
| Food Products - 1.2% | |||
| Mondelez International, Inc. | 4,069,245 | 266,291 | |
| Personal Products - 0.0% | |||
| The Honest Co., Inc. (a) | 158,539 | 523 | |
TOTAL CONSUMER STAPLES | 955,790 | ||
| ENERGY - 5.6% | |||
| Energy Equipment & Services - 1.7% | |||
| Halliburton Co. | 3,551,537 | 146,394 | |
| Schlumberger Ltd. | 3,171,467 | 180,710 | |
| TGS ASA ADR | 2,334,220 | 37,348 | |
| 364,452 | |||
| Oil, Gas & Consumable Fuels - 3.9% | |||
| Cenovus Energy, Inc. (Canada) | 165,947 | 3,315 | |
| Diamondback Energy, Inc. | 1,367,253 | 199,783 | |
| EOG Resources, Inc. | 13,762 | 1,820 | |
| Hess Corp. | 982,106 | 147,473 | |
| Reliance Industries Ltd. | 12,455,117 | 360,061 | |
| Reliance Industries Ltd. sponsored GDR (e) | 1,786,616 | 102,373 | |
| 814,825 | |||
TOTAL ENERGY | 1,179,277 | ||
| FINANCIALS - 2.2% | |||
| Banks - 2.1% | |||
| Bank of America Corp. | 1,949,286 | 69,161 | |
| Fifth Third Bancorp | 2,955,780 | 107,265 | |
| Huntington Bancshares, Inc. | 12,944,296 | 196,365 | |
| Wells Fargo & Co. | 1,268,166 | 59,439 | |
| Wintrust Financial Corp. | 44,026 | 4,027 | |
| 436,257 | |||
| Capital Markets - 0.0% | |||
| S&P Global, Inc. | 683 | 256 | |
| Diversified Financial Services - 0.1% | |||
| Ant International Co. Ltd. Class C (a)(c)(d) | 10,036,067 | 15,857 | |
TOTAL FINANCIALS | 452,370 | ||
| HEALTH CARE - 9.2% | |||
| Biotechnology - 5.2% | |||
| Alnylam Pharmaceuticals, Inc. (a) | 1,153,249 | 261,096 | |
| Amgen, Inc. | 588,345 | 148,498 | |
| Arcutis Biotherapeutics, Inc. (a) | 837,194 | 13,872 | |
| Ascendis Pharma A/S sponsored ADR (a) | 272,851 | 33,855 | |
| GenSight Biologics SA (a)(b) | 213,065 | 795 | |
| Ionis Pharmaceuticals, Inc. (a) | 31,805 | 1,268 | |
| Regeneron Pharmaceuticals, Inc. (a) | 538,231 | 408,232 | |
| Relay Therapeutics, Inc. (a)(b) | 1,107,450 | 23,766 | |
| Trevena, Inc. (a) | 17,913 | 30 | |
| Vertex Pharmaceuticals, Inc. (a) | 638,776 | 206,389 | |
| 1,097,801 | |||
| Health Care Equipment & Supplies - 1.4% | |||
| DexCom, Inc. (a) | 601,661 | 64,432 | |
| Figs, Inc. Class A (a) | 45,265 | 405 | |
| Insulet Corp. (a) | 747,700 | 214,829 | |
| Neuronetics, Inc. (a) | 38,742 | 228 | |
| Outset Medical, Inc. (a) | 40,161 | 1,129 | |
| Pulmonx Corp. (a)(b) | 26,206 | 233 | |
| Tandem Diabetes Care, Inc. (a) | 192,385 | 7,838 | |
| 289,094 | |||
| Health Care Providers & Services - 1.1% | |||
| agilon health, Inc. (a) | 435,676 | 9,480 | |
| Cigna Corp. | 75,285 | 23,841 | |
| Guardant Health, Inc. (a) | 2,094,647 | 65,835 | |
| Humana, Inc. | 252,363 | 129,134 | |
| 228,290 | |||
| Health Care Technology - 0.0% | |||
| Certara, Inc. (a) | 223,966 | 4,345 | |
| Life Sciences Tools & Services - 1.0% | |||
| 10X Genomics, Inc. (a) | 286,891 | 13,435 | |
| Bruker Corp. | 2,470,522 | 173,233 | |
| Illumina, Inc. (a) | 39,013 | 8,357 | |
| Olink Holding AB ADR (a) | 1,015,432 | 19,882 | |
| Seer, Inc. (a) | 590,731 | 2,688 | |
| 217,595 | |||
| Pharmaceuticals - 0.5% | |||
| AstraZeneca PLC sponsored ADR | 1,688,117 | 110,352 | |
| Elanco Animal Health, Inc. (a) | 89,078 | 1,223 | |
| TherapeuticsMD, Inc. (a)(b) | 6,867 | 36 | |
| 111,611 | |||
TOTAL HEALTH CARE | 1,948,736 | ||
| INDUSTRIALS - 1.9% | |||
| Aerospace & Defense - 0.8% | |||
| Space Exploration Technologies Corp.: | |||
| Class A (a)(c)(d) | 2,034,880 | 156,686 | |
| Class C (a)(c)(d) | 70,920 | 5,461 | |
| 162,147 | |||
| Airlines - 0.0% | |||
| Wheels Up Experience, Inc.: | |||
| Class A (a) | 807,578 | 993 | |
| rights (a)(d) | 11,102 | 2 | |
| rights (a)(d) | 11,102 | 2 | |
| rights (a)(d) | 11,103 | 2 | |
| 999 | |||
| Professional Services - 1.0% | |||
| Verisk Analytics, Inc. | 1,212,537 | 220,427 | |
| Road & Rail - 0.1% | |||
| Canadian Pacific Railway Ltd. | 149,561 | 11,800 | |
| CSX Corp. | 287,352 | 8,885 | |
| 20,685 | |||
TOTAL INDUSTRIALS | 404,258 | ||
| INFORMATION TECHNOLOGY - 42.6% | |||
| Communications Equipment - 0.4% | |||
| Cisco Systems, Inc. | 1,770,483 | 86,169 | |
| IT Services - 3.5% | |||
| Gartner, Inc. (a) | 1,069,035 | 361,483 | |
| MasterCard, Inc. Class A | 854,564 | 316,701 | |
| MongoDB, Inc. Class A (a) | 96,389 | 20,647 | |
| PayPal Holdings, Inc. (a) | 171,176 | 13,949 | |
| Twilio, Inc. Class A (a) | 922 | 55 | |
| X Holdings I, Inc. (c)(d) | 70,915 | 28,134 | |
| 740,969 | |||
| Semiconductors & Semiconductor Equipment - 11.9% | |||
| Advanced Micro Devices, Inc. (a) | 2,095,989 | 157,514 | |
| Analog Devices, Inc. | 220,417 | 37,795 | |
| Applied Materials, Inc. | 2,320,382 | 258,699 | |
| ASML Holding NV | 574,426 | 379,604 | |
| Lam Research Corp. | 480,539 | 240,318 | |
| Marvell Technology, Inc. | 10,093,655 | 435,541 | |
| NVIDIA Corp. | 1,630,020 | 318,457 | |
| NXP Semiconductors NV | 540,660 | 99,649 | |
| Skyworks Solutions, Inc. | 93,562 | 10,261 | |
| Taiwan Semiconductor Manufacturing Co. Ltd. sponsored ADR | 5,084,628 | 471,498 | |
| Texas Instruments, Inc. | 589,545 | 104,473 | |
| 2,513,809 | |||
| Software - 14.3% | |||
| Adobe, Inc. (a) | 135,152 | 50,052 | |
| ANSYS, Inc. (a) | 53,425 | 14,230 | |
| Aspen Technology, Inc. (a) | 843,738 | 167,693 | |
| Atom Tickets LLC (a)(c)(d)(f) | 516,103 | 0 | |
| Autodesk, Inc. (a) | 238,574 | 51,332 | |
| Cadence Design Systems, Inc. (a) | 879,600 | 160,817 | |
| Dropbox, Inc. Class A (a) | 193,104 | 4,486 | |
| Duck Creek Technologies, Inc. (a) | 24,804 | 470 | |
| Dynatrace, Inc. (a) | 9,173 | 353 | |
| Intuit, Inc. | 305,182 | 128,991 | |
| Microsoft Corp. | 9,503,447 | 2,355,049 | |
| Salesforce.com, Inc. (a) | 8,600 | 1,445 | |
| Stripe, Inc. Class B (a)(c)(d) | 91,800 | 2,467 | |
| Synopsys, Inc. (a) | 170,213 | 60,213 | |
| Workday, Inc. Class A (a) | 70,529 | 12,796 | |
| 3,010,394 | |||
| Technology Hardware, Storage & Peripherals - 12.5% | |||
| Apple, Inc. | 18,131,166 | 2,616,152 | |
| Samsung Electronics Co. Ltd. | 252,120 | 12,543 | |
| Western Digital Corp. (a) | 286,132 | 12,576 | |
| 2,641,271 | |||
TOTAL INFORMATION TECHNOLOGY | 8,992,612 | ||
| REAL ESTATE - 0.0% | |||
| Equity Real Estate Investment Trusts (REITs) - 0.0% | |||
| Equinix, Inc. | 8,108 | 5,985 | |
| TOTAL COMMON STOCKS (Cost $11,298,199) | 20,726,078 | ||
| Preferred Stocks - 1.7% | |||
| Shares | Value ($) (000s) | ||
| Convertible Preferred Stocks - 1.4% | |||
| COMMUNICATION SERVICES - 0.8% | |||
| Interactive Media & Services - 0.8% | |||
| ByteDance Ltd. Series E1 (a)(c)(d) | 130,752 | 25,878 | |
| Reddit, Inc.: | |||
| Series B(a)(c)(d) | 1,337,584 | 50,226 | |
| Series C(a)(c)(d) | 300,673 | 11,290 | |
| Series D(a)(c)(d) | 929,200 | 34,891 | |
| Series E(a)(c)(d) | 33,800 | 1,269 | |
| Series F(a)(c)(d) | 1,250,100 | 46,941 | |
| 170,495 | |||
| CONSUMER DISCRETIONARY - 0.1% | |||
| Hotels, Restaurants & Leisure - 0.0% | |||
| Discord, Inc. Series I (a)(c)(d) | 3,300 | 1,264 | |
| Internet & Direct Marketing Retail - 0.1% | |||
| Circle Internet Financial Ltd. Series F (c)(d) | 391,560 | 13,235 | |
TOTAL CONSUMER DISCRETIONARY | 14,499 | ||
| INDUSTRIALS - 0.5% | |||
| Aerospace & Defense - 0.5% | |||
| Space Exploration Technologies Corp.: | |||
| Series G(a)(c)(d) | 62,037 | 47,768 | |
| Series H(a)(c)(d) | 65,670 | 50,566 | |
| 98,334 | |||
| INFORMATION TECHNOLOGY - 0.0% | |||
| IT Services - 0.0% | |||
| AppNexus, Inc.: | |||
| Series E (Escrow)(a)(c)(d) | 1,416,796 | 44 | |
| Series F (Escrow)(a)(c)(d) | 90,913 | 25 | |
| 69 | |||
| Software - 0.0% | |||
| Stripe, Inc. Series H (a)(c)(d) | 39,000 | 1,048 | |
| Tenstorrent, Inc. Series C1 (a)(c)(d) | 41,000 | 2,139 | |
| 3,187 | |||
TOTAL INFORMATION TECHNOLOGY | 3,256 | ||
| TOTAL CONVERTIBLE PREFERRED STOCKS | 286,584 | ||
| Nonconvertible Preferred Stocks - 0.3% | |||
| CONSUMER DISCRETIONARY - 0.3% | |||
| Automobiles - 0.1% | |||
| Waymo LLC: | |||
| Series A2(a)(c)(d) | 103,940 | 5,032 | |
| Series B2(a)(c)(d) | 178,470 | 9,032 | |
| 14,064 | |||
| Internet & Direct Marketing Retail - 0.2% | |||
| Circle Internet Financial Ltd. Series E (c)(d) | 1,272,556 | 43,012 | |
TOTAL CONSUMER DISCRETIONARY | 57,076 | ||
| HEALTH CARE - 0.0% | |||
| Pharmaceuticals - 0.0% | |||
| Castle Creek Pharmaceutical Holdings, Inc. Series A4 (a)(c)(d) | 30,303 | 6,558 | |
| TOTAL NONCONVERTIBLE PREFERRED STOCKS | 63,634 | ||
| TOTAL PREFERRED STOCKS (Cost $228,885) | 350,218 | ||
| Convertible Bonds - 0.3% | |||
Principal Amount (g) (000s) | Value ($) (000s) | ||
| FINANCIALS - 0.3% | |||
| Capital Markets - 0.3% | |||
Coinbase Global, Inc. 0.5% 6/1/26 (Cost $63,083) | 89,436 | 60,593 | |
| Preferred Securities - 0.0% | |||
Principal Amount (g) (000s) | Value ($) (000s) | ||
| INFORMATION TECHNOLOGY - 0.0% | |||
| Software - 0.0% | |||
Tenstorrent, Inc. 0% (c)(d)(h) (Cost $2,280) | 2,280 | 2,002 | |
| Money Market Funds - 0.4% | |||
| Shares | Value ($) (000s) | ||
| Fidelity Cash Central Fund 4.38% (i) | 11,807,367 | 11,810 | |
| Fidelity Securities Lending Cash Central Fund 4.38% (i)(j) | 72,923,601 | 72,931 | |
| TOTAL MONEY MARKET FUNDS (Cost $84,741) | 84,741 | ||
| TOTAL INVESTMENT IN SECURITIES - 100.5% (Cost $11,677,188) | 21,223,632 |
NET OTHER ASSETS (LIABILITIES) - (0.5)% | (96,562) |
| NET ASSETS - 100.0% | 21,127,070 |
| (a) | Non-income producing |
| (b) | Security or a portion of the security is on loan at period end. |
| (c) | Restricted securities (including private placements) - Investment in securities not registered under the Securities Act of 1933 (excluding 144A issues). At the end of the period, the value of restricted securities (excluding 144A issues) amounted to $626,465,000 or 3.0% of net assets. |
| (d) | Level 3 security |
| (e) | Security exempt from registration under Rule 144A of the Securities Act of 1933. These securities may be resold in transactions exempt from registration, normally to qualified institutional buyers. At the end of the period, the value of these securities amounted to $219,108,000 or 1.0% of net assets. |
| (f) | Investment is owned by a wholly-owned subsidiary (Subsidiary) that is treated as a corporation for U.S. tax purposes. |
| (g) | Amount is stated in United States dollars unless otherwise noted. |
| (h) | Security is perpetual in nature with no stated maturity date. |
| (i) | Affiliated fund that is generally available only to investment companies and other accounts managed by Fidelity Investments. The rate quoted is the annualized seven-day yield of the fund at period end. A complete unaudited listing of the fund's holdings as of its most recent quarter end is available upon request. In addition, each Fidelity Central Fund's financial statements are available on the SEC's website or upon request. |
| (j) | Investment made with cash collateral received from securities on loan. |
| Additional information on each restricted holding is as follows: | ||
| Security | Acquisition Date | Acquisition Cost ($) (000s) |
| Ant International Co. Ltd. Class C | 5/16/18 | 38,251 |
| AppNexus, Inc. Series E (Escrow) | 8/01/14 - 9/17/14 | 0 |
| AppNexus, Inc. Series F (Escrow) | 8/23/16 | 40 |
| Atom Tickets LLC | 8/15/17 | 3,000 |
| ByteDance Ltd. Series E1 | 11/18/20 | 14,327 |
| Castle Creek Pharmaceutical Holdings, Inc. Series A4 | 9/29/16 | 10,011 |
| Circle Internet Financial Ltd. Series E | 5/11/21 | 20,654 |
| Circle Internet Financial Ltd. Series F | 5/09/22 | 16,500 |
| Discord, Inc. Series I | 9/15/21 | 1,817 |
| Epic Games, Inc. | 7/13/20 - 3/29/21 | 61,546 |
| Reddit, Inc. Series B | 7/26/17 | 18,989 |
| Reddit, Inc. Series C | 7/24/17 | 4,743 |
| Reddit, Inc. Series D | 2/04/19 | 20,151 |
| Reddit, Inc. Series E | 5/18/21 | 1,436 |
| Reddit, Inc. Series F | 8/11/21 | 77,249 |
| Space Exploration Technologies Corp. Class A | 10/16/15 - 9/11/17 | 21,156 |
| Space Exploration Technologies Corp. Class C | 9/11/17 | 957 |
| Space Exploration Technologies Corp. Series G | 1/20/15 | 4,805 |
| Space Exploration Technologies Corp. Series H | 8/04/17 | 8,865 |
| Stripe, Inc. Class B | 5/18/21 | 3,684 |
| Stripe, Inc. Series H | 3/15/21 | 1,565 |
| Tenstorrent, Inc. Series C1 | 4/23/21 | 2,438 |
| Tenstorrent, Inc. 0% | 4/23/21 | 2,280 |
| Waymo LLC Series A2 | 5/08/20 | 8,925 |
| Waymo LLC Series B2 | 6/11/21 | 16,370 |
| X Holdings I, Inc. | 10/27/21 | 54,255 |
| Affiliate (Amounts in thousands) | Value, beginning of period ($) | Purchases ($) | Sales Proceeds ($) | Dividend Income ($) | Realized Gain (loss) ($) | Change in Unrealized appreciation (depreciation) ($) | Value, end of period ($) | % ownership, end of period |
| Fidelity Cash Central Fund 4.38% | 214,599 | 768,367 | 971,156 | 947 | - | - | 11,810 | 0.0% |
| Fidelity Securities Lending Cash Central Fund 4.38% | 148,107 | 589,074 | 664,250 | 943 | - | - | 72,931 | 0.2% |
| Total | 362,706 | 1,357,441 | 1,635,406 | 1,890 | - | - | 84,741 | |
| Affiliate (Amounts in thousands) | Value, beginning of period ($) | Purchases ($) | Sales Proceeds ($) | Dividend Income ($) | Realized Gain (loss) ($) | Change in Unrealized appreciation (depreciation) ($) | Value, end of period ($) |
| Nanostring Technologies, Inc. | 31,085 | - | 22,083 | - | (76,619) | 67,617 | - |
| Total | 31,085 | - | 22,083 | - | (76,619) | 67,617 | - |
| Valuation Inputs at Reporting Date: | ||||
Description (Amounts in thousands) | Total ($) | Level 1 ($) | Level 2 ($) | Level 3 ($) |
Investments in Securities: | ||||
| Equities: | ||||
Communication Services | 3,866,316 | 3,620,531 | - | 245,785 |
Consumer Discretionary | 3,162,804 | 2,740,287 | 350,942 | 71,575 |
Consumer Staples | 955,790 | 838,081 | 117,709 | - |
Energy | 1,179,277 | 819,216 | 360,061 | - |
Financials | 452,370 | 436,513 | - | 15,857 |
Health Care | 1,955,294 | 1,948,736 | - | 6,558 |
Industrials | 502,592 | 242,105 | - | 260,487 |
Information Technology | 8,995,868 | 8,949,468 | 12,543 | 33,857 |
Real Estate | 5,985 | 5,985 | - | - |
| Corporate Bonds | 60,593 | - | 60,593 | - |
| Preferred Securities | 2,002 | - | - | 2,002 |
| Money Market Funds | 84,741 | 84,741 | - | - |
| Total Investments in Securities: | 21,223,632 | 19,685,663 | 901,848 | 636,121 |
| Net Unrealized Depreciation on Unfunded Commitments | (1,996) | - | - | (1,996) |
| Total | (1,996) | - | - | (1,996) |
| (Amounts in thousands) | |||
| Investments in Securities: | |||
| Communication Services | |||
| Beginning Balance | $ | 161,163 | |
| Net Realized Gain (Loss) on Investment Securities | 2,165 | ||
| Net Unrealized Gain (Loss) on Investment Securities | 89,397 | ||
| Cost of Purchases | - | ||
| Proceeds of Sales | (6,940) | ||
| Amortization/Accretion | - | ||
| Transfers into Level 3 | - | ||
| Transfers out of Level 3 | - | ||
| Ending Balance | $ | 245,785 | |
| The change in unrealized gain (loss) for the period attributable to Level 3 securities held at January 31, 2023 | $ | 89,397 | |
| Industrials | |||
| Beginning Balance | $ | 236,816 | |
| Net Realized Gain (Loss) on Investment Securities | - | ||
| Net Unrealized Gain (Loss) on Investment Securities | 23,671 | ||
| Cost of Purchases | - | ||
| Proceeds of Sales | - | ||
| Amortization/Accretion | - | ||
| Transfers into Level 3 | - | ||
| Transfers out of Level 3 | - | ||
| Ending Balance | $ | 260,487 | |
| The change in unrealized gain (loss) for the period attributable to Level 3 securities held at January 31, 2023 | $ | 23,671 | |
| Other Investments in Securities | |||
| Beginning Balance | $ | 150,405 | |
| Net Realized Gain (Loss) on Investment Securities | - | ||
| Net Unrealized Gain (Loss) on Investment Securities | (171,633) | ||
| Cost of Purchases | 28 | ||
| Proceeds of Sales | - | ||
| Amortization/Accretion | - | ||
| Transfers into Level 3 | 151,049 | ||
| Transfers out of Level 3 | - | ||
| Ending Balance | $ | 129,849 | |
| The change in unrealized gain (loss) for the period attributable to Level 3 securities held at January 31, 2023 | $ | (171,633) | |
| The information used in the above reconciliation represents fiscal year to date activity for any Investments in Securities identified as using Level 3 inputs at either the beginning or the end of the current fiscal period. Cost of purchases and proceeds of sales may include securities received and/or delivered through in-kind transactions. Transfers into Level 3 were attributable to a lack of observable market data resulting from decreases in market activity, decreases in liquidity, security restructurings or corporate actions. Transfers out of Level 3 were attributable to observable market data becoming available for those securities. Transfers in or out of Level 3 represent the beginning value of any Security or Instrument where a change in the pricing level occurred from the beginning to the end of the period. The cost of purchases and the proceeds of sales may include securities received or delivered through corporate actions or exchanges. Realized and unrealized gains (losses) disclosed in the reconciliation are included in Net Gain (Loss) on the Fund's Statement of Operations. | |||
| Statement of Assets and Liabilities | ||||
| Amounts in thousands (except per-share amounts) | January 31, 2023 (Unaudited) | |||
| Assets | ||||
| Investment in securities, at value (including securities loaned of $71,376) - See accompanying schedule: | ||||
Unaffiliated issuers (cost $11,592,447) | $ | 21,138,891 | ||
Fidelity Central Funds (cost $84,741) | 84,741 | |||
| Total Investment in Securities (cost $11,677,188) | $ | 21,223,632 | ||
| Receivable for fund shares sold | 5,203 | |||
| Dividends receivable | 9,038 | |||
| Interest receivable | 75 | |||
| Distributions receivable from Fidelity Central Funds | 280 | |||
| Prepaid expenses | 21 | |||
| Other receivables | 404 | |||
Total assets | 21,238,653 | |||
| Liabilities | ||||
| Unrealized depreciation on unfunded commitments | $ | 1,996 | ||
| Payable for fund shares redeemed | 8,475 | |||
| Accrued management fee | 11,242 | |||
| Other affiliated payables | 2,058 | |||
| Other payables and accrued expenses | 14,905 | |||
| Collateral on securities loaned | 72,907 | |||
| Total Liabilities | 111,583 | |||
| Net Assets | $ | 21,127,070 | ||
| Net Assets consist of: | ||||
| Paid in capital | $ | 12,561,315 | ||
| Total accumulated earnings (loss) | 8,565,755 | |||
| Net Assets | $ | 21,127,070 | ||
| Net Asset Value and Maximum Offering Price | ||||
| OTC : | ||||
Net Asset Value , offering price and redemption price per share ($15,631,989 ÷ 1,115,472 shares) | $ | 14.01 | ||
| Class K : | ||||
Net Asset Value , offering price and redemption price per share ($5,495,081 ÷ 383,476 shares) | $ | 14.33 | ||
| Statement of Operations | ||||
| Amounts in thousands | Six months ended January 31, 2023 (Unaudited) | |||
| Investment Income | ||||
| Dividends | $ | 85,089 | ||
| Interest | 3,424 | |||
| Income from Fidelity Central Funds (including $943 from security lending) | 1,890 | |||
| Total Income | 90,403 | |||
| Expenses | ||||
| Management fee | ||||
| Basic fee | $ | 59,837 | ||
| Performance adjustment | 7,048 | |||
| Transfer agent fees | 11,779 | |||
| Accounting fees | 802 | |||
| Custodian fees and expenses | 128 | |||
| Independent trustees' fees and expenses | 37 | |||
| Registration fees | 64 | |||
| Audit | 66 | |||
| Legal | 20 | |||
| Interest | 77 | |||
| Miscellaneous | 68 | |||
| Total expenses before reductions | 79,926 | |||
| Expense reductions | (391) | |||
| Total expenses after reductions | 79,535 | |||
| Net Investment income (loss) | 10,868 | |||
| Realized and Unrealized Gain (Loss) | ||||
| Net realized gain (loss) on: | ||||
| Investment Securities: | ||||
| Unaffiliated issuers (net of foreign taxes of $932) | (617,150) | |||
| Redemptions in-kind | 2,780 | |||
| Affiliated issuers | (76,619) | |||
| Foreign currency transactions | (80) | |||
| Total net realized gain (loss) | (691,069) | |||
| Change in net unrealized appreciation (depreciation) on: | ||||
| Investment Securities: | ||||
| Unaffiliated issuers (net of decrease in deferred foreign taxes of $4,231) | 247,149 | |||
| Affiliated issuers | 67,617 | |||
| Unfunded commitments | 385 | |||
| Assets and liabilities in foreign currencies | (7) | |||
| Total change in net unrealized appreciation (depreciation) | 315,144 | |||
| Net gain (loss) | (375,925) | |||
| Net increase (decrease) in net assets resulting from operations | $ | (365,057) | ||
| Statement of Changes in Net Assets | ||||
| Amount in thousands | Six months ended January 31, 2023 (Unaudited) | Year ended July 31, 2022 | ||
| Increase (Decrease) in Net Assets | ||||
| Operations | ||||
| Net investment income (loss) | $ | 10,868 | $ | (96,304) |
| Net realized gain (loss) | (691,069) | 1,601,620 | ||
| Change in net unrealized appreciation (depreciation) | 315,144 | (7,437,027) | ||
| Net increase (decrease) in net assets resulting from operations | (365,057) | (5,931,711) | ||
| Distributions to shareholders | (782,062) | (3,357,390) | ||
| Share transactions - net increase (decrease) | (59,144) | 1,278,068 | ||
| Total increase (decrease) in net assets | (1,206,263) | (8,011,033) | ||
| Net Assets | ||||
| Beginning of period | 22,333,333 | 30,344,366 | ||
| End of period | $ | 21,127,070 | $ | 22,333,333 |
| Fidelity® OTC Portfolio |
Six months ended (Unaudited) January 31, 2023 | Years ended July 31, 2022 | 2021 | 2020 | 2019 | 2018 A | |||||||
Selected Per-Share Data | ||||||||||||
| Net asset value, beginning of period | $ | 14.74 | $ | 20.67 | $ | 15.61 | $ | 12.45 | $ | 12.50 | $ | 10.57 |
| Income from Investment Operations | ||||||||||||
Net investment income (loss) B,C | .01 | (.07) | (.06) | (.01) | (.01) | (.02) | ||||||
| Net realized and unrealized gain (loss) | (.22) | (3.60) | 6.21 | 4.14 | .75 | 2.48 | ||||||
| Total from investment operations | (.21) | (3.67) | 6.15 | 4.13 | .74 | 2.46 | ||||||
| Distributions from net investment income | - | - | (.01) | - | - | - | ||||||
| Distributions from net realized gain | (.52) | (2.26) | (1.08) | (.97) | (.79) | (.53) | ||||||
| Total distributions | (.52) | (2.26) | (1.09) | (.97) | (.79) | (.53) | ||||||
| Net asset value, end of period | $ | 14.01 | $ | 14.74 | $ | 20.67 | $ | 15.61 | $ | 12.45 | $ | 12.50 |
Total Return D,E | (1.44)% | (20.30)% | 41.90% | 35.79% | 6.43% | 24.34% | ||||||
Ratios to Average Net Assets C,F,G | ||||||||||||
| Expenses before reductions | .79% H | .81% | .80% | .87% | .88% | .88% | ||||||
| Expenses net of fee waivers, if any | .79% H | .81% | .80% | .87% | .88% | .88% | ||||||
| Expenses net of all reductions | .79% H | .81% | .80% | .87% | .88% | .88% | ||||||
| Net investment income (loss) | .08% H | (.37)% | (.33)% | (.07)% | (.10)% | (.17)% | ||||||
| Supplemental Data | ||||||||||||
| Net assets, end of period (in millions) | $ | 15,632 | $ | 16,626 | $ | 22,273 | $ | 16,817 | $ | 13,166 | $ | 13,340 |
Portfolio turnover rate I,J | 12% H | 32% | 28% | 48% | 34% | 38% |
| Fidelity® OTC Portfolio Class K |
Six months ended (Unaudited) January 31, 2023 | Years ended July 31, 2022 | 2021 | 2020 | 2019 | 2018 A | |||||||
Selected Per-Share Data | ||||||||||||
| Net asset value, beginning of period | $ | 15.06 | $ | 21.06 | $ | 15.88 | $ | 12.64 | $ | 12.67 | $ | 10.70 |
| Income from Investment Operations | ||||||||||||
Net investment income (loss) B,C | .01 | (.05) | (.05) | - D | - D | (.01) | ||||||
| Net realized and unrealized gain (loss) | (.22) | (3.68) | 6.33 | 4.21 | .76 | 2.52 | ||||||
| Total from investment operations | (.21) | (3.73) | 6.28 | 4.21 | .76 | 2.51 | ||||||
| Distributions from net investment income | - | - | (.01) | - D | - | - | ||||||
| Distributions from net realized gain | (.52) | (2.27) | (1.09) | (.97) | (.79) | (.54) | ||||||
| Total distributions | (.52) | (2.27) | (1.10) | (.97) | (.79) | (.54) | ||||||
| Net asset value, end of period | $ | 14.33 | $ | 15.06 | $ | 21.06 | $ | 15.88 | $ | 12.64 | $ | 12.67 |
Total Return E,F | (1.41)% | (20.21)% | 42.05% | 35.94% | 6.50% | 24.48% | ||||||
Ratios to Average Net Assets C,G,H | ||||||||||||
| Expenses before reductions | .70% I | .73% | .72% | .78% | .79% | .78% | ||||||
| Expenses net of fee waivers, if any | .69% I | .73% | .71% | .78% | .79% | .78% | ||||||
| Expenses net of all reductions | .69% I | .73% | .71% | .78% | .78% | .77% | ||||||
| Net investment income (loss) | .18% I | (.29)% | (.25)% | .03% | (.01)% | (.07)% | ||||||
| Supplemental Data | ||||||||||||
| Net assets, end of period (in millions) | $ | 5,495 | $ | 5,707 | $ | 8,072 | $ | 7,074 | $ | 6,752 | $ | 7,288 |
Portfolio turnover rate J,K | 12% I | 32% | 28% | 48% | 34% | 38% |
| Fidelity Central Fund | Investment Manager | Investment Objective | Investment Practices | Expense Ratio A |
| Fidelity Money Market Central Funds | Fidelity Management & Research Company LLC (FMR) | Each fund seeks to obtain a high level of current income consistent with the preservation of capital and liquidity. | Short-term Investments | Less than .005% |
| Asset Type | Fair Value | Valuation Technique(s) | Unobservable Input | Amount or Range/Weighted Average | Impact to Valuation from an Increase in Input A |
| Equities | $634,119 | Market comparable | Enterprise value/EBITDA multiple (EV/EBITDA) | 19.3 | Increase |
| Enterprise value/Revenue multiple (EV/R) | 4.0 - 20.5 / 7.7 | Increase | |||
| Recovery Value | Recovery value | $0.00 - $0.28 / $0.12 | Increase | ||
| Market approach | Transaction price | $50.00 - $215.03 / $103.13 | Increase | ||
| Discount rate | 5.3% - 50.0% / 34.2% | Decrease | |||
| Book value | Book value multiple | 1.5 | Increase | ||
| Black scholes | Discount rate | 3.5% - 4.1% / 3.6% | Increase | ||
| Probability rate | 50.0% | Increase | |||
| Volatility | 65.0% - 80.0% / 78.7% | Increase | |||
| Term | 2.0 - 5.0 / 4.6 | Increase | |||
| Preferred Securities | $2,002 | Market approach | Transaction price | $100.00 | Increase |
| Discount rate | 15.0% | Decrease | |||
| Black scholes | Discount rate | 4.1% | Increase | ||
| Volatility | 70.0% | Increase | |||
| Term | 2.0 | Increase |
| Fidelity OTC Portfolio | $383 |
| Gross unrealized appreciation | $10,273,115 |
| Gross unrealized depreciation | (895,737) |
| Net unrealized appreciation (depreciation) | $9,377,378 |
| Tax cost | $11,846,254 |
| Investment to be Acquired | Commitment Amount | Unrealized Appreciation (Depreciation) | |
| Fidelity OTC Portfolio | Stripe, Inc. | $1,996 | $(1,996) |
| $ Amount | % of Net Assets | |
| Fidelity OTC Portfolio | - A | - B |
| Purchases ($) | Sales ($) | |
| Fidelity OTC Portfolio | 1,225,024 | 1,939,037 |
| Shares | Total net realized gain or loss ($) | Total Proceeds ($) | Participating classes | |
| Fidelity OTC Portfolio | 380 | 2,780 | 4,953 | Class K |
| Shares | Total net realized gain or loss ($) | Total Proceeds ($) | Participating classes | |
| Fidelity OTC Portfolio | 8,242 | 94,841 | 144,799 | Class K |
| Amount | % of Class-Level Average Net Assets A | |
| OTC | $10,657 | .14 |
| Class K | 1,122 | .04 |
| $11,779 |
| % of Average Net Assets | |
| Fidelity OTC Portfolio | .01 |
| Amount | |
| Fidelity OTC Portfolio | $37 |
| Borrower or Lender | Average Loan Balance | Weighted Average Interest Rate | Interest Expense | |
| Fidelity OTC Portfolio | Borrower | $15,456 | 3.54% | $71 |
| Purchases ($) | Sales ($) | Realized Gain (Loss) ($) | |
| Fidelity OTC Portfolio | 42,504 | 107,971 | (68,508) |
| Amount | |
| Fidelity OTC Portfolio | $29 |
| Total Security Lending Fees Paid to NFS | Security Lending Income From Securities Loaned to NFS | Value of Securities Loaned to NFS at Period End | |
| Fidelity OTC Portfolio | $99 | $1 | $- |
| Average Loan Balance | Weighted Average Interest Rate | Interest Expense | |
| Fidelity OTC Portfolio | $11,322 | 3.51% | $6 |
Six months ended January 31, 2023 | Year ended July 31, 2022 | |
| Fidelity OTC Portfolio | ||
| Distributions to shareholders | ||
| OTC | $584,667 | $2,483,169 |
| Class K | 197,395 | 874,221 |
| Total | $782,062 | $3,357,390 |
| Shares | Shares | Dollars | Dollars | |
Six months ended January 31, 2023 | Year ended July 31, 2022 | Six months ended January 31, 2023 | Year ended July 31, 2022 | |
| Fidelity OTC Portfolio | ||||
| OTC | ||||
| Shares sold | 34,405 | 125,949 | $470,364 | $2,274,041 |
| Reinvestment of distributions | 38,691 | 119,609 | 545,928 | 2,344,237 |
| Shares redeemed | (85,356) | (195,138) | (1,147,766) | (3,377,430) |
| Net increase (decrease) | (12,260) | 50,420 | $(131,474) | $1,240,848 |
| Class K | ||||
| Shares sold | 9,293 | 23,252 | $129,268 | $425,759 |
| Reinvestment of distributions | 13,689 | 43,712 | 197,395 | 874,221 |
| Shares redeemed | (18,559) | (71,161) | (254,333) | (1,262,760) |
| Net increase (decrease) | 4,423 | (4,197) | $72,330 | $37,220 |
| The Example is based on an investment of $1,000 invested at the beginning of the period and held for the entire period (August 1, 2022 to January 31, 2023). |
Annualized Expense Ratio- A | Beginning Account Value August 1, 2022 | Ending Account Value January 31, 2023 | Expenses Paid During Period- C August 1, 2022 to January 31, 2023 | |||||||
| Fidelity® OTC Portfolio | ||||||||||
| Fidelity® OTC Portfolio | .79% | |||||||||
| Actual | $ 1,000 | $ 985.60 | $ 3.95 | |||||||
Hypothetical- B | $ 1,000 | $ 1,021.22 | $ 4.02 | |||||||
| Class K | .69% | |||||||||
| Actual | $ 1,000 | $ 985.90 | $ 3.45 | |||||||
Hypothetical- B | $ 1,000 | $ 1,021.73 | $ 3.52 | |||||||
- Highly liquid investments - cash or convertible to cash within three business days or less
- Moderately liquid investments - convertible to cash in three to seven calendar days
- Less liquid investments - can be sold or disposed of, but not settled, within seven calendar days
- Illiquid investments - cannot be sold or disposed of within seven calendar days
|


Contents
Top Holdings (% of Fund's net assets) | ||
| Apple, Inc. | 9.4 | |
| Microsoft Corp. | 7.2 | |
| Amazon.com, Inc. | 7.0 | |
| NVIDIA Corp. | 6.2 | |
| Alphabet, Inc. Class A | 4.3 | |
| Marvell Technology, Inc. | 3.2 | |
| Meta Platforms, Inc. Class A | 3.0 | |
| Tesla, Inc. | 2.7 | |
| Netflix, Inc. | 2.2 | |
| UnitedHealth Group, Inc. | 2.1 | |
| 47.3 | ||
| Market Sectors (% of Fund's net assets) | ||
| Information Technology | 38.0 | |
| Consumer Discretionary | 29.3 | |
| Communication Services | 12.1 | |
| Health Care | 9.9 | |
| Energy | 4.6 | |
| Industrials | 2.4 | |
| Consumer Staples | 1.4 | |
| Financials | 1.1 | |
| Materials | 0.8 | |
| Real Estate | 0.1 | |
| Utilities | 0.0 | |
Asset Allocation (% of Fund's net assets) |
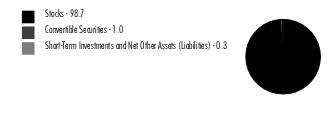 |
Foreign investments - 8.3% |
| Common Stocks - 98.5% | |||
| Shares | Value ($) | ||
| COMMUNICATION SERVICES - 12.0% | |||
| Entertainment - 3.0% | |||
| Activision Blizzard, Inc. | 40,646 | 3,112,264 | |
| Bilibili, Inc. ADR (a) | 116,400 | 2,910,000 | |
| Endeavor Group Holdings, Inc. (a) | 104,195 | 2,337,094 | |
| Netflix, Inc. (a) | 413,282 | 146,243,969 | |
| Sea Ltd. ADR (a) | 577,310 | 37,207,630 | |
| Universal Music Group NV | 347,684 | 8,887,629 | |
| 200,698,586 | |||
| Interactive Media & Services - 8.9% | |||
| Alphabet, Inc. Class A (a) | 2,964,756 | 293,036,483 | |
| Epic Games, Inc. (a)(b)(c) | 607 | 513,443 | |
| Meta Platforms, Inc. Class A (a) | 1,352,722 | 201,514,996 | |
| Pinterest, Inc. Class A (a) | 139,609 | 3,670,321 | |
| Snap, Inc. Class A (a) | 8,664,847 | 100,165,631 | |
| Tencent Holdings Ltd. sponsored ADR (d) | 77,600 | 3,783,000 | |
| 602,683,874 | |||
| Wireless Telecommunication Services - 0.1% | |||
| Rogers Communications, Inc. Class B (non-vtg.) | 13,700 | 666,080 | |
| T-Mobile U.S., Inc. (a) | 43,643 | 6,516,336 | |
| 7,182,416 | |||
TOTAL COMMUNICATION SERVICES | 810,564,876 | ||
| CONSUMER DISCRETIONARY - 29.0% | |||
| Auto Components - 0.1% | |||
| Aptiv PLC (a) | 51,714 | 5,848,336 | |
| Autoliv, Inc. | 3,600 | 331,632 | |
| Mobileye Global, Inc. (d) | 56,620 | 2,185,532 | |
| 8,365,500 | |||
| Automobiles - 2.9% | |||
| Neutron Holdings, Inc. (a)(b)(c) | 491,550 | 11,797 | |
| Rad Power Bikes, Inc. (a)(b)(c) | 101,681 | 408,758 | |
| Rivian Automotive, Inc. (a) | 587,869 | 11,404,659 | |
| Tesla, Inc. (a) | 1,047,471 | 181,442,927 | |
| 193,268,141 | |||
| Diversified Consumer Services - 0.0% | |||
| New Oriental Education & Technology Group, Inc. sponsored ADR (a) | 45,900 | 1,957,176 | |
| Hotels, Restaurants & Leisure - 3.5% | |||
| Airbnb, Inc. Class A (a) | 567,456 | 63,050,036 | |
| Caesars Entertainment, Inc. (a) | 712,742 | 37,105,349 | |
| Chipotle Mexican Grill, Inc. (a) | 3,376 | 5,558,179 | |
| Draftkings Holdings, Inc. (a)(d) | 99,311 | 1,488,672 | |
| Flutter Entertainment PLC (a) | 18,100 | 2,800,480 | |
| Hilton Worldwide Holdings, Inc. | 132,704 | 19,254,023 | |
| Marriott International, Inc. Class A | 215,813 | 37,590,308 | |
| Penn Entertainment, Inc. (a) | 1,247,411 | 44,220,720 | |
| Restaurant Brands International, Inc. | 53,284 | 3,565,349 | |
| Sonder Holdings, Inc.: | |||
| rights (a)(c) | 1,448 | 449 | |
| rights (a)(c) | 1,447 | 376 | |
| rights (a)(c) | 1,447 | 304 | |
| rights (a)(c) | 1,447 | 260 | |
| rights (a)(c) | 1,447 | 217 | |
| rights (a)(c) | 1,447 | 188 | |
| Sweetgreen, Inc. Class A (a) | 1,038,282 | 10,766,984 | |
| Trip.com Group Ltd. ADR (a) | 145,122 | 5,334,685 | |
| Yum China Holdings, Inc. | 71,400 | 4,398,954 | |
| Yum! Brands, Inc. | 17,217 | 2,246,991 | |
| 237,382,524 | |||
| Internet & Direct Marketing Retail - 11.1% | |||
| Alibaba Group Holding Ltd. sponsored ADR (a) | 256,763 | 28,295,283 | |
| Amazon.com, Inc. (a) | 4,571,640 | 471,473,233 | |
| Deliveroo PLC Class A (a)(e) | 1,141,311 | 1,308,008 | |
| FSN E-Commerce Ventures Private Ltd. | 3,776,400 | 6,355,928 | |
| JD.com, Inc. sponsored ADR | 335,496 | 19,972,077 | |
| Lyft, Inc. (a) | 3,485,930 | 56,646,363 | |
| Pinduoduo, Inc. ADR (a) | 169,790 | 16,636,024 | |
| Uber Technologies, Inc. (a) | 4,455,661 | 137,813,595 | |
| Wayfair LLC Class A (a) | 191,790 | 11,603,295 | |
| 750,103,806 | |||
| Multiline Retail - 1.2% | |||
| Dollar Tree, Inc. (a) | 421,067 | 63,235,842 | |
| Ollie's Bargain Outlet Holdings, Inc. (a) | 147,345 | 8,068,612 | |
| Target Corp. | 32,542 | 5,601,780 | |
| 76,906,234 | |||
| Specialty Retail - 5.3% | |||
| American Eagle Outfitters, Inc. | 2,057,748 | 33,212,053 | |
| Bath & Body Works, Inc. | 93,124 | 4,284,635 | |
| Burlington Stores, Inc. (a) | 14,973 | 3,441,245 | |
| Fanatics, Inc. Class A (a)(b)(c) | 225,366 | 18,608,471 | |
| Fast Retailing Co. Ltd. | 1,100 | 668,095 | |
| Five Below, Inc. (a) | 200,589 | 39,542,110 | |
| Foot Locker, Inc. | 114,800 | 4,994,948 | |
| Lowe's Companies, Inc. | 631,772 | 131,566,519 | |
| RH (a)(d) | 128,954 | 40,232,358 | |
| TJX Companies, Inc. | 529,246 | 43,324,078 | |
| Victoria's Secret & Co. (a) | 529,459 | 22,316,697 | |
| Warby Parker, Inc. (a) | 791,230 | 12,778,365 | |
| 354,969,574 | |||
| Textiles, Apparel & Luxury Goods - 4.9% | |||
| Capri Holdings Ltd. (a) | 612,921 | 40,753,117 | |
| Compagnie Financiere Richemont SA Series A | 29,288 | 4,514,960 | |
| Crocs, Inc. (a) | 329,724 | 40,150,491 | |
| Deckers Outdoor Corp. (a) | 132,244 | 56,531,665 | |
| Hermes International SCA | 3,855 | 7,185,406 | |
| lululemon athletica, Inc. (a) | 242,888 | 74,537,469 | |
| LVMH Moet Hennessy Louis Vuitton SE | 25,402 | 22,175,322 | |
| NIKE, Inc. Class B | 591,018 | 75,254,322 | |
| On Holding AG (a) | 427,472 | 9,917,350 | |
| 331,020,102 | |||
TOTAL CONSUMER DISCRETIONARY | 1,953,973,057 | ||
| CONSUMER STAPLES - 1.3% | |||
| Beverages - 1.2% | |||
| Boston Beer Co., Inc. Class A (a) | 33,760 | 13,119,474 | |
| Celsius Holdings, Inc. (a)(d) | 620,814 | 62,280,060 | |
| Constellation Brands, Inc. Class A (sub. vtg.) | 9,449 | 2,187,632 | |
| 77,587,166 | |||
| Food & Staples Retailing - 0.0% | |||
| Costco Wholesale Corp. | 1,294 | 661,415 | |
| Food Products - 0.0% | |||
| Sovos Brands, Inc. (a) | 10,454 | 141,756 | |
| The Real Good Food Co. LLC: | |||
| Class B (c) | 139,521 | 1 | |
| Class B unit (e) | 139,521 | 775,737 | |
| The Real Good Food Co., Inc. (a) | 8,627 | 47,966 | |
| 965,460 | |||
| Household Products - 0.1% | |||
| Procter & Gamble Co. | 32,330 | 4,603,145 | |
| Personal Products - 0.0% | |||
| Estee Lauder Companies, Inc. Class A | 3,140 | 870,031 | |
| Tobacco - 0.0% | |||
| JUUL Labs, Inc. Class A (a)(b)(c) | 23,134 | 280,153 | |
TOTAL CONSUMER STAPLES | 84,967,370 | ||
| ENERGY - 4.6% | |||
| Energy Equipment & Services - 0.2% | |||
| Halliburton Co. | 220,709 | 9,097,625 | |
| Oil, Gas & Consumable Fuels - 4.4% | |||
| Antero Resources Corp. (a) | 348,727 | 10,057,287 | |
| Cenovus Energy, Inc. (Canada) | 334,859 | 6,689,378 | |
| Cheniere Energy, Inc. | 50,008 | 7,640,722 | |
| Denbury, Inc. (a) | 124,790 | 10,829,276 | |
| Devon Energy Corp. | 322,840 | 20,416,402 | |
| Diamondback Energy, Inc. | 230,705 | 33,710,615 | |
| EOG Resources, Inc. | 296,622 | 39,228,260 | |
| EQT Corp. | 70,478 | 2,302,516 | |
| Exxon Mobil Corp. | 220,674 | 25,600,391 | |
| Hess Corp. | 358,499 | 53,832,210 | |
| Marathon Oil Corp. | 382,045 | 10,494,776 | |
| Northern Oil & Gas, Inc. | 83,959 | 2,814,306 | |
| Occidental Petroleum Corp. | 308,337 | 19,977,154 | |
| Ovintiv, Inc. | 41,438 | 2,039,993 | |
| Pioneer Natural Resources Co. | 125,333 | 28,870,457 | |
| Reliance Industries Ltd. | 747,491 | 21,609,007 | |
| Reliance Industries Ltd. sponsored GDR (e) | 37,854 | 2,169,034 | |
| 298,281,784 | |||
TOTAL ENERGY | 307,379,409 | ||
| FINANCIALS - 1.1% | |||
| Banks - 0.4% | |||
| Kotak Mahindra Bank Ltd. | 72,602 | 1,544,710 | |
| Wells Fargo & Co. | 510,574 | 23,930,603 | |
| 25,475,313 | |||
| Consumer Finance - 0.6% | |||
| American Express Co. | 234,464 | 41,014,788 | |
| Diversified Financial Services - 0.1% | |||
| Ant International Co. Ltd. Class C (a)(b)(c) | 403,977 | 638,284 | |
| Berkshire Hathaway, Inc. Class B (a) | 7,627 | 2,375,963 | |
| Housing Development Finance Corp. Ltd. | 65,160 | 2,102,117 | |
| 5,116,364 | |||
| Insurance - 0.0% | |||
| The Travelers Companies, Inc. | 2 | 382 | |
TOTAL FINANCIALS | 71,606,847 | ||
| HEALTH CARE - 9.9% | |||
| Biotechnology - 1.3% | |||
| Alnylam Pharmaceuticals, Inc. (a) | 112,860 | 25,551,504 | |
| Arcutis Biotherapeutics, Inc. (a) | 111,618 | 1,849,510 | |
| Argenx SE ADR (a) | 14,163 | 5,413,807 | |
| Ascendis Pharma A/S sponsored ADR (a) | 68,125 | 8,452,950 | |
| Generation Bio Co. (a) | 114,070 | 673,013 | |
| Karuna Therapeutics, Inc. (a) | 26,677 | 5,319,127 | |
| Moderna, Inc. (a) | 3,140 | 552,828 | |
| Prometheus Biosciences, Inc. (a) | 5,888 | 669,230 | |
| Regeneron Pharmaceuticals, Inc. (a) | 29,822 | 22,619,092 | |
| Vertex Pharmaceuticals, Inc. (a) | 50,678 | 16,374,062 | |
| Verve Therapeutics, Inc. (a)(d) | 73,624 | 1,674,946 | |
| 89,150,069 | |||
| Health Care Equipment & Supplies - 1.5% | |||
| Axonics Modulation Technologies, Inc. (a) | 92,236 | 5,663,290 | |
| Blink Health LLC Series A1 (a)(b)(c) | 5,757 | 248,702 | |
| Boston Scientific Corp. (a) | 340,310 | 15,739,338 | |
| DexCom, Inc. (a) | 441,426 | 47,272,310 | |
| Insulet Corp. (a) | 47,614 | 13,680,454 | |
| Oddity Tech Ltd. (b)(c) | 2,786 | 1,118,245 | |
| Shockwave Medical, Inc. (a) | 90,621 | 17,030,405 | |
| TransMedics Group, Inc. (a) | 17,124 | 1,079,154 | |
| 101,831,898 | |||
| Health Care Providers & Services - 3.0% | |||
| agilon health, Inc. (a) | 61,858 | 1,346,030 | |
| Alignment Healthcare, Inc. (a) | 147,511 | 1,821,761 | |
| Cigna Corp. | 23,097 | 7,314,127 | |
| Elevance Health, Inc. | 6,826 | 3,412,932 | |
| Guardant Health, Inc. (a) | 367,482 | 11,549,959 | |
| Humana, Inc. | 48,952 | 25,048,738 | |
| LifeStance Health Group, Inc. (a) | 183,178 | 967,180 | |
| Surgery Partners, Inc. (a) | 99,782 | 3,312,762 | |
| UnitedHealth Group, Inc. | 289,384 | 144,457,599 | |
| Universal Health Services, Inc. Class B | 12,364 | 1,832,468 | |
| 201,063,556 | |||
| Health Care Technology - 0.0% | |||
| Certara, Inc. (a) | 65,948 | 1,279,391 | |
| MultiPlan Corp. warrants (a)(b) | 13,856 | 57 | |
| 1,279,448 | |||
| Life Sciences Tools & Services - 0.9% | |||
| Danaher Corp. | 110,093 | 29,106,387 | |
| ICON PLC (a) | 17,638 | 4,069,263 | |
| Olink Holding AB ADR (a) | 101,493 | 1,987,233 | |
| Seer, Inc. (a) | 53,618 | 243,962 | |
| Thermo Fisher Scientific, Inc. | 34,265 | 19,542,357 | |
| Veterinary Emergency Group LLC Class A (a)(b)(c)(f) | 62,379 | 3,543,751 | |
| 58,492,953 | |||
| Pharmaceuticals - 3.2% | |||
| AstraZeneca PLC sponsored ADR | 51,378 | 3,358,580 | |
| Eli Lilly & Co. | 347,100 | 119,454,465 | |
| Novo Nordisk A/S: | |||
| Series B | 23,845 | 3,299,907 | |
| Series B sponsored ADR | 194,264 | 26,959,958 | |
| Roche Holding AG (participation certificate) | 8,304 | 2,592,263 | |
| Zoetis, Inc. Class A | 347,629 | 57,529,123 | |
| 213,194,296 | |||
TOTAL HEALTH CARE | 665,012,220 | ||
| INDUSTRIALS - 2.2% | |||
| Aerospace & Defense - 1.2% | |||
| Airbus Group NV | 47,251 | 5,923,663 | |
| Howmet Aerospace, Inc. | 192,631 | 7,838,155 | |
| L3Harris Technologies, Inc. | 22,378 | 4,807,242 | |
| Lockheed Martin Corp. | 12,091 | 5,601,277 | |
| Northrop Grumman Corp. | 9,409 | 4,215,608 | |
| Space Exploration Technologies Corp.: | |||
| Class A (a)(b)(c) | 201,490 | 15,514,730 | |
| Class C (a)(b)(c) | 70,540 | 5,431,580 | |
| The Boeing Co. (a) | 134,566 | 28,662,558 | |
| 77,994,813 | |||
| Air Freight & Logistics - 0.0% | |||
| Delhivery Private Ltd. | 271,900 | 1,007,537 | |
| ZTO Express, Inc. sponsored ADR | 65,300 | 1,861,703 | |
| 2,869,240 | |||
| Airlines - 0.1% | |||
| Delta Air Lines, Inc. (a) | 82,895 | 3,241,195 | |
| United Airlines Holdings, Inc. (a) | 131,703 | 6,448,179 | |
| 9,689,374 | |||
| Commercial Services & Supplies - 0.1% | |||
| ACV Auctions, Inc. Class A (a) | 415,183 | 4,068,793 | |
| Electrical Equipment - 0.4% | |||
| Acuity Brands, Inc. | 112,425 | 21,194,361 | |
| Array Technologies, Inc. (a) | 64,300 | 1,429,389 | |
| Regal Rexnord Corp. | 4,600 | 640,320 | |
| 23,264,070 | |||
| Machinery - 0.2% | |||
| Deere & Co. | 36,507 | 15,436,620 | |
| Professional Services - 0.0% | |||
| Experian PLC | 36,111 | 1,320,561 | |
| Road & Rail - 0.2% | |||
| Avis Budget Group, Inc. (a) | 46,518 | 9,305,461 | |
| Bird Global, Inc. (a)(b) | 201,367 | 47,241 | |
| Bird Global, Inc.: | |||
| Class A (a)(d) | 3,114,083 | 730,564 | |
| Stage 1 rights (a)(c) | 25,742 | 0 | |
| Stage 2 rights (a)(c) | 25,742 | 0 | |
| Stage 3 rights (a)(c) | 25,741 | 0 | |
| Hertz Global Holdings, Inc. (a)(d) | 308,717 | 5,563,080 | |
| 15,646,346 | |||
TOTAL INDUSTRIALS | 150,289,817 | ||
| INFORMATION TECHNOLOGY - 37.6% | |||
| IT Services - 3.0% | |||
| Adyen BV (a)(e) | 995 | 1,504,348 | |
| Block, Inc. Class A (a) | 167,292 | 13,671,102 | |
| Cloudflare, Inc. (a) | 15,723 | 831,904 | |
| MasterCard, Inc. Class A | 286,929 | 106,335,887 | |
| MongoDB, Inc. Class A (a) | 38,632 | 8,275,361 | |
| Okta, Inc. (a) | 224,534 | 16,527,948 | |
| PayPal Holdings, Inc. (a) | 132,263 | 10,778,112 | |
| Shopify, Inc. Class A (a) | 14,400 | 709,637 | |
| Snowflake, Inc. (a) | 43,600 | 6,820,784 | |
| Twilio, Inc. Class A (a) | 193,039 | 11,551,454 | |
| Visa, Inc. Class A | 95,673 | 22,024,881 | |
| X Holdings I, Inc. (b)(c) | 2,471 | 980,320 | |
| 200,011,738 | |||
| Semiconductors & Semiconductor Equipment - 15.2% | |||
| Advanced Micro Devices, Inc. (a) | 670,655 | 50,399,723 | |
| ASML Holding NV | 15,809 | 10,447,220 | |
| Cirrus Logic, Inc. (a) | 113,977 | 10,302,381 | |
| Enphase Energy, Inc. (a) | 35,118 | 7,774,423 | |
| GlobalFoundries, Inc. (a) | 797,439 | 47,272,184 | |
| Lam Research Corp. | 29,883 | 14,944,488 | |
| Marvell Technology, Inc. | 4,990,159 | 215,325,361 | |
| Microchip Technology, Inc. | 36,994 | 2,871,474 | |
| Monolithic Power Systems, Inc. | 36,017 | 15,363,412 | |
| NVIDIA Corp. | 2,126,920 | 415,536,360 | |
| NXP Semiconductors NV | 674,659 | 124,346,400 | |
| onsemi (a) | 688,597 | 50,577,450 | |
| SolarEdge Technologies, Inc. (a) | 17,636 | 5,628,177 | |
| Taiwan Semiconductor Manufacturing Co. Ltd. sponsored ADR | 324,178 | 30,061,026 | |
| Teradyne, Inc. | 266,453 | 27,098,270 | |
| Wolfspeed, Inc. (a) | 3,186 | 245,354 | |
| 1,028,193,703 | |||
| Software - 10.0% | |||
| Bill.Com Holdings, Inc. (a)(d) | 88,970 | 10,286,711 | |
| Confluent, Inc. (a) | 42,800 | 988,680 | |
| Datadog, Inc. Class A (a) | 107,515 | 8,043,197 | |
| HubSpot, Inc. (a) | 79,326 | 27,526,915 | |
| Intuit, Inc. | 74,094 | 31,317,311 | |
| Microsoft Corp. | 1,966,308 | 487,270,785 | |
| Paycom Software, Inc. (a) | 30,047 | 9,733,425 | |
| Pine Labs Private Ltd. (a)(b)(c) | 1,109 | 634,270 | |
| Salesforce.com, Inc. (a) | 360,755 | 60,596,017 | |
| ServiceNow, Inc. (a) | 42,352 | 19,275,666 | |
| Splunk, Inc. (a) | 90,769 | 8,692,947 | |
| Stripe, Inc. Class B (a)(b)(c) | 19,200 | 515,904 | |
| Zoom Video Communications, Inc. Class A (a) | 142,508 | 10,688,100 | |
| 675,569,928 | |||
| Technology Hardware, Storage & Peripherals - 9.4% | |||
| Apple, Inc. | 4,376,165 | 631,436,851 | |
TOTAL INFORMATION TECHNOLOGY | 2,535,212,220 | ||
| MATERIALS - 0.7% | |||
| Chemicals - 0.1% | |||
| Cibus Corp.: | |||
| Series C (a)(b)(c)(f) | 133,810 | 267,620 | |
| Series D (a)(b)(c)(f) | 134,400 | 268,800 | |
| Series E (a)(b)(c)(f) | 232,441 | 464,882 | |
| Series F (a)(b)(c)(f) | 47,626 | 95,252 | |
| Linde PLC | 11,383 | 3,767,090 | |
| 4,863,644 | |||
| Metals & Mining - 0.6% | |||
| Freeport-McMoRan, Inc. | 986,961 | 44,038,200 | |
TOTAL MATERIALS | 48,901,844 | ||
| REAL ESTATE - 0.1% | |||
| Equity Real Estate Investment Trusts (REITs) - 0.0% | |||
| Welltower, Inc. | 9,617 | 721,660 | |
| Real Estate Management & Development - 0.1% | |||
| WeWork, Inc. (a)(d) | 2,109,652 | 3,354,347 | |
TOTAL REAL ESTATE | 4,076,007 | ||
| UTILITIES - 0.0% | |||
| Electric Utilities - 0.0% | |||
| NextEra Energy, Inc. | 17,800 | 1,328,414 | |
| TOTAL COMMON STOCKS (Cost $5,464,934,137) | 6,633,312,081 | ||
| Preferred Stocks - 1.2% | |||
| Shares | Value ($) | ||
| Convertible Preferred Stocks - 1.0% | |||
| COMMUNICATION SERVICES - 0.1% | |||
| Interactive Media & Services - 0.1% | |||
| ByteDance Ltd. Series E1 (a)(b)(c) | 31,950 | 6,323,544 | |
| Reddit, Inc.: | |||
| Series E(a)(b)(c) | 4,835 | 181,554 | |
| Series F(a)(b)(c) | 51,156 | 1,920,908 | |
| 8,426,006 | |||
| CONSUMER DISCRETIONARY - 0.2% | |||
| Automobiles - 0.0% | |||
| Rad Power Bikes, Inc.: | |||
| Series A(a)(b)(c) | 13,256 | 53,289 | |
| Series C(a)(b)(c) | 52,162 | 209,691 | |
| Series D(a)(b)(c) | 102,800 | 413,256 | |
| 676,236 | |||
| Hotels, Restaurants & Leisure - 0.0% | |||
| Discord, Inc. Series I (a)(b)(c) | 700 | 268,093 | |
| Internet & Direct Marketing Retail - 0.1% | |||
| Instacart, Inc.: | |||
| Series H(a)(b)(c) | 27,205 | 1,199,741 | |
| Series I(a)(b)(c) | 13,064 | 576,122 | |
| Meesho Series F (a)(b)(c) | 63,600 | 5,039,028 | |
| 6,814,891 | |||
| Textiles, Apparel & Luxury Goods - 0.1% | |||
| CelLink Corp. Series D (b)(c) | 92,760 | 1,463,753 | |
TOTAL CONSUMER DISCRETIONARY | 9,222,973 | ||
| CONSUMER STAPLES - 0.1% | |||
| Food & Staples Retailing - 0.1% | |||
| GoBrands, Inc.: | |||
| Series G(a)(b)(c) | 18,300 | 2,881,152 | |
| Series H(a)(b)(c) | 11,467 | 1,805,364 | |
| 4,686,516 | |||
| Food Products - 0.0% | |||
| AgBiome LLC Series C (a)(b)(c) | 68,700 | 448,611 | |
| Bowery Farming, Inc. Series C1 (a)(b)(c) | 17,874 | 363,021 | |
| 811,632 | |||
| Tobacco - 0.0% | |||
| JUUL Labs, Inc. Series E (a)(b)(c) | 12,508 | 151,472 | |
TOTAL CONSUMER STAPLES | 5,649,620 | ||
| HEALTH CARE - 0.0% | |||
| Health Care Equipment & Supplies - 0.0% | |||
| Blink Health LLC Series C (a)(b)(c) | 16,970 | 733,104 | |
| INDUSTRIALS - 0.2% | |||
| Aerospace & Defense - 0.2% | |||
| ABL Space Systems: | |||
| Series B(a)(b)(c) | 29,724 | 1,093,249 | |
| Series B2(a)(b)(c) | 17,155 | 623,070 | |
| Relativity Space, Inc. Series E (a)(b)(c) | 276,014 | 5,271,867 | |
| Space Exploration Technologies Corp. Series N (a)(b)(c) | 8,141 | 6,268,570 | |
| 13,256,756 | |||
| Construction & Engineering - 0.0% | |||
| Beta Technologies, Inc. Series A (a)(b)(c) | 11,104 | 845,236 | |
TOTAL INDUSTRIALS | 14,101,992 | ||
| INFORMATION TECHNOLOGY - 0.3% | |||
| Electronic Equipment & Components - 0.0% | |||
| Enevate Corp. Series E (a)(b)(c) | 1,325,513 | 729,032 | |
| Menlo Micro, Inc. Series C (b)(c) | 560,500 | 633,365 | |
| 1,362,397 | |||
| IT Services - 0.0% | |||
| Yanka Industries, Inc. Series F (a)(b)(c) | 55,991 | 605,823 | |
| Semiconductors & Semiconductor Equipment - 0.2% | |||
| Alif Semiconductor Series C (b)(c) | 47,598 | 800,598 | |
| Astera Labs, Inc.: | |||
| Series A(b)(c) | 84,721 | 853,140 | |
| Series B(b)(c) | 14,425 | 145,260 | |
| Series C(a)(b)(c) | 180,900 | 1,821,663 | |
| Series D(b)(c) | 330,609 | 3,329,233 | |
| GaN Systems, Inc.: | |||
| Series F1(a)(b)(c) | 78,477 | 420,637 | |
| Series F2(a)(b)(c) | 41,439 | 222,113 | |
| SiMa.ai: | |||
| Series B(a)(b)(c) | 313,000 | 2,028,240 | |
| Series B1(b)(c) | 20,966 | 157,874 | |
| Xsight Labs Ltd. Series D (a)(b)(c) | 130,900 | 1,006,621 | |
| 10,785,379 | |||
| Software - 0.1% | |||
| Algolia, Inc. Series D (a)(b)(c) | 30,436 | 476,932 | |
| Bolt Technology OU Series E (a)(b)(c) | 20,165 | 2,775,154 | |
| Databricks, Inc.: | |||
| Series G(a)(b)(c) | 48,000 | 2,362,080 | |
| Series H(a)(b)(c) | 31,572 | 1,553,658 | |
| Mountain Digital, Inc. Series D (a)(b)(c) | 62,139 | 699,685 | |
| Skyryse, Inc. Series B (a)(b)(c) | 67,400 | 1,362,828 | |
| Stripe, Inc. Series H (a)(b)(c) | 8,086 | 217,271 | |
| Tenstorrent, Inc. Series C1 (a)(b)(c) | 8,600 | 448,748 | |
| 9,896,356 | |||
TOTAL INFORMATION TECHNOLOGY | 22,649,955 | ||
| MATERIALS - 0.1% | |||
| Metals & Mining - 0.1% | |||
| Diamond Foundry, Inc. Series C (a)(b)(c) | 249,802 | 8,860,477 | |
| UTILITIES - 0.0% | |||
| Independent Power and Renewable Electricity Producers - 0.0% | |||
| Redwood Materials Series C (a)(b)(c) | 37,990 | 1,120,705 | |
| TOTAL CONVERTIBLE PREFERRED STOCKS | 70,764,832 | ||
| Nonconvertible Preferred Stocks - 0.2% | |||
| CONSUMER DISCRETIONARY - 0.1% | |||
| Automobiles - 0.0% | |||
| Neutron Holdings, Inc.: | |||
| Series 1C(a)(b)(c) | 3,178,083 | 76,274 | |
| Series 1D(a)(b)(c) | 5,904,173 | 141,700 | |
| Waymo LLC Series A2 (a)(b)(c) | 7,817 | 378,421 | |
| 596,395 | |||
| Internet & Direct Marketing Retail - 0.1% | |||
| Circle Internet Financial Ltd. Series E (b)(c) | 137,547 | 4,649,089 | |
| ZKH Group Ltd. Series F (c) | 2,521,782 | 1,185,238 | |
| 5,834,327 | |||
TOTAL CONSUMER DISCRETIONARY | 6,430,722 | ||
| INFORMATION TECHNOLOGY - 0.1% | |||
| IT Services - 0.0% | |||
| Gupshup, Inc. (a)(b)(c) | 78,911 | 1,436,180 | |
| Software - 0.1% | |||
| Pine Labs Private Ltd.: | |||
| Series 1(a)(b)(c) | 2,652 | 1,516,758 | |
| Series A(a)(b)(c) | 663 | 379,190 | |
| Series B(a)(b)(c) | 721 | 412,362 | |
| Series B2(a)(b)(c) | 583 | 333,435 | |
| Series C(a)(b)(c) | 1,085 | 620,544 | |
| Series C1(a)(b)(c) | 228 | 130,400 | |
| Series D(a)(b)(c) | 244 | 139,551 | |
| 3,532,240 | |||
TOTAL INFORMATION TECHNOLOGY | 4,968,420 | ||
| TOTAL NONCONVERTIBLE PREFERRED STOCKS | 11,399,142 | ||
| TOTAL PREFERRED STOCKS (Cost $89,192,887) | 82,163,974 | ||
| Convertible Bonds - 0.0% | |||
Principal Amount (g) | Value ($) | ||
| CONSUMER DISCRETIONARY - 0.0% | |||
| Automobiles - 0.0% | |||
| Neutron Holdings, Inc.: | |||
| 4% 10/27/25 (b)(c)(h) | 2,430,300 | 2,243,896 | |
| 4% 5/22/27 (b)(c) | 237,400 | 228,782 | |
| 4% 6/12/27 (b)(c) | 64,200 | 61,870 | |
| (Cost $2,731,900) | 2,534,548 | ||
| Preferred Securities - 0.0% | |||
Principal Amount (g) | Value ($) | ||
| INFORMATION TECHNOLOGY - 0.0% | |||
| Semiconductors & Semiconductor Equipment - 0.0% | |||
| GaN Systems, Inc. 0% (b)(c)(i) | 1,839,388 | 1,137,662 | |
| Software - 0.0% | |||
| Tenstorrent, Inc. 0% (b)(c)(i) | 480,000 | 421,440 | |
| TOTAL PREFERRED SECURITIES (Cost $2,319,388) | 1,559,102 | ||
| Money Market Funds - 1.5% | |||
| Shares | Value ($) | ||
| Fidelity Cash Central Fund 4.38% (j) | 20,110,971 | 20,114,993 | |
| Fidelity Securities Lending Cash Central Fund 4.38% (j)(k) | 77,344,037 | 77,351,772 | |
| TOTAL MONEY MARKET FUNDS (Cost $97,466,765) | 97,466,765 | ||
| TOTAL INVESTMENT IN SECURITIES - 101.2% (Cost $5,656,645,077) | 6,817,036,470 |
NET OTHER ASSETS (LIABILITIES) - (1.2)% | (78,525,603) |
| NET ASSETS - 100.0% | 6,738,510,867 |
| (a) | Non-income producing |
| (b) | Restricted securities (including private placements) - Investment in securities not registered under the Securities Act of 1933 (excluding 144A issues). At the end of the period, the value of restricted securities (excluding 144A issues) amounted to $134,664,646 or 2.0% of net assets. |
| (c) | Level 3 security |
| (d) | Security or a portion of the security is on loan at period end. |
| (e) | Security exempt from registration under Rule 144A of the Securities Act of 1933. These securities may be resold in transactions exempt from registration, normally to qualified institutional buyers. At the end of the period, the value of these securities amounted to $5,757,127 or 0.1% of net assets. |
| (f) | Investment is owned by a wholly-owned subsidiary (Subsidiary) that is treated as a corporation for U.S. tax purposes. |
| (g) | Amount is stated in United States dollars unless otherwise noted. |
| (h) | Security initially issued at one coupon which converts to a higher coupon at a specified date. The rate shown is the rate at period end. |
| (i) | Security is perpetual in nature with no stated maturity date. |
| (j) | Affiliated fund that is generally available only to investment companies and other accounts managed by Fidelity Investments. The rate quoted is the annualized seven-day yield of the fund at period end. A complete unaudited listing of the fund's holdings as of its most recent quarter end is available upon request. In addition, each Fidelity Central Fund's financial statements are available on the SEC's website or upon request. |
| (k) | Investment made with cash collateral received from securities on loan. |
| Additional information on each restricted holding is as follows: | ||
| Security | Acquisition Date | Acquisition Cost ($) |
| ABL Space Systems Series B | 3/24/21 | 1,338,638 |
| ABL Space Systems Series B2 | 10/22/21 | 1,166,473 |
| AgBiome LLC Series C | 6/29/18 | 435,125 |
| Algolia, Inc. Series D | 7/23/21 | 890,102 |
| Alif Semiconductor Series C | 3/08/22 | 966,170 |
| Ant International Co. Ltd. Class C | 5/16/18 | 1,539,709 |
| Astera Labs, Inc. Series A | 5/17/22 | 861,570 |
| Astera Labs, Inc. Series B | 5/17/22 | 146,695 |
| Astera Labs, Inc. Series C | 8/24/21 | 608,150 |
| Astera Labs, Inc. Series D | 5/17/22 - 5/27/22 | 3,362,128 |
| Beta Technologies, Inc. Series A | 4/09/21 | 813,590 |
| Bird Global, Inc. | 5/11/21 | 2,013,670 |
| Blink Health LLC Series A1 | 12/30/20 | 155,957 |
| Blink Health LLC Series C | 11/07/19 - 7/14/21 | 647,847 |
| Bolt Technology OU Series E | 1/03/22 | 5,238,796 |
| Bowery Farming, Inc. Series C1 | 5/18/21 | 1,076,896 |
| ByteDance Ltd. Series E1 | 11/18/20 | 3,500,895 |
| CelLink Corp. Series D | 1/20/22 | 1,931,625 |
| Cibus Corp. Series C | 2/16/18 | 281,001 |
| Cibus Corp. Series D | 5/10/19 | 168,000 |
| Cibus Corp. Series E | 6/23/21 | 409,096 |
| Cibus Corp. Series F | 12/02/22 | 95,252 |
| Circle Internet Financial Ltd. Series E | 5/11/21 | 2,232,400 |
| Databricks, Inc. Series G | 2/01/21 | 2,837,886 |
| Databricks, Inc. Series H | 8/31/21 | 2,320,041 |
| Diamond Foundry, Inc. Series C | 3/15/21 | 5,995,248 |
| Discord, Inc. Series I | 9/15/21 | 385,437 |
| Enevate Corp. Series E | 1/29/21 | 1,469,576 |
| Epic Games, Inc. | 7/30/20 | 349,025 |
| Fanatics, Inc. Class A | 8/13/20 - 10/24/22 | 10,009,624 |
| GaN Systems, Inc. Series F1 | 11/30/21 | 665,485 |
| GaN Systems, Inc. Series F2 | 11/30/21 | 351,403 |
| GaN Systems, Inc. 0% | 11/30/21 | 1,839,388 |
| GoBrands, Inc. Series G | 3/02/21 | 4,569,827 |
| GoBrands, Inc. Series H | 7/22/21 | 4,454,821 |
| Gupshup, Inc. | 6/08/21 | 1,804,316 |
| Instacart, Inc. Series H | 11/13/20 | 1,632,300 |
| Instacart, Inc. Series I | 2/26/21 | 1,633,000 |
| JUUL Labs, Inc. Class A | 12/20/17 - 7/06/18 | 645,585 |
| JUUL Labs, Inc. Series E | 12/20/17 - 7/06/18 | 342,963 |
| Meesho Series F | 9/21/21 | 4,876,358 |
| Menlo Micro, Inc. Series C | 2/09/22 | 742,943 |
| Mountain Digital, Inc. Series D | 11/05/21 | 1,427,041 |
| MultiPlan Corp. warrants | 10/08/20 | 0 |
| Neutron Holdings, Inc. | 2/04/21 | 4,916 |
| Neutron Holdings, Inc. Series 1C | 7/03/18 | 581,081 |
| Neutron Holdings, Inc. Series 1D | 1/25/19 | 1,431,762 |
| Neutron Holdings, Inc. 4% 10/27/25 | 10/29/21 | 2,430,300 |
| Neutron Holdings, Inc. 4% 5/22/27 | 6/04/20 | 237,400 |
| Neutron Holdings, Inc. 4% 6/12/27 | 6/12/20 | 64,200 |
| Oddity Tech Ltd. | 1/06/22 | 1,199,122 |
| Pine Labs Private Ltd. | 6/30/21 | 413,502 |
| Pine Labs Private Ltd. Series 1 | 6/30/21 | 988,825 |
| Pine Labs Private Ltd. Series A | 6/30/21 | 247,206 |
| Pine Labs Private Ltd. Series B | 6/30/21 | 268,832 |
| Pine Labs Private Ltd. Series B2 | 6/30/21 | 217,377 |
| Pine Labs Private Ltd. Series C | 6/30/21 | 404,553 |
| Pine Labs Private Ltd. Series C1 | 6/30/21 | 85,012 |
| Pine Labs Private Ltd. Series D | 6/30/21 | 90,978 |
| Rad Power Bikes, Inc. | 1/21/21 | 490,493 |
| Rad Power Bikes, Inc. Series A | 1/21/21 | 63,945 |
| Rad Power Bikes, Inc. Series C | 1/21/21 | 251,621 |
| Rad Power Bikes, Inc. Series D | 9/17/21 | 985,215 |
| Reddit, Inc. Series E | 5/18/21 | 205,363 |
| Reddit, Inc. Series F | 8/11/21 | 3,161,154 |
| Redwood Materials Series C | 5/28/21 | 1,800,858 |
| Relativity Space, Inc. Series E | 5/27/21 | 6,302,807 |
| SiMa.ai Series B | 5/10/21 | 1,604,876 |
| SiMa.ai Series B1 | 4/25/22 | 148,668 |
| Skyryse, Inc. Series B | 10/21/21 | 1,663,430 |
| Space Exploration Technologies Corp. Class A | 2/16/21 - 12/15/22 | 14,140,734 |
| Space Exploration Technologies Corp. Class C | 12/15/22 | 5,431,580 |
| Space Exploration Technologies Corp. Series N | 8/04/20 | 2,198,070 |
| Stripe, Inc. Class B | 5/18/21 | 770,465 |
| Stripe, Inc. Series H | 3/15/21 | 324,451 |
| Tenstorrent, Inc. Series C1 | 4/23/21 | 511,307 |
| Tenstorrent, Inc. 0% | 4/23/21 | 480,000 |
| Veterinary Emergency Group LLC Class A | 9/16/21 - 3/17/22 | 2,587,644 |
| Waymo LLC Series A2 | 5/08/20 | 671,224 |
| X Holdings I, Inc. | 10/25/22 | 2,471,000 |
| Xsight Labs Ltd. Series D | 2/16/21 | 1,046,676 |
| Yanka Industries, Inc. Series F | 4/08/21 | 1,784,814 |
| Affiliate | Value, beginning of period ($) | Purchases ($) | Sales Proceeds ($) | Dividend Income ($) | Realized Gain (loss) ($) | Change in Unrealized appreciation (depreciation) ($) | Value, end of period ($) | % ownership, end of period |
| Fidelity Cash Central Fund 4.38% | 91,389,124 | 317,678,012 | 388,952,143 | 730,782 | - | - | 20,114,993 | 0.0% |
| Fidelity Securities Lending Cash Central Fund 4.38% | 84,008,097 | 311,782,758 | 318,439,083 | 253,643 | - | - | 77,351,772 | 0.3% |
| Total | 175,397,221 | 629,460,770 | 707,391,226 | 984,425 | - | - | 97,466,765 | |
| Valuation Inputs at Reporting Date: | ||||
| Description | Total ($) | Level 1 ($) | Level 2 ($) | Level 3 ($) |
Investments in Securities: | ||||
| Equities: | ||||
Communication Services | 818,990,882 | 801,163,804 | 8,887,629 | 8,939,449 |
Consumer Discretionary | 1,969,626,752 | 1,901,227,932 | 33,714,305 | 34,684,515 |
Consumer Staples | 90,616,990 | 84,687,216 | - | 5,929,774 |
Energy | 307,379,409 | 285,770,402 | 21,609,007 | - |
Financials | 71,606,847 | 67,321,736 | 3,646,827 | 638,284 |
Health Care | 665,745,324 | 654,209,295 | 5,892,227 | 5,643,802 |
Industrials | 164,391,809 | 121,091,746 | 8,251,761 | 35,048,302 |
Information Technology | 2,562,830,595 | 2,531,577,378 | 1,504,348 | 29,748,869 |
Materials | 57,762,321 | 47,805,290 | - | 9,957,031 |
Real Estate | 4,076,007 | 4,076,007 | - | - |
Utilities | 2,449,119 | 1,328,414 | - | 1,120,705 |
| Corporate Bonds | 2,534,548 | - | - | 2,534,548 |
| Preferred Securities | 1,559,102 | - | - | 1,559,102 |
| Money Market Funds | 97,466,765 | 97,466,765 | - | - |
| Total Investments in Securities: | 6,817,036,470 | 6,597,725,985 | 83,506,104 | 135,804,381 |
| Net Unrealized Depreciation on Unfunded Commitments | (244,073) | - | - | (244,073) |
| Total | (244,073) | - | - | (244,073) |
| Investments in Securities: | |||
| Beginning Balance | $ | 115,038,369 | |
| Net Realized Gain (Loss) on Investment Securities | - | ||
| Net Unrealized Gain (Loss) on Investment Securities | (3,697,353) | ||
| Cost of Purchases | 18,350,230 | ||
| Proceeds of Sales | (564,345) | ||
| Amortization/Accretion | - | ||
| Transfers into Level 3 | 8,104,517 | ||
| Transfers out of Level 3 | (1,427,037) | ||
| Ending Balance | $ | 135,804,381 | |
| The change in unrealized gain (loss) for the period attributable to Level 3 securities held at January 31, 2023 | $ | (3,697,353) | |
| The information used in the above reconciliation represents fiscal year to date activity for any Investments in Securities identified as using Level 3 inputs at either the beginning or the end of the current fiscal period. Cost of purchases and proceeds of sales may include securities received and/or delivered through in-kind transactions. Transfers into Level 3 were attributable to a lack of observable market data resulting from decreases in market activity, decreases in liquidity, security restructurings or corporate actions. Transfers out of Level 3 were attributable to observable market data becoming available for those securities. Transfers in or out of Level 3 represent the beginning value of any Security or Instrument where a change in the pricing level occurred from the beginning to the end of the period. The cost of purchases and the proceeds of sales may include securities received or delivered through corporate actions or exchanges. Realized and unrealized gains (losses) disclosed in the reconciliation are included in Net Gain (Loss) on the Fund's Statement of Operations. | |||
| Statement of Assets and Liabilities | ||||
January 31, 2023 (Unaudited) | ||||
| Assets | ||||
| Investment in securities, at value (including securities loaned of $75,532,662) - See accompanying schedule: | ||||
Unaffiliated issuers (cost $5,559,178,312) | $ | 6,719,569,705 | ||
Fidelity Central Funds (cost $97,466,765) | 97,466,765 | |||
| Total Investment in Securities (cost $5,656,645,077) | $ | 6,817,036,470 | ||
| Foreign currency held at value (cost $710,616) | 710,616 | |||
| Receivable for investments sold | 6,402,856 | |||
| Receivable for fund shares sold | 7,799,893 | |||
| Dividends receivable | 1,569,198 | |||
| Interest receivable | 106,603 | |||
| Distributions receivable from Fidelity Central Funds | 77,305 | |||
Total assets | 6,833,702,941 | |||
| Liabilities | ||||
| Payable to custodian bank | $ | 564,345 | ||
| Payable for investments purchased | 4,019,463 | |||
| Unrealized depreciation on unfunded commitments | 244,073 | |||
| Payable for fund shares redeemed | 9,101,323 | |||
| Accrued management fee | 2,367,188 | |||
| Other payables and accrued expenses | 1,541,182 | |||
| Collateral on securities loaned | 77,354,500 | |||
| Total Liabilities | 95,192,074 | |||
| Net Assets | $ | 6,738,510,867 | ||
| Net Assets consist of: | ||||
| Paid in capital | $ | 5,923,964,701 | ||
| Total accumulated earnings (loss) | 814,546,166 | |||
| Net Assets | $ | 6,738,510,867 | ||
Net Asset Value , offering price and redemption price per share ($6,738,510,867 ÷ 344,799,314 shares) | $ | 19.54 | ||
| Statement of Operations | ||||
Six months ended January 31, 2023 (Unaudited) | ||||
| Investment Income | ||||
| Dividends | $ | 21,776,015 | ||
| Interest | 5,323 | |||
| Income from Fidelity Central Funds (including $253,643 from security lending) | 984,425 | |||
| Total Income | 22,765,763 | |||
| Expenses | ||||
| Management fee | $ | 14,474,260 | ||
| Independent trustees' fees and expenses | 11,259 | |||
| Interest | 9,317 | |||
| Total expenses before reductions | 14,494,836 | |||
| Expense reductions | (265) | |||
| Total expenses after reductions | 14,494,571 | |||
| Net Investment income (loss) | 8,271,192 | |||
| Realized and Unrealized Gain (Loss) | ||||
| Net realized gain (loss) on: | ||||
| Investment Securities: | ||||
| Unaffiliated issuers (net of foreign taxes of $812) | (132,041,753) | |||
| Redemptions in-kind | 28,713,489 | |||
| Foreign currency transactions | 4,152 | |||
| Total net realized gain (loss) | (103,324,112) | |||
| Change in net unrealized appreciation (depreciation) on: | ||||
| Investment Securities: | ||||
| Unaffiliated issuers (net of decrease in deferred foreign taxes of $572,216) | (120,119,027) | |||
| Unfunded commitments | 47,139 | |||
| Assets and liabilities in foreign currencies | (1,720) | |||
| Total change in net unrealized appreciation (depreciation) | (120,073,608) | |||
| Net gain (loss) | (223,397,720) | |||
| Net increase (decrease) in net assets resulting from operations | $ | (215,126,528) | ||
| Statement of Changes in Net Assets | ||||
Six months ended January 31, 2023 (Unaudited) | Year ended July 31, 2022 | |||
| Increase (Decrease) in Net Assets | ||||
| Operations | ||||
| Net investment income (loss) | $ | 8,271,192 | $ | 715,037 |
| Net realized gain (loss) | (103,324,112) | (122,785,158) | ||
| Change in net unrealized appreciation (depreciation) | (120,073,608) | (1,443,162,254) | ||
| Net increase (decrease) in net assets resulting from operations | (215,126,528) | (1,565,232,375) | ||
| Distributions to shareholders | (7,284,411) | (450,387,568) | ||
| Share transactions | ||||
| Proceeds from sales of shares | 911,254,654 | 3,628,936,951 | ||
| Reinvestment of distributions | 7,274,331 | 450,387,568 | ||
| Cost of shares redeemed | (778,891,660) | (1,698,109,014) | ||
Net increase (decrease) in net assets resulting from share transactions | 139,637,325 | 2,381,215,505 | ||
| Total increase (decrease) in net assets | (82,773,614) | 365,595,562 | ||
| Net Assets | ||||
| Beginning of period | 6,821,284,481 | 6,455,688,919 | ||
| End of period | $ | 6,738,510,867 | $ | 6,821,284,481 |
| Other Information | ||||
| Shares | ||||
| Sold | 49,006,367 | 162,418,203 | ||
| Issued in reinvestment of distributions | 380,059 | 16,489,637 | ||
| Redeemed | (42,378,223) | (72,616,870) | ||
| Net increase (decrease) | 7,008,203 | 106,290,970 | ||
| Fidelity® Blue Chip Growth K6 Fund |
Six months ended (Unaudited) January 31, 2023 | Years ended July 31, 2022 | 2021 | 2020 | 2019 | 2018 | |||||||
Selected Per-Share Data | ||||||||||||
| Net asset value, beginning of period | $ | 20.19 | $ | 27.89 | $ | 19.32 | $ | 13.69 | $ | 12.79 | $ | 10.32 |
| Income from Investment Operations | ||||||||||||
Net investment income (loss) A,B | .02 | - C | (.03) | .03 | .04 | .05 D | ||||||
| Net realized and unrealized gain (loss) | (.65) | (5.83) | 8.91 | 5.64 | .91 | 2.44 | ||||||
| Total from investment operations | (.63) | (5.83) | 8.88 | 5.67 | .95 | 2.49 | ||||||
| Distributions from net investment income | (.02) | - | (.02) | (.04) | (.05) | (.01) | ||||||
| Distributions from net realized gain | - | (1.87) | (.29) | - C | - | - C | ||||||
| Total distributions | (.02) | (1.87) | (.31) | (.04) | (.05) | (.02) E | ||||||
| Net asset value, end of period | $ | 19.54 | $ | 20.19 | $ | 27.89 | $ | 19.32 | $ | 13.69 | $ | 12.79 |
Total Return F,G | (3.11)% | (22.62)% | 46.28% | 41.55% | 7.48% | 24.10% | ||||||
Ratios to Average Net Assets B,H,I | ||||||||||||
| Expenses before reductions | .45% J | .45% | .45% | .45% | .45% | .45% | ||||||
| Expenses net of fee waivers, if any | .45% J | .45% | .45% | .45% | .45% | .45% | ||||||
| Expenses net of all reductions | .45% J | .45% | .45% | .45% | .45% | .45% | ||||||
| Net investment income (loss) | .26% J | .01% | (.10)% | .19% | .34% | .45% D | ||||||
| Supplemental Data | ||||||||||||
| Net assets, end of period (000 omitted) | $ | 6,738,511 | $ | 6,821,284 | $ | 6,455,689 | $ | 3,854,348 | $ | 2,290,237 | $ | 1,680,044 |
Portfolio turnover rate K | 22% J,L | 37% L | 44% L | 49% L | 51% L | 40% L |
| Fidelity Central Fund | Investment Manager | Investment Objective | Investment Practices | Expense Ratio A |
| Fidelity Money Market Central Funds | Fidelity Management & Research Company LLC (FMR) | Each fund seeks to obtain a high level of current income consistent with the preservation of capital and liquidity. | Short-term Investments | Less than .005% |
| Asset Type | Fair Value | Valuation Technique(s) | Unobservable Input | Amount or Range/Weighted Average | Impact to Valuation from an Increase in Input A |
| Equities | $131,710,731 | Market comparable | Enterprise value/EBITDA multiple (EV/EBITDA) | 6.0 - 23.0 / 8.1 | Increase |
| Enterprise value/Revenue multiple (EV/R) | 2.0 - 25.0 / 7.3 | Increase | |||
| Enterprise value/Gross profit multiple (EV/GP) | 7.5 | Increase | |||
| Probability rate | 25.0% - 75.0% / 50.0% | Increase | |||
| Recovery value | Recovery value | $0.00 | Increase | ||
| Market approach | Transaction price | $1.11 - $91.72 / $16.63 | Increase | ||
| Discount rate | 5.0% - 50.0% / 24.2% | Decrease | |||
| Premium rate | 10.0% | Increase | |||
| Book value | Book value multiple | 1.5 | Increase | ||
| Discounted cash flow | Weight average cost of capital (WACC) | 25.0% - 36.3% / 30.4% | Decrease | ||
| Exit multiple | 1.8 - 7.3 / 3.1 | Increase | |||
| Black scholes | Discount rate | 3.5% - 4.1% / 3.7% | Increase | ||
| Probability rate | 50.0% | Increase | |||
| Volatility | 50.0% - 100.0% / 69.9% | Increase | |||
| Term | 2.0 - 5.0 / 3.9 | Increase | |||
| Corporate Bonds | $2,534,548 | Market comparable | Enterprise value/Revenue multiple (EV/R) | 3.0 | Increase |
| Discount rate | 29.2% | Decrease | |||
| Probability rate | 10.0% - 50.0% / 33.3% | Increase | |||
| Black scholes | Volatility | 75.0% | Increase | ||
| Term | 0.9 | Increase | |||
| Preferred Securities | $1,559,102 | Market comparable | Enterprise value/Revenue multiple (EV/R) | 4.6 | Increase |
| Probability rate | 10.0% - 90.0% / 50.0% | Increase | |||
| Market approach | Transaction price | $100.00 | Increase | ||
| Discount rate | 15.0% | Decrease | |||
| Black scholes | Discount rate | 4.1% | Increase | ||
| Volatility | 70.0% | Increase | |||
| Term | 2.0 | Increase |
| Gross unrealized appreciation | $1,706,736,136 |
| Gross unrealized depreciation | (568,907,979) |
| Net unrealized appreciation (depreciation) | $1,137,828,157 |
| Tax cost | $5,678,964,240 |
| Investment to be Acquired | Commitment Amount | Unrealized Appreciation (Depreciation) | |
| Fidelity Blue Chip Growth K6 Fund | Stripe, Inc. | $244,073 | $(244,073) |
| $ Amount | % of Net Assets | |
| Fidelity Blue Chip Growth K6 Fund | 4,640,305 | .07 |
| Purchases ($) | Sales ($) | |
| Fidelity Blue Chip Growth K6 Fund | 943,202,645 | 694,769,085 |
| Shares | Total net realized gain or loss ($) | Total Proceeds ($) | |
| Fidelity Blue Chip Growth K6 Fund | 4,451,595 | 28,713,489 | 77,012,597 |
| Shares | Total Proceeds ($) | |
| Fidelity Blue Chip Growth K6 Fund | 3,026,462 | 53,810,496 |
| Shares | Total net realized gain or loss ($) | Total Proceeds ($) | |
| Fidelity Blue Chip Growth K6 Fund | 3,743,610 | 60,349,449 | 101,901,059 |
| Shares | Total Proceeds ($) | |
| Fidelity Blue Chip Growth K6 Fund | 63,577,402 | 1,334,865,017 |
| Amount | |
| Fidelity Blue Chip Growth K6 Fund | $20,852 |
| Borrower or Lender | Average Loan Balance | Weighted Average Interest Rate | Interest Expense | |
| Fidelity Blue Chip Growth K6 Fund | Borrower | $4,788,188 | 4.38% | $9,317 |
| Purchases ($) | Sales ($) | Realized Gain (Loss) ($) | |
| Fidelity Blue Chip Growth K6 Fund | 102,005,589 | 26,066,112 | (8,944,885) |
| Total Security Lending Fees Paid to NFS | Security Lending Income From Securities Loaned to NFS | Value of Securities Loaned to NFS at Period End | |
| Fidelity Blue Chip Growth K6 Fund | $26,693 | $16,465 | $81,570 |
| The Example is based on an investment of $1,000 invested at the beginning of the period and held for the entire period (August 1, 2022 to January 31, 2023). |
Annualized Expense Ratio- A | Beginning Account Value August 1, 2022 | Ending Account Value January 31, 2023 | Expenses Paid During Period- C August 1, 2022 to January 31, 2023 | |||||||
| Fidelity® Blue Chip Growth K6 Fund | .45% | |||||||||
| Actual | $ 1,000 | $ 968.90 | $ 2.23 | |||||||
Hypothetical- B | $ 1,000 | $ 1,022.94 | $ 2.29 | |||||||
- Highly liquid investments - cash or convertible to cash within three business days or less
- Moderately liquid investments - convertible to cash in three to seven calendar days
- Less liquid investments - can be sold or disposed of, but not settled, within seven calendar days
- Illiquid investments - cannot be sold or disposed of within seven calendar days
|


Contents
Top Holdings (% of Fund's net assets) | ||
| Microsoft Corp. | 5.2 | |
| UnitedHealth Group, Inc. | 2.2 | |
| Visa, Inc. Class A | 2.1 | |
| Cigna Corp. | 2.1 | |
| Bristol-Myers Squibb Co. | 1.6 | |
| The Boeing Co. | 1.5 | |
| Allison Transmission Holdings, Inc. | 1.5 | |
| Keurig Dr. Pepper, Inc. | 1.5 | |
| Energy Transfer LP | 1.4 | |
| Exxon Mobil Corp. | 1.4 | |
| 20.5 | ||
| Market Sectors (% of Fund's net assets) | ||
| Information Technology | 15.8 | |
| Health Care | 14.4 | |
| Industrials | 10.8 | |
| Energy | 9.3 | |
| Consumer Staples | 8.6 | |
| Materials | 7.9 | |
| Utilities | 7.6 | |
| Financials | 7.2 | |
| Consumer Discretionary | 5.6 | |
| Communication Services | 5.1 | |
| Real Estate | 5.0 | |
Asset Allocation (% of Fund's net assets) |
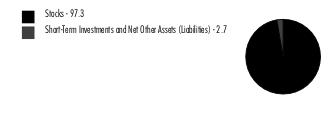 |
Foreign investments - 13% |
Geographic Diversification (% of Fund's net assets) |
 |
* Includes Short-Term investments and Net Other Assets (Liabilities). Percentages are based on country or territory of incorporation and are adjusted for the effect of derivatives, if applicable. |
| Common Stocks - 97.3% | |||
| Shares | Value ($) (000s) | ||
| COMMUNICATION SERVICES - 5.1% | |||
| Diversified Telecommunication Services - 1.6% | |||
| Cellnex Telecom SA (a) | 1,035,300 | 40,571 | |
| Verizon Communications, Inc. | 1,589,300 | 66,067 | |
| 106,638 | |||
| Entertainment - 1.1% | |||
| Activision Blizzard, Inc. | 928,600 | 71,103 | |
| Interactive Media & Services - 1.5% | |||
| Alphabet, Inc. Class A (b) | 540,500 | 53,423 | |
| Meta Platforms, Inc. Class A (b) | 306,900 | 45,719 | |
| 99,142 | |||
| Media - 0.9% | |||
| Comcast Corp. Class A | 1,502,092 | 59,107 | |
TOTAL COMMUNICATION SERVICES | 335,990 | ||
| CONSUMER DISCRETIONARY - 5.6% | |||
| Diversified Consumer Services - 0.8% | |||
| H&R Block, Inc. | 1,286,600 | 50,152 | |
| Hotels, Restaurants & Leisure - 2.5% | |||
| Churchill Downs, Inc. | 65,200 | 16,176 | |
| Domino's Pizza, Inc. | 240,200 | 84,791 | |
| Hilton Worldwide Holdings, Inc. | 48,200 | 6,993 | |
| Krispy Kreme, Inc. (c) | 416,800 | 5,085 | |
| Restaurant Brands International, Inc. (c) | 565,500 | 37,849 | |
| Starbucks Corp. | 800 | 87 | |
| Yum China Holdings, Inc. | 267,000 | 16,450 | |
| 167,431 | |||
| Household Durables - 1.0% | |||
| D.R. Horton, Inc. | 290,400 | 28,660 | |
| Lennar Corp. Class A | 348,900 | 35,727 | |
| 64,387 | |||
| Multiline Retail - 0.8% | |||
| Dollar General Corp. | 221,100 | 51,649 | |
| Specialty Retail - 0.5% | |||
| TJX Companies, Inc. | 446,400 | 36,542 | |
TOTAL CONSUMER DISCRETIONARY | 370,161 | ||
| CONSUMER STAPLES - 8.6% | |||
| Beverages - 3.3% | |||
| Constellation Brands, Inc. Class A (sub. vtg.) | 309,700 | 71,702 | |
| Keurig Dr. Pepper, Inc. | 2,709,600 | 95,595 | |
| The Coca-Cola Co. | 802,000 | 49,179 | |
| 216,476 | |||
| Food & Staples Retailing - 2.0% | |||
| Alimentation Couche-Tard, Inc. Class A (multi-vtg.) | 909,500 | 41,533 | |
| Walmart, Inc. | 613,700 | 88,293 | |
| 129,826 | |||
| Food Products - 0.5% | |||
| The J.M. Smucker Co. | 215,500 | 32,928 | |
| Household Products - 0.9% | |||
| Reynolds Consumer Products, Inc. (c) | 1,935,940 | 57,633 | |
| Tobacco - 1.9% | |||
| Altria Group, Inc. | 1,637,214 | 73,740 | |
| Philip Morris International, Inc. | 527,100 | 54,945 | |
| 128,685 | |||
TOTAL CONSUMER STAPLES | 565,548 | ||
| ENERGY - 9.3% | |||
| Energy Equipment & Services - 0.8% | |||
| Baker Hughes Co. Class A (c) | 1,800,700 | 57,154 | |
| Oil, Gas & Consumable Fuels - 8.5% | |||
| ARC Resources Ltd. | 4,071,500 | 47,308 | |
| Arch Resources, Inc. (c) | 315,300 | 46,671 | |
| Canadian Natural Resources Ltd. (c) | 1,214,900 | 74,643 | |
| Cheniere Energy, Inc. | 61,500 | 9,397 | |
| Cool Co. Ltd. (b) | 1,561,400 | 16,491 | |
| Energy Transfer LP | 7,147,900 | 94,924 | |
| Enterprise Products Partners LP | 2,979,000 | 76,262 | |
| Exxon Mobil Corp. | 772,097 | 89,571 | |
| Reliance Industries Ltd. sponsored GDR (a) | 642,300 | 36,804 | |
| Sitio Royalties Corp. (c) | 919,600 | 24,434 | |
| Viper Energy Partners LP | 1,371,522 | 43,546 | |
| 560,051 | |||
TOTAL ENERGY | 617,205 | ||
| FINANCIALS - 7.2% | |||
| Banks - 2.1% | |||
| Bank of America Corp. | 1,301,800 | 46,188 | |
| Wells Fargo & Co. | 1,894,993 | 88,818 | |
| 135,006 | |||
| Capital Markets - 1.9% | |||
| BlackRock, Inc. Class A | 14,900 | 11,312 | |
| Brookfield Corp. Class A | 500,400 | 18,615 | |
| Intercontinental Exchange, Inc. | 667,100 | 71,747 | |
| S&P Global, Inc. | 70,668 | 26,496 | |
| 128,170 | |||
| Diversified Financial Services - 0.2% | |||
| Apollo Global Management, Inc. | 176,400 | 12,486 | |
| Insurance - 3.0% | |||
| Arthur J. Gallagher & Co. | 361,600 | 70,772 | |
| Brookfield Asset Management Reinsurance Partners Ltd. (c) | 2,825 | 105 | |
| Marsh & McLennan Companies, Inc. | 293,700 | 51,371 | |
| The Travelers Companies, Inc. | 405,500 | 77,499 | |
| 199,747 | |||
TOTAL FINANCIALS | 475,409 | ||
| HEALTH CARE - 14.4% | |||
| Biotechnology - 0.5% | |||
| AbbVie, Inc. | 201,000 | 29,698 | |
| Health Care Equipment & Supplies - 1.3% | |||
| Baxter International, Inc. | 882,500 | 40,321 | |
| Becton, Dickinson & Co. | 139,700 | 35,235 | |
| GE HealthCare Technologies, Inc. (b) | 193,850 | 13,476 | |
| 89,032 | |||
| Health Care Providers & Services - 7.6% | |||
| Cigna Corp. | 442,800 | 140,221 | |
| CVS Health Corp. | 631,900 | 55,746 | |
| Elevance Health, Inc. | 92,500 | 46,249 | |
| HCA Holdings, Inc. | 134,900 | 34,409 | |
| Humana, Inc. | 158,300 | 81,002 | |
| UnitedHealth Group, Inc. | 291,806 | 145,667 | |
| 503,294 | |||
| Life Sciences Tools & Services - 1.4% | |||
| Danaher Corp. | 72,700 | 19,220 | |
| Thermo Fisher Scientific, Inc. | 126,900 | 72,375 | |
| 91,595 | |||
| Pharmaceuticals - 3.6% | |||
| Bristol-Myers Squibb Co. | 1,454,800 | 105,691 | |
| Eli Lilly & Co. | 142,200 | 48,938 | |
| Perrigo Co. PLC | 1,233,800 | 46,169 | |
| Roche Holding AG (participation certificate) | 53,550 | 16,717 | |
| Royalty Pharma PLC | 492,068 | 19,284 | |
| 236,799 | |||
TOTAL HEALTH CARE | 950,418 | ||
| INDUSTRIALS - 10.8% | |||
| Aerospace & Defense - 4.1% | |||
| Airbus Group NV | 231,200 | 28,985 | |
| L3Harris Technologies, Inc. | 102,500 | 22,019 | |
| Lockheed Martin Corp. | 94,100 | 43,593 | |
| Northrop Grumman Corp. | 97,400 | 43,639 | |
| Textron, Inc. | 462,700 | 33,708 | |
| The Boeing Co. (b) | 470,300 | 100,174 | |
| 272,118 | |||
| Air Freight & Logistics - 0.2% | |||
| United Parcel Service, Inc. Class B | 61,600 | 11,410 | |
| Commercial Services & Supplies - 1.0% | |||
| GFL Environmental, Inc. (c) | 2,213,100 | 68,295 | |
| Industrial Conglomerates - 1.0% | |||
| General Electric Co. | 817,550 | 65,796 | |
| Machinery - 3.2% | |||
| Allison Transmission Holdings, Inc. | 2,200,702 | 99,208 | |
| Caterpillar, Inc. | 104,400 | 26,339 | |
| Deere & Co. | 101,300 | 42,834 | |
| Fortive Corp. | 133,300 | 9,068 | |
| PACCAR, Inc. | 299,900 | 32,782 | |
| 210,231 | |||
| Marine - 0.2% | |||
| 2020 Bulkers Ltd. (c)(d) | 1,128,200 | 11,054 | |
| Professional Services - 0.6% | |||
| Equifax, Inc. | 119,300 | 26,508 | |
| Leidos Holdings, Inc. | 146,900 | 14,520 | |
| 41,028 | |||
| Road & Rail - 0.5% | |||
| Canadian Pacific Railway Ltd. (c) | 409,400 | 32,302 | |
TOTAL INDUSTRIALS | 712,234 | ||
| INFORMATION TECHNOLOGY - 15.8% | |||
| Electronic Equipment & Components - 0.3% | |||
| Jabil, Inc. | 247,000 | 19,422 | |
| Vontier Corp. | 6,702 | 154 | |
| 19,576 | |||
| IT Services - 6.0% | |||
| DXC Technology Co. (b) | 387,400 | 11,130 | |
| Fidelity National Information Services, Inc. | 598,600 | 44,919 | |
| Genpact Ltd. | 822,630 | 38,894 | |
| Global Payments, Inc. | 115,600 | 13,030 | |
| MasterCard, Inc. Class A | 200,500 | 74,305 | |
| SS&C Technologies Holdings, Inc. (c) | 1,194,100 | 72,064 | |
| Visa, Inc. Class A | 620,400 | 142,822 | |
| 397,164 | |||
| Semiconductors & Semiconductor Equipment - 2.0% | |||
| Broadcom, Inc. | 64,300 | 37,616 | |
| Marvell Technology, Inc. | 1,299,600 | 56,078 | |
| Microchip Technology, Inc. | 82,700 | 6,419 | |
| NVIDIA Corp. | 40,400 | 7,893 | |
| NXP Semiconductors NV | 84,400 | 15,556 | |
| Universal Display Corp. | 53,150 | 7,044 | |
| 130,606 | |||
| Software - 6.6% | |||
| Intuit, Inc. | 112,700 | 47,635 | |
| Microsoft Corp. | 1,389,400 | 344,308 | |
| Oracle Corp. | 517,400 | 45,769 | |
| 437,712 | |||
| Technology Hardware, Storage & Peripherals - 0.9% | |||
| Apple, Inc. | 258,972 | 37,367 | |
| Samsung Electronics Co. Ltd. | 357,160 | 17,769 | |
| 55,136 | |||
TOTAL INFORMATION TECHNOLOGY | 1,040,194 | ||
| MATERIALS - 7.9% | |||
| Chemicals - 1.5% | |||
| CF Industries Holdings, Inc. | 257,100 | 21,776 | |
| International Flavors & Fragrances, Inc. | 199,200 | 22,402 | |
| Valvoline, Inc. | 1,465,300 | 53,718 | |
| 97,896 | |||
| Metals & Mining - 5.7% | |||
| Agnico Eagle Mines Ltd. (Canada) | 932,900 | 52,684 | |
| Barrick Gold Corp. | 2,861,700 | 55,946 | |
| Freeport-McMoRan, Inc. | 1,179,100 | 52,611 | |
| Glencore PLC | 10,789,500 | 72,256 | |
| Newmont Corp. | 1,571,500 | 83,179 | |
| Wheaton Precious Metals Corp. | 1,250,500 | 57,180 | |
| 373,856 | |||
| Paper & Forest Products - 0.7% | |||
| Louisiana-Pacific Corp. | 731,800 | 49,828 | |
TOTAL MATERIALS | 521,580 | ||
| REAL ESTATE - 5.0% | |||
| Equity Real Estate Investment Trusts (REITs) - 5.0% | |||
| American Tower Corp. | 234,300 | 52,340 | |
| Crown Castle International Corp. | 332,200 | 49,202 | |
| CubeSmart | 312,700 | 14,319 | |
| Digital Realty Trust, Inc. | 274,000 | 31,406 | |
| Four Corners Property Trust, Inc. | 1,246,225 | 35,841 | |
| National Retail Properties, Inc. | 667,300 | 31,597 | |
| Prologis (REIT), Inc. | 173,800 | 22,469 | |
| Public Storage | 78,800 | 23,982 | |
| Simon Property Group, Inc. | 240,300 | 30,869 | |
| Welltower, Inc. | 495,300 | 37,167 | |
| 329,192 | |||
| UTILITIES - 7.6% | |||
| Electric Utilities - 4.3% | |||
| Constellation Energy Corp. | 638,676 | 54,517 | |
| Edison International | 816,400 | 56,250 | |
| Exelon Corp. | 1,111,130 | 46,879 | |
| FirstEnergy Corp. | 1,487,000 | 60,893 | |
| PG&E Corp. (b) | 408,624 | 6,497 | |
| Southern Co. | 826,800 | 55,958 | |
| 280,994 | |||
| Gas Utilities - 0.5% | |||
| Brookfield Infrastructure Corp. A Shares | 767,700 | 33,948 | |
| Independent Power and Renewable Electricity Producers - 2.0% | |||
| NextEra Energy Partners LP | 700,900 | 51,376 | |
| The AES Corp. | 2,300,200 | 63,048 | |
| Vistra Corp. | 894,300 | 20,623 | |
| 135,047 | |||
| Multi-Utilities - 0.8% | |||
| CenterPoint Energy, Inc. | 767,900 | 23,129 | |
| Dominion Energy, Inc. | 440,600 | 28,040 | |
| 51,169 | |||
TOTAL UTILITIES | 501,158 | ||
| TOTAL COMMON STOCKS (Cost $5,545,775) | 6,419,089 | ||
| Money Market Funds - 5.2% | |||
| Shares | Value ($) (000s) | ||
| Fidelity Cash Central Fund 4.38% (e) | 137,130,882 | 137,158 | |
| Fidelity Securities Lending Cash Central Fund 4.38% (e)(f) | 203,550,626 | 203,571 | |
| TOTAL MONEY MARKET FUNDS (Cost $340,729) | 340,729 | ||
| TOTAL INVESTMENT IN SECURITIES - 102.5% (Cost $5,886,504) | 6,759,818 |
NET OTHER ASSETS (LIABILITIES) - (2.5)% | (162,228) |
| NET ASSETS - 100.0% | 6,597,590 |
| (a) | Security exempt from registration under Rule 144A of the Securities Act of 1933. These securities may be resold in transactions exempt from registration, normally to qualified institutional buyers. At the end of the period, the value of these securities amounted to $77,375,000 or 1.2% of net assets. |
| (b) | Non-income producing |
| (c) | Security or a portion of the security is on loan at period end. |
| (d) | Affiliated company |
| (e) | Affiliated fund that is generally available only to investment companies and other accounts managed by Fidelity Investments. The rate quoted is the annualized seven-day yield of the fund at period end. A complete unaudited listing of the fund's holdings as of its most recent quarter end is available upon request. In addition, each Fidelity Central Fund's financial statements are available on the SEC's website or upon request. |
| (f) | Investment made with cash collateral received from securities on loan. |
| Affiliate (Amounts in thousands) | Value, beginning of period ($) | Purchases ($) | Sales Proceeds ($) | Dividend Income ($) | Realized Gain (loss) ($) | Change in Unrealized appreciation (depreciation) ($) | Value, end of period ($) | % ownership, end of period |
| Fidelity Cash Central Fund 4.38% | 176,927 | 879,076 | 918,845 | 4,395 | - | - | 137,158 | 0.3% |
| Fidelity Securities Lending Cash Central Fund 4.38% | 114,743 | 996,756 | 907,928 | 467 | - | - | 203,571 | 0.7% |
| Total | 291,670 | 1,875,832 | 1,826,773 | 4,862 | - | - | 340,729 | |
| Affiliate (Amounts in thousands) | Value, beginning of period ($) | Purchases ($) | Sales Proceeds ($) | Dividend Income ($) | Realized Gain (loss) ($) | Change in Unrealized appreciation (depreciation) ($) | Value, end of period ($) |
| 2020 Bulkers Ltd. | 13,190 | - | - | 643 | - | (2,136) | 11,054 |
| Total | 13,190 | - | - | 643 | - | (2,136) | 11,054 |
| Valuation Inputs at Reporting Date: | ||||
Description (Amounts in thousands) | Total ($) | Level 1 ($) | Level 2 ($) | Level 3 ($) |
Investments in Securities: | ||||
| Equities: | ||||
Communication Services | 335,990 | 295,419 | 40,571 | - |
Consumer Discretionary | 370,161 | 370,161 | - | - |
Consumer Staples | 565,548 | 565,548 | - | - |
Energy | 617,205 | 617,205 | - | - |
Financials | 475,409 | 475,409 | - | - |
Health Care | 950,418 | 933,701 | 16,717 | - |
Industrials | 712,234 | 683,249 | 28,985 | - |
Information Technology | 1,040,194 | 1,022,425 | 17,769 | - |
Materials | 521,580 | 449,324 | 72,256 | - |
Real Estate | 329,192 | 329,192 | - | - |
Utilities | 501,158 | 501,158 | - | - |
| Money Market Funds | 340,729 | 340,729 | - | - |
| Total Investments in Securities: | 6,759,818 | 6,583,520 | 176,298 | - |
| Statement of Assets and Liabilities | ||||
| Amounts in thousands (except per-share amounts) | January 31, 2023 (Unaudited) | |||
| Assets | ||||
| Investment in securities, at value (including securities loaned of $199,600) - See accompanying schedule: | ||||
Unaffiliated issuers (cost $5,532,364) | $ | 6,408,035 | ||
Fidelity Central Funds (cost $340,729) | 340,729 | �� | ||
Other affiliated issuers (cost $13,411) | 11,054 | |||
| Total Investment in Securities (cost $5,886,504) | $ | 6,759,818 | ||
| Foreign currency held at value (cost $101) | 101 | |||
| Receivable for investments sold | 80,322 | |||
| Receivable for fund shares sold | 2,479 | |||
| Dividends receivable | 8,089 | |||
| Distributions receivable from Fidelity Central Funds | 931 | |||
| Prepaid expenses | 6 | |||
| Other receivables | 327 | |||
Total assets | 6,852,073 | |||
| Liabilities | ||||
| Payable to custodian bank | $ | 5 | ||
| Payable for investments purchased | 45,765 | |||
| Payable for fund shares redeemed | 2,012 | |||
| Accrued management fee | 2,030 | |||
| Other affiliated payables | 743 | |||
| Other payables and accrued expenses | 362 | |||
| Collateral on securities loaned | 203,566 | |||
| Total Liabilities | 254,483 | |||
| Net Assets | $ | 6,597,590 | ||
| Net Assets consist of: | ||||
| Paid in capital | $ | 5,665,918 | ||
| Total accumulated earnings (loss) | 931,672 | |||
| Net Assets | $ | 6,597,590 | ||
| Net Asset Value and Maximum Offering Price | ||||
| Dividend Growth : | ||||
Net Asset Value , offering price and redemption price per share ($5,552,846 ÷ 183,205 shares) | $ | 30.31 | ||
| Class K : | ||||
Net Asset Value , offering price and redemption price per share ($1,044,744 ÷ 34,526 shares) | $ | 30.26 | ||
| Statement of Operations | ||||
| Amounts in thousands | Six months ended January 31, 2023 (Unaudited) | |||
| Investment Income | ||||
| Dividends (including $643 earned from affiliated issuers) | $ | 63,247 | ||
| Income from Fidelity Central Funds (including $467 from security lending) | 4,862 | |||
| Total Income | 68,109 | |||
| Expenses | ||||
| Management fee | ||||
| Basic fee | $ | 16,257 | ||
| Performance adjustment | (5,905) | |||
| Transfer agent fees | 3,885 | |||
| Accounting fees | 503 | |||
| Custodian fees and expenses | 28 | |||
| Independent trustees' fees and expenses | 11 | |||
| Registration fees | 61 | |||
| Audit | 42 | |||
| Legal | 6 | |||
| Miscellaneous | 18 | |||
| Total expenses before reductions | 14,906 | |||
| Expense reductions | (120) | |||
| Total expenses after reductions | 14,786 | |||
| Net Investment income (loss) | 53,323 | |||
| Realized and Unrealized Gain (Loss) | ||||
| Net realized gain (loss) on: | ||||
| Investment Securities: | ||||
| Unaffiliated issuers | 88,534 | |||
| Foreign currency transactions | 2,841 | |||
| Total net realized gain (loss) | 91,375 | |||
| Change in net unrealized appreciation (depreciation) on: | ||||
| Investment Securities: | ||||
| Unaffiliated issuers | (1,507) | |||
| Affiliated issuers | (2,136) | |||
| Assets and liabilities in foreign currencies | 86 | |||
| Total change in net unrealized appreciation (depreciation) | (3,557) | |||
| Net gain (loss) | 87,818 | |||
| Net increase (decrease) in net assets resulting from operations | $ | 141,141 | ||
| Statement of Changes in Net Assets | ||||
| Amount in thousands | Six months ended January 31, 2023 (Unaudited) | Year ended July 31, 2022 | ||
| Increase (Decrease) in Net Assets | ||||
| Operations | ||||
| Net investment income (loss) | $ | 53,323 | $ | 83,538 |
| Net realized gain (loss) | 91,375 | 673,133 | ||
| Change in net unrealized appreciation (depreciation) | (3,557) | (940,202) | ||
| Net increase (decrease) in net assets resulting from operations | 141,141 | (183,531) | ||
| Distributions to shareholders | (620,859) | (571,295) | ||
| Share transactions - net increase (decrease) | 873,892 | 37,007 | ||
| Total increase (decrease) in net assets | 394,174 | (717,819) | ||
| Net Assets | ||||
| Beginning of period | 6,203,416 | 6,921,235 | ||
| End of period | $ | 6,597,590 | $ | 6,203,416 |
| Fidelity® Dividend Growth Fund |
Six months ended (Unaudited) January 31, 2023 | Years ended July 31, 2022 | 2021 | 2020 | 2019 | 2018 | |||||||
Selected Per-Share Data | ||||||||||||
| Net asset value, beginning of period | $ | 32.82 | $ | 36.80 | $ | 26.38 | $ | 29.59 | $ | 33.79 | $ | 35.06 |
| Income from Investment Operations | ||||||||||||
Net investment income (loss) A,B | .26 | .44 | .42 | .58 | .59 | .65 | ||||||
| Net realized and unrealized gain (loss) | .38 | (1.37) | 10.59 | (2.29) | 1.01 C | 3.72 | ||||||
| Total from investment operations | .64 | (.93) | 11.01 | (1.71) | 1.60 | 4.37 | ||||||
| Distributions from net investment income | (.29) | (.55) | (.59) | (.49) | (.60) | (.60) | ||||||
| Distributions from net realized gain | (2.85) | (2.50) | - | (1.01) | (5.20) | (5.04) | ||||||
| Total distributions | (3.15) D | (3.05) | (.59) | (1.50) | (5.80) | (5.64) | ||||||
| Net asset value, end of period | $ | 30.31 | $ | 32.82 | $ | 36.80 | $ | 26.38 | $ | 29.59 | $ | 33.79 |
Total Return E,F | 2.30% | (2.83)% | 42.42% | (6.24)% | 5.38% C | 13.60% | ||||||
Ratios to Average Net Assets B,G,H | ||||||||||||
| Expenses before reductions | .50% I | .48% | .49% | .49% | .50% | .50% | ||||||
| Expenses net of fee waivers, if any | .49% I | .47% | .49% | .49% | .50% | .50% | ||||||
| Expenses net of all reductions | .49% I | .47% | .48% | .48% | .49% | .49% | ||||||
| Net investment income (loss) | 1.72% I | 1.27% | 1.31% | 2.11% | 2.05% | 1.94% | ||||||
| Supplemental Data | ||||||||||||
| Net assets, end of period (in millions) | $ | 5,553 | $ | 5,661 | $ | 6,114 | $ | 4,685 | $ | 5,728 | $ | 6,055 |
Portfolio turnover rate J | 48% I | 52% | 93% | 69% | 101% | 115% |
| Fidelity® Dividend Growth Fund Class K |
Six months ended (Unaudited) January 31, 2023 | Years ended July 31, 2022 | 2021 | 2020 | 2019 | 2018 | |||||||
Selected Per-Share Data | ||||||||||||
| Net asset value, beginning of period | $ | 32.77 | $ | 36.76 | $ | 26.36 | $ | 29.56 | $ | 33.76 | $ | 35.04 |
| Income from Investment Operations | ||||||||||||
Net investment income (loss) A,B | .27 | .47 | .44 | .61 | .63 | .69 | ||||||
| Net realized and unrealized gain (loss) | .38 | (1.37) | 10.57 | (2.28) | 1.01 C | 3.71 | ||||||
| Total from investment operations | .65 | (.90) | 11.01 | (1.67) | 1.64 | 4.40 | ||||||
| Distributions from net investment income | (.31) | (.59) | (.61) | (.52) | (.63) | (.64) | ||||||
| Distributions from net realized gain | (2.85) | (2.50) | - | (1.01) | (5.20) | (5.04) | ||||||
| Total distributions | (3.16) | (3.09) | (.61) | (1.53) | (5.84) D | (5.68) | ||||||
| Net asset value, end of period | $ | 30.26 | $ | 32.77 | $ | 36.76 | $ | 26.36 | $ | 29.56 | $ | 33.76 |
Total Return E,F | 2.36% | (2.75)% | 42.53% | (6.11)% | 5.50% C | 13.70% | ||||||
Ratios to Average Net Assets B,G,H | ||||||||||||
| Expenses before reductions | .40% I | .38% | .39% | .39% | .40% | .40% | ||||||
| Expenses net of fee waivers, if any | .40% I | .38% | .39% | .39% | .39% | .40% | ||||||
| Expenses net of all reductions | .40% I | .38% | .38% | .38% | .38% | .39% | ||||||
| Net investment income (loss) | 1.81% I | 1.36% | 1.41% | 2.22% | 2.16% | 2.05% | ||||||
| Supplemental Data | ||||||||||||
| Net assets, end of period (in millions) | $ | 1,045 | $ | 542 | $ | 807 | $ | 1,228 | $ | 1,480 | $ | 1,212 |
Portfolio turnover rate J | 48% I | 52% | 93% | 69% | 101% | 115% |
| Fidelity Central Fund | Investment Manager | Investment Objective | Investment Practices | Expense Ratio A |
| Fidelity Money Market Central Funds | Fidelity Management & Research Company LLC (FMR) | Each fund seeks to obtain a high level of current income consistent with the preservation of capital and liquidity. | Short-term Investments | Less than .005% |
| Fidelity Dividend Growth Fund | $326 |
| Gross unrealized appreciation | $1,095,902 |
| Gross unrealized depreciation | (236,897) |
| Net unrealized appreciation (depreciation) | $859,005 |
| Tax cost | $5,900,813 |
| Purchases ($) | Sales ($) | |
| Fidelity Dividend Growth Fund | 1,744,301 | 1,423,197 |
| Amount | % of Class-Level Average Net Assets A | |
| Dividend Growth | $3,723 | .14 |
| Class K | 162 | .04 |
| $3,885 |
| % of Average Net Assets | |
| Fidelity Dividend Growth Fund | .02 |
| Amount | |
| Fidelity Dividend Growth Fund | $35 |
| Purchases ($) | Sales ($) | Realized Gain (Loss) ($) | |
| Fidelity Dividend Growth Fund | 119,513 | 83,786 | 4,206 |
| Amount | |
| Fidelity Dividend Growth Fund | $8 |
| Total Security Lending Fees Paid to NFS | Security Lending Income From Securities Loaned to NFS | Value of Securities Loaned to NFS at Period End | |
| Fidelity Dividend Growth Fund | $49 | $- A | $- |
| Six months ended January 31, 2023 | Year ended July 31, 2022 | |
| Fidelity Dividend Growth Fund | ||
| Distributions to shareholders | ||
| Dividend Growth | $544,794 | $510,637 |
| Class K | 76,065 | 60,658 |
| Total | $620,859 | $571,295 |
| Shares | Shares | Dollars | Dollars | |
| Six months ended January 31, 2023 | Year ended July 31, 2022 | Six months ended January 31, 2023 | Year ended July 31, 2022 | |
| Fidelity Dividend Growth Fund | ||||
| Dividend Growth | ||||
| Shares sold | 3,224 | 9,180 | $96,142 | $317,840 |
| Reinvestment of distributions | 17,485 | 14,043 | 517,869 | 487,723 |
| Shares redeemed | (9,995) | (16,893) | (295,782) | (581,352) |
| Net increase (decrease) | 10,714 | 6,330 | $318,229 | $224,211 |
| Class K | ||||
| Shares sold | 17,157 | 3,443 | $531,354 | $117,316 |
| Reinvestment of distributions | 2,576 | 1,749 | 76,065 | 60,658 |
| Shares redeemed | (1,761) | (10,595) | (51,756) | (365,178) |
| Net increase (decrease) | 17,972 | (5,403) | $555,663 | $(187,204) |
| The Example is based on an investment of $1,000 invested at the beginning of the period and held for the entire period (August 1, 2022 to January 31, 2023). |
Annualized Expense Ratio- A | Beginning Account Value August 1, 2022 | Ending Account Value January 31, 2023 | Expenses Paid During Period- C August 1, 2022 to January 31, 2023 | |||||||
| Fidelity® Dividend Growth Fund | ||||||||||
| Fidelity® Dividend Growth Fund | .49% | |||||||||
| Actual | $ 1,000 | $ 1,023.00 | $ 2.50 | |||||||
Hypothetical- B | $ 1,000 | $ 1,022.74 | $ 2.50 | |||||||
| Class K | .40% | |||||||||
| Actual | $ 1,000 | $ 1,023.60 | $ 2.04 | |||||||
Hypothetical- B | $ 1,000 | $ 1,023.19 | $ 2.04 | |||||||
- Highly liquid investments - cash or convertible to cash within three business days or less
- Moderately liquid investments - convertible to cash in three to seven calendar days
- Less liquid investments - can be sold or disposed of, but not settled, within seven calendar days
- Illiquid investments - cannot be sold or disposed of within seven calendar days
|


Contents
Top Holdings (% of Fund's net assets) | ||
| Apple, Inc. | 9.3 | |
| Microsoft Corp. | 8.0 | |
| Amazon.com, Inc. | 7.0 | |
| NVIDIA Corp. | 6.2 | |
| Alphabet, Inc. Class A | 4.9 | |
| Marvell Technology, Inc. | 3.0 | |
| Tesla, Inc. | 2.8 | |
| Meta Platforms, Inc. Class A | 2.6 | |
| Netflix, Inc. | 2.1 | |
| Uber Technologies, Inc. | 1.9 | |
| 47.8 | ||
| Market Sectors (% of Fund's net assets) | ||
| Information Technology | 38.1 | |
| Consumer Discretionary | 29.3 | |
| Communication Services | 12.4 | |
| Health Care | 9.2 | |
| Energy | 4.6 | |
| Industrials | 3.0 | |
| Consumer Staples | 1.4 | |
| Financials | 1.1 | |
| Materials | 0.9 | |
| Real Estate | 0.1 | |
| Utilities | 0.0 | |
Asset Allocation (% of Fund's net assets) |
 |
Short-Term Investments and Net Other Assets (Liabilities) - (0.1)%* |
Foreign investments - 9.2% |
Short-Term Investments and Net Other Assets (Liabilities) are not available in the pie chart. |
| Common Stocks - 97.6% | |||
| Shares | Value ($) (000s) | ||
| COMMUNICATION SERVICES - 12.1% | |||
| Entertainment - 2.8% | |||
| Activision Blizzard, Inc. | 238,673 | 18,275 | |
| Bilibili, Inc. ADR (a) | 672,761 | 16,819 | |
| Endeavor Group Holdings, Inc. (a) | 1,152,011 | 25,840 | |
| Netflix, Inc. (a) | 2,250,507 | 796,364 | |
| Sea Ltd. ADR (a) | 2,962,483 | 190,932 | |
| Universal Music Group NV | 2,007,914 | 51,327 | |
| 1,099,557 | |||
| Interactive Media & Services - 9.2% | |||
| Alphabet, Inc. Class A (a) | 19,275,960 | 1,905,236 | |
| Epic Games, Inc. (a)(b)(c) | 6,131 | 5,186 | |
| Meta Platforms, Inc. Class A (a) | 6,858,503 | 1,021,711 | |
| Pinterest, Inc. Class A (a)(d) | 826,518 | 21,729 | |
| Snap, Inc. Class A (a) | 50,206,436 | 580,386 | |
| Tencent Holdings Ltd. sponsored ADR | 459,200 | 22,386 | |
| 3,556,634 | |||
| Wireless Telecommunication Services - 0.1% | |||
| Rogers Communications, Inc. Class B (non-vtg.) | 79,000 | 3,841 | |
| T-Mobile U.S., Inc. (a) | 237,903 | 35,521 | |
| 39,362 | |||
TOTAL COMMUNICATION SERVICES | 4,695,553 | ||
| CONSUMER DISCRETIONARY - 28.7% | |||
| Auto Components - 0.1% | |||
| Aptiv PLC (a) | 302,552 | 34,216 | |
| Autoliv, Inc. | 21,000 | 1,935 | |
| Mobileye Global, Inc. (d) | 333,037 | 12,855 | |
| 49,006 | |||
| Automobiles - 3.0% | |||
| Neutron Holdings, Inc. (a)(b)(c) | 7,152,433 | 172 | |
| Rad Power Bikes, Inc. (a)(b)(c) | 928,091 | 3,731 | |
| Rivian Automotive, Inc. (a)(d) | 3,779,754 | 73,327 | |
| Tesla, Inc. (a) | 6,187,241 | 1,071,754 | |
| 1,148,984 | |||
| Diversified Consumer Services - 0.0% | |||
| New Oriental Education & Technology Group, Inc. sponsored ADR (a) | 264,100 | 11,261 | |
| Hotels, Restaurants & Leisure - 3.5% | |||
| Airbnb, Inc. Class A (a) | 3,249,825 | 361,088 | |
| Caesars Entertainment, Inc. (a) | 3,973,136 | 206,841 | |
| Chipotle Mexican Grill, Inc. (a) | 18,485 | 30,433 | |
| Draftkings Holdings, Inc. (a)(d) | 578,855 | 8,677 | |
| Flutter Entertainment PLC (a) | 103,700 | 16,045 | |
| Hilton Worldwide Holdings, Inc. | 729,483 | 105,841 | |
| Marriott International, Inc. Class A | 1,203,036 | 209,545 | |
| Penn Entertainment, Inc. (a) | 6,811,262 | 241,459 | |
| Restaurant Brands International, Inc. | 312,300 | 20,897 | |
| Sonder Holdings, Inc.: | |||
| rights (a)(c) | 16,222 | 5 | |
| rights (a)(c) | 16,221 | 4 | |
| rights (a)(c) | 16,222 | 3 | |
| rights (a)(c) | 16,221 | 3 | |
| rights (a)(c) | 16,221 | 2 | |
| rights (a)(c) | 16,221 | 2 | |
| Sweetgreen, Inc. Class A (a)(d) | 7,085,594 | 73,478 | |
| Trip.com Group Ltd. ADR (a) | 848,600 | 31,195 | |
| Yum China Holdings, Inc. | 413,500 | 25,476 | |
| Yum! Brands, Inc. | 100,686 | 13,141 | |
| 1,344,135 | |||
| Internet & Direct Marketing Retail - 11.1% | |||
| Alibaba Group Holding Ltd. sponsored ADR (a) | 1,455,459 | 160,392 | |
| Amazon.com, Inc. (a) | 26,404,200 | 2,723,065 | |
| Deliveroo PLC Class A (a)(e) | 11,846,838 | 13,577 | |
| FSN E-Commerce Ventures Private Ltd. | 36,842,580 | 62,008 | |
| JD.com, Inc. sponsored ADR | 1,883,309 | 112,113 | |
| Lyft, Inc. (a) | 19,353,816 | 314,500 | |
| Pinduoduo, Inc. ADR (a) | 909,433 | 89,106 | |
| Uber Technologies, Inc. (a) | 24,246,757 | 749,952 | |
| Wayfair LLC Class A (a) | 1,065,608 | 64,469 | |
| 4,289,182 | |||
| Multiline Retail - 1.0% | |||
| Dollar Tree, Inc. (a) | 2,257,489 | 339,030 | |
| Ollie's Bargain Outlet Holdings, Inc. (a) | 786,369 | 43,062 | |
| Target Corp. | 85,880 | 14,783 | |
| 396,875 | |||
| Specialty Retail - 5.2% | |||
| American Eagle Outfitters, Inc. (f) | 11,961,903 | 193,065 | |
| Bath & Body Works, Inc. | 548,623 | 25,242 | |
| Burlington Stores, Inc. (a) | 73,431 | 16,877 | |
| Fanatics, Inc. Class A (a)(b)(c) | 1,938,909 | 160,096 | |
| Fast Retailing Co. Ltd. | 6,400 | 3,887 | |
| Five Below, Inc. (a) | 1,143,710 | 225,460 | |
| Foot Locker, Inc. | 661,600 | 28,786 | |
| Lowe's Companies, Inc. | 3,389,650 | 705,895 | |
| RH (a)(d) | 691,447 | 215,725 | |
| TJX Companies, Inc. | 2,891,818 | 236,724 | |
| Victoria's Secret & Co. (a) | 2,747,683 | 115,815 | |
| Warby Parker, Inc. (a)(d) | 4,446,295 | 71,808 | |
| 1,999,380 | |||
| Textiles, Apparel & Luxury Goods - 4.8% | |||
| Capri Holdings Ltd. (a) | 3,452,239 | 229,539 | |
| Compagnie Financiere Richemont SA Series A | 170,970 | 26,356 | |
| Crocs, Inc. (a) | 1,874,824 | 228,297 | |
| Deckers Outdoor Corp. (a) | 743,035 | 317,633 | |
| Hermes International SCA | 21,912 | 40,842 | |
| lululemon athletica, Inc. (a) | 1,402,665 | 430,450 | |
| LVMH Moet Hennessy Louis Vuitton SE | 146,980 | 128,310 | |
| NIKE, Inc. Class B | 3,236,220 | 412,068 | |
| On Holding AG (a) | 2,316,704 | 53,748 | |
| Tory Burch LLC (a)(b)(c)(g) | 293,611 | 9,131 | |
| 1,876,374 | |||
TOTAL CONSUMER DISCRETIONARY | 11,115,197 | ||
| CONSUMER STAPLES - 1.2% | |||
| Beverages - 1.1% | |||
| Boston Beer Co., Inc. Class A (a) | 190,910 | 74,190 | |
| Celsius Holdings, Inc. (a)(d) | 3,511,286 | 352,252 | |
| Constellation Brands, Inc. Class A (sub. vtg.) | 58,270 | 13,491 | |
| 439,933 | |||
| Food & Staples Retailing - 0.0% | |||
| Costco Wholesale Corp. | 7,645 | 3,908 | |
| Food Products - 0.0% | |||
| Sovos Brands, Inc. (a) | 62,457 | 847 | |
| The Real Good Food Co. LLC: | |||
| Class B (c)(f) | 1,262,073 | 0 | |
| Class B unit (e)(f) | 1,262,073 | 7,017 | |
| The Real Good Food Co., Inc. (a) | 47,899 | 266 | |
| 8,130 | |||
| Household Products - 0.1% | |||
| Procter & Gamble Co. | 149,376 | 21,268 | |
| Personal Products - 0.0% | |||
| Estee Lauder Companies, Inc. Class A | 18,491 | 5,123 | |
| Tobacco - 0.0% | |||
| JUUL Labs, Inc.: | |||
| Class A (a)(b)(c) | 21,148 | 256 | |
| Class B (a)(b)(c) | 6,625 | 80 | |
| 336 | |||
TOTAL CONSUMER STAPLES | 478,698 | ||
| ENERGY - 4.6% | |||
| Energy Equipment & Services - 0.1% | |||
| Halliburton Co. | 974,626 | 40,174 | |
| Oil, Gas & Consumable Fuels - 4.5% | |||
| Antero Resources Corp. (a) | 1,991,547 | 57,436 | |
| Cenovus Energy, Inc. (Canada) | 1,871,854 | 37,393 | |
| Cheniere Energy, Inc. | 287,145 | 43,873 | |
| Denbury, Inc. (a) | 700,134 | 60,758 | |
| Devon Energy Corp. (d) | 1,638,598 | 103,625 | |
| Diamondback Energy, Inc. | 1,277,151 | 186,617 | |
| EOG Resources, Inc. | 1,685,971 | 222,970 | |
| EQT Corp. | 389,693 | 12,731 | |
| Exxon Mobil Corp. | 1,235,859 | 143,372 | |
| Hess Corp. | 1,960,985 | 294,462 | |
| Marathon Oil Corp. | 2,144,160 | 58,900 | |
| Northern Oil & Gas, Inc. | 508,176 | 17,034 | |
| Occidental Petroleum Corp. | 1,781,195 | 115,404 | |
| Ovintiv, Inc. | 255,715 | 12,589 | |
| Pioneer Natural Resources Co. | 705,552 | 162,524 | |
| Reliance Industries Ltd. | 6,959,093 | 201,178 | |
| Reliance Industries Ltd. sponsored GDR (e) | 224,529 | 12,866 | |
| 1,743,732 | |||
TOTAL ENERGY | 1,783,906 | ||
| FINANCIALS - 1.1% | |||
| Banks - 0.3% | |||
| Kotak Mahindra Bank Ltd. | 779,186 | 16,578 | |
| Wells Fargo & Co. | 2,169,117 | 101,667 | |
| 118,245 | |||
| Consumer Finance - 0.6% | |||
| American Express Co. | 1,328,581 | 232,409 | |
| Diversified Financial Services - 0.2% | |||
| Ant International Co. Ltd. Class C (a)(b)(c) | 6,428,801 | 10,158 | |
| Berkshire Hathaway, Inc. Class B (a) | 41,969 | 13,074 | |
| Housing Development Finance Corp. Ltd. | 697,722 | 22,509 | |
| Rapyd Financial Network 2016 Ltd. (a)(b)(c) | 204,327 | 14,507 | |
| 60,248 | |||
TOTAL FINANCIALS | 410,902 | ||
| HEALTH CARE - 9.2% | |||
| Biotechnology - 1.4% | |||
| Alnylam Pharmaceuticals, Inc. (a) | 665,155 | 150,591 | |
| Arcutis Biotherapeutics, Inc. (a) | 674,708 | 11,180 | |
| Argenx SE ADR (a) | 88,816 | 33,950 | |
| Ascendis Pharma A/S sponsored ADR (a) | 428,366 | 53,152 | |
| CytomX Therapeutics, Inc. (a)(e) | 378,621 | 1,022 | |
| Generation Bio Co. (a) | 792,134 | 4,674 | |
| Instil Bio, Inc. (a) | 158,873 | 129 | |
| Karuna Therapeutics, Inc. (a) | 169,467 | 33,790 | |
| Moderna, Inc. (a) | 18,100 | 3,187 | |
| Prometheus Biosciences, Inc. (a) | 34,300 | 3,899 | |
| Regeneron Pharmaceuticals, Inc. (a) | 168,491 | 127,795 | |
| Vertex Pharmaceuticals, Inc. (a) | 288,718 | 93,285 | |
| Verve Therapeutics, Inc. (a) | 428,562 | 9,750 | |
| 526,404 | |||
| Health Care Equipment & Supplies - 1.5% | |||
| Axonics Modulation Technologies, Inc. (a) | 583,297 | 35,814 | |
| Blink Health LLC Series A1 (a)(b)(c) | 51,117 | 2,208 | |
| Boston Scientific Corp. (a) | 1,993,687 | 92,208 | |
| DexCom, Inc. (a) | 2,330,566 | 249,580 | |
| Insulet Corp. (a) | 316,197 | 90,850 | |
| Oddity Tech Ltd. (b)(c) | 23,418 | 9,400 | |
| Shockwave Medical, Inc. (a) | 534,475 | 100,444 | |
| TransMedics Group, Inc. (a) | 102,274 | 6,445 | |
| 586,949 | |||
| Health Care Providers & Services - 2.5% | |||
| agilon health, Inc. (a) | 369,598 | 8,042 | |
| Alignment Healthcare, Inc. (a) | 902,361 | 11,144 | |
| Cigna Corp. | 136,133 | 43,109 | |
| Elevance Health, Inc. | 38,751 | 19,375 | |
| Guardant Health, Inc. (a) | 2,082,131 | 65,441 | |
| Humana, Inc. | 287,512 | 147,120 | |
| LifeStance Health Group, Inc. (a) | 1,233,896 | 6,515 | |
| Surgery Partners, Inc. (a) | 572,616 | 19,011 | |
| UnitedHealth Group, Inc. | 1,318,087 | 657,976 | |
| Universal Health Services, Inc. Class B | 72,600 | 10,760 | |
| 988,493 | |||
| Health Care Technology - 0.0% | |||
| Certara, Inc. (a) | 378,347 | 7,340 | |
| MultiPlan Corp. warrants (a)(b) | 138,859 | 1 | |
| 7,341 | |||
| Life Sciences Tools & Services - 0.9% | |||
| Danaher Corp. | 604,304 | 159,766 | |
| ICON PLC (a) | 99,384 | 22,929 | |
| Olink Holding AB ADR (a) | 584,547 | 11,445 | |
| Seer, Inc. (a) | 313,100 | 1,425 | |
| Thermo Fisher Scientific, Inc. | 203,713 | 116,184 | |
| Veterinary Emergency Group LLC Class A (a)(b)(c)(g) | 524,494 | 29,797 | |
| 341,546 | |||
| Pharmaceuticals - 2.9% | |||
| AstraZeneca PLC sponsored ADR | 263,545 | 17,228 | |
| Eli Lilly & Co. | 1,718,975 | 591,585 | |
| Novo Nordisk A/S: | |||
| Series B | 139,500 | 19,305 | |
| Series B sponsored ADR | 1,133,100 | 157,252 | |
| Roche Holding AG (participation certificate) | 45,578 | 14,228 | |
| Zoetis, Inc. Class A | 1,908,835 | 315,893 | |
| 1,115,491 | |||
TOTAL HEALTH CARE | 3,566,224 | ||
| INDUSTRIALS - 2.4% | |||
| Aerospace & Defense - 1.5% | |||
| Airbus Group NV | 274,003 | 34,351 | |
| Howmet Aerospace, Inc. | 1,108,640 | 45,111 | |
| L3Harris Technologies, Inc. | 136,376 | 29,296 | |
| Lockheed Martin Corp. | 72,220 | 33,457 | |
| Northrop Grumman Corp. | 52,881 | 23,693 | |
| Space Exploration Technologies Corp.: | |||
| Class A (a)(b)(c) | 2,961,836 | 228,061 | |
| Class C (a)(b)(c) | 27,830 | 2,143 | |
| The Boeing Co. (a) | 775,623 | 165,208 | |
| 561,320 | |||
| Air Freight & Logistics - 0.1% | |||
| Delhivery Private Ltd. | 2,469,600 | 9,151 | |
| ZTO Express, Inc. sponsored ADR | 378,300 | 10,785 | |
| 19,936 | |||
| Airlines - 0.1% | |||
| Delta Air Lines, Inc. (a) | 484,500 | 18,944 | |
| United Airlines Holdings, Inc. (a) | 767,300 | 37,567 | |
| 56,511 | |||
| Commercial Services & Supplies - 0.1% | |||
| ACV Auctions, Inc. Class A (a) | 2,429,145 | 23,806 | |
| Electrical Equipment - 0.3% | |||
| Acuity Brands, Inc. | 646,338 | 121,848 | |
| Array Technologies, Inc. (a) | 374,100 | 8,316 | |
| Regal Rexnord Corp. | 26,600 | 3,703 | |
| 133,867 | |||
| Machinery - 0.1% | |||
| Deere & Co. | 76,354 | 32,286 | |
| Professional Services - 0.0% | |||
| Experian PLC | 211,100 | 7,720 | |
| Road & Rail - 0.2% | |||
| Avis Budget Group, Inc. (a) | 263,783 | 52,767 | |
| Bird Global, Inc. (a)(b) | 1,821,129 | 427 | |
| Bird Global, Inc.: | |||
| Class A (a)(d) | 18,328,735 | 4,300 | |
| Stage 1 rights (a)(c) | 262,923 | 0 | |
| Stage 2 rights (a)(c) | 262,922 | 0 | |
| Stage 3 rights (a)(c) | 262,922 | 0 | |
| Hertz Global Holdings, Inc. (a)(d) | 1,466,783 | 26,431 | |
| 83,925 | |||
TOTAL INDUSTRIALS | 919,371 | ||
| INFORMATION TECHNOLOGY - 37.5% | |||
| IT Services - 2.7% | |||
| Adyen BV (a)(e) | 5,560 | 8,406 | |
| Block, Inc. Class A (a) | 974,300 | 79,620 | |
| Cloudflare, Inc. (a) | 92,349 | 4,886 | |
| MasterCard, Inc. Class A | 1,427,782 | 529,136 | |
| MongoDB, Inc. Class A (a) | 188,309 | 40,338 | |
| Okta, Inc. (a) | 1,316,950 | 96,941 | |
| PayPal Holdings, Inc. (a) | 774,356 | 63,102 | |
| Shopify, Inc. Class A (a) | 82,900 | 4,085 | |
| Snowflake, Inc. (a)(d) | 235,746 | 36,880 | |
| Twilio, Inc. Class A (a) | 942,067 | 56,373 | |
| Visa, Inc. Class A | 545,207 | 125,512 | |
| X Holdings I, Inc. (b)(c) | 19,660 | 7,800 | |
| 1,053,079 | |||
| Semiconductors & Semiconductor Equipment - 14.9% | |||
| Advanced Micro Devices, Inc. (a) | 3,700,250 | 278,074 | |
| ASML Holding NV | 87,447 | 57,788 | |
| Cirrus Logic, Inc. (a) | 681,400 | 61,592 | |
| Enphase Energy, Inc. (a) | 203,700 | 45,095 | |
| GlobalFoundries, Inc. (a) | 4,376,500 | 259,439 | |
| Lam Research Corp. | 163,606 | 81,819 | |
| Marvell Technology, Inc. | 27,350,916 | 1,180,192 | |
| Microchip Technology, Inc. | 215,894 | 16,758 | |
| Monolithic Power Systems, Inc. | 222,717 | 95,002 | |
| NVIDIA Corp. | 12,197,413 | 2,383,009 | |
| NXP Semiconductors NV | 3,662,899 | 675,109 | |
| onsemi (a) | 3,854,165 | 283,088 | |
| SolarEdge Technologies, Inc. (a) | 103,800 | 33,126 | |
| Taiwan Semiconductor Manufacturing Co. Ltd. sponsored ADR | 1,848,168 | 171,381 | |
| Teradyne, Inc. | 1,368,359 | 139,162 | |
| Wolfspeed, Inc. (a) | 19,264 | 1,484 | |
| 5,762,118 | |||
| Software - 10.6% | |||
| Atom Tickets LLC (a)(b)(c)(g) | 1,204,239 | 0 | |
| Bill.Com Holdings, Inc. (a)(d) | 506,773 | 58,593 | |
| Confluent, Inc. (a) | 246,700 | 5,699 | |
| Datadog, Inc. Class A (a)(d) | 614,297 | 45,956 | |
| HubSpot, Inc. (a) | 436,223 | 151,374 | |
| Intuit, Inc. | 375,640 | 158,772 | |
| Microsoft Corp. | 12,528,839 | 3,104,772 | |
| Paycom Software, Inc. (a) | 182,158 | 59,008 | |
| Pine Labs Private Ltd. (a)(b)(c) | 9,912 | 5,669 | |
| Salesforce.com, Inc. (a) | 2,010,637 | 337,727 | |
| ServiceNow, Inc. (a) | 171,474 | 78,043 | |
| Splunk, Inc. (a) | 532,476 | 50,995 | |
| Stripe, Inc. Class B (a)(b)(c) | 173,600 | 4,665 | |
| Tanium, Inc. Class B (a)(b)(c) | 554,900 | 4,040 | |
| Zoom Video Communications, Inc. Class A (a) | 673,550 | 50,516 | |
| 4,115,829 | |||
| Technology Hardware, Storage & Peripherals - 9.3% | |||
| Apple, Inc. | 25,111,775 | 3,623,374 | |
TOTAL INFORMATION TECHNOLOGY | 14,554,400 | ||
| MATERIALS - 0.7% | |||
| Chemicals - 0.1% | |||
| Cibus Corp.: | |||
| Series C (a)(b)(c)(g) | 3,045,600 | 6,091 | |
| Series D (a)(b)(c)(g) | 1,716,640 | 3,433 | |
| Series E (a)(b)(c)(g) | 2,099,645 | 4,199 | |
| Series F (a)(b)(c)(g) | 652,756 | 1,306 | |
| Linde PLC | 67,184 | 22,234 | |
| 37,263 | |||
| Metals & Mining - 0.6% | |||
| Freeport-McMoRan, Inc. | 5,405,639 | 241,200 | |
TOTAL MATERIALS | 278,463 | ||
| REAL ESTATE - 0.1% | |||
| Equity Real Estate Investment Trusts (REITs) - 0.0% | |||
| Welltower, Inc. | 56,100 | 4,210 | |
| Real Estate Management & Development - 0.1% | |||
| WeWork, Inc. (a)(d) | 11,955,558 | 19,009 | |
TOTAL REAL ESTATE | 23,219 | ||
| UTILITIES - 0.0% | |||
| Electric Utilities - 0.0% | |||
| NextEra Energy, Inc. | 102,600 | 7,657 | |
| TOTAL COMMON STOCKS (Cost $22,265,276) | 37,833,590 | ||
| Preferred Stocks - 2.4% | |||
| Shares | Value ($) (000s) | ||
| Convertible Preferred Stocks - 2.1% | |||
| COMMUNICATION SERVICES - 0.3% | |||
| Interactive Media & Services - 0.3% | |||
| ByteDance Ltd. Series E1 (a)(b)(c) | 293,038 | 57,998 | |
| Reddit, Inc.: | |||
| Series B(a)(b)(c) | 524,232 | 19,685 | |
| Series E(a)(b)(c) | 43,813 | 1,645 | |
| Series F(a)(b)(c) | 457,142 | 17,166 | |
| 96,494 | |||
| CONSUMER DISCRETIONARY - 0.3% | |||
| Automobiles - 0.0% | |||
| Rad Power Bikes, Inc.: | |||
| Series A(a)(b)(c) | 120,997 | 486 | |
| Series C(a)(b)(c) | 476,111 | 1,914 | |
| Series D(a)(b)(c) | 867,000 | 3,485 | |
| 5,885 | |||
| Hotels, Restaurants & Leisure - 0.1% | |||
| Discord, Inc. Series I (a)(b)(c) | 6,100 | 2,336 | |
| MOD Super Fast Pizza Holdings LLC: | |||
| Series 3(a)(b)(c)(g) | 68,723 | 19,106 | |
| Series 4(a)(b)(c)(g) | 6,272 | 1,670 | |
| Series 5(a)(b)(c)(g) | 25,187 | 6,299 | |
| 29,411 | |||
| Internet & Direct Marketing Retail - 0.2% | |||
| Instacart, Inc.: | |||
| Series H(a)(b)(c) | 245,379 | 10,821 | |
| Series I(a)(b)(c) | 118,846 | 5,241 | |
| Meesho Series F (a)(b)(c) | 546,589 | 43,306 | |
| 59,368 | |||
| Textiles, Apparel & Luxury Goods - 0.0% | |||
| CelLink Corp. Series D (b)(c) | 771,513 | 12,174 | |
TOTAL CONSUMER DISCRETIONARY | 106,838 | ||
| CONSUMER STAPLES - 0.2% | |||
| Food & Staples Retailing - 0.1% | |||
| GoBrands, Inc.: | |||
| Series G(a)(b)(c) | 166,200 | 26,167 | |
| Series H(a)(b)(c) | 104,029 | 16,378 | |
| 42,545 | |||
| Food Products - 0.0% | |||
| AgBiome LLC Series C (a)(b)(c) | 1,091,300 | 7,126 | |
| Bowery Farming, Inc. Series C1 (a)(b)(c) | 161,262 | 3,275 | |
| 10,401 | |||
| Tobacco - 0.1% | |||
| JUUL Labs, Inc.: | |||
| Series C(a)(b)(c) | 2,570,575 | 31,130 | |
| Series D(a)(b)(c) | 13,822 | 167 | |
| Series E(a)(b)(c) | 14,959 | 181 | |
| 31,478 | |||
TOTAL CONSUMER STAPLES | 84,424 | ||
| HEALTH CARE - 0.0% | |||
| Biotechnology - 0.0% | |||
| Castle Creek Biosciences, Inc. Series D2 (b)(c) | 5,347 | 1,089 | |
| Health Care Equipment & Supplies - 0.0% | |||
| Blink Health LLC Series C (a)(b)(c) | 170,685 | 7,374 | |
| Pharmaceuticals - 0.0% | |||
| Castle Creek Pharmaceutical Holdings, Inc. Series B (a)(b)(c) | 3,301 | 731 | |
TOTAL HEALTH CARE | 9,194 | ||
| INDUSTRIALS - 0.6% | |||
| Aerospace & Defense - 0.6% | |||
| ABL Space Systems: | |||
| Series B(a)(b)(c) | 270,130 | 9,935 | |
| Series B2(a)(b)(c) | 141,569 | 5,142 | |
| Relativity Space, Inc. Series E (a)(b)(c) | 2,480,614 | 47,380 | |
| Space Exploration Technologies Corp.: | |||
| Series G(a)(b)(c) | 97,277 | 74,903 | |
| Series H(a)(b)(c) | 25,767 | 19,841 | |
| Series N(a)(b)(c) | 79,406 | 61,143 | |
| 218,344 | |||
| Construction & Engineering - 0.0% | |||
| Beta Technologies, Inc. Series A (a)(b)(c) | 101,010 | 7,689 | |
TOTAL INDUSTRIALS | 226,033 | ||
| INFORMATION TECHNOLOGY - 0.5% | |||
| Electronic Equipment & Components - 0.0% | |||
| Enevate Corp. Series E (a)(b)(c) | 12,084,432 | 6,646 | |
| Menlo Micro, Inc. Series C (b)(c) | 4,680,700 | 5,289 | |
| 11,935 | |||
| IT Services - 0.0% | |||
| AppNexus, Inc. Series E (Escrow) (a)(b)(c) | 646,522 | 20 | |
| Yanka Industries, Inc. Series F (a)(b)(c) | 508,854 | 5,506 | |
| 5,526 | |||
| Semiconductors & Semiconductor Equipment - 0.2% | |||
| Alif Semiconductor Series C (b)(c) | 391,847 | 6,591 | |
| Astera Labs, Inc.: | |||
| Series A(b)(c) | 672,992 | 6,777 | |
| Series B(b)(c) | 114,587 | 1,154 | |
| Series C(a)(b)(c) | 1,572,300 | 15,833 | |
| Series D(b)(c) | 2,623,426 | 26,418 | |
| GaN Systems, Inc.: | |||
| Series F1(a)(b)(c) | 661,660 | 3,546 | |
| Series F2(a)(b)(c) | 349,385 | 1,873 | |
| SiMa.ai: | |||
| Series B(a)(b)(c) | 2,821,200 | 18,281 | |
| Series B1(b)(c) | 188,978 | 1,423 | |
| Xsight Labs Ltd. Series D (a)(b)(c) | 1,192,000 | 9,166 | |
| 91,062 | |||
| Software - 0.3% | |||
| Algolia, Inc. Series D (a)(b)(c) | 276,495 | 4,333 | |
| Bolt Technology OU Series E (a)(b)(c) | 170,267 | 23,433 | |
| Databricks, Inc.: | |||
| Series G(a)(b)(c) | 437,958 | 21,552 | |
| Series H(a)(b)(c) | 273,924 | 13,480 | |
| Dataminr, Inc. Series D (a)(b)(c) | 277,250 | 4,278 | |
| Delphix Corp. Series D (a)(b)(c) | 675,445 | 3,472 | |
| Mountain Digital, Inc. Series D (a)(b)(c) | 524,265 | 5,903 | |
| Skyryse, Inc. Series B (a)(b)(c) | 560,000 | 11,323 | |
| Stripe, Inc. Series H (a)(b)(c) | 73,100 | 1,964 | |
| Tenstorrent, Inc. Series C1 (a)(b)(c) | 77,800 | 4,060 | |
| 93,798 | |||
TOTAL INFORMATION TECHNOLOGY | 202,321 | ||
| MATERIALS - 0.2% | |||
| Metals & Mining - 0.2% | |||
| Diamond Foundry, Inc. Series C (a)(b)(c) | 2,271,329 | 80,564 | |
| UTILITIES - 0.0% | |||
| Independent Power and Renewable Electricity Producers - 0.0% | |||
| Redwood Materials Series C (a)(b)(c) | 341,408 | 10,072 | |
| TOTAL CONVERTIBLE PREFERRED STOCKS | 815,940 | ||
| Nonconvertible Preferred Stocks - 0.3% | |||
| CONSUMER DISCRETIONARY - 0.2% | |||
| Automobiles - 0.0% | |||
| Neutron Holdings, Inc.: | |||
| Series 1C(a)(b)(c) | 50,654,200 | 1,216 | |
| Series 1D(a)(b)(c) | 85,315,542 | 2,048 | |
| Waymo LLC Series A2 (a)(b)(c) | 81,316 | 3,937 | |
| 7,201 | |||
| Internet & Direct Marketing Retail - 0.2% | |||
| Circle Internet Financial Ltd. Series E (b)(c) | 1,244,183 | 42,053 | |
| ZKH Group Ltd. Series F (c) | 21,325,985 | 10,023 | |
| 52,076 | |||
TOTAL CONSUMER DISCRETIONARY | 59,277 | ||
| HEALTH CARE - 0.0% | |||
| Pharmaceuticals - 0.0% | |||
| Castle Creek Pharmaceutical Holdings, Inc. Series A4 (a)(b)(c) | 29,758 | 6,440 | |
| INFORMATION TECHNOLOGY - 0.1% | |||
| IT Services - 0.0% | |||
| Gupshup, Inc. (a)(b)(c) | 709,497 | 12,913 | |
| Software - 0.1% | |||
| Pine Labs Private Ltd.: | |||
| Series 1(a)(b)(c) | 23,689 | 13,548 | |
| Series A(a)(b)(c) | 5,920 | 3,386 | |
| Series B(a)(b)(c) | 6,440 | 3,683 | |
| Series B2(a)(b)(c) | 5,209 | 2,979 | |
| Series C(a)(b)(c) | 9,690 | 5,542 | |
| Series C1(a)(b)(c) | 2,041 | 1,167 | |
| Series D(a)(b)(c) | 2,183 | 1,249 | |
| 31,554 | |||
TOTAL INFORMATION TECHNOLOGY | 44,467 | ||
| TOTAL NONCONVERTIBLE PREFERRED STOCKS | 110,184 | ||
| TOTAL PREFERRED STOCKS (Cost $857,302) | 926,124 | ||
| Convertible Bonds - 0.1% | |||
Principal Amount (h) (000s) | Value ($) (000s) | ||
| CONSUMER DISCRETIONARY - 0.1% | |||
| Automobiles - 0.1% | |||
| Neutron Holdings, Inc.: | |||
| 4% 10/27/25 (b)(c)(i) | 20,045 | 18,507 | |
| 4% 5/22/27 (b)(c) | 2,433 | 2,344 | |
| 4% 6/12/27 (b)(c) | 647 | 624 | |
| (Cost $23,125) | 21,475 | ||
| Preferred Securities - 0.0% | |||
Principal Amount (h) (000s) | Value ($) (000s) | ||
| INFORMATION TECHNOLOGY - 0.0% | |||
| Semiconductors & Semiconductor Equipment - 0.0% | |||
| GaN Systems, Inc. 0% (b)(c)(j) | 15,508 | 9,592 | |
| Software - 0.0% | |||
| Tenstorrent, Inc. 0% (b)(c)(j) | 4,320 | 3,793 | |
| TOTAL PREFERRED SECURITIES (Cost $19,828) | 13,385 | ||
| Money Market Funds - 1.4% | |||
| Shares | Value ($) (000s) | ||
| Fidelity Cash Central Fund 4.38% (k) | 14,593,872 | 14,597 | |
| Fidelity Securities Lending Cash Central Fund 4.38% (k)(l) | 539,776,966 | 539,831 | |
| TOTAL MONEY MARKET FUNDS (Cost $554,428) | 554,428 | ||
| TOTAL INVESTMENT IN SECURITIES - 101.5% (Cost $23,719,959) | 39,349,002 |
NET OTHER ASSETS (LIABILITIES) - (1.5)% | (566,440) |
| NET ASSETS - 100.0% | 38,782,562 |
| (a) | Non-income producing |
| (b) | Restricted securities (including private placements) - Investment in securities not registered under the Securities Act of 1933 (excluding 144A issues). At the end of the period, the value of restricted securities (excluding 144A issues) amounted to $1,463,518,000 or 3.8% of net assets. |
| (c) | Level 3 security |
| (d) | Security or a portion of the security is on loan at period end. |
| (e) | Security exempt from registration under Rule 144A of the Securities Act of 1933. These securities may be resold in transactions exempt from registration, normally to qualified institutional buyers. At the end of the period, the value of these securities amounted to $42,888,000 or 0.1% of net assets. |
| (f) | Affiliated company |
| (g) | Investment is owned by a wholly-owned subsidiary (Subsidiary) that is treated as a corporation for U.S. tax purposes. |
| (h) | Amount is stated in United States dollars unless otherwise noted. |
| (i) | Security initially issued at one coupon which converts to a higher coupon at a specified date. The rate shown is the rate at period end. |
| (j) | Security is perpetual in nature with no stated maturity date. |
| (k) | Affiliated fund that is generally available only to investment companies and other accounts managed by Fidelity Investments. The rate quoted is the annualized seven-day yield of the fund at period end. A complete unaudited listing of the fund's holdings as of its most recent quarter end is available upon request. In addition, each Fidelity Central Fund's financial statements are available on the SEC's website or upon request. |
| (l) | Investment made with cash collateral received from securities on loan. |
| Additional information on each restricted holding is as follows: | ||
| Security | Acquisition Date | Acquisition Cost ($) (000s) |
| ABL Space Systems Series B | 3/24/21 | 12,165 |
| ABL Space Systems Series B2 | 10/22/21 | 9,626 |
| AgBiome LLC Series C | 6/29/18 | 6,912 |
| Algolia, Inc. Series D | 7/23/21 | 8,086 |
| Alif Semiconductor Series C | 3/08/22 | 7,954 |
| Ant International Co. Ltd. Class C | 5/16/18 | 24,503 |
| AppNexus, Inc. Series E (Escrow) | 8/01/14 | 0 |
| Astera Labs, Inc. Series A | 5/17/22 | 6,844 |
| Astera Labs, Inc. Series B | 5/17/22 | 1,165 |
| Astera Labs, Inc. Series C | 8/24/21 | 5,286 |
| Astera Labs, Inc. Series D | 5/17/22 - 5/27/22 | 26,679 |
| Atom Tickets LLC | 8/15/17 | 7,000 |
| Beta Technologies, Inc. Series A | 4/09/21 | 7,401 |
| Bird Global, Inc. | 5/11/21 | 18,211 |
| Blink Health LLC Series A1 | 12/30/20 | 1,385 |
| Blink Health LLC Series C | 11/07/19 - 7/14/21 | 6,515 |
| Bolt Technology OU Series E | 1/03/22 | 44,235 |
| Bowery Farming, Inc. Series C1 | 5/18/21 | 9,716 |
| ByteDance Ltd. Series E1 | 11/18/20 | 32,109 |
| Castle Creek Biosciences, Inc. Series D2 | 6/28/21 | 917 |
| Castle Creek Pharmaceutical Holdings, Inc. Series A4 | 9/29/16 | 9,831 |
| Castle Creek Pharmaceutical Holdings, Inc. Series B | 10/09/18 | 1,360 |
| CelLink Corp. Series D | 1/20/22 | 16,066 |
| Cibus Corp. Series C | 2/16/18 | 6,396 |
| Cibus Corp. Series D | 5/10/19 | 2,146 |
| Cibus Corp. Series E | 6/23/21 | 3,695 |
| Cibus Corp. Series F | 12/02/22 | 1,306 |
| Circle Internet Financial Ltd. Series E | 5/11/21 | 20,193 |
| Databricks, Inc. Series G | 2/01/21 | 25,893 |
| Databricks, Inc. Series H | 8/31/21 | 20,129 |
| Dataminr, Inc. Series D | 3/06/15 | 3,535 |
| Delphix Corp. Series D | 7/10/15 | 6,079 |
| Diamond Foundry, Inc. Series C | 3/15/21 | 54,512 |
| Discord, Inc. Series I | 9/15/21 | 3,359 |
| Enevate Corp. Series E | 1/29/21 | 13,398 |
| Epic Games, Inc. | 7/30/20 | 3,525 |
| Fanatics, Inc. Class A | 8/13/20 - 10/24/22 | 78,990 |
| GaN Systems, Inc. Series F1 | 11/30/21 | 5,611 |
| GaN Systems, Inc. Series F2 | 11/30/21 | 2,963 |
| GaN Systems, Inc. 0% | 11/30/21 | 15,508 |
| GoBrands, Inc. Series G | 3/02/21 | 41,503 |
| GoBrands, Inc. Series H | 7/22/21 | 40,414 |
| Gupshup, Inc. | 6/08/21 | 16,223 |
| Instacart, Inc. Series H | 11/13/20 | 14,723 |
| Instacart, Inc. Series I | 2/26/21 | 14,856 |
| JUUL Labs, Inc. Class A | 12/20/17 | 453 |
| JUUL Labs, Inc. Class B | 11/21/17 | 0 |
| JUUL Labs, Inc. Series C | 5/22/15 - 7/06/18 | 0 |
| JUUL Labs, Inc. Series D | 6/25/18 - 7/06/18 | 0 |
| JUUL Labs, Inc. Series E | 12/20/17 | 321 |
| Meesho Series F | 9/21/21 | 41,908 |
| Menlo Micro, Inc. Series C | 2/09/22 | 6,204 |
| MOD Super Fast Pizza Holdings LLC Series 3 | 11/03/16 | 9,415 |
| MOD Super Fast Pizza Holdings LLC Series 4 | 12/14/17 | 878 |
| MOD Super Fast Pizza Holdings LLC Series 5 | 5/15/19 | 3,590 |
| Mountain Digital, Inc. Series D | 11/05/21 | 12,040 |
| MultiPlan Corp. warrants | 10/08/20 | 0 |
| Neutron Holdings, Inc. | 2/04/21 | 72 |
| Neutron Holdings, Inc. Series 1C | 7/03/18 | 9,262 |
| Neutron Holdings, Inc. Series 1D | 1/25/19 | 20,689 |
| Neutron Holdings, Inc. 4% 10/27/25 | 10/29/21 | 20,045 |
| Neutron Holdings, Inc. 4% 5/22/27 | 6/04/20 | 2,433 |
| Neutron Holdings, Inc. 4% 6/12/27 | 6/12/20 | 647 |
| Oddity Tech Ltd. | 1/06/22 | 10,079 |
| Pine Labs Private Ltd. | 6/30/21 | 3,696 |
| Pine Labs Private Ltd. Series 1 | 6/30/21 | 8,833 |
| Pine Labs Private Ltd. Series A | 6/30/21 | 2,207 |
| Pine Labs Private Ltd. Series B | 6/30/21 | 2,401 |
| Pine Labs Private Ltd. Series B2 | 6/30/21 | 1,942 |
| Pine Labs Private Ltd. Series C | 6/30/21 | 3,613 |
| Pine Labs Private Ltd. Series C1 | 6/30/21 | 761 |
| Pine Labs Private Ltd. Series D | 6/30/21 | 814 |
| Rad Power Bikes, Inc. | 1/21/21 | 4,477 |
| Rad Power Bikes, Inc. Series A | 1/21/21 | 584 |
| Rad Power Bikes, Inc. Series C | 1/21/21 | 2,297 |
| Rad Power Bikes, Inc. Series D | 9/17/21 | 8,309 |
| Rapyd Financial Network 2016 Ltd. | 3/30/21 | 15,000 |
| Reddit, Inc. Series B | 7/26/17 | 7,442 |
| Reddit, Inc. Series E | 5/18/21 | 1,861 |
| Reddit, Inc. Series F | 8/11/21 | 28,249 |
| Redwood Materials Series C | 5/28/21 | 16,184 |
| Relativity Space, Inc. Series E | 5/27/21 | 56,645 |
| SiMa.ai Series B | 5/10/21 | 14,465 |
| SiMa.ai Series B1 | 4/25/22 | 1,340 |
| Skyryse, Inc. Series B | 10/21/21 | 13,821 |
| Space Exploration Technologies Corp. Class A | 10/16/15 - 5/24/22 | 55,406 |
| Space Exploration Technologies Corp. Class C | 9/11/17 | 376 |
| Space Exploration Technologies Corp. Series G | 1/20/15 | 7,535 |
| Space Exploration Technologies Corp. Series H | 8/04/17 | 3,479 |
| Space Exploration Technologies Corp. Series N | 8/04/20 | 21,440 |
| Stripe, Inc. Class B | 5/18/21 | 6,966 |
| Stripe, Inc. Series H | 3/15/21 | 2,933 |
| Tanium, Inc. Class B | 4/21/17 | 2,755 |
| Tenstorrent, Inc. Series C1 | 4/23/21 | 4,626 |
| Tenstorrent, Inc. 0% | 4/23/21 | 4,320 |
| Tory Burch LLC | 5/14/15 | 20,890 |
| Veterinary Emergency Group LLC Class A | 9/16/21 - 3/17/22 | 21,636 |
| Waymo LLC Series A2 | 5/08/20 | 6,982 |
| X Holdings I, Inc. | 10/25/22 | 19,660 |
| Xsight Labs Ltd. Series D | 2/16/21 | 9,531 |
| Yanka Industries, Inc. Series F | 4/08/21 | 16,221 |
| Affiliate (Amounts in thousands) | Value, beginning of period ($) | Purchases ($) | Sales Proceeds ($) | Dividend Income ($) | Realized Gain (loss) ($) | Change in Unrealized appreciation (depreciation) ($) | Value, end of period ($) | % ownership, end of period |
| Fidelity Cash Central Fund 4.38% | - | 1,244,965 | 1,230,368 | 1,230 | - | - | 14,597 | 0.0% |
| Fidelity Securities Lending Cash Central Fund 4.38% | 776,449 | 1,719,996 | 1,956,614 | 1,650 | - | - | 539,831 | 1.8% |
| Total | 776,449 | 2,964,961 | 3,186,982 | 2,880 | - | - | 554,428 | |
| Affiliate (Amounts in thousands) | Value, beginning of period ($) | Purchases ($) | Sales Proceeds ($) | Dividend Income ($) | Realized Gain (loss) ($) | Change in Unrealized appreciation (depreciation) ($) | Value, end of period ($) |
| American Eagle Outfitters, Inc. | 116,007 | 27,166 | 882 | - | 24 | 50,750 | 193,065 |
| The Real Good Food Co. LLC Class B | - | - | - | - | - | - | - |
| The Real Good Food Co. LLC Class B unit | 8,203 | - | - | - | - | (1,186) | 7,017 |
| The Real Good Food Co., Inc. | 314 | - | 2 | - | (2) | (44) | - |
| Total | 124,524 | 27,166 | 884 | - | 22 | 49,520 | 200,082 |
| Valuation Inputs at Reporting Date: | ||||
Description (Amounts in thousands) | Total ($) | Level 1 ($) | Level 2 ($) | Level 3 ($) |
Investments in Securities: | ||||
| Equities: | ||||
Communication Services | 4,792,047 | 4,639,040 | 51,327 | 101,680 |
Consumer Discretionary | 11,281,312 | 10,721,487 | 220,561 | 339,264 |
Consumer Staples | 563,122 | 478,362 | - | 84,760 |
Energy | 1,783,906 | 1,582,728 | 201,178 | - |
Financials | 410,902 | 347,150 | 39,087 | 24,665 |
Health Care | 3,581,858 | 3,491,285 | 33,534 | 57,039 |
Industrials | 1,145,404 | 637,945 | 51,222 | 456,237 |
Information Technology | 14,801,188 | 14,523,820 | 8,406 | 268,962 |
Materials | 359,027 | 263,434 | - | 95,593 |
Real Estate | 23,219 | 23,219 | - | - |
Utilities | 17,729 | 7,657 | - | 10,072 |
| Corporate Bonds | 21,475 | - | - | 21,475 |
| Preferred Securities | 13,385 | - | - | 13,385 |
| Money Market Funds | 554,428 | 554,428 | - | - |
| Total Investments in Securities: | 39,349,002 | 37,270,555 | 605,315 | 1,473,132 |
| Net Unrealized Depreciation on Unfunded Commitments | (2,214) | - | - | (2,214) |
| Total | (2,214) | - | - | (2,214) |
| (Amounts in thousands) | |||
| Investments in Securities: | |||
| Industrials | |||
| Beginning Balance | $ | 432,551 | |
| Net Realized Gain (Loss) on Investment Securities | - | ||
| Net Unrealized Gain (Loss) on Investment Securities | 23,686 | ||
| Cost of Purchases | - | ||
| Proceeds of Sales | - | ||
| Amortization/Accretion | - | ||
| Transfers into Level 3 | - | ||
| Transfers out of Level 3 | - | ||
| Ending Balance | $ | 456,237 | |
| The change in unrealized gain (loss) for the period attributable to Level 3 securities held at January 31, 2023 | $ | 23,686 | |
| Information Technology | |||
| Beginning Balance | $ | 392,120 | |
| Net Realized Gain (Loss) on Investment Securities | (1,257) | ||
| Net Unrealized Gain (Loss) on Investment Securities | (131,860) | ||
| Cost of Purchases | 19,660 | ||
| Proceeds of Sales | (9,701) | ||
| Amortization/Accretion | - | ||
| Transfers into Level 3 | - | ||
| Transfers out of Level 3 | - | ||
| Ending Balance | $ | 268,962 | |
| The change in unrealized gain (loss) for the period attributable to Level 3 securities held at January 31, 2023 | $ | (122,558) | |
| Other Investments in Securities | |||
| Beginning Balance | $ | 580,432 | |
| Net Realized Gain (Loss) on Investment Securities | - | ||
| Net Unrealized Gain (Loss) on Investment Securities | 92,270 | ||
| Cost of Purchases | 19,975 | ||
| Proceeds of Sales | (5,145) | ||
| Amortization/Accretion | - | ||
| Transfers into Level 3 | 72,469 | ||
| Transfers out of Level 3 | (12,068) | ||
| Ending Balance | $ | 747,933 | |
| The change in unrealized gain (loss) for the period attributable to Level 3 securities held at January 31, 2023 | $ | 92,270 | |
| The information used in the above reconciliation represents fiscal year to date activity for any Investments in Securities identified as using Level 3 inputs at either the beginning or the end of the current fiscal period. Cost of purchases and proceeds of sales may include securities received and/or delivered through in-kind transactions. Transfers into Level 3 were attributable to a lack of observable market data resulting from decreases in market activity, decreases in liquidity, security restructurings or corporate actions. Transfers out of Level 3 were attributable to observable market data becoming available for those securities. Transfers in or out of Level 3 represent the beginning value of any Security or Instrument where a change in the pricing level occurred from the beginning to the end of the period. The cost of purchases and the proceeds of sales may include securities received or delivered through corporate actions or exchanges. Realized and unrealized gains (losses) disclosed in the reconciliation are included in Net Gain (Loss) on the Fund's Statement of Operations. | |||
| Statement of Assets and Liabilities | ||||
| Amounts in thousands (except per-share amounts) | January 31, 2023 (Unaudited) | |||
| Assets | ||||
| Investment in securities, at value (including securities loaned of $540,200) - See accompanying schedule: | ||||
Unaffiliated issuers (cost $22,946,369) | $ | 38,594,492 | ||
Fidelity Central Funds (cost $554,428) | 554,428 | |||
Other affiliated issuers (cost $219,162) | 200,082 | |||
| Total Investment in Securities (cost $23,719,959) | $ | 39,349,002 | ||
| Cash | 831 | |||
| Foreign currency held at value (cost $75) | 75 | |||
| Receivable for investments sold | 34,864 | |||
| Receivable for fund shares sold | 15,489 | |||
| Dividends receivable | 9,386 | |||
| Interest receivable | 941 | |||
| Distributions receivable from Fidelity Central Funds | 109 | |||
| Prepaid expenses | 37 | |||
| Other receivables | 772 | |||
Total assets | 39,411,506 | |||
| Liabilities | ||||
| Payable for investments purchased | $ | 20,705 | ||
| Unrealized depreciation on unfunded commitments | 2,214 | |||
| Payable for fund shares redeemed | 26,734 | |||
| Accrued management fee | 16,730 | |||
| Other affiliated payables | 4,163 | |||
| Other payables and accrued expenses | 18,605 | |||
| Collateral on securities loaned | 539,793 | |||
| Total Liabilities | 628,944 | |||
| Net Assets | $ | 38,782,562 | ||
| Net Assets consist of: | ||||
| Paid in capital | $ | 23,081,794 | ||
| Total accumulated earnings (loss) | 15,700,768 | |||
| Net Assets | $ | 38,782,562 | ||
| Net Asset Value and Maximum Offering Price | ||||
| Blue Chip Growth : | ||||
Net Asset Value , offering price and redemption price per share ($34,964,241 ÷ 275,740 shares) | $ | 126.80 | ||
| Class K : | ||||
Net Asset Value , offering price and redemption price per share ($3,818,321 ÷ 29,972 shares) (a) | $ | 127.39 | ||
(a)Corresponding Net Asset Value does not calculate due to rounding of fractional net assets and/or shares | ||||
| Statement of Operations | ||||
| Amounts in thousands | Six months ended January 31, 2023 (Unaudited) | |||
| Investment Income | ||||
| Dividends | $ | 116,974 | ||
| Interest | 45 | |||
| Income from Fidelity Central Funds (including $1,650 from security lending) | 2,880 | |||
| Total Income | 119,899 | |||
| Expenses | ||||
| Management fee | ||||
| Basic fee | $ | 98,800 | ||
| Performance adjustment | 7,804 | |||
| Transfer agent fees | 24,520 | |||
| Accounting fees | 1,008 | |||
| Custodian fees and expenses | 242 | |||
| Independent trustees' fees and expenses | 66 | |||
| Registration fees | 148 | |||
| Audit | 90 | |||
| Legal | 34 | |||
| Interest | 131 | |||
| Miscellaneous | 128 | |||
| Total expenses before reductions | 132,971 | |||
| Expense reductions | (707) | |||
| Total expenses after reductions | 132,264 | |||
| Net Investment income (loss) | (12,365) | |||
| Realized and Unrealized Gain (Loss) | ||||
| Net realized gain (loss) on: | ||||
| Investment Securities: | ||||
| Unaffiliated issuers | 336,205 | |||
| Redemptions in-kind | 73,492 | |||
| Affiliated issuers | 22 | |||
| Foreign currency transactions | (129) | |||
| Total net realized gain (loss) | 409,590 | |||
| Change in net unrealized appreciation (depreciation) on: | ||||
| Investment Securities: | ||||
| Unaffiliated issuers (net of decrease in deferred foreign taxes of $5,499) | (2,163,470) | |||
| Affiliated issuers | 49,520 | |||
| Unfunded commitments | 428 | |||
| Assets and liabilities in foreign currencies | 81 | |||
| Total change in net unrealized appreciation (depreciation) | (2,113,441) | |||
| Net gain (loss) | (1,703,851) | |||
| Net increase (decrease) in net assets resulting from operations | $ | (1,716,216) | ||
| Statement of Changes in Net Assets | ||||
| Amount in thousands | Six months ended January 31, 2023 (Unaudited) | Year ended July 31, 2022 | ||
| Increase (Decrease) in Net Assets | ||||
| Operations | ||||
| Net investment income (loss) | $ | (12,365) | $ | (156,441) |
| Net realized gain (loss) | 409,590 | 1,694,904 | ||
| Change in net unrealized appreciation (depreciation) | (2,113,441) | (14,698,589) | ||
| Net increase (decrease) in net assets resulting from operations | (1,716,216) | (13,160,126) | ||
| Distributions to shareholders | (195,822) | (4,919,350) | ||
| Share transactions - net increase (decrease) | (412,346) | 2,233,155 | ||
| Total increase (decrease) in net assets | (2,324,384) | (15,846,321) | ||
| Net Assets | ||||
| Beginning of period | 41,106,946 | 56,953,267 | ||
| End of period | $ | 38,782,562 | $ | 41,106,946 |
| Fidelity® Blue Chip Growth Fund |
Six months ended (Unaudited) January 31, 2023 | Years ended July 31, 2022 | 2021 | 2020 | 2019 | 2018 | |||||||
Selected Per-Share Data | ||||||||||||
| Net asset value, beginning of period | $ | 132.94 | $ | 187.79 | $ | 138.12 | $ | 103.05 | $ | 99.75 | $ | 83.20 |
| Income from Investment Operations | ||||||||||||
Net investment income (loss) A,B | (.05) | (.50) | (.73) | (.17) | (.04) | .11 C | ||||||
| Net realized and unrealized gain (loss) | (5.45) | (38.32) | 60.84 | 39.23 | 8.65 | 20.20 | ||||||
| Total from investment operations | (5.50) | (38.82) | 60.11 | 39.06 | 8.61 | 20.31 | ||||||
| Distributions from net investment income | - | - | - | - | (.11) | (.08) | ||||||
| Distributions from net realized gain | (.64) | (16.03) | (10.44) | (3.99) | (5.20) | (3.68) | ||||||
| Total distributions | (.64) | (16.03) | (10.44) | (3.99) | (5.31) | (3.76) | ||||||
| Net asset value, end of period | $ | 126.80 | $ | 132.94 | $ | 187.79 | $ | 138.12 | $ | 103.05 | $ | 99.75 |
Total Return D,E | (4.16)% | (22.85)% | 45.70% | 39.45% | 9.09% | 25.21% | ||||||
Ratios to Average Net Assets B,F,G | ||||||||||||
| Expenses before reductions | .72% H | .76% | .79% | .79% | .80% | .72% | ||||||
| Expenses net of fee waivers, if any | .71% H | .76% | .79% | .79% | .80% | .72% | ||||||
| Expenses net of all reductions | .71% H | .76% | .78% | .78% | .80% | .72% | ||||||
| Net investment income (loss) | (.08)% H | (.31)% | (.44)% | (.16)% | (.04)% | .12% C | ||||||
| Supplemental Data | ||||||||||||
| Net assets, end of period (in millions) | $ | 34,964 | $ | 36,726 | $ | 48,318 | $ | 31,023 | $ | 23,023 | $ | 20,714 |
Portfolio turnover rate I | 23% H,J | 34% J | 41% J | 49% J | 45% J | 41% J |
| Fidelity® Blue Chip Growth Fund Class K |
Six months ended (Unaudited) January 31, 2023 | Years ended July 31, 2022 | 2021 | 2020 | 2019 | 2018 | |||||||
Selected Per-Share Data | ||||||||||||
| Net asset value, beginning of period | $ | 133.48 | $ | 188.45 | $ | 138.50 | $ | 103.24 | $ | 99.92 | $ | 83.34 |
| Income from Investment Operations | ||||||||||||
Net investment income (loss) A,B | .01 | (.37) | (.60) | (.08) | .05 | .20 C | ||||||
| Net realized and unrealized gain (loss) | (5.46) | (38.45) | 61.04 | 39.33 | 8.66 | 20.22 | ||||||
| Total from investment operations | (5.45) | (38.82) | 60.44 | 39.25 | 8.71 | 20.42 | ||||||
| Distributions from net investment income | - | - | - | - | (.19) | (.16) | ||||||
| Distributions from net realized gain | (.64) | (16.15) | (10.49) | (3.99) | (5.20) | (3.68) | ||||||
| Total distributions | (.64) | (16.15) | (10.49) | (3.99) | (5.39) | (3.84) | ||||||
| Net asset value, end of period | $ | 127.39 | $ | 133.48 | $ | 188.45 | $ | 138.50 | $ | 103.24 | $ | 99.92 |
Total Return D,E | (4.10)% | (22.78)% | 45.83% | 39.57% | 9.20% | 25.33% | ||||||
Ratios to Average Net Assets B,F,G | ||||||||||||
| Expenses before reductions | .62% H | .68% | .71% | .70% | .70% | .62% | ||||||
| Expenses net of fee waivers, if any | .62% H | .68% | .71% | .69% | .70% | .62% | ||||||
| Expenses net of all reductions | .62% H | .68% | .70% | .69% | .70% | .62% | ||||||
| Net investment income (loss) | .02% H | (.23)% | (.36)% | (.07)% | .05% | .22% C | ||||||
| Supplemental Data | ||||||||||||
| Net assets, end of period (in millions) | $ | 3,818 | $ | 4,380 | $ | 8,635 | $ | 6,625 | $ | 5,316 | $ | 5,669 |
Portfolio turnover rate I | 23% H,J | 34% J | 41% J | 49% J | 45% J | 41% J |
| Fidelity Central Fund | Investment Manager | Investment Objective | Investment Practices | Expense Ratio A |
| Fidelity Money Market Central Funds | Fidelity Management & Research Company LLC (FMR) | Each fund seeks to obtain a high level of current income consistent with the preservation of capital and liquidity. | Short-term Investments | Less than .005% |
| Asset Type | Fair Value | Valuation Technique(s) | Unobservable Input | Amount or Range/Weighted Average | Impact to Valuation from an Increase in Input A |
| Equities | $1,438,272 | Market comparable | Enterprise value/EBITDA multiple (EVEBITDA) | 6.0 - 23.0 / 8.2 | Increase |
| Enterprise value/Revenue multiple (EV/R) | 2.0 - 25.0 / 7.6 | Increase | |||
| Enterprise value/Gross profit multiple (EV/GP) | 7.5 | Increase | |||
| Probability rate | 25.0% - 75.0% / 50.0% | Increase | |||
| Enterprise value/Revenue multiple (EV/R) | 2.1 | Increase | |||
| Liquidity preference | $250.08 - $278.02 / $264.79 | Increase | |||
| Recovery value | Recovery value | $0.00 - $0.03 / $0.00 | Increase | ||
| Market approach | Transaction price | $1.11 - $215.03 / $39.84 | Increase | ||
| Discount rate | 5.0% - 50.0% / 21.8% | Decrease | |||
| Premium rate | 10.0% | Increase | |||
| Book value | Book value multiple | 1.5 | Increase | ||
| Discounted cash flow | Weighted average cost of capital (WACC) | 25.0% - 36.3% / 30.9% | Decrease | ||
| Exit multiple | 1.8 - 7.3 / 3.2 | Increase | |||
| Black scholes | Discount rate | 3.5% - 4.1% / 3.7% | Increase | ||
| Probability rate | 50.0% | Increase | |||
| Volatility | 50.0% - 100.0% / 70.2% | Increase | |||
| Term | 2.0 - 5.0 / 3.9 | Increase | |||
| Corporate Bonds | $21,475 | Market comparable | Enterprise value/Revenue multiple (EV/R) | 3.0 | Increase |
| Discount rate | 29.2% | Decrease | |||
| Probability rate | 10.0% - 50.0% / 33.3% | Increase | |||
| Black scholes | Volatility | 75.0% | Increase | ||
| Term | 0.9 | Increase | |||
| Preferred Securities | $13,385 | Market comparable | Enterprise value/Revenue multiple (EV/R) | 4.6 | Increase |
| Probability rate | 10.0% - 90.0% / 50.0% | Increase | |||
| Market approach | Transaction price | $100.00 | Increase | ||
| Discount rate | 15.0% | Decrease | |||
| Black scholes | Discount rate | 4.1% | Increase | ||
| Volatility | 70.0% | Increase | |||
| Term | 2.0 | Increase |
| Fidelity Blue Chip Growth Fund | $735 |
| Gross unrealized appreciation | $18,509,971 |
| Gross unrealized depreciation | (2,994,083) |
| Net unrealized appreciation (depreciation) | $15,515,888 |
| Tax cost | $23,830,900 |
| Investment to be Acquired | Commitment Amount | Unrealized Appreciation (Depreciation) | |
| Fidelity Blue Chip Growth Fund | Stripe, Inc. | $2,214 | $(2,214) |
| $ Amount | % of Net Assets | |
| Fidelity Blue Chip Growth Fund | 81,032 | .21 |
| Purchases ($) | Sales ($) | |
| Fidelity Blue Chip Growth Fund | 4,267,621 | 4,718,153 |
| Shares | Total net realized gain or loss ($) | Total Proceeds ($) | Participating classes | |
| Fidelity Blue Chip Growth Fund | 1,332 | 73,492 | 157,282 | Class K |
| Shares | Total net realized gain or loss ($) | Total Proceeds ($) | Participating classes | |
| Fidelity Blue Chip Growth Fund | 10,273 | 673,294 | 1,424,375 | Blue Chip Growth, Class K |
| Amount | % of Class-Level Average Net Assets | |
| Blue Chip Growth | $23,717 | .14 |
| Class K | 803 | .04 |
| $24,520 |
| % of Average Net Assets | |
| Fidelity Blue Chip Growth Fund | .01 |
| Amount | |
| Fidelity Blue Chip Growth Fund | $128 |
| Borrower or Lender | Average Loan Balance | Weighted Average Interest Rate | Interest Expense | |
| Fidelity Blue Chip Growth Fund | Borrower | $15,249 | 3.26% | $120 |
| Purchases ($) | Sales ($) | Realized Gain (Loss) ($) | |
| Fidelity Blue Chip Growth Fund | 499,062 | 137,160 | 2,238 |
| Amount | |
| Fidelity Blue Chip Growth Fund | $53 |
| Total Security Lending Fees Paid to NFS | Security Lending Income From Securities Loaned to NFS | Value of Securities Loaned to NFS at Period End | |
| Fidelity Blue Chip Growth Fund | $167 | $59 | $138 |
| Average Loan Balance | Weighted Average Interest Rate | Interest Expense | |
| Fidelity Blue Chip Growth Fund | $10,843 | 3.76% | $11 |
Six months ended January 31, 2023 | Year ended July 31, 2022 | |
| Fidelity Blue Chip Growth Fund | ||
| Distributions to shareholders | ||
| Blue Chip Growth | $175,348 | $4,200,150 |
| Class K | 20,474 | 719,200 |
Total | $195,822 | $4,919,350 |
| Shares | Shares | Dollars | Dollars | |
Six months ended January 31, 2023 | Year ended July 31, 2022 | Six months ended January 31, 2023 | Year ended July 31, 2022 | |
| Fidelity Blue Chip Growth Fund | ||||
| Blue Chip Growth | ||||
| Shares sold | 24,696 | 59,594 | $2,949,072 | $9,796,348 |
| Reinvestment of distributions | 1,237 | 21,851 | 162,230 | 3,946,089 |
| Shares redeemed | (26,455) | (62,488) | (3,179,692) | (9,722,466) |
| Net increase (decrease) | (522) | 18,957 | $(68,391) | $4,019,971 |
| Class K | ||||
| Shares sold | 2,553 | 6,939 | $309,992 | $1,053,095 |
| Reinvestment of distributions | 155 | 3,969 | 20,473 | 719,197 |
| Shares redeemed | (5,554) | (23,912) | (674,420) | (3,559,108) |
| Net increase (decrease) | (2,846) | (13,004) | $(343,955) | $(1,786,816) |
| The Example is based on an investment of $1,000 invested at the beginning of the period and held for the entire period (August 1, 2022 to January 31, 2023). |
Annualized Expense Ratio- A | Beginning Account Value August 1, 2022 | Ending Account Value January 31, 2023 | Expenses Paid During Period- C August 1, 2022 to January 31, 2023 | |||||||
| Fidelity® Blue Chip Growth Fund | ||||||||||
| Fidelity® Blue Chip Growth Fund | .71% | |||||||||
| Actual | $ 1,000 | $ 958.40 | $ 3.50 | |||||||
Hypothetical- B | $ 1,000 | $ 1,021.63 | $ 3.62 | |||||||
| Class K | .62% | |||||||||
| Actual | $ 1,000 | $ 959.00 | $ 3.06 | |||||||
Hypothetical- B | $ 1,000 | $ 1,022.08 | $ 3.16 | |||||||
- Highly liquid investments - cash or convertible to cash within three business days or less
- Moderately liquid investments - convertible to cash in three to seven calendar days
- Less liquid investments - can be sold or disposed of, but not settled, within seven calendar days
- Illiquid investments - cannot be sold or disposed of within seven calendar days
|


Contents
Top Holdings (% of Fund's net assets) | ||
| Apple, Inc. | 9.6 | |
| Microsoft Corp. | 8.3 | |
| Amazon.com, Inc. | 7.4 | |
| NVIDIA Corp. | 6.1 | |
| Alphabet, Inc. Class A | 4.8 | |
| Tesla, Inc. | 2.8 | |
| Meta Platforms, Inc. Class A | 2.7 | |
| Marvell Technology, Inc. | 2.6 | |
| lululemon athletica, Inc. | 2.1 | |
| Netflix, Inc. | 2.1 | |
| 48.5 | ||
| Market Sectors (% of Fund's net assets) | ||
| Information Technology | 37.9 | |
| Consumer Discretionary | 29.4 | |
| Communication Services | 12.3 | |
| Health Care | 9.5 | |
| Energy | 4.4 | |
| Industrials | 2.5 | |
| Consumer Staples | 1.4 | |
| Financials | 1.0 | |
| Materials | 0.8 | |
| Real Estate | 0.0 | |
| Utilities | 0.0 | |
Asset Allocation (% of Fund's net assets) |
 |
Foreign investments - 7.9% |
| Common Stocks - 97.9% | |||
| Shares | Value ($) | ||
| COMMUNICATION SERVICES - 12.2% | |||
| Entertainment - 2.9% | |||
| Activision Blizzard, Inc. | 45,400 | 3,476,278 | |
| Bilibili, Inc. ADR (a) | 149,100 | 3,727,500 | |
| Endeavor Group Holdings, Inc. (a) | 281,188 | 6,307,047 | |
| Netflix, Inc. (a) | 488,524 | 172,869,103 | |
| Sea Ltd. ADR (a) | 640,231 | 41,262,888 | |
| Universal Music Group NV | 423,076 | 10,814,828 | |
| 238,457,644 | |||
| Interactive Media & Services - 9.2% | |||
| Alphabet, Inc. Class A (a) | 4,011,060 | 396,453,170 | |
| Epic Games, Inc. (a)(b)(c) | 1,076 | 910,156 | |
| Meta Platforms, Inc. Class A (a) | 1,511,010 | 225,095,160 | |
| Pinterest, Inc. Class A (a) | 154,800 | 4,069,692 | |
| Snap, Inc. Class A (a) | 10,956,866 | 126,661,371 | |
| Tencent Holdings Ltd. sponsored ADR | 84,000 | 4,095,000 | |
| 757,284,549 | |||
| Wireless Telecommunication Services - 0.1% | |||
| Rogers Communications, Inc. Class B (non-vtg.) | 17,500 | 850,832 | |
| T-Mobile U.S., Inc. (a) | 44,700 | 6,674,157 | |
| 7,524,989 | |||
TOTAL COMMUNICATION SERVICES | 1,003,267,182 | ||
| CONSUMER DISCRETIONARY - 29.3% | |||
| Auto Components - 0.1% | |||
| Aptiv PLC (a) | 58,500 | 6,615,765 | |
| Autoliv, Inc. | 4,700 | 432,964 | |
| Mobileye Global, Inc. (d) | 64,700 | 2,497,420 | |
| 9,546,149 | |||
| Automobiles - 3.0% | |||
| Neutron Holdings, Inc. (a)(b)(c) | 691,699 | 16,601 | |
| Rad Power Bikes, Inc. (a)(b)(c) | 110,210 | 443,044 | |
| Rivian Automotive, Inc. (a) | 540,995 | 10,495,303 | |
| Tesla, Inc. (a) | 1,342,705 | 232,583,360 | |
| 243,538,308 | |||
| Diversified Consumer Services - 0.0% | |||
| New Oriental Education & Technology Group, Inc. sponsored ADR (a) | 58,500 | 2,494,440 | |
| Hotels, Restaurants & Leisure - 3.4% | |||
| Airbnb, Inc. Class A (a) | 727,700 | 80,854,747 | |
| Caesars Entertainment, Inc. (a) | 861,847 | 44,867,755 | |
| Chipotle Mexican Grill, Inc. (a) | 2,742 | 4,514,374 | |
| Draftkings Holdings, Inc. (a) | 118,500 | 1,776,315 | |
| Flutter Entertainment PLC (a) | 23,100 | 3,574,094 | |
| Hilton Worldwide Holdings, Inc. | 161,900 | 23,490,071 | |
| Marriott International, Inc. Class A | 262,700 | 45,757,086 | |
| Penn Entertainment, Inc. (a) | 1,318,644 | 46,745,930 | |
| Restaurant Brands International, Inc. | 62,300 | 4,168,629 | |
| Sweetgreen, Inc. Class A (a) | 1,164,526 | 12,076,135 | |
| Trip.com Group Ltd. ADR (a) | 176,600 | 6,491,816 | |
| Yum China Holdings, Inc. | 91,400 | 5,631,154 | |
| Yum! Brands, Inc. | 20,700 | 2,701,557 | |
| 282,649,663 | |||
| Internet & Direct Marketing Retail - 11.3% | |||
| Alibaba Group Holding Ltd. sponsored ADR (a) | 316,200 | 34,845,240 | |
| Amazon.com, Inc. (a) | 5,956,400 | 614,283,532 | |
| Deliveroo PLC Class A (a)(e) | 400,600 | 459,111 | |
| FSN E-Commerce Ventures Private Ltd. | 4,910,760 | 8,265,130 | |
| JD.com, Inc. sponsored ADR | 373,500 | 22,234,455 | |
| Lyft, Inc. (a) | 3,413,608 | 55,471,130 | |
| Pinduoduo, Inc. ADR (a) | 203,200 | 19,909,536 | |
| Uber Technologies, Inc. (a) | 5,294,975 | 163,773,577 | |
| Wayfair LLC Class A (a) | 219,920 | 13,305,160 | |
| 932,546,871 | |||
| Multiline Retail - 1.1% | |||
| Dollar Tree, Inc. (a) | 494,600 | 74,279,028 | |
| Ollie's Bargain Outlet Holdings, Inc. (a) | 135,500 | 7,419,980 | |
| Target Corp. | 34,800 | 5,990,472 | |
| 87,689,480 | |||
| Specialty Retail - 4.9% | |||
| American Eagle Outfitters, Inc. | 2,393,286 | 38,627,636 | |
| Bath & Body Works, Inc. | 106,700 | 4,909,267 | |
| Burlington Stores, Inc. (a) | 18,393 | 4,227,263 | |
| Fanatics, Inc. Class A (a)(b)(c) | 159,285 | 13,152,162 | |
| Fast Retailing Co. Ltd. | 1,400 | 850,303 | |
| Five Below, Inc. (a) | 244,784 | 48,254,270 | |
| Foot Locker, Inc. | 146,900 | 6,391,619 | |
| Lowe's Companies, Inc. | 741,606 | 154,439,450 | |
| RH (a)(d) | 148,604 | 46,362,962 | |
| TJX Companies, Inc. | 629,200 | 51,506,312 | |
| Victoria's Secret & Co. (a) | 564,427 | 23,790,598 | |
| Warby Parker, Inc. (a) | 928,979 | 15,003,011 | |
| 407,514,853 | |||
| Textiles, Apparel & Luxury Goods - 5.5% | |||
| Capri Holdings Ltd. (a) | 755,900 | 50,259,791 | |
| Compagnie Financiere Richemont SA Series A | 35,740 | 5,509,583 | |
| Crocs, Inc. (a) | 408,684 | 49,765,451 | |
| Deckers Outdoor Corp. (a) | 90,216 | 38,565,536 | |
| Hermes International SCA | 4,601 | 8,575,890 | |
| lululemon athletica, Inc. (a) | 563,474 | 172,918,901 | |
| LVMH Moet Hennessy Louis Vuitton SE | 30,361 | 26,504,408 | |
| NIKE, Inc. Class B | 707,813 | 90,125,829 | |
| On Holding AG (a) | 319,500 | 7,412,400 | |
| Tory Burch LLC (a)(b)(c)(f) | 106,817 | 3,322,009 | |
| 452,959,798 | |||
TOTAL CONSUMER DISCRETIONARY | 2,418,939,562 | ||
| CONSUMER STAPLES - 1.2% | |||
| Beverages - 1.1% | |||
| Boston Beer Co., Inc. Class A (a) | 26,100 | 10,142,721 | |
| Celsius Holdings, Inc. (a)(d) | 771,000 | 77,346,720 | |
| Constellation Brands, Inc. Class A (sub. vtg.) | 14,200 | 3,287,584 | |
| 90,777,025 | |||
| Food & Staples Retailing - 0.0% | |||
| Costco Wholesale Corp. | 1,300 | 664,482 | |
| Food Products - 0.0% | |||
| Sovos Brands, Inc. (a) | 10,900 | 147,804 | |
| The Real Good Food Co., Inc. (a) | 5,400 | 30,024 | |
| 177,828 | |||
| Household Products - 0.1% | |||
| Procter & Gamble Co. | 23,800 | 3,388,644 | |
| Personal Products - 0.0% | |||
| Estee Lauder Companies, Inc. Class A | 3,600 | 997,488 | |
| Tobacco - 0.0% | |||
| JUUL Labs, Inc. Class B (a)(b)(c) | 2,450 | 29,670 | |
TOTAL CONSUMER STAPLES | 96,035,137 | ||
| ENERGY - 4.4% | |||
| Energy Equipment & Services - 0.1% | |||
| Halliburton Co. | 203,600 | 8,392,392 | |
| Oil, Gas & Consumable Fuels - 4.3% | |||
| Antero Resources Corp. (a) | 421,300 | 12,150,292 | |
| Cenovus Energy, Inc. (Canada) | 381,300 | 7,617,116 | |
| Cheniere Energy, Inc. | 58,300 | 8,907,657 | |
| Denbury, Inc. (a) | 140,800 | 12,218,624 | |
| Devon Energy Corp. | 384,300 | 24,303,132 | |
| Diamondback Energy, Inc. | 275,600 | 40,270,672 | |
| EOG Resources, Inc. | 357,500 | 47,279,375 | |
| EQT Corp. | 53,700 | 1,754,379 | |
| Exxon Mobil Corp. | 266,300 | 30,893,463 | |
| Hess Corp. | 424,800 | 63,787,968 | |
| Marathon Oil Corp. | 452,500 | 12,430,175 | |
| Northern Oil & Gas, Inc. | 78,800 | 2,641,376 | |
| Occidental Petroleum Corp. | 389,600 | 25,242,184 | |
| Ovintiv, Inc. | 41,600 | 2,047,968 | |
| Pioneer Natural Resources Co. | 152,000 | 35,013,200 | |
| Reliance Industries Ltd. | 911,649 | 26,354,604 | |
| Reliance Industries Ltd. sponsored GDR (e) | 24,800 | 1,421,040 | |
| 354,333,225 | |||
TOTAL ENERGY | 362,725,617 | ||
| FINANCIALS - 1.0% | |||
| Banks - 0.3% | |||
| Kotak Mahindra Bank Ltd. | 118,376 | 2,518,616 | |
| Wells Fargo & Co. | 486,300 | 22,792,881 | |
| 25,311,497 | |||
| Consumer Finance - 0.6% | |||
| American Express Co. | 290,500 | 50,817,165 | |
| Diversified Financial Services - 0.1% | |||
| Ant International Co. Ltd. Class C (a)(b)(c) | 1,568,556 | 2,478,318 | |
| Berkshire Hathaway, Inc. Class B (a) | 5,300 | 1,651,056 | |
| 4,129,374 | |||
TOTAL FINANCIALS | 80,258,036 | ||
| HEALTH CARE - 9.4% | |||
| Biotechnology - 1.4% | |||
| Alnylam Pharmaceuticals, Inc. (a) | 137,081 | 31,035,138 | |
| Arcutis Biotherapeutics, Inc. (a) | 125,300 | 2,076,221 | |
| Argenx SE ADR (a) | 11,437 | 4,371,793 | |
| Ascendis Pharma A/S sponsored ADR (a) | 145,496 | 18,053,144 | |
| CytomX Therapeutics, Inc. (a)(e) | 137,854 | 372,206 | |
| Generation Bio Co. (a) | 163,122 | 962,420 | |
| Karuna Therapeutics, Inc. (a) | 40,000 | 7,975,600 | |
| Moderna, Inc. (a) | 3,700 | 651,422 | |
| Prometheus Biosciences, Inc. (a) | 7,100 | 806,986 | |
| Regeneron Pharmaceuticals, Inc. (a) | 37,100 | 28,139,237 | |
| Vertex Pharmaceuticals, Inc. (a) | 61,400 | 19,838,340 | |
| Verve Therapeutics, Inc. (a) | 53,200 | 1,210,300 | |
| 115,492,807 | |||
| Health Care Equipment & Supplies - 1.5% | |||
| Axonics Modulation Technologies, Inc. (a) | 118,620 | 7,283,268 | |
| Blink Health LLC Series A1 (a)(b)(c) | 6,283 | 271,426 | |
| Boston Scientific Corp. (a) | 443,600 | 20,516,500 | |
| DexCom, Inc. (a) | 476,360 | 51,013,392 | |
| Insulet Corp. (a) | 92,698 | 26,633,989 | |
| Shockwave Medical, Inc. (a) | 68,033 | 12,785,442 | |
| TransMedics Group, Inc. (a) | 17,800 | 1,121,756 | |
| 119,625,773 | |||
| Health Care Providers & Services - 2.8% | |||
| agilon health, Inc. (a) | 47,000 | 1,022,720 | |
| Alignment Healthcare, Inc. (a) | 145,747 | 1,799,975 | |
| Cigna Corp. | 25,400 | 8,043,418 | |
| Elevance Health, Inc. | 6,100 | 3,049,939 | |
| Guardant Health, Inc. (a) | 341,409 | 10,730,485 | |
| Humana, Inc. | 62,300 | 31,878,910 | |
| LifeStance Health Group, Inc. (a) | 37,400 | 197,472 | |
| Surgery Partners, Inc. (a) | 54,700 | 1,816,040 | |
| UnitedHealth Group, Inc. | 341,400 | 170,423,466 | |
| Universal Health Services, Inc. Class B | 15,100 | 2,237,971 | |
| 231,200,396 | |||
| Health Care Technology - 0.0% | |||
| Certara, Inc. (a) | 50,700 | 983,580 | |
| MultiPlan Corp. warrants (a)(b) | 24,206 | 99 | |
| 983,679 | |||
| Life Sciences Tools & Services - 0.8% | |||
| Danaher Corp. | 130,900 | 34,607,342 | |
| ICON PLC (a) | 22,200 | 5,121,762 | |
| Olink Holding AB ADR (a) | 72,800 | 1,425,424 | |
| Seer, Inc. (a) | 39,619 | 180,266 | |
| Thermo Fisher Scientific, Inc. | 43,100 | 24,581,223 | |
| 65,916,017 | |||
| Pharmaceuticals - 2.9% | |||
| AstraZeneca PLC sponsored ADR | 60,500 | 3,954,885 | |
| Eli Lilly & Co. | 375,879 | 129,358,758 | |
| Novo Nordisk A/S: | |||
| Series B | 28,700 | 3,971,789 | |
| Series B sponsored ADR | 241,500 | 33,515,370 | |
| Roche Holding AG (participation certificate) | 10,650 | 3,324,615 | |
| Zoetis, Inc. Class A | 416,779 | 68,972,757 | |
| 243,098,174 | |||
TOTAL HEALTH CARE | 776,316,846 | ||
| INDUSTRIALS - 1.9% | |||
| Aerospace & Defense - 1.0% | |||
| Airbus Group NV | 24,100 | 3,021,318 | |
| Howmet Aerospace, Inc. | 236,900 | 9,639,461 | |
| L3Harris Technologies, Inc. | 26,700 | 5,735,694 | |
| Lockheed Martin Corp. | 15,600 | 7,226,856 | |
| Northrop Grumman Corp. | 11,600 | 5,197,264 | |
| Space Exploration Technologies Corp.: | |||
| Class A (a)(b)(c) | 227,030 | 17,481,310 | |
| Class C (a)(b)(c) | 6,860 | 528,220 | |
| The Boeing Co. (a) | 166,600 | 35,485,800 | |
| 84,315,923 | |||
| Air Freight & Logistics - 0.0% | |||
| Delhivery Private Ltd. | 294,700 | 1,092,023 | |
| ZTO Express, Inc. sponsored ADR | 83,700 | 2,386,287 | |
| 3,478,310 | |||
| Airlines - 0.2% | |||
| Delta Air Lines, Inc. (a) | 100,000 | 3,910,000 | |
| United Airlines Holdings, Inc. (a) | 161,300 | 7,897,248 | |
| 11,807,248 | |||
| Commercial Services & Supplies - 0.1% | |||
| ACV Auctions, Inc. Class A (a) | 461,400 | 4,521,720 | |
| Electrical Equipment - 0.3% | |||
| Acuity Brands, Inc. | 130,300 | 24,564,156 | |
| Array Technologies, Inc. (a) | 82,800 | 1,840,644 | |
| Regal Rexnord Corp. | 5,900 | 821,280 | |
| 27,226,080 | |||
| Machinery - 0.2% | |||
| Deere & Co. | 29,400 | 12,431,496 | |
| Professional Services - 0.0% | |||
| Experian PLC | 41,200 | 1,506,664 | |
| Road & Rail - 0.1% | |||
| Avis Budget Group, Inc. (a) | 26,600 | 5,321,064 | |
| Bird Global, Inc.: | |||
| Class A (a)(d) | 2,367,933 | 555,517 | |
| Stage 1 rights (a)(c) | 13,740 | 0 | |
| Stage 2 rights (a)(c) | 13,740 | 0 | |
| Stage 3 rights (a)(c) | 13,740 | 0 | |
| Hertz Global Holdings, Inc. (a) | 100,600 | 1,812,812 | |
| 7,689,393 | |||
TOTAL INDUSTRIALS | 152,976,834 | ||
| INFORMATION TECHNOLOGY - 37.8% | |||
| IT Services - 2.8% | |||
| Adyen BV (a)(e) | 1,100 | 1,663,098 | |
| Block, Inc. Class A (a) | 205,800 | 16,817,976 | |
| Cloudflare, Inc. (a) | 17,200 | 910,052 | |
| MasterCard, Inc. Class A | 339,600 | 125,855,760 | |
| MongoDB, Inc. Class A (a) | 43,080 | 9,228,167 | |
| Okta, Inc. (a) | 278,900 | 20,529,829 | |
| PayPal Holdings, Inc. (a) | 159,200 | 12,973,208 | |
| Shopify, Inc. Class A (a) | 18,400 | 906,759 | |
| Snowflake, Inc. (a) | 33,000 | 5,162,520 | |
| Twilio, Inc. Class A (a) | 192,456 | 11,516,567 | |
| Visa, Inc. Class A | 118,500 | 27,279,885 | |
| 232,843,821 | |||
| Semiconductors & Semiconductor Equipment - 14.5% | |||
| Advanced Micro Devices, Inc. (a) | 821,619 | 61,744,668 | |
| ASML Holding NV | 18,600 | 12,291,624 | |
| Cirrus Logic, Inc. (a) | 100,400 | 9,075,156 | |
| Enphase Energy, Inc. (a) | 42,100 | 9,320,098 | |
| GlobalFoundries, Inc. (a) | 948,360 | 56,218,781 | |
| Lam Research Corp. | 32,000 | 16,003,200 | |
| Marvell Technology, Inc. | 4,980,695 | 214,916,989 | |
| Microchip Technology, Inc. | 41,700 | 3,236,754 | |
| Monolithic Power Systems, Inc. | 46,700 | 19,920,352 | |
| NVIDIA Corp. | 2,580,396 | 504,131,967 | |
| NXP Semiconductors NV | 800,335 | 147,509,744 | |
| onsemi (a) | 844,900 | 62,057,905 | |
| SolarEdge Technologies, Inc. (a)(d) | 21,700 | 6,925,121 | |
| Taiwan Semiconductor Manufacturing Co. Ltd. sponsored ADR | 397,300 | 36,841,629 | |
| Teradyne, Inc. | 333,200 | 33,886,440 | |
| Wolfspeed, Inc. (a) | 3,400 | 261,834 | |
| 1,194,342,262 | |||
| Software - 10.9% | |||
| Atom Tickets LLC (a)(b)(c)(f) | 344,068 | 3 | |
| Bill.Com Holdings, Inc. (a) | 111,200 | 12,856,944 | |
| Confluent, Inc. (a) | 54,800 | 1,265,880 | |
| Datadog, Inc. Class A (a) | 125,700 | 9,403,617 | |
| HubSpot, Inc. (a) | 93,592 | 32,477,360 | |
| Intuit, Inc. | 80,600 | 34,067,202 | |
| Microsoft Corp. | 2,752,100 | 681,997,901 | |
| Paycom Software, Inc. (a) | 41,000 | 13,281,540 | |
| Salesforce.com, Inc. (a) | 437,070 | 73,414,648 | |
| ServiceNow, Inc. (a) | 39,923 | 18,170,155 | |
| Splunk, Inc. (a) | 102,800 | 9,845,156 | |
| Stripe, Inc. Class B (a)(b)(c) | 19,900 | 534,713 | |
| Tanium, Inc. Class B (a)(b)(c) | 151,000 | 1,099,280 | |
| Zoom Video Communications, Inc. Class A (a) | 137,700 | 10,327,500 | |
| 898,741,899 | |||
| Technology Hardware, Storage & Peripherals - 9.6% | |||
| Apple, Inc. | 5,486,036 | 791,580,134 | |
TOTAL INFORMATION TECHNOLOGY | 3,117,508,116 | ||
| MATERIALS - 0.7% | |||
| Chemicals - 0.1% | |||
| Cibus Corp.: | |||
| Series C (a)(b)(c)(f) | 726,554 | 1,453,108 | |
| Series D (a)(b)(c)(f) | 398,640 | 797,280 | |
| Series E (a)(b)(c)(f) | 251,468 | 502,936 | |
| Series F (a)(b)(c)(f) | 130,959 | 261,918 | |
| Linde PLC | 12,900 | 4,269,126 | |
| 7,284,368 | |||
| Metals & Mining - 0.6% | |||
| Freeport-McMoRan, Inc. | 1,092,200 | 48,733,964 | |
TOTAL MATERIALS | 56,018,332 | ||
| REAL ESTATE - 0.0% | |||
| Equity Real Estate Investment Trusts (REITs) - 0.0% | |||
| Welltower, Inc. | 11,600 | 870,464 | |
| Real Estate Management & Development - 0.0% | |||
| WeWork, Inc. (a)(d) | 2,010,085 | 3,196,035 | |
TOTAL REAL ESTATE | 4,066,499 | ||
| UTILITIES - 0.0% | |||
| Electric Utilities - 0.0% | |||
| NextEra Energy, Inc. | 22,800 | 1,701,564 | |
| TOTAL COMMON STOCKS (Cost $5,861,671,205) | 8,069,813,725 | ||
| Preferred Stocks - 1.3% | |||
| Shares | Value ($) | ||
| Convertible Preferred Stocks - 1.2% | |||
| COMMUNICATION SERVICES - 0.1% | |||
| Interactive Media & Services - 0.1% | |||
| ByteDance Ltd. Series E1 (a)(b)(c) | 37,119 | 7,346,592 | |
| Reddit, Inc.: | |||
| Series B(a)(b)(c) | 129,280 | 4,854,464 | |
| Series E(a)(b)(c) | 5,005 | 187,938 | |
| 12,388,994 | |||
| CONSUMER DISCRETIONARY - 0.1% | |||
| Automobiles - 0.0% | |||
| Rad Power Bikes, Inc.: | |||
| Series A(a)(b)(c) | 14,368 | 57,759 | |
| Series C(a)(b)(c) | 56,537 | 227,279 | |
| 285,038 | |||
| Hotels, Restaurants & Leisure - 0.1% | |||
| MOD Super Fast Pizza Holdings LLC: | |||
| Series 3(a)(b)(c)(f) | 22,518 | 6,260,460 | |
| Series 4(a)(b)(c)(f) | 2,055 | 547,185 | |
| Series 5(a)(b)(c)(f) | 8,253 | 2,063,910 | |
| 8,871,555 | |||
| Internet & Direct Marketing Retail - 0.0% | |||
| Instacart, Inc.: | |||
| Series H(a)(b)(c) | 31,105 | 1,371,731 | |
| Series I(a)(b)(c) | 13,960 | 615,636 | |
| 1,987,367 | |||
TOTAL CONSUMER DISCRETIONARY | 11,143,960 | ||
| CONSUMER STAPLES - 0.2% | |||
| Food & Staples Retailing - 0.1% | |||
| GoBrands, Inc. Series G (a)(b)(c) | 19,600 | 3,085,824 | |
| Food Products - 0.0% | |||
| AgBiome LLC Series C (a)(b)(c) | 266,499 | 1,740,238 | |
| Tobacco - 0.1% | |||
| JUUL Labs, Inc.: | |||
| Series C(a)(b)(c) | 660,029 | 7,992,951 | |
| Series D(a)(b)(c) | 5,110 | 61,882 | |
| 8,054,833 | |||
TOTAL CONSUMER STAPLES | 12,880,895 | ||
| HEALTH CARE - 0.0% | |||
| Biotechnology - 0.0% | |||
| Castle Creek Biosciences, Inc. Series D2 (b)(c) | 642 | 130,801 | |
| Health Care Equipment & Supplies - 0.0% | |||
| Blink Health LLC Series C (a)(b)(c) | 27,197 | 1,174,910 | |
| Pharmaceuticals - 0.0% | |||
| Castle Creek Pharmaceutical Holdings, Inc. Series B (a)(b)(c) | 1,069 | 236,805 | |
TOTAL HEALTH CARE | 1,542,516 | ||
| INDUSTRIALS - 0.6% | |||
| Aerospace & Defense - 0.6% | |||
| Space Exploration Technologies Corp.: | |||
| Series G(a)(b)(c) | 42,650 | 32,840,500 | |
| Series H(a)(b)(c) | 6,348 | 4,887,960 | |
| Series N(a)(b)(c) | 12,799 | 9,855,230 | |
| 47,583,690 | |||
| Construction & Engineering - 0.0% | |||
| Beta Technologies, Inc. Series A (a)(b)(c) | 12,033 | 915,952 | |
TOTAL INDUSTRIALS | 48,499,642 | ||
| INFORMATION TECHNOLOGY - 0.1% | |||
| Electronic Equipment & Components - 0.0% | |||
| Enevate Corp. Series E (a)(b)(c) | 1,441,706 | 792,938 | |
| IT Services - 0.0% | |||
| AppNexus, Inc. Series E (Escrow) (a)(b)(c) | 307,049 | 9,617 | |
| Semiconductors & Semiconductor Equipment - 0.0% | |||
| Xsight Labs Ltd. Series D (a)(b)(c) | 140,500 | 1,080,445 | |
| Software - 0.1% | |||
| Bolt Technology OU Series E (a)(b)(c) | 18,160 | 2,499,221 | |
| Databricks, Inc. Series G (a)(b)(c) | 51,900 | 2,553,999 | |
| Dataminr, Inc. Series D (a)(b)(c) | 115,901 | 1,788,352 | |
| Delphix Corp. Series D (a)(b)(c) | 242,876 | 1,248,383 | |
| Stripe, Inc. Series H (a)(b)(c) | 8,700 | 233,769 | |
| 8,323,724 | |||
TOTAL INFORMATION TECHNOLOGY | 10,206,724 | ||
| MATERIALS - 0.1% | |||
| Metals & Mining - 0.1% | |||
| Diamond Foundry, Inc. Series C (a)(b)(c) | 125,000 | 4,433,750 | |
| TOTAL CONVERTIBLE PREFERRED STOCKS | 101,096,481 | ||
| Nonconvertible Preferred Stocks - 0.1% | |||
| CONSUMER DISCRETIONARY - 0.0% | |||
| Automobiles - 0.0% | |||
| Neutron Holdings, Inc. Series 1C (a)(b)(c) | 12,405,800 | 297,739 | |
| Waymo LLC Series A2 (a)(b)(c) | 15,200 | 735,832 | |
| 1,033,571 | |||
| HEALTH CARE - 0.1% | |||
| Pharmaceuticals - 0.1% | |||
| Castle Creek Pharmaceutical Holdings, Inc. Series A4 (a)(b)(c) | 9,636 | 2,085,327 | |
| TOTAL NONCONVERTIBLE PREFERRED STOCKS | 3,118,898 | ||
| TOTAL PREFERRED STOCKS (Cost $55,706,004) | 104,215,379 | ||
| Convertible Bonds - 0.0% | |||
Principal Amount (g) | Value ($) | ||
| CONSUMER DISCRETIONARY - 0.0% | |||
| Automobiles - 0.0% | |||
| Neutron Holdings, Inc.: | |||
| 4% 5/22/27 (b)(c) | 433,800 | 418,053 | |
| 4% 6/12/27 (b)(c) | 115,200 | 111,018 | |
| (Cost $549,000) | 529,071 | ||
| U.S. Treasury Obligations - 0.4% | |||
Principal Amount (g) | Value ($) | ||
U.S. Treasury Bills, yield at date of purchase 4.27% 3/2/23 (h) (Cost $29,658,773) | 29,760,000 | 29,654,098 | |
| Money Market Funds - 2.9% | |||
| Shares | Value ($) | ||
| Fidelity Cash Central Fund 4.38% (i) | 186,607,154 | 186,644,475 | |
| Fidelity Securities Lending Cash Central Fund 4.38% (i)(j) | 56,616,177 | 56,621,838 | |
| TOTAL MONEY MARKET FUNDS (Cost $243,266,313) | 243,266,313 | ||
| TOTAL INVESTMENT IN SECURITIES - 102.5% (Cost $6,190,851,295) | 8,447,478,586 |
NET OTHER ASSETS (LIABILITIES) - (2.5)% | (202,985,902) |
| NET ASSETS - 100.0% | 8,244,492,684 |
| (a) | Non-income producing |
| (b) | Restricted securities (including private placements) - Investment in securities not registered under the Securities Act of 1933 (excluding 144A issues). At the end of the period, the value of restricted securities (excluding 144A issues) amounted to $148,026,703 or 1.8% of net assets. |
| (c) | Level 3 security |
| (d) | Security or a portion of the security is on loan at period end. |
| (e) | Security exempt from registration under Rule 144A of the Securities Act of 1933. These securities may be resold in transactions exempt from registration, normally to qualified institutional buyers. At the end of the period, the value of these securities amounted to $3,915,455 or 0.0% of net assets. |
| (f) | Investment is owned by a wholly-owned subsidiary (Subsidiary) that is treated as a corporation for U.S. tax purposes. |
| (g) | Amount is stated in United States dollars unless otherwise noted. |
| (h) | Security or a portion of the security was pledged to cover margin requirements for futures contracts. At period end, the value of securities pledged amounted to $8,321,283. |
| (i) | Affiliated fund that is generally available only to investment companies and other accounts managed by Fidelity Investments. The rate quoted is the annualized seven-day yield of the fund at period end. A complete unaudited listing of the fund's holdings as of its most recent quarter end is available upon request. In addition, each Fidelity Central Fund's financial statements are available on the SEC's website or upon request. |
| (j) | Investment made with cash collateral received from securities on loan. |
| Additional information on each restricted holding is as follows: | ||
| Security | Acquisition Date | Acquisition Cost ($) |
| AgBiome LLC Series C | 6/29/18 | 1,687,925 |
| Ant International Co. Ltd. Class C | 5/16/18 | 5,978,358 |
| AppNexus, Inc. Series E (Escrow) | 8/01/14 | 0 |
| Atom Tickets LLC | 8/15/17 | 1,999,998 |
| Beta Technologies, Inc. Series A | 4/09/21 | 881,658 |
| Blink Health LLC Series A1 | 12/30/20 | 170,206 |
| Blink Health LLC Series C | 11/07/19 - 1/21/21 | 1,038,273 |
| Bolt Technology OU Series E | 1/03/22 | 4,717,904 |
| ByteDance Ltd. Series E1 | 11/18/20 | 4,067,284 |
| Castle Creek Biosciences, Inc. Series D2 | 6/28/21 | 110,200 |
| Castle Creek Pharmaceutical Holdings, Inc. Series A4 | 9/29/16 | 3,185,523 |
| Castle Creek Pharmaceutical Holdings, Inc. Series B | 10/09/18 | 440,268 |
| Cibus Corp. Series C | 2/16/18 | 1,525,763 |
| Cibus Corp. Series D | 5/10/19 | 498,300 |
| Cibus Corp. Series E | 6/23/21 | 442,584 |
| Cibus Corp. Series F | 12/02/22 | 261,918 |
| Databricks, Inc. Series G | 2/01/21 | 3,068,465 |
| Dataminr, Inc. Series D | 3/06/15 | 1,477,738 |
| Delphix Corp. Series D | 7/10/15 | 2,185,884 |
| Diamond Foundry, Inc. Series C | 3/15/21 | 3,000,000 |
| Enevate Corp. Series E | 1/29/21 | 1,598,398 |
| Epic Games, Inc. | 7/30/20 | 618,700 |
| Fanatics, Inc. Class A | 8/13/20 | 2,754,038 |
| GoBrands, Inc. Series G | 3/02/21 | 4,894,459 |
| Instacart, Inc. Series H | 11/13/20 | 1,866,300 |
| Instacart, Inc. Series I | 2/26/21 | 1,745,000 |
| JUUL Labs, Inc. Class B | 11/21/17 | 0 |
| JUUL Labs, Inc. Series C | 5/22/15 - 7/06/18 | 0 |
| JUUL Labs, Inc. Series D | 6/25/18 - 7/06/18 | 0 |
| MOD Super Fast Pizza Holdings LLC Series 3 | 11/03/16 | 3,084,966 |
| MOD Super Fast Pizza Holdings LLC Series 4 | 12/14/17 | 287,556 |
| MOD Super Fast Pizza Holdings LLC Series 5 | 5/15/19 | 1,176,218 |
| MultiPlan Corp. warrants | 10/08/20 | 0 |
| Neutron Holdings, Inc. | 2/04/21 | 6,918 |
| Neutron Holdings, Inc. Series 1C | 7/03/18 | 2,268,276 |
| Neutron Holdings, Inc. 4% 5/22/27 | 6/04/20 | 433,800 |
| Neutron Holdings, Inc. 4% 6/12/27 | 6/12/20 | 115,200 |
| Rad Power Bikes, Inc. | 1/21/21 | 531,635 |
| Rad Power Bikes, Inc. Series A | 1/21/21 | 69,309 |
| Rad Power Bikes, Inc. Series C | 1/21/21 | 272,725 |
| Reddit, Inc. Series B | 7/26/17 | 1,835,324 |
| Reddit, Inc. Series E | 5/18/21 | 212,583 |
| Space Exploration Technologies Corp. Class A | 4/06/17 - 9/11/17 | 2,534,625 |
| Space Exploration Technologies Corp. Class C | 9/11/17 | 92,610 |
| Space Exploration Technologies Corp. Series G | 1/20/15 | 3,303,669 |
| Space Exploration Technologies Corp. Series H | 8/04/17 | 856,980 |
| Space Exploration Technologies Corp. Series N | 8/04/20 | 3,455,730 |
| Stripe, Inc. Class B | 5/18/21 | 798,555 |
| Stripe, Inc. Series H | 3/15/21 | 349,088 |
| Tanium, Inc. Class B | 4/21/17 | 749,609 |
| Tory Burch LLC | 5/14/15 | 7,600,030 |
| Waymo LLC Series A2 | 5/08/20 | 1,305,181 |
| Xsight Labs Ltd. Series D | 2/16/21 | 1,123,438 |
| Affiliate | Value, beginning of period ($) | Purchases ($) | Sales Proceeds ($) | Dividend Income ($) | Realized Gain (loss) ($) | Change in Unrealized appreciation (depreciation) ($) | Value, end of period ($) | % ownership, end of period |
| Fidelity Cash Central Fund 4.38% | 371,709,138 | 1,730,482,738 | 1,915,547,401 | 3,734,274 | - | - | 186,644,475 | 0.4% |
| Fidelity Securities Lending Cash Central Fund 4.38% | 80,554,541 | 410,727,550 | 434,660,253 | 197,047 | - | - | 56,621,838 | 0.2% |
| Total | 452,263,679 | 2,141,210,288 | 2,350,207,654 | 3,931,321 | - | - | 243,266,313 | |
| Valuation Inputs at Reporting Date: | ||||
| Description | Total ($) | Level 1 ($) | Level 2 ($) | Level 3 ($) |
Investments in Securities: | ||||
| Equities: | ||||
Communication Services | 1,015,656,176 | 991,542,198 | 10,814,828 | 13,299,150 |
Consumer Discretionary | 2,431,117,093 | 2,360,876,322 | 41,129,424 | 29,111,347 |
Consumer Staples | 108,916,032 | 96,005,467 | - | 12,910,565 |
Energy | 362,725,617 | 336,371,013 | 26,354,604 | - |
Financials | 80,258,036 | 75,261,102 | 2,518,616 | 2,478,318 |
Health Care | 779,944,689 | 768,748,917 | 7,296,503 | 3,899,269 |
Industrials | 201,476,476 | 129,347,299 | 5,620,005 | 66,509,172 |
Information Technology | 3,127,714,840 | 3,114,211,022 | 1,663,098 | 11,840,720 |
Materials | 60,452,082 | 53,003,090 | - | 7,448,992 |
Real Estate | 4,066,499 | 4,066,499 | - | - |
Utilities | 1,701,564 | 1,701,564 | - | - |
| Corporate Bonds | 529,071 | - | - | 529,071 |
| U.S. Government and Government Agency Obligations | 29,654,098 | - | 29,654,098 | - |
| Money Market Funds | 243,266,313 | 243,266,313 | - | - |
| Total Investments in Securities: | 8,447,478,586 | 8,174,400,806 | 125,051,176 | 148,026,604 |
| Net Unrealized Depreciation on Unfunded Commitments | (264,823) | - | - | (264,823) |
| Total | (264,823) | - | - | (264,823) |
| Investments in Securities: | |||
| Beginning Balance | $ | 148,073,446 | |
| Net Realized Gain (Loss) on Investment Securities | (392,091) | ||
| Net Unrealized Gain (Loss) on Investment Securities | 3,720,440 | ||
| Cost of Purchases | 263,530 | ||
| Proceeds of Sales | (3,638,721) | ||
| Amortization/Accretion | - | ||
| Transfers into Level 3 | - | ||
| Transfers out of Level 3 | - | ||
| Ending Balance | $ | 148,026,604 | |
| The change in unrealized gain (loss) for the period attributable to Level 3 securities held at January 31, 2023 | $ | 6,620,367 | |
| The information used in the above reconciliation represents fiscal year to date activity for any Investments in Securities identified as using Level 3 inputs at either the beginning or the end of the current fiscal period. Cost of purchases and proceeds of sales may include securities received and/or delivered through in-kind transactions. Transfers into Level 3 were attributable to a lack of observable market data resulting from decreases in market activity, decreases in liquidity, security restructurings or corporate actions. Transfers out of Level 3 were attributable to observable market data becoming available for those securities. Transfers in or out of Level 3 represent the beginning value of any Security or Instrument where a change in the pricing level occurred from the beginning to the end of the period. The cost of purchases and the proceeds of sales may include securities received or delivered through corporate actions or exchanges. Realized and unrealized gains (losses) disclosed in the reconciliation are included in Net Gain (Loss) on the Fund's Statement of Operations. | |||
| Statement of Assets and Liabilities | ||||
January 31, 2023 (Unaudited) | ||||
| Assets | ||||
| Investment in securities, at value (including securities loaned of $55,264,457) - See accompanying schedule: | ||||
Unaffiliated issuers (cost $5,947,584,982) | $ | 8,204,212,273 | ||
Fidelity Central Funds (cost $243,266,313) | 243,266,313 | |||
| Total Investment in Securities (cost $6,190,851,295) | $ | 8,447,478,586 | ||
| Cash | 179,620 | |||
| Foreign currency held at value (cost $382,623) | 382,611 | |||
| Receivable for investments sold | 218,006,531 | |||
| Receivable for fund shares sold | 98,455 | |||
| Dividends receivable | 1,915,917 | |||
| Interest receivable | 58,418 | |||
| Distributions receivable from Fidelity Central Funds | 950,131 | |||
| Receivable for daily variation margin on futures contracts | 970,894 | |||
| Other receivables | 3,669 | |||
Total assets | 8,670,044,832 | |||
| Liabilities | ||||
| Payable for investments purchased | $ | 4,779,628 | ||
| Unrealized depreciation on unfunded commitments | 264,823 | |||
| Payable for fund shares redeemed | 361,551,229 | |||
| Other payables and accrued expenses | 2,346,069 | |||
| Collateral on securities loaned | 56,610,399 | |||
| Total Liabilities | 425,552,148 | |||
| Net Assets | $ | 8,244,492,684 | ||
| Net Assets consist of: | ||||
| Paid in capital | $ | 6,376,016,174 | ||
| Total accumulated earnings (loss) | 1,868,476,510 | |||
| Net Assets | $ | 8,244,492,684 | ||
Net Asset Value , offering price and redemption price per share ($8,244,492,684 ÷ 734,762,364 shares) | $ | 11.22 | ||
| Statement of Operations | ||||
Six months ended January 31, 2023 (Unaudited) | ||||
| Investment Income | ||||
| Dividends | $ | 23,029,289 | ||
| Interest | 292,027 | |||
| Income from Fidelity Central Funds (including $197,047 from security lending) | 3,931,321 | |||
| Total Income | 27,252,637 | |||
| Expenses | ||||
| Custodian fees and expenses | $ | 58,663 | ||
| Independent trustees' fees and expenses | 12,378 | |||
| Total expenses before reductions | 71,041 | |||
| Expense reductions | (1,172) | |||
| Total expenses after reductions | 69,869 | |||
| Net Investment income (loss) | 27,182,768 | |||
| Realized and Unrealized Gain (Loss) | ||||
| Net realized gain (loss) on: | ||||
| Investment Securities: | ||||
| Unaffiliated issuers (net of foreign taxes of $1,003) | (151,947,030) | |||
| Foreign currency transactions | 352,531 | |||
| Futures contracts | 4,492,981 | |||
| Total net realized gain (loss) | (147,101,518) | |||
| Change in net unrealized appreciation (depreciation) on: | ||||
| Investment Securities: | ||||
| Unaffiliated issuers (net of decrease in deferred foreign taxes of $749,152) | 10,491,565 | |||
| Unfunded commitments | 51,147 | |||
| Assets and liabilities in foreign currencies | (333,667) | |||
| Futures contracts | (4,839,166) | |||
| Total change in net unrealized appreciation (depreciation) | 5,369,879 | |||
| Net gain (loss) | (141,731,639) | |||
| Net increase (decrease) in net assets resulting from operations | $ | (114,548,871) | ||
| Statement of Changes in Net Assets | ||||
Six months ended January 31, 2023 (Unaudited) | Year ended July 31, 2022 | |||
| Increase (Decrease) in Net Assets | ||||
| Operations | ||||
| Net investment income (loss) | $ | 27,182,768 | $ | 27,984,322 |
| Net realized gain (loss) | (147,101,518) | 229,153,951 | ||
| Change in net unrealized appreciation (depreciation) | 5,369,879 | (1,572,176,010) | ||
| Net increase (decrease) in net assets resulting from operations | (114,548,871) | (1,315,037,737) | ||
| Distributions to shareholders | (244,959,359) | (1,312,935,433) | ||
| Share transactions | ||||
| Proceeds from sales of shares | 2,194,561,793 | 3,773,203,170 | ||
| Reinvestment of distributions | 244,959,359 | 1,312,935,433 | ||
| Cost of shares redeemed | (960,455,783) | (1,613,105,018) | ||
Net increase (decrease) in net assets resulting from share transactions | 1,479,065,369 | 3,473,033,585 | ||
| Total increase (decrease) in net assets | 1,119,557,139 | 845,060,415 | ||
| Net Assets | ||||
| Beginning of period | 7,124,935,545 | 6,279,875,130 | ||
| End of period | $ | 8,244,492,684 | $ | 7,124,935,545 |
| Other Information | ||||
| Shares | ||||
| Sold | 207,412,669 | 297,595,283 | ||
| Issued in reinvestment of distributions | 21,469,993 | 78,714,050 | ||
| Redeemed | (88,678,636) | (106,486,525) | ||
| Net increase (decrease) | 140,204,026 | 269,822,808 | ||
| Fidelity® Series Blue Chip Growth Fund |
Six months ended (Unaudited) January 31, 2023 | Years ended July 31, 2022 | 2021 | 2020 | 2019 | 2018 | |||||||
Selected Per-Share Data | ||||||||||||
| Net asset value, beginning of period | $ | 11.98 | $ | 19.34 | $ | 19.25 | $ | 15.57 | $ | 15.90 | $ | 14.07 |
| Income from Investment Operations | ||||||||||||
Net investment income (loss) A,B | .04 | .07 | .06 | .09 | .10 | .12 C | ||||||
| Net realized and unrealized gain (loss) | (.41) | (3.37) | 6.76 | 5.30 | 1.58 | 3.28 | ||||||
| Total from investment operations | (.37) | (3.30) | 6.82 | 5.39 | 1.68 | 3.40 | ||||||
| Distributions from net investment income | (.06) | (.05) | (.10) | (.11) | (.12) | (.07) | ||||||
| Distributions from net realized gain | (.33) | (4.00) | (6.63) | (1.60) | (1.89) | (1.50) | ||||||
| Total distributions | (.39) | (4.06) D | (6.73) | (1.71) | (2.01) | (1.57) | ||||||
| Net asset value, end of period | $ | 11.22 | $ | 11.98 | $ | 19.34 | $ | 19.25 | $ | 15.57 | $ | 15.90 |
Total Return E,F | (3.12)% | (22.51)% | 46.98% | 39.00% | 11.85% | 26.54% | ||||||
Ratios to Average Net Assets B,G,H | ||||||||||||
| Expenses before reductions | -% I,J | -% J | -% J | -% J | -% J | -% J | ||||||
| Expenses net of fee waivers, if any | -% I,J | -% J | -% J | -% J | -% J | -% J | ||||||
| Expenses net of all reductions | -% I,J | -% J | -% J | -% J | -% J | -% J | ||||||
| Net investment income (loss) | .75% I | .45% | .31% | .59% | .71% | .81% C | ||||||
| Supplemental Data | ||||||||||||
| Net assets, end of period (000 omitted) | $ | 8,244,493 | $ | 7,124,936 | $ | 6,279,875 | $ | 5,789,434 | $ | 5,846,965 | $ | 6,005,980 |
Portfolio turnover rate K | 25% I | 48% | 53% | 52% L | 53% | 41% |
| Fidelity Central Fund | Investment Manager | Investment Objective | Investment Practices | Expense Ratio A |
| Fidelity Money Market Central Funds | Fidelity Management & Research Company LLC (FMR) | Each fund seeks to obtain a high level of current income consistent with the preservation of capital and liquidity. | Short-term Investments | Less than .005% |
| Asset Type | Fair Value | Valuation Technique(s) | Unobservable Input | Amount or Range/Weighted Average | Impact to Valuation from an Increase in Input A |
| Equities | $147,497,533 | Market comparable | Enterprise value/EBITDA multiple (EV/EBITDA) | 6.0 - 8.8 / 6.5 | Increase |
| Enterprise value/Revenue multiple (EV/R) | 2.0 - 25.0 / 7.4 | Increase | |||
| Enterprise value/Gross profit multiple (EV/GP) | 7.5 | Increase | |||
| Probability rate | 25.0% - 75.0% / 50.0% | Increase | |||
| Enterprise value/Revenue multiple (EV/R) | 2.1 | Increase | |||
| Liquidity preference | $250.08 - $278.02 / $264.79 | Increase | |||
| Recovery value | Recovery value | $0.00 - $0.03 / $0.00 | Increase | ||
| Market approach | Transaction price | $1.11 - $215.03 / $119.41 | Increase | ||
| Discount rate | 5.0% - 50.0% / 18.7% | Decrease | |||
| Book value | Book value multiple | 1.5 | Increase | ||
| Discounted cash flow | Weighted average cost of capital (WACC) | 34.0% - 36.3% / 35.5% | Decrease | ||
| Exit multiple | 1.8 - 5.0 / 3.8 | Increase | |||
| Black scholes | Discount rate | 3.5% - 3.9% / 3.8% | Increase | ||
| Probability rate | 50.0% | Increase | |||
| Volatility | 65.0% - 100.0% / 81.9% | Increase | |||
| Term | 3.0 - 5.0 / 3.6 | Increase | |||
| Corporate Bonds | $529,071 | Market comparable | Enterprise value/Revenue multiple (EV/R) | 3.0 | Increase |
| Gross unrealized appreciation | $2,684,359,226 |
| Gross unrealized depreciation | (475,179,281) |
| Net unrealized appreciation (depreciation) | $2,209,179,945 |
| Tax cost | $6,238,033,818 |
| Investment to be Acquired | Commitment Amount | Unrealized Appreciation (Depreciation) | |
| Fidelity Series Blue Chip Growth Fund | Stripe, Inc. | $264,823 | $(264,823) |
| $ Amount | % of Net Assets | |
| Fidelity Series Blue Chip Growth Fund | 15,208,809 | .18 |
| Equity Risk | Equity risk relates to the fluctuations in the value of financial instruments as a result of changes in market prices (other than those arising from interest rate risk or foreign exchange risk), whether caused by factors specific to an individual investment, its issuer, or all factors affecting all instruments traded in a market or market segment. |
| Purchases ($) | Sales ($) | |
| Fidelity Series Blue Chip Growth Fund | 2,199,600,802 | 900,306,723 |
| Amount | |
| Fidelity Series Blue Chip Growth Fund | $30,993 |
| Purchases ($) | Sales ($) | Realized Gain (Loss) ($) | |
| Fidelity Series Blue Chip Growth Fund | 306,861,534 | 22,150,601 | (4,290,260) |
| Amount ($) | |
| Fidelity Series Blue Chip Growth Fund | 18,708 |
| Total Security Lending Fees Paid to NFS | Security Lending Income From Securities Loaned to NFS | Value of Securities Loaned to NFS at Period End | |
| Fidelity Series Blue Chip Growth Fund | $20,517 | $3,091 | $30,498 |
| The Example is based on an investment of $1,000 invested at the beginning of the period and held for the entire period (August 1, 2022 to January 31, 2023). |
Annualized Expense Ratio- A | Beginning Account Value August 1, 2022 | Ending Account Value January 31, 2023 | Expenses Paid During Period- C August 1, 2022 to January 31, 2023 | |||||||
| Fidelity® Series Blue Chip Growth Fund | -%- D | |||||||||
| Actual | $ 1,000 | $ 968.80 | $- E | |||||||
Hypothetical- B | $ 1,000 | $ 1,025.21 | $- E | |||||||
- Highly liquid investments - cash or convertible to cash within three business days or less
- Moderately liquid investments - convertible to cash in three to seven calendar days
- Less liquid investments - can be sold or disposed of, but not settled, within seven calendar days
- Illiquid investments - cannot be sold or disposed of within seven calendar days
|


Contents
Top Holdings (% of Fund's net assets) | ||
| Crocs, Inc. | 1.4 | |
| Performance Food Group Co. | 1.3 | |
| iShares Russell 2000 Growth Index ETF | 1.2 | |
| Applied Industrial Technologies, Inc. | 1.2 | |
| Haemonetics Corp. | 1.1 | |
| Sprout Social, Inc. | 1.1 | |
| Avid Technology, Inc. | 1.0 | |
| Cabot Corp. | 1.0 | |
| Insulet Corp. | 1.0 | |
| U.S. Foods Holding Corp. | 0.9 | |
| 11.2 | ||
| Market Sectors (% of Fund's net assets) | ||
| Health Care | 21.6 | |
| Industrials | 21.1 | |
| Information Technology | 19.8 | |
| Consumer Discretionary | 13.7 | |
| Energy | 5.6 | |
| Materials | 4.6 | |
| Consumer Staples | 4.5 | |
| Financials | 3.4 | |
| Communication Services | 3.0 | |
| Utilities | 0.6 | |
| Real Estate | 0.0 | |
Asset Allocation (% of Fund's net assets) |
 |
Foreign investments - 9% |
| Common Stocks - 96.6% | |||
| Shares | Value ($) | ||
| COMMUNICATION SERVICES - 2.9% | |||
| Diversified Telecommunication Services - 0.3% | |||
| IDT Corp. Class B (a) | 91,850 | 2,699,472 | |
| Iridium Communications, Inc. | 17,200 | 1,029,248 | |
| 3,728,720 | |||
| Entertainment - 0.3% | |||
| World Wrestling Entertainment, Inc. Class A (b) | 54,627 | 4,622,537 | |
| Interactive Media & Services - 0.9% | |||
| Bumble, Inc. (a) | 170,629 | 4,393,697 | |
| Cars.com, Inc. (a) | 484,427 | 8,283,702 | |
| 12,677,399 | |||
| Media - 0.9% | |||
| Integral Ad Science Holding Corp. (a) | 274,657 | 2,823,474 | |
| TechTarget, Inc. (a) | 215,216 | 10,659,648 | |
| 13,483,122 | |||
| Wireless Telecommunication Services - 0.5% | |||
| Gogo, Inc. (a) | 463,440 | 7,771,889 | |
TOTAL COMMUNICATION SERVICES | 42,283,667 | ||
| CONSUMER DISCRETIONARY - 13.7% | |||
| Auto Components - 0.9% | |||
| Autoliv, Inc. | 74,978 | 6,906,973 | |
| Gentherm, Inc. (a) | 82,428 | 6,135,116 | |
| 13,042,089 | |||
| Diversified Consumer Services - 1.8% | |||
| Duolingo, Inc. (a)(b) | 51,245 | 4,893,385 | |
| Grand Canyon Education, Inc. (a) | 95,557 | 11,138,124 | |
| H&R Block, Inc. | 168,713 | 6,576,433 | |
| Rover Group, Inc. Class A (a) | 1,028,976 | 4,208,512 | |
| 26,816,454 | |||
| Hotels, Restaurants & Leisure - 3.7% | |||
| ARAMARK Holdings Corp. | 82,500 | 3,673,725 | |
| Brinker International, Inc. (a) | 252,226 | 9,952,838 | |
| Churchill Downs, Inc. | 24,309 | 6,031,063 | |
| Dutch Bros, Inc. (a)(b) | 125,430 | 4,780,137 | |
| Everi Holdings, Inc. (a) | 179,004 | 3,109,299 | |
| Kura Sushi U.S.A., Inc. Class A (a)(b) | 56,129 | 3,487,856 | |
| Lindblad Expeditions Holdings (a)(b) | 1,054,875 | 12,553,013 | |
| SeaWorld Entertainment, Inc. (a) | 188,617 | 11,767,815 | |
| 55,355,746 | |||
| Household Durables - 1.3% | |||
| Helen of Troy Ltd. (a) | 73,964 | 8,366,068 | |
| LGI Homes, Inc. (a) | 55,813 | 6,354,310 | |
| Lovesac (a)(b) | 157,295 | 4,048,773 | |
| 18,769,151 | |||
| Internet & Direct Marketing Retail - 0.1% | |||
| BARK, Inc. warrants 8/29/25 (a) | 139,532 | 31,492 | |
| thredUP, Inc. (a)(b) | 710,659 | 1,229,440 | |
| 1,260,932 | |||
| Leisure Products - 0.6% | |||
| YETI Holdings, Inc. (a) | 211,515 | 9,467,411 | |
| Specialty Retail - 3.4% | |||
| Aritzia, Inc. (a) | 161,163 | 5,812,793 | |
| Boot Barn Holdings, Inc. (a) | 39,100 | 3,264,459 | |
| Dick's Sporting Goods, Inc. | 86,605 | 11,324,470 | |
| Fanatics, Inc. Class A (a)(c)(d) | 163,048 | 13,462,873 | |
| Floor & Decor Holdings, Inc. Class A (a) | 108,559 | 9,853,900 | |
| Lithia Motors, Inc. Class A (sub. vtg.) | 23,467 | 6,176,514 | |
| 49,895,009 | |||
| Textiles, Apparel & Luxury Goods - 1.9% | |||
| Crocs, Inc. (a) | 177,183 | 21,575,580 | |
| Kontoor Brands, Inc. | 142,969 | 6,828,199 | |
| 28,403,779 | |||
TOTAL CONSUMER DISCRETIONARY | 203,010,571 | ||
| CONSUMER STAPLES - 4.5% | |||
| Beverages - 0.6% | |||
| Boston Beer Co., Inc. Class A (a) | 21,242 | 8,254,854 | |
| Food & Staples Retailing - 3.6% | |||
| BJ's Wholesale Club Holdings, Inc. (a) | 56,267 | 4,077,669 | |
| Casey's General Stores, Inc. | 23,713 | 5,594,134 | |
| Performance Food Group Co. (a) | 311,800 | 19,119,576 | |
| Sprouts Farmers Market LLC (a) | 312,354 | 9,979,710 | |
| U.S. Foods Holding Corp. (a) | 372,330 | 14,196,943 | |
| 52,968,032 | |||
| Food Products - 0.1% | |||
| Freshpet, Inc. (a)(b) | 27,149 | 1,719,346 | |
| Nomad Foods Ltd. (a) | 18,600 | 330,894 | |
| The Real Good Food Co. LLC: | |||
| Class B (d) | 45,833 | 0 | |
| Class B unit (e) | 45,833 | 254,831 | |
| 2,305,071 | |||
| Personal Products - 0.2% | |||
| BellRing Brands, Inc. (a) | 37,585 | 1,065,911 | |
| The Beauty Health Co. (a)(b) | 208,144 | 2,372,842 | |
| 3,438,753 | |||
TOTAL CONSUMER STAPLES | 66,966,710 | ||
| ENERGY - 5.6% | |||
| Energy Equipment & Services - 2.0% | |||
| Championx Corp. | 147,961 | 4,885,672 | |
| Liberty Oilfield Services, Inc. Class A | 424,200 | 6,715,086 | |
| Nextier Oilfield Solutions, Inc. (a) | 667,159 | 6,284,638 | |
| TechnipFMC PLC (a) | 854,290 | 11,866,088 | |
| 29,751,484 | |||
| Oil, Gas & Consumable Fuels - 3.6% | |||
| Antero Resources Corp. (a) | 241,333 | 6,960,044 | |
| Civitas Resources, Inc. | 62,562 | 4,163,501 | |
| Denbury, Inc. (a) | 146,122 | 12,680,467 | |
| Enviva, Inc. (b) | 51,406 | 2,337,945 | |
| Genesis Energy LP | 705,325 | 7,963,119 | |
| HF Sinclair Corp. | 6,923 | 393,919 | |
| Northern Oil & Gas, Inc. | 302,346 | 10,134,638 | |
| PDC Energy, Inc. | 41,129 | 2,785,667 | |
| Range Resources Corp. | 248,538 | 6,218,421 | |
| 53,637,721 | |||
TOTAL ENERGY | 83,389,205 | ||
| FINANCIALS - 3.4% | |||
| Banks - 0.9% | |||
| First Interstate Bancsystem, Inc. | 74,507 | 2,673,311 | |
| Glacier Bancorp, Inc. | 69,155 | 3,152,776 | |
| PacWest Bancorp | 92,531 | 2,559,407 | |
| Pinnacle Financial Partners, Inc. | 46,880 | 3,690,862 | |
| Starling Bank Ltd. Series D (a)(c)(d) | 431,700 | 1,798,908 | |
| 13,875,264 | |||
| Capital Markets - 1.1% | |||
| Impax Asset Management Group PLC | 1,095 | 10,476 | |
| Lazard Ltd. Class A | 138,963 | 5,569,637 | |
| Perella Weinberg Partners (a)(c) | 457,262 | 4,686,936 | |
| StepStone Group, Inc. Class A | 204,792 | 5,977,878 | |
| 16,244,927 | |||
| Consumer Finance - 0.3% | |||
| OneMain Holdings, Inc. | 91,700 | 3,955,938 | |
| Insurance - 0.8% | |||
| Assurant, Inc. | 16,346 | 2,167,316 | |
| BRP Group, Inc. (a) | 313,816 | 8,990,828 | |
| 11,158,144 | |||
| Thrifts & Mortgage Finance - 0.3% | |||
| Walker & Dunlop, Inc. | 54,648 | 5,212,326 | |
TOTAL FINANCIALS | 50,446,599 | ||
| HEALTH CARE - 21.3% | |||
| Biotechnology - 7.1% | |||
| Absci Corp. (a) | 207,829 | 652,583 | |
| ALX Oncology Holdings, Inc. (a)(b) | 218,649 | 2,033,436 | |
| Arcellx, Inc. | 87,710 | 2,930,391 | |
| Argenx SE ADR (a) | 14,369 | 5,492,550 | |
| Ascendis Pharma A/S sponsored ADR (a) | 57,957 | 7,191,305 | |
| Blueprint Medicines Corp. (a) | 114,485 | 5,351,029 | |
| Celldex Therapeutics, Inc. (a) | 116,684 | 5,141,097 | |
| Cyteir Therapeutics, Inc. (a) | 194,315 | 297,302 | |
| Cytokinetics, Inc. (a) | 220,702 | 9,375,421 | |
| Day One Biopharmaceuticals, Inc. (a) | 197,856 | 4,307,325 | |
| Exelixis, Inc. (a) | 191,386 | 3,372,221 | |
| Halozyme Therapeutics, Inc. (a) | 111,330 | 5,763,554 | |
| Immunocore Holdings PLC ADR (a) | 88,811 | 5,441,450 | |
| Instil Bio, Inc. (a) | 121,411 | 98,816 | |
| Janux Therapeutics, Inc. (a) | 118,925 | 2,641,324 | |
| Keros Therapeutics, Inc. (a) | 74,756 | 4,378,459 | |
| Monte Rosa Therapeutics, Inc. (a) | 169,610 | 1,255,114 | |
| Morphic Holding, Inc. (a) | 92,080 | 3,013,778 | |
| Nuvalent, Inc. Class A (a) | 141,083 | 4,267,761 | |
| PepGen, Inc. | 48,200 | 752,884 | |
| Prelude Therapeutics, Inc. (a) | 186,178 | 1,187,816 | |
| PTC Therapeutics, Inc. (a) | 127,584 | 5,854,830 | |
| Relay Therapeutics, Inc. (a)(b) | 124,304 | 2,667,564 | |
| Tango Therapeutics, Inc. (a) | 389,164 | 2,568,482 | |
| Tenaya Therapeutics, Inc. (a) | 223,702 | 765,061 | |
| Tyra Biosciences, Inc. (a) | 189,820 | 2,015,888 | |
| Vaxcyte, Inc. (a) | 143,849 | 6,523,552 | |
| Vericel Corp. (a) | 108,658 | 2,984,835 | |
| Verve Therapeutics, Inc. (a)(b) | 154,962 | 3,525,386 | |
| Xenon Pharmaceuticals, Inc. (a) | 84,569 | 3,305,802 | |
| 105,157,016 | |||
| Health Care Equipment & Supplies - 5.2% | |||
| Envista Holdings Corp. (a) | 106,506 | 4,152,669 | |
| Figs, Inc. Class A (a)(b) | 559,334 | 5,006,039 | |
| Globus Medical, Inc. (a)(b) | 61,770 | 4,663,635 | |
| Haemonetics Corp. (a) | 194,511 | 16,455,631 | |
| Inspire Medical Systems, Inc. (a) | 42,982 | 10,877,025 | |
| Insulet Corp. (a) | 49,743 | 14,292,159 | |
| Neogen Corp. (a) | 153,400 | 3,284,294 | |
| NeuroPace, Inc. (a)(b) | 302,891 | 1,414,501 | |
| Nevro Corp. (a) | 72,452 | 2,660,437 | |
| PROCEPT BioRobotics Corp. (a) | 130,489 | 5,074,717 | |
| TransMedics Group, Inc. (a) | 158,034 | 9,959,303 | |
| 77,840,410 | |||
| Health Care Providers & Services - 4.7% | |||
| 1Life Healthcare, Inc. (a) | 177,261 | 2,834,403 | |
| Acadia Healthcare Co., Inc. (a) | 146,128 | 12,277,675 | |
| AdaptHealth Corp. (a) | 122,962 | 2,635,076 | |
| agilon health, Inc. (a) | 505,948 | 11,009,428 | |
| Molina Healthcare, Inc. (a) | 43,086 | 13,435,507 | |
| Option Care Health, Inc. (a) | 311,763 | 9,000,598 | |
| Owens & Minor, Inc. | 144,173 | 2,845,975 | |
| R1 Rcm, Inc. (a) | 545,619 | 7,807,808 | |
| Surgery Partners, Inc. (a) | 240,961 | 7,999,905 | |
| 69,846,375 | |||
| Health Care Technology - 1.6% | |||
| Doximity, Inc. (a) | 67,166 | 2,368,945 | |
| Evolent Health, Inc. (a)(b) | 294,920 | 9,502,322 | |
| Phreesia, Inc. (a) | 278,492 | 10,440,665 | |
| Schrodinger, Inc. (a) | 63,719 | 1,540,725 | |
| 23,852,657 | |||
| Life Sciences Tools & Services - 0.5% | |||
| Olink Holding AB ADR (a)(b) | 177,535 | 3,476,135 | |
| Sotera Health Co. (a) | 84,400 | 1,455,056 | |
| Veterinary Emergency Group LLC Class A (a)(c)(d)(f) | 38,574 | 2,191,389 | |
| 7,122,580 | |||
| Pharmaceuticals - 2.2% | |||
| Arvinas Holding Co. LLC (a) | 115,612 | 3,788,605 | |
| Axsome Therapeutics, Inc. (a)(b) | 54,973 | 4,122,975 | |
| DICE Therapeutics, Inc. (a) | 109,254 | 3,471,000 | |
| Edgewise Therapeutics, Inc. (a) | 390,843 | 3,998,324 | |
| Enliven Therapeutics, Inc. (g) | 535,193 | 2,225,332 | |
| Ikena Oncology, Inc. (a) | 182,155 | 775,980 | |
| Intra-Cellular Therapies, Inc. (a) | 135,908 | 6,512,711 | |
| Pharvaris BV (a) | 149,616 | 1,346,544 | |
| Terns Pharmaceuticals, Inc. (a)(b) | 658,033 | 5,968,359 | |
| 32,209,830 | |||
TOTAL HEALTH CARE | 316,028,868 | ||
| INDUSTRIALS - 20.7% | |||
| Aerospace & Defense - 1.7% | |||
| BWX Technologies, Inc. | 109,830 | 6,684,254 | |
| Curtiss-Wright Corp. | 58,918 | 9,768,604 | |
| Dassault Aviation SA | 20,448 | 3,483,448 | |
| V2X, Inc. (a) | 114,732 | 5,066,565 | |
| 25,002,871 | |||
| Air Freight & Logistics - 0.6% | |||
| Air Transport Services Group, Inc. (a) | 194,318 | 5,501,143 | |
| Hub Group, Inc. Class A (a) | 39,009 | 3,326,297 | |
| 8,827,440 | |||
| Building Products - 1.8% | |||
| Builders FirstSource, Inc. (a) | 88,851 | 7,081,425 | |
| Carlisle Companies, Inc. | 14,031 | 3,519,817 | |
| The AZEK Co., Inc. (a)(b) | 229,288 | 5,532,719 | |
| UFP Industries, Inc. | 112,329 | 10,508,378 | |
| 26,642,339 | |||
| Commercial Services & Supplies - 0.9% | |||
| ACV Auctions, Inc. Class A (a) | 222,481 | 2,180,314 | |
| Driven Brands Holdings, Inc. (a) | 245,843 | 7,176,157 | |
| Montrose Environmental Group, Inc. (a) | 66,700 | 3,612,472 | |
| 12,968,943 | |||
| Construction & Engineering - 1.9% | |||
| Bowman Consulting Group Ltd. (a) | 34,985 | 891,768 | |
| EMCOR Group, Inc. | 45,885 | 6,802,451 | |
| Valmont Industries, Inc. | 26,363 | 8,692,672 | |
| Willscot Mobile Mini Holdings (a) | 256,061 | 12,408,716 | |
| 28,795,607 | |||
| Electrical Equipment - 3.7% | |||
| Acuity Brands, Inc. | 27,518 | 5,187,693 | |
| Array Technologies, Inc. (a)(b) | 422,944 | 9,402,045 | |
| Atkore, Inc. (a) | 86,660 | 11,287,465 | |
| nVent Electric PLC | 184,915 | 7,350,371 | |
| Regal Rexnord Corp. | 96,366 | 13,414,147 | |
| Sensata Technologies, Inc. PLC | 73,200 | 3,722,220 | |
| Sunrun, Inc. (a)(b) | 157,406 | 4,136,630 | |
| 54,500,571 | |||
| Machinery - 3.8% | |||
| Chart Industries, Inc. (a) | 42,233 | 5,658,377 | |
| Crane Holdings Co. | 90,791 | 10,523,585 | |
| EnPro Industries, Inc. | 39,262 | 4,753,450 | |
| Federal Signal Corp. | 214,702 | 11,432,882 | |
| ITT, Inc. | 63,124 | 5,781,527 | |
| Mueller Industries, Inc. | 123,694 | 8,108,142 | |
| Terex Corp. | 192,887 | 9,831,450 | |
| 56,089,413 | |||
| Marine - 0.4% | |||
| Kirby Corp. (a) | 85,588 | 6,057,919 | |
| Professional Services - 3.7% | |||
| ASGN, Inc. (a) | 94,044 | 8,553,302 | |
| CACI International, Inc. Class A (a) | 38,267 | 11,789,680 | |
| FTI Consulting, Inc. (a) | 42,379 | 6,760,298 | |
| ICF International, Inc. | 43,314 | 4,426,258 | |
| Insperity, Inc. | 65,199 | 7,207,749 | |
| KBR, Inc. | 234,806 | 12,029,111 | |
| NV5 Global, Inc. (a) | 29,351 | 3,912,195 | |
| 54,678,593 | |||
| Road & Rail - 0.4% | |||
| U-Haul Holding Co. (b) | 47,437 | 3,179,702 | |
| U-Haul Holding Co. (non-vtg.) | 54,963 | 3,396,164 | |
| 6,575,866 | |||
| Trading Companies & Distributors - 1.8% | |||
| Applied Industrial Technologies, Inc. | 123,283 | 17,655,358 | |
| Custom Truck One Source, Inc. Class A (a)(b) | 455,180 | 3,222,674 | |
| Hudson Technologies, Inc. (a) | 235,235 | 2,401,749 | |
| WESCO International, Inc. (a) | 27,683 | 4,125,044 | |
| 27,404,825 | |||
TOTAL INDUSTRIALS | 307,544,387 | ||
| INFORMATION TECHNOLOGY - 19.3% | |||
| Communications Equipment - 0.7% | |||
| Harmonic, Inc. (a) | 276,807 | 3,645,548 | |
| Lumentum Holdings, Inc. (a) | 70,238 | 4,226,923 | |
| NetScout Systems, Inc. (a) | 98,422 | 3,159,346 | |
| 11,031,817 | |||
| Electronic Equipment & Components - 3.2% | |||
| Fabrinet (a) | 102,515 | 13,497,125 | |
| Flex Ltd. (a) | 229,100 | 5,349,485 | |
| Insight Enterprises, Inc. (a) | 95,339 | 10,746,612 | |
| Napco Security Technologies, Inc. (a) | 158,116 | 4,580,621 | |
| Richardson Electronics Ltd. | 111,952 | 2,502,127 | |
| TD SYNNEX Corp. | 66,169 | 6,759,163 | |
| Vontier Corp. | 174,297 | 4,014,060 | |
| 47,449,193 | |||
| IT Services - 3.1% | |||
| Concentrix Corp. | 78,236 | 11,094,647 | |
| ExlService Holdings, Inc. (a) | 81,916 | 13,974,870 | |
| Flywire Corp. (a) | 59,633 | 1,608,302 | |
| Genpact Ltd. | 128,024 | 6,052,975 | |
| Maximus, Inc. | 109,014 | 8,159,698 | |
| Wix.com Ltd. (a) | 55,824 | 4,855,572 | |
| 45,746,064 | |||
| Semiconductors & Semiconductor Equipment - 4.1% | |||
| AEHR Test Systems (a) | 168,968 | 5,907,121 | |
| Allegro MicroSystems LLC (a) | 210,815 | 8,046,809 | |
| Axcelis Technologies, Inc. (a) | 71,117 | 7,819,314 | |
| Cirrus Logic, Inc. (a) | 72,121 | 6,519,017 | |
| eMemory Technology, Inc. | 78,000 | 4,272,916 | |
| Impinj, Inc. (a)(b) | 34,891 | 4,528,154 | |
| Lattice Semiconductor Corp. (a) | 114,492 | 8,677,349 | |
| MACOM Technology Solutions Holdings, Inc. (a) | 140,860 | 9,440,437 | |
| Nova Ltd. (a) | 64,395 | 5,840,627 | |
| 61,051,744 | |||
| Software - 7.2% | |||
| Agilysys, Inc. (a) | 35,600 | 2,974,736 | |
| Algolia, Inc. (a)(c)(d) | 43,269 | 678,025 | |
| Alkami Technology, Inc. (a) | 241,380 | 3,951,391 | |
| Braze, Inc. (a) | 51,925 | 1,661,600 | |
| CCC Intelligent Solutions Holdings, Inc. (a)(c) | 10,832 | 100,142 | |
| Confluent, Inc. (a) | 76,888 | 1,776,113 | |
| Coupa Software, Inc. (a) | 164,927 | 13,180,966 | |
| Cvent Holding Corp. (a) | 813,270 | 6,563,089 | |
| CyberArk Software Ltd. (a)(b) | 44,883 | 6,323,117 | |
| DoubleVerify Holdings, Inc. (a) | 337,266 | 9,170,263 | |
| Dynatrace, Inc. (a) | 214,296 | 8,235,395 | |
| Elastic NV (a) | 76,645 | 4,509,792 | |
| Five9, Inc. (a) | 39,734 | 3,130,245 | |
| Sprout Social, Inc. (a) | 254,270 | 16,265,652 | |
| TECSYS, Inc. | 197,233 | 4,206,886 | |
| Tenable Holdings, Inc. (a) | 279,770 | 11,255,147 | |
| WalkMe Ltd. (a)(b) | 236,921 | 2,414,225 | |
| Workiva, Inc. (a)(b) | 111,213 | 9,623,261 | |
| 106,020,045 | |||
| Technology Hardware, Storage & Peripherals - 1.0% | |||
| Avid Technology, Inc. (a) | 493,630 | 14,961,925 | |
TOTAL INFORMATION TECHNOLOGY | 286,260,788 | ||
| MATERIALS - 4.6% | |||
| Chemicals - 3.3% | |||
| Avient Corp. | 116,288 | 4,711,990 | |
| Axalta Coating Systems Ltd. (a) | 101,400 | 3,052,140 | |
| Cabot Corp. | 198,394 | 14,945,020 | |
| Element Solutions, Inc. | 271,763 | 5,565,706 | |
| Olin Corp. | 50,063 | 3,233,569 | |
| The Chemours Co. LLC | 226,744 | 8,251,214 | |
| Valvoline, Inc. | 242,646 | 8,895,402 | |
| 48,655,041 | |||
| Construction Materials - 0.3% | |||
| Eagle Materials, Inc. | 32,842 | 4,797,559 | |
| Containers & Packaging - 0.8% | |||
| Ardagh Metal Packaging SA (a)(c) | 364,084 | 2,046,152 | |
| O-I Glass, Inc. (a) | 506,338 | 9,747,007 | |
| 11,793,159 | |||
| Metals & Mining - 0.2% | |||
| Lynas Rare Earths Ltd. (a) | 462,353 | 3,095,053 | |
TOTAL MATERIALS | 68,340,812 | ||
| REAL ESTATE - 0.0% | |||
| Real Estate Management & Development - 0.0% | |||
| Compass, Inc. (a) | 42 | 169 | |
| UTILITIES - 0.6% | |||
| Independent Power and Renewable Electricity Producers - 0.6% | |||
| NextEra Energy Partners LP | 63,620 | 4,663,346 | |
| Sunnova Energy International, Inc. (a)(b) | 201,083 | 3,917,097 | |
| 8,580,443 | |||
| TOTAL COMMON STOCKS (Cost $1,266,508,499) | 1,432,852,219 | ||
| Convertible Preferred Stocks - 1.3% | |||
| Shares | Value ($) | ||
| COMMUNICATION SERVICES - 0.1% | |||
| Interactive Media & Services - 0.1% | |||
| Reddit, Inc. Series F (a)(c)(d) | 46,800 | 1,757,340 | |
| HEALTH CARE - 0.3% | |||
| Biotechnology - 0.3% | |||
| Bright Peak Therapeutics AG Series B (a)(c)(d) | 199,331 | 586,033 | |
| Caris Life Sciences, Inc. Series D (a)(c)(d) | 144,435 | 808,836 | |
| LifeMine Therapeutics, Inc. Series C (c)(d) | 402,743 | 741,047 | |
| Sonoma Biotherapeutics, Inc.: | |||
| Series B (a)(c)(d) | 438,013 | 731,482 | |
| Series B1 (a)(c)(d) | 233,603 | 474,214 | |
| T-Knife Therapeutics, Inc. Series B (a)(c)(d) | 201,583 | 772,063 | |
| Treeline Biosciences Series A (a)(c)(d) | 21,246 | 178,679 | |
| 4,292,354 | |||
| Health Care Providers & Services - 0.0% | |||
| Boundless Bio, Inc. Series B (a)(c)(d) | 682,407 | 620,990 | |
| Health Care Technology - 0.0% | |||
| Wugen, Inc. Series B (a)(c)(d) | 59,982 | 313,106 | |
TOTAL HEALTH CARE | 5,226,450 | ||
| INDUSTRIALS - 0.4% | |||
| Construction & Engineering - 0.4% | |||
| Beta Technologies, Inc.: | |||
| Series A (a)(c)(d) | 62,752 | 4,776,682 | |
| Series B, 6.00% (c)(d) | 11,821 | 927,239 | |
| 5,703,921 | |||
| INFORMATION TECHNOLOGY - 0.5% | |||
| Communications Equipment - 0.1% | |||
| Astranis Space Technologies Corp. Series C (a)(c)(d) | 125,912 | 1,611,674 | |
| IT Services - 0.2% | |||
| Yanka Industries, Inc.: | |||
| Series E (a)(c)(d) | 191,029 | 2,066,934 | |
| Series F (a)(c)(d) | 28,989 | 313,661 | |
| 2,380,595 | |||
| Software - 0.2% | |||
| Algolia, Inc. Series D (a)(c)(d) | 9,900 | 155,133 | |
| Convoy, Inc. Series D (a)(c)(d) | 192,936 | 1,385,280 | |
| Mountain Digital, Inc. Series D (a)(c)(d) | 140,383 | 1,580,713 | |
| Skyryse, Inc. Series B (a)(c)(d) | 12,000 | 242,640 | |
| 3,363,766 | |||
TOTAL INFORMATION TECHNOLOGY | 7,356,035 | ||
| TOTAL CONVERTIBLE PREFERRED STOCKS (Cost $28,165,522) | 20,043,746 | ||
| Investment Companies - 1.2% | |||
| Shares | Value ($) | ||
iShares Russell 2000 Growth Index ETF (b) (Cost $16,433,626) | 76,500 | 18,050,940 | |
| Money Market Funds - 5.4% | |||
| Shares | Value ($) | ||
| Fidelity Cash Central Fund 4.38% (h) | 13,358,348 | 13,361,020 | |
| Fidelity Securities Lending Cash Central Fund 4.38% (h)(i) | 66,211,346 | 66,217,967 | |
| TOTAL MONEY MARKET FUNDS (Cost $79,578,987) | 79,578,987 | ||
| TOTAL INVESTMENT IN SECURITIES - 104.5% (Cost $1,390,686,634) | 1,550,525,892 |
NET OTHER ASSETS (LIABILITIES) - (4.5)% | (67,424,395) |
| NET ASSETS - 100.0% | 1,483,101,497 |
| ETF | - | EXCHANGE-TRADED FUND |
| (a) | Non-income producing |
| (b) | Security or a portion of the security is on loan at period end. |
| (c) | Restricted securities (including private placements) - Investment in securities not registered under the Securities Act of 1933 (excluding 144A issues). At the end of the period, the value of restricted securities (excluding 144A issues) amounted to $45,008,171 or 3.0% of net assets. |
| (d) | Level 3 security |
| (e) | Security exempt from registration under Rule 144A of the Securities Act of 1933. These securities may be resold in transactions exempt from registration, normally to qualified institutional buyers. At the end of the period, the value of these securities amounted to $254,831 or 0.0% of net assets. |
| (f) | Investment is owned by a wholly-owned subsidiary (Subsidiary) that is treated as a corporation for U.S. tax purposes. |
| (g) | Security or a portion of the security purchased on a delayed delivery or when-issued basis. |
| (h) | Affiliated fund that is generally available only to investment companies and other accounts managed by Fidelity Investments. The rate quoted is the annualized seven-day yield of the fund at period end. A complete unaudited listing of the fund's holdings as of its most recent quarter end is available upon request. In addition, each Fidelity Central Fund's financial statements are available on the SEC's website or upon request. |
| (i) | Investment made with cash collateral received from securities on loan. |
| Additional information on each restricted holding is as follows: | ||
| Security | Acquisition Date | Acquisition Cost ($) |
| Algolia, Inc. | 10/27/21 | 1,265,404 |
| Algolia, Inc. Series D | 7/23/21 | 289,526 |
| Ardagh Metal Packaging SA | 2/22/21 | 3,640,840 |
| Astranis Space Technologies Corp. Series C | 3/19/21 | 2,760,108 |
| Beta Technologies, Inc. Series A | 4/09/21 | 4,597,839 |
| Beta Technologies, Inc. Series B, 6.00% | 4/04/22 | 1,219,573 |
| Boundless Bio, Inc. Series B | 4/23/21 | 921,249 |
| Bright Peak Therapeutics AG Series B | 5/14/21 | 778,587 |
| Caris Life Sciences, Inc. Series D | 5/11/21 | 1,169,924 |
| CCC Intelligent Solutions Holdings, Inc. | 2/02/21 | 108,320 |
| Convoy, Inc. Series D | 10/30/19 | 2,612,353 |
| Fanatics, Inc. Class A | 8/13/20 - 3/22/21 | 2,891,600 |
| LifeMine Therapeutics, Inc. Series C | 2/15/22 | 820,222 |
| Mountain Digital, Inc. Series D | 11/05/21 | 3,223,938 |
| Perella Weinberg Partners | 12/29/20 | 4,572,620 |
| Reddit, Inc. Series F | 8/11/21 | 2,891,978 |
| Skyryse, Inc. Series B | 10/21/21 | 296,160 |
| Sonoma Biotherapeutics, Inc. Series B | 7/26/21 | 865,645 |
| Sonoma Biotherapeutics, Inc. Series B1 | 7/26/21 | 692,516 |
| Starling Bank Ltd. Series D | 6/18/21 - 4/05/22 | 824,189 |
| T-Knife Therapeutics, Inc. Series B | 6/30/21 | 1,162,892 |
| Treeline Biosciences Series A | 7/30/21 | 166,303 |
| Veterinary Emergency Group LLC Class A | 9/16/21 - 3/17/22 | 1,901,246 |
| Wugen, Inc. Series B | 7/09/21 | 465,154 |
| Yanka Industries, Inc. Series E | 5/15/20 | 2,307,478 |
| Yanka Industries, Inc. Series F | 4/08/21 | 924,077 |
| Affiliate | Value, beginning of period ($) | Purchases ($) | Sales Proceeds ($) | Dividend Income ($) | Realized Gain (loss) ($) | Change in Unrealized appreciation (depreciation) ($) | Value, end of period ($) | % ownership, end of period |
| Fidelity Cash Central Fund 4.38% | 71,258,038 | 256,241,637 | 314,138,655 | 489,977 | - | - | 13,361,020 | 0.0% |
| Fidelity Securities Lending Cash Central Fund 4.38% | 67,966,169 | 242,595,660 | 244,343,862 | 349,992 | - | - | 66,217,967 | 0.2% |
| Total | 139,224,207 | 498,837,297 | 558,482,517 | 839,969 | - | - | 79,578,987 | |
| Valuation Inputs at Reporting Date: | ||||
| Description | Total ($) | Level 1 ($) | Level 2 ($) | Level 3 ($) |
Investments in Securities: | ||||
| Equities: | ||||
Communication Services | 44,041,007 | 42,283,667 | - | 1,757,340 |
Consumer Discretionary | 203,010,571 | 189,547,698 | - | 13,462,873 |
Consumer Staples | 66,966,710 | 66,966,710 | - | - |
Energy | 83,389,205 | 83,389,205 | - | - |
Financials | 50,446,599 | 48,647,691 | - | 1,798,908 |
Health Care | 321,255,318 | 311,612,147 | 2,225,332 | 7,417,839 |
Industrials | 313,248,308 | 307,544,387 | - | 5,703,921 |
Information Technology | 293,616,823 | 281,309,847 | 4,272,916 | 8,034,060 |
Materials | 68,340,812 | 65,245,759 | 3,095,053 | - |
Real Estate | 169 | 169 | - | - |
Utilities | 8,580,443 | 8,580,443 | - | - |
| Investment Companies | 18,050,940 | 18,050,940 | - | - |
| Money Market Funds | 79,578,987 | 79,578,987 | - | - |
| Total Investments in Securities: | 1,550,525,892 | 1,502,757,650 | 9,593,301 | 38,174,941 |
| Investments in Securities: | |||
| Beginning Balance | $ | 41,907,756 | |
| Net Realized Gain (Loss) on Investment Securities | - | ||
| Net Unrealized Gain (Loss) on Investment Securities | (3,736,935) | ||
| Cost of Purchases | 4,120 | ||
| Proceeds of Sales | - | ||
| Amortization/Accretion | - | ||
| Transfers into Level 3 | - | ||
| Transfers out of Level 3 | - | ||
| Ending Balance | $ | 38,174,941 | |
| The change in unrealized gain (loss) for the period attributable to Level 3 securities held at January 31, 2023 | $ | (3,736,935) | |
| The information used in the above reconciliation represents fiscal year to date activity for any Investments in Securities identified as using Level 3 inputs at either the beginning or the end of the current fiscal period. Cost of purchases and proceeds of sales may include securities received and/or delivered through in-kind transactions. Transfers into Level 3 were attributable to a lack of observable market data resulting from decreases in market activity, decreases in liquidity, security restructurings or corporate actions. Transfers out of Level 3 were attributable to observable market data becoming available for those securities. Transfers in or out of Level 3 represent the beginning value of any Security or Instrument where a change in the pricing level occurred from the beginning to the end of the period. The cost of purchases and the proceeds of sales may include securities received or delivered through corporate actions or exchanges. Realized and unrealized gains (losses) disclosed in the reconciliation are included in Net Gain (Loss) on the Fund's Statement of Operations. | |||
| Statement of Assets and Liabilities | ||||
January 31, 2023 (Unaudited) | ||||
| Assets | ||||
| Investment in securities, at value (including securities loaned of $66,705,599) - See accompanying schedule: | $ | |||
Unaffiliated issuers (cost $1,311,107,647) | 1,470,946,905 | |||
Fidelity Central Funds (cost $79,578,987) | 79,578,987 | |||
| Total Investment in Securities (cost $1,390,686,634) | $ | 1,550,525,892 | ||
| Foreign currency held at value (cost $157,842) | 157,842 | |||
| Receivable for investments sold | 8,508,990 | |||
| Receivable for fund shares sold | 2,387,112 | |||
| Dividends receivable | 194,081 | |||
| Distributions receivable from Fidelity Central Funds | 113,761 | |||
Total assets | 1,561,887,678 | |||
| Liabilities | ||||
| Payable for investments purchased | ||||
Regular delivery | $9,312,700 | |||
Delayed delivery | 2,055,666 | |||
| Payable for fund shares redeemed | 501,758 | |||
| Accrued management fee | 699,499 | |||
| Collateral on securities loaned | 66,216,558 | |||
| Total Liabilities | 78,786,181 | |||
| Net Assets | $ | 1,483,101,497 | ||
| Net Assets consist of: | ||||
| Paid in capital | $ | 1,429,320,583 | ||
| Total accumulated earnings (loss) | 53,780,914 | |||
| Net Assets | $ | 1,483,101,497 | ||
Net Asset Value , offering price and redemption price per share ($1,483,101,497 ÷ 107,346,915 shares) | $ | 13.82 | ||
| Statement of Operations | ||||
Six months ended January 31, 2023 (Unaudited) | ||||
| Investment Income | ||||
| Dividends | $ | 3,399,652 | ||
| Income from Fidelity Central Funds (including $349,992 from security lending) | 839,969 | |||
| Total Income | 4,239,621 | |||
| Expenses | ||||
| Management fee | $ | 3,946,997 | ||
| Independent trustees' fees and expenses | 2,237 | |||
| Interest | 2,321 | |||
| Total expenses before reductions | 3,951,555 | |||
| Expense reductions | (644) | |||
| Total expenses after reductions | 3,950,911 | |||
| Net Investment income (loss) | 288,710 | |||
| Realized and Unrealized Gain (Loss) | ||||
| Net realized gain (loss) on: | ||||
| Investment Securities: | ||||
| Unaffiliated issuers | (47,863,370) | |||
| Foreign currency transactions | (50,199) | |||
| Total net realized gain (loss) | (47,913,569) | |||
| Change in net unrealized appreciation (depreciation) on: | ||||
| Investment Securities: | ||||
| Unaffiliated issuers | 112,403,743 | |||
| Assets and liabilities in foreign currencies | (250) | |||
| Total change in net unrealized appreciation (depreciation) | 112,403,493 | |||
| Net gain (loss) | 64,489,924 | |||
| Net increase (decrease) in net assets resulting from operations | $ | 64,778,634 | ||
| Statement of Changes in Net Assets | ||||
Six months ended January 31, 2023 (Unaudited) | Year ended July 31, 2022 | |||
| Increase (Decrease) in Net Assets | ||||
| Operations | ||||
| Net investment income (loss) | $ | 288,710 | $ | 1,038,598 |
| Net realized gain (loss) | (47,913,569) | (9,276,329) | ||
| Change in net unrealized appreciation (depreciation) | 112,403,493 | (249,246,651) | ||
| Net increase (decrease) in net assets resulting from operations | 64,778,634 | (257,484,382) | ||
| Distributions to shareholders | (610,118) | (287,761,100) | ||
| Share transactions | ||||
| Proceeds from sales of shares | 369,190,505 | 651,115,115 | ||
| Reinvestment of distributions | 609,972 | 287,761,100 | ||
| Cost of shares redeemed | (216,093,872) | (282,783,905) | ||
Net increase (decrease) in net assets resulting from share transactions | 153,706,605 | 656,092,310 | ||
| Total increase (decrease) in net assets | 217,875,121 | 110,846,828 | ||
| Net Assets | ||||
| Beginning of period | 1,265,226,376 | 1,154,379,548 | ||
| End of period | $ | 1,483,101,497 | $ | 1,265,226,376 |
| Other Information | ||||
| Shares | ||||
| Sold | 28,168,755 | 44,616,415 | ||
| Issued in reinvestment of distributions | 45,351 | 15,979,576 | ||
| Redeemed | (16,597,995) | (18,439,508) | ||
| Net increase (decrease) | 11,616,111 | 42,156,483 | ||
| Fidelity® Small Cap Growth K6 Fund |
Six months ended (Unaudited) January 31, 2023 | Years ended July 31, 2022 | 2021 | 2020 | 2019 | 2018 | |||||||
Selected Per-Share Data | ||||||||||||
| Net asset value, beginning of period | $ | 13.22 | $ | 21.55 | $ | 15.32 | $ | 13.96 | $ | 13.40 | $ | 10.42 |
| Income from Investment Operations | ||||||||||||
Net investment income (loss) A,B | - C | .01 | (.03) D | - C | (.01) | (.01) | ||||||
| Net realized and unrealized gain (loss) | .61 | (3.11) | 6.81 | 1.36 | .84 | 3.00 | ||||||
| Total from investment operations | .61 | (3.10) | 6.78 | 1.36 | .83 | 2.99 | ||||||
| Distributions from net investment income | (.01) | - | - | - | - | - C | ||||||
| Distributions from net realized gain | - | (5.23) | (.55) | - | (.27) | (.01) | ||||||
| Total distributions | (.01) | (5.23) | (.55) | - | (.27) | (.01) | ||||||
| Net asset value, end of period | $ | 13.82 | $ | 13.22 | $ | 21.55 | $ | 15.32 | $ | 13.96 | $ | 13.40 |
Total Return E,F | 4.59% | (20.31)% | 44.76% | 9.74% | 6.14% | 28.72% | ||||||
Ratios to Average Net Assets B,G,H | ||||||||||||
| Expenses before reductions | .60% I | .60% | .60% | .60% | .60% | .60% | ||||||
| Expenses net of fee waivers, if any | .60% I | .60% | .60% | .60% | .60% | .60% | ||||||
| Expenses net of all reductions | .60% I | .60% | .59% | .59% | .59% | .59% | ||||||
| Net investment income (loss) | .04% I | .09% | (.14)% D | (.02)% | (.09)% | (.06)% | ||||||
| Supplemental Data | ||||||||||||
| Net assets, end of period (000 omitted) | $ | 1,483,101 | $ | 1,265,226 | $ | 1,154,380 | $ | 899,926 | $ | 833,744 | $ | 562,817 |
Portfolio turnover rate J | 62% I,K | 81% K | 119% | 137% K | 108% K | 114% K |
| Fidelity Central Fund | Investment Manager | Investment Objective | Investment Practices | Expense Ratio A |
| Fidelity Money Market Central Funds | Fidelity Management & Research Company LLC (FMR) | Each fund seeks to obtain a high level of current income consistent with the preservation of capital and liquidity. | Short-term Investments | Less than .005% |
| Asset Type | Fair Value | Valuation Techniques | Unobservable Input | Amount or Range / Weighted Average | Impact to Valuation from an Increase in Input A |
| Equities | $ 38,174,941 | Market comparable | Enterprise value/EBITDA multiple (EV/EBITDA) | 6.0 - 6.5 / 6.25 | Increase |
| Enterprise value/Revenue multiple (EV/R) | 2.0 - 9.4 / 5.2 | Increase | |||
| Enterprise value/Net income multiple (EV/NI) | 16.8 | Increase | |||
| Recovery value | Recovery value | $0.00 | Increase | ||
| Market approach | Transaction price | $1.35 - $8.61 / $3.76 | Increase | ||
| Discount rate | 10.0% - 33.6% / 26.3% | Decrease | |||
| Black scholes | Discount rate | 3.9% | Increase | ||
| Volatility | 50.0% - 90.0% / 79.4% | Increase | |||
| Term | 3.0 | Increase |
| Gross unrealized appreciation | $268,820,315 |
| Gross unrealized depreciation | (115,468,134) |
| Net unrealized appreciation (depreciation) | $153,352,181 |
| Tax cost | $1,397,173,711 |
| $ Amount | % of Net Assets | |
| Fidelity Small Cap Growth K6 Fund | 2,191,389 | .15 |
| Purchases ($) | Sales ($) | |
| Fidelity Small Cap Growth K6 Fund | 528,142,285 | 393,750,923 |
| Shares | Total Proceeds ($) | |
| Fidelity Small Cap Growth K6 Fund | 5,311,056 | 71,358,120 |
| Shares | Total Proceeds ($) | |
| Fidelity Small Cap Growth K6 Fund | 2,375,229 | 32,229,577 |
| Amount | |
| Fidelity Small Cap Growth K6 Fund | $13,656 |
| Borrower or Lender | Average Loan Balance | Weighted Average Interest Rate | Interest Expense | |
| Fidelity Small Cap Growth K6 Fund | Borrower | $ 2,852,286 | 4.07% | $2,254 |
| Purchases ($) | Sales ($) | Realized Gain (Loss) ($) | |
| Fidelity Small Cap Growth K6 Fund | 24,837,587 | 22,254,420 | (401,887) |
| Total Security Lending Fees Paid to NFS | Security Lending Income From Securities Loaned to NFS | Value of Securities Loaned to NFS at Period End | |
| Fidelity Small Cap Growth K6 Fund | $35,808 | $199 | $4,550 |
| Average Loan Balance | Weighted Average Interest Rate | Interest Expense | |
| Fidelity Small Cap Growth K6 Fund | $554,000 | 4.33% | $67 |
| The Example is based on an investment of $1,000 invested at the beginning of the period and held for the entire period (August 1, 2022 to January 31, 2023). |
Annualized Expense Ratio- A | Beginning Account Value August 1, 2022 | Ending Account Value January 31, 2023 | Expenses Paid During Period- C August 1, 2022 to January 31, 2023 | |||||||
| Fidelity® Small Cap Growth K6 Fund | .60% | |||||||||
| Actual | $ 1,000 | $ 1,045.90 | $ 3.09 | |||||||
Hypothetical- B | $ 1,000 | $ 1,022.18 | $ 3.06 | |||||||
- Highly liquid investments - cash or convertible to cash within three business days or less
- Moderately liquid investments - convertible to cash in three to seven calendar days
- Less liquid investments - can be sold or disposed of, but not settled, within seven calendar days
- Illiquid investments - cannot be sold or disposed of within seven calendar days
|
Item 2.
Code of Ethics
Not applicable.
Item 3.
Audit Committee Financial Expert
Not applicable.
Item 4.
Principal Accountant Fees and Services
Not applicable.
Item 5.
Audit Committee of Listed Registrants
Not applicable.
Item 6.
Investments
(a)
Not applicable.
(b)
Not applicable
Item 7.
Disclosure of Proxy Voting Policies and Procedures for Closed-End Management Investment Companies
Not applicable.
Item 8.
Portfolio Managers of Closed-End Management Investment Companies
Not applicable.
Item 9.
Purchase of Equity Securities by Closed-End Management Investment Company and Affiliated Purchasers
Not applicable.
Item 10.
Submission of Matters to a Vote of Security Holders
There were no material changes to the procedures by which shareholders may recommend nominees to the Fidelity Securities Fund’s Board of Trustees.
Item 11.
Controls and Procedures
(a)(i) The President and Treasurer and the Chief Financial Officer have concluded that the Fidelity Securities Fund’s (the “Trust”) disclosure controls and procedures (as defined
in Rule 30a-3(c) under the Investment Company Act) provide reasonable assurances that material information relating to the Trust is made known to them by the appropriate persons, based on their evaluation of these controls and procedures as of a date within 90 days of the filing date of this report.
(a)(ii) There was no change in the Trust’s internal control over financial reporting (as defined in Rule 30a-3(d) under the Investment Company Act) that occurred during the period covered by this report that has materially affected, or is reasonably likely to materially affect, the Trust’s internal control over financial reporting.
Item 12.
Disclosure of Securities Lending Activities for Closed-End Management
Investment Companies
Not applicable.
Item 13.
Exhibits
(a) | (1) | Not applicable. |
(a) | (2) | |
(a) | (3) | Not applicable. |
(b) |
SIGNATURES
Pursuant to the requirements of the Securities Exchange Act of 1934 and the Investment Company Act of 1940, the registrant has duly caused this report to be signed on its behalf by the undersigned, thereunto duly authorized.
Fidelity Securities Fund
By: | /s/Stacie M. Smith |
Stacie M. Smith | |
President and Treasurer | |
Date: | March 23, 2023 |
Pursuant to the requirements of the Securities Exchange Act of 1934 and the Investment Company Act of 1940, this report has been signed below by the following persons on behalf of the registrant and in the capacities and on the dates indicated.
By: | /s/Stacie M. Smith |
Stacie M. Smith | |
President and Treasurer | |
Date: | March 23, 2023 |
By: | /s/John J. Burke III |
John J. Burke III | |
Chief Financial Officer | |
Date: | March 23, 2023 |