UNITED STATES SECURITIES AND EXCHANGE COMMISSION
WASHINGTON, D.C. 20549
FORM 10-Q
QUARTERLY REPORT PURSUANT TO SECTION 13 OR 15(d) OF
THE SECURITIES EXCHANGE ACT OF 1934
For the Quarterly Period Ended MARCH 31, 2013
Commission File No. 000-13580
SUFFOLK BANCORP
(Exact Name of Registrant as Specified in Its Charter)
| NEW YORK | | 11-2708279 |
| (State or Other Jurisdiction of Incorporation or Organization) | | (I.R.S. Employer Identification No.) |
4 WEST SECOND STREET, RIVERHEAD, NEW YORK 11901
(Address of Principal Executive Offices) (Zip Code)
(631) 208-2400
(Registrant’s Telephone Number, Including Area Code)
Indicate by check mark whether the registrant (1) has filed all reports required to be filed by Section 13 or 15(d) of the Securities Exchange Act of 1934 during the preceding 12 months (or for such shorter period that the registrant was required to file such reports), and (2) has been subject to such filing requirements for the past 90 days.
Yes x No o
Indicate by check mark whether the registrant has submitted electronically and posted on its corporate Web site, if any, every Interactive Data File required to be submitted and posted pursuant to Rule 405 of Regulation S-T (§232.405 of this chapter) during the preceding 12 months (or for such shorter period that the registrant was required to submit and post such files).
Yes x No o
Indicate by check mark whether the registrant is a large accelerated filer, an accelerated filer, a non-accelerated filer, or a smaller reporting company. See the definitions of “large accelerated filer,” “accelerated filer” and “smaller reporting company” in Rule 12b-2 of the Exchange Act.
| | Large accelerated filer o | Accelerated filer x | |
| | Non-accelerated filer o | Smaller reporting company o | |
Indicate by check mark whether the registrant is a shell company (as defined in Rule 12b-2 of the Exchange Act).
Yes o No x
As of April 25, 2013, there were 11,566,347 shares of registrant’s Common Stock outstanding.
SUFFOLK BANCORP
Form 10-Q
For the Quarterly Period Ended March 31, 2013
| | | Page |
| | PART I | |
| | | |
| Item 1. | Financial Statements | |
| | | |
| | | 2 |
| | | |
| | | 3 |
| | | |
| | | 4 |
| | | |
| | | 4 |
| | | |
| | | 5 |
| | | |
| | | 6 |
| | | |
| Item 2. | | 27 |
| | | |
| Item 3. | | 38 |
| | | |
| Item 4. | | 39 |
| | | |
| | PART II | |
| | | |
| Item 1. | | 39 |
| | | |
| Item 1A. | | 40 |
| | | |
| Item 2. | | 40 |
| | | |
| Item 3. | | 40 |
| | | |
| Item 4. | | 40 |
| | | |
| Item 5. | | 40 |
| | | |
| Item 6. | | 40 |
| | | |
| | | 41 |
PART I
ITEM 1. – FINANCIAL STATEMENTS
SUFFOLK BANCORP AND SUBSIDIARIES
CONDENSED CONSOLIDATED STATEMENTS OF CONDITION (UNAUDITED) March 31, 2013 and December 31, 2012
(dollars in thousands except per share data)
| | | | | | | |
| ASSETS | | | | | | |
| Cash and cash equivalents | | | | | | |
| Cash and non-interest bearing deposits due from banks | | $ | 35,292 | | | $ | 80,436 | |
| Interest bearing deposits due from banks | | | 267,237 | | | | 304,220 | |
| Federal funds sold | | | 1,150 | | | | 1,150 | |
| Total cash and cash equivalents | | | 303,679 | | | | 385,806 | |
| Federal Reserve Bank, Federal Home Loan Bank and other stock | | | 3,043 | | | | 3,043 | |
| Investment securities: | | | | | | | | |
| Available for sale, at fair value | | | 413,277 | | | | 402,353 | |
| Held to maturity (fair value of $8,662 and $8,861, respectively) | | | 7,871 | | | | 8,035 | |
| Total investment securities | | | 421,148 | | | | 410,388 | |
| | | | | | | | | |
| Loans | | | 824,399 | | | | 780,780 | |
| Allowance for loan losses | | | 17,834 | | | | 17,781 | |
| Net loans | | | 806,565 | | | | 762,999 | |
| | | | | | | | | |
| Loans held-for-sale | | | 2,494 | | | | 907 | |
| Premises and equipment, net | | | 27,299 | | | | 27,656 | |
| Deferred taxes | | | 11,656 | | | | 11,385 | |
| Income tax receivable | | | 5,349 | | | | 5,406 | |
| Other real estate owned ("OREO") | | | 372 | | | | 1,572 | |
| Accrued interest and loan fees receivable | | | 5,746 | | | | 4,883 | |
| Goodwill and other intangibles | | | 2,853 | | | | 2,670 | |
| Other assets | | | 3,722 | | | | 5,749 | |
| TOTAL ASSETS | | $ | 1,593,926 | | | $ | 1,622,464 | |
| | | | | | | | | |
| LIABILITIES & STOCKHOLDERS' EQUITY | | | | | | | | |
| Demand deposits | | $ | 557,712 | | | $ | 615,120 | |
| Saving, N.O.W. & money market deposits | | | 596,230 | | | | 572,263 | |
| Time certificates of $100,000 or more | | | 173,918 | | | | 165,731 | |
| Other time deposits | | | 75,898 | | | | 78,000 | |
| Total deposits | | | 1,403,758 | | | | 1,431,114 | |
| | | | | | | | | |
| Unfunded pension liability | | | 7,765 | | | | 7,781 | |
| Capital leases | | | 4,675 | | | | 4,688 | |
| Accrued interest payable | | | 235 | | | | 237 | |
| Other liabilities | | | 11,937 | | | | 14,659 | |
| TOTAL LIABILITIES | | | 1,428,370 | | | | 1,458,479 | |
| COMMITMENTS AND CONTINGENT LIABILITIES | | | | | | | | |
| STOCKHOLDERS' EQUITY | | | | | | | | |
| Common stock (par value $2.50; 15,000,000 shares authorized;13,732,085 shares issued; 11,566,347 shares outstanding at March 31, 2013 and December 31, 2012) | | | 34,330 | | | | 34,330 | |
| Surplus | | | 42,710 | | | | 42,628 | |
| Retained earnings | | | 92,264 | | | | 89,555 | |
| Treasury stock at par (2,165,738 shares at March 31, 2013 and December 31, 2012) | | | (5,414 | ) | | | (5,414 | ) |
| Accumulated other comprehensive income net of tax | | | 1,666 | | | | 2,886 | |
| TOTAL STOCKHOLDERS' EQUITY | | | 165,556 | | | | 163,985 | |
| TOTAL LIABILITIES & STOCKHOLDERS' EQUITY | | $ | 1,593,926 | | | $ | 1,622,464 | |
See accompanying notes to unaudited condensed consolidated financial statements.
SUFFOLK BANCORP AND SUBSIDIARIES
For the Three Months Ended March 31, 2013 and 2012
(dollars in thousands except per share data)
| | | Three Months Ended | |
| | | March 31, | |
| | | 2013 | | | 2012 | |
| INTEREST INCOME | | | | | | |
| Loans and Loan Fees | | $ | 11,082 | | | $ | 12,394 | |
| U.S. Government Agency Obligations | | | 333 | | | | - | |
| Obligations of States & Political Subdivisions | | | 1,500 | | | | 1,526 | |
| Collateralized Mortgage Obligations | | | 835 | | | | 1,194 | |
| Mortgage-Backed Securities | | | 365 | | | | 7 | |
| Corporate Bonds | | | 117 | | | | - | |
| Federal Funds Sold & Interest Bearing Deposits Due from Banks | | | 173 | | | | 77 | |
| Dividends | | | 39 | | | | 46 | |
| Total Interest Income | | | 14,444 | | | | 15,244 | |
| INTEREST EXPENSE | | | | | | | | |
| Saving, N.O.W. & Money Market Deposits | | | 286 | | | | 317 | |
| Time Certificates of $100,000 or More | | | 300 | | | | 439 | |
| Other Time Deposits | | | 182 | | | | 280 | |
| Total Interest Expense | | | 768 | | | | 1,036 | |
| | | | | | | | | |
| Net Interest Income | | | 13,676 | | | | 14,208 | |
| Provision for Loan Losses | | | - | | | | - | |
| Net Interest Income After Provision for Loan Losses | | | 13,676 | | | | 14,208 | |
| NON-INTEREST INCOME | | | | | | | | |
| Service Charges on Deposit Accounts | | | 924 | | | | 950 | |
| Other Service Charges, Commissions & Fees | | | 710 | | | | 750 | |
| Fiduciary Fees | | | 273 | | | | 201 | |
| Net Gain on Sale of Securities Available for Sale | | | 359 | | | | - | |
| Net Gain on Sale of Portfolio Loans | | | 442 | | | | - | |
| Net Gain on Sale of Mortgage Loans Originated for Sale | | | 526 | | | | 197 | |
| Other Operating Income | | | 83 | | | | 157 | |
| Total Non-Interest Income | | | 3,317 | | | | 2,255 | |
| OPERATING EXPENSES | | | | | | | | |
| Employee Compensation and Benefits | | | 8,582 | | | | 8,584 | |
| Occupancy Expense | | | 1,544 | | | | 1,454 | |
| Equipment Expense | | | 572 | | | | 512 | |
| Consulting and Professional Services | | | 570 | | | | 897 | |
| FDIC Assessments | | | 517 | | | | 70 | |
| Data Processing | | | 467 | | | | 369 | |
| Accounting and Audit Fees | | | 21 | | | | 584 | |
| Other Operating Expense | | | 1,528 | | | | 2,135 | |
| Total Operating Expenses | | | 13,801 | | | | 14,605 | |
| | | | | | | | | |
| Income Before Income Tax Expense | | | 3,192 | | | | 1,858 | |
| Income Tax Expense | | | 483 | | | | 690 | |
| | | | | | | | | |
| NET INCOME | | $ | 2,709 | | | $ | 1,168 | |
| | | | | | | | | |
| EARNINGS PER COMMON SHARE - BASIC | | $ | 0.23 | | | $ | 0.12 | |
| EARNINGS PER COMMON SHARE - DILUTED | | $ | 0.23 | | | $ | 0.12 | |
| WEIGHTED AVERAGE NUMBER OF COMMON SHARES - BASIC | | | 11,566,347 | | | | 9,726,814 | |
| WEIGHTED AVERAGE NUMBER OF COMMON SHARES - DILUTED | | | 11,566,347 | | | | 9,726,814 | |
See accompanying notes to unaudited condensed consolidated financial statements.
SUFFOLK BANCORP AND SUBSIDIARIES
CONDENSED CONSOLIDATED STATEMENTS OF COMPREHENSIVE INCOME (LOSS) (UNAUDITED) For the Three Months Ended March 31, 2013 and 2012
(dollars in thousands)
| | | Three Months Ended | |
| | | March 31, | |
| | | 2013 | | | 2012 | |
| Net Income | | $ | 2,709 | | | $ | 1,168 | |
| Other Comprehensive Loss, Net of Taxes and Reclassification Adjustments: | | | | | | | | |
| Decrease in Unrealized Gain on Securities Available for Sale Arising During the Period | | | (1,220 | ) | | | (1,573 | ) |
| Pension and Post-Retirement Plan Benefit Obligation | | | - | | | | (255 | ) |
| Total Other Comprehensive Loss, Net of Taxes | | | (1,220 | ) | | | (1,828 | ) |
| Total Comprehensive Income (Loss) | | $ | 1,489 | | | $ | (660 | ) |
See accompanying notes to unaudited condensed consolidated financial statements.
SUFFOLK BANCORP AND SUBSIDIARIES
CONDENSED CONSOLIDATED STATEMENTS OF STOCKHOLDERS' EQUITY (UNAUDITED) For the Three Months Ended March 31, 2013 and 2012
(in thousands except for share data)
| | | Three Months Ended | |
| | | March 31, | |
| | | 2013 | | | 2012 | |
| Common Stock | | | | | | |
| Balance, January 1 | | $ | 34,330 | | | $ | 34,330 | |
| Ending Balance | | | 34,330 | | | | 34,330 | |
| Surplus | | | | | | | | |
| Balance, January 1 | | | 42,628 | | | | 24,010 | |
| Stock-based compensation | | | 82 | | | | 27 | |
| Ending Balance | | | 42,710 | | | | 24,037 | |
| Retained Earnings | | | | | | | | |
| Balance, January 1 | | | 89,555 | | | | 91,303 | |
| Net income | | | 2,709 | | | | 1,168 | |
| Ending Balance | | | 92,264 | | | | 92,471 | |
| Treasury Stock | | | | | | | | |
| Balance, January 1 | | | (5,414 | ) | | | (10,013 | ) |
| Ending Balance | | | (5,414 | ) | | | (10,013 | ) |
| Accumulated Other Comprehensive Income (Loss), Net of Tax | | | | | | | | |
| Balance, January 1 | | | 2,886 | | | | (3,070 | ) |
| Other comprehensive loss | | | (1,220 | ) | | | (1,828 | ) |
| Ending Balance | | | 1,666 | | | | (4,898 | ) |
| Total Stockholders' Equity | | $ | 165,556 | | | $ | 135,927 | |
See accompanying notes to unaudited condensed consolidated financial statements.
SUFFOLK BANCORP AND SUBSIDIARIES
For the Three Months Ended March 31, 2013 and 2012
(in thousands)
| | | Three Months Ended | |
| | | March 31, | |
| | | 2013 | | | 2012 | |
| | | | | | | |
| NET INCOME | | $ | 2,709 | | | $ | 1,168 | |
| ADJUSTMENTS TO RECONCILE NET INCOME TO NET CASH PROVIDED BY OPERATING ACTIVITIES | | | | | | | | |
| Depreciation and Amortization | | | 684 | | | | 648 | |
| Stock-Based Compensation | | | 82 | | | | 27 | |
| Net Amortization of Premiums | | | 317 | | | | 504 | |
| Originations of Mortgage Loans for Sale | | | (20,461 | ) | | | (8,195 | ) |
| Proceeds from Sale of Mortgage Loans Originated for Sale | | | 23,073 | | | | 8,392 | |
| Gain on Sale of Mortgage Loans Originated for Sale | | | (526 | ) | | | (197 | ) |
| Gain on Sale of Portfolio Loans | | | (442 | ) | | | - | |
| (Increase) Decrease in Other Intangibles | | | (183 | ) | | | 23 | |
| Deferred Tax Expense (Benefit) | | | 425 | | | | (11 | ) |
| Decrease in Income Tax Receivable | | | 57 | | | | 700 | |
| (Increase) Decrease in Accrued Interest and Loan Fees Receivable | | | (863 | ) | | | 752 | |
| Decrease in Other Assets | | | 2,028 | | | | 206 | |
| Adjustment to Unfunded Pension Liability | | | (16 | ) | | | 791 | |
| Decrease in Accrued Interest Payable | | | (2 | ) | | | - | |
| Decrease in Other Liabilities | | | (2,722 | ) | | | (1,373 | ) |
| Gain on Sale of Securities Available for Sale - Net | | | (359 | ) | | | - | |
| Net Cash Provided by Operating Activities | | | 3,801 | | | | 3,435 | |
| | | | | | | | | |
| CASH FLOWS FROM INVESTING ACTIVITIES | | | | | | | | |
| Principal Payments on Investment Securities | | | 19,831 | | | | 8,100 | |
| Proceeds from Sale of Investment Securities - Available for Sale | | | 10,475 | | | | - | |
| Maturities of Investment Securities - Available for Sale | | | 6,025 | | | | 30,406 | |
| Purchases of Investment Securities - Available for Sale | | | (49,129 | ) | | | (30,000 | ) |
| Maturities of Investment Securities - Held to Maturity | | | 163 | | | | 143 | |
| Purchases of Investment Securities - Held to Maturity | | | - | | | | (25 | ) |
| Proceeds from Sale of Portfolio Loans | | | 1,349 | | | | - | |
| Loan (Originations) Repayments - Net | | | (48,146 | ) | | | 29,968 | |
| Proceeds from Sale of OREO | | | 1,200 | | | | - | |
| Purchases of Premises and Equipment - Net | | | (327 | ) | | | (518 | ) |
| Net Cash (Used in) Provided by Investing Activities | | | (58,559 | ) | | | 38,074 | |
| | | | | | | | | |
| CASH FLOWS FROM FINANCING ACTIVITIES | | | | | | | | |
| Net Decrease in Deposit Accounts | | | (27,356 | ) | | | (596 | ) |
| Decrease in Capital Lease Payable | | | (13 | ) | | | (18 | ) |
| Net Cash Used in Financing Activities | | | (27,369 | ) | | | (614 | ) |
| | | | | | | | | |
| Net (Decrease) Increase in Cash and Cash Equivalents | | | (82,127 | ) | | | 40,895 | |
| Cash and Cash Equivalents Beginning of Period | | | 385,806 | | | | 172,559 | |
| | | | | | | | | |
| Cash and Cash Equivalents End of Period | | $ | 303,679 | | | $ | 213,454 | |
| Supplemental Disclosure: | | | | | | | | |
| Cash Paid During the Period for: | | | | | | | | |
| Interest | | $ | 770 | | | $ | 1,249 | |
See accompanying notes to unaudited condensed consolidated financial statements.
NOTES TO UNAUDITED CONDENSED CONSOLIDATED FINANCIAL STATEMENTS
1. FINANCIAL STATEMENT PRESENTATION AND SIGNIFICANT ACCOUNTING POLICIES
The unaudited interim condensed consolidated financial statements include the accounts of Suffolk Bancorp (the “Company”) and its wholly owned subsidiary, the Suffolk County National Bank of Riverhead and its subsidiaries (the “Bank”). The Bank formed Suffolk Greenway, Inc., a real estate investment trust, and owns 100% of an insurance agency and two corporations used to acquire foreclosed real estate. The insurance agency and the two corporations used to acquire foreclosed real estate are immaterial to the Company’s operations. Suffolk Bancorp and subsidiaries are collectively referred to hereafter as the “Company.” All material intercompany accounts and transactions have been eliminated in consolidation.
In the opinion of the Company’s management, the preceding unaudited interim condensed consolidated financial statements contain all adjustments, consisting of normal accruals, necessary for a fair presentation of its condensed consolidated statements of condition as of March 31, 2013 and December 31, 2012, its condensed consolidated statements of operations for the three months ended March 31, 2013 and 2012, its condensed consolidated statements of comprehensive income (loss) for the three months ended March 31, 2013 and 2012, its condensed consolidated statements of stockholders’ equity for the three months ended March 31, 2013 and 2012 and its condensed consolidated statements of cash flows for the three months ended March 31, 2013 and 2012. The preceding unaudited interim condensed consolidated financial statements have been prepared in accordance with accounting principles generally accepted in the United States of America (“U.S. GAAP”) for interim financial information and with the instructions to Form 10-Q and Article 10 of Regulation S-X, as well as in accordance with predominant practices within the banking industry. They do not include all of the information and footnotes required by U.S. GAAP for complete financial statements. The results of operations for the three months ended March 31, 2013 are not necessarily indicative of the results of operations to be expected for the remainder of the year. For further information, please refer to the audited consolidated financial statements and footnotes thereto included in the Company’s 2012 Annual Report on Form 10-K.
Loans and Loan Interest Income Recognition - Loans that management has the intent and ability to hold for the foreseeable future or until maturity or payoff are reported at the principal balance outstanding, net of unearned discounts, deferred loan fees and costs. Unearned discounts on installment loans are credited to income using methods that result in a level yield. Loan origination fees, net of certain direct origination costs, are deferred and recognized in interest income over the respective term of the loan without anticipating prepayments.
Interest income is accrued on the unpaid loan principal balance. Recognition of interest income is discontinued when reasonable doubt exists as to whether principal or interest due can be collected. For all classes of loans, loans generally no longer accrue interest when over 90 days past due unless the loan is well-secured and in process of collection. When a loan is placed on non-accrual status, all interest previously accrued, but not collected, is reversed against current-year interest income. Interest received on such loans is applied against principal or interest, according to management’s judgment as to the collectability of the principal, until qualifying for return to accrual status. Loans start accruing interest again when they become current as to principal and interest for at least six months, and when, in the opinion of management, the loans can be collected in full. For all classes of loans, an impaired loan is defined as a loan for which it is probable that the lender will not collect all amounts due under the contractual terms of the loan agreement. Loans for which the terms have been modified resulting in a concession, and for which the borrower is experiencing financial difficulties are considered troubled debt restructurings (“TDRs”) and are classified as impaired. Generally, TDRs are initially classified as non-accrual until sufficient time has passed to assess whether the restructured loan will continue to perform. For impaired, accruing loans, interest income is recognized on an accrual basis with cash offsetting the recorded accruals upon receipt. Interest received on non-accrual, impaired loans is applied against principal or interest according to management’s judgment as to the collectibility of the principal.
Allowance for Loan Losses - The allowance for loan losses is a valuation allowance for probable incurred losses, increased by the provision for loan losses and recoveries, and decreased by loan charge-offs. For all classes of loans, when a loan, in full or in part, is deemed uncollectible, it is charged against the allowance for loan losses. This happens when the loan is past due and the borrower has not shown the ability or intent to make the loan current, or the borrower does not have sufficient assets to pay the debt, or the value of the collateral is less than the balance of the loan and is not considered likely to improve soon. The allowance for loan losses is determined by a continuous analysis of the loan portfolio. Such analysis includes changes in the size and composition of the portfolio, the Company’s own historical loan losses, industry-wide losses, current and anticipated economic trends, and details about individual loans. It also includes estimates of the actual value of collateral, other possible sources of repayment and estimates that are susceptible to significant changes due to changes in appraisal values of collateral, national and regional economic conditions and other relevant factors. All non-accrual loans over $250 thousand in the commercial and industrial, commercial real estate and real estate construction loan classes and all TDRs are evaluated individually for impairment. Management will use judgment to determine if there are other loans outside of these two categories that fit the definition of impaired. All other loans are generally evaluated as homogeneous pools with similar risk characteristics. In assessing the adequacy of the allowance for loan losses, management reviews the loan portfolio by separate classes that have similar risk and collateral characteristics; e.g., commercial and industrial, commercial real estate, real estate construction, residential mortgages (1st and 2nd liens), home equity and consumer loans.
The allowance for loan losses consists of specific and general components. The specific component relates to loans that are individually classified as impaired. Specific reserves are established based on an analysis of the most probable sources of repayment and liquidation of collateral. Impaired loans that are collateral dependent are reviewed based on their collateral and the estimated time required to recover the Company’s investment in the loans, as well as the cost of doing so, and the estimate of the recovery. Non-collateral dependent impaired loans are reviewed based on the present value of estimated future cash flows, including balloon payments, if any, using the loan’s effective interest rate. While every non-performing loan is evaluated individually, not every loan requires a specific reserve. Specific reserves fluctuate based on changes in the underlying loans, anticipated sources of repayment, and charge-offs. The general component covers non-impaired loans and is based on historical loss experience for each loan class from a rolling twelve quarter period and modifying those percentages, if necessary, after adjusting for current qualitative and environmental factors that reflect changes in the collectability of the loan class not captured by historical loss data. These factors augment actual loss experience and help estimate the probability of loss within the loan portfolio based on emerging or inherent risk trends. These qualitative factors are applied as an adjustment to historical loss rates and require judgments that cannot be subjected to exact mathematical calculation. There are no formulas for translating them into a specific basis point adjustment of the Company’s historical loss rate for a pool of loans having similar risk characteristics. These adjustments reflect management’s overall estimate of the extent to which current losses on a pool of loans will differ from historical loss experience. These adjustments are subjective estimates and management reviews them on a quarterly basis. TDRs are also considered impaired with impairment generally measured at the present value of estimated future cash flows using the loan’s effective interest rate at inception or using the fair value of collateral, less estimated costs to sell, if repayment is expected solely from the collateral.
Loans Held-For-Sale – Loans held-for-sale are carried at the lower of aggregate cost or fair value, as determined by outstanding commitments from investors. Changes in fair value of loans held-for-sale are recognized in earnings.
Dividend Restriction - Banking regulations and the Bank's formal agreement (the “Agreement”) with the Office of the Comptroller of the Currency (“OCC”) require maintaining certain capital levels and impose limitations on dividends paid by the Bank to the Company and by the Company to stockholders. (See also Regulatory Matters footnote contained herein.)
Recent Accounting Guidance - In February 2013, the Financial Accounting Standards Board (“FASB”) issued Accounting Standards Update (“ASU”) 2013-02, Comprehensive Income (Topic 220), “Reporting of Amounts Reclassified Out of Accumulated Other Comprehensive Income.” ASU 2013-02 does not change the current requirements for reporting net income or other comprehensive income in financial statements. However, the amendments require an entity to provide information about the amounts reclassified out of accumulated other comprehensive income by component. In addition, an entity is required to present, either on the face of the statement where net income is presented or in the notes, significant amounts reclassified out of accumulated other comprehensive income by the respective line items of net income but only if the amount reclassified is required under U.S. GAAP to be reclassified to net income in its entirety in the same reporting period. For other amounts that are not required under U.S. GAAP to be reclassified in their entirety to net income, an entity is required to cross-reference to other disclosures required under U.S. GAAP that provide additional detail about those amounts. This standard is effective prospectively for public entities for annual and interim reporting periods beginning after December 15, 2012. Being disclosure-related only, the Company’s adoption of ASU 2013-02 on January 1, 2013 did not have a material effect on the Company’s results of operations or financial condition.
Reclassifications — Certain reclassifications have been made to prior period information in order to conform to the current period’s presentation. Such reclassifications had no impact on the Company’s results of operations or financial condition.
2. ACCUMULATED OTHER COMPREHENSIVE INCOME (“AOCI”)
The changes in the Company’s AOCI by component, net of tax, for the three months ended March 31, 2013 and 2012 follow (in thousands).
| | | Three Months Ended March 31, 2013 | | | Three Months Ended March 31, 2012 | |
| | | Unrealized Gains and Losses on Available-for-Sale Securities | | | Pension and Post- Retirement Plan Items | | | Total | | | Unrealized Gains and Losses on Available-for-Sale Securities | | | Pension and Post- Retirement Plan Items | | | Total | |
| Beginning balance | | $ | 10,553 | | | $ | (7,667 | ) | | $ | 2,886 | | | $ | 11,873 | | | $ | (14,943 | ) | | $ | (3,070 | ) |
| Other comprehensive loss before reclassifications | | | (991 | ) | | | - | | | | (991 | ) | | | (1,573 | ) | | | (255 | ) | | | (1,828 | ) |
| Amounts reclassified from AOCI | | | (229 | ) | | | - | | | | (229 | ) | | | - | | | | - | | | | - | |
| Net current-period other comprehensive loss | | | (1,220 | ) | | | - | | | | (1,220 | ) | | | (1.573 | ) | | | (255 | ) | | | (1,828 | ) |
| Ending balance | | $ | 9,333 | | | $ | (7,667 | ) | | $ | 1,666 | | | $ | 10,300 | | | $ | (15,198 | ) | | $ | (4,898 | ) |
The table below presents reclassifications out of AOCI for the three months ended March 31, 2013 (in thousands).
Three Months Ended March 31, 2013 Details about AOCI Components | | Amount Reclassified from AOCI | | Affected Line Item in the Statement Where Net Income is Presented |
| Unrealized Gains and Losses on Available-for-Sale Securities | | $ | 359 | | Net Gain on Sale of Securities Available for Sale |
| | | | | | |
| | | | (130 | ) | Income Tax Expense |
| | | | | | |
| Total reclassifications, net of tax | | $ | 229 | | |
3. INVESTMENT SECURITIES
At the time of purchase of a security, the Company designates the security as either available for sale or held to maturity, depending upon investment objectives, liquidity needs and intent. Securities held to maturity are stated at cost, adjusted for premium amortized or discount accreted, if any. The Company has the positive intent and ability to hold such securities to maturity. Securities available for sale are stated at estimated fair value. Unrealized gains and losses are excluded from income and reported net of tax as accumulated other comprehensive income (loss) as a separate component of stockholders’ equity until realized. Interest earned on securities is included in interest income. Realized gains and losses on the sale of securities are reported in the consolidated statements of operations and determined using the adjusted cost of the specific security sold.
The amortized cost, estimated fair value and gross unrealized gains and losses of the Company’s investment securities available for sale and held to maturity at March 31, 2013 and December 31, 2012 follow (in thousands).
| | | March 31, 2013 | | | December 31, 2012 | |
| | | | | | Gross | | | Gross | | | Estimated | | | | | | Gross | | | Gross | | | Estimated | |
| | | Amortized | | | Unrealized | | | Unrealized | | | Fair | | | Amortized | | | Unrealized | | | Unrealized | | | Fair | |
| | | Cost | | | Gains | | | Losses | | | Value | | | Cost | | | Gains | | | Losses | | | Value | |
| Available for sale: | | | | | | | | | | | | | | | | | | | | | | | | |
| U.S. Treasury securities | | $ | - | | | $ | - | | | $ | - | | | $ | - | | | $ | 500 | | | $ | - | | | $ | - | | | $ | 500 | |
| U.S. government agency securities | | | 75,533 | | | | 59 | | | | (204 | ) | | | 75,388 | | | | 65,085 | | | | 70 | | | | (77 | ) | | | 65,078 | |
| Obligations of states and political subdivisions | | | 153,701 | | | | 12,851 | | | | - | | | | 166,552 | | | | 155,121 | | | | 13,314 | | | | - | | | | 168,435 | |
| Collateralized mortgage obligations | | | 64,724 | | | | 1,449 | | | | (69 | ) | | | 66,104 | | | | 87,624 | | | | 2,148 | | | | (80 | ) | | | 89,692 | |
| Mortgage-backed securities | | | 86,156 | | | | 500 | | | | (277 | ) | | | 86,379 | | | | 61,750 | | | | 766 | | | | (66 | ) | | | 62,450 | |
| Corporate bonds | | | 18,507 | | | | 362 | | | | (15 | ) | | | 18,854 | | | | 15,701 | | | | 497 | | | | - | | | | 16,198 | |
| Total available for sale securities | | | 398,621 | | | | 15,221 | | | | (565 | ) | | | 413,277 | | | | 385,781 | | | | 16,795 | | | | (223 | ) | | | 402,353 | |
| Held to maturity: | | | | | | | | | | | | | | | | | | | | | | | | | | | | | | | | |
| Obligations of states and political subdivisions | | | 7,871 | | | | 791 | | | | - | | | | 8,662 | | | | 8,035 | | | | 826 | | | | - | | | | 8,861 | |
| Total investment securities | | $ | 406,492 | | | $ | 16,012 | | | $ | (565 | ) | | $ | 421,939 | | | $ | 393,816 | | | $ | 17,621 | | | $ | (223 | ) | | $ | 411,214 | |
At March 31, 2013 and December 31, 2012, investment securities carried at $278 million and $286 million, respectively, were pledged to secure trust deposits and public funds on deposit.
The amortized cost, contractual maturities and estimated fair value of the Company’s investment securities at March 31, 2013 (in thousands) are presented in the table below. Collateralized mortgage obligations (“CMOs”) and mortgage-backed securities (“MBS”) assume maturity dates pursuant to average lives.
| | | March 31, 2013 | |
| | | Amortized | | | Estimated | |
| | | Cost | | | Fair Value | |
| Securities available for sale: | | | | | | |
| Due in one year or less | | $ | 42,434 | | | $ | 43,232 | |
| Due from one to five years | | | 116,217 | | | | 123,531 | |
| Due from five to ten years | | | 209,792 | | | | 216,357 | |
| Due after ten years | | | 30,178 | | | | 30,157 | |
| Total securities available for sale | | | 398,621 | | | | 413,277 | |
| Securities held to maturity: | | | | | | | | |
| Due in one year or less | | | 1,535 | | | | 1,545 | |
| Due from one to five years | | | 5,938 | | | | 6,672 | |
| Due from five to ten years | | | 398 | | | | 445 | |
| Total securities held to maturity | | | 7,871 | | | | 8,662 | |
| Total investment securities | | $ | 406,492 | | | $ | 421,939 | |
The proceeds from sales of securities available for sale and the associated net realized gains follow (in thousands):
| | | Three Months Ended | |
| | | March 31, | |
| | | 2013 | | | 2012 | |
| Proceeds | | $ | 10,475 | | | $ | - | |
| | | | | | | | | |
| Gross realized gains | | | 359 | | | | - | |
| Gross realized losses | | | - | | | | - | |
| Net realized gains | | $ | 359 | | | $ | - | |
The table below indicates the length of time individual securities, both held to maturity and available for sale, have been held in a continuous unrealized loss position at the date indicated (in thousands).
| | | | | | Less than 12 months | | | 12 months or longer | | | Total | |
| As of March 31, 2013 | | Number of | | | Estimated | | | Unrealized | | | Estimated | | | Unrealized | | | Estimated | | | Unrealized | |
| Type of securities | | Securities | | | Fair value | | | Losses | | | Fair value | | | Losses | | | Fair value | | | Losses | |
| U.S. government agency securities | | | 8 | | | $ | 38,820 | | | $ | 204 | | | $ | - | | | $ | - | | | $ | 38,820 | | | $ | 204 | |
| Collateralized mortgage obligations | | | 3 | | | | 10,177 | | | | 69 | | | | - | | | | - | | | | 10,177 | | | | 69 | |
| Mortgage-backed securities | | | 9 | | | | 30,696 | | | | 277 | | | | - | | | | - | | | | 30,696 | | | | 277 | |
| Corporate bonds | | | 2 | | | | 5,520 | | | | 15 | | | | - | | | | - | | | | 5,520 | | | | 15 | |
| Total | | | 22 | | | $ | 85,213 | | | $ | 565 | | | $ | - | | | $ | - | | | $ | 85,213 | | | $ | 565 | |
| | | | | | | | | | | | | | | | | | | | | | | | | | | | | |
| | | | | | | Less than 12 months | | | 12 months or longer | | | Total | |
| As of December 31, 2012 | | Number of | | | Estimated | | | Unrealized | | | Estimated | | | Unrealized | | | Estimated | | | Unrealized | |
| Type of securities | | Securities | | | Fair value | | | Losses | | | Fair value | | | Losses | | | Fair value | | | Losses | |
| U.S. government agency securities | | | 6 | | | $ | 28,958 | | | $ | 77 | | | $ | - | | | $ | - | | | $ | 28,958 | | | $ | 77 | |
| Collateralized mortgage obligations | | | 2 | | | | 7,878 | | | | 80 | | | | - | | | | - | | | | 7,878 | | | | 80 | |
| Mortgage-backed securities | | | 4 | | | | 14,098 | | | | 66 | | | | - | | | | - | | | | 14,098 | | | | 66 | |
| Total | | | 12 | | | $ | 50,934 | | | $ | 223 | | | $ | - | | | $ | - | | | $ | 50,934 | | | $ | 223 | |
The Company’s management evaluates securities for other-than-temporary impairment (“OTTI”) at least on a quarterly basis, and more frequently when economic or market conditions warrant such an evaluation. All of the Company’s investment securities classified as available-for-sale or held-to-maturity are evaluated for OTTI under ASC 320, “Accounting for Certain Investments in Debt and Equity Securities.” In determining OTTI under ASC 320, management considers many factors, including: (1) the length of time and the extent to which the fair value has been less than amortized cost, (2) the financial condition and near-term prospects of the issuer, (3) whether the market decline was affected by macroeconomic conditions, and (4) whether the Company has the intent to sell the debt security or more likely than not will be required to sell the debt security before its anticipated recovery. The assessment of whether an OTTI decline exists involves a high degree of subjectivity and judgment and is based on information available to management at a point in time. An OTTI is deemed to have occurred if there has been an adverse change in the remaining expected future cash flows.
When an OTTI occurs, the amount of the OTTI recognized in earnings depends on whether an entity intends to sell the security or more likely than not will be required to sell the security before recovery of its amortized cost basis less any current-period credit loss. If an entity intends to sell or more likely than not will be required to sell the security before recovery of its amortized cost basis less any current-period credit loss, the OTTI is recognized in earnings equal to the entire difference between the investment’s amortized cost and its estimated fair value at the balance sheet date. If an entity does not intend to sell the security and it is not more likely than not that the entity will be required to sell the security before recovery of its amortized cost less any current-period loss, the OTTI is separated into the amount representing the credit loss and the amount related to all other factors. The amount of the total OTTI related to the credit loss is determined based on the present value of cash flows expected to be collected and is recognized in earnings. The amount of the total OTTI related to other factors is recognized in other comprehensive income, net of applicable tax benefit. The previous amortized cost basis less the OTTI recognized in earnings becomes the new amortized cost basis of the investment.
Upon review of the considerations mentioned here, no OTTI was deemed to be warranted at March 31, 2013.
4. LOANS
At March 31, 2013 and December 31, 2012, net loans disaggregated by class consisted of the following (in thousands):
| | | March 31, | | | December 31, | |
| | | 2013 | | | 2012 | |
| Commercial and industrial | | $ | 187,775 | | | $ | 168,709 | |
| Commercial real estate | | | 399,270 | | | | 369,271 | |
| Real estate construction | | | 14,075 | | | | 15,469 | |
| Residential mortgages (1st and 2nd liens) | | | 146,967 | | | | 146,575 | |
| Home equity | | | 63,463 | | | | 66,468 | |
| Consumer | | | 12,849 | | | | 14,288 | |
| Gross loans | | | 824,399 | | | | 780,780 | |
| Allowance for loan losses | | | (17,834 | ) | | | (17,781 | ) |
| Net loans at end of period | | $ | 806,565 | | | $ | 762,999 | |
For the three months ended March 31, 2013 and 2012, the activity in the allowance for loan losses disaggregated by class is shown below (in thousands).
| | | Commercial and industrial | | | Commercial real estate | | | Real estate construction | | | Residential mortgages (1st and 2nd liens) | | | Home equity | | | Consumer | | | Unallocated | | | Total | |
| | | | | | | | | | | | | | | | | | | | | | | | | |
| Three months ended March 31, 2013 | | | | | | | | | | | | | | | | | | | | | | | | |
| Balance at beginning of period | | $ | 6,181 | | | $ | 6,149 | | | $ | 141 | | | $ | 1,576 | �� | | $ | 907 | | | $ | 189 | | | $ | 2,638 | | | $ | 17,781 | |
| Charge-offs | | | (348 | ) | | | - | | | | - | | | | - | | | | - | | | | (11 | ) | | | - | | | | (359 | ) |
| Recoveries | | | 299 | | | | 72 | | | | - | | | | 1 | | | | 1 | | | | 39 | | | | - | | | | 412 | |
| Provision for loan losses | | | (787 | ) | | | 349 | | | | 704 | | | | 864 | | | | 16 | | | | 28 | | | | (1,174 | ) | | | - | |
| Balance at end of period | | $ | 5,345 | | | $ | 6,570 | | | $ | 845 | | | $ | 2,441 | | | $ | 924 | | | $ | 245 | | | $ | 1,464 | | | $ | 17,834 | |
| | | | | | | | | | | | | | | | | | | | | | | | | | | | | | | | | |
| | | Commercial and industrial | | | Commercial real estate | | | Real estate construction | | | Residential mortgages (1st and 2nd liens) | | | Home equity | | | Consumer | | | Unallocated | | | Total | |
| | | | | | | | | | | | | | | | | | | | | | | | | | | | | | | | | |
| Three months ended March 31, 2012 | | | | | | | | | | | | | | | | | | | | | | | | | | | | | | | | |
| Balance at beginning of period | | $ | 25,047 | | | $ | 11,029 | | | $ | 623 | | | $ | 2,401 | | | $ | 512 | | | $ | 313 | | | $ | 33 | | | $ | 39,958 | |
| Charge-offs | | | (337 | ) | | | - | | | | - | | | | (395 | ) | | | (61 | ) | | | (32 | ) | | | - | | | | (825 | ) |
| Recoveries | | | 855 | | | | - | | | | - | | | | 1 | | | | - | | | | 19 | | | | - | | | | 875 | |
| Provision for loan losses | | | (1,772 | ) | | | (2,150 | ) | | | (44 | ) | | | 28 | | | | 804 | | | | 54 | | | | 3,080 | | | | - | |
| Balance at end of period | | $ | 23,793 | | | $ | 8,879 | | | $ | 579 | | | $ | 2,035 | | | $ | 1,255 | | | $ | 354 | | | $ | 3,113 | | | $ | 40,008 | |
The allowance for loan losses is a valuation allowance for probable incurred credit losses. Loan losses are charged against the allowance when management believes the uncollectibility of a loan balance is confirmed. Subsequent recoveries, if any, are credited to the allowance. Management estimates the allowance balance required using past loan loss experience, the nature and volume of the portfolio, information about specific borrower situations and estimated collateral values, economic conditions, and other factors. Allocations of the allowance may be made for specific loans, but the entire allowance is available for any loan that, in management’s judgment, should be charged off. The allowance consists of specific and general components. The specific component relates to loans that are individually classified as impaired.
A loan is impaired when, based on current information and events, it is probable that the Company will be unable to collect all amounts due according to the contractual terms of the loan agreement. Loans for which the terms have been modified resulting in a concession, and for which the borrower is experiencing financial difficulties, are considered TDRs and classified as impaired. Generally, TDRs are initially classified as non-accrual until sufficient time has passed to assess whether the restructured loan will continue to perform. Generally, the Company returns a TDR to accrual status upon six months of performance under the new terms.
Factors considered by management in determining impairment include payment status, collateral value, and the probability of collecting scheduled principal and interest payments when due. Loans that experience insignificant payment delays and payment shortfalls generally are not classified as impaired. Management determines the significance of payment delays and payment shortfalls on a case-by-case basis, taking into consideration all of the circumstances surrounding the loan and the borrower, including the length of the delay, the reasons for the delay, the borrower’s prior payment record, and the amount of the shortfall in relation to the principal and interest owed.
Management has determined that all TDRs and all non-accrual loans are impaired; however, non-accrual loans with an impaired balance of $250 thousand or less will be evaluated under ASC 450 with other groups of smaller or homogeneous loans with similar risk characteristics. Management will use judgment to determine if there are other loans outside of these two categories that fit the definition of impaired. If a loan is impaired, a specific reserve is recorded so that the loan is reported, net, at the present value of estimated future cash flows including balloon payments, if any, using the loan’s existing rate or at the fair value of collateral if repayment is expected solely from the collateral. Large groups of homogeneous loans with smaller individual balances, such as consumer and residential real estate loans, are generally evaluated collectively for impairment, and accordingly, are not separately identified for impairment disclosures. TDRs are separately identified for impairment disclosures and are measured at the present value of estimated future cash flows using the loan’s effective rate at inception. If a TDR is considered to be “collateral-dependent,” the loan is reported at the fair value of the collateral net of estimated costs to sell. For TDRs that subsequently default, the Company determines the allowance amount in accordance with its accounting policy for the allowance for loan losses.
The general component of the allowance covers non-impaired loans and is based on historical loss experience, adjusted for qualitative factors. The historical loss experience is determined by loan class, and is based on the actual loss history experienced by the Company over a rolling twelve quarter period. This actual loss experience is supplemented with other qualitative factors based on the risks present for each loan class. These qualitative factors include consideration of the following: levels of and trends in delinquencies and impaired loans; levels of and trends in charge-offs and recoveries; trends in volume and terms of loans; effects of any changes in risk selection and underwriting standards; other changes in lending policies, procedures and practices; experience, ability, and depth of lending management and other relevant staff; local, regional and national economic trends and conditions; industry conditions; and effects of changes in credit concentrations. The following loan classes have been identified: commercial and industrial, commercial real estate, real estate construction, residential mortgages (1st and 2nd liens), home equity and consumer. For performing loans, an estimate of adequacy is made by applying qualitative factors specific to the portfolio to the period-end balances. Consideration is also given to the type and collateral of the loans with particular attention paid to commercial real estate construction loans, due to the inherent risk of this type of loan. Specific and general reserves are available for any identified loss.
The Company recorded no consolidated provision for loan losses for the three months ended March 31, 2013 and 2012. For the three months ended March 31, 2013, the Company decreased its allowance for loan losses allocated to commercial and industrial (“C&I”) loans by $787 thousand, while increasing its allowance allocation to commercial real estate (“CRE”), real estate construction and residential mortgages (1st and 2nd liens) by $349 thousand, $704 thousand and $864 thousand, respectively.
The decrease in the allowance for loan losses allocated to C&I loans during the first quarter of 2013 reflected a 0.94% reduction in the ASC 450-20 historical loss factors rate on unimpaired pass rated C&I loans. Partially offsetting the loss factors rate reduction was a $20 million increase in the balance of unimpaired pass rated C&I loans during the first quarter of 2013, coupled with an increase of $97 thousand in specific reserves for C&I loans as computed under ASC 310-10 at March 31, 2013 as compared to December 31, 2012.
The increase in the allowance for loan losses allocated to CRE loans was primarily due to a $39 million increase in the balance of unimpaired pass rated CRE loans, mainly due to growth in multi-family lending, versus December 31, 2012. The increases to the allowance allocated to real estate construction and residential mortgages was largely due to increases in the ASC 450-20 historical loss factors for such loans of 5.68% and 0.56%, respectively, when compared to December 31, 2012.
The changes in the ASC 450-20 loss factors rates were primarily due to an expansion of the look back period used in calculating historical losses to a rolling twelve quarter period (from an eight quarter period) for each loan segment. This change results from the Company’s effort to improve the granularity of its individual loan segment charge-off history effective with the March 31, 2013 calculation. Additionally, the expansion of the look back period reduces the volatility associated with improperly weighting short-term trends in this calculation. These changes more accurately represent the Company’s incurred and expected losses at March 31, 2013 by individual loan segment.
At March 31, 2013 and December 31, 2012, the ending balance in the allowance for loan losses disaggregated by class and impairment methodology follows below (in thousands). Also shown below are total loans at March 31, 2013 and December 31, 2012 disaggregated by class and impairment methodology (in thousands).
| March 31, 2013 | | Commercial and industrial | | | Commercial real estate | | | Real estate construction | | | Residential mortgages (1st and 2nd liens) | | | Home equity | | | Consumer | | | Unallocated | | | Total | |
| Allowance for loan losses: | | | | | | | | | | | | | | | | | | | | | | | | |
| Ending balance: individually evaluated for impairment | | $ | 437 | | | $ | - | | | $ | - | | | $ | 618 | | | $ | 165 | | | $ | 56 | | | $ | - | | | $ | 1,276 | |
| Ending balance: collectively evaluated for impairment | | | 4,908 | | | | 6,570 | | | | 845 | | | | 1,823 | | | | 759 | | | | 189 | | | | 1,464 | | | | 16,558 | |
| Ending balance | | $ | 5,345 | | | $ | 6,570 | | | $ | 845 | | | $ | 2,441 | | | $ | 924 | | | $ | 245 | | | $ | 1,464 | | | $ | 17,834 | |
| Loan balances: | | | | | | | | | | | | | | | | | | | | | | | | | | | | | | | | |
| Ending balance: individually evaluated for impairment | | $ | 10,545 | | | $ | 8,238 | | | $ | 840 | | | $ | 4,976 | | | $ | 750 | | | $ | 324 | | | $ | - | | | $ | 25,673 | |
| Ending balance: collectively evaluated for impairment | | | 177,230 | | | | 391,032 | | | | 13,235 | | | | 141,991 | | | | 62,713 | | | | 12,525 | | | | - | | | | 798,726 | |
| Ending balance | | $ | 187,775 | | | $ | 399,270 | | | $ | 14,075 | | | $ | 146,967 | | | $ | 63,463 | | | $ | 12,849 | | | $ | - | | | $ | 824,399 | |
| | | | | | | | | | | | | | | | | | | | | | | | | | | | | | | | | |
| December 31, 2012 | | Commercial and industrial | | | Commercial real estate | | | Real estate construction | | | Residential mortgages (1st and 2nd liens) | | | Home equity | | | Consumer | | | Unallocated | | | Total | |
| Allowance for loan losses: | | | | | | | | | | | | | | | | | | | | | | | | | | | | | | | | |
| Ending balance: individually evaluated for impairment | | $ | 340 | | | $ | 22 | | | $ | 1 | | | $ | 575 | | | $ | 86 | | | $ | - | | | $ | - | | | $ | 1,024 | |
| Ending balance: collectively evaluated for impairment | | | 5,841 | | | | 6,127 | | | | 140 | | | | 1,001 | | | | 821 | | | | 189 | | | | 2,638 | | | | 16,757 | |
| Ending balance | | $ | 6,181 | | | $ | 6,149 | | | $ | 141 | | | $ | 1,576 | | | $ | 907 | | | $ | 189 | | | $ | 2,638 | | | $ | 17,781 | |
| Loan balances: | | | | | | | | | | | | | | | | | | | | | | | | | | | | | | | | |
| Ending balance: individually evaluated for impairment | | $ | 10,369 | | | $ | 9,443 | | | $ | 1,961 | | | $ | 4,660 | | | $ | 502 | | | $ | 21 | | | $ | - | | | $ | 26,956 | |
| Ending balance: collectively evaluated for impairment | | | 158,340 | | | | 359,828 | | | | 13,508 | | | | 141,915 | | | | 65,966 | | | | 14,267 | | | | - | | | | 753,824 | |
| Ending balance | | $ | 168,709 | | | $ | 369,271 | | | $ | 15,469 | | | $ | 146,575 | | | $ | 66,468 | | | $ | 14,288 | | | $ | - | | | $ | 780,780 | |
The following table presents certain information pertaining to the Company’s impaired loans disaggregated by class at March 31, 2013 and December 31, 2012 (in thousands):
| | | March 31, 2013 | | | December 31, 2012 | |
| | | Impaired Loans | | | Impaired Loans | |
| | | Unpaid Principal Balance | | | Recorded Balance | | | Allowance Allocated | | | Unpaid Principal Balance | | | Recorded Balance | | | Allowance Allocated | |
| With no allowance recorded: | | | | | | | | | | | | | | | | | | |
| Commercial and industrial | | $ | 8,887 | | | $ | 8,887 | | | $ | - | | | $ | 7,913 | | | $ | 7,492 | | | $ | - | |
| Commercial real estate | | | 9,223 | | | | 8,238 | | | | - | | | | 8,859 | | | | 7,282 | | | | - | |
| Real estate construction | | | 840 | | | | 840 | | | | - | | | | 1,334 | | | | 1,305 | | | | - | |
| Residential mortgages (1st and 2nd liens) | | | 2,335 | | | | 2,206 | | | | - | | | | 1,918 | | | | 1,788 | | | | - | |
| Home equity | | | 572 | | | | 572 | | | | - | | | | 418 | | | | 416 | | | | - | |
| Consumer | | | 166 | | | | 166 | | | | - | | | | 21 | | | | 21 | | | | - | |
| Subtotal | | | 22,023 | | | | 20,909 | | | | - | | | | 20,463 | | | | 18,304 | | | | - | |
| | | | | | | | | | | | | | | | | | | | | | | | | |
| With an allowance recorded: | | | | | | | | | | | | | | | | | | | | | | | | |
| Commercial and industrial | | | 1,960 | | | | 1,658 | | | | 437 | | | | 2,884 | | | | 2,877 | | | | 340 | |
| Commercial real estate | | | - | | | | - | | | | - | | | | 2,161 | | | | 2,161 | | | | 22 | |
| Real estate construction | | | - | | | | - | | | | - | | | | 656 | | | | 656 | | | | 1 | |
| Residential mortgages (1st and 2nd liens) | | | 2,896 | | | | 2,770 | | | | 618 | | | | 3,015 | | | | 2,872 | | | | 575 | |
| Home equity | | | 178 | | | | 178 | | | | 165 | | | | 86 | | | | 86 | | | | 86 | |
| Consumer | | | 158 | | | | 158 | | | | 56 | | | | - | | | | - | | | | - | |
| Subtotal | | | 5,192 | | | | 4,764 | | | | 1,276 | | | | 8,802 | | | | 8,652 | | | | 1,024 | |
| Total | | $ | 27,215 | | | $ | 25,673 | | | $ | 1,276 | | | $ | 29,265 | | | $ | 26,956 | | | $ | 1,024 | |
The following table presents additional information pertaining to the Company’s impaired loans disaggregated by class for the three months ended March 31, 2013 and 2012 (in thousands):
| | | Three Months Ended March 31, 2013 | | | Three Months Ended March 31, 2012 | |
| | | Impaired Loans | | | Impaired Loans | |
| | | Average recorded investment in impaired loans | | | Interest income recognized on impaired loans | | | Interest income recognized on a cash basis on impaired loans | | | Average recorded investment in impaired loans | | | Interest income recognized on impaired loans | | | Interest income recognized on a cash basis on impaired loans | |
| Commercial and industrial | | $ | 10,947 | | | $ | 57 | | | $ | - | | | $ | 29,678 | | | $ | 265 | | | $ | - | |
| Commercial real estate | | | 11,090 | | | | 69 | | | | - | | | | 73,791 | | | | 325 | | | | - | |
| Real estate construction | | | 1,401 | | | | - | | | | - | | | | 12,609 | | | | 181 | | | | - | |
| Residential mortgages (1st and 2nd liens) | | | 5,004 | | | | 42 | | | | - | | | | 8,463 | | | | - | | | | - | |
| Home equity | | | 751 | | | | 3 | | | | - | | | | 3,993 | | | | - | | | | - | |
| Consumer | | | 318 | | | | 5 | | | | - | | | | 675 | | | | - | | | | - | |
| Total | | $ | 29,511 | | | $ | 176 | | | $ | - | | | $ | 129,209 | | | $ | 771 | | | $ | - | |
TDRs involve modifications or renewals where the Company has granted a concession to a borrower in financial distress. The Company reviews all modifications and renewals for determination of TDR status. The Company allocated $1 million and $800 thousand of specific reserves to customers whose loan terms have been modified in TDRs as of March 31, 2013 and December 31, 2012, respectively. These loans involved the restructuring of terms to allow customers to mitigate the risk of foreclosure by meeting a lower payment requirement based upon their current cash flow. These may also include loans that renewed at existing contractual rates, but below market rates for comparable credit.
A total of $38 thousand and $35 thousand were committed to be advanced in connection with TDRs as of March 31, 2013 and December 31, 2012, respectively, representing the amount the Company is legally required to advance under existing loan agreements. These loans are not in default under the terms of the loan agreements and are accruing. It is the Company’s policy to evaluate advances on such loans on a case by case basis. Absent a legal obligation to advance pursuant to the terms of the loan agreement, the Company generally will not advance funds for which it has outstanding commitments, but may do so in certain circumstances.
The following tables present certain information regarding outstanding TDRs at March 31, 2013 and December 31, 2012 (dollars in thousands), TDRs executed during the three months ended March 31, 2013 and 2012 (dollars in thousands) and TDRs with payment defaults of 90 days or more within twelve months of restructuring during the three months ended March 31, 2013 and 2012 (dollars in thousands):
| | | March 31, 2013 | | | December 31, 2012 | |
| Total Troubled Debt Restructurings | | Number of Loans | | | Outstanding Recorded Balance | | | Number of Loans | | | Outstanding Recorded Balance | |
| | | | | | | | | | | | | |
| Commercial and industrial | | | 42 | | | $ | 6,400 | | | | 41 | | | $ | 6,468 | |
| Commercial real estate | | | 8 | | | | 5,072 | | | | 9 | | | | 6,238 | |
| Residential mortgages (1st and 2nd liens) | | | 18 | | | | 4,441 | | | | 15 | | | | 3,587 | |
| Consumer | | | 5 | | | | 324 | | | | 5 | | | | 311 | |
| | | | 73 | | | $ | 16,237 | | | | 70 | | | $ | 16,604 | |
| | | Three months ended | | | Three months ended | |
| | | March 31, 2013 | | | March 31, 2012 | |
| | | | | | Pre-Modification | | | Post-Modification | | | | | | Pre-Modification | | | Post-Modification | |
| | | Number | | | Outstanding | | | Outstanding | | | Number | | | Outstanding | | | Outstanding | |
| New Troubled Debt | | of | | | Recorded | | | Recorded | | | of | | | Recorded | | | Recorded | |
| Restructurings | | Loans | | | Balance | | | Balance | | | Loans | | | Balance | | | Balance | |
| | | | | | | | | | | | | | | | | | | |
| Commercial and industrial | | | 2 | | | $ | 320 | | | $ | 320 | | | | 9 | | | $ | 3,316 | | | $ | 3,316 | |
| Residential mortgages (1st and 2nd liens) | | | 3 | | | | 905 | | | | 905 | | | | - | | | | - | | | | - | |
| Consumer | | | 1 | | | | 17 | | | | 17 | | | | - | | | | - | | | | - | |
| | | | 6 | | | $ | 1,242 | | | $ | 1,242 | | | | 9 | | | $ | 3,316 | | | $ | 3,316 | |
| | | Three months ended | | | Three months ended | |
| | | March 31, 2013 | | | March 31, 2012 | |
| | | | | | Outstanding | | | | | | Outstanding | |
| | | Number | | | Recorded | | | Number | | | Recorded | |
| Defaulted Troubled Debt Restructurings | | of Loans | | | Balance | | | of Loans | | | Balance | |
| | | | | | | | | | | | | |
| Commercial and industrial | | | - | | | $ | - | | | | 1 | | | $ | 15 | |
| Residential mortgages (1st and 2nd liens) | | | - | | | | - | | | | 1 | | | | 494 | |
| | | | - | | | $ | - | | | | 2 | | | $ | 509 | |
Not all loan modifications are TDRs. In some cases, the Company might provide a concession, such as a reduction in interest rate, but the borrower is not experiencing financial distress. This could be the case if the Company is matching a competitor’s interest rate.
The following table presents information regarding modifications and renewals executed during the three months ended March 31, 2013 and 2012 that are not considered TDRs (dollars in thousands):
| | | Three months ended | | | Three months ended | |
| | | March 31, 2013 | | | March 31, 2012 | |
| | | | | | Outstanding | | | | | | Outstanding | |
| | | Number | | | Recorded | | | Number | | | Recorded | |
| Modifications Not Considered TDRs | | of Loans | | | Balance | | | of Loans | | | Balance | |
| | | | | | | | | | | | | |
| Commercial and industrial | | | - | | | $ | - | | | | 1 | | | $ | 580 | |
| Commercial real estate | | | 11 | | | | 19,703 | | | | 2 | | | | 3,179 | |
| | | | 11 | | | $ | 19,703 | | | | 3 | | | $ | 3,759 | |
The following is a summary of information pertaining to non-performing assets at March 31, 2013 and December 31, 2012 (in thousands):
| | | March 31, | | | December 31, | |
| | | 2013 | | | 2012 | |
| Non-accrual loans | | $ | 14,420 | | | $ | 16,435 | |
| Non-accrual loans held-for-sale | | | - | | | | 907 | |
| Loans 90 days past due and still accruing | | | - | | | | - | |
| OREO | | | 372 | | | | 1,572 | |
| Total non-performing assets | | $ | 14,792 | | | $ | 18,914 | |
| TDRs accruing interest | | $ | 10,247 | | | $ | 9,954 | |
| TDRs nonaccruing | | $ | 5,990 | | | $ | 6,650 | |
The following table summarizes non-accrual loans by loan class at March 31, 2013 and December 31, 2012 (dollars in thousands):
| | | Non-accrual Loans | |
| | | | | | Total | | | % of | | | | | | Total | | | % of | |
| | | | | | % of | | | Loans | | | Total | | | | | | % of | | | Loans | | | Total | |
| | | 3/31/2013 | | | Total | | | 3/31/2013 | | | Loans | | | 12/31/2012 | | | Total | | | 12/31/2012 | | | Loans | |
| Commercial and industrial | | $ | 6,746 | | | | 46.8 | % | | $ | 187,775 | | | | 0.8 | % | | $ | 6,529 | | | | 39.8 | % | | $ | 168,709 | | | | 0.8 | % |
| Commercial real estate | | | 3,972 | | | | 27.5 | | | | 399,270 | | | | 0.5 | | | | 5,192 | | | | 31.6 | | | | 369,271 | | | | 0.7 | |
| Real estate construction | | | 840 | | | | 5.8 | | | | 14,075 | | | | 0.1 | | | | 1,961 | | | | 11.9 | | | | 15,469 | | | | 0.3 | |
| Residential mortgages (1st and 2nd liens) | | | 2,336 | | | | 16.2 | | | | 146,967 | | | | 0.3 | | | | 2,466 | | | | 15.0 | | | | 146,575 | | | | 0.3 | |
| Home equity | | | 514 | | | | 3.6 | | | | 63,463 | | | | - | | | | 266 | | | | 1.6 | | | | 66,468 | | | | - | |
| Consumer | | | 12 | | | | 0.1 | | | | 12,849 | | | | - | | | | 21 | | | | 0.1 | | | | 14,288 | | | | - | |
| Total non-accrual loans | | $ | 14,420 | | | | 100.0 | % | | $ | 824,399 | | | | 1.7 | % | | $ | 16,435 | | | | 100.0 | % | | $ | 780,780 | | | | 2.1 | % |
For the non-accrual loans outstanding at the end of the reported periods, additional interest income of approximately $406 thousand and $1.4 million would have been recorded on non-accrual loans during the three months ended March 31, 2013 and 2012, respectively, if the loans had performed in accordance with their original terms.
The following table details the collateral value securing non-accrual loans at March 31, 2013 and December 31, 2012 (in thousands):
| | | March 31, 2013 | | | December 31, 2012 | |
| | | Non-accrual Loans | | | Non-accrual Loans | |
| | | Principal Balance | | | Collateral Value | | | Principal Balance | | | Collateral Value | |
| Commercial and industrial (1) | | $ | 6,746 | | | $ | 5,163 | | | $ | 6,529 | | | $ | 4,400 | |
| Commercial real estate | | | 3,972 | | | | 10,490 | | | | 5,192 | | | | 12,675 | |
| Real estate construction | | | 840 | | | | 3,310 | | | | 1,961 | | | | 3,661 | |
| Residential mortgages (1st and 2nd liens) | | | 2,336 | | | | 3,511 | | | | 2,466 | | | | 5,141 | |
| Home equity | | | 514 | | | | 1,436 | | | | 266 | | | | 849 | |
| Consumer | | | 12 | | | | - | | | | 21 | | | | - | |
| Total | | $ | 14,420 | | | $ | 23,910 | | | $ | 16,435 | | | $ | 26,726 | |
(1) Repayment of commercial and industrial loans is expected primarily from the cash flow of the business. The collateral typically securing these loans is a lien on all corporate assets via a blanket UCC filing and does not usually include real estate. For purposes of this disclosure, the Company has ascribed no value to the non-real estate collateral for this class of loans.
At March 31, 2013 and December 31, 2012, past due loans disaggregated by class were as follows (in thousands):
| | | Past Due | | | | | | | |
| March 31, 2013 | | 30 - 59 days | | | 60 - 89 days | | | 90 days and over | | | Total | | | Current | | | Total | |
| Commercial and industrial | | $ | 382 | | | $ | 370 | | | $ | 6,746 | | | $ | 7,498 | | | $ | 180,277 | | | $ | 187,775 | |
| Commercial real estate | | | 1,339 | | | | - | | | | 3,972 | | | | 5,311 | | | | 393,959 | | | | 399,270 | |
| Real estate construction | | | - | | | | - | | | | 840 | | | | 840 | | | | 13,235 | | | | 14,075 | |
| Residential mortgages | | | | | | | | | | | | | | | | | | | | | | | | |
| (1st and 2nd liens) | | | 2,540 | | | | - | | | | 2,336 | | | | 4,876 | | | | 142,091 | | | | 146,967 | |
| Home equity | | | 1,356 | | | | 496 | | | | 514 | | | | 2,366 | | | | 61,097 | | | | 63,463 | |
| Consumer | | | 79 | | | | 1 | | | | 12 | | | | 92 | | | | 12,757 | | | | 12,849 | |
| Total | | $ | 5,696 | | | $ | 867 | | | $ | 14,420 | | | $ | 20,983 | | | $ | 803,416 | | | $ | 824,399 | |
| | | | | | | | | | | | | | | | | | | | | | | | | |
| | | Past Due | | | | | | | | | |
| December 31, 2012 | | 30 - 59 days | | | 60 - 89 days | | | 90 days and over | | | Total | | | Current | | | Total | |
| Commercial and industrial | | $ | 6,591 | | | $ | 1,274 | | | $ | 6,529 | | | $ | 14,394 | | | $ | 154,315 | | | $ | 168,709 | |
| Commercial real estate | | | 1,145 | | | | 329 | | | | 5,192 | | | | 6,666 | | | | 362,605 | | | | 369,271 | |
| Real estate construction | | | 1,382 | | | | - | | | | 1,961 | | | | 3,343 | | | | 12,126 | | | | 15,469 | |
| Residential mortgages | | | | | | | | | | | | | | | | | | | | | | | | |
| (1st and 2nd liens) | | | 2,867 | | | | 6 | | | | 2,466 | | | | 5,339 | | | | 141,236 | | | | 146,575 | |
| Home equity | | | 261 | | | | 100 | | | | 266 | | | | 627 | | | | 65,841 | | | | 66,468 | |
| Consumer | | | 189 | | | | 18 | | | | 21 | | | | 228 | | | | 14,060 | | | | 14,288 | |
| Total | | $ | 12,435 | | | $ | 1,727 | | | $ | 16,435 | | | $ | 30,597 | | | $ | 750,183 | | | $ | 780,780 | |
The Bank utilizes an eight-grade risk-rating system for commercial and industrial loans, commercial real estate and construction loans. Loans in risk grades 1- 4 are considered “pass” loans. The Bank’s risk grades are as follows:
Risk Grade 1 – Excellent. Loans secured by liquid collateral such as certificates of deposit, reputable bank letters of credit, or other cash equivalents; loans that are guaranteed or otherwise backed by the full faith and credit of the United States government or an agency thereof, such as the Small Business Administration; or loans to any publicly held company with a current long-term debt rating of A or better.
Risk Grade 2 – Good. Loans to businesses that have strong financial statements containing an unqualified opinion from a CPA firm and at least three consecutive years of profits; loans supported by un-audited financial statements containing strong balance sheets, five consecutive years of profits, a five-year satisfactory relationship with the Bank, and key balance sheet and income statement trends that are either stable or positive; loans secured by publicly traded marketable securities where there is no impediment to liquidation; loans to individuals backed by liquid personal assets, established credit history, and unquestionable character; or loans to publicly held companies with current long-term debt ratings of Baa or better.
Risk Grade 3 – Satisfactory. Loans supported by financial statements (audited or un-audited) that indicate average or slightly below average risk and having some deficiency or vulnerability to changing economic conditions; loans with some weakness but offsetting features of other support are readily available; loans that are meeting the terms of repayment, but which may be susceptible to deterioration if adverse factors are encountered. Loans may be graded Satisfactory when there is no recent information on which to base a current risk evaluation and the following conditions apply:
| | · | At inception, the loan was properly underwritten, did not possess an unwarranted level of credit risk, and the loan met the above criteria for a risk grade of Excellent, Good, or Satisfactory. |
| | · | At inception, the loan was secured with collateral possessing a loan value adequate to protect the Bank from loss. |
| | · | The loan has exhibited two or more years of satisfactory repayment with a reasonable reduction of the principal balance. |
| | · | During the period that the loan has been outstanding, there has been no evidence of any credit weakness. Some examples of weakness include slow payment, lack of cooperation by the borrower, breach of loan covenants, or |
| | · | The borrower is in an industry known to be experiencing problems. If any of these credit weaknesses is observed, a lower risk grade may be warranted. |
Risk Grade 4 - Satisfactory/Monitored. Loans in this category are considered to be of acceptable credit quality, but contain greater credit risk than satisfactory loans due to weak balance sheets, marginal earnings or cash flow, or other uncertainties. These loans warrant a higher than average level of monitoring to ensure that weaknesses do not advance. The level of risk in a Satisfactory/Monitored loan is within acceptable underwriting guidelines so long as the loan is given the proper level of management supervision.
Risk Grade 5 - Special Mention. Loans which possess some credit deficiency or potential weakness which deserves close attention. Such loans pose an unwarranted financial risk that, if not corrected, could weaken the loan by adversely impacting the future repayment ability of the borrower. The key distinctions of a Special Mention classification are that (1) it is indicative of an unwarranted level of risk and (2) weaknesses are considered “potential,” not “defined,” impairments to the primary source of repayment.
Risk Grade 6 – Substandard. One or more of the following characteristics may be exhibited in loans classified Substandard:
| | · | Loans which possess a defined credit weakness. The likelihood that a loan will be paid from the primary source of repayment is uncertain. Financial deterioration is under way and very close attention is warranted to ensure that the loan is collected without loss. |
| | · | Loans are inadequately protected by the current net worth and paying capacity of the obligor. |
| | · | The primary source of repayment is gone, and the Bank is forced to rely on a secondary source of repayment, such as collateral liquidation or guarantees. |
| | · | Loans have a distinct possibility that the Bank will sustain some loss if deficiencies are not corrected. |
| | · | Unusual courses of action are needed to maintain a high probability of repayment. |
| | · | The borrower is not generating enough cash flow to repay loan principal; however, it continues to make interest payments. |
| | · | The lender is forced into a subordinated or unsecured position due to flaws in documentation. |
| | · | Loans have been restructured so that payment schedules, terms, and collateral represent concessions to the borrower when compared to the normal loan terms. |
| | · | The lender is seriously contemplating foreclosure or legal action due to the apparent deterioration in the loan. |
| | · | There is a significant deterioration in market conditions to which the borrower is highly vulnerable. |
Risk Grade 7 – Doubtful. One or more of the following characteristics may be present in loans classified Doubtful:
| | · | Loans have all of the weaknesses of those classified as Substandard. However, based on existing conditions, these weaknesses make full collection of principal highly improbable. |
| | · | The primary source of repayment is gone, and there is considerable doubt as to the quality of the secondary source of repayment. |
| | · | The possibility of loss is high but because of certain important pending factors which may strengthen the loan, loss classification is deferred until the exact status of repayment is known. |
Risk Grade 8 – Loss. Loans are considered uncollectible and of such little value that continuing to carry them as assets is not feasible. Loans will be classified Loss when it is neither practical nor desirable to defer writing off or reserving all or a portion of a basically worthless asset, even though partial recovery may be possible at some time in the future.
At March 31, 2013 and December 31, 2012, based upon the most recent analysis performed, the following table presents the Company’s loan portfolio credit risk profile by internally assigned grade disaggregated by class of loan (in thousands):
| | | Credit Risk Profile By Internally Assigned Grade | |
| March 31, 2013 | | Commercial and industrial | | | Commercial real estate | | | Real estate construction | | | Residential mortgages (1st and 2nd liens) | | | Home equity | | | Consumer | | | Total | |
| Grade: | | | | | | | | | | | | | | | | | | | | | |
| Pass | | $ | 163,819 | | | $ | 353,080 | | | $ | 5,283 | | | $ | 141,991 | | | $ | 62,949 | | | $ | 12,530 | | | $ | 739,652 | |
| Special mention | | | 4,969 | | | | 25,627 | | | | - | | | | - | | | | - | | | | - | | | | 30,596 | |
| Substandard | | | 18,987 | | | | 20,563 | | | | 8,792 | | | | 4,976 | | | | 514 | | | | 319 | | | | 54,151 | |
| Total | | $ | 187,775 | | | $ | 399,270 | | | $ | 14,075 | | | $ | 146,967 | | | $ | 63,463 | | | $ | 12,849 | | | $ | 824,399 | |
| | | | | | | | | | | | | | | | | | | | | | | | | | | | | |
| | | Credit Risk Profile By Internally Assigned Grade | |
| December 31, 2012 | | Commercial and industrial | | | Commercial real estate | | | Real estate construction | | | Residential mortgages (1st and 2nd liens) | | | Home equity | | | Consumer | | | Total | |
| Grade: | | | | | | | | | | | | | | | | | | | | | | | | | | | | |
| Pass | | $ | 143,804 | | | $ | 311,123 | | | $ | 4,790 | | | $ | 141,915 | | | $ | 65,966 | | | $ | 14,267 | | | $ | 681,865 | |
| Special mention | | | 5,995 | | | | 38,670 | | | | - | | | | - | | | | - | | | | - | | | | 44,665 | |
| Substandard | | | 18,910 | | | | 19,478 | | | | 10,679 | | | | 4,660 | | | | 502 | | | | 21 | | | | 54,250 | |
| Total | | $ | 168,709 | | | $ | 369,271 | | | $ | 15,469 | | | $ | 146,575 | | | $ | 66,468 | | | $ | 14,288 | | | $ | 780,780 | |
The Bank annually reviews the ratings on all commercial and industrial, commercial real estate and real estate construction loans greater than $1 million. Semi-annually, the Bank engages an independent third-party to review a significant portion of loans within these loan classes. Management uses the results of these reviews as part of its ongoing review process.
5. RETIREMENT PLAN
The Company’s retirement plan is noncontributory and covers substantially all eligible employees. The plan conforms to the provisions of the Employee Retirement Income Security Act of 1974, as amended, and the Pension Protection Act of 2006, which requires certain funding rules for defined benefit plans. The Company’s policy is to accrue for all pension costs and to fund the maximum amount allowable for tax purposes. Actuarial gains and losses that arise from changes in assumptions concerning future events are amortized over a period that reflects the long-term nature of pension expense used in estimating pension costs.
The Company accounts for its retirement plan in accordance with ASC 715, “Compensation – Retirement Benefits” and ASC 960, “Plan Accounting – Defined Benefit Pension Plans,” which require an employer that is a business entity and sponsors one or more single-employer defined benefit plans to recognize the funded status of a benefit plan in its statement of financial position; recognize as a component of other comprehensive income, net of tax, the gains or losses and prior service costs or credits that arise during the period but are not recognized as components of net periodic benefit cost; measure defined benefit plan assets and obligation as of the date of fiscal year-end statement of financial position (with limited exceptions); and disclose in the notes to financial statements additional information about certain effects of net periodic benefit cost for the next fiscal year that arise from delayed recognition of the gains or losses, prior service costs or credits, and transition asset and obligation. Plan assets and benefit obligations shall be measured as of the date of its statement of financial position and in determining the amount of net periodic benefit cost. The codification also requires an employer to use the same date for the measurement of plan assets as for the statement of condition.
On December 31, 2012, certain provisions of the Company’s retirement plan were changed which affected all participants in this plan and froze the participation of new entrants into the pension plan for all remaining employees in 2012. These changes froze the plan such that no additional pension benefits would accumulate.
The following table presents information concerning net periodic defined benefit pension (income) expense for the three months ended March 31, 2013 and 2012 (in thousands):
| | | Three Months Ended | |
| | | March 31, 2013 | | | March 31, 2012 | |
| Service cost | | $ | - | | | $ | 603 | |
| Interest cost | | | 498 | | | | 555 | |
| Expected return on plan assets | | | (575 | ) | | | (527 | ) |
| Net amortization | | | 61 | | | | 160 | |
| Net periodic benefit (income) expense | | $ | (16 | ) | | $ | 791 | |
In December 2012, the Company made an annual minimum contribution of $1 million for the plan year ending September 30, 2013. There is no additional minimum required contribution for the plan year ending September 30, 2013.
6. STOCK-BASED COMPENSATION
Under the terms of the Company’s stock option plans adopted in 1999 and 2009, options have been granted to key employees and directors to purchase shares of the Company’s stock. Under the 2009 Stock Incentive Plan (“the Plan”), there are 500,000 shares of the Company’s common stock reserved for issuance, of which 175,000 had been granted as of March 31, 2013. There are no remaining shares reserved for issuance under the 1999 Stock Option Plan. Options are awarded by the Compensation Committee of the Board of Directors. Both plans provide that the option price shall not be less than the fair value of the common stock on the date the option is granted. All options are exercisable for a period of ten years or less. Options granted prior to 2010 vest after one year. No options were granted in 2010. Options granted in 2011 are exercisable over a three-year period commencing three years from the date of grant at a rate of one third per year. Options granted in 2012 and 2013 are exercisable over a three-year period commencing one year from the date of grant at a rate of one third per year.
Both plans provide for but do not require the grant of stock appreciation rights (“SARs”) that the holder may exercise instead of the underlying option. At March 31, 2013, there were 6,000 SARs outstanding related to options granted before 2011. The SARs had no intrinsic value at March 31, 2013. When the SAR is exercised, the underlying option is canceled. The optionee receives shares of common stock or cash with a fair market value equal to the excess of the fair value of the shares subject to the option at the time of exercise (or the portion thereof so exercised) over the aggregate option price of the shares set forth in the option agreement. The exercise of SARs is treated as the exercise of the underlying option.
In 2011 the Company granted an award of 30,000 non-qualified stock options at an exercise price of $10.79 per share to its President and Chief Executive Officer as a material inducement to employment with the Company. The non-qualified options were not issued as part of any of the Company’s registered stock-based compensation plans. The options are exercisable over a three-year period commencing three years from the date of grant at a rate of one third per year.
A summary of stock option activity follows:
| | | | | | Weighted-Average | |
| | | Number | | | Exercise Price | |
| | | of Shares | | | Per Share | |
| Outstanding - January 1, 2013 | | | 211,500 | | | $ | 15.41 | |
| Granted | | | 25,000 | | | $ | 14.26 | |
| Exercised | | | - | | | | - | |
| Forfeited or expired | | | (25,333 | ) | | $ | 15.50 | |
| Outstanding - March 31, 2013 | | | 211,167 | | | $ | 15.26 | |
The following table presents information regarding stock options granted in 2013:
| Black-Scholes Assumptions for Options Granted During the Three Months Ended March 31, 2013: | |
| | | | |
| Risk-free interest rate | | | 0.81 | % |
| Expected dividend yield | | | - | |
| Expected life in years | | | 10 | |
| Expected volatility | | | 43.11 | % |
The following summarizes shares subject to purchase from stock options outstanding and exercisable as of March 31, 2013:
| | | | Outstanding | | | Exercisable | |
| | | | | | Weighted-Average | | | | | | | Weighted-Average | | | |
| Range of | | | | | Remaining | | Weighted-Average | | | | | Remaining | | Weighted-Average | |
| Exercise Prices | | | Shares | | Contractual Life | | Exercise Price | | | Shares | | Contractual Life | | Exercise Price | |
| $10.79 - $12.44 | | | | 100,000 | | 8.9 years | | $ | 11.49 | | | | 6,667 | | 8.9 years | | $ | 12.44 | |
| $13.13 - $14.97 | | | | 81,667 | | 9.3 years | | $ | 13.80 | | | | 20,001 | | 9.0 years | | $ | 13.34 | |
| $28.30 - $31.83 | | | | 15,000 | | 4.1 years | | $ | 30.24 | | | | 15,000 | | 4.1 years | | $ | 30.24 | |
| $32.90 - $34.95 | | | | 14,500 | | 2.9 years | | $ | 34.01 | | | | 14,500 | | 2.9 years | | $ | 34.01 | |
| | | | | 211,167 | | 8.3 years | | $ | 15.26 | | | | 56,168 | | 6.1 years | | $ | 23.08 | |
The Company accounts for stock-based compensation on a modified prospective basis with the fair value of grants of employee stock options recognized in the financial statements. Compensation expense related to stock-based compensation amounted to approximately $82 thousand and $27 thousand for the three months ended March 31, 2013 and 2012, respectively. The remaining unrecognized compensation cost of approximately $635 thousand at March 31, 2013 will be expensed over the remaining weighted average vesting period of 2.8 years.
7. INCOME TAXES
The Company uses an asset and liability approach to accounting for income taxes. The asset and liability approach requires the recognition of deferred tax assets and liabilities for the expected future tax consequences of temporary differences between the carrying amounts and the tax bases of assets and liabilities. Deferred tax assets are recognized if it is more likely than not that a future benefit will be realized. The Company accounts for income taxes in accordance with ASC 740, “Income Taxes,” which prescribes the recognition and measurement criteria related to tax positions taken or expected to be taken in a tax return. The Company had unrecognized tax benefits including interest of approximately $34 thousand as of March 31, 2013. The Company recognizes interest and penalties accrued relating to unrecognized tax benefits in income tax expense.
The realization of deferred tax assets (net of a recorded valuation allowance) is largely dependent upon future taxable income, future reversals of existing taxable temporary differences and the ability to carryback losses to available tax years. In assessing the need for a valuation allowance, the Company considers positive and negative evidence, including taxable income in carry-back years, scheduled reversals of deferred tax liabilities, expected future taxable income and tax planning strategies. The Company can apply a carryback of the net operating losses for 2012 which resulted in $5 million included in income tax receivable in the accompanying consolidated statements of condition. The Company has net operating loss carryforwards of approximately $13.9 million and $24.1 million for Federal and New York State (“NYS”) income tax purposes, respectively, which may be applied against future taxable income. In 2012, the Company established a full valuation reserve of $558 thousand, tax effected, on the NYS net operating loss due to the Company’s significant tax-exempt investment income in NYS. The valuation allowance may be reversed to income in future periods to the extent that the related deferred tax assets are realized or when the Company returns to consistent, taxable earnings in NYS. Management believes it is more likely than not that forecasted income, including income that may be generated as a result of certain tax planning strategies, together with the tax effects of the deferred tax liabilities, will be sufficient to fully recover the remaining deferred tax assets. Both the Federal and NYS unused net operating loss carryforwards are expected to expire in varying amounts in the year 2032. It is anticipated that the Federal carryforward will be utilized prior to its expiration based on the Company’s future years’ projected earnings.
8. REGULATORY MATTERS
The Company and the Bank are subject to various regulatory capital requirements administered by the federal banking agencies. Failure to meet minimum capital requirements can initiate certain mandatory and possibly additional discretionary actions by regulators that, if undertaken, could have a direct material effect on the Company’s financial statements. Under capital adequacy guidelines and the regulatory framework for prompt corrective action, the Company and the Bank must meet specific capital requirements that involve quantitative measures of the Company’s and the Bank’s assets, liabilities, and certain off-balance-sheet items calculated under regulatory accounting practices. The Company’s and the Bank’s capital amounts and the Bank’s classification are also subject to qualitative judgments by the regulators about components, risk weighting, and other factors.
Quantitative measures established by regulation to ensure capital adequacy require the Company and the Bank to maintain minimum amounts and ratios of total and Tier 1 capital, as defined in the federal banking regulations, to risk-weighted assets and of Tier 1 capital to adjusted average assets (leverage). Management believes, as of March 31, 2013, that the Company and the Bank met all such capital adequacy requirements to which it is subject.
The Bank’s capital amounts and ratios were as follows (dollars in thousands):
| | | | | | | | | Minimum | | | Minimum to be "Well | |
| | | | | | | | | for capital | | | Capitalized" under prompt | |
| | | Actual capital ratios | | | adequacy | | | corrective action provisions | |
| | | Amount | | | Ratio | | | Amount | | | Ratio | | | Amount | | | Ratio | |
| As of March 31, 2013 | | | | | | | | | | | | | | | | | | |
| Total capital to risk-weighted assets | | $ | 165,759 | | | | 17.53 | % | | $ | 75,625 | | | | 8.00 | % | | $ | 94,531 | | | | 10.00 | % |
| Tier 1 capital to risk-weighted assets | | | 153,865 | | | | 16.28 | % | | | 37,812 | | | | 4.00 | % | | | 56,719 | | | | 6.00 | % |
| Tier 1 capital to adjusted average assets (leverage) | | | 153,865 | | | | 9.77 | % | | | 62,997 | | | | 4.00 | % | | | 78,746 | | | | 5.00 | % |
| As of December 31, 2012 | | | | | | | | | | | | | | | | | | | | | | | | |
| Total capital to risk-weighted assets | | $ | 162,458 | | | | 18.05 | % | | $ | 72,020 | | | | 8.00 | % | | $ | 90,025 | | | | 10.00 | % |
| Tier 1 capital to risk-weighted assets | | | 151,121 | | | | 16.79 | % | | | 36,010 | | | | 4.00 | % | | | 54,015 | | | | 6.00 | % |
| Tier 1 capital to adjusted average assets (leverage) | | | 151,121 | | | | 9.74 | % | | | 62,092 | | | | 4.00 | % | | | 77,615 | | | | 5.00 | % |
The Company’s Tier 1 leverage, Tier 1 risk-based and total risk-based capital ratios were 9.83%, 16.37% and 17.63%, respectively, at March 31, 2013.
On October 25, 2010, the Bank, following discussion with the OCC entered into the Agreement. The Agreement requires the Bank to take certain actions to address issues identified by the OCC. As of March 31, 2013, management believes it has taken significant steps to satisfy the requirements of the Agreement.
Under the Agreement, the Bank is subject to individual minimum capital ratios (“IMCRs”) established by the OCC requiring Tier 1 leverage capital equal to at least 8.00% of adjusted average assets, Tier 1 risk-based capital equal to at least 10.50% of risk-weighted assets and total risk-based capital equal to at least 12.00% of risk-weighted assets. Management believes the Bank met all three IMCRs at March 31, 2013. Failure to meet minimum capital requirements can initiate certain mandatory and possibly additional discretionary actions by regulators that, if undertaken, could have a direct material effect on the Bank’s financial statements.
While subject to the Agreement, the Company expects that its and the Bank’s management and Board of Directors will be required to focus a substantial amount of time on complying with its terms. There is no guarantee that the Bank will be able to fully comply with the Agreement. If the Bank fails to comply with the terms of the Agreement, it could be subject to further regulatory enforcement actions.
The ability of the Bank to pay dividends to the Company is subject to certain regulatory restrictions. Generally, dividends declared in a given year by a national bank are limited to its net profit, as defined by regulatory agencies, for that year, combined with its retained net income for the preceding two years, less any required transfer to surplus or to fund the retirement of any preferred stock, of which the Bank had none as of March 31, 2013. In addition, a national bank may not pay any dividends in an amount greater than its undivided profits and a national bank may not declare any dividends if such declaration would leave the Bank inadequately capitalized. Therefore, the ability of the Bank to declare dividends will depend on its future net income and capital requirements. In addition, under the Agreement the Bank is required to establish a dividend policy that will permit the declaration of a dividend only when the Bank is in compliance with its capital program and with the prior written determination of no supervisory objection by the OCC.
9. FAIR VALUE
The Company records investments available for sale, loans held-for-sale, certain impaired loans, OREO and mortgage servicing rights at fair value. Fair value measurement is determined based on the assumptions that market participants would use in pricing the asset or liability in an exchange. The definition of fair value includes the exchange price which is the price in an orderly transaction between market participants to sell an asset or transfer a liability in the principal market for the asset or liability. Market participant assumptions include assumptions about risk, the risk inherent in a particular valuation technique used to measure fair value and/or the risk inherent in the inputs to the valuation technique, as well as the effect of credit risk on the fair value of liabilities. The Company uses three levels of the fair value inputs to measure assets, as described below.
Basis of Fair Value Measurement:
Level 1 – Valuations based on quoted prices in active markets for identical investments.
Level 2 – Valuations based on quoted prices in markets that are not active or for which all significant inputs are observable, either directly or indirectly. Level 2 inputs include: (i) quoted prices for similar investments in active markets, (ii) quoted prices for identical investments traded in non-active markets (i.e., dealer or broker markets) and (iii) inputs other than quoted prices that are observable or inputs derived from or corroborated by market data for substantially the full term of the investment.
Level 3 – Valuations based on inputs that are unobservable, supported by little or no market activity, and significant to the overall fair value measurement.
The types of instruments valued based on quoted market prices in active markets include most U.S. Treasury securities. Such instruments are generally classified within Level 1 and Level 2 of the fair value hierarchy. The Company does not adjust the quoted price for such instruments.
The types of instruments valued based on quoted prices in markets that are not active, broker or dealer quotations, or alternative pricing sources with reasonable levels of price transparency include U.S. Government agency securities, state and municipal obligations, MBS, CMOs and corporate bonds. Such instruments are generally classified within Level 2 of the fair value hierarchy.
The types of instruments valued based on significant unobservable inputs that reflect the Company’s own assumptions about the assumptions that market participants would use in pricing an asset or liability are generally classified within Level 3 of the fair value hierarchy.
ASC 820, “Fair Value Measurements and Disclosures,” presents requirements for measuring fair value and for disclosing information about fair value measurements, including a consistent meaning of the term “fair value.” ASC 820 provides additional guidance in determining fair values when the volume and level of activity for the asset or liability have significantly decreased, particularly when there is no active market or where the price inputs being used represent distressed sales. It also provides guidelines for making fair value measurements more consistent with principles, reaffirming the need to use judgment to ascertain if a formerly active market has become inactive and in determining fair values when markets become inactive.
The following table presents the carrying amounts and estimated fair values of the Company’s financial instruments (in thousands).
| | | Level in | | | March 31, 2013 | | | December 31, 2012 | |
| | | Fair Value | | | Carrying | | | Estimated | | | Carrying | | | Estimated | |
| | | Heirarchy | | | Amount | | | Fair Value | | | Amount | | | Fair Value | |
| Cash and due from banks | | Level 1 | | | $ | 302,529 | | | $ | 302,529 | | | $ | 384,656 | | | $ | 384,656 | |
| Cash equivalents | | Level 2 | | | | 1,150 | | | | 1,150 | | | | 1,150 | | | | 1,150 | |
| Federal Reserve Bank, Federal Home Loan Bank and other stock | | N/A | | | | 3,043 | | | | N/A | | | | 3,043 | | | | N/A | |
| Investment securities held to maturity | | Level 2 | | | | 7,871 | | | | 8,662 | | | | 8,035 | | | | 8,861 | |
| Investment securities available for sale | | Level 2 | | | | 413,277 | | | | 413,277 | | | | 402,353 | | | | 402,353 | |
| Loans held-for-sale | | Level 3 | | | | 2,494 | | | | 2,494 | | | | 907 | | | | 907 | |
| Loans, net of allowance | | Level 2, 3 (1) | | | | 806,565 | | | | 826,342 | | | | 762,999 | | | | 787,597 | |
| Accrued interest and loan fees receivable | | Level 2 | | | | 5,746 | | | | 5,746 | | | | 4,883 | | | | 4,883 | |
| Non-maturity deposits | | Level 2 | | | | 1,153,942 | | | | 1,153,942 | | | | 1,187,383 | | | | 1,187,383 | |
| Time deposits | | Level 2 | | | | 249,816 | | | | 251,423 | | | | 243,731 | | | | 245,595 | |
| Accrued interest payable | | Level 2 | | | | 235 | | | | 235 | | | | 237 | | | | 237 | |
(1) Impaired loans are generally classified within Level 3 of the fair value hierarchy.
Fair value estimates are made at a specific point in time and may be based on judgments regarding losses expected in the future, risk, and other factors that are subjective in nature. The methods and assumptions used to produce the fair value estimates follow.
Short-term financial instruments are valued at the carrying amounts included in the condensed consolidated statements of condition, which are reasonable estimates of fair value due to the relatively short term nature of the instruments. This approach applies to cash and cash equivalents, accrued interest and loan fees receivable, non-interest-bearing demand deposits, N.O.W., money market and saving deposits and accrued interest payable. Certificates of deposit are valued using a replacement cost of funds approach.
Fair values are estimated for portfolios of loans with similar characteristics. The fair value of performing loans was calculated by discounting projected cash flows through their estimated maturity using market discount rates that reflect the general credit and interest rate characteristics of the loan category. The maturity horizon is based on the Bank’s history of repayments for each type of loan and an estimate of the effect of current economic conditions. Fair value for significant non-performing loans is based on recent external appraisals of collateral, if any. If appraisals are not available, estimated cash flows are discounted using a rate commensurate with the associated risk. Assumptions regarding credit risk, cash flows, and discount rates are made using available market information and specific borrower information.
OREO properties are initially recorded at fair value, less estimated costs to sell when acquired, establishing a new cost basis. Adjustments to OREO are measured at fair value, less estimated costs to sell. Fair values are generally based on third party appraisals or realtor evaluations of the property. These appraisals and evaluations may utilize a single valuation approach or a combination of approaches including comparable sales and the income approach. Adjustments are routinely made in the appraisal process by the appraisers to adjust for differences between the comparable sales and income data available. Such adjustments are usually significant and typically result in a Level 3 classification. In cases where the carrying amount exceeds the fair value, less estimated costs to sell, an impairment loss is recognized through a valuation allowance, and the property is reported as non-recurring Level 3.
Loans identified as impaired are measured using one of three methods: the loan’s observable market price, the fair value of collateral or the present value of expected future cash flows. Those measured using the loan’s observable market price or the fair value of collateral are recorded at fair value. For each period presented, no impaired loans were measured using the loan’s observable market price. If an impaired loan has had a charge-off or if the fair value of the collateral is less than the recorded investment in the loan, the Company establishes a specific reserve and reports the loan as non-recurring Level 3. The fair value of collateral of impaired loans is generally based on recent real estate appraisals. These appraisals may utilize a single valuation approach or a combination of approaches including comparable sales and the income approach. Adjustments are routinely made in the appraisal process by the appraisers to adjust for differences between the comparable sales and income data available. Such adjustments are usually significant and typically result in a Level 3 classification of the inputs for determining fair value.
The fair value of loans held-for-sale is based upon binding contracts from third party investors.
The fair value of commitments to extend credit was estimated by either discounting cash flows or using the fees currently charged to enter into similar agreements, taking into account the remaining terms of the agreements and the current creditworthiness of the counter-parties. The estimated fair value of written financial guarantees and letters of credit is based on fees currently charged for similar agreements. The fees charged for the commitments were not material in amount.
Assets measured at fair value on a recurring basis are as follows (in thousands):
| | | | | | Fair Value Measurements Using | |
| | | | | | Significant Other | | | Significant | |
| | | | | | Observable Inputs | | | Unobservable Inputs | |
| Assets: | | March 31, 2013 | | | (Level 2) | | | (Level 3) | |
| U.S. Government Agency securities | | $ | 75,388 | | | $ | 75,388 | | | $ | - | |
| Corporate bonds | | | 18,854 | | | | 18,854 | | | | - | |
| Collateralized mortgage obligations | | | 66,104 | | | | 66,104 | | | | - | |
| Mortgage-backed securities | | | 86,379 | | | | 86,379 | | | | - | |
| Obligations of states and political subdivisions | | | 166,552 | | | | 166,552 | | | | - | |
| Loans held-for-sale | | | 2,494 | | | | - | | | | 2,494 | |
| Mortgage servicing rights | | | 2,039 | | | | - | | | | 2,039 | |
| Total | | $ | 417,810 | | | $ | 413,277 | | | $ | 4,533 | |
| | | | | | | | | | | | | |
| | | | | | | Fair Value Measurements Using | |
| | | | | | | Significant Other | | | Significant | |
| | | | | | | Observable Inputs | | | Unobservable Inputs | |
| Assets: | | December 31, 2012 | | | (Level 2) | | | (Level 3) | |
| U.S. Treasury Securities | | $ | 500 | | | $ | 500 | | | $ | - | |
| U.S. Government Agency securities | | | 65,078 | | | | 65,078 | | | | - | |
| Corporate bonds | | | 16,198 | | | | 16,198 | | | | - | |
| Collateralized mortgage obligations | | | 89,692 | | | | 89,692 | | | | - | |
| Mortgage-backed securities | | | 62,450 | | | | 62,450 | | | | - | |
| Obligations of states and political subdivisions | | | 168,435 | | | | 168,435 | | | | - | |
| Loans held-for-sale | | | 907 | | | | - | | | | 907 | |
| Mortgage servicing rights | | | 1,856 | | | | - | | | | 1,856 | |
| Total | | $ | 405,116 | | | $ | 402,353 | | | $ | 2,763 | |
Assets measured at fair value on a non-recurring basis are as follows (in thousands):
| | | | | | Fair Value Measurements Using | |
| | | | | | Significant | |
| | | | | | Unobservable | |
| | | | | | Inputs | |
| Assets: | | March 31, 2013 | | | (Level 3) | |
| Impaired loans | | $ | 9,805 | | | $ | 9,805 | |
| OREO | | | 372 | | | | 372 | |
| Total | | $ | 10,177 | | | $ | 10,177 | |
| | | | | | | | | |
| | | | | | | Fair Value Measurements Using | |
| | | | | | | Significant | |
| | | | | | | Unobservable | |
| | | | | | | Inputs | |
| Assets: | | December 31, 2012 | | | (Level 3) | |
| Impaired loans | | $ | 9,390 | | | $ | 9,390 | |
| OREO | | | 1,572 | | | | 1,572 | |
| Total | | $ | 10,962 | | | $ | 10,962 | |
10. LEGAL PROCEEDINGS
On July 11, 2011, a shareholder derivative action, Robert J. Levy v. J. Gordon Huszagh, et al., No. 11 Civ. 3321 (JS), was filed in the U.S. District Court for the Eastern District of New York against certain current and former directors of the Company and a former officer of the Company. The Company was named as a nominal defendant. The complaint seeks damages against the individual defendants in an unspecified amount, and alleges that the individual defendants breached their fiduciary duties by making improper statements regarding the sufficiency of the Company’s allowance for loan losses and loan portfolio credit quality, and by failing to establish sufficient allowances for loan losses and to establish effective credit risk management policies. On September 30, 2011, the Company and the current and former director defendants filed a motion to dismiss the complaint. On September 28, 2012, the court granted the motion to dismiss and granted the plaintiff leave to file an amended complaint. On April 22, 2013, the parties filed a joint status report informing the court that they had reached an agreement in principle for the joint settlement of this action and the Forbush action, described below. Management does not believe that the ultimate resolution of this matter will have a material adverse impact on the consolidated financial statements.
On October 28, 2011, a separate shareholder derivative action, Susan Forbush v. Edgar F. Goodale, et al., No. 33538/11, was filed in the Supreme Court of the State of New York for the County of Suffolk, against certain current and former directors of the Company and a former officer of the Company. The Company was named as a nominal defendant. The complaint asserts claims that are substantially similar to those asserted in the Levy action. On February 17, 2012, the defendants filed a motion to dismiss the complaint. On February 4, 2013, the Supreme Court denied the defendants’ motion to dismiss. On April 24, 2013, the plaintiff informed the court that the parties had reached an agreement in principle for the joint settlement of this action and the Levy action, described above. Management does not believe that the ultimate resolution of this matter will have a material adverse impact on the consolidated financial statements.
On October 20, 2011, a putative shareholder class action, James E. Fisher v. Suffolk Bancorp, et al., No. 11 Civ. 5114 (SJ), was filed in the U.S. District Court for the Eastern District of New York against the Company, its former chief executive officer, and a former chief financial officer of the Company. The complaint alleges that the defendants violated Sections 10(b) and 20(a) of the Securities Exchange Act of 1934 by knowingly or recklessly making false statements about, or failing to disclose accurate information about, the Company’s financial results and condition, loan loss reserves, impaired assets, internal and disclosure controls, and banking practices. The complaint seeks damages in an unspecified amount on behalf of purchasers of the Company’s common stock between March 12, 2010 and August 10, 2011. On October 15, 2012, the defendants filed a motion to dismiss the complaint. On April 8, 2013, the parties entered into an agreement to settle the action, subject to the approval of the court, and on April 10, 2013, the lead plaintiff filed an unopposed motion requesting the court’s preliminary approval of the settlement. The motion remains pending. Management does not believe that the ultimate resolution of this matter will have a material adverse impact on the consolidated financial statements.
It is not possible at the current phases of these lawsuits to ascertain whether there is a reasonable possibility of a loss from these matters. Therefore we have concluded that an amount for a loss contingency is not to be accrued or disclosed at this time. The Company believes that it has substantial defenses to the claims filed against it in these lawsuits and, to the extent that these actions proceed, the Company intends to defend itself vigorously.
The SEC’s New York regional office has formally requested certain loan files, other records and information from the Company, and the Company is in the process of providing this information. The SEC has not asserted that any federal securities law violation has occurred. The Company believes it is in compliance with all federal securities laws and is cooperating with the SEC’s inquiry.
ITEM 2. - MANAGEMENT’S DISCUSSION AND ANALYSIS OF FINANCIAL CONDITION AND RESULTS OF OPERATIONS
Safe Harbor Statement Pursuant to the Private Securities Litigation Reform Act of 1995 - Certain statements contained in this discussion are “forward-looking statements” within the meaning of the Private Securities Litigation Reform Act of 1995. These can include remarks about the Company, the banking industry, the economy in general, expectations of the business environment in which the Company operates, projections of future performance, and potential future credit experience. These remarks are based upon current management expectations, and may, therefore, involve risks and uncertainties that cannot be predicted or quantified and are beyond the Company’s control and are subject to a variety of uncertainties that could cause future results to vary materially from the Company’s historical performance, or from current expectations. These remarks may be identified by such forward-looking statements as “should,” “expect,” “believe,” “view,” “opportunity,” “allow,” “continues,” “reflects,” “typically,” “usually,” “anticipate,” or similar statements or variations of such terms. Factors that could affect the Company include particularly, but are not limited to: a failure by the Company to meet the deadlines under SEC rules for filing its periodic reports (or any permitted extension thereof); increased capital requirements mandated by the Company’s regulators; the Company’s ability to raise capital; changes in interest rates; increases or decreases in retail and commercial economic activity in the Company’s market area; variations in the ability and propensity of consumers and businesses to borrow, repay, or deposit money, or to use other banking and financial services; results of regulatory examinations; any failure by the Company to comply with the Agreement or the individual minimum capital ratios for the Bank established by the OCC; the cost of compliance with the Agreement; any failure by the Company to maintain effective internal control over financial reporting; larger-than-expected losses from the sale of assets; potential litigation or regulatory action relating to the matters resulting in the Company’s failure to file on time its Quarterly Report on Form10-Q for the quarters ended March 31, 2011, June 30, 2011, and September 30, 2011 or resulting from the revisions to earnings previously announced on April 12, 2011 or the restatement of its financial statements for the quarterly period ended September 30, 2010 and year ended December 31, 2010; and the potential that net charge-offs are higher than expected or for further increases in our provision for loan losses. Further, it could take the Company longer than anticipated to implement its strategic plans to increase revenue and manage non-interest expense, or it may not be possible to implement those plans at all. Finally, new and unanticipated legislation, regulation, or accounting standards may require the Company to change its practices in ways that materially change the results of operations. We have no obligation to update any forward-looking statements to reflect events or circumstances after the date of this document. For more information, see the risk factors described in the Company’s Annual Report on Form 10-K and other filings with the Securities and Exchange Commission.
Non-GAAP Disclosure - This discussion includes a non-GAAP financial measure of the Company’s tangible common equity ratio. A non-GAAP financial measure is a numerical measure of historical or future financial performance, financial position or cash flows that excludes or includes amounts that are required to be disclosed in the most directly comparable measure calculated and presented in accordance with GAAP. The Company believes that this non-GAAP financial measure provides both management and investors a more complete understanding of the underlying operational results and trends and the Company’s marketplace performance. The presentation of this additional information is not meant to be considered in isolation or as a substitute for the numbers prepared in accordance with GAAP.
Executive Summary - The Company is a one-bank holding company engaged in the commercial banking business through the Bank, a full-service commercial bank headquartered in Riverhead, New York. Organized in 1890, the Bank has 30 branch offices in Suffolk County, New York, and is a wholly owned subsidiary of the Company. The Bank offers a full line of domestic commercial and retail banking services and wealth management services. The Bank’s primary lending area includes all of Suffolk County and to a limited degree the adjacent markets of Nassau County and New York City. The Bank makes commercial real estate floating and fixed rate loans, commercial and industrial loans to small manufacturers, wholesalers, builders, farmers, and retailers, including dealer financing. The Bank serves as an indirect lender to the customers of a number of automobile dealers. The Bank also makes loans secured by residential mortgages, and both fixed and floating rate second mortgage loans with a variety of plans for repayment. Real estate construction loans are also offered. In order to expand the Company geographically into western Suffolk and Nassau Counties and to diversify the lending business of the Company, a new loan production office was opened in Melville in 2012. Seasoned banking professionals have joined the Company to exploit the opportunity available in the local marketplace to augment both interest and fee income through the origination of commercial and industrial loans, the generation of high quality multi-family and jumbo mortgages to be retained in the portfolio and conforming mortgages for sale in secondary markets. The Bank finances most of its activities with deposits, including demand, saving, N.O.W. and money market deposits, as well as time deposits. It may also rely on other sources of funds, including inter-bank overnight loans.
The Agreement with the OCC - The Agreement requires the Bank to take certain actions, and set forth below are the requirements of the Agreement along with a description of the actions taken by the Bank to date to satisfy the requirements. References to “Article” are to those sections of the Agreement setting forth the specific requirements for the issue being addressed.
| 1. | Create a Compliance Committee which is to meet at least monthly to monitor and coordinate the Bank’s adherence to the provisions of the Agreement and make monthly reports to the Board of Directors. |
The Bank has created a Compliance Committee consisting of members of the Board of Directors and of management which meets at least monthly to monitor and coordinate the Bank’s adherence to the provisions of the Agreement. The Compliance Committee makes monthly reports to the Board.
| 2. | Ensure the Bank has competent management in certain officer positions to carry out the Board’s policies, ensure compliance with the Agreement, applicable laws, rules and regulations and manage the daily operations of the Bank. |
Upon receipt of the Agreement, the Board of Directors engaged qualified independent consultants to assist with compliance with the Agreement, including an assessment of key management roles. The Board has evaluated management and subsequently several strategic hires were made to ensure competent management. (See staffing plan discussed in number 3 below.)
| 3. | Develop a staffing plan that is consistent with the goals and objectives established in the Bank’s strategic plan that addresses the workload requirements and maintenance of an effective control environment. |
A comprehensive staffing plan was established following receipt of the Agreement. Since that time, the Bank has hired qualified management to fill certain key positions and has made other staffing and organization changes to effectively manage the operations of the Bank consistent with the Bank’s strategic plan. Steps taken by the Bank include:
| | - | Hired a new, qualified, and highly-experienced President and Chief Executive Officer effective December 31, 2011. |
| | - | Hired a new, qualified, and highly-experienced Chief Credit Officer during the first quarter of 2013. |
| | - | Hired a new, qualified, highly-experienced Chief Lending Officer during the first quarter of 2012. |
| | - | During the first quarter of 2012, hired a qualified and highly-experienced Chief Financial Officer with sufficient knowledge of U.S. GAAP, regulatory accounting and the banking industry and the skills to implement this knowledge. |
| | - | Improved credit function by hiring a new loan administrator, additional underwriting staff and a loan workout specialist. |
| | - | During the first quarter of 2012, hired a qualified and highly-experienced Comptroller with sufficient knowledge of U.S. GAAP, regulatory accounting and the banking industry and the skills to implement this knowledge. |
| | - | During the second quarter of 2012, hired a qualified and highly experienced General Counsel and Corporate Secretary with prior experience as general counsel of publicly held financial institutions. |
| | - | Appointed a Vice Chairman of the Board of Directors, who was subsequently named Chairman in May 2012, to provide daily oversight of management on behalf of the full Board and to communicate back to the Board. |
| | - | During the third quarter of 2012, created and filled the position of Financial Reporting Manager with experience in regulatory and SEC reporting. |
| | - | Created and filled the position of Treasurer to further relieve the Chief Financial Officer of day-to-day duties in asset liability management, investment portfolio management, and additional treasury functions. |
| | - | Outsourced the internal audit function to a qualified risk management firm to provide greater independence and depth to the function. |
| | - | This plan is updated annually. |
All key executive and senior management positions necessary to carry out the Board’s policies and to ensure compliance with the Agreement, applicable laws, rules and regulations and manage the daily operations of the Bank have been filled.
| 4. | Adopt, implement, and thereafter ensure adherence to a three year written strategic plan. |
A three year strategic plan incorporating all required elements of this Article, including monitoring of adherence to the strategic plan, has been approved and adopted by the Board of Directors. This plan is updated annually.
| 5. | Develop, implement, and thereafter ensure adherence to a three year capital program. |
A three year capital program incorporating all required elements of this Article, including monitoring of adherence to the capital program, has been approved and adopted by the Board of Directors. This plan is updated annually.
| 6. | Adopt, implement, and thereafter ensure adherence to an independent internal audit program. |
Management has outsourced the internal audit function to a qualified risk management firm to provide greater independence and depth to the function. The Bank’s internal auditors meet regularly with the Audit Committee of the Board of Directors. The Audit Committee monitors internal audit activities, the results of audits and the tracking of action plans for corrective actions of findings.
| 7. | Implement and adhere to a written program for the maintenance of an adequate Allowance for Loan Losses. |
The Bank has developed and implemented a written program for the maintenance of an adequate Allowance for Loan Losses. The Bank has devoted substantial management resources to this area. An Allowance for Loan Losses Committee has been established that meets quarterly to discuss and review the Bank’s computed Allowance for Loan Losses, which is then presented to the Board of Directors. Technology solutions have been implemented to provide more robust measuring and reporting tools. The program developed is consistent with OCC guidelines and current U.S. GAAP standards and incorporates all elements required by the Agreement.
| 8. | Develop, implement and thereafter ensure adherence to a written program to ensure compliance with the appraisal and evaluation requirements for loans and OREO. |
The Bank has developed and implemented a written program to ensure compliance with the appraisal and evaluation requirements for loans and OREO.
| 9. | Develop, implement and thereafter ensure adherence to a written program to improve credit risk management processes and practices to reduce the high level of credit risk in the Bank. |
The Bank has developed and implemented a written program to improve its credit risk management process and practices to reduce the high level of credit risk in the Bank. The program is consistent with OCC guidelines and incorporates all elements required by the Agreement. Steps taken by the Bank include:
| | - | Reorganized the credit department to ensure appropriate separation of duties and developed expanded training for lenders. |
| | - | Hired a senior credit officer to run a newly created separate loan review and workout department. |
| | - | Changed the Bank’s credit policy to require identification of concentrations of risk, analysis of our customer’s global cash flows, reappraisal and re-evaluation of collateral, more accurate and timely credit-risk rating procedures and improved underwriting processes and standards. |
| | - | Incorporated the results of a systematic re-appraisal of commercial real estate which secures loans in excess of $1 million. |
| | - | Engaged qualified outside consultants to assist in re-evaluating risk ratings. |
| | - | Improved the processes for identifying loans and the determination of the amount of impairment. |
| | - | Augmented the Bank’s credit policy to govern loan workout. |
| | - | Implemented a new procedure to ensure that OREO was accounted for in accordance with U.S. GAAP. |
| | - | Adopted additional management reports to enhance monitoring. |
| 10. | Adopt, implement and thereafter ensure adherence to a written asset diversification program. |
The Bank has adopted and implemented a written asset diversification program which is reviewed quarterly by management and the Board of Directors.
| 11. | Develop, implement and thereafter ensure adherence to a written program of policies and procedures, staffing and training to provide for compliance with the Bank Secrecy Act. |
The Bank has developed and implemented a written program of policies and procedures, staffing and training to provide for compliance with the Bank Secrecy Act.
| 12. | Review and revise the contingency funding plan. |
The Bank has reviewed and revised its contingency funding plan.
| 13. | Adopt, implement and thereafter ensure adequate management reports that enable the Board and management to monitor the Bank’s liquidity position on a monthly basis. |
The Bank has adopted and implemented adequate management reports that enable the Board of Directors and management to monitor the Bank’s liquidity position on a monthly basis.
| 14. | Develop, implement and thereafter ensure adherence to a comprehensive, written information security program to ensure the safety and soundness of its operations to support the Bank’s efforts to safeguard customer information. |
The Bank has developed and implemented a comprehensive, written information security program to ensure the safety and soundness of its operations to support the Bank’s efforts to safeguard customer information.
Management and the Board of Directors are committed to taking all necessary actions to promptly address the requirements of the Agreement, and believe that the Bank has made significant progress in addressing these requirements.
Financial Performance of the Company - As of March 31, 2013, the Company, on a consolidated basis, had total assets of $1.6 billion, total deposits of $1.4 billion and stockholders’ equity of $166 million. The Company recorded net income of $2.7 million, or $0.23 per diluted common share, for the first quarter of 2013, compared to net income of $1.2 million, or $0.12 per diluted common share, for the first quarter of 2012. The improvement in first quarter 2013 earnings versus the comparable 2012 period resulted from a $1.1 million increase in non-interest income, an $804 thousand reduction in total operating expenses and a lower effective tax rate in 2013. The higher level of non-interest income resulted principally from improvements in net gain on the sale of portfolio loans, net gain on the sale of securities available for sale and net gain on the sale of mortgage loans originated for sale during the first quarter of 2013. The reduction in operating expenses versus 2012 was due to lower pension costs in 2013 resulting from a freezing of the Company’s defined benefit plan at year-end 2012, lower accounting and auditing fees and reductions in consulting and professional services, marketing and telecom expenses. Partially offsetting these positive factors was a $532 thousand (3.7%) reduction in net interest income resulting from a 32 basis point narrowing of the net interest margin to 3.95% in 2013.
The Company’s return on average assets and return on average common stockholders’ equity were 0.69% and 6.69%, respectively, for the first quarter of 2013 and 0.31% and 3.43%, respectively, for the first quarter of 2012. The Company’s net interest margin decreased by 32 basis points to 3.95% for the first quarter of 2013 from 4.27% for the first quarter of 2012. The decrease in the net interest margin was due to the continued low level of interest rates and a shift in the Company’s balance sheet mix from loans into lower-yielding overnight interest-bearing deposits due principally to loan workout activity. Generally, the Company’s net interest margin is impacted not only by the average balance and mix of the Company’s interest-earning assets and interest-bearing liabilities, but also by the level of market interest rates. These rates are significantly influenced by the actions of the Federal Open Market Committee of the Board of Governors of the Federal Reserve System (the “FOMC”) policy makers.
Financial Performance Summary
As of or for the quarters ended March 31, 2013 and 2012
(dollars in thousands, except per share data)
| | | Quarters ended March 31, | |
| | | | | | | | | Over/ | |
| | | | | | | | | (under) | |
| | | 2013 | | | 2012 | | | 2012 | |
| Revenue (1) | | $ | 16,993 | | | $ | 16,463 | | | | 3.2 | % |
| Operating expenses | | $ | 13,801 | | | $ | 14,605 | | | | (5.5 | %) |
| Provision for loan losses | | $ | - | | | $ | - | | | | - | |
| Net income | | $ | 2,709 | | | $ | 1,168 | | | | 131.9 | % |
| Net income per common share - diluted | | $ | 0.23 | | | $ | 0.12 | | | | 95.2 | % |
| Return on average assets | | | 0.69 | % | | | 0.31 | % | | | 38 | bp |
| Return on average stockholders' equity | | | 6.69 | % | | | 3.43 | % | | | 326 | bp |
| Tier 1 leverage ratio | | | 9.83 | % | | | 8.76 | % | | | 107 | bp |
| Tier 1 risk-based capital ratio | | | 16.37 | % | | | 13.14 | % | | | 323 | bp |
| Total risk-based capital ratio | | | 17.63 | % | | | 14.42 | % | | | 321 | bp |
| Tangible common equity ratio (non-GAAP) | | | 10.23 | % | | | 9.02 | % | | | 121 | bp |
bp - denotes basis points; 100 bp equals 1%.
(1) Represents net interest income plus total non-interest income.
The Company’s core deposit franchise continues to be among the best in the region. Core deposits, consisting of demand, N.O.W., saving and money market deposits, totaled $1.2 billion at March 31, 2013 and represented 82% of total deposits at that date. Demand deposits alone totaled $558 million at March 31, 2013 and represented 40% of total deposits at that date. The deposit product mix continues to be a primary strength of the Company and resulted in a total cost of funds of approximately 22 basis points during the first quarter of 2013.
The Company experienced quarter over quarter growth in our total loan portfolio of $43 million, from $781 million at December 31, 2012 to $824 million at March 31, 2013, a 5.6% quarterly growth rate. With the sales of $85 million in non-performing and other criticized and classified loans and $25 million capital raise in 2012 and now behind us, the Company has strengthened its overall financial position. The management team worked hard to put the people, systems and processes in place to position the Company for growth. As we continue to diversify our lending focus into a more balanced mix of products and expand west from the eastern end of Long Island, we believe there are many opportunities for us in attractive markets. By gradually redeploying our current cash position into higher-yielding, high quality loans and other interest-earning assets, and focusing our efforts on expense reductions going forward, management of the Company believes we can achieve improved financial results in future periods.
Critical Accounting Policies, Judgments and Estimates - The Company’s accounting and reporting policies conform to U.S. GAAP and general practices within the financial services industry. The preparation of the financial statements in conformity with U.S. GAAP requires management to make estimates and assumptions that affect the amounts reported in the financial statements and the accompanying notes. Actual results could differ from those estimates.
Allowance for Loan Losses - In management’s opinion, one of the most critical accounting policies impacting the Company’s financial statements is the evaluation of the allowance for loan losses. The allowance for loan losses is a valuation allowance for probable incurred losses, increased by the provision for loan losses and recoveries, and decreased by loan charge-offs. For all classes of loans, when a loan, in full or in part, is deemed uncollectible, it is charged against the allowance for loan losses. This happens when the loan is past due and the borrower has not shown the ability or intent to make the loan current, or the borrower does not have sufficient assets to pay the debt, or the value of the collateral is less than the balance of the loan and is not considered likely to improve soon. The allowance for loan losses is determined by a continuous analysis of the loan portfolio. Such analysis includes changes in the size and composition of the portfolio, the Company’s own historical loan losses, industry-wide losses, current and anticipated economic trends, and details about individual loans. It also includes estimates of the actual value of collateral, other possible sources of repayment and estimates that are susceptible to significant changes due to changes in appraisal values of collateral, national and regional economic conditions and other relevant factors. All non-accrual loans over $250 thousand in the commercial and industrial, commercial real estate and real estate construction loan classes and all TDRs are evaluated individually for impairment. Management will use judgment to determine if there are other loans outside of these two categories that fit the definition of impaired. All other loans are generally evaluated as homogeneous pools with similar risk characteristics. In assessing the adequacy of the allowance for loan losses, management reviews the loan portfolio by separate classes that have similar risk and collateral characteristics; e.g., commercial and industrial, commercial real estate, real estate construction, residential mortgages (1st and 2nd liens), home equity and consumer loans.
The allowance for loan losses consists of specific and general components. The specific component relates to loans that are individually classified as impaired. Specific reserves are established based on an analysis of the most probable sources of repayment and liquidation of collateral. Impaired loans that are collateral dependent are reviewed based on their collateral and the estimated time required to recover the Company’s investment in the loans, as well as the cost of doing so, and the estimate of the recovery. Non-collateral dependent impaired loans are reviewed based on the present value of estimated future cash flows, including balloon payments, if any, using the loan’s effective interest rate. While every non-performing loan is evaluated individually, not every loan requires a specific reserve. Specific reserves fluctuate based on changes in the underlying loans, anticipated sources of repayment, and charge-offs. The general component covers non-impaired loans and is based on historical loss experience for each loan class from a rolling twelve quarter period and modifying those percentages, if necessary, after adjusting for current qualitative and environmental factors that reflect changes in the collectability of the loan class not captured by historical loss data. These factors augment actual loss experience and help estimate the probability of loss within the loan portfolio based on emerging or inherent risk trends. These qualitative factors are applied as an adjustment to historical loss rates and require judgments that cannot be subjected to exact mathematical calculation. There are no formulas for translating them into a specific basis point adjustment of the Company’s historical loss rate for a pool of loans having similar risk characteristics. These adjustments reflect management’s overall estimate of the extent to which current losses on a pool of loans will differ from historical loss experience. These adjustments are subjective estimates and management reviews them on a quarterly basis. TDRs are also considered impaired with impairment generally measured at the present value of estimated future cash flows using the loan’s effective interest rate at inception or using the fair value of collateral, less estimated costs to sell, if repayment is expected solely from the collateral.
Deferred Tax Assets and Liabilities – Deferred tax assets and liabilities are the expected future tax consequences of temporary differences between the carrying amounts and the tax bases of assets and liabilities, computed using enacted tax rates. Deferred tax assets are recognized if it is more likely than not that a future benefit will be realized. A valuation allowance, if needed, reduces deferred tax assets to the amount expected to be realized. The realization of deferred tax assets (net of a recorded valuation allowance) is largely dependent upon future taxable income, future reversals of existing taxable temporary differences and the ability to carryback losses to available tax years. In assessing the need for a valuation allowance, the Company considers all relevant positive and negative evidence, including taxable income in carryback years, scheduled reversals of deferred tax liabilities, expected future taxable income and available tax planning strategies.
OTTI of Investment Securities – Management evaluates securities for OTTI on at least a quarterly basis, and more frequently when economic or market conditions warrant such an evaluation. For securities in an unrealized loss position, management considers the extent and duration of the unrealized loss, and the financial condition and near-term prospects of the issuer. Management also assesses whether it intends to sell, or it is more likely than not that it will be required to sell, a security in an unrealized loss position before recovery of its amortized cost basis. If either of the criteria regarding intent or requirement to sell is met, the entire difference between amortized cost and fair value is recognized as impairment through earnings. For debt securities that do not meet the aforementioned criteria, the amount of impairment is split into two components as follows: 1) OTTI related to credit loss, which must be recognized in the statement of operations and 2) OTTI related to other factors, which is recognized in other comprehensive income (loss). The credit loss is defined as the difference between the present value of the cash flows expected to be collected and the amortized cost basis. For equity securities, the entire amount of impairment is recognized through earnings.
Material Changes in Financial Condition - Total assets of the Company were $1.6 billion at March 31, 2013. When compared to December 31, 2012, total assets decreased by $29 million. This change primarily reflects a decline in cash and cash equivalents of $82 million, partially offset by increases in loans and investment securities of $43 million and $11 million, respectively. These movements largely reflect the redeployment of lower-yielding overnight interest-bearing deposits into loans and, secondarily, into investment securities. Total loans were $824 million at March 31, 2013 as compared to $781 million at December 31, 2012. Total investment securities increased to $421 million at March 31, 2013 from $410 million at December 31, 2012.
The increase in the loan portfolio largely reflects growth of multifamily and commercial and industrial loans of $26 million and $19 million, respectively, during the first quarter of 2013. The increase in the investment portfolio largely reflects purchases of mortgage-backed securities of U.S. Government-sponsored enterprises and U.S. Government agency securities of $25 million and $15 million, respectively, during the first quarter of 2013. These were partially offset by sales and prepayments of CMOs totaling $26 million during the same 2013 period.
At March 31, 2013, total deposits were $1.4 billion, a decrease of $27 million when compared to December 31, 2012. This decrease was primarily due to lower demand deposit balances of $57 million, partially offset by growth in saving, N.O.W. and money market deposits of $24 million. Although core deposit balances, which consist of demand, saving, N.O.W. and money market deposits, decreased $33 million during the first quarter of 2013, such balances represented 82% of total deposits at March 31, 2013 as compared to 83% at December 31, 2012. Demand deposit balances decreased during the first quarter of 2013, but represented 40% of total deposits at March 31, 2013 versus 43% at December 31, 2012. The Company had no borrowed funds outstanding at either March 31, 2013 or December 31, 2012.
Liquidity and Capital Resources - Liquidity management is defined as both the Company’s and the Bank’s ability to meet their financial obligations on a continuous basis without material loss or disruption of normal operations. These obligations include the withdrawal of deposits on demand or at their contractual maturity, the repayment of borrowings as they mature, funding new and existing loan commitments and the ability to take advantage of business opportunities as they arise. Asset liquidity is provided by short-term investments and the marketability of securities available for sale. The Company may also leave excess reserve balances at the Federal Reserve Bank (“FRB”) if the rate being paid is higher than would be available from other short-term investments. Liquid assets, consisting of federal funds sold, securities available for sale and balances at the FRB, were $680 million at March 31, 2013 compared to $706 million at December 31, 2012. These liquid assets may include assets that have been pledged against municipal deposits or other short-term borrowings. Liquidity is also provided by the maintenance of a base of core deposits, maturing short-term assets including cash and due from banks, the ability to sell or pledge marketable assets and access to lines of credit.
Liquidity is continuously monitored, thereby allowing management to better understand and react to emerging balance sheet trends, including temporary mismatches with regard to sources and uses of funds. After assessing actual and projected cash flow needs, management seeks to obtain funding at the most economical cost. These funds can be obtained by converting liquid assets to cash or by attracting new deposits or other sources of funding. Many factors affect the Company’s ability to meet liquidity needs, including variations in the markets served, loan demand, its asset/liability mix, its reputation and credit standing in its markets and general economic conditions. Borrowings and the scheduled amortization of investment securities and loans are more predictable funding sources. Deposit flows and securities prepayments are somewhat less predictable as they are often subject to external factors. Among these are changes in the local and national economies, competition from other financial institutions and changes in market interest rates.
The Company’s primary sources of funds are cash provided by deposits and borrowings, proceeds from maturities and sales of securities available for sale, and cash provided by operating activities. At March 31, 2013, total deposits were $1.4 billion, a decrease of $27 million when compared to December 31, 2012. Of the total time deposits at March 31, 2013, $207 million are scheduled to mature within the next 12 months. At March 31, 2013 and December 31, 2012, there were no borrowings outstanding. Based on historical experience, the Company expects to be able to replace a substantial portion of those maturing deposits. For the three months ended March 31, 2013 and 2012, proceeds from sales and maturities of securities available for sale totaled $17 million and $30 million, respectively.
The Company’s primary uses of funds are for the origination of loans and the purchase of investment securities. For the three months ended March 31, 2013, the Company had net loan originations for portfolio of $48 million compared to net loan repayments of $30 million for the same period in 2012. The Company purchased investment securities totaling $49 million and $30 million during the three months ended March 31, 2013 and 2012, respectively.
The Company strives to maintain an efficient level of capital, commensurate with its risk profile, on which a competitive rate of return to stockholders will be realized over both the short and long term. Capital is managed to enhance stockholder value while providing flexibility for management to act opportunistically in a changing marketplace. Management continually evaluates the Company’s capital position in light of current and future growth objectives and regulatory guidelines. Total stockholders’ equity amounted to $166 million at March 31, 2013 and $164 million at December 31, 2012, the increase reflecting the Company’s net income for the first quarter of 2013.
The Company’s tangible common equity ratio was 10.23% at March 31, 2013 compared to 9.96% at December 31, 2012 and 9.02% at March 31, 2012. The ratio of tangible common equity to tangible assets, or TCE ratio, is calculated by dividing total common stockholders’ equity by total assets, after reducing both amounts by intangible assets. The TCE ratio is not required by GAAP or by applicable bank regulatory requirements, but is a metric used by management to evaluate the adequacy of our capital levels. Since there is no authoritative requirement to calculate the TCE ratio, our TCE ratio is not necessarily comparable to similar capital measures disclosed or used by other companies in the financial services industry. Tangible common equity and tangible assets are non-GAAP financial measures and should be considered in addition to, not as a substitute for or superior to, financial measures determined in accordance with GAAP or as required by bank regulatory agencies. Set forth below are the reconciliations of tangible common equity to GAAP total common stockholders’ equity and tangible assets to GAAP total assets at March 31, 2013 (in thousands):
| Total stockholders' equity | | $ | 165,556 | |
| Less: intangible assets | | | (2,853 | ) |
| Tangible common equity | | $ | 162,703 | |
| | | | | |
| Total assets | | $ | 1,593,926 | |
| Less: intangible assets | | | (2,853 | ) |
| Tangible assets | | $ | 1,591,073 | |
The Company’s Tier 1 leverage, Tier 1 risk-based and total risk-based capital ratios were 9.83%, 16.37% and 17.63%, respectively, at March 31, 2013. The Company’s capital ratios exceeded all regulatory requirements at March 31, 2013.
The Bank’s Tier I leverage, Tier I risk-based and total risk-based capital ratios were 9.77%, 16.28% and 17.53%, respectively, at March 31, 2013. Each of these ratios exceeds the regulatory guidelines for a “well capitalized” institution, the highest regulatory capital category. Each of these ratios also exceeds the IMCRs established by the OCC requiring the Bank to maintain Tier 1 leverage, Tier 1 risk-based and total risk-based capital ratios of at least 8.00%, 10.50% and 12.00%, respectively.
The Company did not repurchase any shares of its common stock during the first quarter of 2013 under the existing stock repurchase plan. Repurchase of shares will occur only if management believes that the purchase will be at prices that are accretive to earnings per share and is the most efficient use of the Company’s capital.
Off-Balance Sheet Arrangements - The Bank is a party to financial instruments with off-balance sheet risk in the normal course of business to meet the financing needs of its customers. These financial instruments include commitments to extend credit and standby and documentary letters of credit. Those instruments involve, to varying degrees, elements of credit risk in excess of the amount recognized in the consolidated financial statements. The Bank uses the same credit policies in making commitments and conditional obligations as it does for on-balance sheet instruments.
Commitments to extend credit are agreements to lend to a customer as long as there is no violation of any condition established in the contract. Commitments generally have fixed expiration dates or other termination clauses and may require payment of a fee. Since many of the commitments are expected to expire without being drawn upon, the total commitment amounts do not necessarily represent future cash requirements. The Bank evaluates each customer’s creditworthiness on a case-by-case basis. The amount of collateral obtained, if deemed necessary by the Bank upon extension of credit, is based on management’s credit evaluation of the customer. Collateral required varies, but may include accounts receivable, inventory, equipment, real estate and income-producing commercial properties. At March 31, 2013 and December 31, 2012, commitments to originate loans and commitments under unused lines of credit for which the Bank is obligated amounted to approximately $142 million and $140 million, respectively.
Letters of credit are conditional commitments guaranteeing payments of drafts in accordance with the terms of the letter of credit agreements. Commercial letters of credit are used primarily to facilitate trade or commerce and are also issued to support public and private borrowing arrangements, bond financing and similar transactions. Collateral may be required to support letters of credit based upon management’s evaluation of the creditworthiness of each customer. The credit risk involved in issuing letters of credit is essentially the same as that involved in extending loan facilities to customers. Most letters of credit expire within one year. At both March 31, 2013 and December 31, 2012, letters of credit outstanding were approximately $19 million.
The Company has a liability of $255 thousand for unfunded commitments at March 31, 2013.
Material Changes in Results of Operations – Comparison of the Quarters Ended March 31, 2013 and 2012 - The Company recorded net income of $2.7 million during the first quarter of 2013 versus net income of $1.2 million in the comparable 2012 period. The improvement in net income primarily reflects a $1.1 million increase in non-interest income, an $804 thousand reduction in total operating expenses and a lower effective tax rate, partially offset by a decrease in net interest income of $532 thousand during the first quarter of 2013.
As shown in the net interest income analysis table below for the three months ended March 31, 2013 and 2012, net interest income decreased $532 thousand resulting from a 32 basis point reduction in the Company’s net interest margin to 3.95% in the first quarter of 2013 versus the first quarter of 2012, offset in part by an $83 million increase in average total interest-earning assets. The decrease in the net interest margin was due to the continued low level of interest rates coupled with a shift in the Company’s balance sheet mix from loans (average loans down 17.1% versus first quarter 2012) into lower-yielding overnight interest-bearing deposits and fed funds sold which represented 20% of average total interest-earning assets in the first quarter of 2013 versus 10% in the first quarter of 2012.
NET INTEREST INCOME ANALYSIS
For the Three Months Ended March 31, 2013 and 2012
(unaudited, dollars in thousands)
| | | 2013 | | | 2012 | |
| | | Average | | | | | | Average | | | Average | | | | | | Average | |
| | | Balance | | | Interest | | | Yield/Cost | | | Balance | | | Interest | | | Yield/Cost | |
| Assets: | | | | | | | | | | | | | | | | | | |
| Interest-earning assets: | | | | | | | | | | | | | | | | | | |
| Investment securities (1) | | $ | 413,591 | | | $ | 4,048 | | | | 3.97 | % | | $ | 319,327 | | | $ | 3,521 | | | | 4.43 | % |
| Federal Reserve Bank, Federal Home Loan Bank and other stock | | | 3,044 | | | | 39 | | | | 5.20 | | | | 2,536 | | | | 46 | | | | 7.30 | |
| Federal funds sold and interest-bearing deposits | | | 292,042 | | | | 173 | | | | 0.24 | | | | 141,560 | | | | 77 | | | | 0.22 | |
| Loans | | | 788,788 | | | | 11,082 | | | | 5.70 | | | | 951,003 | | | | 12,394 | | | | 5.24 | |
| Total interest-earning assets | | | 1,497,465 | | | $ | 15,342 | | | | 4.16 | % | | | 1,414,426 | | | $ | 16,038 | | | | 4.56 | % |
| Non-interest-earning assets | | | 102,689 | | | | | | | | | | | | 79,191 | | | | | | | | | |
| Total Assets | | $ | 1,600,154 | | | | | | | | | | | $ | 1,493,617 | | | | | | | | | |
| | | | | | | | | | | | | | | | | | | | | | | | | |
| Liabilities and Stockholders' Equity: | | | | | | | | | | | | | | | | | | | | | | | | |
| Interest-bearing liabilities: | | | | | | | | | | | | | | | | | | | | | | | | |
| Saving, N.O.W. & money market deposits | | $ | 600,712 | | | $ | 286 | | | | 0.19 | % | | $ | 539,614 | | | $ | 317 | | | | 0.24 | % |
| Time deposits | | | 246,146 | | | | 482 | | | | 0.79 | | | | 261,253 | | | | 719 | | | | 1.11 | |
| Total saving and time deposits | | | 846,858 | | | | 768 | | | | 0.37 | | | | 800,867 | | | | 1,036 | | | | 0.52 | |
| Borrowings | | | 23 | | | | - | | | | - | | | | - | | | | - | | | | - | |
| Total interest-bearing liabilities | | | 846,881 | | | | 768 | | | | 0.37 | | | | 800,867 | | | | 1,036 | | | | 0.52 | |
| Demand deposits | | | 562,281 | | | | | | | | | | | | 513,008 | | | | | | | | | |
| Other liabilities | | | 26,682 | | | | | | | | | | | | 42,929 | | | | | | | | | |
| Total Liabilities | | | 1,435,844 | | | | | | | | | | | | 1,356,804 | | | | | | | | | |
| Stockholders' Equity | | | 164,310 | | | | | | | | | | | | 136,813 | | | | | | | | | |
| Total Liabilities and Stockholders' Equity | | $ | 1,600,154 | | | | | | | | | | | $ | 1,493,617 | | | | | | | | | |
| Net interest rate spread | | | | | | | | | | | 3.79 | % | | | | | | | | | | | 4.04 | % |
| Net interest income/margin | | | | | | | 14,574 | | | | 3.95 | % | | | | | | | 15,002 | | | | 4.27 | % |
| Less tax-equivalent basis adjustment | | | | | | | (898 | ) | | | | | | | | | | | (794 | ) | | | | |
| Net interest income | | | | | | $ | 13,676 | | | | | | | | | | | $ | 14,208 | | | | | |
(1) Interest on securities includes the effects of tax-equivalent basis adjustments of $898 and $794 in 2013 and 2012, respectively.
The Company’s first quarter 2013 average total interest-earning asset yield was 4.16%, down 40 basis points from the comparable 2012 period principally due to a 46 basis point reduction in the average yield on the Company’s investment securities portfolio to 3.97% in the first quarter of 2013 from 4.43% in the first quarter of 2012. This is largely a result of principal paydowns and sales of mortgage-backed securities and CMOs of U.S. Government-sponsored enterprises, as these securities had higher yields than those of the securities subsequently purchased. The lower yields reflect the lower rate environment that has been prevalent. The average balance of the Company’s securities portfolio increased $94 million for the first quarter of 2013 as compared to the same period in 2012. This was primarily due to purchases of mortgage-backed securities of U.S. Government-sponsored enterprises and U.S. Government agency securities.
The Company’s average cost of total interest-bearing liabilities declined by 15 basis points to 0.37% in the first quarter of 2013 versus 0.52% in the first quarter of 2012. The Company’s lower funding cost resulted largely from average core deposits of $1.2 billion in the first quarter of 2013, with average demand deposits representing 40% of average total deposits. The average cost of time deposits declined 32 basis points in the first quarter of 2013 compared to the same period in 2012. The Company also experienced a $15 million decrease in the average balance of time deposits for the first quarter of 2013 versus the same period in 2012.
The Company recorded no consolidated provision for loan losses for the three months ended March 31, 2013 and 2012. The adequacy of the provision and the resulting allowance for loan losses, which was $18 million at both March 31, 2013 and December 31, 2012, is determined by management’s ongoing review of the loan portfolio, including identification and review of individual problem situations that may affect a borrower’s ability to repay, delinquency and non-performing loan data including the current status of criticized and classified loans, collateral values and changes in the size and mix of the loan portfolio. (See also Critical Accounting Policies, Judgments and Estimates and Asset Quality contained herein.)
Non-Interest Income
For the quarters ended March 31, 2013 and 2012
(dollars in thousands)
| | | Quarters ended March 31, | | | |
| | | | | | | | | Over/ | | | |
| | | | | | | | | (under) | | | |
| | | 2013 | | | 2012 | | | 2012 | | | |
| Service charges on deposit accounts | | $ | 924 | | | $ | 950 | | | | (2.7 | ) | % | |
| Other service charges, commissions & fees | | | 710 | | | | 750 | | | | (5.3 | ) | | |
| Fiduciary fees | | | 273 | | | | 201 | | | | 35.8 | | | |
| Net gain on sale of securities available for sale | | | 359 | | | | - | | | | N/M | | (1) | |
| Net gain on sale of portfolio loans | | | 442 | | | | - | | | | N/M | | (1) | |
| Net gain on sale of mortgage loans originated for sale | | | 526 | | | | 197 | | | | 167.0 | | | |
| Other operating income | | | 83 | | | | 157 | | | | (47.1 | ) | | |
| Total non-interest income | | $ | 3,317 | | | $ | 2,255 | | | | 47.1 | | % | |
(1) N/M - denotes % variance not meaningful for statistical purposes.
Non-interest income grew by $1.1 million or 47.1% for the three months ended March 31, 2013 versus 2012 due to a combination of increases in gain on the sale of portfolio loans of $442 thousand, gain on the sale of securities available for sale of $359 thousand and gain on the sale of mortgage loans originated for sale of $329 thousand in the first quarter of 2013. The net gain on the sale of portfolio loans related to loans previously written down and transferred to held-for-sale during the second quarter of 2012. The gain on the sale of investment securities resulted from a strategic repositioning of a portion of the Company’s portfolio to take advantage of market conditions present in 2013. The growth in income associated with the sale of mortgage loans originated for sale is due to the Company’s commitment to this business which has resulted in significant growth in monthly originations sourced through a dedicated sales staff and branch referral network.
Total operating expenses declined by $804 thousand or 5.5% for the first quarter of 2013 versus 2012 as the result of reductions in pension costs (down $824 thousand), accounting and audit fees (down $563 thousand), consulting and professional services expenses (down $327 thousand) and other operating expenses largely due to lower marketing and telecom expenses. These were partially offset by increases in FDIC assessments expense, occupancy and equipment expenses and data processing costs of $447 thousand, $150 thousand and $98 thousand, respectively.
The lower pension costs in the first quarter of 2013 resulted from a freezing of the
Company’s defined benefit plan at December 31, 2012. The decrease in accounting and audit fees in the first quarter of 2013 versus 2012 was largely due to fees recorded in 2012 and not repeated in 2013 pertaining to the Company’s predecessor independent registered public accounting firm. While the Company made significant investments in people and systems over the last year to implement its growth plans, as a result the Company was able to realize reduced consulting and professional services expenses in the first quarter of 2013 as compared to the same 2012 period. These reductions were partially offset by increased FDIC assessments expense in the first quarter of 2013 versus 2012. As a result of the Company’s first quarter 2012 reassessment of the carrying value of its prepaid FDIC assessment asset, the cumulative expense recorded was adjusted downward accordingly in the first quarter of 2012.
Operating Expenses
For the quarters ended March 31, 2013 and 2012
(dollars in thousands)
| | | Quarters ended March 31, | |
| | | | | | | | | Over/ | |
| | | | | | | | | (under) | |
| | | 2013 | | | 2012 | | | 2012 | |
| Employee compensation and benefits | | $ | 8,582 | | | $ | 8,584 | | | | - | % |
| Occupancy expense | | | 1,544 | | | | 1,454 | | | | 6.2 | |
| Equipment expense | | | 572 | | | | 512 | | | | 11.7 | |
| Consulting and professional services | | | 570 | | | | 897 | | | | (36.5 | ) |
| FDIC assessments | | | 517 | | | | 70 | | | | 638.6 | |
| Data processing | | | 467 | | | | 369 | | | | 26.6 | |
| Accounting and audit fees | | | 21 | | | | 584 | | | | (96.4 | ) |
| Other operating expense | | | 1,528 | | | | 2,135 | | | | (28.4 | ) |
| Total operating expenses | | $ | 13,801 | | | $ | 14,605 | | | | (5.5 | ) % |
The Company recorded income tax expense of $483 thousand in the first quarter of 2013 resulting in an effective tax rate of 15.1% versus $690 thousand and 37.1%, respectively, in the comparable period a year ago. The reduction in the Company’s effective tax rate in 2013 versus 2012 resulted from a change in the expected tax rate at which the deferred tax asset will be realized in future periods.
Asset Quality - Non-accrual loans, excluding loans categorized as held-for-sale, totaled $14 million or 1.75% of total loans outstanding at March 31, 2013 versus $16 million or 2.10% of loans outstanding at December 31, 2012 and $83 million or 8.85% of loans outstanding at March 31, 2012. The decrease in non-accrual loans at March 31, 2013 compared to March 31, 2012 resulted primarily from the sales in 2012 of non-performing and other criticized and classified loans as part of management’s strategy to resolve legacy credit issues. The allowance for loan losses as a percentage of total non-accrual loans amounted to 124% at March 31, 2013 versus 108% at December 31, 2012 and 48% at March 31, 2012.
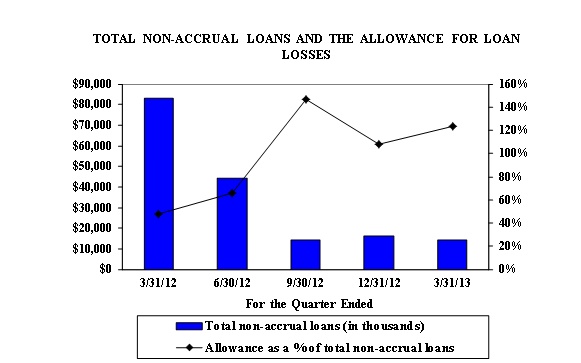
The Company held no loans 90 days or more past due and still accruing at any of the reported dates. Total loans 30 - 89 days past due and accruing amounted to $7 million or 0.80% of loans outstanding at March 31, 2013 versus $14 million or 1.81% of loans outstanding as of December 31, 2012 and $22 million or 2.35% of loans outstanding at March 31, 2012. The Company held OREO of $372 thousand, $1.6 million and $1.8 million at March 31, 2013, December 31, 2012 and March 31, 2012, respectively. The Company sold one OREO property at its carrying value of $1.2 million in the first quarter of 2013.
Total criticized and classified loans were $85 million at March 31, 2013, $99 million at December 31, 2012 and $246 million at March 31, 2012. Criticized loans are those loans that are not classified but require some degree of heightened monitoring. Classified loans were $54 million at March 31, 2013, $54 million at December 31, 2012 and $177 million at March 31, 2012. The allowance for loan losses as a percentage of total classified loans was 33%, 33% and 23%, respectively, at the same dates. At March 31, 2013, the Company had $16 million in TDRs, primarily consisting of commercial and industrial, commercial real estate and residential mortgage loans. At March 31, 2013, $10 million of the TDRs were current and accruing and $6 million were on non-accrual status. The Company had TDRs amounting to $17 million at December 31, 2012 and $28 million at March 31, 2012.
The Company recorded net loan recoveries of $53 thousand in the first quarter of 2013 versus net loan charge-offs of $2.1 million in the fourth quarter of 2012 and $50 thousand in net loan recoveries in the first quarter of 2012. As a percentage of average total loans outstanding, these net amounts represented, on an annualized basis, (0.03)% for the first quarter of 2013, 1.12% for the fourth quarter of 2012 and (0.02)% for the first quarter of 2012.
As of March 31, 2013, the Company’s allowance for loan losses amounted to $18 million or 2.16% of period-end loans outstanding. The allowance as a percentage of loans outstanding was 2.28% at December 31, 2012 and 4.26% at March 31, 2012.
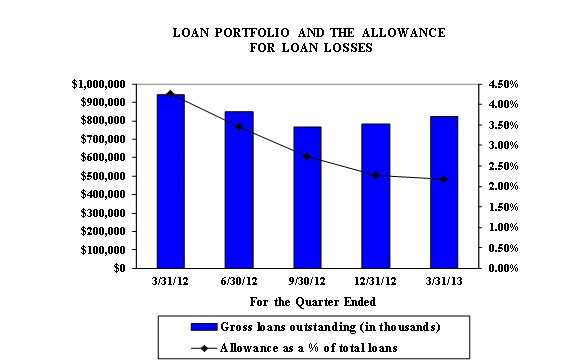
Management has determined that the current level of the allowance for loan losses is adequate in relation to the probable inherent losses present in the portfolio. Management considers many factors in this analysis, among them credit risk grades, delinquency trends, concentrations within segments of the loan portfolio, recent charge-off experience, local and national economic conditions, current real estate market conditions in geographic areas where the Company’s loans are located, changes in the trend of non-performing loans, changes in interest rates and loan portfolio growth. Changes in one or a combination of these factors may adversely affect the Company’s loan portfolio resulting in increased delinquencies, loan losses and future levels of loan loss provisions. Due to these uncertainties, management expects to record loan charge-offs in future periods. (See also Critical Accounting Policies, Judgments and Estimates contained herein.)
ANALYSIS OF NON-PERFORMING ASSETS
AND THE ALLOWANCE FOR LOAN LOSSES
March 31, 2013 versus December 31, 2012 and March 31, 2012
(dollars in thousands)
NON-PERFORMING ASSETS BY TYPE:
| | | At | |
| | | 3/31/2013 | | | 12/31/2012 | | | 3/31/2012 | |
| Non-accrual Loans | | $ | 14,420 | | | $ | 16,435 | | | $ | 83,152 | |
| Non-accrual Loans Held-for-Sale | | | - | | | | 907 | | | | - | |
| Loans 90 Days or More Past Due and Still Accruing | | | - | | | | - | | | | - | |
| OREO | | | 372 | | | | 1,572 | | | | 1,800 | |
| Total Non-performing Assets | | $ | 14,792 | | | $ | 18,914 | | | $ | 84,952 | |
| | | | | | | | | | | | | |
| Gross Loans Outstanding | | $ | 824,399 | | | $ | 780,780 | | | $ | 939,736 | |
| Total Loans Held-for-Sale | | $ | 2,494 | | | $ | 907 | | | $ | - | |
ANALYSIS OF THE ALLOWANCE FOR LOAN LOSSES:
| | | Quarter Ended | |
| | | 3/31/2013 | | | 12/31/2012 | | | 3/31/2012 | |
| Beginning Balance | | $ | 17,781 | | | $ | 21,021 | | | $ | 39,958 | |
| Provision (Credit) | | | - | | | | (1,100 | ) | | | - | |
| Charge-offs | | | (359 | ) | | | (2,526 | ) | | | (825 | ) |
| Recoveries | | | 412 | | | | 386 | | | | 875 | |
| Ending Balance | | $ | 17,834 | | | $ | 17,781 | | | $ | 40,008 | |
KEY RATIOS:
| | | At | |
| | | 3/31/2013 | | | 12/31/2012 | | | 3/31/2012 | |
| Allowance as a % of Total Loans (1) | | | 2.2 | % | | | 2.3 | % | | | 4.3 | % |
| | | | | | | | | | | | | |
| Non-accrual Loans as a % of Total Loans (1) | | | 1.7 | % | | | 2.1 | % | | | 8.8 | % |
| | | | | | | | | | | | | |
| Non-performing Assets as a % of Total Loans, Loans Held-for-Sale and OREO | | | 1.8 | % | | | 2.4 | % | | | 9.0 | % |
| | | | | | | | | | | | | |
| Allowance for Loan Losses as a % of Non-accrual Loans (1) | | | 124 | % | | | 108 | % | | | 48 | % |
| | | | | | | | | | | | | |
| Allowance for Loan Losses as a % of Non-accrual Loans and Loans 90 days or More Past Due and Still Accruing (1) | | | 124 | % | | | 108 | % | | | 48 | % |
(1) Excludes loans held-for-sale.
The Company originates and invests in interest-earning assets and solicits interest-bearing deposit accounts. The Company’s operations are subject to market risk resulting from fluctuations in interest rates to the extent that there is a difference between the amounts of interest-earning assets and interest-bearing liabilities that are prepaid, withdrawn, mature, or repriced in any given period of time. The Company’s earnings or the net value of its portfolio will change under different interest rate scenarios. The principal objective of the Company’s asset/liability management program is to maximize net interest income within an acceptable range of overall risk, including both the effect of changes in interest rates and liquidity risk. The Company’s exposure to interest-rate risk has not changed materially since December 31, 2012.
The Company carried out an evaluation, under the supervision and with the participation of its principal executive officer and principal financial officer, of the effectiveness of the design and operation of its disclosure controls and procedures as defined in Rule 13a-15(e) and Rule 15d-15(e) under the Securities Exchange Act of 1934, as amended (the “Exchange Act”). Based on this evaluation, the Company’s principal executive officer and principal financial officer concluded that, as of the end of the period covered by this report, the Company’s disclosure controls and procedures are effective in timely alerting them to material information required to be included in the Company’s periodic reports filed with the SEC. There have been no significant changes in the Company’s internal controls or in other factors that could significantly affect internal controls subsequent to the date the Company carried out its evaluation.
There were no changes to the Company’s internal control over financial reporting as defined in Rule 13a-15(f) and Rule 15d-15(f) under the Exchange Act that occurred in the first quarter of 2013 that have materially affected, or are reasonably likely to materially affect, the Company’s internal control over financial reporting.
PART II
ITEM 1. - LEGAL PROCEEDINGS
See the information set forth in Note 10—Legal Proceedings in the Notes to Unaudited Condensed Consolidated Financial Statements under Part I, Item I, which information is incorporated by reference in response to this item.
There are no material changes from the risks disclosed in the “Risk Factors” section of our annual report on Form 10-K for the year ended December 31, 2012, except as discussed below.
An increase in the Company’s allowance for loan losses would negatively impact capital levels and could make it difficult to maintain the capital levels directed by the OCC.
The Bank is subject to IMCRs established by the OCC requiring Tier 1 leverage capital equal to at least 8.00% of adjusted average assets, Tier 1 risk-based capital equal to at least 10.50% of risk-weighted assets and total risk-based capital equal to at least 12.00% of risk-weighted assets. The Bank met all three IMCRs at March 31, 2013: Tier 1 capital was 9.77% of adjusted average assets, Tier 1 risk-based capital was 16.28% of risk-weighted assets and total risk-based capital was 17.53% of risk-weighted assets. Further increases to the Company’s allowance for loan losses, however, would negatively impact the Bank’s capital levels and could make it difficult to maintain the capital levels directed by the OCC. If the Bank fails to maintain the minimum required capital levels, it could be subject to further regulatory enforcement actions.
The Company’s loan portfolio has a high concentration of real estate loans, and its business may be adversely affected by credit risk associated with residential and commercial real estate and a decline in property values.
At March 31, 2013, $624 million, or 76% of the Company’s total gross loan portfolio, was comprised of residential and commercial real estate and construction loans and home equity lines of credit. This type of lending is generally sensitive to regional and local economic conditions that significantly impact the ability of borrowers to meet their loan payment obligations, making loss levels difficult to predict. Although real estate prices have shown signs of improvement, a decline in real estate values may reduce the value of the real estate collateral securing these types of loans and increase the risk that the Company would incur losses if borrowers default on their loans.
ITEM 2. – UNREGISTERED SALES OF EQUITY SECURITIES AND USE OF PROCEEDS
Not applicable.
ITEM 3. – DEFAULTS UPON SENIOR SECURITIES
Not applicable.
Not applicable.
Not applicable.
| 31.1 | Certification of principal executive officer pursuant to Rule 13a-14(a) or 15d-14(a) of the Securities Exchange Act of 1934, as adopted pursuant to Section 302 of the Sarbanes-Oxley Act of 2002 |
| | |
| 31.2 | Certification of principal financial officer pursuant to Rule 13a-14(a) or 15d-14(a) of the Securities Exchange Act of 1934, as adopted pursuant to Section 302 of the Sarbanes-Oxley Act of 2002 |
| | |
| 32.1 | Certification of principal executive officer pursuant to 18 U.S.C. Section 1350, as adopted pursuant to Section 906 of the Sarbanes-Oxley Act of 2002 |
| | |
| 32.2 | Certification of principal financial officer pursuant to 18 U.S.C. Section 1350, as adopted pursuant to Section 906 of the Sarbanes-Oxley Act of 2002 |
| | |
| 101.INS | XBRL Instance Document |
| | |
| 101.SCH | XBRL Taxonomy Extension Schema Document |
| | |
| 101.CAL | XBRL Taxonomy Extension Calculation Linkbase Document |
| | |
| 101.LAB | XBRL Taxonomy Extension Label Linkbase Document |
| | |
| 101.PRE | XBRL Taxonomy Extension Presentation Linkbase Document |
| | |
| 101.DEF | XBRL Taxonomy Extension Definition Linkbase Document |
Pursuant to the requirements of the Securities Exchange Act of 1934, the Registrant has duly caused this report to be signed on its behalf by the undersigned, thereunto duly authorized.
SUFFOLK BANCORP
| Date: May 7, 2013 | /s/ Howard C. Bluver |
| | Howard C. Bluver |
| | President & Chief Executive Officer |
| | (principal executive officer) |
| | |
| Date: May 7, 2013 | /s/ Brian K. Finneran |
| | Brian K. Finneran |
| | Executive Vice President & Chief Financial Officer |
| | (principal financial and accounting officer) |
EXHIBIT INDEX
Exhibit Number | Description |
| | |
| Certification of principal executive officer pursuant to Rule 13a-14(a) or 15d-14(a) of the Securities Exchange Act of 1934, as adopted pursuant to Section 302 of the Sarbanes-Oxley Act of 2002 |
| | |
| Certification of principal financial officer pursuant to Rule 13a-14(a) or 15d-14(a) of the Securities Exchange Act of 1934, as adopted pursuant to Section 302 of the Sarbanes-Oxley Act of 2002 |
| | |
| Certification of principal executive officer pursuant to 18 U.S.C. Section 1350, as adopted pursuant to Section 906 of the Sarbanes-Oxley Act of 2002 |
| | |
| Certification of principal financial officer pursuant to 18 U.S.C. Section 1350, as adopted pursuant to Section 906 of the Sarbanes-Oxley Act of 2002 |
| | |
| 101.INS | XBRL Instance Document |
| | |
| 101.SCH | XBRL Taxonomy Extension Schema Document |
| | |
| 101.CAL | XBRL Taxonomy Extension Calculation Linkbase Document |
| | |
| 101.LAB | XBRL Taxonomy Extension Label Linkbase Document |
| | |
| 101.PRE | XBRL Taxonomy Extension Presentation Linkbase Document |
| | |
| 101.DEF | XBRL Taxonomy Extension Definition Linkbase Document |