SECURITIES AND EXCHANGE COMMISSION
Washington, D.C. 20549
FORM 10-K
(Mark One)
| x | Annual report pursuant to section 13 or 15(d) of the Securities Exchange Act of 1934 |
For the fiscal year ended December 31, 2008
-OR-
| ¨ | Transition report pursuant to section 13 or 15(d) of the Securities Exchange Act of 1934 |
For the transition period from _________ to ___________.
Commission File Number: 000-13580
SUFFOLK BANCORP
(Name of Issuer in Its Charter)
| | |
| New York | | 11-2708279 |
(State or Other Jurisdiction of Incorporation of Organization) | | (I.R.S. Employer Identification No.) |
| | |
| 4 West Second Street, P.O. Box 9000, Riverhead, New York | | 11901 |
| (Address of Principal Executive Offices) | | (Zip Code) |
Issuer’s Telephone Number, Including Area Code: (631) 727-5667
Securities registered under Section 12(b) of the Exchange Act: None
Securities registered under Section 12(g) of the Exchange Act: Common Stock, par value $2.50 per share
(Title of Class)
Indicate by check mark if the Registrant is a well-known seasoned issuer, as defined in Rule 405 of the Securities
Act. YES ¨ NO x
Indicate by check mark if the Registrant is not required to file reports pursuant to Section 13 or 15(d) of the Exchange Act. YES ¨ NO x
Indicate by check mark whether the Registrant (1) has filed all reports required to be filed by Section 13 or 15(d) of the Securities Exchange Act of 1934 during the preceding 12 months (or for such shorter period that the Registrant was required to file such reports), and (2) has been subject to such filing requirements for the past 90 days. YES x NO ¨
Indicate by check mark if disclosure of delinquent filers pursuant to Item 405 of Regulation S-K is not contained herein and will not be contained, to the best of the Registrant’s knowledge, in definitive proxy or information statements incorporated by reference in Part III of this Form 10-K or any amendment to this Form 10-K. x
Indicate by check mark whether the Registrant is a large accelerated filer, an accelerated filer, or a non-accelerated filer. See definition of “accelerated filer” and “large accelerated filer” in Rule 12b-2 of the Exchange Act. (Check one):
Large accelerated filer ¨ Accelerated filer x Non-accelerated filer ¨
Indicate by check mark whether the Registrant is a shell company. YES ¨ NO x
The aggregate market value of the common equity held by non-affiliates of the Registrant as of the last business day of the Registrant’s most recently completed second fiscal quarter was $275.8 million.
As of January 31, 2009, there were 9,590,571 shares outstanding of the Registrant’s common stock.


On The Cover
Moniebogue Bay and Westhampton Beach
What is now Westhampton Beach had its origins in the “Quogue Purchase” in 1659 when John Ogden, “the Pilgrim” whose influence was felt through much of colonial America during the mid–seventeenth century, arranged to acquire land from the Montauk tribe. The first English settlement occurred in 1666. The Village of Westhampton Beach surrounds Moniebogue Bay, illustrated in the center of the photograph above with the small island in the middle.
As is the case with many of the resorts along Long Island’s ocean shore, Westhampton Beach started to take its modern shape when the Long Island Rail Road arrived in 1870. Locals took in visiting New Yorkers, and tourism steadily overtook whaling, fishing, and farming as the inhabitants’ chief source of income. The Village of Westhampton Beach was incorporated in 1928, and while the village was severely damaged by the “Long Island Express,” the notorious hurricane of 1938, residents from that time would recognize the look and feel of Westhampton Beach today, though its amenities have expanded greatly since. Served just outside its borders by Gabreski Airport, capable of handling any type of aircraft; by the Long Island Rail Road; near the convergence of highways that lead in all directions; and only 75 miles from midtown Manhattan, it boasts wide ocean beaches, trendy shops and eateries, boating, and a variety of housing, as well as a growing, year-round population. The village is also home to the Westhampton Beach Performing Arts Center, formerly a movie theater in the grand tradition of the 1930’s. Since its doors reopened in 1998 as a live theater featuring dance, drama, music, and children’s programs, its calendar has expanded to include not only educational programs, but a regular series of performances by world-famous entertainers.
SCNB has maintained a full-service office in Westhampton Beach since 1972.
Corporate Profile
Suffolk Bancorp does commercial banking through its wholly owned subsidiary, Suffolk County National Bank. Organized in 1890, “SCNB” is a full-service, nationally chartered commercial bank. Most of SCNB’s revenue comes from net interest income, and the remainder from charges for a variety of services. SCNB has built a good reputation for personal, attentive service, resulting in a loyal and growing clientele. SCNB operates 29 full-service offices throughout Suffolk County, New York.
The staff at SCNB works hard to develop and maintain ties to the communities it serves. SCNB’s business includes loans to small and medium-sized commercial enterprises, to professionals, and to individual consumers. Suffolk Bancorp’s main strategic focus is on small businessmen and professionals and those retail customers who need a range of financial services tailored to their individual needs, and who expect the kind of personal service that is possible only through the establishment of relationships that develop over time. In recent years commercial loans of all types have increased as a percentage of the loan portfolio and have made substantial contributions to SCNB’s profitability. SCNB’s primary market is Long Island, New York. Long Island is home to approximately 2.8 million people outside of the limits of New York City and is primarily suburban in nature. Nassau County and the western end of Suffolk County are a center for commerce and are highly developed, supporting a diversified economy. The economy on eastern Long Island is based on services that support tourism, a large number of second homes, and agriculture. Together, they generate family incomes greater than the national average, providing Suffolk Bancorp with a steady and growing demand for loans and other services, and a reliable, reasonably priced supply of deposits.
Financial Highlights
| | | | | | | | | | |
| | | (dollars in thousands, except ratios, share, and per-share information) | |
| | | December 31, | | 2008 | | | 2007 | |
EARNINGS FOR THE YEAR | | Net income | | $ | 24,688 | | | $ | 22,128 | |
| | Net interest income | | | 66,219 | | | | 63,964 | |
| | Net income-per-share | | | 2.58 | | | | 2.24 | |
| | Cash dividends-per-share | | | 0.88 | | | | 0.88 | |
| | | | | | | | | | |
BALANCES AT YEAR END | | Assets | | $ | 1,582,819 | | | $ | 1,469,062 | |
| | Net loans | | | 1,084,470 | | | | 949,609 | |
| | Investment securities | | | 404,746 | | | | 410,407 | |
| | Deposits | | | 1,216,437 | | | | 1,143,375 | |
| | Equity | | | 112,401 | | | | 108,981 | |
| | Shares outstanding | | | 9,582,699 | | | | 9,610,730 | |
| | Book value per common share | | $ | 11.73 | | | $ | 11.34 | |
| | | | | | | | | | |
RATIOS | | Return on average equity | | | 21.79 | % | | | 21.47 | % |
| | Return on average assets | | | 1.59 | | | | 1.57 | |
| | Average equity to average assets | | | 7.29 | | | | 7.30 | |
| | Net interest margin (taxable-equivalent) | | | 4.75 | | | | 5.06 | |
| | Efficiency ratio | | | 52.81 | | | | 54.17 | |
| | Net (recoveries) charge-offs to average net loans | | | 0.06 | | | | (0.01 | ) |
| | | | | | | | | | |

CORPORATE INFORMATION
Suffolk Bancorp Annual Meeting
Tuesday, April 14, 2009, 1:00 P.M.
Suffolk County National Bank
Administrative Center
Lower Level
Four West Second Street
Riverhead, New York
S.E.C. Form 10-K
The Annual Report to the Securities and Exchange Commission on Form
10-K and documents incorporated by reference can be obtained, without
charge, by writing to the Secretary, Suffolk Bancorp, 4 West Second Street,
Riverhead, New York 11901, or call (631) 727-5667, fax to (631) 727-3214,
or e-mail to
invest@suffolkbancorp.com
They are also available on the Internet at
www.suffolkbancorp.com
Trading
Suffolk Bancorp’s common stock is traded over-the-counter, and is listed on
the NASDAQ National Market System under the symbol “SUBK.”
Registrar and Transfer Agent
Any questions about the registration or transfer of shares, the payment,
reinvestment, or direct deposit of dividends can be answered by:
American Stock Transfer
& Trust Co.
59 Maiden Lane
New York, New York 10038
1-800-937-5449
www.amstock.com
Registered Independent Public Accountant
Grant Thornton LLP
Two Commerce Square
Suite 3100
2001 Market Street
Philadelphia, Pennsylvania 19103
General Counsel
Smith, Finkelstein, Lundberg,
Isler & Yakaboski, LLP
456 Griffing Avenue
Riverhead, New York 11901
FDIC Rules and Regulations, Part 350.4(d)
This statement has not been reviewed, or confirmed for accuracy or relevance,
by the Federal Deposit Insurance Corporation.
2
TABLE OF CONTENTS
3
“PRUDENT, PREDICTABLE, PROFITABLE”
Dear Shareholder:
There are no remarks I can make that would better explain what has happened in our industry and the economy as a whole than what has already been reported and commented upon in the news media. Each day brings a new story, and a new twist to matters both financial and regulatory, and it is not realistic to predict where and when credit markets will again function effectively in allocating capital to useful enterprises. We are in historic times, and I am humble enough about the limits to my ability to foresee how the current credit crunch will end.
That said, I do want to reassure our investors, customers, and employees about Suffolk Bancorp’s condition and prospects. We have been alert to developments in the economy and in our market, and conservative and disciplined in our lending and investing. That attention to the details of our business is evident in the numbers we reported for 2008, which remain consistent with our past performance, with return on average equity remaining at approximately 20 percent exclusive of the proceeds of VISA, Inc.’s initial public offering during the first quarter, and at approximately 22 percent for the year when that transaction is included. What is most important is our core business. Going forward, we cannot assure that we will remain unaffected by the turmoil in the broader economy, but we are sharply focused on mitigating the effects of a continued or deepened downturn, and hopeful that we can preserve our traditional ranking in the industry, if not our historical performance ratios.
First, I would like to provide a brief overview of our performance during 2008. Net income was $24,688,000, up 11.6 percent from $22,128,000 last year. Earnings-per-share were $2.58, up 15.2 percent compared to $2.24 during 2007. Net interest income increased by 3.5 percent, to $66,219,000 from $63,964,000. Our net interest margin declined to 4.75 percent from 5.06 percent as interest rates declined, although it remains among the highest in the industry. Non-interest income increased by 38.2 percent to $14,643,000 as a result of the VISA transaction, but more importantly, by 2.9 percent exclusive of that gain. We were able to hold non-interest expense to an increase of 5.7 percent, well short of the 10.1 percent increase in average assets, which increased to $1,555,000 from $1,413,000.
There are several items of which I would like to make specific mention. First, loan balances increased by 14.2 percent from year to year. We attribute this in part to good, solid borrowers whose former banks have not been in a position to lend to them as the credit crisis developed. This led to a substantial increase in commercial real estate loans which have been underwritten on the basis of reasonable ratios of loan-to-value, conservative evaluations of projected cash flows, and guarantees for permanent financing in
4
place when granting an interim credit. We are optimistic that we will be able to develop many of these credits into well-rounded, long-standing relationships with stable customers of the sort who have always been our bread and butter.
We evaluate our allowance for possible loan losses on an ongoing basis to ensure its adequacy. Accordingly, our provision has been increased by 444 percent in comparison to 2007, to account for growth in the portfolio and for upheaval in the markets. We believe this is the prudent response to current disorder in the economy, and uncertainty about how quickly it will recover.
This is my first message to you, the shareholders as President and Chief Executive Officer. I want to take a moment to recognize my predecessor, Tom Kohlmann, who has served as Chairman, President, and CEO since 1999, during which time Suffolk has posted an admirable average of 21.4 percent return on average equity, consistently among the best in the industry. My appointment makes for mixed feelings, inasmuch as Tom is stepping aside from the rigor of daily duties for medical reasons, but we are fortunate to have the benefit of his continuing guidance as a Director, and I myself have been the beneficiary of his personal support, both before and during my recent tenure as acting CEO.

The ease of this transition, however, speaks of something very important about your company, which is that we are a team, and rely on no one individual for our success. I will consider it one of my most important obligations to keep it that way.
Having been in business now for more than 119 years, our Board, my colleagues, and I all feel a sense of stewardship for Suffolk Bancorp and its future. As for any bank in these times, the year ahead will not be easy, but we are well positioned to weather the storm. Most important, our Board and management are unified in their determination to preserve and maintain Suffolk as the prudent, predictable, and profitable member of Long Island’s financial community it has always been.
Sincerely,
|

|
J. Gordon Huszagh |
President and Chief Executive Officer |
5
PRICE RANGE OF COMMON STOCK AND DIVIDENDS
Suffolk’s common stock is traded in the over-the-counter market, and is quoted on the NASDAQ National Market System under the symbol “SUBK.” Following are quarterly high and low prices of Suffolk’s common stock as reported by NASDAQ.
| | | | | | | | | | | | | | | | | | | | |
2008 | | High | | Low | | Dividends | | 2007 | | High | | Low | | Dividends |
First Quarter | | $ | 33.73 | | $ | 28.49 | | $ | 0.22 | | First Quarter | | $ | 38.80 | | $ | 30.56 | | $ | 0.22 |
Second Quarter | | | 35.36 | | | 28.77 | | | 0.22 | | Second Quarter | | | 34.00 | | | 29.75 | | | 0.22 |
Third Quarter | | | 49.02 | | | 26.35 | | | 0.22 | | Third Quarter | | | 33.92 | | | 25.55 | | | 0.22 |
Fourth Quarter | | | 40.00 | | | 25.68 | | | 0.22 | | Fourth Quarter | | | 36.00 | | | 29.54 | | | 0.22 |
SUMMARY OF SELECTED FINANCIAL DATA
| | | | | | | | | | | | | | | | | | | | |
FIVE-YEAR SUMMARY: (dollars in thousands except shares and per-share amounts) | |
| For the year ended December 31, | | 2008 | | | 2007 | | | 2006 | | | 2005 | | | 2004 | |
Interest income | | $ | 88,457 | | | $ | 89,081 | | | $ | 86,209 | | | $ | 75,673 | | | $ | 67,984 | |
Interest expense | | | 22,238 | | | | 25,117 | | | | 20,499 | | | | 11,312 | | | | 7,379 | |
| | | | | | | | | | | | | | | | | | | | |
Net interest income | | | 66,219 | | | | 63,964 | | | | 65,710 | | | | 64,361 | | | | 60,605 | |
Provision for loan losses | | | 2,050 | | | | 377 | | | | 966 | | | | 1,575 | | | | 1,973 | |
| | | | | | | | | | | | | | | | | | | | |
Net interest income after provision | | | 64,169 | | | | 63,587 | | | | 64,744 | | | | 62,786 | | | | 58,632 | |
Other income | | | 14,643 | | | | 10,595 | | | | 10,672 | | | | 10,145 | | | | 12,294 | |
Other expense | | | 42,701 | | | | 40,392 | | | | 39,975 | | | | 37,453 | | | | 36,621 | |
| | | | | | | | | | | | | | | | | | | | |
Income before income taxes | | | 36,111 | | | | 33,790 | | | | 35,441 | | | | 35,478 | | | | 34,305 | |
Provision for income taxes | | | 11,423 | | | | 11,662 | | | | 12,813 | | | | 13,376 | | | | 13,430 | |
| | | | | | | | | | | | | | | | | | | | |
Net Income | | $ | 24,688 | | | $ | 22,128 | | | $ | 22,628 | | | $ | 22,102 | | | $ | 20,875 | |
| | | | | | | | | | | | | | | | | | | | |
BALANCE AT DECEMBER 31: | | | | | | | | | | | | | | | | | | | | |
Federal funds sold | | $ | — | | | $ | 2,700 | | | $ | — | | | $ | — | | | $ | 2,500 | |
Investment securities – available for sale | | | 382,357 | | | | 392,796 | | | | 403,246 | | | | 400,038 | | | | 427,678 | |
Investment securities – held to maturity | | | 22,389 | | | | 17,611 | | | | 15,097 | | | | 17,274 | | | | 14,461 | |
| | | | | | | | | | | | | | | | | | | | |
Total investment securities | | | 404,746 | | | | 410,407 | | | | 418,343 | | | | 417,312 | | | | 442,139 | |
Net loans | | | 1,084,470 | | | | 949,609 | | | | 882,096 | | | | 893,245 | | | | 815,349 | |
Total assets | | | 1,582,819 | | | | 1,469,062 | | | | 1,390,849 | | | | 1,407,902 | | | | 1,346,347 | |
Total deposits | | | 1,216,437 | | | | 1,143,375 | | | | 1,139,075 | | | | 1,158,707 | | | | 1,197,592 | |
Other borrowings | | | 224,820 | | | | 198,320 | | | | 120,135 | | | | 127,975 | | | | 25,300 | |
Stockholders’ equity | | $ | 112,401 | | | $ | 108,981 | | | $ | 108,566 | | | $ | 102,001 | | | $ | 106,212 | |
| | | | | | | | | | | | | | | | | | | | |
SELECTED FINANCIAL RATIOS: | | | | | | | | | | | | | | | | | | | | |
Performance: | | | | | | | | | | | | | | | | | | | | |
Return on average equity | | | 21.79 | % | | | 21.47 | % | | | 22.16 | % | | | 22.18 | % | | | 20.85 | % |
Return on average assets | | | 1.59 | | | | 1.57 | | | | 1.61 | | | | 1.59 | | | | 1.53 | |
Net interest margin (taxable-equivalent) | | | 4.75 | | | | 5.06 | | | | 5.16 | | | | 5.09 | | | | 4.90 | |
Efficiency ratio | | | 52.81 | | | | 54.17 | | | | 52.34 | | | | 50.28 | | | | 50.24 | |
Average equity to average assets | | | 7.29 | | | | 7.30 | | | | 7.25 | | | | 7.19 | | | | 7.35 | |
Dividend pay-out ratio | | | 34.18 | | | | 39.70 | | | | 39.19 | | | | 37.56 | | | | 39.69 | |
Asset quality: | | | | | | | | | | | | | | | | | | | | |
Non-performing assets to total loans, net of discount | | | 0.45 | | | | 0.17 | | | | 0.10 | | | | 0.49 | | | | 0.65 | |
Non-performing assets to total assets | | | 0.31 | | | | 0.11 | | | | 0.06 | | | | 0.32 | | | | 0.40 | |
Allowance to non-performing assets | | | 185.32 | | | | 459.13 | | | | 846.52 | | | | 220.41 | | | | 153.06 | |
Allowance to loans, net of discount | | | 0.83 | | | | 0.08 | | | | 0.85 | | | | 1.09 | | | | 1.00 | |
Net charge-offs (recoveries) to average net loans | | | 0.06 | | | | (0.01 | ) | | | 0.36 | | | | (0.01 | ) | | | 0.28 | |
| | | | | | | | | | | | | | | | | | | | |
PER-SHARE DATA: | | | | | | | | | | | | | | | | | | | | |
Net income (basic) | | | 2.58 | | | | 2.24 | | | | 2.20 | | | | 2.09 | | | | 1.92 | |
Cash dividends | | | 0.88 | | | | 0.88 | | | | 0.88 | | | | 0.79 | | | | 0.76 | |
Book value at year-end | | | 11.73 | | | | 11.34 | | | | 10.60 | | | | 9.80 | | | | 9.80 | |
Highest market value | | | 49.02 | | | | 38.80 | | | | 38.95 | | | | 37.00 | | | | 36.30 | |
Lowest market value | | | 25.68 | | | | 25.55 | | | | 28.17 | | | | 25.68 | | | | 29.69 | |
Average shares outstanding | | | 9,580,025 | | | | 9,895,301 | | | | 10,279,870 | | | | 10,570,896 | | | | 10,882,327 | |
| | | | | | | | | | | | | | | | | | | | |
Number of full-time-equivalent employees | | | 362 | | | | 350 | | | | 357 | | | | 369 | | | | 374 | |
Number of branch offices | | | 29 | | | | 29 | | | | 27 | | | | 27 | | | | 26 | |
Number of automatic teller machines | | | 29 | | | | 26 | | | | 26 | | | | 25 | | | | 25 | |
| | | | | | | | | | | | | | | | | | | | |
6
MANAGEMENT’S DISCUSSION AND ANALYSIS OF FINANCIAL CONDITION
AND RESULTS OF OPERATIONS
The discussion that follows analyzes Suffolk Bancorp’s (“Suffolk”) operations for each of the past three years and its financial condition as of December 31, 2008 and 2007, respectively. Selected tabular data are presented for each of the past five years.
Summary of Recent Developments and Current Trends
Suffolk Bancorp is a one-bank holding company engaged in the commercial banking business through The Suffolk County National Bank, a full-service commercial bank headquartered in Riverhead, New York. “SCNB” is Suffolk Bancorp’s wholly owned subsidiary. Organized in 1890, Suffolk County National Bank is headquartered on Long Island, with 29 offices in Suffolk County, New York.
Recent Developments
Credit became steadily less available as the losses in sub-prime mortgages granted during the previous several years became increasingly evident. This trend was amplified as investors were unable to value accurately securities backed by these mortgages, which sharply limited trading. This forced a number of financial institutions to take losses, reducing the amount of capital available to support lending. The value of other securities also came into question such as, for example, credit default swaps, and individuals and financial institutions became reluctant to lend to one another. The contraction of credit led to a lack of confidence in the ability of other industries to continue to operate profitably, triggering a steep decline in equity markets. Federal officials took a number of unprecedented steps to stabilize credit markets, most notably the Troubled Asset Relief Program (“TARP”), but including reductions in certain target rates of interest to near zero. The effectiveness of these steps remains unclear. In the absence of credit, and with widespread foreclosures, residential real estate continued to decline in value, further diminishing investors’ confidence and resulting in significant declines in the value of banking stocks.
Against this background, rates of interest for shorter terms dropped during the year more than those for longer terms, resulting in a steeper “yield curve.” This was primarily the result of reductions by the Federal Reserve Board in its targets for federal funds and discount rates. However, at times, actual rates for overnight lending greatly exceed the target rates because of inadequate liquidity as investors stayed in cash. Rates were volatile throughout the period.
At Suffolk, interest income was flat despite an increase in total net loans, although that was offset by lesser interest expense, resulting in higher net interest income. The net interest margin decreased to 4.75 percent, down from 5.06 percent, year to year.
Return on average equity increased to 21.79 percent for the year, up from 21.47 percent during 2007, and earnings-per-share increased from $2.24 in 2007 to $2.58 in 2008. The increase in return on average equity and earnings-per-share on a year-to-date basis is the result of a net gain on the sale of securities during the first quarter of 2008, the proceeds of which were realized from the sale of shares issued by Visa, Inc. in connection with its initial public offering. Please refer to “Other Income” for further discussion.
Key to maintaining performance was close management of the balance sheet. Steps included:
| | • | | Managing the investment portfolio to provide downside protection from falling rates, and continued purchases of municipal securities, currently providing liquidity as well as higher returns net of taxes, and some protection from falling interest rates. |
| | • | | Pursuing ongoing program of capital management, maintaining total risk-based capital (“TRBC”) at a modest margin above 10.00 percent, which qualifies as “well-capitalized” with regulatory agencies and affords certain advantages to the banking subsidiary. Maximum prudent leverage is thus applied to the shareholders’ investment by means of selected repurchases of shares when capital exceeds the target, and through the retention of earnings when assets are growing. Growth in the core business during the year was sufficient to provide leverage to all retained earnings, and no shares were repurchased after the first quarter. |
| | • | | Maintaining emphasis on both commercial and personal demand deposits, and non-maturity time deposits while responding as necessary to demand in Suffolk’s market for certificates of deposit of all sizes. In light of increased demand for loans from customers unable to obtain financing from other banks whose capital losses reduced their lending capacity, Suffolk redoubled its emphasis on the profitability of the whole banking relationship with its customers with the Bank, seeking when possible to both make loans to and obtain funding from qualified customers. |
| | • | | Managing net loan charge-offs aggressively. During 2008, net charge-offs amounted to 6 basis points of average net loans. |
| | • | | Consistent underwriting for lending to preserve both credit quality and yields in face of competition. Emphasis on preservation of margins over less profitable growth, and on the relationship rather than the transaction. |
It has not been Suffolk’s policy to grant loans or to buy investment securities backed by loans which would be characterized as “sub-prime.”
7
Suffolk’s Business
Nearly all of Suffolk’s business is to provide banking services to its commercial and retail customers in Suffolk County, on Long Island, New York. Suffolk is a one-bank holding company. Its banking subsidiary, Suffolk County National Bank (the “Bank”), operates 29 full-service offices in Suffolk County, New York. It offers a full line of domestic, retail, and commercial banking services, and trust services. The Bank’s primary lending area includes all of Suffolk County, New York, and a limited number of loans or loan-participations in the adjacent markets of Nassau County and New York City. The Bank makes loans that are secured by commercial real estate and float with the prime rate and other indices, and that are retained in the Bank’s portfolio: commercial and industrial loans to small manufacturers, wholesalers, builders, farmers, and retailers, including dealer financing. The Bank serves as an indirect lender to the customers of a number of automobile dealers. The Bank also makes loans secured by residential mortgages, and both fixed and floating rate second mortgage loans with a variety of plans for repayment. Real estate construction loans are also offered.
Other investments are made in short-term United States Treasury debt, high-quality obligations of municipalities in New York and other states, issues of agencies of the United States government, collateralized mortgage obligations, mortgage-backed securities, and stock in the Federal Reserve Bank and the Federal Home Loan Bank of New York, each required as a condition of membership.
The Bank finances most of its activities with deposits, including demand, saving, N.O.W., and money market accounts, as well as term certificates. It also relies on other sources of funds, including inter-bank overnight loans, and sale-repurchase agreements.
General Economic Conditions
Long Island has a population of approximately 2.8 million people, which accounts for 20 percent of the population of New York State. Health services and education clusters grew the fastest of all industry clusters over the past five years. Finance and information clusters experienced declines in growth during 2008. Unemployment rates grew locally and nationally during the year. Long Island’s overall private sector employment grew by about 6 percent between 1998 and 2008; however, more recently, private sector employment declined by 3% from 2007 to 2008. Average pay per employee on Long Island increased 3% from 1999 to 2008 compared to the national average, which rose 7%, indicating that national income has grown faster than on Long Island. (Source: Long Island Index 2009)
The economy on Long Island continued to show a decrease in growth during 2008 and is not faring well in comparison to the rest of the U.S. Following several consecutive years with double-digit increases, both home sales and prices continued to decline during 2008. Interest rates decreased to record low levels. The current financial crisis appears to be the most severe in many decades. In its favor, Long Island has a highly educated and skilled work force and a diverse industrial base. It is adjacent to New York City, one of the world’s largest centers of distribution and a magnet for finance and culture. The island’s economic cycles vary from those of the national economy. In the past, Long Island’s economy seems to have been more stable than the national economy, owing in part to its comparative diversity. However, there has been little recent growth in Long Island’s gross domestic product (GDP), which trails that of the U.S. as a whole.
Results of Operations
Net Income
Net income was $24,688,000 compared to $22,128,000 last year and $22,628,000 in 2006. These figures represent an increase of 11.6 percent and 2.2 percent, respectively. Basic earnings-per-share were $2.58 during 2008, compared to $2.24 last year and $2.20 in 2006.
Net Interest Income
Net interest income during 2008 was $66,219,000, up 3.5 percent from $63,964,000 in 2007, which was down 2.7 percent from $65,710,000 in 2006. Net interest income is the most important part of the net income of Suffolk. The effective interest rate differential, on a taxable-equivalent basis, was 4.75 percent in 2008, 5.06 percent during 2007, and 5.16 percent in 2006. Average rates on average interest-earning assets decreased to 6.27 percent in 2008, down from 6.96 percent in 2007, and 6.72 percent in 2006. Average rates on average interest-bearing liabilities decreased to 2.24 percent in 2008, down from 2.91 percent in 2007, and 2.39 percent in 2006. The interest rate differential decreased in 2008, from 2007 and 2006. Demand deposits remained a significant source of funds as a percentage of total liabilities.
8
Average Assets, Liabilities, Stockholders’ Equity, Rate Spread, and Effective Interest Rate Differential
(on a taxable-equivalent)
The following table illustrates the average composition of Suffolk’s statements of condition. It presents an analysis of net interest income on a taxable-equivalent basis, listing each major category of interest-earning assets and interest-bearing liabilities, as well as other assets and liabilities: (dollars in thousands)
| | | | | | | | | | | | | | | | | | | | | | | | | | | | | | |
Year ended December 31, | | 2008 | | | 2007 | | | 2006 | |
| | | Average
Balance | | Interest | | | Average
Rate | | | Average
Balance | | Interest | | | Average
Rate | | | Average
Balance | | Interest | | | Average
Rate | |
Interest-earning assets | | | | | | | | | | | | | | | | | | | | | | | | | | | | | | |
U.S. Treasury securities | | $ | 9,988 | | $ | 407 | | | 4.07 | % | | $ | 9,526 | | $ | 406 | | | 4.26 | % | | $ | 9,580 | | $ | 405 | | | 4.23 | % |
Collateralized mortgage obligations | | | 145,285 | | | 7,878 | | | 5.42 | | | | 142,876 | | | 7,605 | | | 5.32 | | | | 174,680 | | | 7,887 | | | 4.52 | |
Mortgage-backed securities | | | 721 | | | 49 | | | 6.80 | | | | 953 | | | 67 | | | 7.03 | | | | 1,369 | | | 95 | | | 6.94 | |
Obligations of states & political subdivisions | | | 164,296 | | | 9,570 | | | 5.82 | | | | 139,429 | | | 8,234 | | | 5.91 | | | | 101,923 | | | 6,072 | | | 5.96 | |
U.S. government agency obligations | | | 94,801 | | | 3,663 | | | 3.86 | | | | 114,190 | | | 4,576 | | | 4.01 | | | | 122,573 | | | 4,879 | | | 3.98 | |
Corporate bonds & other securities | | | 9,278 | | | 482 | | | 5.20 | | | | 5,727 | | | 423 | | | 7.39 | | | | 5,755 | | | 343 | | | 5.96 | |
Federal funds sold & securities purchased under agreements to resell | | | 17,875 | | | 314 | | | 1.76 | | | | 2,637 | | | 140 | | | 5.31 | | | | 5,426 | | | 281 | | | 5.18 | |
Loans, including non-accrual loans | | | | | | | | | | | | | | | | | | | | | | | | | | | | | | |
Commercial, financial & agricultural loans | | | 223,722 | | | 14,568 | | | 6.51 | | | | 193,885 | | | 16,213 | | | 8.36 | | | | 185,548 | | | 15,192 | | | 8.19 | |
Commercial real estate mortgages | | | 329,121 | | | 23,562 | | | 7.16 | | | | 298,632 | | | 22,480 | | | 7.53 | | | | 305,121 | | | 22,883 | | | 7.50 | |
Real estate construction loans | | | 106,608 | | | 8,594 | | | 8.06 | | | | 84,610 | | | 8,786 | | | 10.38 | | | | 71,290 | | | 7,283 | | | 10.22 | |
Residential mortgages (1st and 2nd liens) | | | 194,915 | | | 12,175 | | | 6.25 | | | | 158,294 | | | 10,160 | | | 6.42 | | | | 134,687 | | | 8,829 | | | 6.56 | |
Home equity loans | | | 68,972 | | | 3,799 | | | 5.51 | | | | 68,239 | | | 5,725 | | | 8.39 | | | | 78,464 | | | 6,373 | | | 8.12 | |
Consumer loans | | | 95,030 | | | 6,672 | | | 7.02 | | | | 98,739 | | | 7,084 | | | 7.17 | | | | 115,807 | | | 7,766 | | | 6.71 | |
Other loans | | | 3,108 | | | — | | | — | | | | 2,489 | | | — | | | — | | | | 1,671 | | | — | | | — | |
| | | | | | | | | | | | | | | | | | | | | | | | | | | | | | |
Total interest-earning assets | | $ | 1,463,720 | | $ | 91,733 | | | 6.27 | % | | $ | 1,320,226 | | $ | 91,899 | | | 6.96 | % | | $ | 1,313,894 | | $ | 88,288 | | | 6.72 | % |
| | | | | | | | | | | | | | | | | | | | | | | | | | | | | | |
Cash & due from banks | | $ | 45,718 | | | | | | | | | $ | 46,744 | | | | | | | | | $ | 47,044 | | | | | | | |
Other non-interest-earning assets | | | 45,300 | | | | | | | | | | 45,611 | | | | | | | | | | 47,713 | | | | | | | |
| | | | | | | | | | | | | | | | | | | | | | | | | | | | | | |
Total assets | | $ | 1,554,738 | | | | | | | | | $ | 1,412,581 | | | | | | | | | $ | 1,408,651 | | | | | | | |
Interest-bearing liabilities | | | | | | | | | | | | | | | | | | | | | | | | | | | | | | |
Saving, N.O.W. & money market deposits | | $ | 467,180 | | $ | 6,334 | | | 1.36 | % | | $ | 417,472 | | $ | 4,838 | | | 1.16 | % | | $ | 475,634 | | $ | 4,791 | | | 1.01 | % |
Time deposits | | | 319,888 | | | 9,852 | | | 3.08 | | | | 311,098 | | | 13,275 | | | 4.27 | | | | 245,996 | | | 8,748 | | | 3.56 | |
| | | | | | | | | | | | | | | | | | | | | | | | | | | | | | |
Total saving & time deposits | | | 787,068 | | | 16,186 | | | 2.06 | | | | 728,570 | | | 18,113 | | | 2.49 | | | | 721,630 | | | 13,539 | | | 1.88 | |
Federal funds purchased & securities sold under agreements to repurchase | | | 49,260 | | | 1,417 | | | 2.88 | | | | 54,531 | | | 2,876 | | | 5.27 | | | | 58,678 | | | 2,955 | | | 5.04 | |
Other borrowings | | | 157,618 | | | 4,635 | | | 2.94 | | | | 79,328 | | | 4,128 | | | 5.20 | | | | 78,833 | | | 4,005 | | | 5.08 | |
| | | | | | | | | | | | | | | | | | | | | | | | | | | | | | |
Total interest-bearing liabilities | | $ | 993,946 | | $ | 22,238 | | | 2.24 | % | | $ | 862,429 | | $ | 25,117 | | | 2.91 | % | | $ | 859,141 | | $ | 20,499 | | | 2.39 | % |
| | | | | | | | | | | | | | | | | | | | | | | | | | | | | | |
Rate spread | | | | | | | | | 4.03 | % | | | | | | | | | 4.05 | % | | | | | | | | | 4.33 | % |
Non-interest-bearing deposits | | $ | 430,610 | | | | | | | | | $ | 425,553 | | | | | | | | | $ | 431,067 | | | | | | | |
Other non-interest-bearing liabilities | | | 16,906 | | | | | | | | | | 21,547 | | | | | | | | | | 16,342 | | | | | | | |
| | | | | | | | | | | | | | | | | | | | | | | | | | | | | | |
Total liabilities | | $ | 1,441,462 | | | | | | | | | $ | 1,309,529 | | | | | | | | | $ | 1,306,550 | | | | | | | |
Stockholders’ equity | | | 113,276 | | | | | | | | | | 103,052 | | | | | | | | | | 102,101 | | | | | | | |
| | | | | | | | | | | | | | | | | | | | | | | | | | | | | | |
Total liabilities & stockholders’ equity | | $ | 1,554,738 | | | | | | | | | $ | 1,412,581 | | | | | | | | | $ | 1,408,651 | | | | | | | |
Net interest income (taxable-equivalent basis) & effective interest rate differential | | | | | $ | 69,495 | | | 4.75 | % | | | | | $ | 66,782 | | | 5.06 | % | | | | | $ | 67,789 | | | 5.16 | % |
Less: taxable-equivalent basis adjustment | | | | | | (3,275 | ) | | | | | | | | | (2,818 | ) | | | | | | | | | (2,079 | ) | | | |
| | | | | | | | | | | | | | | | | | | | | | | | | | | | | | |
Net interest income | | | | | $ | 66,220 | | | | | | | | | $ | 63,964 | | | | | | | | | $ | 65,710 | | | | |
| | | | | | | | | | | | | | | | | | | | | | | | | | | | | | |
Interest income on a taxable-equivalent basis includes the additional amount of interest income that would have been earned if Suffolk’s investment in nontaxable U.S. Treasury securities and state and municipal obligations had been subject to New York State and federal income taxes yielding the same after-tax income. The rate used for this adjustment was approximately 34 percent for federal income taxes and 9 percent for New York State income taxes for all periods. For each of the years 2008, 2007, and 2006, $1.00 of nontaxable income from obligations of states and political subdivisions equates to fully taxable income of $1.52, and $1.00 of nontaxable income from taxable obligations of state and political subdivisions equates to fully taxable income of $1.50. In addition, in 2008, 2007, and 2006, $1.00 of nontaxable income on U.S. Treasury securities equates to $1.02 of fully taxable income. Various loan fees included in interest income amounted to $1,817,000, $2,156,000, and $2,664,000 in 2008, 2007, and 2006, respectively.
9
Analysis of Changes in Net Interest Income
The table below presents a summary of changes in interest income, interest expense, and the resulting net interest income on a taxable-equivalent basis for the periods presented, each as compared with the preceding period. Because of numerous, simultaneous changes in volume and rate during the period, it is not possible to allocate precisely the changes between volumes and rates. In this table changes not due solely to volume or to rate have been allocated to these categories based on percentage changes in average volume and average rate as they compare to each other: (in thousands)
| | | | | | | | | | | | | | | | | | | | | | | | |
| | | In 2008 over 2007
Changes Due to | | | In 2007 over 2006
Changes Due to | |
| | | Volume | | | Rate | | | Net Change | | | Volume | | | Rate | | | Net Change | |
Interest-earning assets | | | | | | | | | | | | | | | | | | | | | | | | |
U.S. Treasury securities | | $ | 19 | | | $ | (18 | ) | | $ | 1 | | | $ | (2 | ) | | $ | 3 | | | $ | 1 | |
Collateralized mortgage obligations | | | 129 | | | | 144 | | | | 273 | | | | (1,566 | ) | | | 1,284 | | | | (282 | ) |
Mortgage-backed securities | | | (16 | ) | | | (2 | ) | | | (18 | ) | | | (29 | ) | | | 1 | | | | (28 | ) |
Obligations of states & political subdivisions | | | 1,450 | | | | (113 | ) | | | 1,337 | | | | 2,218 | | | | (56 | ) | | | 2,162 | |
U.S. government agency obligations | | | (754 | ) | | | (159 | ) | | | (913 | ) | | | (336 | ) | | | 33 | | | | (303 | ) |
Corporate bonds & other securities | | | 210 | | | | (151 | ) | | | 59 | | | | (2 | ) | | | 82 | | | | 80 | |
Federal funds sold & securities purchased under agreements to resell | | | 324 | | | | (150 | ) | | | 174 | | | | (148 | ) | | | 7 | | | | (141 | ) |
Loans, including non-accrual loans | | | 8,495 | | | | (9,574 | ) | | | (1,079 | ) | | | 949 | | | | 1,173 | | | | 2,122 | |
| | | | | | | | | | | | | | | | | | | | | | | | |
Total interest-earning assets | | $ | 9,857 | | | $ | (10,023 | ) | | $ | (166 | ) | | $ | 1,084 | | | $ | 2,527 | | | $ | 3,611 | |
| | | | | | | | | | | | | | | | | | | | | | | | |
Interest-bearing liabilities | | | | | | | | | | | | | | | | | | | | | | | | |
Saving, N.O.W., & money market deposits | | $ | 616 | | | $ | 880 | | | $ | 1,496 | | | $ | (625 | ) | | $ | 672 | | | $ | 47 | |
Time deposits | | | 365 | | | | (3,788 | ) | | | (3,423 | ) | | | 2,579 | | | | 1,948 | | | | 4,527 | |
Federal funds purchased & securities sold under agreements to repurchase | | | (256 | ) | | | (1,203 | ) | | | (1,459 | ) | | | (215 | ) | | | 136 | | | | (79 | ) |
Other borrowings | | | 2,844 | | | | (2,337 | ) | | | 507 | | | | 25 | | | | 98 | | | | 123 | |
| | | | | | | | | | | | | | | | | | | | | | | | |
Total interest-bearing liabilities | | $ | 3,569 | | | $ | (6,448 | ) | | $ | (2,879 | ) | | $ | 1,764 | | | $ | 2,854 | | | $ | 4,618 | |
| | | | | | | | | | | | | | | | | | | | | | | | |
Net change in net interest income (taxable-equivalent basis) | | $ | 6,288 | | | $ | (3,575 | ) | | $ | 2,713 | | | $ | (680 | ) | | $ | (327 | ) | | $ | (1,007 | ) |
| | | | | | | | | | | | | | | | | | | | | | | | |
Interest Income
Interest income decreased to $88,457,000 in 2008, down .7 percent from $89,081,000 in 2007, which was up 3.3 percent from $86,209,000 in 2006.
Investment Securities
SCNB purchases investment securities only after a disciplined evaluation to ensure that they are the most appropriate available given the company’s objectives. Key factors include:
| | • | | Liquidity – the ease with which the security can be pledged or sold. |
| | • | | Credit Quality – the likelihood the security will perform according to its original terms, with timely payments of principal and interest. |
| | • | | Yield – the rate of return on the investment, balanced against the first two. |
Investment securities are also selected in consideration of certain key risks to:
| | • | | Market value – the market value of fixed-rate securities increases when interest rates fall, and decreases when interest rates rise. The longer the maturity of the security, the greater this effect. |
| | • | | Income risk – how long fixed payments can be assured. The shorter the duration of the portfolio, the greater this risk. |
| | • | | Asset liability management – seeks to limit the change in net interest income as a result of changing interest rates. For example, when the maturities or the intervals between the re-pricing of investments are longer than those of the liabilities that fund them, net interest income will decline when rates rise because payments from those securities will remain the same while payments to depositors or other banks from which SCNB has borrowed will increase. This is referred to as “asset-sensitive.” Conversely, when investments mature or are re-priced sooner than their funding, net interest income may decline when interest rates fall as income declines the same while funding expense remains the same. Asset liability management attempts to manage the duration of the investment portfolio, as well as that of the funding to minimize the risk to net interest income while maximizing returns. |
10
The company seeks to create a portfolio that is diversified across different classes of assets. Historically, bonds have returned more than cash, and been less volatile than mortgage-backed securities (“MBS”). The steady return on bonds can also offset the decline in variable loan yields as interest rates fall. Collateralized mortgage obligations (“CMO’s”) provide more predictable cash flows because payments are assigned to specific securities (“tranches” or slices) in the order in which they are received, in contrast to a traditional security backed by a pool of mortgages in which investors share payments equally pro rata, based on the percentage of the pool they own. Analysis of CMO’s requires careful due diligence of the mortgages that serve as the underlying collateral. Suffolk has never owned mortgage obligations with underlying collateral that could be classified as “sub-prime.” Tranche structure, final maturity and credit support also provide improved assurance of repayment. Suffolk reviews its investments for impairment regularly, and to date, none has been determined to be impaired.
Average investment in U.S. government agency securities decreased to $94,801,000 from $114,190,000 in 2007, and $122,573,000 in 2006. Average balances of CMO’s increased to $145,285,000 in 2008 from $142,876,000 in 2007, and decreased from $174,680,000 in 2006. Average investments in municipal securities increased to $164,296,000 in 2008, up from $139,429,000 in 2007 and $101,923,000 in 2006. U.S. Treasury, U.S. government agency, collateralized mortgage obligations, and municipal securities provide collateral for various liabilities to municipal depositors. Securities are Suffolk’s primary source of liquidity. With regard to securities characterized as available for sale, in general, Suffolk has the intent and ability to hold them until maturity. The following table summarizes Suffolk’s investment securities available for sale and held to maturity as of the dates indicated: (in thousands)
| | | | | | | | | |
December 31, | | 2008 | | 2007 | | 2006 |
Investment securities available for sale, at fair value: | | | | | | | | | |
U.S. Treasury securities | | $ | 10,152 | | $ | 9,838 | | $ | 9,423 |
U.S. government agency debt securities | | | 76,477 | | | 105,066 | | | 122,883 |
Collateralized mortgage obligations agency issues | | | 131,841 | | | 129,562 | | | 156,239 |
Mortgage-backed securities | | | 595 | | | 859 | | | 1,072 |
Obligations of states & political subdivisions | | | 163,292 | | | 147,471 | | | 113,629 |
| | | | | | | | | |
Total investment securities available for sale | | | 382,357 | | | 392,796 | | | 403,246 |
| | | | | | | | | |
Investment securities held to maturity: | | | | | | | | | |
Obligations of states & political subdivisions | | | 11,830 | | | 9,055 | | | 9,913 |
Corporate bonds & other securities | | | 10,559 | | | 8,556 | | | 5,184 |
| | | | | | | | | |
Total investment securities held to maturity | | | 22,389 | | | 17,611 | | | 15,097 |
| | | | | | | | | |
Total investment securities | | $ | 404,746 | | $ | 410,407 | | $ | 418,343 |
| | | | | | | | | |
Fair value of investment securities held to maturity | | $ | 22,974 | | $ | 18,199 | | $ | 15,647 |
Unrealized gains | | | 596 | | | 603 | | | 588 |
Unrealized losses | | | 11 | | | 15 | | | 38 |
| | | | | | | | | |
11
The amortized cost, maturities, and approximate weighted average yields, at December 31, 2008 are as follows: (in thousands)
| | | | | | | | | | | | | | | | | | | | | | | | | | | | | | | | | | | |
| | | Available for Sale | | | Held to Maturity | | | | | |
| | | U.S. Treasury
Securities | | | U.S.
Govt. Agency
Debt | | | Obligations of
States & Political
Subdivisions | | | Obligations of
States & Political
Subdivisions | | | Corporate
Bonds
&
Other Securities | | | | | |
Maturity (in years) | | Fair
Value | | Yield | | | Fair
Value | | Yield | | | Fair
Value | | Yield | | | Amortized
Cost | | Yield | | | Amortized
Cost | | Yield | | Total | | Yield | |
Within 1 | | $ | 3,575 | | 3.47 | % | | $ | 68,937 | | 3.85 | | | $ | 1,007 | | 3.98 | | | $ | 4,946 | | 2.40 | % | | $ | — | | — | | $ | 78,465 | | 3.74 | % |
After 1 but within 5 | | | 6,577 | | 4.58 | | | | 7,540 | | 3.21 | % | | | 7,543 | | 3.59 | | | | 1,580 | | 4.21 | % | | | — | | — | | $ | 23,240 | | 3.79 | % |
After 5 but within 10 | | | — | | — | | | | — | | — | | | | 121,547 | | 3.76 | | | | 5,196 | | 5.56 | | | | — | | — | | $ | 126,743 | | 3.83 | % |
After 10 | | | — | | — | | | | — | | — | | | | 33,195 | | 4.03 | % | | | 108 | | 3.81 | % | | | — | | — | | $ | 33,303 | | 4.03 | % |
Other securities | | | — | | — | | | | — | | — | | | | — | | — | | | | — | | — | | | | 10,559 | | — | | $ | 10,559 | | — | |
| | | | | | | | | | | | | | | | | | | | | | | | | | | | | | | | | | | |
Subtotal | | $ | 10,152 | | 4.19 | % | | $ | 76,477 | | 3.79 | % | | $ | 163,292 | | 3.81 | % | | $ | 11,830 | | 4.04 | % | | $ | 10,559 | | — | | $ | 272,310 | | 3.68 | % |
Collateralized mortgage obligations | | | | | | | | | | | | | | | | | | | | | | $ | 131,841 | | 5.51 | % |
Mortgage-backed securities | | | | | | | | | | | | | | | | | | | | | | | | | | | | | | | $ | 595 | | 7.38 | % |
Total | | $ | 10,152 | | 4.19 | % | | $ | 76,477 | | 3.79 | % | | $ | 163,292 | | 3.81 | % | | $ | 11,830 | | 4.04 | % | | $ | 10,559 | | — | | $ | 404,746 | | 4.28 | % |
| | | | | | | | | | | | | | | | | | | | | | | | | | | | | | | | | | | |
As a member of the Federal Reserve System, the Bank owns Federal Reserve Bank stock with a book value of $638,000. Being an equity investment, the stock has no maturity. There is no public market for this investment. The last dividend was 6.0 percent.
As a member of the Federal Home Loan Bank of New York, the Bank owns Federal Home Loan Bank of New York stock with a book value of $9,821,000. As of December 31, 2008, the Bank owns 13,971 shares valued at $1,397,000 as its membership portion. The remaining $8,424,000 in stock is owned based on borrowing activity requirements. Being an equity investment, the stock has no maturity. There is no public market for this investment. The last declared dividend was 1.09 percent.
Loan Portfolio
Loans, net of unearned discounts but before the allowance for loan losses, totaled $1,093,521,000. Loans secured by commercial real estate amounted to $352,502,000 and comprise 32.2 percent of the portfolio, the largest single component, up from $317,262,000 in 2007, and $290,893,000 in 2006. Commercial and industrial loans followed at $220,946,000, up 8.2 percent from $204,222,000 at the end of 2007. These loans are made to small local businesses throughout Suffolk County. Commercial loan balances are seasonal, particularly in the Hamptons where retail inventories rise in the spring and decline by autumn. Consumer loans are a declining part of the portfolio. Net of unearned discounts, they totaled $94,691,000 at the end of 2008, down 4.6 percent from $99,298,000 at year-end 2007. Consumer loans include indirect, dealer-generated automobile loans. Competition among commercial banks and with captive finance companies of automobile manufacturers has reduced yields and volume. Additionally, rising fuel costs and uncertainties regarding the economy have led to a decline in consumer confidence, affecting automobile sales. Regional financial institutions have tightened their lending activities as a result of turmoil in the credit markets, offering continuing opportunity for real estate construction, residential and commercial mortgage lending.
The remaining significant components of the loan portfolio are residential mortgages at $216,127,000, up 17.1 percent from $184,599,000; home equity loans at $75,654,000, up 12.8 percent from $67,081,000; and construction loans at $131,889,000, up 57.5 percent from $83,715,000. Construction loans increased primarily because of new borrowers whose former banks were no longer in a position to lend to them as a result of the current credit crisis. These loans have been underwritten on the basis of reasonable ratios of loan to value, conservative evaluations of projected cash flows, guarantees for permanent financing in place prior to granting the interim credit, and the ability of the borrower to repay the loan from sources other than the sale of the secured property.
The following table categorizes total loans (net of unearned discounts) at December 31: (in thousands)
| | | | | | | | | | | | | | | | | | | | | | | | | | | | | | |
| | | 2008 | | | 2007 | | | 2006 | | | 2005 | | | 2004 | |
Commercial, financial & agricultural loans | | $ | 220,946 | | 20.2 | % | | $ | 204,222 | | 21.3 | % | | $ | 182,801 | | 20.5 | % | | $ | 179,522 | | 19.9 | % | | $ | 158,204 | | 19.2 | % |
Commercial real estate mortgages | | | 352,502 | | 32.2 | % | | | 317,262 | | 33.1 | % | | | 290,893 | | 32.7 | % | | | 306,754 | | 34.0 | % | | | 260,779 | | 31.7 | % |
Real estate - construction loans | | | 131,889 | | 12.1 | % | | | 83,715 | | 8.7 | % | | | 80,687 | | 9.1 | % | | | 67,411 | | 7.5 | % | | | 50,455 | | 6.1 | % |
Residential mortgages (1st and 2nd liens) | | | 216,127 | | 19.8 | % | | | 184,599 | | 19.3 | % | | | 154,959 | | 17.4 | % | | | 130,853 | | 14.5 | % | | | 114,826 | | 13.9 | % |
Home equity loans | | | 75,654 | | 6.9 | % | | | 67,081 | | 7.0 | % | | | 76,361 | | 8.6 | % | | | 80,775 | | 8.9 | % | | | 75,484 | | 9.2 | % |
Consumer loans | | | 94,691 | | 8.7 | % | | | 99,298 | | 10.4 | % | | | 103,054 | | 11.6 | % | | | 132,802 | | 14.7 | % | | | 161,964 | | 19.7 | % |
Other loans | | | 1,712 | | 0.2 | % | | | 1,104 | | 0.1 | % | | | 892 | | 0.1 | % | | | 4,956 | | 0.5 | % | | | 1,847 | | 0.2 | % |
| | | | | | | | | | | | | | | | | | | | | | | | | | | | | | |
Total loans (net of unearned discounts) | | $ | 1,093,521 | | 100 | % | | $ | 957,281 | | 100 | % | | $ | 889,647 | | 100 | % | | $ | 903,073 | | 100 | % | | $ | 823,559 | | 100 | % |
| | | | | | | | | | | | | | | | | | | | | | | | | | | | | | |
12
Non-Performing Loans
Generally, recognition of interest income is discontinued when reasonable doubt exists as to whether interest can be collected. Ordinarily, loans no longer accrue interest when 90 days past due. When a loan stops accruing interest, all interest accrued in the current year, but not collected, is reversed against interest income in the current year. Any interest accrued in prior years is charged against the allowance for loan losses. Loans start accruing interest again when they become current as to principal and interest, and when, in the opinion of management, they can be collected in full.
The following table shows non-accrual, past due, and restructured loans at December 31: (in thousands)
| | | | | | | | | | | | | | | |
| | | 2008 | | 2007 | | 2006 | | 2005 | | 2004 |
Loans accruing but past due contractually | | | | | | | | | | | | | | | |
90 days or more | | $ | 699 | | $ | 23 | | $ | 68 | | $ | — | | $ | — |
Loans not accruing interest | | | 4,185 | | | 1,648 | | | 824 | | | 4,459 | | | 5,337 |
Restructured loans | | | — | | | — | | | — | | | — | | | 27 |
| | | | | | | | | | | | | | | |
Total | | $ | 4,884 | | $ | 1,671 | | $ | 892 | | $ | 4,459 | | $ | 5,364 |
| | | | | | | | | | | | | | | |
Interest on loans that are restructured or are no longer accruing interest would have amounted to about $214,000 for 2008 under the contractual terms of those loans. Suffolk records the payment of interest on such loans as a reduction of principal. Interest income recognized on restructured and non-accrual loans was immaterial for the years 2008, 2007, and 2006. Suffolk has a formal procedure for internal credit review to more precisely identify risk and exposure in the loan portfolio.
Summary of Loan Losses and Allowance for Loan Losses
The allowance for loan losses is determined by continuous analysis of the loan portfolio. That analysis includes changes in the size and composition of the portfolio, historical loan losses, industry-wide losses, current and anticipated economic trends, and details about individual loans. It also includes estimates of the actual value of collateral and other possible sources of repayment. There can be no assurance that the allowance is, in fact, adequate. When a loan, in full or in part, is deemed uncollectible, it is charged against the allowance. This happens when it is well past due and the borrower has not shown the ability or intent to make the loan current, or the borrower does not have enough assets to pay the debt, or the value of the collateral is less than the balance of the loan and not likely to improve soon. Residential real estate and consumer loans are analyzed as a group and not individually because of the large number of loans, small balances, and historically low losses. In the future, the provision for loan losses may change as a percentage of total loans. The percentage of net charge-offs to average net loans during 2008 was 0.06 percent, compared to net recoveries of 0.01 percent in 2007, and net charge-offs of 0.36 percent during 2006. A single credit, the circumstances of which are particular to that loan, was charged off during 2006. Management does not believe that it is reflective of a systemic weakness in the loan portfolio or of the underwriting standards and procedures. The ratio of the allowance for loan losses to loans, net of discounts, was 0.83 percent at the end of 2008, up from 0.80 percent in 2007 and down from 0.85 percent in 2006. A summary of transactions follows: (in thousands)
| | | | | | | | | | | | | | | |
Year ended December 31, | | 2008 | | 2007 | | 2006 | | 2005 | | 2004 |
Allowance for loan losses, January 1, | | $ | 7,672 | | $ | 7,551 | | $ | 9,828 | | $ | 8,210 | | $ | 8,551 |
| | | | | |
Loans charged-off: | | | | | | | | | | | | | | | |
Commercial, financial & agricultural loans | | | 694 | | | 133 | | | 3,547 | | | 180 | | | 2,130 |
Commercial real estate mortgages | | | — | | | — | | | — | | | — | | | — |
Real estate - construction loans | | | — | | | — | | | — | | | — | | | — |
Residential mortgages (1st and 2nd liens) | | | — | | | — | | | — | | | — | | | — |
Home equity loans | | | — | | | — | | | — | | | — | | | — |
Consumer loans | | | 337 | | | 48 | | | 210 | | | 428 | | | 1,059 |
Other loans | | | — | | | — | | | — | | | — | | | — |
| | | | | | | | | | | | | | | |
Total Charge-offs | | $ | 1,031 | | $ | 181 | | $ | 3,757 | | $ | 608 | | $ | 3,189 |
| | | | | | | | | | | | | | | |
13
| | | | | | | | | | | | | | | | | | |
Loans recovered after being charge-off | | 2008 | | | 2007 | | | 2006 | | 2005 | | | 2004 |
Commercial, financial & agricultural loans | | | 155 | | | | 79 | | | | 56 | | | 46 | | | | 50 |
Commercial real estate mortgages | | | — | | | | — | | | | — | | | — | | | | — |
Real estate – construction loans | | | — | | | | — | | | | — | | | — | | | | — |
Residential mortgages (1st and 2nd liens) | | | — | | | | — | | | | — | | | — | | | | — |
Home equity loans | | | — | | | | — | | | | — | | | — | | | | — |
Consumer loans | | | 234 | | | | 236 | | | | 458 | | | 605 | | | | 825 |
Other loans | | | — | | | | — | | | | — | | | — | | | | — |
| | | | | | | | | | | | | | | | | | |
Total recoveries | | $ | 389 | | | $ | 315 | | | $ | 514 | | $ | 651 | | | $ | 875 |
| | | | | | | | | | | | | | | | | | |
Net loans charged-off (recovered) | | | 642 | | | | (134 | ) | | | 3,243 | | | (43 | ) | | | 2,314 |
Reclass to Allowance for Contingent Liabilities (1) | | | (29 | ) | | | (390 | ) | | | — | | | — | | | | — |
Provision for loan losses | | | 2,050 | | | | 377 | | | | 966 | | | 1,575 | | | | 1,973 |
| | | | | | | | | | | | | | | | | | |
Allowance for loan losses, December 31 | | $ | 9,051 | | | $ | 7,672 | | | $ | 7,551 | | $ | 9,828 | | | $ | 8,210 |
| | | | | | | | | | | | | | | | | | |
| (1) | Prior year amounts not reclassified due to immateriality. |
The following table summarizes the allowance for loan losses allocated by loan type: (dollars in thousands)
| | | | | | | | | | | | | | | | | | | | | | | | | | | | | |
As of December 31, | | 2008 | | % of
Total | | | 2007 | | % of
Total | | | 2006 | | % of
Total | | | 2005 | | % of
Total | | | 2004 | | % of
Total | |
Commercial, financial & agricultural loans | | $ | 3,875 | | 42.8 | % | | $ | 3,762 | | 49.0 | %$ | | 2,852 | | 37.7 | % | | $ | 5,209 | | 53.0 | % | | $ | 4,004 | | 48.8 | % |
Commercial real estate mortgages | | | 2,780 | | 30.7 | % | | | 2,264 | | 29.5 | % | | 2,139 | | 28.3 | % | | | 2,431 | | 24.7 | % | | | 2,597 | | 31.6 | % |
Real estate – construction loans | | | 875 | | 9.7 | % | | | 542 | | 7.1 | % | | 518 | | 6.9 | % | | | 388 | | 4.0 | % | | | 261 | | 3.2 | % |
Residential mortgages (1st and 2nd liens) | | | 538 | | 5.9 | % | | | 239 | | 3.1 | % | | 190 | | 2.5 | % | | | 162 | | 1.7 | % | | | 215 | | 2.6 | % |
Home equity loans | | | 436 | | 4.8 | % | | | 290 | | 3.8 | % | | 450 | | 6.0 | % | | | 502 | | 5.1 | % | | | 540 | | 6.6 | % |
Consumer loans | | | 384 | | 4.2 | % | | | 334 | | 4.4 | % | | 272 | | 3.6 | % | | | 434 | | 4.4 | % | | | 593 | | 7.2 | % |
Allocated to general pool | | | 163 | | 1.9 | % | | | 241 | | 3.1 | % | | 1,130 | | 15.0 | % | | | 702 | | 7.1 | % | | | — | | 0.0 | % |
| | | | | | | | | | | | | | | | | | | | | | | | | | | | | |
Allowance for loan losses | | $ | 9,051 | | 100 | % | | $ | 7,672 | | 100 | %$ | | 7,551 | | 100 | % | | $ | 9,828 | | 100 | % | | $ | 8,210 | | 100 | % |
| | | | | | | | | | | | | | | | | | | | | | | | | | | | | |
The following table presents information concerning loan balances and asset quality: (dollars in thousands)
| | | | | | | | | | | | | | | | | | | | |
Year ended December 31, | | 2008 | | | 2007 | | | 2006 | | | 2005 | | | 2004 | |
Loans, net of discounts: | | | | | | | | | | | | | | | | | | | | |
Average | | $ | 1,021,476 | | | $ | 904,887 | | | $ | 892,588 | | | $ | 854,158 | | | $ | 816,765 | |
At end of period | | | 1,093,521 | | | | 957,281 | | | | 889,647 | | | | 903,073 | | | | 823,559 | |
Non-performing assets/total loans, net of discounts (1) | | | 0.45 | % | | | 0.17 | % | | | 0.10 | % | | | 0.49 | % | | | 0.65 | % |
Non-performing assets/total assets (1) | | | 0.31 | | | | 0.11 | | | | 0.06 | | | | 0.32 | | | | 0.40 | |
Ratio of net charge-offs (recoveries)/average net loans | | | 0.06 | | | | (0.01 | ) | | | 0.36 | | | | (0.01 | ) | | | 0.28 | |
Net charge-offs (recoveries)/net loans at December 31, | | | 0.06 | | | | (0.01 | ) | | | 0.36 | | | | (0.00 | ) | | | 0.28 | |
Allowance for loan losses/loans, net of discounts | | | 0.83 | | | | 0.80 | | | | 0.85 | | | | 1.09 | | | | 1.00 | |
| | | | | | | | | | | | | | | | | | | | |
| (1) | Non-performing assets include non-performing loans and other real estate owned (“OREO”). There was no OREO as of December 31, 2008. |
Interest Expense
Interest expense in 2008 was $22,237,000, down from $25,117,000 the year before, which was up from $20,499,000 during 2006. Most interest was paid for the deposits of individuals, businesses, and various governments and their agencies. Borrowings include federal funds purchased (short-term lending by other banks), securities sold under agreements to repurchase, and Federal Home Loan Bank borrowings. The Federal Reserve Bank discount window was available though not used during 2008. Borrowings averaged $206,878,000 during 2008, $133,859,000 during 2007, and $137,511,000 during 2006.
Deposits
Average interest-bearing deposits increased to $787,068,000 in 2008, up 8.0 percent from $728,570,000 in 2007. Saving, N.O.W., and money market deposits increased during 2008, averaging $467,180,000, up 11.9 percent from 2007 when they averaged $417,472,000. Average time certificates of less than $100,000 totaled $179,159,000, down 11.3 percent from $201,941,000 in 2007. Average time certificates of $100,000 or more totaled $140,729,000, up 28.9% from $109,157,000 during 2007. During 2008, the Bank entered into an agreement with a broker for the purpose of issuing brokered certificates of deposits. As of December 31, 2008, the Bank had issued $6,061,000 in brokered certificates of deposits. A portion of the Bank’s demand deposits are reclassified as savings accounts on a daily basis. The sole purpose of the reclassification is to reduce the non-interest-bearing reserve balances that the Bank is required to maintain with the Federal Reserve Bank, and thereby increase funds available for investment. Although these balances are classified as saving accounts for regulatory purposes, they are included in demand deposits in the accompanying consolidated statements of condition.
14
The following table classifies average deposits for each of the periods indicated: (in thousands)
| | | | | | | | | | | | | | | | | | |
| | | 2008 | | | | | 2007 | | | | | 2006 | | | |
| | Average | | Average
Rate Paid | | | Average | | Average
Rate Paid | | | Average | | Average
Rate Paid | |
Demand deposits | | $ | 430,610 | | | | | $ | 425,553 | | | | | $ | 431,067 | | | |
Saving deposits | | | 240,360 | | 0.84 | % | | | 255,276 | | 0.82 | % | | | 301,457 | | 0.69 | % |
N.O.W. & money market deposits | | | 226,820 | | 1.90 | | | | 162,196 | | 1.70 | | | | 174,177 | | 1.55 | |
Time certificates of $100,000 or more | | | 140,729 | | 2.89 | | | | 109,157 | | 4.67 | | | | 46,887 | | 4.34 | |
Other time deposits | | | 179,159 | | 3.23 | | | | 201,941 | | 4.05 | | | | 199,109 | | 3.37 | |
| | | | | | | | | | | | | | | | | | |
Total deposits | | $ | 1,217,678 | | | | | $ | 1,154,123 | | | | | $ | 1,152,697 | | | |
| | | | | | | | | | | | | | | | | | |
At December 31, 2008, the remaining maturities of time certificates of $100,000 or more were as follows: (in thousands)
| | | |
3 months or less | | $ | 125,632 |
Over 3 through 6 months | | | 5,208 |
Over 6 through 12 months | | | 5,319 |
Over 12 months | | | 2,442 |
| | | |
Total | | $ | 138,601 |
| | | |
Borrowings
Suffolk uses both short-term and long-term funding when it is advantageous to do so in comparison with the alternatives. This includes borrowings from the Federal Home Loan Bank, lines of credit for federal funds with correspondent banks, and repurchase agreements.
The following table summarizes borrowings: (dollars in thousands)
| | | | | | | | | | | | | | | | | | | | | | | | |
| | | Federal Home Loan
Bank Borrowings | | | Repurchase
Agreements | | | Federal Funds
Purchased | |
| | | 2008 | | | 2007 | | | 2008 | | | 2007 | | | 2008 | | | 2007 | |
December 31, balance | | $ | 187,200 | | | $ | 143,500 | | | $ | 37,620 | | | $ | 54,820 | | | $ | — | | | $ | — | |
Weighted-average interest rate on balances outstanding | | | 2.32 | % | | | 4.26 | % | | | 2.45 | % | | | 4.45 | % | | | — | % | | | — | % |
Maximum amount outstanding at any month-end | | $ | 219,400 | | | $ | 143,500 | | | $ | 54,820 | | | $ | 54,820 | | | $ | 15,000 | | | $ | — | |
Daily average outstanding | | $ | 157,618 | | | $ | 79,328 | | | $ | 58,176 | | | $ | 55,930 | | | $ | 1,084 | | | $ | 601 | |
Average interest rate paid | | | 2.94 | % | | | 5.20 | % | | | 2.87 | % | | | 5.28 | % | | | 3.01 | % | | | 4.87 | % |
Other Income
Other income increased to $14,643,000 during 2008, up 38.2 percent from $10,595,000 during 2007, which was down 0.7 percent from $10,672,000 during 2006. Service charges on deposit accounts increased 2.7 percent from 2007 to 2008, and decreased 2.5 percent from 2006 to 2007. Other service charges were up 2.2 percent and down 3.7 percent for the same periods, respectively. Fiduciary fees in 2008 totaled $1,460,000, up 3.6 percent from 2007 when they amounted to $1,409,000, which was up 12.5 percent from 2006, at $1,252,000.
Included in other income is net securities gains, $3,737,000, ($2,429,000, net of provision for income taxes) of which pertain to the proceeds realized from the sale of shares issued by Visa, Inc. in connection with its initial public offering. Suffolk’s subsidiary, Suffolk County National Bank, was a member of the former Visa, Inc. payments organization and was issued shares when Visa, Inc. was organized. Approximately 39 percent of those shares were redeemed in connection with the initial public offering. The remaining shares are restricted because of unsettled litigation pending against Visa, Inc. Accordingly, Suffolk has recorded these shares at zero in the accompanying statement of condition.
On October 14, 2008, Visa, Inc. announced that it had reached an agreement in principle with Discover Financial Services (“Discover”) to settle litigation pending since 2004, and that the specific terms of the settlement were still being negotiated and would be made available when a final agreement had been reached. On October 27, 2008, Visa, Inc. announced that it had agreed to settle litigation with Discover, for $1.8875 billion, which included $1.7425 billion from the escrow created under Visa, Inc.’s retrospective responsibility plan, $80 million from Visa, Inc. to obtain releases from MasterCard, and an additional $65 million which would be refunded by Morgan Stanley under a separate agreement related to the settlement; and that this settlement would be subject to approval by Visa, Inc.’s former U.S. member financial institutions. On October 31, 2008, officials of Visa, Inc. conducted a conference call providing additional information concerning the settlement, thus allowing Suffolk to compute conclusively the net amount of its liability under the settlement. Based on a total excess of settlements over the amount of litigation escrow provided by
15
Visa, Inc. of $807,500,000, Suffolk’s portion amounted to $455,995, resulting in an after-tax charge of $294,116, or $0.03 per share, recorded for the third quarter. On December 22, 2008, Visa, Inc., announced it deposited $1.1 billion into the litigation escrow account, effectively acting as a share repurchase program. As such, the conversion ratio of the remaining restricted shares was reduced, and the liability of $455,995 was reversed as of December 31, 2008.
Other Expense
During 2008, other expense was $42,701,000, up 5.7 percent from 2007 when it was $40,392,000, which was up 1.0 percent from $39,975,000 in 2006. Salaries and employee benefits increased 5.1 percent, and net occupancy expense grew by 14.3 percent as two new offices were opened and others moved to better locations. Other operating expense increased 5.7 percent, offset by a decrease in equipment expense of 2.8 percent. Deposits meeting certain regulatory criteria as to size held at SCNB are insured by the Federal Deposit Insurance Corporation (“FDIC”). The Federal Deposit Insurance Reform Act of 2005 merged the Bank Insurance Fund with the Savings Association Insurance Fund to form the Deposit Insurance Fund (“DIF”). The FDIC maintains the DIF by assessing depository institutions an insurance premium. The amount each institution is assessed is based upon statutory factors that include the balance of insured deposits as well as the degree of risk the institution poses to the insurance fund. SCNB is participating in the FDIC’s Transaction Guarantee Program. Under that program, through December 31, 2009, all non-interest-bearing transaction accounts are fully guaranteed by the FDIC for the entire amount in the account. Coverage under the Transaction Guarantee Program is in addition to and separate from the coverage available under the FDIC’s general deposit insurance rules. The FDIC granted a one-time initial assessment credit to recognize an institution’s past contributions to the DIF. For SCNB, this credit totaled $970,000. Up to ninety (90) percent of the credit may be applied to the annual assessment with the remainder carried forward to the next year. In 2008, approximately $340,000 of the remaining one-time initial assessment credit offset DIF premiums of $777,000. During 2009, SCNB expects FDIC premiums of approximately $1,500,000. The FDIC has raised insurance premiums to cover substantial losses incurred by the DIF due to recent bank failures of 2008 and those anticipated in the coming year. As a result, SCNB expects deposit insurance premiums to be higher for the foreseeable future than they have been in the recent past.
The provision for income taxes decreased from $11,662,000, for an effective income tax rate of 34.5 percent in 2007, to $11,423,000, for an effective income tax rate of 31.6 percent in 2008, primarily as a result of increased investment in municipal securities. Bank tax provisions of New York State Article 32 allows banking corporations to exclude from income 60 percent of the dividends it has received from subsidiaries such as a Real Estate Investment Trust (REIT). In recent years, similar provisions in the tax codes of other states have been repealed as those and other states have attempted to generate additional tax revenue. On various occasions over the course of a number of years, the tax commissioner of New York State has proposed the elimination of this provision, raising the question for New York State banking corporations as to whether this exclusion would remain in effect. Going forward, the Company may not realize the benefits of the exclusion from income 60 percent of the dividends received from the REIT, resulting in a higher effective state income tax rate.
Asset/Liability Management & Liquidity
The Asset/Liability Management Committee reviews Suffolk’s financial performance and compares it to the asset/liability management policy. The committee includes four outside directors, executive management, the senior lenders, the comptroller, and the head of risk management. It uses computer simulations to quantify interest rate risk and to project liquidity. The simulations also help the committee to develop contingent strategies to increase net interest income. The committee always assesses the impact of any change in strategy on Suffolk’s ability to make loans and repay deposits. Only strategies and policies that meet regulatory guidelines and that are appropriate under the economic and competitive circumstances are considered by the committee. Suffolk has not used forward contracts or interest rate swaps to manage interest rate risk.
Suffolk and its subsidiary manage liquidity to ensure that it has funds available, at a reasonable cost, to disburse funds as it becomes necessary, both in the ordinary course of business, and under extraordinary circumstances. These disbursements are made primarily to: depositors making withdrawals from their accounts; other banks when repaying borrowed funds; borrowers from the bank when funding loans to which the bank had previously made commitments; purchase investments; respond to unanticipated declines in deposits; take advantage of unanticipated opportunities to lend or invest which may help Suffolk to grow; and fund operations.
Suffolk’s principal sources of liquidity included cash and cash equivalents of $2.2 million as of December 31, 2008, a line of credit, and dividends from the Bank. Cash available for distribution of dividends to shareholders of Suffolk is derived primarily from dividends paid by the Bank to Suffolk. Regulatory restrictions limit the amount of dividends that may be paid by the Bank (see Capital Resources). Dividends from the Bank to Suffolk at December 31, 2008, were limited to $33 million, which represented the Bank’s net income for 2008 as well as its retained earnings for the previous two years. Prior approval from regulators is required if the total of all dividends declared by the Bank in any calendar year exceeds this amount. In the event that Suffolk expands its current operations, in addition to dividends from the Bank, it will need to rely on its own earnings, additional capital raised, and other borrowings to meet its need for liquidity. Suffolk currently has a line of credit in the amount of $6 million against which no funds have been drawn.
16
The Bank’s most liquid assets are cash and cash equivalents, securities available for sale, and securities held to maturity due within one year. The amounts of these assets are dependent upon the Bank’s operating, financing, lending, and investing activities during any given period. Other sources of liquidity include principal repayments and maturities of loans and investment securities, lines of credit with other financial institutions including the Federal Home Loan Bank, growth in core deposits, and sources of wholesale funding such as brokered certificates of deposit. Scheduled loan amortization, maturing securities, and short-term investments are relatively predictable sources of funds, whereas deposit flows and prepayments of loans and mortgage-backed securities are influenced by general interest rates, economic conditions, and competition, and may vary accordingly. The Bank adjusts its liquidity to fund such things as seasonal deposit outflows and loans, and to pursue asset and liability management objectives using a marginal cost of funds approach, seeking to find the lowest cost of funding possible for each additional dollar. The Bank relies primarily on its deposits, obtained through twenty nine full-service branches that serve its market area, as well as local municipal deposits. The Bank’s primary service area is Suffolk County, New York, where it holds approximately 3.35% of deposits in that market.
During 2008, the Bank’s core deposits increased, in demand, savings, N.O.W., and money market accounts, and in time deposits in excess of $100,000. Other time deposits decreased. The Bank borrowed from the Federal Home Loan Bank as advance rates were generally lower than local rates for other time deposits offered by competitors. The Bank’s Asset/Liability and Funds Management Policy allows for wholesale borrowings of up to 25% of total assets. On December 31, 2008, the Bank had access to total lines of credit in the amount of $31 million which provide for short-term credit for liquidity. Of this total, $20 million was available on an unsecured basis. As of December 31, 2008, none of these lines had been drawn upon. The Bank is a member of the Federal Home Loan Bank of New York (“FHLBNY”) and may borrow using as collateral unencumbered investment securities and residential and commercial mortgages owned by the Bank. As of December 31, 2008, the Bank had pledged collateral giving it the capacity to borrow approximately $417.8 million from FHLBNY. As of December 31, 2008, the amount of overnight borrowings under these lines was $47.2 million. Additionally, the Bank had $140.0 million in term borrowings from the FHLBNY. Securities sold under agreements to repurchase from an unaffiliated primary broker totaled $37.6 million as of December 31, 2008. In addition, during 2008, the Bank entered into an agreement for the purpose of issuing brokered certificates of deposit. As of December 31, 2008, the Bank had $6.1 million in brokered deposits.
Interest Rate Sensitivity
Interest rate “sensitivity” is determined by the date when each asset and liability in Suffolk’s portfolio can be repriced. Sensitivity increases when interest-earning assets and interest-bearing liabilities cannot be repriced at the same time. While this analysis presents the volume of assets and liabilities repricing in each period of time, it does not consider how quickly various assets and liabilities might actually be repriced in response to changes in interest rates. Management reviews its interest rate sensitivity regularly and adjusts its asset/liability management strategy accordingly. Because the interest rates of assets and liabilities vary according to their maturity, management may selectively mismatch the repricing of assets and liabilities to take advantage of temporary or projected differences between short- and long-term interest rates.
17
The following table reflects the sensitivity of Suffolk’s assets and liabilities at December 31, 2008: (dollars in thousands)
| | | | | | | | | | | | | | | | | | | | | | | |
Maturity | | Less than
3 Months | | | 3 to 6
Months | | | 7 to 12
Months | | | More Than
1 Year | | | Not Rate
Sensitive | | | Total |
Interest-earning assets | | | | | | | | | | | | | | | | | | | | | | | |
Domestic loans (1) (net of unearned discount) | | $ | 445,597 | | | $ | 92,335 | | | $ | 135,580 | | | $ | 418,090 | | | $ | 1,919 | | | $ | 1,093,521 |
Investment securities (2) | | | 23,376 | | | | 60,612 | | | | 53,631 | | | | 259,919 | | | | 7,209 | | | | 404,747 |
| | | | | | | | | | | | | | | | | | | | | | | |
Total interest-earning assets | | $ | 468,973 | | | $ | 152,947 | | | $ | 189,211 | | | $ | 678,009 | | | $ | 9,128 | | | $ | 1,498,268 |
| | | | | | | | | | | | | | | | | | | | | | | |
Demand deposits and interest-bearing liabilities | | | | | | | | | | | | | | | | | | | | | | | |
Demand deposits (3) | | $ | 21,969 | | | $ | 21,969 | | | $ | 43,938 | | | $ | 351,504 | | | $ | — | | | $ | 439,380 |
N.O.W. & money market accounts (4) | | | 169,437 | | | | 3,789 | | | | 7,578 | | | | 60,623 | | | | — | | | | 241,427 |
Borrowings | | | 134,820 | | | | 50,000 | | | | — | | | | 40,000 | | | | — | | | | 224,820 |
Interest-bearing deposits (5) | | | 188,284 | | | | 44,174 | | | | 20,453 | | | | 282,720 | | | | — | | | | 535,631 |
| | | | | | | | | | | | | | | | | | | | | | | |
Total demand deposits & interest-bearing liabilities | | $ | 514,510 | | | $ | 119,932 | | | $ | 71,969 | | | $ | 734,847 | | | $ | — | | | $ | 1,441,258 |
| | | | | | | | | | | | | | | | | | | | | | | |
Gap | | $ | (45,537 | ) | | $ | 33,015 | | | $ | 117,242 | | | $ | (56,838 | ) | | $ | 9,128 | | | $ | 57,010 |
| | | | | | | | | | | | | | | | | | | | | | | |
Cumulative difference between interest-earning assets and interest-bearing liabilities | | $ | (45,537 | ) | | $ | (12,522 | ) | | $ | 104,720 | | | $ | 47,882 | | | $ | 57,010 | | | | |
| | | | | | | | | | | | | | | | | | | | | | | |
Cumulative difference/total assets | | | (2.88 | )% | | | (0.79 | )% | | | 6.62 | % | | | 3.03 | % | | | 3.60 | % | | | |
| | | | | | | | | | | | | | | | | | | | | | | |
Footnotes to Interest Rate Sensitivity
| (1) | Based on contractual maturity and instrument repricing date, if applicable; projected prepayments and prepayments of principal based on experience. |
| (2) | Based on contractual maturity, and projected prepayments based on experience. FRB and FHLB stock is not considered rate-sensitive. |
| (3) | Based on experience of historical stable core deposit relationships. |
| (4) | N.O.W. and money market accounts are assumed to decline over a period of five years. |
| (5) | Fixed-rate deposits and deposits with fixed pricing intervals are reflected as maturing in the period of contractual maturity. Saving accounts are assumed to decline over a period of five years. |
At December 31, 2008, interest-bearing assets with maturities of less than one year exceed interest-earning liabilities of similar maturity. This cumulative gap might result in increased net interest income if interest rates increase or remain stable during the next twelve months. If interest rates decline, net interest income might decrease. However, interest-earning liabilities with maturities of greater than one year exceed interest-bearing assets of similar maturity. This cumulative gap might result in decreased net interest income if interest rates increase beyond twelve months. If interest rates decline or remain stable, net interest income might increase.
Interest Rate Risk
Interest rate risk is the sensitivity of earnings to changes in interest rates. As interest rates change, interest income and expense also change, thereby changing net interest income (“NII”). NII is the primary component of Suffolk’s earnings. ALCO uses a detailed and dynamic model to quantify the effect of sustained changes in interest rates on NII. While ALCO routinely monitors simulated NII sensitivity two years into the future, it uses other tools to monitor longer term interest rate risk.
The model measures the effect in the future of changing interest rates on both interest income and expense for all assets and liabilities, as well as for derivative financial instruments that do not appear on the balance sheet. The results are compared to ALCO policy limits that specify a maximum effect on NII one year in the future, assuming no growth in assets or liabilities, or 200 basis point (“bp”) change in interest rates upward and 100 bp downward.
Following is Suffolk’s NII sensitivity as of December 31, 2008. Suffolk’s Board has approved a policy limit of 12.5 percent.
| | | |
Rate Change | | Estimated NII Sensitivity
to December 31, 2008 | |
+200 basis point rate shock | | (1.60 | )% |
-100 basis point rate shock | | 1.30 | % |
| | | |
18
These estimates should not be interpreted as Suffolk’s forecast, and should not be considered as indicative of management’s expectations for operating results. They are hypothetical estimates that are based on many assumptions including: the nature and time of changes in interest rates, the shape of the “yield curve” (variations in interest rates for financial instruments of varying maturity at a given moment in time), prepayments on loans and securities, deposit outflows, pricing on loans and deposits, and the reinvestment of cash flows from assets and liabilities, among other things. While these assumptions are based on management’s best estimate of current economic conditions, Suffolk cannot give any assurance that they will actually predict results, nor can they anticipate how the behavior of customers and competitors may change in the future.
Factors that may affect actual results include: prepayment and refinancing of loans other than as assumed, interest rate change caps and floors, repricing intervals on adjustable rate instruments, changes in debt service on adjustable rate loans, and early withdrawal of deposits. Actual results may also be affected by actions ALCO takes in response to changes in interest rates, actual or anticipated.
When appropriate, ALCO may use off-balance-sheet instruments such as interest rate floors, caps, and swaps to hedge its position with regard to interest rate risk. The Board of Directors has approved a hedging policy statement that governs the use of such instruments. As of December 31, 2008, there were no derivative financial instruments outstanding.
The following table illustrates the contractual sensitivity to changes in interest rates of the Company’s total loans, net of discounts, not including overdrafts and loans not accruing interest, together totaling $5,897,000 at December 31, 2008: (in thousands)
| | | | | | | | | | | | |
Interest rate provision | | Due Within
1 Year | | After 1 but
Before 5 Years | | After
5 Years | | Total |
Predetermined rates | | $ | 175,248 | | $ | 152,486 | | $ | 25,977 | | $ | 353,711 |
Floating or adjustable rates | | | 498,264 | | | 215,421 | | | 20,228 | | | 733,913 |
| | | | | | | | | | | | |
Total | | $ | 673,512 | | $ | 367,907 | | $ | 46,205 | | $ | 1,087,624 |
| | | | | | | | | | | | |
The following table illustrates the contractual sensitivity to changes in interest rates on the Company’s commercial, financial, agricultural, and real estate construction loans not including non-accrual loans totaling approximating $2,833,000 at December 31, 2008: (in thousands)
| | | | | | | | | | | | |
| | | Due Within
1 Year | | After 1 but
Before 5 Years | | After
5 Years | | Total |
Commercial, financial & agricultural | | | | | | | | | | | | |
Predetermined rates | | $ | 29,599 | | $ | 53,711 | | $ | 3,712 | | $ | 87,022 |
Floating or adjustable rates | | | 129,600 | | | 1,491 | | | — | | | 131,091 |
| | | | | | | | | | | | |
| | $ | 159,199 | | $ | 55,202 | | $ | 3,712 | | $ | 218,113 |
Real estate construction | | | | | | | | | | | | |
Predetermined rates | | | — | | | — | | | — | | | — |
Floating or adjustable rates | | | 131,889 | | | — | | | — | | | 131,889 |
| | | | | | | | | | | | |
| | $ | 131,889 | | $ | — | | $ | — | | $ | 131,889 |
| | | | | | | | | | | | |
Total | | $ | 291,088 | | $ | 55,202 | | $ | 3,712 | | $ | 350,002 |
| | | | | | | | | | | | |
Market Risk
Market risk is the risk that a financial instrument will lose value as the result of adverse changes in market prices, interest rates, foreign currency exchange rates, commodity prices, or the prices of equity securities. Suffolk’s primary exposure to market risk is to changing interest rates.
Monitoring and managing this risk is an important part of Suffolk’s asset/liability management process. It is governed by policies established by its Board of Directors. These policies are reviewed and approved annually. The Board delegates responsibility for asset/liability management to the Asset/Liability Committee (“ALCO”). ALCO then develops guidelines and strategies to implement the policy.
19
Contractual and Off-Balance-Sheet Obligations
Following is a table describing certain liabilities not included in Suffolk’s consolidated statement of condition as well as borrowings and time deposits in the period in which they are due: (in thousands of dollars)
| | | | | | | | | | | | | | | |
Contractual obligations | | Total | | Less than 1 year | | 1 - 3 years | | 3 - 5 years | | More than 5 years |
Federal Home Loan Bank borrowings & repurchase agreements | | $ | 224,820 | | $ | 184,820 | | $ | 40,000 | | $ | — | | $ | — |
Time deposits | | | 294,853 | | | 252,981 | | | 33,957 | | | 7,915 | | | — |
Operating lease obligations | | | 11,695 | | | 1,451 | | | 3,038 | | | 2,925 | | | 4,281 |
Purchase obligations | | | 6,065 | | | 2,215 | | | 2,299 | | | 659 | | | 892 |
Performance and financial letters of credit | | | 26,918 | | | 25,970 | | | 875 | | | 73 | | | — |
| | | | | | | | | | | | | | | |
Total | | $ | 564,351 | | $ | 467,437 | | $ | 80,169 | | $ | 11,572 | | $ | 5,173 |
| | | | | | | | | | | | | | | |
Amounts listed as purchase obligations represent agreements to purchase services for Suffolk's core banking system. Operating lease obligations do not reflect a new office scheduled to open during 2009.
Suffolk has not used, and has no intention to use, any significant off-balance-sheet financing arrangements for liquidity purposes. Its primary financial instruments with off-balance-sheet risk are limited to loan servicing for others and obligations to fund loans to customers pursuant to existing commitments.
Capital Resources
Primary capital, including stockholders’ equity, not including the net unrealized gain (loss) on securities available for sale, net of tax, the comprehensive loss on the unfunded projected benefit obligation of the pension plan, and the allowance for loan losses, amounted to $132,882,000 at year-end 2008, compared to $115,810,000 at year-end 2007 and $120,187,000 at year-end 2006. During 2008, Suffolk repurchased 42,000 shares for an aggregate price of $1,253,160. Management determined that this would increase leverage while preserving capital ratios well above regulatory requirements.
The following table presents Suffolk’s capital ratio and other related ratios for each of the past five years: (dollars in thousands)
| | | | | | | | | | | | | | | | | | | | |
| | | 2008 (1) | | | 2007 (1) | | | 2006 (1) | | | 2005 (1) | | | 2004 (1) | |
Primary capital at year-end | | $ | 132,882 | | | $ | 115,810 | | | $ | 120,187 | | | $ | 114,107 | | | $ | 112,951 | |
Primary capital at year-end as a percentage of year-end: | | | | | | | | | | | | | | | | | | | | |
Total assets plus allowance for loan losses | | | 8.35 | % | | | 7.83 | % | | | 8.58 | % | | | 8.05 | % | | | 8.33 | % |
Loans, net of unearned discounts | | | 12.15 | % | | | 12.08 | % | | | 13.48 | % | | | 12.61 | % | | | 13.68 | % |
Total deposits | | | 10.92 | % | | | 10.13 | % | | | 10.55 | % | | | 9.85 | % | | | 9.43 | % |
| | | | | | | | | | | | | | | | | | | | |
| (1) | Capital ratios do not include the effect of SFAS No. 115, “Accounting for Certain Investments in Debt and Investment Securities,” nor SFAS No. 158, “Employers’ Accounting for Defined Benefit Pension and Other Postretirement Plans – an amendment of FASB Statements No. 87, 88, 106 and 132(R).” |
The Board has adopted a policy whereby management will maximize both return on average equity and earnings-per-share, and therefore shareholder value, while maintaining the regulatory standard of “well capitalized.” That standard is 10 percent Total Risk-Based Capital, 6 percent Tier 1 Capital, and 5 percent Leverage Capital. When capital exceeds that standard by more than a small cushion over what is expected to be required to maintain the “well-capitalized” standard during the current quarter, shares may be repurchased as they become available at prices that remain accretive to earnings-per-share in transactions under SEC rule 10-b 18 and in private purchases. When capital expected to be required during the current quarter does not exceed the standard, repurchases will not be made. Further, the dividend reinvestment program will automatically follow the same standard, purchasing shares in the market when Suffolk is in the market to repurchase shares, and issuing from the reserve when it is not. Each of these replaces the prior practice of authorizing the repurchase of a specific number of shares by Suffolk, or the purchase or issuance of shares by the dividend reinvestment program without specific reference to capital ratios. The following table details repurchases during 2008:
| | | | | | | | | | | | |
Period | | Total Number
of Shares
Purchased | | Average
Price Paid
per Share | | Total
Aggregate Cost | | Total Number of
Shares Purchased as
Part of Publicly
Announced Plan
or Programs | | Maximum Number
(or Appropriate Dollar
Value) of Shares that
May Yet Be Purchased
Under the Plan
or Programs |
February 2008 | | 33,000 | | $ | 29.75 | | $ | 981,690 | | n/a | | n/a |
March 2008 | | 9,000 | | | 30.16 | | | 271,470 | | | | |
| | | | | | | | | | | | |
Total for the year ended December 31, 2008 | | 42,000 | | $ | 29.84 | | $ | 1,253,160 | | n/a | | n/a |
| | | | | | | | | | | | |
None of these shares were purchased pursuant to a publicly announced plan or program. See “Capital Resources” beginning on page 20 for a description of Suffolk’s policy concerning the repurchase of shares.
20
Suffolk measures how effectively it uses capital by two widely accepted performance ratios: return on average assets and return on average common stockholders’ equity. The return in 2008 on average assets of 1.59 percent and average common equity of 21.79 percent compared to 2007 when returns were 1.57 percent and 21.47 percent, respectively.
All dividends must conform to applicable statutory requirements. Suffolk Bancorp’s ability to pay dividends depends on Suffolk County National Bank’s ability to pay dividends. Under 12 USC 56-9, a national bank may not pay a dividend on its common stock if the dividend would exceed net undivided profits then on hand. Further, under 12 USC 60, a national bank must obtain prior approval from the Office of the Comptroller of the Currency to pay dividends on either common or preferred stock that would exceed the bank’s net profits for the current year combined with retained net profits (net profits minus dividends paid during that period) of the prior two years. The amount the Bank currently has available to pay dividends is approximately $32,997,000.
During the fourth quarter of 2008, the United States Treasury Department announced the Capital Purchase Program (“CPP”) of the Troubled Asset Relief Program (“TARP”). Under the program, banks were provided the opportunity to obtain additional capital in the form of senior preferred stock bearing an interest rate of 5% for five years and 9% thereafter and not callable for three years except in consideration of the issuance of other Tier 1 capital, along with certain warrants to purchase common stock. Suffolk analyzed it carefully and at length, and in light of satisfactory current capital and net income, neither applied for nor accepted funds from the program.
Risk-Based Capital and Leverage Guidelines
The Federal Reserve Bank’s risk-based capital guidelines call for bank holding companies to require minimum ratios of capital to risk-weighted assets, which include certain off-balance-sheet activities, such as standby letters of credit. The guidelines define capital as being “core,” or “Tier 1” capital, which includes common stockholders’ equity; a limited amount of perpetual preferred stock; minority interest in unconsolidated subsidiaries, less goodwill; or “supplementary” or “Tier 2” capital, which includes subordinated debt, redeemable preferred stock, and a limited amount of the allowance for loan losses. All bank holding companies must meet a minimum ratio of total qualifying capital to risk-weighted assets of 8.00 percent, of which at least 4.00 percent should be in the form of Tier 1 capital. At December 31, 2008 Suffolk’s ratios of core capital and total qualifying capital (core capital plus Tier 2 capital) to risk-weighted assets were 9.87 percent and 10.60 percent, respectively.
Discussion of New Accounting Pronouncements
In September 2006, FASB issued Statement No. 157, “Fair Value Measurements” (SFAS No. 157). This statement defines fair value, establishes a framework for measuring fair value in generally accepted accounting principles, and expands disclosures about fair value measurements. The definition of fair value retains the exchange price notion; however, this statement clarifies that the exchange price is the price in an orderly transaction between market participants to sell the asset or transfer the liability in the principal market for the asset or liability. This statement emphasizes that fair value is a market-based measurement, not an entity-specific measurement; therefore, a fair value measurement should be determined based on the assumptions that market participants would use in pricing the asset or liability. This statement clarifies that market participant assumptions include assumptions about risk, the risk inherent in a particular valuation technique used to measure fair value and/or the risk inherent in the inputs to the valuation technique, as well as the effect of credit risk on the fair value of liabilities. This statement also expands disclosures about the use of fair value to measure assets and liabilities in interim and annual periods, focusing on the inputs used to measure fair value. This statement is effective for fiscal years beginning after November 15, 2007. Suffolk has adopted the provisions of SFAS No. 157, which have been recorded in the accompanying consolidated statements of condition and disclosures.
In September 2006, FASB issued Statement No. 158, “Employers’ Accounting for Defined Benefit Pension and Other Postretirement Plans – an amendment of FASB Statements No. 87, 88, 106 and 132(R)” (SFAS No. 158). This statement requires an employer that is a business entity and sponsors one or more single-employer defined benefit plans to recognize the funded status of a benefit plan in its statement of financial position; recognize as a component of other comprehensive income, net of tax, the gains or losses and prior service costs or credits that arise during the period but are not recognized as components of net periodic benefit cost pursuant to FASB No. 87 or No. 106; measure defined benefit plan assets and obligation as of the date of the employer’s fiscal year-end statement of financial position (with limited exceptions); and disclose in the notes to financial statements additional information about certain effects of net periodic benefit cost for the next fiscal year that arise from delayed recognition of the gains or losses, prior service costs or credits, and transition asset and obligation. Upon initial application of this statement and subsequently, an employer should continue to apply the provisions in Statements 87, 88, and 106 in measuring plan assets and benefit obligations as of the date of its statement of financial position and in determining the amount of net periodic benefit cost. An employer with publicly traded equity securities is required to initially recognize the funded status of a defined benefit postretirement plan and to provide the required disclosures as of the end of the fiscal year ending after December 15, 2006. Suffolk has adopted the provisions of SFAS No. 158, which have been recorded in the accompanying consolidated statement of condition and disclosures.
In February 2007, FASB issued Statement No. 159, “The Fair Value Option for Financial Assets and Financial Liabilities — Including an amendment of FASB Statement No. 115” (SFAS No.159). This statement permits entities to choose to measure many financial instruments and certain other items at fair value at specified election dates. The statement defines items eligible for
21
the measurement option. A business entity shall report unrealized gains and losses on items for which the fair value option has been elected in earnings at each subsequent reporting date. This statement is effective for fiscal years beginning after November 15, 2007. Suffolk has elected not to adopt the provisions of SFAS No. 159.
In December 2007, FASB revised Statement No. 141, “Business Combinations” (SFAS No. 141R). This statement requires an acquirer to recognize the assets acquired, the liabilities assumed, and any noncontrolling interest in the acquiree at the acquisition date, measured at their fair values as of that date. This statement recognizes and measures the goodwill acquired in the business combination or a gain from a bargain purchase. This statement also defines the acquirer as the entity that obtains control of one or more businesses in the business combination and establishes the acquisition date as the date that the acquiree achieves control. Additionally this statement determines what information to disclose to enable users of the financial statements to evaluate the nature and financial effects of the business combination. This statement is effective for fiscal years beginning after December 15, 2008. Suffolk is currently evaluating the impact of SFAS No. 141R on its financial condition, results of operations, and disclosures.
In December 2007, FASB issued Statement No. 160, “Noncontrolling Interests in Consolidated Financial Statements — an amendment of Accounting Research Bulletin (ARB) No. 51” (SFAS No. 160). This statement applies to all entities that prepare consolidated financial statements, except not-for-profit organizations, but will affect only those entities that have an outstanding noncontrolling interest in one or more subsidiaries or that deconsolidate a subsidiary. This statement amends ARB No. 51 to establish accounting and reporting standards for the noncontrolling interest in a subsidiary and for the deconsolidation of a subsidiary. This statement is effective for fiscal years beginning after January 1, 2009. Suffolk is currently evaluating the impact of SFAS No. 160 on its financial condition, results of operations, and disclosures.
In March 2008, FASB issued SFAS No. 161, “Disclosures about Derivative Instruments and Hedging Activities – an amendment of FASB Statement No. 133” (SFAS No. 161). This statement requires enhanced disclosures about an entity’s derivative and hedging activities and thereby improves the transparency of financial reporting. Entities are required to provide enhanced disclosures about (a) how and why an entity uses derivative instruments, (b) how derivative instruments and related hedged items are accounted for under SFAS No. 133 and its related interpretations, and (c) how derivative instruments and related hedged items affect an entity’s financial position, financial performance, and cash flows. This statement is effective for fiscal years and interim periods beginning after November 15, 2008. Suffolk is currently evaluating the impact of SFAS No. 161 on its financial condition, results of operations, and disclosures.
In May 2008, FASB issued SFAS No. 162, “The Hierarchy of Generally Accepted Accounting Principles” (SFAS No.162). This statement identifies the sources of accounting principles and the framework for selecting the principles to be used in the preparation of financial statements of nongovernmental entities that are presented in conformity with GAAP in the United States (the U.S. GAAP hierarchy). SFAS No. 162 divides the body of U.S. GAAP into four categories by level of authority. This statement is effective sixty days following the SEC’s approval of the Public Company Accounting Oversight Board amendments to AU Section 411, “The Meaning of Present Fairly in Conformity With Generally Accepted Accounting Principles.” Suffolk is currently evaluating the impact of SFAS No. 162 on its financial condition, results of operations, and disclosures.
On October 10, 2008, FASB issued Staff Position No. FAS 157-3, “Determining the Fair Value of a Financial Asset When the Market for That Asset is Not Active.” This FASB Staff Position (FSP) applies to financial assets within the scope of accounting pronouncements that require or permit fair value measurements in accordance with SFAS No. 157. FSP 157-3 clarifies the application of SFAS No. 157 in a market that is not active and provides an example to illustrate key considerations and internal assumption that can be used in determining the fair value of financial assets when the market for that financial asset is not active. This FSP is effective upon issuance, including prior periods for which financial statements have not been issued.
Critical Accounting Policies, Judgments, and Estimates
The accounting and reporting policies of Suffolk conform to accounting principles generally accepted in the United States of America and general practices in the financial services industry. The preparation of financial statements in conformity with these accounting principles requires management to make estimates and assumptions that affect the amounts reported in the financial statements and the accompanying notes. Actual results in the future could differ from those estimates.
Suffolk considers that the determination of the allowance for loan losses involves a higher degree of judgment and complexity than its other significant accounting policies. The allowance for loan losses is calculated to maintain a reserve believed by management to be sufficient to absorb estimated credit losses. Management’s determination of the adequacy of the allowance is based on periodic evaluations of the loan portfolio and other relevant factors. This evaluation is inherently subjective as it requires material estimates, including, among others, the expected probability of default; the amount of loss in the event of default; the expected usage of loan commitments; the amounts and timing of cash flows expected in the future from impaired loans and mortgages; and an additional factor for potential loan losses based on historical experience. Management also considers economic conditions, uncertainties in estimating losses, and inherent risks in the loan portfolio. All of these factors may change significantly in the future. To the extent that actual results differ from management’s estimates, additional provisions for loan losses may be required that could reduce earnings in future periods.
22
Suffolk recognizes deferred-tax assets and liabilities. Deferred income taxes occur when income taxes are allocated through time. Some items are temporary, resulting from differences in the timing of a transaction under generally accepted accounting principles, and for the computation of income tax. Examples would include the future tax effects of temporary differences for such items as deferred compensation and the provision for loan losses. Estimates of deferred tax assets are based upon evidence available to management that future realization is more likely than not. If management determines that Suffolk may be unable to realize all or part of net deferred tax assets in the future, a direct charge to income tax expense may be required to reduce the recorded value of the net deferred tax asset to the amount that management expects to realize.
Suffolk evaluates unrealized losses on securities to determine if any reduction in the fair value is other than temporary. This amount will continue to be dependent on market conditions, the occurrence of certain events or changes in circumstances of the issuer of the security, and the Company’s intent and ability to hold the impaired investment at the time the valuation is made. If management determines that an impairment in the investment’s value is other than temporary, earnings would be charged.
Business Risks and Uncertainties
This annual report contains some statements that look to the future. These may include remarks about Suffolk Bancorp, the banking industry, and the economy in general. Factors affecting Suffolk Bancorp include particularly, but are not limited to: changes in interest rates; increases or decreases in retail and commercial economic activity in Suffolk’s market area; and variations in the ability and propensity of consumers and businesses to borrow, repay, or deposit money, or to use other banking and financial services. Further, it could take Suffolk longer than anticipated to implement its strategic plans to increase revenue and manage non-interest expense, or it may not be possible to implement those plans at all. Finally, new and unanticipated legislation, regulation, or accounting standards may require Suffolk to change its practices in ways that materially change the results of operations. Each of these factors may change in ways that management does not now foresee. These remarks are based on current plans and expectations. They are subject, however, to a variety of uncertainties that could cause future results to vary materially from Suffolk’s historical performance, or from current expectations.
Management’s Report on Internal Control over Financial Reporting
The management of Suffolk Bancorp is responsible for establishing and maintaining adequate internal control over financial reporting. Suffolk Bancorp’s internal control system was designed to provide reasonable assurance to the company’s management and Board of Directors regarding the preparation and fair presentation of published financial statements.
All internal control systems, no matter how well designed, have inherent limitations. Therefore, even those systems determined to be effective can provide only reasonable assurance with respect to financial statement preparation and presentation.
Suffolk Bancorp management assessed the effectiveness of the company’s internal control over financial reporting as of December 31, 2008. In making this assessment, it used the criteria set forth by the Committee of Sponsoring Organizations of the Treadway Commission (COSO) inInternal Control – Integrated Framework. Based on our assessment and those criteria we have determined that, as of December 31, 2008, the company’s internal control over financial reporting is effective.
Suffolk Bancorp’s independent registered public accounting firm has issued its report on our assessment of the company’s internal control over financial reporting. This report appears on page 43.
23
CONSOLIDATED STATEMENTS OF CONDITION
| | | | | | | | |
| | | December 31, | |
| | | 2008 | | | 2007 | |
ASSETS | | | | | | | | |
Cash and Due From Banks | | $ | 41,512,480 | | | $ | 56,633,337 | |
Federal Funds Sold | | | — | | | | 2,700,000 | |
Investment Securities: | | | | | | | | |
Available for Sale, at Fair Value | | | 382,357,190 | | | | 392,795,741 | |
Held to Maturity (Fair Value of $22,973,957 and $18,199,025, respectively) | | | | | | | | |
Obligations of States and Political Subdivisions | | | 11,830,259 | | | | 9,055,124 | |
Federal Reserve Bank Stock | | | 637,849 | | | | 637,849 | |
Federal Home Loan Bank Stock | | | 9,821,100 | | | | 7,817,700 | |
Corporate Bonds and Other Securities | | | 100,000 | | | | 100,000 | |
| | | | | | | | |
Total Investment Securities | | | 404,746,398 | | | | 410,406,414 | |
| | |
Total Loans | | | 1,093,554,189 | | | | 957,316,114 | |
Less: Unearned Discounts | | | 32,906 | | | | 35,309 | |
Allowance for Loan Losses | | | 9,050,798 | | | | 7,672,030 | |
| | | | | | | | |
Net Loans | | | 1,084,470,485 | | | | 949,608,775 | |
Premises and Equipment, Net | | | 22,739,566 | | | | 22,143,233 | |
Accrued Interest Receivable | | | 7,042,075 | | | | 7,359,348 | |
Excess of Cost Over Fair Value of Net Assets Acquired | | | 814,445 | | | | 814,445 | |
Other Assets | | | 21,493,233 | | | | 19,396,951 | |
| | | | | | | | |
TOTAL ASSETS | | $ | 1,582,818,682 | | | $ | 1,469,062,503 | |
| | | | | | | | |
LIABILITIES & STOCKHOLDERS’ EQUITY | | | | | | | | |
Demand Deposits | | $ | 439,380,062 | | | $ | 423,225,286 | |
Saving, N.O.W., and Money Market Deposits | | | 482,204,209 | | | | 404,456,350 | |
Time Certificates of $100,000 or more | | | 138,601,386 | | | | 116,795,006 | |
Other Time Deposits | | | 156,251,836 | | | | 198,898,222 | |
| | | | | | | | |
Total Deposits | | | 1,216,437,493 | | | | 1,143,374,864 | |
Repurchase Agreements | | | 37,620,000 | | | | 54,820,000 | |
Federal Home Loan Bank Borrowings | | | 187,200,000 | | | | 143,500,000 | |
Dividend Payable on Common Stock | | | 2,108,194 | | | | 2,120,989 | |
Accrued Interest Payable | | | 2,243,864 | | | | 2,247,370 | |
Other Liabilities | | | 24,808,197 | | | | 14,017,909 | |
| | | | | | | | |
TOTAL LIABILITIES | | | 1,470,417,748 | | | | 1,360,081,132 | |
| | | | | | | | |
Commitments and Contingent Liabilities (see Note 11) | | | | | | | | |
| | |
STOCKHOLDERS’ EQUITY | | | | | | | | |
Common Stock (par value $2.50; 15,000,000 shares authorized, 9,582,699 and 9,610,730 shares outstanding at December 31, 2008 & 2007, respectively) | | | 33,945,901 | | | | 33,910,979 | |
Surplus | | | 20,782,214 | | | | 20,171,885 | |
Retained Earnings | | | 79,092,185 | | | | 63,939,181 | |
Treasury Stock at Par (3,995,661 shares and 3,953,661 shares, respectively) | | | (9,989,160 | ) | | | (9,884,160 | ) |
Accumulated Other Comprehensive (Loss) Income, Net of Tax | | | (11,430,206 | ) | | | 843,486 | |
| | | | | | | | |
TOTAL STOCKHOLDERS’ EQUITY | | | 112,400,934 | | | | 108,981,371 | |
| | | | | | | | |
TOTAL LIABILITIES & STOCKHOLDERS’ EQUITY | | $ | 1,582,818,682 | | | $ | 1,469,062,503 | |
| | | | | | | | |
See accompanying notes to consolidated financial statements.
24
CONSOLIDATED STATEMENTS OF INCOME
| | | | | | | | | |
| | | For the Years ended December 31, |
| | | 2008 | | 2007 | | 2006 |
INTEREST INCOME | | | | | | | | | |
Federal Funds Sold | | $ | 313,945 | | $ | 140,488 | | $ | 281,161 |
United States Treasury Securities | | | 398,540 | | | 397,637 | | | 396,996 |
Obligations of States and Political Subdivisions (tax exempt) | | | 5,766,450 | | | 4,914,370 | | | 3,529,614 |
Obligations of States and Political Subdivisions (taxable) | | | 537,007 | | | 509,259 | | | 471,291 |
Mortgage-Backed Securities | | | 7,926,441 | | | 7,672,224 | | | 7,981,951 |
U.S. Government Agency Obligations | | | 3,663,307 | | | 4,575,522 | | | 4,879,061 |
Corporate Bonds and Other Securities | | | 482,088 | | | 423,401 | | | 343,288 |
Loans and Loan Fees | | | 69,369,546 | | | 70,448,470 | | | 68,325,474 |
| | | | | | | | | |
Total Interest Income | | | 88,457,324 | | | 89,081,371 | | | 86,208,836 |
INTEREST EXPENSE | | | | | | | | | |
Saving, N.O.W., and Money Market Deposits | | | 6,333,647 | | | 4,838,463 | | | 4,791,785 |
Time Certificates of $100,000 or more | | | 4,064,507 | | | 5,093,827 | | | 2,034,215 |
Other Time Deposits | | | 5,787,324 | | | 8,180,878 | | | 6,713,778 |
Federal Funds Purchased and Repurchase Agreements | | | 1,416,534 | | | 2,876,088 | | | 2,954,948 |
Interest on Other Borrowings | | | 4,635,183 | | | 4,127,929 | | | 4,004,768 |
| | | | | | | | | |
Total Interest Expense | | | 22,237,195 | | | 25,117,185 | | | 20,499,494 |
Net Interest Income | | | 66,220,129 | | | 63,964,186 | | | 65,709,342 |
Provision for Loan Losses | | | 2,050,000 | | | 376,718 | | | 965,749 |
| | | | | | | | | |
Net Interest Income After Provision for Loan Losses | | | 64,170,129 | | | 63,587,468 | | | 64,743,593 |
OTHER INCOME | | | | | | | | | |
Service Charges on Deposit Accounts | | | 5,557,936 | | | 5,411,969 | | | 5,547,675 |
Other Service Charges, Commissions & Fees | | | 3,046,089 | | | 2,980,797 | | | 3,097,420 |
Fiduciary Fees | | | 1,459,849 | | | 1,408,759 | | | 1,252,101 |
Other Operating Income | | | 837,724 | | | 793,289 | | | 774,580 |
Net Gain on Sale of Securities Available for Sale | | | 3,741,001 | | | — | | | — |
| | | | | | | | | |
Total Other Income | | | 14,642,599 | | | 10,594,814 | | | 10,671,776 |
OTHER EXPENSE | | | | | | | | | |
Salaries & Employee Benefits | | | 25,645,919 | | | 24,407,513 | | | 23,896,752 |
Net Occupancy Expense | | | 4,649,140 | | | 4,069,312 | | | 3,950,083 |
Equipment Expense | | | 2,145,770 | | | 2,207,888 | | | 2,112,945 |
Outside Services | | | 2,274,632 | | | 2,354,862 | | | 2,176,004 |
FDIC Assessments | | | 486,304 | | | 145,992 | | | 153,744 |
Other Operating Expense | | | 7,499,147 | | | 7,206,704 | | | 7,685,199 |
| | | | | | | | | |
Total Other Expense | | | 42,700,912 | | | 40,392,271 | | | 39,974,727 |
Income Before Provision for Income Taxes | | | 36,111,816 | | | 33,790,011 | | | 35,440,642 |
Provision for Income Taxes | | | 11,423,381 | | | 11,662,386 | | | 12,813,015 |
| | | | | | | | | |
NET INCOME | | $ | 24,688,435 | | $ | 22,127,625 | | $ | 22,627,627 |
| | | | | | | | | |
Average: Common Shares Outstanding | | | 9,580,025 | | | 9,895,301 | | | 10,279,870 |
Dilutive Stock Options | | | 21,970 | | | 20,642 | | | 23,639 |
| | | | | | | | | |
Average Total Common Shares and Dilutive Options | | | 9,601,995 | | | 9,915,943 | | | 10,303,509 |
EARNINGS PER COMMON SHARE | | | | | | | | | |
Basic | | $ | 2.58 | | $ | 2.24 | | $ | 2.20 |
Diluted | | $ | 2.57 | | $ | 2.23 | | $ | 2.20 |
See accompanying notes to consolidated financial statements.
25
CONSOLIDATED STATEMENTS OF CHANGES IN STOCKHOLDERS’ EQUITY
| | | | | | | | | | | | | | | | | | | | | | | | | | |
| | | Common
Stock | | Surplus | | Retained
Earnings | | | Treasury
Stock | | | Accumulated
Other Comprehensive
Income (Loss)
Net of Tax | | | Total | | | Comprehensive
Income | |
Balance, December 31, 2005 | | $ | 33,884,340 | | $ | 19,439,444 | | $ | 58,822,484 | | | $ | (7,867,542 | ) | | $ | (2,277,967 | ) | | $ | 102,000,759 | | | | | |
Net Income | | | — | | | — | | | 22,627,627 | | | | — | | | | — | | | | 22,627,627 | | | $ | 22,627,627 | |
Dividend - Cash | | | — | | | — | | | (9,037,469 | ) | | | — | | | | — | | | | (9,037,469 | ) | | | | |
Purchase of Treasury Stock | | | — | | | — | | | (5,241,270 | ) | | | (432,477 | ) | | | — | | | | (5,673,747 | ) | | | | |
Stock Appreciation Rights and Stock Options Exercised | | | 26,639 | | | 260,110 | | | (72,257 | ) | | | (5,236 | ) | | | — | | | | 209,256 | | | | | |
Stock Option Expense | | | — | | | 231,878 | | | — | | | | — | | | | — | | | | 231,878 | | | | | |
Other | | | — | | | 33 | | | — | | | | — | | | | — | | | | 33 | | | | | |
Net Change in Unrealized Loss on Securities Available for Sale | | | — | | | — | | | — | | | | — | | | | 939,592 | | | | 939,592 | | | | 939,592 | |
Other Comprehensive Loss on Pension Projected Benefit Obligation | | | — | | | — | | | — | | | | — | | | | (2,731,582 | ) | | | (2,731,582 | ) | | | | |
| | | | | | | | | | | | | | | | | | | | | | | | | | |
Comprehensive Income | | | | | | | | | | | | | | | | | | | | | | | | $ | 23,567,219 | |
| | | | | | | | | | | | | | | | | | | | | | | | | | |
Balance, December 31, 2006 | | $ | 33,910,979 | | $ | 19,931,465 | | $ | 67,099,115 | | | $ | (8,305,255 | ) | | $ | (4,069,957 | ) | | $ | 108,566,347 | | | | | |
Cumulative Effect of Adoption of FIN 48 | | | — | | | — | | | 2,012,657 | | | | — | | | | — | | | | 2,012,657 | | | | | |
Balance, January 1, 2007 as revised | | $ | 33,910,979 | | $ | 19,931,465 | | $ | 69,111,772 | | | $ | (8,305,255 | ) | | $ | (4,069,957 | ) | | $ | 110,579,004 | | | | | |
Net Income | | | — | | | — | | | 22,127,625 | | | | — | | | | — | | | | 22,127,625 | | | $ | 22,127,625 | |
Dividend - Cash | | | — | | | — | | | (8,651,816 | ) | | | — | | | | — | | | | (8,651,816 | ) | | | | |
Purchase of Treasury Stock | | | — | | | — | | | (18,648,400 | ) | | | (1,578,905 | ) | | | — | | | | (20,227,305 | ) | | | | |
Stock Option Expense | | | — | | | 240,420 | | | — | | | | — | | | | — | | | | 240,420 | | | | | |
Net Change in Unrealized Gain on Securities Available for Sale | | | — | | | — | | | — | | | | — | | | | 3,011,237 | | | | 3,011,237 | | | | 3,011,237 | |
Other Comprehensive Gain on Pension Projected Benefit Obligation | | | — | | | — | | | — | | | | — | | | | 1,902,206 | | | | 1,902,206 | | | | 1,902,206 | |
| | | | | | | | | | | | | | | | | | | | | | | | | | |
Comprehensive Income | | | | | | | | | | | | | | | | | | | | | | | | $ | 27,041,068 | |
| | | | | | | | | | | | | | | | | | | | | | | | | | |
Balance, December 31, 2007 | | $ | 33,910,979 | | $ | 20,171,885 | | $ | 63,939,181 | | | $ | (9,884,160 | ) | | $ | 843,486 | | | $ | 108,981,371 | | | | | |
Remeasurement of Post Retirement Obligation Under FAS 158 | | | | | | | | | 157,137 | | | | | | | | | | | | 157,137 | | | | | |
Remeasurement of Pension Obligation Under FAS 158 | | | | | | | | | (118,515 | ) | | | | | | | | | | | (118,515 | ) | | | | |
Balance, January 1, 2008 as revised | | $ | 33,910,979 | | $ | 20,171,885 | | $ | 63,977,803 | | | $ | (9,884,160 | ) | | $ | 843,486 | | | $ | 109,019,993 | | | | | |
Net Income | | | — | | | — | | | 24,688,435 | | | | — | | | | — | | | | 24,688,435 | | | $ | 24,688,435 | |
Dividend - Cash | | | — | | | — | | | (8,425,893 | ) | | | — | | | | — | | | | (8,425,893 | ) | | | | |
Purchase of Treasury Stock | | | — | | | — | | | (1,148,160 | ) | | | (105,000 | ) | | | — | | | | (1,253,160 | ) | | | | |
Stock Option Expense | | | — | | | 181,894 | | | — | | | | — | | | | — | | | | 181,894 | | | | | |
Stock Dividend Reinvestment | | | 34,922 | | | 428,435 | | | — | | | | — | | | | — | | | | 463,357 | | | | | |
Net Change in Unrealized Gain on Securities Available for Sale | | | — | | | — | | | — | | | | — | | | | (3,603,284 | ) | | | (3,603,284 | ) | | | (3,603,284 | ) |
Other Comprehensive Gain (Loss) on Pension Projected Benefit Obligation | | | — | | | — | | | — | | | | — | | | | (8,670,408 | ) | | | (8,670,408 | ) | | | (8,670,408 | ) |
| | | | | | | | | | | | | | | | | | | | | | | | | | |
Comprehensive Income | | | | | | | | | | | | | | | | | | | | | | | | $ | 12,414,7439 | |
| | | | | | | | | | | | | | | | | | | | | | | | | | |
Balance, December 31, 2008 | | $ | 33,945,901 | | $ | 20,782,214 | | $ | 79,092,185 | | | $ | (9,989,160 | ) | | $ | (11,430,206 | ) | | $ | 112,400,934 | | | | | |
| | | | | | | | | | | | | | | | | | | | | | | | | | |
See accompanying notes to consolidated financial statements.
26
CONSOLIDATED STATEMENTS OF CASHFLOWS
| | | | | | | | | | | | |
| | | For the Years ended December 31, | |
| | | 2008 | | | 2007 | | | 2006 | |
NET INCOME | | $ | 24,688,435 | | | $ | 22,127,625 | | | $ | 22,627,627 | |
ADJUSTMENTS TO RECONCILE NET INCOME TO NET CASH | | | | | | | | | | | | |
CASHFLOWS FROM OPERATING ACTIVITIES | | | | | | | | | | | | |
Provision for Loan Losses | | | 2,050,000 | | | | 376,718 | | | | 965,749 | |
Depreciation and Amortization | | | 2,468,657 | | | | 2,312,684 | | | | 2,200,182 | |
Stock-Based Compensation | | | 181,894 | | | | 240,420 | | | | 231,878 | |
Accretion of Discounts | | | (317,089 | ) | | | (136,959 | ) | | | (239,212 | ) |
Amortization of Premiums | | | 896,089 | | | | 768,006 | | | | 2,358,689 | |
Decrease (Increase) in Accrued Interest Receivable | | | 317,272 | | | | 249,655 | | | | (861,718 | ) |
Decrease (Increase) in Other Assets | | | 730,749 | | | | (4,283,583 | ) | | | (226,780 | ) |
(Decrease) Increase in Accrued Interest Payable | | | (3,506 | ) | | | (1,125,623 | ) | | | 1,650,585 | |
Increase (Decrease) in Income Taxes Payable | | | 682,182 | | | | (4,632,729 | ) | | | 3,410,675 | |
Increase (Decrease) in Other Liabilities | | | 1,701,208 | | | | 3,572,497 | | | | (1,974,959 | ) |
Net Gain on Sale of Securities | | | (3,741,001 | ) | | | — | | | | — | |
| | | | | | | | | | | | |
Net Cash Provided by Operating Activities | | | 29,654,890 | | | | 19,468,711 | | | | 30,142,716 | |
| | | | | | | | | | | | |
CASH FLOWS FROM INVESTING ACTIVITIES | | | | | | | | | | | | |
Principal Payments on Investment Securities | | | 35,381,854 | | | | 28,170,242 | | | | 37,683,350 | |
Proceeds from Sale of Investment Securities; Available for Sale | | | 3,741,001 | | | | — | | | | — | |
Maturities of Investment Securities; Available for Sale | | | 47,200,000 | | | | 20,000,000 | | | | 6,500,000 | |
Purchases of Investment Securities; Available for Sale | | | (78,808,947 | ) | | | (33,249,252 | ) | | | (47,919,748 | ) |
Maturities of Investment Securities; Held to Maturity | | | 2,326,400 | | | | 2,919,000 | | | | 4,775,400 | |
Purchases of Investment Securities; Held to Maturity | | | (7,104,068 | ) | | | (5,430,981 | ) | | | (2,597,200 | ) |
Loan Disbursements and Repayments, Net | | | (137,481,135 | ) | | | (67,608,733 | ) | | | 10,347,602 | |
Purchases of Premises and Equipment, Net | | | (3,064,990 | ) | | | (1,984,843 | ) | | | (1,879,607 | ) |
| | | | | | | | | | | | |
Net Cash (Used in) Provided by Investing Activities | | | (137,809,885 | ) | | | (57,184,567 | ) | | | 6,909,797 | |
| | | | | | | | | | | | |
CASH FLOWS FROM FINANCING ACTIVITIES | | | | | | | | | | | | |
Net Increase (Decrease) in Deposit Accounts | | | 73,062,630 | | | | 4,299,875 | | | | (19,631,521 | ) |
Short-Term Borrowings and Repayments, Net | | | 26,500,000 | | | | 78,185,000 | | | | (7,840,000 | ) |
Dividends Paid to Shareholders | | | (8,438,689 | ) | | | (8,784,131 | ) | | | (8,867,708 | ) |
Stock Dividend Reinvestment | | | 463,357 | | | | — | | | | — | |
Stock Options and Stock Appreciation Rights Exercised | | | — | | | | — | | | | 7 | |
Treasury Shares Acquired | | | (1,253,160 | ) | | | (20,227,305 | ) | | | (5,673,747 | ) |
Director Stock Gain Divestiture | | | — | | | | — | | | | 5,803 | |
| | | | | | | | | | | | |
Net Cash Provided by (Used in) Financing Activities | | | 90,334,138 | | | | 53,473,439 | | | | (42,007,166 | ) |
| | | | | | | | | | | | |
Net (Decrease) Increase in Cash and Cash Equivalents | | | (17,820,857 | ) | | | 15,757,583 | | | | (4,954,653 | ) |
Cash and Cash Equivalents Beginning of Year | | | 59,333,337 | | | | 43,575,754 | | | | 48,530,407 | |
| | | | | | | | | | | | |
Cash and Cash Equivalents End of Year | | $ | 41,512,480 | | | $ | 59,333,337 | | | $ | 43,575,754 | |
| | | | | | | | | | | | |
Supplemental Disclosure of Cash Flow Information | | | | | | | | | | | | |
Cash Received During the Year for Interest | | $ | 88,774,596 | | | $ | 89,331,026 | | | $ | 85,347,118 | |
| | | | | | | | | | | | |
Cash Paid During the Year for: | | | | | | | | | | | | |
Interest | | $ | 22,240,700 | | | $ | 26,242,808 | | | $ | 18,848,909 | |
Income Taxes | | | 12,638,659 | | | | 14,767,686 | | | | 8,369,541 | |
| | | | | | | | | | | | |
Total Cash Paid During Year for Interest & Income Taxes | | $ | 34,879,359 | | | $ | 41,010,494 | | | $ | 27,218,450 | |
| | | | | | | | | | | | |
Non-Cash Investing and Financing: | | | | | | | | | | | | |
(Increase) Decrease in Market Value of Investments | | | 6,085,776 | | | | (5,103,793 | ) | | | (1,592,530 | ) |
(Decrease) Increase in Deferred Tax Asset Related to Market Value of Investments Available for Sale | | | 2,482,492 | | | | (2,092,555 | ) | | | (652,937 | ) |
Dividends Declared But Not Paid | | | 2,108,194 | | | | 2,120,989 | | | | 2,253,304 | |
Stock Options and Stock Appreciation Rights Exercised for Stock | | | — | | | | — | | | | 209,256 | |
See accompanying notes to consolidated financial statements.
27
Notes to Consolidated Financial Statements
Note 1 — Summary of Significant Accounting Policies
The accounting and reporting policies of Suffolk Bancorp (Suffolk) and its subsidiary conform to accounting principles generally accepted in the United States of America (U.S. GAAP) and general practices within the banking industry. The following footnotes describe the most significant of these policies.
In preparing the consolidated financial statements, management is required to make estimates and assumptions that affect the reported assets and liabilities as of the date of the consolidated statements of condition. The same is true of revenues and expenses reported for the period. Actual results could differ significantly from those estimates.
(A) Consolidation — The consolidated financial statements include the accounts of Suffolk and its wholly owned subsidiary, Suffolk County National Bank (the “Bank”). In 1998, the Bank formed a Real Estate Investment Trust named Suffolk Green-way, Inc. In 2004, the Bank formed an insurance agency named SCNB Financial Services, Inc. All inter-company transactions have been eliminated in consolidation.
(B) Investment Securities — Suffolk reports debt securities and mortgage-backed securities in one of the following categories: (i) “held to maturity” (management has the intent and ability to hold to maturity), which are to be reported at amortized cost; (ii) “trading” (held for current resale), which are to be reported at fair value, with unrealized gains and losses included in earnings; and (iii) “available for sale” (all other debt securities and mortgage-backed securities), which are to be reported at fair value, with unrealized gains and losses excluded from earnings and reported as a separate component of stockholders’ equity. Accordingly, Suffolk classified all of its holdings of debt securities and mortgage-backed securities as either “held to maturity” or “available for sale.” At the time a security is purchased, a determination is made as to the appropriate classification.
Premiums and discounts on debt and mortgage-backed securities are amortized as expense and accreted as income over the estimated life of the respective security using a method that approximates the level-yield method. Gains and losses on the sales of investment securities are recognized upon realization, using the specific identification method and shown separately in the consolidated statements of income.
Suffolk evaluates unrealized losses on securities to determine if any reduction in the fair value is other than temporary. This amount will continue to be dependent on market conditions, the occurrence of certain events or changes in circumstances of the issuer of the security, and the Company’s intent and ability to hold the impaired investment at the time the valuation is made. If management determines that an impairment in the investment’s value is other than temporary, earnings would be charged.
(C) Loans and Loan Interest Income Recognition — Loans are stated at the principal amount outstanding. Interest on loans not made on a discounted basis is credited to income, based upon the principal amount outstanding during the period. Unearned discounts on installment loans are credited to income using methods that result in a level yield. Recognition of interest income is discontinued when reasonable doubt exists as to whether interest due can be collected. Loans generally no longer accrue interest when 90 days past due. When a loan is placed on non-accrual status, all interest previously accrued in the current year, but not collected, is reversed against current-year interest income. Any interest accrued in prior years is charged against the allowance for loan losses. Loans and leases start accruing interest again when they become current as to principal and interest, and when, in the opinion of management, the loans can be collected in full.
(D) Allowance for Loan Losses — The balance of the allowance for loan losses is determined by management’s estimate of the amount of financial risk in the loan portfolio and the likelihood of loss. The analysis also considers the Bank’s loan loss experience and is adjusted for economic conditions and other factors. Additions to the allowance are made by charges to expense, and actual losses, net of recoveries, are charged to the allowance. Regulatory examiners may require the Bank to add to the allowance based upon their judgment of information available to them at the time of their examination.
In accordance with SFAS No. 114, “Accounting by Creditors for Impairment of a Loan,” as amended by Statement No. 118, “Accounting by Creditors for Impairment of Loan-Income Recognition and Disclosures,” an allowance is maintained for impaired loans to reflect the difference, if any, between the principal balance of the loan and the present value of projected cash flows, observable fair value, or collateral value. SFAS No. 114 defines an impaired loan as a loan for which it is probable that the lender will not collect all amounts due under the contractual terms of the loan.
The Bank accounts for its transfers and servicing financial assets in accordance with SFAS No. 140, “Accounting for Transfers and Servicing of Financial Assets and Extinguishments of Liabilities,” and SFAS No. 156, “Accounting for Servicing of Financial Assets—an Amendment of FASB No. 140.” SFAS No. 140 revises the standards for accounting for the securitizations and other transfers of financial assets and collateral. Transfers of financial assets for which the Bank has surrendered control of the financial assets are accounted for as sales to the extent that consideration other than beneficial interests in the transferred assets is received in exchange. Retained interests in a sale or securitization of financial assets are measured at the date of transfer by allocating the previous carrying amount between the assets transferred and based on their relative estimated fair values. The fair values of retained servicing rights and any other retained interests are determined based on the present value of expected future cash flows associated with those interests and by reference to market prices for similar assets. There were no transfers of financial assets to related or affiliated parties. At December 31, 2008 and 2007, the Bank’s servicing loan portfolio approximated $121,233,000, and $98,524,000, respectively, which are not included in the accompanying consolidated statements of condition. The estimated fair value of mortgage servicing rights was $1,199,000 and $1,248,000 as of December 31, 2008 and 2007, respectively.
28
(E) Premises and Equipment — Premises and equipment are stated at cost, less accumulated depreciation and amortization. Depreciation is calculated by the declining-balance or straight-line method over the estimated useful lives of the assets. Leasehold improvements are amortized using the straight-line method over the term of the lease or the estimated life of the asset, whichever is shorter.
The Bank measures impairment of long-lived assets in accordance with SFAS No. 144, “Accounting for the Impairment or Disposal of Long-Lived Assets.” SFAS No. 144 retains the existing requirements to recognize and measure the impairment of long-lived assets to be held and used or to be disposed of by sale. There was no impairment of long-lived assets as of December 31, 2008 and 2007, respectively.
(F) Other Real Estate Owned — Property acquired through foreclosure (other real estate owned or “OREO”), is stated at the lower of cost or fair value less selling costs. Credit losses arising at the time of the acquisition of property are charged against the allowance for loan losses. Any additional write-downs to the carrying value of these assets that may be required, as well as the cost of maintaining and operating these foreclosed properties, are charged to expense. Additional write-downs are recorded in a valuation reserve account that is maintained asset by asset.
(G) Excess of Cost Over Fair Value of Net Assets Acquired and Other Intangible Assets — Through December 31, 2001, the excess of cost over fair value of net assets acquired (goodwill) was amortized on a straight-line basis over a period of ten years. Effective with the adoption of SFAS No. 142, “Goodwill and Other Intangible Assets,” on January 1, 2002, the Bank ceased amortizing goodwill and, instead, tests goodwill for impairment annually or when there is a circumstance that would indicate the need to evaluate between annual tests. No such circumstances occurred in 2008. Accordingly, there was no impairment of goodwill as of December 31, 2008 and 2007.
(H) Allowance for Contingent Liabilities — The balance of the allowance for contingent liabilities is determined by management’s estimate of the amount of financial risk in outstanding loan commitments and contingent liabilities such as performance and financial letters of credit. The allowance for contingent liabilities was $419,000 as of December 31, 2008 and $390,000 as of December 31, 2007.
The Bank accounts for letters of credit in accordance with FASB Interpretation 45 (“FIN 45”), “Guarantor’s Accounting and Disclosure Requirements for Guarantees, including Indirect Guarantees of Indebtedness of Others.” Suffolk has financial and performance letters of credit. Financial letters of credit require the Bank to make payment if the customer’s financial condition deteriorates, as defined in the agreements. Performance letters of credit require the Bank to make payments if the customer fails to perform certain nonfinancial contractual obligations. The maximum potential undiscounted amount of the future payments of these letters of credit as of December 31, 2008 is $26,918,000 and they expire as follows:
| | | |
2009 | | $ | 25,970,000 |
2010 | | | 773,000 |
2011 | | | 102,000 |
2012 and thereafter | | | 73,000 |
| | | |
| | $ | 26,918,000 |
| | | |
Amounts due under these letters of credit would be reduced by any proceeds that Suffolk would be able to obtain in liquidating the collateral for the loans, which varies depending on the customer. The valuation of the allowance for contingent liabilities includes a provision of $40,000 for losses based on the letters of credit outstanding on December 31, 2008.
(I) Income Taxes — Suffolk uses an asset and liability approach to accounting for income taxes. The asset and liability approach requires the recognition of deferred tax assets and liabilities for the expected future tax consequences of temporary differences between the carrying amounts and the tax bases of assets and liabilities. Deferred tax assets are recognized if it is more likely than not that a future benefit will be realized. It is management’s position that no valuation allowance is necessary against any of Suffolk’s deferred tax assets.
As of January 1, 2007, Suffolk adopted FASB Interpretation No. 48, “Accounting for Uncertainty in Income Taxes — an interpretation of FASB Statement No. 109” (FIN 48), which prescribes the recognition and measurement criteria related to tax positions taken or expected to be taken in a tax return. The cumulative effect of applying the provisions of FIN 48 were recorded as a credit adjustment to the opening balance of retained earnings in the amount of $2,013,000.
(J) Summary of Retirement Benefits Accounting — Suffolk’s retirement plan is noncontributory and covers substantially all eligible employees. The plan conforms to the provisions of the Employee Retirement Income Security Act of 1974, as amended, and the Pension Protection Act of 2006, which requires certain funding rules for defined benefit plans. Suffolk’s policy is to accrue for all pension costs and to fund the maximum amount allowable for tax purposes. Actuarial gains and losses that arise from changes in assumptions concerning future events are amortized over a period that reflects the long-term nature of pension expense used in estimating pension costs.
On December 31, 2006, Suffolk adopted FASB Statement No. 158, “Employers’ Accounting for Defined Benefit Pension and Other Postretirement Plans – an amendment of FASB Statements No. 87, 88, 106 and 132(R).” This statement requires an employer to recognize the overfunded or underfunded status of a defined benefit postretirement plan as an asset or liability in its statement of financial position and to recognize changes in the funded status of the plan in the year in which the changes occur through comprehensive income. Application of the Statement will not change the calculation of net income in future periods, but will affect the calculation of other comprehensive income. Statement 158 also requires an employer to use the same date for the measurement of plan assets as for the statement of condition, and provides for either of two methods to make the transition. Suffolk has chosen to re-measure the obligations of the plan as of the beginning of fiscal year 2008. Under this method, 2008 net periodic pension expense
29
was determined using the market value of plan assets and liabilities as of January 1, 2008. Accordingly, Suffolk recorded a decrease to prepaid pension cost of $1,297,000, a debit adjustment to opening retained earnings in the amount of $118,000, and a debit adjustment to accumulated other comprehensive loss in the amount of $1,140,000.
Suffolk accrues for postretirement benefits other than pensions by accruing the cost of providing those benefits to an employee during the years that the employee serves. The remeasurement of the postretirement plan resulted in a credit to opening retained earnings in the amount of $157,000.
(K) Cash and Cash Equivalents — For purposes of the consolidated statement of cash flows, cash and due from banks, and federal funds sold are considered to be cash equivalents. Generally, federal funds are sold for one-day periods.
(L) Stock-Based Compensation — At December 31, 2008, the Bank had one stock-based employee compensation plan, which is more fully described in Note 8. Suffolk accounts for stock-based employee compensation in accordance with SFAS No. 123(R), “Share-Based Payment” (SFAS No. 123(R)). This statement requires all share-based payments to employees, including grants of employee stock options, to be recognized in the financial statements based on their fair values.
During 2008, 2007, and 2006, $108,000, $143,000, and $137,000 of compensation expense, net of a tax benefit of $74,000, $97,000, and $95,000, respectively, was recorded for stock-based compensation. As of December 31, 2008, there was $15,000 of total unrecognized compensation cost, net of estimated forfeitures, related to non-vested options under the stock-based employee compensation plan. That cost is expected to be recognized over a weighted average period of one month.
(M) Treasury Stock — The balance of treasury stock is computed at par value. The excess cost over par is subtracted from undivided profits.
(N) Earnings-per-share — Basic earnings-per-share is computed by dividing net income by the number of weighted-average shares outstanding during the period. Diluted earnings-per-share reflect the dilution that would occur if stock options were exercised in return for common stock that would then share in Suffolk’s earnings. It is computed by dividing net income by the sum of the weighted-average number of common shares outstanding and the weighted-average number of stock options exercisable during the period. Suffolk has no other securities that could be converted into common stock, nor any contracts that would result in the issuance of common stock.
(O) Comprehensive Income — Comprehensive income includes net income and all other changes in equity during a period except those resulting from investments by owners and distributions to owners. Other comprehensive income includes revenues, expenses, gains, and losses that under generally accepted accounting principles are included in comprehensive income but excluded from net income. Comprehensive income and accumulated other comprehensive income are reported net of related income taxes. Accumulated other comprehensive income for the Bank consists of unrealized holding gains or losses on securities available for sale, and gains or losses on the unfunded projected benefit obligation of the pension plan.
The following table summarizes comprehensive income activity : (in thousands)
| | | | | | | | | | | | | | | | | | | | | | | | |
| | | December 31, 2008 | | | December 31, 2007 | | December 31, 2006 | |
| | | Before
Tax
Amount | | | Tax
(Expense)
Benefit | | Net of
Tax
Amount | | | Before
Tax
Amount | | Tax
(Expense)
Benefit | | | Net of
Tax
Amount | | Before
Tax
Amount | | | Tax
(Expense)
Benefit | | | Net of
Tax
Amount | |
Unrealized gains (losses) on investment securities (1) | | (6,086 | ) | | 2,483 | | (3,603 | ) | | 5,104 | | (2,093 | ) | | 3,011 | | 1,593 | | | (653 | ) | | 940 | |
Gains (losses) on pension projected benefit obligation | | (14,799 | ) | | 6,010 | | (8,671 | ) | | 3,247 | | (1,344 | ) | | 1,903 | | (4,620 | ) | | 1,888 | | | (2,732 | ) |
| | | | | | | | | | | | | | | | | | | | | | | | |
Adjusted other comprehensive income (loss), net | | (20,885 | ) | | 8,493 | | (12,274 | ) | | 8,351 | | (3,437 | ) | | 4,914 | | (3,027 | ) | | 1,235 | | | (1,792 | ) |
| | | | | | | | | | | | | | | | | | | | | | | | |
| (1) | Excludes realized securities gains from the sale of Visa shares with a zero basis. |
(P) Segment Reporting — SFAS No. 131, “Disclosures About Segments of an Enterprise and Related Information,” requires that public companies report certain information about operating segments. It also requires that public companies report certain information about their products and services, the geographic areas in which they operate, and their major customers. Suffolk is a regional bank, which offers a wide array of products and services to its customers. Pursuant to its banking strategy, emphasis is placed on building relationships with its customers, as opposed to building specific lines of business. As a result, at December 31, 2008 and 2007, Suffolk is not organized around discernible lines of business and prefers to work as an integrated unit to customize solutions for its customers, with business line emphasis and product offerings changing over time as needs and demands change. Thus, all necessary requirements of SFAS No. 131 have been met by Suffolk as of December 31, 2008.
(Q) Fair Value Measurements— SFAS No. 157, “Fair Value Measurements” defines fair value, establishes a framework for measuring fair value in accordance with U.S. GAAP and expands disclosures about fair value measurements. The definition of fair value retains the exchange price notion; however, this statement clarifies that the exchange price is the price in an orderly transaction between market participants to sell the asset or transfer the liability in the principal market for the asset or
30
liability. This statement emphasizes that fair value is a market-based measurement, not an entity-specific measurement; therefore, a fair value measurement should be determined based on the assumptions that market participants would use in pricing the asset or liability. This statement clarifies that market participant assumptions include assumptions about risk, the risk inherent in a particular valuation technique used to measure fair value and/or the risk inherent in the inputs to the valuation technique, as well as the effect of credit risk on the fair value of liabilities. This statement also expands disclosures about the use of fair value to measure assets and liabilities in interim and annual periods, focusing on the inputs used to measure fair value. The three levels of the fair value inputs under SFAS No. 157 are described below:
Basis of Fair Value Measurement:
Level 1 - Unadjusted quoted prices in active markets that are accessible at the measurement date for identical, unrestricted assets or liabilities;
Level 2 - Quoted prices in markets that are not active, or inputs that are observable, either directly or indirectly, for substantially the full term of the asset or liability;
Level 3 - Prices or valuation techniques that require inputs that are both significant to the fair value measurement and unobservable (i.e., supported by little or no market activity).
Suffolk has adopted the provisions of SFAS 157 as of January 1, 2008. Please refer to Note 14 for further discussion of fair value.
The following table summarizes fair value measurements on a recurring basis as of December 31, 2008: (in thousands)
| | | | | | | | | | | | |
| | | Fair Value Measurements Using |
Description | | 12/31/2008 | | Quoted Prices in
Active Markets for
Identical Assets
(Level 1) | | Significant
Other
Observable Inputs
(Level 2) | | Significant
Unobservable
Inputs
(Level 3) |
Available-for-sale securities | | $ | 382,357 | | $ | 86,629 | | $ | 295,728 | | | — |
Mortgage Servicing Rights | | | 1,199 | | | — | | | — | | | 1,199 |
| | | | | | | | | | | | |
Total | | $ | 383,556 | | $ | 86,629 | | $ | 295,728 | | $ | 1,199 |
| | | | | | | | | | | | |
The types of instruments valued based on quoted market prices in active markets include most U.S. government debt and agency debt securities. Such instruments are generally classified within level 1 or level 2 of the fair value hierarchy. As required by SFAS No. 157, Suffolk does not adjust the quoted price for such instruments.
The types of instruments valued based on quoted prices in markets that are not active, broker or dealer quotations, or alternative pricing sources with reasonable levels of price transparency include state and municipal obligations, mortgage-backed securities and collateralized mortgage obligations. Such instruments are generally classified within level 2 of the fair value hierarchy.
Assets measured at fair value on a non-recurring basis are as follows:
| | | | | | | | | | | | |
| | | Fair Value Measurements Using |
Description | | 12/31/2008 | | Quoted Prices in
Active Markets for
Identical Assets
(Level 1) | | Significant
Other
Observable Inputs
(Level 2) | | Significant
Unobservable
Inputs
(Level 3) |
Impaired Loans | | $ | 1,543 | | | — | | | — | | $ | 1,543 |
| | | | | | | | | | | | |
Total | | $ | 1,543 | | $ | — | | $ | — | | $ | 1,543 |
| | | | | | | | | | | | |
Impaired loans are evaluated and valued at the time the loan is identified as impaired, at the lower of cost or market value, and classified at level 3 in the fair value hierarchy. Market value is measured based on the value of the collateral securing these loans or techniques that are not supported by market activity for loans that are not collateral dependent and require management’s judgment. Collateral may be real estate and/or business assets including equipment, inventory, and/or accounts receivable. The value of real estate collateral is determined based on appraisals by qualified licensed appraisers hired by Suffolk. The value of business equipment
31
may be based on an appraisal by qualified licensed appraisers hired by Suffolk if significant, or may be valued based on the equipment’s net book value on the business’ financial statements. Inventory and accounts receivable collateral may be valued based on independent field examiner review or aging reports, if significant.
Field examiner reviews may be conducted based on the loan exposure and reliance on this type of collateral. Appraised and reported values may be discounted based on management’s historical knowledge, changes in market conditions from the time of valuation, and/or management’s expertise and knowledge of the client and client’s business. Impaired loans are reviewed and evaluated on at least a quarterly basis for additional impairment and adjusted accordingly, based on the same factors identified above.
(R) Reclassification of Prior Year Consolidated Financial Statements — Certain reclassifications have been made to the prior year’s consolidated financial statements that conform with the current year’s presentation. Such reclassifications had no impact on net income.
Note 2 — Investment Securities
The amortized cost, estimated fair values, and gross unrealized gains and losses of Suffolk’s investment securities available for sale and held to maturity at December 31, 2008 and 2007 were: (in thousands)
| | | | | | | | | | | | | | | | | | | | | | | | | | |
| | | 2008 | | | 2007 | |
| | | Amortized
Cost | | Estimated
Fair
Value | | Gross
Unrealized
Gains | | Gross
Unrealized
Losses | | | Amortized
Cost | | Estimated
Fair
Value | | Gross
Unrealized
Gains | | Gross
Unrealized
Losses | |
Available for sale: | | | | | | | | | | | | | | | | | | | | | | | | | | |
U.S. Treasury securities | | $ | 9,534 | | $ | 10,152 | | $ | 618 | | $ | — | | | $ | 9,547 | | $ | 9,838 | | $ | 291 | | $ | — | |
U.S. government agency debt | | | 75,358 | | | 76,477 | | | 1,119 | | | — | | | | 105,100 | | | 105,066 | | | 219 | | | (253 | ) |
Collateralized mortgage obligations agency issue | | | 134,947 | | | 131,841 | | | 2,663 | | | (5,769 | ) | | | 128,442 | | | 129,562 | | | 1,302 | | | (182 | ) |
Mortgage-backed securities | | | 566 | | | 595 | | | 29 | | | — | | | | 824 | | | 859 | | | 35 | | | — | |
Obligations of states and political subdivisions | | | 165,203 | | | 163,292 | | | 1,121 | | | (3,032 | ) | | | 146,047 | | | 147,471 | | | 1,595 | | | (171 | ) |
| | | | | | | | | | | | | | | | | | | | | | | | | | |
Balance at end of year | | | 385,608 | | | 382,357 | | | 5,550 | | | (8,801 | ) | | | 389,960 | | | 392,796 | | | 3,442 | | | (606 | ) |
| | | | | | | | | | | | | | | | | | | | | | | | | | |
Held to maturity: | | | | | | | | | | | | | | | | | | | | | | | | | | |
Obligations of states and political subdivisions | | | 11,830 | | | 12,415 | | | 596 | | | (11 | ) | | | 9,055 | | | 9,643 | | | 603 | | | (15 | ) |
Other securities | | | 10,559 | | | 10,559 | | | — | | | — | | | | 8,556 | | | 8,556 | | | — | | | — | |
| | | | | | | | | | | | | | | | | | | | | | | | | | |
Balance at end of year | | | 22,389 | | | 22,974 | | | 596 | | | (11 | ) | | | 17,611 | | | 18,199 | | | 603 | | | (15 | ) |
| | | | | | | | | | | | | | | | | | | | | | | | | | |
Total investment securities | | $ | 407,997 | | $ | 405,331 | | $ | 6,146 | | $ | (8,812 | ) | | $ | 407,571 | | $ | 410,995 | | $ | 4,045 | | $ | (621 | ) |
| | | | | | | | | | | | | | | | | | | | | | | | | | |
The amortized cost, maturities, and approximate fair value of Suffolk’s investment securities at December 31, 2008 are as follows: (in thousands)
| | | | | | | | | | | | | | | | | | | | | | | | | | | | | | | | | | | | |
| | | Available for Sale | | Held to Maturity |
| | | U.S. Treasury
Securities | | U.S.
Govt. Agency Debt | | Obligations of
States & Political
Subdivisions | | Obligations of
States & Political
Subdivisions | | Other Securities | | Total
Amortized
Cost | | Total
Fair
Value |
(1) Maturity (in years) | | Amortized
Cost | | Fair
Value | | Amortized
Cost | | Fair
Value | | Amortized
Cost | | Fair
Value | | Amortized
Cost | | Fair
Value | | Amortized
Cost | | Fair
Value | | | | |
Within 1 | | $ | 3,498 | | $ | 3,575 | | $ | 68,040 | | $ | 68,937 | | $ | 1,005 | | $ | 1,007 | | $ | 4,946 | | $ | 4,963 | | $ | — | | $ | — | | $ | 77,489 | | $ | 78,482 |
After 1 but within 5 | | | 6,036 | | | 6,577 | | | 7,318 | | | 7,540 | | | 7,421 | | | 7,544 | | | 1,468 | | | 1,522 | | | — | | | — | | | 22,243 | | | 23,183 |
After 5 but within 10 | | | — | | | — | | | — | | | — | | | 122,177 | | | 121,546 | | | 5,308 | | | 5,828 | | | — | | | — | | | 127,485 | | | 127,374 |
After 10 | | | — | | | — | | | — | | | — | | | 34,600 | | | 33,195 | | | 108 | | | 102 | | | — | | | — | | | 34,708 | | | 33,297 |
Other Securities | | | — | | | — | | | — | | | — | | | — | | | — | | | — | | | — | | | 10,559 | | | 10,559 | | | 10,559 | | | 10,559 |
| | | | | | | | | | | | | | | | | | | | | | | | | | | | | | | | | | | | |
Subtotal | | $ | 9,534 | | $ | 10,152 | | $ | 75,358 | | $ | 76,477 | | $ | 165,203 | | $ | 163,292 | | $ | 11,830 | | $ | 12,415 | | $ | 10,559 | | $ | 10,559 | | $ | 272,484 | | $ | 272,895 |
Collateralized mortgage obligations | | | | | | | | | | | | | | | | | | | | | | | | | | | | | | | | | 134,947 | | | 131,841 |
Mortgage-backed securities | | | | | | | | | | | | | | | | | | | | | | | | | | | | | | | | | 566 | | | 595 |
| | | | | | | | | | | | | | | | | | | | | | | | | | | | | | | | | | | | |
Total | | | | | | | | | | | | | | | | | | | | | | | | | | | | | | | | $ | 407,997 | | $ | 405,331 |
| | | | | | | | | | | | | | | | | | | | | | | | | | | | | | | | | | | | |
| (1) | Maturities shown are stated maturities. Securities backed by mortgages are expected to have substantial periodic prepayments resulting in weighted average lives considerably less than what would be surmised from the table above. |
32
As a member of the Federal Reserve system, the Bank owns Federal Reserve Bank stock with a book value of $638,000. The stock has no maturity and there is no public market for the investment.
As a member of the Federal Home Loan Bank of New York, the bank owns Federal Home Loan Bank of New York stock with a book value of $9,821,000. As of December 31, 2008, the Bank owns 13,971 shares valued at $1,397,000 as its membership portion. The remaining $8,424,000 in stock is owned based on borrowing activity requirements. The stock has no maturity and there is no public market for the investment.
At December 31, 2008 and 2007, investment securities carried at $352,185,000 and $286,421,000 respectively, were pledged to secure trust deposits and public funds on deposit.
The following table presents detail concerning realized securities gains and losses during the years indicated: (in thousands)
| | | | | | | | | |
| | | 2008 | | 2007 | | 2006 |
Gross realized gains | | $ | 3,741 | | $ | — | | $ | — |
Gross realized losses | | | — | | | — | | | — |
| | | | | | | | | |
Net gains | | $ | 3,741 | | $ | — | | $ | — |
| | | | | | | | | |
Included in realized gains on securities is $3,737,000 of proceeds received in connection with shares redeemed as part of the Visa, Inc. initial public offering. Suffolk’s subsidiary, Suffolk County National Bank, was a member of the former Visa, Inc. payments organization and was issued shares when Visa, Inc. was organized. Approximately 39 percent of those shares were redeemed in connection with the public offering. The remaining shares are restricted because of unsettled litigation pending against Visa, Inc. Visa, Inc., at its discretion, may redeem additional shares in order to resolve pending litigation.
The restriction expires upon resolution of the pending litigation. Accordingly, Suffolk has recorded these shares at zero in the accompanying statement of condition. Upon expiration of the restriction, Suffolk expects to record the fair value of the remaining shares.
The table below indicates the length of time individual securities, both held-to-maturity and available-for-sale, have been held in a continuous unrealized loss position at the date indicated: (in thousands)
| | | | | | | | | | | | | | | | | | | | |
As of December 31, 2008 Type of securities | | Number of
Securities | | Less than 12 months | | 12 months or longer | | Total |
| | | Fair Value | | Unrealized Losses | | Fair Value | | Unrealized Losses | | Fair Value | | Unrealized Losses |
U.S. government agency securities | | — | | $ | — | | $ | — | | $ | — | | $ | — | | $ | — | | $ | — |
U.S. Treasury securities | | — | | | — | | | — | | | — | | | — | | | — | | | — |
Municipal securities | | 377 | | | — | | | — | | | 106,549 | | | 3,043 | | | 106,549 | | | 3,043 |
Collateralized mortgage obligations | | 5 | | | — | | | — | | | 30,994 | | | 5,769 | | | 30,994 | | | 5,769 |
| | | | | | | | | | | | | | | | | | | | |
Total | | 382 | | $ | — | | $ | — | | $ | 137,543 | | $ | 8,812 | | $ | 137,543 | | $ | 8,812 |
| | | | | | | | | | | | | | | | | | | | |
| | | | |
As of December 31, 2007 Type of securities | | Number of
Securities | | Less than 12 months | | 12 months or longer | | Total |
| | | Fair Value | | Unrealized Losses | | Fair Value | | Unrealized Losses | | Fair Value | | Unrealized Losses |
U.S. government agency securities | | 3 | | $ | 29,815 | | $ | 160 | | $ | 43,093 | | $ | 93 | | $ | 72,908 | | $ | 253 |
U.S. Treasury securities | | — | | | — | | | — | | | — | | | — | | | — | | | — |
Municipal securities | | 133 | | | 38 | | | — | | | 37,869 | | | 186 | | | 37,907 | | | 186 |
Collateralized mortgage obligations | | 8 | | | — | | | — | | | 36,973 | | | 182 | | | 36,973 | | | 182 |
| | | | | | | | | | | | | | | | | | | | |
Total | | 144 | | $ | 29,853 | | $ | 160 | | $ | 117,935 | | $ | 461 | | $ | 147,788 | | $ | 621 |
| | | | | | | | | | | | | | | | | | | | |
Management has considered factors such as market value, cash flows, and analysis of underlying collateral regarding other-than-temporarily impaired securities and determined that there are no impaired securities as of December 31, 2008.
33
Note 3 — Loans
At December 31, 2008 and 2007, loans included the following: (in thousands)
| | | | | | | | |
| | | 2008 | | | 2007 | |
Commercial, financial, and agricultural | | $ | 220,946 | | | $ | 204,222 | |
Commercial real estate | | | 352,502 | | | | 317,262 | |
Real estate construction loans | | | 131,889 | | | | 83,715 | |
Residential mortgages (1st and 2nd liens) | | | 216,127 | | | | 184,599 | |
Home equity loans | | | 75,654 | | | | 67,081 | |
Consumer loans | | | 94,724 | | | | 99,333 | |
Other loans | | | 1,712 | | | | 1,104 | |
| | | | | | | | |
| | | 1,093,554 | | | | 957,316 | |
Unearned discounts | | | (33 | ) | | | (35 | ) |
Allowance for loan losses | | | (9,051 | ) | | | (7,672 | ) |
| | | | | | | | |
Balance at end of year | | $ | 1,084,470 | | | $ | 949,609 | |
| | | | | | | | |
Restructured loans, loans not accruing interest, and loans contractually past due 90 days or more with regard to payment of principal and/or interest amounted to $4,884,000 and $1,671,000 at December 31, 2008 and 2007, respectively. Interest on loans that have been restructured or are no longer accruing interest would have amounted to $214,000 during 2008, $131,000 during 2007, and $68,000 during 2006, under contractual terms of those loans. Interest income recognized on restructured and non-accrual loans was immaterial for the years 2008, 2007, and 2006.
Suffolk makes loans to its directors and executives, as well as to other related parties in the ordinary course of its business. Loans made to directors and executives, either directly or indirectly, which exceed $60,000 in aggregate for any one director or executive, totaled $9,721,000 and $14,561,000 at December 31, 2008 and 2007, respectively. Unused portions of lines of credit to directors and executives, directly or indirectly, totaled $14,550,000 and $13,445,000. New loans totaling $35,746,000 were granted and payments of $40,586,000 were received during 2008.
Note 4 — Allowance for Loan Losses
An analysis of the changes in the allowance for loan losses follows: (in thousands)
| | | | | | | | | | | | |
| | | 2008 | | | 2007 | | | 2006 | |
Balance at beginning of year | | $ | 7,672 | | | $ | 7,551 | | | $ | 9,828 | |
Provision for loan losses | | | 2,050 | | | | 377 | | | | 966 | |
Reclass to Allowance for Contingent Liabilities | | | (29 | ) | | | (390 | ) | | | — | |
Loans charged-off | | | (1,031 | ) | | | (181 | ) | | | (3,757 | ) |
Recoveries on loans | | | 389 | | | | 315 | | | | 514 | |
| | | | | | | | | | | | |
Balance at end of year | | $ | 9,051 | | | $ | 7,672 | | | $ | 7,551 | |
| | | | | | | | | | | | |
At December 31, 2008 and 2007, respectively, the Bank’s recorded investment in impaired loans and the related valuation allowance calculated under SFAS No. 114 and SFAS No. 118 are as follows: (in thousands)
| | | | | | |
| | | 2008 | | 2007 |
Recorded investment | | $ | 2,834 | | $ | 1,435 |
Valuation allowance | | | 1,291 | | | 700 |
| | | | | | |
This valuation allowance is included in the allowance for loan losses on the statements of condition. The average investment in impaired loans in 2008 was $1,644,000, compared to $816,000 in 2007.
Note 5 — Premises and Equipment
The following table details premises and equipment: (in thousands)
| | | | | | | | | | |
| | | Estimated
Useful Lives | | 2008 | | | 2007 | |
Land | | Indefinite | | $ | 3,326 | | | $ | 3,326 | |
Premises | | 30 - 40 years | | | 19,647 | | | | 19,010 | |
Furniture, fixtures & equipment | | 2 - 7 years | | | 25,830 | | | | 24,652 | |
Leasehold improvements | | 2 - 18 years | | | 3,465 | | | | 3,165 | |
| | | | | | | | | | |
| | | | | 52,268 | | | | 50,153 | |
Accumulated depreciation and amortization | | | | | (29,528 | ) | | | (28,010 | ) |
| | | | | | | | | | |
Balance at end of year | | | | $ | 22,740 | | | $ | 22,143 | |
| | | | | | | | | | |
Depreciation and amortization charged to operations amounted to $2,469,000, $2,313,000, and $2,200,000 during 2008, 2007, and 2006, respectively.
Note 6 — Deposits
The following table summarizes the contractual maturities of time deposits during the years after 2008: (in thousands)
| | | | | | |
Year during which Time Deposit Matures | | Time Deposits
> $100,000 | | Other Time
Deposits |
2009 | | $ | 130,840 | | $ | 121,976 |
2010 | | | 1,280 | | | 12,802 |
2011 | | | 4,039 | | | 6,280 |
2012 | | | 1,897 | | | 7,749 |
2013 | | | 545 | | | 7,445 |
| | | | | | |
Total | | $ | 138,601 | | $ | 156,252 |
| | | | | | |
Note 7 — Borrowings
Presented below is information concerning short- and long-term interest-bearing liabilities — principally Federal Home Loan Bank Borrowings, Securities Sold Under Agreements to Repurchase, and Federal Funds Purchased — and their related weighted-average interest rates for the years 2008, 2007, and 2006: (dollars in thousands)
| | | | | | | | | | | | |
December 31, | | 2008 | | | 2007 | | | 2006 | |
Daily average outstanding | | $ | 206,878 | | | $ | 133,859 | | | $ | 137,511 | |
Total interest cost | | | 6,052 | | | | 7,004 | | | | 7,004 | |
Average interest rate paid | | | 2.93 | % | | | 5.23 | % | | | 5.06 | % |
Maximum amount outstanding at any month-end | | $ | 289,170 | | | $ | 198,320 | | | $ | 192,675 | |
December 31, balance | | | 224,820 | | | | 198,320 | | | | 198,320 | |
Weighted-average interest rate on balances outstanding | | | 2.34 | % | | | 4.31 | % | | | 5.35 | % |
| | | | | | | | | | | | |
34
The following table summarizes the components of short-term and long-term borrowings as of December 31, 2008: (in thousands)
| | | | | | | | | |
December 31, | | Short-Term
Borrowings | | Long-Term
Borrowings | | Total |
Daily average outstanding | | $ | 177,777 | | $ | 29,101 | | $ | 206,878 |
Total interest cost | | | 5,061 | | | 991 | | | 6,052 |
Average interest rate paid | | | 2.85 | | | 3.41 | | | 2.93 |
Maximum amount outstanding at any month-end | | $ | 249,170 | | | 40,000 | | $ | 289,170 |
December 31, balance | | | 184,820 | | | 40,000 | | | 224,820 |
Weighted-average interest rate on balances outstanding | | | 2.11 | | | 3.41 | | | 2.34 |
| | | | | | | | | |
There were no long-term borrowings during 2007 and 2006.
For purposes of borrowing, Suffolk has no assets pledged as collateral to the Federal Reserve Bank as of December 31, 2008. Assets pledged as collateral to the Federal Home Loan Bank (FHLB) as of December 31, 2008 totaled $417,773,000, consisting of eligible loans and investment securities as determined under FHLB borrowing guidelines.
Note 8 — Stockholders’ Equity
Suffolk has a Dividend Reinvestment Plan. Stockholders can reinvest dividends in common stock of Suffolk at a 3 percent discount from market value on newly issued shares. Shareholders may also make additional cash purchases at market value. In 2008, 13,969 shares were issued. No shares were issued in 2007 and 2006.
At December 31, 2008, Suffolk has a Stock Option Plan (“the Plan”) under which 1,200,000 shares of Suffolk’s common stock were originally reserved for issuance to key employees, and of which 1,020,500 remained available at that date. Options are awarded by a committee appointed by the Board of Directors. The Plan provides that the option price shall not be less than the fair value of the common stock on the date the option is granted. All options are exercisable for a period of ten years or less. The Plan provides for but does not require the grant of stock appreciation rights that the holder may exercise instead of the underlying option. When the stock appreciation right is exercised, the underlying option is canceled. The optionee receives shares of common stock with a fair market value equal to the excess of the fair value of the shares subject to the option at the time of exercise (or the portion thereof so exercised) over the aggregate option price of the shares set forth in the option agreement. The exercise of stock appreciation rights is treated as the exercise of the underlying option. Options vest after one year and expire after ten years. Compensation expense related to stock appreciation rights amounted to approximately $104,000, $46,000, and ($93,000), for the years ended December 31, 2008, 2007, and 2006, respectively. The following table presents the options granted, exercised, or expired during each of the past three years:
| | | | | | |
| | | Shares | | | Wtd. Avg. Exercise |
Balance at December 31, 2005 | | 110,500 | | | $ | 23.32 |
Options granted | | 25,000 | | | | 34.95 |
Options exercised | | (14,000 | ) | | | 14.38 |
Options expired or terminated | | (4,000 | ) | | | 33.11 |
| | | | | | |
Balance at December 31, 2006 | | 117,500 | | | $ | 26.52 |
Options granted | | 24,000 | | | | 32.90 |
Options exercised | | — | | | | — |
Options expired or terminated | | — | | | | — |
| | | | | | |
Balance at December 31, 2007 | | 141,500 | | | $ | 27.61 |
| | | | | | |
Options granted | | 17,000 | | | | 31.18 |
Options exercised | | — | | | | — |
Options expired or terminated | | (16,000 | ) | | | 32.83 |
| | | | | | |
Balance at December 31, 2008 | | 142,500 | | | $ | 27.45 |
| | | | | | |
The following table presents additional information:
| | | | | | | | | | | | |
At, or during, year ended December 31, | | 2008 | | | 2007 | | | 2006 | |
Average remaining contractual life in years | | | 5.26 | | | | 5.95 | | | | 6.31 | |
Exercisable options (vested) | | | 127,500 | | | | 117,500 | | | | 93,500 | |
Weighted average fair value of options (Black-Scholes model) at date of grant: | | $ | 10.38 | | | $ | 10.07 | | | $ | 9.44 | |
Black-Scholes Assumptions: | | | | | | | | | | | | |
Risk-free interest rate | | | 3.59 | % | | | 4.89 | % | | | 4.36 | % |
Expected dividend yield | | | 2.82 | % | | | 2.43 | % | | | 2.36 | % |
Expected life in years | | | 10 | | | | 10 | | | | 10 | |
Expected volatility | | | 35.40 | % | | | 25.20 | % | | | 22.00 | % |
| | | | | | | | | | | | |
The following table details contractual weighted-averages lives of outstanding options at various prices:
| | | | | | | | | |
| | | By range of exercise prices |
from | | $ | 13.13 | | $ | 31.25 | | $ | 34.39 |
to | | | 15.50 | | | 31.83 | | | 34.95 |
| | | | | | | | | |
Outstanding stock options | | | 42,000 | | | 67,000 | | | 33,500 |
Weighted-average remaining life | | | 1.60 | | | 7.03 | | | 6.32 |
Weighted-average exercise price | | $ | 14.60 | | $ | 31.86 | | $ | 34.74 |
| | | |
Exercisable stock options | | | 42,000 | | | 52,000 | | | 33,500 |
Weighted-average remaining life | | | 1.60 | | | 6.44 | | | 6.32 |
Weighted-average exercise price | | $ | 14.60 | | $ | 32.05 | | $ | 34.74 |
| | | | | | | | | |
| |
| | | Weighted-average |
At all prices | | Options | | price | | life (yrs) |
Total outstanding | | | 142,500 | | $ | 27.45 | | | 5.26 |
Total exerciseable | | | 127,500 | | $ | 27.01 | | | 4.81 |
| | | | | | | | | |
35
All dividends must conform to applicable statutory requirements. Under 12 USC 56-9, a national bank may not pay a dividend on its common stock if the dividend would exceed net undivided profits then on hand. Further, under 12 USC 60, a national bank must obtain prior approval from the Office of the Comptroller of the Currency (“OCC”) to pay dividends on either common or preferred stock that would exceed the bank’s net profits for the current year combined with retained net profits (net profits minus dividends paid during that period) from the prior two years. At December 31, 2008, approximately $32,997,000 was available for dividends from the Bank to Suffolk Bancorp without prior approval of the OCC.
Note 9 — Income Taxes
The following table presents the provision for income taxes in the consolidated statements of income which is comprised of the following: (in thousands)
| | | | | | | | | | | | | |
| | | | | 2008 | | | 2007 | | | 2006 |
Current: | | Federal | | $ | 10,574 | | | $ | 10,382 | | | $ | 10,071 |
| | State | | | 1,382 | | | | 1,473 | | | | 1,746 |
| | | | | | | | | | | | | |
| | | | | 11,956 | | | | 11,855 | | | | 11,817 |
Deferred: | | Federal | | | (487 | ) | | | (204 | ) | | | 776 |
| | State | | | (46 | ) | | | 11 | | | | 220 |
| | | | | | | | | | | | | |
| | | | | (533 | ) | | | (193 | ) | | | 996 |
| | | | | | | | | | | | | |
Total | | | | $ | 11,423 | | | $ | 11,662 | | | $ | 12,813 |
| | | | | | | | | | | | | |
The total current tax expense was different from the amounts computed by applying the federal income tax rate because of the following:
| | | | | | | | | |
| | | 2008 | | | 2007 | | | 2006 | |
Federal income tax expense at statutory rates | | 35 | % | | 35 | % | | 35 | % |
Tax-exempt interest | | (6 | )% | | (5 | )% | | (3 | )% |
State income taxes net of federal benefit | | 2 | % | | 3 | % | | 3 | % |
Other | | 1 | % | | 1 | % | | 1 | % |
| | | | | | | | | |
Total | | 32 | % | | 34 | % | | 36 | % |
| | | | | | | | | |
The effects of temporary differences between tax and financial accounting that create significant deferred-tax assets and liabilities at December 31, 2008 and 2007, and the recognition of income and expense for purposes of tax and financial reporting, that resulted in a net increase to Suffolk’s net deferred tax asset for the years ended December 31, 2008, 2007, and 2006 are presented below: (in thousands)
| | | | | | | | | |
| | | 2008 | | 2007 | | 2006 |
Deferred tax assets: | | | | | | | | | |
Provision for possible loan losses | | $ | 3,675 | | $ | 3,116 | | $ | 3,086 |
Post-retirement benefits | | | 957 | | | 1,018 | | | 1,010 |
Deferred compensation | | | 2,014 | | | 1,930 | | | 1,837 |
Securities available for sale | | | 1,320 | | | — | | | 930 |
Unfunded pension obligation | | | 4,717 | | | — | | | 260 |
Other | | | 769 | �� | | 580 | | | 352 |
| | | | | | | | | |
Total deferred tax assets before valuation allowance | | | 13,452 | | | 6,644 | | | 7,475 |
Valuation allowance | | | — | | | — | | | — |
| | | | | | | | | |
Total deferred tax assets net of valuation allowance | | | 13,452 | | | 6,644 | | | 7,475 |
| | | | | | | | | |
Deferred tax liabilities: | | | | | | | | | |
Prepaid pension cost | | | — | | | 1,259 | | | — |
Securities available for sale | | | — | | | 1,162 | | | — |
Other | | | 873 | | | 669 | | | 677 |
| | | | | | | | | |
Total deferred tax liabilities | | | 873 | | | 3,090 | | | 677 |
| | | | | | | | | |
Net deferred tax asset | | $ | 12,579 | | $ | 3,554 | | $ | 6,798 |
| | | | | | | | | |
As discussed in Note 1 (I), Suffolk adopted the provisions of FIN 48 effective January 1, 2007. Suffolk had unrecognized tax benefits including interest of approximately $111,000 as of December 31, 2008 and approximately $96,000 as of December 31, 2007. Changes in unrecognized tax benefits consist of the following: (in thousands)
| | | | | | | | | | | |
| | | Total | | | Federal | | | State |
Balance 12/31/07 | | $ | 96 | | | $ | 81 | | | $ | 15 |
Additions from current year tax positions | | | — | | | | — | | | | — |
Additions from prior year tax positions | | | 44 | | | | 34 | | | | 10 |
Reductions for prior year tax positions | | | (29 | ) | | | (29 | ) | | | — |
Settlements | | | — | | | | — | | | | — |
| | | | | | | | | | | |
Balance 12/31/08 | | $ | 111 | | | $ | 86 | | | $ | 25 |
| | | | | | | | | | | |
Suffolk recognizes interest and penalties accrued relating to unrecognized tax benefits in income tax expense. The total amount of accrued interest relating to uncertain tax positions is $31,000 as of December 31, 2008. Suffolk files income tax returns in the U.S. federal jurisdiction and in New York state. Federal returns are subject to audits by tax authorities beginning with the 2004 tax year. New York state returns are subject to audits by tax authorities beginning with the 2005 tax year. It is not anticipated that the unrecognized tax benefits will significantly change over the next twelve months.
36
Note 10 — Employee Benefits
(A) Retirement Plan — Suffolk has a noncontributory defined benefit pension plan available to all full-time employees who are at least 21 years old and have completed at least one year of employment. The plan is governed by the rules and regulations in the Prototype Plan of the New York Bankers Association Retirement System and the Retirement System Adoption Agreement executed by the Bank. For purposes of investment, the plan contributions are pooled with those of other participants in the system.
The following tables set forth the status of Suffolk Bancorp’s combined plan as of December 31, 2008 and December 31, 2007, the time at which the annual valuation of the plan is made.
The following table sets forth the plan’s change in benefit obligation:
| | | | | | | | |
| | | 2008 | | | 2007 | |
Benefit obligation at start of year | | $ | 26,129,023 | | | $ | 25,793,210 | |
Transition adjustment | | | 390,198 | | | | — | |
Service cost | | | 1,353,807 | | | | 1,381,723 | |
Interest cost | | | 1,632,661 | | | | 1,482,086 | |
Actuarial (gain) loss | | | 4,118,954 | | | | (1,267,669 | ) |
Benefits paid | | | (1,362,561 | ) | | | (1,260,327 | ) |
| | | | | | | | |
Benefit obligation at end of year | | $ | 32,262,082 | | | $ | 26,129,023 | |
| | | | | | | | |
The following table sets forth the plan’s change in plan assets:
| | | | | | | | |
| | | 2008 | | | 2007 | |
Fair value of plan assets at start of year | | $ | 29,228,280 | | | $ | 25,156,330 | |
Transition adjustment | | | (906,946 | ) | | | — | |
Actual return on plan assets | | | (7,278,490 | ) | | | 3,790,371 | |
Employer contribution | | | 986,196 | | | | 1,541,906 | |
Benefits paid | | | (1,382,970 | ) | | | (1,260,327 | ) |
| | | | | | | | |
Fair value of plan assets at end of year | | $ | 20,646,070 | | | $ | 29,228,280 | |
| | | | | | | | |
The following table presents the plan’s funded status:
| | | | | | | | |
| | | 2008 | | | 2007 | |
Prepaid Pension Cost | | $ | 4,299,222 | | | $ | 4,413,172 | |
Unrecognized Net Gain (Loss) | | | (15,930,862 | ) | | | (1,334,577 | ) |
Unrecognized Prior Service Cost | | | 15,688 | | | | 20,662 | |
| | | | | | | | |
Funded Status (Under)/Over | | $ | (11,615,952 | ) | | $ | 3,099,257 | |
| | | | | | | | |
A transition adjustment in the amount of $1,297,000 was recorded in 2008 for the 2007 plan year. Suffolk will be required to make an annual minimum contribution of $2,300,000 by June 15, 2009 for the plan year ending September 30, 2008, and $1,554,603 is the minimum required contribution for the plan year ending September 30, 2009.
The following table presents estimated benefits to be paid during the years indicated: (in thousands)
| | | | | | |
| | | Qualified
pension
plan | | Post-
retirement
plan |
2009 | | $ | 1,125 | | $ | 53 |
2010 | | | 1,145 | | | 56 |
2011 | | | 1,196 | | | 59 |
2012 | | | 1,257 | | | 62 |
2013 | | | 1,361 | | | 66 |
2014-2018 | | | 9,192 | | | 382 |
| | | | | | |
The following table summarizes the net periodic pension cost:
| | | | | | | | | | | | |
| | | 2008 | | | 2007 | | | 2006 | |
Service cost | | $ | 1,353,807 | | | $ | 1,381,723 | | | $ | 1,401,348 | |
Interest cost on projected benefit obligations | | | 1,632,661 | | | | 1,482,086 | | | | 1,359,983 | |
Expected return on plan assets | | | (2,081,897 | ) | | | (1,883,320 | ) | | | (1,779,840 | ) |
Net amortization & deferral | | | (3,979 | ) | | | 130,947 | | | | 263,230 | |
| | | | | | | | | | | | |
Net periodic pension cost | | $ | 900,592 | | | $ | 1,111,436 | | | $ | 1,244,721 | |
| | | | | | | | | | | | |
Other changes in plan assets and benefit obligations recognized in other comprehensive income | | | | | | | | | | | | |
Transition Adjustment | | $ | 651,824 | | | $ | — | | | $ | — | |
Net actuarial loss (gain) | | | 8,016,221 | | | | (1,904,569 | ) | | | 2,746,129 | |
Amortization of service cost | | | 2,363 | | | | 2,363 | | | $ | (14,547 | ) |
| | | | | | | | | | | | |
Total recognized in other comprehensive loss (income) | | $ | 8,670,408 | | | $ | (1,902,206 | ) | | $ | 2,731,582 | |
| | | | | | | | | | | | |
Total recognized in net periodic pension cost and other comprehensive loss (income) | | $ | 9,571,000 | | | $ | (3,013,642 | ) | | $ | 1,486,861 | |
| | | | | | | | | | | | |
Weighted-average discount rate | | | 6.29 | % | | | 5.86 | % | | | 5.50 | % |
Rate of increase in future compensation | | | 3.50 | % | | | 3.50 | % | | | 3.00 | % |
Expected long-term rate of return on assets | | | 7.50 | % | | | 7.50 | % | | | 8.00 | % |
| | | | | | | | | | | | |
The following table summarizes the net periodic pension cost expected for December 31, 2009. This expense amount is subject to change if a significant plan-related event should occur before the end of fiscal 2009.
| | | | |
| | | 2009 | |
Service cost | | $ | 1,682,941 | |
Interest cost on projected benefit obligations | | | 1,883,744 | |
Expected return on plan assets | | | (1,561,569 | ) |
Net amortization & deferral | | | 965,177 | |
| | | | |
Net periodic pension cost | | $ | 2,970,293 | |
| | | | |
Weighted-average discount rate | | | 5.95 | % |
Rate of increase in future compensation | | | 3.50 | % |
Expected long-term rate of return on assets | | | N/A | |
| | | | |
37
Plan Assets
Suffolk’s pension plan weighted-average asset allocations at December 31, 2008 and 2007, by asset category are as follows:
| | | | | | |
| | | at
December 31, | |
| | | 2008 | | | 2007 | |
Asset category | | | | | | |
Equity Securities | | 50 | % | | 54 | % |
Debt Securities | | 43 | % | | 40 | % |
Other | | 7 | % | | 6 | % |
| | | | | | |
Total | | 100 | % | | 100 | % |
| | | | | | |
Investment Policies
The New York State Bankers Retirement System (the “System”) was established in 1938 to provide for the payment of benefits to employees of participating banks. The System is overseen by a Board of Trustees who meet quarterly and set the investment policy guidelines.
The System utilizes two investment management firms (which will be referred to as Firm I and Firm II), each investing approximately 50 percent of the total portfolio. The System’s investment objective is to exceed the investment benchmarks in each asset category. Each firm operates under a separate written investment policy approved by the Trustees and designed to achieve an allocation approximating 60 percent invested in equity securities and 40 percent invested in debt securities.
Each Firm shall report at least quarterly to the Investment Committee and semiannually to the Board.
Equity Securities
The target allocation percentage for equity securities is 60 percent but may vary from 50-70 percent at the investment manager’s discretion.
Firm I is employed for its expertise as a Value Manager. It is allowed to invest a certain amount of the equity portfolio under its management in international securities and to hedge said international securities so as to protect against currency devaluations.
The equities managed by Firm II are in a separately managed Large Cap Core Equity Fund. The portfolio is permitted to invest in a diversified range of securities in the U.S. equity markets. Although the portfolio holds primarily common stocks, from time to time the portfolio may invest in other types of investments on an opportunistic basis.
Debt Securities
For both investment portfolios, the target allocation percentage for debt securities is 40 percent but may vary from 30-50 percent at the investment manager’s discretion.
The Fixed Income Portfolio managed by Firm I operates with guidelines relating to types of debt securities, quality ratings, maturities, and maximum single and sector allocations.
The portfolio may trade foreign currencies in both spot and forward markets to effect securities transactions and to hedge underlying asset positions. The purchase and sale of futures and options on futures on foreign currencies and on foreign and domestic bonds, bond indices, and short-term securities is permitted; however, purchases may not be used to leverage the portfolio. Currency transactions may be used only to hedge 0-100 percent of currency exposure of foreign securities.
The Fixed Income portfolio managed by Firm II is a Core Bond Fixed Income Fund. The portfolio investments are limited to U.S. Dollar denominated, fixed income securities and selective derivatives designed to have similar attributes of such fixed income securities. The term “fixed income security” is defined to include instruments with fixed, floating, variable, adjustable, auction rate, zero, or other coupon features.
Expected Long-Term Rate of Return
The expected long-term rate of return on plan assets reflects long-term earnings expectations on existing plan assets and those contributions expected to be received during the current plan year. In estimating that rate, appropriate consideration was given to historical returns earned by plan assets in the fund and the rates of return expected to be available for reinvestment. Average rates of return over the past one-, three-, five-, and ten-year periods were determined and subsequently adjusted to reflect current capital market assumptions and changes in investment allocations.
(B) Director’s Retirement Income Agreement of the Bank of the Hamptons — On April 11, 1994, Suffolk acquired Hamptons Bancshares, Inc., which had a director’s deferred compensation plan. The liability for this plan was approximately $164,000 and $190,000 on December 31, 2008 and 2007. Interest (approximately $14,000 in 2008, $16,000 in 2007, and $18,000 in 2006) is accrued over the term of the plan. In 2008, the Bank paid approximately $40,000 to participants.
(C) Deferred Compensation
1986 Plan — In 1986, the Board approved a deferred compensation plan. Under the plan, certain employees and Directors of Suffolk elected to defer compensation aggregating approximately $177,000 in exchange for stated future payments to be made at specified dates. The rate of return on the initial deferral was guaranteed. For purposes of financial reporting, interest (approximately $268,000 in 2008, $206,000 in 2007, and $216,000 in 2006) at the plan’s contractual rate is being accrued on the deferral amounts over the expected plan term.
During 2008, Suffolk made payments of approximately $160,000 to participants of the plan. Suffolk has purchased life insurance policies on the plan’s participants based upon reasonable actuarial benefit and other financial assumptions where the present value of the projected cash flows from the insurance proceeds approximates the present value of the projected cost of the employee benefit.
38
Suffolk is the named beneficiary on the policies. Net insurance income related to the policies aggregated approximately $222,000, $29,000, and $20,000, in 2008, 2007, and 2006, respectively.
1999 Plan — In 1999, the Board approved a non-qualified deferred compensation plan. Under this plan, certain employees and Directors of Suffolk may elect to defer some or all of their compensation in exchange for a future payment of the compensation deferred, with accrued interest, at retirement. During 2008, participants deferred compensation totaling $123,000. No payments have been made to any of the participants.
(D) Postretirement Benefits Other Than Pension —The following table sets forth the postretirement benefit liability included in other liabilities in the accompanying consolidated statements of condition as of December 31, 2008 and 2007:
| | | | | | | | |
| | | 2008 | | | 2007 | |
Accumulated benefit obligation | | $ | (1,377,462 | ) | | $ | (1,287,267 | ) |
Unrecognized net gain | | | (979,827 | ) | | | (1,055,855 | ) |
Unrecognized past service cost | | | (9,986 | ) | | | (10,794 | ) |
Unrecognized transition obligation | | | 2,834 | | | | 3,742 | |
| | | | | | | | |
Postretirement benefit liability | | $ | (2,364,441 | ) | | $ | (2,350,174 | ) |
| | | | | | | | |
Net periodic post retirement benefit cost (the “net periodic cost”) for the years ended December 31, 2008, 2007, and 2006 includes the following components:
| | | | | | | | | | | | |
| | | 2008 | | | 2007 | | | 2006 | |
Service cost of benefits earned | | $ | 37,257 | | | $ | 35,408 | | | $ | 39,392 | |
Interest cost on liability | | | 81,430 | | | | 75,570 | | | | 65,918 | |
Unrecognized gain | | | (53,830 | ) | | | (52,895 | ) | | | (56,743 | ) |
| | | | | | | | | | | | |
Net periodic cost | | $ | 64,857 | | | $ | 58,083 | | | $ | 48,567 | |
| | | | | | | | | | | | |
Benefit assumptions are based on sponsor contributions of $0.27 per participant per month per $1,000 of life insurance. The retiree is responsible for the premiums, less sponsor contributions. The Bank no longer contributes towards a retiree health plan.
(E) 401(k) Retirement Plan
The Bank has a 401(k) Retirement Plan and Trust (the “401(k) Plan”). Employees who have attained the age of 21 and have completed one year of service have the option to participate. Employees may elect to contribute up to a dollar limit which is set by law. The limit was $15,500 for 2008. The Bank will match one-half of the employee’s contribution up to a maximum of 6% of the employee’s annual gross compensation subject to the aforementioned limit. Employees are fully vested in their own contributions, and the Bank’s matching contributions are fully vested once the participant has six years of service. Bank contributions under the 401(k) Plan amounted to $377,000, $366,000, and $350,000 in 2008, 2007, and 2006, respectively. The Bank funds all amounts when due. At December 31, 2008, contributions to the 401(k) Plan were invested in various bond, equity, money market, or diversified funds as directed by each employee. The 401(k) Plan does not allow for investment in the Company’s common stock.
Note 11 — Commitments and Contingent Liabilities
In the normal course of business, there are various outstanding commitments and contingent liabilities, such as standby letters of credit and commitments to extend credit, which are not reflected in the accompanying consolidated financial statements. No material losses are anticipated as a result of these transactions. Suffolk is contingently liable under standby letters of credit in the amount of $26,918,000 and $21,094,000 at December 31, 2008 and 2007, respectively. Suffolk has commitments to make or to extend credit in the form of revolving open-end lines secured by one- to four-family residential properties, commercial real estate, construction and land development loans, and lease financing arrangements in the amount of $181,744,000 and $174,466,000, and commercial loans of $47,219,000 and $55,863,000 as of December 31, 2008 and 2007, respectively.
In the opinion of management, based upon legal counsel, liabilities arising from legal proceedings against Suffolk would not have a significant effect on the financial position of Suffolk.
During 2008, Suffolk was required to maintain balances with the Federal Reserve Bank of New York for reserve and clearing requirements. These balances averaged $3,243,000 in 2008.
Total rental expense for the years ended December 31, 2008, 2007, and 2006 amounted to $1,319,000, $1,003,000, and $978,000, respectively.
At December 31, 2008, Suffolk was obligated under a number of non-cancelable operating leases for land and buildings used for bank purposes. Minimum annual rentals, exclusive of taxes and other charges under non-cancelable operating leases, are summarized as follows: (in thousands)
| | | |
| | | Minimum Rentals |
2009 | | $ | 1,451 |
2010 | | | 1,527 |
2011 | | | 1,510 |
2012 | | | 1,508 |
2013 and thereafter | | | 5,699 |
| | | |
These rentals do not include obligations for one new office currently scheduled to open in 2009.
Note 12 — Regulatory Capital
The Bank is subject to various regulatory capital requirements administered by the federal banking agencies. Failure to meet minimum capital requirements can initiate certain mandatory and possibly additional discretionary actions by regulators that, if undertaken, could have a direct material effect on the Bank’s financial statements. Under capital adequacy guidelines and the regulatory framework for prompt corrective action, the Bank must meet specific capital requirements that involve quantitative measures of the Bank’s assets, liabilities, and certain off-balance-sheet items calculated under regulatory accounting practices. The Bank’s capital amounts and classification are also subject to qualitative judgments by the regulators about components, risk weighting, and other factors.
39
Quantitative measures established by regulation to ensure capital adequacy require the Bank to maintain minimum amounts and ratios (set forth in the following table) of total and Tier 1 capital (as defined in the regulations) to risk-weighted assets (as defined), and of Tier 1 capital (as defined) to average assets (as defined). Management believes, as of December 31, 2008, that the Bank meets all capital adequacy requirements to which it is subject.
As of December 31, 2008, the most recent notification from the Comptroller of the Currency categorized the Bank as well capitalized under the regulatory framework for prompt corrective action. To be categorized as well capitalized, the Bank must maintain minimum total risk-based, Tier 1 risk-based, and Tier 1 leverage ratios as set forth in the table. Management believes that since that notification no circumstances have changed the institution’s category.
The Bank’s actual capital amounts and ratios are also presented in the following table: (dollars in thousands)
| | | | | | | | | | | | | | | | | | |
| | | Actual capital ratios | | | Minimum
for capital
adequacy | | | Minimum to be
“Well Capitalized” under prompt
corrective action provisions | |
| | | Amount | | Ratio | | | Amount | | Ratio | | | Amount | | Ratio | |
As of December 31, 2008 | | | | | | | | | | | | | | | | | | |
Total Capital (to risk-weighted assets) | | $ | 131,884 | | 10.59 | % | | $ | 99,585 | | 8.00 | % | | $ | 124,482 | | 10.00 | % |
Tier 1 Capital (to risk-weighted assets) | | | 122,833 | | 9.87 | % | | | 49,793 | | 4.00 | % | | | 74,689 | | 6.00 | % |
Tier 1 Capital (to average assets) | | | 122,833 | | 7.90 | % | | | 62,172 | | 4.00 | % | | | 77,214 | | 5.00 | % |
| | | | | | | | | | | | | | | | | | |
As of December 31, 2007 | | | | | | | | | | | | | | | | | | |
Total Capital (to risk-weighted assets) | | $ | 114,858 | | 10.21 | % | | $ | 89,991 | | 8.00 | % | | $ | 112,488 | | 10.00 | % |
Tier 1 Capital (to risk-weighted assets) | | | 107,186 | | 9.53 | % | | | 44,995 | | 4.00 | % | | | 67,493 | | 6.00 | % |
Tier 1 Capital (to average assets) | | | 107,186 | | 7.60 | % | | | 56,449 | | 4.00 | % | | | 70,562 | | 5.00 | % |
| | | | | | | | | | | | | | | | | | |
Note 13 — Credit Concentrations
Suffolk’s principal investments are loans and a portfolio of short- and medium-term debt of the United States Treasury, states and other political subdivisions, U.S. government agencies, corporations, and mortgage-backed securities and collateralized mortgage obligations.
Loans secured by real estate comprise 71.0 percent of the portfolio and 49.1 percent of assets, 32.2 percent of which are for commercial real estate. Commercial real estate loans present greater risk than residential mortgages. Suffolk has attempted to minimize the risks of these loans by considering several factors, including the creditworthiness of the borrower, location, condition, value, and the business prospects for the security property. Commercial, financial, and agricultural loans, unsecured or secured by collateral other than real estate, comprise 20.2 percent of the loan portfolio and 14.0 percent of assets. These loans present significantly greater risk than other types of loans. Average credits are greater in size than consumer loans, and unsecured loans may be more difficult to collect. Suffolk obtains, whenever possible, both the personal guarantees of the principal(s) and cross-guarantees among the principals’ business enterprises. Consumer loans, net of unearned discounts, comprised 8.7 percent of Suffolk’s loan portfolio and 6.0 percent of assets. A majority are indirect dealer-generated loans secured by automobiles. Most of these loans are made to residents of Suffolk’s primary lending area. Each loan is small in amount. Borrowers represent a cross-section of the population and are employed in a variety of industries. The risk presented by any one loan is correspondingly small, and therefore, the risk that this portion of the portfolio presents to Suffolk depends on the financial stability of the population as a whole, not any one entity or industry.
Municipal obligations constitute 43.2 percent of the investment portfolio and 11.0 percent of assets. These obligations present slightly greater risk than U.S. Treasury securities, or those secured by the U.S. government, but significantly less risk than loans because they are backed by the full faith and taxing power of the issuer, most of which is located in the state of New York. U.S. Treasury securities represented 2.5 percent of the investment portfolio and 0.6 percent of assets. U.S. government agency debt securities represented 18.9 percent of the investment portfolio and 4.8 percent of assets. These offer little or no financial risk. Collateralized mortgage obligations represented 32.6 percent of the investment portfolio and 8.3 percent of assets. Mortgage-backed securities represented 0.1 percent of the investment portfolio and less than 0.1 percent of assets.
40
Note 14 — Fair Value of Financial Instruments
The following table presents the carrying amounts and fair values of Suffolk’s financial instruments. SFAS No. 107, “Disclosures About Fair Value of Financial Instruments,” defines the fair value of a financial instrument as the amount at which the instrument could be exchanged in a current transaction between willing parties, other than in a forced sale or liquidation: (in thousands)
| | | | | | | | | | | | |
| | | 2008 | | 2007 |
| | | Carrying
Amount | | Fair
Value | | Carrying
Amount | | Fair
Value |
Cash & cash equivalents | | $ | 41,512 | | $ | 41,512 | | $ | 56,633 | | $ | 56,633 |
Investment securities available for sale | | | 382,357 | | | 382,357 | | | 392,796 | | | 392,796 |
Investment securities held to maturity | | | 22,389 | | | 22,978 | | | 17,611 | | | 18,199 |
Loans, net | | | 1,093,521 | | | 1,103,610 | | | 957,281 | | | 964,076 |
Accrued interest receivable | | | 7,042 | | | 7,042 | | | 7,359 | | | 7,359 |
Deposits | | | 1,216,437 | | | 1,218,872 | | | 1,143,375 | | | 1,143,558 |
Borrowings | | | 224,820 | | | 226,327 | | | 198,320 | | | 198,303 |
Accrued interest payable | | | 2,244 | | | 2,244 | | | 2,247 | | | 2,247 |
| | | | | | | | | | | | |
Limitations
The following estimates are made at a specific point in time and may be based on judgments regarding losses expected in the future, risk, and other factors that are subjective in nature. The methods and assumptions used to produce the fair value estimates follow.
Short-Term Instruments
Short-term financial instruments are valued at the carrying amounts included in the statements of condition, which are reasonable estimates of fair value due to the relatively short term of the instruments. This approach applies to cash and cash equivalents; federal funds purchased; accrued interest receivable; non-interest-bearing demand deposits; N.O.W., money market, and saving accounts; accrued interest payable; and other borrowings.
Loans
Fair values are estimated for portfolios of loans with similar characteristics. Loans are segregated by type.
The fair value of performing loans was calculated by discounting scheduled cash flows through the estimated maturity using estimated market discount rates that reflect the credit and interest rate risk of the loan. Estimated maturity is based on the Bank’s history of repayments for each type of loan and an estimate of the effect of the current economy.
Fair value for significant non-performing loans is based on recent external appraisals of collateral, if any. If appraisals are not available, estimated cash flows are discounted using a rate commensurate with the associated risk. Assumptions regarding credit risk, cash flows, and discount rates are made using available market information and specific borrower information.
The carrying amount and fair value of loans were as follows at December 31, 2008 and 2007: (in thousands)
| | | | | | | | | | | | |
| | | 2008 | | 2007 |
| | | Carrying
Amount | | Fair
Value | | Carrying
Amount | | Fair
Value |
Commercial financial & agricultural | | $ | 220,946 | | $ | 219,728 | | $ | 204,222 | | $ | 205,056 |
Commercial real estate | | | 352,502 | | | 361,327 | | | 317,262 | | | 320,260 |
Real estate construction loans | | | 131,889 | | | 132,169 | | | 83,715 | | | 83,663 |
Residential mortgages (1st & 2nd liens) | | | 216,127 | | | 219,522 | | | 184,599 | | | 184,924 |
Home equity loans | | | 75,654 | | | 73,161 | | | 67,081 | | | 68,378 |
Consumer loans, net of unearned discounts | | | 94,691 | | | 95,991 | | | 99,298 | | | 100,691 |
Other loans | | | 1,712 | | | 1,712 | | | 1,104 | | | 1,104 |
| | | | | | | | | | | | |
Totals | | $ | 1,093,521 | | $ | 1,103,610 | | $ | 957,281 | | $ | 964,076 |
| | | | | | | | | | | | |
Investment Securities
The fair value of the investment portfolio, including mortgage-backed securities, was based on quoted market prices or market prices of similar instruments.
Deposit Liabilities
The fair value of certificates of deposit less than $100,000 was calculated by discounting cash flows with applicable origination rates. At December 31, 2008, the fair value of certificates of deposit less than $100,000 totaling $158,122,000 had a carrying value of $156,252,000. At December 31, 2008, the fair value of certificates of deposit more than $100,000 totaling $139,167,000 had a carrying value of $138,601,000.
Commitments to Extend Credit, Standby Letters of Credit, and Written Financial Guarantees
The fair value of commitments to extend credit was estimated by either discounting cash flows or using the fees currently charged to enter into similar agreements, taking into account the remaining terms of the agreements and the current credit-worthiness of the counterparties.
Credit in the form of revolving open-end lines secured by one- to four-family residential properties, commercial real estate, construction and land development loans, and lease financing arrangements were $181,744,000 and $174,466,000 as of December 31, 2008 and 2007, respectively.
The estimated fair value of written financial guarantees and letters of credit is based on fees currently charged for similar agreements. The contractual amounts of these commitments were $74,137,000 and $76,957,000 at December 31, 2008 and 2007, respectively. The fees charged for the commitments were not material in amount.
41
Note 15 — Selected Quarterly Financial Data (Unaudited)
The comparative results for the four quarters of 2008 and 2007 are as follows: (in thousands of dollars except for share and per-share data)
| | | | | | | | | | | | | | | | | | | | | | | | |
| | | 2008 | | 2007 |
| | | 1st Qtr. | | 2nd Qtr. | | 3rd Qtr. | | 4th Qtr. | | 1st Qtr. | | 2nd Qtr. | | 3rd Qtr. | | 4th Qtr. |
Interest income | | $ | 21,967 | | $ | 21,986 | | $ | 22,454 | | $ | 22,050 | | $ | 22,032 | | $ | 22,364 | | $ | 22,474 | | $ | 22,211 |
Interest expense | | | 6,104 | | | 5,548 | | | 5,769 | | | 4,817 | | | 5,950 | | | 6,379 | | | 6,427 | | | 6,361 |
| | | | | | | | | | | | | | | | | | | | | | | | |
Net interest income | | | 15,863 | | | 16,438 | | | 16,685 | | | 17,233 | | | 16,082 | | | 15,985 | | | 16,047 | | | 15,850 |
Provision for loan losses | | | 225 | | | 300 | | | 300 | | | 1,225 | | | 112 | | | 18 | | | 22 | | | 225 |
| | | | | | | | | | | | | | | | | | | | | | | | |
Net interest income after provision for loan losses | | | 15,638 | | | 16,138 | | | 16,385 | | | 16,008 | | | 15,970 | | | 15,967 | | | 16,025 | | | 15,625 |
Other income | | | 6,350 | | | 2,692 | | | 2,801 | | | 2,800 | | | 2,371 | | | 2,558 | | | 2,756 | | | 2,910 |
Other expense | | | 10,354 | | | 10,435 | | | 11,345 | | | 10,567 | | | 10,323 | | | 10,319 | | | 9,907 | | | 9,843 |
Provision for income taxes | | | 4,075 | | | 2,681 | | | 2,168 | | | 2,499 | | | 2,869 | | | 2,874 | | | 2,831 | | | 3,088 |
| | | | | | | | | | | | | | | | | | | | | | | | |
Net income | | $ | 7,559 | | $ | 5,714 | | $ | 5,673 | | $ | 5,742 | | $ | 5,149 | | $ | 5,332 | | $ | 6,043 | | $ | 5,604 |
| | | | | | | | | | | | | | | | | | | | | | | | |
Basic per-share data: | | | | | | | | | | | | | | | | | | | | | | | | |
Net income | | $ | 0.79 | | $ | 0.60 | | $ | 0.59 | | $ | 0.60 | | $ | 0.51 | | $ | 0.54 | | $ | 0.61 | | $ | 0.58 |
Cash dividends | | $ | 0.22 | | $ | 0.22 | | $ | 0.22 | | $ | 0.22 | | $ | 0.22 | | $ | 0.22 | | $ | 0.22 | | $ | 0.22 |
Average shares | | | 9,593,554 | | | 9,568,730 | | | 9,575,691 | | | 9,582,147 | | | 10,189,580 | | | 9,957,096 | | | 9,765,095 | | | 9,676,500 |
| | | | | | | | | | | | | | | | | | | | | | | | |
Note 16 — Suffolk Bancorp (Parent Company Only) Condensed Financial Statements (in thousands)
| | | | | | | | | | | | |
Condensed Statements of Condition as of December 31, | | 2008 | | | 2007 | | | 2006 | |
Assets | | | | | | | | | | | | |
Due From Banks | | $ | 2,163 | | | $ | 2,177 | | | $ | 2,298 | |
Investment in Subsidiaries: SCNB | | | 112,337 | | | | 108,969 | | | | 108,559 | |
Other Assets | | | 457 | | | | 341 | | | | 296 | |
| | | | | | | | | | | | |
Total Assets | | $ | 114,957 | | | $ | 111,487 | | | $ | 111,153 | |
| | | | | | | | | | | | |
Liabilities and Stockholders’ Equity | | | | | | | | | | | | |
Dividends Payable | | $ | 2,108 | | | $ | 2,121 | | | $ | 2,253 | |
Other Liabilities | | | 448 | | | | 385 | | | | 334 | |
Stockholders’ Equity | | | 112,401 | | | | 108,981 | | | | 108,566 | |
| | | | | | | | | | | | |
Total Liabilities and Stockholders’ Equity | | $ | 114,957 | | | $ | 111,487 | | | $ | 111,153 | |
| | | | | | | | | | | | |
| | | |
Condensed Statements of Income for the Years Ended December 31, | | 2008 | | | 2007 | | | 2006 | |
Income | | | | | | | | | | | | |
Dividends From Subsidiary Bank | | | 9,416 | | | | 29,079 | | | | 14,911 | |
| | | | | | | | | | | | |
| | | 9,416 | | | | 29,079 | | | | 14,911 | |
Expense | | | | | | | | | | | | |
Other Expense | | | 331 | | | | 434 | | | | 262 | |
| | | | | | | | | | | | |
Income Before Equity in Undistributed Net Income of Subsidiaries | | | 9,085 | | | | 28,645 | | | | 14,649 | |
Equity in Undistributed Earnings of Subsidiaries | | | 15,603 | | | | (6,517 | ) | | | 7,979 | |
| | | | | | | | | | | | |
Net Income | | $ | 24,688 | | | $ | 22,128 | | | $ | 22,628 | |
| | | | | | | | | | | | |
| | | |
Condensed Statements of Cash Flows for the Years Ended December 31, | | 2008 | | | 2007 | | | 2006 | |
Cash Flows From Operating Activities | | | | | | | | | | | | |
Net Income | | $ | 24,688 | | | $ | 22,128 | | | $ | 22,628 | |
Less: Equity in Undistributed Earnings of Subsidiaries | | | (15,603 | ) | | | 6,517 | | | | (7,979 | ) |
Other, Net | | | 130 | | | | 245 | | | | 93 | |
| | | | | | | | | | | | |
Net Cash Provided by Operating Activities | | | 9,215 | | | | 28,890 | | | | 14,742 | |
| | | | | | | | | | | | |
Cash Flows From Investing Activities | | | | | | | | | | | | |
Maturities of Investment Securities; Available for Sale | | | — | | | | — | | | | — | |
| | | | | | | | | | | | |
Net Cash Provided by Investing Activities | | | — | | | | — | | | | — | |
| | | | | | | | | | | | |
Cash Flows From Financing Activities | | | | | | | | | | | | |
Stock Dividend Reinvestment | | | 463 | | | | — | | | | — | |
Repurchase of Common Stock | | | (1,253 | ) | | | (20,227 | ) | | | (5,674 | ) |
Dividends Paid | | | (8,439 | ) | | | (8,784 | ) | | | (8,868 | ) |
| | | | | | | | | | | | |
Net Cash Used in Financing Activities | | | (9,229 | ) | | | (29,011 | ) | | | (14,542 | ) |
| | | | | | | | | | | | |
Net (Decrease) Increase in Cash and Cash Equivalents | | | (14 | ) | | | (121 | ) | | | 200 | |
Cash and Cash Equivalents, Beginning of Year | | | 2,177 | | | | 2,298 | | | | 2,098 | |
| | | | | | | | | | | | |
Cash and Cash Equivalents, End of Year | | $ | 2,163 | | | $ | 2,177 | | | $ | 2,298 | |
| | | | | | | | | | | | |
Note: No income tax provision has been recorded on the books of Suffolk Bancorp since it files a return consolidated with its subsidiaries.
42
REPORT OF INDEPENDENT REGISTERED PUBLIC ACCOUNTING FIRM
Board of Directors and
Shareholders of Suffolk Bancorp
We have audited Suffolk Bancorp (a New York corporation) and subsidiaries’ internal control over financial reporting as of December 31, 2008, based on criteria established inInternal Control—Integrated Framework issued by the Committee of Sponsoring Organizations of the Treadway Commission (COSO). Suffolk Bancorp’s management is responsible for maintaining effective internal control over financial reporting and for its assessment of the effectiveness of internal control over financial reporting, included inManagement’s Report on Internal Control over Financial Reporting. Our responsibility is to express an opinion on Suffolk Bancorp’s internal control over financial reporting based on our audit.
We conducted our audit in accordance with the standards of the Public Company Accounting Oversight Board (United States). Those standards require that we plan and perform the audit to obtain reasonable assurance about whether effective internal control over financial reporting was maintained in all material respects. Our audit included obtaining an understanding of internal control over financial reporting, assessing the risk that a material weakness exists, testing and evaluating the design and operating effectiveness of internal control based on the assessed risk, and performing such other procedures as we considered necessary in the circumstances. We believe that our audit provides a reasonable basis for our opinion.
A company’s internal control over financial reporting is a process designed to provide reasonable assurance regarding the reliability of financial reporting and the preparation of financial statements for external purposes in accordance with generally accepted accounting principles. A company’s internal control over financial reporting includes those policies and procedures that (1) pertain to the maintenance of records that, in reasonable detail, accurately and fairly reflect the transactions and dispositions of the assets of the company; (2) provide reasonable assurance that transactions are recorded as necessary to permit preparation of financial statements in accordance with generally accepted accounting principles, and that receipts and expenditures of the company are being made only in accordance with authorizations of management and directors of the company; and (3) provide reasonable assurance regarding prevention or timely detection of unauthorized acquisition, use, or disposition of the company’s assets that could have a material effect on the financial statements.
Because of its inherent limitations, internal control over financial reporting may not prevent or detect misstatements. Also, projections of any evaluation of effectiveness to future periods are subject to the risk that controls may become inadequate because of changes in conditions, or that the degree of compliance with the policies or procedures may deteriorate.
In our opinion, Suffolk Bancorp and subsidiaries maintained, in all material respects, effective internal control over financial reporting as of December 31, 2008, based on criteria established inInternal Control—Integrated Framework issued by COSO.
We also have audited, in accordance with the standards of the Public Company Accounting Oversight Board (United States), the consolidated statements of condition of Suffolk Bancorp and subsidiaries as of December 31, 2008 and 2007, and the related consolidated statements of income, changes in stockholders’ equity, and cash flows for each of the three years in the period ended December 31, 2008 and our report dated March 13, 2009 expressed an unqualified opinion.
|
 |
| GRANT THORNTON LLP |
Philadelphia, Pennsylvania
March 13, 2009
43
REPORT OF INDEPENDENT REGISTERED PUBLIC
ACCOUNTING FIRM
Board of Directors and
Shareholders of Suffolk Bancorp
We have audited the accompanying consolidated statements of condition of Suffolk Bancorp (a New York corporation) and subsidiaries as of December 31, 2008 and 2007, and the related consolidated statements of income, changes in stockholders’ equity and cash flows for each of the three years in the period ended December 31, 2008. These financial statements are the responsibility of the Company’s management. Our responsibility is to express an opinion on these financial statements based on our audits.
We conducted our audits in accordance with the standards of the Public Company Accounting Oversight Board (United States). Those standards require that we plan and perform the audit to obtain reasonable assurance about whether the financial statements are free of material misstatement. An audit includes examining, on a test basis, evidence supporting the amounts and disclosures in the financial statements. An audit also includes assessing the accounting principles used and significant estimates made by management, as well as evaluating the overall financial statement presentation. We believe that our audits provide a reasonable basis for our opinion.
In our opinion, the consolidated financial statements referred to above present fairly, in all material respects, the consolidated financial position of Suffolk Bancorp and subsidiaries as of December 31, 2008 and 2007, and the results of their operations and their cash flows for each of the three years in the period ended December 31, 2008 in conformity with accounting principles generally accepted in the United States of America.
As discussed in Note 9, the Company adopted FASB Interpretation No. 48,Accounting for Uncertainty in Income Taxes — An Interpretation of FASB Statement No. 109, as a cumulative effect adjustment to the opening balance of retained earnings as of January 1, 2007. As discussed in Note 1 to the financial statements, the Company adopted Financial Accounting Standards Board Statement (FASB) No. 123(R),Share-Based Payments and FASB No. 158,Employer’s Accounting for Defined Benefit Pension and Other Postretirement Plans — an amendment of FASB Statements No. 87, 88, 106, and 132(R) in 2006.
We also have audited, in accordance with the standards of the Public Company Accounting Oversight Board (United States), the effectiveness of Suffolk Bancorp and its subsidiaries’ internal control over financial reporting as of December 31, 2008, based on criteria established inInternal Control—Integrated Framework issued by the Committee of Sponsoring Organizations of the Treadway Commission (COSO) and our report dated March 13, 2009 expressed an unqualified opinion.
|
 |
| Philadelphia, Pennsylvania |
| March 13, 2009 |
REPORT OF MANAGEMENT
Board of Directors and
Shareholders of Suffolk Bancorp
The management of Suffolk Bancorp is responsible for the preparation and integrity of the consolidated financial statements and all other information in this annual report, whether audited or unaudited. The financial statements have been prepared in accordance with generally accepted accounting principles and, where necessary, are based on management’s best estimates and judgment. The financial information contained elsewhere in this annual report is consistent with that in the consolidated financial statements.
Suffolk Bancorp’s independent registered public accounting firm has been engaged to perform an audit of the consolidated financial statements in accordance with auditing standards of the Public Company Accounting Oversight Board (United States), and the firm’s report expresses its opinion as to the fair presentation of the consolidated financial statements and conformity with generally accepted accounting principles.
Suffolk Bancorp maintains systems of internal controls that provide reasonable assurance that assets are safeguarded and keeps reliable financial records for preparing financial statements. Internal audits are conducted to continually evaluate the adequacy and effectiveness of such internal controls, policies, and procedures.
The audit committee of the Board of Directors, which is composed entirely of directors who are not employees of Suffolk Bancorp, meets periodically with the internal auditors and management to discuss audit and internal accounting controls, regulatory audits, and financial reporting matters.

J. Gordon Huszagh
President, Chief Executive Officer, & Chief Financial Officer
Riverhead, New York
March 13, 2009
44
SECURITIES AND EXCHANGE COMMISSION
Washington, D.C. 20549
FORM 10-K
(Mark One)
| x | Annual report pursuant to section 13 or 15(d) of the Securities Exchange Act of 1934 |
For the fiscal year ended December 31, 2008
-OR-
| ¨ | Transition report pursuant to section 13 or 15(d) of the Securities Exchange Act of 1934 |
For the transition period from to .
Commission File Number: 01-13580
SUFFOLK BANCORP
(Name of Issuer in Its Charter)
| | |
| New York | | 11-2708279 |
(State or Other Jurisdiction of Incorporation of Organization) | | (I.R.S. Employer Identification No.) |
| | |
| 4 West Second Street, P.O. Box 9000, Riverhead, New York | | 11901 |
| (Address of Principal Executive Offices) | | (Zip Code) |
Issuer’s Telephone Number, Including Area Code: (631) 727-5667
Securities registered under Section 12(b) of the Exchange Act: None
Securities registered under Section 12(g) of the Exchange Act: Common Stock, par value $2.50 per share
(Title of Class)
Indicate by check mark if the Registrant is a well-known seasoned issuer, as defined in Rule 405 of the Securities Act. YES ¨ NO x
Indicate by check mark if the Registrant is not required to file reports pursuant to Section 13 or 15(d) of the Exchange Act. YES ¨ NO x
Indicate by check mark whether the Registrant (1) has filed all reports required to be filed by Section 13 or 15(d) of the Securities Exchange Act of 1934 during the preceding 12 months (or for such shorter period that the Registrant was required to file such reports), and (2) has been subject to such filing requirements for the past 90 days. YES x NO ¨
Indicate by check mark if disclosure of delinquent filers pursuant to Item 405 of Regulation S-K is not contained herein and will not be contained, to the best of the Registrant’s knowledge, in definitive proxy or information statements incorporated by reference in Part III of this Form 10-K or any amendment to this Form 10-K. x
Indicate by check mark whether the Registrant is a large accelerated filer, an accelerated filer, or a non-accelerated filer. See definition of “accelerated filer” and “large accelerated filer” in Rule 12b-2 of the Exchange Act. (Check one):
Large accelerated filer ¨ Accelerated filer x Non-accelerated filer ¨
Indicate by check mark whether the Registrant is a shell company. YES ¨ NO x
The aggregate market value of the common equity held by non-affiliates of the Registrant as of the last business day of the Registrant’s most recently completed second fiscal quarter was $275.8 million.
As of January 31, 2009, there were 9,590,571 shares outstanding of the Registrant’s common stock.
45
PART I
DOCUMENT INCORPORATED BY REFERENCE
Portions of the Registrant’s Proxy Statement for its Annual Meeting of Shareholders to be held April 14, 2009, filed on March 13, 2009. (Part III)
Suffolk Bancorp (“Suffolk”)
Suffolk was incorporated on January 2, 1985 as a bank holding company. On that date, Suffolk acquired, and currently owns, all of the outstanding capital stock of Suffolk County National Bank. On July 14, 1988, Suffolk acquired all the outstanding capital stock of Island Computer Corporation of New York, Inc. The business of Suffolk consists primarily of the ownership, supervision, and control of its subsidiaries. On April 11, 1994, Suffolk acquired all the outstanding capital stock of Hamptons Bancshares, Inc. and merged it into a subsidiary. During 1996, the operations of Island Computer Corporation of New York, Inc. were assumed by Suffolk County National Bank.
Suffolk’s chief competition includes local banks with main or branch offices in the service area of Suffolk County National Bank, including Bank of Smithtown and Bridgehampton National Bank. Additionally, New York City money center banks and regional banks provide competition. These banks include primarily Capital One, Citibank, Bank of America, JPMorgan Chase & Co., TD Bank, and Hudson City Savings.
Suffolk and its subsidiaries had 350 full-time and 57 part-time employees on December 31, 2008.
Suffolk County National Bank (the “Bank”)
The Suffolk County National Bank of Riverhead was organized under the national banking laws of the United States of America on January 6, 1890. The Bank is a member of the Federal Reserve System, and its deposits are insured by the Federal Deposit Insurance Corporation to the extent provided by law.
Directed by members of the communities it serves, the Bank’s main service area includes the towns of Babylon, Brookhaven, East Hampton, Islip, Riverhead, Smithtown, Southampton, and Southold. The main office of the Bank is situated at 6 West Second Street, Riverhead, New York. Its branch offices are located at Bohemia, Center Moriches, Cutchogue, Deer Park, East Hampton, Hampton Bays, Hauppauge, Manorville, Mattituck, Medford, Middle Island, Miller Place, Montauk, Port Jefferson, Port Jefferson Station, Riverhead, Sag Harbor, Sayville, Shore-ham, Smithtown, Southampton, Wading River, Water Mill, West Babylon, and Westhampton Beach, New York. An additional office in Amityville is scheduled to open in late 2009.
The Bank is a full-service bank serving the needs of the local residents of Suffolk County. Most of the Bank’s business is devoted to serving those residing in the immediate area of the Bank’s main and branch offices. Among the services offered by the Bank are checking accounts, savings accounts, time and savings certificates, money market accounts, negotiable-order-of-withdrawal accounts, holiday club accounts, and individual retirement accounts; secured and unsecured loans, including commercial loans to individuals, partnerships, and corporations, agricultural loans to farmers, installment loans to finance small businesses, mobile home loans, and automobile loans; home equity and real estate mortgage loans; safe deposit boxes; trust and estate services; the sale of mutual funds and annuities; and the maintenance of a master pension plan for self-employed individuals’ participation. The business of the Bank is only mildly seasonal.
BUSINESS SEGMENT REPORTING
Suffolk County National Bank is a regional bank, which offers a wide array of products and services to its customers. Pursuant to its banking strategy, emphasis is placed on building relationships with its customers, as opposed to building specific lines of business. As a result, at December 31, 2008 and 2007, Suffolk is not organized around discernible lines of business and prefers to work as an integrated unit to customize solutions for its customers, with business line emphasis and product offerings changing over time as needs and demands change. See page 30 of this Annual Report to Shareholders for the fiscal year ended December 31, 2008.
AVAILABLE INFORMATION
Suffolk files Annual Reports on Form 10-K, Quarterly Reports on Form 10-Q, Current Reports on Form 8-K, Proxy Statements on Form 14(a), and any amendments to those reports, with the United States Securities and Exchange Commission (the “SEC”). The public may read and copy any of these materials at the SEC’s Public Reference Room at 450 Fifth Street, NW, Washington, D.C. 20549. Information on the operation of the Public Reference Room can be obtained by calling the SEC at 1-800-SEC-0330 (1-800-732-0330). The SEC also maintains an Internet site (http://www.sec.gov) that contains reports, proxy, and information statements, and other information regarding issuers, including Suffolk, that file electronically with the SEC. Suffolk also makes these reports available free of charge through its Internet website (http://www.suffolkbancorp.com) as soon as practicably possible after Suffolk files these reports electronically with the SEC.
SUPERVISION AND REGULATION
References in this section to applicable statutes and regulations are brief summaries only, and do not purport to be complete. The reader should consult such statutes and regulations themselves for a full understanding of the details of their operation.
As a consequence of the extensive regulation of commercial banking activities in the United States, the business of Suffolk and its subsidiaries is particularly susceptible to federal and state legislation that may have the effect of increasing or decreasing the cost of doing business, modifying permissible activities, or enhancing the competitive position of other financial institutions.
46
Suffolk is a bank holding company registered under the Bank Holding Company Act (“BHC”Act) and is subject to supervision and regulation by the Federal Reserve Board. Federal laws subject bank holding companies to particular restrictions on the types of activities in which they may engage, and to a range of supervisory requirements and activities, including regulatory enforcement actions for violation of laws and policies.
Activities “Closely Related” to Banking
The BHC Act prohibits a bank holding company, with certain limited exceptions, from acquiring direct or indirect ownership or control of any voting shares of any company that is not a bank or from engaging in any activities other than those of banking, managing or controlling banks and certain other subsidiaries, or furnishing services to or performing services for its subsidiaries. One principal exception to these prohibitions allows the acquisition of interests in companies whose activities are found by the Federal Reserve Board, by order or regulation, to be closely related to banking, or managing or controlling banks. If a bank holding company has become a “financial holding company” (an “FHC”), it may engage in activities that are jointly determined by the Federal Reserve Board and the Treasury Department to be “financial in nature or incidental to such financial activity.” FHCs may also engage in activities that are determined by the Federal Reserve to be “complementary to financial activities.” See “Gramm-Leach-Bliley Act” for a brief summary of the statutory provisions relating to FHCs.
Safe and Sound Banking Practices
Bank holding companies are not permitted to engage in unsafe and unsound banking practices. The Federal Reserve Board may order a bank holding company to terminate an activity or control of a nonbank subsidiary if such activity or control constitutes a significant risk to the financial safety, soundness, or stability of a subsidiary bank and is inconsistent with sound banking principles. Regulation Y also requires a holding company to give the Federal Reserve Board prior notice of any redemption or repurchase of its own equity securities, if the consideration to be paid, together with the consideration paid for any repurchases or redemptions in the preceding year, is equal to 10 percent or more of the company’s consolidated net worth.
The Federal Reserve Board has broad authority to prohibit activities of bank holding companies and their non-banking subsidiaries which represent unsafe and unsound banking practices or which constitute violations of laws or regulations. Notably, the Financial Institutions Reform, Recovery and Enforcement Act of 1989 (“FIRREA”) provides that the Federal Reserve Board can assess civil money penalties for such practices or violations, which can be as high as $1 million per day. FIRREA contains expansive provisions regarding the scope of individuals and entities against which such penalties may be assessed.
Annual Reporting and Examinations
Suffolk is required to file an annual report with the Federal Reserve Board, and such additional information as the Federal Reserve Board may require pursuant to the BHC Act. The Federal Reserve Board may examine a bank holding company or any of its subsidiaries, and charge the company for the cost of such an examination. Suffolk is also subject to reporting and disclosure requirements under state and federal securities laws.
Imposition of Liability for Undercapitalized Subsidiaries
The Federal Deposit Insurance Corporation Improvement Act of 1991 (“FDICIA”) required each federal banking agency to revise its risk-based capital standards to ensure that those standards take adequate account of interest rate risk, concentration of credit risk, and the risks of nontraditional activities, as well as reflect the actual performance and expected risk of loss on multifamily mortgages. In accordance with the law, each federal banking agency has specified, by regulation, the levels at which an insured institution would be considered “well capitalized,” “adequately capitalized,” “undercapitalized,” “significantly undercapitalized,” and “critically undercapitalized.” Under these regulations, as of December 31, 2008, the Bank would be deemed to be “well capitalized.”
FDICIA requires bank regulators to take “prompt corrective action” to resolve problems associated with insured depository institutions. In the event an institution becomes “undercapitalized,” it must submit a capital restoration plan. If an institution becomes “significantly undercapitalized” or “critically undercapitalized,” additional and significant limitations are placed on the institution. The capital restoration plan of an undercapitalized institution will not be accepted by the regulators unless each company “having control of” the undercapitalized institution “guarantees” the subsidiary’s compliance with the capital restoration plan until it becomes “adequately capitalized.” Suffolk has control of the Bank for purpose of this statute.
Additionally, Federal Reserve Board policy discourages the payment of dividends by a bank holding company from borrowed funds as well as payments that would adversely affect capital adequacy. Failure to meet the capital guidelines may result in supervisory or enforcement actions by the Federal Reserve Board.
Acquisition by Bank Holding Companies
The BHC Act requires every bank holding company to obtain the prior approval of the Federal Reserve Board before it may acquire all or substantially all of the assets of any bank, or ownership or control of any voting shares of any bank, if after such acquisition it would own or control, directly or indirectly, more than 5 percent of the voting shares of such bank. In approving bank acquisitions by bank holding companies, the Federal Reserve Board is required to consider the financial and managerial resources and future prospects of the bank holding company and banks concerned, the convenience and needs of the communities to be served, and the effect on competition. The Attorney General of the United States may, within 30 days after approval of an acquisition by the Federal Reserve Board, bring an action challenging such acquisition under the federal antitrust laws, in which case the effectiveness of such approval is stayed pending a final ruling by the courts. Under certain circumstances, the 30-day period may be shortened to 15 days.
47
Interstate Acquisitions
Under the Riegle-Neal Interstate Banking and Branching Efficiency Act of 1994, beginning September 29, 1995, bank holding companies may acquire banks in any state subject to limited restrictions including bank age and deposit concentration limits, notwithstanding contrary state law. All banks owned in common by a bank holding company may act as agents for one another. An agent bank may receive deposits, renew time deposits, accept payments, and close and service loans for its principal bank and not be considered to be a branch of the principal banks.
Banks also may merge with banks in another state and operate either office as a branch, preexisting contrary state law notwithstanding. This law became effective automatically in all states on June 1, 1997, unless a state, by legislation enacted before June 1, 1997, opted out of coverage by the interstate branching provision. Upon consummation of an interstate merger, the resulting bank may acquire or establish branches on the same basis that any participant in the merger could have if the merger had not taken place.
Banks may also merge with branches of banks in other states without merging with the banks themselves, or may establishde novobranches in other states if the laws of the other states expressly permit such mergers or such interstatede novo branching.
Banking Regulation
The Bank is a national bank, which is subject to regulation and supervision primarily by the Office of the Comptroller of the Currency (the “OCC”) and secondarily by the Federal Reserve Board and the Federal Deposit Insurance Corporation (the “FDIC”). The Bank is subject to the requirements and restrictions under federal law, including requirements to maintain reserves against deposits, restrictions on the types and amounts of loans that may be granted and the interest that may be charged thereon, and limitations on the types of investments that may be made and the types of services that may be offered. Various consumer laws and regulations also affect the operations of the Bank.
Restrictions on Transactions with Affiliates
Section 23A of the Federal Reserve Act imposes quantitative and qualitative limits on transactions between a bank and any affiliate, and requires certain levels of collateral for such loans. It also limits the amount of advances to third parties which are collateralized by the securities or obligations of Suffolk or its subsidiaries.
Section 23B requires that certain transactions between the Bank and its affiliates must be on terms substantially the same, or at least as favorable, as those prevailing at the time for comparable transactions with or involving other nonaffiliated companies. In the absence of such comparable transactions, any transaction between the Bank and its affiliates must be on terms and under circumstances, including credit standards, that in good faith would be offered to or would apply to nonaffiliated companies.
Examinations
The OCC regularly examines the Bank and records of the Bank. The FDIC may also periodically examine and evaluate insured banks. In addition, the Federal Reserve Board regularly examines the Bank and records of Suffolk.
Standards for Safety and Soundness
As part of the FDICIA’s efforts to promote the safety and soundness of depository institutions and their holding companies, appropriate federal banking regulators are required to have in place regulations specifying operational and management standards (addressing internal controls, loan documentation, credit underwriting, and interest rate risk), asset quality, and earnings. In addition, the Federal Reserve Board, the OCC, and FDIC have extensive authority to police unsafe or unsound practices and violations of applicable laws and regulations by depository institutions and their holding companies. For example, the FDIC may terminate the deposit insurance of any institution that it determines has engaged in an unsafe or unsound practice. The agencies can also assess civil money penalties of up to $1 million per day, issue cease-and-desist or removal orders, seek injunctions, and publicly disclose such actions.
Gramm-Leach-Bliley Act
The Gramm-Leach-Bliley Act, effective on March 11, 2000, permits bank holding companies to become FHCs and, by doing so, affiliate with securities firms and insurance companies and engage in other activities that are financial in nature or complementary thereto. A bank holding company may become an FHC, if each of its subsidiary banks is “well capitalized” under the FDI-CIA prompt corrective action provisions, is “well managed,” and has at least a “satisfactory” rating under the Community Reinvestment Act as of 1977 as amended (the “CRA”), by filing a declaration that the bank holding company wishes to become an FHC and meets all applicable requirements.
No prior regulatory approval is required for an FHC to acquire a company, other than a bank or savings association, engaged in activities permitted under the Gramm-Leach-Bliley Act. Activities specified in the Gramm-Leach-Bliley Act as being “financial in nature” include securities underwriting and dealing, and insurance underwriting and agency activities. Activities that the Federal Reserve Board has determined to be closely related to banking are also deemed to be financial in nature.
A national bank also may engage, subject to limitations on investment, in activities that are financial in nature, other than insurance underwriting, merchant banking, real estate development, and real estate investment, through a financial subsidiary of the bank, if the bank is “well capitalized,” “well managed,” and has at least a “satisfactory” CRA rating. Subsidiary banks of an FHC or national bank with financial subsidiaries must continue to be well capitalized and well managed in order to continue to engage in such activities without regulatory actions or restrictions, which could include divestiture of the financial subsidiary or subsidiaries. In addition, an FHC or a bank may not acquire a company that is engaged in such activities unless each of the subsidiary banks of the FHC or the bank has at least a “satisfactory” rating. At December 31, 2008, the Bank was rated as “outstanding.”
48
In July of 2001, provisions of the Gramm-Leach-Bliley Act became effective that impose additional requirements on financial institutions with respect to customer privacy. These provisions generally prohibit disclosure of customer information to nonaffiliated third parties unless the customer has been given the opportunity to object, and has not objected, to such disclosure. Financial institutions are also required to disclose their privacy policies to customers annually and may be required to comply with provisions of applicable state law if such provisions are more protective of customer privacy than those contained in the Gramm-Leach-Bliley Act.
Governmental Monetary Policies and Economic Conditions
The principal sources of funds essential to the business of banks and bank holding companies are deposits, stockholders’ equity, and borrowed funds. The availability of these various sources of funds and other potential sources, such as preferred stock or commercial paper, and the extent to which they are utilized, depends on many factors, the most important of which are the Federal Reserve Board’s monetary policies and the relative costs of different types of funds. An important function of the Federal Reserve Board is to regulate the national supply of bank credit in order to combat recession and curb inflationary pressure. Among the instruments of monetary policy used by the Federal Reserve Board to implement these objectives are open market operations in United States government securities, changes in the discount rate on bank borrowings, and changes in reserve requirements against bank deposits. The monetary policies of the Federal Reserve Board have had a significant effect on the operating results of commercial banks in the past and are expected to continue to do so in the future. In view of the recent changes in regulations affecting commercial banks and other actions and proposed actions by the federal government and its monetary and fiscal authorities, including proposed changes in the structure of banking in the United States, no prediction can be made as to future changes in interest rates, availability of credit, deposit balances, or the overall performance of banks generally or of Suffolk and its subsidiaries in particular.
Net income at Suffolk is primarily reliant on its ability to generate net interest income, and to a lesser extent, fee income. Accordingly, factors affecting Suffolk Bancorp include particularly, but are not limited to: credit risk, the ability of borrowers to repay debt; interest rate risk, changes in interest rates that may cause the net interest margin between earning assets and interest-bearing liabilities to contract; market risk, changes in the market value of securities owing to changes in interest rates; increases or decreases in retail and commercial economic activity in Suffolk’s market area; variations in the ability and propensity of consumers and businesses to borrow, repay, or deposit money, or to use other banking and financial services. Further, it could take Suffolk longer than anticipated to implement its strategic plans to increase revenue and manage non-interest expense, or it may not be possible to implement those plans at all. Finally, new and unanticipated legislation, regulation, or accounting standards may require Suffolk to change its practices in ways that materially change the results of operations. Each of these factors may change in ways that management does not now foresee. They are subject, however, to a variety of uncertainties that could cause future results to vary materially from Suffolk’s historical performance, or from current expectations.
Additional information about the nature of these risks and how they are managed can be found in the following locations in this report:
Credit Risk: under the captions “Non-Performing Loans” and “Summary of Loan Losses and Allowance for Loan Losses” on page 13 of this report.
Interest Rate Risk: under the captions “Asset/Liability Management & Liquidity” and “Interest Rate Sensitivity” and on pages 16 and 17 of this report, respectively.
Market Risk: under the caption “Market Risk” on page 19 of this report.
Management believes that it is imprudent to make or rely on assertions made before the fact concerning the probability that any specific risk will be realized, and that any such assertions would be speculative. Instead, credit, asset/liability management, investment, compliance, and other operating policies are written to account for a range of possible outcomes, and prevent or ameliorate those outcomes falling at the margins of possible occurrence.
STATISTICAL DISCLOSURE
Registrant
Suffolk as such has no physical properties. Office facilities of Suffolk are located at 4 West Second Street, Riverhead, New York.
Bank
The Bank’s main office campus, with three buildings, is located at 6 West Second Street, Riverhead, New York, title to which is held by the Town of Riverhead, New York Industrial Development Agency for reasons of tax abatement, but to which the Bank has all other rights of ownership. The Bank also owns a total of 12 properties with 12 buildings in fee, and holds 17 buildings under lease agreements. The bank also holds one building under lease agreements that will commence upon occupancy of the building in 2009. Management believes that the physical facilities are suitable and adequate and at present are being fully utilized. Suffolk, however, evaluates future needs continuously and anticipates other changes in its facilities during the next several years.
49
There are no material legal proceedings, individually or in the aggregate, to which Suffolk or its subsidiaries are a party or of which any of the property is subject.
| ITEM 4. | Submission of Matters to a Vote of Security Holders |
None.
PART II
| ITEM 5. | Market for Registrant’s Common Equity and Related Stockholder Matters |
Pages 6, 20, and 25 of this Annual Report to Shareholders for the fiscal year ended December 31, 2008.
Comparison of Cumulative Total Return of Suffolk Bancorp, Industry Index, and Broad Market (in $)
| | | | | | | | | | | | |
| | | 1/1/04 | | 12/31/04 | | 12/31/05 | | 12/31/06 | | 12/31/07 | | 12/31/08 |
Suffolk Bancorp | | 100.00 | | 102.12 | | 101.35 | | 116.38 | | 97.62 | | 115.12 |
NASDAQ Banks | | 100.00 | | 114.44 | | 111.80 | | 125.47 | | 99.45 | | 72.51 |
NASDAQ US | | 100.00 | | 108.84 | | 111.16 | | 122.11 | | 132.42 | | 63.80 |
| source: CRSP Total Return Indices - NASDAQ | | | | | | | | | | | | |
ASSUMES $100 INVESTED ON JANUARY 1, 2004 — ASSUMES DIVIDEND REINVESTED — FISCAL YEAR ENDING
DECEMBER 31, 2007
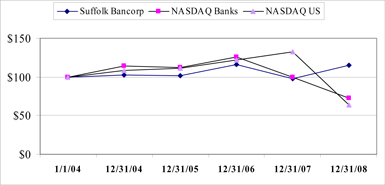
50
At January 31, 2009, there were approximately 1,470 equity holders of record and approximately 2,235 beneficial shareholders of the Company’s common stock. Information concerning dividends and the price range of the common stock can be found on page 6 of this Annual Report to Shareholders. The following table illustrates equity compensation plan information as of December 31, 2008:
Equity Compensation Plan Information (item 201(d))
| | | | | | |
Plan category at December 31, 2008 | | Number of securities
to be issued upon
exercise of outstanding
options, warrants, and
rights
(a) | | Weighted-average
exercise price of
outstanding options,
warrants, and rights
(b) | | Number of securities
remaining available for
future issuance under
equity compensation
plans (excluding
securities reflected in
column (a))
(c) |
| | | # | | $ | | # |
Equity compensation plans approved by security holders | | 142,500 | | 27.45 | | 1,020,500 |
Equity compensation plans not approved by security holders | | — | | — | | — |
| | | | | | |
Total | | 142,500 | | 27.45 | | 1,020,500 |
| | | | | | |
The Suffolk Bancorp 1999 Stock Option Plan which was in effect at December 31, 2008 expired on January 22, 2009 and was replaced by the Suffolk Bancorp 2009 Stock Incentive Plan on February 23, 2009. The new plan provides for 500,000 securities for future issuance under equity compensation plans. Accordingly, as of the date of filing of this document, the total in column C of this table would be 500,000.
| ITEM 6. | Selected Quarterly Financial Data |
Page 42 of this Annual Report to Shareholders for the fiscal year ended December 31, 2008.
| ITEM 7. | Management’s Discussion and Analysis of Financial Condition and Results of Operations |
Pages 7—23 of this Annual Report to Shareholders for the fiscal year ended December 31, 2008.
| ITEM 7a. | Quantitative and Qualitative Disclosure about Market Risk |
Page 19 of this Annual Report to Shareholders for the fiscal year ended December 31, 2008.
| ITEM 8. | Financial Statements and Supplementary Date |
Pages 24—42 of this Annual Report to Shareholders for the fiscal year ended December 31, 2008.
| ITEM 9. | Changes in and Disagreements with Accountants on Accounting and Financial Disclosure |
None.
| ITEM 9a. | Controls and Procedures |
Suffolk’s Chief Executive Officer and Chief Financial Officer (collectively, the “Certifying Officers”) are responsible for establishing and maintaining disclosure controls and procedures for Suffolk. Based upon their evaluation of these controls and procedures as of a date within 90 days of the filing of this report, the Certifying Officers have concluded that Suffolk’s disclosure controls and procedures are effective to ensure that information required to be disclosed by Suffolk in this report is accumulated and communicated to Suffolk’s management, including its principal executive officers as appropriate, to allow timely decisions regarding required disclosure.
The Certifying Officers also have indicated that there were no significant changes in Suffolk’s internal controls or other factors that could significantly affect these controls subsequent to the date of their evaluation, and there were no corrective actions with regard to significant deficiencies and material weaknesses. Management’s Report on Internal Control over Financial Reporting is incorporated herein and can be found on page 23. The effectiveness of Suffolk’s internal control over financial reporting as of December 31, 2008, has been audited by Grant Thornton LLP whose report can be found on page 43.
51
PART III
| ITEM 10. | Directors and Executive Officers of the Registrant |
Pages 2 - 7 of Registrant’s Proxy Statement for its Annual Meeting of Shareholders to be held on April 14, 2009 is incorporated herein by reference.
EXECUTIVE OFFICERS
| | | | | | | | | | | | |
| Name | | Age | | Position | | Business Experience |
| | | | | | |
| J. Gordon Huszagh | | 55 | | President, Chief Executive Officer, & Chief Financial Officer | | Feb-09 | | - | | Present | | President, CEO, CFO, and Director, Suffolk Bancorp |
| | | | | Feb-09 | | - | | Present | | President, CEO, CFO, and Director, SCNB |
| | | | | Jan-99 | | - | | Present | | CFO Suffolk Bancorp, SCNB |
| | | | | Jan-99 | | - | | Feb-09 | | EVP Suffolk Bancorp, SCNB |
| | | | | Jan-97 | | - | | Jan-99 | | SVP and CFO, SCNB |
| | | | | Jan-97 | | - | | Jan-99 | | SVP and CFO, SCNB |
| | | | | Dec-92 | | - | | Dec-96 | | SVP & Comptroller, SCNB |
| | | | | Dec-88 | | - | | Dec-92 | | VP & Comptroller, SCNB |
| | | | | Dec-86 | | - | | Dec-88 | | VP, SCNB |
| | | | | Jan-83 | | - | | Dec-86 | | Auditor, SCNB |
| | | | | 1975 | | - | | 1982 | | Eastern Federal Savings and Loan |
| | | | | Employed by SCNB since January 1983. |
| | | | | | |
| Robert C. Dick | | 59 | | Executive Vice President and Chief Lending Officer | | Apr-00 | | - | | Present | | EVP, Suffolk Bancorp |
| | | | | Apr-00 | | - | | Present | | EVP and Chief Lending Officer, SCNB |
| | | | | Oct-99 | | - | | Apr-00 | | SVP and Chief Lending Officer, SCNB |
| | | | | Dec-88 | | - | | Oct-99 | | SVP, Commercial Loans, SCNB |
| | | | | Dec-82 | | - | | Apr-88 | | VP, Commercial Loans, SCNB |
| | | | | 1965 | | - | | 1980 | | Security National Bank/Chemical Bank |
| | | | | Employed by SCNB since January 1980. |
| | | | | | |
| Frank D. Filipo | | 57 | | Executive Vice President, Retail Banking | | Mar-03 | | - | | Present | | EVP, Suffolk Bancorp |
| | | | | Mar-03 | | - | | Present | | EVP, Retail Banking, SCNB |
| | | | | Sep-01 | | - | | Mar-03 | | SVP, Retail Banking, SCNB |
| | | | | Sep-96 | | - | | Sep-01 | | Regional Administrator, North Fork Bank |
| | | | | Apr-94 | | - | | Sep-96 | | SVP, Commercial Loans, SCNB |
| | | | | Jul-84 | | - | | Apr-94 | | EVP, Senior Lending Officer, Bank of the Hamptons, N.A. |
| | | | | 1982 | | - | | Jul-84 | | VP Commercial Loans, Continental Bank |
| | | | | Employed by SCNB from April 1994 to September 1996 and since September 2001. |
52
| ITEM 11. | Executive Compensation |
Pages 8-18 of Registrant’s Proxy Statement for its Annual Meeting of Shareholders to be held on April 14, 2009 is incorporated herein by reference.
| ITEM 12. | Security Ownership of Certain Beneficial Owners and Management |
Pages 2, 12, 13, and 14 of Registrant’s Proxy Statement for its Annual Meeting of Shareholders to be held on April 14, 2009 is incorporated herein by reference.
| ITEM 13. | Certain Relationships and Related Transactions |
Page 4 of Registrant’s Proxy Statement for its Annual Meeting of Shareholders to be held on April 14, 2009 is incorporated herein by reference.
| ITEM 14. | Principal Accountant Fees and Services |
The following table presents the fees billed for each of the last two fiscal years by Suffolk’s principal accountant by category:
| | | | | | |
| | | 2008 | | 2007 |
Audit fees | | $ | 278,837 | | $ | 355,143 |
Audit-related fees | | | 35,160 | | | 25,167 |
Tax fees | | | — | | | — |
All other fees | | | 1,500 | | | — |
| | | | | | |
| | $ | 315,497 | | $ | 380,310 |
| | | | | | |
The Audit Committee pre-approves all auditing services and permitted non-audit services (including the fees and terms thereof) to be performed for Suffolk by its independent auditor, subject to thede minimis exceptions for non-audit services described in Section
10A (i) (1) (B) of the Exchange Act which are approved by the Committee prior to the completion of the audit. The Audit Committee may form and delegate authority to subcommittees consisting of one or more members when appropriate, including the authority to grant pre-approvals of audit and permitted non-audit services, provided that decisions of such subcommittee to grant pre-approvals shall be presented to the full Audit Committee at its next scheduled meeting. Fees for consultation concerning the computation and filing of income taxes amounting to $45,000 for 2008 were paid to the firm of Marcum & Kliegman, LLP.
PART IV
| ITEM 15. | Exhibits, Financial Statement Schedules, and Reports on Form 8-K |
The following consolidated financial statements of the Registrant and Subsidiaries, and the accountant’s report thereon, are included on pages 24 through 44 inclusive.
Financial Statements (Consolidated)
Statements of Condition — December 31, 2008 and 2007.
Statements of Income — For the years ended December 31, 2008, 2007, and 2006.
Statements of Changes in Stockholders’ Equity — For the years ended December 31, 2008, 2007, and 2006.
Statements of Cash Flows — For the years ended December 31, 2008, 2007, and 2006.
Notes to Consolidated Financial Statements
EXHIBITS
The following exhibits, which supplement this report, have been filed with the Securities and Exchange Commission. Suffolk Bancorp will furnish a copy of any or all of the following exhibits to any persons sending a request in writing to the Corporate Secretary, Suffolk Bancorp, 4 West Second Street, P.O. Box 9000, Riverhead, New York 11901. Suffolk also makes these reports available free of charge through its Internet website (http://www.suffolkbancorp.com)
| A. | Certificate of Incorporation of Suffolk Bancorp (filed by incorporation by reference to Suffolk Bancorp’s Form 10-K for the fiscal year ended December 31, 1999, filed March 10, 2000) |
| B. | Bylaws of Suffolk Bancorp (filed by incorporation by reference to Suffolk Bancorp’s Form 10-K for the fiscal year ended December 31, 1999, filed March 10, 2000) |
| C. | Suffolk Bancorp 2009 Stock Incentive Plan (filed by incorporation by reference to Suffolk Bancorp’s Form 10-K for the fiscal year ended December 31, 2008, filed March 13, 2009) |
| D. | Suffolk Bancorp Form of Change-of-Control Employment Contract (filed by incorporation by reference to Suffolk Bancorp’s Form 10-K for the fiscal year ended December 31, 2008, filed March 13, 2009) |
Reports on Form 8-K
The following reports were filed on Form 8-K during the three-month period ended December 31, 2008:
October 15, 2008, Item 2.02 Results of Operations and Financial Condition. Attached as an exhibit is the Company’s press release titled “Suffolk Bancorp Announces Earnings For The Third Quarter Of 2008” dated October 15, 2008.
November 25, 2008, Item 8.01 Other Events and Required FD Disclosure. Attached as an exhibit is the Company’s press release titled “Suffolk Bancorp Announces Regular Quarterly Dividend” dated November 25, 2008.
53
SIGNATURES
Pursuant to the requirements of Section 13 or 15(d) of the Securities Exchange Act of 1934, the Registrant has duly caused this report to be signed on its behalf by the undersigned, thereunto duly authorized.
|
| SUFFOLK BANCORP |
| March 13, 2009 |
| (Registrant) |
| | | | | | | | | | |
| By: | | /s/ EDGAR F. GOODALE | | | | | | By: | | /s/ JAMES E. DANOWSKI |
| | Edgar F. Goodale | | | | | | | | James E. Danowski |
| | Chairman of the Board & Director | | | | | | | | Director |
| | | | | |
| By: | | /s/ J. GORDON HUSZAGH | | | | | | By: | | /s/ JOSEPH A. GAVIOLA |
| | J. Gordon Huszagh | | | | | | | | Joseph A. Gaviola |
| | President, Chief Executive Officer, | | | | | | | | Director |
| | Chief Financial Officer, & Director | | | | | | | | |
| | | | | |
| | | | | | | | By: | | /s/ DAVID A. KANDELL |
| | | | | | | | | | David A. Kandell |
| | | | | | | | | | Director |
| | | | | |
| | | | | | | | By: | | /s/ THOMAS S. KOHLMANN |
| | | | | | | | | | Thomas S. Kohlmann |
| | | | | | | | | | Director |
| | | | | |
| | | | | | | | By: | | /s/ TERENCE X. MEYER |
| | | | | | | | | | Terence X. Meyer |
| | | | | | | | | | Director |
| | | | | |
| | | | | | | | By: | | /s/ SUSAN V. B. O’SHEA |
| | | | | | | | | | Susan V. B. O’Shea |
| | | | | | | | | | Director |
| | | | | |
| | | | | | | | By: | | /s/ JOHN D. STARK, JR. |
| | | | | | | | | | John D. Stark, Jr. |
| | | | | | | | | | Director |

DIRECTORS
James E. Danowski
Partner; Coughlin, Foundotos, Cullen & Danowski
(accounting firm)
Joseph A. Gaviola
Principal; Gaviola’s Montauk Market
Chris-Nic Properties
(retail, commercial and residential real estate)
Edgar F. Goodale
Chairman of the Board
President; Riverhead Building Supply Corp.
(building supply distributor)
J. Gordon Huszagh
President, Chief Executive Officer & Chief Financial Officer
David A. Kandell
Managing Partner; Kandell, Farnworth, & Pubins, C.P.A.’s
(accounting firm)
Thomas S. Kohlmann
Past Chairman, President & Chief Executive Officer
Terence X. Meyer
Managing Partner; Meyer, Meyer & Keneally, Esqs. L.L.P.
(attorneys)
Susan V. B. O’Shea
Managing Partner; O’Shea Properties
(commercial real estate)
John D. Stark, Jr.
Vice President; Foxwood Corporation
(manufactured housing)
OFFICERS
J. Gordon Huszagh
President, Chief Executive Officer & Chief Financial Officer
Robert C. Dick
Executive Vice President
Frank D. Filipo
Executive Vice President
Douglas Ian Shaw
Senior Vice President & Corporate Secretary
54

DIRECTORS
Edgar F. Goodale
Chairman of the Board
James E. Danowski
Joseph A. Gaviola
J. Gordon Huszagh
David A. Kandell
Thomas S. Kohlmann
Terence X. Meyer
Susan V. B. O’Shea
John. D. Stark, Jr.
EXECUTIVE OFFICERS
J. Gordon Huszagh
President, Chief Executive Officer,
& Chief Financial Officer
Robert C. Dick
Executive Vice President &
Chief Lending Officer
Frank D. Filipo
Executive Vice President
Retail Banking
LOANS
Bruce W. Bradley
Senior Vice President
David T. DeVito
Senior Vice President
Joan Brigante
Senior Vice President
Robert T. Ellerkamp
Vice President
Robert P. Grady
Vice President
Wendy Harris
Vice President
Paul D. Hawkins, Jr.
Vice President
Benjamin Mancuso
Vice President
Gerard H. McGuirk
Vice President
William Mitarotondo
Vice President
Deborah Simonetti
Vice President
Thomas J. Sullivan
Vice President
Frederick J. Weinfurt
Vice President
RETAIL BANKING
Stanley V. Gelish
Senior Vice President
Anita J. Nigrel
Senior Vice President
Cynthia D’Andrea
Vice President
Maureen Hines
Vice President
David E. Lebens
Vice President
Susan M. Martinelli
Vice President
Bohemia Office
Steve E. Horner
Vice President
Center Moriches Officer
Julia Pratt
Assistant Vice President
Cutchogue Office
Kim Sweeney
Assistant Vice President
Deer Park Office
Steven DeLuca
Vice President
East Hampton Pantigo Office
Robert Mangels
Assistant Vice President
East Hampton Village Office
Rebecca Collins
Assistant Vice President
Hampton Bays Office
David C. Barczak
Vice President
Hauppauge Office
Mark Harrigan
Vice President
Manorville Office
Tara Bodkin
Assistant Vice President
Mattituck Office
Janet V. Stewart
Vice President
Medford Office
Paul E. Vaas
Vice President
Middle Island Office
Geralyn Harper
Assistant Vice President
Miller Place Office
Cynthia Berner
Assistant Vice President
Montauk Harbor Office
Montauk Village Office
John J. McDonald
Vice President
Port Jefferson Harbor Office
Port Jefferson Village Officer
Jacqueline Brown
Vice President
Port Jefferson Station Office
Michael E. Newins
Vice President
Riverhead, Ostrander
Avenue Office
Angela R. Reese
Vice President
Riverhead, Second Street Office
Vincent Cangiano
Vice President
Sag Harbor Office
Susan Tooker
Assistant Vice President
Sayville Office
Pamela S. Werner
Assistant Vice President
Shoreham Office
Wendy A. Stapon
Vice President
Smithtown Office
Susan L. Hughes
Assistant Vice President
Southampton Office
Patricia Bolomey
Vice President
Wading River Office
John A. Maki
Assistant Vice President
Water Mill Office
Jill James
Vice President
West Babylon Office
Joanne Goodman
Assistant Vice President
Westhampton Beach Office
Jayne D. Ebert
Vice President
TRUST & ASSET
MANAGEMENT GROUP
Dan A. Cicale
Senior Vice President
& Trust Officer
Trust & Estate Services
Linda Schwartz
Vice President & Trust Officer
Warren Palzer
Vice President
Lori E. Thompson
Vice President
SCNB Financial Services, Inc.
Martin Mangialardi
Vice President
AUDIT
Maria R. Michaelson
Senior Vice President
Tricia Thomas-Hector
Vice President
COLLECTIONS
Christopher R. Martinelli
Vice President
COMPTROLLER
Stacey L. Moran
Vice President
& Comptroller
CORPORATE SERVICES
Douglas Ian Shaw
Senior Vice President &
Corporate Secretary
FACILITIES
Charles E. Anderson
Manager
HUMAN RESOURCES
Nancy Jacob
Senior Vice President
INFORMATION
SECURITY
Joanne Appel
Vice President &
Information Security Officer
INFORMATION
TECHONOLOGY
Mark J. Drozd
Senior Vice President &
Chief Information Officer
Fred A. Bohonan
Vice President
MARKETING
Brenda B. Sujecki
Vice President
OPERATIONS
Dennis F. Orski
Senior Vice President
Deanna L. Miller
Vice President
RISK MANAGEMENT &
COMPLIANCE
Jeanne P. Kelley
Senior Vice President
Linda Follett
Vice President
SECURITY
Alexander B. Doroski
Senior Vice President
55
Directory of Offices and Departments
| | | | | | |
| | | | | Area Code (631) |
ON THE WEB AT: | | WWW.SCNB.COM | | Telephone | | FAX |
| | | |
| Executive Offices | | 4 West Second Street, P.O. Box 9000, Riverhead, N.Y. 11901 | | 208-2400 | | 727-2638 |
| | | |
| Audit | | 4 West Second Street, P.O. Box 9000, Riverhead, N.Y. 11901 | | 208-2285 | | 727-8236 |
| | | |
| Bohemia Office | | 3880 Veterans Memorial Highway, Bohemia, N.Y. 11716 | | 585-4477 | | 585-4809 |
| | | |
| Business and Professional Banking Center | | 222 Middle Country Road, Smithtown, N.Y. 11787 | | 979-3400 | | 979-3430 |
| | | |
| Center Moriches Office | | 502 Main Street, Center Moriches, N.Y. 11934 | | 878-8800 | | 878-4431 |
| | | |
| Collections | | 206 Griffing Avenue, Riverhead, N.Y. 11901 | | 208-2370 | | 727-5732 |
| | | |
| Commercial Loans | | 4 West Second Street, P.O. Box 9000, Riverhead, N.Y. 11901 | | 208-2201 | | 727-5798 |
| | | |
| | 3880 Veterans Memorial Highway, Bohemia, N.Y. 11716 | | 580-0181 | | 580-0183 |
| | | |
| | 137 West Broadway, Port Jefferson, N.Y. 11777 | | 642-1000 | | 642-0200 |
| | | |
| | 295 North Sea Road, Southampton, N.Y. 11968 | | 287-3104 | | 287-3296 |
| | | |
| Compliance | | 4 West Second Street, P.O. Box 9000, Riverhead, N.Y. 11901 | | 208-2292 | | 727-1399 |
| | | |
| Comptroller | | 4 West Second Street, P.O. Box 9000, Riverhead, N.Y. 11901 | | 208-2270 | | 369-2230 |
| | | |
| Consumer Loans | | 4 West Second Street, P.O. Box 9000, Riverhead, N.Y. 11901 | | 208-2222 | | 727-5521 |
| | | |
| Corporate Services (Investor Relations) | | 4 West Second Street, P.O. Box 9000, Riverhead, N.Y. 11901 | | 727-5667 | | 727-3214 |
| | | |
| Cutchogue Office | | 31525 Main Road, P.O. Box 702, Cutchogue, N.Y. 11935 | | 734-5050 | | 734-7759 |
| | | |
| Deer Park Office | | 21 East Industry Court, Suite 4, Deer Park, N.Y. 11729 | | 274-4888 | | 274-4810 |
| | | |
| Data Processing | | 206 Griffing Avenue, Riverhead, N.Y. 11901 | | 208-2495 | | 369-5834 |
| | | |
| East Hampton Pantigo Office | | 351 Pantigo Road, East Hampton, N.Y. 11937 | | 324-2000 | | 324-6367 |
| | | |
| East Hampton Village Office | | 99 Newtown Lane, East Hampton, N.Y. 11937 | | 324-3800 | | 324-3863 |
| | | |
| Facilities | | 4 West Second Street, P.O. Box 9000, Riverhead, N.Y. 11901 | | 208-2333 | | 208-0767 |
| | | |
| Hampton Bays Office | | 168 West Montauk Highway, Hampton Bays, N.Y. 11946 | | 728-2700 | | 728-8311 |
| | | |
| Hauppauge Office | | 110 Marcus Boulevard, Hauppauge, N.Y. 11788 | | 436-5400 | | 436-4454 |
| | | |
| Human Resources | | 4 West Second Street, P.O. Box 9000, Riverhead, N.Y. 11901 | | 208-2310 | | 727-3170 |
| | | |
| Investments and Insurance at SCNB | | 6 West Second Street, P.O. Box 9000, Riverhead, NY 11901 | | 208-2380 | | 727-3210 |
| | | |
| Manorville Office | | 460 County Road 111, Suite 18, Manorville, N.Y. 11949 | | 281-8200 | | 281-5695 |
| | | |
| Marketing | | 4 West Second Street, P.O. Box 9000, Riverhead, N.Y. 11901 | | 208-2323 | | 727-9223 |
| | | |
| Mattituck Office | | 10900 Main Road, P.O. Box 1420, Mattituck, N.Y. 11952 | | 298-9400 | | 298-9188 |
| | | |
| Medford Office | | 2801 Route 112, Suite B, Medford, N.Y . 11763 | | 758-1500 | | 758-1509 |
| | | |
| Middle Island Office | | 900 Middle Country Road, Middle Island, N.Y. 11953 | | 345-0010 | | 345-5377 |
| | | |
| Miller Place Office | | 159-21A Route 25A, Miller Place, N.Y. 11764 | | 474-8400 | | 474-5357 |
| | | |
| Montauk Harbor Office | | 541 West Lake Drive, P.O. Box 2368, Montauk, N.Y. 11954 | | 668-4333 | | 668-3643 |
| | | |
| Montauk Village Office | | 746 Montauk Highway, P.O. Box 743, Montauk, N.Y. 11954 | | 668-5300 | | 668-1214 |
| | | |
| Operations | | 206 Griffing Avenue, Riverhead, N.Y. 11901 | | 208-2450 | | 369-5834 |
| | | |
| Port Jefferson Harbor Office | | 135 West Broadway, Port Jefferson, N.Y. 11777 | | 474-7200 | | 331-7806 |
| | | |
| Port Jefferson Station Office | | 1510 Route 112, Port Jefferson Station, N.Y. 11776 | | 473-0222 | | 473-0775 |
| | | |
| Port Jefferson Village Office | | 228 East Main Street, Port Jefferson, N.Y. 11777 | | 473-7700 | | 473-9406 |
| | | |
| Residential Mortgage Loans | | 4 West Second Street, P.O. Box 9000, Riverhead, N.Y. 11901 | | 208-2244 | | 369-2468 |
| | | |
| Retail Banking | | 4 West Second Street, P.O. Box 9000, Riverhead, N.Y. 11901 | | 208-2300 | | 727-3873 |
| | | |
| Riverhead, Ostrander Avenue Office | | 1201 Ostrander Avenue, P.O. Box 9000, Riverhead, N.Y. 11901 | | 727-6800 | | 727-5095 |
| | | |
| Riverhead, Second Street Office | | 6 West Second Street, Riverhead, N.Y. 11901 | | 208-2350 | | 727-3210 |
| | | |
| Sag Harbor Office | | 17 Main Street, P.O. Box 1268, Sag Harbor, N.Y. 11963 | | 725-3000 | | 725-4627 |
| | | |
| Sayville Office | | 161 North Main Street, Sayville, N.Y . 11782 | | 218-1600 | | 218-9425 |
| | | |
| SCNB Financial Services, Inc. | | 31525 Main Road, P.O. Box 702, Cutchogue, N.Y. 11935 | | 208-2380 | | 727-3210 |
| | | |
| Shoreham Office | | 9926 Route 25A, P.O. Box 622, Shoreham , N.Y. 11786 | | 744-4400 | | 744-6743 |
| | | |
| Smithtown Office | | 222 Middle Country Road, Suite 108, Smithtown, N.Y. 11787 | | 979-3400 | | 979-3430 |
| | | |
| Southampton Office | | 295 North Sea Road, Southampton, N.Y. 11968 | | 283-3800 | | 287-3293 |
| | | |
| Trust and Asset Management | | 3880 Veterans Memorial Highway, Bohemia, N.Y. 11716 | | 285-6600 | | 285-6610 |
| | | |
| Wading River Office | | 2065 Wading River-Manor Road, Wading River, N.Y. 11792 | | 929-6300 | | 929-6799 |
| | | |
| Water Mill Office | | 828 Montauk Highway, P.O. Box 216, Water Mill, N.Y. 11976 | | 726-4500 | | 726-7573 |
| | | |
| West Babylon Office | | 955 Little East Neck Road, West Babylon, N.Y. 11704 | | 669-7300 | | 669-5211 |
| | | |
| Westhampton Beach Office | | 144 Sunset Avenue, Westhampton Beach, N.Y. 11978 | | 288-4000 | | 288-9252 |