
PG&E Corporation
Edison Electric Institute
Financial Conference
Financial Conference
November 9-12, 2008
Phoenix, Arizona
Exhibit 99

2
This presentation contains forward-looking statements regarding management’s guidance for PG&E Corporation’s 2008 and 2009 earnings per share (“EPS”) from
operations, targeted compound annual growth rate for EPS from operations over the 2007-2011 outlook period, and financing plans, as well as management’s
projections of Pacific Gas and Electric Company’s (Utility) capital expenditures, rate base, rate base growth, and financing plans. These statements and the underlying
assumptions are based on current expectations which management believes are reasonable. The realization of these statements and assumptions are subject to
various risks and uncertainties and actual results may differ materially. Factors that could cause actual results to differ materially include:
§ the Utility’s ability to manage capital expenditures and operating costs within authorized levels and recover costs through rates in a timely manner;
§ the outcome of regulatory proceedings, including pending and future ratemaking proceedings at the California Public Utilities Commission (CPUC) and
the Federal Energy Regulatory Commission;
the Federal Energy Regulatory Commission;
§ the adequacy and price of electricity and natural gas supplies, and the ability of the Utility to manage and respond to the volatility of the electricity and
natural gas markets;
natural gas markets;
§ the effect of weather, storms, earthquakes, fires, floods, disease, other natural disasters, explosions, accidents, mechanical breakdowns, acts of
terrorism, and other events or hazards on the Utility’s facilities and operations, its customers, and third parties on which the Utility relies;
terrorism, and other events or hazards on the Utility’s facilities and operations, its customers, and third parties on which the Utility relies;
§ the potential impacts of climate change on the Utility’s electricity and natural gas business;
§ changes in customer demand for electricity and natural gas resulting from unanticipated population growth or decline, general economic and financial
market conditions, changes in technology including the development of alternative energy sources, or other reasons;
market conditions, changes in technology including the development of alternative energy sources, or other reasons;
§ operating performance of the Utility’s Diablo Canyon nuclear generating facilities (Diablo Canyon), the occurrence of unplanned outages at Diablo
Canyon, or the temporary or permanent cessation of operations at Diablo Canyon;
Canyon, or the temporary or permanent cessation of operations at Diablo Canyon;
§ whether the Utility can maintain the cost savings it has recognized from operating efficiencies it has achieved and identify and successfully implement
additional sustainable cost-saving measures;
additional sustainable cost-saving measures;
§ whether the Utility incurs substantial unanticipated expense to improve the safety and reliability of its electric and natural gas distribution systems;
§ whether the Utility achieves the CPUC’s energy efficiency targets and recognizes any incentives the Utility may earn in a timely manner;
§ the impact of changes in federal or state laws, or their interpretation, on energy policy and the regulation of utilities and their holding companies;
§ the impact of changing wholesale electric or gas market rules, including the California Independent System Operator’s new rules to restructure the
California wholesale electricity market;
California wholesale electricity market;
§ how the CPUC administers the conditions imposed on PG&E Corporation when it became the Utility’s holding company;
§ the extent to which PG&E Corporation or the Utility incurs costs and liabilities in connection with litigation that are not recoverable through rates, from
third parties, or through insurance recoveries;
third parties, or through insurance recoveries;
§ the ability of PG&E Corporation and/or the Utility to access capital markets and other sources of credit in a timely manner on favorable terms; especially
given the recent deteriorating conditions in the economy and financial markets
given the recent deteriorating conditions in the economy and financial markets
§ the impact of environmental laws and regulations and the costs of compliance and remediation;
§ the effect of municipalization, direct access, community choice aggregation, or other forms of bypass;
§ the impact of changes in federal or state tax laws, policies or regulations; and
§ other risks and factors disclosed in PG&E Corporation’s and the Utility’s 2007 Annual Report on Form 10-K and other reports filed with the SEC.
Cautionary Language Regarding
Forward-Looking Statements
Forward-Looking Statements

3
PCG: Investment Case
§ PCG’s investment case remains solid in turbulent
financial times:
financial times:
§ Decoupled revenues
§ Ratemaking mechanisms mitigate exposure to commodity price volatility
§ 11.45% weighted ROE on 52% equity
§ Successful execution and timely completion on large scale projects
§ Sustainable dividend, growing in-line with EPS

4
2008 Business Priorities
§ Deliver on Financial Objectives
§ Focus on Customer Service and Satisfaction
§ Identify and Capture Operating Efficiencies
§ Ensure Workforce Readiness and Alignment
§ Improve System Reliability
5
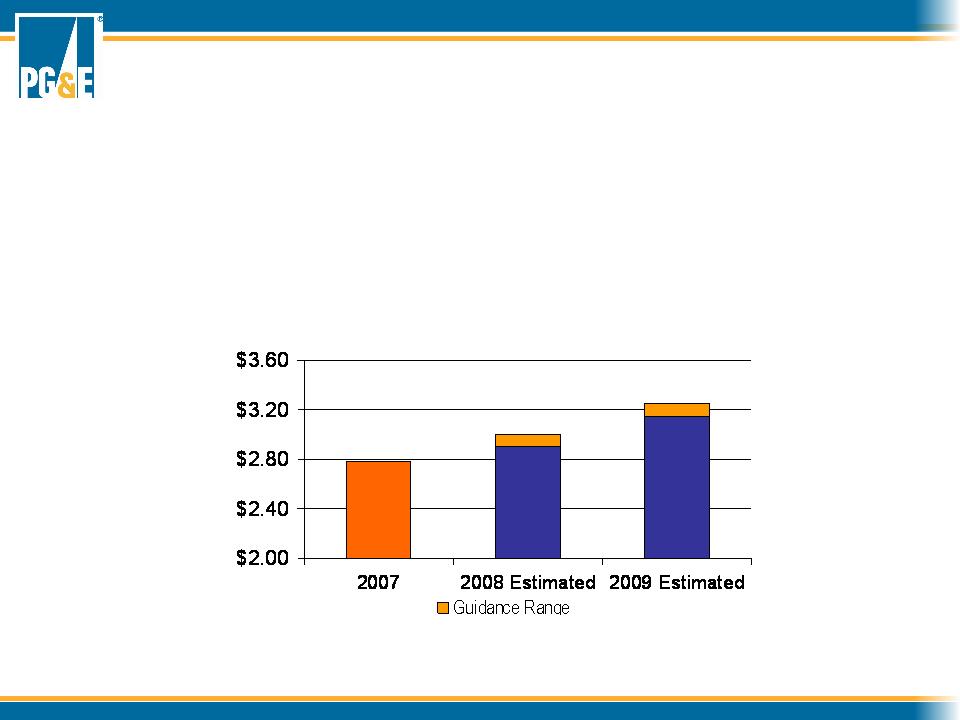
EPS from Operations*
* Reg G reconciliation to GAAP for 2007 EPS from Operations, and 2008 and 2009 EPS Guidance available in Appendix and at
www.pgecorp.com
www.pgecorp.com
Confirming EPS Guidance
§ EPS from Operations Guidance:
§ 2008 guidance of $2.90-$3.00 per share
§ 2009 guidance of $3.15-$3.25 per share
§ 8% targeted CAGR 2007-2011
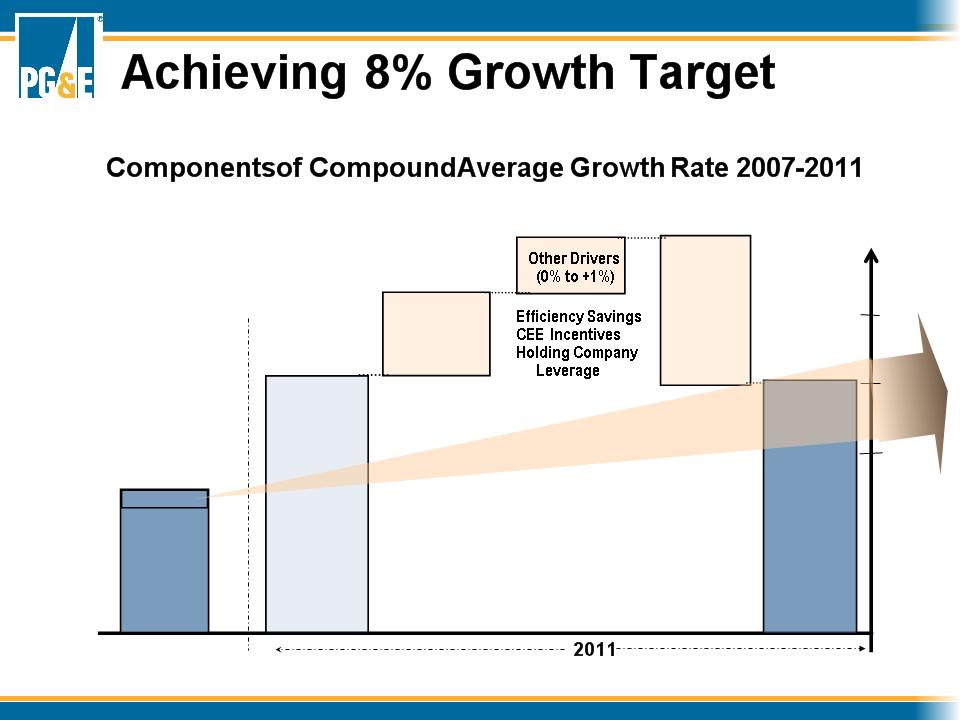
6
2007
Base
Forecast
Rate Base
Forecast
Rate Base
Growth
(+9% to 10%)
Add’l CapEx
(+1% to 3%)
New Shares
(-3% to- 5%)
$2.70-
$2.80
$2.80
8% CAGR
2007- 2011
8%
10%
6%
2007
Guidance {
Guidance {
Range
% CAGR
2007-2011
7
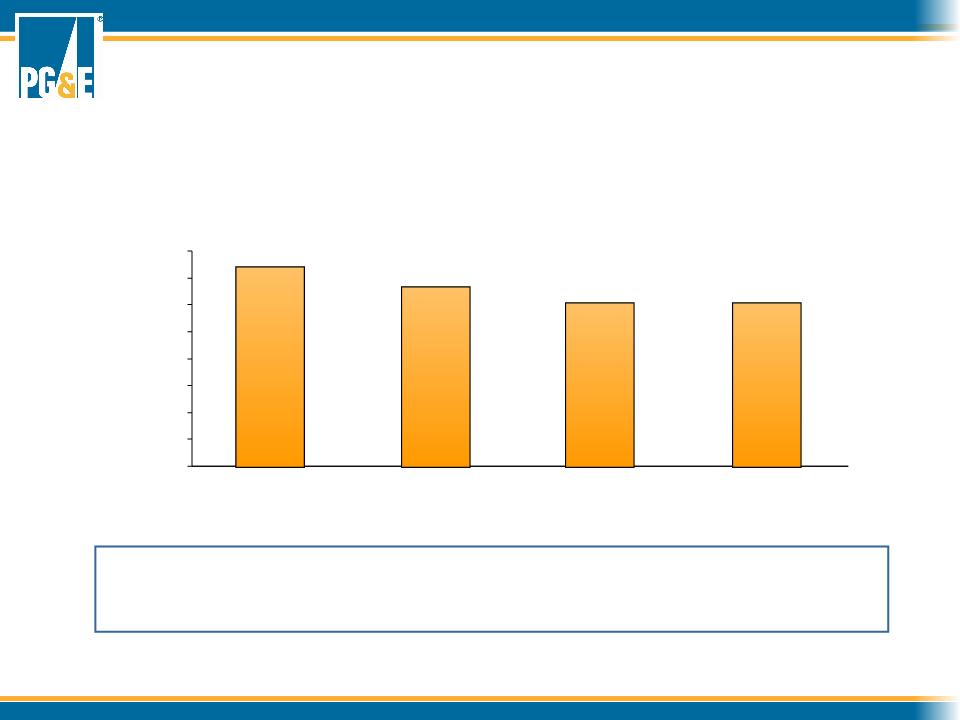
$ MM
500
1,000
1,500
2,000
2,500
3,000
3,500
4,000
2008
2009
2010
2011
Projects not included in base forecast include: SmartMeterTM Upgrade, Cornerstone
Improvement Program, additional generation and gas pipeline investments, and BC
Transmission
Improvement Program, additional generation and gas pipeline investments, and BC
Transmission
$3.6 B
$3.3 B
$3.0 B
$3.0 B
Capital Expenditure Outlook
8
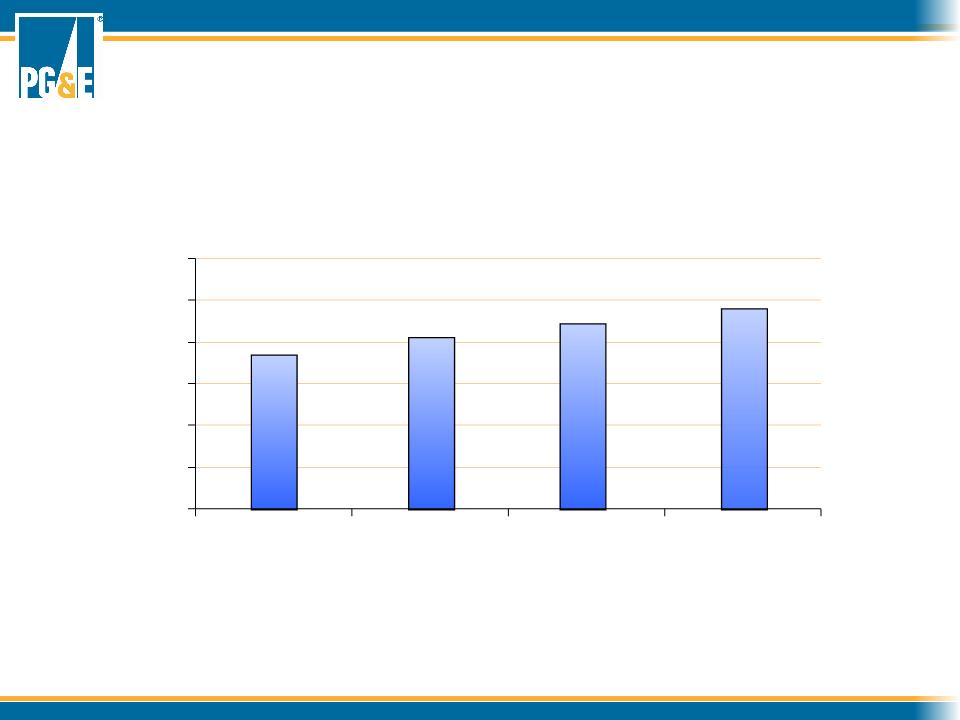
* Projected 2008-2011 rate base is not adjusted for the impact of the carrying cost credit that primarily results from the second series of the Energy
Recovery Bonds. Earnings will be reduced by an amount equal to the deferred tax balance associated with the Energy Recovery Bonds regulatory
asset, multiplied by the Utility's equity ratio and by its equity return. This rate base offset carrying cost declines to zero when the taxes are fully paid
in 2012.
Weighted Average Annual Rate Base*
$18.3
$20.4
$22.1
$23.9
0.0
5.0
10.0
15.0
20.0
25.0
30.0
2008
2009
2010
2011
$ B
Rate Base Growth
9
§ Steam Generator Replacement
§ $700 MM approved capital investment
§ Unit 2 replacement completed in 69 days earlier this year
§ Unit 1 replacement scheduled for early 2009
Current Rate Base:
Diablo Steam Generator Replacement
Diablo Steam Generator Replacement
10
Current Rate Base:
Gateway Generating Station
Gateway Generating Station
§ More than 90% complete
§ Testing phase begun
§ On budget, on time
§ Begins operations 1Q 2009
11
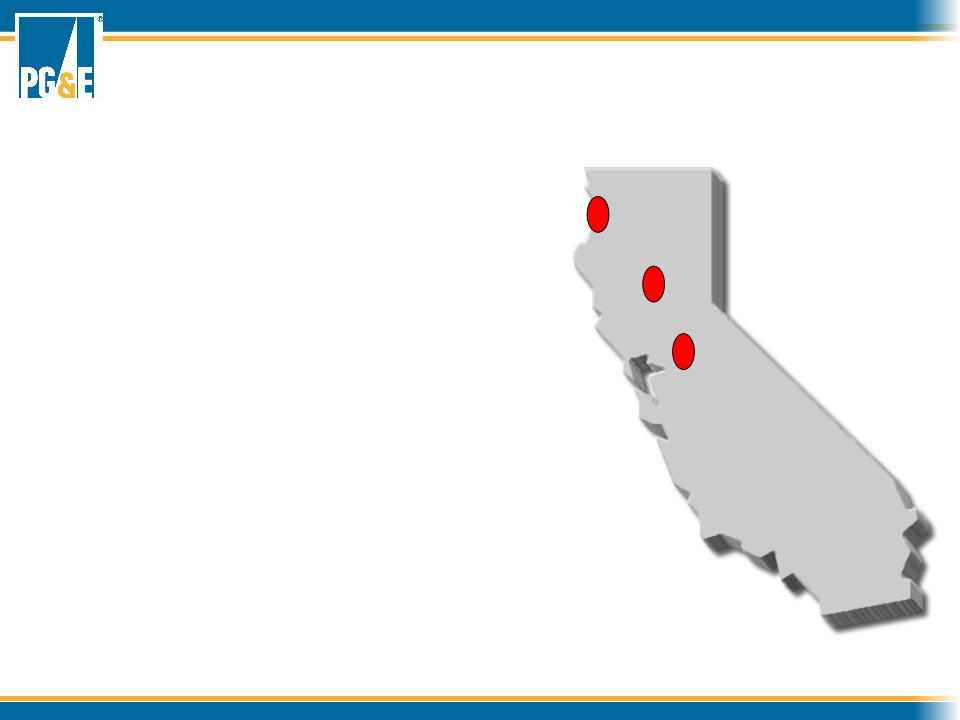
Colusa
657 MW
Gateway
530 MW
Humboldt
163 MW
Current Rate Base:
New Generation - Colusa & Humboldt
New Generation - Colusa & Humboldt
§ Colusa Generating Station
§ All permits received and cleared
§ Construction started in early October
§ Cost cap is $673 MM
§ Humboldt Repowering Project
§ Final approvals for site demolition received
§ Construction began early November
§ Cost cap is $239 MM
§ Strategy for execution on both projects
mirrors successes at Gateway
mirrors successes at Gateway
§ Experienced project teams in place
12
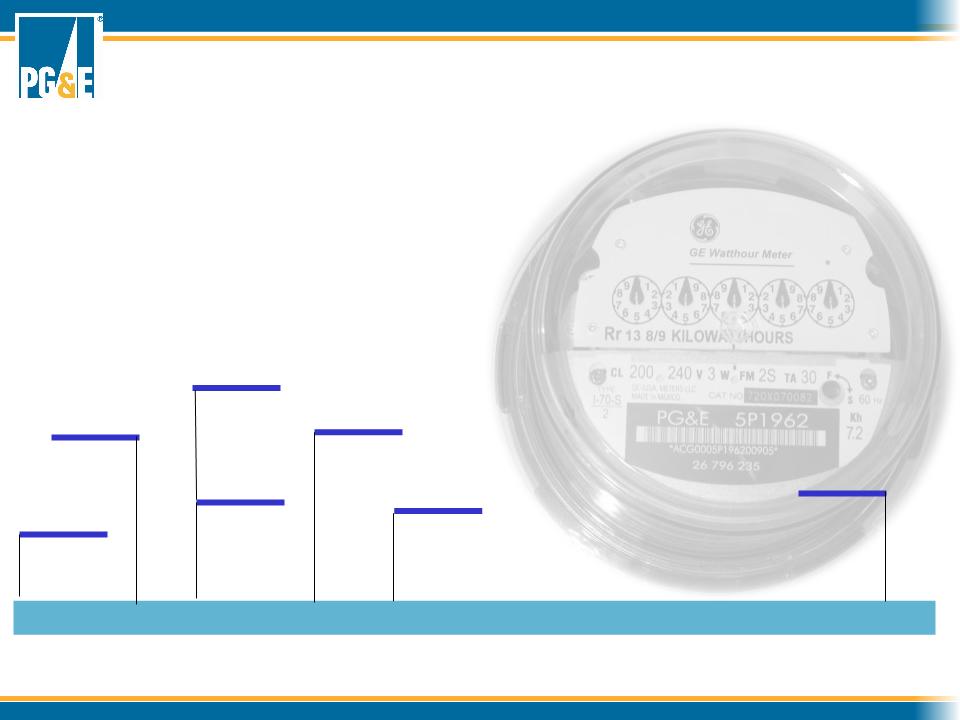
* 2008 to 2011 estimates are based on forecasted construction schedules and additional contracted resources
2007 2008 2009 2010 2011 2012
1st meter
installed
11/06
11/06
Billing IT infrastructure
live 2Q 2007
Live AMI billing
12/07
SmartMeterTM
Upgrade Filing
12/07
12/07
Demand Response
Interval Billing Live
05/08
05/08
Upgrade technology
installation 4Q 08
Deployment (incl.upgrade)
complete 1Q 2012
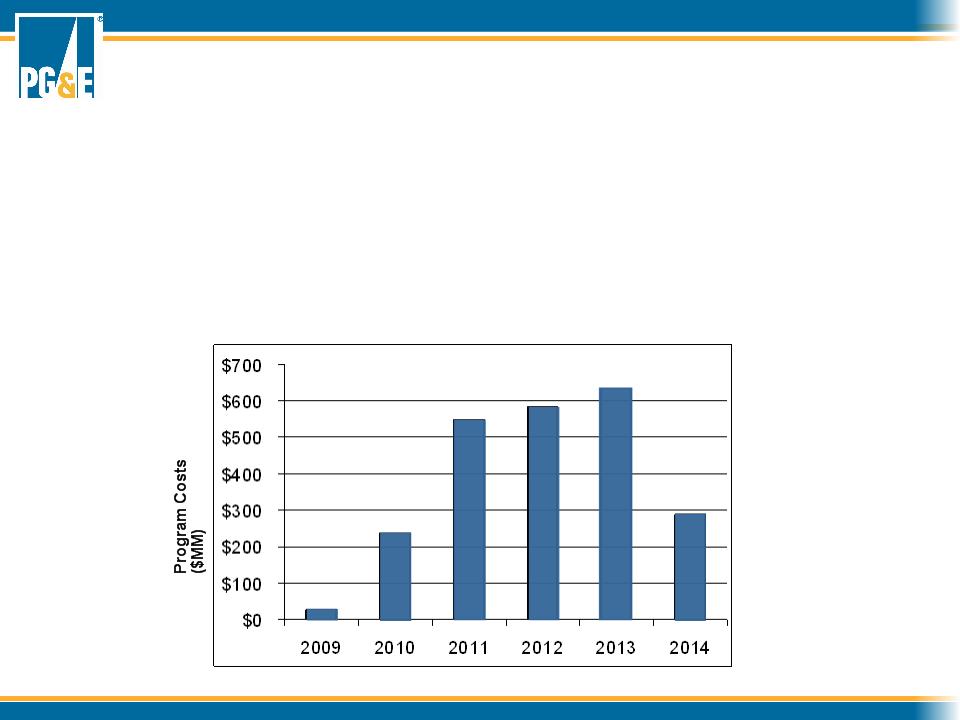
Current Rate Base: SmartMeterTM Program
§ Year-end 2008 target: 1.5 million meters installed
- 1,300,000 meters currently installed
- Over 1 million meters being read electronically

13
Additional CapEx
Proposed Projects Above 2008-2011 Base CapEx
Forecast
Forecast
§ SmartMeterTM Program Upgrade
§ $460 MM capital
§ Approval expected around year-end 2008
§ Cornerstone Improvement Program (Enhanced Reliability Investment)
§ $800 MM capital 2008-2011
§ $1.5 B capital investment beyond 2011
§ BC Transmission
§ Recovery of costs approved by FERC
§ Working on multi-utility partnership for development of the project
§ $5+ B in forecasted capital costs, with PG&E’s share at 51% or greater
§ New Generation
§ RFO for 2006-2016 period issued April 2008 for 800 - 1200 MW
§ Renewable investment opportunities
§ Pacific Connector LNG Pipeline
§ ~$50 MM capital 2008-2011
§ FERC approval expected by 3Q 2009

14
Additional CapEx:
SmartMeterTM Program Upgrade
SmartMeterTM Program Upgrade
§ Funding request of $572 MM
- $463 MM additional capital
§ CPUC decision expected around year-end
§ New capabilities
- Integrated connect/disconnect switches
- Solid state meter technology
- Home area network gateway device
15
PG&E seeking CPUC approval for a six-year program to improve
reliability of our electric distribution system.
reliability of our electric distribution system.
§ Enhances overall reliability of energy delivery
§ Increases grid flexibility to mitigate outages
§ Sets higher performance expectations as measured by a proposed set of metrics
$2.3B total capital investment with revenue requirement true-up
Additional CapEx:
Cornerstone Improvement Program
Cornerstone Improvement Program

16
(1) Pacific Gas and Electric Company issued $600 million of senior notes in March 2008 and an additional $600 million of senior notes in October 2008
Financing Plan 2008-2011
Objective: Ensure adequate liquidity to fund operations and capital growth
• Strong financial profile that will support growth plan
• Ensure adequate liquidity
Pacific Gas and Electric Company Financings
• Maintain authorized capital structure with 48% debt/preferred and 52% equity components
• Additional(1) $3.5 - $4.0 billion of long-term debt projected through 2011
• Total equity contribution of $1.1 - $1.7 billion by PG&E Corporation projected from 2009 through
2011
2011
PG&E Corporation Financings
• Estimate that PG&E Corporation partially funds equity contributions by issuing $100-$200
million of common stock annually through internal programs (e.g. DRSPP and 401k)
million of common stock annually through internal programs (e.g. DRSPP and 401k)
• Balance of equity contributions funded through additional equity issuances and incremental
parent debt
parent debt
• Additional parent debt capacity: $300 - - $500 million, depending on market conditions

17
Financial Assumptions 2008-2011
§ Capital expenditure base forecast reflects projects that
are highly likely or already approved
are highly likely or already approved
§ CPUC authorized ROE is 11.35% and Utility earns at
least 12% at FERC on projected rate base
least 12% at FERC on projected rate base
§ Ratemaking capital structure maintained at 52% equity
§ Additional capital expenditures, CEE incentives, and
operational efficiencies consistent with earnings targets
operational efficiencies consistent with earnings targets
§ Resolution of FERC generator claims in 2009-2011
results in financing needs
results in financing needs
§ Timely return to stable capital markets
18
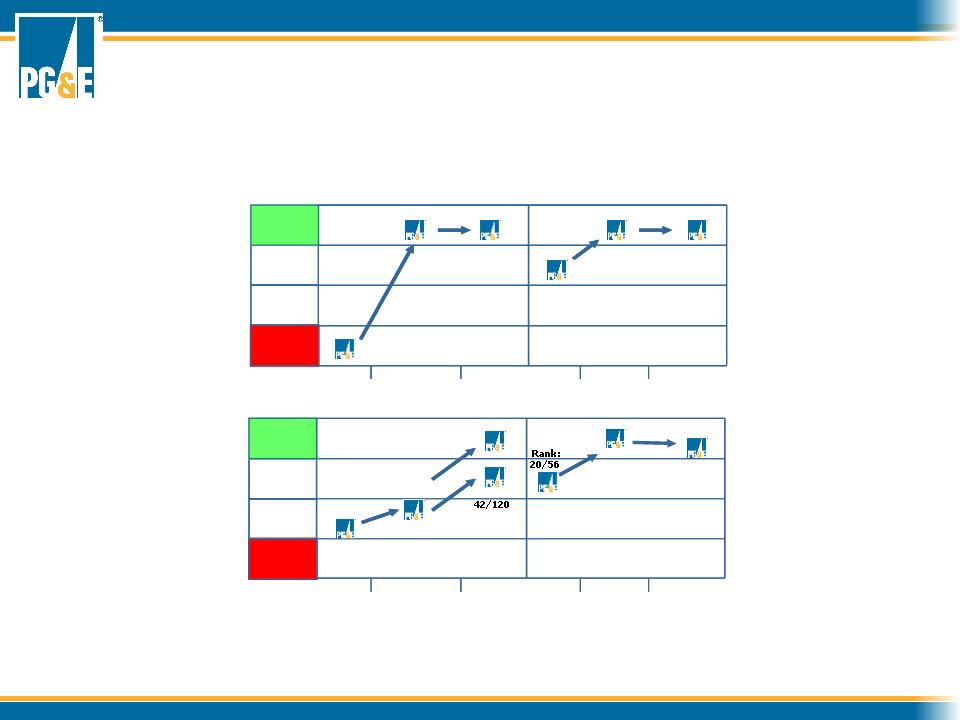
2008
Business
Overall Customer
Satisfaction Index
Note: Residential data released in July (Electric) and September (Gas); Business data released in February (Electric) and March (Gas)
* Residential Electric Study switched from a telephone to an online survey in 2008 and expanded to cover 120 utilities that serve 125,000 or more residential electric customers.
JD Power also provided rankings for a subset of the 58 large utilities that serve at least 500,000 residential electric customers
JD Power also provided rankings for a subset of the 58 large utilities that serve at least 500,000 residential electric customers
Residential
Overall Customer
Satisfaction Index
Electric Customers
Gas Customers
3
rd
Quartile
2
nd
Quartile
2006
2007
2006
2007
2008
2008
Rank:
2/55
Rank:
46/51
Rank:
4/38
Rank:
11/37
Rank:
2/40
Rank:
11/56
3
rd
Quartile
2
nd
Quartile
Rank:
51/76
Rank:
43/76
Rank:
5/56
2006
2007
2006
2007
2008
2008
Rank:
15/58
Rank:
*
Electric Customers
Gas Customers
Bottom
Quartile
3
rd
Quartile
2
nd
Quartile
Top
Quartile
2006
2007
2006
2007
2008
2008
Rank:
2/55
Rank:
46/51
Rank:
4/38
Rank:
11/37
Rank:
2/40
Rank:
11/56
Bottom
Quartile
3
rd
Quartile
2
nd
Quartile
Top
Quartile
Rank:
51/76
Rank:
43/76
Rank:
5/58
2006
2007
2006
2007
2008
Rank:
15/58
Rank:
*
Rank:
11/60
Customer Satisfaction Performance
19
Case | Docket # | Expected Decision Date |
CEMA | A. 08-03-017 | Q4 2008 |
SmartMeterTM Upgrade Program | A. 07-12-009 | Q4 2008 |
Energy Efficiency Programs | R.06-04-010 D. 07-09-043 D.08-01-042 | Q4 2008 |
Direct Access § Phase 1 - Legal Issues § Phase 2a - DWR Contracts § Phase 2b - Merit § Phase 3 - Rules | OIR: Q2 2007 | 2/29/08 Q4 2008 TBD TBD |
AB 32 Implementation • CARB Scoping Plan • Implementation (regulations in effect) | AB 32 signed 9/2006 | 1/1/2009 1/1/2012 |
Hydro Divestiture | A. 08-05-023 | 2009 |
Transmission Owners Rate Case 11 | ER08-1318-000 | Q3 2009 |
Reserve Margin | R. 08-04-012 | Q3 2009 |
2011 General Rate Case | August 2009 (NOI) | Q4 2010 |
Cornerstone Improvement Program | A. 08-05-023 | TBD |
Key Regulatory Proceedings
Appendix

21
(1) Authorized revenues = operating costs + (rate of return x rate base)
Rate base = net plant ± adjustments to approximate invested capital
Business Scope |
§ Retail electricity and natural gas distribution service (construction, operations and maintenance) § Customer services (call centers, meter reading, billing) § 5.1 million electric and 4.3 million gas customer accounts |
Primary Assets |
§ $11.0 billion of rate base (2007 wtd. avg.) |
Regulation |
§ California state regulation (CPUC) § Cost of service ratemaking (1) |
Electric And Gas Distribution

22
Midway
Los Banos
Moss Landing
Diablo Canyon
Gates
Dixon
Malin
Round Mt
Vaca
Business Scope |
§ Wholesale electric transmission services (construction, maintenance) § Operation by CA Independent System Operator |
Primary Assets |
§ $2.6 billion of rate base (2007 wtd. avg.) |
Regulation |
§ Federal regulation (FERC) § Cost of service ratemaking § Revenues vary with system load |

23
Business Scope |
§ Natural gas transportation, storage, parking and lending services § Customers: PG&E natural gas distribution and electric generation businesses, industrial customers, California electric generators |
Primary Assets |
§ $1.5 billion of rate base (2007 wtd. avg.) |
Regulation |
§ California state regulation (CPUC) § Incentive ratemaking framework (“Gas Accord”) § Revenues vary with throughput |
Natural Gas Transmission

24
Business Scope |
§ Electricity and ancillary services from owned and controlled resources § Energy procurement program |
Primary Assets |
§ $1.7 billion of rate base (2007 wtd. avg.) § Diablo Canyon nuclear power plant (2,240 MW) § Largest privately owned hydro system (3,896 MW) § Funded nuclear plant decommissioning trusts of $1.8 billion |
Regulation |
§ Cost of service ratemaking for utility-owned generation § Pass through of power procurement costs |
Electric Procurement & Owned Generation
25
Year Signed | Project | Max GWh/yr | Technology |
2006 | Military Pass Rd. | 840 | Geothermal |
2006 | HFI Silvan | 142 | Biomass |
2006 | Liberty Biofuels | 70 | Biofuels |
2006 | Bottle Rock USRG | 385 | Geothermal |
2006 | IAE Truckhaven | 366 | Geothermal |
2006 | Global Common - Chowchilla | 72 | 2006 |
2006 | Global Common - El Nido | 72 | Biomass |
2006 | Newberry | 840 | Geothermal |
2006 | Calpine Geysers | 922 | Geothermal |
2006 | Tunnel Hydro | 2.1 | Hydro |
2006 | Buckeye Hydro | 1.4 | Hydro |
2006 | Eden Vale Dairy | 1.3 | Biogas |
2006 | Microgy | TBD | Biogas |
2006 | Bio_Energy LLC | TBD | Biogas |
2006 | Palco | 36 | Biomass |
Year Signed | Project | Max GWh/yr | Technology |
2007 | Solel | 1388 | Solar Thermal |
2007 | PPM-Klondike | 265 | Wind |
2007 | CalRenew | 9 | PV |
2007 | Green Volts | 5 | PV |
2007 | enXco | 509 | Wind |
2007 | Ausra | 388 | Solar Thermal |
2008 | Calpine | 500 | Geothermal |
2008 | Wadham | 141 | Biomass |
2008 | BrightSource | 1230 | Solar Thermal |
2008 | San Joaquin Solar | 700 | Solar Thermal- Biofuel Hybrid |
2008 | Arlington Wind (Horizon) | 240 | Wind |
2008 | OptiSolar | 1148 | PV |
2008 | SunPower | 594 | PV |
2008 | Iberdrola / BPA Klla | 260 | Wind |
* Based on contracts signed through October 2008
1) Average delivered energy over multiple years: pre-RPS baseline
Over 24% of Projected Load Currently Signed*
Renewable Contracts Signed

26
* Earnings per share from operations is a non-GAAP measure. This non-GAAP measure is used because it allows
investors to compare the core underlying financial performance from one period to another, exclusive of items that do not
reflect the normal course of operations.
investors to compare the core underlying financial performance from one period to another, exclusive of items that do not
reflect the normal course of operations.
EPS on an Earnings from Operations Basis | $2.78 |
Items Impacting Comparability | 0.00 |
EPS on a GAAP Basis | $2.78 |
2007
2007 EPS - Reg G Reconciliation

27
2008 | ||
Low | High | |
EPS Guidance on an Earnings from Operations Basis* Estimated Items Impacting Comparability** Estimated EPS on a GAAP Basis | $2.90 0.66 $3.56 | $3.00 0.69 $3.69 |
2009 | ||
Low | High | |
EPS Guidance on an Earnings from Operations Basis* Estimated Items Impacting Comparability Estimated EPS on a GAAP Basis | $3.15 0.00 $3.15 | $3.25 0.00 $3.25 |
* Earnings per share from operations is a non-GAAP measure. This non-GAAP measure is used because it allows investors to compare the core underlying financial performance from one period to another, exclusive of items that do not reflect the normal course of operations. ** Estimated amount of income to be recognized in the fourth quarter of 2008 in connection with the recent settlement of 2001-2004 tax audits. | ||
Guidance Range
Guidance Range
EPS Guidance -Reg G Reconciliation