
Investor Conference
February 26, 2009
February 26, 2009
This presentation is not complete without the accompanying statements made by management on February 26, 2009.
A replay is available on PG&E Corporation’s homepage at www.pge-corp.com.
A replay is available on PG&E Corporation’s homepage at www.pge-corp.com.

2
Agenda
February 26, 2009 2:00pm - 5:00pm |
• PG&E’s Vision: 2008 and Beyond Peter A. Darbee Chairman, CEO and President PG&E Corporation President and CEO Pacific Gas and Electric Company • PG&E’s Financial Outlook Christopher Johns Senior Vice President, Chief Financial Officer and Treasurer PG&E Corporation • PG&E’s Operational Outlook Jack Keenan Senior Vice President and Chief Operating Officer Pacific Gas and Electric Company |
February 26, 2009 5:00pm - 6:00 pm

3
This presentation contains management’s guidance for PG&E Corporation’s 2009, 2010 and 2011 earnings per share from operations, projections of Pacific
Gas and Electric Company’s (Utility) capital expenditures, rate base and rate base growth, and projections of PG&E Corporation’s and the Utility’s financing
needs. These statements and projections, as well as the underlying assumptions, are forward-looking statements that are based on current expectations
which management believes are reasonable. These statements and assumptions are necessarily subject to various risks and uncertainties, the realization or
resolution of which may be outside of management's control. Actual results may differ materially. Factors that could cause actual results to differ materially
include:
• the Utility’s ability to manage capital expenditures and its operating and maintenance expenses within authorized levels;
• the outcome of pending and future regulatory proceedings and whether the Utility is able to timely recover its costs through rates;
• the adequacy and price of electricity and natural gas supplies, and the ability of the Utility to manage and respond to the volatility of the electricity and natural gas markets,
including the ability of the Utility and its counterparties to post or return collateral;
including the ability of the Utility and its counterparties to post or return collateral;
• the effect of weather, storms, earthquakes, fires, floods, disease, other natural disasters, explosions, accidents, mechanical breakdowns, acts of terrorism, and other events or
hazards on the Utility’s facilities and operations, its customers, and third parties on which the Utility relies;
hazards on the Utility’s facilities and operations, its customers, and third parties on which the Utility relies;
• the potential impacts of climate change on the Utility’s electricity and natural gas businesses;
• changes in customer demand for electricity and natural gas resulting from unanticipated population growth or decline, general economic and financial market conditions,
changes in technology, including the development of alternative energy sources, or other reasons;
changes in technology, including the development of alternative energy sources, or other reasons;
• operating performance of Diablo Canyon, the availability of nuclear fuel, the occurrence of unplanned outages at Diablo Canyon or the temporary or permanent cessation of
operations at Diablo Canyon;
operations at Diablo Canyon;
• whether the Utility can maintain the cost savings it has recognized from operating efficiencies it has achieved and identify and successfully implement additional sustainable
cost-saving measures;
cost-saving measures;
• whether the Utility incurs substantial expense to improve the safety and reliability of its electric and natural gas systems;
• whether the Utility achieves the California Public Utilities Commission’s (CPUC) energy efficiency targets and recognizes any incentives the Utility may earn in a timely manner;
• the impact of changes in federal or state laws, or their interpretation, on energy policy and the regulation of utilities and their holding companies;
• the impact of changing wholesale electric or gas market rules, including new rules of the California Independent System Operator (CAISO) to restructure the California
wholesale electricity market;
wholesale electricity market;
• how the CPUC administers the conditions imposed on PG&E Corporation when it became the Utility’s holding company;
• the extent to which PG&E Corporation or the Utility incurs costs and liabilities in connection with litigation that are not recoverable through rates, from insurance, or from other
third parties;
third parties;
• the ability of PG&E Corporation, the Utility, and counterparties, to access capital markets and other sources of credit in a timely manner on acceptable terms, especially given
the recent deteriorating conditions in the economy and financial markets;
the recent deteriorating conditions in the economy and financial markets;
• the impact of environmental laws and regulations and the costs of compliance and remediation;
• the effect of municipalization, direct access, community choice aggregation, or other forms of bypass;
• the impact of changes in federal or state tax laws, policies, or regulations; and
• other factors and risks discussed in PG&E Corporation’s and the Utility’s 2008 Annual Report on Form 10-K and other reports filed with the Securities and Exchange
Commission.
Commission.
Cautionary Language Regarding Forward-Looking
Statements
Statements

PG&E’s Vision:
2008 and Beyond
Peter A. Darbee
Chairman, Chief Executive Officer and President
PG&E Corporation
President and Chief Executive Officer
Pacific Gas and Electric Company
2008 and Beyond
Peter A. Darbee
Chairman, Chief Executive Officer and President
PG&E Corporation
President and Chief Executive Officer
Pacific Gas and Electric Company

5
Key Takeaways
• PG&E’s plans are aligned with customer needs and
regulatory objectives.
regulatory objectives.
• Management is focused on the efficient delivery of
reliable, clean energy.
reliable, clean energy.
• PG&E is on track to achieve its long-term growth target.

6
Top Analyst Questions
• What do you expect from the California regulatory
environment?
environment?
• How will your service territory and business be
affected by the economic decline?
affected by the economic decline?
• What opportunities do you see for owning renewable
generation?
generation?
• What is the potential range of EPS outcomes?
• What are your financing needs?

7
PCG Investment Case
• PCG is focused on better service to our customers,
which is the foundation of our growth:
which is the foundation of our growth:
• Substantial Cap Ex Program
• Manageable financing requirements
• Decoupled revenues
• Pass-through of procurement costs
• 11.45% weighted ROE on 52% equity
• Low carbon footprint
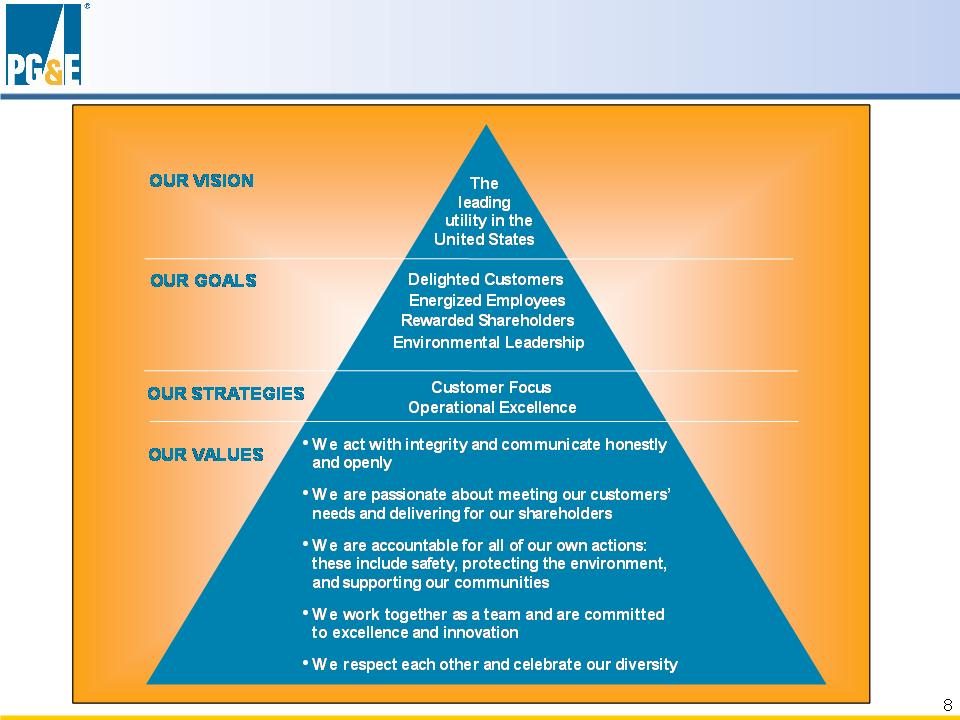
Vision and Values

9
2008 Accomplishments
Results from Operations:
$2.95 per share
$2.95 per share
Managed Storms,
Municipalization Efforts, and
Challenging Economy
Achieved Targeted Performance
and Exceeded Market Expectations
Successful Financings
in Volatile Markets

10
2008 Accomplishments
Managed complex projects on time and on budget
• Diablo Unit 2 Steam Generators Replaced
• Gateway Power Plant Completed
• 1.4 million SmartMeters Installed
In total, executed $3.7B of CapEx in 2008
11
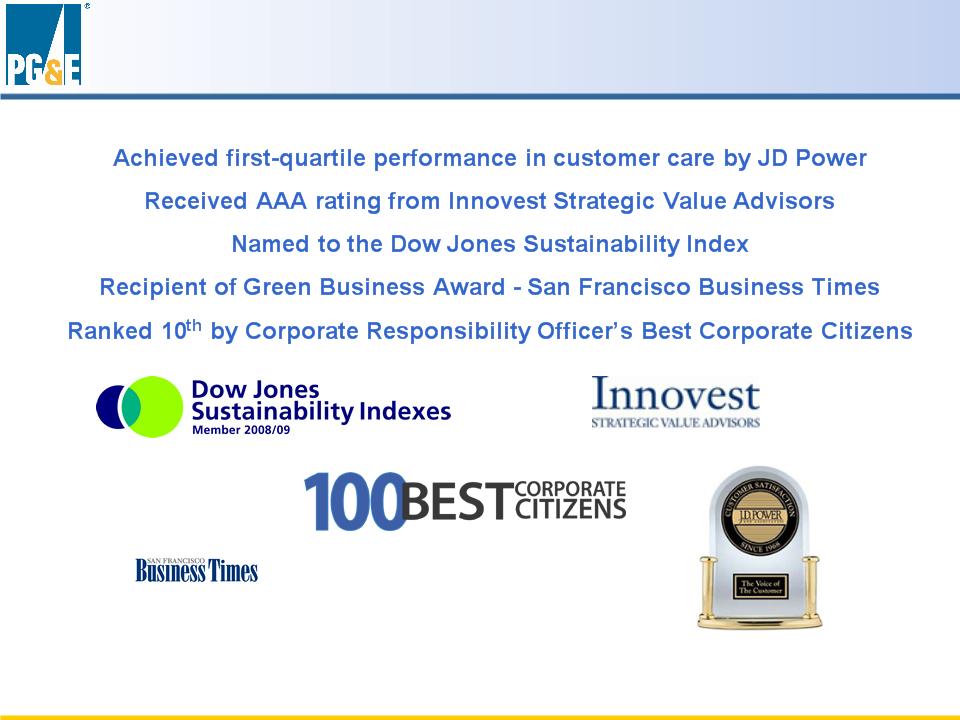
2008 Accomplishments

12
2009 Business Priorities
• Improve reliability
• Improve safety and human performance
• Deliver on budget, on plan, and on purpose
• Drive customer satisfaction
• Champion effective regulatory and legislative policies

13
Understanding our customers’
needs by segment…
needs by segment…
Knowing Our Customer Needs
… and providing innovative solutions
… and providing innovative solutions

14
Delivering on Operational Excellence
Responsibly managing our costs…
… and improving the delivery of
reliable, clean energy
reliable, clean energy
… and improving the delivery of
reliable, clean energy
reliable, clean energy
15
Building Strong Regulatory Relations
Sharing our regulators’ vision for
California’s energy future…
California’s energy future…
… by investing in jobs and
renewable generation
renewable generation
… by investing in jobs and
renewable generation
renewable generation

16
Leading on Environmental Issues
Being innovative…
… and limiting risk from new
carbon legislation
carbon legislation
… and limiting risk from new
carbon legislation
carbon legislation

17
Supporting Our Communities
Increased community involvement…
… results in broad support for our priorities
… results in broad support for our priorities
18
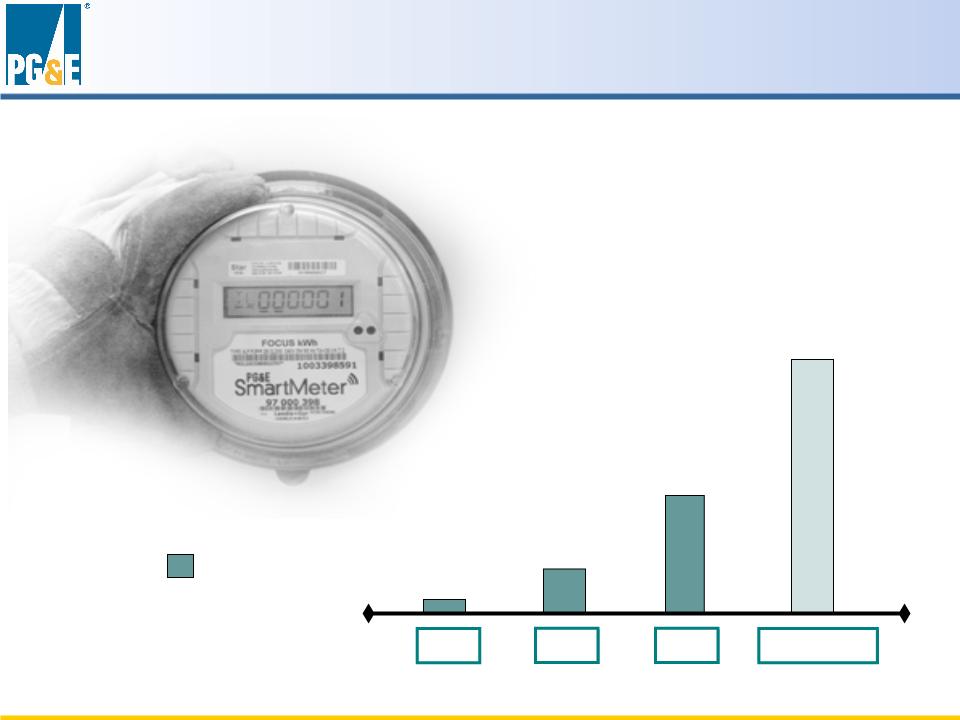
SmartMeterTM
Cumulative Meters Installed
Cumulative Meters Installed
1.7 million
1.7 million
1,656
1,656
2006
273,000
273,000
2007
2008
2009 PLAN
4.5 million
4.5 million
19
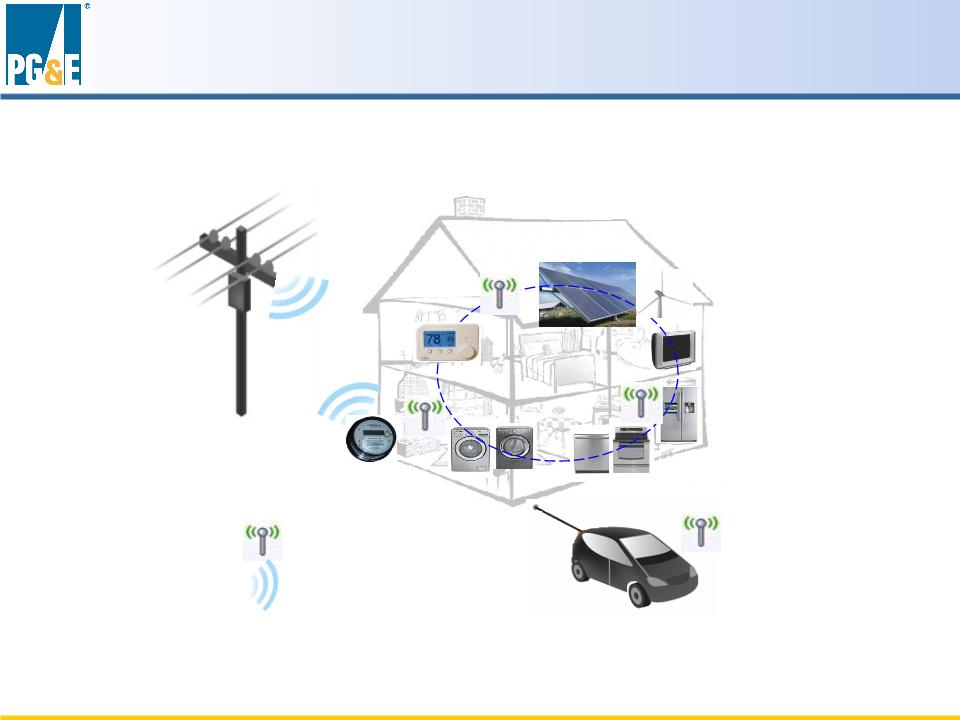
“Smart” Opportunities
Home Area Network
AMI/SmartGrid
The SmartMeter™ Project will lead us to other opportunities
The SmartMeter™ Project will lead us to other opportunities
“Smart” usage of appliances
“Smart” usage of appliances
20
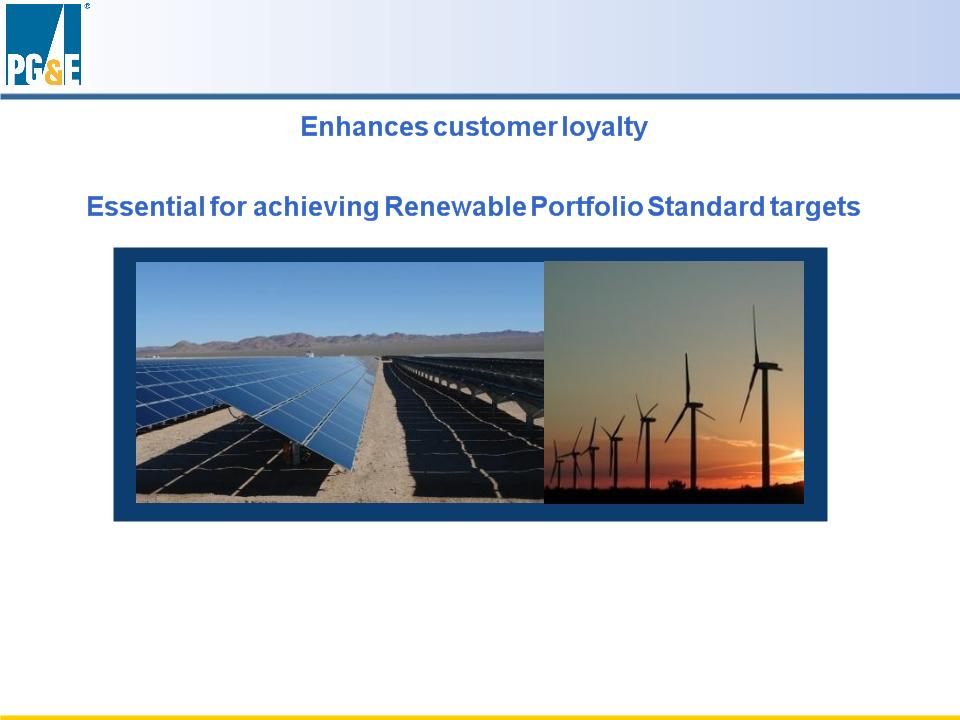
PG&E Ownership of Renewables
Demonstrates our sustained commitment to environmental leadership
Demonstrates our sustained commitment to environmental leadership

PG&E Ownership of Renewables
Proposed Solar PV Program
• Up to 250 MW of Utility-owned PV generation
• Up to 250 MW of standard-offer PV PPAs

22
Delivering on the Vision
• Meeting customer needs
• Working cooperatively with regulators
• Delivering strong returns for shareholders
PG&E Strategies and Priorities Result in:
PG&E Strategies and Priorities Result in:

PG&E’s Financial
Outlook
Christopher Johns
Senior Vice President, CFO and Treasurer PG&E
Corporation
Outlook
Christopher Johns
Senior Vice President, CFO and Treasurer PG&E
Corporation

24
PG&E Financial Strategy
• Achieve solid, sustained EPS growth
• Actively manage cash flow
• Maintain opportunistic financing approach
25
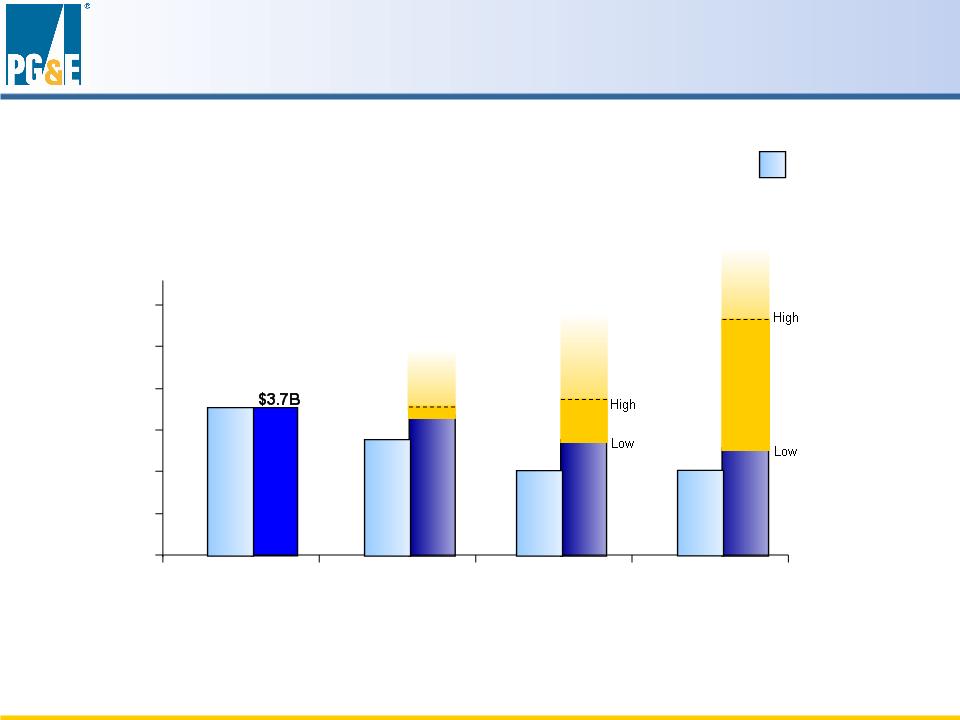
Capital Expenditure Outlook
Low Case $3.6B
Low Case $3.6B
High Case $3.7B
High Case $3.7B
Low Case $3.4B
Low Case $3.4B
High Case $3.8B
High Case $3.8B
Low Case $3.3B
Low Case $3.3B
High Case $4.8B
High Case $4.8B
2.0
2.5
3.0
3.5
4.0
4.5
5.0
2008
2009
2010
2011
$ B
Low
Low
High
High
Prior Forecast
Prior Forecast
CapEx Outlook
Prior vs. Current Forecast
Prior vs. Current Forecast
CapEx Outlook
Prior vs. Current Forecast
Prior vs. Current Forecast
$3.3B
$3.3B
$3.0B
$3.0B
$3.0B
$3.0B
$3.7B
$3.7B
Actual

26
Capital Expenditure Outlook
2009 | 2010 | 2011 | |
Low Case | Total CapEx of $3.6B • Includes: • CPUC Basic CapEx of $3.0B • Elec. Trans. CapEx of $600MM • Does not include: • SmartMeter Program Upgrade • Cornerstone Program • Renewable Generation • BC Transmission / Pacific Connector Gas Pipeline | Total CapEx of $3.4B • Includes: • CPUC Basic CapEx of $2.6B • Elec. Trans. CapEx of $800MM • Does not include: • SmartMeter Program Upgrade • Cornerstone Program • Renewable Generation • BC Transmission / Pacific Connector Gas Pipeline • | Total CapEx of $3.3B • Includes: • CPUC Basic CapEx of $2.45B • Elec. Trans. CapEx of $850MM • Does not include: • SmartMeter Program Upgrade • Cornerstone Program • Renewable Generation • BC Transmission / Pacific Connector Gas Pipeline • |
High Case | Total CapEx of $3.7B • Includes: • CPUC Basic CapEx of $3.0B • Elec. Trans. CapEx of $600MM • SmartMeter Program Upgrade • Cornerstone Program • Renewable Generation •Does not include: • BC Transmission / Pacific Connector Gas Pipeline | Total CapEx of $3.8B • Includes: • CPUC Basic CapEx of $2.6B • Elec. Trans. CapEx of $800MM • SmartMeter Program Upgrade • Cornerstone Program • Renewable Generation • Does not include: • BC Transmission / Pacific Connector Gas Pipeline | Total CapEx of $4.8B • Includes: • CPUC Basic CapEx of $3.1B • Elec. Trans. CapEx of $1.0B • SmartMeter Program Upgrade • Cornerstone Program • Renewable Generation • Does not include: • BC Transmission / Pacific Connector Gas Pipeline |
Spending Included in Low Case and High Case
Spending Included in Low Case and High Case
27
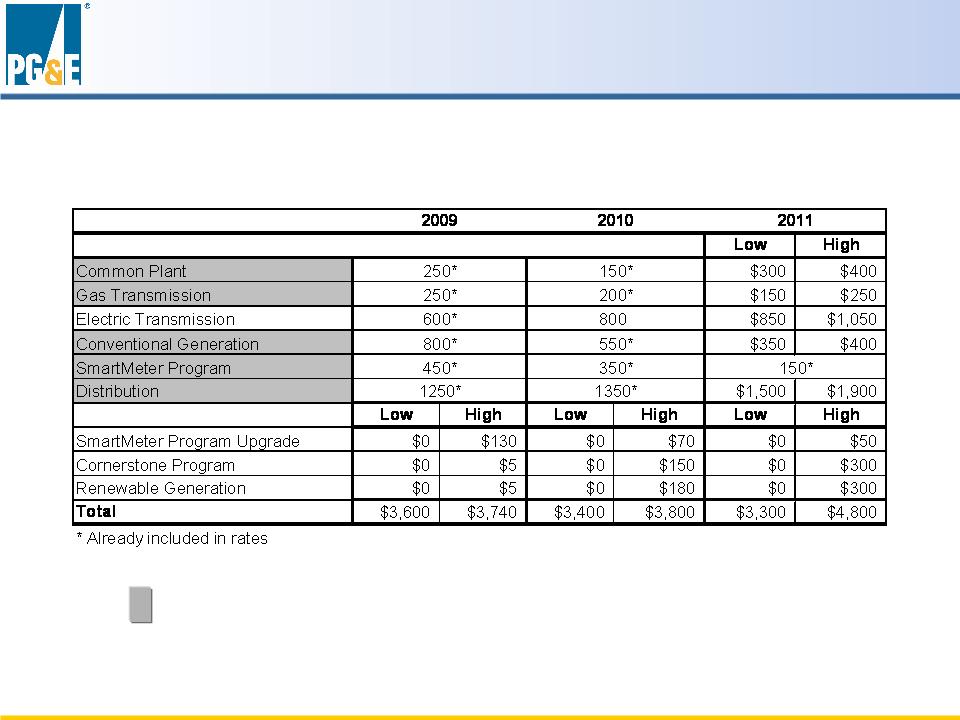
CapEx Low and High Cases
- 2011 GRC Category Capital Expenditures
- 2011 GRC Category Capital Expenditures
Capital Expenditure Forecast ($MM)
Capital Expenditure Forecast ($MM)

28
Generation
• Prior RFO Shortfalls
• RFO for 2006-2016 issued April 2008 for 800-1200 MW
• Additional renewable generation investment opportunities
Electric Transmission & Gas Pipelines
• Additional transmission to reach renewable generation
• B.C. Transmission Line
• Pacific Connector Gas Pipeline
Additional Capital Opportunities
29
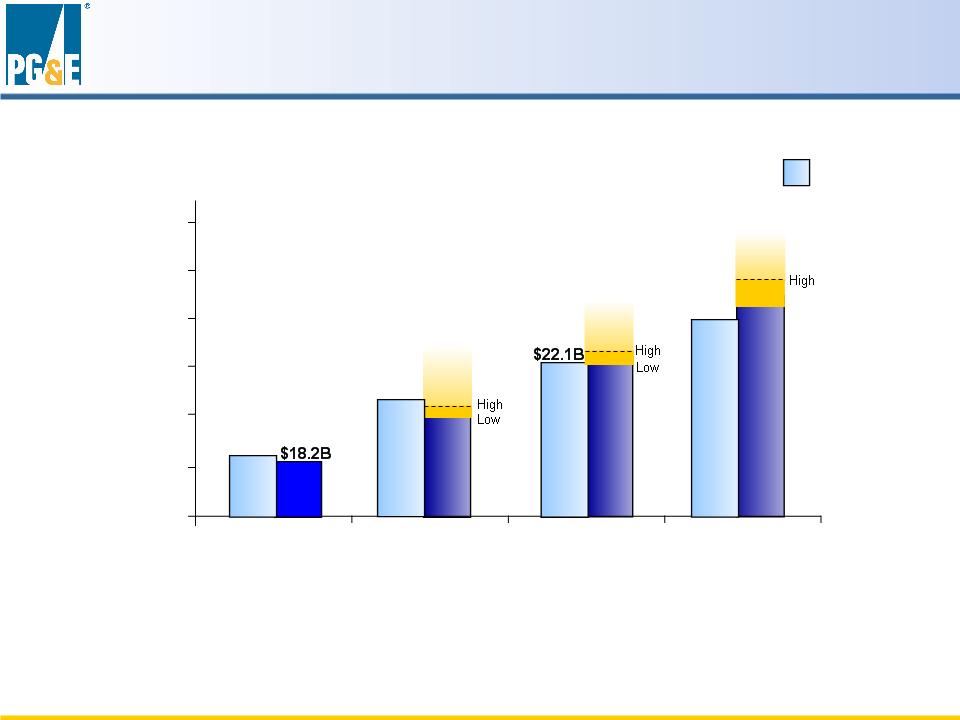
* Projected 2008-2011 rate base is not adjusted for the impact of the carrying cost credit that primarily results from the second series of the Energy
Recovery Bonds. Earnings will be reduced by an amount equal to the deferred tax balance associated with the Energy Recovery Bonds regulatory
asset, multiplied by the Utility's equity ratio and by its equity return. This rate base offset carrying cost declines to zero when the taxes are fully paid in
2012.
Weighted Average Annual Rate Base*
16.0
18.0
20.0
22.0
24.0
26.0
28.0
2008
2009
2010
2011
$ B
Rate Base Growth
Low
Low
Low Case $20.1B
Low Case $20.1B
High Case $20.3B
High Case $20.3B
Low Case $22.1B
Low Case $22.1B
High Case $22.4B
High Case $22.4B
Low Case $24.3B
Low Case $24.3B
High Case $25.4B
High Case $25.4B
$20.4B
$20.4B
Prior Forecast
Prior Forecast
$23.9B
$23.9B
$18.3B
$18.3B
Actual
30
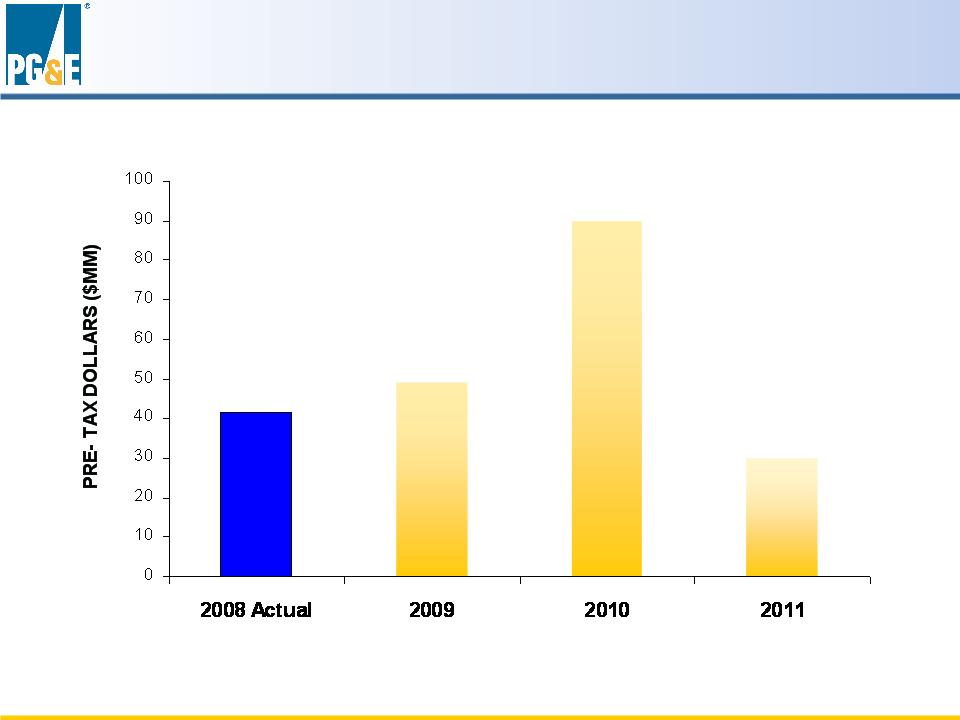
Energy Efficiency Incentive Opportunities
$41.5MM
$41.5MM
31
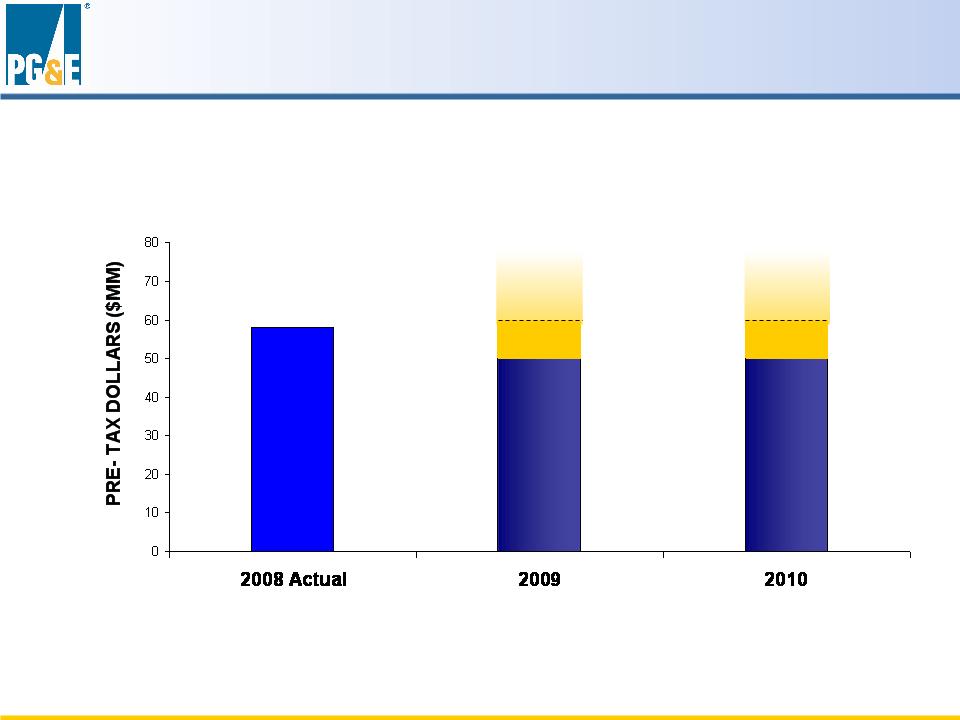
Operational Changes and Efficiencies
Low
Low
High
High
Low
Low
High
High
Low Case $50MM
Low Case $50MM
High Case $60MM
High Case $60MM
Low Case $50MM
Low Case $50MM
High Case $60MM
High Case $60MM
$58MM
$58MM
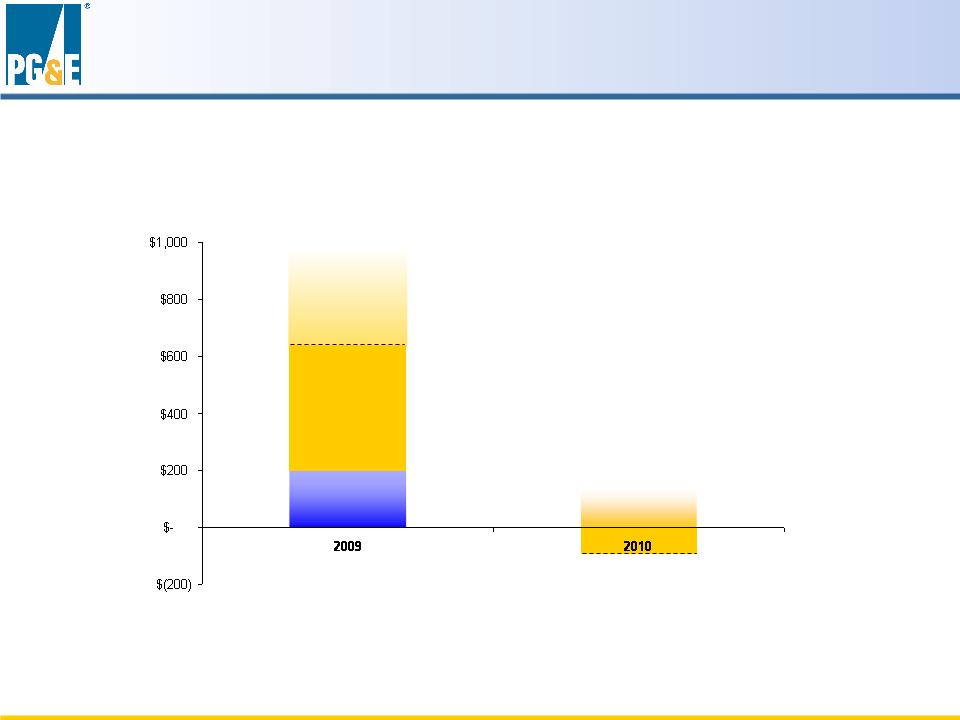
Impact to Cash Flow from Tax
Low
Low
High
High
Low
Low
High
High
Low Case $200M
Low Case $200M
High Case $640M
High Case $640M
Low Case ($90M)
Low Case ($90M)
High Case ($90M)
High Case ($90M)
32
33
2011
2007
Actual
Actual
EPS Guidance
$3.85
2008
Actual
Actual
2009
2010
$2.78
$2.95
$3.65
Low
High
Low
High
Low
High
$3.50
$3.35
$3.25
$3.15
Earnings per Share from Operations
Earnings per Share from Operations
34
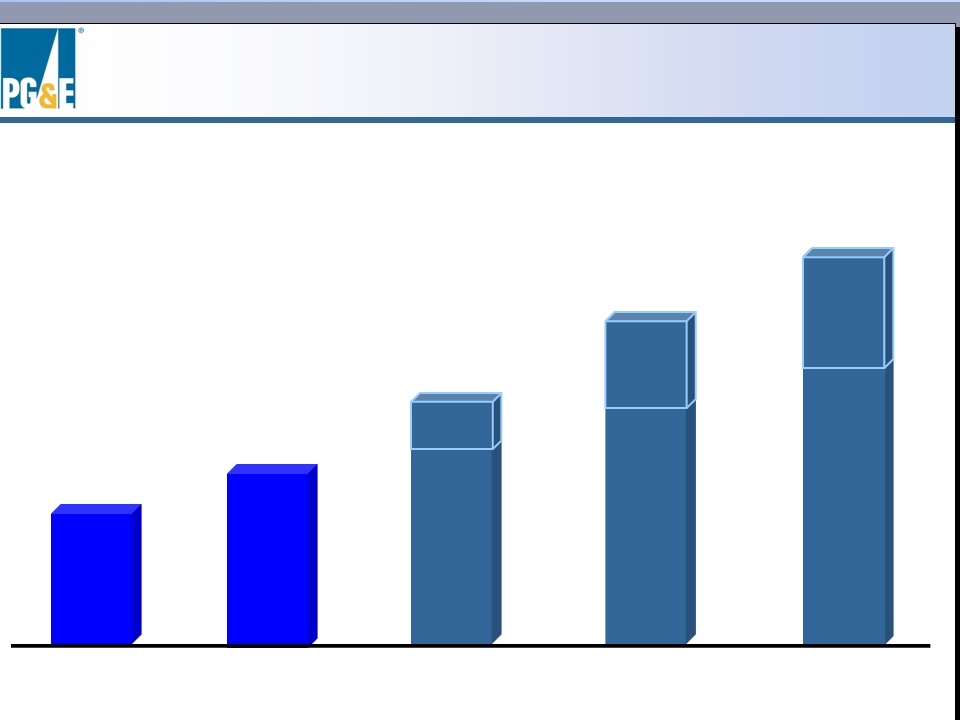
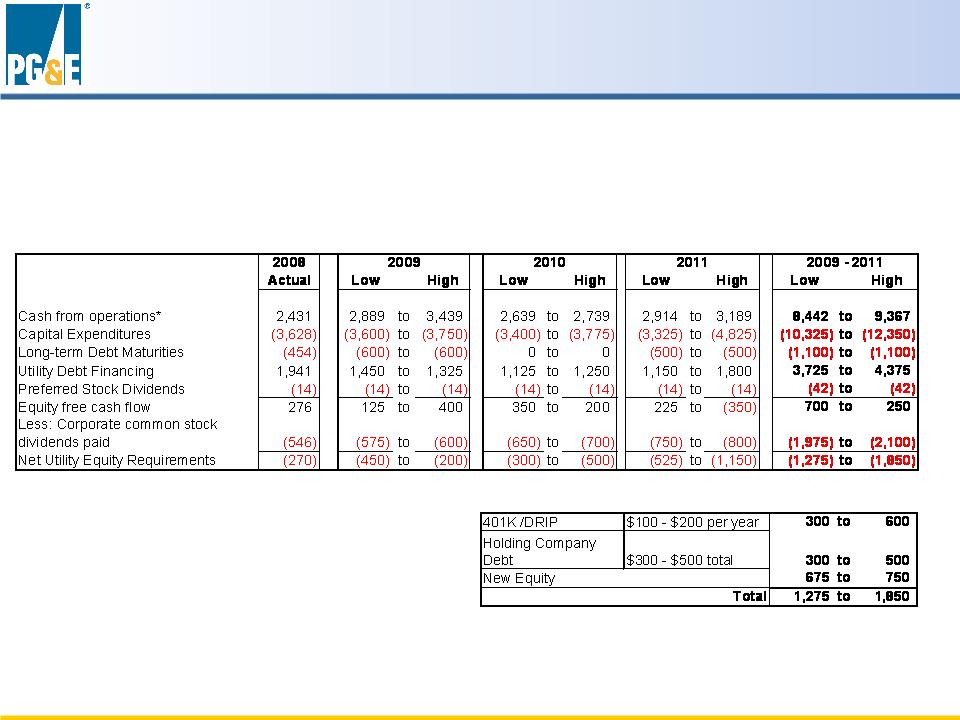
Cash Flow and Equity Needs
Financing Needs 2009 - 2011 ($MM)
Financing Needs 2009 - 2011 ($MM)
Projected Sources of Equity
Projected Sources of Equity
2009 - - 2011
2009 - - 2011
* Excludes cash from Energy Recovery Bond revenues |
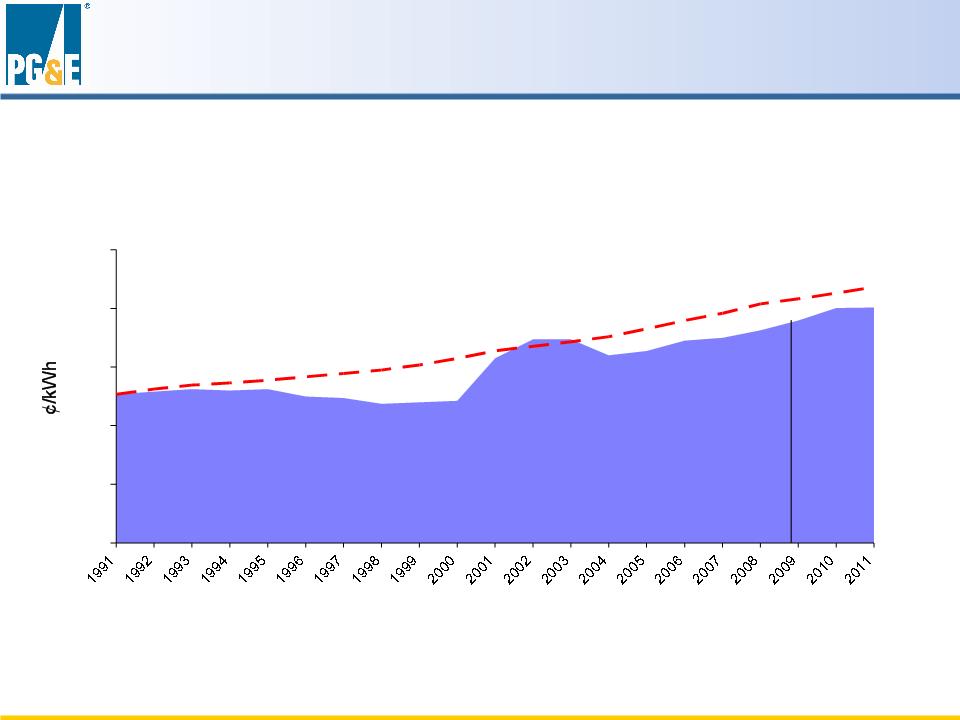
Bundled System Average Electric Rate
0.0
4.0
8.0
12.0
16.0
20.0
14.4¢
Bundled
CPI
35
Electric Rate Forecast
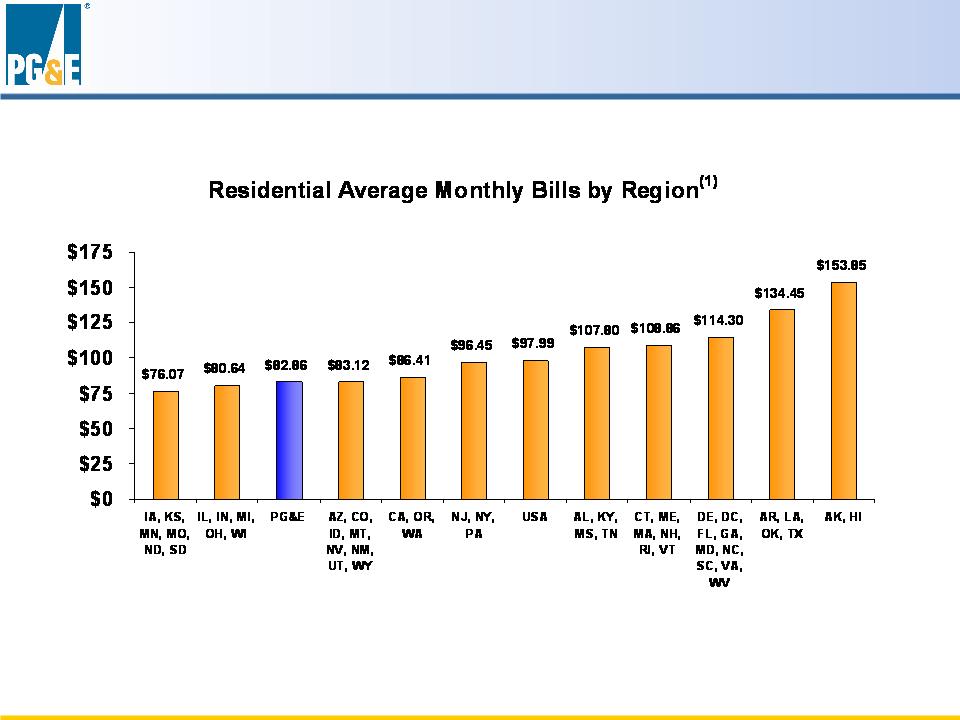
Residential Electric Bills
(1) Edison Electric Institute, Statistical Yearbook, Year 2007 (latest data available).
36
37
• Sustainable, comparable dividend
• Payout ratio range of 50% - 70%
• Dividend growth in line with EPS growth.
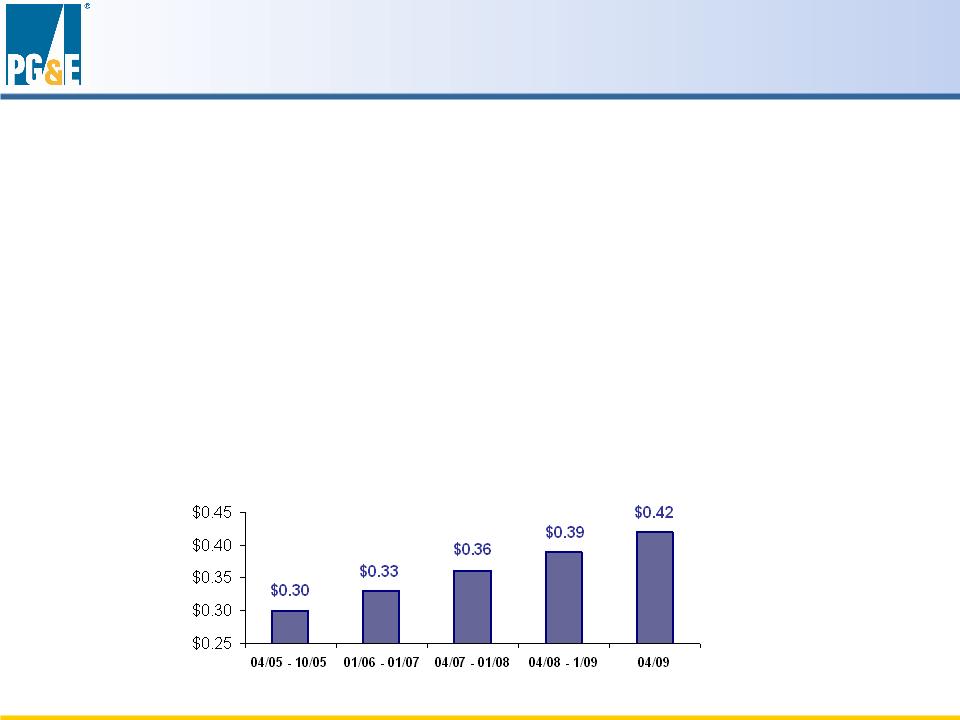
Dividend Policy
Historical Quarterly Dividends per Share

38
Financial Assumptions 2009-2011
GUIDANCE REFLECTS:
• Capital expenditures consistent with low and high case ranges
• CPUC authorized ROE of at least 11.35% and Utility earns at least
12% on FERC projected rate base
12% on FERC projected rate base
• Ratemaking capital structure maintained at 52% equity
• CEE incentives, operational changes and efficiencies and tax cash
flow consistent with low and high case ranges
flow consistent with low and high case ranges
• Current conditions for debt and equity markets
• Resolution of FERC generator claims in 2009-2011 results in
financing needs
financing needs

Achievement of Guidance
• Met Challenges
• Energy Efficiency Incentive Award of $41.5 MM
• Operating Efficiencies of $60 MM
• Tax settlements augment cash flow
• Identified Cap Ex Opportunities
• SmartMeter Upgrade
• Renewable Generation Investment
• Cornerstone Improvement Program
Exceeded expectations with earnings for 2007 and 2008
Exceeded expectations with earnings for 2007 and 2008
Regulatory Update

41
Impacts of Current Economy
Issue | Regulatory Mechanism |
Decreased sales due to housing market and business sector decline | Decoupled revenues and sales |
Fluctuating commodity costs | Pass-through of energy procurement costs |
Volatile capital markets | Multi-year cost of capital mechanism |
Decline of equity markets | Pension precedents and recovery assurance |
42
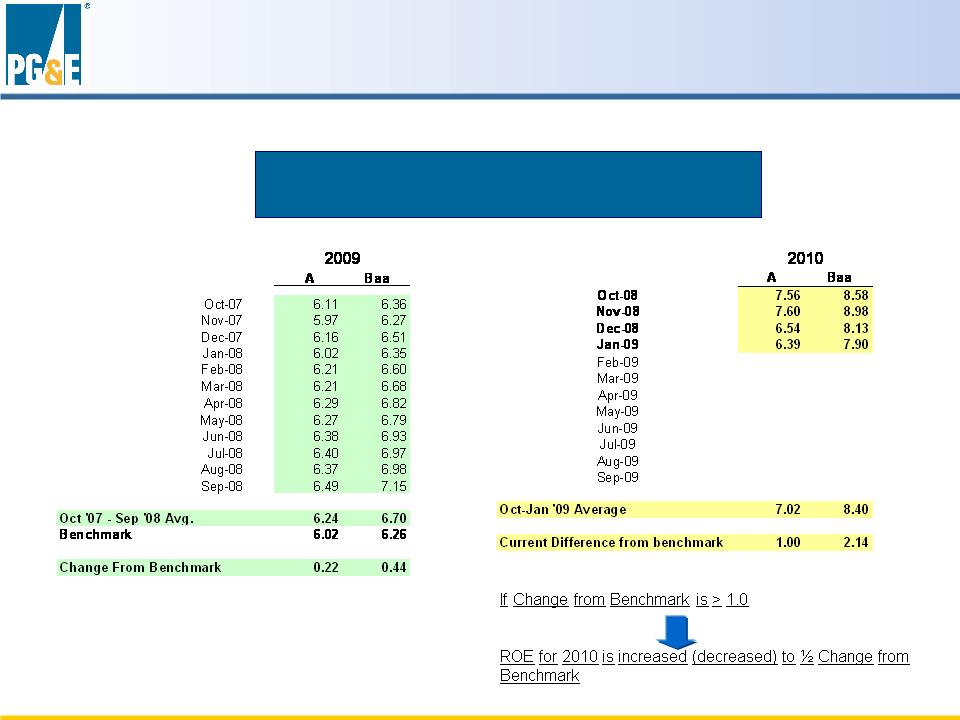
CPUC Cost of Capital Mechanism
Moody’s Utility Bond Yield Index
Current Avg.
Rating (Oct. 08 - Jan. 09)
Rating (Oct. 08 - Jan. 09)
A 7.02
Baa 8.40
Baa 8.40
Benchmark
(Oct. 06 - Sept. 07)
Rating Benchmark
A 6.02
Baa 6.26
Baa 6.26
If the Moody’s Utility Bond
Yield Index average for
October 2008 - September
2009 moves above 100 basis
points from the benchmark …
Yield Index average for
October 2008 - September
2009 moves above 100 basis
points from the benchmark …
Then our authorized ROE
(11.35%) will move up one-half
of the change in the index and
cost of debt is reset to
embedded plus projected cost
(11.35%) will move up one-half
of the change in the index and
cost of debt is reset to
embedded plus projected cost

43
Pension Status
• Currently 83% funded
• 2006 Pension Settlement set rate recovery for pension
contributions
contributions
• Contributing $176MM annually through 2010
• Regulatory accounting allows PG&E to neutralize
pension-related earnings impact
pension-related earnings impact
• A balancing account protects shareholders in the event
minimum required cash contribution levels rise above
$176MM per year
minimum required cash contribution levels rise above
$176MM per year

44
Energy Efficiency Incentive Revenues
• Received 35% of 2006-2007 incentive opportunity
• Received 35% of 2006-2007 incentive opportunity
• CPUC plans to complete review of 2006-2008 programs by
December 2009
December 2009
• CPUC plans to complete review of 2006-2008 programs by
December 2009
December 2009
• CPUC plans to complete true-up of 2006-2008 holdback by
December 2010
December 2010
• CPUC plans to complete true-up of 2006-2008 holdback by
December 2010
December 2010
2006 - - 2008 Cycle
2006 - - 2008 Cycle
2009 - - 2011 Cycle
2009 - - 2011 Cycle
• Determination of new mechanism underway
• Determination of new mechanism underway
• Process aims to be streamlined and transparent
• Process aims to be streamlined and transparent
• Regular ongoing earnings opportunity
• Regular ongoing earnings opportunity

45
2011 General Rate Case
2009
2009
2010
2010
2011
2011
August 2009:
Prepare and File
Notice of Intent
Prepare and File
Notice of Intent
August 2009:
Prepare and File
Notice of Intent
Prepare and File
Notice of Intent
December 2009:
Prepare and File
Application and Testimony
Prepare and File
Application and Testimony
December 2009:
Prepare and File
Application and Testimony
Prepare and File
Application and Testimony
Spring 2010:
Third Party Filings
PG&E Reply
Third Party Filings
PG&E Reply
Spring 2010:
Third Party Filings
PG&E Reply
Third Party Filings
PG&E Reply
Summer 2010:
Hearings
Hearings
Summer 2010:
Hearings
Hearings
December 2010:
Final Decision
Final Decision
December 2010:
Final Decision
Final Decision
January 2011:
Rates go into effect
Rates go into effect
January 2011:
Rates go into effect
Rates go into effect

Transmission Cases
• TO 10
• Requested: $760.5 million in retail revenue requirement
• Settlement: $718 million in October 2008
• TO 11
• Requested: $849 million
• Settlement: In negotiations, expect decision in Q3 2009
• TO 12
• On track to file August 1, 2009
46
FERC Updates

PG&E’s Operational
Outlook
Jack Keenan
Senior Vice President and Chief Operating Officer
Pacific Gas and Electric Company
Outlook
Jack Keenan
Senior Vice President and Chief Operating Officer
Pacific Gas and Electric Company

48
Investment in Infrastructure
Generation
• Diablo Unit 1 Steam Generators
• Gateway
• Colusa
• Humboldt
49
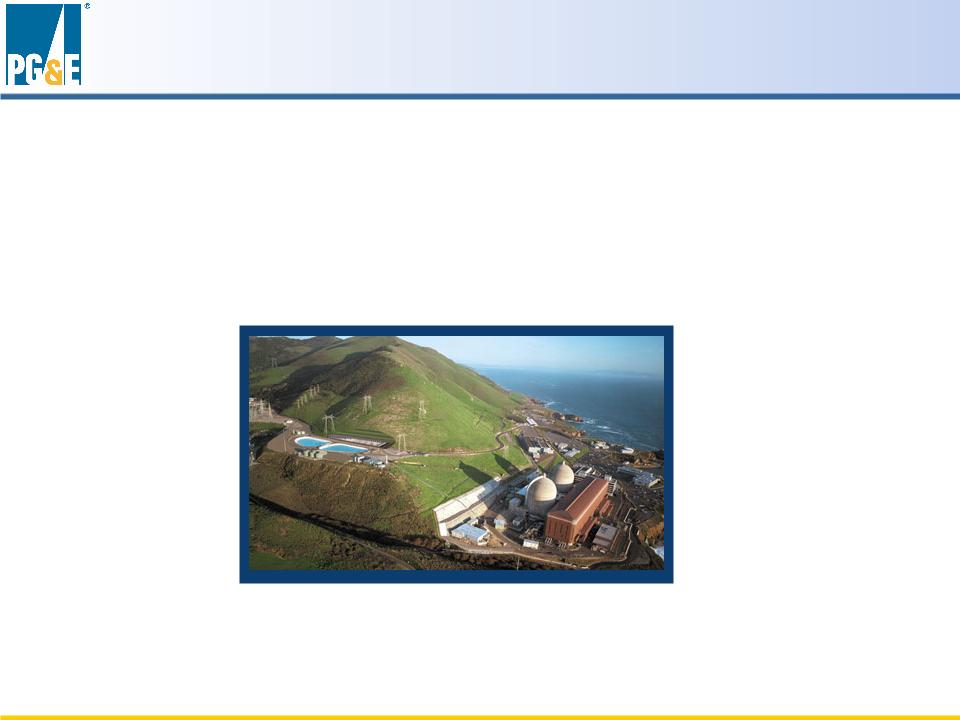
Diablo Canyon Steam Generator Replacement
• $700 Million approved capital investment
• Unit 2 replacement completed in 69 days in 2008
• Unit 1 replacement began January 25, 2009
50
Gateway Generating Station
• Gateway came online January 2009
• Gateway came online January 2009
• Generating capacity is 530 MW
• Generating capacity is 530 MW
• On time, on budget
• On time, on budget
• Zero lost time due to safety incidents
• Zero lost time due to safety incidents
• Currently operating at full capacity
• Currently operating at full capacity
51
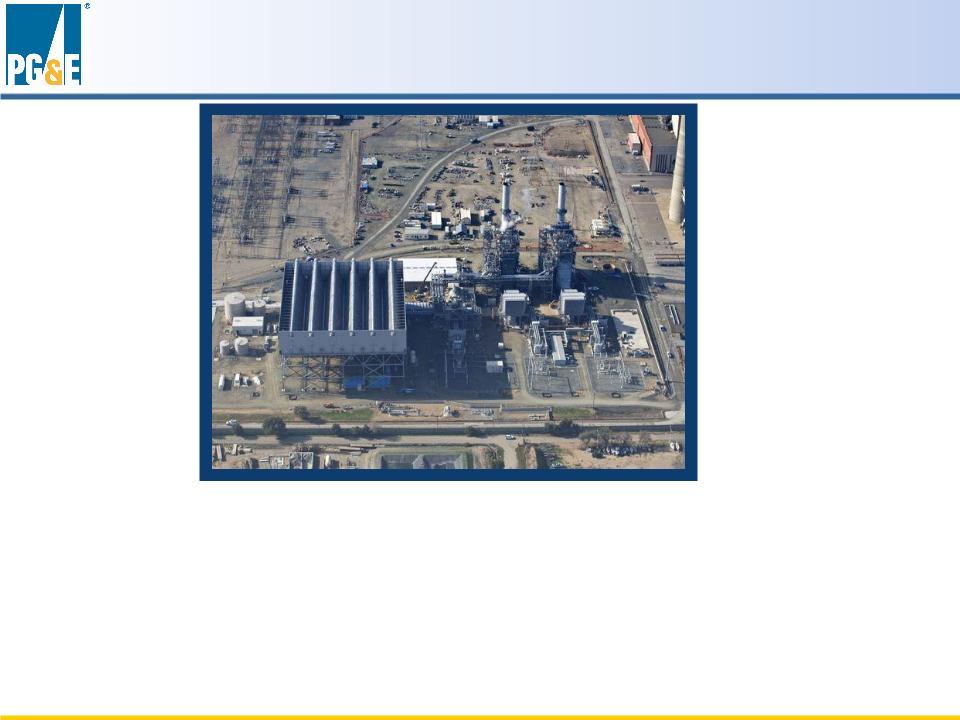
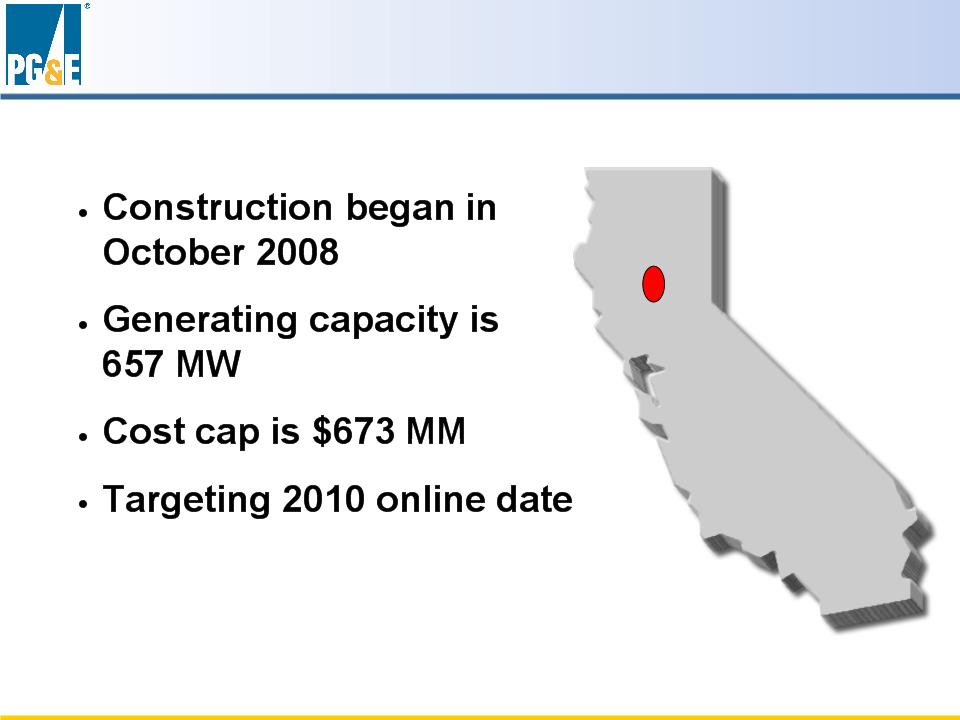
Colusa
Colusa Generating Station
52
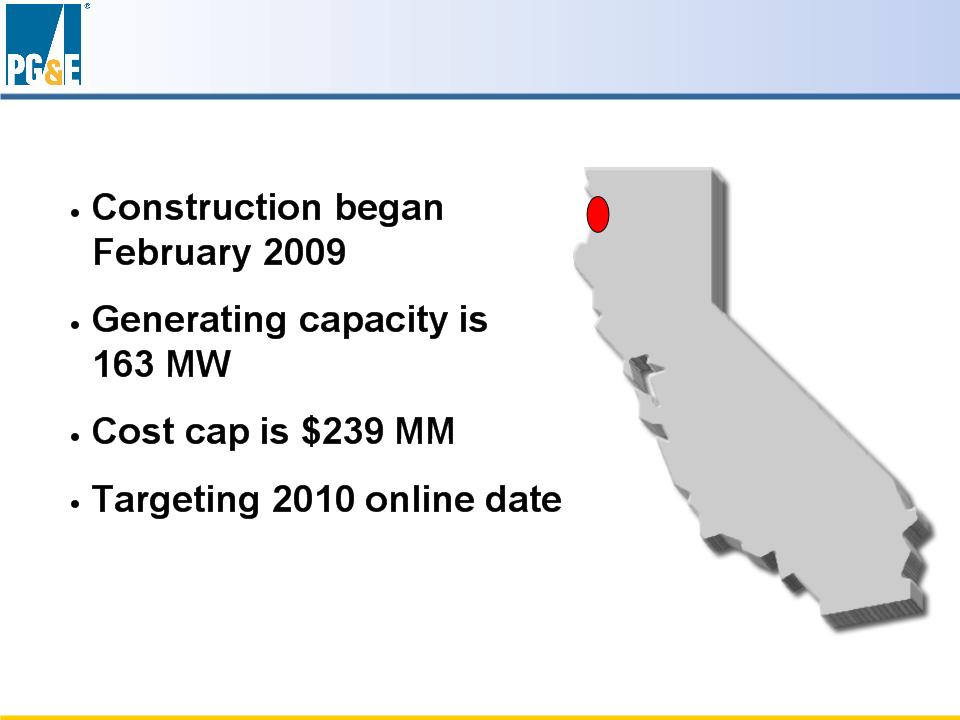
Humboldt
Humboldt Bay Project

53
Category | 2009 | 2010 | 2011 |
System Expansion/Congestion Relief | $230M | $400M | $590M |
Maintenance and Replacement | $280M | $290M | $310M |
Automation Technology Expansion | $70M | $90M | $110M |
New Generation Interconnection | $20M | $20M | $40M |
Total | $600M | $800M | $1050M |
Transmission Investments
*All numbers are approximate

54
• $1.2 - $1.5 Billion annual investment
• Infrastructure main spend categories:
• Substations
• Poles and Maintenance
• New Customer Connects
• Capacity and Reliability
Distribution Investments

55
Electric Procurement
Ensure reliable supply while reducing cost and risk
• Goals include supporting environmentally preferred resources
• Portfolio diversification is key
• Competitive solicitations and pre-approval of plans keep risk low
Market Redesign Technology Upgrade (MRTU)
• Implemented by CAISO
• Operate the transmission grid even more reliably
• Create a day-ahead market for wholesale electricity
• Improve the current existing real time market for wholesale electricity

56
RPS Strategy
• Expect 14% deliveries from renewable resources in 2009
• Contracted/Current deliveries represent over 20% of projected load for 2013
• Utility Owned PV is a contributor to achieving RPS goals
57
Safety
Zero In on Safety
• Aggressive targets for safety metrics with goal of accelerating toward ZERO incidents
• Enhanced Safety Action Plans, Ergonomic Program, Drivers Training Program
• Expanded Safety Committees throughout company
• Implemented Root Cause Investigation Process
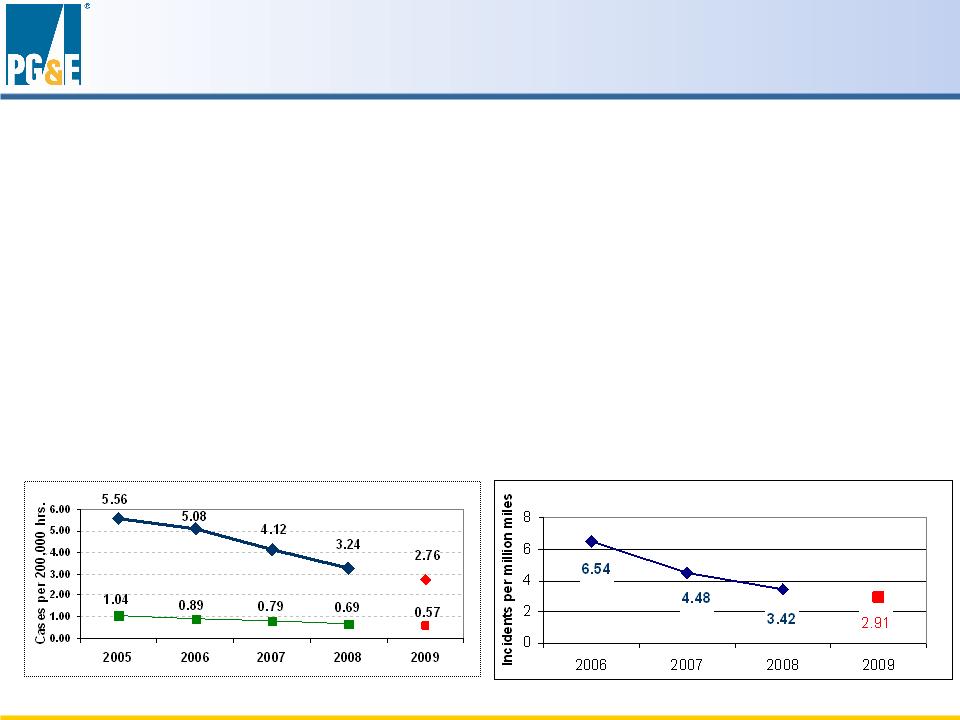
• OSHA, Lost Workday and Motor Vehicle rates all down significantly since 2006
OSHA Recordable Rate / Lost Workday Case Rate
OSHA Recordable Rate / Lost Workday Case Rate
Motor Vehicle Incident Rate
Motor Vehicle Incident Rate

58
Improving Human Performance
• Field Services Productivity
• Strategic Sourcing
• Real Estate Optimization
• Cash Cycle Management
• Inventory Management
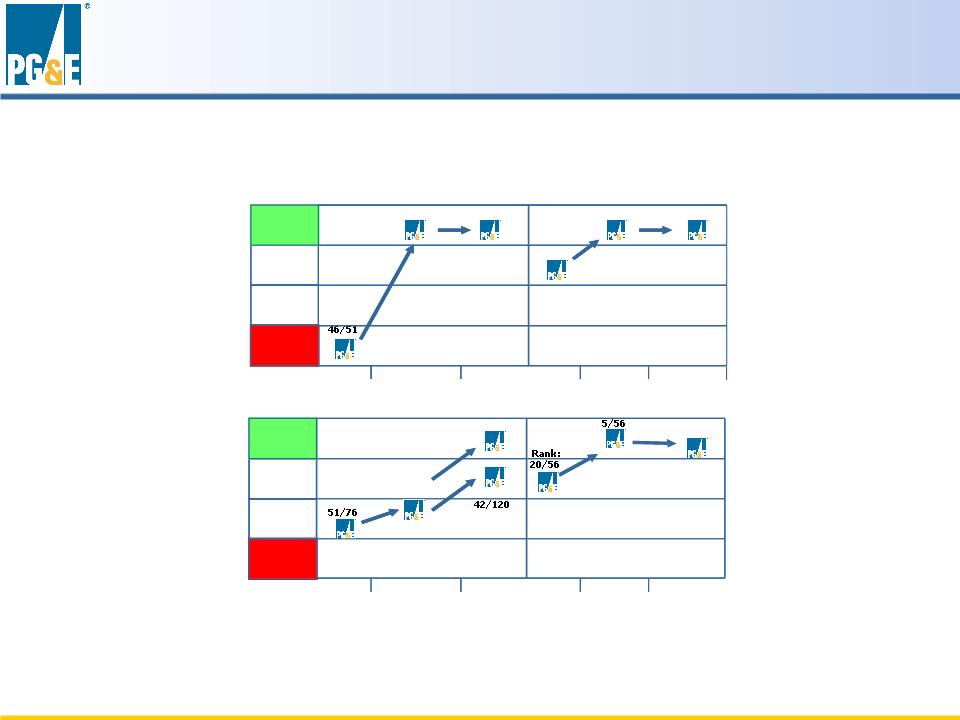
Customer Satisfaction
2008
Business
Overall Customer
Satisfaction Index
Note: Residential data released in July (Electric) and September (Gas); Business data released in February (Electric) and March (Gas)
* Residential Electric Study switched from a telephone to an online survey in 2008 and expanded to cover 120 utilities that serve 125,000 or more residential electric customers.
JD Power also provided rankings for a subset of the 58 large utilities that serve at least 500,000 residential electric customers
JD Power also provided rankings for a subset of the 58 large utilities that serve at least 500,000 residential electric customers
Residential
Overall Customer
Satisfaction Index
Electric Customers
Gas Customers
3
rd
Quartile
2
nd
Quartile
2006
2007
2006
2007
2008
2008
Rank:
2/55
Rank:
Rank:
4/38
Rank:
11/37
Rank:
2/40
Rank:
11/56
3
rd
Quartile
2
nd
Quartile
Rank:
Rank:
43/76
Rank:
2006
2007
2006
2007
2008
2008
Rank:
15/58
Rank:
*
Electric Customers
Gas Customers
Bottom
Quartile
3
rd
Quartile
2
nd
Quartile
Top
Quartile
2006
2007
2006
2007
2008
2008
Rank:
2/55
Rank:
Rank:
4/38
Rank:
11/37
Rank:
2/40
Rank:
11/56
Bottom
Quartile
3
rd
Quartile
2
nd
Quartile
Top
Quartile
Rank:
Rank:
43/76
Rank:
2006
2007
2006
2007
2008
Rank:
15/58
Rank:
*
Rank:
11/60

60
Brand Health
• Reliability of Service
• Pricing of Service
• CEE & Environmental Stewardship
• Customer Service Experience
• Bill & Payment Options
• Community Involvement
• Field Service Experience

61
We measure Reliable Energy Delivery across a number of factors, including:
• SAIFI - Indicates Average Outages/Customer
• CAIDI - Measures Average Restoration Time
• Execution of Electric Work Units
• Gas Transmission & Distribution Integrity
Reliable Energy Delivery
62
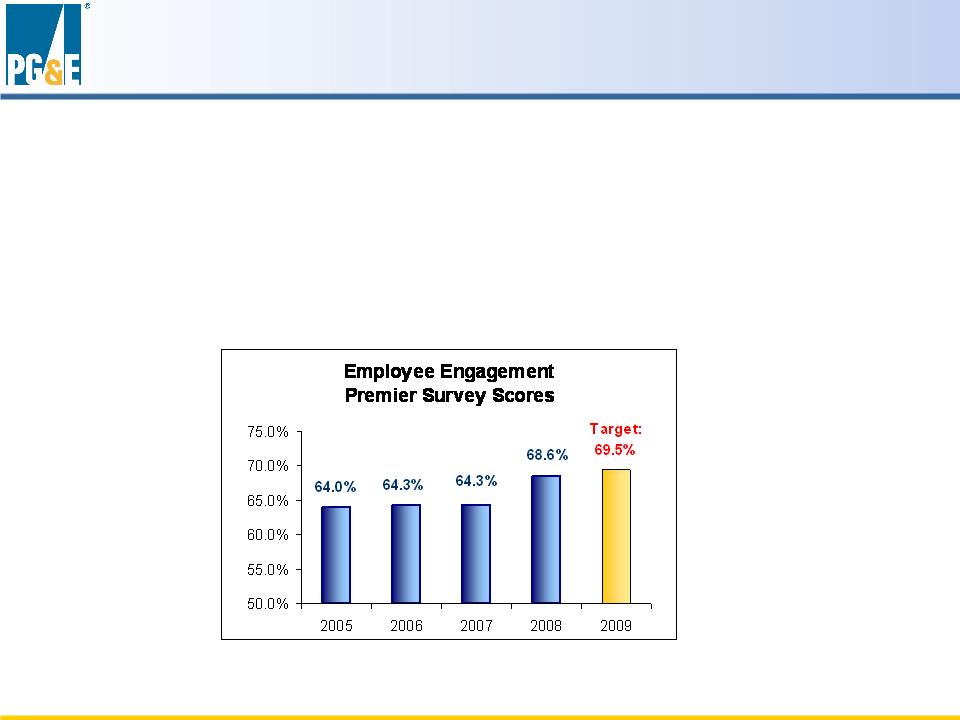
Employee Engagement
• Employee Engagement measured through annual survey
• Scores have steadily increased since 2005
• 2009 Target is 69.5%
63
2009 Short Term Incentive Program
2009 Compensation metrics | Percentage Weight |
Delivering on EPS Goals (Measurement of earnings from ongoing core operations) | 50% |
Customer Satisfaction & Brand Health Index (Composite of customer surveys and marketing research) | 17.5% |
Reliable Energy Delivery Index (Composite of various reliability metrics) | 17.5% |
Safety Performance (Measurement of occupational injury or illness based on OSHA Recordables) | 10% |
Employee Engagement Premier Survey (Measurement of employee engagement at PG&E) | 5% |
Peter Darbee
Chairman, CEO and President
PG&E Corporation
Chairman, CEO and President
PG&E Corporation
Peter Darbee
Chairman, CEO and President
PG&E Corporation
Chairman, CEO and President
PG&E Corporation

65
PCG Investment Case
• PCG is focused on better service to our customers,
which is the foundation of our growth:
which is the foundation of our growth:
• Substantial Cap Ex Program
• Manageable financing requirements
• Decoupled revenues
• Pass-through of procurement costs
• 11.45% weighted ROE on 52% equity
• Low carbon footprint

66
Notes
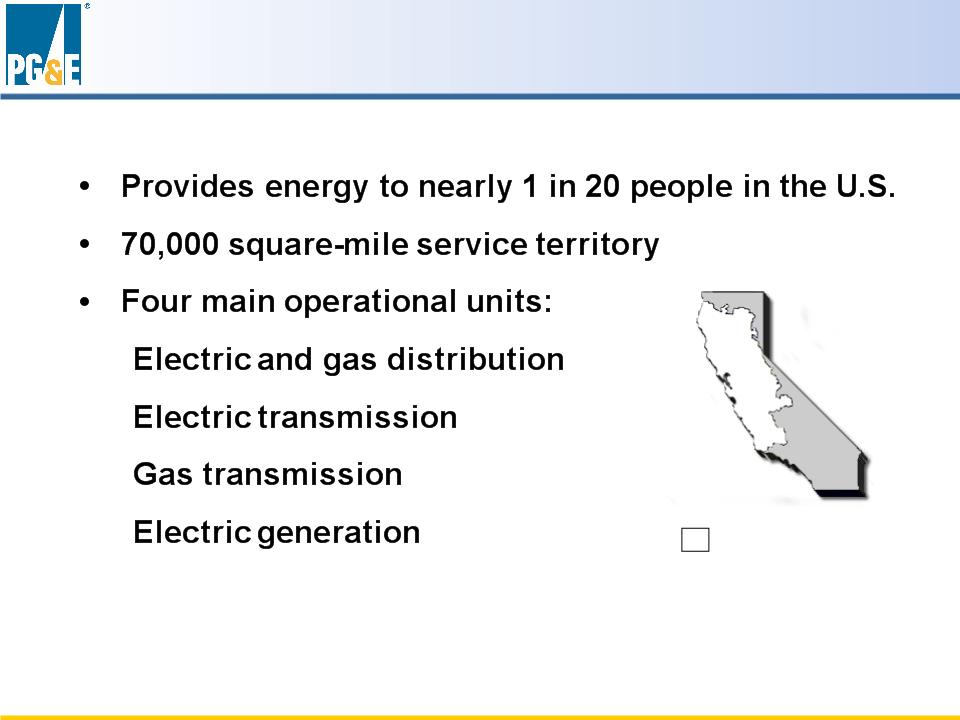
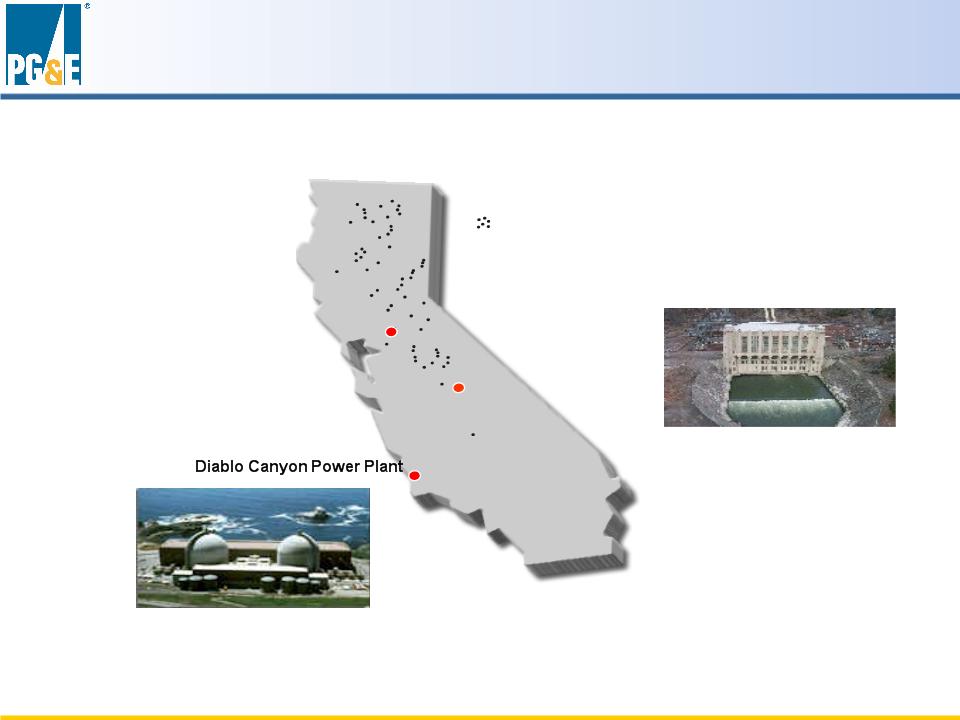
PG&E SERVICE AREA
IN CALIFORNIA
IN CALIFORNIA
68
Pacific Gas and Electric Company (PG&E)
(1) Authorized revenues = operating costs + (rate of return x rate base)
Rate base = net plant ± adjustments to approximate invested capital
Business Scope |
• Retail electricity and natural gas distribution service (construction, operations and maintenance) • Customer services (call centers, meter reading, billing) • 5.1 million electric and 4.3 million gas customer accounts |
Primary Assets |
• $11.9 billion of rate base (2008 wtd. avg.) |
Regulation |
• California state regulation (CPUC) • Cost of service ratemaking (1) |
69
Electric And Gas Distribution
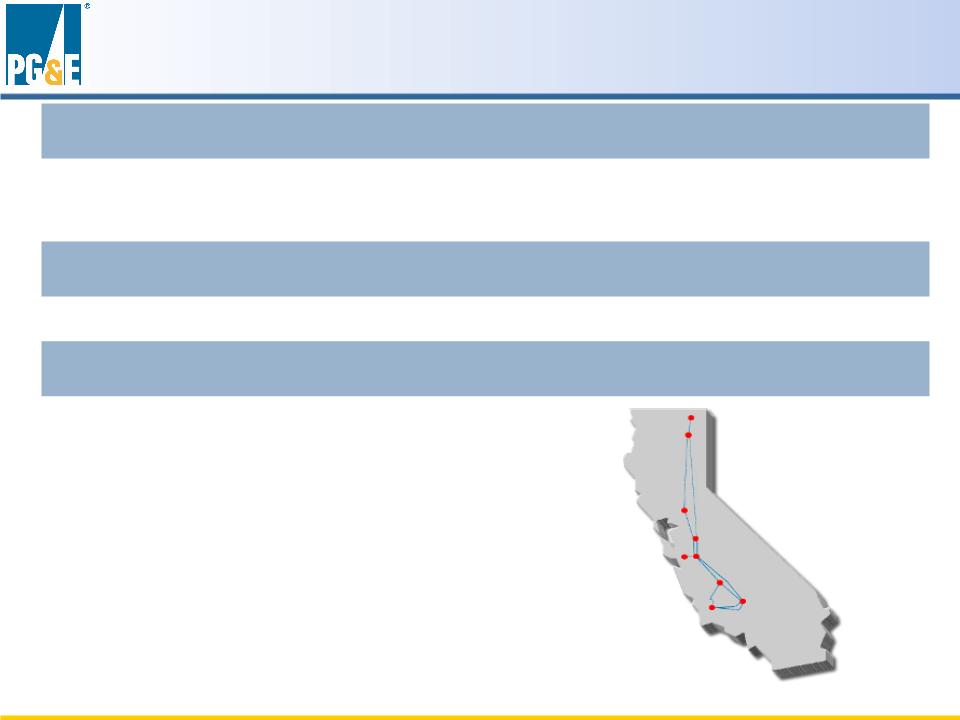
Midway
Los Banos
Moss Landing
Diablo Canyon
Gates
Dixon
Malin
Round Mt
Vaca
Business Scope |
• Wholesale electric transmission services (construction, maintenance) • Operation by CA Independent System Operator |
Primary Assets |
• $2.8 billion of rate base (2008 wtd. avg.) |
Regulation |
• Federal regulation (FERC) • Cost of service ratemaking • Revenues vary with system load |
70
Electric Transmission
Business Scope |
• Natural gas transportation, storage, parking and lending services • Customers: PG&E natural gas distribution and electric generation businesses, industrial customers, California electric generators |
Primary Assets |
• $1.5 billion of rate base (2008 wtd. avg.) |
Regulation |
• California state regulation (CPUC) • Incentive ratemaking framework (“Gas Accord”) • Revenues vary with throughput |
71
Natural Gas Transmission
Business Scope |
• Electricity and ancillary services from owned and controlled resources • Energy procurement program |
Primary Assets |
• $2.0 billion of rate base (2008 wtd. avg.) • Diablo Canyon Nuclear Power Plant (2,240 MW) • Gateway Generating Station (530 MW) • Largest privately owned hydro system (3,896 MW) • Funded nuclear plant decommissioning trusts of $1.8 billion |
Regulation |
• Cost of service ratemaking for utility-owned generation • Pass through of power procurement costs |
72
Electric Procurement & Owned Generation
Helms Pumped Storage
Conventional Hydroelectric
facilities
facilities
PG&E Generation in California
Gateway
73
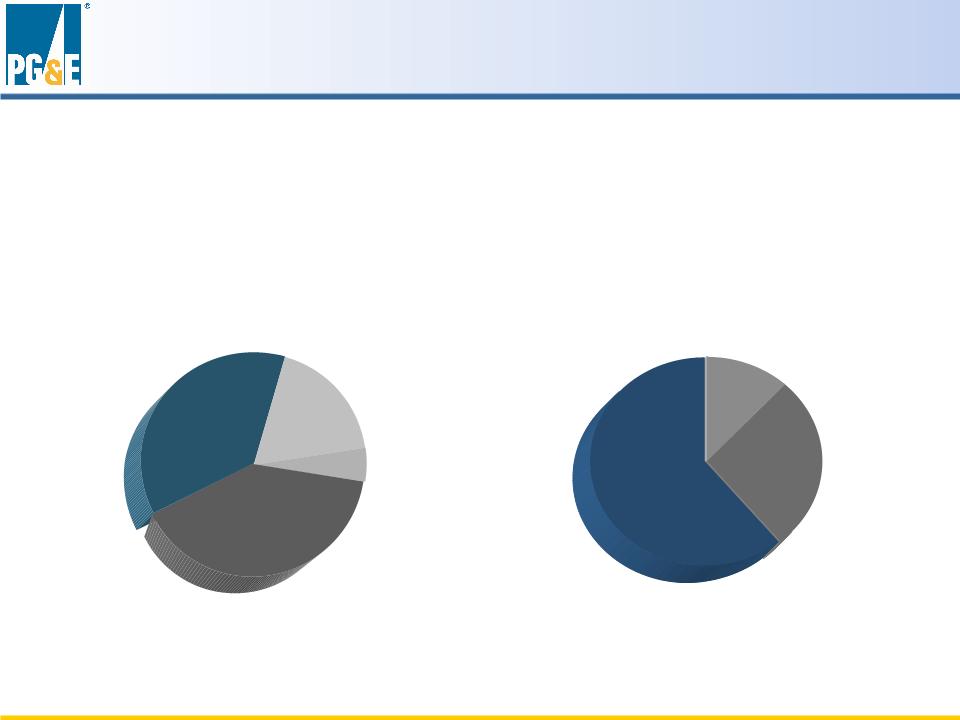
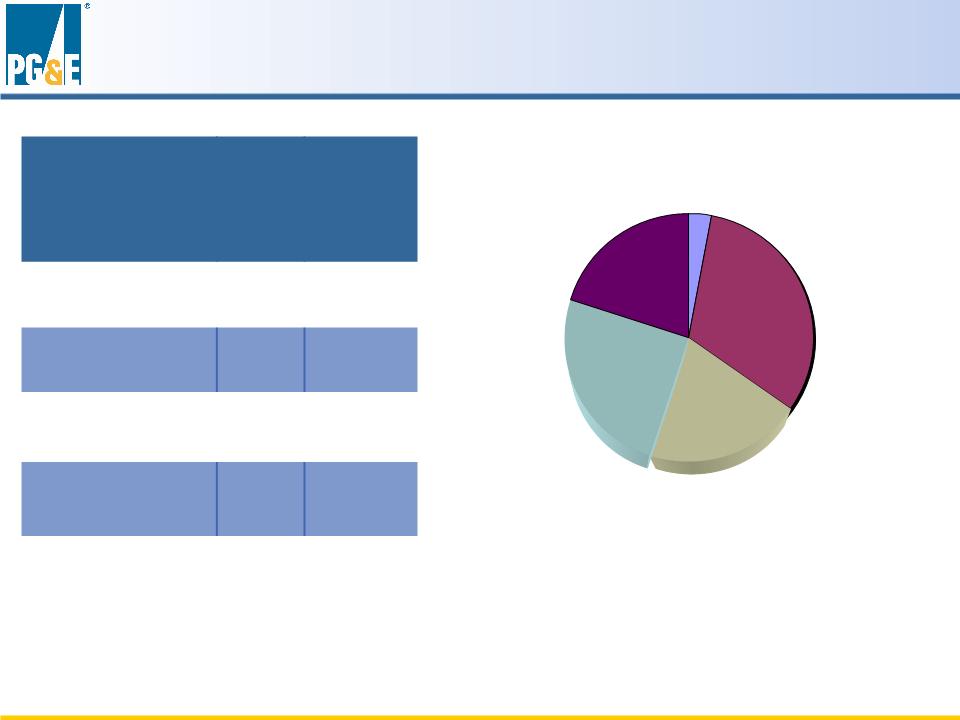
Agricultural
Electric Customers
(88,127 GWh delivered)
Gas Customers
(839 Bcf delivered)
Industrial
63%
63%
Commercial
11%
11%
Residential
26%
26%
Industrial
18%
18%
Commercial
39%
39%
Residential
36%
36%
Agricultural
& Other
& Other
7%
2008 Customer Profiles (% by Sales)
74
2008 total sources of electric energy*
Owned Generation | Type | Net Capacity (MW) |
Diablo Canyon | Nuclear | 2,240 |
Hydroelectric Facilities | Hydro | 3,896 |
Humboldt | Fossil | 135 |
Total | 6,271 |
Existing Resource Mix
* Approximately 12% of total retail sales are supplied by eligible renewable resources coming from utility-owned, QF, Irrigation Districts, and
other sources.
other sources.
75
Utility Owned
30%
Irrigation Districts 2%
DWR
15%
QF/ Renewables
18%
Other Power
Purchases
35%

Case | Docket # | Expected Decision Date |
SmartMeterTM Upgrade Program | A. 07-12-009 | 3/12/2009 |
Energy Efficiency 2009-2011 Programs Incentive Mechanism | A.08-07-031 R.09-01-019 | Q3 2009 for the 2009-2011 Portfolio Rulemaking Opened Q1 2009 Interim earnings claim for 2008 in Q4 2009 True-up earnings claim for 2006-2008 in Q4 2010 |
Direct Access • Phase 1 - Legal Issues • Phase 2a - DWR Contracts • Phase 2b - Merit • Phase 3 - Rules | OIR: Q2 2007 | 2/29/08 Q4 2008 TBD TBD |
AB 32 Implementation • CARB Scoping Plan • Implementation (regulations in effect) | AB 32 signed 9/2006 | 1/1/2009 1/1/2012 |
Gas Transmission & Storage Rate Case 2011 | Filing in Q3 2009 | |
Hydro Divestiture | A. 08-04-022 | 2009 |
Transmission Owner Rate Case 11 | ER08-1318-000 | Q2 2009 |
Transmission Owner Rate Case 12 | Filing in Summer 2009 | |
Planning Reserve Margin | R. 08-04-012 | Q3 2009 |
2011 General Rate Case | Filing in August 2009 | |
Cornerstone Improvement Program | A. 08-05-023 | Hearings in 2009 |
Dynamic Pricing | Filing in February 2009 | |
SmartGrid OIR | R. 08-12-009 | OIR - December 2008 Responses due February/March 2009 |
Short-term Debt Application | A. 08-12-014 | March 2009 |
PG&E Renewable Generation and Solar Projects | Filing in February 2009 |
76
Key Regulatory Proceedings
PG&E is currently rated
BBB+ / A3
Result for 2009: No change in ROE
Result for 2009: No change in ROE
77
CPUC Cost of Capital Mechanism

Year Signed | Project | Max GWh/yr | Technology |
2006 | HFI Silvan | 142 | Biomass |
2006 | Liberty Biofuels | 70 | Biofuels |
2006 | Bottle Rock USRG | 385 | Geothermal |
2006 | IAE Truckhaven | 366 | Geothermal |
2006 | Global Common - Chowchilla | 72 | Biomass |
2006 | Global Common - El Nido | 72 | Biomass |
2006 | Newberry | 840 | Geothermal |
2006 | Calpine Geysers | 922 | Geothermal |
2006 | Eden Vale Dairy | 1.3 | Biogas |
2006 | Microgy | TBD | Biogas |
2006 | Bio_Energy LLC | TBD | Biogas |
2006 | Palco | 36 | Biomass |
2007 | Solel | 1388 | Solar Thermal |
2007 | PPM-Klondike | 265 | Wind |
Year Signed | Project | Max GWh/yr | Technology |
2007 | CalRenew | 9 | PV |
2007 | Green Volts | 5 | PV |
2007 | enXco | 509 | Wind |
2007 | Ausra | 388 | Solar Thermal |
2008 | Calpine | 500 | Geothermal |
2008 | Wadham | 141 | Biomass |
2008 | BrightSource | 1230 | Solar Thermal |
2008 | San Joaquin Solar | 700 | Solar Thermal- Biofuel Hybrid |
2008 | Arlington Wind (Horizon) | 240 | Wind |
2008 | OptiSolar | 1148 | PV |
2008 | SunPower | 594 | PV |
2008 | Iberdrola/ BPA | 260 | Wind |
2008 | Hatchet Ridge | 303 | Wind |
2008 | El Dorado Energy (Sempra) | 23 | PV |
*Based on contracts signed through January 2009.
Over 20% of Projected Load Currently Under Contract*
78
Renewable Contracts Signed
* Estimated carrying cost credits include only the equity portion and assume a utility equity ratio of 52% and ROE at 11.35%.
($MM) | 2009 | 2010 | 2011 | 2012 |
Energy Recovery Bond Average Deferred Tax Balance | $542 | $396 | $243 | $82 |
Estimated After-tax Carrying Cost Credit* | $(32) | $(23) | $(14) | $(5) |
Estimated Average Deferred Tax Balances and
Carrying Cost Credit Impacts ($MM)
Carrying Cost Credit Impacts ($MM)
79
Carrying Cost Credit Impacts

($MM) | 2009 | 2010 | 2011 | 2012 |
Annual ERB Amortization | $370 | $386 | $404 | $423 |
End-of-year ERB balance | $1,213 | $827 | $423 | $0 |
80
ERB Amortization Schedule

* Metrics include debt equivalents for long-term power purchase contracts
Current Ratings |
• Utility Corporate Credit/Issuer: BBB+ (S&P) and A3 (Moody’s) • Utility Senior unsecured debt: BBB+ (S&P) and A3 (Moody’s) |
Average Utility Metrics (2009-2011)* |
• S&P Business Profile Rating: 5 • Total Debt to capitalization (EOY): 54% • Funds from Operations Cash Interest Coverage: 5.5x • Funds from Operations to Average Total Debt: 24% |
81
Credit Profile
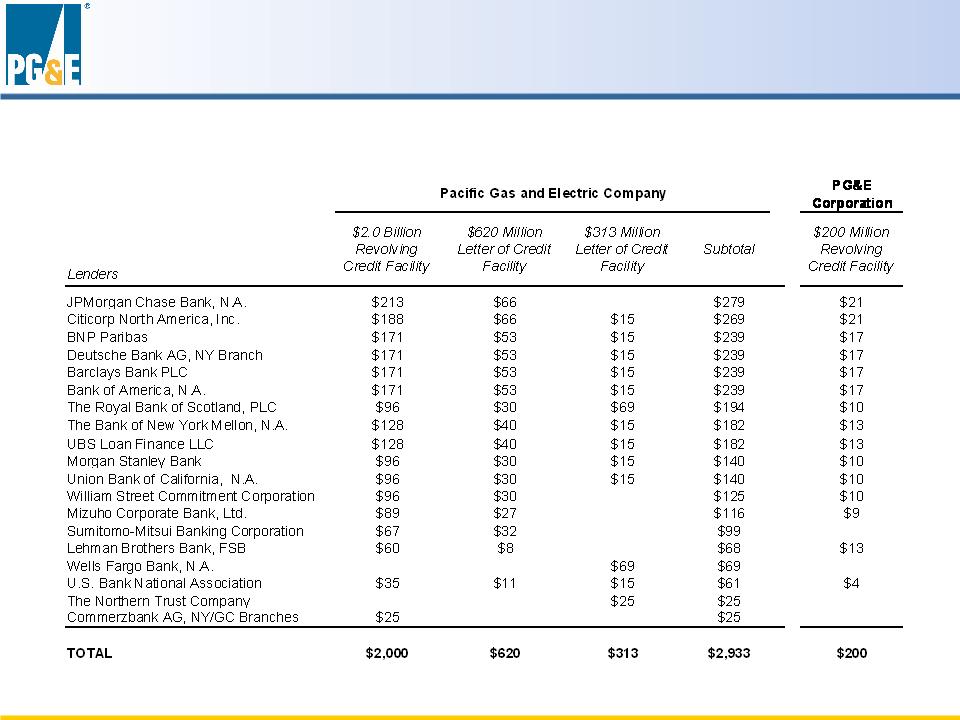
Bank Group Financial Commitments
Bank Group Financial Commitments
($ in millions)
($ in millions)
82
Bank Group

As of December 31, 2008
As of December 31, 2008
Pacific Gas and Electric Company | PG&E Corporation | |
Bank Revolver Capacity | $2,000 | $200 |
less: | ||
- Loans outstanding | $0 | $0 |
- Letters of credit outstanding | ($287) | $0 |
- Commercial paper outstanding (1) | ($287) | n/a |
- Lehman Brothers Bank FSB (2) | ($60) | ($13) |
Cash and cash equivalents | $52 (3) | $167 (4) |
Available liquidity | $1,418 | $354 |
(1) Bank revolver serves as a liquidity backstop for the commercial paper program.
(1) Bank revolver serves as a liquidity backstop for the commercial paper program.
(2) Lehman Brothers Bank FSB (Lehman Bank) had previously failed to fulfill its obligation under the bank credit agreement to make
revolving loans to PG&E. Lehman Bank is an affiliate of Lehman Brothers Holdings, Inc., which filed for bankruptcy on September 15,
2008.
revolving loans to PG&E. Lehman Bank is an affiliate of Lehman Brothers Holdings, Inc., which filed for bankruptcy on September 15,
2008.
(3) Unrestricted cash only. PG&E also had $1,290 million of restricted cash held in escrow pending the resolution of remaining Disputed
Claims.
Claims.
(3) Unrestricted cash only. PG&E also had $1,290 million of restricted cash held in escrow pending the resolution of remaining Disputed
Claims.
Claims.
(4) Of the $167 million held by the Holding Company, approximately $141 million was paid to common shareholders as dividend on January
15, 2009.
15, 2009.
(4) Of the $167 million held by the Holding Company, approximately $141 million was paid to common shareholders as dividend on January
15, 2009.
15, 2009.
83
Available Liquidity

* Earnings per share from operations is a non-GAAP measure. This non-GAAP measure is used because it allows
investors to compare the core underlying financial performance from one period to another, exclusive of items that do not
reflect the normal course of operations.
investors to compare the core underlying financial performance from one period to another, exclusive of items that do not
reflect the normal course of operations.
** Items impacting comparability reconcile earnings from operations with consolidated net income as reported in accordance
with GAAP. For the three and twelve months ended December 31, 2008, PG&E Corporation recognized $257 million of
net income resulting from a settlement of tax audits for tax years 2001 through 2004. Of this amount, $154 million was
related to PG&E Corporation’s former subsidiary, National Energy & Gas Transmission, Inc., and was recorded as income
from discontinued operations
EPS on an Earnings from Operations Basis* | $2.95 |
Items Impacting Comparability** | 0.68 |
EPS on a GAAP Basis | $3.63 |
2008
84
2008 EPS - Reg G Reconciliation
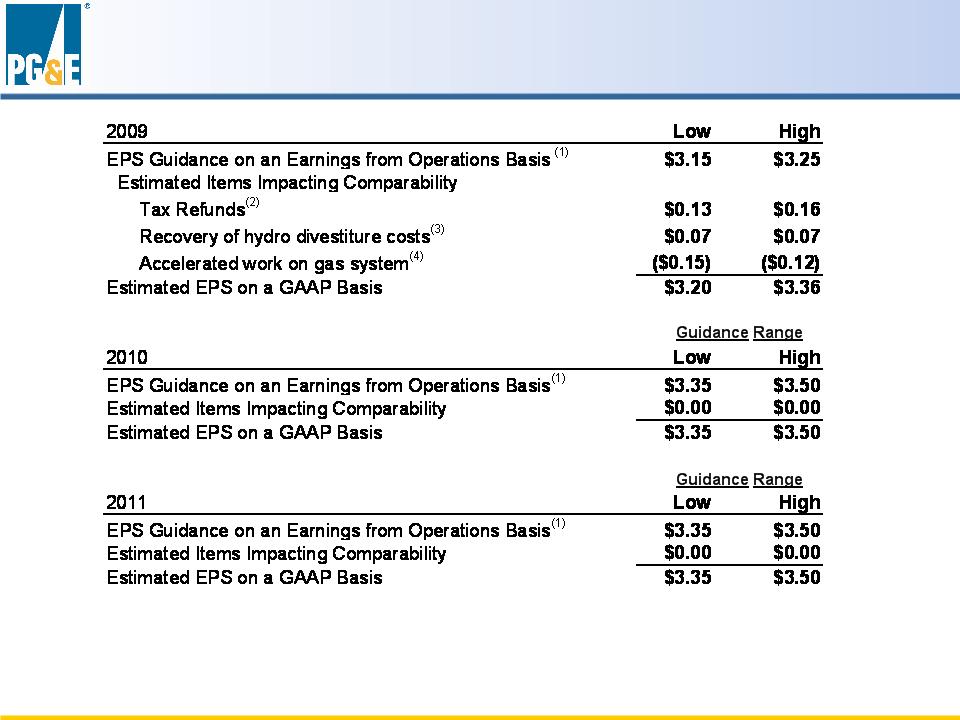
(1) Earnings per share from operations is a non-GAAP measure. This non-GAAP measure is used because it allows investors to compare the core underlying financial performance from one period to another, exclusive of items that do not reflect the normal course of operations. (2) Tentative agreement to resolve federal tax refund claims related to tax years 1998 and 1999. (3) Anticipated recovery of costs incurred in connection with efforts to determine the market value of hydroelectric generation facilities. (4) Forecasted cost to accelerate the performance of system-wide gas integrity surveys and remedial work. |
Guidance Range
Reg G reconciliation also provided on the PG&E Corporation website: www.pge-corp.com
85
EPS Guidance - Reg G Reconciliation

Officer Biographies

87
PETER A. DARBEE
Chairman of the Board, Chief Executive Officer, and President
PG&E Corporation
President and Chief Executive Officer
Pacific Gas and Electric Company
Chairman of the Board, Chief Executive Officer, and President
PG&E Corporation
President and Chief Executive Officer
Pacific Gas and Electric Company
Peter A. Darbee, a veteran of the energy, telecommunications, and investment banking industries, is
Chairman of the Board, Chief Executive Officer and President of PG&E Corporation, and President and
Chief Executive Officer of Pacific Gas and Electric Company. Based in San Francisco, PG&E Corporation
is a $41 billion energy-based holding company that owns Pacific Gas and Electric Company, one of the
largest combination natural gas and electric utilities in the United States. The utility serves 15 million
people throughout a 70,000-square-mile service area in Northern and Central California.
Darbee joined PG&E Corporation in 1999 as Senior Vice President and Chief Financial Officer. Prior to
that, he was Vice President and Chief Financial Officer of Advanced Fibre Communications, Inc. (AFC), a
telecommunications manufacturer of digital loop carrier systems. Before joining AFC, he was Vice
President, Chief Financial Officer, and Controller of Pacific Bell.
that, he was Vice President and Chief Financial Officer of Advanced Fibre Communications, Inc. (AFC), a
telecommunications manufacturer of digital loop carrier systems. Before joining AFC, he was Vice
President, Chief Financial Officer, and Controller of Pacific Bell.
Darbee previously was an investment banker with Goldman Sachs, where he was Vice President and co-
head of the company's energy and telecommunications group. He also held positions at Salomon Brothers
and AT&T.
head of the company's energy and telecommunications group. He also held positions at Salomon Brothers
and AT&T.
Darbee earned his bachelor's degree in economics from Dartmouth College and an M.B.A. from the Amos
Tuck School of Business at Dartmouth. He has also successfully completed the Nuclear Reactor
Technology Program at the Massachusetts Institute of Technology.
Tuck School of Business at Dartmouth. He has also successfully completed the Nuclear Reactor
Technology Program at the Massachusetts Institute of Technology.
Darbee is a Director of PG&E Corporation and Pacific Gas and Electric Company. He is a member of the
CEO board for the Clean Energy Group, a member of the Edison Electric Institute Executive Committee,
and also serves as Co-Chairman of the EEI Energy Efficiency Task Force. Darbee also is active in
numerous civic and community organizations, including The Business Council, the California Business
Roundtable, the California Commission for Jobs and Economic Growth, the San Francisco Committee on
JOBS, and the San Francisco Symphony Board of Governors.

88
CHRISTOPHER P. JOHNS
Senior Vice President, Chief Financial Officer and Treasurer
PG&E Corporation
Senior Vice President and Treasurer
Pacific Gas and Electric Company
Senior Vice President, Chief Financial Officer and Treasurer
PG&E Corporation
Senior Vice President and Treasurer
Pacific Gas and Electric Company
Christopher P. Johns is Senior Vice President, Chief Financial Officer and Treasurer for PG&E Corporation and
Senior Vice President and Treasurer for Pacific Gas and Electric Company.
Senior Vice President and Treasurer for Pacific Gas and Electric Company.
Johns oversees the financial activities of the $41 billion company including accounting, treasury, tax, business
and financial planning, and investor relations.
and financial planning, and investor relations.
Johns joined Pacific Gas and Electric Company in 1996 as Vice President and Controller, and became
Controller of PG&E Corporation when it was formed in January 1997. Later that year, he was promoted to Vice
President and Controller. Johns was named Senior Vice President and Controller in September 2001 and
elected Chief Financial Officer in January 2005. He assumed his current position in October 2005.
Before joining PG&E Corporation, Johns was a partner in KPMG Peat Marwick LLP. He also was the associate
national director of the firm’s Public Utilities practice.
national director of the firm’s Public Utilities practice.
He earned a bachelor’s degree in accounting from the University of Notre Dame. He has also completed the
Nuclear Reactor Technology Program at the Massachusetts Institute of Technology.
Nuclear Reactor Technology Program at the Massachusetts Institute of Technology.
Johns is a Certified Public Account in the states of California and Florida, and is a member of the Financial
Executives Institute. He also serves on the Board of Trustees for the San Francisco Ballet.
Executives Institute. He also serves on the Board of Trustees for the San Francisco Ballet.

JACK KEENAN
Senior Vice President and Chief Operating Officer
Pacific Gas and Electric Company
Senior Vice President and Chief Operating Officer
Pacific Gas and Electric Company
Jack Keenan is Chief Operating Officer of Pacific Gas and Electric Company, and oversees the day-to-day
operations of the Utility.
operations of the Utility.
Keenan joined Pacific Gas and Electric Company as Senior Vice President, Generation and Chief Nuclear
Officer in December 2005, where he was responsible for all of PG&E’s power generation assets, including
nuclear, fossil and hydroelectric as well as the strategic direction and financial success in the following power
generation sectors: nuclear, fossil, hydroelectric, cogeneration, and renewables.
Officer in December 2005, where he was responsible for all of PG&E’s power generation assets, including
nuclear, fossil and hydroelectric as well as the strategic direction and financial success in the following power
generation sectors: nuclear, fossil, hydroelectric, cogeneration, and renewables.
Keenan has three decades of experience in nuclear generation, including system engineering, outage
management, maintenance and operations. Most recently, Jack served as Vice President, Fossil Generation at
Progress Energy in North Carolina. Previously, he has held leadership positions at Progress Energy’s
Brunswick Nuclear Plant and Robinson Nuclear Plant, and managerial positions at Northeast Utilities’ Millstone
Nuclear Power Station. Under his leadership, the Diablo Canyon, Brunswick, and Robinson Plants were ranked
among the best in the country by industry standards.
Keenan holds a bachelor’s degree in mechanical engineering from Worcester Polytechnic Institute, in
Massachusetts, and an MBA from Rensselaer Polytechnic Institute in Connecticut.
Massachusetts, and an MBA from Rensselaer Polytechnic Institute in Connecticut.
89

Tom Bottorff is Senior Vice President, Regulatory Relations, at Pacific Gas and Electric Company. He oversees
the following areas: Energy Revenue Requirements, Operations Revenue Requirements, Rates and Tariffs,
Regulatory Relations, Electric Transmission Rates, and Regulatory Strategy and Analysis.
the following areas: Energy Revenue Requirements, Operations Revenue Requirements, Rates and Tariffs,
Regulatory Relations, Electric Transmission Rates, and Regulatory Strategy and Analysis.
Bottorff is responsible for developing, coordinating and managing policy with state and regulatory agencies,
including the California Public Utilities Commission (CPUC), the Federal Energy Regulatory Commission
(FERC), and the California Independent System Operator (ISO). He also is responsible for developing and filing
rate proposals with the CPUC and FERC, and for oversight of the company’s gas and electric tariffs.
Bottorff joined PG&E in 1982 and has served in a number of regulatory, rates, and customer service areas prior
to his current assignment. Before joining the Utility, he was a power supply analyst for the Nuclear Regulatory
Commission in Washington, D.C. He has also developed and built over 25 new homes in Northern California.
to his current assignment. Before joining the Utility, he was a power supply analyst for the Nuclear Regulatory
Commission in Washington, D.C. He has also developed and built over 25 new homes in Northern California.
Bottorff received a Bachelor of Science degree in Electrical Engineering from the University of California,
Berkeley, and a Master of Science degree in Engineering Economic Systems from Stanford University. He holds
both general building and engineering contractor licenses in the state of California.
Berkeley, and a Master of Science degree in Engineering Economic Systems from Stanford University. He holds
both general building and engineering contractor licenses in the state of California.
90
THOMAS E. BOTTORFF
Senior Vice President, Regulatory Relations
Pacific Gas and Electric Company
Senior Vice President, Regulatory Relations
Pacific Gas and Electric Company

HELEN A. BURT
Senior Vice President and Chief Customer Officer
Pacific Gas and Electric Company
Helen Burt is Senior Vice President and Chief Customer Officer of Pacific Gas and Electric Company.
Burt is responsible for all marketing and customer care functions at PG&E. Organizational responsibility
includes marketing and customer insight, product development, sales and services as well as all call center,
credit and billing operations, meter reading and credit operations, and field gas and electric services. She is
also responsible for the company’s $1.7 billion SmartMeter™ project, designed to deploy 10 million advanced
meter devices, as well as the company’s energy efficiency, solar, and demand response portfolio.
Burt is an experienced customer executive with 27 years of experience at TXU (previously known as Texas
Utilities). She began her career at TXU as a customer service representative and concluded it as Vice
President, Customer Billing and Operations at TXU Energy, with responsibility for all gas and electric customer
service and a 2,000-person organization. Most recently, she worked with Bass and Company Management
Consultants assisting energy and water industries with business process re-engineering, large-scale
organizational change and technology integration to improve customer points of contact.
Burt holds a bachelor’s degree in biology from Midwestern State University in Wichita Falls, Texas. She is
active in numerous community and professional organizations. She has also been active in non-profit support
for urban education and is a 2004 Fellow in the Broad Urban Superintendents Academy.
active in numerous community and professional organizations. She has also been active in non-profit support
for urban education and is a 2004 Fellow in the Broad Urban Superintendents Academy.
91

GREG S. PRUETT
Senior Vice President, Corporate Relations
PG&E Corporation
Senior Vice President, Corporate Relations
Senior Vice President, Corporate Relations
Pacific Gas and Electric Company
Greg S. Pruett is Senior Vice President, Corporate Relations of PG&E Corporation.
He is responsible for leading and overseeing all external and internal communications and activities supporting
the reputation and identity of PG&E Corporation, and its primary subsidiary, Pacific Gas and Electric Company.
the reputation and identity of PG&E Corporation, and its primary subsidiary, Pacific Gas and Electric Company.
Pruett has nearly 27 years of experience and expertise in communications and public affairs, including senior
leadership positions at Bechtel and PG&E. He joined PG&E most recently after leading public affairs for the
American Gas Association in Washington, D.C., where he was Vice President of Communications and
Marketing. Prior to this assignment, Pruett served as Bechtel Corporation’s Chief Public Affairs Officer for its Iraq
Infrastructure Reconstruction Program and was headquartered in Baghdad where he managed all of the firm’s
communications, public affairs and government relations efforts in support of its numerous infrastructure projects.
Pruett was previously Vice President, Corporate Communications with PG&E, where he had served for 23 years
in positions of increasing responsibility.
He holds a bachelor of arts degree in Journalism from California State University, Fresno. He is also a graduate
of Harvard Business School’s Program for Management Development.
of Harvard Business School’s Program for Management Development.
92

GABRIEL B. TOGNERI
Vice President, Investor Relations
PG&E Corporation
Gabriel B. Togneri is Vice President, Investor Relations for PG&E Corporation. With more than 25 years of
experience in energy and finance, Togneri is responsible for providing the investment community with
information about the Corporation and its performance.
experience in energy and finance, Togneri is responsible for providing the investment community with
information about the Corporation and its performance.
Togneri joined Pacific Gas and Electric Company, the Corporation's utility unit, in 1977 and has held a number
of positions in the areas of sales forecasting, corporate planning, financial planning, financing, and cash
management. He was named Assistant Treasurer in 1994 and joined PG&E Corporation in 1997. He assumed
his current position as Vice President, Investor Relations in 2000.
of positions in the areas of sales forecasting, corporate planning, financial planning, financing, and cash
management. He was named Assistant Treasurer in 1994 and joined PG&E Corporation in 1997. He assumed
his current position as Vice President, Investor Relations in 2000.
Togneri received a bachelor's degree in mathematics from the University of California, Davis, and holds master's
degrees in statistics, operations research, and business administration from the University of California,
Berkeley. He is a member of the Board of Directors of both the National Investor Relations Institute's San
Francisco Chapter and the Lindsay Wildlife Museum.
degrees in statistics, operations research, and business administration from the University of California,
Berkeley. He is a member of the Board of Directors of both the National Investor Relations Institute's San
Francisco Chapter and the Lindsay Wildlife Museum.
93