UNITED STATES
SECURITIES AND EXCHANGE COMMISSION
Washington, D.C. 20549
FORM N-CSR
CERTIFIED SHAREHOLDER REPORT OF REGISTERED
MANAGEMENT INVESTMENT COMPANIES
Investment Company Act File Number: 811-04119
T. Rowe Price High Yield Fund, Inc.
(Exact name of registrant as specified in charter)
100 East Pratt Street, Baltimore, MD 21202
(Address of principal executive offices)
David Oestreicher
100 East Pratt Street, Baltimore, MD 21202
(Name and address of agent for service)
Registrant’s telephone number, including area code: (410) 345-2000
Date of fiscal year end: May 31
Date of reporting period: May 31, 2024
Item 1. Reports to Shareholders
(a) Report pursuant to Rule 30e-1
Annual Shareholder Report
May 31, 2024
This annual shareholder report contains important information about U.S. High Yield Fund (the "fund") for the period of June 1, 2023 to May 31, 2024. You can find the fund’s prospectus, financial information on Form N-CSR (which includes required tax information for dividends), holdings, proxy voting information, and other information atwww.troweprice.com/prospectus. You can also request this information without charge by contacting T. Rowe Price at 1-800-638-5660 or info@troweprice.com or contacting your intermediary.
What were the fund costs for the last year? (based on a hypothetical $10,000 investment)
| Costs of a $10,000 investment | Costs paid as a percentage of a $10,000 investment |
|---|
| U.S. High Yield Fund - Investor Class | $80 | 0.75% |
What drove fund performance during the past 12 months?
High yield bonds strongly advanced in the 12-month period ended May 31, 2024, as a pause in rate hikes, receding recession fears, healthy risk appetite, and favorable technical conditions—a pickup in primary issuance and improved market liquidity—supported performance.
Compared with the style-specific ICE BofA US High Yield Constrained Index, the fund’s strongest relative results were in the media, consumer goods, and services segments. By credit quality, our selection in the B and BB rating tiers provided meaningful relative contributions. Our underweight to BBs was also beneficial as lower qualities outperformed. The fund’s off-benchmark allocation to bank loans added relative value as they outperformed high yield bonds for the year.
Relative to the style-specific benchmark, the fund’s weakest results were in the capital goods, technology and electronic, and automotive industries. Our selection among CCC rated bonds also detracted. The fund’s cash position, necessary for liquidity purposes, held back relative gains in the strong performance environment.
The fund seeks total return and, secondarily, current income by investing primarily in U.S. below investment-grade corporate debt securities. We utilized the market’s rally to trim/exit names that we believed to be fully valued and redeployed proceeds into higher-conviction ideas, selectively taking advantage of stronger primary issuance. We expect more income-like returns from here given tight spread levels. We significantly increased the credit quality of the fund and sought to maintain a current yield advantage versus the index by exchanging lower-coupon COVID-era bonds for higher-coupon paper and increasing bank loan exposure.
How has the fund performed?
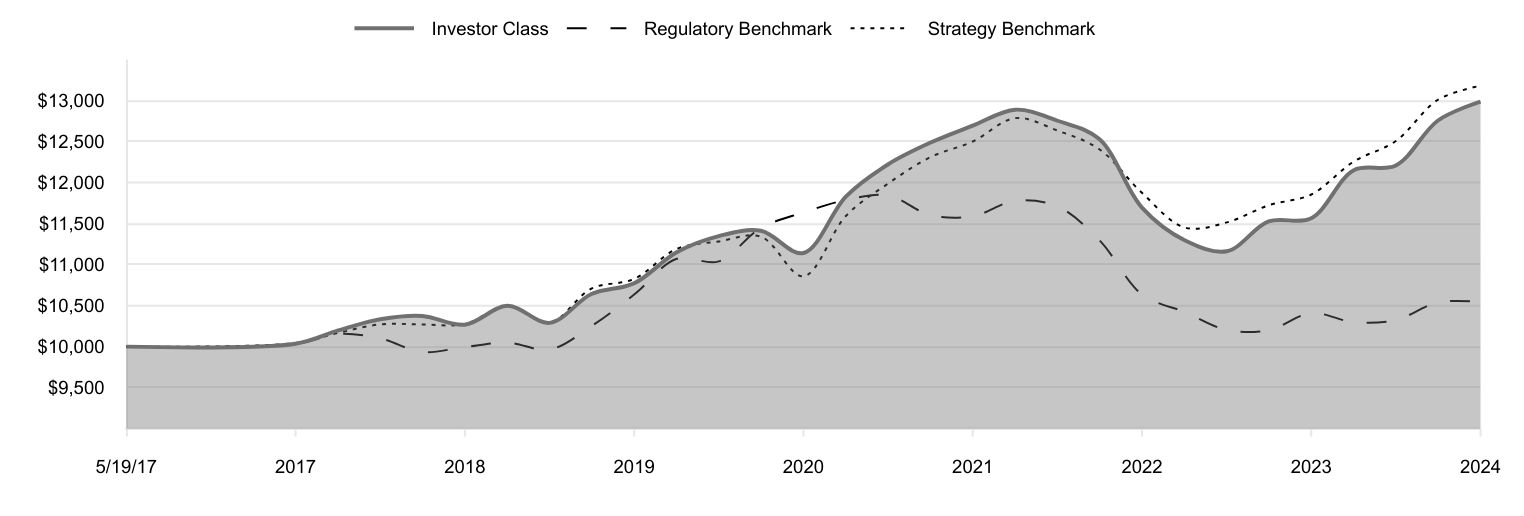
Cumulative Returns of a Hypothetical $10,000 Investment as of May 31, 2024
| Investor Class | Regulatory Benchmark | Strategy Benchmark |
|---|
| 5/19/17 | 10,000 | 10,000 | 10,000 |
| 5/31/17 | 10,036 | 10,032 | 10,044 |
| 8/31/17 | 10,198 | 10,156 | 10,168 |
| 11/30/17 | 10,334 | 10,100 | 10,272 |
| 2/28/18 | 10,374 | 9,935 | 10,271 |
| 5/31/18 | 10,268 | 9,995 | 10,274 |
| 8/31/18 | 10,498 | 10,049 | 10,500 |
| 11/30/18 | 10,290 | 9,965 | 10,294 |
| 2/28/19 | 10,641 | 10,250 | 10,708 |
| 5/31/19 | 10,772 | 10,635 | 10,825 |
| 8/31/19 | 11,151 | 11,071 | 11,191 |
| 11/30/19 | 11,348 | 11,040 | 11,283 |
| 2/29/20 | 11,412 | 11,447 | 11,341 |
| 5/31/20 | 11,141 | 11,636 | 10,858 |
| 8/31/20 | 11,833 | 11,788 | 11,596 |
| 11/30/20 | 12,224 | 11,844 | 11,990 |
| 2/28/21 | 12,485 | 11,605 | 12,308 |
| 5/31/21 | 12,694 | 11,589 | 12,501 |
| 8/31/21 | 12,889 | 11,778 | 12,786 |
| 11/30/21 | 12,754 | 11,708 | 12,634 |
| 2/28/22 | 12,530 | 11,299 | 12,407 |
| 5/31/22 | 11,695 | 10,636 | 11,875 |
| 8/31/22 | 11,298 | 10,422 | 11,452 |
| 11/30/22 | 11,163 | 10,204 | 11,515 |
| 2/28/23 | 11,526 | 10,200 | 11,723 |
| 5/31/23 | 11,565 | 10,408 | 11,855 |
| 8/31/23 | 12,151 | 10,298 | 12,257 |
| 11/30/23 | 12,209 | 10,325 | 12,507 |
| 2/29/24 | 12,757 | 10,540 | 13,010 |
| 5/31/24 | 12,988 | 10,544 | 13,181 |
202405-3565004, 202407-3567727
Average Annual Total Returns
| 1 Year | 5 Years | Since Inception 5/19/2017 |
|---|
| U.S. High Yield Fund (Investor Class) | 12.31% | 3.81% | 3.79% |
| Bloomberg U.S. Aggregate Bond Index (Regulatory Benchmark) | 1.31 | | 0.76 |
| ICE BofA US High Yield Constrained Index (Strategy Benchmark) | 11.18 | 4.02 | 4.01 |
The preceding line graph shows the value of a hypothetical $10,000 investment in the fund over the past 10 fiscal year periods or since inception (for funds lacking 10-year records). The fund’s performance information included in the line graph and table above is compared with a regulatory required index that represents an overall securities market (Regulatory Benchmark). In addition, the line graph and table may also include one or more indexes that more closely aligns to the fund's investment strategy (Strategy Benchmark(s)). Due to new SEC Rules on shareholder reporting the fund adopted a new broad-based securities market index, referred to as the Regulatory Benchmark. Market index returns do not include expenses, which are deducted from fund returns. The fund's total return figures reflect the reinvestment of dividends and capital gains, if any. Neither the fund’s returns nor the index returns reflect the deduction of taxes that a shareholder would pay on fund distributions or redemptions of fund shares. The fund’s past performance is not a good predictor of the fund’s future performance. Updated performance information can be found at www.troweprice.com.
What are some fund statistics?
| Total Net Assets (000s) | $474,187 |
| Number of Portfolio Holdings | 104 |
| Investment Advisory Fees Paid (000s) | $2,174 |
| Portfolio Turnover Rate | 87.0% |
What did the fund invest in?
Credit Quality Allocation* (as a % of Net Assets)
| BB Rated | 22.8% |
| B Rated | 48.9 |
| CCC Rated | 9.9 |
| Bank Debt | 13.5 |
| D Rated | 0.2 |
| Reserves | 4.7 |
*Credit ratings for the securities held in the Fund are provided by Moody’s, Standard & Poor’s, and Fitch and are converted to the Standard & Poor’s nomenclature. A rating of AAA represents the highest-rated securities, and a rating of D represents the lowest rated securities. When a rating is available from all three agencies, the median rating is used. If there are two ratings, the lower rating is used, and if only one rating is available, that rating is used. If a rating is not available, the security is classified as Not Rated. The rating of the underlying investment vehicle is used to determine the creditworthiness of credit default swaps and sovereign securities. The Fund is not rated by any agency.
Top Ten Holdings (as a % of Net Assets)
| Energy Transfer | 2.3% |
| Osaic Holdings | 2.3 |
| Aretec Group | 2.0 |
| Vistra | 2.0 |
| Victra Holdings | 1.9 |
| Six Flags Entertainment | 1.9 |
| Enbridge | 1.7 |
| Heartland Dental | 1.7 |
| Sigma Holdco | 1.6 |
| Civitas Resources | 1.5 |
If you invest directly with T. Rowe Price, you can elect to receive future shareholder reports or other important documents through electronic delivery by enrolling at www.troweprice.com/paperless. If you invest through a financial intermediary such as an investment advisor, a bank, retirement plan sponsor or a brokerage firm, please contact that organization and ask if it can provide electronic delivery.
Bloomberg and ICE do not accept any liability for any errors or omissions in the indexes or data, and hereby expressly disclaim all warranties of originality, accuracy, completeness, timeliness, merchantability and fitness for a particular purpose. No party may rely on any indexes or data contained in this communication. Visit www.troweprice.com/en/us/market-data-disclosures for additional legal notices & disclaimers.
U.S. High Yield Fund
Investor Class (TUHYX)
T. Rowe Price Investment Services, Inc.
100 East Pratt Street
Baltimore, MD 21202
Annual Shareholder Report
May 31, 2024
This annual shareholder report contains important information about U.S. High Yield Fund (the "fund") for the period of June 1, 2023 to May 31, 2024. You can find the fund’s prospectus, financial information on Form N-CSR (which includes required tax information for dividends), holdings, proxy voting information, and other information atwww.troweprice.com/prospectus. You can also request this information without charge by contacting T. Rowe Price at 1-800-638-5660 or info@troweprice.com or contacting your intermediary.
What were the fund costs for the last year? (based on a hypothetical $10,000 investment)
| Costs of a $10,000 investment | Costs paid as a percentage of a $10,000 investment |
|---|
| U.S. High Yield Fund - Advisor Class | $95 | 0.90% |
What drove fund performance during the past 12 months?
High yield bonds strongly advanced in the 12-month period ended May 31, 2024, as a pause in rate hikes, receding recession fears, healthy risk appetite, and favorable technical conditions—a pickup in primary issuance and improved market liquidity—supported performance.
Compared with the style-specific ICE BofA US High Yield Constrained Index, the fund’s strongest relative results were in the media, consumer goods, and services segments. By credit quality, our selection in the B and BB rating tiers provided meaningful relative contributions. Our underweight to BBs was also beneficial as lower qualities outperformed. The fund’s off-benchmark allocation to bank loans added relative value as they outperformed high yield bonds for the year.
Relative to the style-specific benchmark, the fund’s weakest results were in the capital goods, technology and electronic, and automotive industries. Our selection among CCC rated bonds also detracted. The fund’s cash position, necessary for liquidity purposes, held back relative gains in the strong performance environment.
The fund seeks total return and, secondarily, current income by investing primarily in U.S. below investment-grade corporate debt securities. We utilized the market’s rally to trim/exit names that we believed to be fully valued and redeployed proceeds into higher-conviction ideas, selectively taking advantage of stronger primary issuance. We expect more income-like returns from here given tight spread levels. We significantly increased the credit quality of the fund and sought to maintain a current yield advantage versus the index by exchanging lower-coupon COVID-era bonds for higher-coupon paper and increasing bank loan exposure.
How has the fund performed?
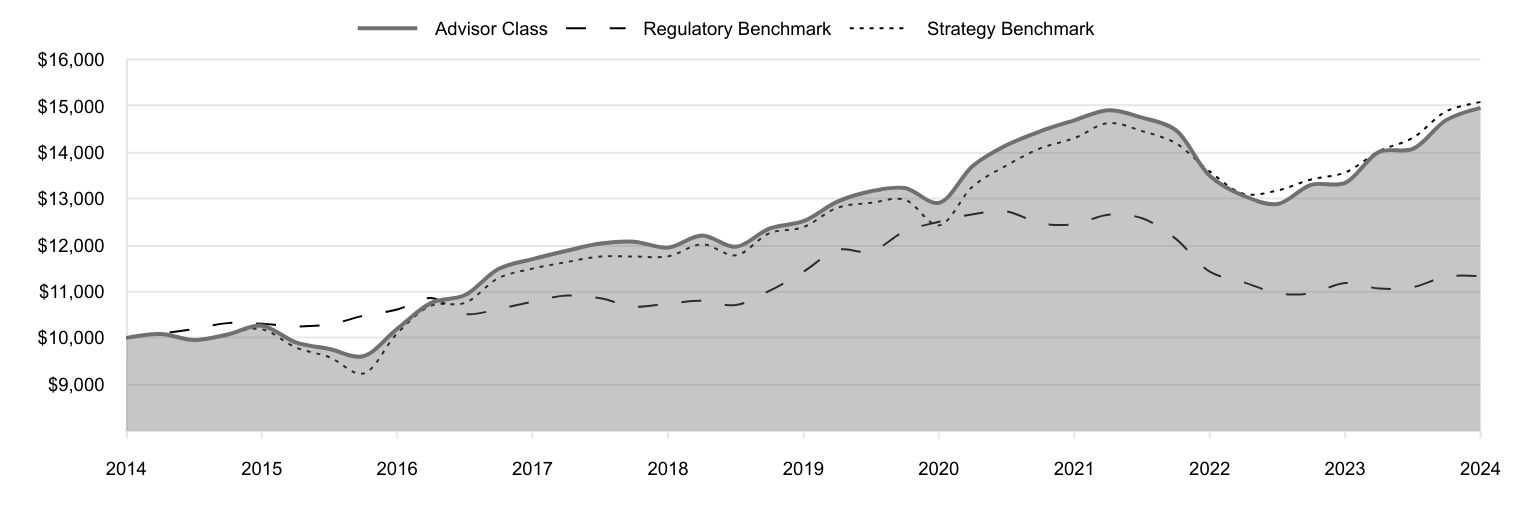
Cumulative Returns of a Hypothetical $10,000 Investment as of May 31, 2024
| Advisor Class | Regulatory Benchmark | Strategy Benchmark |
|---|
| 2014 | 10,000 | 10,000 | 10,000 |
| 2014 | 10,084 | 10,090 | 10,104 |
| 2014 | 9,955 | 10,192 | 9,933 |
| 2015 | 10,073 | 10,318 | 10,089 |
| 2015 | 10,263 | 10,303 | 10,186 |
| 2015 | 9,903 | 10,247 | 9,793 |
| 2015 | 9,760 | 10,291 | 9,582 |
| 2016 | 9,604 | 10,473 | 9,230 |
| 2016 | 10,195 | 10,612 | 10,096 |
| 2016 | 10,754 | 10,859 | 10,696 |
| 2016 | 10,924 | 10,514 | 10,756 |
| 2017 | 11,485 | 10,621 | 11,288 |
| 2017 | 11,697 | 10,780 | 11,493 |
| 2017 | 11,877 | 10,912 | 11,635 |
| 2017 | 12,033 | 10,852 | 11,754 |
| 2018 | 12,074 | 10,674 | 11,753 |
| 2018 | 11,946 | 10,739 | 11,757 |
| 2018 | 12,209 | 10,798 | 12,016 |
| 2018 | 11,963 | 10,707 | 11,780 |
| 2019 | 12,354 | 11,013 | 12,254 |
| 2019 | 12,515 | 11,426 | 12,388 |
| 2019 | 12,937 | 11,896 | 12,806 |
| 2019 | 13,161 | 11,862 | 12,912 |
| 2020 | 13,230 | 12,299 | 12,978 |
| 2020 | 12,911 | 12,502 | 12,425 |
| 2020 | 13,709 | 12,666 | 13,270 |
| 2020 | 14,156 | 12,726 | 13,720 |
| 2021 | 14,453 | 12,470 | 14,084 |
| 2021 | 14,690 | 12,452 | 14,305 |
| 2021 | 14,909 | 12,655 | 14,631 |
| 2021 | 14,748 | 12,579 | 14,458 |
| 2022 | 14,483 | 12,140 | 14,198 |
| 2022 | 13,496 | 11,428 | 13,589 |
| 2022 | 13,063 | 11,198 | 13,105 |
| 2022 | 12,886 | 10,964 | 13,177 |
| 2023 | 13,300 | 10,960 | 13,415 |
| 2023 | 13,340 | 11,183 | 13,566 |
| 2023 | 14,011 | 11,064 | 14,025 |
| 2023 | 14,073 | 11,094 | 14,312 |
| 2024 | 14,699 | 11,324 | 14,887 |
| 2024 | 14,960 | 11,329 | 15,083 |
202405-3565004, 202407-3567727
Average Annual Total Returns
| 1 Year | 5 Years | 10 Years |
|---|
| U.S. High Yield Fund (Advisor Class) | 12.14% | 3.63% | 4.11% |
| Bloomberg U.S. Aggregate Bond Index (Regulatory Benchmark) | 1.31 | | 1.26 |
| ICE BofA US High Yield Constrained Index (Strategy Benchmark) | 11.18 | 4.02 | 4.20 |
The preceding line graph shows the value of a hypothetical $10,000 investment in the fund over the past 10 fiscal year periods or since inception (for funds lacking 10-year records). The fund’s performance information included in the line graph and table above is compared with a regulatory required index that represents an overall securities market (Regulatory Benchmark). In addition, the line graph and table may also include one or more indexes that more closely aligns to the fund's investment strategy (Strategy Benchmark(s)). Due to new SEC Rules on shareholder reporting the fund adopted a new broad-based securities market index, referred to as the Regulatory Benchmark. Market index returns do not include expenses, which are deducted from fund returns. The fund's total return figures reflect the reinvestment of dividends and capital gains, if any. Neither the fund’s returns nor the index returns reflect the deduction of taxes that a shareholder would pay on fund distributions or redemptions of fund shares. The fund’s past performance is not a good predictor of the fund’s future performance. Updated performance information can be found at www.troweprice.com.
What are some fund statistics?
| Total Net Assets (000s) | $474,187 |
| Number of Portfolio Holdings | 104 |
| Investment Advisory Fees Paid (000s) | $2,174 |
| Portfolio Turnover Rate | 87.0% |
What did the fund invest in?
Credit Quality Allocation* (as a % of Net Assets)
| BB Rated | 22.8% |
| B Rated | 48.9 |
| CCC Rated | 9.9 |
| Bank Debt | 13.5 |
| D Rated | 0.2 |
| Reserves | 4.7 |
*Credit ratings for the securities held in the Fund are provided by Moody’s, Standard & Poor’s, and Fitch and are converted to the Standard & Poor’s nomenclature. A rating of AAA represents the highest-rated securities, and a rating of D represents the lowest rated securities. When a rating is available from all three agencies, the median rating is used. If there are two ratings, the lower rating is used, and if only one rating is available, that rating is used. If a rating is not available, the security is classified as Not Rated. The rating of the underlying investment vehicle is used to determine the creditworthiness of credit default swaps and sovereign securities. The Fund is not rated by any agency.
Top Ten Holdings (as a % of Net Assets)
| Energy Transfer | 2.3% |
| Osaic Holdings | 2.3 |
| Aretec Group | 2.0 |
| Vistra | 2.0 |
| Victra Holdings | 1.9 |
| Six Flags Entertainment | 1.9 |
| Enbridge | 1.7 |
| Heartland Dental | 1.7 |
| Sigma Holdco | 1.6 |
| Civitas Resources | 1.5 |
If you invest directly with T. Rowe Price, you can elect to receive future shareholder reports or other important documents through electronic delivery by enrolling at www.troweprice.com/paperless. If you invest through a financial intermediary such as an investment advisor, a bank, retirement plan sponsor or a brokerage firm, please contact that organization and ask if it can provide electronic delivery.
Bloomberg and ICE do not accept any liability for any errors or omissions in the indexes or data, and hereby expressly disclaim all warranties of originality, accuracy, completeness, timeliness, merchantability and fitness for a particular purpose. No party may rely on any indexes or data contained in this communication. Visit www.troweprice.com/en/us/market-data-disclosures for additional legal notices & disclaimers.
U.S. High Yield Fund
Advisor Class (TUHAX)
T. Rowe Price Investment Services, Inc.
100 East Pratt Street
Baltimore, MD 21202
Annual Shareholder Report
May 31, 2024
This annual shareholder report contains important information about U.S. High Yield Fund (the "fund") for the period of June 1, 2023 to May 31, 2024. You can find the fund’s prospectus, financial information on Form N-CSR (which includes required tax information for dividends), holdings, proxy voting information, and other information atwww.troweprice.com/prospectus. You can also request this information without charge by contacting T. Rowe Price at 1-800-638-5660 or info@troweprice.com or contacting your intermediary.
What were the fund costs for the last year? (based on a hypothetical $10,000 investment)
| Costs of a $10,000 investment | Costs paid as a percentage of a $10,000 investment |
|---|
| U.S. High Yield Fund - I Class | $65 | 0.61% |
What drove fund performance during the past 12 months?
High yield bonds strongly advanced in the 12-month period ended May 31, 2024, as a pause in rate hikes, receding recession fears, healthy risk appetite, and favorable technical conditions—a pickup in primary issuance and improved market liquidity—supported performance.
Compared with the style-specific ICE BofA US High Yield Constrained Index, the fund’s strongest relative results were in the media, consumer goods, and services segments. By credit quality, our selection in the B and BB rating tiers provided meaningful relative contributions. Our underweight to BBs was also beneficial as lower qualities outperformed. The fund’s off-benchmark allocation to bank loans added relative value as they outperformed high yield bonds for the year.
Relative to the style-specific benchmark, the fund’s weakest results were in the capital goods, technology and electronic, and automotive industries. Our selection among CCC rated bonds also detracted. The fund’s cash position, necessary for liquidity purposes, held back relative gains in the strong performance environment.
The fund seeks total return and, secondarily, current income by investing primarily in U.S. below investment-grade corporate debt securities. We utilized the market’s rally to trim/exit names that we believed to be fully valued and redeployed proceeds into higher-conviction ideas, selectively taking advantage of stronger primary issuance. We expect more income-like returns from here given tight spread levels. We significantly increased the credit quality of the fund and sought to maintain a current yield advantage versus the index by exchanging lower-coupon COVID-era bonds for higher-coupon paper and increasing bank loan exposure.
How has the fund performed?
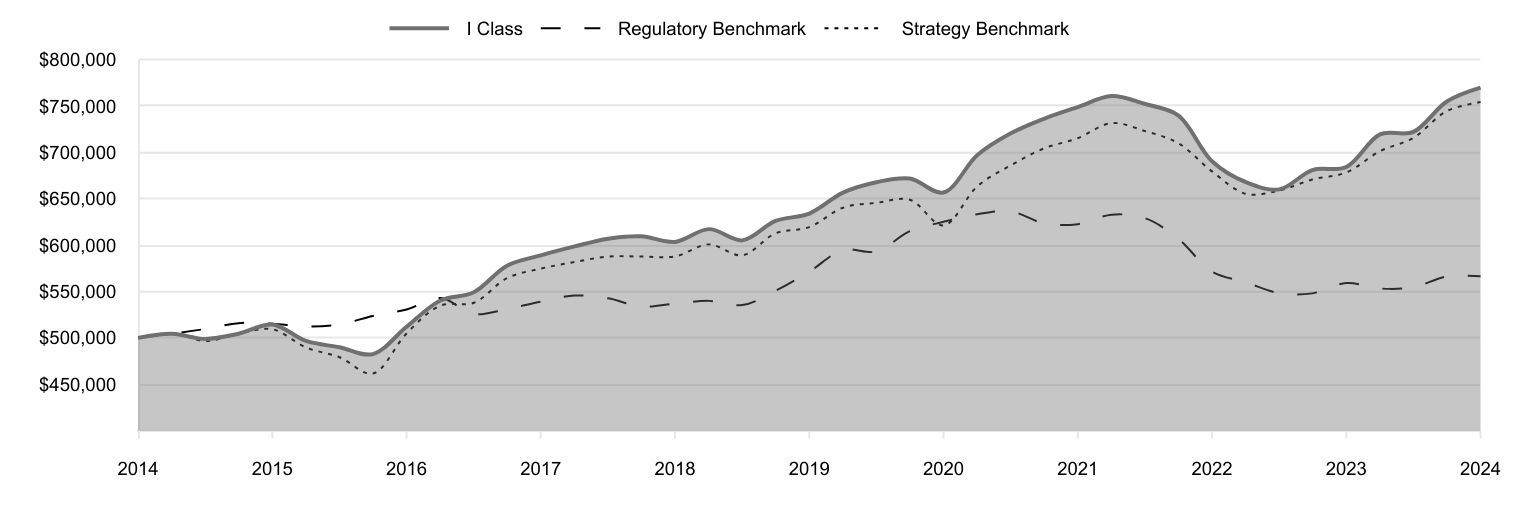
Cumulative Returns of a Hypothetical $500,000 Investment as of May 31, 2024
| I Class | Regulatory Benchmark | Strategy Benchmark |
|---|
| 2014 | 500,000 | 500,000 | 500,000 |
| 2014 | 504,483 | 504,512 | 505,175 |
| 2014 | 498,835 | 509,603 | 496,626 |
| 2015 | 504,448 | 515,879 | 504,434 |
| 2015 | 514,350 | 515,171 | 509,286 |
| 2015 | 496,715 | 512,359 | 489,630 |
| 2015 | 489,896 | 514,547 | 479,114 |
| 2016 | 482,542 | 523,631 | 461,513 |
| 2016 | 511,917 | 530,599 | 504,786 |
| 2016 | 540,269 | 542,926 | 534,798 |
| 2016 | 549,185 | 525,721 | 537,810 |
| 2017 | 577,867 | 531,041 | 564,408 |
| 2017 | 588,989 | 538,976 | 574,663 |
| 2017 | 598,563 | 545,600 | 581,766 |
| 2017 | 606,915 | 542,619 | 587,704 |
| 2018 | 609,489 | 533,724 | 587,666 |
| 2018 | 603,431 | 536,956 | 587,840 |
| 2018 | 617,210 | 539,875 | 600,781 |
| 2018 | 605,111 | 535,337 | 588,977 |
| 2019 | 626,055 | 550,642 | 612,690 |
| 2019 | 633,993 | 571,324 | 619,376 |
| 2019 | 656,606 | 594,794 | 640,301 |
| 2019 | 667,768 | 593,106 | 645,582 |
| 2020 | 671,801 | 614,971 | 648,889 |
| 2020 | 656,660 | 625,117 | 621,250 |
| 2020 | 697,127 | 633,297 | 663,480 |
| 2020 | 720,500 | 636,307 | 686,003 |
| 2021 | 736,167 | 623,480 | 704,219 |
| 2021 | 748,834 | 622,586 | 715,245 |
| 2021 | 760,649 | 632,763 | 731,542 |
| 2021 | 752,129 | 628,967 | 722,890 |
| 2022 | 739,817 | 606,994 | 709,880 |
| 2022 | 690,468 | 571,397 | 679,452 |
| 2022 | 667,883 | 559,895 | 655,227 |
| 2022 | 660,044 | 548,211 | 658,837 |
| 2023 | 680,912 | 547,983 | 670,764 |
| 2023 | 684,257 | 559,153 | 678,303 |
| 2023 | 719,315 | 553,214 | 701,268 |
| 2023 | 722,056 | 554,678 | 715,617 |
| 2024 | 754,829 | 566,215 | 744,365 |
| 2024 | 769,729 | 566,453 | 754,162 |
202405-3565004, 202407-3567727
Average Annual Total Returns
| 1 Year | 5 Years | 10 Years |
|---|
| U.S. High Yield Fund (I Class) | 12.49% | 3.96% | 4.41% |
| Bloomberg U.S. Aggregate Bond Index (Regulatory Benchmark) | 1.31 | | 1.26 |
| ICE BofA US High Yield Constrained Index (Strategy Benchmark) | 11.18 | 4.02 | 4.20 |
The preceding line graph shows the value of a hypothetical $500,000 investment in the fund over the past 10 fiscal year periods or since inception (for funds lacking 10-year records). The fund’s performance information included in the line graph and table above is compared with a regulatory required index that represents an overall securities market (Regulatory Benchmark). In addition, the line graph and table may also include one or more indexes that more closely aligns to the fund's investment strategy (Strategy Benchmark(s)). Due to new SEC Rules on shareholder reporting the fund adopted a new broad-based securities market index, referred to as the Regulatory Benchmark. Market index returns do not include expenses, which are deducted from fund returns. The fund's total return figures reflect the reinvestment of dividends and capital gains, if any. Neither the fund’s returns nor the index returns reflect the deduction of taxes that a shareholder would pay on fund distributions or redemptions of fund shares. The fund’s past performance is not a good predictor of the fund’s future performance. Updated performance information can be found at www.troweprice.com.
What are some fund statistics?
| Total Net Assets (000s) | $474,187 |
| Number of Portfolio Holdings | 104 |
| Investment Advisory Fees Paid (000s) | $2,174 |
| Portfolio Turnover Rate | 87.0% |
What did the fund invest in?
Credit Quality Allocation* (as a % of Net Assets)
| BB Rated | 22.8% |
| B Rated | 48.9 |
| CCC Rated | 9.9 |
| Bank Debt | 13.5 |
| D Rated | 0.2 |
| Reserves | 4.7 |
*Credit ratings for the securities held in the Fund are provided by Moody’s, Standard & Poor’s, and Fitch and are converted to the Standard & Poor’s nomenclature. A rating of AAA represents the highest-rated securities, and a rating of D represents the lowest rated securities. When a rating is available from all three agencies, the median rating is used. If there are two ratings, the lower rating is used, and if only one rating is available, that rating is used. If a rating is not available, the security is classified as Not Rated. The rating of the underlying investment vehicle is used to determine the creditworthiness of credit default swaps and sovereign securities. The Fund is not rated by any agency.
Top Ten Holdings (as a % of Net Assets)
| Energy Transfer | 2.3% |
| Osaic Holdings | 2.3 |
| Aretec Group | 2.0 |
| Vistra | 2.0 |
| Victra Holdings | 1.9 |
| Six Flags Entertainment | 1.9 |
| Enbridge | 1.7 |
| Heartland Dental | 1.7 |
| Sigma Holdco | 1.6 |
| Civitas Resources | 1.5 |
If you invest directly with T. Rowe Price, you can elect to receive future shareholder reports or other important documents through electronic delivery by enrolling at www.troweprice.com/paperless. If you invest through a financial intermediary such as an investment advisor, a bank, retirement plan sponsor or a brokerage firm, please contact that organization and ask if it can provide electronic delivery.
Bloomberg and ICE do not accept any liability for any errors or omissions in the indexes or data, and hereby expressly disclaim all warranties of originality, accuracy, completeness, timeliness, merchantability and fitness for a particular purpose. No party may rely on any indexes or data contained in this communication. Visit www.troweprice.com/en/us/market-data-disclosures for additional legal notices & disclaimers.
U.S. High Yield Fund
I Class (TUHIX)
T. Rowe Price Investment Services, Inc.
100 East Pratt Street
Baltimore, MD 21202
Item 1. (b) Notice pursuant to Rule 30e-3.
Not applicable.
Item 2. Code of Ethics.
The registrant has adopted a code of ethics, as defined in Item 2 of Form N-CSR, applicable to its principal executive officer, principal financial officer, principal accounting officer or controller, or persons performing similar functions. A copy of this code of ethics is filed as an exhibit to this Form N-CSR. No substantive amendments were approved or waivers were granted to this code of ethics during the period covered by this report.
Item 3. Audit Committee Financial Expert.
The registrant’s Board of Directors has determined that Mr. Paul F. McBride qualifies as an audit committee financial expert, as defined in Item 3 of Form N-CSR. Mr. McBride is considered independent for purposes of Item 3 of Form N-CSR.
Item 4. Principal Accountant Fees and Services.
(a) – (d) Aggregate fees billed for the last two fiscal years for professional services rendered to, or on behalf of, the registrant by the registrant’s principal accountant were as follows:
| | | | | | | | | | |
| | | | 2024 | | | 2023 | |
| | Audit Fees | | $ | 33,841 | | | $ | 33,192 | |
| | Audit-Related Fees | | | - | | | | - | |
| | Tax Fees | | | - | | | | - | |
| | All Other Fees | | | - | | | | - | |
Audit fees include amounts related to the audit of the registrant’s annual financial statements and services normally provided by the accountant in connection with statutory and regulatory filings. Audit-related fees include amounts reasonably related to the performance of the audit of the registrant’s financial statements and specifically include the issuance of a report on internal controls and, if applicable, agreed-upon procedures related to fund acquisitions. Tax fees include amounts related to services for tax compliance, tax planning, and tax advice. The nature of these services specifically includes the review of distribution calculations and the preparation of Federal, state, and excise tax returns. All other fees include the registrant’s pro-rata share of amounts for agreed-upon procedures in conjunction with service contract approvals by the registrant’s Board of Directors/Trustees.
(e)(1) The registrant’s audit committee has adopted a policy whereby audit and non-audit services performed by the registrant’s principal accountant for the registrant, its investment adviser, and any entity controlling, controlled by, or under common control with the investment adviser that provides ongoing services to the registrant require pre-approval in advance at regularly scheduled audit committee meetings. If such a service is required between regularly scheduled audit committee meetings, pre-approval may be authorized by one audit committee member with ratification at the next scheduled audit committee meeting. Waiver of pre-approval for audit or non-audit services requiring fees of a de minimis amount is not permitted.
(2) No services included in (b) – (d) above were approved pursuant to paragraph (c)(7)(i)(C) of Rule 2-01 of Regulation S-X.
(f) Less than 50 percent of the hours expended on the principal accountant’s engagement to audit the registrant’s financial statements for the most recent fiscal year were attributed to work performed by persons other than the principal accountant’s full-time, permanent employees.
(g) The aggregate fees billed for the most recent fiscal year and the preceding fiscal year by the registrant’s principal accountant for non-audit services rendered to the registrant, its investment adviser, and any entity controlling, controlled by, or under common control with the investment adviser that provides ongoing services to the registrant were $1,230,000 and $1,521,000, respectively.
(h) All non-audit services rendered in (g) above were pre-approved by the registrant’s audit committee. Accordingly, these services were considered by the registrant’s audit committee in maintaining the principal accountant’s independence.
(i) Not applicable.
(j) Not applicable.
Item 5. Audit Committee of Listed Registrants.
Not applicable.
Item 6. Investments.
(a) Not applicable. The complete schedule of investments is included in Item 7 of this Form N-CSR.
(b) Not applicable.
Item 7. Financial Statements and Financial Highlights for Open-End Management Investment Companies.
(a – b) Report pursuant to Regulation S-X.
Financial
Highlights
Portfolio
of
Investments
Financial
Statements
and
Notes
Additional
Fund
Information
Financial
Statements
and
Other
Information
For
more
insights
from
T.
Rowe
Price
investment
professionals,
go
to
troweprice.com
.
T.
ROWE
PRICE
TUHYX
U.S.
High
Yield
Fund
–
.
TUHAX
U.S.
High
Yield
Fund–
.
Advisor Class
TUHIX
U.S.
High
Yield
Fund–
.
I Class
T.
ROWE
PRICE
U.S.
High
Yield
Fund
Go
Paperless
Going
paperless
offers
a
host
of
benefits,
which
include:
Timely
delivery
of
important
documents
Convenient
access
to
your
documents
anytime,
anywhere
Strong
security
protocols
to
safeguard
sensitive
data
Waive
your
account
service
fee
by
going
paperless.*
To
Enroll:
˃
If
you
invest
directly
with
T.
Rowe
Price,
go
to
troweprice.com/paperless
.
If
you
invest
through
a
financial
intermediary
such
as
an
investment
advisor,
a
bank,
or
a
brokerage
firm,
please
contact
that
organization
and
ask
if
it
can
provide
electronic
documentation.
Log
in
to
your
account
at
troweprice.com
for
more
information.
*
An
account
service
fee
will
be
charged
annually
for
each
T.
Rowe
Price
mutual
fund
account
unless
you
meet
criteria
for
a
fee
waiver.
Go
to
troweprice.com/personal-investing/
help/fees-and-minimums.html
to
learn
more
about
this
account
service
fee,
including
other
ways
to
waive
it.
T.
ROWE
PRICE
U.S.
High
Yield
Fund
For
a
share
outstanding
throughout
each
period
Investor
Class
..
Year
..
..
Ended
.
5/31/24
5/31/23
5/31/22
5/31/21
5/31/20
NET
ASSET
VALUE
Beginning
of
period
$
8.02
$
8.73
$
10.11
$
9.39
$
9.61
Investment
activities
Net
investment
income
(1)(2)
0.62
0.60
0.55
0.56
0.55
Net
realized
and
unrealized
gain/loss
0.34
(0.71)
(1.30)
0.72
(0.22)
Total
from
investment
activities
0.96
(0.11)
(0.75)
1.28
0.33
Distributions
Net
investment
income
(0.63)
(0.60)
(0.55)
(0.56)
(0.55)
Net
realized
gain
—
—
(0.08)
—
—
Total
distributions
(0.63)
(0.60)
(0.63)
(0.56)
(0.55)
NET
ASSET
VALUE
End
of
period
$
8.35
$
8.02
$
8.73
$
10.11
$
9.39
T.
ROWE
PRICE
U.S.
High
Yield
Fund
For
a
share
outstanding
throughout
each
period
The
accompanying
notes
are
an
integral
part
of
these
financial
statements.
Investor
Class
..
Year
..
..
Ended
.
5/31/24
5/31/23
5/31/22
5/31/21
5/31/20
Ratios/Supplemental
Data
Total
return
(2)(3)
12.31%
(1.11)%
(7.87)%
13.94%
3.43%
Ratios
to
average
net
assets:
(2)
Gross
expenses
before
waivers/payments
by
Price
Associates
0.83%
0.87%
0.78%
0.79%
0.87%
Net
expenses
after
waivers/
payments
by
Price
Associates
0.75%
0.75%
0.77%
0.79%
0.79%
Net
investment
income
7.57%
7.34%
5.62%
5.60%
5.75%
Portfolio
turnover
rate
87.0%
31.6%
73.4%
135.3%
156.7%
Net
assets,
end
of
period
(in
thousands)
$254,953
$216,586
$266,157
$437,017
$276,480
0%
0%
0%
0%
0%
(1)
Per
share
amounts
calculated
using
average
shares
outstanding
method.
(2)
Includes
the
impact
of
expense-related
arrangements
with
Price
Associates.
(3)
Total
return
reflects
the
rate
that
an
investor
would
have
earned
on
an
investment
in
the
fund
during
each
period,
assuming
reinvestment
of
all
distributions,
and
payment
of
no
redemption
or
account
fees,
if
applicable.
T.
ROWE
PRICE
U.S.
High
Yield
Fund
For
a
share
outstanding
throughout
each
period
Advisor
Class
..
Year
..
..
Ended
.
5/31/24
5/31/23
5/31/22
5/31/21
5/31/20
NET
ASSET
VALUE
Beginning
of
period
$
8.01
$
8.71
$
10.10
$
9.38
$
9.61
Investment
activities
Net
investment
income
(1)(2)
0.61
0.58
0.54
0.55
0.54
Net
realized
and
unrealized
gain/loss
0.33
(0.70)
(1.31)
0.71
(0.24)
Total
from
investment
activities
0.94
(0.12)
(0.77)
1.26
0.30
Distributions
Net
investment
income
(0.61)
(0.58)
(0.54)
(0.54)
(0.53)
Net
realized
gain
—
—
(0.08)
—
—
Total
distributions
(0.61)
(0.58)
(0.62)
(0.54)
(0.53)
NET
ASSET
VALUE
End
of
period
$
8.34
$
8.01
$
8.71
$
10.10
$
9.38
T.
ROWE
PRICE
U.S.
High
Yield
Fund
For
a
share
outstanding
throughout
each
period
The
accompanying
notes
are
an
integral
part
of
these
financial
statements.
Advisor
Class
..
Year
..
..
Ended
.
5/31/24
5/31/23
5/31/22
5/31/21
5/31/20
Ratios/Supplemental
Data
Total
return
(2)(3)
12.14%
(1.16)%
(8.13)%
13.78%
3.17%
Ratios
to
average
net
assets:
(2)
Gross
expenses
before
waivers/payments
by
Price
Associates
1.13%
1.01%
0.99%
0.97%
0.98%
Net
expenses
after
waivers/
payments
by
Price
Associates
0.90%
0.90%
0.92%
0.94%
0.94%
Net
investment
income
7.43%
7.17%
5.49%
5.52%
5.60%
Portfolio
turnover
rate
87.0%
31.6%
73.4%
135.3%
156.7%
Net
assets,
end
of
period
(in
thousands)
$2,940
$4,178
$6,873
$13,815
$14,497
0%
0%
0%
0%
0%
(1)
Per
share
amounts
calculated
using
average
shares
outstanding
method.
(2)
Includes
the
impact
of
expense-related
arrangements
with
Price
Associates.
(3)
Total
return
reflects
the
rate
that
an
investor
would
have
earned
on
an
investment
in
the
fund
during
each
period,
assuming
reinvestment
of
all
distributions,
and
payment
of
no
redemption
or
account
fees,
if
applicable.
T.
ROWE
PRICE
U.S.
High
Yield
Fund
For
a
share
outstanding
throughout
each
period
I
Class
..
Year
..
..
Ended
.
5/31/24
5/31/23
5/31/22
5/31/21
5/31/20
NET
ASSET
VALUE
Beginning
of
period
$
7.98
$
8.68
$
10.06
$
9.35
$
9.57
Investment
activities
Net
investment
income
(1)(2)
0.63
0.61
0.57
0.57
0.56
Net
realized
and
unrealized
gain/loss
0.34
(0.70)
(1.31)
0.71
(0.22)
Total
from
investment
activities
0.97
(0.09)
(0.74)
1.28
0.34
Distributions
Net
investment
income
(0.64)
(0.61)
(0.56)
(0.57)
(0.56)
Net
realized
gain
—
—
(0.08)
—
—
Total
distributions
(0.64)
(0.61)
(0.64)
(0.57)
(0.56)
NET
ASSET
VALUE
End
of
period
$
8.31
$
7.98
$
8.68
$
10.06
$
9.35
T.
ROWE
PRICE
U.S.
High
Yield
Fund
For
a
share
outstanding
throughout
each
period
The
accompanying
notes
are
an
integral
part
of
these
financial
statements.
I
Class
..
Year
..
..
Ended
.
5/31/24
5/31/23
5/31/22
5/31/21
5/31/20
Ratios/Supplemental
Data
Total
return
(2)(3)
12.49%
(0.90)%
(7.79)%
14.04%
3.58%
Ratios
to
average
net
assets:
(2)
Gross
expenses
before
waivers/payments
by
Price
Associates
0.67%
0.69%
0.65%
0.68%
0.72%
Net
expenses
after
waivers/
payments
by
Price
Associates
0.61%
0.61%
0.61%
0.63%
0.64%
Net
investment
income
7.71%
7.49%
6.04%
5.78%
5.86%
Portfolio
turnover
rate
87.0%
31.6%
73.4%
135.3%
156.7%
Net
assets,
end
of
period
(in
thousands)
$216,294
$191,390
$228,946
$55,120
$44,469
0%
0%
0%
0%
0%
(1)
Per
share
amounts
calculated
using
average
shares
outstanding
method.
(2)
Includes
the
impact
of
expense-related
arrangements
with
Price
Associates.
(3)
Total
return
reflects
the
rate
that
an
investor
would
have
earned
on
an
investment
in
the
fund
during
each
period,
assuming
reinvestment
of
all
distributions,
and
payment
of
no
redemption
or
account
fees,
if
applicable.
T.
ROWE
PRICE
U.S.
High
Yield
Fund
May
31,
2024
Par/Shares
$
Value
(Amounts
in
000s)
‡
BANK
LOANS
13.5%
(1)
Consumer
Goods
2.0%
Journey
Personal
Care,
FRN,
3M
TSFR
+
4.25%,
9.694%,
3/1/28
4,874
4,853
Naked
Juice,
FRN,
3M
TSFR
+
6.00%,
11.402%,
1/24/30
5,596
4,678
9,531
Energy
0.8%
GIP
III
Stetson
I,
FRN,
1M
TSFR
+
3.50%,
8.829%,
10/31/28
3,931
3,947
3,947
Financial
Services
0.5%
Osaic
Holdings,
FRN,
1M
TSFR
+
4.00%,
9.329%,
8/17/28
2,291
2,308
2,308
Health
Care
1.5%
Endo
Finance
Holdings,
FRN,
1M
TSFR
+
4.50%,
9.826%,
4/23/31
2,340
2,337
Surgery
Center
Holdings,
FRN,
1M
TSFR
+
3.50%,
8.821%,
12/5/30
4,440
4,459
6,796
Leisure
1.5%
Caesars
Entertainment,
FRN,
1M
TSFR
+
2.75%,
8.097%,
2/6/31
5,880
5,889
Life
Time,
FRN,
1M
TSFR
+
4.00%,
9.591%,
1/15/26
1,095
1,099
6,988
Media
1.0%
Magnite,
FRN,
1M
TSFR
+
4.50%,
9.793%,
2/6/31
4,590
4,616
4,616
Retail
0.6%
Victra
Holdings,
FRN,
3M
TSFR
+
6.50%,
11.829%,
3/31/29 (2)
(3)
2,952
2,996
2,996
Services
1.7%
KNS
Midco,
FRN,
1M
TSFR
+
6.25%,
11.694%,
4/21/27
4,002
3,432
Vestis,
FRN,
1M
TSFR
+
2.25%,
7.577%,
2/22/31
4,750
4,729
8,161
Technology
&
Electronics
2.0%
Applied
Systems,
FRN,
1M
TSFR
+
3.50%,
8.809%,
2/24/31
4,755
4,793
UKG,
FRN,
1M
TSFR
+
3.50%,
8.82%,
2/10/31
4,745
4,779
9,572
Transportation
1.9%
Mileage
Plus
Holdings,
FRN,
3M
TSFR
+
5.25%,
10.733%,
6/21/27
3,567
3,646
T.
ROWE
PRICE
U.S.
High
Yield
Fund
Par/Shares
$
Value
(Amounts
in
000s)
‡
WestJet
Loyalty,
FRN,
1M
TSFR
+
3.75%,
9.052%,
2/14/31
5,390
5,416
9,062
Total
Bank
Loans
(Cost
$64,683)
63,977
CORPORATE
BONDS
81.2%
Automotive
2.8%
Adient
Global
Holdings,
4.875%,
8/15/26 (4)
1,512
1,465
Adient
Global
Holdings,
8.25%,
4/15/31 (4)
1,005
1,045
Aston
Martin
Capital
Holdings,
10.00%,
3/31/29 (4)
4,848
4,666
Clarios
Global,
8.50%,
5/15/27 (4)
4,835
4,853
Jaguar
Land
Rover
Automotive,
5.50%,
7/15/29 (4)
1,045
992
13,021
Basic
Industry
5.5%
Camelot
Return
Merger
Sub,
8.75%,
8/1/28 (4)
4,455
4,399
ERO
Copper,
6.50%,
2/15/30 (4)
5,075
4,917
First
Quantum
Minerals,
6.875%,
10/15/27 (4)
4,575
4,508
LGI
Homes,
8.75%,
12/15/28 (4)
4,425
4,569
Miter
Brands
Acquisition
Holdco,
6.75%,
4/1/32 (4)
2,015
1,992
White
Cap
Parent,
(8.250%
Cash
or
9.00%
PIK),
8.25%,
3/15/26 (4)(5)
5,760
5,688
26,073
Capital
Goods
4.6%
AAR
Escrow
Issuer,
6.75%,
3/15/29 (4)
4,815
4,869
Bombardier,
7.25%,
7/1/31 (4)
4,645
4,715
GrafTech
Finance,
4.625%,
12/15/28 (4)
2,220
1,438
GrafTech
Global
Enterprises,
9.875%,
12/15/28 (4)
2,177
1,638
TransDigm,
6.75%,
8/15/28 (4)
4,570
4,621
Trivium
Packaging
Finance,
8.50%,
8/15/27 (4)
4,670
4,664
21,945
Consumer
Goods
3.4%
Coty,
6.625%,
7/15/30 (4)
4,653
4,688
HLF
Financing,
12.25%,
4/15/29 (4)
3,774
3,708
Sigma
Holdco,
7.875%,
5/15/26 (4)
8,013
7,793
16,189
Energy
19.1%
Ascent
Resources
Utica
Holdings,
8.25%,
12/31/28 (4)
4,505
4,584
Civitas
Resources,
8.75%,
7/1/31 (4)
6,490
6,912
Comstock
Resources,
6.75%,
3/1/29 (4)
5,175
4,994
CVR
Energy,
8.50%,
1/15/29 (4)
5,005
5,024
Enbridge,
Series NC5,
VR,
8.25%,
1/15/84 (6)
7,920
8,196
Encino
Acquisition
Partners
Holdings,
8.75%,
5/1/31 (4)
4,805
4,943
Energy
Transfer,
VR,
8.00%,
5/15/54 (6)
5,075
5,286
T.
ROWE
PRICE
U.S.
High
Yield
Fund
Par/Shares
$
Value
(Amounts
in
000s)
‡
Energy
Transfer,
Series F,
VR,
6.75% (6)(7)
760
748
Energy
Transfer,
Series H,
VR,
6.50% (6)(7)
5,090
4,982
Harvest
Midstream
I,
7.50%,
9/1/28 (4)
2,540
2,569
Howard
Midstream
Energy
Partners,
6.75%,
1/15/27 (4)
4,655
4,649
Kinetik
Holdings,
6.625%,
12/15/28 (4)
4,620
4,655
Matador
Resources,
6.50%,
4/15/32 (4)
4,845
4,821
NGL
Energy
Operating,
8.125%,
2/15/29 (4)
4,825
4,909
PBF
Holding,
7.875%,
9/15/30 (4)
4,740
4,852
Permian
Resources
Operating,
7.00%,
1/15/32 (4)
4,650
4,737
Sunoco,
7.00%,
5/1/29 (4)
4,725
4,808
Tallgrass
Energy
Partners,
7.375%,
2/15/29 (4)
4,125
4,135
Weatherford
International,
8.625%,
4/30/30 (4)
4,503
4,655
90,459
Financial
Services
10.2%
Aretec
Group,
10.00%,
8/15/30 (4)
8,730
9,527
Credit
Acceptance,
9.25%,
12/15/28 (4)
5,010
5,273
Encore
Capital
Group,
9.25%,
4/1/29 (4)
4,835
5,028
FirstCash,
6.875%,
3/1/32 (4)
4,893
4,838
OneMain
Finance,
7.875%,
3/15/30
4,850
4,941
Osaic
Holdings,
10.75%,
8/1/27 (4)
8,275
8,513
PennyMac
Financial
Services,
7.875%,
12/15/29 (4)
5,047
5,167
PRA
Group,
8.375%,
2/1/28 (4)
4,855
4,812
48,099
Health
Care
5.3%
CHS,
8.00%,
3/15/26 (4)
2,496
2,502
CHS,
8.00%,
12/15/27 (4)
3,125
3,110
Endo
Finance
Holdings,
8.50%,
4/15/31 (4)
2,410
2,461
Heartland
Dental,
10.50%,
4/30/28 (4)
7,528
8,008
IQVIA,
6.50%,
5/15/30 (4)
4,810
4,846
Tenet
Healthcare,
6.25%,
2/1/27
4,366
4,355
25,282
Insurance
2.0%
Alliant
Holdings
Intermediate,
7.00%,
1/15/31 (4)
4,660
4,672
Panther
Escrow
Issuer,
7.125%,
6/1/31 (4)
4,800
4,830
9,502
Leisure
5.6%
Carnival,
6.00%,
5/1/29 (4)
4,690
4,567
Carnival
Holdings
Bermuda,
10.375%,
5/1/28 (4)
4,265
4,601
Life
Time,
5.75%,
1/15/26 (4)
3,674
3,651
NCL,
8.375%,
2/1/28 (4)
4,395
4,582
Six
Flags
Entertainment,
7.25%,
5/15/31 (4)
8,978
8,933
26,334
T.
ROWE
PRICE
U.S.
High
Yield
Fund
Par/Shares
$
Value
(Amounts
in
000s)
‡
Media
2.9%
CCO
Holdings,
4.50%,
5/1/32
5,950
4,700
DISH
Network,
11.75%,
11/15/27 (4)
4,406
4,406
Outfront
Media
Capital,
7.375%,
2/15/31 (4)
4,665
4,817
13,923
Real
Estate
1.0%
Brookfield
Property
REIT,
4.50%,
4/1/27 (4)
5,315
4,910
4,910
Retail
2.9%
Cougar
JV
Subsidiary,
8.00%,
5/15/32 (4)
2,760
2,843
eG
Global
Finance,
12.00%,
11/30/28 (4)
4,605
4,749
Victra
Holdings,
7.75%,
2/15/26 (4)
6,067
5,991
13,583
Services
4.0%
Avis
Budget
Car
Rental,
8.00%,
2/15/31 (4)
4,845
4,772
Ritchie
Bros
Holdings,
6.75%,
3/15/28 (4)
2,475
2,500
Ritchie
Bros
Holdings,
7.75%,
3/15/31 (4)
2,045
2,129
Sabre
GLBL,
11.25%,
12/15/27 (4)
5,060
4,921
Williams
Scotsman,
7.375%,
10/1/31 (4)
4,565
4,685
19,007
Technology
&
Electronics
3.9%
Cloud
Software
Group,
8.25%,
6/30/32 (4)
4,820
4,844
McAfee,
7.375%,
2/15/30 (4)
4,825
4,469
Open
Text,
6.90%,
12/1/27 (4)
4,571
4,674
Seagate
HDD
Cayman,
8.25%,
12/15/29 (4)
2,285
2,445
Seagate
HDD
Cayman,
8.50%,
7/15/31 (4)
1,970
2,093
18,525
Telecommunications
2.0%
Level
3
Financing,
10.50%,
4/15/29 (4)
4,645
4,633
Telesat
Canada,
6.50%,
10/15/27 (4)
4,080
1,183
Viasat,
6.50%,
7/15/28 (4)
5,050
3,712
9,528
Transportation
1.9%
American
Airlines,
5.75%,
4/20/29 (4)
4,855
4,685
VistaJet
Malta
Finance,
6.375%,
2/1/30 (4)
4,130
3,314
VistaJet
Malta
Finance,
9.50%,
6/1/28 (4)
1,055
960
8,959
Utility
4.1%
NRG
Energy,
VR,
10.25% (4)(6)(7)
4,730
5,144
Talen
Energy
Supply,
8.625%,
6/1/30 (4)
4,635
4,971
T.
ROWE
PRICE
U.S.
High
Yield
Fund
Par/Shares
$
Value
(Amounts
in
000s)
‡
Vistra,
VR,
8.00% (4)(6)(7)
9,286
9,379
19,494
Total
Corporate
Bonds
(Cost
$386,117)
384,833
PREFERRED
STOCKS
0.6%
Financial
Services
0.6%
Osaic
Financial
Services,
6.50%,
11/30/27
152
2,955
Total
Preferred
Stocks
(Cost
$2,727)
2,955
SHORT-TERM
INVESTMENTS
2.2%
Money
Market
Funds
2.2%
T.
Rowe
Price
Government
Reserve
Fund,
5.39% (8)(9)
10,444
10,444
Total
Short-Term
Investments
(Cost
$10,444)
10,444
Total
Investments
in
Securities
97.5%
of
Net
Assets
(Cost
$463,971)
$
462,209
T.
ROWE
PRICE
U.S.
High
Yield
Fund
‡
Par/Shares
are
denominated
in
U.S.
dollars
unless
otherwise
noted.
(1)
Bank
loan
positions
may
involve
multiple
underlying
tranches.
In
those
instances,
the
position
presented
reflects
the
aggregate
of
those
respective
underlying
tranches
and
the
rate
presented
reflects
the
weighted
average
rate
of
the
settled
positions.
(2)
All
or
a
portion
of
this
loan
is
unsettled
as
of
May
31,
2024.
The
interest
rate
for
unsettled
loans
will
be
determined
upon
settlement
after
period
end.
(3)
See
Note
2.
Level
3
in
fair
value
hierarchy.
(4)
Security
was
purchased
pursuant
to
Rule
144A
under
the
Securities
Act
of
1933
and
may
be
resold
in
transactions
exempt
from
registration
only
to
qualified
institutional
buyers.
Total
value
of
such
securities
at
period-end
amounts
to
$351,625
and
represents
74.2%
of
net
assets.
(5)
Security
has
the
ability
to
pay
in-kind
or
pay
in
cash.
When
applicable,
separate
rates
of
such
payments
are
disclosed.
(6)
Security
is
a
fix-to-float
security,
which
carries
a
fixed
coupon
until
a
certain
date,
upon
which
it
switches
to
a
floating
rate.
Reference
rate
and
spread
are
provided
if
the
rate
is
currently
floating.
(7)
Perpetual
security
with
no
stated
maturity
date.
(8)
Seven-day
yield
(9)
Affiliated
Companies
1M
TSFR
One
month
term
SOFR
(Secured
overnight
financing
rate)
3M
TSFR
Three
month
term
SOFR
(Secured
overnight
financing
rate)
FRN
Floating
Rate
Note
PIK
Payment-in-kind
VR
Variable
Rate;
rate
shown
is
effective
rate
at
period-end.
The
rates
for
certain
variable
rate
securities
are
not
based
on
a
published
reference
rate
and
spread
but
are
determined
by
the
issuer
or
agent
and
based
on
current
market
conditions.
T.
ROWE
PRICE
U.S.
High
Yield
Fund
The
accompanying
notes
are
an
integral
part
of
these
financial
statements.
AFFILIATED
COMPANIES
($000s)
The
fund
may
invest
in
certain
securities
that
are
considered
affiliated
companies.
As
defined
by
the
1940
Act,
an
affiliated
company
is
one
in
which
the
fund
owns
5%
or
more
of
the
outstanding
voting
securities,
or
a
company
that
is
under
common
ownership
or
control.
The
following
securities
were
considered
affiliated
companies
for
all
or
some
portion
of
the
year
ended
May
31,
2024.
Net
realized
gain
(loss),
investment
income,
change
in
net
unrealized
gain/loss,
and
purchase
and
sales
cost
reflect
all
activity
for
the
period
then
ended.
Affiliate
Net
Realized
Gain
(Loss)
Change
in
Net
Unrealized
Gain/Loss
Investment
Income
T.
Rowe
Price
Government
Reserve
Fund,
5.39%
$
—#
$
—
$
1,134+
Supplementary
Investment
Schedule
Affiliate
Value
05/31/23
Purchase
Cost
Sales
Cost
Value
05/31/24
T.
Rowe
Price
Government
Reserve
Fund,
5.39%
$
10,724
¤
¤
$
10,444^
#
Capital
gain
distributions
from
underlying
Price
funds
represented
$0
of
the
net
realized
gain
(loss).
+
Investment
income
comprised
$1,134
of
dividend
income
and
$0
of
interest
income.
¤
Purchase
and
sale
information
not
shown
for
cash
management
funds.
^
The
cost
basis
of
investments
in
affiliated
companies
was
$10,444.
T.
ROWE
PRICE
U.S.
High
Yield
Fund
May
31,
2024
Statement
of
Assets
and
Liabilities
($000s,
except
shares
and
per
share
amounts)
Assets
Investments
in
securities,
at
value
(cost
$463,971)
$
462,209
Interest
receivable
7,792
Receivable
for
investment
securities
sold
6,348
Receivable
for
shares
sold
184
Cash
115
Other
assets
50
Total
assets
476,698
Liabilities
Payable
for
investment
securities
purchased
1,230
Payable
for
shares
redeemed
801
Investment
management
fees
payable
221
Due
to
affiliates
16
Other
liabilities
243
Total
liabilities
2,511
Commitments
and
Contingent
Liabilities
(note
5
)
NET
ASSETS
$
474,187
T.
ROWE
PRICE
U.S.
High
Yield
Fund
May
31,
2024
Statement
of
Assets
and
Liabilities
($000s,
except
shares
and
per
share
amounts)
The
accompanying
notes
are
an
integral
part
of
these
financial
statements.
Net
Assets
Consist
of:
Total
distributable
earnings
(loss)
$
(93,877)
Paid-in
capital
applicable
to
56,920,371
shares
of
$0.01
par
value
capital
stock
outstanding;
3,000,000,000
shares
of
the
Corporation
authorized
568,064
NET
ASSETS
$
474,187
NET
ASSET
VALUE
PER
SHARE
Investor
Class
(Net
assets:
$254,953;
Shares
outstanding:
30,526,574)
$
8.35
Advisor
Class
(Net
assets:
$2,940;
Shares
outstanding:
352,428)
$
8.34
I
Class
(Net
assets:
$216,294;
Shares
outstanding:
26,041,369)
$
8.31
T.
ROWE
PRICE
U.S.
High
Yield
Fund
Year
Ended
5/31/24
Investment
Income
(Loss)
Income
Interest
$
36,128
Dividend
1,194
Other
1
Total
income
37,323
Expenses
Investment
management
2,492
Shareholder
servicing
Investor
Class
$
437
Advisor
Class
9
I
Class
76
522
Rule
12b-1
fees
Advisor
Class
10
Prospectus
and
shareholder
reports
Investor
Class
35
Advisor
Class
1
I
Class
10
46
Custody
and
accounting
179
Registration
80
Legal
and
audit
39
Proxy
and
annual
meeting
10
Directors
2
Miscellaneous
26
Waived
/
paid
by
Price
Associates
(318)
Total
expenses
3,088
Net
investment
income
34,235
T.
ROWE
PRICE
U.S.
High
Yield
Fund
The
accompanying
notes
are
an
integral
part
of
these
financial
statements.
Year
Ended
5/31/24
Realized
and
Unrealized
Gain
/
Loss
–
Net
realized
loss
on
securities
(49,215)
Change
in
net
unrealized
gain
/
loss
Securities
66,317
Other
assets
and
liabilities
denominated
in
foreign
currencies
5
Change
in
net
unrealized
gain
/
loss
66,322
Net
realized
and
unrealized
gain
/
loss
17,107
INCREASE
IN
NET
ASSETS
FROM
OPERATIONS
$
51,342
T.
ROWE
PRICE
U.S.
High
Yield
Fund
Statement
of
Changes
in
Net
Assets
.
Year
.
.
.
.
.
.
.
.
.
.
.
.
.
.
Ended
.
.
.
.
.
.
.
.
.
.
.
.
.
.
5/31/24
5/31/23
Increase
(Decrease)
in
Net
Assets
Operations
Net
investment
income
$
34,235
$
32,596
Net
realized
loss
(49,215)
(35,410)
Change
in
net
unrealized
gain
/
loss
66,322
(4,990)
Increase
(decrease)
in
net
assets
from
operations
51,342
(7,804)
Distributions
to
shareholders
Net
earnings
Investor
Class
(18,275)
(16,896)
Advisor
Class
(295)
(393)
I
Class
(15,665)
(15,194)
Decrease
in
net
assets
from
distributions
(34,235)
(32,483)
Capital
share
transactions
*
Shares
sold
Investor
Class
118,318
104,416
Advisor
Class
888
852
I
Class
64,814
58,729
Distributions
reinvested
Investor
Class
17,412
15,963
Advisor
Class
295
392
I
Class
13,121
12,773
Shares
redeemed
Investor
Class
(106,516)
(148,928)
Advisor
Class
(2,601)
(3,398)
I
Class
(60,805)
(90,334)
Increase
(decrease)
in
net
assets
from
capital
share
transactions
44,926
(49,535)
T.
ROWE
PRICE
U.S.
High
Yield
Fund
Statement
of
Changes
in
Net
Assets
The
accompanying
notes
are
an
integral
part
of
these
financial
statements.
Year
.
.
.
.
.
.
.
.
.
.
.
.
.
.
Ended
.
.
.
.
.
.
.
.
.
.
.
.
.
.
5/31/24
5/31/23
Net
Assets
Increase
(decrease)
during
period
62,033
(89,822)
Beginning
of
period
412,154
501,976
End
of
period
$
474,187
$
412,154
*Share
information
(000s)
Shares
sold
Investor
Class
14,322
12,826
Advisor
Class
109
104
I
Class
7,896
7,195
Distributions
reinvested
Investor
Class
2,110
1,973
Advisor
Class
36
48
I
Class
1,599
1,587
Shares
redeemed
Investor
Class
(12,904)
(18,305)
Advisor
Class
(314)
(420)
I
Class
(7,444)
(11,177)
Increase
(decrease)
in
shares
outstanding
5,410
(6,169)
T.
ROWE
PRICE
U.S.
High
Yield
Fund
NOTES
TO
FINANCIAL
STATEMENTS
T.
Rowe
Price
High
Yield
Fund,
Inc. (the
corporation) is
registered
under
the
Investment
Company
Act
of
1940
(the
1940
Act).
The
U.S.
High
Yield
Fund
(the
fund)
is a
diversified, open-end
management
investment
company
established
by
the
corporation.
The
fund
seeks
total
return,
and
secondarily,
current
income.
The
fund
has three classes
of
shares:
the
U.S.
High
Yield
Fund
(Investor
Class),
the
U.S.
High
Yield
Fund–Advisor
Class
(Advisor
Class)
and
the
U.S.
High
Yield
Fund–I
Class
(I
Class).
Advisor
Class
shares
are
sold
only
through
various
brokers
and
other
financial
intermediaries.
I
Class
shares
require
a
$500,000
initial
investment
minimum,
although
the
minimum
generally
is
waived
or
reduced
for
financial
intermediaries,
eligible
retirement
plans,
and
certain
other
accounts.
The
Advisor
Class
operates
under
a
Board-approved
Rule
12b-1
plan
pursuant
to
which
the
class
compensates
financial
intermediaries
for
distribution,
shareholder
servicing,
and/or
certain
administrative
services;
the
Investor
and
I
Classes
do
not
pay
Rule
12b-1
fees. Each
class
has
exclusive
voting
rights
on
matters
related
solely
to
that
class;
separate
voting
rights
on
matters
that
relate
to
all
classes;
and,
in
all
other
respects,
the
same
rights
and
obligations
as
the
other
classes.
NOTE
1
-
SIGNIFICANT
ACCOUNTING
POLICIES
Basis
of
Preparation
The fund
is
an
investment
company
and
follows
accounting
and
reporting
guidance
in
the
Financial
Accounting
Standards
Board
(FASB)
Accounting
Standards
Codification
Topic
946
(ASC
946).
The
accompanying
financial
statements
were
prepared
in
accordance
with
accounting
principles
generally
accepted
in
the
United
States
of
America
(GAAP),
including,
but
not
limited
to,
ASC
946.
GAAP
requires
the
use
of
estimates
made
by
management.
Management
believes
that
estimates
and
valuations
are
appropriate;
however,
actual
results
may
differ
from
those
estimates,
and
the
valuations
reflected
in
the
accompanying
financial
statements
may
differ
from
the
value
ultimately
realized
upon
sale
or
maturity.
Investment
Transactions,
Investment
Income,
and
Distributions
Investment
transactions
are
accounted
for
on
the
trade
date
basis.
Income
and
expenses
are
recorded
on
the
accrual
basis.
Realized
gains
and
losses
are
reported
on
the
identified
cost
basis. Premiums
and
discounts
on
debt
securities
are
amortized
for
financial
reporting
purposes. Income
tax-related
interest
and
penalties,
if
incurred,
are
recorded
as
income
tax
expense. Dividends
received
from other
investment
companies are
reflected
as
dividend income;
capital
gain
T.
ROWE
PRICE
U.S.
High
Yield
Fund
distributions
are
reflected
as
realized
gain/loss. Dividend
income and
capital
gain
distributions
are
recorded
on
the
ex-dividend
date. Non-cash
dividends,
if
any,
are
recorded
at
the
fair
market
value
of
the
asset
received. Proceeds
from
litigation
payments,
if
any,
are
included
in
either
net
realized
gain
(loss)
or
change
in
net
unrealized
gain/loss
from
securities. Distributions
to
shareholders
are
recorded
on
the
ex-dividend
date. Income
distributions,
if
any, are
declared
by
each
class daily
and
paid
monthly. A
capital
gain
distribution,
if
any, may
also
be
declared
and
paid
by
the
fund
annually.
Currency
Translation
Assets,
including
investments,
and
liabilities
denominated
in
foreign
currencies
are
translated
into
U.S.
dollar
values
each
day
at
the
prevailing
exchange
rate,
using
the
mean
of
the
bid
and
asked
prices
of
such
currencies
against
U.S.
dollars
as
provided
by
an
outside
pricing
service.
Purchases
and
sales
of
securities,
income,
and
expenses
are
translated
into
U.S.
dollars
at
the
prevailing
exchange
rate
on
the
respective
date
of
such
transaction.
The
effect
of
changes
in
foreign
currency
exchange
rates
on
realized
and
unrealized
security
gains
and
losses
is
not
bifurcated
from
the
portion
attributable
to
changes
in
market
prices.
Class
Accounting
Shareholder
servicing,
prospectus,
and
shareholder
report
expenses
incurred
by
each
class
are
charged
directly
to
the
class
to
which
they
relate.
Expenses
common
to
all
classes
and
investment
income
are
allocated
to
the
classes
based
upon
the
relative
daily
net
assets
of
each
class’s
settled
shares;
realized
and
unrealized
gains
and
losses
are
allocated
based
upon
the
relative
daily
net
assets
of
each
class’s
outstanding
shares.
The
Advisor
Class
pays
Rule
12b-1
fees,
in
an
amount
not
exceeding
0.25%
of
the
class’s
average
daily
net
assets.
Capital
Transactions
Each
investor’s
interest
in
the
net
assets
of the
fund
is
represented
by
fund
shares. The
fund’s
net
asset
value
(NAV)
per
share
is
computed
at
the
close
of
the
New
York
Stock
Exchange
(NYSE),
normally
4
p.m.
ET,
each
day
the
NYSE
is
open
for
business.
However,
the
NAV
per
share
may
be
calculated
at
a
time
other
than
the
normal
close
of
the
NYSE
if
trading
on
the
NYSE
is
restricted,
if
the
NYSE
closes
earlier,
or
as
may
be
permitted
by
the
SEC.
Purchases
and
redemptions
of
fund
shares
are
transacted
at
the
next-computed
NAV
per
share,
after
receipt
of
the
transaction
order
by
T.
Rowe
Price
Associates,
Inc.,
or
its
agents.
T.
ROWE
PRICE
U.S.
High
Yield
Fund
Indemnification
In
the
normal
course
of
business, the
fund
may
provide
indemnification
in
connection
with
its
officers
and
directors,
service
providers,
and/or
private
company
investments. The
fund’s
maximum
exposure
under
these
arrangements
is
unknown;
however,
the
risk
of
material
loss
is
currently
considered
to
be
remote.
NOTE
2
-
VALUATION
Fair
Value
The
fund’s
financial
instruments
are
valued
at
the
close
of
the
NYSE
and
are
reported
at
fair
value,
which
GAAP
defines
as
the
price
that
would
be
received
to
sell
an
asset
or
paid
to
transfer
a
liability
in
an
orderly
transaction
between
market
participants
at
the
measurement
date. The fund’s
Board
of
Directors
(the
Board)
has
designated
T.
Rowe
Price
Associates,
Inc.
as
the
fund’s
valuation
designee
(Valuation
Designee).
Subject
to
oversight
by
the
Board,
the
Valuation
Designee
performs
the
following
functions
in
performing
fair
value
determinations:
assesses
and
manages
valuation
risks;
establishes
and
applies
fair
value
methodologies;
tests
fair
value
methodologies;
and
evaluates
pricing
vendors
and
pricing
agents.
The
duties
and
responsibilities
of
the
Valuation
Designee
are
performed
by
its
Valuation
Committee. The
Valuation
Designee provides
periodic
reporting
to
the
Board
on
valuation
matters.
Various
valuation
techniques
and
inputs
are
used
to
determine
the
fair
value
of
financial
instruments.
GAAP
establishes
the
following
fair
value
hierarchy
that
categorizes
the
inputs
used
to
measure
fair
value:
Level
1
–
quoted
prices
(unadjusted)
in
active
markets
for
identical
financial
instruments
that
the
fund
can
access
at
the
reporting
date
Level
2
–
inputs
other
than
Level
1
quoted
prices
that
are
observable,
either
directly
or
indirectly
(including,
but
not
limited
to,
quoted
prices
for
similar
financial
instruments
in
active
markets,
quoted
prices
for
identical
or
similar
financial
instruments
in
inactive
markets,
interest
rates
and
yield
curves,
implied
volatilities,
and
credit
spreads)
Level
3
–
unobservable
inputs
(including
the Valuation
Designee’s assumptions
in
determining
fair
value)
Observable
inputs
are
developed
using
market
data,
such
as
publicly
available
information
about
actual
events
or
transactions,
and
reflect
the
assumptions
that
market
participants
would
use
to
price
the
financial
instrument.
Unobservable
inputs
are
those
for
which
market
data
are
not
available
and
are
developed
T.
ROWE
PRICE
U.S.
High
Yield
Fund
using
the
best
information
available
about
the
assumptions
that
market
participants
would
use
to
price
the
financial
instrument.
GAAP
requires
valuation
techniques
to
maximize
the
use
of
relevant
observable
inputs
and
minimize
the
use
of
unobservable
inputs.
When
multiple
inputs
are
used
to
derive
fair
value,
the
financial
instrument
is
assigned
to
the
level
within
the
fair
value
hierarchy
based
on
the
lowest-level
input
that
is
significant
to
the
fair
value
of
the
financial
instrument.
Input
levels
are
not
necessarily
an
indication
of
the
risk
or
liquidity
associated
with
financial
instruments
at
that
level
but
rather
the
degree
of
judgment
used
in
determining
those
values.
Valuation
Techniques
Debt
securities
generally
are
traded
in
the over-the-
counter
(OTC)
market
and
are
valued
at
prices
furnished
by
independent
pricing
services
or
by
broker
dealers
who
make
markets
in
such
securities.
When
valuing
securities,
the
independent
pricing
services
consider
factors
such
as,
but
not
limited
to,
the
yield
or
price
of
bonds
of
comparable
quality,
coupon,
maturity,
and
type,
as
well
as
prices
quoted
by
dealers
who
make
markets
in
such
securities.
Equity
securities,
including
exchange-traded
funds, listed
or
regularly
traded
on
a
securities
exchange
or
in
the
over-the-counter
(OTC)
market
are
valued
at
the
last
quoted
sale
price
or,
for
certain
markets,
the
official
closing
price
at
the
time
the
valuations
are
made.
OTC
Bulletin
Board
securities
are
valued
at
the
mean
of
the
closing
bid
and
asked
prices.
A
security
that
is
listed
or
traded
on
more
than
one
exchange
is
valued
at
the
quotation
on
the
exchange
determined
to
be
the
primary
market
for
such
security.
Listed
securities
not
traded
on
a
particular
day
are
valued
at
the
mean
of
the
closing
bid
and
asked
prices
for
domestic
securities.
Investments
in
mutual
funds
are
valued
at
the
mutual
fund’s
closing
NAV
per
share
on
the
day
of
valuation.
Assets
and
liabilities
other
than
financial
instruments,
including
short-term
receivables
and
payables,
are
carried
at
cost,
or
estimated
realizable
value,
if
less,
which
approximates
fair
value.
Investments
for
which
market
quotations are
not
readily
available
or
deemed
unreliable
are
valued
at
fair
value
as
determined
in
good
faith
by
the
Valuation
Designee.
The
Valuation
Designee
has
adopted
methodologies
for
determining
the
fair
value
of
investments
for
which
market
quotations
are
not
readily
available
or
deemed
unreliable,
including
the
use
of
other
pricing
sources.
Factors
used
in
determining
fair
value
vary
by
type
of
investment
and
may
include
market
or
investment
specific
considerations.
The
Valuation
Designee typically
will
afford
greatest
weight
to
actual
prices
in
arm’s
length
transactions,
to
the
extent
they
represent
orderly
transactions
between
market
T.
ROWE
PRICE
U.S.
High
Yield
Fund
participants,
transaction
information
can
be
reliably
obtained,
and
prices
are
deemed
representative
of
fair
value.
However,
the
Valuation
Designee may
also
consider
other
valuation
methods
such
as
market-based
valuation
multiples;
a
discount
or
premium
from
market
value
of
a
similar,
freely
traded
security
of
the
same
issuer;
discounted
cash
flows;
yield
to
maturity;
or
some
combination.
Fair
value
determinations
are
reviewed
on
a
regular
basis.
Because
any
fair
value
determination
involves
a
significant
amount
of
judgment,
there
is
a
degree
of
subjectivity
inherent
in
such
pricing
decisions. Fair
value
prices
determined
by
the
Valuation
Designee could
differ
from
those
of
other
market
participants,
and
it
is
possible
that
the
fair
value
determined
for
a
security
may
be
materially
different
from
the
value
that
could
be
realized
upon
the
sale
of
that
security.
Valuation
Inputs
The
following
table
summarizes
the
fund’s
financial
instruments,
based
on
the
inputs
used
to
determine
their
fair
values
on
May
31,
2024
(for
further
detail
by
category,
please
refer
to
the
accompanying
Portfolio
of
Investments):
NOTE
3
-
OTHER
INVESTMENT
TRANSACTIONS
Consistent
with
its
investment
objective, the
fund
engages
in
the
following
practices
to
manage
exposure
to
certain
risks
and/or
to
enhance
performance.
The
investment
objective,
policies,
program,
and
risk
factors
of the
fund
are
described
more
fully
in the
fund’s prospectus
and
Statement
of
Additional
Information.
Noninvestment-Grade
Debt
The
fund
invests,
either
directly
or
through
its
investment
in
other
T.
Rowe
Price
funds,
in
noninvestment-grade
debt,
including
“high
yield”
or
“junk”
bonds
or
leveraged
loans.
Noninvestment-grade
debt
issuers
are
more
likely
to
suffer
an
adverse
change
in
financial
condition
that
($000s)
Level
1
Level
2
Level
3
Total
Value
Assets
Corporate
Bonds
$
—
$
384,833
$
—
$
384,833
Bank
Loans
—
60,981
2,996
63,977
Preferred
Stocks
—
2,955
—
2,955
Short-Term
Investments
10,444
—
—
10,444
Total
$
10,444
$
448,769
$
2,996
$
462,209
T.
ROWE
PRICE
U.S.
High
Yield
Fund
would
result
in
the
inability
to
meet
a
financial
obligation.
The
noninvestment-
grade
debt
market
may
experience
sudden
and
sharp
price
swings
due
to
a
variety
of
factors
that
may
decrease
the
ability
of
issuers
to
make
principal
and
interest
payments
and
adversely
affect
the
liquidity
or
value,
or
both,
of
such
securities.
Accordingly,
securities
issued
by
such
companies
carry
a
higher
risk
of
default
and
should
be
considered
speculative.
Restricted
Securities
The
fund
invests
in
securities
that
are
subject
to
legal
or
contractual
restrictions
on
resale.
Prompt
sale
of
such
securities
at
an
acceptable
price
may
be
difficult
and
may
involve
substantial
delays
and
additional
costs.
Bank
Loans
The
fund
invests
in
bank
loans,
which
represent
an
interest
in
amounts
owed
by
a
borrower
to
a
syndicate
of
lenders.
Bank
loans
are
generally
noninvestment
grade
and
often
involve
borrowers
whose
financial
condition
is
highly
leveraged.
The
fund
may
invest
in
fixed
and
floating
rate
loans,
which
may
include
senior
floating
rate
loans;
secured
and
unsecured
loans,
second
lien
or
more
junior
loans;
and
bridge
loans
or
bridge
facilities.
Certain
bank
loans
may
be
revolvers
which
are
a
form
of
senior
bank
debt,
where
the
borrower
can
draw
down
the
credit
of
the
revolver
when
it
needs
cash
and
repays
the
credit
when
the
borrower
has
excess
cash.
Certain
loans
may
be
“covenant-lite”
loans,
which
means
the
loans
contain
fewer
maintenance
covenants
than
other
loans
(in
some
cases,
none)
and
do
not
include
terms
which
allow
the
lender
to
monitor
the
performance
of
the
borrower
and
declare
a
default
if
certain
criteria
are
breached.
As
a
result
of
these
risks,
the
fund’s
exposure
to
losses
may
be
increased.
Bank
loans
may
be
in
the
form
of
either
assignments
or
participations.
A
loan
assignment
transfers
all
legal,
beneficial,
and
economic
rights
to
the
buyer,
and
transfer
typically
requires
consent
of
both
the
borrower
and
agent.
In
contrast,
a
loan
participation
generally
entitles
the
buyer
to
receive
the
cash
flows
from
principal,
interest,
and
any
fee
payments
on
a
portion
of
a
loan;
however,
the
seller
continues
to
hold
legal
title
to
that
portion
of
the
loan.
As
a
result,
the
buyer
of
a
loan
participation
generally
has
no
direct
recourse
against
the
borrower
and
is
exposed
to
credit
risk
of
both
the
borrower
and
seller
of
the
participation.
Bank
loans
often
have
extended
settlement
periods,
generally
may
be
repaid
at
any
time
at
the
option
of
the
borrower,
and
may
require
additional
principal
to
be
funded
at
the
borrowers’
discretion
at
a
later
date
(e.g.
unfunded
commitments
and
revolving
debt
instruments).
Until
settlement,
the
fund
maintains
liquid
assets
sufficient
to
settle
its
unfunded
loan
commitments.
The
fund
reflects
T.
ROWE
PRICE
U.S.
High
Yield
Fund
both
the
funded
portion
of
a
bank
loan
as
well
as
its
unfunded
commitment
in
the
Portfolio
of
Investments.
However,
if
a
credit
agreement
provides
no
initial
funding
of
a
tranche,
and
funding
of
the
full
commitment
at
a
future
date(s)
is
at
the
borrower’s
discretion
and
considered
uncertain,
a
loan
is
reflected
in
the
Portfolio
of
Investments
only
if,
and
only
to
the
extent
that,
the
fund
has
actually
settled
a
funding
commitment.
Other
Purchases
and
sales
of
portfolio
securities
other
than
in-kind
transactions,
if
any,
and short-term securities
aggregated $406,180,000 and
$369,667,000,
respectively,
for
the
year ended
May
31,
2024.
NOTE
4
-
FEDERAL
INCOME
TAXES
Generally,
no
provision
for
federal
income
taxes
is
required
since
the
fund
intends
to continue
to
qualify
as
a
regulated
investment
company
under
Subchapter
M
of
the
Internal
Revenue
Code
and
distribute
to
shareholders
all
of
its taxable
income
and
gains.
Distributions
determined
in
accordance
with
federal
income
tax
regulations
may
differ
in
amount
or
character
from
net
investment
income
and
realized
gains
for
financial
reporting
purposes.
The
fund
files
U.S.
federal,
state,
and
local
tax
returns
as
required.
The
fund’s
tax
returns
are
subject
to
examination
by
the
relevant
tax
authorities
until
expiration
of
the
applicable
statute
of
limitations,
which
is
generally
three
years
after
the
filing
of
the
tax
return
but
which
can
be
extended
to
six
years
in
certain
circumstances.
Tax
returns
for
open
years
have
incorporated
no
uncertain
tax
positions
that
require
a
provision
for
income
taxes.
Capital
accounts
within
the
financial
reporting
records
are
adjusted
for
permanent
book/tax
differences
to
reflect
tax
character
but
are
not
adjusted
for
temporary
differences.
The
permanent
book/tax
adjustments,
if
any,
have
no
impact
on
results
of
operations
or
net
assets.
The
tax
character
of
distributions
paid
for
the
periods
presented
was
as
follows:
($000s)
May
31,
2024
May
31,
2023
Ordinary
income
(including
short-term
capital
gains,
if
any)
$
34,235
$
32,483
T.
ROWE
PRICE
U.S.
High
Yield
Fund
At
May
31,
2024,
the
tax-basis
cost
of
investments
(including
derivatives,
if
any)
and
gross
unrealized
appreciation
and
depreciation
were as
follows:
At
May
31,
2024,
the
tax-basis
components
of
accumulated
net
earnings
(loss)
were
as
follows:
Temporary
differences
between
book-basis
and
tax-basis
components
of
total
distributable
earnings
(loss)
arise
when
certain
items
of
income,
gain,
or
loss
are
recognized
in
different
periods
for
financial
statement
purposes
versus
for
tax
purposes;
these
differences
will
reverse
in
a
subsequent
reporting
period.
The
temporary
differences
relate
primarily
to
the
deferral
of
losses
from
wash
sales.
The
loss
carryforwards
and
deferrals
primarily
relate
to
capital
loss
carryforwards.
Capital
loss
carryforwards
are
available
indefinitely
to
offset
future
realized
capital
gains.
Other
temporary
differences
relate
primarily
to
amortization
of
organizational
costs.
NOTE
5
-
RELATED
PARTY
TRANSACTIONS
The
fund
is
managed
by
T.
Rowe
Price
Associates,
Inc.
(Price
Associates),
a
wholly
owned
subsidiary
of
T.
Rowe
Price
Group,
Inc.
(Price
Group). Price
Associates
has
entered
into
a
sub-advisory
agreement(s)
with
one
or
more
of
its
wholly
owned
subsidiaries,
to
provide
investment
advisory
services
to
the
fund.
The
investment
management
agreement
between
the
fund
and
Price
Associates
provides
for
an
annual
investment
management
fee,
which
is
computed
daily
and
paid
monthly. The
fee
consists
of
an
individual
fund
fee,
equal
to
0.27%
($000s)
Cost
of
investments
$
463,973
Unrealized
appreciation
$
6,754
Unrealized
depreciation
(8,521)
Net
unrealized
appreciation
(depreciation)
$
(1,767)
($000s)
Undistributed
ordinary
income
$
270
Net
unrealized
appreciation
(depreciation)
(1,767)
Loss
carryforwards
and
deferrals
(92,379)
Other
temporary
differences
(1)
Total
distributable
earnings
(loss)
$
(93,877)
T.
ROWE
PRICE
U.S.
High
Yield
Fund
of
the
fund’s
average
daily
net
assets,
and
a
group
fee.
The
group
fee
rate
is
calculated
based
on
the
combined
net
assets
of
certain
mutual
funds
sponsored
by
Price
Associates
(the
group)
applied
to
a
graduated
fee
schedule,
with
rates
ranging
from
0.48%
for
the
first
$1
billion
of
assets
to
0.260%
for
assets
in
excess
of
$845
billion.
The
fund’s
group
fee
is
determined
by
applying
the
group
fee
rate
to
the
fund’s
average
daily
net
assets. At
May
31,
2024,
the
effective
annual
group
fee
rate
was
0.29%.
The Investor
Class and Advisor
Class are
each
subject
to
a
contractual
expense
limitation
through
the
expense
limitation
dates
indicated
in
the
table
below.
This
agreement
will
continue
through
the
expense
limitation
date
indicated
in
the
table
below,
and
may
be
renewed,
revised,
or
revoked
only
with
approval
of
the
fund’s
Board.
During
the
limitation
period,
Price
Associates
is required
to
waive
or
pay
any
expenses
(excluding
interest;
expenses
related
to
borrowings,
taxes,
and
brokerage;
non-recurring,
extraordinary
expenses;
and
acquired
fund
fees
and
expenses)
that
would
otherwise
cause
the
class’s
ratio
of
annualized
total
expenses
to
average
net
assets
(net
expense
ratio)
to
exceed
its
expense
limitation.
Each
class
is
required
to
repay
Price
Associates
for
expenses
previously
waived/paid
to
the
extent
the
class’s
net
assets
grow
or
expenses
decline
sufficiently
to
allow
repayment
without
causing
the
class’s
net
expense
ratio
(after
the
repayment
is
taken
into
account)
to
exceed
the
lesser
of:
(1)
the
expense
limitation
in
place
at
the
time
such
amounts
were
waived;
or
(2)
the
class’s
current
expense
limitation.
However,
no
repayment
will
be
made
more
than
three
years
after
the
date
of
a
payment
or
waiver.
The
I
Class
is
also
subject
to
an
operating
expense
limitation
(I
Class
Limit)
pursuant
to
which
Price
Associates
is
contractually
required
to
pay
all
operating
expenses
of
the
I
Class,
excluding
management
fees;
interest;
expenses
related
to
borrowings,
taxes,
and
brokerage; non-recurring,
extraordinary expenses; and
acquired
fund
fees
and
expenses, to
the
extent
such
operating
expenses,
on
an
annualized
basis,
exceed
the
I
Class
Limit. This
agreement
will
continue
through
the
expense
limitation
date
indicated
in
the
table
below,
and
may
be
renewed,
revised,
or
revoked
only
with
approval
of
the
fund’s
Board.
The
I
Class
is
required
to
repay
Price
Associates
for
expenses
previously
paid
to
the
extent
the
class’s
net
assets
grow
or
expenses
decline
sufficiently
to
allow
repayment
without
causing
the
class’s
operating
expenses
(after
the
repayment
is
taken
into
account)
to
exceed
the
lesser
of:
(1)
the
I
Class
Limit
in
place
at
the
time
such
amounts
were
paid;
or
(2)
the
current
I
Class
Limit.
However,
no
repayment
will
be
made
more
than
three
years
after
the
date
of
a
payment
or
waiver.
T.
ROWE
PRICE
U.S.
High
Yield
Fund
Pursuant
to
these
agreements,
expenses
were
waived/paid
by
and/or
repaid
to
Price
Associates
during
the
year ended May
31,
2024
as
indicated
in
the
table
below.
Including these
amounts,
expenses
previously
waived/paid
by
Price
Associates
in
the
amount
of $920,000 remain
subject
to
repayment
by
the
fund
at
May
31,
2024.
Any
repayment
of
expenses
previously
waived/paid
by
Price
Associates
during
the
period
would
be
included
in
the
net
investment
income
and
expense
ratios
presented
on
the
accompanying
Financial
Highlights.
In
addition,
the
fund
has
entered
into
service
agreements
with
Price
Associates
and
two
wholly
owned
subsidiaries
of
Price
Associates,
each
an
affiliate
of
the
fund
(collectively,
Price).
Price
Associates
provides
certain
accounting
and
administrative
services
to
the
fund.
T.
Rowe
Price
Services,
Inc.
provides
shareholder
and
administrative
services
in
its
capacity
as
the
fund’s
transfer
and
dividend-disbursing
agent.
T.
Rowe
Price
Retirement
Plan
Services,
Inc.
provides
subaccounting
and
recordkeeping
services
for
certain
retirement
accounts
invested
in
the
Investor
Class
and
Advisor
Class.
For
the
year
ended
May
31,
2024,
expenses
incurred
pursuant
to
these
service
agreements
were
$106,000
for
Price
Associates;
$336,000
for
T.
Rowe
Price
Services,
Inc.;
and
less
than
$1,000
for
T.
Rowe
Price
Retirement
Plan
Services,
Inc.
All
amounts
due
to
and
due
from
Price,
exclusive
of
investment
management
fees
payable,
are
presented
net
on
the
accompanying
Statement
of
Assets
and
Liabilities.
T.
Rowe
Price
Investment
Services,
Inc.
(Investment
Services)
serves
as
distributor
to
the
fund.
Pursuant
to
an
underwriting
agreement,
no
compensation
for
any
distribution
services
provided
is
paid
to
Investment
Services
by
the
fund
(except
for
12b-1
fees
under
a
Board-approved
Rule
12b-1
plan).
The fund
may
invest
its
cash
reserves
in
certain
open-end
management
investment
companies
managed
by
Price
Associates
and
considered
affiliates
of
the
fund:
the
T.
Rowe
Price
Government
Reserve
Fund
or
the
T.
Rowe
Price
Treasury
Reserve
Fund,
organized
as
money
market
funds
(together,
the
Price
Reserve
Funds).
The
Price
Reserve
Funds
are
offered
as
short-term
investment
options
to
mutual
funds,
trusts,
and
other
accounts
managed
by
Price
Associates
or
its
affiliates
and
are
not
available
for
direct
purchase
by
members
Investor
Class
Advisor
Class
I
Class
Expense
limitation/I
Class
Limit
0.75%
0.90%
0.05%
Expense
limitation
date
09/30/25
09/30/25
09/30/25
(Waived)/repaid
during
the
period
($000s)
$(177)
$(9)
$(132)
T.
ROWE
PRICE
U.S.
High
Yield
Fund
of
the
public.
Cash
collateral
from
securities
lending,
if
any,
is
invested
in
the
T.
Rowe
Price
Government
Reserve Fund. The
Price
Reserve
Funds
pay
no
investment
management
fees.
The fund may
participate
in
securities
purchase
and
sale
transactions
with
other
funds
or
accounts
advised
by
Price
Associates
(cross
trades),
in
accordance
with
procedures
adopted
by the
fund’s
Board
and
Securities
and
Exchange
Commission
rules,
which
require,
among
other
things,
that
such
purchase
and
sale
cross
trades
be
effected
at
the
independent
current
market
price
of
the
security.
During
the
year
ended
May
31,
2024,
the
fund
had
no
purchases
or
sales
cross
trades
with
other
funds
or
accounts
advised
by
Price
Associates.
NOTE
6
-
OTHER
MATTERS
Unpredictable environmental,
political,
social
and
economic
events,
including
but
not
limited
to,
environmental
or
natural
disasters,
war
and
conflict
(including
Russia’s
military
invasion
of
Ukraine
and
the
conflict
in
Israel,
Gaza
and
surrounding
areas),
terrorism,
geopolitical
developments
(including
trading
and
tariff
arrangements,
sanctions
and
cybersecurity
attacks),
and
public
health
epidemics
(including
the
global
outbreak
of
COVID-19)
and
similar
public
health
threats,
may
significantly
affect
the
economy
and
the
markets
and
issuers
in
which
a
fund
invests.
The
extent
and
duration
of
such
events
and
resulting
market
disruptions
cannot
be
predicted.
These
and
other
similar
events
may
cause
instability
across
global
markets,
including
reduced
liquidity
and
disruptions
in
trading
markets,
while
some
events
may
affect
certain
geographic
regions,
countries,
sectors,
and
industries
more
significantly
than
others,
and
exacerbate
other
pre-existing
political,
social,
and
economic
risks.
The
fund’s
performance
could
be
negatively
impacted
if
the
value
of
a
portfolio
holding
were
harmed
by
these
or
such
events.
Management
actively
monitors
the
risks
and
financial
impacts
arising
from
such
events.
T.
ROWE
PRICE
U.S.
High
Yield
Fund
REPORT
OF
INDEPENDENT
REGISTERED
PUBLIC
ACCOUNTING
FIRM
To
the
Board
of
Directors
of
T.
Rowe
Price
High
Yield
Fund,
Inc.
and
Shareholders
of
T.
Rowe
Price
U.S.
High
Yield
Fund
Opinion
on
the
Financial
Statements
We
have
audited
the
accompanying
statement
of
assets
and
liabilities,
including
the
portfolio
of
investments,
of
T.
Rowe
Price
U.S.
High
Yield
Fund
(one
of
the
funds
constituting
T.
Rowe
Price
High
Yield
Fund,
Inc.,
referred
to
hereafter
as
the
"Fund")
as
of
May
31,
2024,
the
related
statement
of
operations
for
the
year
ended
May
31,
2024,
the
statement
of
changes
in
net
assets
for
each
of
the
two
years
in
the
period
ended
May
31,
2024,
including
the
related
notes,
and
the
financial
highlights
for
each
of
the
five
years
in
the
period
ended
May
31,
2024
(collectively
referred
to
as
the
“financial
statements”).
In
our
opinion,
the
financial
statements
present
fairly,
in
all
material
respects,
the
financial
position
of
the
Fund
as
of
May
31,
2024,
the
results
of
its
operations
for
the
year
then
ended,
the
changes
in
its
net
assets
for
each
of
the
two
years
in
the
period
ended
May
31,
2024
and
the
financial
highlights
for
each
of
the
five
years
in
the
period
ended
May
31,
2024
in
conformity
with
accounting
principles
generally
accepted
in
the
United
States
of
America.
Basis
for
Opinion
These
financial
statements
are
the
responsibility
of
the
Fund’s
management.
Our
responsibility
is
to
express
an
opinion
on
the
Fund’s
financial
statements
based
on
our
audits.
We
are
a
public
accounting
firm
registered
with
the
Public
Company
Accounting
Oversight
Board
(United
States)
(PCAOB)
and
are
required
to
be
independent
with
respect
to
the
Fund
in
accordance
with
the
U.S.
federal
securities
laws
and
the
applicable
rules
and
regulations
of
the
Securities
and
Exchange
Commission
and
the
PCAOB.
We
conducted
our
audits
of
these
financial
statements
in
accordance
with
the
standards
of
the
PCAOB.
Those
standards
require
that
we
plan
and
perform
the
audit
to
obtain
reasonable
assurance
about
whether
the
financial
statements
are
free
of
material
misstatement,
whether
due
to
error
or
fraud.
T.
ROWE
PRICE
U.S.
High
Yield
Fund
Our
audits
included
performing
procedures
to
assess
the
risks
of
material
misstatement
of
the
financial
statements,
whether
due
to
error
or
fraud,
and
performing
procedures
that
respond
to
those
risks.
Such
procedures
included
examining,
on
a
test
basis,
evidence
regarding
the
amounts
and
disclosures
in
the
financial
statements.
Our
audits
also
included
evaluating
the
accounting
principles
used
and
significant
estimates
made
by
management,
as
well
as
evaluating
the
overall
presentation
of
the
financial
statements.
Our
procedures
included
confirmation
of
securities
owned
as
of
May
31,
2024
by
correspondence
with
the
custodians,
transfer
agent
and
brokers;
when
replies
were
not
received
from
brokers,
we
performed
other
auditing
procedures.
We
believe
that
our
audits
provide
a
reasonable
basis
for
our
opinion.
/s/
PricewaterhouseCoopers
LLP
Baltimore,
Maryland
July
18,
2024
We
have
served
as
the
auditor
of
one
or
more
investment
companies
in
the
T.
Rowe
Price
group
of
investment
companies
since
1973.
REPORT
OF
INDEPENDENT
REGISTERED
PUBLIC
ACCOUNTING
FIRM
(continued)
T.
ROWE
PRICE
U.S.
High
Yield
Fund
TAX
INFORMATION
(UNAUDITED)
FOR
THE
TAX
YEAR
ENDED 5/31/24
We
are
providing
this
information
as
required
by
the
Internal
Revenue
Code.
The
amounts
shown
may
differ
from
those
elsewhere
in
this
report
because
of
differences
between
tax
and
financial
reporting
requirements.
For
taxable
non-corporate
shareholders,
$185,000
of
the
fund's
income
represents
qualified
dividend
income
subject
to
a
long-term
capital
gains
tax
rate
of
not
greater
than
20%.
For
corporate
shareholders,
$185,000
of
the
fund's
income
qualifies
for
the
dividends-received
deduction.
For
shareholders
subject
to
interest
expense
deduction
limitation
under
Section
163(j),
$33,079,000
of
the
fund’s
income
qualifies
as
a
Section
163(j)
interest
dividend
and
can
be
treated
as
interest
income
for
purposes
of
Section
163(j),
subject
to
holding
period
requirements
and
other
limitations.
T.
ROWE
PRICE
U.S.
High
Yield
Fund
APPROVAL
OF
INVESTMENT
MANAGEMENT
AGREEMENT
AND
SUBADVISORY
AGREEMENT
Each
year,
the
fund’s
Board
of
Directors
(Board)
considers
the
continuation
of
the
investment
management
agreement
(Advisory
Contract)
between
the
fund
and
its
investment
adviser,
T.
Rowe
Price
Associates,
Inc.
(Adviser),
as
well
as
the
investment
subadvisory
agreement
(Subadvisory
Contract)
that
the
Adviser
has
entered
into
with
T.
Rowe
Price
Investment
Management,
Inc.
(Subadviser)
on
behalf
of
the
fund.
In
that
regard,
at
a
meeting
held
on
March
11–12,
2024
(Meeting),
the
Board,
including
all
of
the
fund’s
independent
directors
present
in
person
at
the
Meeting,
approved
the
continuation
of
the
fund’s
Advisory
Contract
and
Subadvisory
Contract.
At
the
Meeting,
the
Board
considered
the
factors
and
reached
the
conclusions
described
below
relating
to
the
selection
of
the
Adviser
and
Subadviser
and
the
approval
of
the
Advisory
Contract
and
Subadvisory
Contract.
The
independent
directors
were
assisted
in
their
evaluation
of
the
Advisory
Contract
and
Subadvisory
Contract
by
independent
legal
counsel
from
whom
they
received
separate
legal
advice
and
with
whom
they
met
separately.
In
providing
information
to
the
Board,
the
Adviser
was
guided
by
a
detailed
set
of
requests
for
information
submitted
by
independent
legal
counsel
on
behalf
of
the
independent
directors.
In
considering
and
approving
the
continuation
of
the
Advisory
Contract
and
Subadvisory
Contract,
the
Board
considered
the
information
it
believed
was
relevant,
including,
but
not
limited
to,
the
information
discussed
below.
The
Board
considered
not
only
the
specific
information
presented
in
connection
with
the
Meeting,
but
also
the
knowledge
gained
over
time
through
interaction
with
the
Adviser
and
Subadviser
about
various
topics.
The
Board
also
considered
that
the
Subadviser
has
its
own
investment
platform
and
investment
management
leadership,
and
the
Adviser
and
Subadviser
have
implemented
information
barriers
restricting
the
sharing
of
investment
information
and
voting
activity.
The
Board
meets
regularly
and,
at
each
of
its
meetings,
covers
an
extensive
agenda
of
topics
and
materials
and
considers
factors
that
are
relevant
to
its
annual
consideration
of
the
renewal
of
the
T.
Rowe
Price
funds’
advisory
contracts,
including
performance
and
the
services
and
support
provided
to
the
funds
and
their
shareholders.
Services
Provided
by
the
Adviser
and
Subadviser
The
Board
considered
the
nature,
quality,
and
extent
of
the
services
provided
to
the
fund
by
the
Adviser
and
Subadviser.
These
services
included,
but
were
not
limited
to,
directing
the
fund’s
investments
in
accordance
with
its
investment
program
and
the
overall
management
of
the
fund’s
portfolio,
as
well
as
a
variety
of
related
activities
such
as
financial,
investment
operations,
and
administrative
services;
compliance;
maintaining
the
fund’s
records
and
registrations;
and
shareholder
communications.
However,
the
Board
noted
that
there
are
information
barriers
between
investment
personnel
of
the
Adviser
and
Subadviser
that
restrict
the
sharing
of
certain
information,
such
as
investment
research,
trading,
and
proxy
T.
ROWE
PRICE
U.S.
High
Yield
Fund
voting.
The
Board
also
reviewed
the
background
and
experience
of
the
Adviser’s
and
Subadviser’s
senior
management
teams
and
investment
personnel
involved
in
the
management
of
the
fund,
as
well
as
the
Adviser’s
compliance
record.
The
Board
concluded
that
the
information
it
considered
with
respect
to
the
nature,
quality,
and
extent
of
the
services
provided
by
the
Adviser
and
Subadviser,
as
well
as
the
other
factors
considered
at
the
Meeting,
supported
the
Board’s
approval
of
the
continuation
of
the
Advisory
Contract
and
Subadvisory
Contract.
Investment
Performance
of
the
Fund
The
Board
took
into
account
discussions
with
the
Adviser
and
detailed
reports
that
it
regularly
receives
throughout
the
year
on
relative
and
absolute
performance
for
the
T.
Rowe
Price
funds.
In
connection
with
the
Meeting,
the
Board
reviewed
information
provided
by
the
Adviser
that
compared
the
fund’s
total
returns,
as
well
as
a
wide
variety
of
other
previously
agreed-upon
performance
measures
and
market
data,
against
relevant
benchmark
indexes
and
peer
groups
of
funds
with
similar
investment
programs
for
various
periods
through
December
31,
2023.
Additionally,
the
Board
reviewed
the
fund’s
relative
performance
information
as
of
September
30,
2023,
which
ranked
the
returns
of
the
fund’s
Investor
Class
for
various
periods
against
a
universe
of
funds
with
similar
investment
programs
selected
by
Broadridge,
an
independent
provider
of
mutual
fund
data.
In
the
course
of
its
deliberations,
the
Board
considered
performance
information
provided
throughout
the
year
and
in
connection
with
the
Advisory
Contract
review
at
the
Meeting,
as
well
as
information
provided
during
investment
review
meetings
conducted
with
portfolio
managers
and
senior
investment
personnel
during
the
course
of
the
year
regarding
the
fund’s
performance.
The
Board
also
considered
relevant
factors,
such
as
overall
market
conditions
and
trends
that
could
adversely
impact
the
fund’s
performance,
the
length
of
the
fund’s
performance
track
record,
and
how
closely
the
fund’s
strategies
align
with
its
benchmarks
and
peer
groups.
The
Board
concluded
that
the
information
it
considered
with
respect
to
the
fund’s
performance,
as
well
as
the
other
factors
considered
at
the
Meeting,
supported
the
Board’s
approval
of
the
continuation
of
the
Advisory
Contract
and
Subadvisory
Contract.
Costs,
Benefits,
Profits,
and
Economies
of
Scale
The
Board
reviewed
detailed
information
regarding
the
revenues
received
by
the
Adviser
under
the
Advisory
Contract
and
other
direct
and
indirect
benefits
that
the
Adviser
(and
its
affiliates,
including
the
Subadviser)
may
have
realized
from
its
relationship
with
the
fund.
In
considering
soft-dollar
arrangements
pursuant
to
which
research
may
be
received
from
broker-dealers
that
execute
the
fund’s
portfolio
transactions,
the
Board
noted
that
during
2023
the
Adviser
paid
the
costs
of
research
services
for
all
client
accounts
that
it
advises,
including
the
T.
Rowe
Price
APPROVAL
OF
INVESTMENT
MANAGEMENT
AGREEMENT
AND
SUBADVISORY
AGREEMENT
(continued)
T.
ROWE
PRICE
U.S.
High
Yield
Fund
funds.
However,
effective
January
1,
2024,
the
Adviser
will
begin
using
brokerage
commissions
in
connection
with
certain
T.
Rowe
Price
funds’
securities
transactions
to
pay
for
research
when
permissible.
The
Board
received
information
on
the
estimated
costs
incurred
and
profits
realized
by
the
Adviser
from
managing
the
T.
Rowe
Price
funds.
The
Board
also
reviewed
estimates
of
the
profits
realized
from
managing
the
fund
in
particular,
and
the
Board
concluded
that
the
Adviser’s
profits
were
reasonable
in
light
of
the
services
provided
to
the
fund.
The
Board
also
considered
whether
the
fund
benefits
under
the
fee
levels
set
forth
in
the
Advisory
Contract
or
otherwise
from
any
economies
of
scale
realized
by
the
Adviser.
Under
the
Advisory
Contract,
the
fund
pays
a
fee
to
the
Adviser
for
investment
management
services
composed
of
two
components—a
group
fee
rate
based
on
the
combined
average
net
assets
of
most
of
the
T.
Rowe
Price
funds
(including
the
fund)
that
declines
at
certain
asset
levels
and
an
individual
fund
fee
rate
based
on
the
fund’s
average
daily
net
assets—and
the
fund
pays
its
own
expenses
of
operations.
Under
the
Subadvisory
Contract,
the
Adviser
may
pay
the
Subadviser
up
to
60%
of
the
advisory
fees
that
the
Adviser
receives
from
the
fund.
The
group
fee
rate
decreases
as
total
T.
Rowe
Price
fund
assets
grow,
which
reduces
the
management
fee
rate
for
any
fund
that
has
a
group
fee
component
to
its
management
fee,
and
reflects
that
certain
resources
utilized
to
operate
the
fund
are
shared
with
other
T.
Rowe
Price
funds,
thus
allowing
shareholders
of
those
funds
to
share
potential
economies
of
scale.
The
fund’s
shareholders
also
benefit
from
potential
economies
of
scale
through
a
decline
in
certain
operating
expenses
as
the
fund
grows
in
size.
However,
the
fund
is
also
subject
to
contractual
expense
limitations
that
require
the
Adviser
to
waive
its
fees
and/or
bear
any
expenses
that
would
otherwise
cause
the
expenses
of
a
share
class
of
the
fund
to
exceed
a
certain
percentage
based
on
the
class’s
net
assets.
The
expense
limitations
mitigate
the
potential
for
an
increase
in
operating
expenses
above
a
certain
level
that
could
impact
shareholders.
In
addition,
the
Board
noted
that
the
fund
potentially
shares
in
indirect
economies
of
scale
through
the
Adviser’s
and
Subadviser’s
ongoing
investments
in
their
business
in
support
of
the
T.
Rowe
Price
funds,
including
investments
in
trading
systems,
technology,
and
regulatory
support
enhancements,
and
the
ability
to
possibly
negotiate
lower
fee
arrangements
with
third-party
service
providers.
The
Board
concluded
that
the
advisory
fee
structure
for
the
fund
provides
for
a
reasonable
sharing
of
benefits
from
any
economies
of
scale
with
the
fund’s
investors.
APPROVAL
OF
INVESTMENT
MANAGEMENT
AGREEMENT
AND
SUBADVISORY
AGREEMENT
(continued)
T.
ROWE
PRICE
U.S.
High
Yield
Fund
Fees
and
Expenses
The
Board
was
provided
with
information
regarding
industry
trends
in
management
fees
and
expenses.
Among
other
things,
the
Board
reviewed
data
for
peer
groups
that
were
compiled
by
Broadridge,
which
compared:
(i)
contractual
management
fees,
actual
management
fees,
nonmanagement
expenses,
and
total
expenses
of
the
Investor
Class
of
the
fund
with
a
group
of
competitor
funds
selected
by
Broadridge
(Investor
Class
Expense
Group);
(ii)
actual
management
fees
and
total
expenses
of
the
Advisor
Class
of
the
fund
with
a
group
of
competitor
funds
selected
by
Broadridge
(Advisor
Class
Expense
Group);
and
(iii)
actual
management
fees,
nonmanagement
expenses,
and
total
expenses
of
the
Investor
Class
of
the
fund
with
a
broader
set
of
funds
within
the
Lipper
investment
classification
(Expense
Universe).
The
Board
considered
the
fund’s
contractual
management
fee
rate,
actual
management
fee
rate
(which
reflects
the
management
fees
actually
received
from
the
fund
by
the
Adviser
after
any
applicable
waivers,
reductions,
or
reimbursements),
operating
expenses,
and
total
expenses
(which
reflect
the
net
total
expense
ratio
of
the
fund
after
any
waivers,
reductions,
or reimbursements)
in
comparison
with
the
information
for
the
Broadridge
peer
groups.
Broadridge
generally
constructed
the
peer
groups
by
seeking
the
most
comparable
funds
based
on
similar
investment
classifications
and
objectives,
expense
structure,
asset
size,
and
operating
components
and
attributes
and
ranked
funds
into
quintiles,
with
the
first
quintile
representing
the
funds
with
the
lowest
relative
expenses
and
the
fifth
quintile
representing
the
funds
with
the
highest
relative
expenses.
The
information
provided
to
the
Board
indicated
that
the
fund’s
contractual
management
fee
ranked
in
the
second
quintile
(Investor
Class
Expense
Group),
the
fund’s
actual
management
fee
rate
ranked
in
the
first
quintile
(Investor
Class
Expense
Group)
and
second
quintile
(Advisor
Class
Expense
Group
and
Expense
Universe),
and
the
fund’s
total
expenses
ranked
in
the
third
quintile
(Investor
Class
Expense
Group),
first
quintile
(Advisor
Class
Expense
Group),
and
fourth
quintile
(Expense
Universe).
The
Board
also
reviewed
the
fee
schedules
for
other
investment
portfolios
with
similar
mandates
that
are
advised
or
subadvised
by
the
Adviser
and
its
affiliates,
including
separately
managed
accounts
for
institutional
and
individual
investors;
subadvised
funds;
and
other
sponsored
investment
portfolios,
including
collective
investment
trusts
and
pooled
vehicles
organized
and
offered
to
investors
outside
the
United
States.
Management
provided
the
Board
with
information
about
the
Adviser’s
responsibilities
and
services
provided
to
subadvisory
and
other
institutional
account
clients,
including
information
about
how
the
requirements
and
economics
of
the
institutional
business
are
fundamentally
different
from
those
of
the
proprietary
mutual
fund
business.
The
Board
considered
information
showing
that
the
Adviser’s
mutual
fund
business
is
generally
more
complex
from
a
business
and
compliance
perspective
than
its
institutional
account
business
and
considered
APPROVAL
OF
INVESTMENT
MANAGEMENT
AGREEMENT
AND
SUBADVISORY
AGREEMENT
(continued)
T.
ROWE
PRICE
U.S.
High
Yield
Fund
various
relevant
factors,
such
as
the
broader
scope
of
operations
and
oversight,
more
extensive
shareholder
communication
infrastructure,
greater
asset
flows,
heightened
business
risks,
and
differences
in
applicable
laws
and
regulations
associated
with
the
Adviser’s
proprietary
mutual
fund
business.
In
assessing
the
reasonableness
of
the
fund’s
management
fee
rate,
the
Board
considered
the
differences
in
the
nature
of
the
services
required
for
the
Adviser
to
manage
its
mutual
fund
business
versus
managing
a
discrete
pool
of
assets
as
a
subadviser
to
another
institution’s
mutual
fund
or
for
an
institutional
account
and
that
the
Adviser
generally
performs
significant
additional
services
and
assumes
greater
risk
in
managing
the
fund
and
other
T.
Rowe
Price
funds
than
it
does
for
institutional
account
clients,
including
subadvised
funds.
On
the
basis
of
the
information
provided
and
the
factors
considered,
the
Board
concluded
that
the
fees
paid
by
the
fund
under
the
Advisory
Contract
are
reasonable.
Approval
of
the
Advisory
Contract
and
Subadvisory
Contract
As
noted,
the
Board
approved
the
continuation
of
the
Advisory
Contract
and
Subadvisory
Contract.
No
single
factor
was
considered
in
isolation
or
to
be
determinative
to
the
decision.
Rather,
the
Board
concluded,
in
light
of
a
weighting
and
balancing
of
all
factors
considered,
that
it
was
in
the
best
interests
of
the
fund
and
its
shareholders
for
the
Board
to
approve
the
continuation
of
the
Advisory
Contract
and
Subadvisory
Contract
(including
the
fees
to
be
charged
for
services
thereunder).
APPROVAL
OF
INVESTMENT
MANAGEMENT
AGREEMENT
AND
SUBADVISORY
AGREEMENT
(continued)
100
East
Pratt
Street
Baltimore,
MD
21202
T.
Rowe
Price
Investment
Services,
Inc.
Call
1-800-225-5132
to
request
a
prospectus
or
summary
prospectus;
each
includes
investment
objectives,
risks,
fees,
expenses,
and
other
information
that
you
should
read
and
consider
carefully
before
investing.
F1106-050
7/24
Item 8. Changes in and Disagreements with Accountants for Open-End Management Investment Companies.
Not applicable.
Item 9. Proxy Disclosures for Open-End Management Investment Companies.
Not applicable.
Item 10. Remuneration Paid to Directors, Officers, and Others of Open-End Management Investment Companies.
Remuneration paid to Directors is included in Item 7 of this Form N-CSR.
Item 11. Statement Regarding Basis for Approval of Investment Advisory Contract.
If applicable, see Item 7.
Item 12. Disclosure of Proxy Voting Policies and Procedures for Closed-End Management Investment Companies.
Not applicable.
Item 13. Portfolio Managers of Closed-End Management Investment Companies.
Not applicable.
Item 14. Purchases of Equity Securities by Closed-End Management Investment Company and Affiliated Purchasers.
Not applicable.
Item 15. Submission of Matters to a Vote of Security Holders.
There has been no change to the procedures by which shareholders may recommend nominees to the registrant’s board of directors.
Item 16. Controls and Procedures.
(a) The registrant’s principal executive officer and principal financial officer have evaluated the registrant’s disclosure controls and procedures within 90 days of this filing and have concluded that the registrant’s disclosure controls and procedures were effective, as of that date, in ensuring that information required to be disclosed by the registrant in this Form N-CSR was recorded, processed, summarized, and reported timely.
(b) The registrant’s principal executive officer and principal financial officer are aware of no change in the registrant’s internal control over financial reporting that occurred during the period covered by this report that has materially affected, or is reasonably likely to materially affect, the registrant’s internal control over financial reporting.
Item 17. Disclosure of Securities Lending Activities for Closed-End Management Investment Companies.
Not applicable.
Item 18. Recovery of Erroneously Awarded Compensation.
Not applicable.
Item 19. Exhibits.
SIGNATURES
Pursuant to the requirements of the Securities Exchange Act of 1934 and the Investment Company Act of 1940, the registrant has duly caused this report to be signed on its behalf by the undersigned, thereunto duly authorized.
T. Rowe Price U.S. High Yield Fund
| | | | |
| | |
| By | | /s/ David Oestreicher | | |
| | David Oestreicher | | |
| | Principal Executive Officer | | |
| | |
| Date | | July 18, 2024 | | |
Pursuant to the requirements of the Securities Exchange Act of 1934 and the Investment Company Act of 1940, this report has been signed below by the following persons on behalf of the registrant and in the capacities and on the dates indicated.
| | | | |
| By | | /s/ David Oestreicher | | |
| | David Oestreicher | | |
| | Principal Executive Officer | | |
| | |
| Date | | July 18, 2024 | | |
| | |
| By | | /s/ Alan S. Dupski | | |
| | Alan S. Dupski | | |
| | Principal Financial Officer | | |
| | |
| Date | | July 18, 2024 | | |