UNITED STATES
SECURITIES AND EXCHANGE COMMISSION
Washington, D.C. 20549
FORM N-CSR
CERTIFIED SHAREHOLDER REPORT OF REGISTERED
MANAGEMENT INVESTMENT COMPANIES
Investment Company Act File Number: 811-04119
| T. Rowe Price High Yield Fund, Inc. |
|
| (Exact name of registrant as specified in charter) |
| |
| 100 East Pratt Street, Baltimore, MD 21202 |
|
| (Address of principal executive offices) |
| |
| David Oestreicher |
| 100 East Pratt Street, Baltimore, MD 21202 |
|
| (Name and address of agent for service) |
Registrant’s telephone number, including area code: (410) 345-2000
Date of fiscal year end: May 31
Date of reporting period: May 31, 2012
Item 1. Report to Shareholders
| High Yield Fund | May 31, 2012 |
The views and opinions in this report were current as of May 31, 2012. They are not guarantees of performance or investment results and should not be taken as investment advice. Investment decisions reflect a variety of factors, and the managers reserve the right to change their views about individual stocks, sectors, and the markets at any time. As a result, the views expressed should not be relied upon as a forecast of the fund’s future investment intent. The report is certified under the Sarbanes-Oxley Act, which requires mutual funds and other public companies to affirm that, to the best of their knowledge, the information in their financial reports is fairly and accurately stated in all material respects.
REPORTS ON THE WEB
Sign up for our E-mail Program, and you can begin to receive updated fund reports and prospectuses online rather than through the mail. Log in to your account at troweprice.com for more information.
Manager’s Letter
Fellow Shareholders
In stark contrast with the first half of our fiscal year, high yield bonds generated strong gains in the six months ended May 31, 2012. Demand for below investment-grade companies rebounded and reached record levels in the first quarter of 2012 as corporate fundamentals and domestic economic developments improved. When investor sentiment turned bullish, junk bond prices rallied, and when news turned dour, the market retreated. Although the market experienced a pullback in May when concerns about the European sovereign debt crisis worsened, defaults remained low because these macroeconomic concerns are largely unrelated to the asset class. Overall, conditions within the high yield market have improved over the past six months.
PORTFOLIO PERFORMANCE
The High Yield Fund posted strong absolute and relative performance in the six months ended May 31, 2012, lifting fiscal year results into positive territory. Junk bonds endured a year marred by periodic bouts of volatility due to concerns about the European sovereign debt crisis and faltering global growth. The portfolio outperformed the Credit Suisse High Yield Index for the six months but trailed for the year. The fund outperformed its Lipper peer group average in both periods. Results for the fund’s Advisor Class were slightly lower, reflecting its different fee structure.
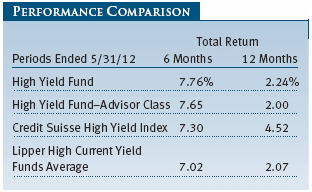
The portfolio’s share price advanced $0.25 over the past six months, closing the reporting period at $6.61. Capital appreciation contributed about half of the fund’s total return for the six-month period. The share price fell during the 12-month period but dividend income offset the decline, producing a modest positive total return for the year. Our longer-term returns are shown in the table on page 13.

The High Yield Fund’s returns compare favorably with those of its peer group, especially over longer time periods. Lipper ranked the fund in the top quarter of its high current yield funds universe for the 5- and 10-year periods ended May 31, 2012. (Based on cumulative total return, Lipper ranked the High Yield Fund 275 of 503, 92 of 371, and 58 of 247 funds in the high current yield bond funds category for the 1-, 5-, and 10-year periods ended May 31, 2012, respectively. Past performance cannot guarantee future results.)
MARKET ENVIRONMENT
Junk bonds generated good absolute and relative returns in the six-month period through May 31, 2012. However, results in May were down due to uncertainty about the global economy, particularly in Europe. Our European credit analyst, Ken Orchard, depicts investor sentiment about the region as vacillating among three stages: hope, disappointment, and despair. For much of the past six months we were in the hope phase, but the disappointment that began in April quickly turned into despair in May, when all risk assets tumbled. Adding to investor skittishness is concern about another seasonal/summer sell-off—historically a period of low liquidity—that may mirror the performance in 2010 and 2011.
However, the key difference versus a year ago is that high yield spreads (the yield difference between high yield bonds and similar-maturity Treasuries) were extremely tight in May 2011, and today they are much wider. At this time last year, high yield bonds were yielding about 5% (500 basis points) more than Treasuries—the market had rallied for an extended period, and yields on junk bonds were near all-time lows. At the end of the current reporting period, the spread was approximately 720 basis points, which leads us to believe that downside potential is somewhat limited. Monetary policy, soft economic data, and overseas and domestic fiscal concerns caused Treasury yields to fall to record lows near the end of the reporting period. High yield bond returns have been volatile in this environment and are certainly not for the faint of heart. As we write this letter, we view junk bonds as fairly priced, with room to perform well if investor concerns outside of the asset class find some sort of stabilization; spreads are well above the lows set last year and comfortably above the long-term average, which is about 580 basis points.
| Fund Closes to New Investors |
The High Yield Fund closed to new investors on April 30, 2012. However, the fund will continue to accept additional investments from existing shareholders and direct rollovers from qualified retirement plans into new IRAs offered through T. Rowe Price. We decided to close the fund to ensure that we can continue to manage the portfolio responsibly and maintain the integrity of the fund’s investment program, including our ability to remain selective in our credit standards. We determined that the fund’s existing shareholders would be better served by limiting new inflows, enabling us to pursue our careful and prudent course in buying high yield bonds for the portfolio. The changing market environment, combined with record demand from investors for higher-yielding debt, could strain our ability to invest cash inflows efficiently. By closing the fund, we hope to ensure adequate flexibility, preserve our ability to effectively diversify the portfolio, and maintain our active buy and sell discipline.
PORTFOLIO REVIEW
Commodity prices have continued to fall, and we believe the global supercycle in commodities is coming to an end. Rather than a short-term, demand-driven correction, we believe that additional supply will decrease commodity prices over the long term. For example, new energy production from Libya, Iraq, and Russia coupled with more drilling domestically could keep downward pressure on oil and gas prices for the foreseeable future. Oil and natural gas prices fell 13% and 46%, respectively, in the past year. Agricultural commodities also tumbled—corn, wheat, coffee, and cotton prices fell between 25% and 50% in the year ended May 31, 2012. Lower fuel, food, and clothing costs are like a tax cut for consumers who can spend that money in other places. These market trends have implications for sectors in the below investment-grade universe. Industries that could benefit from a decrease in oil or gas include airlines, autos, and manufacturing.
Overall, the companies in the high yield market remain fundamentally sound. They have spent the past three years repairing balance sheets and improving liquidity. We don’t see that trend shifting dramatically in the near term. In recent years, the majority of new issuance has been for refinancing, which does not materially add to supply. The net effect has been to lower financing costs and to extend the due dates on a significant portion of the outstanding corporate debt. Because issuer maturities have been pushed out, there is significantly less debt coming due over the next few years, which supports our belief that defaults will remain low.
TWO MAJOR ALLOCATION SHIFTS GENERATE GOOD RESULTS
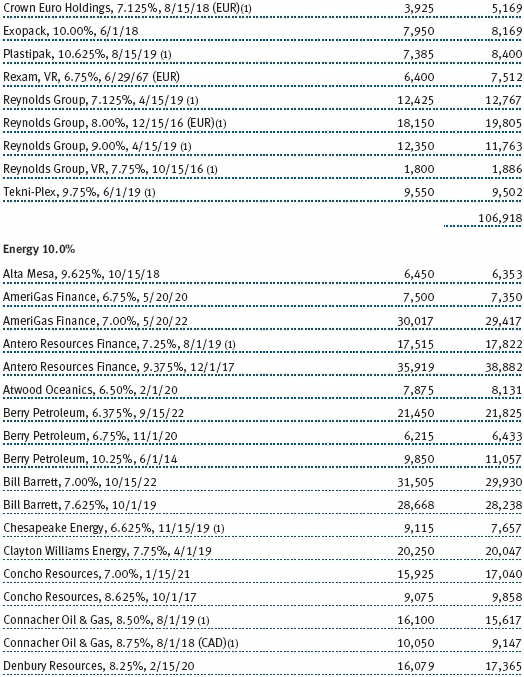
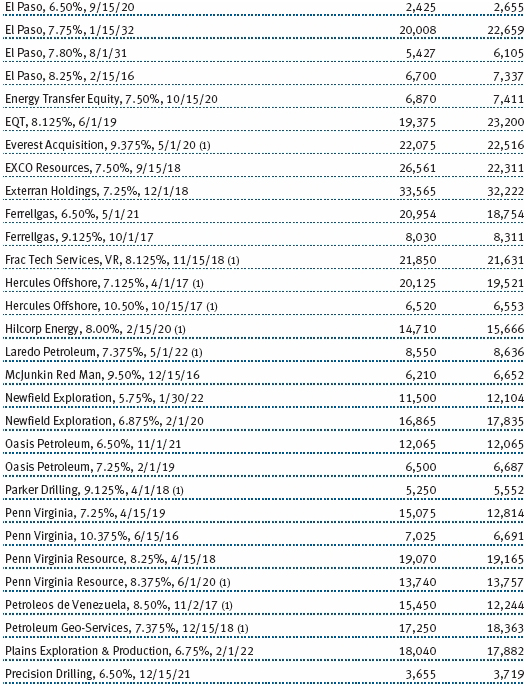
Energy is the largest industry in the high yield market, but we are concerned that falling prices pose a headwind for these companies. Consequently, over the past six months, we cut our energy exposure to 11% from 14% in November. Many small- and mid-cap oil and gas producers issued high yield debt, but we intentionally reduced our exposure (by almost 25% in the past six months) to an underweight versus the benchmark index. Although the group lagged the benchmark for the six-month period, credit selection and our lighter allocation contributed to the fund’s relative performance. We intend to continue opportunistically trimming our energy allocation. We were also underweight in metals and mining, another industry that underperformed the benchmark for the past six months. A big part of this segment is coal companies—coal prices fell in sync with the global commodities collapse. Credit selection and the underweight allocation to the metals and mining group generated a positive relative performance contribution. Conversely, we think that many industries can benefit from lower fuel prices. The airline industry, for example, should generate huge savings. In general, lower energy prices are positive for the entire economy and especially for consumers who will have more disposable income.
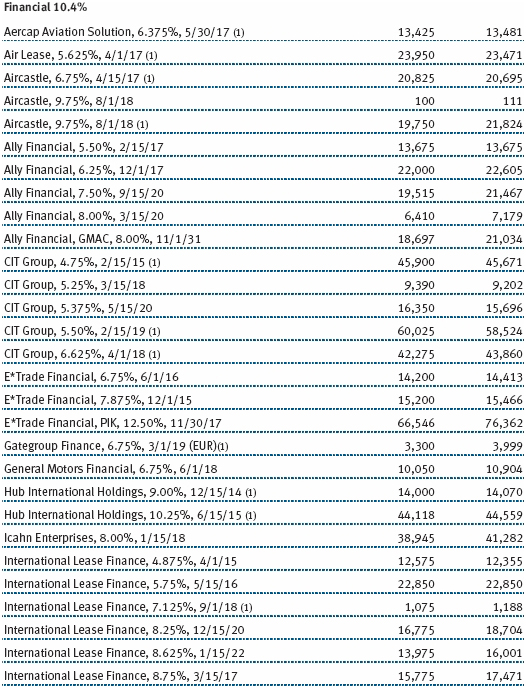
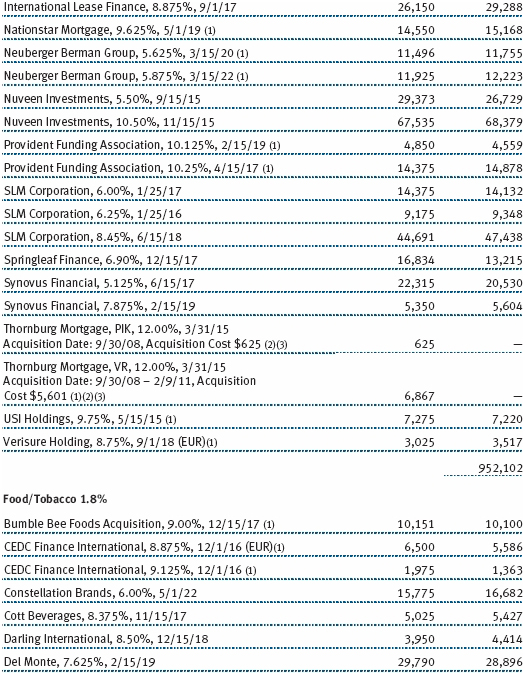
Financials are now the fund’s largest allocation. In the past six months, we significantly added to our allocation, which now stands at 13%. After a weak first half of our fiscal year, financial services companies rebounded in the last six months. We benefited from the overweight allocation and credit selection. At the same time we were reducing our energy exposure we were adding to financials, and both allocation shifts contributed to the fund’s relative results. In addition to financials, energy, and metals and mining, the best industry contributors to the fund’s relative performance over the past six months were information technology, broadcasting, building products, and chemicals—each delivered double-digit absolute returns and strong relative performance contributions.
Short-term holdings, which include the cash we keep on hand for day-to-day liquidity and our “dry powder” for buying opportunities, were the biggest drag on relative returns during this strong performance environment. The interest rate on short-term securities was barely positive over the six-month period, and throughout the period, we held roughly 3% to meet redemptions and for other purposes. The second-largest detractor from relative returns was building and real estate holdings. Although these holdings posted solid absolute gains, we were significantly underweight compared with the benchmark. Another detractor was transportation. Credit selection and an underweight allocation to the segment detracted from relative results.
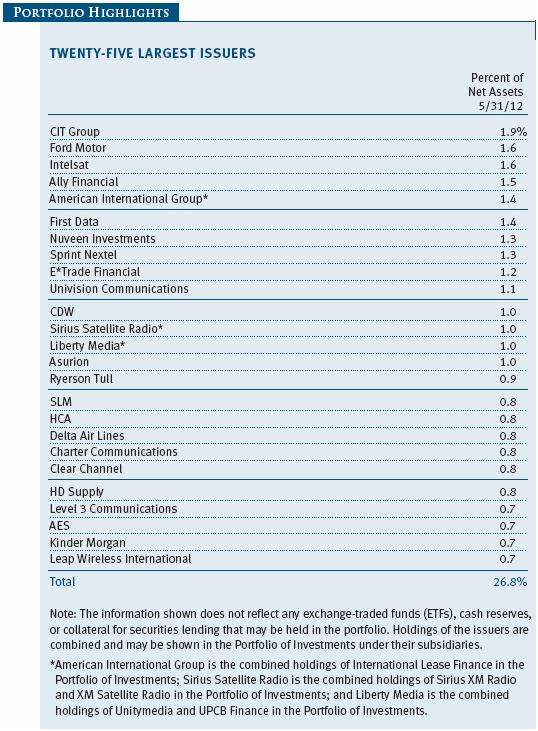
THE LARGEST ISSUERS WERE ALSO TOP CONTRIBUTORS
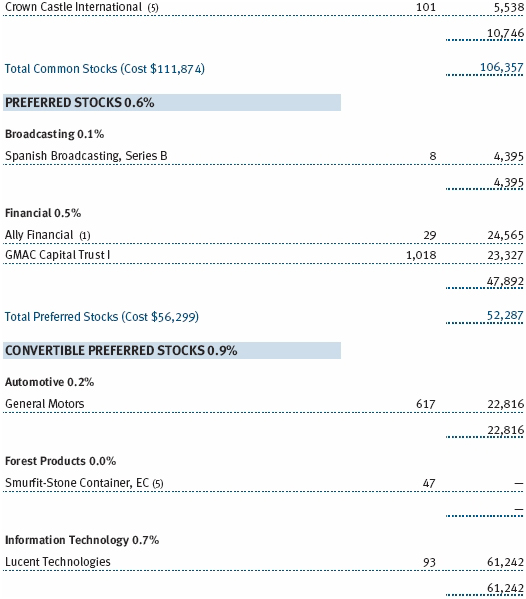
The portfolio’s best contributors for the past six months are near the top of our list of largest issuers, which can be found on page 12 of this letter. Ally Financial and Ford Motor generated the best performance contributions. Ally used to be called GMAC. It was a wholly owned subsidiary and the finance arm of General Motors. A bailout engineered when the company was on the brink of bankruptcy made the federal government a majority shareholder in December 2008. The one-time investment-grade company has flourished thanks to the cash infusion, and it continues to make substantial progress financially. As the company has regained its footing, its credit profile continued to improve. (Please refer to the fund’s portfolio of investments for a complete list of holdings and the amount each represents in the portfolio.)
Ford’s credit rating has risen steadily over the years, and it was recently upgraded to an investment-grade credit with a BBB rating by two credit rating agencies. Our conviction in the company’s turnaround caused us to take a large position several years ago—it has been one of our largest holdings for the past three years. Ford bonds were the portfolio’s top contributor for the past 12 months and second-best for the last six months. We believe there is a huge automobile replacement cycle unfolding. Americans have been holding onto their clunkers and have postponed purchasing new vehicles for several years. We believe that is due to change. Today, the average car on the road is about 11 years old, making the American automobile fleet the oldest it has ever been. We’ve begun trimming our Ford holdings now that our thesis has played out and given its limited upside potential. However, we have established a position in Chrysler, another large, well-established auto company that partnered with Fiat last year. The company has a strong management team with a growing product pipeline that should continue to help the company grow into its balance sheet. Based on our constructive view, we also own several parts companies in the segment.
UP AND DOWN AND OUT
Avaya and Alcatel-Lucent were top contributors for the last six months of the reporting period, but they were extremely volatile and traded sharply lower in May. Both companies reported weak first-quarter earnings. We have been trimming our Avaya position, which traded at par a year ago, then fell about one-third six months ago, and subsequently rallied back to par. The bonds were trading at about 80% of par value at the end of this reporting period. Although we made a decent return on the holding, we have decided to reduce exposure due to the volatility. Alcatel is a France-domiciled telecommunications company that has rallied and plunged on news from the eurozone. Although it was a top contributor for the six-month period, it sold off sharply in May and was among our largest detractors for the year. Unlike Avaya, we like Alcatel’s risk/reward characteristics. The company generates a large portion of its revenue and income outside the euro region.
The only major credit problem we had in the past 12 months was Energy Future Holdings (formerly called TXU/Texas Competitive Electric). Its revenue and cash flow move in tandem with natural gas prices, and its earnings evaporated when the commodity price collapsed. We eliminated the position on concern that the company will have to restructure its debt at some point in the next few years. It was our largest absolute detractor for the 6- and 12-month periods. However, the decision to eliminate this issuer generated a strong relative performance contribution.
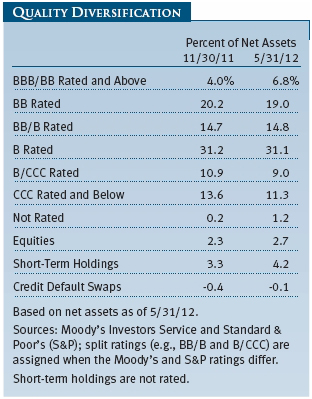
TAKING ON BALLAST TO DAMPEN PORTFOLIO VOLATILITY
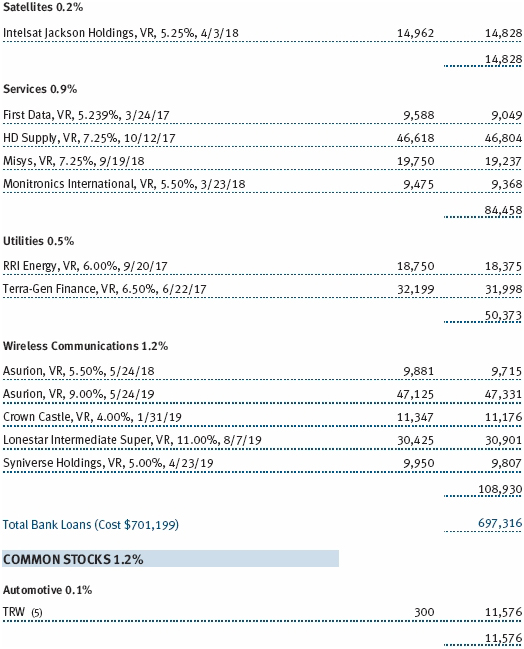
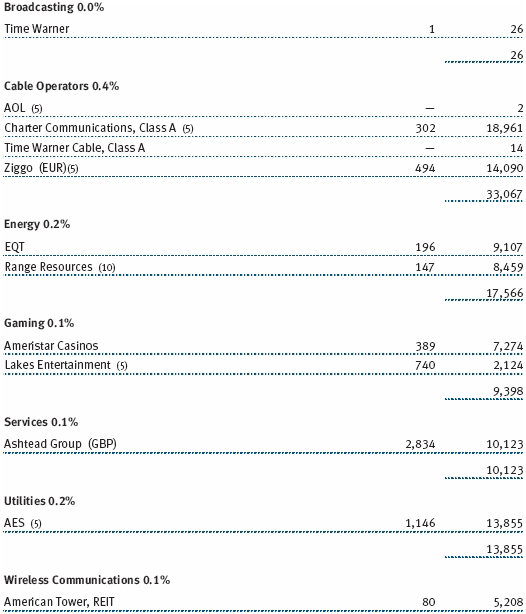
In the past 12 months, we took several steps to reduce the portfolio’s volatility. Our CCC and below rated credits now represent 11.3% of assets, about one-third less than a year ago. Equity exposure, including convertible preferred, preferred, and common stock, now stands at 2.7% of the fund, well below our 4.8% allocation a year ago. As we reduced our exposure to higher-risk holdings, we doubled our bank debt allocation, which at the end of the period represented 8.1% of the fund. We think bank debt offers a compelling blend of characteristics. The income is approximately the same as BB rated bonds; they are senior in a company’s capital structure; and they have a floating rate feature, which could help if rates eventually move higher.
While the portfolio is not as aggressively postured as it was a year ago, we are not overly defensive either. We think of our current positioning as neutral. We expect modest U.S. economic growth in the year ahead, and we believe that the high yield asset class offers a compelling risk/ reward trade-off. Europe is the wild card, and a successful resolution to Spain’s banking crisis is, in our opinion, more important than what happens in Greece.
Although we have a below-benchmark allocation in non-U.S. markets, we have more international exposure now than in prior periods. We have added several overseas credit analysts, and they have aided us in identifying high-quality European credits, of which several are household names, such as Reynolds Group, the leading aluminum foil marketer. Our sovereign analysts help us assess companies and their credit ratings, as well as a country’s sovereign rating. Our ability to understand these relationships is essential, as developments in Europe can drive large swings in the high yield market. While we are hopeful for a solution to the euro crisis, it is likely to be a factor for all asset classes for many years. Approximately 11% of the portfolio is invested in non-U.S. bonds, and about half of that is invested in developed western European companies. The rest of our overseas exposure is fairly evenly split between other developed countries and emerging markets. Because high yield is a risk asset, it tends to sell off when global concerns flare up.
OUTLOOK
Our 12-month outlook for the high yield market is cautiously positive, given the current valuations, solid fundamental underpinnings, a modestly growing domestic economy, and strong investor demand for above-average income in the current low-rate environment. Those factors taken together could lead to positive performance for the rest of the year. Exogenous factors—notably from the other side of the pond—including a “Grexit” (a Greek exit from the eurozone) or faltering global growth in key emerging markets, such as China and Brazil, could cause a capital flight to safe-haven investments. Right now, all eyes are focused on Spain, but next week another European country could be in the spotlight. We’re also watching developments in Washington related to fiscal policy and its impact on our economy. November’s elections will likely amplify this concern.
It seems that every time there are negative headlines about the European sovereign crisis, the high yield market declines. Despite the uncertain environment, we think the high yield market can generate returns that are comparable with its coupon for the rest of the year. Double-digit gains for the calendar year are not out of the question but, in our view, are unlikely. The summer has historically been a seasonally slow period—traders take leave and reduce risk taking—leading us to believe that the market is unlikely to regain positive momentum until September. Some investors view the asset class as a less risky alternative to equities. As a firm, T. Rowe Price has overweight allocations to high yield bonds across our asset allocation strategies because we believe the U.S. economy will continue to show improvement.
As always, our goal is to deliver high current income and attractive total returns over time while seeking to cushion the volatility inherent in this market. We will continue our commitment to research and diversification, which we believe is prudent for a fund that invests in a riskier area of the bond market.
Thank you for investing with T. Rowe Price.
Respectfully submitted,

Mark J. Vaselkiv
Chairman of the fund’s Investment Advisory Committee
June 11, 2012
The committee chairman has day-to-day responsibility for managing the portfolio and works with committee members in developing and executing the fund’s investment program.
RISKS OF BOND INVESTING
Bonds are subject to interest rate risk, the decline in bond prices that usually accompanies a rise in interest rates, and credit risk, the chance that any fund holding could have its credit rating downgraded or that a bond issuer will default (fail to make timely payments of interest or principal), potentially reducing the fund’s income level and share price. High yield corporate bonds could have greater price declines than funds that invest primarily in high-quality bonds. Companies issuing high yield bonds are not as strong financially as those with higher credit ratings, so the bonds are usually considered speculative investments.
GLOSSARY
Credit Suisse High Yield Index: Tracks the performance of domestic noninvestment-grade corporate bonds.
Duration: The average time (expressed in years) needed for an investor to receive the present value of the future cash flows on a fixed income investment. It is used to measure a bond or bond fund’s sensitivity to interest rate changes. For example, a fund with a three-year duration would fall about 3% in price in response to a one-percentage-point increase in interest rates, and vice versa. Modified duration provides a more accurate estimate of the fund’s price sensitivity based solely on changes in real interest rates.
Lipper averages: The averages of available mutual fund performance returns for specified time periods in categories defined by Lipper Inc.
SEC yield (30-day): A method of calculating a fund’s yield that assumes all portfolio securities are held until maturity. Yield will vary and is not guaranteed.
Weighted average maturity: In general, the longer the average maturity, the greater the fund’s sensitivity to interest rate changes. The weighted average maturity may take into account the interest rate readjustment dates for certain securities.

Performance and Expenses
This chart shows the value of a hypothetical $10,000 investment in the fund over the past 10 fiscal year periods or since inception (for funds lacking 10-year records). The result is compared with benchmarks, which may include a broad-based market index and a peer group average or index. Market indexes do not include expenses, which are deducted from fund returns as well as mutual fund averages and indexes.


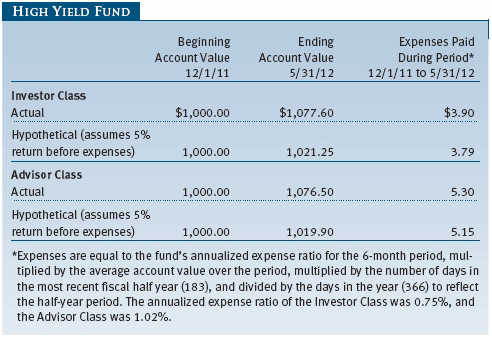
As a mutual fund shareholder, you may incur two types of costs: (1) transaction costs, such as redemption fees or sales loads, and (2) ongoing costs, including management fees, distribution and service (12b-1) fees, and other fund expenses. The following example is intended to help you understand your ongoing costs (in dollars) of investing in the fund and to compare these costs with the ongoing costs of investing in other mutual funds. The example is based on an investment of $1,000 invested at the beginning of the most recent six-month period and held for the entire period.
Please note that the fund has two share classes: The original share class (Investor Class) charges no distribution and service (12b-1) fee, and the Advisor Class shares are offered only through unaffiliated brokers and other financial intermediaries and charge a 0.25% 12b-1 fee. Each share class is presented separately in the table.
Actual Expenses
The first line of the following table (Actual) provides information about actual account values and expenses based on the fund’s actual returns. You may use the information on this line, together with your account balance, to estimate the expenses that you paid over the period. Simply divide your account value by $1,000 (for example, an $8,600 account value divided by $1,000 = 8.6), then multiply the result by the number on the first line under the heading “Expenses Paid During Period” to estimate the expenses you paid on your account during this period.
Hypothetical Example for Comparison Purposes
The information on the second line of the table (Hypothetical) is based on hypothetical account values and expenses derived from the fund’s actual expense ratio and an assumed 5% per year rate of return before expenses (not the fund’s actual return). You may compare the ongoing costs of investing in the fund with other funds by contrasting this 5% hypothetical example and the 5% hypothetical examples that appear in the shareholder reports of the other funds. The hypothetical account values and expenses may not be used to estimate the actual ending account balance or expenses you paid for the period.
Note: T. Rowe Price charges an annual account service fee of $20, generally for accounts with less than $10,000. The fee is waived for any investor whose T. Rowe Price mutual fund accounts total $50,000 or more; accounts electing to receive electronic delivery of account statements, transaction confirmations, prospectuses, and shareholder reports; or accounts of an investor who is a T. Rowe Price Preferred Services, Personal Services, or Enhanced Personal Services client (enrollment in these programs generally requires T. Rowe Price assets of at least $100,000). This fee is not included in the accompanying table. If you are subject to the fee, keep it in mind when you are estimating the ongoing expenses of investing in the fund and when comparing the expenses of this fund with other funds.
You should also be aware that the expenses shown in the table highlight only your ongoing costs and do not reflect any transaction costs, such as redemption fees or sales loads. Therefore, the second line of the table is useful in comparing ongoing costs only and will not help you determine the relative total costs of owning different funds. To the extent a fund charges transaction costs, however, the total cost of owning that fund is higher.

The accompanying notes are an integral part of these financial statements.
The accompanying notes are an integral part of these financial statements.


The accompanying notes are an integral part of these financial statements.


The accompanying notes are an integral part of these financial statements.

The accompanying notes are an integral part of these financial statements.
The accompanying notes are an integral part of these financial statements.
| Notes to Financial Statements |
T. Rowe Price High Yield Fund, Inc. (the fund), is registered under the Investment Company Act of 1940 (the 1940 Act) as a diversified, open-end management investment company. The fund seeks high current income and, secondarily, capital appreciation. The fund has two classes of shares: the High Yield Fund original share class, referred to in this report as the Investor Class, offered since December 31, 1984, and the High Yield Fund–Advisor Class (Advisor Class), offered since March 31, 2000. Advisor Class shares are sold only through unaffiliated brokers and other unaffiliated financial intermediaries that are compensated by the class for distribution, shareholder servicing, and/or certain administrative services under a Board-approved Rule 12b-1 plan. Each class has exclusive voting rights on matters related solely to that class; separate voting rights on matters that relate to both classes; and, in all other respects, the same rights and obligations as the other class.
NOTE 1 - SIGNIFICANT ACCOUNTING POLICIES
Basis of Preparation The accompanying financial statements were prepared in accordance with accounting principles generally accepted in the United States of America (GAAP), which require the use of estimates made by management. Management believes that estimates and valuations are appropriate; however, actual results may differ from those estimates, and the valuations reflected in the accompanying financial statements may differ from the value ultimately realized upon sale or maturity.
Investment Transactions, Investment Income, and Distributions Income and expenses are recorded on the accrual basis. Premiums and discounts on debt securities are amortized for financial reporting purposes. Paydown gains and losses are recorded as an adjustment to interest income. Dividends received from mutual fund investments are reflected as dividend income; capital gain distributions are reflected as realized gain/loss. Dividend income and capital gain distributions are recorded on the ex-dividend date. Income tax-related interest and penalties, if incurred, would be recorded as income tax expense. Investment transactions are accounted for on the trade date. Realized gains and losses are reported on the identified cost basis. Distributions to shareholders are recorded on the ex-dividend date. Income distributions are declared by each class daily and paid monthly. Capital gain distributions, if any, are generally declared and paid by the fund annually.
Currency Translation Assets, including investments, and liabilities denominated in foreign currencies are translated into U.S. dollar values each day at the prevailing exchange rate, using the mean of the bid and asked prices of such currencies against U.S. dollars as quoted by a major bank. Purchases and sales of securities, income, and expenses are translated into U.S. dollars at the prevailing exchange rate on the date of the transaction. The effect of changes in foreign currency exchange rates on realized and unrealized security gains and losses is reflected as a component of security gains and losses.
Class Accounting The Advisor Class pays distribution, shareholder servicing, and/or certain administrative expenses in the form of Rule 12b-1 fees, in an amount not exceeding 0.25% of the class’s average daily net assets. Shareholder servicing, prospectus, and shareholder report expenses incurred by each class are charged directly to the class to which they relate. Expenses common to both classes and investment income are allocated to the classes based upon the relative daily net assets of each class’s settled shares; realized and unrealized gains and losses are allocated based upon the relative daily net assets of each class’s outstanding shares.
Credits The fund earns credits on temporarily uninvested cash balances held at the custodian, which reduce the fund’s custody charges. Custody expense in the accompanying financial statements is presented before reduction for credits, which are reflected as expenses paid indirectly.
Redemption Fees The fund assesses a fee on redemptions of fund shares held for 90 days or less to deter short-term trading and to protect the interests of long-term shareholders. For fund shares purchased through August 14, 2011, the redemption fee rate was 1%; for fund shares purchased thereafter, the redemption fee rate increased to 2%. Redemption fees are withheld from proceeds that shareholders receive from the sale or exchange of fund shares. The fees are paid to the fund and are recorded as an increase to paid-in capital. The fees may cause the redemption price per share to differ from the net asset value per share.
New Accounting Pronouncements In May 2011, the Financial Accounting Standards Board (FASB) issued amended guidance to align fair value measurement and disclosure requirements in U.S. GAAP with International Financial Reporting Standards. The guidance is effective for fiscal years and interim periods beginning on or after December 15, 2011. Adoption will have no effect on net assets or results of operations.
In December 2011, the FASB issued amended guidance to enhance disclosure for offsetting assets and liabilities. The guidance is effective for fiscal years and interim periods beginning on or after January 1, 2013; adoption will have no effect on the fund’s net assets or results of operations.
NOTE 2 - VALUATION
The fund’s financial instruments are reported at fair value as defined by GAAP. The fund determines the values of its assets and liabilities and computes each class’s net asset value per share at the close of the New York Stock Exchange (NYSE), normally 4 p.m. ET, each day that the NYSE is open for business.
Valuation Methods Debt securities are generally traded in the over-the-counter (OTC) market. Securities with remaining maturities of one year or more at the time of acquisition are valued at prices furnished by dealers who make markets in such securities or by an independent pricing service, which considers the yield or price of bonds of comparable quality, coupon, maturity, and type, as well as prices quoted by dealers who make markets in such securities. Securities with remaining maturities of less than one year at the time of acquisition generally use amortized cost in local currency to approximate fair value. However, if amortized cost is deemed not to reflect fair value or the fund holds a significant amount of such securities with remaining maturities of more than 60 days, the securities are valued at prices furnished by dealers who make markets in such securities or by an independent pricing service.
Equity securities listed or regularly traded on a securities exchange or in the OTC market are valued at the last quoted sale price or, for certain markets, the official closing price at the time the valuations are made, except for OTC Bulletin Board securities, which are valued at the mean of the latest bid and asked prices. A security that is listed or traded on more than one exchange is valued at the quotation on the exchange determined to be the primary market for such security. Listed securities not traded on a particular day are valued at the mean of the latest bid and asked prices for domestic securities and the last quoted sale price for international securities.
Investments in mutual funds are valued at the mutual fund’s closing net asset value per share on the day of valuation. Purchased and written options, and OTC options with a listed equivalent, are valued at the mean of the closing bid and asked prices. Options on futures contracts are valued at the closing settlement prices. Financial futures contracts are valued at closing settlement prices. Forward currency exchange contracts are valued using the prevailing forward exchange rate. Swaps are valued at prices furnished by independent swap dealers or by an independent pricing service.
Other investments, including restricted securities and private placements, and those financial instruments for which the above valuation procedures are inappropriate or are deemed not to reflect fair value, are stated at fair value as determined in good faith by the T. Rowe Price Valuation Committee, established by the fund’s Board of Directors (the Board). Subject to oversight by the Board, the Valuation Committee develops pricing-related policies and procedures and approves all fair-value determinations. The Valuation Committee regularly makes good faith judgments, using a wide variety of sources and information, to establish and adjust valuations of certain securities as events occur and circumstances warrant. For instance, in determining the fair value of private-equity instruments, the Valuation Committee considers a variety of factors, including the company’s business prospects, its financial performance, strategic events impacting the company, relevant valuations of similar companies, new rounds of financing, and any negotiated transactions of significant size between other investors in the company. Because any fair-value determination involves a significant amount of judgment, there is a degree of subjectivity inherent in such pricing decisions.
For valuation purposes, the last quoted prices of non-U.S. equity securities may be adjusted under the circumstances described below. If the fund determines that developments between the close of a foreign market and the close of the NYSE will, in its judgment, materially affect the value of some or all of its portfolio securities, the fund will adjust the previous closing prices to reflect what it believes to be the fair value of the securities as of the close of the NYSE. In deciding whether it is necessary to adjust closing prices to reflect fair value, the fund reviews a variety of factors, including developments in foreign markets, the performance of U.S. securities markets, and the performance of instruments trading in U.S. markets that represent foreign securities and baskets of foreign securities. A fund may also fair value securities in other situations, such as when a particular foreign market is closed but the fund is open. The fund uses outside pricing services to provide it with closing prices and information to evaluate and/or adjust those prices. The fund cannot predict how often it will use closing prices and how often it will determine it necessary to adjust those prices to reflect fair value. As a means of evaluating its security valuation process, the fund routinely compares closing prices, the next day’s opening prices in the same markets, and adjusted prices. Additionally, trading in the underlying securities of the fund may take place in various foreign markets on certain days when the fund is not open for business and does not calculate a net asset value. As a result, net asset values may be significantly affected on days when shareholders cannot make transactions.
Valuation Inputs Various inputs are used to determine the value of the fund’s financial instruments. These inputs are summarized in the three broad levels listed below:
Level 1 – quoted prices in active markets for identical financial instruments
Level 2 – observable inputs other than Level 1 quoted prices (including, but not limited to, quoted prices for similar financial instruments, interest rates, prepayment speeds, and credit risk)
Level 3 – unobservable inputs
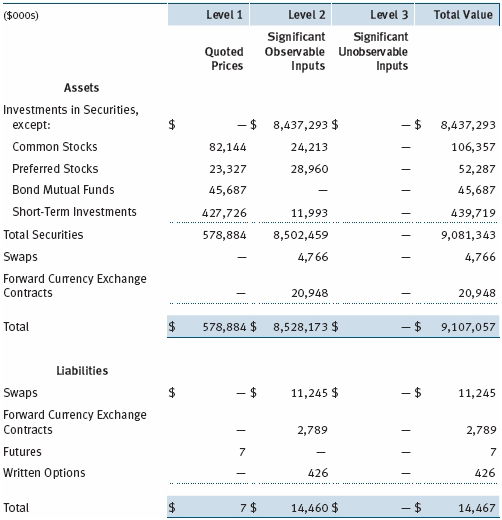
Observable inputs are those based on market data obtained from sources independent of the fund, and unobservable inputs reflect the fund’s own assumptions based on the best information available. The input levels are not necessarily an indication of the risk or liquidity associated with financial instruments at that level. For example, non-U.S. equity securities actively traded in foreign markets generally are reflected in Level 2 despite the availability of closing prices because the fund evaluates and determines whether those closing prices reflect fair value at the close of the NYSE or require adjustment, as described above. The following table summarizes the fund’s financial instruments, based on the inputs used to determine their values on May 31, 2012:
Following is a reconciliation of the fund’s Level 3 investments for the year ended May 31, 2012. Gain (loss) reflects both the realized and change in unrealized gain (loss) on Level 3 securities during the period, and is included on the accompanying Statement of Operations; $000 of this balance represents the change in unrealized gain/loss on Level 3 investments held at May 31, 2012.

NOTE 3 - DERIVATIVE INSTRUMENTS
During the year ended May 31, 2012, the fund invested in derivative instruments. As defined by GAAP, a derivative is a financial instrument whose value is derived from an underlying security price, foreign exchange rate, interest rate, index of prices or rates, or other variable; it requires little or no initial investment and permits or requires net settlement. The fund invests in derivatives only if the expected risks and rewards are consistent with its investment objectives, policies, and overall risk profile, as described in its prospectus and Statement of Additional Information. The fund may use derivatives for a variety of purposes, such as seeking to hedge against declines in principal value, increase yield, invest in an asset with greater efficiency and at a lower cost than is possible through direct investment, or to adjust portfolio duration and credit exposure. The risks associated with the use of derivatives are different from, and potentially much greater than, the risks associated with investing directly in the instruments on which the derivatives are based. Investments in derivatives can magnify returns positively or negatively; however, the fund at all times maintains sufficient cash reserves, liquid assets, or other SEC-permitted asset types to cover the settlement obligations under its open derivative contracts.
The fund values its derivatives at fair value, as described below and in Note 2, and recognizes changes in fair value currently in its results of operations. Accordingly, the fund does not follow hedge accounting, even for derivatives employed as economic hedges. The fund does not offset the fair value of derivative instruments against the right to reclaim or obligation to return collateral.
The following table summarizes the fair value of the fund’s derivative instruments held as of May 31, 2012, and the related location on the accompanying Statement of Assets and Liabilities, presented by primary underlying risk exposure:

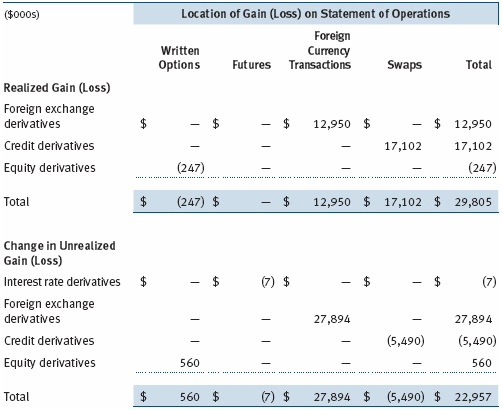
Additionally, the amount of gains and losses on derivative instruments recognized in fund earnings during the year ended May 31, 2012, and the related location on the accompanying Statement of Operations is summarized in the following table by primary underlying risk exposure:
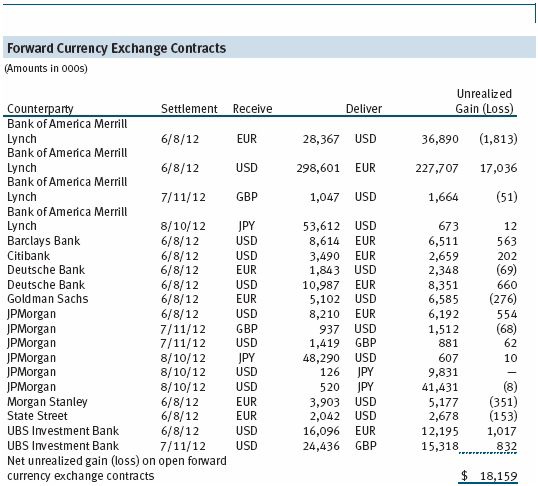
Forward Currency Exchange Contracts The fund is subject to foreign currency exchange rate risk in the normal course of pursuing its investment objectives. It uses forward currency exchange contracts (forwards) primarily to protect its non-U.S. dollar-denominated securities from adverse currency movements relative to the U.S. dollar. A forward involves an obligation to purchase or sell a fixed amount of a specific currency on a future date at a price set at the time of the contract. Although certain forwards may be settled by exchanging only the net gain or loss on the contract, most forwards are settled with the exchange of the underlying currencies in accordance with the specified terms. Forwards are valued at the unrealized gain or loss on the contract, which reflects the net amount the fund either is entitled to receive or obligated to deliver, as measured by the difference between the forward exchange rates at the date of entry into the contract and the forward rates at the reporting date. Appreciated forwards are reflected as assets, and depreciated forwards are reflected as liabilities on the accompanying Statement of Assets and Liabilities. Risks related to the use of forwards include the possible failure of counterparties to meet the terms of the agreements; that anticipated currency movements will not occur, thereby reducing the fund’s total return; and the potential for losses in excess of the fund’s initial investment. During the year ended May 31, 2012, the fund’s exposure to forwards, based on underlying notional amounts, was generally between 2% and 6% of net assets.
Futures Contracts The fund is subject to interest rate risk in the normal course of pursuing its investment objectives and uses futures contracts to help manage such risk. The fund may enter into futures contracts to manage exposure to interest rate and yield curve movements, security prices, foreign currencies, credit quality, and mortgage prepayments; as an efficient means of adjusting exposure to all or part of a target market; to enhance income; as a cash management tool; and/or to adjust portfolio duration and credit exposure. A futures contract provides for the future sale by one party and purchase by another of a specified amount of a particular underlying financial instrument at an agreed-upon price, date, time, and place. The fund currently invests only in exchange-traded futures, which generally are standardized as to maturity date, underlying financial instrument, and other contract terms. Upon entering into a futures contract, the fund is required to deposit with the broker cash or securities in an amount equal to a certain percentage of the contract value (initial margin deposit); the margin deposit must then be maintained at the established level over the life of the contract. Subsequent payments are made or received by the fund each day to settle daily fluctuations in the value of the contract (variation margin), which reflect changes in the value of the underlying financial instrument. Variation margin is recorded as unrealized gain or loss until the contract is closed. The value of a futures contract included in net assets is the amount of unsettled variation margin; net variation margin receivable is reflected as an asset, and net variation margin payable is reflected as a liability on the accompanying Statement of Assets and Liabilities. Risks related to the use of futures contracts include possible illiquidity of the futures markets, contract prices that can be highly volatile and imperfectly correlated to movements in hedged security values and/or interest rates, and potential losses in excess of the fund’s initial investment. During the year ended May 31, 2012, the fund’s exposure to futures, based on underlying notional amounts, was generally less than 1% of net assets.
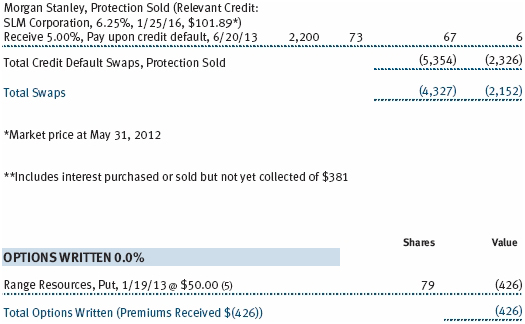
Options The fund is subject to equity price risk in the normal course of pursuing its investment objectives and uses options to help manage such risk. The fund may use call and put options to manage exposure to interest rates, security prices, foreign currencies, and credit quality; as an efficient means of adjusting exposure to all or a part of a target market; to enhance income; as a cash management tool; and/or to adjust portfolio duration and credit exposure. Call and put options give the holder the right, in return for a premium paid, to purchase or sell, respectively, a security at a specified exercise price at any time during the period of the option. Options are included in net assets at fair value; purchased options are included in Investments in Securities; and written options are separately reflected as a liability on the accompanying Statement of Assets and Liabilities. Premiums on unexercised, expired options are recorded as realized gains or losses; premiums on exercised options are recorded as an adjustment to the proceeds from the sale or cost of the purchase. The difference between the premium and the amount received or paid in a closing transaction is also treated as realized gain or loss. Risks related to the use of options include possible illiquidity of the options markets; trading restrictions imposed by an exchange; movements in underlying security values; and for written options, potential losses in excess of the fund’s initial investment. During the year ended May 31, 2012, the fund’s exposure to options, based on underlying notional amounts, was generally less than 1% of net assets. Transactions in written options and related premiums received during the year ended May 31, 2012, were as follows:

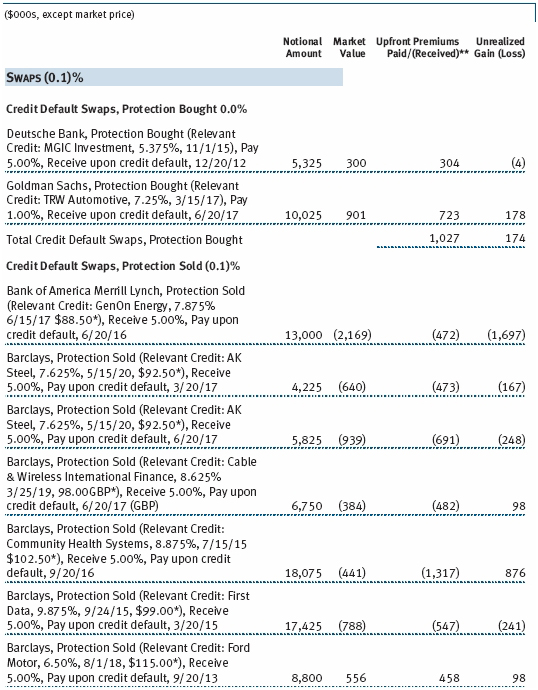
Credit Default Swaps The fund is subject to credit risk in the normal course of pursuing its investment objectives and uses swap contracts to help manage such risk. The fund may use swaps in an effort to manage exposure to changes in interest rates, inflation rates, and credit quality; to adjust overall exposure to certain markets; to enhance total return or protect the value of portfolio securities; to serve as a cash management tool; and/or to adjust portfolio duration or credit exposure. Credit default swaps are agreements where one party (the protection buyer) agrees to make periodic payments to another party (the protection seller) in exchange for protection against specified credit events, such as certain defaults and bankruptcies related to an underlying credit instrument, or issuer or index of such instruments. Upon occurrence of a specified credit event, the protection seller is required to pay the buyer the difference between the notional amount of the swap and the value of the underlying credit, either in the form of a net cash settlement or by paying the gross notional amount and accepting delivery of the relevant underlying credit. For credit default swaps where the underlying credit is an index, a specified credit event may affect all or individual underlying securities included in the index and will be settled based upon the relative weighting of the affected underlying security(s) within the index. Generally, the payment risk for the seller of protection is inversely related to the current market price of the underlying credit; or, in the case of an index swap, the market value of the contract relative to the notional amount. Therefore, the payment risk increases as the price of the relevant underlying credit, or market value of the index swap, declines due to market valuations of credit quality. As of May 31, 2012, the notional amount of protection sold by the fund totaled $245,223,000 (2.7% of net assets), which reflects the maximum potential amount the fund could be required to pay under such contracts. The value of a swap included in net assets is the unrealized gain or loss on the contract plus or minus any unamortized premiums paid or received, respectively. Appreciated swaps and premiums paid are reflected as assets, and depreciated swaps and premiums received are reflected as liabilities on the accompanying Statement of Assets and Liabilities. Net periodic receipts or payments required by swaps are accrued daily and are recorded as realized gain or loss for financial reporting purposes when settled; fluctuations in the fair value of swaps are reflected in the change in net unrealized gain or loss and are reclassified to realized gain or loss upon termination prior to maturity or cash settlement. Risks related to the use of credit default swaps include the possible inability of the fund to accurately assess the current and future creditworthiness of underlying issuers, the possible failure of a counterparty to perform in accordance with the terms of the swap agreements, potential government regulation that could adversely affect the fund’s swap investments, and potential losses in excess of the fund’s initial investment. During the year ended May 31, 2012, the fund’s exposure to swaps, based on underlying notional amounts, was generally between 1% and 6% of net assets.
NOTE 4 - OTHER INVESTMENT TRANSACTIONS
Consistent with its investment objective, the fund engages in the following practices to manage exposure to certain risks and/or to enhance performance. The investment objective, policies, program, and risk factors of the fund are described more fully in the fund’s prospectus and Statement of Additional Information.
Noninvestment-Grade Debt Securities At May 31, 2012, approximately 89% of the fund’s net assets were invested, either directly or through its investment in T. Rowe Price institutional funds, in noninvestment-grade debt securities, commonly referred to as “high yield” or “junk” bonds. The noninvestment-grade bond market may experience sudden and sharp price swings due to a variety of factors, including changes in economic forecasts, stock market activity, large sustained sales by major investors, a high-profile default, or a change in the market’s psychology. These events may decrease the ability of issuers to make principal and interest payments and adversely affect the liquidity or value, or both, of such securities.
Restricted Securities The fund may invest in securities that are subject to legal or contractual restrictions on resale. Prompt sale of such securities at an acceptable price may be difficult and may involve substantial delays and additional costs.
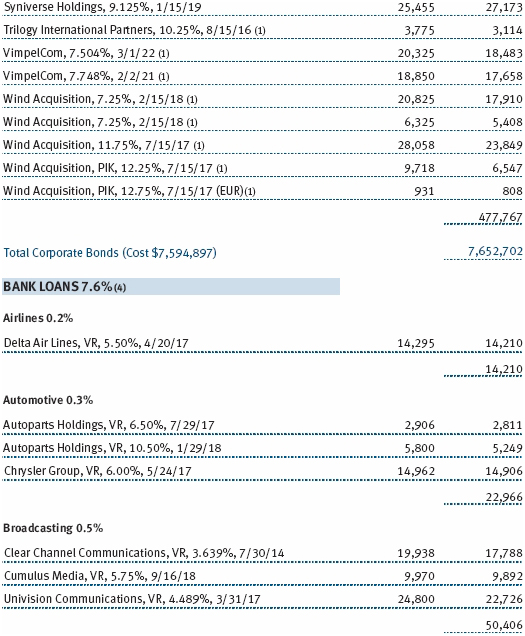
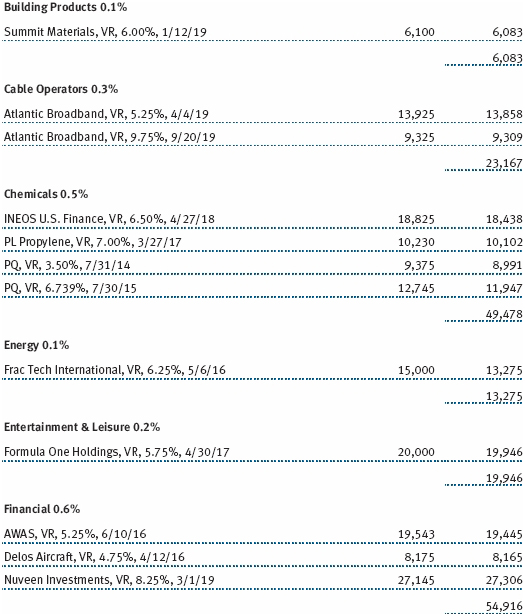
Bank Loans The fund may invest in bank loans, which represent an interest in amounts owed by a borrower to a syndication of lenders. Bank loans may involve multiple loans with the same borrower under a single credit agreement (each loan, a tranche), and each tranche may have different terms and associated risks. A bank or other financial institution typically acts as the agent and administers a bank loan in accordance with the associated credit agreement. Bank loans are generally noninvestment grade and often involve borrowers whose financial condition is troubled or uncertain and companies that are highly leveraged. The fund may buy and sell bank loans in the form of either loan assignments or loan participations. A loan assignment transfers all legal, beneficial, and economic rights to the buyer. Although loan assignments continue to be administered by the agent, the buyer acquires direct rights against the borrower. In many cases, a loan assignment requires the consent of both the borrower and the agent. In contrast, a loan participation generally entitles the buyer to receive the cash flows from principal, interest, and any fee payments that the seller is entitled to receive from the borrower; however, the seller continues to hold legal title to the loan. As a result, with loan participations, the buyer generally has no right to enforce compliance with the terms of the credit agreement against the borrower, and the buyer is subject to the credit risk of both the borrower and the seller. Bank loans often have extended settlement periods, during which the fund is subject to nonperformance by the counterparty. A portion of the fund’s bank loans may require additional principal to be funded at the borrowers’ discretion at a later date (unfunded commitments), and bank loans usually may be repaid any time at the option of the borrower. The fund reflects both the funded portion of the bank loan as well as any unfunded commitment on the loan in the Portfolio of Investments. Certain credit agreements include tranches that provide no initial funding but may require the full principal commitment to be funded at a future date(s) at the borrower’s discretion. Such agreements are not reflected in the Portfolio of Investments until funded. At May 31, 2012, the fund’s total unfunded commitments were $33,900,000.
Counterparty Risk and Collateral The fund has entered into collateral agreements with certain counterparties to mitigate counterparty risk associated with certain over-the-counter (OTC) financial instruments, including swaps, forward currency exchange contracts, TBA purchase commitments, and OTC options (collectively, covered OTC instruments). Subject to certain minimum exposure requirements (which typically range from $100,000 to $500,000), collateral requirements generally are determined and transfers made based on the net aggregate unrealized gain or loss on all OTC instruments covered by a particular collateral agreement with a specified counterparty. Collateral, both pledged by the fund to a counterparty and pledged by a counterparty to the fund, is held in a segregated account by a third-party agent and can be in the form of cash or debt securities issued by the U.S. government or related agencies. Securities posted as collateral by the fund to a counterparty are so noted in the accompanying Portfolio of Investments and remain in the fund’s net assets. As of May 31, 2012, securities valued at $9,903,000 had been posted by the fund to counterparties. In accordance with GAAP, cash pledged by counterparties to the fund is included in the fund’s net assets; however, securities pledged by counterparties to the fund are not recorded by the fund. As of May 31, 2012, collateral pledged by counterparties to the fund consisted of securities valued at $2,194,000.
At any point in time, the fund’s risk of loss from counterparty credit risk on covered OTC instruments is the aggregate unrealized gain on appreciated covered OTC instruments in excess of collateral, if any, pledged by the counterparty to the fund. Counterparty risk related to exchange-traded futures and options contracts is minimal because the exchange’s clearinghouse provides protection against counterparty defaults. Generally, for exchange-traded derivatives such as futures and options, each broker, in its sole discretion, may change margin requirements applicable to the fund. In accordance with the terms of the relevant derivatives agreements, counterparties to OTC derivatives may be able to terminate derivative contracts prior to maturity after the occurrence of certain stated events, such as a decline in net assets above a certain percentage or a failure by the fund to perform its obligations under the contract. Upon termination, all transactions would typically be liquidated and a net amount would be owed by or payable to the fund.
Other Purchases and sales of portfolio securities other than short-term securities aggregated $5,950,918,000 and $5,143,192,000, respectively, for the year ended May 31, 2012.
NOTE 5 - FEDERAL INCOME TAXES
No provision for federal income taxes is required since the fund intends to continue to qualify as a regulated investment company under Subchapter M of the Internal Revenue Code and distribute to shareholders all of its taxable income and gains. Distributions determined in accordance with federal income tax regulations may differ in amount or character from net investment income and realized gains for financial reporting purposes. Financial reporting records are adjusted for permanent book/tax differences to reflect tax character but are not adjusted for temporary differences.
The fund files U.S. federal, state, and local tax returns as required. The fund’s tax returns are subject to examination by the relevant tax authorities until expiration of the applicable statute of limitations, which is generally three years after the filing of the tax return but which can be extended to six years in certain circumstances. Tax returns for open years have incorporated no uncertain tax positions that require a provision for income taxes.
Reclassifications to paid-in capital relate primarily to a tax practice that treats a portion of the proceeds from each redemption of capital shares as a distribution of taxable net investment income and/or realized capital gain. Reclassifications between income and gain relate primarily to differences between book/tax amortization policies. For the year ended May 31, 2012, the following reclassifications were recorded to reflect tax character (there was no impact on results of operations or net assets):
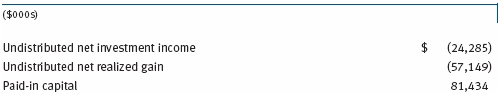
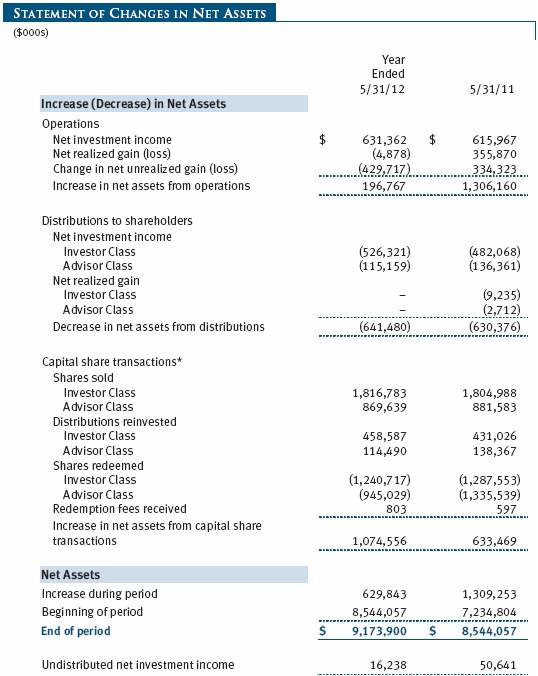
Distributions during the years ended May, 31, 2012 and May 31, 2011, totaled $641,480,000 and $630,376,000, respectively, and were characterized as ordinary income for tax purposes. At May 31, 2012, the tax-basis cost of investments and components of net assets were as follows:
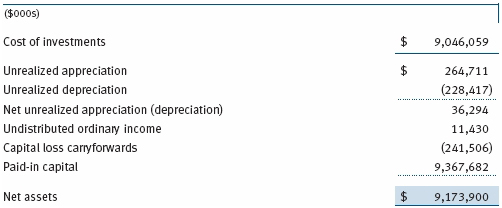
The difference between book-basis and tax-basis net unrealized appreciation (depreciation) is attributable to the realization of gains/losses on certain open derivative contracts for tax purposes. The fund intends to retain realized gains to the extent of available capital loss carryforwards. As a result of the Regulated Investment Company Modernization Act of 2010, net capital losses realized on or after June 1, 2011 (effective date) may be carried forward indefinitely to offset future realized capital gains; however, post-effective losses must be used before pre-effective capital loss carryforwards with expiration dates. Accordingly, it is possible that all or a portion of the fund’s pre-effective capital loss carryforwards could expire unused. Additionally, all or a portion of the fund’s capital loss carryforwards may be from losses realized between November 1 and the fund’s fiscal year-end, which are deferred for tax purposes until the subsequent year but recognized for financial reporting purposes in the year realized. During the year ended May 31, 2012, the fund utilized $13,259,000 of capital loss carryforwards. The fund’s available capital loss carryforwards as of May 31, 2012, expire as follows: $120,228,000 in fiscal 2017 and $68,620,000 in fiscal 2018; $52,658,000 have no expiration.
NOTE 6 - RELATED PARTY TRANSACTIONS
The fund is managed by T. Rowe Price Associates, Inc. (Price Associates), a wholly owned subsidiary of T. Rowe Price Group, Inc. (Price Group). The investment management agreement between the fund and Price Associates provides for an annual investment management fee, which is computed daily and paid monthly. The fee consists of an individual fund fee, equal to 0.30% of the fund’s average daily net assets, and a group fee. The group fee rate is calculated based on the combined net assets of certain mutual funds sponsored by Price Associates (the group) applied to a graduated fee schedule, with rates ranging from 0.48% for the first $1 billion of assets to 0.28% for assets in excess of $300 billion. The fund’s group fee is determined by applying the group fee rate to the fund’s average daily net assets. At May 31, 2012, the effective annual group fee rate was 0.30%.
In addition, the fund has entered into service agreements with Price Associates and two wholly owned subsidiaries of Price Associates (collectively, Price). Price Associates computes the daily share prices and provides certain other administrative services to the fund. T. Rowe Price Services, Inc., provides shareholder and administrative services in its capacity as the fund’s transfer and dividend disbursing agent. T. Rowe Price Retirement Plan Services, Inc., provides subaccounting and recordkeeping services for certain retirement accounts invested in the Investor Class. For the year ended May 31, 2012, expenses incurred pursuant to these service agreements were $206,000 for Price Associates; $1,500,000 for T. Rowe Price Services, Inc.; and $325,000 for T. Rowe Price Retirement Plan Services, Inc. The total amount payable at period-end pursuant to these service agreements is reflected as Due to Affiliates in the accompanying financial statements.
The fund is also one of several mutual funds sponsored by Price Associates (underlying Price funds) in which the T. Rowe Price Spectrum Funds (Spectrum Funds) and T. Rowe Price Retirement Funds (Retirement Funds) may invest. Neither the Spectrum Funds nor the Retirement Funds invest in the underlying Price funds for the purpose of exercising management or control. Pursuant to separate special servicing agreements, expenses associated with the operation of the Spectrum and Retirement Funds are borne by each underlying Price fund to the extent of estimated savings to it and in proportion to the average daily value of its shares owned by the Spectrum and Retirement Funds, respectively. Expenses allocated under these agreements are reflected as shareholder servicing expenses in the accompanying financial statements. For the year ended May 31, 2012, the fund was allocated $1,836,000 of Spectrum Funds’ expenses and $3,163,000 of Retirement Funds’ expenses. Of these amounts, $3,045,000 related to services provided by Price. The amount payable at period-end pursuant to this agreement is reflected as Due to Affiliates in the accompanying financial statements. At May 31, 2012, approximately 17% of the outstanding shares of the Investor Class were held by the Spectrum Funds and 25% were held by the Retirement Funds.
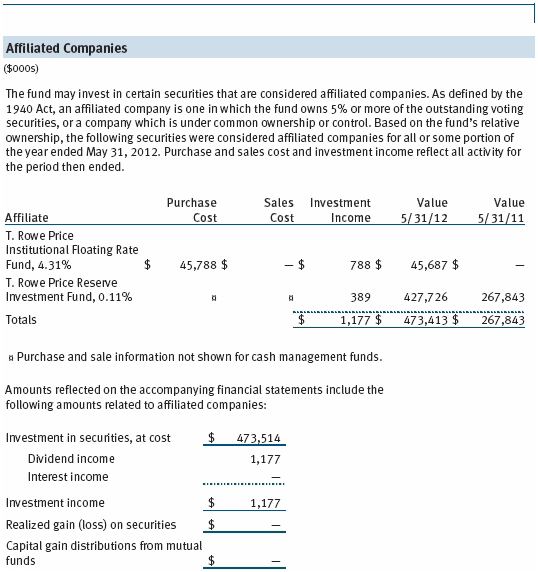
The fund may invest in the T. Rowe Price Reserve Investment Fund and the T. Rowe Price Government Reserve Investment Fund (collectively, the T. Rowe Price Reserve Investment Funds), open-end management investment companies managed by Price Associates and considered affiliates of the fund. The T. Rowe Price Reserve Investment Funds are offered as cash management options to mutual funds, trusts, and other accounts managed by Price Associates and/or its affiliates and are not available for direct purchase by members of the public. The T. Rowe Price Reserve Investment Funds pay no investment management fees.
| Report of Independent Registered Public Accounting Firm |
To the Board of Directors and Shareholders of T. Rowe Price
High Yield Fund, Inc.
In our opinion, the accompanying statement of assets and liabilities, including the portfolio of investments, and the related statements of operations and of changes in net assets and the financial highlights present fairly, in all material respects, the financial position of T. Rowe Price High Yield Fund, Inc. (the “Fund”) at May 31, 2012, and the results of its operations, the changes in its net assets and the financial highlights for each of the periods indicated therein, in conformity with accounting principles generally accepted in the United States of America. These financial statements and financial highlights (hereafter referred to as “financial statements”) are the responsibility of the Fund’s management; our responsibility is to express an opinion on these financial statements based on our audits. We conducted our audits of these financial statements in accordance with the standards of the Public Company Accounting Oversight Board (United States). Those standards require that we plan and perform the audit to obtain reasonable assurance about whether the financial statements are free of material misstatement. An audit includes examining, on a test basis, evidence supporting the amounts and disclosures in the financial statements, assessing the accounting principles used and significant estimates made by management, and evaluating the overall financial statement presentation. We believe that our audits, which included confirmation of securities at May 31, 2012 by correspondence with the custodian and brokers, and confirmation of the underlying funds by correspondence with the transfer agent, provide a reasonable basis for our opinion.
PricewaterhouseCoopers LLP
Baltimore, Maryland
July 13, 2012
| Tax Information (Unaudited) for the Tax Year Ended 5/31/12 |
We are providing this information as required by the Internal Revenue Code. The amounts shown may differ from those elsewhere in this report because of differences between tax and financial reporting requirements.
The fund’s distributions to shareholders included $50,868,000 from short-term capital gains.
For taxable non-corporate shareholders, $8,454,000 of the fund’s income represents qualified dividend income subject to the 15% rate category.
For corporate shareholders, $8,235,000 of the fund’s income qualifies for the dividends-received deduction.
| Information on Proxy Voting Policies, Procedures, and Records |
A description of the policies and procedures used by T. Rowe Price funds and portfolios to determine how to vote proxies relating to portfolio securities is available in each fund’s Statement of Additional Information, which you may request by calling 1-800-225-5132 or by accessing the SEC’s website, sec.gov. The description of our proxy voting policies and procedures is also available on our website, troweprice.com. To access it, click on the words “Our Company” at the top of our corporate homepage. Then, when the next page appears, click on the words “Proxy Voting Policies” on the left side of the page.
Each fund’s most recent annual proxy voting record is available on our website and through the SEC’s website. To access it through our website, follow the directions above, then click on the words “Proxy Voting Records” on the right side of the Proxy Voting Policies page.
| How to Obtain Quarterly Portfolio Holdings |
The fund files a complete schedule of portfolio holdings with the Securities and Exchange Commission for the first and third quarters of each fiscal year on Form N-Q. The fund’s Form N-Q is available electronically on the SEC’s website (sec.gov); hard copies may be reviewed and copied at the SEC’s Public Reference Room, 100 F St. N.E., Washington, DC 20549. For more information on the Public Reference Room, call 1-800-SEC-0330.
| Approval of Investment Management Agreement |
On March 6, 2012, the fund’s Board of Directors (Board), including a majority of the fund’s independent directors, approved the continuation of the investment management agreement (Advisory Contract) between the fund and its investment advisor, T. Rowe Price Associates, Inc. (Advisor). In connection with its deliberations, the Board requested, and the Advisor provided, such information as the Board (with advice from independent legal counsel) deemed reasonably necessary. The Board considered a variety of factors in connection with its review of the Advisory Contract, also taking into account information provided by the Advisor during the course of the year, as discussed below:
Services Provided by the Advisor
The Board considered the nature, quality, and extent of the services provided to the fund by the Advisor. These services included, but were not limited to, directing the fund’s investments in accordance with its investment program and the overall management of the fund’s portfolio, as well as a variety of related activities such as financial, investment operations, and administrative services; compliance; maintaining the fund’s records and registrations; and shareholder communications. The Board also reviewed the background and experience of the Advisor’s senior management team and investment personnel involved in the management of the fund, as well as the Advisor’s compliance record. The Board concluded that it was satisfied with the nature, quality, and extent of the services provided by the Advisor.
Investment Performance of the Fund
The Board reviewed the fund’s average annual total returns over the three-month and 1-, 3-, 5-, and 10-year periods, as well as the fund’s year-by-year returns, and compared these returns with a wide variety of previously agreed upon comparable performance measures and market data, including those supplied by Lipper and Morningstar, which are independent providers of mutual fund data.
On the basis of this evaluation and the Board’s ongoing review of investment results, and factoring in the relative market conditions during certain of the performance periods, the Board concluded that the fund’s performance was satisfactory.
Costs, Benefits, Profits, and Economies of Scale
The Board reviewed detailed information regarding the revenues received by the Advisor under the Advisory Contract and other benefits that the Advisor (and its affiliates) may have realized from its relationship with the fund, including any research received under “soft dollar” agreements and commission-sharing arrangements with broker-dealers. The Board considered that the Advisor may receive some benefit from soft-dollar arrangements pursuant to which research is received from broker-dealers that execute the applicable fund’s portfolio transactions. The Board received information on the estimated costs incurred and profits realized by the Advisor from managing T. Rowe Price mutual funds. The Board also reviewed estimates of the profits realized from managing the fund in particular, and the Board concluded that the Advisor’s profits were reasonable in light of the services provided to the fund.
The Board also considered whether the fund benefits under the fee levels set forth in the Advisory Contract from any economies of scale realized by the Advisor. Under the Advisory Contract, the fund pays a fee to the Advisor for investment management services composed of two components—a group fee rate based on the combined average net assets of most of the T. Rowe Price mutual funds (including the fund) that declines at certain asset levels and an individual fund fee rate based on the fund’s average daily net assets—and the fund pays its own expenses of operations. The Board concluded that the advisory fee structure for the fund continued to provide for a reasonable sharing of benefits from any economies of scale with the fund’s investors.
Fees
The Board was provided with information regarding industry trends in management fees and expenses, and the Board reviewed the fund’s management fee rate, operating expenses, and total expense ratio (for the Investor Class and Advisor Class) in comparison with fees and expenses of other comparable funds based on information and data supplied by Lipper. The information provided to the Board indicated that the fund’s management fee rate was above the median for comparable funds. The information also indicated that the total expense ratio (for both the Investor Class and Advisor Class) was below the median for comparable funds.
The Board also reviewed the fee schedules for institutional accounts and private accounts with similar mandates that are advised or subadvised by the Advisor and its affiliates. Management provided the Board with information about the Advisor’s responsibilities and services provided to institutional account clients, including information about how the requirements and economics of the institutional business are fundamentally different from those of the mutual fund business. The Board considered information showing that the mutual fund business is generally more complex from a business and compliance perspective than the institutional business and that the Advisor generally performs significant additional services and assumes greater risk in managing the fund and other T. Rowe Price mutual funds than it does for institutional account clients.
On the basis of the information provided and the factors considered, the Board concluded that the fees paid by the fund under the Advisory Contract are reasonable.
Approval of the Advisory Contract
As noted, the Board approved the continuation of the Advisory Contract. No single factor was considered in isolation or to be determinative to the decision. Rather, the Board concluded, in light of a weighting and balancing of all factors considered, that it was in the best interests of the fund and its shareholders for the Board to approve the continuation of the Advisory Contract (including the fees to be charged for services thereunder). The independent directors were advised throughout the process by independent legal counsel.
| About the Fund’s Directors and Officers |
Your fund is overseen by a Board of Directors (Board) that meets regularly to review a wide variety of matters affecting the fund, including performance, investment programs, compliance matters, advisory fees and expenses, service providers, and other business affairs. The Board elects the fund’s officers, who are listed in the final table. At least 75% of the Board’s members are independent of T. Rowe Price Associates, Inc. (T. Rowe Price), and its affiliates; “inside” or “interested” directors are employees or officers of T. Rowe Price. The business address of each director and officer is 100 East Pratt Street, Baltimore, Maryland 21202. The Statement of Additional Information includes additional information about the fund directors and is available without charge by calling a T. Rowe Price representative at 1-800-638-5660.
| Independent Directors |
| |
| Name | | |
| (Year of Birth) | | Principal Occupation(s) and Directorships of Public Companies and |
| Year Elected* | | Other Investment Companies During the Past Five Years |
| | | |
| William R. Brody | | President and Trustee, Salk Institute for Biological Studies (2009 |
| (1944) | | to present); Director, Novartis, Inc. (2009 to present); Director, IBM |
| 2009 | | (2007 to present); President and Trustee, Johns Hopkins University |
| | (1996 to 2009); Chairman of Executive Committee and Trustee, |
| | Johns Hopkins Health System (1996 to 2009) |
| | | |
| Jeremiah E. Casey | | Retired |
| (1940) | | |
| 2006 | | |
| | | |
| Anthony W. Deering | | Chairman, Exeter Capital, LLC, a private investment firm (2004 |
| (1945) | | to present); Director, Under Armour (2008 to present); Director, |
| 1984 | | Vornado Real Estate Investment Trust (2004 to present); Director |
| | and Member of the Advisory Board, Deutsche Bank North America |
| | (2004 to present); Director, Mercantile Bankshares (2002 to 2007) |
| | | |
| Donald W. Dick, Jr. | | Principal, EuroCapital Partners, LLC, an acquisition and management |
| (1943) | | advisory firm (1995 to present) |
| 2001 | | |
| | | |
| Robert J. Gerrard, Jr. | | Director and Chairman of Compensation Committee, Syniverse |
| (1952) | | Holdings, Inc. (2008 to 2011); Executive Vice President and General |
| 2012 | | Counsel, Scripps Networks, LLC (1997 to 2009); Advisory Board |
| | Member, Pipeline Crisis/Winning Strategies (1997 to present) |
| | | |
| Karen N. Horn | | Senior Managing Director, Brock Capital Group, an advisory and |
| (1943) | | investment banking firm (2004 to present); Director, Eli Lilly and |
| 2003 | | Company (1987 to present); Director, Simon Property Group (2004 |
| | to present); Director, Norfolk Southern (2008 to present); Director, |
| | Fannie Mae (2006 to 2008) |
| | | |
| Theo C. Rodgers | | President, A&R Development Corporation (1977 to present) |
| (1941) | | |
| 2005 | | |
| | | |
| Cecelia E. Rouse, Ph.D. | | Professor and Researcher, Princeton University (1992 to present); |
| (1963) | | Director, MDRC (2011 to present); Member, National Academy of |
| 2012 | | Education (2010 to present); Research Associate, National Bureau |
| | of Economic Research’s Labor Studies Program (1998 to 2009 |
| | and 2011 to present); Member, President’s Council of Economic |
| | Advisors (2009 to 2011); Member, The MacArthur Foundation |
| | Network on the Transition to Adulthood and Public Policy (2000 to |
| | 2008); Member, National Advisory Committee for the Robert Wood |
| | Johnson Foundation’s Scholars in Health Policy Research Program |
| | (2008); Director and Member, National Economic Association |
| | (2006 to 2008); Member, Association of Public Policy Analysis and |
| | Management Policy Council (2006 to 2008); Member, Hamilton |
| | Project’s Advisory Board at The Brookings Institute (2006 to 2008); |
| | Chair of Committee on the Status of Minority Groups in the Economic |
| | Profession, American Economic Association (2006 to 2008) |
| | | |
| John G. Schreiber | | Owner/President, Centaur Capital Partners, Inc., a real estate |
| (1946) | | investment company (1991 to present); Cofounder and Partner, |
| 1992 | | Blackstone Real Estate Advisors, L.P. (1992 to present); Director, |
| | General Growth Properties, Inc. (2010 to present) |
| | | |
| Mark R. Tercek | | President and Chief Executive Officer, The Nature Conservancy (2008 |
| (1957) | | to present); Managing Director, The Goldman Sachs Group, Inc. |
| 2009 | | (1984 to 2008) |
| |
| *Each independent director oversees 136 T. Rowe Price portfolios and serves until retirement, resignation, or election of a successor. |
| |
| Inside Directors |
| |
| Name | | |
| (Year of Birth) | | |
| Year Elected* | | |
| [Number of T. Rowe Price | | Principal Occupation(s) and Directorships of Public Companies and |
| Portfolios Overseen] | | Other Investment Companies During the Past Five Years |
| | | |
| Edward C. Bernard | | Director and Vice President, T. Rowe Price; Vice Chairman of the |
| (1956) | | Board, Director, and Vice President, T. Rowe Price Group, Inc.; |
| 2006 | | Chairman of the Board, Director, and President, T. Rowe Price |
| [136] | | Investment Services, Inc.; Chairman of the Board and Director, |
| | T. Rowe Price Retirement Plan Services, Inc., T. Rowe Price Savings |
| | Bank, and T. Rowe Price Services, Inc.; Chairman of the Board, Chief |
| | Executive Officer, and Director, T. Rowe Price International; Chief |
| | Executive Officer, Chairman of the Board, Director, and President, |
| | T. Rowe Price Trust Company; Chairman of the Board, all funds |
| | | |
| Michael C. Gitlin | | Director of Fixed Income, T. Rowe Price (2009 to present); Global |
| (1970) | | Head of Trading, T. Rowe Price (2007 to 2009); Vice President, Price |
| 2010 | | Hong Kong, Price Singapore, T. Rowe Price, T. Rowe Price Group, Inc., |
| [46] | | and T. Rowe Price International |
| |
| *Each inside director serves until retirement, resignation, or election of a successor. |
| Officers | | |
| |
| Name (Year of Birth) | | |
| Position Held With High Yield Fund | | Principal Occupation(s) |
| | | |
| Jason A. Bauer (1979) | | Vice President, T. Rowe Price and T. Rowe Price |
| Vice President | | Group, Inc. |
| | | |
| Andrew M. Brooks (1956) | | Vice President, T. Rowe Price and T. Rowe Price |
| Vice President | | Group, Inc. |
| | | |
| Michael F. Connelly, CFA (1977) | | Vice President, T. Rowe Price and T. Rowe Price |
| Vice President | | Group, Inc. |
| | | |
| Michael Della Vedova (1969) | | Vice President, T. Rowe Price Group, Inc. and |
| Vice President | | T. Rowe Price International; formerly Cofounder |
| | and Partner, Four Quarter Capital (to 2009) |
| | | |
| Carson R. Dickson, CFA, CPA (1976) | | Vice President, T. Rowe Price and T. Rowe Price |
| Vice President | | Group, Inc.; formerly Equity Research Analyst, |
| | MTB Investment Advisors (to 2008) |
| | | |
| Roger L. Fiery III, CPA (1959) | | Vice President, Price Hong Kong, Price |
| Vice President | | Singapore, T. Rowe Price, T. Rowe Price Group, |
| | Inc., T. Rowe Price International, and T. Rowe |
| | Price Trust Company |
| | | |
| Stephen M. Finamore, CPA (1976) | | Vice President, T. Rowe Price and T. Rowe Price |
| Vice President | | Group, Inc. |
| | | |
| Justin T. Gerbereux, CFA (1975) | | Vice President, T. Rowe Price, T. Rowe Price |
| Vice President | | Group, Inc., and T. Rowe Price Trust Company |
| | | |
| John R. Gilner (1961) | | Chief Compliance Officer and Vice President, |
| Chief Compliance Officer | | T. Rowe Price; Vice President, T. Rowe Price |
| | Group, Inc., and T. Rowe Price Investment |
| | Services, Inc. |
| | | |
| Gregory S. Golczewski (1966) | | Vice President, T. Rowe Price and T. Rowe Price |
| Vice President | | Trust Company |
| | | |
| Gregory K. Hinkle, CPA (1958) | | Vice President, T. Rowe Price, T. Rowe Price |
| Treasurer | | Group, Inc., and T. Rowe Price Trust Company |
| | | |
| Andrew P. Jamison (1981) | | Vice President, T. Rowe Price; formerly stu- |
| Vice President | | dent, Darden Graduate School of Business |
| | Administration, University of Virginia (to 2009), |
| | Analyst, Carlson Capital, LP (to 2008) |
| | | |
| Paul A. Karpers, CFA (1967) | | Vice President, T. Rowe Price and T. Rowe Price |
| Vice President | | Group, Inc. |
| | | |
| Patricia B. Lippert (1953) | | Assistant Vice President, T. Rowe Price and |
| Secretary | | T. Rowe Price Investment Services, Inc. |
| | | |
| Paul M. Massaro, CFA (1975) | | Vice President, T. Rowe Price, T. Rowe Price |
| Vice President | | Group, Inc., and T. Rowe Price Trust Company |
| | | |
| Michael J. McGonigle (1966) | | Vice President, T. Rowe Price and T. Rowe Price |
| Vice President | | Group, Inc. |
| | | |
| David Oestreicher (1967) | | Director and Vice President, T. Rowe Price |
| Vice President | | Investment Services, Inc., T. Rowe Price |
| | Retirement Plan Services, Inc., T. Rowe |
| | Price Services, Inc., and T. Rowe Price Trust |
| | Company; Vice President, Price Hong Kong, |
| | Price Singapore, T. Rowe Price, T. Rowe Price |
| | Group, Inc., and T. Rowe Price International |
| | | |
| Brian A. Rubin, CPA (1974) | | Vice President, T. Rowe Price, T. Rowe Price |
| Vice President | | Group, Inc., and T. Rowe Price Trust Company |
| | | |
| Deborah D. Seidel (1962) | | Vice President, T. Rowe Price, T. Rowe Price |
| Vice President | | Group, Inc., T. Rowe Price Investment Services, |
| | Inc., and T. Rowe Price Services, Inc. |
| | | |
| Walter P. Stuart III, CFA (1960) | | Vice President, T. Rowe Price and T. Rowe Price |
| Vice President | | Group, Inc. |
| | | |
| Thomas E. Tewksbury (1961) | | Vice President, T. Rowe Price, T. Rowe Price |
| Vice President | | Group, Inc., and T. Rowe Price Trust Company |
| | | |
| Mark J. Vaselkiv (1958) | | Vice President, T. Rowe Price, T. Rowe Price |
| President | | Group, Inc., and T. Rowe Price Trust Company |
| | | |
| Julie L. Waples (1970) | | Vice President, T. Rowe Price |
| Vice President | | |
| | | |
| Thea N. Williams (1961) | | Vice President, T. Rowe Price, T. Rowe Price |
| Vice President | | Group, Inc., and T. Rowe Price Trust Company |
| |
| Unless otherwise noted, officers have been employees of T. Rowe Price or T. Rowe Price International for at least 5 years. |
Item 2. Code of Ethics.
The registrant has adopted a code of ethics, as defined in Item 2 of Form N-CSR, applicable to its principal executive officer, principal financial officer, principal accounting officer or controller, or persons performing similar functions. A copy of this code of ethics is filed as an exhibit to this Form N-CSR. No substantive amendments were approved or waivers were granted to this code of ethics during the period covered by this report.
Item 3. Audit Committee Financial Expert.
The registrant’s Board of Directors/Trustees has determined that Mr. Anthony W. Deering qualifies as an audit committee financial expert, as defined in Item 3 of Form N-CSR. Mr. Deering is considered independent for purposes of Item 3 of Form N-CSR.
Item 4. Principal Accountant Fees and Services.
(a) – (d) Aggregate fees billed to the registrant for the last two fiscal years for professional services rendered by the registrant’s principal accountant were as follows:

Audit fees include amounts related to the audit of the registrant’s annual financial statements and services normally provided by the accountant in connection with statutory and regulatory filings. Audit-related fees include amounts reasonably related to the performance of the audit of the registrant’s financial statements and specifically include the issuance of a report on internal controls and, if applicable, agreed-upon procedures related to fund acquisitions. Tax fees include amounts related to services for tax compliance, tax planning, and tax advice. The nature of these services specifically includes the review of distribution calculations and the preparation of Federal, state, and excise tax returns. All other fees include the registrant’s pro-rata share of amounts for agreed-upon procedures in conjunction with service contract approvals by the registrant’s Board of Directors/Trustees.
(e)(1) The registrant’s audit committee has adopted a policy whereby audit and non-audit services performed by the registrant’s principal accountant for the registrant, its investment adviser, and any entity controlling, controlled by, or under common control with the investment adviser that provides ongoing services to the registrant require pre-approval in advance at regularly scheduled audit committee meetings. If such a service is required between regularly scheduled audit committee meetings, pre-approval may be authorized by one audit committee member with ratification at the next scheduled audit committee meeting. Waiver of pre-approval for audit or non-audit services requiring fees of a de minimis amount is not permitted.
(2) No services included in (b) – (d) above were approved pursuant to paragraph (c)(7)(i)(C) of Rule 2-01 of Regulation S-X.
(f) Less than 50 percent of the hours expended on the principal accountant’s engagement to audit the registrant’s financial statements for the most recent fiscal year were attributed to work performed by persons other than the principal accountant’s full-time, permanent employees.
(g) The aggregate fees billed for the most recent fiscal year and the preceding fiscal year by the registrant’s principal accountant for non-audit services rendered to the registrant, its investment adviser, and any entity controlling, controlled by, or under common control with the investment adviser that provides ongoing services to the registrant were $1,375,000 and $1,539,000 respectively.
(h) All non-audit services rendered in (g) above were pre-approved by the registrant’s audit committee. Accordingly, these services were considered by the registrant’s audit committee in maintaining the principal accountant’s independence.
Item 5. Audit Committee of Listed Registrants.
Not applicable.
Item 6. Investments.
(a) Not applicable. The complete schedule of investments is included in Item 1 of this Form N-CSR.
(b) Not applicable.
Item 7. Disclosure of Proxy Voting Policies and Procedures for Closed-End Management Investment Companies.
Not applicable.
Item 8. Portfolio Managers of Closed-End Management Investment Companies.
Not applicable.
Item 9. Purchases of Equity Securities by Closed-End Management Investment Company and Affiliated Purchasers.
Not applicable.
Item 10. Submission of Matters to a Vote of Security Holders.
Not applicable.
Item 11. Controls and Procedures.
(a) The registrant’s principal executive officer and principal financial officer have evaluated the registrant’s disclosure controls and procedures within 90 days of this filing and have concluded that the registrant’s disclosure controls and procedures were effective, as of that date, in ensuring that information required to be disclosed by the registrant in this Form N-CSR was recorded, processed, summarized, and reported timely.
(b) The registrant’s principal executive officer and principal financial officer are aware of no change in the registrant’s internal control over financial reporting that occurred during the registrant’s second fiscal quarter covered by this report that has materially affected, or is reasonably likely to materially affect, the registrant’s internal control over financial reporting.
Item 12. Exhibits.
(a)(1) The registrant’s code of ethics pursuant to Item 2 of Form N-CSR is attached.
(2) Separate certifications by the registrant's principal executive officer and principal financial officer, pursuant to Section 302 of the Sarbanes-Oxley Act of 2002 and required by Rule 30a-2(a) under the Investment Company Act of 1940, are attached.
(3) Written solicitation to repurchase securities issued by closed-end companies: not applicable.
(b) A certification by the registrant's principal executive officer and principal financial officer, pursuant to Section 906 of the Sarbanes-Oxley Act of 2002 and required by Rule 30a-2(b) under the Investment Company Act of 1940, is attached.
SIGNATURES
Pursuant to the requirements of the Securities Exchange Act of 1934 and the Investment Company Act of 1940, the registrant has duly caused this report to be signed on its behalf by the undersigned, thereunto duly authorized.
T. Rowe Price High Yield Fund, Inc.
| | By | /s/ Edward C. Bernard |
| | Edward C. Bernard |
| | Principal Executive Officer |
| |
| Date July 13, 2012 | | |
Pursuant to the requirements of the Securities Exchange Act of 1934 and the Investment Company Act of 1940, this report has been signed below by the following persons on behalf of the registrant and in the capacities and on the dates indicated.
| | By | /s/ Edward C. Bernard |
| | Edward C. Bernard |
| | Principal Executive Officer |
| |
| Date July 13, 2012 | | |
| |
| |
| By | /s/ Gregory K. Hinkle |
| | Gregory K. Hinkle |
| | Principal Financial Officer |
| |
| Date July 13, 2012 | | |