
Interchange
Financial Services
Corporation
America’s Community Bankers Conference
San Francisco, February 21-22, 2006
1

Forward Looking Statement
In addition to discussing historical information, certain statements included in or incorporated into
this report relating to the financial condition, results of operations and business of the Company,
which are not historical facts may be deemed “forward-looking statements” within the meaning of the
Private Securities Litigation Reform Act of 1995. When used herein, the words “anticipate,”
“believe,” “estimate,” “expect” and other similar expressions (including when preceded or followed by
the word “not”) are generally intended to identify such forward-looking statements. Such statements
are intended to be covered by the safe harbor provisions for forward-looking statements contained in
such Act, and we are including this statement for purposes of invoking these safe harbor provisions.
Such forward-looking statements include, but are not limited to, statements about the operations of
the Company, the adequacy of the Company’s allowance for losses associated with the loan and lease
portfolio, the quality of the loan and lease portfolio, the prospects of continued loan and deposit
growth, and improved credit quality. The forward-looking statements in this report involve certain
estimates or assumptions, known and unknown risks and uncertainties, many of which are beyond the
control of the Company, and reflect what we currently anticipate will happen in each case. What
actually happens could differ materially from what we currently anticipate will happen due to a
variety of factors, including, among others, (i) increased competitive pressures among financial
services companies; (ii) adverse changes in Government-Sponsored Enterprises (the “GSE”) status or
financial condition impacting the GSE’s guarantees or ability to pay or issue debt; (iii) changes in
the interest rate yield curve such as flat, inverted or steep yield curves, or interest rate
environment which impact interest margins and may impact prepayments on the mortgage-backed securities
portfolio; (iv) changes in consumer spending, borrowing and saving habits; (v) technological changes,
(vi) deterioration in general economic conditions, internationally, nationally, or in the State of New
Jersey; (vii) disruptions caused by terrorism, such as the events of September 11, 2001, or military
actions in the Middle East or other areas; (viii) legislation or regulatory requirements or changes
adversely affecting the business of the Company; and (ix) other risks detailed in reports filed by the
Company with the Securities and Exchange Commission. Readers should not place undue expectations on
any forward-looking statements. We are not promising to make any public announcement when we consider
forward-looking statements in this document to be no longer accurate, whether as a result of new
information, what actually happens in the future or for any other reason.
2

A diversified financial services holding company:
Principal subsidiary is Interchange Bank (since 1969)
Total Assets: $1.6 Billion
Total Loans and leases: $1.1 Billion
Market Cap: $378 million (As of 2/14/05)
Book Value per Share: $8.89
3
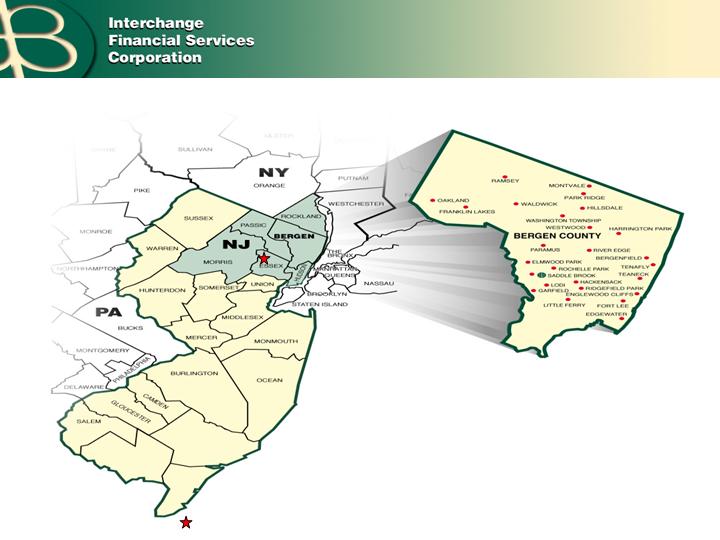
Markets Served
Bergen County Demographics
Total Population: 901,514
Businesses: 42,785
Households: 337,645
Median Household Income: $ 70,957
Median House Price: $448,100
Franklin Bank acquisition in Nutley, NJ
4

Strategic Goals
Premier Business Bank in New Jersey
To rank in the Top 100 banks in the US
(based on total assets)
Strong and consistent profitability
Continue to build shareholder value
5

Business Lending contributes approximately
40% of the Company’s pretax earnings
Planned growth of 15% to 20% annually
Restructured and expanded our Business
Banking platform
Streamlined lending and credit administration
Implemented specialized lending units and
lending teams
Business development programs
Attract and retain talented loan officers
Focus on Business Banking
6

Business Banking
Commercial
Real Estate
Capital
Financing
Commercial &
Industrial Loans
SBA/ EDA
Loans
Small
Business
Loans
Equipment
Leasing
Compensating
Balances
Construction
Lending
Business
Banking
Asset Based
Lending
7
Business Banking
(In Millions)
Commercial loans represents 73% of total loans at 12/05 as compared to
45% at 12/98 (Objective 70%)
8

A strong core deposit base drives profitability
87% of earning assets are funded by deposits
Strong core deposit mix…low cost of funds
Non-interest bearing demand 21%
Non-maturity deposits 75%
Creates a competitive advantage
Loyal core customer base
Balance Sheet (Funding)
9

On average, our customers have been with us for 12-13 years
65% of the Bank’s customer households have been with us
over 5 years
81% of current customers consider us their primary bank
77% of our customers rated us in the top 30th percentile
Bank customers rated us much higher than non-customers
rated their own banks
The majority (81%) of our customers felt that Interchange
was a stable and solid financial company and was a one stop
shop for all their banking needs.
Customer Loyalty
10

Core Deposit Advantage
Funding Cost Advantage To Peers
Spread benefit to peers: Interest expense as a % of total assets / Peer source: UPBR
11

Our focus remains on:
Innovating the customer experience
1.
Distinction in customer service
2.
Value of relationship
3.
Convenience
Disciplined pricing (Marginal Cost Pricing)
Core Deposit Strategies
12

Strategic Growth
Acquire whole financial companies
Purchase branches
Pursue de novo branching
Projected new denovo branches in 2006
Potential denovo branches in 2007 & 2008
Nutley, NJ
Corporate Offices (Saddle Brook, NJ)
LEGEND
13

RISK MANAGEMENT
AND FINANCIAL
OVERVIEW
14

Risk Management
We are highly focused on risk -- evaluating it to ensure that
it is either mitigated or well-balanced with the reward.
Credit Risk
Strong credit culture and policy
Independent credit administration function.
Validated by strong loan growth with minimal Commercial Loan
charge-offs.
Interest Rate Risk
Emphasis on total return
Risks are commensurate with rewards
Understanding the dynamic nature of interest rates and the effects
of prudent balance sheet management on current and future
earnings.
15

2005
Commercial loan growth of 28%
Loans to interest earning assets of 75%
ROA 1.28%
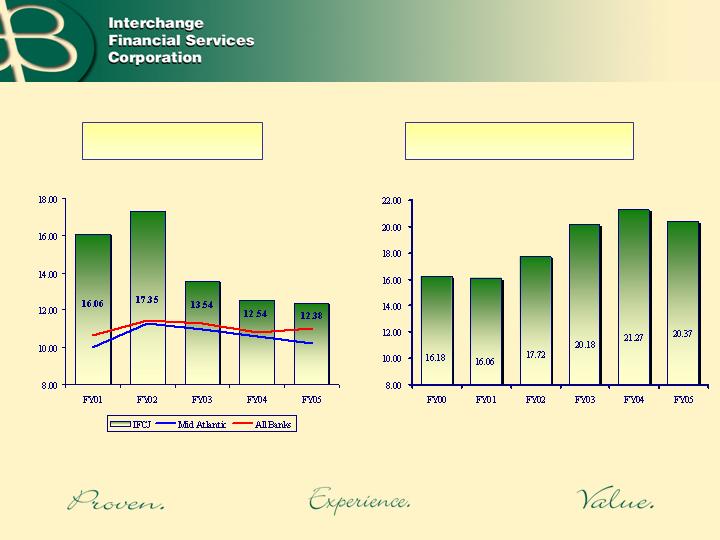
ROTE 20.37%
Financial Overview
16

Balance Sheet
($ in thousands)
17

Net Interest Margin (%)
Competitive advantage: 21bp to All Banks
and 40bp to Mid Atlantic Banks
Mid Atlantic and All Banks
Data Source: SNL 9/05
18
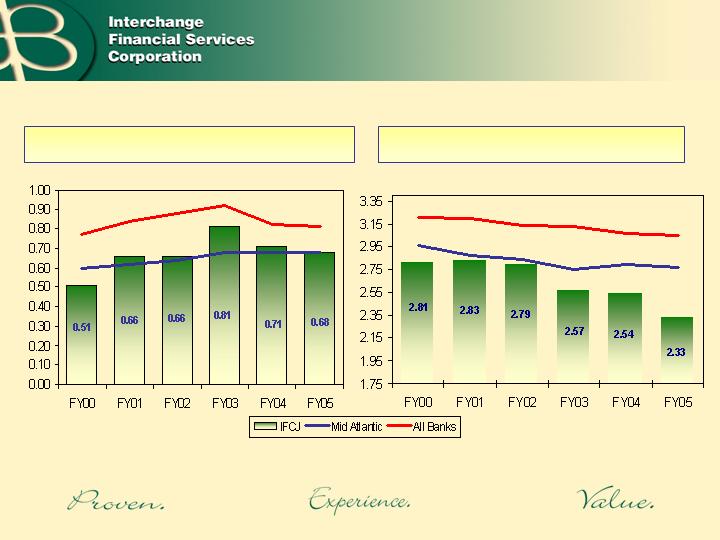
Non-interest Income &
Expense /Average Assets (%)
Non-interest income
Non-interest expense
19

Net charge-offs % of loans
Credit Quality
20

NPA’s % of assets
Credit Quality
21

Return On Assets (%)
22
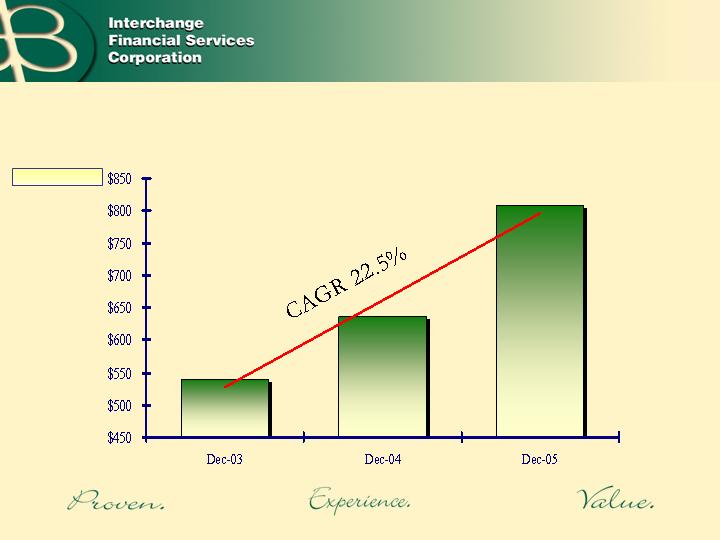
Total Equity
Tangible Equity
Return On Equity (%)
23

Diluted EPS
24

Valuable franchise in a superior market
Consistently Strong Profitability Through Varying
Economic Cycles
Uninterrupted Dividend for over 20 years
IFCJ’s value proposition has significantly exceeded major
market indices
Returning Shareholder Value
25

IFCJ – 10 Year Total
Return on Investment
8
%
1
5
As of 02/10/2006
Annual
Equivalent
of 20%.
26