Exhibit 99.1

Link to searchable text of slide shown above
Link to searchable text of slide shown above
Link to searchable text of slide shown above
Link to searchable text of slide shown above

Link to searchable text of slide shown above
Link to searchable text of slide shown above
Link to searchable text of slide shown above
Link to searchable text of slide shown above
Link to searchable text of slide shown above
Link to searchable text of slide shown above
Link to searchable text of slide shown above

Link to searchable text of slide shown above
Link to searchable text of slide shown above

Link to searchable text of slide shown above
Link to searchable text of slide shown above
Link to searchable text of slide shown above

Link to searchable text of slide shown above
Link to searchable text of slide shown above
Link to searchable text of slide shown above
Link to searchable text of slide shown above
Link to searchable text of slide shown above
Link to searchable text of slide shown above
Link to searchable text of slide shown above

Link to searchable text of slide shown above

Link to searchable text of slide shown above
Link to searchable text of slide shown above
Link to searchable text of slide shown above
Link to searchable text of slide shown above
Link to searchable text of slide shown above
Link to searchable text of slide shown above
Link to searchable text of slide shown above
Searchable text section of graphics shown above
[LOGO]
Mercer International Inc.
(Nasdaq: MERCS)
(TSE: MRI.U)
Safe Harbour Statement
The Private Securities Litigation Reform Act of 1995 provides a “safe harbor” for forward-looking statements. Certain information included in this presentation contains statements that are forward-looking, such as statements relating to results of operations and financial condition and business development activities, as well as capital spending and financing sources. Such forward-looking information involves important risks and uncertainties that could significantly affect anticipated results in the future and, accordingly, such results may differ materially from those expressed in any forward-looking statements made by or on behalf of Mercer. For more information regarding these risks and uncertainties, review Mercer’s filings with the Securities and Exchange Commission.
March 31, 2004
2
Mercer International - Investment Merits
• Low Cost NBSK Producer with World Class Assets
• Ideal Geographic Location Creates Unique Market Dynamics
• Strategically Positioned Relative to Emerging Markets
• Access to Stable, Low-Cost Fiber Sources
• Significant Leverage to Pulp Cycle
• Rapid Organic Growth
• Long-Term, Low-Cost Debt Financing in Place
3
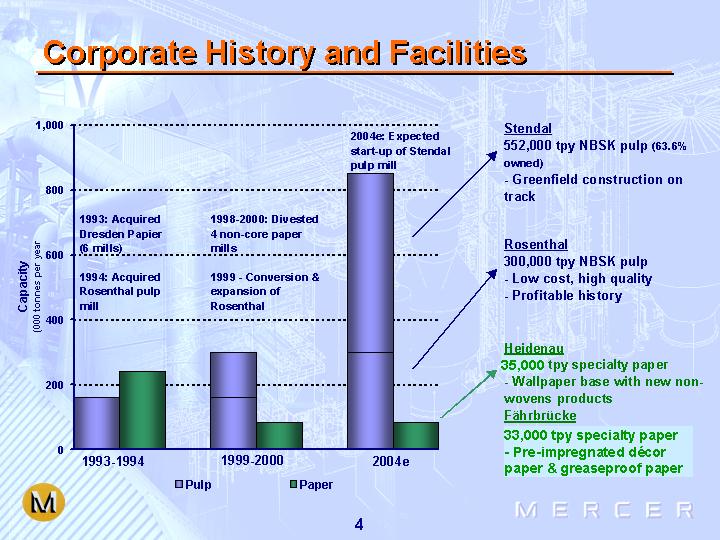
Corporate History and Facilities
[CHART]
4
INDUSTRY OVERVIEW
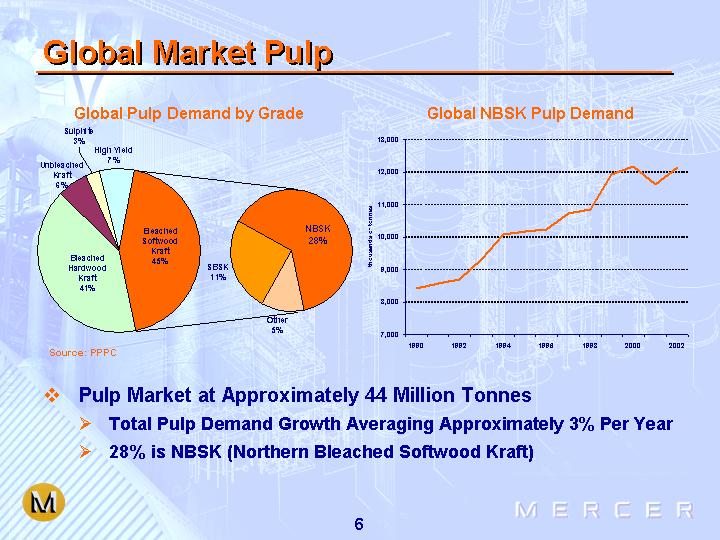
Global Market Pulp
Global Pulp Demand by Grade
[CHART]
Global NBSK Pulp Demand
[CHART]
• Pulp Market at Approximately 44 Million Tonnes
• Total Pulp Demand Growth Averaging Approximately 3% Per Year
• 28% is NBSK (Northern Bleached Softwood Kraft)
6
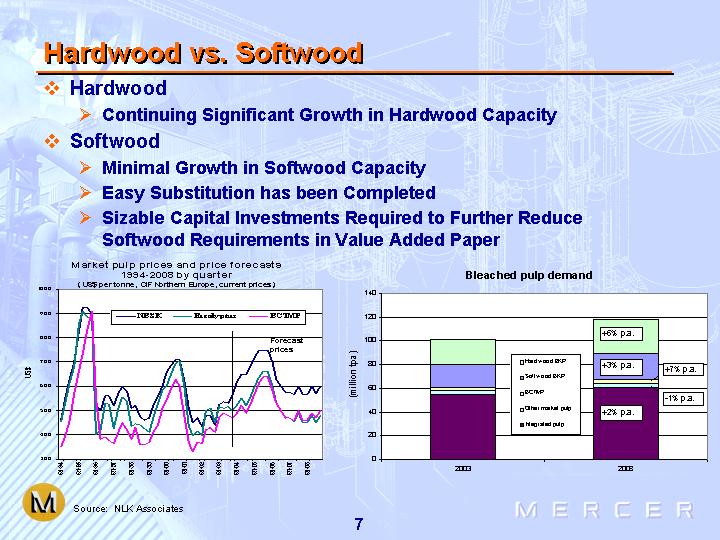
Hardwood vs. Softwood
• Hardwood
• Continuing Significant Growth in Hardwood Capacity
• Softwood
• Minimal Growth in Softwood Capacity
• Easy Substitution has been Completed
• Sizable Capital Investments Required to Further Reduce Softwood Requirements in Value Added Paper
Market pulp prices and price forecasts 1994-2008 by quarter
(US$ per tonne, CIF Northern Europe, current prices)
[CHART]
Bleached pulp demand
[CHART]
Source: NLK Associates
7
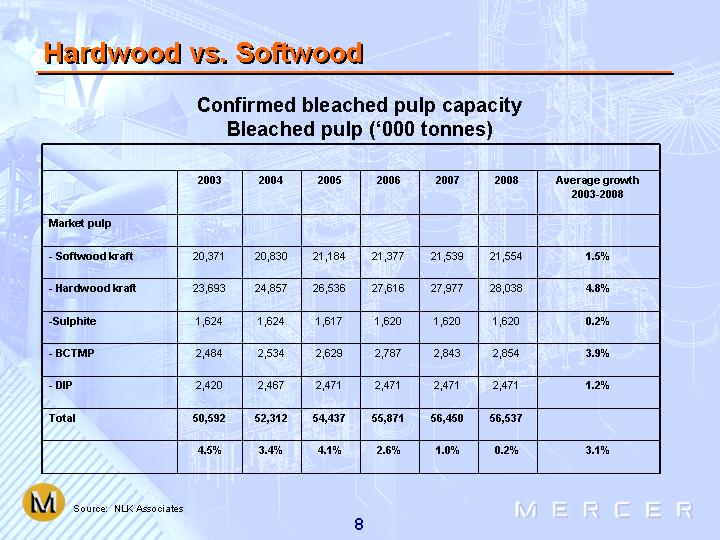
Hardwood vs. Softwood
Confirmed bleached pulp capacity
Bleached pulp (‘000 tonnes)
|
| 2003 |
| 2004 |
| 2005 |
| 2006 |
| 2007 |
| 2008 |
| Average growth |
|
Market pulp |
|
|
|
|
|
|
|
|
|
|
|
|
|
|
|
• Softwood kraft |
| 20,371 |
| 20,830 |
| 21,184 |
| 21,377 |
| 21,539 |
| 21,554 |
| 1.5 | % |
• Hardwood kraft |
| 23,693 |
| 24,857 |
| 26,536 |
| 27,616 |
| 27,977 |
| 28,038 |
| 4.8 | % |
• Sulphite |
| 1,624 |
| 1,624 |
| 1,617 |
| 1,620 |
| 1,620 |
| 1,620 |
| 0.2 | % |
• BCTMP |
| 2,484 |
| 2,534 |
| 2,629 |
| 2,787 |
| 2,843 |
| 2,854 |
| 3.9 | % |
• DIP |
| 2,420 |
| 2,467 |
| 2,471 |
| 2,471 |
| 2,471 |
| 2,471 |
| 1.2 | % |
Total |
| 50,592 |
| 52,312 |
| 54,437 |
| 55,871 |
| 56,450 |
| 56,537 |
|
|
|
|
| 4.5 | % | 3.4 | % | 4.1 | % | 2.6 | % | 1.0 | % | 0.2 | % | 3.1 | % |
8
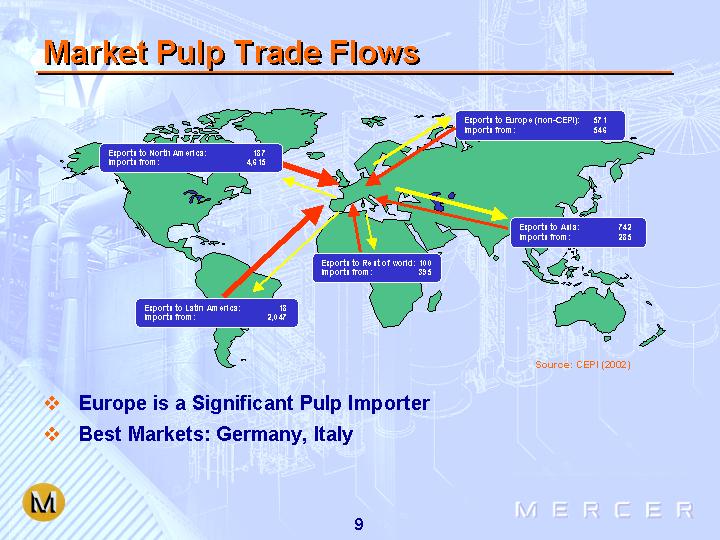
Market Pulp Trade Flows
[GRAPHIC]
• Europe is a Significant Pulp Importer
• Best Markets: Germany, Italy
9
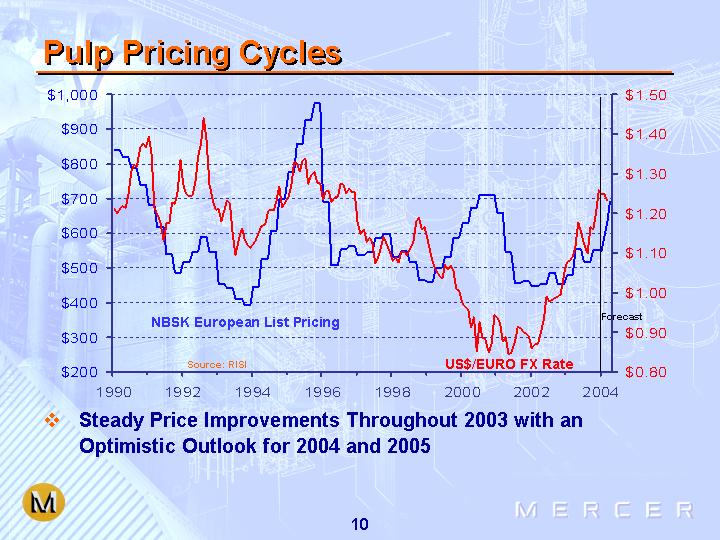
Pulp Pricing Cycles
[CHART]
• Steady Price Improvements Throughout 2003 with an Optimistic Outlook for 2004 and 2005
10
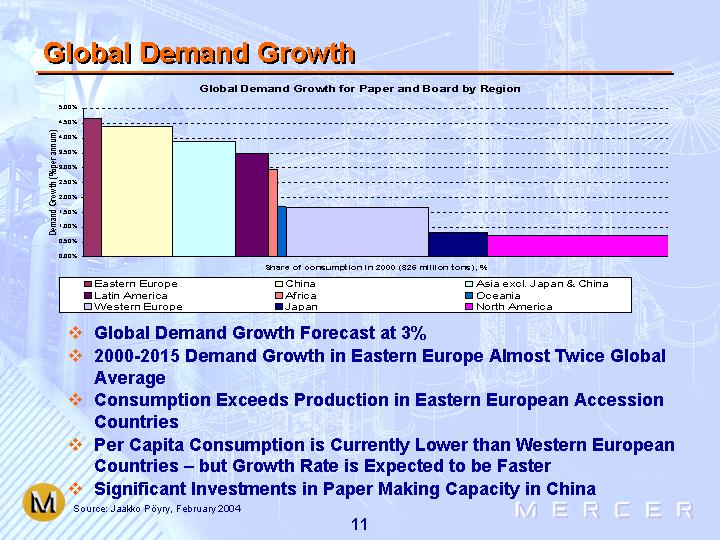
Global Demand Growth
Global Demand Growth for Paper and Board by Region
[CHART]
• Global Demand Growth Forecast at 3%
• 2000-2015 Demand Growth in Eastern Europe Almost Twice Global Average
• Consumption Exceeds Production in Eastern European Accession Countries
• Per Capita Consumption is Currently Lower than Western European Countries - but Growth Rate is Expected to be Faster
• Significant Investments in Paper Making Capacity in China
Source: Jaakko Pöyry, February 2004
11
BUSINESS DETAILS
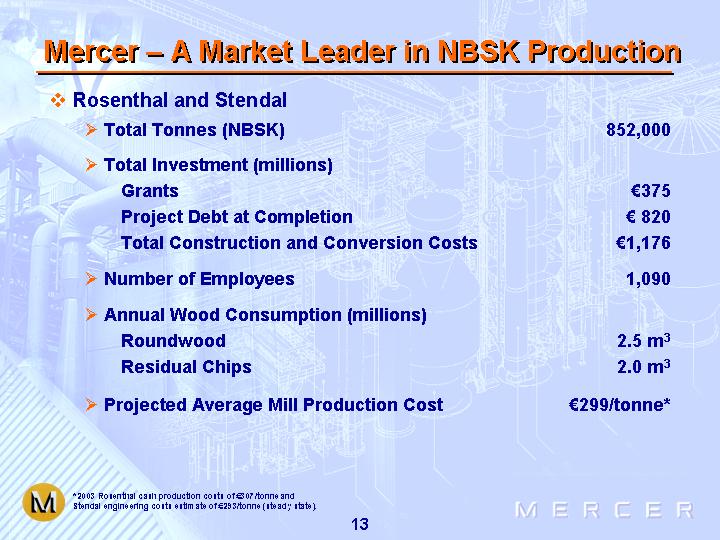
Mercer - - A Market Leader in NBSK Production
• Rosenthal and Stendal |
|
|
| |
• Total Tonnes (NBSK) |
| 852,000 |
| |
• Total Investment (millions) |
|
|
| |
Grants |
| € | 375 |
|
Project Debt at Completion |
| € | 820 |
|
Total Construction and Conversion Costs |
| € | 1,176 |
|
• Number of Employees |
| 1,090 |
| |
• Annual Wood Consumption (millions) |
|
|
| |
Roundwood |
| 2.5m3 |
| |
Residual Chips |
| 2.0m3 |
| |
• Projected Average Mill Production Cost |
| € | 299/tonne | * |
* 2003 Rosenthal cash production costs of €307/tonne and Stendal engineering costs estimate of €293/tonne (steady state).
13
Rosenthal - - An Unparalleled Success
• In 1999, Conversion of Rosenthal Mill to Kraft Pulp Production Created Unique Asset
• Approximately €361 Million Invested (€101 million from grants)
• Fastest Ever Start-up of an NBSK Facility
• Capacity Increased From 160,000 Tonnes to 300,000 Tonnes
• Strong Cost Position (€307/tonne*)
• Lowest Quartile From a Global Delivered Cost Perspective
[GRAPHIC]
* Cash production costs per tonne sold are determined by subtracting depreciation and shipping and handling costs from cost of sales for the pulp segment divided by sales volume.
14
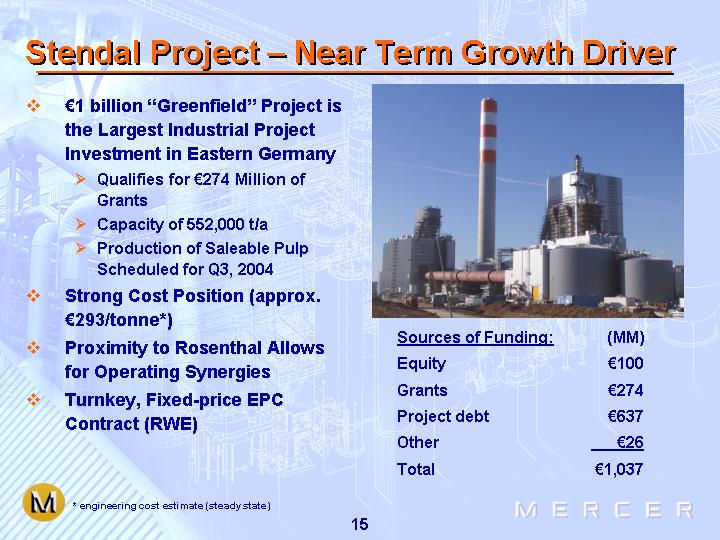
Stendal Project - Near Term Growth Driver
• €1 billion “Greenfield” Project is the Largest Industrial Project Investment in Eastern Germany
• Qualifies for €274 Million of Grants
• Capacity of 552,000 t/a
• Production of Saleable Pulp Scheduled for Q3, 2004
• Strong Cost Position (approx. €293/tonne*)
• Proximity to Rosenthal Allows for Operating Synergies
• Turnkey, Fixed-price EPC Contract (RWE)
[GRAPHIC]
Sources of Funding: |
| (MM) |
| |
Equity |
| € | 100 |
|
Grants |
| € | 274 |
|
Project debt |
| € | 637 |
|
Other |
| € | 26 |
|
Total |
| € | 1,037 |
|
* engineering cost estimate (steady state)
15
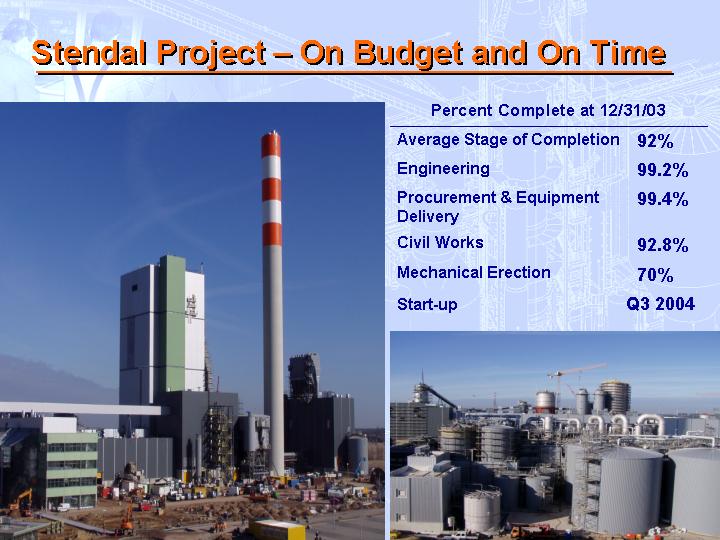
Stendal Project - On Budget and On Time
[GRAPHIC]
Percent Complete at 12/31/03
Average Stage of Completion |
| 92 | % |
Engineering |
| 99.2 | % |
Procurement & Equipment |
| 99.4 | % |
Delivery |
|
|
|
Civil Works |
| 92.8 | % |
Mechanical Erection |
| 70 | % |
Start-up |
| Q3 2004 |
|
[GRAPHIC]
COMPETITIVE STRENGTHS
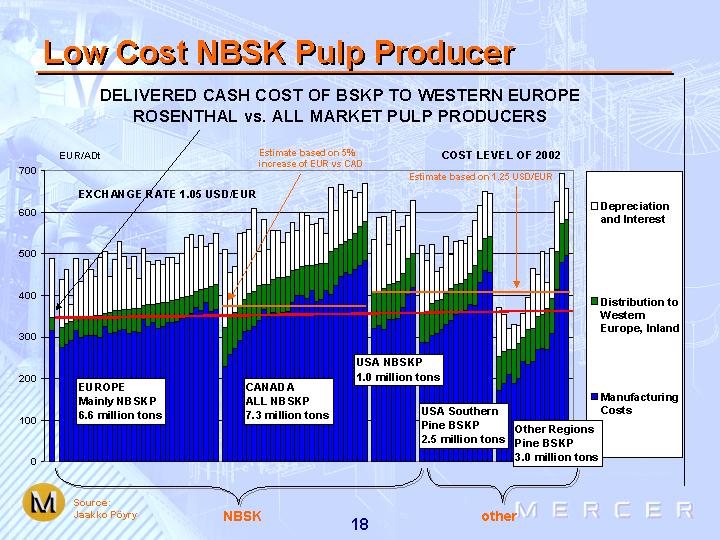
Low Cost NBSK Pulp Producer
DELIVERED CASH COST OF BSKP TO WESTERN EUROPE
ROSENTHAL vs. ALL MARKET PULP PRODUCERS
[CHART]
Source:
Jaakko Pöyry
18
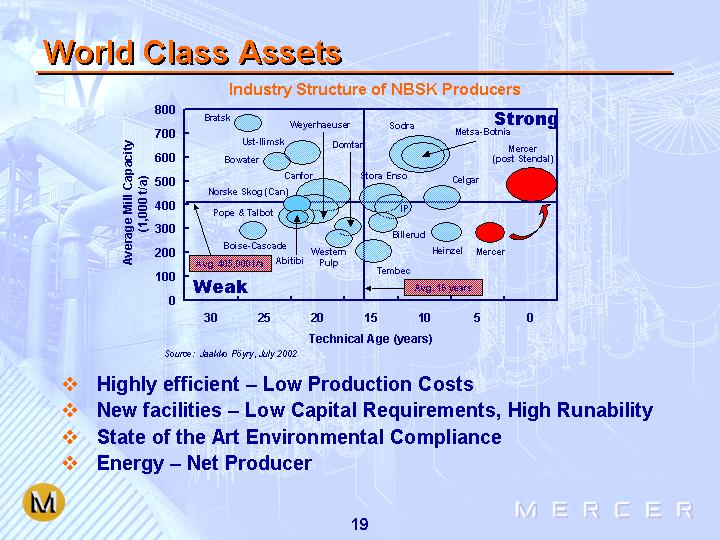
World Class Assets
Industry Structure of NBSK Producers
[CHART]
Source: Jaakko Pöyry, July 2002
• Highly efficient – Low Production Costs
• New facilities – Low Capital Requirements, High Runability
• State of the Art Environmental Compliance
• Energy – Net Producer
19
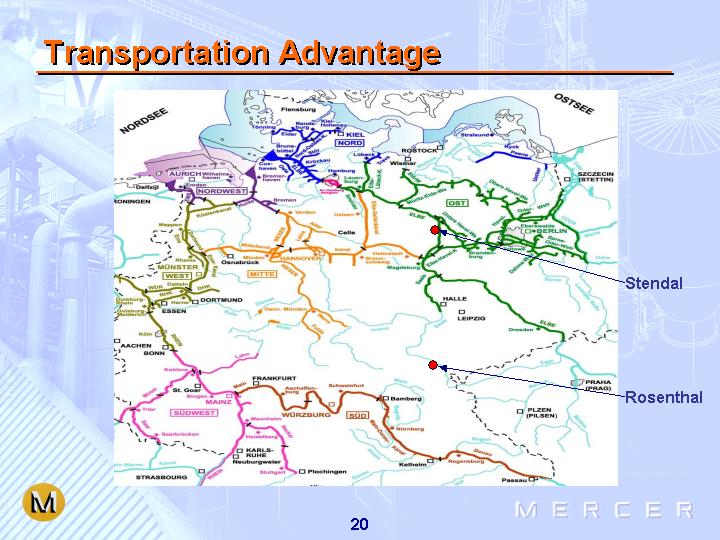
Transportation Advantage
[GRAPHIC]
20
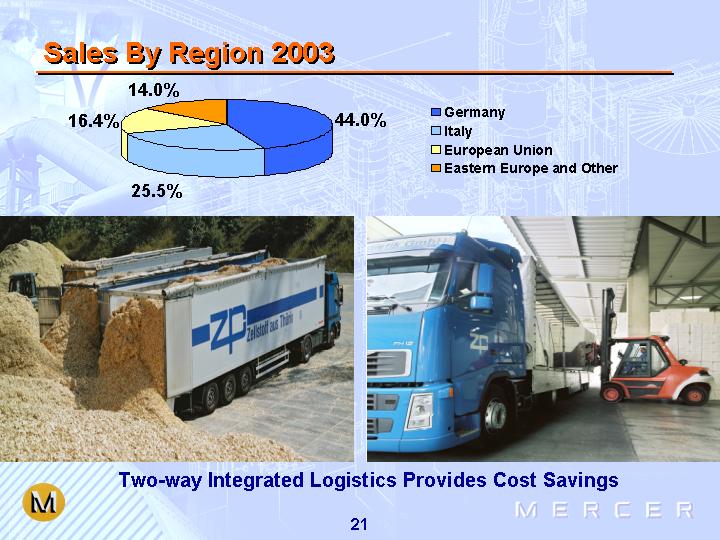
Sales By Region 2003
[CHART]
[GRAPHIC] |
| [GRAPHIC] |
Two-way Integrated Logistics Provides Cost Savings
21
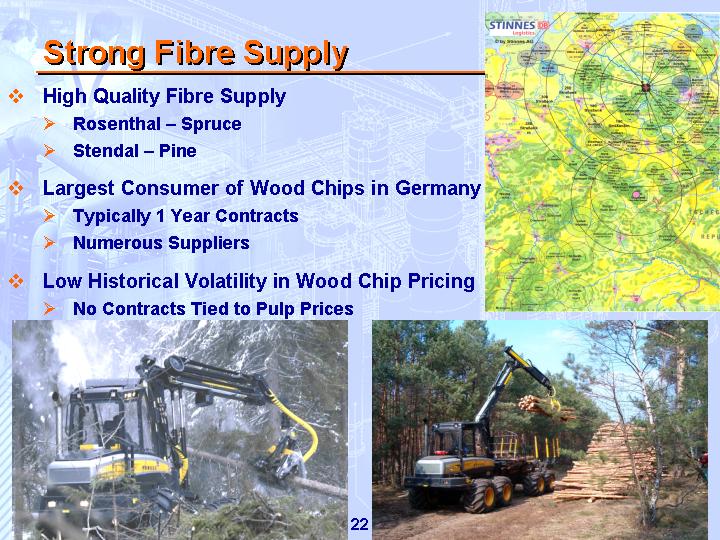
Strong Fibre Supply
• High Quality Fibre Supply
• Rosenthal – Spruce
• Stendal – Pine
• Largest Consumer of Wood Chips in Germany
• Typically 1 Year Contracts
• Numerous Suppliers
• Low Historical Volatility in Wood Chip Pricing
• No Contracts Tied to Pulp Prices
[GRAPHIC]
[GRAPHIC]
[GRAPHIC]
22
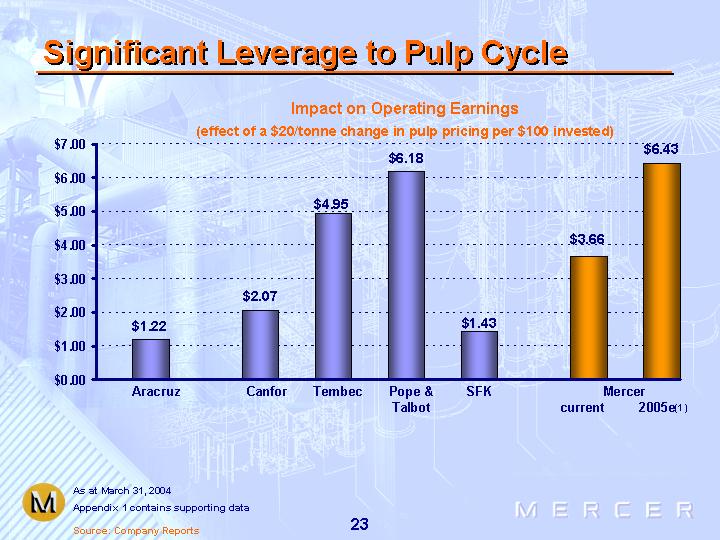
Significant Leverage to Pulp Cycle
Impact on Operating Earnings
(effect of a $20/tonne change in pulp pricing per $100 invested)
[CHART]
As at March 31, 2004
Appendix 1 contains supporting data
Source: Company Reports
23
Long Term, Low Cost Debt Financing
• Project Financings Benefit Our Equity Holders
• Reduced Dilution
• No Cash Sweep
• Ring Fenced Structure
• Government Guarantees, of 80% of Debt, is Maximized
• Resulting in Low Cost Financing Structure
|
| Rosenthal |
|
|
| Stendal |
|
Size |
| €191.7m(1) |
|
|
| €668m(2) |
|
Term |
|
|
| 15 years |
|
|
|
|
|
|
| amortizing |
|
|
|
Financing Cost |
| 4.57% |
|
|
| 5.26% |
|
|
| (cap of 6.8% to ‘07) |
|
|
| (est. fixed) |
|
EBITDA(3) / Interest |
|
|
|
|
|
|
|
2003 |
|
|
| 1.7 | x |
|
|
2002 |
|
|
| 1.9 | x |
|
|
2001 |
|
|
| 2.2 | x |
|
|
Notes:
(1) Amount outstanding as at December 31, 2003; Rosenthal had €25.1 million of restricted cash at such date
(2) Initial permanent amounts available under the project facility
(3) For discussion of EBITDA and limitations see last slide
24
FINANCIAL HIGHLIGHTS & VALUATION
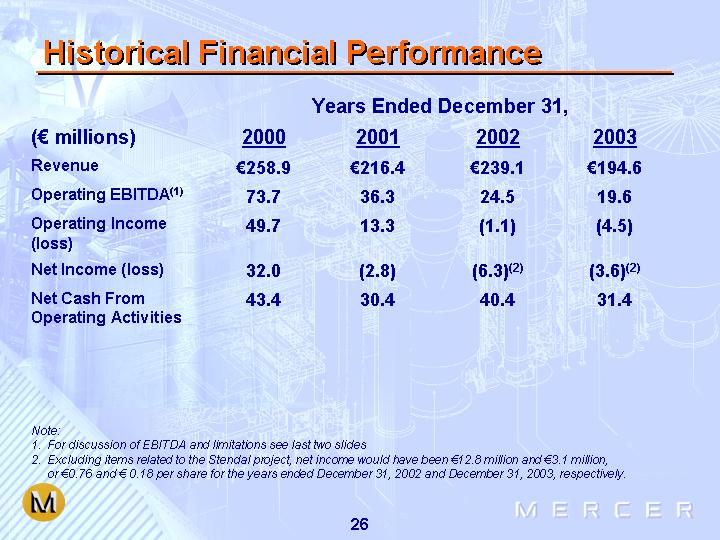
Historical Financial Performance
|
| Years Ended December 31, |
| ||||||||||
(€ millions) |
| 2000 |
| 2001 |
| 2002 |
| 2003 |
| ||||
Revenue |
| € | 258.9 |
| € | 216.4 |
| € | 239.1 |
| € | 194.6 |
|
Operating EBITDA(1) |
| 73.7 |
| 36.3 |
| 24.5 |
| 19.6 |
| ||||
Operating Income (loss) |
| 49.7 |
| 13.3 |
| (1.1 | ) | (4.5 | ) | ||||
Net Income (loss) |
| 32.0 |
| (2.8 | ) | (6.3 | )(2) | (3.6 | )(2) | ||||
Net Cash From Operating Activities |
| 43.4 |
| 30.4 |
| 40.4 |
| 31.4 |
| ||||
Note:
(1) For discussion of EBITDA and limitations see last two slides
(2) Excluding items related to the Stendal project, net income would have been €12.8 million and €3.1 million, or €0.76 and € 0.18 per share for the years ended December 31, 2002 and December 31, 2003, respectively.
26
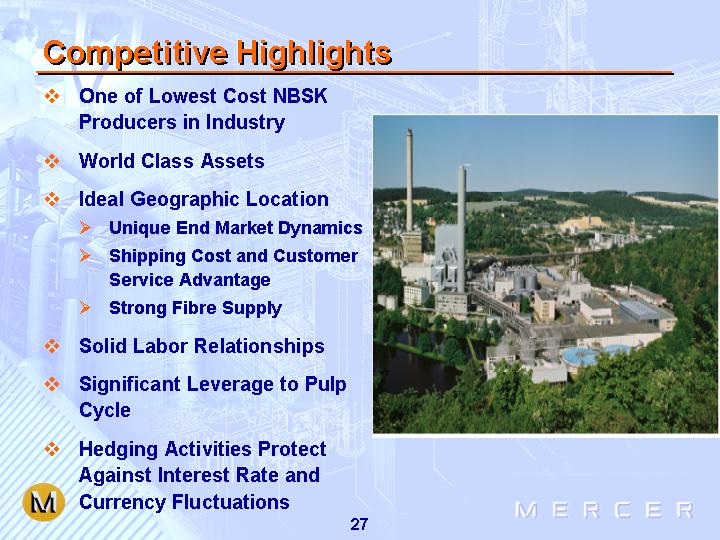
Competitive Highlights
• One of Lowest Cost NBSK Producers in Industry
• World Class Assets
• Ideal Geographic Location
• Unique End Market Dynamics
• Shipping Cost and Customer Service Advantage
• Strong Fibre Supply
• Solid Labor Relationships
• Significant Leverage to Pulp Cycle
• Hedging Activities Protect Against Interest Rate and Currency Fluctuations
[GRAPHIC]
27
[LOGO]
Mercer International Inc.
(Nasdaq: MERCS)
(TSE: MRI.U)
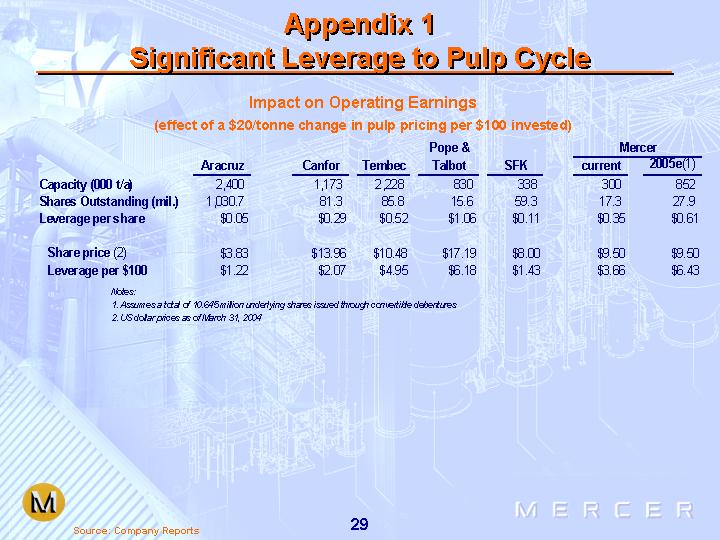
Appendix 1
Significant Leverage to Pulp Cycle
Impact on Operating Earnings
(effect of a $20/tonne change in pulp pricing per $100 invested)
|
|
|
|
|
|
|
| Pope & |
|
|
| Mercer |
| ||||||||||
|
| Aracruz |
| Canfor |
| Tembec |
| Talbot |
| SFK |
| current |
| 2005e(1) |
| ||||||||
Capacity (000 t/a) |
| 2,400 |
| 1,173 |
| 2,228 |
| 830 |
| 338 |
| 300 |
| 852 |
| ||||||||
Shares Outstanding (mil.) |
| 1,030.7 |
| 81.3 |
| 85.8 |
| 15.6 |
| 59.3 |
| 17.3 |
| 27.9 |
| ||||||||
Leverage per share |
| $ | 0.05 |
| $ | 0.29 |
| $ | 0.52 |
| $ | 1.06 |
| $ | 0.11 |
| $ | 0.35 |
| $ | 0.61 |
| |
|
|
|
|
|
|
|
|
|
|
|
|
|
|
|
| ||||||||
Share price (2) |
| $ | 3.83 |
| $ | 13.96 |
| $ | 10.48 |
| $ | 17.19 |
| $ | 8.00 |
| $ | 9.50 |
| $ | 9.50 |
| |
Leverage per $100 |
| $ | 1.22 |
| $ | 2.07 |
| $ | 4.95 |
| $ | 6.18 |
| $ | 1.43 |
| $ | 3.66 |
| $ | 6.43 |
| |
Notes:
(1) Assumes a total of 10.645 million underlying shares issued through convertible debentures
(2) US dollar prices as of March 31, 2004
Source: Company Reports
29
EBITDA
EBITDA as presented herein refers to Operating EBITDA, defined as income from operations plus depreciation and amortization. Management uses Operating EBITDA as a benchmark measurement of its own operating results, and as a benchmark relative to its competitors. Operating EBITDA is not a measure of financial performance under accounting principles generally accepted in the United States, and should not be considered as an alternative to net income (loss) or income (loss) from operations as a measure of performance, nor as an alternative to net cash from operating activities as a measure of liquidity. Operating EBITDA has significant limitations as an analytical tool, and should not be considered in isolation, or as a substitute for analysis of our results as reported under GAAP. Operating EBITDA as calculated by us may differ from Operating EBITDA as calculated by other companies.
30
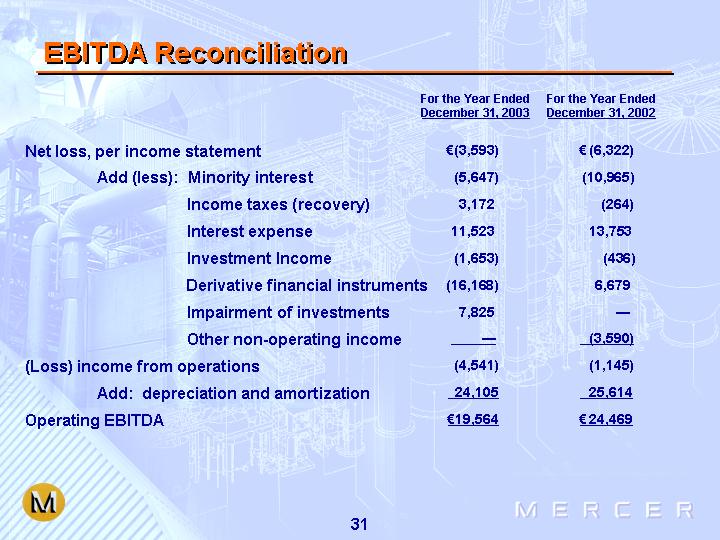
EBITDA Reconciliation
|
| For the Year Ended |
| For the Year Ended |
| |||
|
|
|
|
|
| |||
Net loss, per income statement |
| € | (3,593 | ) | € | (6,322 | ) | |
Add (less): | Minority interest |
| (5,647 | ) | (10,965 | ) | ||
| Income taxes (recovery) |
| 3,172 |
| (264 | ) | ||
| Interest expense |
| 11,523 |
| 13,753 |
| ||
| Investment Income |
| (1,653 | ) | (436 | ) | ||
| Derivative financial instruments |
| (16,168 | ) | 6,679 |
| ||
| Impairment of investments |
| 7,825 |
| — |
| ||
| Other non-operating income |
| — |
| (3,590 | ) | ||
(Loss) income from operations |
| (4,541 | ) | (1,145 | ) | |||
Add: depreciation and amortization |
| 24,105 |
| 25,614 |
| |||
Operating EBITDA |
| € | 19,564 |
| € | 24,469 |
| |
31