Table of Contents

BT Group plc Annual Report & Form 20-F 2010 |  |
BT GROUP PLC ANNUAL REPORT & FORM 20-F
BT Group plc
Annual Report
& Form 20-F
2010
Annual Report
& Form 20-F
2010
 | |||||
| 2 | |||||
| 4 | |||||
| 5 | |||||
| 6 | |||||
 | |||||
| 11 | |||||
| 15 | |||||
| 18 | |||||
| 22 | |||||
| 34 | |||||
| 36 | |||||
| 38 | |||||
| 41 | |||||
 | |||||
| 58 | |||||
| 60 | |||||
| 62 | |||||
| 64 | |||||
| 65 | |||||
| 66 | |||||
| 78 | |||||
| 79 | |||||
| 82 | |||||
 | |||||
| 84 | |||||
| 85 | |||||
| 87 | |||||
| 145 | |||||
| 146 | |||||
| 149 | |||||
| 150 | |||||
| 151 | |||||
| 153 | |||||
| 154 | |||||
 | |||||
| 156 | |||||
| 168 | |||||
| 171 | |||||
| 174 | |||||
Table of Contents
OVERVIEW
FINANCIAL SUMMARY
Group results
| 2010 | 2009a | |||||||||||
| £m | £m | Change | Five year record | |||||||||
Revenue | Adjusted revenue (£m) | |||||||||||
– adjustedb,c | £20,911 | £21,431 |  | 2% | 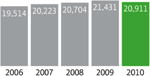 | |||||||
– reported | £20,859 | £21,390 | | 2% | ||||||||
EBITDAd | Adjusted EBITDA (£m) | |||||||||||
– adjustedb,c | £5,639 | £5,238 |  | 8% | 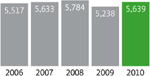 | |||||||
– reported | £5,162 | £3,191 | | 62% | ||||||||
Profit (loss) before taxation | Adjusted profit before taxation (£m) | |||||||||||
– adjustedb,c | £1,735 | £1,454 | | 19% | 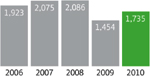 | |||||||
– reported | £1,007 | £(244 | ) | | £1,251m | |||||||
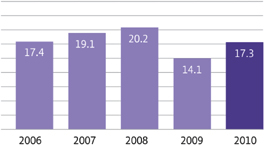
Earnings (loss) per share | Adjusted earnings per share (pence) | |||||||||||
– adjustedb,c | 17.3p | 14.1p | | 23% | 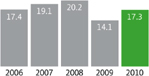 | |||||||
– reported | 13.3p | (2.5)p | | 15.8p | ||||||||
| Full year dividend (pence) | ||||||||||||
Proposed full year dividend | 6.9p | 6.5p | | 6% | 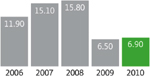 | |||||||
| Free cash flow (£m) | ||||||||||||
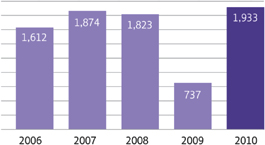
Free cash flowc | £1,933 | £737 | | £1,196m | 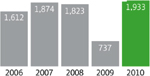 | |||||||
| Net debt (£m) | ||||||||||||
Net debtc | £9,283 | £10,361 | | £1,078m | 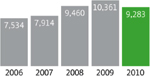 | |||||||
| a | Restated. See page 94. | |
| b | Items presented as adjusted are stated before specific items, BT Global Services contract and financial review charges in 2009 and net interest on pensions. See page 55 for further details. In our quarterly results announcements we also report adjusted measures before leaver costs, consistent with the basis of our outlook for the year (see page 3). From 2011 onwards, we will be reporting our quarterly adjusted results after leaver costs. | |
| c | Adjusted revenue, adjusted EBITDA, adjusted profit (loss) before taxation, adjusted earnings (loss) per share, free cash flow and net debt are non-GAAP measures provided in addition to the disclosure requirements of IFRS. The rationale for using non-GAAP measures and the locations of reconciliations to the most directly comparable IFRS measure are provided in theFinancial reviewon pages 54 to 56. | |
| d | EBITDA: Earnings before interest, taxation, depreciation and amortisation. |
2 BT GROUP PLCANNUAL REPORT & FORM 20-F
Table of Contents
OVERVIEWFINANCIAL SUMMARY
Performance against our outlook for 2010
| Outlook | Outlook | Outlook | ||||||||||||||
| May 2009 | updated | Outcome | achieved | |||||||||||||
 | Adjusted revenue decline | 4%-5 | % | 3%-4 | % | 2 | % |  | ||||||||
| Total underlying costareductions | >£1bn | >£1.5bn | £1.75bn | | |||||||||||
| Adjusted EBITDAbbefore leaver costs | – | c.£5.7bn | £5.8bn | | |||||||||||
| Capital expenditure | c.£2.7bn | c.£2.5bn | £2.5bn | | |||||||||||
| Free cash flowc | >£1bn | c.£1.7bn | £1.9bn | | |||||||||||
| Full year dividend | – | c.5%up | 6% up | | |||||||||||
| Net debtd | – | <£10.0bn | £9.3bn | | |||||||||||
Key points for 2010
 | Full year results ahead of our outlook | |
| Revenue down 2% | |
| Total underlying costsareduced by £1,752m, down 9% | |
| Capital expenditure reduced by £555m to £2,533m | |
| Free cash flowcof £1,933m, an improvement of £1,196m | |
| Net debtdreduced by over £1bn | |
| Proposed final dividend of 4.6p per share, giving 6.9p for the full year |
Outlook for 2011
| Revenue | c.£20bn | ||
| Operating cost savingse | c.£900m | ||
| Adjusted EBITDAbafter leaver costs | in line with 2010 | ||
| Free cash flowfbefore specific items | c.£1.8bn | ||
| Net debtd | <£9.0bn |
| a | Underlying operating costs and capital expenditure, before specific items, leaver costs, depreciation and amortisation and other operating income, excluding BT Global Services contract and financial review charges in 2009. | |
| b | Before specific items. | |
| c | Before pension deficit payment of £525m but after the cash costs of the BT Global Services restructuring. | |
| d | Net debt is defined on page 56. | |
| e | Underlying operating costs before specific items and depreciation and amortisation. | |
| f | Before pension deficit payment and before specific items of around £150m, with capital expenditure at around £2.6bn. |
BT GROUP PLCANNUAL REPORT & FORM 20-F 3
Table of Contents
OVERVIEW
CHAIRMAN’S MESSAGE

As we promised, 2010 has been a year for delivery. After the challenges of the last financial year, we focused our efforts on starting to improve BT Global Services’ performance and reducing our cost base so that we could emerge stronger from recession. While the economy is still challenging, I am delighted to say our determination has paid off and we have delivered results ahead of our original expectations for the year.
Dividends
Last year we said we wanted to rebase the dividend to a level which we were confident was sustainable and from which it could grow. The Board is committed to delivering progressive dividends, while balancing the need to invest in the business, support the pension fund and reduce our net debt. Given our good performance in terms of free cash flow generation this year, the Board is proposing a final dividend of 4.6p, making a total of 6.9p for the full year. This represents 6% growth over last year, in line with our indication of around a 5% increase.
Pension fund
In February we announced that BT had reached agreement with the Trustee of the BT Pension Scheme on the triennial funding valuation of the pension scheme and a recovery plan for the £9bn deficit. I was disappointed, given the significant amount of work done by the Trustee and the prudent assumptions we had agreed, that the Pensions Regulator had substantial concerns with certain features of the agreement. We and the Trustee continue to work with the Pensions Regulator to progress this matter. Since the valuation date the scheme’s investments have increased in value by £4bn.
Regulation
In the current economic environment it is imperative that we avoid protectionism and establish a truly level playing field for businesses. We continue to work with governments and regulators in the UK, the EU and around the world for open and fair wholesale access to telecoms networks, whether fixed or mobile, and to premium pay TV content to drive competition and avoid inequalities and excessive pricing in the broadband market. Our own access network is open to all-comers on an equivalent basis and it is because of this that the UK has one of the most competitive and vibrant telecoms markets. This benefits everyone, be they our competitors or our customers. We seek consistency and ask only in other markets what we offer in the UK market.
Environment and the community
We are proud to be involved with the London 2012 Olympic and Paralympic Games and see this as an opportunity to contribute to a great event not just for London but for the whole of the UK and the rest of the world. In keeping with our tradition of helping others, BT people will be volunteering and contributing to the Games and our network will provide a lasting legacy beyond.
We firmly believe in investing in young people and I am delighted that BT is stepping up its commitment to the Modern Apprenticeship scheme.
BT is committed to a sustainable environment and has set one of the most aggressive corporate carbon reduction targets in the world. We have made considerable progress, reducing the carbon intensity of our global business by 54% compared with our 1997 baseline. By 2020 we aim to have reduced our emissions by 80%.
The Board
I was delighted that Tony Ball, chief executive of BSkyB from 1999 to 2003, joined the Board in July 2009. He brings great experience of international telecoms and broadcasting.
Patricia Hewitt, who joined the Board in March 2008, has taken on the role of Senior Independent Director, which had been previously held by Maarten van den Bergh, who stepped down from the Board in July 2009.
I would like to thank Deborah Lathen, who stepped down from the Board in January 2010 at the end of her three year term. She brought helpful insights into the international telecoms market and regulatory matters, for which I have been very grateful.
I continue to work with the Nominating Committee to ensure we have the appropriate skills and experience at Board level to guide the business through its next stages of development.
Hanif Lalani, Chief Executive of BT Global Services and formerly Group Finance Director between 2005 and 2008, stepped down from the Board in January 2010 and left the company in March 2010. Jeff Kelly was appointed as Chief Executive of BT Global Services and as a member of the Operating Committee in January 2010. Jeff had 25 years’ experience at EDS, the global IT services firm, where he most recently ran their US$10bn business in the Americas. Jeff’s task will be to improve the performance of BT Global Services and build on its position as a global leader in networked IT services.
My thanks go to the rest of the Board who have continued to support me and the executive management through these challenging times.
The future
The year ahead will have its challenges as the world economy struggles to recover from the long recession. No one knows when, or by how much, conditions will improve. However, we believe we can drive efficiency, provide even better customer service and deliver a better future for all our stakeholders.
SIR MICHAEL RAKE
CHAIRMAN
12 MAY 2010
CHAIRMAN
12 MAY 2010
4 BT GROUP PLCANNUAL REPORT & FORM 20-F
Table of Contents
OVERVIEW
CHIEF EXECUTIVE’S STATEMENT

A better business, a better future
In the last year, we’ve taken decisive action with one aim in mind – to make BT a better business with a better future. We are making good progress. Of course, there’s a lot more to do but we have established a much firmer base from which to invest in the future of our company.
A better business
Our focus on improving customer service is paying off. Faults and complaints have been significantly reduced. We will continue to invest in training, systems and processes to deliver a better customer experience. Reducing the time spent on fixing service issues has been a critical factor in helping to transform our cost base and, as a result, we have been able to free up the resources to invest in new products and technology.
We have now set clear objectives for the next three years – objectives that will help build a better future for BT.
A better future
The UK’s communications market is one of the most competitive in the world and consumers have benefited from this. Real prices are down more than 50% in the last 20 years and are among the lowest in any major advanced economy.
We see significant opportunity to provide consumers with not just great value but with a wide range of broadband-based services. For example, BT Vision, our television service, where we will be offering new channels, content and interactivity. The UK’s small and medium-sized businesses will also benefit from our investment in communications services that will enhance their efficiency and capabilities.
Improving the financial performance of BT Global Services remains an important priority. We’ve started to turn the corner with five quarters of improved profitability and an impressive list of new deals. Globalisation is here to stay and we will build on our position as a global leader in networked IT services by enhancing our product portfolio, and improving customer service and contract delivery. We will also make targeted investment in areas of potential profitable growth such as in the Asia Pacific region where we already have a strong market presence.
BT is the largest communications wholesaler in Europe. Our BT Wholesale business will continue to move into new markets, winning deals with organisations like mobile operators, who are choosing BT to run a large part of their infrastructure.
Nowhere is competition more intense than in the broadband market, where we are making one of the largest private sector investments in Europe, spending £1.5bn to bring fibre to at least 40% of the UK in 2012. If conditions are favourable, we see no reason not to extend this to around two-thirds of the UK by 2015 which will take our total investment to £2.5bn.
Our people
Our people have worked hard to improve service and efficiency, often changing working practices to be available when and where our customers need us. We have also reduced the number of people working for BT, doing our best to protect the jobs of our permanent employees. With retraining and support, some 5,000 people have found new roles in the business. No small feat and one we are proud of in today’s economic environment.
In the last year, we have made some tough, but necessary, changes that are helping us to create the sort of company BT needs to be, at the same time as providing new opportunities for our people.
The right foundations are in place to make BT a better business with a better future – for our customers, for our shareholders, and for our people.
There is a lot more to do but we are heading in the right direction. Thank you for your support in this journey.
IAN LIVINGSTON
CHIEF EXECUTIVE
12 MAY 2010
CHIEF EXECUTIVE
12 MAY 2010
BT GROUP PLCANNUAL REPORT & FORM 20-F 5
Table of Contents
OVERVIEW
OUR BUSINESS
BT is one of the world’s leading communications services companies, serving the needs of customers in the UK and in more than 170 countries worldwide.
What we do
Our main activities are the provision of fixed lines, broadband, mobile and TV products and services as well as networked IT services.
In the UK we are the largest communications services provider, serving the consumer, business and public sector markets. Globally, we supply networked IT services to multinational corporations, domestic businesses and government departments. We also provide access to our network and services to more than 1,000 communications providers in the UK and others worldwide.
Our customers benefit from a range of products and services:
Multinational corporations
| 4 | Global networked IT services | |
| 4 | Worldwide virtual private network via our multi-protocol label switching service | |
| 4 | State-of-the-art videoconferencing and telepresence services |
Small and medium enterprises
| 4 | Fixed line and mobile call and broadband packages | |
| 4 | IT and communications solutions |
UK consumer
| 4 | Fixed line calls and broadband packages | |
| 4 | Largest video-on-demand service in the UK | |
| 4 | Biggest wi-fi network, with more than 1.5m hotspots | |
| 4 | A new fibre-based access network |
Wholesale and carrier
| 4 | Local loop unbundling, allowing communications providers to install their equipment in BT exchanges, and use these lines to connect to end users | |
| 4 | White label managed services for customers who want to enter the communications market without the need to invest | |
| 4 | Managed network solutions for communications providers | |
| >More on page 11 |
Our aim
We aim to drive shareholder value by making BT a better business with a better future. We are
making BT a better business by focusing on three areas:
making BT a better business by focusing on three areas:
| 4 | Customer service delivery | |
| 4 | Cost transformation | |
| 4 | Investing for the future |
| Customer service delivery | |||
| Our goal is to provide excellent customer service in every market in which we operate by putting our customers at the heart of everything we do. | ||||
> More on page 11 | ||||
| Cost transformation | |||
| We continue our drive to reduce costs across our business and deliver absolute levels of cost reduction. | ||||
> More on page 11 | ||||
| Investing for the future | |||
| We are investing in our networks, systems and services to ensure they enable our customers to take advantage of the digital revolution. | ||||
> More on page 12 |
6 BT GROUP PLCANNUAL REPORT & FORM 20-F
Table of Contents
OVERVIEWOUR BUSINESS
Our strategic priorities
We will build a better future for BT through our five strategic priorities:
| Broadband-based consumer services |
| >More on page 12 |
| The ‘Brand for Business’ for UK small and medium enterprises |
| > More on page 12 |
| BT Global Services – a global leader |
| > More on page 12 |
| The wholesaler of choice |
| > More on page 13 |
| The best network provider |
| > More on page 13 |
How we measure our progress
We measure our progress through three key performance indicators: earnings per share, free cash flow and customer service.
| Adjusted earnings per sharea,b (pence) 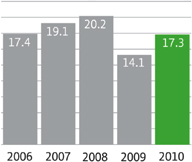 | Free cash flowb (£m) 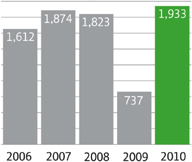 | Customer service improvementc (%) 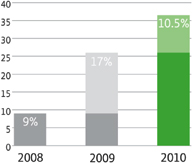 |
> More on pages 13 and 14
| a | Before specific items, BT Global Services contract and financial review charges in 2009 and net interest on pensions. | |
| b | Adjusted earnings per share and free cash flow are non-GAAP measures provided in addition to the disclosure requirements of IFRS. The rationale for using non-GAAP measures is explained on pages 54 to 56. A reconciliation of adjusted earnings per share and free cash flow, to the most directly comparable IFRS measure, is provided on pages 42 and 51, respectively. | |
| c | Cumulative improvement from 1 April 2007. |
BT GROUP PLCANNUAL REPORT & FORM 20-F 7
Table of Contents
OVERVIEWOUR BUSINESS
How we are structured
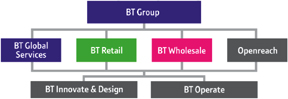
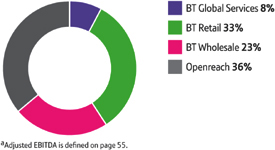
We meet the needs of our different customer groups in more than 170 countries around the world through four customer-facing lines of business – BT Global Services, BT Retail, BT Wholesale and Openreach. These are supported by two internal service units – BT Innovate & Design and BT Operate.
BT Global Services
BT Global Services is a global leader in the provision of networked IT services, serving multinational corporations, domestic businesses, government departments and other communications providers in more than 170 countries.
> More on page 22
BT Retail
BT Retail is the UK’s leading provider of telecommunications products and services to the consumer market, and provides IT services and communications solutions to the small and medium enterprises market.
> More on page 25
BT Wholesale
BT Wholesale provides products and solutions to communications providers in the UK and worldwide.
> More on page 28
Openreach
Openreach is responsible for the crucial ‘first mile’ of the UK telecommunications network – the copper wires and fibre connecting homes and businesses to their local telephone exchange.
> More on page 31
BT Innovate & Design
BT Innovate & Design is responsible for the innovation, design, development and delivery of the processes, networks and platforms on behalf of the customer-facing lines of business and which run BT’s business.
> More on page 33
BT Operate
BT Operate manages BT’s IT and network infrastructure platforms. It also runs parts of other communications providers’ networks on behalf of the customer-facing lines of business.
> More on page 33
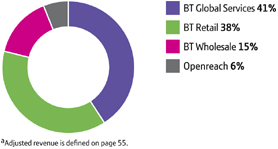
2010 Adjusted external revenueaby line of business
2010 Adjusted EBITDAaby line of business
How we maintain a sustainable business
We aim to carry out our business in a responsible and sustainable way as increasingly our customers, shareholders, suppliers and our people expect this from BT. The innovative solutions we develop will benefit both society and our long-term development.
> More on page 34

8 BT GROUP PLCANNUAL REPORT & FORM 20-F
Table of Contents
OVERVIEWOUR BUSINESS
Where we operate

We serve the needs of customers in the UK and in more than 170 countries worldwide.
> More on page 16
> More on page 16
Our products and services and who we sell them to
We have a portfolio of around 1,800 products and services. We sell them to consumers, small and medium enterprises and the public sector in the UK, and globally to multinational corporations, domestic businesses, government departments and other communications providers. Some of our customers are shown below.
> More on page 16

BT GROUP PLCANNUAL REPORT & FORM 20-F 9
Table of Contents
REVIEW OF THE YEAR
10 BT GROUP PLCANNUAL REPORT & FORM 20-F
Table of Contents
REVIEW OF THE YEAR
OUR BUSINESS AND STRATEGY
| Our business and strategy | ||
 | Who we are | |
| What we do | |
| Our aim | |
| Our strategic priorities | |
| How we measure our progress | |
| 2010 outlook | |
| 2011 outlook and future plans | |
This is the Annual Report for the year ended 31 March 2010. It complies with UK regulations and is the Annual Report on Form 20-F for the US Securities and Exchange Commission to meet US regulations. This Annual Report has been sent to shareholders who have elected to receive a copy. A separate summary financial statement & notice of meeting 2010 has been issued to shareholders who have elected to receive a shorter document. Both documents are available on the company’s website,www.bt.com
In this Annual Report, references to ‘BT Group’, ‘BT’, ‘the group’, ‘the company’, ‘we’ or ‘our’ are to BT Group plc (which includes the continuing activities of British Telecommunications plc) and its subsidiaries and lines of business, internal service units, or any of them as the context may require.
References to ‘a year’ are to the financial year ended 31 March of that year, e.g. ‘2010’ refers to the year ended 31 March 2010, except in relation to our fibre-based broadband roll out plans which are based on calendar years, not financial years. Unless otherwise stated, all non financial statistics are at 31 March 2010. Please see cautionary statement regarding forward-looking statements on page 156.
 Denotes non financial targets. Being a responsible and sustainable business is integral to the way we work. Our non financial key performance indicators measure our progress. These also include direct costs to BT related to our environmental and social performance, in line with the principles of the connected reporting framework.
Who we are
BT is one of the world’s leading communications services companies, serving the needs of customers in the UK and in more than 170 countries.
What we do
Our main activities are the provision of fixed lines, broadband, mobile and TV products and services as well as networked IT services.
In the UK we are the largest communications services provider, serving the consumer, business and public sector markets. Globally, we supply networked IT services to multinational corporations, domestic businesses and government departments. We also provide access to our network and services to more than 1,000 communications providers (CPs) in the UK and others worldwide.
Our aim
Our aim is to drive shareholder value by making BT a better business with a better future.
Three areas – customer service delivery, cost transformation and investing for the future – are essential building blocks to making BT a better business. They are linked: the better we serve our customers, the less time and money we spend on reworking and fixing faults. By continuing to transform our cost base, we open up new opportunities to invest in BT’s future.
We are committed to acting as a responsible business for shareholders, customers, suppliers and our people, developing innovative solutions that both benefit society and support our long-term development. Investing in the communities in which we operate and driving down our CO2 emissions are critical parts of this commitment.
Customer service delivery
Every part of BT is taking action to make substantial improvements to the delivery of our services by putting our customers at the heart of everything we do.
This means keeping our promises to our customers, being easy to contact and straightforward to deal with, keeping customers informed, and taking action to address the reasons why they complain.
We track the real experience of our customers from start to finish, and will remove duplication and inefficiency to drive down service provision time.
We have significantly reduced failures, faults and complaints over the past year and will invest in training, systems and better processes to continue this improvement. In the last year, we have reduced business and consumer complaints by 50% and 33%, respectively.
Cost transformation
We continue our drive to reduce costs across our business and deliver absolute levels of cost reduction. During 2010, our cost transformation activities have delivered a step change in the cost base of our business, with a reduction of £1,752m in total underlying operating costs and capital expenditure. All of our lines of business and internal service units have made a contribution to the delivery of these savings. SeeTransforming our cost baseon page 44 for further analysis.
Savings have been delivered from targeted cost reduction programmes which focus on eliminating the cost of failure across the group, an overhead value analysis programme which provides a structured approach to reducing costs on a project-by-project basis, and process re-engineering which reviews processes end-to-end across the group to remove unnecessary steps. These actions have allowed us to operate more efficiently and consequently reduce our input costs.
BT GROUP PLCANNUAL REPORT & FORM 20-F 11
Table of Contents
REVIEW OF THE YEAROUR BUSINESS AND STRATEGY
By reviewing procurement arrangements with our largest suppliers on a group-wide basis, we have improved supply terms and service delivery. We expect further benefits to be achieved in 2011.
As a result of increased efficiency across our operations, we have also been able to reduce our total labour resource, delivering substantial cost savings. In the past year, we have reduced the number of full time employees by around 9,000. In addition, the number of indirect employees working through agencies or third-party contractors was reduced by around 11,000, giving a reduction in our total labour resource of around 20,000. As far as possible, we have sought to retain our permanent workforce through redeployment, training and insourcing work which had been previously performed by subcontractors, and we will continue to do so. As we drive efficiency, we expect to be able to make further reductions in total labour costs.
Investing for the future
BT continues to invest to bring faster and more feature-rich services to our customers, including higher speed Ethernet and faster broadband. Our Ethernet footprint in the UK market is extensive, while ADSL2+ broadband delivered over copper lines is currently available to 55% of UK premises, with plans to increase to up to 75% by spring 2011.
We are investing £1.5bn and aim to make super-fast fibre-based broadband services available to at least 40% of UK premises in 2012 – one of the largest investments in fibre-based broadband ever undertaken in Europe. We aim to make our fibre services available to 4m UK premises by the end of 2010. Assuming an acceptable environment for investment, we see potential to expand our fibre roll out to around two-thirds of the UK by 2015 for an incremental investment of around £1bn. This will take our total fibre investment to £2.5bn which will be managed within our current levels of capital expenditure.
We are responding to market demand by providing a range of broadband access technologies and options – a mixed economy model – providing customer choice and flexibility. We are increasing access speeds over the existing copper infrastructure, over a mix of fibre and copper, and over fibre direct to premises. This mixed approach maximises use of the existing copper infrastructure, helping us be more efficient while also accelerating the speed of fibre roll out.
Fibre to the cabinet (FTTC) will, on current plans, be the most widely deployed fibre-based broadband technology, delivering download speeds of up to 40Mb/s and upload speeds of up to 10Mb/s and rising to up to 15Mb/s.
Fibre to the premises (FTTP) – which delivers speeds initially of up to 100Mb/s – is being deployed in new build sites and in existing premises where it is economically viable to do so.
Super-fast speeds allow users to run multiple bandwidth-hungry applications at the same time. For example, some members of a family could be watching different high-definition films, while others play online games or work on complex graphics or video projects.
For businesses, the new network will underpin the introduction of many new services and applications. Computer processing and storage of files will become more sophisticated and secure using ‘cloud’ computing technology, where scalable IT-related capabilities are provided as a service to customers using internet technologies. There will be faster back-up of computer systems, and wider use of high-quality videoconferencing within organisations, and between them and their customers.
As part of our plans for the future, we are making additional investments, mainly in the areas of enhancing our TV offering; introducing other new consumer propositions; and building on opportunities in BT Global Services, particularly in the Asia Pacific region.
Our strategic priorities
We will build a better future for BT through our five strategic priorities.
4 Broadband-based consumer services
We recognise that competition is intense and that customers’ demands are evolving, but we are confident we can continue to win in this changing market. We already provide the UK’s most comprehensive broadband service, offering more features than our competitors. This has helped us maintain our retail share of the broadband digital subscriber line (DSL) and local loop unbundling (LLU) market at around 35% over the past three years. We plan to build on this position in a number of ways.
Following the conclusion of the Office of Communications (Ofcom) narrowband market review in 2010 we are able to benefit from our new regulatory freedom to launch bundled services targeted at different customer groups. We will also use the Plusnet brand to offer lower-priced services for more price-conscious customers.
We will provide high-speed broadband services by exploiting the roll out of up to 20Mb/s broadband services and by taking full advantage of the roll out of our up to 100Mb/s super-fast fibre-based services.
We will build on our existing BT Vision service. It will be expanded to include free to air high-definition (HD) programming, more interactive services that will transform the TV experience, a wider choice of on-demand programming, and we will also provide greater access to premium sports.
4 The ‘Brand for Business’ for UK SMEs
We are already the leading provider of fixed communications for UK small and medium enterprises (SMEs), and we are well placed to grow our mobility and IT activities. The market is fragmented and no other supplier can match our channels or breadth of portfolio. We continue to build sales and service channels that can offer our smaller business customers a one-stop shop for communications and IT – providing good value for money in these challenging economic times. We aim to continue to win market share and to stem revenue decline by developing innovative products such as BT Business One Plan Plus, the first unlimited calls, lines, broadband and mobile option available to small businesses in the UK.
4 BT Global Services – a global leader
BT Global Services is a global leader in the provision of networked IT services. However, during 2009 the level of profitability in BT Global Services fell significantly. This was caused by a combination of higher costs, cost reductions being delivered more slowly than expected and worsening economic conditions. This led the Board to conclude that previous estimates of profitability for some of our major contracts were no longer likely to be achieved.
12 BT GROUP PLCANNUAL REPORT & FORM 20-F
Table of Contents
REVIEW OF THE YEAROUR BUSINESS AND STRATEGY
The Board took action as a result of these issues and BT Global Services has been restructured including changes being made to the senior management team (seeBT Global Services – How BT Global Services is changingon page 22).
Over the past year we have worked to improve efficiency and delivery, and to build a stronger business. We have made significant progress. We have improved the way we bid for and manage contracts, reduced costs and delivered better service for customers. These changes are delivering results with an improved financial and operational performance, and this is already showing in BT Global Services’ financial results, with a sequential improvement in adjusted EBITDA and a £430m reduction in operating cash outflow in 2010. But there is still much more to do and we will continue to drive this transformation.
We are seeking to strengthen our market position by enhancing our product portfolio and improving customer service and contract delivery, as well as through targeted investment in areas of potential profitable growth, such as in the Asia Pacific region where we already have a strong market presence. In this way, we can build on BT Global Services’ world-leading position.
4 The wholesaler of choice
BT is committed to supplying CPs in the UK and overseas with vital communications infrastructure. We have the broadest portfolio in the industry and are trusted to underpin the UK’s infrastructure. We aim to be the wholesaler of choice in the UK, where we have more than 1,000 CP customers and we are the established leader for carriers, and to extend and develop our international wholesale business. Over the next year, we also aim to consolidate further our position as a leading provider of managed network services (MNS) in the UK’s fixed and mobile markets.
Our traditional wholesale markets are in decline, but we expect to see the addressable market grow in the medium term due to growth in digital content, consolidation, convergence and capital constraints which make our white label services attractive for operators who do not want to invest in a fixed line infrastructure. We believe the capacity demand on our networks will quadruple by 2013.
We are simplifying and reinventing our portfolio through internet protocol (IP), enhancing our capabilities and expanding our addressable market to become a next generation wholesale business. We are investing in our products and services for the future, developing advanced, software-driven platforms and services that, for example, exchange traditional and IP traffic and capabilities to deliver video content which is growing exponentially.
In the mobile space, we are facilitating mobile network operators’ entry into the fixed line market and have MNS contracts in place with all five key operators. We are enabling the growth of 3G mobile data volumes in a market that is consolidating through mergers and infrastructure joint ventures.
4 The best network provider
Super-fast fibre-based broadband is critical to BT’s future success and will be critical to the UK economy. We will play a major part in this new communications environment and are making good progress in deploying this new technology.
At the same time, we will also continue to focus on our market-leading Ethernet footprint – which expanded from 600 nodes, or access points for customers, in 2009 to more than 800 in 2010.
Being the best network provider is not just about expanding coverage. We have also improved reliability and reduced costs through our cost saving and efficiency programmes. Our plan is to continue to deliver operational savings through further focus on the efficiency of our work. We have reduced the number of IT incidents across the network by 33% over the last two years.
How we measure our progress
We measure our progress through three key performance indicators: earnings per share, free cash flow and customer service.
Adjusted earnings per share
Adjusted earnings per share was 17.3p in 2010, compared with 14.1p in 2009 and 20.2p in 2008 (seeFinancial reviewpage 47).
Adjusted earnings per sharea,b
(pence)
Free cash flow
Free cash flow in 2010 was £1,933m, compared with £737m in 2009 and £1,823m in 2008 (seeFinancial reviewpage 51).
Free cash flowb
(£m)
| a | Before specific items, BT Global Services contract and financial review charges in 2009 and net interest on pensions. | |
| b | Adjusted basic earnings per share and free cash flow are non-GAAP measures provided in addition to the disclosure requirements of IFRS. The rationale for using non-GAAP measures is explained on pages 54 to 56. A reconciliation of adjusted earnings per share and free cash flow, to the most directly comparable IFRS measure, is provided on pages 42 and 51, respectively. |
BT GROUP PLCANNUAL REPORT & FORM 20-F 13
Table of Contents
REVIEW OF THE YEAROUR BUSINESS AND STRATEGY
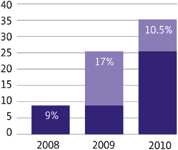
Customer service
In 2010 we achieved a 10.5% increase in the internal scores we use to measure customer service. This compares with a 9% improvement in 2008 and 17% in 2009. These measures are cumulative, so the results show real progress is being made.
Customer service year-on-year improvement
(%)
2010 outlook
In our original outlook statement for 2010 we said we expected:
| 4 | revenue to decline by 4%-5% | |
| 4 | a net reduction in group capital expenditure and operating costs of well over £1bn | |
| 4 | a reduction in group capital expenditure to around £2.7bn | |
| 4 | group free cash flow, before any pension deficit payments, but after the cash costs of BT Global Services restructuring, to reach over £1bn. |
During the year, as a result of our progress, we were able to update our outlook to:
| 4 | revenue to decline by 3%-4% | |
| 4 | total underlying cost reductions of at least £1.5bn | |
| 4 | EBITDA of around £5.7bn | |
| 4 | capital expenditure of around £2.5bn | |
| 4 | free cash flow of around £1.7bn | |
| 4 | net debt below £10bn | |
| 4 | dividend growth of around 5%. |
As shown in theFinancial summaryon page 3 we have delivered full year results ahead of our outlook.
2011 outlook and future plans
We aim to drive shareholder value by making BT a better business by focusing on three areas: customer service delivery; cost transformation; and investing for the future. We will build a better business for the future by focusing on five strategic priorities: driving broadband-based consumer services; being the ‘Brand for Business’ for UK SMEs; developing BT Global Services’ position as a global leader in networked IT services; being the wholesaler of choice; and being the best network provider.
As part of our plans for the future, we are making an additional investment of around £200m within our adjusted EBITDA outlook for 2011: mainly in the areas of enhancing our TV offering; introducing other new consumer propositions; fibre roll out; and building on opportunities in BT Global Services, particularly in the Asia Pacific region.
If investment conditions are favourable, we see the potential to extend our current fibre roll out to around two-thirds of UK premises by 2015 for an incremental cost of around £1bn, while maintaining our annual capital expenditure levels at around £2.6bn.
For 2011 our outlook is:
| 4 | revenue of around £20bn | |
| 4 | operating cost savingsaof around £900m | |
| 4 | adjusted EBITDAbafter leaver costs in line with last year’s level with underlying improvement being offset by the increase in the pension service charge of around £100m and targeted investment in the business of around £200m | |
| 4 | free cash flowcof around £1.8bn before the cash effect of specific items of around £150m, with capital expenditure at around £2.6bn | |
| 4 | BT Global Services operating cash flow expected to show further significant improvement, turning positive by 2012 | |
| 4 | Net debt below £9bn. |
Our future outlook is as follows:
| 4 | we expect improving underlying revenue trends from 2011 to 2013, with growth in 2013 | |
| 4 | BT Global Services revenue expected to grow by 2013 | |
| 4 | BT Retail expected to show an improvement in revenue trends over the period to 2013 | |
| 4 | BT Wholesale and Openreach revenue expected to be broadly level over the period to 2013 | |
| 4 | adjusted EBITDAbafter leaver costs expected to grow from 2011 to 2013 driven by a combination of further cost reductions and improving revenue trends | |
| 4 | free cash flowcbefore specific items expected to reach around £2bn by 2013 | |
| 4 | progressive dividends over the next three years. |
| a | Underlying operating costs before specific items, depreciation and amortisation. | |
| b | Before specific items. | |
| c | Before pension deficit payment. |
14 BT GROUP PLCANNUAL REPORT & FORM 20-F
Table of Contents
REVIEW OF THE YEAR
OUR MARKETS AND CUSTOMERS
| Our markets and customers | ||
| Our markets | |
| Competition | |
| Customers | |
| How we are structured | |
| How we sell our products and services | |
Our markets
We serve the needs of customers in the UK and in more than 170 countries worldwide.
In the UK, regulation and the open, commercial marketplace have created one of the most competitive telecommunications markets in the world. The market is characterised by demand for increasingly lower prices, ease of use, speed, reduced operational complexity, and the ability to offer end users genuinely differentiated services with improved quality of service.
UK consumer
The market in the UK has been challenging with falling demand for fixed lines and calls. The calls and lines consumer market is valued at around £5.9bn and declined by 1% last year.
BT’s market share of consumer fixed line revenue is 59%. We expect continuing pressure on our market share of calls and lines in particular as more people choose to buy telephony from their broadband supplier.
The broadband market has continued to grow through the recession despite the market maturing. Broadband penetration now exceeds two-thirds of UK households.
In the broadband market BT’s retail share of the DSL and LLU base remains strong at 35%, and our share of net additions was 44% in the fourth quarter of 2010, having remained above 40% for five consecutive quarters.
UK SMEs
We estimate that the total combined SME market for communications and IT is worth about £29bn per annum, of which BT had revenues of £2.6bn in 2010. The economic environment in 2010 has impacted the overall market with falling demand for lines and calls, slower growth in broadband, and lower IT spending. There have been fewer business start ups, a higher rate of insolvencies, and firms have been downsizing and cutting costs.
Wholesale
The UK wholesale and local access market is consolidating through the acquisition of CPs by other providers, and the merging of network and systems infrastructure. For example, Carphone Warehouse bought Tiscali, and Cable & Wireless acquired Thus. In addition, there has been consolidation in the mobile space with mobile operators 3 and T-Mobile sharing their infrastructure, as do O2 and Vodafone. During the year, Orange and T-Mobile also agreed to merge their UK operations. The industry is also embracing internet-based, next generation communications services that are faster, more flexible and cheaper. There is greater demand than ever for lower input prices, with stronger demand for higher, cost-effective bandwidth. Our wholesale customers are increasingly positioning themselves as service providers rather than network operators. Many of the services they provide are bandwidth hungry, which presents them with a challenge during an economic downturn as they may be unwilling to commit to the high levels of capital investment required by network expansion or upgrade. This presents us with opportunities to supply a range of managed network and outsourced services leveraging our network capacity.
BT operates in the wholesale market outside the UK, primarily through Global Telecoms Markets, the wholesale arm of BT Global Services. The business provides voice and non voice connectivity and consultancy capabilities to fixed line and mobile network operators worldwide, primarily across BT’s global network assets.
Global networked IT services
Globally, we are in the networked IT services market which is valued at around US$579bn, according to International Data Corporation (IDC). As the market responds to economic conditions, we see continued interest in network operational efficiency, workforce management, security, unified communications (where an organisation’s infrastructure, mobility, desktop and applications work together), global hosted contact centre solutions, virtualisation (where the resources of a single computer are shared across multiple applications), and ‘cloud’ services.
As a result of the global recession, industry analysts Gartner reported the worldwide IT industry declined by 5% in the 2009 calendar year, but is expected to recover in the 2010 calendar year. We are well placed to take advantage of any upturn in the economic climate.
Competition
The markets in which we operate are very competitive.
| 4 | In the UK consumer market, our voice and broadband offerings compete with a range of players and propositions. Our competitors include a number of well known brands that utilise BT’s infrastructure to provide competing services in telephony and broadband, and also Virgin Media which provides an alternative service utilising its own cable network. | |
| 4 | In serving our SME customers, we find competition is fragmented and can depend on which services our customers take from us, simple connectivity, or one of our more popular IT services packages. For smaller accounts, we might be in competition with local start-ups or services firms such as Geek Squad. For larger SMEs, we face competition from, among others, TalkTalk (via Opal) and Cable & Wireless Worldwide. However, we retain the largest market share in voice telephony. | |
| 4 | The networked IT services market is also challenging, both in the UK and internationally. Companies such as Orange Business Services and Verizon Business are targeting multinational corporations. | |
| 4 | Finally, while we have the largest network in the UK, our BT Wholesale and Openreach lines of business compete regularly against other CPs either selling network capabilities to others or choosing to build their own infrastructure. |
BT GROUP PLCANNUAL REPORT & FORM 20-F 15
Table of Contents
REVIEW OF THE YEAROUR MARKETS AND CUSTOMERS
Customers
We meet the needs of customers ranging from individual consumers through to multinational corporations and the communications industry. Our portfolio of products and services is sold in four customer segments by the customer-facing lines of business: BT Global Services, BT Retail, BT Wholesale and Openreach.
Multinational corporations
BT Global Services provides networked IT services to organisations ranging from multinational corporations like major banks, retailers and pharmaceutical manufacturers to local businesses and government departments, in more than 170 countries. Organisations need to be more efficient and effective. They are looking at ways to meet expectations of customer service at a time when, as a result of economic conditions, budgets are increasingly under pressure.
We have created a powerful combination of networked IT and professional services capabilities to help our customers deliver sustainable organisations, communicate effectively, improve their own customer focus, create security and resilience, react to a changing marketplace, and increase their operational efficiency.
Public sector
As one of the largest suppliers of networked IT services for the UK Government, we are well placed to help it improve the efficiency and effectiveness of public services through networked and shared IT infrastructures, electronic purchasing and procurement, while meeting stringent security requirements. We help the Government outsource services to be more effective with the use of customer contact centres and the internet for revenue collection and benefit distribution, engagement with citizens, and mobile and flexible working.
We are a trusted supplier of networked IT services to central and regional governments in many other countries around the world. As one example of this, an important new business win for BT Global Services this year was a major contract awarded by the Spanish government to connect its embassies across the world with national and international data networks.
The UK Government, collectively, is our largest customer, but the provision of services to any one of its departments or agencies does not comprise a material proportion of our revenue. Except as described inOur relationship with HM Governmenton page 39, the commercial relationship between BT as a supplier and the UK Government as a customer has been on a normal customer and supplier basis.
SMEs
We provide the UK’s SMEs with a range of IT and communications solutions. We have around 1m SME customers, characterised by their diversity, which can be anything from a start-up or ‘micro-business’ with from one to 10 employees, through to a substantial medium-sized business with up to 1,000 or more employees. We aim to simplify the management of communications for these customers, giving them value for money and driving innovation so they can get more benefit from their investment in communications. Our broadband, e-mail, VoIP and online applications help SMEs keep in touch and communicate online with their customers, employees and suppliers, while our domain and web-hosting services make it easy for them to get online, develop their business online and sell online. Our mobile services also help our SME customers work on the move.
‘Cloud’ computing has great potential for delivering IT services to SMEs at lower prices. It is a style of computing where scalable and flexible IT capabilities are provided as a service to customers over the internet. We are offering business applications that exploit ‘cloud’ computing.
Consumer
We serve consumer customers in the UK with fixed lines, broadband, mobile and TV products and services. We aim to offer value-for-money packages.
We meet the needs of the increasing numbers of consumers wanting to buy telephony, broadband and TV from a single provider. These bundled services have increased in popularity as they meet users’ needs at a fixed price. BT Vision, our on-demand television service, gives viewers access to a wide range of TV and radio channels and pay-per-view services.
We are also the only CP to offer a special service across the UK to the more vulnerable members of our society. BT Basic offers a discount of over 60% off line rental, is available to nearly four million people on low income and also includes a call allowance.
Wholesale and carrier
Our wholesale and carrier customers are fixed and mobile operators, internet service providers, broadcasters, and other CPs. We provide these customers with a portfolio of broadband and high-speed data connectivity, interoperability, voice and interconnection services, as well as partial or fully-managed network services and platforms.
They are a diverse group of companies, with end users ranging from large corporations to individual households.
How we are structured
We have four customer-facing lines of business: BT Global Services, BT Retail, BT Wholesale and Openreach. These are supported by two internal service units: BT Innovate & Design and BT Operate.
BT Retail, BT Wholesale and Openreach operate mainly in the UK, where we are one of the largest communications services providers to the consumer and business markets. BT Global Services operates in the UK and globally.
In the UK we support CPs through BT Wholesale and Openreach, and internationally through Global Telecoms Markets, a part of BT Global Services.
How we sell our products and services
BT has a portfolio of around 1,800 products and services, divided into five broad categories:
| 4 | Managed solutions which comprise networked IT services, multi-protocol label switching (MPLS) and MNS | |
| 4 | Broadband and convergence | |
| 4 | Calls and lines | |
| 4 | Transit, conveyance, interconnect circuits, wholesale line rental (WLR), global carrier and other wholesale products | |
| 4 | Other products and services which include BT Global Services’ revenue from non UK global products and BT Retail’s Enterprises division including revenue from conferencing, directories, payphones and other select services. |
16 BT GROUP PLCANNUAL REPORT & FORM 20-F
Table of Contents
REVIEW OF THE YEAROUR MARKETS AND CUSTOMERS
UK consumers can contact us online, through our call centres, or in ‘stores without walls’ which are situated in prime locations in major shopping centres across the UK and provide an opportunity for our customers to interact with us face-to-face. We promote our products and services widely using a full range of media including TV and social media such as Facebook.
We sell to the UK’s SMEs through our call centres, online, or via account teams, and also through 47 BT Local Businesses – regional franchises with their own sales staff and account management teams.
CPs can order most of our products and services online, and we have standardised our systems and processes across our next generation broadband portfolio to streamline service delivery.
Increasingly, our CP customers are choosing MNS. We bring BT’s economies of scale to their cost base, and they no longer have to worry about core network management, building new infrastructure or even running an engineering field force. By outsourcing these tasks to BT, our customers are free to focus on their own customers’ needs.
Our biggest wholesale customers are supported by client directors who have a thorough understanding of the companies they support and take overall responsibility – providing products and services from our existing portfolio, and developing solutions based on their understanding of their customer’s business priorities.
Openreach has a range of account management options from which CPs can choose. All new customers go through a specialised ‘customer establishment process’, fully supported by dedicated Openreach people. Once set up, customers mainly order through a secure online portal, where possible by integrating the Openreach order management system into their own operations.
BT Global Services manages a wide variety of customers, with relationships of varying degrees of complexity. We have created a consistent framework for our relationships. These range from complex relationships with global multinational corporations, where we have developed a client engagement model integrating sales delivery and professional services, through to desk-based account management relationships, channel partner relationships and even web-based self-servicing for some other customers.
BT GROUP PLCANNUAL REPORT & FORM 20-F 17
Table of Contents
REVIEW OF THE YEAR
| Our resources | ||
| Brand and reputation | |
| People | |
| Networks and platforms | |
| Global research capability | |
| Suppliers | |
| Property portfolio | |
Our resources, in particular our brand and reputation, our people, our networks and platforms, global research capability, suppliers and property portfolio are critical to delivering our business priorities.
Brand and reputation
We are committed to delivering our brand vision of helping our customers thrive in a changing world.
We are proud to have a trusted brand that is recognised in the UK and around the world as a leader in delivering communications services.
A strong brand is important as it helps shape our relationships with customers and suppliers, and between the people who work for the company. Customers turn to suppliers they know they can rely on.
BT marks the 1,000 day countdown to the London 2012 Olympic Games and Paralympic Games

Our partnership with the London 2012 Olympic Games and Paralympic Games is a powerful signal of the inspiring and innovative brand we aim to be. We are the official communications services partner and will be providing the critical communications infrastructure which means that working together with our fellow London 2012 technology partners we will carry every image, sports report, visit to the London 2012 website and millions of calls, e-mails and texts.
With just over two years to go to the Olympic and Paralympic Games, our partnership with London 2012 is already delivering real benefits. The work we are doing at the Olympic Park in Stratford, East London and at event sites around the country, is helping demonstrate our capabilities to large customers. Internally, we have seen an increase in the proportion of employees who say the partnership makes them feel proud to work for BT, rising from 59% in 2009 to 71% in 2010.
We are measuring the impact of our services using a newly developed carbon footprint methodology and will be capturing lessons learned about where savings can be made for future Games. We are also sponsoring the BT Paralympic World Cup in Manchester in May 2010, an event for elite international athletes.
Our support for major sporting events was reinforced in February when we became an official supporter of the England 2018 FIFA World Cup bid.
People
One of our key resources is our people and we aim to maintain a team of high-performing, engaged and motivated people who can make a difference for customers, shareholders, the company and themselves. The quality of our leadership is vital to BT’s continued transformation. We aim to ensure leaders at all levels understand what is expected of them and have access to appropriate development opportunities.
The improvement in our efficiency has enabled us to reduce our total labour resource with the majority of this reduction in indirect labour. We have a successful track record of redeploying and retraining people by helping them learn new skills and find jobs within BT’s growth areas. Some BT people are being given the opportunity to gain valuable experience and develop their skills while seconded to another organisation.
At 31 March 2010, BT employed around 78,200 full-time equivalent people in the UK, and around 17,900 outside the UK. We also employ 32,000 people indirectly, through agencies and contractors, giving BT a total labour resource of around 128,100. This represents a reduction in total labour resource in the past year of around 20,000 people.
We continue to support an inclusive working environment in which our people can develop their careers regardless of their race, sex, religion/beliefs, disability, marital or civil partnership status, age, sexual orientation, gender identity, gender expression or caring responsibilities and we are proud of our performance benchmarks. Our policy is for people to be paid fairly, regardless of gender, ethnic origin or disability.
We work with specialist recruitment agencies to attract people with disabilities to work for BT and we run a retention service to ensure that talented people can stay with us even if their capabilities change.
Diversity of the BT workforce
| Target 2011 | 2010 | 2009 | 2008 | |||
| BT will maintain a top 10 position in four of five major diversity benchmarks; four UK based, and one global |  |  | | |||
18 BT GROUP PLCANNUAL REPORT & FORM 20-F
Table of Contents
REVIEW OF THE YEAROUR RESOURCES
We aim to give our people the skills and the tools necessary to ensure that every customer experience is an excellent one. We offer our people a wide range of learning and re-skilling opportunities. For example, this year more than 5,000 BT people, many of whom have very few formally-recognised qualifications, are undertaking training that will lead to a nationally-recognised qualification awarded by a third party. We also support federated and group apprenticeship schemes.
Tidying waterways bordering the Olympic Park in Stratford is just one of many volunteering activities carried out by BT people

BT people are also encouraged to volunteer in their communities and about 4,000 people around the world have been involved in 2010 for around 28,700 days. The community benefits from their involvement, while they benefit from the opportunity to enhance their existing skills.
Reward and recognition
We conduct a review of salaries every year. Managers are eligible for variable, performance-related bonuses, and the long-term share incentives for our most senior managers are linked to BT’s total shareholder return and cash generation performance measured over a period of three years. For Openreach senior managers, the key measure is Openreach’s performance over a three-year period.
Employees outside the UK currently receive an annual award of free BT shares or a cash equivalent depending on local legislation and/or regulation. In the UK, employees receive free broadband. Employees in more than 25 countries also have the opportunity to save to buy BT shares at a discount to the price at the start of the savings period. Under the BT Employee Share Investment Plan, UK employees can buy BT shares from their pre-tax and pre-National Insurance salaries. More than 50% of eligible employees participate in one or more of these plans.
In relation to the 2010 pay review, the company made an offer to increase salaries but has not reached agreement with the Communication Workers Union (CWU) regarding a pay settlement for the team member (non manager) population. The company has reached an agreement with the pay negotiating committee of Prospect, the trade union representing managerial and professional staff, on the pay arrangements for 2010. This agreement was recommended to the membership by the executive committee of the union and it is hoped that the settlement will be accepted by the membership of the union following a ballot which is being conducted in May 2010.
Pensions
Most of BT’s UK employees are members of a pension scheme – either the BT Pension Scheme (BTPS), a defined benefit scheme, or the BT Retirement Saving Scheme (BTRSS), a defined contribution scheme. The BTPS has around 55,000 active members, 185,000 pensioners and 93,000 deferred members. The BTPS was closed to new members on 31 March 2001.
As a result of a review of our UK pension arrangements in 2009, there have been changes to future benefit accruals under the BTPS. To ensure the scheme remains flexible, fair and sustainable in the long term, benefits built up from 1 April 2009 are now on a career average re-valued earnings basis, members’ contributions have increased, and the scheme has ceased to be contracted out of the State Second Pension. Also, the normal pension age has risen from 60 to 65. Benefits built up before 1 April 2009 remain linked to final pensionable salary.
BT has reached agreement with the Trustee of the BTPS on the triennial funding valuation of the BTPS at 31 December 2008 and a 17-year recovery plan which is discussed in more detail in theFinancial reviewon page 53.
The BTRSS was set up on 1 April 2009 and has more than 17,500 active members. It is a contract-based, defined contribution arrangement, which means that what the pension members receive is linked to contributions paid, the performance of the fund and the annuity rates at retirement, rather than to their final BT salary.
Health and safety
The health and safety of our people are of paramount importance, and we continue to seek improvements by focusing on behavioural and lifestyle change. Details of time lost to injury and sickness absence are given in the graph below along with their cost to BT.
Our lost time injury rate rose for the first time in three years, and we failed to meet our target, due to the adverse winter weather conditions in the UK resulting in an increase in injuries.
Lost time injury rate– lost time injury cases expressed as a rate per 100,000 hours worked on a 12-month rolling average
| Non financial performance | ||||||||||||
| Target 2011 | 2010 | 2009 | 2008 | |||||||||
| Reduce to 0.18 cases | 0.209 | 0.160 | 0.188 | |||||||||
| Financial performance | ||||||||||||
| 2010 | 2009 | 2008 | ||||||||||
| Cost to the business arising from injuries resulting in time off work | £5.6m | £7.0m | new measure in 2009 | |||||||||
We failed to meet our target for sickness absence this year due to the H1N1 ‘swine flu’ influenza pandemic, causing an anomaly in the number of cases of colds and flu.
Sickness absence rate- percentage of calendar days lost to sickness absence expressed as a 12-month rolling average
| Non financial performance | ||||||||||||
| Target 2011 | 2010 | 2009 | 2008 | |||||||||
| Reduce to 2.21% | 2.46% | 2.17% | 2.43% | |||||||||
| Financial performance | ||||||
| 2010 | 2009 | 2008 | ||||
| BT sick pay costs | £95.4m | £85.2m | £89.8m | |||
BT GROUP PLCANNUAL REPORT & FORM 20-F 19
Table of Contents
REVIEW OF THE YEAROUR RESOURCES
People engagement and communication
Keeping our people informed about what is happening in BT is an important part of how we manage our business. We use a range of communications channels, including online news services, quarterly employee magazine and two-way communications activities such as town hall meetings and webchats.
We have a record of stable industrial relations and constructive relationships with recognised unions in the UK and works councils elsewhere in Europe. In the UK, we recognise two main trade unions – the CWU and Prospect. We also operate a pan-European works council, the BT European Consultation Committee (BTECC).
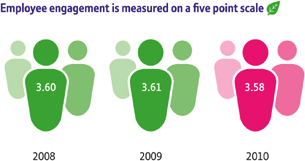
Our values
Our values are a guide to how we get things done in BT. They describe an approach and an attitude which will help us provide a consistent customer experience:
| 4 | Trustworthy: we do what we say we will | |
| 4 | Helpful: we work as one team | |
| 4 | Inspiring: we create new possibilities | |
| 4 | Straightforward: we make things clear | |
| 4 | Heart: we believe in what we do. |
We measure BT’s relationship with employees through our annual attitude survey on a five-point scale. In 2010, this was 3.58. We have held engagement steady through challenging economic conditions. Our target for 2011 is to maintain or improve on the 2010 result.
Networks and platforms
We have the most comprehensive fixed line communications network in the UK, with around 5,600 exchanges and 670 local and 120 trunk processor units.
We own and maintain the UK’s local access network – the copper wires and fibre connecting homes and businesses to telephone exchanges, from where phone calls and data are transmitted across the country and the world.
More than 99% of UK premises now have access to first generation broadband which is capable of delivering up to 8Mb/s. At 31 March 2010, our second generation broadband, based on ADSL2+ technology, offered up to 20Mb/s service to 55% of UK premises, with plans to increase to up to 75% by spring 2011. We are now rolling out super-fast fibre-based broadband, with a combination of FTTC and FTTP. We aim to make our fibre services available to 4m UK premises by the end of 2010 and to be available to at least 40% of UK premises in 2012. Assuming an acceptable environment for investment, we see potential to expand our fibre roll out to around two-thirds of the UK by 2015 for an incremental investment of around £1bn.
BT’s network platform is a global, open, software-driven IP platform, integrating various network layers into one converged multi-service network. Products and services provided on top of this flexible infrastructure give customers high-speed access and converged communications and content services. It helps us meet our customers’ needs faster and more efficiently – whether they are delivered over copper or fibre – and reduces the time it takes to get new services to market, eliminating duplication and reducing costs.
We have also further extended our Ethernet footprint, from 600 nodes in 2009 to more than 800 in 2010. Ethernet is a next generation data connectivity service offering high-speed, lower cost connectivity for large volumes of data between sites. This expansion has enabled us to provide improved and lower cost high-speed Ethernet services across the largest footprint in the UK marketplace.
Our international MPLS network service provides coverage and support around the world. It provides the performance, reliability, and security of a leased-line network with the scalability and flexibilities of an IP network. It delivers mission-critical data applications, as well as multimedia and our business quality IP voice service, as part of a converged voice and data solution. BT MPLS allows customers to prioritise traffic based on application, ensuring essential data applications are served irrespective of the growth of competing, lower priority traffic.
Global research capability
Technology innovation and the ability to create new and exciting products and services our customers want is critical to BT’s future.
Our research and development team works with customers, partners and universities around the world. We have dedicated innovation scanning teams in the US, Asia, Europe and the Middle East who identified more than 500 new technologies, business propositions and market trends over the year – and global development centres in the UK, US, Europe, India and China. We have focused on bringing our innovation scanning and research teams closer to our customers, designers and product development teams so that BT can quickly capitalise on the opportunities they uncover.
In 2010 we invested £789m (2009: £1,119m) in global research and development to support our drive for innovation. This investment comprised capitalised software development costs of £345m (2009: £529m) and research and development operating costs of £444m (2009: £590m).
We embrace open innovation and our acquisition of Ribbit in the US in 2008 extended our ability to recruit ideas from outside our own boundaries. It provides an open platform that enables developers to create innovative voice applications and services by combining telephony and internet technologies in new ways. We give our global community of developers access to our technology through the Ribbit interface, allowing them to innovate at will – without any prior knowledge of telephony. We believe it is this community of more than 21,000 and growing registered developers that will create the next generation of communications solutions.
In 2010 we filed patent applications for 63 inventions. We routinely seek patent protection in different countries including the US, Japan, France, Germany and China, and we currently maintain a total worldwide portfolio of around 6,400 patents and applications.
20 BT GROUP PLCANNUAL REPORT & FORM 20-F
Table of Contents
REVIEW OF THE YEAROUR RESOURCES
Suppliers
BT has around 11,000 suppliers across the world, and spends approximately £12bn per annum with them, with the top 100 accounting for more than 65% of this spend. We operate a strategic sourcing process for the vast majority of spend to derive maximum value and ensure the appropriate suppliers are engaged.
We source products and services from across the world and have procurement professionals located in 16 countries.
We have a set of purchasing principles which ensure we act in an ethically and commercially responsible way in our business dealings with our global supply base. We work with our suppliers to ensure the goods and services we procure are made, delivered and disposed of in a socially and environmentally-responsible manner. Sustainability factors such as energy usage, environmental impact, and labour standards are embedded in our sourcing and adjudication process, and influence supplier and product selection.
Supplier relationships– a measure of the overall success of BT’s relationship with suppliers, based on our annual supplier survey
| Non financial performance | ||||||||||||
| Target 2011 | 2010 | 2009 | 2008 | |||||||||
| To achieve a rating of 80% or more based on a response of ‘excellent’ or ‘good’ to the question: ‘How would you describe the quality of your company’s relationship with BT?’ | 86 | % | 85 | % | 78 | % | ||||||
| Financial performance | ||||||||||||
| 2010 | 2009 | 2008 | ||||||||||
| Total spend with external supply base | £12.0bn | £13.0bn | £12.8bn | |||||||||
Ethical trading– a measure of the application of BT’s supply chain human rights standard | ||||||||||||
| Non financial performance | ||||||
| Target 2011 | 2010 | 2009 | 2008 | |||
| To achieve 100% follow up within three months for all suppliers identified as high | 180 risk | 78 risk | 234 risk | |||
| or medium risk, through our ethical standard questionnaires | assessments | assessments | assessments | |||
| with 100% | with 100% | with 100% | ||||
| follow up | follow up | follow up | ||||
Value of procurement contracts– where our suppliers agree that we work with them to improve sustainability impacts | ||||||
| Financial performance | ||||||
| 2010 | 2009 | 2008 | ||||
| Value of spend where our suppliers agree that BT ensures its purchases are made, delivered, used and disposed of in a socially and environmentally responsible manner (extrapolated from supplier survey responses) | 86% of supplier spend | 83% of supplier spend | 66% of supplier spend | |||
Payment of suppliers
In normal circumstances, BT’s payment terms for contracted suppliers will be to pay each due, valid and undisputed invoice between 60 and 73 days from date of receipt from the supplier. There are variations to this policy, for example interconnect payments to other telecommunications operators, low value spend, various customer-specified requirements and rates are paid in shorter timescales. In 2010, the average number of days between the invoice date and the date of the payment run for the invoice was 49 (2009: 49).
In the UK, BT provides access to a supplier financing scheme which offers contracted suppliers the opportunity to obtain payments in advance of the agreed terms. In addition, BT subscribes to the Better Payment Practice Code, details of which can be found atwww.payontime.co.uk
Property portfolio
At 31 March 2010, we occupied around 6,500 properties in the UK, and around 350 general purpose properties in the rest of the world. The majority of the UK properties are owned by – and leased from – Telereal Trillium, which is part of the William Pears Group.
Approximately 85% of the UK portfolio consists of operational telephone exchanges which contain exchange equipment and are needed as part of our continuing activities. Other general purpose properties consist chiefly of offices, depots and computer centres.
We are constantly monitoring our use of space. In the last two years, our focus on cost savings and efficiency has led to significant reductions in our total labour resource. This has resulted in vacant space and under-utilisation of buildings within our UK property estate. Accordingly, in 2010 we initiated a property rationalisation programme to consolidate office space within the estate.
As detailed in theSpecific itemssection in theFinancial reviewon pages 45 to 46, a property rationalisation charge of £121m has been recognised in 2010. The property rationalisation programme is expected to continue over the next two years as further properties are vacated. Including the charge recognised in 2010, we expect to incur a total charge in respect of this programme of around £300m.
Our group property team manages waste and recycling on behalf of the rest of the business. More detailed information on our performance regarding waste management and recycling is given below.
Waste to landfill and recycling– a measure of BT’s use of resources
| Non financial performance | ||||||||||||
| UK only | ||||||||||||
| Target 2011 | 2010 | 2009 | 2008 | |||||||||
| BT Group will reduce the tonnage of waste sent to landfill by 10% from 2010 levels | 15 | % | 17 | % | 22 | % | ||||||
| reduction | reduction | reduction | ||||||||||
| in waste to | in waste to | in waste to | ||||||||||
| landfill from | landfill from | landfill from | ||||||||||
| 2009 | 2008 | 2007 | ||||||||||
| Financial performance | ||||||||||||
| UK only | ||||||||||||
| 2010 | 2009 | 2008 | ||||||||||
| Net benefit to the business of the waste programme | £1.61m | £0.67m | £0.32m | |||||||||
BT GROUP PLCANNUAL REPORT & FORM 20-F 21
Table of Contents
REVIEW OF THE YEAR
OUR LINES OF BUSINESS
| Our lines of business | |||
| | BT Global Services | ||
| BT Retail | ||
| BT Wholesale | ||
| Openreach | ||
 | BT Innovate & Design | ||
| BT Operate | ||
Our customer-facing lines of business are BT Global Services, BT Retail, BT Wholesale and Openreach. They meet the needs of our different customer groups, supported by two internal service units, BT Innovate & Design and BT Operate.
The financial performance of each of our customer-facing lines of business for 2010, 2009 and 2008 is discussed in this section. We measure the financial performance of BT Global Services, BT Retail, BT Wholesale and Openreach on an ‘adjusted’ basis, being revenue, EBITDA and operating profit; all stated before specific items. For BT Global Services adjusted EBITDA also excludes the impact of the contract and financial review charges recognised in 2009. For further discussion of these items, see pages 54 to 56. A reconciliation of adjusted EBITDA to group operating profit (loss) by customer-facing line of business, and for the group, is provided in theSegment information, note 1 to the consolidated financial statements on page 102. The financial performance commentaries for each customer-facing line of business also discuss movements in operating cash flow. Operating cash flow is defined as adjusted EBITDA less direct and allocated capital expenditure, working capital movements and other non cash items.
BT Global Services
How BT Global Services is changing
In 2009 a combination of higher costs, the slow delivery of cost reduction initiatives and worsening economic conditions caused the level of profitability in BT Global Services to fall significantly. The Board took action as a result of this, including changing the BT Global Services senior management team.
The new team’s brief was to address the cost base, bring greater focus to the profitability of new contract wins and reduce shortfalls in delivery performance on existing contracts.
The management team undertook an extensive review of BT Global Services’ financial position, contracts and operations. The financial review covered the financial performance of BT Global Services and its balance sheet position. The contract reviews covered the largest and most complex contracts and were conducted jointly with external advisors. Having completed the contract and financial reviews, charges of £1.6bn were recognised in 2009, which included £1.2bn relating to two major contracts. These charges reflected a more cautious view of the recognition of the expected and future cost efficiencies and revenues and other changes in underlying assumptions and estimates, particularly in the light of the economic outlook.
The new management team implemented a number of process improvements in 2009 and further enhancements have been made in 2010, as noted below.
The operational review was completed towards the end of 2009 and resulted in a revised operating model and restructuring plan to reshape and refocus the business, in order to further enhance BT Global Services’ ability to serve customers and establish a significantly lower cost base.
In 2009 we said that we expected to incur restructuring charges of around £420m in 2010 and 2011. In 2010, we have recognised restructuring charges of £301m (2009: £280m), predominately comprising network, products and supplier rationalisation charges and people and property costs. Further restructuring charges of around £175m are expected to be incurred in 2011, giving a total charge of around £475m, above our original estimate of £420m. This increase reflects the complexities of our restructuring programme. An analysis of these charges is provided in theSpecific itemssection of theFinancial reviewon pages 45 to 46.
In 2010 we implemented the new operating model in BT Global Services, which focuses on three customer segments:
| 4 | seamless global connectivity and networked IT services to multinational corporations | |
| 4 | networked IT services to customers in the UK corporate and public sectors | |
| 4 | networked IT services to corporate and public sector customers outside the UK. |
Other structural improvements have been made to improve the organisation. During 2010 we significantly improved contract management, risk management and performance. We have changed the way we bid for major contracts and also carry out regular in-life contract reviews to assess commercial risks and opportunities and to improve contract performance, creating independent review teams to provide additional assurance on our most significant contracts.
Sales teams have been realigned to focus on the key customer segments, and service units have been restructured. We have brought together all design, programme and technical delivery people across the wider design organisation to standardise and create replicable solutions. This has helped us to manage and more accurately forecast demand and costs. We have continued to rationalise systems and networks. Strategy, marketing, propositions, commercial, legal and regulatory functions have also been realigned.
We have made progress this year but we still have more to do.
Business overview
BT Global Services is a global leader in the provision of networked IT services to multinational corporations, domestic businesses, government departments and other CPs in more than 170 countries. We have a strong customer base, global reach, and a powerful combination of networked IT and professional services capabilities.
We aim to be the global partner of choice for multinational corporations, the number one provider to business and public
22 BT GROUP PLCANNUAL REPORT & FORM 20-F
Table of Contents
REVIEW OF THE YEAROUR LINES OF BUSINESS
sector organisations in the UK, and a leading player in other countries key to our customers. Our professional services consultants use in-depth knowledge of networked IT services, combined with a solid understanding of sector-based business processes, to build on the investment our customers make in networked IT services to help them to realise business benefits, including cost saving, productivity gains, competitive advantage, and improved customer experience and loyalty. We have consultants located worldwide helping our customers choose the right technology solution for their business, and how to use it to deliver what they need.
We build and run complex networks for our customers to enable them to deliver applications critical to their success. Building on our network expertise, we provide services which include unified communications, mobility, customer relationship management (CRM) and customer contact centres, data centre services, flexible working, IT sustainability, managed security and sophisticated conferencing solutions.
Our customers benefit from BT’s global scale, but they are sold to, and served by, our teams in their own countries and sectors who understand their specific business challenges and create locally relevant solutions.
BT Global Services has a worldwide reach and capability. More than 300 of our top customers are headquartered in the US. In Latin America, we operate in 22 countries where we offer communications services including IP infrastructure, outsourcing solutions and business transformation.
The world’s top stock exchanges, leading broker-dealers and biggest banks depend on BT infrastructure to provide secure, shared connectivity and services.
BT Global Services sees the Asia Pacific region as a major area for growth and plans to further increase its capabilities to capture the dynamic business opportunities available in the fast-growing region. The new investment will build on the strong market presence already established and will align to growth plans of multinational customers as they continue to expand. Key elements will be extending our professional services, industry sector and innovation resources with enhancements to many products and services and the establishment of technology showcase centres where customers can directly experience BT’s leading edge products.
In China we have technology and service centres providing software development, service delivery and multilingual customer support.
Headquartered in Singapore, BT Frontline is a leading regional provider of end-to-end IT services including consulting and implementation, IT security, enterprise software and outsourcing services and solutions.
In Europe, we are a leading provider of communication services dedicated to the corporate, SME and public sectors in Italy. In Spain, we are a leading alternative enterprise data transmission provider. Our customers in Germany include more than two-thirds of the DAX 30 companies.
More than 20 of Switzerland’s top 100 multinational companies and international financial organisations use our services, as well as global institutions including the World Health Organisation and the United Nations. In the three Benelux countries, our 870 customers include the EU and NATO.
Operating review
In challenging market conditions we continued to win and re-sign contracts in our three key markets, with a total order value of £6.6bn in 2010 (2009: £7.9bn, 2008: £7.8bn) which reflects the continued interest in outsourcing, managed and hosted services, converged communications and security.
The lower order intake value in 2010 reflects the market trend towards lower value and shorter contracts and longer sales lead times as customers delay decisions in the current climate.
Order intake
(£bn) 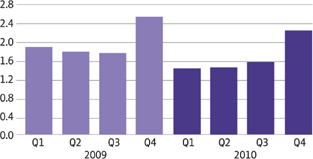
(£bn)
We secured a number of contract renewals and extensions with existing customers, including leading multinationals, in 2010. These included:
| 4 | a global contract with FIAT Group to provide and manage their worldwide networked IT services with an MPLS network connecting more than 500 locations in 37 countries | |
| 4 | a two-year contract extension with Eni Group, one of the world’s major integrated energy companies, to provide and manage their global telecommunications services across five continents. |
Our focus on the important Asia Pacific market was demonstrated by a contract secured to provide a managed services solution for Deutsche Post DHL’s telecommunications infrastructure in 15 countries and more than 1,000 sites across the region.
During the year we built on our expertise and leadership in the global banking and financial markets sector. New contracts in this sector included:
| 4 | global investment bank Nomura to provide dealing room technologies and implementation of market data infrastructure | |
| 4 | Commerzbank, one of Germany’s biggest banks, to manage local and wide area network across hundreds of sites. |
In the UK we secured a three-year contract extension with the UK Department for Work and Pensions to provide voice, data network and contact centre solutions helping to transform their voice and data network, which regularly handles more than two million calls a day and at peak times has managed three million.
Other UK public sector contract wins included the Ministry of Defence which awarded us a five-year contract to manage voice and data networks across 196 military bases as part of the defence fixed telecommunications service agreement BT delivers on their behalf and a seven-year deal in partnership with Capgemini to provide IT and communication services to the Environment Agency in England and Wales.
BT GROUP PLCANNUAL REPORT & FORM 20-F 23
Table of Contents
REVIEW OF THE YEAROUR LINES OF BUSINESS
We continue to deliver on our National Health Service (NHS) National Programme for Information Technology contracts. We had our busiest year for deployments under our local service provider contract, where we are upgrading NHS IT systems and services across London and the South of England. Our systems and services now support more than 100,000 registered users. The Spine, the secure database and messaging service which BT has built and is managing for the NHS, continues to enable the increased use of key services to transform the NHS. Every day more than 30,000 referrals are arranged through the national electronic referrals and booking system ‘Choose and Book’, as well as the electronic transfer of around 700,000 prescription messages. N3, the secure broadband network BT has built and is managing for the NHS, now has more than 47,000 connections and connects every NHS organisation across England and more than a million NHS employees.
Our corporate and public sector customers in our target markets outside the UK have signed a number of significant deals during the year, including contracts to provide global hosted contact centre services, network connectivity and voice services in Spain and Portugal for the security company Prosegur Activa, fixed mobile IP telephony for Dutch rail infrastructure provider ProRail to enable their employees to work flexibly, and with South Africa’s leading integrated energy and chemical company Sasol to provide and manage services including managed security. In Brazil we signed a contract with the largest retailer, Pão de Açúcar, to provide high quality network services.
During 2010 we launched new products and service enhancements reflecting the continued market interest in outsourcing, managed and hosted services, converged communications and security. These included the releases of virtual data centre, hybrid virtual private network, hosted unified communications service, unified communications and collaboration, next generation contact centres and BT OneVoice.
As part of our ‘right first time’ initiative, BT Global Services has improved sales order quality by 40% and the number of calls unanswered by our call centres has reduced by around 70% in 2010.
Financial performance
| 2010 | 2009 | a | 2008 | a | ||||||||
| £m | £m | £m | ||||||||||
| Adjusted revenue | 8,513 | 8,628 | 7,664 | |||||||||
| Net operating costs | 8,056 | 8,367 | 6,856 | |||||||||
| Adjusted EBITDA | 457 | 261 | 808 | |||||||||
Contract and financial review chargesb | – | 1,639 | – | |||||||||
| EBITDA | 457 | (1,378 | ) | 808 | ||||||||
| Depreciation and amortisation | 815 | 776 | 744 | |||||||||
| Adjusted operating (loss) profit | (358 | ) | (2,154 | ) | 64 | |||||||
| Capital expenditure | 599 | 886 | 961 | |||||||||
| Operating cash flow | (482 | ) | (912 | ) | (150 | ) | ||||||
| a | Restated. See page 101. | |
| b | Contract and financial review charges in 2009 include £41m recognised in revenue. |
In 2010 revenue decreased by 1% to £8,513m (2009: 13% increase). This decrease is after the impact of favourable foreign exchange movements of £269m and acquisitions of £11m. Excluding these, underlying revenue decreased by 4%. The reduction in underlying revenue reflects the trends seen throughout the year including the impact of mobile termination rate reductions, lower wholesale call volumes in continental Europe, declines in UK calls and lines revenue and the impact of economic conditions.
Revenue from outside the UK increased to 50% of BT Global Services’ total revenue (2009: 48%, 2008: 40%) reflecting the impact of organic growth as well as foreign exchange movements.
| 2010 | 2009 | a | 2008 | a | ||||||||
| £m | £m | £m | ||||||||||
Products and services | ||||||||||||
| Managed solutions | 5,281 | 5,273 | 4,468 | |||||||||
| Calls and lines | 956 | 1,055 | 1,197 | |||||||||
| Global carrier | 822 | 904 | 777 | |||||||||
| Broadband and convergence | 334 | 321 | 275 | |||||||||
| Other products and services | 1,120 | 1,075 | 947 | |||||||||
Total adjusted revenue | 8,513 | 8,628 | 7,664 | |||||||||
| a | Restated. See page 101. |
Revenue from managed solutions remained broadly flat (2009: 18% increase). Within this, networked IT services revenue was negatively impacted by the challenging economic conditions. This was offset by increased MPLS revenue and the impact of favourable foreign exchange rate movements.
Calls and lines revenue decreased by 9% (2009: 12% decrease), the reduced rate of decline reflecting our focus on winning new business to mitigate the continuing trend of customers migrating to alternative services including managed solutions.
Global carrier revenue decreased by 9% (2009: 16% increase) due to the impact of mobile termination rate reductions and lower wholesale call volumes in continental Europe.
Broadband and convergence revenue increased by 4% (2009: 17% increase) reflecting continued demand for business mobility solutions. Other revenue, principally comprising global product revenues, increased by 4% (2009: 14% increase) partially due to foreign exchange movements and global demand.
Net operating costs decreased by 4% to £8,056m (2009: 22% increase). This decrease is after the adverse impact of foreign exchange rate movements of £285m and acquisitions of £11m. Excluding these, underlying operating costs decreased by 7%. This improvement reflects delivery of our cost saving initiatives during 2010. These initiatives have addressed our total labour cost, resulting in a reduction of more than 5,900 in total labour resource in 2010. They also reflect continued progress in the re-negotiation of better pricing through our procurement channels and the simplification of processes, systems and networks.
As a result of our progress in addressing the cost base, adjusted EBITDA increased by 75% (2009: 68% decrease). In 2009 EBITDA was a loss of £1,378m, principally due to the contract and financial review charges of £1,639m.
Depreciation and amortisation increased by 5% to £815m (2009: 4% increase). The increase reflects the impact of unfavourable foreign exchange movements and the timing of higher value and shorter-lived software assets which were brought into use in prior years.
The adjusted operating loss in 2010 was £358m, an improvement compared with the loss of £2,154m in 2009. The improvement is due to the operational improvements in the
24 BT GROUP PLCANNUAL REPORT & FORM 20-F
Table of Contents
REVIEW OF THE YEAROUR LINES OF BUSINESS
performance of BT Global Services and the impact of the contract and financial review charges in 2009.
Capital expenditure reduced by 32% to £599m in 2010 due to the timing of capital expenditure across certain of our larger customer contracts, more stringent investment return criteria and improved procurement and programme delivery.
Operating cash outflow in 2010 almost halved from an outflow of £912m to £482m reflecting the higher EBITDA, improved working capital and lower capital expenditure. In 2009 the poor operating cash outflow reflected the unacceptable performance of BT Global Services.
BT Retail
Business overview
BT Retail has around 13m consumer lines in the UK, and around a million SME customers. We serve UK consumers and SMEs through four customer-facing divisions: BT Consumer, BT Business, BT Enterprises and BT Ireland.
2010 Revenue by division
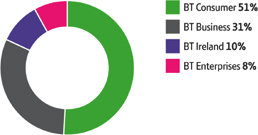
We are the UK’s leading provider of telecommunications products and services to the consumer market, where we offer our customers innovative and value-for-money calls, lines, broadband and TV packages.
BT Vision, our television service, now has over 6,000 hours of video on-demand content available, the most in the UK. Among its selection of more than 7,000 programmes, it has 600 films, from classics to family favourites, with seven new titles added every week. BT Vision will be expanded to include free-to-air HD programming, more interactive services, a wider choice of on-demand programming, and we will provide greater access to premium sports.
We believe that Project Canvas, our TV joint venture with the BBC, Channel 4, Five, ITV, and others, will transform the UK TV market, combining free digital channels with free on-demand content from public service broadcasters and on-demand and interactive TV delivered over broadband.
BT Business customers are characterised by their diversity, ranging from start-up or micro businesses with one to 10 employees, to medium-sized businesses with up to 1,000 or more.
We offer SMEs telecommunications and IT services that were once available only to the largest businesses, helping them cut costs and improve services to their own customers. We take away their need to invest and take the burden out of implementing new technologies, so they can concentrate on their core business. We also offer them a range of specialised services through BT Enterprises.
BT is also one of the largest single suppliers of leased line internet access to UK businesses through BT Net, which together with our Etherflow service was the first to leverage the resilience and flexibility of BT’s software-driven IP network platform, enabling new features such as our self-service Etherflow portal which makes it quicker and easier for businesses to manage and reconfigure services as their needs change. In addition, BT has the largest wholly owned estate of customer access points in the UK market – more than 800 – which increases availability and reliability while driving down the cost of high quality internet and Ethernet connectivity for our customers.
BT Business aims to become the ‘Brand for Business’ for the UK’s SMEs. This means partnering with customers to find ways to help them grow their business, whether it be solutions that unify their IT and communications needs, or ways to help them collaborate. BT Business generated £2.6bn revenue in 2010. However, the UK’s SMEs spend in total around £29bn a year on their IT and telecommunications needs, presenting a significant opportunity for BT Business.
BT Enterprises consists of a portfolio of businesses, including BT Conferencing, BT Directories, BT Expedite, BT Payphones and BT Redcare. Each of these businesses operates as a standalone business, with the support of BT’s brand and customer relationships.
| BT Conferencing | Global provider of audio, video and internet collaboration services | ||||
| BT Directories | Directory Enquiries (118 500), operator and emergency services, and The Phone Book | ||||
| BT Expedite | Software and IT services for retailers. BT Expedite now supports more than 10,000 points of sale for more than 60 retailers | ||||
| BT Payphones | Street, managed, prison, card and private payphones. In a declining market, we are committed to meeting our obligation to provide a public payphone service | ||||
| BT Redcare | Alarm monitoring and tracking facilities |
Our BT Openzone business provides wi-fi hotspots to offer broadband on the move, both to retail customers and to wholesale customers such as mobile network operators. BT Openzone has now become part of BT Enterprises.
We design our products and services for use by as many people as possible. We have redevelopedbt.comto make it more accessible to all, including those with impaired abilities, and we are the only FTSE 100 company to hold the ‘See it Right’ industry accreditation for our inclusion websitewww.bt.com/inclusion
BT Retail is also improving the sustainability of its products and services by reducing their environmental impact and improving their energy efficiency. For example, our Home Hub 2.0 has a standby facility to reduce power consumption. We are also reducing the volume of our product packaging as well as using recycled materials.
BT Ireland operates in Northern Ireland and in the Republic of Ireland. In Northern Ireland we are the leading provider of communication services to consumers and SMEs. We are also responsible for providing regulated wholesale access via Openreach. In the Republic of Ireland, we are one of the largest
BT GROUP PLCANNUAL REPORT & FORM 20-F 25
Table of Contents
REVIEW OF THE YEAROUR LINES OF BUSINESS
providers of wholesale network services. Across Northern Ireland and the Republic of Ireland we are the second largest provider of IT services focusing mainly on government and major corporate customers.
Operating review
In a challenging market, BT Retail has continued to improve its profitability and its customer service performance. We have continued to invest in broadband, and have developed our offers of TV to consumers and IT services to business customers.
BT Retail has continued to focus on making its business more efficient, with sustained cost reductions by simplifying, standardising and automating processes. Our focus on customer service improvement has contributed significantly to cost savings by removing costs of failure, such as repeat calls.
BT Consumer
The degree of competition in the retail calls and lines markets led Ofcom to remove certain restrictions in 2009 to allow BT to provide bundled products so that it could compete more effectively.
This has given us the freedom to offer attractive bundled packages of broadband, calls and TV services. We have been encouraging customers to move to call packages, and the proportion of customers on our highest value plan has increased from 11% to 17% during 2010.
The popularity of buying bundles of services from BT has driven average annual revenue per consumer user (ARPU) up to £309 as multi-product take up among our customers grows.
Average annual revenue per consumer user
(£)
(£)
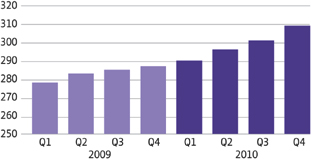
In the broadband market, BT’s retail share of the DSL and LLU base has remained at around 35% for the last three years. Our share of net additions was 44% in the fourth quarter of 2010. We continue to invest in this market to build on our success.
BT’s retail broadbanda market share year end
(million lines)
(million lines)
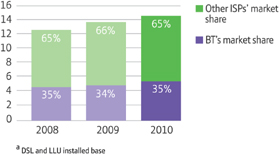
During 2010 we started the roll out of our ADSL2+ service, delivering speeds of up to 20Mb/s at no extra cost to customers. This technology increases the speed at which customers can download information over their copper telephone line.
We offer our customers unbeatable broadband coverage, with Home Hubs which give the widest available range in the home, supported by the largest network of hotspots.
In January we launched BT Infinity, our super-fast fibre-based broadband proposition currently offering download speeds of up to 40 Mb/s and upload speeds of up to 10 Mb/s, which will change the way customers use the internet. We aim to make the service available to at least 40% of UK premises in 2012.
We have entered into a commercial partnership with OnLive Inc, a Silicon Valley based ‘cloud’ computing video gaming business, which gives BT exclusive rights to bundle its game service with broadband in the UK. This service will enable customers to purchase and play video games streamed over broadband.
We also offer consumer broadband and home phone services under the Plusnet brand which now has 369,000 customers (2009: 309,000).
We continue to pursue growth opportunities in the TV market. BT Vision now has 467,000 customers (2009: 423,000), with the average number of views per subscriber per month up 37% year on year. Ofcom concluded its pay TV market investigation in March 2010 by requiring Sky to provide Sky Sports 1 and Sky Sports 2 at wholesale regulated prices. This should enable BT and other pay TV operators to offer premium sports channels in future at lower prices than those currently available.
We have reached an agreement with Arqiva to supply digital terrestrial TV transmission capacity to support the planned offers of these channels. We aim to bring these offers to viewers in time for the 2010/11 Premier League season. Sky has indicated that it is planning to appeal Ofcom’s decision.
Project Canvas achieved a significant milestone in December 2009 with the BBC Trust giving provisional approval for the BBC’s involvement which means the partners can continue developing the technology.
Our customers also benefit from our investment in our wi-fi network. BT has the largest wi-fi hotspot estate in the UK and Ireland. Comprising BT Openzone, BT Fon and Business Hubs, our customers can now get online at more than 1.5m locations including high street chains, hotels, transport hubs, residential and commercial sites. Strong usage growth doubled BT wi-fi user traffic over the previous year. We now carry more than a billion minutes a year.
26 BT GROUP PLCANNUAL REPORT & FORM 20-F
Table of Contents
REVIEW OF THE YEAROUR LINES OF BUSINESS
In 2010, we signed UK wi-fi deals to provide Orange, Vodafone and O2 with BT Openzone wi-fi access.
BT Business
The SME market is diverse and fragmented. It has been a challenging sector to operate in over the past year as the economic downturn has had a significant impact on this market.
We were the first UK CP to make an unlimited calls, lines, broadband and mobile option available to SMEs via our BT One Plan Plus package, bringing them certainty and value for money. This has contributed to the growth of our mobile base, which now has more than 230,000 end users (2009: 188,000).
BT Business mobile end user base (excl. free mobile broadband)
(’000)
(’000)
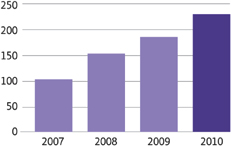
BT Business has continued to develop its activities in the SME IT services market which is worth around £19bn. This is a market characterised by fragmented competition with a clear customer need for simple IT solutions. BT Business has consolidated the IT services and companies it has acquired, integrating BT Lynx and BT Basilica into BT EngageIT and driving the performance of Dabs and BT iNet in an extremely challenging environment.
Dabs offers customers the IT hardware components they need and has built its market share in the business-to-business market with contract wins with VT Group, QinetiQ, and CAN Media Group.
BT iNet is a centre of excellence for Cisco technology and has won contracts in its markets but especially in higher education.
BT EngageIT provides IT hardware and software infrastructure solutions to medium-sized business-to-business customers in both the public and private sector. During 2010 BT EngageIT has achieved some notable customer wins including the Environment Agency and UK Anti Doping.
BT Enterprises
BT Enterprises comprises five standalone businesses, all of which made progress in 2010.
In February BT Conferencing introduced interoperability between the world’s top three videoconferencing systems. It has now installed more than 500 immersive networked telepresence rooms worldwide. Air travel disruption and other global incidents have promoted the use of conferencing services. Businesses are also more environmentally aware and can reduce CO2 emissions by using BT Conferencing’s services to cut down on travel. We are working to maximise revenue with our existing accounts by finding new applications and new users, and by working with other parts of BT to acquire new customers who are either existing or first time conferencing users. More than half of BT Conferencing’s revenue comes from outside the UK.
The integration of UFindus, now known as BT Customerstreet, into BT Directories further strengthens our online directory offering.
In May we introduced a new product range, BT Redcare Agile which meets the high industry security standards. BT Redcare is aiming to migrate customers to IP-based security services.
In July luxury shirtmaker Thomas Pink, retail fashion chain Warehouse and JJB Sports became the first businesses in the UK to commit to use BT Expedite’s Integrated Store technology to link their high street and online operations. Major new contracts included installing BT Expedite’s latest store electronic point of sale system at New Look, and building e-commerce websites for JJB Sports and Snow & Rock.
BT Ireland
Despite the challenging economic conditions, particularly in the Republic of Ireland, we continued to secure major private and public sector contracts during 2010.
In July we signed a contract with Vodafone in the Republic of Ireland for the provision of wholesale network services over a seven-year period, and the transfer of BT’s consumer and SME broadband and voice customer base to Vodafone.
In December we signed a contract with the Northern Ireland government to extend the roll out of fibre-based broadband beyond our existing commercial deployment plans through a combination of public-private sector investment and European Union funding.
In November we announced a multi-million pound investment in our contact centre operations in Northern Ireland, with the creation of two dedicated digital care sites, enabling our customers to access the highest quality of customer support via e-mail, live chat and other web-based contact including proactive support channels such as Twitter. This development involves advanced training and development of more than 600 BT customer care advisors in Northern Ireland.
Our achievements in this market were recognised by BT being named Northern Ireland’s Responsible Company of the Year 2009 by Business in the Community for our role in helping build economically sustainable and socially inclusive communities.
We have delivered significant cost savings over the year as a result of labour efficiencies, property rationalisation and optimisation of marketing spend.
Customer service delivery
We have a range of programmes in progress which are designed to improve the customer experience and take the cost of failure out of the business. Customers are noticing the difference: this year we have seen a reduction of around a third in the number of enquiries about bills. Core service costs (labour and non labour) have fallen 12% over the same period as we enhance self-service capabilities and cut down call transfers. We also increasingly resolve customer complaints and queries on first contact with no repeat calls.
We will continue to build on this positive momentum, with a sustained focus on systems, processes and people.
In order to serve our customers better, we are expanding our channels where customers can contact us or find self-help support, including Twitter,bt.comcommunity forums, YouTube and Live Chat.
BT GROUP PLCANNUAL REPORT & FORM 20-F 27
Table of Contents
REVIEW OF THE YEAROUR LINES OF BUSINESS
Financial performance
| 2010 | 2009 | a | 2008 | a | ||||||||
| £m | £m | £m | ||||||||||
| Revenue | 8,297 | 8,663 | 8,682 | |||||||||
| Net operating costs | 6,447 | 6,999 | 7,153 | |||||||||
| Adjusted EBITDA | 1,850 | 1,664 | 1,529 | |||||||||
| Depreciation and amortisation | 459 | 426 | 445 | |||||||||
| Adjusted operating profit | 1,391 | 1,238 | 1,084 | |||||||||
| Capital expenditure | 417 | 471 | 579 | |||||||||
| Operating cash flow | 1,640 | 1,064 | 1,011 | |||||||||
| a | Restated. See page 101. |
In 2010 revenue decreased by 4% to £8,297m (2009: flat). Revenue benefited from favourable foreign exchange rate movements of £31m, acquisitions of £18m and a one-off benefit of £40m relating to prior periods. Excluding these, revenue declined by 5%.
BT Consumer and BT Business revenue decreased by 3% and 9%, respectively (2009: 4% decrease and 1% increase, respectively), reflecting the continued reduction in calls and lines revenue. Both the BT Consumer and BT Business divisions faced challenging market conditions throughout 2010, arising from a combination of the economic climate, particularly in the business market where the level of insolvencies has remained high, and competitive pressure.
| 2010 | 2009 | a | 2008 | a | ||||||||
| £m | £m | £m | ||||||||||
Products and services | ||||||||||||
| Calls and lines | 5,031 | 5,422 | 5,745 | |||||||||
| Broadband and convergence | 1,316 | 1,313 | 1,201 | |||||||||
| Managed solutions | 588 | 599 | 530 | |||||||||
| Other products and services | 989 | 986 | 941 | |||||||||
External revenue | 7,924 | 8,320 | 8,417 | |||||||||
| Internal revenue | 373 | 343 | 265 | |||||||||
Total | 8,297 | 8,663 | 8,682 | |||||||||
| a | Restated. See page 101. |
Calls and lines revenue decreased by 7% in 2010 (2009: 6% decrease) reflecting the economy and the increasingly competitive market environment.
Broadband and convergence revenue remained broadly flat (2009: 9% increase) in 2010, reflecting the successful retention of customers in the maturing broadband market, together with revenue from services such as BT Vision and mobility.
Managed solutions (ICT) revenue decreased by 2% in 2010 (2009: 13% increase) reflecting the economic conditions in the business market compared with 2009.
Other products and services revenue, which principally comprises our Enterprises division, remained broadly flat in 2010 (2009: 5% increase).
Net operating costs decreased by 8% (2009: 2% decrease). Excluding the impact of unfavourable foreign exchange movements of £27m, acquisitions of £16m and a favourable one-off internal rebate of £15m relating to prior periods, underlying costs reduced by 8%. The decrease reflects the reduction in revenue but also the success of our cost saving initiatives which focused on labour productivity and supplier management.
The above factors contributed to an 11% increase (2009: 9% increase) in adjusted EBITDA in 2010, including one-off benefits of £55m.
Depreciation and amortisation increased by 8% to £459m (2009: 4% decrease) due to higher value and shorter-lived assets being brought into use in recent years.
Adjusted operating profit increased by 12% to £1,391m in 2010 (2009: 14% increase).
Capital expenditure decreased by 11% to £417m in 2010 (2009: 19% decrease), due to improved procurement and management of capital expenditure.
Operating cash flow increased by 54% to £1,640m, a significant improvement compared with a 5% increase in 2009. This reflects the higher EBITDA, improved customer cash collections and lower capital expenditure.
BT Wholesale
Business overview
BT Wholesale provides products and solutions to CPs in the UK and worldwide. It meets the wide-ranging needs of more than 1,000 CPs in the UK, as well as worldwide through a working relationship with Global Telecoms Markets, the wholesale arm of BT Global Services.
We provide our customers with access to BT’s platforms, skills and technology, making BT’s investments and economies of scale work for their benefit, both in the UK and across the globe.
We provide communications services and partially or fully managed solutions for customers ranging from mobile and fixed line operators to internet services providers, broadcast organisations and smaller resellers.
We offer wholesale products but can also manage a customer’s network infrastructure via our MNS solutions, as we do for customers like Virgin Media and KCOM Group. Our white label managed services are designed for customers who have not invested in fixed line infrastructure or want to enter the fixed line communications market for the first time. Customers like the Post Office and Scottish and Southern Energy, as well as Vodafone and O2’s fixed line businesses, fall into this category.
We support the mobile industry with fixed line services that connect thousands of base stations across the UK to the mobile network operators’ core networks, without the capital investment and time to market that a self build option would require. We have managed services contracts in place with all of the UK’s mobile network operators to help them manage the growth in mobile data and video content volumes generated by 3G services as well as national wi-fi access through BT Openzone.
28 BT GROUP PLCANNUAL REPORT & FORM 20-F
Table of Contents
REVIEW OF THE YEAROUR LINES OF BUSINESS
Products and services
Wholesale Ethernet
We offer IP-based Ethernet services across the widest national footprint in the UK market, giving customers high-speed data connectivity at a range of speeds. At 31 March 2010, Wholesale Ethernet was available from more than 800 nodes throughout the UK (2009: 600 nodes).
Private and partial private circuits
BT Wholesale is the largest provider of analogue data circuits in the UK which help our customers extend the reach of their services and act as infill solutions for their own networks.
Wholesale broadband
We are the UK’s largest wholesale provider of broadband nationally. We currently enable more than 8m broadband lines in the UK, including CP customers who have invested in their own broadband infrastructure and use our services outside their own network footprint.
We offer a range of broadband services, delivered over copper and fibre with speeds of up to 8 Mb/s (ADSL), up to 20Mb/s (ADSL2+) and up to 40Mb/s and up to 100 Mb/s over fibre. At 31 March 2010, our up to 20Mb/s service, based on ADSL2+ technology, was available from exchanges serving 55% of UK premises (2009: 40%). In January 2010, we introduced Wholesale Broadband Connect Fibre, a wholesale variant of BT’s fibre-based broadband service tailored to the needs of CPs.
Content distribution network
We are introducing a content distribution network in 2011 that will help our CP customers manage the rapidly rising volume of video content that is being downloaded over fixed and broadband networks. Our network will make this traffic more cost efficient for CPs to manage and will enable a range of new business models for digital content.
Capacity and call-based products
We continue to sell a wide range of capacity and call-based products and services, including regulated and new, non regulated ones. As we refresh our core portfolio with next generation replacements, we will, over time, migrate these services to our IP network platform, decommissioning parts of our legacy systems. One of these new products is IP Exchange, BT Wholesale’s global IP interoperability platform that allows CPs to manage traditional and IP voice calls, on a single gateway, regardless of whether the calls are from mobile or fixed networks.
Operating review
During 2010 BT Wholesale stabilised its financial performance, as demonstrated by the improving EBITDA trend.
This was achieved through a realignment of our business’s organisational structure to match more closely the changing needs of our markets, success in winning a range of new MNS contracts, the introduction of next generation broadband and Ethernet services, and focused cost and labour resource reduction. Much of our cost reduction was delivered through improvements in service quality and a focus on improving the delivery of products and services ‘right first time’.
(%)
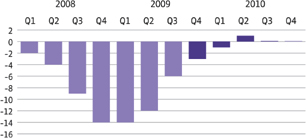
We are focused on the continuous improvement of our customer experience. This year, for example, we have reduced the number of high level complaints by more than 35% and since 2006 we have nearly doubled the average time between faults for our data customers, from a fault every two years to a fault every three and a half. We have also improved the service delivery of our new next generation broadband service to a level comparable with our traditional broadband service.
(%)
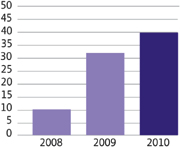
The majority of BT Wholesale’s largest UK customers by revenue have signed long-term MNS contracts, typically for between three and five years. As a result, the proportion of our business underpinned by long-term contracts has increased from 10% in 2007 to 40% in March 2010. These contracts include a high proportion of products and services with low levels of bespoke development. This allows us to defend product and service revenues, as well as creating new opportunities for growth. Managed services revenue is growing, and accounted for 22% of BT Wholesale’s external revenue in 2010, up from 15% the previous year.
BT GROUP PLCANNUAL REPORT & FORM 20-F 29
Table of Contents
REVIEW OF THE YEAROUR LINES OF BUSINESS

In 2010 we signed MNS contracts with a total order value of £1.8bn (2009: £1.3bn), including:
| 4 | A 10-year network outsourcing agreement with KCOM Group to provide the operator with a fully-managed, national operational capability and a new streamlined portfolio of next generation products and services | |
| 4 | A long-term agreement to provide O2 with fixed line broadband services to enable it to offer fixed line services to the SME market in the UK for the first time | |
| 4 | A long-term contract with Vodafone UK to enable it to introduce unified communications to UK SMEs | |
| 4 | A five-year agreement to consolidate O2’s core fixed and mobile networks in the UK into one cost-effective network using BT’s IP network platform. |
We also signed a major international voice services agreement with Tata Communications that allows both parties to benefit from shared resources and lower costs as part of a global supply agreement.
(%)
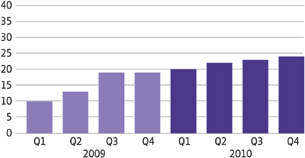
In April 2010 BT Wholesale signed a major MNS contract with Orange UK to take on the management and development of its UK fixed line broadband infrastructure for consumers and SMEs. Over the next 15 months we will migrate Orange UK’s LLU-based customers to the BT Wholesale broadband platform.
Around half of BT Wholesale’s activity in the UK remains subject to UK and European Union industry regulation and regulatory pricing. During 2010 mobile termination rates across Europe were reduced, eroding some £140m from BT Wholesale’s 2010 revenue, but with no impact on profitability.
Financial performance
| 2010 | 2009 | a | 2008 | a | |||||||||
| £m | £m | £m | |||||||||||
| Revenue | 4,450 | 4,658 | 4,959 | ||||||||||
| Internal revenue | 1,227 | 1,228 | 1,252 | ||||||||||
| External revenue | 3,223 | 3,430 | 3,707 | ||||||||||
| Net operating costs | 3,171 | 3,381 | 3,553 | ||||||||||
| Adjusted EBITDA | 1,279 | 1,277 | 1,406 | ||||||||||
| Depreciation and amortisation | 680 | 686 | 893 | ||||||||||
| Adjusted operating profit | 599 | 591 | 513 | ||||||||||
| Capital expenditure | 325 | 435 | 522 | ||||||||||
| Operating cash flow | 844 | 824 | 800 | ||||||||||
| a | Restated. See page 101. |
In 2010 revenue declined by 4% to £4,450m (2009: 6% decline), an improvement in the rate of decline. The overall decrease principally reflects reductions in transit revenue, largely driven by the decline in mobile termination rates, which has no impact on EBITDA. Excluding transit, revenue declined by 1% compared with 2009.
| 2010 | 2009 | a | 2008 | a | ||||||||
| £m | £m | £m | ||||||||||
Products and services | ||||||||||||
| Transit, conveyance and WLR | 1,521 | 1,828 | 2,113 | |||||||||
| Managed network services | 715 | 518 | 295 | |||||||||
| Broadband and convergence | 431 | 482 | 624 | |||||||||
| Calls and lines | 306 | 385 | 462 | |||||||||
| Other products and services | 250 | 217 | 213 | |||||||||
Total external revenue | 3,223 | 3,430 | 3,707 | |||||||||
| Internal revenue | 1,227 | 1,228 | 1,252 | |||||||||
| 4,450 | 4,658 | 4,959 | ||||||||||
| a | Restated. See page 101. |
Transit, conveyance and WLR revenue decreased by 17% (2009: 13% decrease). This decline has arisen principally as a result of the price impact of mobile termination rate reductions.
Broadband and convergence revenue decreased by 11% due to the continued trend of CPs switching to LLU provided by Openreach although the rate of decline slowed compared with 23% in 2009 as the majority of the LLU migration took place in that year.
These declines have been partially offset by an increase of 38% in MNS revenue (2009: 43% increase).
Calls and lines revenue decreased by 20% (2009: 17% decrease) reflecting lower circuit volumes and the substitution impact as customers migrate to long-term MNS contract arrangements.
Other products and services revenue increased by 15% (2009: 2% increase).
30 BT GROUP PLCANNUAL REPORT & FORM 20-F
Table of Contents
REVIEW OF THE YEAROUR LINES OF BUSINESS
Net operating costs decreased by 6% (2009: 5% decrease), partly due to the decline in revenue and lower mobile termination rates, but also due to the impact of our cost efficiency programmes principally through reductions in our total labour resource.
Adjusted EBITDA remained broadly flat at £1,279m (2009: 9% decrease), reflecting the delivery of our cost efficiency programmes and growth in managed network services revenue offsetting the decline in traditional products such as broadband.
Depreciation and amortisation decreased by 1% to £680m (2009: 23% decrease). The slowdown in the rate of decrease was due to certain legacy assets becoming fully depreciated in 2010.
Adjusted operating profit increased by 1% (2009: 15% increase) due to the slight improvement in EBITDA and the lower level of depreciation and amortisation.
Capital expenditure decreased 25% to £325m in 2010 (2009: 17% decrease), reflecting improved procurement terms and more stringent investment return criteria.
Operating cash flow increased by 2% to £844m in 2010 (2009: 3% increase) due primarily to the reduction in capital expenditure, although this was partially offset by the negative impact of intra-group VAT settlements with Openreach.
Openreach
Business overview
Openreach was created in 2006 and is responsible for the crucial ‘first mile’ of the UK telecommunications network – the copper wires and fibre connecting homes and businesses to their local telephone exchange via fixed line local and backhaul connections. It offers all Openreach CP customers (currently more than 480, including other BT lines of business) fair, equal and open access to its networks.
Openreach operates in a competitive environment both from other providers of fixed network capacity and substitution into the mobile market, and many of our products’ prices are covered by regulation. Our performance is influenced by economic conditions, as recessionary periods increase the risk of business failure and loss of line rental, and low activity in the housing market reduces churn and hence connections. In prior years, poor weather had a significant impact on the network increasing faults, but following improvements in sealing the network, it is now only affected by severe weather conditions.
Our 19,000 field engineers work on behalf of all CPs, enabling them to provide their customers with a range of services from analogue telephone lines to complex networked IT services.
To meet our customers’ requirements with a greater degree of flexibility and efficiency, an agreement was reached with the CWU to introduce more flexible working hours, effective from April 2010.
Openreach operates a fleet of more than 20,000 vehicles and is committed to finding innovative ways to minimise its environmental impact. During the year we equipped more than 13,000 vans with satellite location technology that, together with improved business practices, will save time, reduce our carbon footprint and improve our responsiveness to customer needs. The fuel consumed by BT’s commercial fleet reduced by 10% compared with 2009.
Products and services
We offer our customers a range of products that meet their needs – from Ethernet to fibre-based broadband. Our products and services are designed to provide our customers with the tools they need to meet the increasing demands of their customers today, while helping them to plan their services of the future.
Wholesale line rental (WLR)
WLR enables CPs to offer telephony services with their own brand and pricing structure over BT’s network. At 31 March 2010, Openreach was providing 17.9m WLR lines to other BT lines of business, and 6m to other CPs. Of the lines provided to other CPs, 4.8m were WLR analogue lines (up 6% on 2009) and 1.2m were WLR digital channels (up 11% on 2009).
Local loop unbundling (LLU)
LLU enables CPs to use the lines connecting BT exchanges to end users’ premises, and to install their own equipment in those exchanges. In 2009, 84% of UK premises were served by an unbundled exchange. At 31 March 2010, there were 14.8m unbundled lines in the UK, up 7% on the previous year. Of these, 8.2m were for other BT lines of business to support broadband services and 6.6m were for other CPs. More than 30 CPs are providing unbundled services, and Openreach is fulfilling more than 94,000 LLU orders a week.
Ethernet
Openreach’s Ethernet products offer CPs a wide choice of high-bandwidth circuits to build or extend their customers’ data networks. We made major reductions in the connection and rental charges of services in our Ethernet portfolio in February 2009 and January 2010, which have improved the access and backhaul markets in the UK, and support the growth of data-intensive applications.
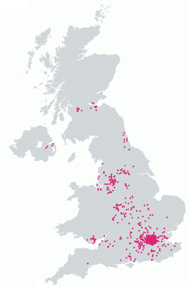
Exchanges announced to date for fibre-based broadband services.
BT GROUP PLCANNUAL REPORT & FORM 20-F 31
Table of Contents
REVIEW OF THE YEAROUR LINES OF BUSINESS
Fibre-based broadband access
Pilots of our fibre-based broadband access service in Whitchurch, South Glamorgan and Muswell Hill, North London proved the effectiveness of FTTC solutions. We have also continued trials of FTTP at Ebbsfleet to prove the technology in a greenfield location, and have announced further brownfield trials at Highams Park in East London and Bradwell Abbey in Buckinghamshire for this year. Mass deployment of FTTC accelerated during 2010. We aim to make our fibre services available to 4m UK premises by the end of 2010, and to be available to at least 40% of UK premises in 2012, with an expected 25% of these being FTTP and the remainder FTTC.
Operating review
In 2010 Openreach made significant improvements in the quality of service delivery of its products.
Faults due to the access network reduced by 11% compared with the previous year as a result of our focused network investment and quality programmes. Over the past three years, fault rates have reduced from one fault every nine years to one fault every 15 years.
Ofcom’s charge controls on Openreach impacted the LLU, WLR and Ethernet products. Both the LLU and WLR controls expire on 31 March 2011 and importantly, the former allowed Openreach to raise the price of Metallic Path Facilities (MPF) rentals. The controls which apply to Ethernet require downward movement in prices each year for the period until September 2012.
Ofcom has agreed two variations to BT’s Undertakings which allow Openreach to control and operate fibre-based broadband access equipment for FTTC and FTTP deployments, and has also confirmed its approach that, for the time being, there will be no predicted future price regulation applied to BT’s new fibre-based products.
Some key customers are taking the decision to reduce ongoing rental costs by moving from WLR and Shared Metallic Path Facility (SMPF) to MPF, taking advantage of the difference in the regulated prices.
In 2010 our cost transformation programmes have provided the platform to deliver continued efficiencies which have allowed us to resource our fibre-based broadband roll out and, at the same time, reduce our total labour resource as well as enabling future productivity improvements to be made.
Supplier contract renegotiations, engineering process improvements and more orders delivered ‘right first time’ have all helped to reduce costs further.
A BT engineer during the winter snow

During 2010, we rationalised our civil engineering work, reducing from several suppliers to a single long-term national contract with a Carillion-Telent joint venture.
The winter of 2010 saw some extreme weather conditions in the UK with considerable flooding and snow. Our engineers demonstrated their commitment by working hard to keep our customers connected. On 20 November 2009, just under 10,000 phone lines and 37,000 broadband lines were cut off as bridges collapsed and extensive flooding affected homes and businesses in an area of Cumbria. Within 12 hours phone services to the majority of customers had been restored and most broadband lines were working again within 36 hours.
Financial performance
| 2010 | 2009 | 2008 | ||||||||||
| £m | £m | £m | ||||||||||
| External revenue | 1,211 | 1,013 | 888 | |||||||||
| Revenue from other BT lines of business | 3,953 | 4,218 | 4,378 | |||||||||
| Revenue | 5,164 | 5,231 | 5,266 | |||||||||
| Net operating costs | 3,204 | 3,235 | 3,355 | |||||||||
| Adjusted EBITDA | 1,960 | 1,996 | 1,911 | |||||||||
| Depreciation and amortisation | 856 | 778 | 689 | |||||||||
| Adjusted operating profit | 1,104 | 1,218 | 1,222 | |||||||||
| Capital expenditure | 907 | 951 | 1,073 | |||||||||
| Operating cash flow | 1,167 | 1,079 | 841 | |||||||||
In 2010 revenue decreased by 1% (2009: 1% decrease). The 2010 decrease reflects lower Ethernet prices, a reduced WLR base due to the depressed housing market and the difficult economic conditions. These factors were partially offset by volume growth in Ethernet and LLU which now forms 26% of our revenue, with WLR at 56%, reflecting the change in mix compared with 2009 (23% and 59%, respectively). This was due to the growth in the broadband market and the ongoing migration of end customers from BT to other CPs as well as targeted offers to the CP community to help stimulate and drive demand for our products.
External revenue was £1,211m in 2010, an increase of 20% (2009: 14% increase) and reflecting the continuing migration of end customers to other CPs’ WLR and in particular, LLU rentals. External revenue represented 23% of our revenue in 2010 compared with 19% in 2009 and 17% in 2008.
Revenue from other BT lines of business decreased by 6% to £3,953m in 2010 (2009: 4% decrease). These reductions reflect the shift of WLR and LLU volumes from other BT lines of business to external CPs and the effect of lower Ethernet prices, partially offset by volume increases.
Net operating costs decreased by 1% in 2010 (2009: 4% decrease). Cost reductions have been achieved through a decrease in total labour costs, process improvements and efficiencies and a reduction in the number of faults due to the improved quality of our network and lower levels of connection activity.
Adjusted EBITDA decreased by 2% (2009: 4% increase) as the reduction in revenue was only partially offset by cost savings.
Depreciation and amortisation increased by 10% to £856m (2009: 13% increase) reflecting the higher value and shorter-lived
Depreciation and amortisation increased by 10% to £856m (2009: 13% increase) reflecting the higher value and shorter-lived
32 BT GROUP PLCANNUAL REPORT & FORM 20-F
Table of Contents
REVIEW OF THE YEAROUR LINES OF BUSINESS
software assets being brought into use in 2010 and also our ongoing investment in systems to support new products and services.
Adjusted operating profit decreased by 9% to £1,104m in 2010 (2009: broadly flat) due principally to the higher depreciation and amortisation.
Capital expenditure decreased by 5% in 2010 to £907m (2009: 11% decrease), with the investment in our super-fast fibre access network being more than offset by lower own work capitalised following the delivery of significant efficiency savings.
Operating cash flow increased by 8% in 2010 to £1,167m (2009: 28% increase) due to the lower capital expenditure and the beneficial impact of intra-group VAT settlements with BT Wholesale.
BT Innovate & Design
BT Innovate & Design is responsible for the innovation, design, development and delivery of the processes, networks and platforms on behalf of the customer-facing lines of business and which run BT’s business. These are operated and run by BT Operate.
BT Innovate & Design has an operating model focused on delivery, with strong cost and quality management, which includes the whole lifecycle of both the network and associated software. In addition, by having the innovation, design and development skills within one team we are able to bring innovation closer to the customer, bringing new ideas, products and services to market faster, cheaper and more effectively for our customers. This is supported through the use of global development centres (in the UK, US, Europe, India and China) which improve collaboration, agility and efficiency in network and software development by bringing together the development teams and customers.
We continue to reduce our cost base through a combination of cost controls and efficiency measures, whilst improving quality and meeting demand. In 2010 we reduced our unit costs by 31% through a quality delivery process, which focuses on re-use, consolidation and standardisation, the metrication of software which can be used to guide decisions about development, and supplier management.
BT Operate
BT Operate manages BT’s IT and network infrastructure platforms as a single converged operation, providing a seamless IT infrastructure. BT Operate also runs parts of other CPs’ networks on behalf of the customer-facing lines of business, and is responsible for delivery of the products and services BT sells to its customers.
We set and manage security policy and processes throughout BT, enabling us to meet the requirements of our customers, both in the UK and globally.
BT Operate also manages the group’s energy policy which aims to reduce consumption, establish security of supply, and reduce carbon emissions. The renewal of our green energy contract until 2014 means we continue to meet approximately 40% of our electricity needs in the UK from renewable sources, and almost 60% from combined heat and power generation. We are investigating how to use more renewable electricity or new technologies, such as developing our own wind farms.
The chart below shows BT’s worldwide CO2 equivalent (CO2e) emissions and progress towards reducing our CO2e emissions intensity by 80% from 1997 levels by 2020. We have reduced our absolute CO2e emissions by 51% and our carbon intensity by 54% (from 1997 levels) taking into account the purchase of zero and low carbon electricity. Our full carbon accounts are available in our 2010 Sustainability Report, available atwww.bt.com/betterworld
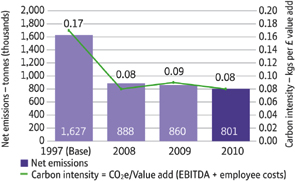
In 2010 we achieved a significant reduction in our total labour resource, more efficient business operations and improved supply chain management. We also continued to reduce the number of IT incidents across the network as well as improving its reliability.
We have reduced the number of IT incidents across the network by 33% over the last two years.
BT GROUP PLCANNUAL REPORT & FORM 20-F 33
Table of Contents
REVIEW OF THE YEAR
OUR CORPORATE RESPONSIBILITY
Our corporate responsibility
| Helping tackle climate change | |
| Developing sustainable customer solutions | |
| Enabling skills for an inclusive society | |
| Charity support | |
| Our corporate responsibility risks | |
| Recognition of our contribution | |
| Further information |
We have a long track record of acting responsibly. We have established policies on equal opportunities, fair pay and anti-bullying. Our environmental management system dates back to 1991, and during 2010 we celebrated the tenth anniversary of our ISO14001 certification. We have been providing solutions for our older and less able customers since 1984.
Our statement of business practice,The Way We Work, provides the principles to which all our people are expected to comply, and is championed by senior executives throughout BT.
We want to make a difference to some of the global challenges society faces, and are focusing our activities on three key areas: climate change; developing sustainable customer solutions; and enabling skills for an inclusive society.
This year we invested money, time and in-kind contributions worth £26.4m supporting responsible and sustainable business activities, meeting our commitment to invest at least 1% of group pre-tax profits.
Our target for 2011 is to maintain a minimum investment of 1% of underlying pre-tax profits in our community.
Community investment
(£m)

We meet the guidelines of the Association of British Insurers in reporting on social performance and have also applied the Prince of Wales’ Accounting for Sustainability reporting framework.
Helping tackle climate change
We can play a significant role helping our customers in the move to a low carbon economy, and can already see the start of this transition with growing customer demand for lower carbon products and services – reducing costs, improving energy efficiency and boosting productivity.
At the same time, we need to continue to minimise our own carbon footprint, and have set ourselves one of the most aggressive corporate emissions reduction targets in the world to help transform BT into a less carbon-intensive business. By 2020 we aim to have reduced the carbon intensity of our global business by 80% compared with our 1997 base year.
BT Operate is responsible for BT’s energy policy, including reducing carbon emissions (seeOur lines of business – BT Operateon page 33).
Developing sustainable customer solutions
Our work in this area has two elements: embedding sustainability, and supporting the low carbon economy. Our sustainability framework is now part of BT’s portfolio development process, comprising environmental, economic and societal criteria. Our series of detailed standards help our product teams source products with a lower environmental impact, and we are working with industry bodies to raise standards across the global IT supply chain. Our centre of excellence for inclusive design helps BT product designers embed inclusive design principles from the beginning of the development process, and incorporate accessibility features across our consumer product range.
We broadened our ethical key performance indicator this year to help measure the impact of our ethics training and other activities designed to raise employee awareness of our policies on issues such as bribery and corruption, and receiving or offering hospitality. Our result for the first year was 3.58 out of five.
We have been working to develop our market propositions supporting the low carbon economy. The table below shows the value of customer contract bids which include a sustainability element.
Financial performance
| 2010 | 2009 | a | 2008 | a | ||||||||
| Customer bids with a sustainability element | £2.1bn | £1.5bn | £2.6bn | |||||||||
| a | We have improved the way we collect this data during the year and have restated 2009 and 2008 figures. |
Enabling skills for an inclusive society
We want everyone to share the benefits of communications technology. Our inclusive society programme promotes inclusion by making our products readily available, affordable and easy to use; increasing communication and IT skills through community investment programmes; and creating an inclusive culture across BT.
34 BT GROUP PLCANNUAL REPORT & FORM 20-F
Table of Contents
REVIEW OF THE YEAROUR CORPORATE RESPONSIBILITY
During the last year, we have been working to identify the skills our people need to integrate sustainability fully into their development and business decisions.
Through our digital inclusion projects we work with partners to help older people, disadvantaged communities and individuals gain IT skills they can use to improve their lives.
Our programmes to target barriers to digital inclusion in 2010 included the BT Internet Rangers website, providing tools for young people to teach older relatives how to use the internet; BT Community Connections, providing laptops, broadband and IT equipment to community organisations in deprived areas across the UK and the Republic of Ireland; and our work with Katha, an education charity, which is bringing IT education and training to disadvantaged children in India in Delhi’s poorest communities at the Katha Information Technology E-Commerce School. With our help, since 2001 Katha has awarded more than 16,000 IT certificates of which 54% went to girls and women.
As one of six London 2012 Sustainability Partners we want to leave a lasting legacy by making the most of what we do best - bringing people together using eco-efficient technologies.
Charity support
BT works with strategic charity partners in the UK as well as local charities across Europe and the Americas. Our people gave £2.5m to charity in 2010, matched by a BT contribution of £1m.
Our strategic charity partner in the UK is ChildLine, an organisation that provides support for children and young people, including a 24-hour helpline. We support ChildLine through strategic and technical support, fundraising, and by donating money, equipment and expertise. BT people also volunteer as ChildLine counsellors.
BT has invested £1.5m in Inspiring Young Minds, a three-year strategic partnership with UNICEF which brings education, IT and communication skills to disadvantaged children in South Africa, Brazil and China.
The programme started in South Africa in 2007, was expanded to Brazil a year later and in 2010 the initiative was launched in China. In its first year in China, more than 6,600 students at 40 schools in poorer areas have had access to IT equipment through the programme. In 2011, the equipment will be used to enable cultural exchanges and remote learning between the students of the Hong Kong Polytechnic University and those in mainland China.
We are providing support over two years to One Economy, a new digital literacy partnership in the US, to help young people teach adults how to use the internet.
We use our communications expertise to support fundraising telethons including Children in Need, Comic Relief, Sport Relief and the Disasters Emergency Committee (DEC). We helped raise more than £100m in 2010 by providing equipment; telephony and network management; call centres and BT people to take calls/donations; an online giving platform; and communications and PR support.
The ongoing partnership between Openreach and I CAN, the children’s communication charity, aims to ensure that everyone in contact with children up to the age of 11 knows how important communication is, what communication difficulties look like and what they can do to help.
BT people take calls/donations for Sport Relief and other telethons

Our corporate responsibility (CR) risks
We quantify the most significant social, environmental and ethical risks to BT in our CR risk register. This is updated twice a year and reviewed annually by our Board and our external Leadership Advisory Panel.
We currently have seven CR risks which we monitor and report on, four of which are managed by the CR risk forum:
| 4 | Mitigating climate change impacts such as increased costs associated with changing legislation | |
| 4 | Adapting our business to reduce our exposure to the direct impacts of climate change, such as severe weather | |
| 4 | The effect of diversity on employee relations and customer service | |
| 4 | Unacceptable supply chain working conditions. | |
| We manage the following three CR risks at group level: | ||
| 4 | Health and safety risks to employees and the public exposed to BT operations | |
| 4 | Breach of integrity leading to a loss of trust in BT | |
| 4 | Loss of trust caused by unintended release of private customer data which is part of ourSecurity and resiliencerisk (seeOur riskson page 37). |
Each of these seven CR risks has a senior management owner and a mitigation strategy in place. Aside from the loss of trust caused by unintended release of private customer data, these CR risks are not regarded as material in relation to the group, and consequently are not included inOur riskson page 36.
Recognition of our contribution
We have been ranked seventh in the list of 60 top green businesses in Britain in this year’s Best Green Companies Awards announced by The Sunday Times, and won a number of awards for CR, including the prestigious Queen’s Award for Enterprise for Sustainable Development and Business in the Community’s Community Mark and ‘platinum plus recognition’. We have been in the top 5% of our sector in the Dow Jones Sustainability Index for the last nine years.
Further information
More detailed information about our CR and sustainability performance is available on our independently verified 2010 sustainability report atwww.bt.com/betterworld
BT GROUP PLCANNUAL REPORT & FORM 20-F 35
Table of Contents
REVIEW OF THE YEAR
OUR RISKS
Our risks
| Principal risks and uncertainties | |
| Competitive activity | |
| Global economic and credit market conditions | |
| Regulatory controls | |
| Major contracts | |
| Security and resilience | |
| Pensions |
Principal risks and uncertainties
In common with all businesses, BT is affected by a number of risks and uncertainties, not all of which are wholly within our control. Although many of the risks and uncertainties influencing our performance are macroeconomic and likely to affect the performance of businesses generally, others are particular to our operations.
This section highlights some of those particular risks and uncertainties affecting our business but it is not intended to be an extensive analysis of all risk and uncertainty affecting our business. Some may be unknown to us and others, currently regarded as immaterial, could turn out to be material. All of them have the potential to impact our business, revenue, profits, assets, liquidity and capital resources adversely.
We have a defined enterprise-wide risk management process for identifying, evaluating and managing the significant risks faced by the group. The key features of the risk management process are provided inInternal control and risk managementon page 80. The group risk register captures the most significant risks facing the business. Each risk is assigned a senior management owner responsible for monitoring and evaluating the risk and the mitigation strategies. The group risk register has been reviewed by theOperating Committeebefore being reviewed and approved by the Board. The principal risks below are all identified on the group risk register.
The principal risks and uncertainties should be considered in conjunction with the risk management process, the forward-looking statements for this document and theCautionary statement regarding forward-looking statementson page 156.
Competitive activity
As detailed on page 15, we operate in markets which are characterised by high levels of competition. While there are many factors which contribute to the high level of competition the prominent factors include regulatory intervention which is focused on promoting competition, technology substitution, market and service convergence, customer churn, declining levels of market differentiation, declining market growth rates and the emergence of competitors with distinctive and non replicable sources of competitive advantage.
BT faces a number of challenges in relation to growing revenues. A distinct challenge is that our UK voice and connectivity business is a mature business subject to price deflation and declining or negative market growth rates leading to declining revenues, margins and cashflow. The net effect is that we increasingly have to look beyond the UK voice and connectivity market to secure profitable revenue growth from adjacent markets, both inside and outside the UK. This in turn is dependent on developing strong and advantaged competitive positions in attractive product and service markets. As well as looking beyond the UK and voice and connectivity market we also need to deliver major new investments (e.g. super-fast broadband) which will not only help us defend existing revenues but also open up new adjacent markets for us to penetrate. These new areas of growth carry associated risks including high investment in development and launch and might not yield the necessary returns or offset declining revenues in our traditional business.
Global economic and credit market conditions
Whilst there have been improvements in the UK and global economies during 2010, the level of business activity could be impacted by continued economic uncertainty and could lead to a reduction in revenue, profitability and cash generation. In common with many other businesses, our financial performance could also be impacted by increased exposure to the default of customers and suppliers if economic conditions do not continue to improve. In achieving our goals, we are dependent on a number of partners, contractors and suppliers and therefore are at risk of loss of revenue, increased cost, delays and possibly associated penalties in the event of their failure.
However, unfavourable economic conditions may arise which could impact our ability to generate sufficient cash flow or access capital markets to enable us to service or repay our indebtedness or to fund our other liquidity requirements. We may be required to refinance all or a portion of our indebtedness on or before maturity, reduce or delay capital expenditure or seek additional capital. Refinancing or raising additional financing may not be available on commercially reasonable terms or at all. Our inability to continually generate sufficient cash flow to satisfy our debt service obligations, or to refinance debt on commercially reasonable terms, may adversely affect our business, financial condition, results of operations and prospects.
Regulatory controls
Some of our activities continue to be subjected to significant price and other regulatory controls which may affect our market share, competitive position and future profitability.
Many of our wholesale fixed network activities in the UK are subject to significant regulatory controls which are reviewed periodically. The controls regulate, among other things, the prices we may charge for many of our services and the extent to which we
36 BT GROUP PLCANNUAL REPORT & FORM 20-F
Table of Contents
REVIEW OF THE YEAROUR RISKS
have to provide services to other CPs. In recent years the effect of these controls has required us to reduce our prices, although in some recent cases, prices have been allowed to increase in real terms. We cannot provide assurance to our shareholders that the regulatory authorities will not increase the severity of the price controls, extend the services to which controls apply or extend the services which we have to provide to other CPs. These controls may adversely affect our market share, our ability to compete and our future profitability.
Wholesale customers may also raise disputes with Ofcom, seeking lower prices on wholesale services which are not subject to direct price control.
Major contracts
We have a number of complex and high value contracts with customers. The profitability of these contracts is subject to a number of factors including: variation in cost and achievement of cost reductions anticipated in the contract pricing both in scale and time; delays in delivery or achieving agreed milestones owing to factors either within or outside of our control; changes in customers’ requirements, budgets, strategies or businesses; the performance of our suppliers and other factors. Any of these factors could make a contract less profitable or even loss making.
In 2009 a failure to achieve anticipated cost savings made a number of our major contracts less profitable or even loss making, adversely impacting our profits. Contract and financial reviews were undertaken in BT Global Services, and resulted in our taking a more cautious view of the recognition of expected and future cost efficiencies, revenues and other changes in underlying assumptions and estimates, particularly in light of the economic outlook, resulting in contract and financial review charges of £1,639m being recognised.
In 2009 a failure to achieve anticipated cost savings made a number of our major contracts less profitable or even loss making, adversely impacting our profits. Contract and financial reviews were undertaken in BT Global Services, and resulted in our taking a more cautious view of the recognition of expected and future cost efficiencies, revenues and other changes in underlying assumptions and estimates, particularly in light of the economic outlook, resulting in contract and financial review charges of £1,639m being recognised.
As detailed on page 22, during 2010 we have taken actions and implemented a number of improvements to significantly enhance contract management, risk management and performance. Independent review teams provide additional assurance on our most significant contracts. Whilst progress has been made, and no significant charges in relation to major contracts were incurred in 2010, there is still a risk that further contract charges could arise in the future due to the impact of any of the factors identified above.
The degree of risk increases generally in proportion to the scope and life of the contract and is typically higher in the early stages. Some customer contracts require significant investment in the early stages, which is expected to be recovered over the life of the contract. Major contracts often involve the implementation of new systems and communications networks, transformation of legacy networks and the development of new technologies. The recoverability of these capital costs may be adversely impacted by delays or failure to meet milestones. Substantial performance risk exists in these contracts, and some or all elements of performance depend upon successful completion of the transition, development, transformation and deployment phases. Failure to manage and meet our commitments under these contracts, as well as changes in customers’ requirements, budgets, strategies or businesses, during the contract term, may lead to a reduction in our expected and future revenue, profitability and cash generation. We may lose significant customers due to merger or acquisition, change of customer strategy, business failure or contract expiry. Failure to replace the revenue and earnings from lost customers could reduce revenue and profitability.
Security and resilience
BT is critically dependent on the secure operation and resilience of its information systems, networks and data.
Any significant failure or interruption of such data transfer as a result of factors outside our control could have a material adverse effect on the business and our results from operations. We have a corporate resilience strategy and business continuity plans in place, designed to deal with such catastrophic events including, for example, major terrorist action, industrial action, cyber-attacks or natural disasters. A failure to deliver that strategy may lead to a reduction in our profitability and there can be no assurance that material adverse events will not occur.
The scale of our business and global nature of our operations means we are required to manage significant volumes of personal and commercially sensitive information. BT stores and transmits data for its own purposes and on behalf of customers, all of which needs to be safeguarded from potential exposure, loss or corruption, and therefore receives a high level of management attention and security measures. Any material failure could significantly damage our reputation and could lead to a loss of revenues, cancellation of contracts, penalties and additional costs being incurred.
Pensions
We have a significant funding obligation to a defined benefit pension scheme.
Declining investment returns, longer life expectancy and regulatory changes may result in the cost of funding BT’s defined benefit pension scheme (BTPS) becoming a significant burden on our financial resources.
The triennial funding valuation of the BTPS at 31 December 2008 and associated recovery plan has been agreed with the Trustee. Under this prudent funding valuation basis the deficit is £9bn. BT and the Trustee have agreed a 17 year recovery plan with the first three years’ payments being £525m. The payment in 2013 will be £583m, then increasing by 3% per annum.
Whilst the valuation and the recovery plan have been agreed with the Trustee, they are currently under review by the Pensions Regulator. However, the Pensions Regulator’s initial view is that they have substantial concerns with certain features of the agreement. The Pensions Regulator has indicated it will discuss its position with us once they have completed their review. Accordingly, as matters stand, it is uncertain as to whether the Pensions Regulator will take any further action. This uncertainty is outside of our control.
The results of future scheme valuations and associated funding requirements will be impacted by the future performance of investment markets, interest and inflation rates and the general trend towards longer life expectancy, as well as regulatory changes, all of which are outside our control.
BT GROUP PLCANNUAL REPORT & FORM 20-F 37
Table of Contents
REVIEW OF THE YEAR
OTHER INFORMATION
Other information
| Regulation | |
| Our relationship with HM Government | |
| Legal proceedings | |
| Acquisitions and disposals |
Regulation
Innovation in communications markets continues at a high level, driven by consumer needs and new technology. Convergence is maturing, and consumers routinely buy bundles of fixed, mobile, broadband and TV services. In July 2009, we announced our ambitious plans for fibre-based broadband deployment, underpinned by significant investments. The UK communications market is highly competitive and as a result, in 2010 many of our retail services were deregulated (seeSignificant market power designations). Regulatory evolution needs to keep pace with these developments, allowing further deregulation where effective competition exists, encouraging investment and rewarding risk-taking in new markets such as fibre-based broadband, and ensuring that any new regulation is only applied where necessary.
Regulation in the UK
Electronic communications regulation in the UK is conducted within a framework set out in various EU directives, regulations and recommendations. The framework was recently reviewed and amended directives are expected to be implemented by late May 2011 in the UK and other EU member states.
Ofcom
Ofcom was set up under the Office of Communications Act 2002 to provide a single, seamless approach to regulating the entire UK communications market. Its principal duties are to further the interests of citizens in relation to communications matters, and to further the interests of consumers in relevant markets, where appropriate by promoting competition.
Ofcom regulation takes the form of sets of conditions laid down under the Communications Act 2003 (Communications Act), and directions under these conditions. Some conditions apply to all providers of electronic communications networks and services; others apply to individual providers, which Ofcom has designated as universal service providers or having significant market power (SMP) in a particular market.
Conditions applying to all providers
Although these general conditions are concerned mainly with consumer protection, they also include requirements relating to general access and interconnection; standards; emergency planning; the payment of administrative charges; the provision of information to Ofcom; and numbering. A separate condition regulates the provision of premium rate services. The Electronic Communications Code applies to all CPs authorised to carry out streetworks and similar activities for network provision. It requires CPs with apparatus on or in the public highway to identify potential liabilities and, where appropriate, to make financial provision to cover any damage caused by work they carry out, and for the removal of their networks in the event of liquidation or bankruptcy. BT has provided the required certificate of compliance to Ofcom in accordance with this requirement.
Conditions applying to BT
Universal service obligations (USO) are defined in an order issued by the Secretary of State. BT is the designated supplier of universal service for the UK, excluding the Hull area where Kingston Communications is the designated provider. Our primary obligation is to ensure that basic fixed line services are available at an affordable price to all citizens and consumers in the UK. Other conditions relate to payphones and social needs schemes.
We understand that the UK Government’s plans for the digital economy, prior to the May 2010 election, are expected to create a fund of £200m that will be available via competitive tender to bidders in order to deliver the Government’s universal service commitment (USC) to provide a 2Mb/s broadband connection. This is not part of BT’s USO, but BT is likely to be one of the providers eligible to bid for such funds. The procurement process for allocation of the funds for the USC is currently expected to be administered by a new Government body known as Broadband Delivery UK.
Significant market power designations
Ofcom is also required by EU directives to review relevant markets regularly, and determine whether any CP has SMP in those markets. Where Ofcom finds that a provider has SMP, it must impose appropriate remedies that may include price controls. In 2010 Ofcom completed its market review of fixed narrowband retail services in relation to the supply of consumer and business telephone lines and voice calls. Ofcom concluded that BT no longer had SMP in these markets (except for digital exchange lines, although Ofcom is currently consulting on a market review/charge control for ISDN30 lines), which resulted in BT having greater freedom to package and price those services as we choose. Ofcom also completed its review of wholesale narrowband services markets and concluded that BT retained SMP in certain defined markets – for example, the provision of wholesale exchange lines, call origination and interconnect links – but not in local-to-tandem conveyance where BT’s activities became deregulated. BT is also deemed to have SMP in other markets such as wholesale leased lines. In the 2010 calendar year, Ofcom will conduct market reviews, which are currently underway, of the Wholesale Local Access (WLA) and the Wholesale Broadband Access (WBA) markets, covering products such as LLU and IPStream. Ofcom’s WLA proposals include new obligations on BT to provide a fibre-based Virtual Unbundled Local Access (VULA) product and an obligation to share our ducts and poles for fibre-based broadband purposes. Openreach already offers a product that we believe meets the requirements for VULA and we have said BT will share its ducts and poles with other CPs. In the WBA market, Ofcom proposes to increase the size of the mainly urban deregulated geographic market, and to introduce price regulation in the remainder of the country with a price control to cover rural areas.
38 BT GROUP PLCANNUAL REPORT & FORM 20-F
Table of Contents
REVIEW OF THE YEAROTHER INFORMATION
SMP charge controls
As a result of SMP designations, the charges we can make for a number of wholesale services are subject to regulatory controls which are designed to ensure that our charges are reasonably derived from costs, plus an appropriate return on capital employed. These include:
| 4 | network charge controls (NCC) on wholesale interconnect services – we operate under interconnection agreements with most other CPs | |
| 4 | partial private circuits (PPC) charge controls applying to certain wholesale leased lines that BT provides to other network operators | |
| 4 | certain wholesale Ethernet access and backhaul services | |
| 4 | LLU and WLR. |
Regulatory decisions by Ofcom are liable to appeal. Other CPs are currently appealing Ofcom decisions on wholesale leased lines, LLU and WLR charge controls.
Ofcom is currently consulting on market reviews/charge controls for ISDN30 and WBA (seeSignificant market power designationson page 38).
In December 2009, Ofcom published a consultation document about how BT’s costs of providing pensions benefits should be treated in regulatory charges. Ofcom is expected to consult further later in the 2010 calendar year, and conclude its review towards the end of the year. Ofcom would then look to implement any revised approach in setting charge controls moving forward.
BT’s Undertakings
In response to Ofcom’s 2005 strategic review of telecommunications, we proposed a number of legally-binding Undertakings under the Enterprise Act 2002 (Enterprise Act). These Undertakings, which included the creation of Openreach, were accepted by Ofcom and came into force in September 2005. The Undertakings are intended to deliver clarity and certainty to the UK telecommunications industry about the way BT will provide ‘upstream’ regulated products to support effective and fair competition in related ‘downstream’ markets. Ofcom acknowledges that BT’s delivery of the Undertakings has enabled deregulation in more competitive downstream markets. The Undertakings do need to evolve in light of market developments and variations have been agreed in 2010 to assist delivery of fibre-based broadband, and to reschedule timescales for the delivery of operational systems separation and the migration of BT’s installed base to the same, equivalent base as other CPs.
Business rates
The European Commission formally investigated the way the UK Government set the rates payable on BT’s infrastructure and those paid by Kingston Communications, and whether or not the UK Government complied with European Community Treaty rules on state aid. The Commission concluded in October 2006 that no state aid had been granted. The Commission’s decision was appealed. Judgement on the appeal has not yet been given but we continue to believe that any allegation of state aid is groundless and that the appeal will not succeed.
Regulation outside the UK
BT must comply with the regulatory regimes in the countries in which we operate and this can have a material impact on our business.
European Union
Communications regulation in each EU country is conducted within the regulatory framework determined by EU directives, regulations and recommendations. The manner and speed with which the existing directives have been implemented vary from country to country. National regulators are working together in the Body of European Regulators for Electronic Communications to introduce greater harmonisation in their approach to the assessment of SMP and the imposition of appropriate remedies. BT does not have USO outside the UK, although in certain member states we may be required to contribute towards an industry fund to pay for the cost of meeting such obligations.
The rest of the world
The vast majority of the communications markets in which we operate around the world are subject to regulation. The degree to which these markets are liberalised varies widely, and our ability to compete is constrained, to a greater or lesser degree, in many countries. We continue to press incumbent operators and their national regulatory authorities around the world (including in the EU) for cost-related non discriminatory wholesale access to their networks, where appropriate, and for advance notice of any changes to their network design or technology which would have an impact on our ability to serve our customers.
Competition law
In addition to communications industry-specific regulation, BT is subject to the Competition Act 1998 (Competition Act) in the UK and to EU competition law.
Our relationship with HM Government
We can be required by law to do certain things and provide certain services for the UK Government. For example, under the Communications Act, we (and others) can be required to make and implement plans for the provision or restoration of services in connection with disasters. Additionally, under the Civil Contingencies Act 2004, the UK Government can impose obligations on us (and others) at times of emergency and in connection with civil contingency planning. Also, the Secretary of State can require us to take certain actions in the interest of national security and international relations.
Legal proceedings
We do not believe that there is any single current court action that would have a material adverse effect on the financial position or operations of the group. However the aggregate volume and value of legal actions to which we are a party has increased significantly during 2010.
There have been criminal proceedings in Italy against 21 defendants, including a former BT employee, in connection with the Italian UMTS (universal mobile telecommunication system) auction in 2000. Blu, in which BT held a minority interest, participated in that auction process. On 20 July 2005, the former BT employee was found not culpable of the fraud charge brought
BT GROUP PLCANNUAL REPORT & FORM 20-F 39
Table of Contents
REVIEW OF THE YEAROTHER INFORMATION
by the Rome Public Prosecutor. All the other defendants were also acquitted. The Public Prosecutor has appealed the court’s decision. The appeal was unsuccessful and no damages follow.
Acquisitions and disposals
We actively review our portfolio of assets and acquisition opportunities in our target markets. We will consider acquiring companies if they bring us skills, technology, geographic reach or time-to-market advantage for new products and services.
2010
During 2010, there were no acquisitions.
In August 2009 BT transferred its consumer and SME broadband and voice customer base in the Republic of Ireland to Vodafone, and agreed to provide wholesale network services to underpin Vodafone’s business over a seven-year period. We also completed a number of other minor disposals in 2010.
Prior to 2010
The BT of today was largely created by a restructuring of the company in the 2002 financial year. This restructuring involved a rights issue (raising £5.9bn), the demerger of O2 (comprising BT’s wholly-owned mobile assets in Europe), the disposal of significant non core businesses and assets, the unwinding of Concert (our joint venture with AT&T), and the creation of customer-facing lines of business.
During 2009, we completed a number of acquisitions, including:
| 4 | Wire One Holdings Inc (one of the leading providers of videoconferencing solutions in the US) | |
| 4 | Ufindus Ltd (one of the UK’s leading online business directories) | |
| 4 | Ribbit Corporation (a Silicon Valley-based ‘Telco 2.0’ platform company) | |
| 4 | Stemmer GmbH and SND GmbH (two German companies constituting the enterprise IT services segment of net AG, listed on the Frankfurt Stock Exchange). |
We also completed a number of other transactions in 2009, including:
| 4 | an agreement with Sekunjalo Investments Limited, under which Sekunjalo became a 30% shareholder in BT’s South African business | |
| 4 | an extension of the geographic scope of our joint venture with Enìa SpA in Parma, Italy, and an increase of our stake in the joint venture from 55% to 59.5% | |
| 4 | the acquisition of the remaining shares of Net2S SA, a publicly-traded IT services company listed in France, other than certain treasury shares and locked-up shares issued under employee share plans (we had acquired over 91% of the outstanding issued share capital of Net2S SA in 2008). |
40 BT GROUP PLCANNUAL REPORT & FORM 20-F
Table of Contents
REVIEW OF THE YEAR
FINANCIAL REVIEW
Financial review
| Principal accounting policies, critical accounting estimates and key judgements | |
| Summarised group income statement | |
| Financial results | |
| Financial position and resources | |
| Liquidity | |
| Funding and capital management | |
| Alternative performance measures |
In theFinancial reviewwe discuss the financial results of the group for 2010, 2009 and 2008. We explain financial performance using a variety of measures, some of which are not defined under IFRS, and are therefore termed ‘non-GAAP measures’. These measures are in addition to, and supplement, those prepared in accordance with IFRS. In particular, in thisFinancial review, we principally discuss the group’s results on an ‘adjusted’ basis. The rationale for using adjusted measures is explained on page 55. Results on an adjusted basis are presented before specific items, the contract and financial review charges recognised within BT Global Services in 2009 and net interest on pensions. Specific items are analysed and discussed separately in thisFinancial review on pages 45 and 46.
The other non-GAAP measures we use in thisFinancial revieware underlying revenue, underlying operating costs, underlying capital expenditure, free cash flow and net debt. Each of these measures is discussed in more detail on pages 54 to 56.
In theFinancial review, references to ‘2010’, ‘2009’, and ‘2008’ are to the financial years ended 31 March 2010, 2009 and 2008, respectively. References to ‘the year’ and ‘the current year’ are to the year ended 31 March 2010.
Principal accounting policies, critical accounting estimates and key judgements
Our principal accounting policies are set out on pages 87 to 95 of the consolidated financial statements and conform with IFRS. These policies, and applicable estimation techniques, have been reviewed by the directors who have confirmed them to be appropriate for the preparation of the 2010 consolidated financial statements.
We, in common with virtually all other companies, use estimates in the preparation of our consolidated financial statements. The most sensitive estimates affecting our consolidated financial statements are in the areas of assessing the stage of completion and likely outcome under long-term contracts; assessing the level of interconnect income with and payments to other telecommunications operators; making appropriate long-term assumptions in calculating pension liabilities and costs; establishing asset lives of property, plant and equipment and software for depreciation and amortisation purposes; calculating current and deferred tax assets and liabilities; making appropriate medium-term assumptions for goodwill impairment reviews; determining the fair values of certain financial instruments; providing for doubtful debts; and estimating the value of provisions. Details of critical accounting estimates and key judgements are provided in the accounting policies on pages 93 and 94.
Line of business results
The financial performance of each of the customer-facing lines of business for 2010, 2009 and 2008 is discussed in theReview of the year. We measure the financial performance of BT Global Services, BT Retail, BT Wholesale and Openreach on an ‘adjusted’ basis being revenue, EBITDA and operating profit, all stated before specific items. For BT Global Services adjusted EBITDA also excludes the impact of the contract and financial review charges recognised in 2009. For further discussion of these items, see pages 54 to 56. A reconciliation of adjusted EBITDA to group operating profit (loss) by customer-facing line of business, and for the group, is provided inSegment information, note 1 to the consolidated financial statements on page 102.
BT GROUP PLCANNUAL REPORT & FORM 20-F 41
Table of Contents
REVIEW OF THE YEARFINANCIAL REVIEW
Summarised group income statement
| 2010 | 2009 | b | 2008b | |||||||||
| Year ended 31 March | £m | £m | £m | |||||||||
Revenue | ||||||||||||
Adjusteda | 20,911 | 21,431 | 20,704 | |||||||||
| Specific items | (52 | ) | – | – | ||||||||
| Contract and financial review charges | – | (41 | ) | – | ||||||||
Reported | 20,859 | 21,390 | 20,704 | |||||||||
Other operating income | ||||||||||||
Adjusteda | 378 | 352 | 359 | |||||||||
| Specific items | 2 | (13 | ) | (10 | ) | |||||||
Reported | 380 | 339 | 349 | |||||||||
Operating costs | ||||||||||||
Adjusteda | (18,689 | ) | (19,435 | ) | (18,168 | ) | ||||||
| Specific items | (427 | ) | (395 | ) | (529 | ) | ||||||
| Contract and financial review charges | – | (1,598 | ) | – | ||||||||
Reported | (19,116 | ) | (21,428 | ) | (18,697 | ) | ||||||
Operating profit | ||||||||||||
Adjusteda | 2,600 | 2,348 | 2,895 | |||||||||
| Specific items | (477 | ) | (408 | ) | (539 | ) | ||||||
| Contract and financial review charges | – | (1,639 | ) | – | ||||||||
Reported | 2,123 | 301 | 2,356 | |||||||||
Net finance expense | ||||||||||||
Adjusteda | (890 | ) | (933 | ) | (798 | ) | ||||||
| Specific items | 11 | – | – | |||||||||
| Net interest on pensions | (279 | ) | 313 | 420 | ||||||||
Reported | (1,158 | ) | (620 | ) | (378 | ) | ||||||
Share of post tax profits (losses) of associates and joint ventures | ||||||||||||
Adjusteda | 25 | 39 | (11 | ) | ||||||||
| Specific items | 29 | 36 | – | |||||||||
Reported | 54 | 75 | (11 | ) | ||||||||
(Loss) profit on disposal of associates and joint ventures –specific items | (12 | ) | – | 9 | ||||||||
Profit (loss) before taxation | ||||||||||||
Adjusteda | 1,735 | 1,454 | 2,086 | |||||||||
| Specific items | (449 | ) | (372 | ) | (530 | ) | ||||||
| Contract and financial review charges | – | (1,639 | ) | – | ||||||||
| Net interest on pensions | (279 | ) | 313 | 420 | ||||||||
Reported | 1,007 | (244 | ) | 1,976 | ||||||||
Taxation credit (charge) | ||||||||||||
Adjusteda | (398 | ) | (361 | ) | (455 | ) | ||||||
| Specific items | 342 | 43 | 343 | |||||||||
| Contract and financial review charges | – | 459 | – | |||||||||
| Net interest on pensions | 78 | (88 | ) | (126 | ) | |||||||
Reported | 22 | 53 | (238 | ) | ||||||||
Profit (loss) for the year | ||||||||||||
Adjusteda | 1,337 | 1,093 | 1,631 | |||||||||
| Specific items | (107 | ) | (329 | ) | (187 | ) | ||||||
| Contract and financial review charges | – | (1,180 | ) | – | ||||||||
| Net interest on pensions | (201 | ) | 225 | 294 | ||||||||
Reported | 1,029 | (191 | ) | 1,738 | ||||||||
Basic earnings (loss) per share | ||||||||||||
Adjusteda | 17.3p | 14.1p | 20.2p | |||||||||
| Specific items | (1.4)p | (4.3)p | (2.4)p | |||||||||
| Contract and financial review charges | – | (15.3)p | – | |||||||||
| Net interest on pensions | (2.6)p | 3.0p | 3.7p | |||||||||
Reported | 13.3p | (2.5)p | 21.5p | |||||||||
| a | Adjusted revenue, adjusted other operating income, adjusted operating costs, adjusted operating profit, adjusted net finance expense, adjusted share of post tax profits (losses) of associates and joint ventures, adjusted profit (loss) before taxation, adjusted taxation credit (charge), adjusted profit (loss) for the year and adjusted basic earnings (loss) per share are non-GAAP measures provided in addition to the disclosure requirements defined under IFRS. The rationale for using non-GAAP measures is explained on pages 54 to 56. | |
| b | Restated. See page 94. |
42 BT GROUP PLCANNUAL REPORT & FORM 20-F
Table of Contents
REVIEW OF THE YEARFINANCIAL REVIEW
Financial results
Group revenue
Revenue decreased by 2% to £20,859m in 2010 (2009: 3% increase). Favourable foreign exchange movements and the impact of acquisitions contributed £297m and £31m, respectively, to revenue in 2010. Excluding these, adjusted revenue decreased by 4% to £20,911m in 2010.
Movement in adjusted revenue
(£m)
(£m)
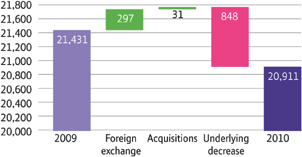
Products and services revenue
| 2010 | 2009a | 2008a | ||||||||||
| £m | £m | £m | ||||||||||
| Managed solutions | 6,581 | 6,390 | 5,293 | |||||||||
| Broadband and convergence | 2,678 | 2,617 | 2,549 | |||||||||
| Calls and lines | 6,293 | 6,862 | 7,404 | |||||||||
| Transit, conveyance, interconnect, WLR, global carrier and other wholesale products | 2,957 | 3,244 | 3,329 | |||||||||
| Other products and services | 2,402 | 2,318 | 2,129 | |||||||||
Adjusted revenue | 20,911 | 21,431 | 20,704 | |||||||||
| Specific items | (52 | ) | – | – | ||||||||
| Contract and financial review charges | – | (41 | ) | – | ||||||||
Revenue | 20,859 | 21,390 | 20,704 | |||||||||
| a | Restated. See page 101. |
Managed solutions
Managed solutions revenue, which comprises networked IT services, MPLS and managed network services (MNS) increased by 3% to £6,581m in 2010. This was mainly due to an increase in MNS revenue in BT Wholesale and growth in MPLS revenue in BT Global Services, offset by a decline in networked IT services revenue, reflecting the challenging economic conditions. In 2009 managed solutions revenue increased by 21%, driven by growth in revenue from networked IT services and MPLS.
Broadband and convergence
Broadband and convergence comprises consumer and wholesale broadband, LLU, mobile and wi-fi services and other broadband based products, such as BT Vision. Broadband and convergence revenue increased by 2% to £2,678m in 2010 due to growth in broadband revenue in BT Retail and BT Global Services and an increase in LLU revenue in Openreach. This was offset by a decline in broadband revenue in BT Wholesale, reflecting the continuing trend of CPs continuing to switch to LLU provided by Openreach.
Calls and lines
Calls and lines revenue comprises the revenue from the connection and rental of exchange and ISDN data lines, associated call traffic and also the provision of private circuits. Calls and lines revenue decreased by 8% to £6,293m in 2010, compared with a decline of 7% in 2009. The decline in 2010 reflects the challenging market conditions, particularly in the business sector.
Transit, conveyance, interconnect, WLR, global carrier and other wholesale products
Revenue from UK transit, conveyance, interconnect circuits, WLR, global carrier and other wholesale products decreased by 9% to £2,957m in 2010, compared with a decrease of 3% in 2009, primarily due to the impact of mobile termination rate reductions, the continued decline in low margin transit volumes and lower conveyance volumes.
Other products and services
Other products and services principally comprises BT Global Services revenue from non UK global products and BT Retail revenue from conferencing, directories, payphones and other select services. Revenue from other products and services increased by 4% to £2,402m in 2010, compared with an increase of 9% in 2009.
Revenue by products and services
(£bn)
(£bn)
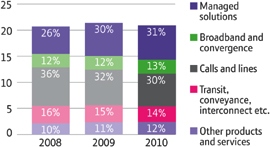
Other operating income
Other operating income was £380m in 2010 an increase of 12% (2009: 3% decrease). The increase in 2010 was principally due to an increase in scrap and cable recoveries and settlements. The decrease in 2009 was largely due to lower income from the sale of intellectual property rights, licences, vehicles and other assets, partially offset by higher income from the sale of scrap and cable recovery.
BT GROUP PLCANNUAL REPORT & FORM 20-F 43
Table of Contents
REVIEW OF THE YEARFINANCIAL REVIEW
Transforming our cost base
We have continued our drive to reduce costs across our business and deliver absolute levels of cost reduction. During 2010, our cost transformation activities have delivered a reduction of £1,752m (9%) in total underlying capital expenditure and operating costs.
Movement in total underlying costsa
(£m)
(£m)
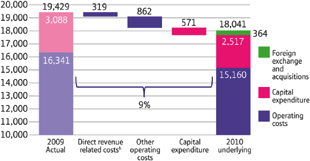
| a | Underlying costs exclude specific items, leaver costs, depreciation and amortisation, foreign exchange movements and acquisitions. | |
| b | Comprises payments to telecommunications operators. |
Operating costs
Operating costs decreased by 11% in 2010 to £19,116m (2009: 15% increase). Adjusted operating costs decreased by 4% in 2010 to £18,689m compared with an increase of 7% in 2009. Adjusted operating costs in 2010 include the impact of unfavourable foreign exchange rate movements of £342m and the impact of acquisitions of £32m. Excluding these, underlying adjusted operating costs reduced by 6% compared with 2009. The reduction reflects the successful delivery of the group’s cost saving initiatives by all lines of business. The group has reduced total labour resource by around 20,000 in 2010, mostly in the area of indirect labour, including agency and contractors.
The components of the group’s operating costs are shown in the table below:
| 2010 | 2009 | a | 2008 | a | ||||||||
| £m | £m | £m | ||||||||||
| Staff costs before leaver costs | 4,862 | 5,412 | 5,231 | |||||||||
| Leaver costs | 142 | 204 | 127 | |||||||||
Staff costs | 5,004 | 5,616 | 5,358 | |||||||||
| Own work capitalised | (575 | ) | (673 | ) | (724 | ) | ||||||
Net staff costs | 4,429 | 4,943 | 4,634 | |||||||||
| Depreciation | 2,304 | 2,249 | 2,410 | |||||||||
| Amortisation | 735 | 641 | 479 | |||||||||
| Payments to telecommunications operators | 4,083 | 4,266 | 4,237 | |||||||||
| Other operating costs | 7,138 | 7,336 | 6,408 | |||||||||
Adjusted operating costs | 18,689 | 19,435 | 18,168 | |||||||||
| Specific items | 427 | 395 | 529 | |||||||||
| Contract and financial review charges | – | 1,598 | – | |||||||||
Operating costs | 19,116 | 21,428 | 18,697 | |||||||||
| a | Restated. See page 94. |
Staff costs
| 2010 | 2009a | 2008a | ||||||||||
| £m | £m | £m | ||||||||||
Staff costs | ||||||||||||
| Wages and salaries | 4,182 | 4,499 | 4,242 | |||||||||
| Social security costs | 447 | 432 | 417 | |||||||||
| Pensions costs | 304 | 544 | 626 | |||||||||
| Share-based payments | 71 | 141 | 73 | |||||||||
| 5,004 | 5,616 | 5,358 | ||||||||||
| a | Restated. See page 94. |
Wages and salaries decreased by 7% to £4,182m (2009: 6% increase), largely due to the impact of labour resource reductions and lower pay inflation. Leaver costs, included within wages and salaries, were £142m (2009: £204m, 2008: £127m).
The pension charge for 2010 was £304m, compared with £544m in 2009 and £626m in 2008. The decrease in the pension cost in 2010 reflects the impact of the changes to benefit accruals from 1 April 2009 following the review of UK pension arrangements which are discussed in more detail on page 19. This is partially offset by an increase in social security costs as BTPS ceased to contract out of the Second State Pension. We expect the BTPS operating charge for the BTPS in 2011 to increase by about £100m as a result of the lower discount rate and higher inflation assumptions.
Share-based payment costs decreased by 50% to £71m, compared with an increase of 93% in 2009, reflecting the significant number of UK Sharesave cancellations which took place in 2009.
Depreciation and amortisation
Depreciation and amortisation increased by 5% to £3,039m in 2010 reflecting the impact of higher value and shorter-lived software assets brought into use during the past two years. Depreciation and amortisation was broadly flat in 2009 compared with 2008.
Payments to telecommunications operators
Payments to telecommunications operators reduced by 4% to £4,083m, compared with an increase of 1% in 2009. The reduction in 2010 reflects the impact of mobile termination rate reductions and lower volumes, which were partially offset by unfavourable foreign exchange movements. The increase of 1% in 2009 was primarily due to foreign exchange movements.
Other operating costs
Other operating costs principally comprises indirect labour, property, energy, network, maintenance and IT costs, consultancy and other general overheads. Other operating costs decreased by 3% to £7,138m in 2010, largely reflecting the impact of reductions in third party labour and discretionary expenditure. In 2009 other operating costs increased by 14% largely due to unfavourable foreign exchange movements, the impact of acquisitions and the slow delivery of cost efficiency savings in BT Global Services.
44 BT GROUP PLCANNUAL REPORT & FORM 20-F
Table of Contents
REVIEW OF THE YEARFINANCIAL REVIEW
EBITDA
In 2010 adjusted EBITDA was £5,639m, compared with £5,238m in 2009 and £5,784m in 2008, as disclosed in theSegment informationnote on page 102. The increase in 2010 reflects the benefit of group wide cost reduction activities and the improvement in the performance of BT Global Services. The decline in 2009 reflected the unacceptable performance in BT Global Services and the continued decline in BT Wholesale offset by a good performance in BT Retail and Openreach.
Adjusted EBITDA for the last five financial years is included in theSelected financial datasection on page 152.
Operating profit
In 2010 adjusted operating profit was £2,600m (2009: £2,348m, 2008: £2,895m), 11% higher than 2009 which in turn was 19% lower than 2008. The increase in 2010 reflects the improved EBITDA partially offset by higher depreciation and amortisation. The reduction in 2009 reflected the unacceptable performance in BT Global Services, partially offset by good performance in the other lines of business. Reported operating profit was £2,123m in 2010, compared with £301m in 2009 and £2,356m in 2008.
Other group items
Specific items
Specific items for 2010, 2009 and 2008 are shown in the table below and are defined on page 55.
| 2010 | 2009 | 2008 | ||||||||||
| £m | £m | £m | ||||||||||
Revenue | ||||||||||||
| Regulatory settlement | 52 | – | – | |||||||||
Other operating income | ||||||||||||
| (Profit) loss on disposal of a business | (2 | ) | 13 | 10 | ||||||||
Operating costs | ||||||||||||
| BT Global Services restructuring charges | 301 | 280 | – | |||||||||
| Property rationalisation costs | 121 | – | – | |||||||||
| Costs associated with settlement of open tax years | 5 | – | – | |||||||||
| Restructuring costs – group transformation and reorganisation activities | – | 65 | 402 | |||||||||
| 21CN asset impairment and related charges | – | 50 | – | |||||||||
| Creation of Openreach and delivery of the Undertakings | – | – | 53 | |||||||||
| Write off of circuit inventory and other working capital balances | – | – | 74 | |||||||||
| 427 | 395 | 529 | ||||||||||
Finance income | ||||||||||||
| Interest on settlement of open tax years | (11 | ) | – | – | ||||||||
Share of results of associates and joint ventures | ||||||||||||
| Impact of renegotiated supply contracts on associate | (29 | ) | – | – | ||||||||
| Reassessment of carrying value of associate | – | (36 | ) | – | ||||||||
| Loss (profit) on disposal of associate | 12 | – | (9 | ) | ||||||||
Net specific items charge before tax | 449 | 372 | 530 | |||||||||
| Tax credit in respect of settlement of open tax years | (230 | ) | – | (40 | ) | |||||||
| Tax credit on re-measurement of deferred tax | – | – | (154 | ) | ||||||||
| Tax credit on specific items above | (112 | ) | (43 | ) | (149 | ) | ||||||
Net specific items charge after tax | 107 | 329 | 187 | |||||||||
BT GROUP PLCANNUAL REPORT & FORM 20-F 45
Table of Contents
REVIEW OF THE YEARFINANCIAL REVIEW
Where appropriate, the specific items recognised in 2010, 2009 and 2008 are explained in more detail below.
| 4 | A charge of £52m was recognised in 2010 reflecting an Ofcom determination in relation to 2Mb/s partial private circuit prices. | |
| 4 | In 2010 and 2009, respectively, the group recognised BT Global Services restructuring charges of £301m and £280m. The main components of the charges are set out below. |
| – | Networks, products and procurement channels rationalisation charges of £142m (2009: £183m). In 2010 this included a payment of £127m made to Tech Mahindra for the renegotiation of certain supply contracts as part of the rationalisation of procurement channels. There was an associated credit of £29m in connection with BT’s share of its associate, Tech Mahindra. | ||
| – | People and property charges of £132m (2009: £51m) principally comprising leaver costs and property exit costs. | ||
| – | Intangible asset impairments and other charges of £27m (2009: £46m) reflecting the costs associated with rationalising the services that are offered to customers and the brands under which customers are served. |
| 4 | In 2010 £121m of property rationalisation charges were recognised in relation to the rationalisation of the group’s UK property portfolio as detailed on page 21. The charge relates to properties which have been vacated and as a result of which, the associated leases have become onerous, reflecting future commitments to meet rental obligations which exceed future economic benefits. This rationalisation programme is expected to continue over the next two years. Including the charge recognised in 2010, the total cost of the rationalisation programme is expected to be around £300m. | |
| 4 | In 2010 the group agreed substantially all outstanding tax matters with HM Revenue & Customs (HMRC) relating to the 2006, 2007 and 2008 tax years. Specific items include a tax credit of £230m, associated interest of £11m and costs of £5m in connection with reaching the agreement. In 2008, the group agreed an outstanding tax matter relating to a business disposed of in 2001, the impact of which was a tax credit of £40m. | |
| 4 | In 2009 and 2008, respectively, the group incurred costs of £65m and £402m in respect of the group’s transformation and reorganisation activities. The costs mainly comprised leaver costs, property exit and transformation programme costs. | |
| 4 | In 2009 a £50m charge was recognised comprising £31m of asset impairments and £19m of associated costs, following the group’s review of its 21CN programme and associated voice strategy in the light of the move to a customer-led roll out strategy and focus on next generation voice service developments of fibre-based products. | |
| 4 | In 2008 a charge of £53m was recognised in relation to further estimated costs to create Openreach and deliver the Undertakings agreed with Ofcom. | |
| 4 | In 2008 a charge of £74m was recognised as a result of the completion of a review of circuit inventory and other working capital balances. | |
| 4 | In 2009 a credit of £36m was recognised in respect of a reassessment of the value of the group’s share of the net assets of an associate. | |
| 4 | In 2008 a tax credit of £154m was recognised for the re-measurement of deferred tax balances as a result of the change in the UK statutory corporation tax rate from 30% to 28% effective in 2009. |
Net finance expense
| 2010 | 2009 | 2008 | ||||||||||
| £m | £m | £m | ||||||||||
| Interest on borrowings | 886 | 935 | 822 | |||||||||
| Loss arising on derivatives not in a designated hedge relationship | 19 | 29 | 41 | |||||||||
| Interest on pension scheme liabilities | 2,211 | 2,308 | 2,028 | |||||||||
| Finance expense | 3,116 | 3,272 | 2,891 | |||||||||
| Less: interest on qualifying assets | (3 | ) | – | – | ||||||||
Total finance expense | 3,113 | 3,272 | 2,891 | |||||||||
| Other interest and similar income | (12 | ) | (31 | ) | (65 | ) | ||||||
| Expected return on pension scheme assets | (1,932 | ) | (2,621 | ) | (2,448 | ) | ||||||
Total finance income | (1,944 | ) | (2,652 | ) | (2,513 | ) | ||||||
| Analysed as: | ||||||||||||
| Adjusted net finance expense | 890 | 933 | 798 | |||||||||
| Net interest on pensions | 279 | (313 | ) | (420 | ) | |||||||
| Net finance expense before specific items | 1,169 | 620 | 378 | |||||||||
| Specific items | (11 | ) | – | – | ||||||||
Net finance expense | 1,158 | 620 | 378 | |||||||||
Finance expense
Interest on borrowings in 2010 was £886m, a decrease of £49m. This reflects a reduction in average gross debt principally through repayment of short-term borrowings. The increase of £113m in 2009 reflects higher net debt mainly due to the lower free cash flow being exceeded by dividend and share buy back payments. The loss arising on derivatives not in a designated hedge relationship was £19m in 2010 (2009: £29m, 2008: £41m). This loss includes a charge of £9m arising from the negotiation of swap break dates on certain derivatives. In 2008 losses on derivatives not in a designated hedge relationship of £41m included a charge of £26m on a low cost borrowing transaction which was marginally earnings positive after tax in the year.
Interest capitalised on qualifying assets was £3m, reflecting the impact of the adoption of IAS 23 (Revised) ‘Borrowing Costs’ as detailed on page 95.
46 BT GROUP PLCANNUAL REPORT & FORM 20-F
Table of Contents
REVIEW OF THE YEARFINANCIAL REVIEW
The graph below shows the relationship between average gross debt and interest rates over the three-year period.
Average gross debt and interest rates
(£bn)
(£bn)
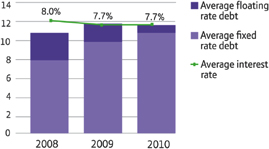
Finance income
Interest income arising from listed investments and other interest and similar income was £12m in 2010 compared with £31m in 2009 and £65m in 2008. The reduction in 2010 is a result of lower interest rates on deposits held. The reduction in 2009 reflects lower levels of investments held by the group and lower average interest rates on deposits.
Net interest on pensions
The net finance expense associated with the group’s defined benefit pension obligation of £279m in 2010 was £592m higher compared with net finance income of £313m in 2009, which in turn was £107m lower than 2008.
The interest on pension scheme liabilities and expected return on pension scheme assets reflects the IAS 19 assumptions and valuation as at the start of 2010. This is expected to be a net interest expense of around £70m in 2011 a reduction of around £210m, principally due to increased asset values at 31 March 2010.
Interest cover
Adjusted operating profit represented 2.9 times net finance expense before specific items and the interest associated with pensions, which compares with interest cover of 2.5 times in 2009 and 3.6 times in 2008. The increase in cover was largely due to higher operating profits in the year and lower net borrowing costs. Interest cover of reported operating profit and net finance expense represented 1.8 times net finance expense in 2010 (2009: 0.5 times, 2008: 6.2 times).
Associates and joint ventures
The results of associates and joint ventures before specific items are shown below:
| 2010 | 2009 | 2008 | ||||||||||
| £m | £m | £m | ||||||||||
| Share of post tax profit (loss) of associates and joint ventures | 25 | 39 | (11 | ) | ||||||||
Our share of the post tax profit or loss from associates and joint ventures was a profit of £25m in 2010 (2009: £39m profit, 2008: £11m loss). Our most significant associate is Tech Mahindra, which contributed £25m of post tax profits in 2010 (2009: £33m profit, 2008: £5m loss).
Profit before taxation
Adjusted profit before taxation was £1,735m in 2010, compared with £1,454m in 2009 and £2,086m in 2008. The increase in 2010 is due to the improvement in the group’s operating profit, partially offset by higher net finance expense. The reduction in 2009 was primarily due to the unacceptable performance in BT Global Services, partially offset by good performance in the other lines of business.
Reported profit before taxation was £1,007m in 2010, compared with a loss before taxation of £244m in 2009 and a profit before taxation of £1,976m in 2008.
Taxation
The tax credit for 2010 was £22m and comprised a tax charge of £320m on the profit before taxation and specific items of £1,456m as shown in theIncome statementon page 96 and a credit of £342m on specific items. The effective rate on the profit before taxation and specific items was 22% compared with the statutory rate of 28%, reflecting the utilisation of tax losses and the continued focus on tax efficiency within the group.
The tax credit for 2009 was £53m and comprised a tax credit of £10m on the profit before taxation and specific items and a credit of £43m on specific items. The effective rate of the tax credit on the profit before taxation and specific items was (7.8)%, reflecting the tax credit arising on the contract and financial review charges of £1,639m recorded in the year.
The net tax charge in 2008 was £238m and comprised a charge of £581m on profit before taxation and specific items partially offset by a tax credit of £343m on certain specific items. The effective rate on the profit before taxation and specific items was 23.2%.
For further details on taxation, seeTaxationsection on page 50.
Earnings per share
Adjusted basic earnings per share was 17.3p in 2010, compared with 14.1p in 2009 and 20.2p in 2008, reflecting the improved profitability in 2010. In 2010, the reported basic earnings per share was 13.3p (2009: loss per share 2.5p, 2008: earnings per share 21.5p).
Reported diluted earnings (loss) per share were not materially different from reported basic earnings (loss) per share in any year under review.
Basic and adjusted earnings (loss) per share for the last five financial years are included in theSelected financial datasection on page 151.
Dividends
The company provides returns to shareholders through dividends. The company has historically paid dividends semi-annually, with an interim dividend in respect of the first six months of the year payable in February and a final dividend payable in September.
The Board recommends a final dividend of 4.6p per share for 2010 (2009: 1.1p per share, 2008: 10.4p per share) to shareholders, amounting to approximately £356m (2009: £85m, 2008: £805m). This will be paid, subject to shareholder approval,
BT GROUP PLCANNUAL REPORT & FORM 20-F 47
Table of Contents
REVIEW OF THE YEARFINANCIAL REVIEW
on 6 September 2010 to shareholders on the register on 13 August 2010. When combined with the 2010 interim dividend of 2.3p per share, the total dividend proposed for 2010 is 6.9p per share, totalling £534m (2009: £503m, 2008: £1,236m). This compares with 6.5p in 2009 and 15.8p in 2008. The reduction in the 2009 full year dividend reflected a rebasing of dividend payments to a level which the Board was confident was sustainable and from which it could grow.
Dividends per share
(pence)
(pence)
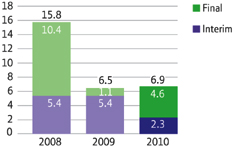
Dividends recognised in 2010 were £263m (2009: £1,222m, 2008: £1,241m) and have been presented as a deduction from shareholders’ equity.
A table setting out the interim, final and total cash dividends paid, or in the case of the final dividend for 2010, proposed, for the last five financial years are included in theAdditional information for shareholderssection on page 158.
Financial position and resources
Summarised balance sheet
| 2010 | 2009 | a | ||||||
| £m | £m | |||||||
Non current assets | ||||||||
| Goodwill | 1,432 | 1,489 | ||||||
| Other intangible assets | 2,240 | 2,299 | ||||||
| Property, plant and equipment | 14,856 | 15,405 | ||||||
| Derivative financial instruments | 1,076 | 2,542 | ||||||
| Trade and other receivables | 336 | 322 | ||||||
| Deferred tax assets | 2,196 | 1,103 | ||||||
| Other non current assets | 259 | 187 | ||||||
| 22,395 | 23,347 | |||||||
Current assets | ||||||||
| Trade and other receivables | 3,696 | 4,185 | ||||||
| Cash and cash equivalents | 1,452 | 1,300 | ||||||
| Derivative financial instruments | 624 | 158 | ||||||
| Other current assets | 513 | 284 | ||||||
| 6,285 | 5,927 | |||||||
Current liabilities | ||||||||
| Loans and other borrowings | 3,269 | 1,542 | ||||||
| Derivative financial instruments | 166 | 56 | ||||||
| Trade and other payables | 6,531 | 7,215 | ||||||
| Current tax liabilities | 320 | 1 | ||||||
| Provisions | 134 | 254 | ||||||
| 10,420 | 9,068 | |||||||
| Total assets less current liabilities | 18,260 | 20,206 | ||||||
Non current liabilities | ||||||||
| Loans and other borrowings | 9,522 | 12,365 | ||||||
| Derivative financial instruments | 533 | 711 | ||||||
| Deferred tax liabilities | 1,456 | 1,728 | ||||||
| Retirement benefit obligations | 7,864 | 3,973 | ||||||
| Provisions | 707 | 466 | ||||||
| Other non current liabilities | 804 | 794 | ||||||
| 20,886 | 20,037 | |||||||
Equity | ||||||||
| Ordinary shares and share premium | 470 | 470 | ||||||
| Retained loss and other reserves | (3,120 | ) | (328 | ) | ||||
| (2,650 | ) | 142 | ||||||
| Minority interest | 24 | 27 | ||||||
| Total (deficit) equity | (2,626 | ) | 169 | |||||
| 18,260 | 20,206 | |||||||
| a | Restated. See page 94. |
We believe it is appropriate to show the sub-total ‘Total assets less current liabilities’ of £18,260m at 31 March 2010 (2009: £20,206m) in the group balance sheet because it provides useful financial information being an indication of the level of capital employed at the balance sheet date, namely total equity and non current liabilities.
Goodwill
Goodwill decreased by £57m during 2010 to £1,432m. This reduction was primarily due to the impact of foreign exchange movements. There were no acquisitions during 2010. An analysis of goodwill by cash generating units for the purposes of the impairment assessment is provided in note 12 to the consolidated financial statements.
48 BT GROUP PLCANNUAL REPORT & FORM 20-F
Table of Contents
REVIEW OF THE YEARFINANCIAL REVIEW
Other intangible assets
Other intangible assets include the cost of intangibles acquired from third parties and internally developed and purchased computer software. The net book value of other intangible assets decreased by £59m during 2010 to £2,240m, predominately due to £629m of additions, which were more than offset by £735m of amortisation.
Property, plant and equipment
Property, plant and equipment decreased by £549m from £15,405m at 31 March 2009 to £14,856m at 31 March 2010, predominately due to £1,861m of additions, which were more than offset by £2,304m of depreciation charges and a £103m reduction due to disposals. For further details of capital expenditure in 2010, see page 51.
Derivative financial instruments
The group held derivative financial instruments with a combined net asset fair value of £1,001m compared with £1,933m at 31 March 2009, which primarily comprise interest rate and cross currency swaps the group use to hedge its overseas currency borrowings to Sterling and to hedge its interest to a fixed Sterling rate. The decrease primarily reflects the year on year weakening of the US Dollar and Euro currencies against Sterling and an increase in US interest rates. For further details on the group’s derivative financial instruments see page 120.
Non current trade and other receivables
Non current trade and other receivables principally comprises costs relating to the initial set up, transition or transformation phase of long-term networked IT services contracts. There was a net increase of £14m during 2010.
Current trade and other receivables
Trade and other receivables decreased by £489m to £3,696m at 31 March 2010 principally reflecting lower prepayments and accrued income.
Loans and other borrowings
Current and non current loans and other borrowings decreased to £12,791m at 31 March 2010 from £13,907m at 31 March 2009. The decrease is primarily due to the translation of the group’s US Dollar and Euro denominated debt where both currencies have weakened against Sterling. For further details of movements in net debt, see page 53.
Trade and other payables
Trade and other payables decreased by £684m to £6,531m at 31 March 2010 principally reflecting the impact of the reduction in our cost base in 2010.
Taxation liabilities
The deferred taxation liability decreased from £1,728m at 31 March 2009 to £1,456m at 31 March 2010 mainly due to the impact of the BT Global Services contract and financial review charges in 2009 on excess capital allowances. The increase in current taxation liability from £1m to £320m at 31 March 2010 reflects a return to UK taxable profits in 2010. For further details on taxation, seeTaxationsection on page 50.
Provisions
The group held current and non current provisions totalling £841m at 31 March 2010 an increase of £121m compared to 2009. The movements in provisions are disclosed in note 21.
Retirement benefit obligations
At 31 March 2010, the IAS 19 accounting deficit was £5.7bn, net of a deferred tax asset of £2.2bn, compared with a deficit of £2.9bn net of tax, at 31 March 2009. The market value of the BTPS assets have increased by £6.0bn since 31 March 2009 to £35.3bn at 31 March 2010 principally reflecting the improvement in the global financial markets during the year. However, the value of the liabilities have increased by £9.9bn to £43.0bn at 31 March 2010 principally as a result of reductions in the discount rate and increased inflation expectations. The relationship between the discount rate in real terms and the value of the BTPS liabilities over the past five years is shown by the table below.
Pension scheme liabilities under IAS 19
(£bn)
(£bn)
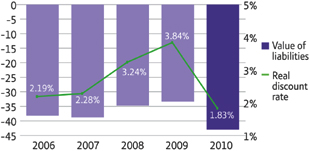
Information about the funding of the group’s pension obligation is provided on pages 53 and 54.
Detailed pensions accounting disclosures are provided in note 29 to the consolidated financial statements.
Total equity
A summary of the movements in equity is set out below:
| 2010 | 2009 | |||||||
| £m | £m | |||||||
| Total equity at the beginning of the year | 169 | 5,432 | ||||||
| Profit (loss) for the year | 1,029 | (191 | ) | |||||
| Other comprehensive loss for the year | (3,661 | ) | (3,911 | ) | ||||
| Dividends to shareholders | (263 | ) | (1,222 | ) | ||||
| Share-based payment | 81 | 143 | ||||||
| Tax on share-based payment | 19 | (12 | ) | |||||
| Net issue (purchase) of treasury shares | 4 | (63 | ) | |||||
| Movements in minority interests | (4 | ) | (7 | ) | ||||
Total (deficit) equity at the end of the year | (2,626 | ) | 169 | |||||
The reduction in equity in 2010 is principally due to the recognition of actuarial losses on retirement benefit obligations, which more than offset the profit for the year. The deficit at 31 March 2010 does not impact the distributable reserves and dividend paying capacity of the parent company, BT Group plc, which had a profit and loss reserve, net of the treasury reserve, of £9,677m at
BT GROUP PLCANNUAL REPORT & FORM 20-F 49
Table of Contents
REVIEW OF THE YEARFINANCIAL REVIEW
31 March 2010. The financial statements of BT Group plc are prepared in accordance with UK GAAP.
Other comprehensive income
Included in other comprehensive loss for the year of £3,661m (2009: £3,911m) are actuarial losses of £4,324m (2009: £7,037m), foreign exchange losses on the translation of overseas operations of £119m (2009: £692m gain), net fair value losses on cash flow hedges of £575m (2009: £570m) and the tax credit of £1,350m (2009: £1,859m) relating to items recognised in other comprehensive income.
Treasury shares
At 31 March 2010 the company held 401m shares (2009: 409m) in Treasury. These shares are used to settle exercises of share options and share awards. The carrying value of £1,105m (2009: £1,109m) has been deducted from retained earnings. BT did not purchase any shares for cancellation in 2010 (2009: 250m) or any shares to be held as Treasury (2009: 143m). The Board suspended the £2.5bn share buy back programme in July 2008 as a result of the group’s strategic investment in fibre deployment.
Taxation
Total tax contribution
BT is a significant contributor to the UK Exchequer, collecting and paying taxes of around £3bn in a typical year. In 2010 we collected and paid £1,299m of VAT, £896m of PAYE and National Insurance, £34m of UK corporation tax for the current year (in addition to receiving a £425m repayment in respect of overpayments and settlements of earlier years) and £226m of UK business and UK network rates.
Our total UK Exchequer tax contribution as measured in the Hundred Group Total Tax Contribution Survey for 2009 ranked BT the fourth highest contributor. The relative percentage contribution of the total tax payments made in 2010 is shown below.
2010 Percentage of total tax contribution
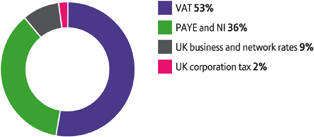
Tax strategy
Our strategy is to comply with relevant regulations whilst minimising the tax burden for BT and our customers. We seek to achieve this through engagement with our stakeholders including HMRC and other tax authorities, partners and customers.
The Board considers that it has a responsibility to minimise the tax burden for the group and its customers. In this respect the Board considers it entirely proper that BT endeavours to structure its affairs in a tax efficient manner where there is strong commercial merit, especially in support of customer initiatives, with the aim of supporting our capital or operational expenditure programmes and reducing our overall cost of capital. This planning is carried out within Board defined parameters. The Board regularly reviews the group’s tax strategy.
We operate in over 170 countries and this comes with additional complexities in the taxation arena. To reduce those complexities we have implemented a simplified trading model for our BT Global Services division in accordance with OECD Transfer Pricing Guidelines.
The majority of tax issues arise in the UK with a small number of issues arising in our overseas jurisdictions. In terms of the group’s UK corporation tax position, all years up to 2007 are agreed. For 2008 there is one minor open issue which we are discussing with HMRC with a view to resolving. The UK corporation tax returns for 2009 were all filed prior to the statutory deadline of 31 March 2010.
We have an open, honest and positive working relationship with HMRC. We are committed to prompt disclosure and transparency in all tax matters with HMRC. We recognise that there will be areas of differing legal interpretations between ourselves and tax authorities and where this occurs we will engage in proactive discussion to bring matters to as rapid a conclusion as possible.
Our positive working relationship with HMRC was demonstrated in 2007 and again in 2010 when we worked intensively with HMRC to accelerate the agreement of substantially all outstanding tax matters relating to the 2006, 2007 and 2008 tax years, resulting in a tax repayment of £215m and associated interest of £11m. In addition, in 2010 we were refunded £210m in respect of overpaid corporation tax in 2009 following the recognition of the contract and financial review charge in 2009.
We have a policy to lobby the UK Government directly on tax matters that are likely to impact our customers or shareholders and in particular respond to consultation documents where the impact could be substantial. We also lobby the UK Government indirectly though the CBI, various working groups and committees and leading professional advisors.
Tax accounting
At each financial year end an estimate of the tax charge is calculated for the group and the level of provisioning across the group is reviewed in detail. As it can take a number of years to obtain closure in respect of some items contained within the corporation tax returns it is necessary for us to reflect the risk that final tax settlements will be at amounts in excess of our submitted corporation tax computations. The level of provisioning involves a high degree of judgement.
In 2010 BT reached agreement with HMRC on all major open issues resulting in a cash repayment of £215m and the recognition of an overall net credit to the income statement of £230m. The tax charge arising on our 2010 profits of £245m is higher than our cash tax paid of £76m in the same period predominantly due to the current tax deduction available on our pension deficit payment of £525m and the phasing of UK corporation tax instalment payments.
In 2009 we paid cash tax in excess of the income statement charge. We were subsequently refunded £210m in 2010 primarily arising on the impact of the BT Global Services contract and financial review charges.
In 2008 the cash tax paid was lower than the income statement charge. This was partly due to the phasing of UK corporation tax instalment payments, the level of provisioning for risks, the taxation of specific items, the impact of deferred tax and the impact of overseas losses or profits which are relieved or taxed at different rates from that of the UK.
50 BT GROUP PLCANNUAL REPORT & FORM 20-F
Table of Contents
REVIEW OF THE YEARFINANCIAL REVIEW
The effective corporation tax rate on our profit before specific items is expected to increase from 22%, the rate applicable to 2010. However, we believe that the future years’ tax effective rate will remain below the statutory rate of 28%.
Liquidity
The major sources of group liquidity for 2010, 2009 and 2008 were cash generated from operations and borrowing through short-term and long-term issuances in the capital markets. These, as well as committed bank facilities, are expected to remain the key sources of liquidity for the foreseeable future.
Wherever possible, surplus funds in the group are managed by the centralised treasury operation.
Free cash flow
The components of free cash flow, which is a non-GAAP measure and a key performance indicator, are presented in the table below and reconciled to net cash inflow from operating activities, the most directly comparable IFRS measure. For further discussion of the definition of free cash flow, refer to pages 55 and 56.
Free cash flow for the last five financial years is included in theSelected financial datasection on page 152.
| Summarised cash flow statement | ||||||||||||
| 2010 | 2009 | 2008 | ||||||||||
| £m | £m | £m | ||||||||||
| Cash generated from operations | 4,476 | 4,934 | 5,187 | |||||||||
| Net income taxes received (paid) | 349 | (228 | ) | 299 | ||||||||
Net cash inflow from operating activities | 4,825 | 4,706 | 5,486 | |||||||||
| Add back pension deficit payment | 525 | – | 320 | |||||||||
| Net capital expenditure | (2,480 | ) | (3,038 | ) | (3,253 | ) | ||||||
| Net purchase of non current financial assets | – | – | (1 | ) | ||||||||
| Dividends from associates and joint ventures | 3 | 6 | 2 | |||||||||
| Interest paid | (956 | ) | (956 | ) | (842 | ) | ||||||
| Interest received | 16 | 19 | 111 | |||||||||
Free cash flow | 1,933 | 737 | 1,823 | |||||||||
| Deduct pension deficit payment | (525 | ) | – | (320 | ) | |||||||
| Acquisitions and disposals | (68 | ) | (227 | ) | (364 | ) | ||||||
| Net (purchase) sale of current financial assets | (246 | ) | 286 | (159 | ) | |||||||
| Net (repayment) drawdown of borrowings | (497 | ) | 522 | 2,061 | ||||||||
| Dividends paid | (265 | ) | (1,222 | ) | (1,236 | ) | ||||||
| Net issue (purchase) of treasury shares | 4 | (209 | ) | (1,413 | ) | |||||||
| Foreign exchange | (7 | ) | 54 | 25 | ||||||||
Net increase (decrease) in cash and cash equivalents | 329 | (59 | ) | 417 | ||||||||
| Cash and cash equivalents at the start of the year | 1,115 | 1,174 | 757 | |||||||||
Cash and cash equivalents at the end of the year | 1,444 | 1,115 | 1,174 | |||||||||
Net cash inflow from operating activities
In 2010 cash generated from operations was £4,476m, a decrease of 9% compared with 2009 reflecting improvements in profitability offset by a pension deficit payment of £525m (2009: £nil, 2008: £320m). In 2010 the group received a net tax repayment of £349m. This comprised tax payments of £76m offset by a tax repayment of £215m following the agreement of substantially all outstanding tax matters with HMRC relating to the 2006 to 2008 tax years and a repayment of £210m in respect of overpaid corporation tax in 2009. In 2009 the group paid net tax of £228m, compared with a net tax refund of £299m received in 2008. The net refund received in 2008 included a receipt of £521m in relation to the settlement of open tax years up to and including the 2005 tax year, partly offset by current tax paid of £222m.
In 2010 net cash inflow from operating activities was £4,825m (2009: £4,706m, 2008: £5,486m).
Capital expenditure
Capital expenditure is a key measure of our expenditure on property, plant and equipment and software and is included inFinancial statisticson page 153. It excludes any assets acquired through new acquisitions in a year. Capital expenditure, on an accruals basis, totalled £2,533m in 2010 compared with £3,088m and £3,339m in 2009 and 2008, respectively. Our original outlook in May 2009 was for capital expenditure in 2010 to be around £2.7bn. This was subsequently reduced to an outlook of around £2.5bn, which was achieved. Capital expenditure is expected to be around £2.6bn in 2011.
Of the capital expenditure, £280m arose outside of the UK in 2010, compared with £316m in 2009. Contracts placed for ongoing capital expenditure totalled £383m at 31 March 2010 (2009: £451m).
In 2010 the net cash outflow for capital expenditure was £2,480m (2009: £3,038m, 2008: £3,253m) which comprised a cash outflow of £2,509m (2009 £3,082m, 2008: £3,315m) offset by cash proceeds from disposals of £29m (2009: £44m, 2008: £62m).
The capital expenditure by major area over the last three years is shown below.
Capital expenditure
(£m)
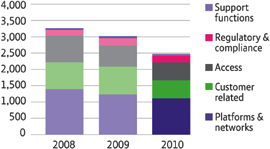
The reduction of £555m in capital expenditure in 2010 reflects steps taken to improve procurement and better efficiency and management of capital expenditure. It also reflects lower levels of investment in legacy network assets and reductions in customer
BT GROUP PLCANNUAL REPORT & FORM 20-F 51
Table of Contents
REVIEW OF THE YEARFINANCIAL REVIEW
related capital expenditure which has more than offset an increase in our investment in our fibre roll out.
The reduction of £251m in capital expenditure in 2009 reflected lower investment on exchange equipment and reduced provisioning volumes in Openreach due to a lower level of house moves and reduced LLU volumes from other CPs.
Interest
Interest paid in 2010 was £956m. Interest payments in 2010 have remained at the same level as 2009 due to the impact of coupon payments on bond issuance made in 2009 offsetting the lower debt levels. Interest payments in 2008 included a one-off payment of £26m on the close out of derivatives associated with a low cost borrowing transaction. Excluding this payment, interest paid was £140m higher in 2009 reflecting the impact of increased average net debt levels.
Interest received was £16m in 2010. The interest receipts in 2010 and 2008 included £11m and £65m respectively from HMRC on the settlement of open tax years. Excluding these receipts, interest received was £14m lower in 2010 than in 2009 and £27m lower in 2009 than in 2008. The reduction in 2010 is a result of lower average interest rates on deposits held. The reduction in 2009 reflects lower levels of investments held by the group and lower average interest rates on deposits.
Acquisitions and disposals
There were no significant acquisitions or disposals in 2010. Net cash outflow on acquisitions was £68m in 2010 (2009: £227m, 2008: £364m) principally comprising deferred consideration payments relating to the acquisition of Albacom in a prior period.
The total consideration for acquisitions made in 2009 was £186m, giving rise to goodwill of £131m. In 2009 the net cash outflow for BT Retail acquisitions included Wire One Holdings Inc and Ufindus Ltd (total consideration of £98m; net assets acquired of £24m; goodwill arising of £74m). The net cash outflow for BT Innovate & Design acquisitions comprised Ribbit Corporation and Moorhouse Consulting Ltd (total consideration of £75m; net assets acquired of £28m; goodwill arising of £47m). BT Global Services acquired Stemmer GmbH and SND GmbH (total consideration of £13m; net assets acquired of £3m; goodwill of £10m).
In 2008, net cash outflow on significant new acquisitions included Comsat International, Frontline Technologies Corporation Limited and i2i Enterprise Private Limited.
Net (purchase) sale of current and non current financial assets
In 2010 the net cash outflow from the net sale of investments was £246m, compared with an inflow of £286m in 2009 and an outflow of £160m in 2008. The cash flows in all financial years mainly related to changes in amounts held in liquidity funds.
Net (repayment) drawdown of borrowing
During 2010 borrowings amounting to £1,028m matured, principally consisting of £697m commercial paper and £331m of other long-term debt. In 2010, the group raised a €600m Euro bond at 6.125% repayable in 2014 which was swapped into £520m at a fixed semi-annual rate of 6.8%.
In 2009 the group raised debt of £795m mainly through our European Medium Term Note programme and received £606m from the net issue of commercial paper. This was partially offset by cash outflows on the repayment of maturing borrowings and lease liabilities amounting to £879m.
In 2008 the group raised debt of £3,939m mainly through its European Medium Term Note and US Shelf programmes which was partially offset by cash outflows on the repayment of maturing borrowings, lease liabilities and the net repayment of commercial paper amounting to £1,878m.
Dividends
Dividends paid in 2010 were £265m, compared with £1,222m and £1,236m in 2009 and 2008, respectively.
Net purchase of shares
There were no purchases of shares in 2010. In 2009 we repurchased 143m shares for cash consideration of £334m. Our share buy back programme was suspended in July 2008 as a result of the group’s investment in fibre-based broadband deployment. During 2008 we repurchased 540m shares for cash consideration of £1,498m.
In 2010, we also issued 8m shares out of treasury to satisfy obligations under employee share scheme exercises receiving consideration of £4m (2009: £125m, 2008: £85m).
Funding and capital management
The objective of the group’s capital management policy is to reduce net debt over time whilst investing in the business, supporting the pension scheme and delivering progressive dividends. In order to meet this objective the group may issue or repay debt, issue new shares, repurchase shares or adjust the amount of dividends paid to shareholders. The group manages the capital structure and makes adjustments to it in the light of changes in economic conditions and the risk characteristics of the group. The Board regularly reviews the capital structure. No changes were made to the group’s objectives and processes during 2010 and 2009.
The general funding policy is to raise and invest funds centrally to meet anticipated requirements using a combination of capital market bond issuance, commercial paper borrowing, committed borrowing facilities and investments. These financial instruments vary in their maturity in order to meet short, medium and long-term requirements.
At 31 March 2010 the group had financial assets of £6.5bn consisting of current and non current investments, derivative financial assets, trade and other receivables, cash and cash equivalents. Credit exposures are continually reviewed and proactive steps have been taken to ensure that the impact of adverse market conditions on these financial assets is minimised. In particular, line of business management actively review exposures arising from trading balances and, in managing investments and derivative financial instruments, the treasury operation has continued to monitor the credit quality across treasury counterparties and is actively managing exposures which arise.
At 31 March 2010 the group’s credit rating with Standard and Poor’s (S&P) was BBB- with stable outlook (2009: BBB with stable outlook) following a downgrade in February 2010. The group’s credit rating with Moody’s was maintained at Baa2 with negative outlook (2009: Baa2 with negative outlook). Fitch downgraded the group’s credit rating to BBB with stable outlook in April 2009 (2009: BBB+ with stable outlook).
52 BT GROUP PLCANNUAL REPORT & FORM 20-F
Table of Contents
REVIEW OF THE YEARFINANCIAL REVIEW
Net debt
At 31 March 2010 net debt was £9,283m, compared with £10,361m at 31 March 2009, a reduction of £1,078m. The components of net debt, which is a non-GAAP measure, together with a reconciliation to the most directly comparable IFRS measure, is detailed below. The movement in the group’s net debt position in 2010 was as follows:
| Foreign | ||||||||||||||||||||
| exchange | Acquisitions | |||||||||||||||||||
| At | and fair | and other | At | |||||||||||||||||
| 1 April | Cash | value | non cash | 31 March | ||||||||||||||||
| 2009 | flow | movements | movements | 2010 | ||||||||||||||||
| Movements in net debt | £m | £m | £m | £m | £m | |||||||||||||||
| Bank overdrafts | 185 | (177 | ) | – | – | 8 | ||||||||||||||
| Debt due within 1 year | 1,357 | (1,006 | ) | 377 | 2,533 | 3,261 | ||||||||||||||
| Debt due after 1 year | 12,365 | 509 | (817 | ) | (2,535 | ) | 9,522 | |||||||||||||
| Cash at bank and in hand | (562 | ) | 360 | 5 | – | (197 | ) | |||||||||||||
| Cash equivalents | (738 | ) | (519 | ) | 2 | – | (1,255 | ) | ||||||||||||
| Current asset investments | (163 | ) | (246 | ) | 1 | 2 | (406 | ) | ||||||||||||
| 12,444 | (1,079 | ) | (432 | ) | – | 10,933 | ||||||||||||||
Adjustmentsa | (2,083 | ) | – | 433 | – | (1,650 | ) | |||||||||||||
Net debt | 10,361 | (1,079 | ) | 1 | – | 9,283 | ||||||||||||||
| a | Adjustments to net debt of £1,650m at 31 March 2010 (2009: £2,083m) comprise £1,326m (2009: £1,766m) arising from the re-translation of currency denominated balances at swapped rates where hedged and £324m (2009: £317m) to remove fair value adjustments and accrued interest. |
The group has two significant term debt maturities during the 2011 financial year. In December 2010 the group’s US Dollar 8.625% note matures with a principal of $2,883m (£1,742m at swapped rates) and in February 2011 a Euro 7.375% note matures with a principal of €1,125m (£758m at swapped rates). The group has built up significant liquidity in anticipation of these maturities which, alongside cash flows generated from operations and the group’s financing strategy, will fund this requirement. In May 2010, the group entered into a £650m two-year facility arrangement. There are no term debt maturities in the 2012 financial year. The maturity profile of the group’s term debt at 31 March 2010 is shown in the table below.
Additional disclosures relating to these financial assets and financial liabilities are included in notes 10, 11, 14, 18 and 19 to the consolidated financial statements and include a debt maturity profile, currency and interest rate composition and hedging strategy. Details of the group’s treasury management policies are included in note 32 to the consolidated financial statements.
Maturity profile of term debta
(£m)
(£m)
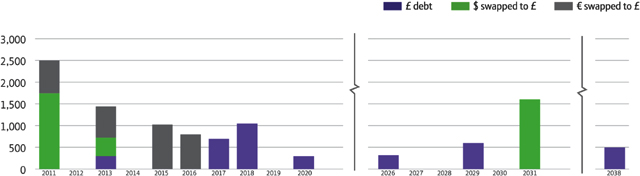
Financial year
| a | Balances reported at swapped rates where hedged. |
Pensions
Funding valuation and future funding obligations
The triennial funding valuation of the BTPS at 31 December 2008 and associated recovery plan has been agreed with the Trustee. Under this prudent funding valuation basis at 31 December 2008, the assets of the BTPS had a market value of £31.2bn (2005: £34.4bn) and were sufficient to cover 77.6% (2005: 90.9%) of the benefits accrued by that date. This represented a funding deficit of £9.0bn compared with £3.4bn at 31 December 2005. If the valuation had used a ‘median estimate’ approach, we estimate that the deficit would have been about £3bn at December 2008. This approach reflects how investments might on average be expected to perform over time and the expected impact of the pensions review changes implemented on 1 April 2009. In the three years ended 31 December 2008, the decline in the market value of assets, combined with the longer life expectancy assumptions, significantly increased the funding deficit, although the impact on the liabilities was partially offset by an increase in the discount rate and favourable experience compared to other actuarial assumptions used at 31 December 2005. The key demographic and financial assumptions are set out in note 29 to the consolidated financial statements. Since the valuation date the scheme’s assets have increased by £4.1bn and the Trustee estimates that if the funding valuation was performed at 31 December 2009, the deficit would have been around £7.5bn on this prudent valuation basis.
Following the agreement of the valuation the ordinary contributions rate reduced to 13.6% of pensionable salaries (including employee contributions) from 19.5%, reflecting the implementation of benefit changes with effect from 1 April 2009, following the UK pensions review. In addition, the group will make deficit payments of £525m per annum for the first three years of the 17 year recovery plan, the first payment of which was made in December 2009. The payment in the fourth year will be £583m, then increasing at 3% per annum. The payments in years four to 17 are equivalent to £533m per annum in real terms assuming annual inflation of 3%. Under the 2005 valuation, deficit contributions were £280m per annum for 10 years. In 2010 the group made regular contributions of £384m (2009: £433m) and deficit contributions of £525m. No deficit contributions were made in 2009 as they were paid in advance during 2008.
Other features of the agreements with the Trustee for BT providing support to the scheme are:
| 4 | In the event that cumulative shareholder distributions exceed |
BT GROUP PLCANNUAL REPORT & FORM 20-F 53
Table of Contents
REVIEW OF THE YEARFINANCIAL REVIEW
| cumulative total pension contributions over the three-year period to 31 December 2011, then BT will make additional matching contributions to the scheme. Total pension contributions (including regular contributions) are expected to be approximately £2.4bn over the three years. | ||
| 4 | In the event that BT generates net cash proceeds greater than £1bn from disposals and acquisitions in any 12-month period to 31 December 2011, then BT will make additional contributions to the scheme equal to one third of those net cash proceeds. | |
| 4 | A negative pledge that provides comfort to the scheme that future creditors will not be granted superior security to the scheme in excess of a £1.5bn threshold. |
Whilst the valuation and the recovery plan have been agreed with the Trustee, they are currently under review by the Pensions Regulator. However, the Pensions Regulator’s initial view is that they have substantial concerns with certain features of the agreement. The Pensions Regulator has indicated it will discuss its position with us once they have completed their review. Accordingly, as matters stand, it is uncertain as to whether the Pensions Regulator will take any further action. This uncertainty is outside of our control.
The number of retired members and other current beneficiaries in the BTPS has been increasing in recent years. Consequently, our future pension costs and contributions will principally depend on the investment returns of the pension fund, mortality of members and inflation, all of which could fluctuate in the medium to long-term. To ensure that the scheme remains flexible, fair and sustainable in the long-term there have been changes to future benefit accruals under BTPS, as discussed in more detail on page 19.
The BTPS was closed to new entrants on 31 March 2001 and people joining BT after that date can participate in a defined contribution pension arrangement which provides benefits based on the employees’ and the employing company’s contributions.
Contractual obligations and commitments
A summary of the group’s principal contractual financial obligations and commitments at 31 March 2010 is shown below. Further details on the items can be found in the notes to the consolidated financial statements. Details of the group’s contingent liabilities are included in note 27 to the consolidated financial statements.
| Payments due by period | ||||||||||||||||||||
| Less | Between | Between | More | |||||||||||||||||
| than 1 | 1 and 3 | 3 and 5 | than 5 | |||||||||||||||||
| Contractual obligations | Total | year | years | years | years | |||||||||||||||
| and commitments | £m | £m | £m | £m | £m | |||||||||||||||
Loans and other borrowingsa | 12,493 | 3,253 | 1,753 | 1,204 | 6,283 | |||||||||||||||
| Finance lease obligations | 304 | 16 | 28 | 20 | 240 | |||||||||||||||
| Operating lease obligations | 7,687 | 494 | 891 | 775 | 5,527 | |||||||||||||||
| Capital commitments | 383 | 330 | 28 | 23 | 2 | |||||||||||||||
| Pension deficit obligations | 11,012 | 525 | 1,108 | 1,219 | 8,160 | |||||||||||||||
Total | 31,879 | 4,618 | 3,808 | 3,241 | 20,212 | |||||||||||||||
| a | Excludes fair value adjustments for hedged risks. |
At 31 March 2010 the group had cash, cash equivalents and current asset investments of £1,858m. The group also had unused committed borrowing facilities amounting to £1,500m. At 31 March 2010, £2,532m of debt principal (at hedged rates) fell due for repayment in the 2011 financial year. In May 2010 the group also entered into a £650m two-year facility. These resources will allow the group to settle its obligations as they fall due.
Off-balance sheet arrangements
As disclosed in the consolidated financial statements, there are no off-balance sheet arrangements that have or are reasonably likely to have a current or future material effect on the group’s financial condition, changes in financial condition, revenues or expenses, results of operations, liquidity, capital expenditure or capital resources, with the exception of financial commitments and contingent liabilities disclosed in note 27.
Quantitative and qualitative disclosures about interest, foreign exchange, credit and liquidity risks
A discussion of the group’s financial risk management objectives and policies and the exposure of the group to interest rate, foreign exchange, credit and liquidity risk is included in note 32 to the consolidated financial statements.
Going concern
TheReview of the yearsection on pages 10 to 40 includes information on the group structure, the performance of each of the lines of business, the impact of regulation and competition, principal risks and uncertainties and the group’s outlook. TheFinancial reviewwithin this section includes information on our financial position and resources, financial results, liquidity and funding and capital management. Notes 10, 11, 14, 18, 19 and 32 of the consolidated financial statements include information on the group’s investments, derivatives, cash and cash equivalents, borrowings, financial risk management objectives, hedging policies and exposures to credit, liquidity and market risks.
Alongside the factors noted above, the directors have considered the group’s cash flow forecast for the period to the end of May 2011. The directors are satisfied that this cash flow forecast, taking into account reasonably possible risk sensitivities associated with this forecast and the group’s current funding and facilities, alongside the group’s funding strategy, shows that the group will continue to operate for the foreseeable future. The directors therefore continue to have a reasonable expectation that the group has adequate resources to continue in operational existence for the foreseeable future and continue to adopt a going concern basis (in accordance with the guidance ‘Going Concern and Liquidity Risk: Guidance for Directors of UK Companies 2009’ issued by the Financial Reporting Council) in preparing the consolidated financial statements.
There has been no significant change in the financial or trading position of the group since 31 March 2010.
Alternative performance measures
We assess the performance of the group using a variety of measures, some of which are not defined under IFRS, and are therefore termed ‘non-GAAP measures’. These measures are in addition to, and supplement, those prepared in accordance with IFRS. The alternative performance measures we use include adjusted EBITDA; adjusted operating profit; adjusted profit before taxation; adjusted earnings per share; underlying revenue; underlying operating costs and underlying capital expenditure; free cash flow; and net debt. Free cash flow and adjusted earnings per share are also the group’s key financial performance indicators as disclosed inHow we measure our progress on page 7.
54 BT GROUP PLCANNUAL REPORT & FORM 20-F
Table of Contents
REVIEW OF THE YEARFINANCIAL REVIEW
An explanation of each of these alternative performance measures is set out below. Reconciliations to the nearest measure prepared in accordance with IFRS are included within the body of theFinancial reviewand in theConsolidated financial statements. The alternative performance measures we use may not be directly comparable to similarly titled measures used by other companies.
EBITDA
In addition to measuring financial performance of the lines of business based on operating profit, we also measure performance based on adjusted EBITDA. EBITDA is defined as the group profit or loss before depreciation, amortisation, net finance expense and taxation. Since this is a non-GAAP measure, it may not be directly comparable to the EBITDA of other companies, as they may define it differently. EBITDA is a common measure used by investors and analysts to evaluate the operating financial performance of companies, particularly in the telecommunications sector.
We consider EBITDA to be a useful measure of our operating performance because it reflects the underlying operating cash costs, by eliminating depreciation and amortisation. EBITDA is not a direct measure of our liquidity, which is shown by our cash flow statement, and it needs to be considered in the context of our financial commitments. Areconciliation from adjusted EBITDA to operating profit, the most directly comparable IFRS measure, is given onpage 102.
Adjusted performance measures
Performance measures presented as ‘adjusted’ are stated before specific items, contract and financial review charges of £1,639m recognised within BT Global Services in 2009 and net interest on pensions.
The directors believe that the presentation of the group’s results in this way is relevant to an understanding of the group’s financial performance. Areconciliationfrom adjusted EBITDA to operating profit, the most directly comparable IFRS measure is included in the segment information note onpage 102. Areconciliationfrom adjusted operating profit to the reported profit is included onpage 42. Areconciliationfrom adjusted earnings per share to reported earnings per share is included onpage 110.
Specific items
In our income statement and segmental analysis we separately identify specific items and present our results both before and after these items. This is consistent with the way that financial performance is measured by management and is reported to the Board and theOperating Committeeand assists in providing a meaningful analysis of the trading results of the group. The directors believe that presentation of the group’s results in this way is relevant to the understanding of the group’s financial performance as specific items are significant one-off or unusual in nature and have little predictive value. Items that we consider to be significant one-off or unusual in nature include disposals of businesses and investments, business restructuring costs, asset impairment charges, property rationalisation programmes and the settlement of multiple tax years in a single settlement. An analysis ofSpecific items recognised in all years presented is included onpages 45and106.
Contract and financial review charges
Adjusted revenue, adjusted EBITDA and adjusted operating profit are stated before specific items and the BT Global Services contract and financial review charges of £1,639m recognised in 2009 due to the size and nature of these charges.
Net interest on pensions
Adjusted profit before taxation and adjusted earnings per share are also presented before net interest on pensions, as disclosed in note 29 to the consolidated financial statements, due to the volatile nature of this item.
Underlying revenue, operating costs and capital expenditure
Underlying revenue, operating costs and capital expenditure refers to the amounts excluding 1) the contribution in the current year from acquisitions that are not reflected in the comparable period in the prior year due to the date the acquisition was completed, and 2) the impact of rebasing the prior year to be on a constant currency basis compared with the current year. No adjustment is made to the prior year reported revenue, operating costs or capital expenditure in determining the year on year movement in underlying revenue, operating costs and capital expenditure. The directors believe that presentation of the group’s revenue, operating costs and capital expenditure in this way is relevant to an understanding of the group’s financial performance.
Both acquisitions and foreign exchange rate movements can have significant impacts on the group’s reported revenue, operating costs and capital expenditure and therefore can impact year on year comparisons. Presentation of the group’s revenue, operating costs and capital expenditure excluding the year on year impact of acquisitions and on a constant currency basis allows the group’s revenue, operating costs and capital expenditure to be presented on a consistent basis for the purpose of year on year comparisons. A reconciliation of reported operating costs and capital expenditure to underlying operating costs and capital expenditure is presented below:
| Operating | Capital | |||||||||||
| costs | expenditure | Total | ||||||||||
| Year ended 31 March 2010 | £m | £m | £m | |||||||||
Reported | 19,116 | 2,533 | 21,649 | |||||||||
| Less: | ||||||||||||
| Specific items | (427) | – | (427 | ) | ||||||||
| Depreciation and amortisation | (3,039) | – | (3,039 | ) | ||||||||
| Leaver costs | (142) | – | (142 | ) | ||||||||
| 15,508 | 2,533 | 18,041 | ||||||||||
| Less: | ||||||||||||
| Foreign exchange | (316) | (16 | ) | (332 | ) | |||||||
| Acquisitions | (32) | – | (32 | ) | ||||||||
Total underlying costs | 15,160 | 2,517 | 17,677 | |||||||||
Free cash flow
Free cash flow is one of our key performance indicators by which our financial performance is measured. Free cash flow is defined as the net increase in cash and cash equivalents less cash flows from financing activities (except net interest paid) and less the acquisition or disposal of group undertakings and less the net sale of short-term investments and excluding pension deficit payments. Free cash flow is primarily a liquidity measure, however we also
BT GROUP PLCANNUAL REPORT & FORM 20-F 55
Table of Contents
REVIEW OF THE YEARFINANCIAL REVIEW
believe it is an important indicator of our overall operational performance as it reflects the cash we generate from operations after capital expenditure and financing costs, both of which are significant ongoing cash outflows associated with investing in our infrastructure and financing our operations. In addition, free cash flow excludes cash flows that are determined at a corporate level independently of ongoing trading operations such as dividends, share buy backs, acquisitions and disposals and repayment of debt. Our use of the term free cash flow does not mean that this is a measure of the funds that are available for distribution to shareholders. Areconciliationof free cash flow to net cash inflow from operating activities, the most directly comparable IFRS measure, is included onpage 51.
Net debt
Net debt consists of loans and other borrowings (both current and non current), less current asset investments and cash and cash equivalents. Loans and other borrowings are measured at the net proceeds raised, adjusted to amortise any discount over the term of the debt. For the purpose of this measure, current asset investments and cash and cash equivalents are measured at the lower of cost and net realisable value. Currency denominated balances within net debt are translated to Sterling at swapped rates where hedged.
This definition of net debt measures balances at the expected value of future undiscounted cash flows due to arise on maturity of financial instruments and removes the balance sheet adjustments made from the re-measurement of hedged risks under fair value hedges and the use of the effective interest method as required by IAS 39. In addition, the gross balances are adjusted to take account of netting arrangements.
Net debt is considered to be an alternative performance measure as it is not defined in IFRS. The most directly comparable IFRS measure is the aggregate of loans and other borrowings (current and non current), current asset investments and cash and cash equivalents. Areconciliationof net debt to this measure is included onpage 53. It is considered both useful and necessary to disclose net debt as it is a key measure against which performance against the group’s strategy is measured. It is a measure of the group’s net indebtedness that provides an indicator of the overall balance sheet strength. It is also a single measure that can be used to assess both the group’s cash position and indebtedness. There are material limitations in the use of alternative performance measures and the use of the term net debt does not necessarily mean that the cash included in the net debt calculation is available to settle the liabilities included in this measure.
56 BT GROUP PLCANNUAL REPORT & FORM 20-F
Table of Contents
REPORT OF THE DIRECTORS
We are committed to operating in accordance with best practice in business integrity, maintaining the highest standards of financial reporting, corporate governance and ethics. The directors consider that BT has, throughout the year, complied with the provisions set out in Section 1 of the 2008 Combined Code on Corporate Governance (the Code) and has applied the main principles of the Code as described in this report.
BT GROUP PLCANNUAL REPORT & FORM 20-F 57
Table of Contents
REPORT OF THE DIRECTORS
BOARD OF DIRECTORS AND OPERATING COMMITTEE
Chairman
 | Sir Michael Rake Chairmanc,d,e,f |
Sir Michael was appointed to the Board as Chairman on 26 September 2007. He also chairs theNominating Committeeand theCommittee for Responsible and Sustainable Business. He was formerly chairman of KPMG International from 2002 to 2007, and previously held other roles in KPMG from 1972.
He is chairman of the UK Commission for Employment and Skills and easyJet, and a non-executive director of Barclays, where he chairs the Audit Comittee, McGraw Hill and the Financial Reporting Council. Sir Michael’s appointments include vice-president of the RNIB, membership of the board of the TransAtlantic Business Dialogue, the CBI International Advisory Board and the National Security Forum.
A Chartered Accountant, he was knighted in 2007 for his services to the accountancy profession. Aged 62.
Executive directors
 | Ian Livingston Chief Executivea,f |
Ian Livingston was appointed as Chief Executive on 1 June 2008. He chairs theOperating Committee. He was formerly Chief Executive of BT Retail from 7 February 2005 and Group Finance Director from April 2002. Prior to joining BT, he was group finance director of Dixons Group from 1997. He joined Dixons in 1991 after working for 3i Group and Bank of America International. His experience at Dixons spanned a number of operational and financial roles, both in the UK and overseas. He is a non-executive director of Celtic. He is a Chartered Accountant. Aged 45.
 | Tony Chanmugam Group Finance Directora |
Tony Chanmugam was appointed to the Board on 1 December 2008 as Group Finance Director. He was formerly Chief Financial Officer of BT Retail and Managing Director of BT Enterprises and, from 1997 to 2004, he was Chief Financial Officer and then Chief Operating Officer at BT Global Solutions. He was appointed a non-executive director and chairman of the audit committee of Barnet and Chase Farm Hospital Trust in April 2010. He is a Chartered Management Accountant. Aged 56.
 | Gavin Patterson Chief Executive, BT Retaila,e |
Gavin Patterson was appointed to the Board on 1 June 2008. He joined BT in January 2004 as Managing Director, Consumer Division, BT Retail and was appointed Chief Executive, BT Retail on 1 May 2008. Before joining BT, he was managing director of the consumer division of Telewest. He joined Telewest in 1999 and held a number of commercial and marketing roles, after working for Procter & Gamble since 1990. Aged 42.
Company Secretary
 | Andrew Parker |
Andrew Parker, formerly General Counsel, BT Retail from 2004, was appointed Company Secretary on 1 April 2008. A solicitor, he has worked for BT since 1988 in a number of legal, regulatory and compliance roles. He is an employer-nominated trustee director of the BT Pension Scheme. Andrew previously worked in the City in legal private practice. Aged 50.
Operating Committee
Ian Livingston, Chief Executive
Tony Chanmugam, Group Finance Director
Sally Davis, Chief Executive, BT Wholesale
Jeff Kelly, Chief Executive, BT Global Services
Roel Louwhoff, Chief Executive, BT Operate
Gavin Patterson, Chief Executive, BT Retail
Clive Selley, Chief Executive, BT Innovate & Design
Tony Chanmugam, Group Finance Director
Sally Davis, Chief Executive, BT Wholesale
Jeff Kelly, Chief Executive, BT Global Services
Roel Louwhoff, Chief Executive, BT Operate
Gavin Patterson, Chief Executive, BT Retail
Clive Selley, Chief Executive, BT Innovate & Design
Key to membership of Board committees:
a Operating
b Audit
c Remuneration
d Nominating
e Responsible and Sustainable Business
f Pension Scheme Performance Review Group
g Equality of Access Board
58 BT GROUP PLCANNUAL REPORT & FORM 20-F
Table of Contents
REPORT OF THE DIRECTORSBOARD OF DIRECTORS AND OPERATING COMMITTEE
Non-executive directors
 | Tony Balld |
Tony Ball was appointed to the Board on 16 July 2009. He has held senior executive positions in broadcasting and telecommunications businesses in the UK, US and continental Europe. Between 1999 and 2003 he was chief executive of BSkyB. He is chairman of the supervisory board of Kabel Deutschland, the German cable operator. He is also a board member of the Olympic Delivery Authority for the 2012 London Olympic Games and a non-executive director of the Spanish cable company ONO. Aged 54.
 | J Eric Danielsc,d |
Eric Daniels was appointed to the Board on 1 April 2008. He has been group chief executive of Lloyds Banking Group (formerly Lloyds TSB Group) since 2003 and a director since 2001, and was formerly group executive director, UK retail banking. He worked for Citibank from 1975 to 2000 becoming chief operating officer of Citibank’s consumer bank, then chairman and CEO of Travelers Life and Annuity, following its merger with Citibank. After that, Eric was chairman and chief executive of Zona Financiera from 2000 to 2001 before joining Lloyds TSB Group.
He is an international advisory board member for British American Business Inc, a member of the International Council of Business Advisors and chief executive of the UK Career Academy Foundation. A US national, he is aged 58.
 | Phil Hodkinsonb,d,e,f |
Phil Hodkinson was appointed to the Board on 1 February 2006. He chairs theAudit Committee. A Fellow of the Institute of Actuaries, prior to his retirement in 2007, Phil’s former roles included group finance director of HBOS, chairman of Insight Investment and Clerical Medical, and chief executive of Zurich Life and Eagle Star Life.
Phil is a non-executive director of HM Revenue & Customs, Travelex, Resolution and Business in the Community, and a trustee of Christian Aid and BBC Children in Need. Aged 52.
 | Clayton Brendishb,d,e |
Clay Brendish was appointed to the Board on 1 September 2002. Prior to his retirement in May 2001, Clay was executive deputy chairman of CMG, having joined the board when it acquired Admiral. Clay was co-founder and executive chairman of Admiral. He also acted as an adviser to the Government on the efficiency of the Civil Service.
He is non-executive chairman of Anite, Echo Research and SThree and a non-executive director of Herald Investment Trust. He is also a trustee of the Economist Group. Aged 63.
 | Rt Hon Patricia Hewittb,c,d,f |
Patricia Hewitt was appointed to the Board on 24 March 2008 and became the Senior Independent Director on 16 July 2009. She chairs theRemuneration Committeeand thePension Scheme Performance Review Group. She stepped down as an MP at the 2010 election. She was Secretary of State for Health from 2005 to 2007 and previously for Trade and Industry and Cabinet Minister for Women from 2001 to 2005. Before entering Parliament in 1997, she was director of research EMEA at Andersen Consulting (now Accenture) and deputy director of the Institute for Public Policy Research. Patricia is a member of the Asia Pacific Advisory Committee of Barclays. She chairs the UK India Business Council and Katha Children’s Trust. A British and Australian dual national, she is aged 61.
 | Carl G Symonb,c,g |
Carl Symon was appointed to the Board on 14 January 2002, and was appointed chairman of theEquality of Access Boardwhen it became operational on 1 November 2005. He retired from IBM in May 2001 after a 32-year career, during which he held senior executive positions in the US, Canada, Latin America, Asia and Europe.
Carl is a non-executive director of BAE Systems and Rexam. He was formerly chairman of the HMV Group and a non-executive director of Rolls-Royce. A US national, he is aged 64.
BT GROUP PLCANNUAL REPORT & FORM 20-F 59
Table of Contents
REPORT OF THE DIRECTORS
THE BOARD
Introduction
BT Group plc is the listed holding company for the BT group of companies: its shares are listed on the London Stock Exchange and on the New York Stock Exchange in the form of American Depositary Shares.
The directors submit their report and the audited financial statements of the company, BT Group plc, and the group, which includes its subsidiary undertakings, for the 2010 financial year.
TheReview of the yearon pages 10 to 40 forms part of this report. The audited financial statements are presented on pages 87 to 144 and 149.
Corporate governance statement
We are committed to operating in accordance with best practice in business integrity and maintaining the highest standards of financial reporting, corporate governance and ethics. The directors consider that BT has, throughout the year, complied with the provisions set out in Section 1 of the 2008 Combined Code on Corporate Governance (the Code) and applied the main principles of the Code as described in pages 58 to 82 of this Report. The Code and associated guidance can be found on the Financial Reporting Council website atwww.frc.org.uk/corporate/combinedcode.cfm
Directors
The names and biographical details of the directors are given on pages 58 and 59 inBoard of Directors and Operating Committee.
Changes to the composition of the Board from 1 April 2009 are set out in the table below:
Former directors | Date of change | |||
| Matti Alahuhta | 31 May 2009 | |||
| Maarten van den Bergh | 15 July 2009 | |||
| Hanif Lalani | 7 January 2010 | |||
| Deborah Lathen | 31 January 2010 | |||
New director | ||||
| Tony Ball | 16 July 2009 | |||
Maarten van den Bergh retired from the Board on 15 July 2009. He was succeeded as Senior Independent Director by Rt Hon Patricia Hewitt, who also became chair of theRemuneration Committeeand thePension Scheme Performance Review Group, and a member of theNominating Committee.
Governance and role of the Board
The Board, which operates as a single team, is made up of the part-time Chairman, the Chief Executive, two other executive directors and six non-executive directors. All the non-executive directors during the 2010 financial year met, and continue to meet, the criteria for independence set out in the Combined Code and are therefore considered by the Board to be independent. The Board viewed the Chairman as independent at the time of his appointment. In line with BT’s policy, the Board comprised a majority of independent non-executive directors throughout the 2010 financial year.
The Board is ultimately responsible for the management of the group’s operations in addition to discharging certain legal responsibilities. It has final responsibility for the group’s strategy and for overseeing the group’s performance. Its principal focus is on:
| 4 | Strategy | |
| 4 | Development | |
| 4 | Growing shareholder value | |
| 4 | Oversight and control | |
| 4 | Corporate governance. |
| It approves BT’s: |
| 4 | values, ethics and business policies and practices | |
| 4 | strategic plans | |
| 4 | annual budget | |
| 4 | capital expenditure and investments budgets | |
| 4 | larger capital expenditure proposals | |
| 4 | the overall system of internal controls, governance and compliance authorities. |
The Board also oversees controls, operating and financial performance and reviews the risk register. These responsibilities are set out in a formal statement of the Board’s role which is available atwww.bt.com/board
The Board has agreed the corporate governance framework, including giving authority to the key management committee, theOperating Committee, to make decisions on operational and other matters. The roles and powers of this Committee are set out below.
The Board normally meets nine times each year as it did during the 2010 financial year.
The roles of the Chairman and the Chief Executive are separate. They are set out in written job descriptions, approved by theNominating Committee. As well as chairing the Board, the Chairman consults the non-executive directors, particularly the Senior Independent Director, on corporate governance issues, matters considered by theNominating Committee, which the Chairman chairs, and the individual performance of the non-executive directors. The Chairman and the non-executive directors hold regular meetings at which they discuss matters without the executive directors being present. With the Chief Executive and the Company Secretary, the Chairman ensures that the Board is kept properly informed, is consulted on all issues reserved to it and that its decisions are made in a timely and considered way that enables the directors to fulfil their fiduciary duties. The Chairman ensures that the views of the shareholders are known to the Board and considered appropriately. He represents BT in specified strategic and Government relationships, as agreed with the Chief Executive, and generally acts as the bridge between the Board and the executive team, particularly on BT’s broad strategic direction. The Chairman’s other current significant commitments are shown inBoard of Directors and Operating Committeeon page 58. The Chief Executive has final executive responsibility, reporting to the Board, for the success of the group.
The Company Secretary manages the provision of timely, accurate and considered information to the Board for its meetings and, in consultation with the Chairman and Chief Executive, at other appropriate times. He recommends to the Chairman and the Chief Executive, for Board consideration where appropriate, corporate governance policies and practices and is responsible for communicating and implementing them. He advises the Board on appropriate procedures for the management of its meetings and duties (and the meetings of the main committees), as well as corporate governance and compliance within the group. The appointment and removal of the Company Secretary is a matter for the whole Board.
60 BT GROUP PLCANNUAL REPORT & FORM 20-F
Table of Contents
REPORT OF THE DIRECTORSTHE BOARD
Directors’ powers to authorise conflicts of interest
All directors have a duty under the Companies Act 2006 (the ‘2006 Act’) to avoid a situation in which he or she has or can have a direct or indirect interest that conflicts or possibly may conflict with the interests of the company. The company adopted new Articles of Association in July 2009 which included provisions for dealing with directors’ conflicts of interest in accordance with the 2006 Act. The Company has procedures in place, which it follows, to deal with situations where directors may have any such conflicts, which require the Board to:
| 4 | consider each conflict situation separately on its particular facts | |
| 4 | consider the conflict situation in conjunction with the rest of their duties under the 2006 Act | |
| 4 | keep records and Board minutes as to authorisations granted by directors and the scope of any approvals given | |
| 4 | regularly review conflict authorisation. |
BT’s non-executive directors
TheNominating Committeehas agreed and reviews from time to time the combination of experience, skills and other attributes which the non-executive directors as a whole should bring to the Board. This profile is used by the Committee, when the appointment of a non-executive director is being considered, to assess the suitability of candidates. Short-listed candidates meet the Committee, which then recommends to the Board candidates for appointment.
The non-executive directors provide a strong, independent element on the Board. Between them, they bring experience and independent judgement, gained at the most senior levels of international business operations and strategy, finance, marketing, technology, communications and political and international affairs.
In her capacity as the Senior Independent Director, and as the chairman of theRemuneration Committee, Patricia Hewitt meets from time to time with BT’s major institutional shareholders. She is able, if necessary, to discuss matters with these shareholders where it would be inappropriate for those discussions to take place with either the Chairman or the Chief Executive.
Non-executive directors are appointed initially for three years, subject to three months’ termination notice from either BT or the director. At the end of the first three years, the appointment may be continued by mutual agreement. Each non-executive director is provided, upon appointment, with a letter setting out the terms of his or her appointment, including membership of Board committees, the fees to be paid and the time commitment expected from the director. The letter also covers such matters as the confidentiality of information and BT’s share dealing code.
Main Board committees
TheOperating Committee, the key management committee, meets weekly and is chaired by the Chief Executive. The other members are the Group Finance Director and the Chief Executives of BT Retail, BT Wholesale, BT Global Services, BT Innovate & Design and BT Operate. The Company Secretary attends all meetings and the Group HR Director normally attends the meetings. The Committee has collective responsibility for running the group’s business. To do that, it develops BT’s strategy and budget for Board approval, recommends to the Board capital expenditure and investments budgets, monitors financial, operational and customer quality of service performance, reviews the risk register and individual risks on it, allocates resources across BT within plans agreed by the Board, plans and delivers major programmes, and reviews the senior talent base and succession plans. Within BT’s corporate governance framework, approved by the Board, theOperating Committeecan approve, up to limits beyond which Board approval is required, capital expenditure, disposals of fixed assets, investments and divestments. It can delegate these approvals, up to its own limits, to sub-committees and to senior executives.
To meet best corporate governance practice, theAudit Committee, theRemuneration Committeeand theNominating Committeehave long been an established part of BT’s system of governance. Each committee has written terms of reference, which are available on our website. TheReport of the Audit Committee, theReport of the Nominating Committeeand theReport on directors’ remunerationare on pages 62 to 77. TheReport of the Committee for responsible and sustainable businessis included on page 65.The Equality of Access Board(EAB), which is also a committee of the Board, was established, as part of the Undertakings given by BT to Ofcom following Ofcom’s strategic review of telecommunications, to monitor, report and advise BT on BT’s compliance with these Undertakings. As required by the Undertakings, the EAB comprises five members: Carl Symon, a BT non-executive director and chairman of the EAB; a BT senior executive, Himanshu Raja, Chief Financial Officer, BT Innovate & Design; and three independent members: Sir Bryan Carsberg, Stephen Pettit and Dr Peter Radley. The EAB reports regularly to the Board. Its terms of reference are available on BT’s website. The EAB publishes an annual report to Ofcom, which is also available on BT’s website.
The Board also has aPension Scheme Performance Review Group, which reviews the position of the BTPS and issues affecting its ongoing funding.
New York Stock Exchange
BT, as a foreign issuer with American Depositary Shares listed on the New York Stock Exchange (NYSE), is obliged to disclose any significant ways in which its corporate governance practices differ from the corporate governance listing standards of the NYSE.
We have reviewed the NYSE’s listing standards and believe that our corporate governance practices are consistent with them, with the following exception where we do not meet the strict requirements set out in the standards. These state that companies must have a nominating/corporate governance committee composed entirely of independent directors and with written terms of reference which, in addition to identifying individuals qualified to become board members, develops and recommends to the Board a set of corporate governance principles applicable to the company. We have aNominating Committeechaired by the Chairman, Sir Michael Rake, but this does not develop corporate governance principles for the Board’s approval. The Board itself approves the group’s overall system of internal controls, governance and compliance authorities. The Board and theNominating Committeeare made up of a majority of independent, non-executive directors.
The Sarbanes-Oxley Act of 2002, the US Securities and Exchange Commission (SEC) and NYSE introduced rules on 31 July 2005 requiring us to comply with certain provisions relating to theAudit Committee. These include the independence ofAudit Committee members and procedures for the treatment of complaints regarding accounting or auditing matters. We are fully compliant with these requirements.
BT GROUP PLCANNUAL REPORT & FORM 20-F 61
Table of Contents
REPORT OF THE DIRECTORS
REPORT OF THE AUDIT COMMITTEE
Introduction
TheAudit Committeeis chaired by Phil Hodkinson. The other members are Clay Brendish, Patricia Hewitt and Carl Symon. They are all independent non-executive directors. They were all members of the Committee throughout the 2010 financial year. Appointments are for a period of up to three years, which may be extended for two further three year periods, provided the director remains independent. The Board considers that the Committee’s members have broad commercial knowledge and extensive business leadership experience, having held between them various prior roles in major business, Government, financial management, treasury and financial function supervision and that this constitutes a broad and suitable mix of business, financial management and IT experience. The Board has reviewed membership of the Committee and is satisfied that it includes a member in the person of Phil Hodkinson who has recent and relevant financial experience required for the provisions of the Code and is an ‘audit committee financial expert’ for the purposes of the US Sarbanes-Oxley Act. The Committee meets typically five times each financial year: in April, May, July, November and February and the Chairman of the Committee reports on the discussions at the next Board meeting.
The Group Finance Director, Company Secretary, Director Internal Audit and Director Group Financial Control although not members of theAudit Committee, will attend meetings with the agreement of the Chairman of theAudit Committee. The external auditors will normally attend meetings, although they will not be present when the Committee discusses their performance and/or remuneration.
The papers and minutes of theAudit Committee meetings are also sent to directors who are not members of the Committee.
Committee role
The Committee’s terms of reference are available from the Company Secretary and are posted on our website atwww.bt.com/committeesThe Committee recommends the appointment and reappointment of the external auditors and considers their resignation or dismissal, recommending to the Board appropriate action to appoint new auditors. PricewaterhouseCoopers have been the company’s auditors for many years. Having reviewed the independence and effectiveness of the external auditors, the Committee has not considered it necessary to date to require them to tender for the audit. The external auditors are required to rotate the lead partner every five years, and other partners every seven years, that are responsible for the group and subsidiary audits. The partner currently responsible for BT’s audit is completing his first year. The Committee discusses with the auditors the scope of their audits before they commence, reviews the results and considers the formal reports of the auditors and reports the results of those reviews to the Board. The Committee reviews the auditors’ performance each year by gathering feedback from Committee members and senior management, and by considering reports on the audit firm’s own internal quality control procedures and assessment of independence. No contractual obligations exist that restrict the group’s choice of external audit firm.
As a result of regulatory or similar requirements, it may be necessary to employ the external auditors for certain non-audit work. In order to safeguard the independence and objectivity of the external auditors, the Board has determined policies as to what non-audit services can be provided by the external auditors and the approval processes related to them. Under those policies, work of a consultancy nature will not be offered to the external auditors unless there are clear efficiencies and value-added benefits to the company. The overall policies and processes to implement them were reviewed and appropriately modified in the light of the provisions of the Sarbanes-Oxley Act relating to non-audit services that external auditors may not perform. TheAudit Committeemonitors the extent of non-audit services being performed by the external auditors and approves any services not included on the list of services the Committee has pre-approved before it is undertaken. It also monitors the level of non-audit fees paid to the auditors. Details of non-audit services carried out by the external auditors are in note 31 in theNotes to the consolidated financial statementson page 136.
TheAudit Committeereviews BT’s published financial results, the Annual Report and Form 20-F and other published information for statutory and regulatory compliance. It reports its views to the Board to assist it in its approval of the results announcements and the Annual Report and Form 20-F.
The Committee also reviews the disclosures made by the Chief Executive and Group Finance Director during the certification process for the annual report about the design and operation of internal controls or weaknesses in the controls, including any fraud involving management or other employees who have a significant role in the company’s financial controls. The Board, as required by UK law, takes responsibility for all disclosures in the annual report.
TheAudit Committeereviews internal audit and its relationship with the external auditors, including plans and performance; and monitors, reviews and reports on risk management processes and the standards of risk management and internal control, including the processes and procedures for ensuring that material business risks, including risks relating to IT security, fraud and related matters, are properly identified and managed.
It reviews promptly all material reports on the company from the internal auditors and ensures that appropriate action is taken on issues arising from such reports, including monitoring management’s responsiveness to the findings and recommendations of the internal auditors.
It reviews the processes for dealing with complaints received by the company regarding accounting, internal accounting controls or auditing matters and the confidential, anonymous submission by employees of concerns regarding questionable accounting or auditing matters (‘whistleblowing’ procedures), ensuring arrangements are in place for the proportionate, independent investigation and appropriate follow up of such matters.
During the 2010 financial year, the Committee placed particular emphasis on reviewing: the effectiveness of internal audit, major contract management and accounting, the line of business Audit Committees and the management of risk.
Committee activities
At each of its meetings, the Committee reviews with the Director Internal Audit and appropriate executives the implementation and effectiveness of key operational and functional change and remedial programmes. The Committee also sets time aside at each meeting to seek the views of the internal and external auditors in the absence of management.
During the year theAudit Committeebusiness included consideration of the following:
April:
| 4 | BT Global Services contract performance | |
| 4 | review of the internal control requirements under the Combined Code and Sarbanes-Oxley | |
| 4 | draft Annual Report and Form 20-F. | |
| May: | ||
| 4 | review of going concern | |
| 4 | review of external audit and non-audit fees |
62 BT GROUP PLCANNUAL REPORT & FORM 20-F
Table of Contents
REPORT OF THE DIRECTORSREPORT OF THE AUDIT COMMITTEE
| 4 | the Annual Report and Form 20-F, full year results announcements and related formal statements | |
| 4 | corporation tax provisions | |
| 4 | accounting estimates and judgements | |
| 4 | review of the internal control requirements under the Combined Code and Sarbanes-Oxley | |
| 4 | annual report on the performance of the Internal Audit function and year end Corporate Summary report | |
| 4 | annual update on ‘whistleblowing’, litigation trends and major litigation report | |
| 4 | external auditors’ report. | |
| July: | ||
| 4 | review of the external and internal auditors’ effectiveness | |
| 4 | first quarter results, announcement and related formal statements | |
| 4 | BT Security update. | |
| September: | ||
| 4 | review of internal audit effectiveness. November: | |
| 4 | review of fees for audit and non-audit services | |
| 4 | review of the line of business Audit Committees | |
| 4 | enterprise risk management review | |
| 4 | half year results, announcement and related formal statements | |
| 4 | external audit plan | |
| 4 | BT Global Services major contracts review | |
| 4 | review of internal control requirements under the Combined Code and Sarbanes-Oxley | |
| 4 | forward strategy for Internal Audit. | |
| February: | ||
| 4 | third quarter results, announcement and related formal statements | |
| 4 | internal audit review update | |
| 4 | risk management agenda for 2010/11 | |
| 4 | external auditors’ quarterly report | |
| 4 | annual review of accounting policies | |
| 4 | review of the operation of Sarbanes-Oxley s404 processes. |
The Committee evaluated its performance and processes by inviting Committee members, key executives and the external auditors to complete questionnaires. This formed part of the annual Board and Committee evaluation. The results showed that the Committee continued to be effective in terms of both behaviours and processes but highlighted the need to understand better the risks inherent in and the accounting for major BT Global Services contracts and to focus more on the adequacy of risk mitigation plans. As a result, and having considered the recommendation in the ‘Walker Review’ about establishing a risk committee, the annual meeting schedule of the Committee has changed to include an additional meeting and for risk management to be given special attention at the July and February meetings. The Committee will monitor the position to assess whether a separate risk committee is needed going forward, given the complex nature of BT’s business. The Committee also undertook a review of the Internal Audit function during the year, which focused on direction, experience and skill set, and the appropriateness of the methodologies and tools used. In response to the findings, the Committee approved an action plan to address the areas highlighted for improvement.
BT GROUP PLCANNUAL REPORT & FORM 20-F 63
Table of Contents
REPORT OF THE DIRECTORS
REPORT OF THE NOMINATING COMMITTEE
Introduction
TheNominating Committeeis chaired by the Chairman. The other members are Tony Ball, Clay Brendish, Eric Daniels, Patricia Hewitt and Phil Hodkinson.
Five of its six members are independent non-executive directors. Although he is not independent, the Board believes that Sir Michael Rake, as Chairman of the Board, is the most appropriate person to chair the Committee. He would not participate in the selection and appointment of his successor. The Company Secretary and, where appropriate, at the invitation of the Chairman, the Chief Executive attend the Committee’s meetings.
Committee role and activities
The Committee’s terms of reference are available from the Company Secretary and are posted on our website atwww.bt.com/committeesTheNominating Committeeensures an appropriate balance of experience and expertise on the Board, reviews the size and composition of the Board and recommends any proposed changes to the Board.
It keeps under review the need to refresh the Board, prepares a description of the specific experience and skills needed for an appointment, considers candidates who are put forward by the directors and external consultants, and recommends to the Board the appointment of all directors after having met short-listed candidates. It makes recommendations to the Board on whether to reappoint non-executive directors at the end of terms of office. It also reviews the time required from the Senior Independent Director and other non-executive directors to carry out their duties and advises the Board on succession planning for the positions of the Chairman, Deputy Chairman and/or Senior Independent Director, Chief Executive and all other Board appointments.
The Committee met three times during the 2010 financial year. It reviewed Board succession, in particular the position of Senior Independent Director, the size, skills profile and composition of the Board, the role of external recruitment consultants and Board and Committee evaluation questionnaires and process. The Committee recommended:
| 4 | the appointment of Patricia Hewitt as Senior Independent Director in succession to Maarten van den Bergh; and | |
| 4 | the appointment of Tony Ball as a non-executive director to bring industry-relevant knowledge and experience to the Board, having held senior executive positions in broadcasting and telecommunication businesses in the US and Europe, including the UK. |
It also reviewed the position of the Chairman.
The minutes ofNominating Committeemeetings are sent, at their request, to directors who are not members of the Committee, where appropriate to do so.
Board evaluation
A further review was carried out by the Chairman and Company Secretary through a questionnaire and discussion with directors in April 2009.
Maarten van den Bergh, the Deputy Chairman, reviewed the performance of the Chairman taking into account the views of the non-executive directors.
The Chairman and Maarten van den Bergh’s successor as Senior Independent Director, Patricia Hewitt, reviewed the results of the evaluation and agreed and implemented a set of actions to address the points raised. These included:
| 4 | the appointment of Tony Ball as a director, to bring broadcasting and telecommunication business experience to the Board | |
| 4 | an increased focus on improving BT Global Services’ performance | |
| 4 | more frequent discussion at Board meetings on strategic issues and opportunities | |
| 4 | building further customer and investor confidence | |
| 4 | improving the quality and depth of oversight functions. |
A further review was carried out in March and April 2010 by the Chairman and Company Secretary through a questionnaire and discussion and the results will be discussed by the Board following which an action plan will be produced. It has been agreed that, from now on, the annual Board evaluation will be carried out using an external facilitator every two or three years.
Separate surveys aboutAudit CommitteeandRemuneration Committee effectiveness were also carried out and the outcomes of the surveys are reported in their respective reports. TheOperating Committeealso conducted its own evaluation, and considered the results.
64 BT GROUP PLCANNUAL REPORT & FORM 20-F
Table of Contents
REPORT OF THE DIRECTORS
REPORT OF THE COMMITTEE FOR RESPONSIBLE
AND SUSTAINABLE BUSINESS
AND SUSTAINABLE BUSINESS
Introduction
TheCommittee for Responsible and Sustainable Businessis chaired by the Chairman and comprises: Gavin Patterson, Chief Executive BT Retail; Larry Stone, President Group Public and Government Affairs; and Alex Wilson, Group Human Resources Director; two non-executive directors: Clay Brendish and Phil Hodkinson and three independent members: Lord Hastings, Baroness Jay and Dame Ellen MacArthur. Jonathon Porritt, chair of BT’s external Leadership Advisory Panel, attends one meeting per annum. Deborah Lathen left the Committee on 31 January 2010, when she ceased to be a director.
Committee role
With input and recommendations from executive management and advice from an independent expert advisory panel, the Committee sets the corporate responsible and sustainable business strategy for the BT group globally (including wholly owned subsidiaries) for approval by the Board. The Committee reviews and agrees plans and targets, evaluates performance, oversees a culture of transparency and stakeholder accountability and distributes, within the approved budget, funding to support the strategy.
Committee activities
The Committee aims to ensure that BT’s responsible policies, behaviour and practices are applied throughout the business, minimising any CR risks to BT’s operations and reputation. It encourages innovation and the development of new communication services to help create a more sustainable society. The Committee met four times in the 2010 financial year and reviewed:
| 4 | progress against CR strategy and key performance indicators | |
| 4 | community and charity support programmes | |
| 4 | the development of BT’s volunteering and sustainability skills programmes | |
| 4 | activities supporting BT’s environment and climate change programmes | |
| 4 | proposals relating to the development of BT’s low carbon economy solutions. |
The Committee made visits to a number of organisations in the 2010 financial year, including InterHealth, One Young World, I CAN and Radar, and also to Adastral Park (where the Committee met more organisations and reviewed a number of projects).
The Committee has close links with BT’s CR Leadership Advisory Panel (Panel); Jonathon Porritt (chair of the Panel) attended the July meeting of the Committee and Dame Ellen MacArthur attended the December Panel meeting. Gavin Patterson is a member of the Committee and he attends Panel meetings.
BT GROUP PLCANNUAL REPORT & FORM 20-F 65
Table of Contents
REPORT OF THE DIRECTORS
REPORT ON DIRECTORS’ REMUNERATION
Overview
| 4 | TheRemuneration Committeeendorsed the Chief Executive’s proposal that directors and senior executives should receive no salary increase in 2009/10, in line with the pay freeze for all employees. | |
| 4 | In view of our executive team’s strong performance, the Committee decided to increase salaries to directors and senior executives from June 2010. Executive directors’ salaries are set to be below the median level for directors of comparable companies. The salary increases proposed for 2010/11 are in line with that principle. | |
| 4 | The demanding conditions set for the 2009/10 annual bonus were largely met. In particular, BT exceeded the targets for free cash flow and earnings per share (EPS). The Chief Executive was therefore awarded a bonus of 142% of target; 71% of his maximum bonus opportunity. | |
| 4 | In 2008, shareholders supported a two-stage change in executive remuneration, designed to simplify the structure and bring total remuneration closer to our comparators. As we reported last year, however, the second stage was postponed in view of the company’s disappointing performance. The second stage will now be implemented in 2010/11, but with lower maximum long-term incentive opportunities than originally proposed, and lower than awards granted in previous years. | |
| 4 | Following consultation with major shareholders, we strengthened the performance measures for our long-term Incentive Share Plan. For awards granted from 2009/10, half of each award is linked to total shareholder return and half to a new three-year cumulative free cash flow measure. | |
| 4 | The Committee introduced a clawback mechanism into all executive share plans, making BT one of the first companies to take such action. | |
| 4 | Having considered the impact of personal income tax changes from April 2010, the Committee endorsed the Chief Executive’s recommendation that no changes be made in order to either avoid or to compensate for the higher top tax rate. | |
| 4 | Hanif Lalani, Chief Executive of BT Global Services and formerly Group Finance Director, resigned as a director on 7 January 2010. Details of his leaving arrangements are disclosed in this report. |
Introduction
This report sets out the details of the remuneration policy for the company’s directors and senior executives and the amounts paid to the directors in 2009/10. As well as meeting statutory requirements, the Committee aims to comply with best practice guidelines in producing this report. Relevant sections of this report have been audited in accordance with the Large and Medium-sized Companies and Groups (Accounts and Reports) Regulations 2008.
This report covers the following:
| 4 | Remuneration policy (not subject to audit) |
| (i) | Role of the Remuneration Committee | ||
| (ii) | Remuneration principles | ||
| (iii) | Remuneration in 2009/10 and 2010/11 | ||
| (iv) | Other matters | ||
| Executive share ownership | |||
| Pensions | |||
| Other benefits | |||
| Director who has left the Board | |||
| Service agreements | |||
| Outside appointments | |||
| Non-executive directors’ letters of appointment | |||
| Non-executive directors’ remuneration | |||
| Directors’ service agreements and contracts of appointment | |||
| Directors’ interests | |||
| Performance graph |
| 4 | Remuneration review (audited) |
| Directors’ emoluments | |||
| Former directors | |||
| Loans | |||
| Pensions | |||
| Share options | |||
| Share awards under long-term incentive plans | |||
| Vesting of outstanding share awards and options | |||
| Deferred Bonus Plan awards | |||
| Share awards under the Employee Share Investment Plan |
Shareholders will be asked to vote on this Report at the 2010 AGM.
Remuneration policy
This part of the Report on directors’ remuneration is not subject to audit.
(i) Role of the Remuneration Committee
TheRemuneration Committeeis a formal committee of the Board and has powers delegated to it under the Articles of Association. Its remit is set out in the terms of reference formally adopted by the Board, which were last reviewed in December 2009.
The terms of reference of the Committee are available on the company’s website atwww.bt.com/committees
TheRemuneration Committeeagrees the framework for the remuneration of the Chairman, the executive directors and certain senior executives. This includes the policy for all cash remuneration, executive share plans, service contracts and termination arrangements. The Committee approves salaries, bonuses and share awards for executive directors and senior executives. The Committee approves changes to the executive share plans and recommends to the Board any changes which require shareholder approval. The Committee also determines the basis on which awards are granted under the executive share plans to executives reporting to the senior management team.
The Board has reviewed compliance with the Combined Code on reward-related matters, and confirms that the company has complied with all aspects. The Chairman, Sir Michael Rake, is a member of the Committee, in accordance with the provision of the Combined Code permitting a company chairman to be a member of, but not chair, the remuneration committee.
The Committee met five times during 2009/10. In addition to the Chairman, the members of the Committee are all independent non-executive directors. Maarten van den Bergh, who had been chairman of the Committee since October 2006, stood down at the AGM in July 2009 and was succeeded by Patricia Hewitt, the Senior Independent Director. The other members who served during 2009/10 were:
| 4 | Matti Alahuhta (retired 31 May 2009) | |
| 4 | Eric Daniels | |
| 4 | Deborah Lathen (retired 31 January 2010) | |
| 4 | Carl Symon |
In addition, the Chief Executive is invited to attend meetings, except when it would be inappropriate for him to be there, for example, when his own remuneration is discussed. Non-executive directors who are not members of the Committee are entitled to receive the papers discussed at meetings and the minutes.
66 BT GROUP PLCANNUAL REPORT & FORM 20-F
Table of Contents
REPORT OF THE DIRECTORSREPORT ON DIRECTORS’ REMUNERATION
The Committee has received advice during the year from independent remuneration consultants, Kepler Associates, who were appointed by the company. Kepler advised both the Committee and the company and attended Committee meetings when major remuneration issues were discussed. They provided no other services to the company. In March 2010 Kepler Associates were replaced by Towers Watson, who were appointed by the Committee. Towers Watson also provide the company with consultancy services on general HR and pensions issues. The Committee also regularly consults the Chief Executive, the Group Finance Director, the Group HR Director, the Director Reward and Employee Relations, and the Company Secretary.
The chair of the Committee met several major shareholders, the Association of British Insurers and Pensions Investment Research Consultants Limited (PIRC) to discuss remuneration issues, including the recommendations of Sir David Walker’s review and the Financial Reporting Council’s review of the Combined Code.
The Committee reviewed its own performance and has taken steps to improve its effectiveness further, for instance by holding a private session for members and the independent remuneration consultants advising the Committee before each meeting.
(ii) Remuneration principles
During 2009/10, the Committee reviewed the principles upon which we base senior executive pay. Our goal remains to maintain a competitive remuneration package that will attract, retain and motivate a high quality top team and align their interests with those of shareholders.
We believe in pay for performance. We aim to set base salaries below the median for our comparator group, while setting stretching goals for the annual bonus (including deferred shares) and the long-term incentive share plan. It is only in return for sustained and excellent performance that the remuneration package as a whole will deliver upper quartile rewards. A significant proportion of the total remuneration package is therefore variable and linked to corporate performance. The Committee reviews the performance targets regularly to ensure that they are both challenging and closely linked to the group’s annual and strategic priorities. Furthermore, because a large part of the remuneration package is delivered in shares and senior executives are required to build up a significant shareholding themselves, they are directly exposed to the same gains or losses as all other shareholders.
In setting directors’ remuneration, the Committee also takes into account the pay and employment conditions of all our employees. For instance, following the general pay freeze (including the senior team) in 2009/10, the overall increase in senior managers’ pay for 2010/11 is comparable with the cost of the pay settlement offered to our employees generally, with some senior managers receiving no increase. Although the pay rise for the Chief Executive is higher (reflecting his performance and commitments made upon his appointment), the Committee welcomed Ian Livingston’s decision to donate any salary increase above the average percentage salary award made to employees to the BT Benevolent Fund and other charities.
The Committee has considered carefully the relationship of risk to remuneration. The largest single driver of on-target remuneration is cash flow (28% of the Chief Executive’s remuneration), reflecting the importance of cash flow to invest in the business, support the pension fund, reduce net debt and pay progressive dividends. The other performance drivers are EPS, total shareholder return and customer service. The Committee is satisfied that this spread of measurement criteria does not drive inappropriate and risky behaviour and that they are aligned to shareholders’ interests.
The Committee is also satisfied that the incentive structure for senior executives does not raise environmental, social or governance risks by inadvertently motivating irresponsible behaviour. Part of the annual bonus depends upon an individual assessment of each senior executive’s personal contribution to environmental, social and governance measures, including results of the regular employee surveys.
The Committee is also satisfied that the incentive structure for senior executives does not raise environmental, social or governance risks by inadvertently motivating irresponsible behaviour. Part of the annual bonus depends upon an individual assessment of each senior executive’s personal contribution to environmental, social and governance measures, including results of the regular employee surveys.
Annual bonuses are not pensionable.
The Committee will be conducting a further review of the executive pay structure in 2010/11, to ensure that we continue to strengthen the alignment of executive interests with those of shareholders, simplifying the system where possible. We will consult major shareholders and representative bodies during the review, while any proposed changes will be the subject of a shareholder vote on the 2011 Directors’ remuneration report.
(iii) Remuneration in 2009/10 and 2010/11
Remuneration structure
| 2008/09 | 2009/10 | 2010/11 | ||||
| Base salary | increases to align | no increases | increases to align | |||
| with the market | with the market | |||||
| Annual bonus | ||||||
| Chief Executive | target 100% salary | target 100% salary | target 125% salary | |||
| maximum 200% salary | maximum 200% salary | maximum 200% salary | ||||
| Executive directors | target 80% salary | target 80% salary | target 100% salary | |||
| maximum 120% salary | maximum 120% salary | maximum 150% salary | ||||
| Deferred bonus (in shares) | ||||||
| Chief Executive | 1x cash bonus | 1x cash bonus | 1x cash bonus | |||
| Executive directors | 75% of cash bonus | 75% of cash bonus | 75% of cash bonus | |||
| Incentive shares | ||||||
| Chief Executive | 3x salary | 3x salary | 2.5x salarya | |||
| Executive directors | 2.5x salary | 2.5x salary | 2x salarya | |||
| Retention shares | none | none | none | |||
| Share options | none | none | none | |||
| a | Although shareholders agreed a maximum award of incentive shares of 3x salary for the Chief Executive (2.5x for executive directors) , theRemuneration Committeeapproved a proposal from the Chairman and Chief Executive to reduce this to 2.5x salary for the Chief Executive (2x salary for executive directors), in view of the wider economic conditions and the base salary increases. |
BT GROUP PLCANNUAL REPORT & FORM 20-F 67
Table of Contents
REPORT OF THE DIRECTORSREPORT ON DIRECTORS’ REMUNERATION
Remuneration in 2009/10
Salaries
Salaries are reviewed annually but increases are made only where the Committee believes the adjustments are appropriate to reflect the contribution of the individual, increased responsibilities and market conditions. In 2009/10 salaries of the executive directors were not increased.
Annual bonus
The annual bonus is linked to corporate performance targets set at the beginning of the financial year. For 2009/10, the weighting of the bonus targets were set as follows:
| % of total bonus opportunity | ||
| Earnings per share (EPS) | 30% | |
| Free cash flow | 30% | |
| Customer service | 25% | |
| Environmental, social and | ||
| governance objectives | 15% |
The scores for corporate performance targets for 2009/10 were as follows:
| Measure (weighting) | Threshold | Target | Stretch | Actual | ||||||||||||
Financial measures (60%) | ||||||||||||||||
| EPS (30%) | 15% | 30% | 60% | 43% | ||||||||||||
| Free cash flow (30%) | 15% | 30% | 60% | 60% | ||||||||||||
Customer service (25%) | 12.5% | 25% | 50% | 18% | ||||||||||||
Sub-total | 121% | |||||||||||||||
Environment, social and | ||||||||||||||||
governance (15%) | 7.5% | 15% | 30% | a | ||||||||||||
| a | Performance is assessed on an individual basis. |
The two financial targets (which together represent 60% of the bonus) have a direct impact on shareholder value, while customer service and broader objectives are vital to the company’s long-term health and growth. We do not publish details of the EPS and cash flow targets, since these are market sensitive and commercially confidential. The Committee is, however, satisfied that the measures are appropriate and that the targets are properly stretching.
In calculating EPS for purposes of the annual bonus, volatile items which would be reported under IFRS are excluded. The impact of market movements in foreign exchange and financial instruments, plus the net finance expense or income relating to the group’s pension liabilities, were excluded from the target.
Customer service is measured by rigorous and challenging ‘right first time’ metrics across each line of business. Although we will keep this measure under review, ‘right first time’ is directly linked to cost reductions as well as to customer satisfaction and is measured objectively.
The environmental, social and governance measure is assessed by the Chief Executive for each senior executive, and by the Chairman for the Chief Executive himself. Assessment is based upon BT’s regular employee survey as well as health and safety and sustainability measures.
Annual bonuses are paid in cash. Details of the bonuses for Ian Livingston, Tony Chanmugam, Gavin Patterson and Hanif Lalani are set out in the table on page 73.
Deferred Bonus Plan
In addition to the annual cash bonus, directors receive an award of shares under the Deferred Bonus Plan (DBP). For the Chief Executive, the award has a value of 100% of his cash bonus and for the other executive directors, the value of the awards is 75% of their cash bonus.
The shares vest and are transferred to the executive after three years if they remain employed by the company. There are currently no additional performance measures for the vesting of DBP awards. The Committee considers that awarding shares on a deferred basis acts as a retention measure and contributes to the alignment of management with the long-term interests of the shareholders.
The DBP awards for previous years for Ian Livingston, Tony Chanmugam, Gavin Patterson and Hanif Lalani at the end of 2009/10 are contained in the table on page 77.
Remuneration in 2010/11
In early 2010, theRemuneration Committeereviewed the senior executive remuneration package, taking into account the challenges to the business, the significant improvement in performance and the need to incentivise and, if appropriate, reward management for success. In particular, we considered whether to implement the second stage of the two-stage change in remuneration agreed by shareholders in 2008 but not implemented in 2009 because of the company’s unacceptable performance. We also took into account the views of institutional shareholders and representative bodies. The Committee agreed that the on-target and maximum levels for the annual bonus should be increased as originally agreed, but that the maximum opportunities for awards granted under the long-term Incentive Share Plan should be reduced as a multiple of salary.
Base salaries have also been reviewed and, where appropriate, increased to bring them more closely towards, but still typically below or around, mid-market levels in comparable companies. In making these decisions, the Committee took account of the position of all BT’s employees who will benefit from pay increases and annual bonuses based on the company’s performance in 2010/11.
No retention awards or share options will be granted.
Details of the remuneration structure are set out in the table on page 67.
Annual bonus
The Committee considered carefully the structure of the corporate scorecard for 2010/11. We have retained the EPS and free cash flow measures at 30% each, reflecting their importance as measures of corporate performance. In order to ensure that senior executives are also focused on the need for sustained profitable growth, we have added a new measure – worth 10% – of individual performance against personal objectives based on the company’s strategic priorities. Customer service measures will be 20% and the environmental, social and governance objectives 10% of the weighting.
The Committee believes that the group performance targets for the financial year 2010/11 are very challenging.
Proportion of fixed and variable remuneration
The composition of each executive director’s performance-related remuneration, excluding pension, is as follows:
| Fixed | Variable | Variable | ||||||||||||||
| base pay | cash | shares | Total | |||||||||||||
| Ian Livingston | ||||||||||||||||
| 2010/11 target | 22% | 28% | 50% | 100% | ||||||||||||
compositiona | ||||||||||||||||
| 2009/10 actual | 38% | 53% | 9% | 100% | ||||||||||||
compositionb | ||||||||||||||||
| Tony Chanmugam | ||||||||||||||||
| 2010/11 target | 28% | 28% | 44% | 100% | ||||||||||||
compositiona | ||||||||||||||||
| 2009/10 actual | 48% | 46% | 6% | 100% | ||||||||||||
compositionb | ||||||||||||||||
| Gavin Patterson | ||||||||||||||||
| 2010/11 target | 28% | 28% | 44% | 100% | ||||||||||||
compositiona | ||||||||||||||||
| 2009/10 actual | 46% | 45% | 9% | 100% | ||||||||||||
compositionb | ||||||||||||||||
| a | Target remuneration comprises current base salary, on-target annual bonus and the expected value of awards under the deferred bonus and incentive share plans, excluding retention shares. | |
| b | Actual remuneration comprises base salary, actual cash bonus and the value received from deferred shares and incentive shares (awards granted in 2006 and vested in 2009) during the financial year, excluding retention shares. |
68 BT GROUP PLCANNUAL REPORT & FORM 20-F
Table of Contents
REPORT OF THE DIRECTORSREPORT ON DIRECTORS’ REMUNERATION
Long-term share-based incentives
Incentive shares
BT operates a long-term Incentive Share Plan (ISP), based on performance over three years. Shares only vest if the participant is still employed by BT and challenging performance measures have been met. In 2007/8 and 2008/9, the vesting of awards was entirely based on Total Shareholder Return (TSR) relative to a comparable group of companies; for 2009/10 and 2010/11, 50% of awards are based on relative TSR with the balance based on a three-year cumulative free cash flow measure. The use of a free cash flow measure for the long-term incentive plan as well as the annual bonus reflects the importance of cash generation.
TSR for these purposes was calculated by J.P.Morgan Cazenove. TSR links the reward given to directors with the performance of BT against other major companies. TSR is measured against a comparator group which contains European telecommunications companies and companies which are either similar in size or market capitalisation and/or have a similar business mix and spread to BT.
The TSR comparator group for 2010/11 is the same as last year (with the substitution of Cable & Wireless Worldwide for Cable & Wireless and TalkTalk for Carphone Warehouse) and comprises the following companies:
| Accenture | France Telecom | Telecom Italia | ||
| AT & T | Hellenic Telecom | Telefónica | ||
| Belgacom | IBM | Telekom Austria | ||
| BSkyB | National Grid | Telenor | ||
| BT Group | Portugal Telecom | TeliaSonera | ||
| Cable & Wireless Worldwide | Royal KPN | Verizon | ||
| Cap Gemini | Swisscom | Virgin Media | ||
| Centrica | TalkTalk | Vodafone | ||
| Deutsche Telekom | ||||
The TSR for a company is calculated by comparing the return index (RI) at the beginning of the performance period with the RI at the end of the period. The RI is the TSR value of a company measured on a daily basis, as tracked by independent analysts, Datastream. It uses the official closing prices for a company’s shares, adjusted for all capital actions and dividends paid. The initial RI is determined by calculating the average RI value taken daily over the three months prior to the beginning of the performance period; and the end value is determined by calculating the average RI over the three months up to the end of the performance period. This mitigates the effects of share price volatility. A positive change between the initial and end values indicates growth in TSR.
At 31 March 2010, the TSR for the 2007/08 awards was at 14th position against the comparator group of 15 companies. As a result, none of the shares will vest and all of the share awards have lapsed.
TSR vesting schedule for ISP awards granted in 2009/10 and 2010/11
| Relative TSR over 3 years | % of share award vesting | |||
| Below median | Nil | |||
| Median | 12.5% | |||
| Between median and upper quartile | Between 12.5% and 50% on straight line basis | |||
| Upper quartile | 50% | |||
The remaining 50% of the ISP awards are based on a three-year cumulative free cash flow, set at a level considered by the Committee, and confirmed by its independent adviser, to be at least as challenging as the previous measure. For awards granted in 2009/10, performance is assessed against a range of cumulative cash flow measures. 25% of the relevant part of the award will vest for performance at the lower end of the range, increasing on a straight line basis, such that 100% of the relevant part of the award will vest for performance at the upper end of the range. At 31 March 2010, the performance for the awards granted in 2009/10 was at the upper end of the range.
The threshold level for vesting for the free cash flow measure for awards to be made in 2010/11 has been set above market expectations prevailing when the performance conditions were set; the range between threshold and maximum vesting is £1bn.
The details of ISP awards held by Ian Livingston, Tony Chanmugam, Gavin Patterson and Hanif Lalani at the end of the 2009/10 financial year are contained in the table on page 76.
Clawback
The rules of each of the executive share plans provide for a clawback of unvested awards in circumstances where it becomes apparent that there was a misjudgement of the basis on which the award was made.
In addition to the ISP, the BT Equity Incentive Portfolio includes the Retention Share Plan (RSP) and the Global Share Option Plan (GSOP).
Retention shares
RSP awards are used by exception only and principally as a recruitment or retention tool. As a result, shares currently under award are not generally linked to a corporate performance target. The length of the retention period before awards vest is flexible, although this would normally be three years unless the Committee agrees otherwise. The shares are transferred at the end of the specified period if the individual is still employed by BT and any performance conditions are met. No RSP awards were made to executive directors, but three awards were granted to other senior executives, in 2009/10.
Share options
No share options were awarded under the GSOP in 2009/10 and none have been awarded since 2004/05.
Details of options held by directors at the end of 2009/10 are contained in the table on page 75.
Other share plans
The Chairman and executive directors may participate in BT’s all-employee share plans, the Employee Sharesave Scheme, Employee Share Investment Plan and Allshare International, on the same basis as other employees. Details of these plans are disclosed in note 30 to the consolidated financial statements.
Openreach
In the Undertakings given to Ofcom on 22 September 2005, BT agreed that the incentive elements of the remuneration of executives within Openreach should be linked to Openreach performance rather than BT targets or share price. These incentives cannot be provided by way of BT shares.
As a result, separate arrangements were put in place for Openreach executives in 2005/06. The annual bonus is linked solely to Openreach targets, and long-term incentives are paid in cash instead of shares. However, payment of bonuses in Openreach is subject to overall affordability within BT Group.
Openreach executives participate in the BT all-employee share plans on the same terms as other BT employees.
None of the executive directors participates in the Openreach incentive plans.
BT GROUP PLCANNUAL REPORT & FORM 20-F 69
Table of Contents
REPORT OF THE DIRECTORSREPORT ON DIRECTORS’ REMUNERATION
Dilution
Treasury shares are generally used to satisfy the exercise of share options, the grant of share awards and for the all-employee share plans. At the end of the 2009/10 financial year, treasury shares equivalent to 9% of the issued share capital would be required for these purposes. It is estimated that treasury shares equivalent to approximately 1% of the issued share capital will be required for all the employee share plans in 2010/11.
(iv) Other matters
Executive share ownership
The Committee believes that the interests of the executive directors should be closely aligned with those of shareholders. The DBP and ISP provide considerable alignment. The directors are encouraged to build up a shareholding in the company over time by retaining shares which they have received under an executive share plan (other than shares sold to meet a National Insurance or income tax liability) or from a purchase in the market. The Chief Executive is required to build up a shareholding of 2x salary and the remaining directors 1.5x salary. Progress towards meeting these targets has been made in 2009/10.
Current shareholdings are set out on page 72.
Pensions
The BT Pension Scheme (BTPS) closed to new entrants on 31 March 2001. None of the executive directors participates in future service accrual in the BTPS. Executive directors who are members of the BTPS also benefit from a death in service lump sum of four times salary.
All new employees are eligible to join the defined contribution BT Retirement Saving Scheme (BTRSS), the successor to the defined contribution BT Retirement Plan (BTRP). The BTRSS is a group personal pension plan. For executive directors the company agrees to pay a fixed percentage of the executive’s salary each year which can be put towards the provision of retirement benefits. Executive directors who are not members of BTPS benefit from a death in service lump sum of four times salary and a dependant’s pension of 30% of capped salary.
Pension provision for all executives is based on salary alone – bonuses, other elements of pay and long-term incentives are excluded.
Other benefits
Other benefits for the Chairman and the senior management team include some or all of the following: company car, fuel or driver, personal telecommunications facilities and home security, medical and dental cover for the director and immediate family, special life cover, professional subscriptions, and personal tax advice and financial counselling. The company has a permanent health insurance policy to provide cover for the Chairman and certain executive directors who may become permanently incapacitated.
Director who has left the Board
Hanif Lalani resigned as a director on 7 January 2010 and left BT on 31 March 2010. In accordance with the terms of his director’s service contract, which was terminated on 11 January 2010, and, following the cessation of his employment, his salary of £585,000 per annum and the value of all of the benefits to which he was entitled, amounting to £195,000 per annum, continue to be provided until the earlier of nine months from 31 March 2010 or his obtaining full-time employment. A bonus for the year ended 31 March 2010 of £503,290 was also paid.
Hanif Lalani held awards over a total of 1,990,525 shares under the ISP all of which lapsed on the date of termination. At the discretion of theRemuneration Committee, his awards over a total of 282,744 shares under the Deferred Bonus Plan were pro-rated and 124,691 shares will vest in August 2010 and 105,374 shares will vest in August 2011. A total of 52,679 shares under the Deferred Bonus Plan lapsed. As such awards over a total of 2,043,204 shares (90%) under the executive share plans lapsed.
Hanif Lalani’s options over a total of 195,889 shares at option prices of 192p and 199.5p under the GSOP were preserved, at the discretion of theRemuneration Committee, until 31 March 2011.
Service agreements
It is group policy for the Chairman and executive directors to have service agreements providing for one year’s notice. It may be necessary on recruitment to offer longer initial periods to new directors from outside BT, or circumstances may make it appropriate to offer a longer fixed term. All of the service agreements contain provisions dealing with the removal of a director for poor performance, including in the event of early termination of the contract by BT. The contracts of the Chairman, Ian Livingston, Tony Chanmugam and Gavin Patterson entitle them on termination of their contract by BT to payment of salary and the value of benefits (pension benefits (including life cover), health cover, dental cover and car) until the earlier of 12 months from notice of termination or the director obtaining full-time employment. No director will receive a bonus or other payments on a change of control.
Outside appointments
The Committee believes that there are significant benefits, to both the company and the individual, from executive directors accepting non-executive directorships of companies outside BT. The Committee will consider up to two external appointments (of which only one may be to the Board of a major company), for which a director may retain the fees. Ian Livingston receives an annual fee of £25,000 as a non-executive director of Celtic and an additional annual fee of £5,000 for chairing the audit committee. Gavin Patterson was a non-executive director of Johnston Press from 7 July 2008 until 24 April 2009, for which he received a fee at the rate of £40,000 per annum. Tony Chanmugam was appointed as a non-executive director and chairman of the audit committee of Barnet and Chase Farm Hospital Trust on 1 April 2010, for which he receives a fee of £6,000 per annum and which is donated to charity.
Non-executive directors’ letters of appointment
Non-executive directors have letters of appointment. They are appointed for an initial period of three years. During that period, either party can give the other at least three months’ notice. At the end of the period, the appointment may be continued by mutual agreement. Further details of appointment arrangements for non-executive directors are set out inGovernance and role of the Boardon page 60. The letters of appointment of non-executive directors are terminable on notice by the company without compensation.
Non-executive directors’ remuneration
Six of the directors on the Board are non-executive directors who, in accordance with BT’s articles of association, cannot individually vote on their own remuneration. Non-executive remuneration is reviewed by the Chairman and the Chief Executive, and discussed and agreed by the Board. Non-executive directors may attend the Board discussion but may not participate in it.
The most recent review by the Board of the fees for the non-executive directors was in January 2008, having not previously been reviewed since 2004. Increases in the fees were made in order to align them with the market.
The basic fee for non-executive directors is £60,000 per annum. There are additional fees for membership and chairing a Board committee, details of which are given in the table below:
70 BT GROUP PLCANNUAL REPORT & FORM 20-F
Table of Contents
REPORT OF THE DIRECTORSREPORT ON DIRECTORS’ REMUNERATION
| Additional | ||||||||
| Committee | Member’s fee | Chairman’s fee | ||||||
| Audit | £10,000 | £15,000 | ||||||
| Remuneration | £10,000 | £10,000 | ||||||
| Nominating | £5,000 | £5,000 | ||||||
| Other Board committees | £5,000 | £5,000 | ||||||
Patricia Hewitt, as Senior Independent Director, chairman of the Remuneration Committee and chairman of the Pension Scheme Performance Review Group, receives total fees of £150,000 per annum. Carl Symon receives an additional annual fee of £70,000 as chairman of the Equality of Access Board (a Board committee), which was established on 1 November 2005.
An additional fee of £2,000 per trip is paid to those non-executive directors travelling regularly from overseas to Board and Board committee meetings on an inter-continental basis.
To align further the interests of the non-executive directors with those of shareholders, the company’s policy is to encourage these directors to purchase, on a voluntary basis, £5,000 of BT shares each year. The directors are asked to hold these shares until they retire from the Board. This policy is not mandatory. Current shareholdings are shown on page 72.
No element of non-executive remuneration is performance-related. Non-executive directors do not participate in BT’s bonus or employee share plans and are not members of any of the company pension schemes.
Directors’ service agreements and contracts of appointment
The dates on which directors’ initial service agreements/letters of appointment commenced and the current expiry dates are as follows:
Chairman and executive directors | Commencement date | Expiry date of current service agreement or letter of appointment | ||||
| Sir Michael Rake I Livingston T Chanmugam G Patterson | 26 September 2007 1 June 2008 1 December 2008 1 June 2008 |  | The contract is terminable by the company on 12 months’ notice and by the director on six months’ notice. | |||
Non-executive directors | ||||||
| C Brendish C G Symon | 1 September 2002 14 January 2002 | | Letters of appointment were for an initial period of three years. The appointments were extended for three years in 2005 and by a further three years in 2008. The appointments are terminable by the company or the director on three months’ notice. | |||
| P Hodkinson | 1 February 2006 | Letter of appointment was for an initial period of three years. The appointment was extended for three years in 2009. The appointment is terminable by the company or the director on three months’ notice. | ||||
| J E Daniels P Hewitt T Ball | 1 April 2008 24 March 2008 16 July 2009 | | Letters of appointment are for an initial period of three years and are terminable by the company or the director on three months’ notice. | |||
Former directors | ||||||
| H Lalani | 7 February 2005 | The contract was terminable by the company on 12 months’ notice and by the director on six months’ notice. The contract was terminated on 11 January 2010. | ||||
| M van den Bergh | 1 September 2000 | Letter of appointment was for an initial period of three years. The appointment was extended for three years in 2003 and extended for a further three years in 2006. The appointment was terminable by the company or director on three months’ notice. The appointment terminated at the conclusion of the Annual General Meeting on 15 July 2009. | ||||
| M Alahuhta | 1 February 2006 | Letter of appointment was for an initial period of three years. The appointment was extended for three months in February 2009. The appointment terminated on 31 May 2009. | ||||
| D Lathen | 1 February 2007 | Letter of appointment was for an initial period of three years and was terminable by the company or the director on three months’ notice. Appointment terminated on 31 January 2010. | ||||
There are no other service agreements or material contracts, existing or proposed, between the company and the directors. There are no arrangements or understandings between any director or executive officer and any other person pursuant to which any director or executive officer was selected to serve. There are no family relationships between the directors.
BT GROUP PLCANNUAL REPORT & FORM 20-F 71
Table of Contents
REPORT OF THE DIRECTORSREPORT ON DIRECTORS’ REMUNERATION
Directors’ interests
The interests of directors holding office at the end of the year, and their families, in the company’s shares at 31 March 2010 and 1 April 2009, or at date of appointment if later, are shown below:
| Number of shares | ||||||||
| Beneficial holdings | 2010 | 2009 | ||||||
| Sir Michael Rake | 108,362 | 102,056 | ||||||
I Livingstona,b | 1,084,513 | 759,108 | ||||||
T Chanmugama,b | 205,629 | 49,249 | ||||||
G Pattersona,b | 409,181 | 252,769 | ||||||
T Ballc | 15,000 | – | ||||||
| C Brendish | 41,920 | 36,920 | ||||||
| J E Daniels | 12,647 | 12,647 | ||||||
| P Hewitt | 10,554 | 6,534 | ||||||
| P Hodkinson | 16,683 | 9,261 | ||||||
| C G Symon | 20,056 | 20,056 | ||||||
Total | 1,924,545 | 1,248,600 | ||||||
| a | Includes free shares awarded under the BT Group Employee Share Investment Plan. | |
| b | The executive directors decided to receive their annual bonuses for 2008/09 in shares. On 1 June 2009, 224,385 shares were purchased for Ian Livingston, 67,097 shares were purchased for Tony Chanmugam and 105,592 shares were purchased for Gavin Patterson. | |
| c | Tony Ball was appointed as a director on 16 July 2009. |
During the period from 1 April 2010 to 7 May 2010, there were no movements in directors’ beneficial holdings.
The directors, as a group, beneficially own less than 1% of the company’s shares.
Performance graph
This graph illustrates, as required by the Large and Medium-sized Companies and Groups (Accounts and Reports) Regulations 2008, the performance of BT Group plc measured by TSR relative to a broad equity market index over the past five years. We consider the FTSE 100 to be the most appropriate index against which to measure performance for these purposes, as BT has been a constituent of the FTSE 100 throughout the five-year period, and the index is widely used. TSR is the measure of the returns that a company has provided for its shareholders, reflecting share price movements and assuming reinvestment of dividends.
BT’s total shareholder return (TSR) performance
over the five financial years to 31 March 2010
over the five financial years to 31 March 2010
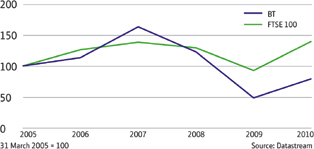
72 BT GROUP PLCANNUAL REPORT & FORM 20-F
Table of Contents
REPORT OF THE DIRECTORSREPORT ON DIRECTORS’ REMUNERATION
Remuneration review
This part of the Report on directors’ remuneration is subject to audit.
Directors’ emoluments
Directors’ emoluments for the 2009/10 financial year were as follows:
| Pension allowance net of pension contributionsa | ||||||||||||||||||||||||||||||||||||||||
| Other benefits excluding pension | ||||||||||||||||||||||||||||||||||||||||
| Basic salary and fees | ||||||||||||||||||||||||||||||||||||||||
| Total salary and fees | Annual bonus | Expense allowance | Total | Total | Deferred Bonus Planb | |||||||||||||||||||||||||||||||||||
| 2010 | 2009 | 2010 | 2009 | |||||||||||||||||||||||||||||||||||||
| £000 | £000 | £000 | £000 | £000 | £000 | £000 | £000 | £000 | £000 | |||||||||||||||||||||||||||||||
Sir Michael Rakec | 600 | – | 600 | – | – | 70 | 670 | 630 | – | – | ||||||||||||||||||||||||||||||
I Livingstonc | 850 | 10 | 860 | 1,206 | – | 39 | 2,105 | 1,174 | 1,206 | 343 | ||||||||||||||||||||||||||||||
T Chanmugamc,d,e | 475 | 143 | 618 | 463 | 19 | 9 | 1,109 | 275 | 346 | 77 | ||||||||||||||||||||||||||||||
G Pattersonc,d | 500 | 100 | 600 | 487 | 19 | 27 | 1,133 | 698 | 365 | 121 | ||||||||||||||||||||||||||||||
T Ballf | 53 | – | 53 | – | – | – | 53 | – | – | – | ||||||||||||||||||||||||||||||
| C Brendish | 80 | – | 80 | – | – | – | 80 | 80 | – | – | ||||||||||||||||||||||||||||||
| J E Daniels | 75 | – | 75 | – | – | – | 75 | 74 | – | – | ||||||||||||||||||||||||||||||
P Hewittg | 128 | – | 128 | – | – | – | 128 | 75 | – | – | ||||||||||||||||||||||||||||||
| P Hodkinson | 100 | – | 100 | – | – | – | 100 | 100 | – | �� | ||||||||||||||||||||||||||||||
C G Symonh | 150 | – | 150 | – | – | 24 | 174 | 150 | – | – | ||||||||||||||||||||||||||||||
H Lalanic,d,i | 458 | 176 | 634 | 503 | 4 | 25 | 1,166 | 805 | – | – | ||||||||||||||||||||||||||||||
M Alahuhtaj | 12 | – | 12 | – | – | – | 12 | 70 | – | – | ||||||||||||||||||||||||||||||
D Lathenh,k | 63 | – | 63 | – | – | 18 | 81 | 75 | – | – | ||||||||||||||||||||||||||||||
M van den Berghl | 44 | – | 44 | – | – | – | 44 | 150 | – | – | ||||||||||||||||||||||||||||||
F Barraultm | – | – | – | – | – | – | – | 1,257 | – | – | ||||||||||||||||||||||||||||||
B Verwaayenn | – | – | – | – | – | – | – | 577 | – | – | ||||||||||||||||||||||||||||||
| 3,588 | 429 | 4,017 | 2,659 | 42 | 212 | 6,930 | 6,190 | 1,917 | 541 | |||||||||||||||||||||||||||||||
Termination payments | ||||||||||||||||||||||||||||||||||||||||
H Lalanio | 131 | – | ||||||||||||||||||||||||||||||||||||||
F Barraultp | 10 | 1,599 | ||||||||||||||||||||||||||||||||||||||
| B Verwaayen | – | 700 | ||||||||||||||||||||||||||||||||||||||
| 7,071 | 8,489 | |||||||||||||||||||||||||||||||||||||||
| a | Pension allowance paid in cash for the 2009/10 financial year – see ‘Pensions’ below. | |
| b | Deferred annual bonuses payable in shares in three years’ time, subject to continued employment. | |
| c | Other benefits include some or all of the following: company car, fuel or driver, personal telecommunications facilities and home security, medical and dental cover for the director and immediate family, special life cover, professional subscriptions, personal tax advice, and financial counselling. | |
| d | Expense allowance in the above table includes a monthly cash allowance in lieu of a company car or part of such allowance which has not been used for a company car. | |
| e | Tony Chanmugam was granted a retention cash award in early 2008 prior to his appointment as a director. He will receive a payment of £315,000 in May 2010. | |
| f | Tony Ball was appointed as a director on 16 July 2009. | |
| g | Patricia Hewitt was appointed as Senior Independent Director on 16 July 2009. | |
| h | Includes an additional fee for regular travel from overseas to Board and Board committee meetings. | |
| i | Hanif Lalani resigned as a director on 7 January 2010 and left the company on 31 March 2010. | |
| j | Matti Alahuhta retired as a director on 31 May 2009. | |
| k | Deborah Lathen retired as a director on 31 January 2010. | |
| l | Maarten van den Bergh retired as a director on 15 July 2009. | |
| m | François Barrault resigned as a director on 30 October 2008 and left the company on 30 November 2008. | |
| n | Ben Verwaayen retired as a director on 30 June 2008. | |
| o | Hanif Lalani’s contract was terminated on 11 January 2010. In accordance with his contract, his salary of £585,000 per annum and the value of all the benefits to which he is entitled, amounting to £195,000 per annum, will continue to be provided until the earlier of nine months from 31 March 2010 or his obtaining full-time employment. | |
| p | François Barrault continued to receive medical insurance until 30 November 2009, in accordance with the terms of his contract. |
BT GROUP PLCANNUAL REPORT & FORM 20-F 73
Table of Contents
REPORT OF THE DIRECTORSREPORT ON DIRECTORS’ REMUNERATION
The directors’ salaries were not increased in 2009/10.
The annual cash bonus awards for 2009/10 are not pensionable. Ian Livingston’s bonus of £1,206,000 represented 142% of his current salary (2008/09: 40%), Tony Chanmugam’s bonus of £462,650 represented 97% of his current salary (2008/09: 22%) Gavin Patterson’s bonus of £487,000 represented 97% of his current salary (2008/09: 32%) and Hanif Lalani’s bonus of £503,290 represented 86% of his salary (2008/09: 0%).
Following this year’s review of annual salaries, Ian Livingston’s salary will be increased to £900,000, Tony Chanmugam’s salary will be increased to £510,000 and Gavin Patterson’s salary will be increased to £525,000. All increases will be effective from 1 June 2010.
Former directors
Sir Peter Bonfield received, under pre-existing arrangements, a pension of £394,283 payable in the 2009/10 financial year (2008/09 – £390,766).
Baroness Jay retired as a non-executive director on 13 January 2008 but continues as a member of theCommittee for Responsible and Sustainable Business, for which she receives an annual fee of £6,500.
Deborah Lathen retired as a director on 31 January 2010 and has been appointed as a consultant to BT for which she receives an annual fee of US$70,000 (£44,000).
Loans
There are no outstanding loans granted by any member of the BT Group to any of the directors, or guarantees provided by any member of the BT Group for their benefit.
Pensions
Sir Michael Rake is not a member of any of the company pension schemes, and the company made no payments towards retirement provision. BT provides him with a lump sum death in service benefit of £1m.
Ian Livingston is not a member of any of the company pension schemes, but the company has agreed to pay an annual amount equal to 30% of his salary towards pension provision. The company paid £245,000 into his personal pension plan, plus a cash payment of £10,000 representing the balance of the pension allowance for the 2009/10 financial year. BT also provides him with a lump sum death in service benefit of four times his salary.
Tony Chanmugam is a member of the BTPS but has opted out of future pensionable service accrual. The company pays him an annual allowance equal to 30% of salary towards pension provision. A cash payment of £142,500 was made for Tony Chanmugam for the 2009/10 financial year. BT also provides him with a death in service lump sum benefit of four times salary.
Gavin Patterson receives an annual allowance equal to 30% of salary towards pension provision. Of this amount, £50,000 was paid as an employer contribution into the BTRSS and the balance of £100,000 was paid as a cash payment for the 2009/10 financial year. BT also provides him with a death in service lump sum benefit of four times salary plus a widow’s pension of 30% of his capped salary.
Hanif Lalani is a member of the BTPS but opted out of future pensionable service accrual. The company paid an annual allowance equal to 30% of salary towards pension provision. A cash payment of £175,500 was paid to Hanif Lalani for the 2009/10 financial year. BT also provided a death in service lump sum benefit of four times salary and a two-thirds widow’s pension.
The table below shows the increase in the accrued benefits, including those referred to above, to which each director who is a member of the BTPS has become entitled during the year, and the transfer value of the increase in accrued benefits.
Increases in pension benefits at 31 March 2010
| Transfer | ||||||||||||||||||||||||||||
| value of | ||||||||||||||||||||||||||||
| increase | ||||||||||||||||||||||||||||
| Change | in accrued | |||||||||||||||||||||||||||
| in transfer | Additional | benefits in | ||||||||||||||||||||||||||
| value c-d | accrued benefits | e less | ||||||||||||||||||||||||||
| less directors’ | earned in | directors’ | ||||||||||||||||||||||||||
| Accrued pension | Transfer value of accrued benefits | contributions | the year | contributions | ||||||||||||||||||||||||
| 2010 | 2009 | 2010 | 2009 | 2010 | 2010 | 2010 | ||||||||||||||||||||||
| £000a | £000b | £000c | £000d | £000 | £000e | £000 | f | |||||||||||||||||||||
T Chanmugamg,h | 180 | 140 | 3,536 | 2,419 | 1,117 | 35 | 693 | |||||||||||||||||||||
H Lalanig,i | 166 | 161 | 2,382 | 1,742 | 640 | – | – | |||||||||||||||||||||
| a-d | As required by the Large and Medium-sized Companies and Groups (Accounts and Reports) Regulations 2008. | |
| a-b | The values represent the deferred pension to which they would have been entitled had they left the company on 31 March 2010 and 2009, respectively. | |
| c | Transfer value of the deferred pension in column (a) as at 31 March 2010 calculated on the basis of actuarial advice in accordance with relevant legislation. The transfer value represents a liability of the BTPS rather than any remuneration due to the individual, and cannot be meaningfully aggregated with annual remuneration, as it is not money the individual is entitled to receive. | |
| d | The equivalent transfer value but calculated as at 31 March 2009 on the assumption that the director left the company on that date. | |
| e | The increase in pension built up during the year, net of inflation. The gross amount can be calculated by deducting the amount under column (b) from the amount under column (a). | |
| f | The transfer value of the pension in column (e), less directors’ contributions. | |
| g | Directors’ contributions in the financial year 2009/10 were as follows: Hanif Lalani £nil (2009: £nil); Tony Chanmugam, £nil (2009: £9,500). | |
| h | Tony Chanmugam was appointed as a director on 1 December 2008. | |
| i | Hanif Lalani resigned as a director on 7 January 2010 and left the company on 31 March 2010. |
74 BT GROUP PLCANNUAL REPORT & FORM 20-F
Table of Contents
REPORT OF THE DIRECTORSREPORT ON DIRECTORS’ REMUNERATION
Share options held at 31 March 2010, or date of appointment if later
| Number of shares under option | ||||||||||||||||||||||||||||||||
| 1 April 2009 | Usual date | |||||||||||||||||||||||||||||||
| or date of | 31 March | Option price | from which | Usual expiry | ||||||||||||||||||||||||||||
| appointment if later | Granted | Lapsed | Exercised | 2010 | per share | exercisable | date | |||||||||||||||||||||||||
| Sir Michael Rake | – | 12,110 | a | – | – | 12,110 | 68p | 01/08/2012 | 01/02/2013 | |||||||||||||||||||||||
| I Livingston | – | 12,110 | a | – | – | 12,110 | 68p | 01/08/2012 | 01/02/2013 | |||||||||||||||||||||||
| T Chanmugam | 37,384 | b | – | – | – | 37,384 | 192p | 24/06/2007 | 24/06/2014 | |||||||||||||||||||||||
| – | 12,110 | a | – | – | 12,110 | 68p | 01/08/2012 | 01/02/2013 | ||||||||||||||||||||||||
| G Patterson | 11,198 | d | – | 11,198 | – | – | 146p | 14/08/2009 | 14/02/2010 | |||||||||||||||||||||||
| 98,178 | b | – | – | – | 98,178 | 192p | 24/06/2007 | 24/06/2014 | ||||||||||||||||||||||||
Former director | ||||||||||||||||||||||||||||||||
H Lalanie | 90,625 | b | – | – | – | 90,625 | 192p | 24/06/2007 | 24/06/2014 | |||||||||||||||||||||||
| 105,264 | c | – | – | – | 105,264 | 199.5p | 24/06/2004 | 24/06/2013 | ||||||||||||||||||||||||
| – | 12,110 | a | 12,110 | – | – | 68p | 01/08/2012 | 01/02/2013 | ||||||||||||||||||||||||
Total | 342,649 | 48,440 | 23,308 | – | 367,781 | |||||||||||||||||||||||||||
| All of the above options were granted for nil consideration. | ||
| a | Option granted on 7 April 2009 under the Employee Sharesave Scheme, in which all employees of the company are entitled to participate. | |
| b | Options granted under the GSOP on 24 June 2004. The exercise of options was subject to a performance measure being met. The performance measure is relative TSR compared with a group of 20 companies from the European Telecom Sector as at 1 April 2004. BT’s TSR had to be in the upper quartile for all the options to become exercisable. At median 30% of the options would be exercisable. Below that point none of the options could be exercised. The three-year performance period ended on 31 March 2007. At that date, the company was at 8th position against the comparator group and as a result, 42% of the options lapsed and 58% of each option became exercisable on 24 June 2007. | |
| c | Option granted under the GSOP (Special Incentive Award) on 24 June 2003, prior to Hanif Lalani’s appointment as a director. This option is not subject to a performance measure as the grant was linked to personal performance. | |
| d | Option granted on 25 June 2004 under the Employee Sharesave Scheme, in which all employees of the company are eligible to participate. | |
| e | Hanif Lalani left the company on 31 March 2010. His options under the GSOP were preserved until 31 March 2011. His options under the Employee Sharesave Scheme lapsed on 31 March 2010. | |
Unrealised gains on share options
The market price of BT shares at 31 March 2010 was 123.9p (2009: 78.2p) and the range during the 2009/10 financial year was 79.7p-149.6p (2008/09: 71.4p-235.5p).
Tony Chanmugam and Gavin Patterson had no unrealised gains on share options as at 31 March 2010.
Hanif Lalani had no unrealised gains on share options as at 31 March 2010. He left the company on 31 March 2010.
BT GROUP PLCANNUAL REPORT & FORM 20-F 75
Table of Contents
REPORT OF THE DIRECTORSREPORT ON DIRECTORS’ REMUNERATION
Share awards under long-term incentive plans held at 31 March 2010, or date of appointment, if later
Details of the company’s ordinary shares provisionally awarded to directors, as participants under the ISP and RSP are as follows:
| Total | ||||||||||||||||||||||||||||||||||||||||
| number of | Monetary | |||||||||||||||||||||||||||||||||||||||
| award | value of | |||||||||||||||||||||||||||||||||||||||
| shares | Market | vested | ||||||||||||||||||||||||||||||||||||||
| 1 April | Dividends | 31 March | Normal | Price | price | award | ||||||||||||||||||||||||||||||||||
| 2009 | Awarded | re-invested | Vested | Lapsed | 2010 | vesting date | on grant | at vesting | £000 | |||||||||||||||||||||||||||||||
| I Livingston | ||||||||||||||||||||||||||||||||||||||||
ISP 2007a | 383,307 | – | 9,961 | – | 393,268 | – | 31/3/2010 | 321.67p | – | – | ||||||||||||||||||||||||||||||
ISP 2008b | 1,397,025 | – | 36,307 | – | – | 1,433,332 | 31/3/2011 | 203p | – | – | ||||||||||||||||||||||||||||||
ISP 2009c | – | 1,985,723 | 51,606 | – | – | 2,037,329 | 31/3/2012 | 128.41p | – | – | ||||||||||||||||||||||||||||||
| T Chanmugam | ||||||||||||||||||||||||||||||||||||||||
ISP 2007a | 92,411 | – | 2,400 | – | 94,811 | – | 31/3/2010 | 317.67p | – | – | ||||||||||||||||||||||||||||||
ISP 2008b | 145,179 | – | 3,772 | – | – | 148,951 | 31/3/2011 | 203p | – | – | ||||||||||||||||||||||||||||||
ISP 2009c | – | 924,723 | 24,032 | – | – | 948,755 | 31/3/2012 | 128.41p | – | – | ||||||||||||||||||||||||||||||
RSP 2007d | 97,772 | – | 2,540 | 100,312 | – | – | 20/3/2010 | 300p | 121.07 | 121 | ||||||||||||||||||||||||||||||
| G Patterson | ||||||||||||||||||||||||||||||||||||||||
ISP 2007a | 124,941 | – | 3,246 | – | 128,187 | – | 31/3/2010 | 317.67p | – | – | ||||||||||||||||||||||||||||||
ISP 2008b | 684,815 | – | 17,797 | – | – | 702,612 | 31/3/2011 | 203p | – | – | ||||||||||||||||||||||||||||||
ISP 2009c | – | 973,393 | 25,296 | – | – | 998,689 | 31/3/2012 | 128.41p | – | – | ||||||||||||||||||||||||||||||
Former director | ||||||||||||||||||||||||||||||||||||||||
| H Lalani | ||||||||||||||||||||||||||||||||||||||||
ISP 2007a | 251,887 | – | 6,546 | – | 258,433 | – | 31/3/2010 | 321.67p | – | – | ||||||||||||||||||||||||||||||
ISP 2008b | 801,235 | – | 20,823 | – | 822,058 | – | 31/3/2011 | 203p | – | – | ||||||||||||||||||||||||||||||
ISP 2009c | – | 1,138,870 | 29,597 | – | 1,168,467 | – | 31/3/2012 | 128.41p | – | – | ||||||||||||||||||||||||||||||
| a | Awards under the ISP granted in 2007 vest subject to meeting a performance condition, on 31 March 2010. The performance measure is relative TSR compared with a group of 15 companies from the European Telecom Sector as at 1 April 2007. BT’s TSR had to be in the upper quartile for all the shares to vest. At median, 25% of the shares would vest. At 31 March 2010, BT’s TSR was at 14th position against the comparator group. As a result all of the awards lapsed on that date. | |
| b | Awards under the ISP granted on 25 June 2008. The number of shares subject to awards was calculated using the average middle market price of a BT share for the three days prior to the grant. The awards will vest subject to meeting a performance condition, on 31 March 2011. The performance measure is relative TSR compared with a group of 15 companies from the European Telecom Sector as at 1 April 2008. BT’s TSR must be in the upper quartile for all the shares to vest. At median, 25% of the shares would vest. Below that point, no shares would vest. | |
| c | Awards under the ISP granted on 7 August 2009. The number of shares subject to awards was calculated using the average middle market price of a BT share for the three days prior to the grant. 50% of each award of shares is linked to TSR compared with a group of 25 companies and 50% is linked to a three-year cumulative free cash flow measure. The awards will vest subject to meeting the two performance conditions, on 31 March 2012. | |
| d | Tony Chanmugam was granted an RSP award on 20 March 2007. The award vested in full on 20 March 2010. Vesting of RSP awards is not subject to a performance target being met. | |
| e | Hanif Lalani left the company on 31 March 2010. On that date, all of his outstanding awards under the ISP lapsed. |
Vesting of outstanding share awards and options
| 31 March 2010 | 31 March 2009 | |||||||||||||||||||||||||||
| Free cash | Percentage of | Percentage of | Percentage of | |||||||||||||||||||||||||
| Vesting date | flow position | shares vesting | TSR position | shares vesting | TSR position | shares vesting | ||||||||||||||||||||||
ISP 2006a | 31/03/2009 | N/A | N/A | 14 | 0% | 14 | 0% | |||||||||||||||||||||
ISP 2007b | 31/03/2010 | N/A | N/A | 14 | 0% | 14 | 0% | |||||||||||||||||||||
ISP 2008c | 31/03/2011 | N/A | N/A | 14 | 0% | 14 | 0% | |||||||||||||||||||||
ISP 2009d | 31/03/2012 | 100% | 50% | 10 | 31% | – | – | |||||||||||||||||||||
| a | The performance period for the ISP 2006 ended on 31 March 2009. BT’s TSR position was at 14th position against the European Telecom Sector of 17 companies. As a result all the shares lapsed on that date. | |
| b | The performance period for the ISP 2007 ended on 31 March 2010. BT’s TSR position was at 14th position against the European Telecom Sector of 15 companies. As a result all the shares lapsed on that date. | |
| c | The performance period for the ISP 2008 ends on 31 March 2011. | |
| d | The performance period for the ISP 2009 ends on 31 March 2012. 50% of each award of shares is linked to TSR; and 50% is linked to a three-year cumulative free cash flow measure. (SeeLong-term share-based incentiveson page 69). The awards will vest subject to meeting the two performance conditions on 31 March 2012. |
76 BT GROUP PLCANNUAL REPORT & FORM 20-F
Table of Contents
REPORT OF THE DIRECTORSREPORT ON DIRECTORS’ REMUNERATION
Deferred Bonus Plan (DBP) awards at 31 March 2010, or date of appointment, if later
The following DBP awards have been granted to the directors under the DBP. These shares will normally be transferred to participants at the end of the three-year deferred period if those participants are still employed by BT Group.
| Total | ||||||||||||||||||||||||||||||||||||||||
| number of | Monetary | |||||||||||||||||||||||||||||||||||||||
| award | value of | |||||||||||||||||||||||||||||||||||||||
| shares | Market | vested | ||||||||||||||||||||||||||||||||||||||
| 1 April | Dividends | 31 March | Price | price | award | |||||||||||||||||||||||||||||||||||
| 2009 | Awardeda | re-invested | Vested | Lapsed | 2010 | Vesting date | at grant | at vesting | £000 | |||||||||||||||||||||||||||||||
| I Livingston | 167,149 | – | – | 167,149 | – | – | 1/8/2009 | 231.58p | 124.43p | 208 | ||||||||||||||||||||||||||||||
| 138,708 | – | 3,604 | – | – | 142,312 | 1/8/2010 | 321.67p | – | – | |||||||||||||||||||||||||||||||
| 221,199 | – | 5,747 | – | – | 226,946 | 1/8/2011 | 203p | – | – | |||||||||||||||||||||||||||||||
| – | 267,410 | 6,948 | – | – | 274,358 | 1/8/2012 | 128.41p | – | – | |||||||||||||||||||||||||||||||
| T Chanmugam | 51,230 | – | – | 51,230 | – | – | 1/8/2009 | 231.58p | 124.43p | 64 | ||||||||||||||||||||||||||||||
| 37,450 | – | 972 | – | – | 38,422 | 1/8/2010 | 321.67p | – | – | |||||||||||||||||||||||||||||||
| 52,007 | – | 1,350 | – | – | 53,357 | 1/8/2011 | 203p | – | – | |||||||||||||||||||||||||||||||
| – | 59,972 | 1,557 | – | – | 61,529 | 1/8/2012 | 128.41p | – | – | |||||||||||||||||||||||||||||||
| G Patterson | 84,071 | – | – | 84,071 | – | – | 1/8/2009 | 231.58p | 124.43p | 105 | ||||||||||||||||||||||||||||||
| 57,440 | – | 1,491 | – | – | 58,931 | 1/8/2010 | 321.67p | – | – | |||||||||||||||||||||||||||||||
| 90,267 | – | 2,344 | – | – | 92,611 | 1/8/2011 | 203p | – | – | |||||||||||||||||||||||||||||||
| – | 94,380 | 2,452 | – | – | 96,832 | 1/8/2012 | 128.41p | – | – | |||||||||||||||||||||||||||||||
Former director | ||||||||||||||||||||||||||||||||||||||||
H Lalanib | 127,351 | – | – | 127,351 | – | – | 1/8/2009 | 231.58p | 124.43p | 158 | ||||||||||||||||||||||||||||||
| 121,533 | – | 3,158 | – | – | 124,691 | 1/8/2010 | 321.67p | – | – | |||||||||||||||||||||||||||||||
| 154,050 | – | 4,003 | – | 52,679 | 105,374 | 1/8/2011 | 203p | – | – | |||||||||||||||||||||||||||||||
| a | Awards granted on 3 August 2009 in respect of the financial year 2008/09. The number of shares subject to awards was calculated using the average middle market price of a BT share for the three days prior to the grant. | |
| b | Hanif Lalani left the company on 31 March 2010. His 2008 award was pro-rated and will vest on 1 August 2011. |
Details of DBP awards in respect of the 2009/10 financial year are given in the table on page 73. The number of shares subject to the awards will be calculated using the average middle market price of a BT share for the three days prior to the grant. It is expected that awards will be granted in June 2010.
Share awards under the Employee Share Investment Plan (ESIP) at 31 March 2010, or at date of appointment, if later
| Total number of | ||||
| shares | ||||
| 31 March 2010 | ||||
| I Livingston | 363 | |||
| T Chanmugam | 679 | |||
| G Patterson | 247 | |||
Former director | ||||
H Lalania | 679 | |||
| a | Hanif Lalani left the company on 31 March 2010. |
During the year no awards of shares were granted under the ESIP.
By order of the Board
Rt Hon Patricia Hewitt
Chair of Remuneration Committee
12 May 2010
Chair of Remuneration Committee
12 May 2010
BT GROUP PLCANNUAL REPORT & FORM 20-F 77
Table of Contents
REPORT OF THE DIRECTORS
DIRECTORS’ INFORMATION
Election and re-election
All directors are required by BT’s articles of association to be elected by shareholders at the first annual general meeting (AGM) after their appointment, if appointed by the Board. A director must subsequently retire by rotation at an AGM at intervals of not more than three years. The director may seek re-election.
Accordingly, Tony Ball, having been appointed as a director by the Board, retires at the forthcoming AGM and will be proposed for election. Sir Michael Rake, Ian Livingston and Carl Symon retire by rotation and will be proposed for re-election. Details of these directors’ contracts/letters of appointment are included in theReport on directors’ remuneration.
Meetings attendance
The following table shows the attendance of directors at meetings of the Board andAudit, NominatingandRemuneration Committeesduring the 2010 financial year.
| Audit | Nominating | Remuneration | ||||||||||||||
| Board | Committee | Committee | Committee | |||||||||||||
| Number of meetings held | ||||||||||||||||
| 9 | 6 | 3 | 5 | |||||||||||||
| Number of meetings attended (maximum possible) | ||||||||||||||||
| Sir Michael Rake | 9 (9) | – | 3 (3) | 3 (5) | ||||||||||||
Tony Balla | 6 (6) | – | 2 (2) | – | ||||||||||||
| Clay Brendish | 9 (9) | 6 (6) | 2 (3) | – | ||||||||||||
| Tony Chanmugam | 9 (9) | – | – | – | ||||||||||||
| Eric Daniels | 9 (9) | – | 3 (3) | 5 (5) | ||||||||||||
| Patricia Hewitt | 8 (9) | 6 (6) | 2 (2) | 4 (4) | ||||||||||||
| Phil Hodkinson | 9 (9) | 6 (6) | 3 (3) | – | ||||||||||||
| Ian Livingston | 9 (9) | – | – | – | ||||||||||||
| Gavin Patterson | 9 (9) | – | – | – | ||||||||||||
| Carl Symon | 9 (9) | 6 (6) | – | 5 (5) | ||||||||||||
Matti Alahuhtab | 2 (2) | – | – | 1 (1) | ||||||||||||
Maarten van den Berghc | 2 (3) | 2 (2) | – (1) | 1 (1) | ||||||||||||
Hanif Lalanid | 7 (7) | – | – | – | ||||||||||||
Deborah Lathene | 7 (7) | – | – | 2 (3) | ||||||||||||
| a | Appointed to the Board on 16 July 2009 | |
| b | Resigned from the Board on 31 May 2009 | |
| c | Resigned from the Board on 15 July 2009 | |
| d | Resigned from the Board on 7 January 2010 | |
| e | Resigned from the Board on 31 January 2010 |
Service agreements
The Chairman and executive directors have service agreements, which are approved by theRemuneration Committee. Information about the periods of these contracts is in theReport on directors’ remuneration.
Training and information
On appointment, directors take part in an induction programme when they receive information about BT, the role of the Board and the matters reserved for its decision, the terms of reference and membership of the main Board committees, and the powers delegated to those committees, BT’s corporate governance policies and procedures, including the powers reserved to the group’s most senior executives, and the latest financial information. There are also visits to key BT locations and meetings with members of theOperating Committeeand other key senior executives.
Directors are continually updated on BT’s business, the competitive and regulatory environments in which it operates, technology and corporate responsibility matters and other changes affecting BT and the communications industry as a whole, by written briefings and meetings with senior BT executives. The Board has an annual strategy meeting, with regular reviews during the year. Directors are also advised on appointment of their legal and other duties and obligations as a director of a listed company, both in writing and in face-to-face meetings with the Company Secretary. They are reminded of these duties each year and they are also updated on changes to the legal, accounting and governance requirements affecting the company and themselves as directors. During the 2010 financial year, for example, accounting and governance seminars were held and the Board also received briefings on changes to UK company law and on various corporate governance matters through monthly Secretary’s Reports. The Chairman also sends a weekly e-mail to non-executive directors with topical sector highlights.
Guidelines govern the content, presentation and delivery of papers for each Board meeting, so that the directors have enough information to be properly briefed sufficiently far ahead of each Board meeting and at other appropriate times, and to take account of their duties as directors.
Independent advice
The Board has a procedure for directors, in carrying out their duties, to take independent professional advice if necessary, at BT’s expense. All directors also have access to the advice and services of the Company Secretary.
Directors’ and officers’ liability insurance and indemnity
For some years, BT has purchased insurance to cover the directors and officers of BT Group plc and its subsidiaries (and the BT nominated directors of associated companies and joint ventures) against defence costs and civil damages awarded following an action brought against them in that capacity. The insurance operates to protect the directors and officers directly in circumstances where by law BT cannot provide an indemnity and also provides BT, subject to a retention, with cover against the cost of indemnifying a director or officer. One layer of the programme is ringed-fenced for the directors of BT Group plc. The cover has been extended to provide limited cover for civil fines and penalties. At the date on which this report was approved, and throughout the 2010 financial year, the company’s wholly owned subsidiary, British Telecommunications plc, has provided an indemnity in respect of a similar group of people who would be covered by the above insurance. Neither the insurance nor the indemnity provides cover where the person has acted fraudulently or dishonestly.
Interest of management in certain transactions
During and at the end of the 2010 financial year, none of BT’s directors was materially interested in any material transaction in relation to the group’s business and none is materially interested in any presently proposed material transactions.
78 BT GROUP PLCANNUAL REPORT & FORM 20-F
Table of Contents
REPORT OF THE DIRECTORS
BUSINESS POLICIES
Responsible business
We have had in place for over ten years a written statement of business practice (The Way We Work). This covers all our operations and applies worldwide to all employees, and to all agents and contractors when representing BT, and is available in nine languages. During 2010, we have refreshed and reissuedThe Way We Workand our policy on Anti-corruption and Bribery to all our people worldwide.
We have also issued a new Gifts and Hospitality policy to our employees. We are committed to high ethical standards and legal compliance in all aspects of our business. We have measured our employee awareness ofThe Way We Workand the extent to which our employees display ethical behaviour; and we are reviewing our KPIs on ethics to reflect our policies.
Through our Sourcing with Human Dignity initiative, we seek to ensure that working conditions throughout our supply chain meet internationally recognised human rights standards. We investigate potential social and environmental shortcomings and are committed to achieving 100% follow-up within three months for all suppliers identified as high- or medium-risk. During the 2010 financial year, we completed 32 on-site assessments (2009: 27). The majority of assessments were conducted in China, although we also conducted assessments in Hungary, India, Malaysia, South Korea, Tunisia, the UK and the US. We now employ our own assessor based in Shanghai, which has enabled us to focus our efforts on suppliers in China. We work with our suppliers to help them improve their performance. In 2010, 86% of our suppliers agreed that we work with them to ensure our purchases are made, delivered, used and disposed of in a socially and environmentally responsible manner.
The high-level principles inThe Way We Workare supported by a continuing and comprehensive communications programme and on-line training. A confidential helpline and dedicated e-mail facility are also available to employees who have questions about the application of these principles. The helpline number is also published externally. BT’s Undertakings code of practice (It matters) forms part of our statement of business practice and is consistent with it.
We are committed to managing our environmental performance. BT’s environment management system within the UK has been certified to the international standard ISO 14001 since 1999. Since then we have extended our certification to include Belgium, Ireland, Germany and the Netherlands. BT has its own ISO 14001 certification and BT Spain is certified.
A Board committee – theCommittee for Responsible and Sustainable Business– chaired by Sir Michael Rake and comprising representatives from BT businesses, two non-executive directors and three independent members oversees our corporate responsibility, environment and community activities, including charitable expenditure and the strategy for maximising our contribution to society. More information is available inReview of the year – Our corporate responsibilityon page 34. TheReport of the Committee for responsible and sustainable businessis on page 65.
Political donations
Our continuing policy is that no company in the group will make contributions in cash or kind to any political party, whether by gift or loan. However, the definition of political donations used in the Companies Act 2006 (the 2006 Act) is very much broader than the sense in which these words are ordinarily used. It may cover activities such as making MPs and others in the political world aware of key industry issues and matters affecting the company, which make an important contribution to their understanding of BT. These activities have been carried out on an even-handed basis, related broadly to the major UK political parties’ electoral strength. The authority we are requesting at the AGM is not designed to change the above policy. It will, however, ensure that BT continues to act within the provisions of the 2006 Act requiring companies to obtain shareholder authority before they can make donations to EU political parties and/or political organisations as defined in the 2006 Act. During 2010, the company’s wholly-owned subsidiary, British Telecommunications plc, made the following payments totalling £14,952 (2009: £17,658) to cover, for example, the cost of hosting briefing meetings with MPs and MEPs about the company’s activities: Labour Party £5,333; Conservative Party £3,793; Liberal Democrats £3,333; Scottish National Party £2,493. No loans were made to any political party by any company in the BT group.
Pension funds
BT’s two main UK pension arrangements – the BTPS and the BT Retirement Saving Scheme (BTRSS) – are not controlled by the Board but by a separate and independent corporate trustee for the BTPS and a management committee for the BTRSS. The trustee of the BTPS looks after the assets of the funds, which are held separately from those of the company. For BTRSS members, each member has an individual personal pension secured with an insurance company (Standard Life). Pension funds’ assets can be used only in accordance with their respective rules and for no other purpose.
Financial statements
So far as each of the directors is aware, there is no relevant information that has not been disclosed to the auditors and each of the directors believes that all steps have been taken that ought to have been taken to make them aware of any relevant audit information and to establish that the auditors have been made aware of that information.
A statement by the directors of their responsibilities for preparing the financial statements is included in theStatement of directors’ responsibilityon page 84. The directors’ statement on going concern is included inReview of the year – Financial reviewon page 54.
Takeover Directive disclosure
Following the implementation of the EU Takeover Directive by certain provisions of the 2006 Act, we are required to make additional disclosures. A number of these disclosures can be found elsewhere in this Report as set out below:
| 4 | structure of BT’s share capital (refer to page 123) including the rights and obligations attaching to the shares (refer to pages 161 to 164); | |
| 4 | restrictions on the transfer of BT shares and voting rights (refer to pages 161 and 162); | |
| 4 | significant direct or indirect shareholdings (refer to page 82); and | |
| 4 | appointment and replacement of directors (refer to page 163). |
The disclosures which are not covered elsewhere in this Report include the following:
| 4 | BT has two employee share ownership trusts which hold BT shares for the purpose of satisfying awards made under the various employee share plans. The trustee of the BT Group ESIP |
BT GROUP PLCANNUAL REPORT & FORM 20-F 79
Table of Contents
REPORT OF THE DIRECTORSBUSINESS POLICIES
| may invite participants on whose behalf it holds shares to direct it how to vote in respect of those shares, and if there is an offer for the shares or other transaction which would lead to a change of control of BT, participants may direct it to accept the offer or agree to the transaction. In respect of shares held in the BT Group Employee Share Ownership Trust, the trustee abstains from voting those shares, and if there is an offer for the shares the trustee is not obliged to accept or reject the offer but will have regard to the interests of the participants, may consult them to obtain their views on the offer and may otherwise take the action with respect to the offer it thinks fair: |
| 4 | we are not aware of any agreements between shareholders that may result in restrictions on the transfer of shares or on voting rights | ||
| 4 | no person holds securities carrying special rights with regard to control of the Company | ||
| 4 | proxy appointment and voting instructions must be received by the registrars not less than 48 hours before a general meeting (see also page 161) | ||
| 4 | the amendment of BT’s articles of association requires shareholder approval in accordance with legislation in force from time to time | ||
| 4 | the powers of the directors are determined by UK legislation and the articles of association. They are authorised to issue and allot shares, and to undertake purchases of BT shares subject to shareholder approval at the AGM | ||
| 4 | BT Group plc is not party to any significant agreements that take effect, alter or terminate upon a change of control following a takeover | ||
| 4 | we do not have any agreements with directors providing for compensation for loss of office or employment that occurs because of a takeover. There is similarly no such provision in standard contracts for employees. |
Financial instruments
Details of the financial risk management objectives and policies of the group and exposure to interest risk, credit risk, liquidity risk and foreign exchange are given in note 32 on pages 137 to 144.
Internal control and risk management
The Board is responsible for the group’s systems of internal control and risk management and for reviewing each year the effectiveness of those systems. Such systems are designed to manage, rather than eliminate, the risk of failure to achieve business objectives; any system can provide only reasonable and not absolute assurance against material misstatement or loss. The process in place for reviewing BT’s systems of internal control includes procedures designed to identify and evaluate failings and weaknesses, and, in the case of any categorised as significant, procedures exist to ensure that necessary action is taken to remedy the failings.
The Board also takes account of significant social, environmental and ethical matters that relate to BT’s businesses and reviews annually BT’s corporate responsibility policy. The company’s workplace practices, specific environmental, social and ethical risks and opportunities and details of underlying governance processes are dealt with in theReview of the year – Our resourceson page 18.
We have enterprise-wide risk management processes for identifying, evaluating and managing the significant risks faced by the group. These processes have been in place for the whole of the 2010 financial year and have continued up to the date on which this document was approved. The processes are in accordance with the Revised Guidance for Directors on the Combined Code published by the Financial Reporting Council (the Turnbull Guidance).
Risk assessment and evaluation takes place as an integral part of BT’s annual strategic planning cycle. We have a detailed risk management process, culminating in a Board review, which identifies the key risks facing the group and each business unit. This information is reviewed by senior management as part of the strategic review. Our current key risks are summarised inReview of the Year – Our Riskson pages 36 and 37.
The key features of the enterprise-wide risk management and internal control process comprise the following procedures:
| 4 | senior executives collectively review the group’s key risks and have created a group risk register describing the risks, owners and mitigation strategies. This is reviewed by theOperating Committeebefore being reviewed and approved by the Board | |
| 4 | the lines of business carry out risk assessments of their operations, create risk registers relating to those operations, and ensure that the key risks are addressed | |
| 4 | senior executives with responsibilities for major group operations report quarterly with their opinion on the effectiveness of the operation of internal controls in their area of responsibility | |
| 4 | the group’s internal auditors carry out continuing assessments of the quality of risk management and control, report to management and theAudit Committeeon the status of specific areas identified for improvement and promote effective risk management in the lines of business operations | |
| 4 | theAudit Committee, on behalf of the Board, considers the effectiveness of the operation of internal control procedures in the group during the financial year. It reviews reports from the internal and external auditors and reports its conclusions to the Board. TheAudit Committeehas carried out these actions for the 2010 financial year. |
Joint ventures and associates, which BT does not control, have not been dealt with as part of the group risk management process and are responsible for their own internal control assessment.
The Board has approved the formal statement of matters which are reserved to it for consideration, approval or oversight. It has also approved the group’s corporate governance framework, which sets out the high level principles by which BT is managed and the responsibilities and powers of theOperating Committeeand the group’s senior executives. As part of this framework, the development and implementation of certain powers relating to group-wide policies and practices are reserved to identified senior executives.
In the 2009 financial year, we undertook a comprehensive re-evaluation of our management of major contracts and as a result have implemented enhanced due diligence in contract bidding, a new governance structure to monitor contract delivery and to identify commercial, financial or operational risks, and greater focus on managing the cost base including our key suppliers. An independent contract review team now undertakes reviews of our most significant contracts and monitors compliance with our governance standards. These further developments in our management of contract risk have applied throughout the 2010 financial year.
US Sarbanes-Oxley Act of 2002
BT has securities registered with the US Securities and Exchange Commission (SEC). As a result, we must comply with those provisions of the Sarbanes-Oxley Act applicable to foreign issuers.
80 BT GROUP PLCANNUAL REPORT & FORM 20-F
Table of Contents
REPORT OF THE DIRECTORSBUSINESS POLICIES
We comply with the legal and regulatory requirements introduced pursuant to this legislation, in so far as they are applicable. It is the opinion of the Board that theAudit Committeeincludes in the person of Phil Hodkinson a member who is an ‘audit committee financial expert’ and who is independent (as defined for this purpose). The Board considers that the Committee’s members generally have broad commercial knowledge and extensive business leadership experience, having held – between them – various prior roles in major business, government, financial management, treasury and financial function supervision and that this constitutes a broad and suitable mix of business, financial, management and IT experience on the Committee. The code of ethics adopted for the purposes of the Sarbanes-Oxley Act is posted on the company’s website atwww.bt.com/ethics The code applies to the Chief Executive, Group Finance Director and senior finance managers.
Disclosure controls and procedures
The Chief Executive and Group Finance Director, after evaluating the effectiveness of BT’s disclosure controls and procedures as of the end of the period covered by this Annual Report & Form 20-F, have concluded that, as of such date, BT’s disclosure controls and procedures were effective to ensure that material information relating to BT was made known to them by others within the group. The Chief Executive and Group Finance Director have also provided the certifications required by the Sarbanes-Oxley Act.
Internal control over financial reporting
BT’s management is responsible for establishing and maintaining adequate internal control over financial reporting for the group including the consolidation process. Internal control over financial reporting is designed to provide reasonable assurance regarding the reliability of financial reporting and the preparation of financial statements for external reporting purposes in accordance with IFRS. Management conducted an assessment of the effectiveness of internal control over financial reporting based on the framework for internal control evaluation contained in the Turnbull Guidance.
Based on this assessment, management has concluded that as at 31 March 2010, BT’s internal control over financial reporting was effective.
There were no changes in BT’s internal control over financial reporting that occurred during the 2010 financial year that have materially affected, or are reasonably likely to have materially affected, the group’s internal control over financial reporting. Any significant deficiency, as defined by the US Public Company Accounting Oversight Board (PCAOB), in internal control over financial reporting, is reported to theAudit Committee.
PricewaterhouseCoopers LLP, which has audited the consolidated financial statements for the 2010 financial year, has also audited the effectiveness of the group’s internal control over financial reporting under Auditing Standard No. 5 of the PCAOB. Their report is on page 86.
BT GROUP PLCANNUAL REPORT & FORM 20-F 81
Table of Contents
REPORT OF THE DIRECTORS
SHAREHOLDERS AND ANNUAL GENERAL MEETING
Relations with shareholders
Senior executives, led by the Chief Executive and the Group Finance Director and including, as appropriate, the other executive directors, hold meetings with BT’s institutional shareholders and prospective shareholders to discuss BT’s strategy, financial performance and prospects. The Chairman also meets with major shareholders, at their request, during the year. This may also include meetings to discuss overall remuneration policies and governance issues. All non-executive directors have an invitation to attend investors’ meetings if they wish and during the year the Senior Independent Director has held meetings with major institutional shareholders about governance and remuneration policy matters. Contact with institutional shareholders (and with financial analysts, brokers and the media) is controlled by written guidelines to ensure the protection of inside information that has not already been made generally available to the market. The directors are provided with reports and other written briefings on shareholders’ and analysts’ views and are regularly informed by the Company Secretary about the holdings of the principal shareholders. The Company Secretary also surveys individual shareholders about the quality of our shareholder communications and a survey of BT’s institutional shareholders and analysts has recently been carried out by an independent third party.
Established procedures ensure the timely release of inside information and the publication of financial results and regulatory financial statements. All external announcements are also reviewed for accuracy and compliance requirements by a committee of senior executives, the Disclosure Committee, which is chaired by the Company Secretary.
Substantial shareholdings
At 12 May 2010, BT had received notifications, under the Disclosure and Transparency Rules issued by the Financial Services Authority, in respect of the following holdings of shares representing percentage holdings of BT’s total voting rights as shown:
| Shares | % of total voting rights | |||||||
| Invesco Limited | 780,354,826 | 10.06 | ||||||
| BlackRock Inc | 381,255,769 | 4.92 | ||||||
| Barclays PLC | 360,935,363 | 4.65 | ||||||
| AXA S.A. | 359,297,926 | 4.63 | ||||||
| Legal & General Group PLC | 309,597,603 | 3.99 | ||||||
| Norges Bank | 240,354,001 | 3.09 | ||||||
AGM resolutions
We are continuing our policy that shareholders vote on the annual report at the AGM. Shareholders will also again be asked to vote separately on theReport on directors’ remuneration.
It is part of our policy to involve shareholders fully in the affairs of the company and to give them the opportunity at the AGM to ask questions about BT’s activities and prospects. We also give shareholders the opportunity to vote on every substantially different issue by proposing a separate resolution for each issue. The proxy votes for and against each resolution, as well as votes withheld, will be counted before the AGM and the results will be made available at the meeting. As at the 2009 AGM, votes on all matters at the 2010 AGM, except procedural issues, will be taken on a poll. Every vote cast, whether in person or by proxy at the meeting will be counted. The outcome of voting on the resolutions will be posted on our website as soon as possible after the meeting. It is our policy for all directors to attend the AGM if at all possible. Whilst, because of ill health or other pressing reasons, this may not always be possible, in normal circumstances this means that the chairmen of theAudit,NominatingandRemunerationcommittees are at the AGM and are available to answer relevant questions. All the directors attended the 2009 AGM.
The resolutions to be proposed at the 2010 AGM at the BT Convention Centre, Liverpool on 22 July, together with explanatory notes, appear in the separateSummary financial statement & notice of meeting 2010which is sent to all shareholders who have requested a copy. Copies of this annual report are sent only to shareholders who have requested or request a copy. All shareholders are notified of the publication of these documents which are sent out in the most cost-effective way. We aim to give as much notice of our AGM as possible and at least 21 clear days’ notice, as required by our articles of association. In practice, these documents are being sent to shareholders more than 20 working days before the AGM.
Resolutions to re-appoint PricewaterhouseCoopers LLP as BT’s auditors and to authorise the directors to agree their remuneration will also be proposed at the AGM.
The presentation made by the Chairman and the Chief Executive will be broadcast live on the internet atwww.bt.com/btagm2010and will be available after the AGM.
Authority to purchase shares
The authority given at last year’s AGM of the company held on 15 July 2009 for BT to purchase in the market 774m of its shares, representing 10% of the issued share capital, expires on 14 October 2010. Shareholders will be asked to give a similar authority at the AGM.
During the 2010 financial year, 8m treasury shares were transferred to meet BT’s obligations under our employee share plans. At 12 May 2010 a total of 397m shares were retained as treasury shares. All the shares were purchased in an on-market programme of buying back BT shares, started in November 2003. The programme was suspended with effect from 31 July 2008.
By order of the Board
Andrew Parker
12 May 2010
82 BT GROUP PLCANNUAL REPORT & FORM 20-F
Table of Contents
FINANCIAL STATEMENTS
BT GROUP PLCANNUAL REPORT & FORM 20-F 83
Table of Contents
FINANCIAL STATEMENTS
STATEMENT OF DIRECTORS’ RESPONSIBILITIES
The directors are responsible for preparing the Annual Report, the Report on directors’ remuneration and the financial statements in accordance with applicable law and regulations.
Company law requires the directors to prepare financial statements for each financial year. Under that law the directors have elected to prepare the consolidated financial statements in accordance with International Financial Reporting Standards (IFRSs) as adopted by the European Union, and the parent company financial statements in accordance with United Kingdom Generally Accepted Accounting Practice (United Kingdom Accounting Standards and applicable law). In preparing the consolidated financial statements, the directors have also elected to comply with IFRSs, issued by the International Accounting Standards Board (IASB). Under company law the directors must not approve the financial statements unless they are satisfied that they give a true and fair view of the state of affairs of the group and the company and of the profit or loss of the group for that period. In preparing these financial statements, the directors are required to:
| 4 | select suitable accounting policies and then apply them consistently; | |
| 4 | make judgements and accounting estimates that are reasonable and prudent; | |
| 4 | state whether IFRSs as adopted by the European Union and IFRSs issued by IASB and applicable UK Accounting Standards have been followed, subject to any material departures disclosed and explained in the consolidated and parent company financial statements respectively; and | |
| 4 | prepare the financial statements on the going concern basis unless it is inappropriate to presume that the company will continue in business. |
The directors are responsible for keeping adequate accounting records that are sufficient to show and explain the company’s transactions and disclose with reasonable accuracy at any time the financial position of the company and the group and enable them to ensure that the financial statements and the Report on directors’ remuneration comply with the Companies Act 2006 and, as regards the consolidated financial statements, Article 4 of the IAS Regulation. They are also responsible for safeguarding the assets of the company and the group and hence for taking reasonable steps for the prevention and detection of fraud and other irregularities.
Each of the directors, whose names and functions are listed on pages 58 to 59 confirm that, to the best of their knowledge:
| 4 | the consolidated financial statements, which have been prepared in accordance with IFRSs as adopted by the European Union, give a true and fair view of the assets, liabilities, financial position and profit of the group; and | |
| 4 | the Report of the directors on pages 57 to 82 includes a fair review of the development and performance of the business and the position of the group, together with a description of the principal risks and uncertainties that it faces. |
84 BT GROUP PLCANNUAL REPORT & FORM 20-F
Table of Contents
FINANCIAL STATEMENTS
REPORT OF THE INDEPENDENT AUDITORS – CONSOLIDATED FINANCIAL STATEMENTS
United Kingdom opinion
We have audited the consolidated financial statements of BT Group plc for the year ended 31 March 2010 which comprise the Group income statement, the Group statement of comprehensive income, the Group statement of changes in equity, the Group cash flow statement, the Group balance sheet, the Accounting policies and the related notes. The financial reporting framework that has been applied in their preparation is applicable law and International Financial Reporting Standards (IFRSs) as adopted by the European Union.
Respective responsibilities of directors and auditors
As explained more fully in the Statement of directors’ responsibilities set out on page 84, the directors are responsible for the preparation of the consolidated financial statements and for being satisfied that they give a true and fair view. Our responsibility is to audit the consolidated financial statements in accordance with applicable law and International Standards on Auditing (UK and Ireland). Those standards require us to comply with the Auditing Practices Board’s Ethical Standards for Auditors.
This report, including the opinions, has been prepared for and only for the company’s members as a body in accordance with Chapter 3 of Part 16 of the Companies Act 2006 and for no other purpose. We do not, in giving these opinions, accept or assume responsibility for any other purpose or to any other person to whom this report is shown or into whose hands it may come save where expressly agreed by our prior consent in writing.
Scope of the audit of the financial statements
An audit involves obtaining evidence about the amounts and disclosures in the financial statements sufficient to give reasonable assurance that the financial statements are free from material misstatement, whether caused by fraud or error. This includes an assessment of: whether the accounting policies are appropriate to the group’s circumstances and have been consistently applied and adequately disclosed; the reasonableness of significant accounting estimates made by the directors; and the overall presentation of the financial statements.
Opinion on financial statements
In our opinion the consolidated financial statements:
| 4 | give a true and fair view of the state of the group’s affairs as at 31 March 2010 and of its profit and cash flows for the year then ended; | |
| 4 | have been properly prepared in accordance with IFRSs as adopted by the European Union; and | |
| 4 | have been prepared in accordance with the requirements of the Companies Act 2006 and Article 4 of the IAS Regulation. |
Separate opinion in relation to IFRSs as issued by the IASB
As explained in the accounting policies for the consolidated financial statements the group, in addition to complying with its legal obligation to apply IFRSs as adopted by the European Union, has also applied IFRSs as issued by the International Accounting Standards Board (IASB).
In our opinion the consolidated financial statements comply with IFRSs as issued by the IASB.
Opinion on other matters prescribed by the Companies Act 2006
In our opinion the information given in the Report of the directors for the financial year for which the consolidated financial statements are prepared is consistent with the consolidated financial statements.
Matters on which we are required to report by exception
We have nothing to report in respect of the following:
Under the Companies Act 2006 we are required to report to you if, in our opinion:
| 4 | certain disclosures of directors’ remuneration specified by law are not made; or | |
| 4 | we have not received all the information and explanations we require for our audit. |
Under the Listing Rules we are required to review:
| 4 | the directors’ statement, set out on page 54, in relation to going concern; and | |
| 4 | the part of the Corporate Governance Statement relating to the company’s compliance with the nine provisions of the June 2008 Combined Code specified for our review. |
Other matter
We have reported separately on the parent company financial statements of BT Group plc for the year ended 31 March 2010 and on the information in the Report on directors’ remuneration that is described as having been audited.
Philip Rivett (Senior Statutory Auditor)
for and on behalf of PricewaterhouseCoopers LLP
Chartered Accountants and Statutory Auditors
London, United Kingdom
12 May 2010
for and on behalf of PricewaterhouseCoopers LLP
Chartered Accountants and Statutory Auditors
London, United Kingdom
12 May 2010
BT GROUP PLCANNUAL REPORT & FORM 20-F 85
Table of Contents
FINANCIAL STATEMENTSREPORT OF THE INDEPENDENT AUDITORS – CONSOLIDATED FINANCIAL STATEMENTS
United States opinion
Report of Independent Registered Public Accounting Firm to the Board of Directors and Shareholders of BT Group plc (the ‘company’)
In our opinion, the accompanying Group income statements, Group statements of comprehensive income, Group statements of changes in equity, Group cash flow statements and Group balance sheets present fairly, in all material respects, the financial position of BT Group plc and its subsidiaries at 31 March 2010 and 2009 and the results of their operations and cash flows for each of the three years in the period ended 31 March 2010, in conformity with International Financial Reporting Standards (IFRSs) as issued by the International Accounting Standards Board. Also, in our opinion the company maintained, in all material respects, effective internal control over financial reporting as of 31 March 2010, based on criteria established in the Turnbull Guidance.
The company’s management is responsible for these financial statements, for maintaining effective internal control over financial reporting and for its assessment of the effectiveness of internal control over financial reporting, included in management’s evaluation of the effectiveness of internal control over financial reporting as set out in the first three paragraphs of Internal control over financial reporting in the Report of the directors, Business Policies of the Form 20-F.
Our responsibility is to express opinions on these financial statements and on the company’s internal control over financial reporting based on our integrated audits. We conducted our audits in accordance with the standards of the Public Company Accounting Oversight Board (United States). Those standards require that we plan and perform the audits to obtain reasonable assurance about whether the financial statements are free of material misstatement and whether effective internal control over financial reporting was maintained in all material respects.
Our audits of the financial statements included examining, on a test basis, evidence supporting the amounts and disclosures in the financial statements, assessing the accounting principles used and significant estimates made by management, and evaluating the overall financial statement presentation. Our audit of internal control over financial reporting included obtaining an understanding of internal control over financial reporting, assessing the risk that a material weakness exists, and testing and evaluating the design and operating effectiveness of internal control based on the assessed risk. Our audits also included performing such other procedures as we considered necessary in the circumstances. We believe that our audits provide a reasonable basis for our opinions.
As disclosed in note 30 to the consolidated financial statements, the company adopted an amendment to IFRS 2 ‘Share-based payment’ and accordingly changed the manner in which it accounts for vesting conditions and cancellations.
A company’s internal control over financial reporting is a process designed to provide reasonable assurance regarding the reliability of financial reporting and the preparation of financial statements for external purposes in accordance with generally accepted accounting principles. A company’s internal control over financial reporting includes those policies and procedures that (i) pertain to the maintenance of records that, in reasonable detail, accurately and fairly reflect the transactions and dispositions of the assets of the company; (ii) provide reasonable assurance that transactions are recorded as necessary to permit preparation of financial statements in accordance with generally accepted accounting principles, and that receipts and expenditures of the company are being made only in accordance with authorisations of management and directors of the company; and (iii) provide reasonable assurance regarding prevention or timely detection of unauthorised acquisition, use, or disposition of the company’s assets that could have a material effect on the financial statements.
Because of its inherent limitations, internal control over financial reporting may not prevent or detect misstatements. Also, projections of any evaluation of effectiveness to future periods are subject to the risk that controls may become inadequate because of changes in conditions, or that the degree of compliance with the policies or procedures may deteriorate.
PricewaterhouseCoopers LLP
London, United Kingdom
12 May 2010
London, United Kingdom
12 May 2010
86 BT GROUP PLCANNUAL REPORT & FORM 20-F
Table of Contents
FINANCIAL STATEMENTS
CONSOLIDATED FINANCIAL STATEMENTS
Accounting policies
(i) Basis of preparation and presentation of the financial statements
Compliance with applicable law and IFRS
These consolidated financial statements have been prepared in accordance with the Companies Act 2006, Article 4 of the IAS Regulation and International Accounting Standards (IAS) and International Financial Reporting Standards (IFRS) and related interpretations, as adopted by the European Union. The consolidated financial statements are also in compliance with IFRS as issued by the International Accounting Standards Board.
Accounting convention
The consolidated financial statements have been prepared under the historical cost convention, modified for the revaluation of certain financial assets and liabilities at fair value.
Presentation of specific items
The group’s income statement and segmental analysis separately identify trading results before significant one-off or unusual items (termed ‘specific items’). This is consistent with the way that financial performance is measured by management and reported to the Board and theOperating Committeeand assists in providing a meaningful analysis of the trading results of the group. The directors believe that presentation of the group’s results in this way is relevant to an understanding of the group’s financial performance as specific items are significant one-off or unusual in nature and have little predictive value. Furthermore, the group considers a columnar presentation to be appropriate, as it improves the clarity of the presentation and is consistent with the way that financial performance is measured by management and reported to the Board and theOperating Committee. Specific items may not be comparable to similarly titled measures used by other companies. Items which have been considered to be significant one-off or unusual in nature include disposals of businesses and investments, business restructuring programmes, asset impairment charges, property rationalisation programmes and the settlement of multiple tax years in a single settlement. Specific items for the current and prior years are disclosed in note 5.
Critical accounting estimates and key judgements
The preparation of financial statements in conformity with generally accepted accounting principles requires management to make estimates and assumptions that affect the reported amounts of assets and liabilities and disclosure of contingent assets and liabilities at the date of the financial statements and the reported amounts of revenue and expenses during the reporting period. Actual results could differ from those estimates. The areas involving a higher degree of judgement or complexity, or areas where assumptions and estimates are significant to the consolidated financial statements are disclosed on pages 93 and 94 in‘Critical accounting estimates and key judgements’.
Implementation of new accounting standards
With effect from 1 April 2009, the group adopted the amendment to IFRS 2 ‘Share-based payment – Vesting Conditions and Cancellations’, IFRS 8 ‘Operating Segments’, IAS 1 (Revised) ‘Presentation of Financial Statements’, IAS 23 (Revised) ‘Borrowing costs’, minor amendments to a number of other accounting standards and several new interpretations. The adoption of the amendment to IFRS 2 and IAS 1 (Revised) has resulted in the restatement of comparative information. Further details are provided on pages 94 and 95.
Composition of the group
The group’s principal operating subsidiaries and associate are detailed on page 149.
(ii) Basis of consolidation
The group financial statements consolidate the financial statements of BT Group plc (‘the company’) and its subsidiaries, and they incorporate its share of the results of joint ventures and associates using the equity method of accounting.
| 4 | A subsidiary is an entity that is controlled by another entity, known as the parent. Control is the power to govern the financial and operating policies of an entity so as to obtain benefits from its activities. | |
| 4 | A joint venture is an entity that is jointly controlled by two or more entities. Joint control is the contractually agreed sharing of control over an economic activity, and exists only when the strategic financial and operating decisions relating to the activity require the unanimous consent of the parties sharing control. | |
| 4 | An associate is an entity over which another entity has significant influence and that is neither a subsidiary nor an interest in a joint venture. Significant influence is the power to participate in the financial and operating policy decisions of an entity but is not control or joint control over those policies. |
The results of subsidiaries acquired or disposed of during the year are consolidated from and up to the date of change of control. Where necessary, adjustments are made to the financial statements of subsidiaries, associates and joint ventures to bring the accounting policies used in line with those used by the group. All intra group transactions, balances, income and expenses are eliminated on consolidation.
Investments in associates and joint ventures are initially recognised at cost. Subsequent to acquisition, the carrying value of the group’s investment in associates and joint ventures includes the group’s share of post acquisition reserves, less any impairment in the value of individual assets. The income statement reflects the group’s share of the results of operations after tax of the associate or joint venture.
(iii) Revenue
Revenue represents the fair value of the consideration received or receivable for communication services and equipment sales, net of discounts and sales taxes. Revenue from the rendering of services and sale of equipment is recognised when it is probable that the economic benefits associated with a transaction will flow to the group and the amount of revenue and associated costs can be measured reliably. Where the group acts as an agent in a transaction, it recognises revenue net of directly attributable costs.
Services
Revenue arising from separable installation and connection services is recognised when it is earned, upon activation. Revenue from the rental of analogue and digital lines and private circuits is recognised evenly over the period to which the charges relate. Revenue from calls is recognised at the time the call is made over the group’s network.
Subscription fees, consisting primarily of monthly charges for access to broadband and other internet access or voice services, are recognised as revenue as the service is provided. Revenue arising from the interconnection of voice and data traffic between other telecommunications operators is recognised at the time of transit across the group’s network.
BT GROUP PLCANNUAL REPORT & FORM 20-F 87
Table of Contents
FINANCIAL STATEMENTSCONSOLIDATED FINANCIAL STATEMENTS
Equipment sales
Revenue from the sale of peripheral and other equipment is recognised when all the significant risks and rewards of ownership are transferred to the buyer, which is normally the date the equipment is delivered and accepted by the customer.
Long-term contractual arrangements
Revenue from long-term contractual arrangements is recognised based on the percentage of completion method. The stage of completion is estimated using an appropriate measure according to the nature of the contract. For long-term services contracts, revenue is recognised on a straight line basis over the term of the contract. However, if the performance pattern is other than straight line, revenue is recognised as services are provided, usually on an output or consumption basis. For fixed price contracts, including contracts to design and build software solutions, revenue is recognised by reference to the stage of completion, as determined by the proportion of costs incurred relative to the estimated total contract costs, or other measures of completion such as the achievement of contract milestones and customer acceptance. In the case of time and materials contracts, revenue is recognised as the service is rendered.
Costs related to delivering services under long-term contractual arrangements are expensed as incurred. An element of costs incurred in the initial set up, transition or transformation phase of the contract are deferred and recorded within non current assets. These costs are then recognised in the income statement on a straight line basis over the remaining contractual term, unless the pattern of service delivery indicates a different profile is appropriate. These costs are directly attributable to specific contracts, relate to future activity, will generate future economic benefits and are assessed for recoverability on a regular basis.
The percentage of completion method relies on estimates of total expected contract revenues and costs, as well as reliable measurement of the progress made towards completion. Unless the financial outcome of a contract can be estimated with reasonable certainty, no attributable profit is recognised. In such circumstances, revenue is recognised equal to the costs incurred to date, to the extent that such revenue is expected to be recoverable. Recognised revenue and profits are subject to revisions during the contract if the assumptions regarding the overall contract outcome are changed. The cumulative impact of a revision in estimates is recorded in the period in which such revisions become likely and can be estimated. Where the actual and estimated costs to completion exceed the estimated revenue for a contract, the full contract life loss is recognised immediately.
Where a contractual arrangement consists of two or more separate elements that have value to a customer on a standalone basis, revenue is recognised for each element as if it were an individual contract. The total contract consideration is allocated between the separate elements on the basis of relative fair value and the appropriate revenue recognition criteria are applied to each element as described above.
(iv) Other operating income
Other operating income is income generated by the group that arises from activities outside of the provision of communication services and equipment sales. Items reported as other operating income include income from repayment works, proceeds from scrap and cable recovery, income generated by our fleet operations, income from government grants, profits and losses on the disposal of business operations and property, plant and equipment and income generated from the exploitation of our intellectual property.
(v) Government grants
Government grants are recognised initially as deferred income at their fair value where there is a reasonable assurance that the grant will be received and the group will comply with the conditions associated with the grant. Grants that compensate the group for expenses incurred are recognised in the income statement within other operating income in the same periods in which the associated expenditure is recognised. Grants that compensate the group for the cost of an asset are recognised in the income statement on a straight line basis over the useful life of the asset.
(vi) Leases
The determination of whether an arrangement is, or contains, a lease is based on the substance of the arrangement and requires an assessment of whether the fulfilment of the arrangement is dependent on the use of a specific asset or assets and whether the arrangement conveys the right to use the asset.
Leases of property, plant and equipment where the group holds substantially all the risks and rewards of ownership are classified as finance leases.
Finance lease assets are capitalised at the commencement of the lease term at the lower of the present value of the minimum lease payments or the fair value of the leased asset. The obligations relating to finance leases, net of finance charges in respect of future periods, are recognised as liabilities. Leases are subsequently measured at amortised cost using the effective interest method. If a sale and leaseback transaction results in a finance lease, any excess of sale proceeds over the carrying amount is deferred and recognised in the income statement over the lease term.
Leases where a significant portion of the risks and rewards are held by the lessor are classified as operating leases. Rentals are charged to the income statement on a straight line basis over the period of the lease. If a sale and leaseback transaction results in an operating lease, any profit or loss is recognised in the income statement immediately, except where a proportion of the profit or loss is deferred or amortised because the sale price was not equal to fair value.
(vii) Foreign currencies
Items included in the financial statements of each of the group’s subsidiaries are measured using the currency of the primary economic environment in which the entity operates (the functional currency). The consolidated financial statements are presented in Sterling, the presentation currency of the group.
Foreign currency transactions are translated into the functional currency using the exchange rates prevailing at the date of the transaction. Foreign exchange gains and losses resulting from the settlement of such transactions and from the translation of monetary assets and liabilities denominated in foreign currencies at period end exchange rates are recognised in the income statement in the line which most appropriately reflects the nature of the item or transaction. Where monetary items form part of the net investment in a foreign operation and are designated as hedges of a net investment or as cash flow hedges, such exchange differences are recognised in equity.
On consolidation, assets and liabilities of foreign undertakings are translated into Sterling at year end exchange rates. The results of foreign undertakings are translated into Sterling at average rates of exchange for the year (unless this average is not a reasonable approximation of the cumulative effects of the rates prevailing on the transaction dates, in which case income and expenses are translated at the dates of the transactions). Foreign exchange differences arising on retranslation are recognised directly in a separate component of equity, the translation reserve.
88 BT GROUP PLCANNUAL REPORT & FORM 20-F
Table of Contents
FINANCIAL STATEMENTSCONSOLIDATED FINANCIAL STATEMENTS
In the event of the disposal of an undertaking with assets and liabilities denominated in a foreign currency, the cumulative translation difference associated with the undertaking in the translation reserve is charged or credited to the gain or loss on disposal recognised in the income statement.
(viii) Business combinations
The purchase method of accounting is used for the acquisition of subsidiaries, in accordance with IFRS 3 ‘Business Combinations’. On transition to IFRS, the group elected not to apply IFRS 3 retrospectively to acquisitions that occurred before 1 April 2004. Goodwill arising on the acquisition of subsidiaries is therefore treated as follows:
| 4 | Goodwill which arose after 1 April 2004: included in the balance sheet at original cost, less any provisions for impairment. This goodwill is not amortised. | |
| 4 | Goodwill which arose between 1 January 1998 and 1 April 2004: included in the balance sheet at original cost, less accumulated amortisation to the date of transition to IFRS and less any provisions for impairment. This goodwill is not amortised after the date of transition to IFRS. | |
| 4 | Goodwill which arose before 1 January 1998: written off directly to retained earnings. |
On acquisition of a subsidiary, fair values are attributed to the identifiable net tangible and intangible assets acquired. The excess of the cost of the acquisition over the fair value of the group’s share of the identifiable net assets acquired is recorded as goodwill. If the cost of the acquisition is less than the fair value of the group’s share of the identifiable net assets acquired, the difference is recognised directly in the income statement. On disposal of a subsidiary, the gain or loss on disposal includes the carrying amount of goodwill relating to the subsidiary sold. Goodwill previously written off to retained earnings is not recycled to the income statement on disposal of the related subsidiary.
(ix) Intangible assets
Identifiable intangible assets are recognised when the group controls the asset, it is probable that future economic benefits attributable to the asset will flow to the group and the cost of the asset can be reliably measured. All intangible assets, other than goodwill and indefinite lived assets, are amortised over their useful economic life. The method of amortisation reflects the pattern in which the assets are expected to be consumed. If the pattern cannot be determined reliably, the straight line method is used.
Goodwill
Goodwill represents the excess of the cost of an acquisition over the fair value of the group’s share of the identifiable net assets (including intangible assets) of the acquired subsidiary. Goodwill is reviewed annually for impairment and carried at cost less accumulated impairment losses.
Computer software
Computer software comprises computer software purchased from third parties, and also the cost of internally developed software. Computer software purchased from third parties and internally developed software is initially recorded at cost.
Telecommunication licences
Licence fees paid to governments, which permit telecommunication activities to be operated for defined periods, are initially recorded at cost and amortised from the time the network is available for use to the end of the licence period.
Brands, customer lists and customer relationships
Intangible assets acquired through business combinations are recorded at fair value at the date of acquisition. Assumptions are used in estimating the fair values of acquired intangible assets and include management’s estimates of revenue and profits to be generated by the acquired businesses.
Subscriber acquisition costs
Subscriber acquisition costs are expensed as incurred, unless they meet the criteria for capitalisation, in which case they are capitalised and amortised over the shorter of the expected customer life or contractual period.
Estimated useful economic lives
The estimated useful economic lives assigned to the principal categories of intangible assets are as follows:
| 4 | Computer software | 2 to 5 years | ||
| 4 | Telecommunication licences | 1 to 5 years | ||
| 4 | Brands, customer lists and customer relationships | 3 to 15 years |
(x) Research and development
Research expenditure is recognised in the income statement in the period in which it is incurred.
Development expenditure, including the cost of internally developed software, is recognised in the income statement in the period in which it is incurred unless it is probable that economic benefits will flow to the group from the asset being developed, the cost of the asset can be reliably measured and technical feasibility can be demonstrated. Capitalisation ceases when the asset being developed is ready for use.
Research and development costs include direct labour, contractors’ charges, materials and directly attributable overheads.
(xi) Property, plant and equipment
Property, plant and equipment is included in the balance sheet at historical cost, less accumulated depreciation and any impairment losses. On disposal of property, plant and equipment, the difference between the sale proceeds and the net book value at the date of disposal is recorded in the income statement.
Cost
Included within the cost for network infrastructure and equipment are direct labour, contractors’ charges, materials and directly attributable overheads.
Depreciation
Depreciation is provided on property, plant and equipment on a straight line basis from the time the asset is available for use, so as to write off the asset’s cost over the estimated useful life taking into account any expected residual value. Freehold land is not subject to depreciation. The lives assigned to principal categories of assets are as follows:
| 4 | Land and buildings | |||
| Freehold buildings | 40 years | |||
| Leasehold land and buildings | Unexpired portion of lease or 40 years, whichever is the shorter |
BT GROUP PLCANNUAL REPORT & FORM 20-F 89
Table of Contents
FINANCIAL STATEMENTSCONSOLIDATED FINANCIAL STATEMENTS
| 4 | Network infrastructure and equipment | |||
| Transmission equipment: | ||||
| Duct | 40 years | |||
| Cable | 3 to 25 years | |||
| Fibre | 5 to 20 years | |||
| Exchange equipment | 2 to 13 years | |||
| Payphones and other network equipment | 2 to 20 years | |||
| 4 | Other | |||
| Motor vehicles | 2 to 9 years | |||
| Computers and office equipment | 3 to 6 years |
Assets held under finance leases are depreciated over the shorter of the lease term or their useful economic life. Residual values and useful lives are reassessed annually and, if necessary, changes are recognised prospectively.
(xii) Borrowing costs
In respect of borrowing costs relating to qualifying assets for which the commencement date for capitalisation is on or after 1 April 2009, and which take more than 12 months to complete, the group capitalises borrowing costs during the construction phase as part of the cost of that asset. Previously, the group immediately recognised all borrowing costs as an expense in the income statement. The change in accounting policy was due to the adoption of IAS 23 ‘Borrowing Costs (Revised)’.
(xiii) Asset impairment (non financial assets)
Intangible assets with finite useful lives and property, plant and equipment are tested for impairment if events or changes in circumstances (assessed at each reporting date) indicate that the carrying amount may not be recoverable. When an impairment test is performed, the recoverable amount is assessed by reference to the higher of the net present value of the expected future cash flows (value in use) of the relevant cash generating unit and the fair value less cost to sell.
Goodwill and intangible assets with indefinite useful lives are reviewed for impairment at least annually.
Impairment losses are recognised in the income statement.
If a cash generating unit is impaired, provision is made to reduce the carrying amount of the related assets to their estimated recoverable amount, normally as a specific item. Impairment losses are allocated firstly against goodwill, and secondly on a pro rata basis against intangible and other assets.
Where an impairment loss has been recognised against an asset, it may be reversed in future periods where there has been a change in the estimates used to determine the recoverable amount since the last impairment loss was recognised, but only to the extent that the asset’s carrying amount does not exceed the carrying amount that would have been determined, net of depreciation or amortisation, if no impairment loss had been recognised. This does not apply for goodwill, for which an impairment loss may not be reversed in any circumstances.
(xiv) Inventory
Inventory mainly comprises items of equipment held for sale or rental and consumable items.
Equipment held and consumable items are stated at the lower of cost and estimated net realisable value, after provisions for obsolescence. Cost is calculated on a first-in-first-out basis.
(xv) Termination benefits
Termination benefits (leaver costs) are payable when employment is terminated before the normal retirement date, or when an employee accepts voluntary redundancy in exchange for these benefits. The group recognises termination benefits when it is demonstrably committed to the affected employees leaving the group.
(xvi) Post retirement benefits
The group operates a funded defined benefit pension plan, which is administered by an independent Trustee, for the majority of its employees.
The group’s obligation in respect of defined benefit pension plans is calculated separately for each scheme by estimating the amount of future benefit that employees have earned in return for their service to date. That benefit is discounted to determine its present value, and the fair value of any plan assets is deducted to arrive at the net pension obligation or asset. The discount rate used is the yield at the balance sheet date on AA credit rated bonds that have maturity dates approximating the terms of the group’s obligations. The calculation is performed by a qualified actuary using the projected unit credit method. The net obligation or asset recognised in the balance sheet is the present value of the defined benefit obligation less the fair value of the plan assets.
The income statement charge is allocated between an operating charge and net finance expense or income. The operating charge reflects the service cost which is spread systematically over the working lives of the employees. The net finance charge reflects the unwinding of the discount applied to the liabilities of the plan, offset by the expected return on the assets of the plan, based on conditions prevailing at the start of the year.
Actuarial gains and losses are recognised in full in the period in which they occur and are presented in the statement of comprehensive income.
Actuarial valuations of the main defined benefit plan are carried out by an independent actuary as determined by the Trustee at intervals of not more than three years, to determine the rates of contribution payable. The pension cost is determined on the advice of the group’s actuary, having regard to the results of these Trustee valuations. In any intervening years, the actuaries review the continuing appropriateness of the contribution rates.
The group also operates defined contribution pension schemes and the income statement is charged with the contributions payable.
(xvii) Share-based payment
The group operates a number of equity settled share-based payment arrangements, under which the group receives services from employees as consideration for equity instruments (share options and shares) of the group. Equity settled share-based payments are measured at fair value (excluding the effect of non market-based vesting conditions) at the date of grant, but including any market-based performance criteria and the impact of non-vesting conditions (for example the requirement for employees to save). The fair value determined at the grant date is recognised on a straight-line basis over the vesting period, based on the group’s estimate of the options or shares that will eventually vest and adjusted for the effect of non market-based vesting conditions.
Fair value is measured using either the Binomial pricing model or the Monte Carlo model, whichever is most appropriate to the award.
The group adopted IFRS 2 ‘Share-based payment – vesting conditions and cancellations’, with effect from 1 April 2009. The amendment clarifies that only service and performance conditions are vesting conditions. Any other conditions are non-vesting conditions which have to be taken into account to determine the fair value of equity instruments granted. In the case that an award or option does not vest as a result of a failure to meet a non-vesting condition that is within the control of either counterparty, this is accounted for as a cancellation. Cancellations must be treated as
90 BT GROUP PLCANNUAL REPORT & FORM 20-F
Table of Contents
FINANCIAL STATEMENTSCONSOLIDATED FINANCIAL STATEMENTS
accelerated vesting and all remaining future charges are immediately recognised. As the requirement to save under an employee share save arrangement is a non-vesting condition, employee cancellations must be treated as an accelerated vesting.
(xviii) Taxation
Current income tax is calculated on the basis of the tax laws enacted or substantively enacted at the balance sheet date in the countries where the company’s subsidiaries, associates and joint ventures operate and generate taxable income. The group periodically evaluates positions taken in tax returns with respect to situations in which applicable tax regulation is subject to interpretation, and the group establishes provisions where appropriate on the basis of the amounts expected to be paid to tax authorities.
Deferred tax is recognised, using the liability method, in respect of temporary differences between the carrying amount of the group’s assets and liabilities and their tax base, except to the extent that the deferred tax asset or liability arises from the initial recognition of goodwill or from the initial recognition of an asset or liability in a transaction which is not a business combination and affects neither accounting profit nor taxable profit.
Deferred tax liabilities are, where permitted, offset against deferred tax assets within the same taxable entity or qualifying local tax group. Any remaining deferred tax asset is recognised only when, on the basis of all available evidence, it can be regarded as probable that there will be suitable taxable profits, within the same jurisdiction, in the foreseeable future against which the deductible temporary difference can be utilised.
Deferred tax is determined using tax rates that are expected to apply in the periods in which the asset is realised or liability settled, based on tax rates and laws that have been enacted or substantively enacted by the balance sheet date.
Deferred tax is provided on temporary differences arising on investments in subsidiaries, associates and joint ventures, except where the timing of the reversal of the temporary difference can be controlled and it is probable that the temporary difference will not reverse in the foreseeable future.
Current and deferred tax are recognised in the income statement, except when the tax relates to items charged or credited directly in equity, in which case the tax is also recognised in equity.
(xix) Advertising and marketing
The costs associated with the group’s advertising and marketing activities are recognised within other operating costs as incurred.
(xx) Dividends
Final dividends are recognised as a liability in the year in which they are declared and approved by the company’s shareholders in the annual general meeting. Interim dividends are recognised when they are paid.
(xxi) Provisions
Provisions are recognised when the group has a present legal or constructive obligation as a result of past events, it is probable that an outflow of resources will be required to settle the obligation and the amount can be reliably estimated. Provisions are determined by discounting the expected future cash flows at a pre-tax rate that reflects current market assessments of the time value of money and the risks specific to the liability. Financial liabilities within provisions are initially recognised at fair value and subsequently carried at amortised cost using the effective interest method. Onerous lease provisions have been measured at the lower of the cost to fulfil the contract or the cost to exit it.
(xxii) Financial instruments
Recognition and derecognition of financial assets and financial liabilities
Financial assets and financial liabilities are recognised when the group becomes party to the contractual provisions of the instrument. Financial assets are derecognised when the group no longer has rights to cash flows, the risks and rewards of ownership or control of the asset. Financial liabilities are derecognised when the obligation under the liability is discharged, cancelled or expires. In particular, for all regular way purchases and sales of financial assets, the group recognises the financial assets on the settlement date, which is the date on which the asset is delivered to or by the group.
Financial assets
Financial assets at fair value through income statement
A financial asset is classified in this category if acquired principally for the purpose of selling in the short-term (held for trading) or if so designated by management. Financial assets held in this category are initially recognised and subsequently measured at fair value, with changes in value recognised in the income statement in the line which most appropriately reflects the nature of the item or transaction. The direct transaction costs are recognised immediately in the income statement.
A financial asset is classified in this category if acquired principally for the purpose of selling in the short-term (held for trading) or if so designated by management. Financial assets held in this category are initially recognised and subsequently measured at fair value, with changes in value recognised in the income statement in the line which most appropriately reflects the nature of the item or transaction. The direct transaction costs are recognised immediately in the income statement.
Loans and receivables
Loans and receivables are non-derivative financial assets with fixed or determinable payments that are not quoted in an active market other than those for which the group may not recover substantially all of its initial investment, other than because of credit deterioration, which are classified as available-for-sale.
Loans and receivables are initially recognised at fair value plus transaction costs and subsequently carried at amortised cost using the effective interest method, with changes in carrying value recognised in the income statement in the line which most appropriately reflects the nature of the item or transaction.
Available-for-sale financial assets
Non-derivative financial assets classified as available-for-sale are either specifically designated in this category or not classified in any of the other categories. Available-for-sale financial assets are initially recognised at fair value plus direct transaction costs and then re-measured at subsequent reporting dates to fair value, with unrealised gains and losses (except for changes in exchange rates for monetary items, interest, dividends and impairment losses, which are recognised in the income statement) recognised in equity until the financial asset is derecognised, at which time the cumulative gain or loss previously recognised in equity is taken to the income statement, in the line that most appropriately reflects the nature of the item or transaction.
Trade and other receivables
Financial assets within trade and other receivables are initially recognised at fair value, which is usually the original invoiced amount, and are subsequently carried at amortised cost using the effective interest method less provisions made for doubtful receivables.
Provisions are made specifically where there is evidence of a risk of non payment, taking into account ageing, previous losses experienced and general economic conditions.
Cash and cash equivalents
Cash and cash equivalents comprise cash in hand and current balances with banks and similar institutions, which are readily convertible to cash and which are subject to insignificant risk of changes in value and have an original maturity of three months or less.
BT GROUP PLCANNUAL REPORT & FORM 20-F 91
Table of Contents
FINANCIAL STATEMENTSCONSOLIDATED FINANCIAL STATEMENTS
For the purpose of the consolidated cash flow statement, cash and cash equivalents are as defined above net of outstanding bank overdrafts. Bank overdrafts are included within loans and other borrowings, in current liabilities on the balance sheet.
Impairment of financial assets
The group assesses at each balance sheet date whether a financial asset or group of financial assets are impaired.
Where there is objective evidence that an impairment loss has arisen on assets carried at amortised cost, the carrying amount is reduced with the loss being recognised in the income statement. The impairment loss is measured as the difference between that asset’s carrying amount and the present value of estimated future cash flows discounted at the financial asset’s original effective interest rate. The impairment loss is only reversed if it can be related objectively to an event after the impairment was recognised and is reversed to the extent that the carrying value of the asset does not exceed its amortised cost at the date of reversal.
If an available-for-sale asset is impaired, an amount comprising the difference between its cost (net of any principal payment and amortisation) and its fair value is transferred from equity to the income statement. Reversals of impairment losses on debt instruments are taken through the income statement if the increase in fair value of the instrument can be objectively related to an event occurring after the impairment loss was recognised in the income statement. Reversals in respect of equity instruments classified as available-for-sale are recognised directly in equity.
If there is objective evidence that an impairment loss has been incurred on an unquoted equity instrument that is not carried at fair value because its fair value cannot be objectively measured, or on a derivative asset that is linked to and must be settled by delivery of such an unquoted equity instrument, the amount of loss is measured as the difference between the asset’s carrying amount and the present value of estimated future cash flows discounted at the current market rate of return for a similar financial asset.
Financial liabilities
Trade and other payables
Financial liabilities within trade and other payables are initially recognised at fair value, which is usually the original invoiced amount, and subsequently carried at amortised cost using the effective interest method.
Loans and other borrowings
Loans and other borrowings are initially recognised at fair value plus directly attributable transaction costs. Where loans and other borrowings contain a separable embedded derivative, the fair value of the embedded derivative is the difference between the fair value of the hybrid instrument and the fair value of the loan or borrowing. The fair value of the embedded derivative and the loan or borrowing is recorded separately on initial recognition. Loans and other borrowings are subsequently measured at amortised cost using the effective interest method and, if included in a fair value hedge relationship, are revalued to reflect the fair value movements on the hedged risk associated with the loans and other borrowings. The resultant amortisation of fair value movements, on de-designation of the hedge, are recognised in the income statement.
Financial guarantees
Financial guarantees are recognised initially at fair value plus transaction costs and subsequently measured at the higher of the amount determined in accordance with the accounting policy relating to provisions and the amount initially determined less, when appropriate, cumulative amortisation.
Derivative financial instruments
The group uses derivative financial instruments mainly to reduce exposure to foreign exchange risks and interest rate movements. The group does not hold or issue derivative financial instruments for financial trading purposes. However, derivatives that do not qualify for hedge accounting are accounted for as trading instruments.
Derivative financial instruments are classified as held for trading and are initially recognised and subsequently measured at fair value. The gain or loss on re-measurement to fair value is recognised immediately in the income statement in net finance expense. However, where derivatives qualify for hedge accounting, recognition of any resultant gain or loss depends on the nature of the hedge. Derivative financial instruments are classified as current assets or current liabilities where they are not designated in a hedging relationship or have a maturity period within 12 months. Where derivative financial instruments have a maturity period greater than 12 months and are designated in a hedge relationship, they are classified within either non current assets or non current liabilities.
Derivatives embedded in other financial instruments or other host contracts are treated as separate derivatives when their risk and characteristics are not closely related to those of the host contract and the host contract is not carried at fair value. Changes in the fair value of embedded derivatives are recognised in the income statement in the line which most appropriately reflects the nature of the item or transaction.
Hedge accounting
To qualify for hedge accounting, hedge documentation must be prepared at inception and the hedge must be expected to be highly effective both prospectively and retrospectively. The hedge is tested for effectiveness at inception and in subsequent periods in which the hedge remains in operation.
Cash flow hedge
When a financial instrument is designated as a hedge of the variability in cash flows of a recognised asset or liability, or a highly probable transaction, the effective part of any gain or loss on the derivative financial instrument is recognised directly in equity.
For cash flow hedges of recognised assets or liabilities, the associated cumulative gain or loss is removed from equity and recognised in the same line in the income statement in the same period or periods during which the hedged transaction affects the income statement.
For highly probable transactions, when the transaction subsequently results in the recognition of a non financial asset or non financial liability the associated cumulative gain or loss is removed from equity and included in the initial cost or carrying amount of the non financial asset or liability.
If a hedge of a highly probable transaction subsequently results in the recognition of a financial asset or a financial liability, then the associated gains and losses that were recognised directly in equity are reclassified into the income statement in the same period or periods during which the asset acquired or liability assumed affects the income statement.
Any ineffectiveness arising on a cash flow hedge of a recognised asset or liability is recognised immediately in the same income statement line as the hedged item. Where ineffectiveness arises on highly probable transactions, it is recognised in the line which most appropriately reflects the nature of the item or transaction.
Fair value hedge
When a derivative financial instrument is designated as a hedge of the variability in fair value of a recognised asset or liability, or unrecognised firm commitment, the change in fair value of the
92 BT GROUP PLCANNUAL REPORT & FORM 20-F
Table of Contents
FINANCIAL STATEMENTSCONSOLIDATED FINANCIAL STATEMENTS
derivatives that are designated as fair value hedges are recorded in the same line in the income statement, together with any changes in fair value of the hedged asset or liability that is attributable to the hedged risk.
Hedge of net investment in a foreign operation
Exchange differences arising from the retranslation of currency instruments designated as hedges of net investments in a foreign operation are taken to shareholders’ equity on consolidation to the extent that the hedges are deemed effective.
Any ineffectiveness arising on a hedge of a net investment in a foreign operation is recognised in net finance expense.
Discontinuance of hedge accounting
Discontinuance of hedge accounting may occur when a hedging instrument expires or is sold, terminated or exercised, or when the hedge no longer qualifies for hedge accounting or the group revokes designation of the hedge relationship but the hedged financial asset or liability remains or a highly probable transaction is still expected to occur. Under a cash flow hedge, the cumulative gain or loss at that point remains in equity and is recognised in accordance with the above policy when the transaction occurs. If the hedged transaction is no longer expected to take place or the underlying hedged financial asset or liability no longer exists, the cumulative unrealised gain or loss recognised in equity is recognised immediately in the income statement. Under a hedge of a net investment, the cumulative gain or loss remains in equity when the hedging instrument expires or is sold, terminated or exercised, or when the hedge no longer qualifies for hedge accounting or the group revokes designation of the hedge relationship. The cumulative gain or loss is recognised in the income statement as part of the profit on disposal when the net investment in the foreign operation is disposed. Under a fair value hedge, the cumulative gain or loss adjustment associated with the hedged risk is amortised to the income statement using the effective interest method over the remaining term of the hedged item.
Share capital
Ordinary shares are classified as equity. Incremental costs directly attributable to the issue of new shares are shown in equity as a deduction from the proceeds received. Shares in the parent company, BT Group plc, held by employee share ownership trusts and repurchased treasury shares are recorded in the balance sheet as a deduction from shareholders’ equity at cost.
Critical accounting estimates and key judgements
The preparation of financial statements in conformity with IFRSs requires the use of accounting estimates and assumptions. It also requires management to exercise its judgement in the process of applying the group’s accounting policies. We continually evaluate our estimates, assumptions and judgements based on available information and experience. As the use of estimates is inherent in financial reporting, actual results could differ from these estimates. The areas involving a higher degree of judgement or complexity are described below.
Long-term customer contracts
Long-term customer contracts can extend over a number of financial years. During the contractual period recognition of costs and profits may be impacted by estimates of the ultimate profitability of each contract. If, at any time, these estimates indicate that any contract will be unprofitable, the entire estimated loss for the contract is recognised immediately. If these estimates indicate that any contract will be less profitable than previously forecast, contract assets may have to be written down to the extent they are no longer considered to be fully recoverable. The group performs ongoing profitability reviews of its contracts in order to determine whether the latest estimates are appropriate. Key factors reviewed include:
| 4 | Transaction volumes or other inputs affecting future revenues which can vary depending on customer requirements, plans and market position and other factors such as general economic conditions; | |
| 4 | Our ability to achieve key contract milestones connected with the transition, development, transformation and deployment phases for customer contracts; | |
| 4 | The status of commercial relations with customers and the implication for future revenue and cost projections; and | |
| 4 | Our estimates of future staff and third party costs and the degree to which cost savings and efficiencies are deliverable. |
The carrying value of assets comprising the costs of the initial set up, transition or transformation phase of long-term networked IT services contracts are disclosed in note 17.
Interconnect income and payments to other telecommunications operators
In certain instances, BT relies on other operators to measure the traffic flows interconnecting with our networks. Estimates are used in these cases to determine the amount of income receivable from, or payments we need to make to, these other operators. The prices at which these services are charged are often regulated and may be subject to retrospective adjustment by regulators, and estimates are used in assessing the likely effect of these adjustments.
Pension obligations
BT has a commitment, mainly through the BT Pension Scheme, to pay pension benefits to approximately 333,000 people over approximately 60 years. The cost of these benefits and the present value of our pension liabilities depend on such factors as the life expectancy of the members, the salary progression of our current employees, the return that the pension fund assets will generate in the time before they are used to fund the pension payments and the rate at which the future pension payments are discounted. We use estimates for all of these factors in determining the pension costs and liabilities incorporated in our financial statements. The assumptions reflect historical experience and our judgement regarding future expectations.
The value of the net pension obligation at 31 March 2010 and the key financial assumptions used to measure the obligation are disclosed in note 29.
Useful lives for property, plant and equipment and software
The plant and equipment in BT’s networks is long lived with cables and switching equipment operating for over 10 years and underground ducts being used for decades. BT also develops software for use in IT systems and platforms that supports the products and services provided to our customers and that is also used within the group. The annual depreciation and amortisation charge is sensitive to the estimated service lives allocated to each type of asset. Asset lives are assessed annually and changed when necessary to reflect current thinking on their remaining lives in light of technological change, network investment plans (including the group’s fibre roll out programme), prospective economic utilisation and physical condition of the assets concerned. Changes to the service lives of assets implemented from 1 April 2009 had no significant impact in aggregate on the results for the year ended 31 March 2010.
The carrying values of software, property, plant and equipment are disclosed in notes 12 and 13, respectively. The useful lives applied to the principal categories of assets are disclosed on pages 89 and 90.
BT GROUP PLCANNUAL REPORT & FORM 20-F 93
Table of Contents
FINANCIAL STATEMENTSCONSOLIDATED FINANCIAL STATEMENTS
Income tax
The actual tax we pay on our profits is determined according to complex tax laws and regulations. Where the effect of these laws and regulations is unclear, we use estimates in determining the liability for the tax to be paid on our past profits which we recognise in our financial statements. We believe the estimates, assumptions and judgements are reasonable but this can involve complex issues which may take a number of years to resolve. The final determination of prior year tax liabilities could be different from the estimates reflected in the financial statements and may result in the recognition of an additional tax expense or tax credit in the income statement.
The value of the group’s income tax liability is disclosed on the balance sheet on page 100.
Deferred tax
Deferred tax assets and liabilities require management judgement in determining the amounts to be recognised. In particular, judgement is used when assessing the extent to which deferred tax assets should be recognised with consideration given to the timing and level of future taxable income.
The carrying value of the group’s deferred tax assets and liabilities are disclosed in notes 29 and 22, respectively.
Goodwill
The recoverable amount of cash generating units has been determined based on value in use calculations. These calculations require the use of estimates, including management’s expectations of future revenue growth, operating costs and profit margins for each cash generating unit.
The carrying value of goodwill and the key assumptions used in performing the annual impairment assessment are disclosed in note 12.
Determination of fair values
Certain financial instruments such as investments, derivative financial instruments and certain elements of loans and borrowings, are carried on the balance sheet at fair value, with changes in fair value reflected in the income statement. Fair values are estimated by reference in part to published price quotations and in part by using valuation techniques.
The fair values of financial instruments are disclosed in note 32.
Providing for doubtful debts
BT provides services to consumer and business customers, mainly on credit terms. We know that certain debts due to us will not be paid through the default of a small number of our customers. Estimates, based on our historical experience, are used in determining the level of debts that we believe will not be collected. These estimates include such factors as the current state of the economy and particular industry issues.
The value of the provision for doubtful debts is disclosed in note 17.
Provisions
As disclosed in note 21, the group’s provisions principally relate to obligations arising from property rationalisation programmes, restructuring programmes, claims and litigation and regulatory risks.
Under our property rationalisation programmes we have identified a number of surplus properties. Although efforts are being made to sub-let this space, this is not always possible given the current regulatory environment. Estimates have been made of the cost of vacant possession and of any shortfall arising from any sub-lease income being lower than the lease costs. Any such shortfall is recognised as a provision.
In respect of claims, litigation and regulatory risks, the group provides for anticipated costs where an outflow of resources is considered probable and a reasonable estimate can be made of the likely outcome. The ultimate liability may vary from the amounts provided and will be dependent upon the eventual outcome of any settlement.
Accounting standards, interpretations and amendments to published standards adopted in the year ended 31 March 2010
The following new, revised and amended standards and interpretations have been adopted in 2010 and have affected the amounts reported in these financial statements or have resulted in a change in presentation or disclosure.
Amendment to IFRS 2 ‘Share-based payment – Vesting Conditions and Cancellations’
The adoption of the amendment to IFRS 2 ‘Share-based payment –Vesting Conditions and Cancellations’ has resulted in a change in the group’s accounting policy for share-based payments. The amendment clarifies that only service and performance conditions are vesting conditions. Any other conditions are non-vesting conditions which have to be taken into account to determine the fair value of the equity instruments granted. In the case that the award does not vest as a result of a failure to meet a non-vesting condition that is within the control of either the group or the counterparty, this must be treated as a cancellation. Cancellations are treated as accelerated vestings and all remaining future charges are immediately recognised in the income statement with the credit recognised directly in equity. Prior to the adoption of the amendment to IFRS 2, the monthly savings requirement under the group’s all employee sharesave plans was classified as a vesting condition and any cancellations made by employees prior to the normal vesting date resulted in the reversal of all charges recognised to date.
The amendment to IFRS 2 requires retrospective adoption and hence prior period comparatives have been restated resulting in an increase of £110m in the share-based payment charge for 2009 (2008: £nil) and a reduction of 1.4p in basic and diluted loss per share for 2009 (2008: nil). There was no impact on net assets and cash flow. There was no material impact on the share-based payment charge in 2010, following the adoption of the amendment.
IAS 1 (Revised) ‘Presentation of Financial Statements’
IAS 1 (Revised) introduced some changes in the format and content of the financial statements. In addition, the revised standard requires the presentation of a third balance sheet as at 1 April 2008 because the group has applied two new accounting policies retrospectively.
The adoption of the amendment to IAS 1 (Revised) arising from the Annual Improvements to IFRSs 2007 has also resulted in a change in accounting policy applied to the classification of derivatives which have not been allocated to a specific hedge relationship. Where such derivatives have a maturity of and are expected to be held for more than twelve months after the reporting period, they are now presented as non current assets or liabilities. Prior period balance sheets have been reclassified to be on a consistent basis. The impact of these changes on the balance sheet line items is an increase in non current assets as at 31 March 2009 of £86m (31 March 2008: £6m) and a reduction in current assets as at 31 March 2009 of £86m (31 March 2008: £6m), and a reduction in current liabilities as at 31 March 2009 of £284m (31 March 2008: £209m) and an increase in non current liabilities of £284m (31 March 2008: £209m).
94 BT GROUP PLCANNUAL REPORT & FORM 20-F
Table of Contents
FINANCIAL STATEMENTSCONSOLIDATED FINANCIAL STATEMENTS
IAS 23 (Revised) ‘Borrowing costs’
In respect of borrowing costs relating to qualifying assets for which the commencement date for capitalisation is on or after 1 April 2009, the group capitalises borrowing costs during the construction phase as part of the cost of that asset. Previously, the group immediately recognised all borrowing costs as an expense in the income statement. The change in accounting policy was due to the adoption of IAS 23 (Revised) ‘Borrowing Costs’. The change in accounting policy has had no material impact on earnings per share. In 2010, the group capitalised borrowing costs of £3m with respect to property, plant and equipment under construction (note 13) and software development costs (note 12).
Amendment to IFRS 7 ‘Financial Instruments: Disclosures’
The amendment to IFRS 7 expands the disclosures required in respect of fair value financial instruments measurements and liquidity risk. The group has elected not to provide comparative information for these expanded disclosures in 2010, as set out in note 32, in accordance with the transitional relief offered in the amendment.
IFRS 8 ‘Operating Segments’
IFRS 8 is a new disclosure standard which has not changed the group’s reportable segments but has introduced certain new disclosures as set out in note 1.
As part of the Annual Improvements to IFRSs 2009 the IASB modified the requirement to disclose total assets for each reportable segment. This disclosure is now required only if a measure of total assets by segment is reported to the ‘chief operating decision maker’ (CODM). For BT, such a measure is not included in the information regularly provided to the CODM. The amendment to IFRS 8 is effective for accounting periods commencing on or after 1 January 2010. The amendment was endorsed by the EU on 23 March 2010 and the group has chosen to adopt it early for 2010.
The following new and revised standards and interpretations have also been adopted in these financial statements. Their adoption has not had any significant impact on the amounts reported.
| 4 | IFRIC 12 ‘Service concession arrangements’; | |
| 4 | IFRIC 13 ‘Customer loyalty programmes’; | |
| 4 | IFRIC 16 ‘Hedges of a net investment in a foreign operation’; and | |
| 4 | IFRIC 18 ‘Transfer of assets from customers’. |
Accounting standards, interpretations and amendments to published standards not yet effective
Certain new standards, interpretations and amendments to existing standards have been published that are mandatory for the group’s accounting periods beginning on or after 1 April 2010 or later periods, which the group has not adopted early, with the exception of the amendment to IFRS 8 as described above. Those which are considered to be relevant to the group’s operations, but which are not currently expected to have a significant impact on the group’s financial statements, are as follows:
IFRS 3 (Revised) ‘Business Combinations’ (effective 1 April 2010)
IFRS 3 (Revised) revises certain aspects of accounting for business combinations. Revisions include the requirement to expense all transaction costs and the requirement for all payments to acquire a business to be recorded at fair value at the acquisition date, with future contingent consideration subsequently re-measured at fair value through the income statement. IFRS 3 (Revised) is applied prospectively to business combinations entered into on or after the effective date.
IAS 27 (Revised) ‘Consolidated and Separate Financial Statements’ (effective 1 April 2010)
IAS 27 (Revised), which is applied prospectively, requires the effects of all transactions with non-controlling interests to be recorded in equity if there is no overall change in control. Such transactions will no longer result in goodwill or gains or losses being recorded. IAS 27 (Revised) also specifies that when control is lost, any remaining interest should be re-measured to fair value and a gain or loss recorded through the income statement.
IFRIC 17 ‘Distributions of Non-cash Assets to Owners’ (effective 1 April 2010)
IFRIC 17 provides guidance on how an entity should measure distributions other than cash when it pays dividends to its owners. The interpretation requires the dividend payable to be measured at the fair value of the assets to be distributed, and any difference between the fair value and the book value of the assets is recorded in the income statement.
Amendment to IAS 39 ‘Financial Instruments: Recognition and Measurement: Eligible Hedged items’ (effective 1 April 2010)
This clarifies two aspects of hedge accounting relating to hedging with options and the identification of inflation as a hedged risk.
Amendment to IAS 32 ‘Financial Instruments: Presentation-Classification of Rights Issues’ (effective 1 April 2010)
This requires an issue to all existing shareholders of rights to acquire additional shares to be recognised in equity, regardless of the currency in which the exercise price is denominated.
Annual Improvements to IFRSs 2009 (effective 1 April 2010)
These improvements relate to a number of standards including changes in presentation, recognition and measurement, terminology and editorial changes. It incorporates minor amendments to a number of standards in areas including operating segments, leases, intangible assets and financial instruments.
IAS 24 (Revised) ‘Related Party Disclosures’ (effective 1 April 2011)
The revised standard clarifies the definition of a related party and provides some exemptions for government-related entities.
Amendment to IFRIC 14 ‘Prepayments of a Minimum Funding Requirement’ (effective 1 April 2011)
This amendment permits a voluntary prepayment of a minimum funding requirement to be recognised as an asset.
IFRIC 19 ‘Extinguishing Financial Liabilities with Equity Instruments’ (effective 1 April 2011)
This interpretation, which is applied retrospectively, clarifies the accounting when an entity renegotiates the terms of its debt with the result that the liability is settled in part or in full by the debtor issuing its own equity instrument to the creditor.
IFRS 9 ‘Financial Instruments’ (effective 1 April 2013)
IFRS 9 is the first phase of the IASB’s three phase project to replace IAS 39 ‘Financial Instruments: Recognition and Measurement’. It is applicable to financial assets and requires classification and measurement in either the amortised cost or the fair value category. IFRS 9 is applied prospectively with transitional arrangements depending on the date of application.
BT GROUP PLCANNUAL REPORT & FORM 20-F 95
Table of Contents
FINANCIAL STATEMENTSCONSOLIDATED FINANCIAL STATEMENTS
GROUP INCOME STATEMENT
| Before specific | Specific | |||||||||||||||
| items | items | a | Total | |||||||||||||
| Year ended 31 March 2010 | Notes | £m | £m | £m | ||||||||||||
Revenue | 1 | 20,911 | (52 | ) | 20,859 | |||||||||||
| Other operating income | 2 | 378 | 2 | 380 | ||||||||||||
| Operating costs | 3 | (18,689 | ) | (427 | ) | (19,116 | ) | |||||||||
Operating profit | 1 | 2,600 | (477 | ) | 2,123 | |||||||||||
| Finance expense | 6 | (3,113 | ) | – | (3,113 | ) | ||||||||||
| Finance income | 6 | 1,944 | 11 | 1,955 | ||||||||||||
Net finance expense | (1,169 | ) | 11 | (1,158 | ) | |||||||||||
| Share of post tax profit of associates and joint ventures | 15 | 25 | 29 | 54 | ||||||||||||
| Loss on disposal of associate | 15 | – | (12 | ) | (12 | ) | ||||||||||
Profit before taxation | 1,456 | (449 | ) | 1,007 | ||||||||||||
| Taxation | 8 | (320 | ) | 342 | 22 | |||||||||||
Profit for the year | 1,136 | (107 | ) | 1,029 | ||||||||||||
Attributable to: | ||||||||||||||||
| Equity shareholders of the parent | 1,135 | (107 | ) | 1,028 | ||||||||||||
| Minority interests | 23 | 1 | – | 1 | ||||||||||||
Earnings per share | 9 | |||||||||||||||
| Basic | 13.3p | |||||||||||||||
| Diluted | 12.9p | |||||||||||||||
| a | For a definition of specific items, see page 87. An analysis of specific items is provided in note 5. |
| Before specific | Specific | |||||||||||||||
| items | b | items | a | Total | b | |||||||||||
| Year ended 31 March 2009 | Notes | £m | £m | £m | ||||||||||||
Revenue | 1 | 21,390 | – | 21,390 | ||||||||||||
| Other operating income | 2 | 352 | (13 | ) | 339 | |||||||||||
| Operating costs | 3 | (21,033 | ) | (395 | ) | (21,428 | ) | |||||||||
Operating profit | 1 | 709 | (408 | ) | 301 | |||||||||||
| Finance expense | 6 | (3,272 | ) | – | (3,272 | ) | ||||||||||
| Finance income | 6 | 2,652 | – | 2,652 | ||||||||||||
Net finance expense | (620 | ) | – | (620 | ) | |||||||||||
| Share of post tax profit of associates and joint ventures | 15 | 39 | 36 | 75 | ||||||||||||
Profit (loss) before taxation | 128 | (372 | ) | (244 | ) | |||||||||||
| Taxation | 8 | 10 | 43 | 53 | ||||||||||||
Profit (loss) for the year | 138 | (329 | ) | (191 | ) | |||||||||||
Attributable to: | ||||||||||||||||
| Equity shareholders of the parent | 136 | (329 | ) | (193 | ) | |||||||||||
| Minority interests | 23 | 2 | – | 2 | ||||||||||||
Loss per share | 9 | |||||||||||||||
| Basic | (2.5)p | |||||||||||||||
| Diluted | (2.5)p | |||||||||||||||
| a | For a definition of specific items, see page 87. An analysis of specific items is provided in note 5. | |
| b | Restated. See page 94. |
96 BT GROUP PLCANNUAL REPORT & FORM 20-F
Table of Contents
FINANCIAL STATEMENTSCONSOLIDATED FINANCIAL STATEMENTS
GROUP INCOME STATEMENT
| Before specific | Specific | |||||||||||||||
| items | b | items | a | Total | b | |||||||||||
| Year ended 31 March 2008 | Notes | £m | £m | £m | ||||||||||||
Revenue | 1 | 20,704 | – | 20,704 | ||||||||||||
| Other operating income | 2 | 359 | (10 | ) | 349 | |||||||||||
| Operating costs | 3 | (18,168 | ) | (529 | ) | (18,697 | ) | |||||||||
Operating profit | 1 | 2,895 | (539 | ) | 2,356 | |||||||||||
| Finance expense | 6 | (2,891 | ) | – | (2,891 | ) | ||||||||||
| Finance income | 6 | 2,513 | – | 2,513 | ||||||||||||
Net finance expense | (378 | ) | – | (378 | ) | |||||||||||
| Share of post tax loss of associates and joint ventures | (11 | ) | – | (11 | ) | |||||||||||
| Profit on disposal of associate | – | 9 | 9 | |||||||||||||
Profit before taxation | 2,506 | (530 | ) | 1,976 | ||||||||||||
| Taxation | 8 | (581 | ) | 343 | (238 | ) | ||||||||||
Profit for the year | 1,925 | (187 | ) | 1,738 | ||||||||||||
Attributable to: | ||||||||||||||||
| Equity shareholders of the parent | 1,924 | (187 | ) | 1,737 | ||||||||||||
| Minority interests | 1 | – | 1 | |||||||||||||
Earnings per share | 9 | |||||||||||||||
| Basic | 21.5p | |||||||||||||||
| Diluted | 21.1p | |||||||||||||||
| a | For a definition of specific items, see page 87. An analysis of specific items is provided in note 5. | |
| b | Restated. See page 94. |
GROUP STATEMENT OF COMPREHENSIVE INCOME
| 2010 | 2009 | a | 2008 | a | ||||||||||||
| Year ended 31 March | Notes | £m | £m | £m | ||||||||||||
Profit (loss) for the year | 1,029 | (191 | ) | 1,738 | ||||||||||||
Other comprehensive (loss) income | ||||||||||||||||
| Actuarial (losses) gains relating to retirement benefit obligations | 29 | (4,324 | ) | (7,037 | ) | 2,621 | ||||||||||
| Exchange differences on translation of foreign operations | 25 | (119 | ) | 692 | 213 | |||||||||||
| Fair value movements on available-for-sale assets | 25 | 7 | 5 | – | ||||||||||||
| Fair value movements on cash flow hedges: | ||||||||||||||||
| – fair value (losses) gains | 25 | (1,067 | ) | 2,719 | 446 | |||||||||||
| – reclassified and reported in net profit (loss) | 25 | 496 | (2,144 | ) | (294 | ) | ||||||||||
| – reclassified and reported in non current assets | 25 | (4 | ) | (5 | ) | 11 | ||||||||||
| Tax on components of other comprehensive income | 8 | 1,350 | 1,859 | (832 | ) | |||||||||||
Other comprehensive (loss) income for the year, net of tax | (3,661 | ) | (3,911 | ) | 2,165 | |||||||||||
Total comprehensive (loss) income for the year | (2,632 | ) | (4,102 | ) | 3,903 | |||||||||||
Attributable to: | ||||||||||||||||
| Equity shareholders of the parent | (2,633 | ) | (4,113 | ) | 3,899 | |||||||||||
| Minority interests | 1 | 11 | 4 | |||||||||||||
| (2,632 | ) | (4,102 | ) | 3,903 | ||||||||||||
| a | Restated. See page 94. |
BT GROUP PLCANNUAL REPORT & FORM 20-F 97
Table of Contents
FINANCIAL STATEMENTSCONSOLIDATED FINANCIAL STATEMENTS
GROUP STATEMENT OF CHANGES IN EQUITY
| Shareholders’ equity (deficit) | ||||||||||||||||||||||||||||||||
| Share | Share | Capital | Other | Retained | Minority | Total | ||||||||||||||||||||||||||
| capital | a | premium | a | reserve | reserves | b | earnings | Total | interests | c | Equity | |||||||||||||||||||||
| £m | £m | £m | £m | £m | £m | £m | £m | |||||||||||||||||||||||||
| At 1 April 2007 | 432 | 31 | 2 | 88 | 3,685 | 4,238 | 34 | 4,272 | ||||||||||||||||||||||||
| Change in accounting policy for adoption of the amendment to IFRS 2 (see page 94) | – | – | – | – | – | – | – | – | ||||||||||||||||||||||||
Total comprehensive incomed | – | – | – | 344 | 3,555 | 3,899 | 4 | 3,903 | ||||||||||||||||||||||||
| Dividends to shareholders | – | – | – | – | (1,241 | ) | (1,241 | ) | – | (1,241 | ) | |||||||||||||||||||||
| Share-based payments | – | – | – | – | 55 | 55 | – | 55 | ||||||||||||||||||||||||
| Tax on share-based payments | – | – | – | – | (45 | ) | (45 | ) | – | (45 | ) | |||||||||||||||||||||
| Issue of ordinary shares | 1 | 31 | – | – | – | 32 | – | 32 | ||||||||||||||||||||||||
| Cancellation of shares | (13 | ) | – | 13 | 570 | (570 | ) | – | – | – | ||||||||||||||||||||||
| Net purchase of treasury shares | – | – | – | (1,529 | ) | – | (1,529 | ) | – | (1,529 | ) | |||||||||||||||||||||
| Other movements in minority interests | – | – | – | – | – | – | (15 | ) | (15 | ) | ||||||||||||||||||||||
| At 1 April 2008 | 420 | 62 | 15 | (527 | ) | 5,439 | 5,409 | 23 | 5,432 | |||||||||||||||||||||||
Total comprehensive (loss) incomed | – | – | – | 1,094 | (5,207 | ) | (4,113 | ) | 11 | (4,102 | ) | |||||||||||||||||||||
| Dividends to shareholders | – | – | – | – | (1,222 | ) | (1,222 | ) | – | (1,222 | ) | |||||||||||||||||||||
| Share-based payments | – | – | – | – | 143 | 143 | – | 143 | ||||||||||||||||||||||||
| Tax on share-based payments | – | – | – | – | (12 | ) | (12 | ) | – | (12 | ) | |||||||||||||||||||||
| Issue of ordinary shares | – | – | – | 797 | (797 | ) | – | – | – | |||||||||||||||||||||||
| Cancellation of shares | (12 | ) | – | 12 | – | – | – | – | – | |||||||||||||||||||||||
| Net purchase of treasury shares | – | – | – | (63 | ) | – | (63 | ) | – | (63 | ) | |||||||||||||||||||||
| Other movements in minority interests | – | – | – | – | – | – | (7 | ) | (7 | ) | ||||||||||||||||||||||
| At 1 April 2009 | 408 | 62 | 27 | 1,301 | (1,656 | ) | 142 | 27 | 169 | |||||||||||||||||||||||
Total comprehensive (loss) incomed | – | – | – | (548 | ) | (2,085 | ) | (2,633 | ) | 1 | (2,632 | ) | ||||||||||||||||||||
| Dividends to shareholders | – | – | – | – | (263 | ) | (263 | ) | – | (263 | ) | |||||||||||||||||||||
| Share-based payments | – | – | – | – | 81 | 81 | – | 81 | ||||||||||||||||||||||||
| Tax on share-based payments | – | – | – | – | 19 | 19 | – | 19 | ||||||||||||||||||||||||
| Net issuance of treasury shares | – | – | – | 4 | – | 4 | – | 4 | ||||||||||||||||||||||||
| Other movements in minority interests | – | – | – | – | – | – | (4 | ) | (4 | ) | ||||||||||||||||||||||
At 31 March 2010 | 408 | 62 | 27 | 757 | (3,904 | ) | (2,650 | ) | 24 | (2,626 | ) | |||||||||||||||||||||
| a | For details of share capital and share premium, see note 24. | |
| b | For further analysis of Other reserves, see note 25. | |
| c | For further analysis of minority interests, see note 23. | |
| d | The group statement of comprehensive income is on page 97. |
98 BT GROUP PLCANNUAL REPORT & FORM 20-F
Table of Contents
FINANCIAL STATEMENTSCONSOLIDATED FINANCIAL STATEMENTS
GROUP CASH FLOW STATEMENT
| 2010 | 2009 | a | 2008 | a | ||||||||||||
| Year ended 31 March | Note | £m | £m | £m | ||||||||||||
Cash flow from operating activities | ||||||||||||||||
Profit (loss) before taxationb | 1,007 | (244 | ) | 1,976 | ||||||||||||
| Depreciation and amortisation | 3,039 | 2,890 | 2,889 | |||||||||||||
| Loss on sale of associates and group undertakings | 10 | 13 | 1 | |||||||||||||
| Net finance expense | 1,158 | 620 | 378 | |||||||||||||
| Other non cash charges | 77 | 596 | 60 | |||||||||||||
| Share of (profits) losses of associates and joint ventures | (54 | ) | (75 | ) | 11 | |||||||||||
| Decrease in inventories | 14 | 11 | 23 | |||||||||||||
| Decrease (increase) in trade and other receivables | 524 | 1,063 | (498 | ) | ||||||||||||
| (Decrease) increase in trade and other payables | (708 | ) | (379 | ) | 451 | |||||||||||
(Decrease) increase in provisions and other liabilitiesd | (591 | ) | 439 | (104 | ) | |||||||||||
Cash generated from operationsb | 4,476 | 4,934 | 5,187 | |||||||||||||
| Income taxes paid | (76 | ) | (232 | ) | (222 | ) | ||||||||||
| Income tax repayment for prior years | 425 | 4 | 521 | |||||||||||||
Net cash inflow from operating activities | 4,825 | 4,706 | 5,486 | |||||||||||||
Cash flow from investing activities | ||||||||||||||||
| Interest received | 16 | 19 | 111 | |||||||||||||
| Dividends received from associates and joint ventures | 3 | 6 | 2 | |||||||||||||
| Proceeds on disposal of property, plant and equipment | 29 | 44 | 62 | |||||||||||||
| Proceeds on disposal of businesses | 2 | – | – | |||||||||||||
| Proceeds on disposal of associates and joint ventures | – | – | 13 | |||||||||||||
| Proceeds on disposal of non current financial assets | – | – | 1 | |||||||||||||
Proceeds on disposal of current financial assetsc | 8,739 | 6,316 | 4,779 | |||||||||||||
| Acquisition of subsidiaries, net of cash acquired | (70 | ) | (227 | ) | (377 | ) | ||||||||||
| Purchases of property, plant and equipment and software | (2,509 | ) | (3,082 | ) | (3,315 | ) | ||||||||||
| Purchases of non current financial assets | – | – | (2 | ) | ||||||||||||
Purchases of current financial assetsc | (8,985 | ) | (6,030 | ) | (4,938 | ) | ||||||||||
Net cash outflow from investing activities | (2,775 | ) | (2,954 | ) | (3,664 | ) | ||||||||||
Cash flow from financing activities | ||||||||||||||||
| Equity dividends paid | (265 | ) | (1,221 | ) | (1,236 | ) | ||||||||||
| Dividends paid to minority interests | – | (1 | ) | – | ||||||||||||
| Interest paid | (956 | ) | (956 | ) | (842 | ) | ||||||||||
| Repayment of borrowings | (307 | ) | (863 | ) | (913 | ) | ||||||||||
| Repayment of finance lease liabilities | (24 | ) | (16 | ) | (284 | ) | ||||||||||
| Net proceeds (repayment) of issued commercial paper | (697 | ) | 606 | (681 | ) | |||||||||||
| New bank loans raised | 522 | 795 | 3,939 | |||||||||||||
| Proceeds from finance leases | 9 | – | – | |||||||||||||
| Repurchase of ordinary shares | – | (334 | ) | (1,498 | ) | |||||||||||
| Proceeds on issue of treasury shares | 4 | 125 | 85 | |||||||||||||
Net cash used in financing activities | (1,714 | ) | (1,865 | ) | (1,430 | ) | ||||||||||
| Effect of exchange rate changes on cash and cash equivalents | (7 | ) | 54 | 25 | ||||||||||||
Net increase (decrease) in cash and cash equivalents | 329 | (59 | ) | 417 | ||||||||||||
| Cash and cash equivalents at the start of the year | 1,115 | 1,174 | 757 | |||||||||||||
Cash and cash equivalents at the end of the year | 10 | 1,444 | 1,115 | 1,174 | ||||||||||||
| a | Restated. See page 94. | |
| b | The reconciliation from the loss before taxation of £244m for 2009 to the cash generated from operations of £4,934m for 2009 includes BT Global Services contract and financial review charges of £1,639m, which were non cash charges. | |
| c | Primarily consists of investment in and redemption of amounts held in liquidity funds. | |
| d | Includes pension deficit payment of £525m (2009: £nil, 2008: £320m). |
BT GROUP PLCANNUAL REPORT & FORM 20-F 99
Table of Contents
FINANCIAL STATEMENTSCONSOLIDATED FINANCIAL STATEMENTS
GROUP BALANCE SHEET
| 2010 | 2009 | a | 2008 | a | ||||||||||||
| At 31 March | Notes | £m | £m | £m | ||||||||||||
Non current assets | ||||||||||||||||
| Intangible assets | 12 | 3,672 | 3,788 | 3,355 | ||||||||||||
| Property, plant and equipment | 13 | 14,856 | 15,405 | 15,307 | ||||||||||||
| Derivative financial instruments | 19 | 1,076 | 2,542 | 316 | ||||||||||||
| Investments | 14 | 64 | 55 | 31 | ||||||||||||
| Retirement benefit asset | 29 | – | – | 2,887 | ||||||||||||
| Associates and joint ventures | 15 | 195 | 132 | 85 | ||||||||||||
| Trade and other receivables | 17 | 336 | 322 | 854 | ||||||||||||
| Deferred tax assets | 22 | 2,196 | 1,103 | – | ||||||||||||
| 22,395 | 23,347 | 22,835 | ||||||||||||||
Current assets | ||||||||||||||||
| Inventories | 16 | 107 | 121 | 122 | ||||||||||||
| Trade and other receivables | 17 | 3,696 | 4,185 | 4,449 | ||||||||||||
| Derivative financial instruments | 19 | 624 | 158 | 71 | ||||||||||||
| Investments | 14 | 406 | 163 | 440 | ||||||||||||
| Cash and cash equivalents | 10 | 1,452 | 1,300 | 1,435 | ||||||||||||
| 6,285 | 5,927 | 6,517 | ||||||||||||||
Current liabilities | ||||||||||||||||
| Loans and other borrowings | 18 | 3,269 | 1,542 | 1,524 | ||||||||||||
| Derivative financial instruments | 19 | 166 | 56 | 58 | ||||||||||||
| Trade and other payables | 20 | 6,531 | 7,215 | 7,591 | ||||||||||||
| Current tax liabilities | 320 | 1 | 241 | |||||||||||||
| Provisions | 21 | 134 | 254 | 81 | ||||||||||||
| 10,420 | 9,068 | 9,495 | ||||||||||||||
Total assets less current liabilities | 18,260 | 20,206 | 19,857 | |||||||||||||
Non current liabilities | ||||||||||||||||
| Loans and other borrowings | 18 | 9,522 | 12,365 | 9,818 | ||||||||||||
| Derivative financial instruments | 19 | 533 | 711 | 1,014 | ||||||||||||
| Retirement benefit obligations | 29 | 7,864 | 3,973 | 108 | ||||||||||||
| Other payables | 20 | 804 | 794 | 707 | ||||||||||||
| Deferred tax liabilities | 22 | 1,456 | 1,728 | 2,513 | ||||||||||||
| Provisions | 21 | 707 | 466 | 265 | ||||||||||||
| 20,886 | 20,037 | 14,425 | ||||||||||||||
Equity | ||||||||||||||||
| Ordinary shares | 24 | 408 | 408 | 420 | ||||||||||||
| Share premium | 24 | 62 | 62 | 62 | ||||||||||||
| Capital redemption reserve | 27 | 27 | 15 | |||||||||||||
| Other reserves | 25 | 757 | 1,301 | (527 | ) | |||||||||||
| Retained (loss) earnings | (3,904 | ) | (1,656 | ) | 5,439 | |||||||||||
Total parent shareholders’ (deficit) equity | (2,650 | ) | 142 | 5,409 | ||||||||||||
| Minority interests | 23 | 24 | 27 | 23 | ||||||||||||
Total (deficit) equityb | (2,626 | ) | 169 | 5,432 | ||||||||||||
| 18,260 | 20,206 | 19,857 | ||||||||||||||
| a | Restated. See page 94. | |
| b | The Group statement of changes in equity is on page 98. |
The consolidated financial statements on pages 87 to 144 and 149 were approved by the Board of Directors on 12 May 2010 and were signed on its behalf by
Sir Michael Rake
Chairman
Chairman
Ian Livingston
Chief Executive
Chief Executive
Tony Chanmugam
Group Finance Director
Group Finance Director
100 BT GROUP PLCANNUAL REPORT & FORM 20-F
Table of Contents
FINANCIAL STATEMENTSNOTES TO THE CONSOLIDATED FINANCIAL STATEMENTS
NOTES TO THE CONSOLIDATED FINANCIAL STATEMENTS
1. Segment information
The group has implemented IFRS 8 ‘Operating segments’ with effect from 1 April 2009. IFRS 8 requires operating segments to be identified on the basis of internal reports about components of the group which are regularly reviewed by the ‘chief operating decision maker’ in order to allocate resources to the segments and to assess their performance. As a result of the adoption of IFRS 8, the group’s reportable segments have not changed. The group’s operating segments are reported based on financial information provided to theOperating Committee,as detailed on page 61, which is the key management committee and represents the ‘chief operating decision maker’. TheOperating Committeeis chaired by the Group Chief Executive and the other members are the Group Finance Director and the Chief Executives of BT Retail, BT Wholesale, BT Global Services, BT Innovate & Design and BT Operate. The Chief Executive of Openreach also normally attends all meetings.
The group’s organisational structure reflects the different customer groups to which it provides communications products and services via its four customer-facing lines of business, supported by two internal functional units. The four customer-facing lines of business are the group’s reportable segments and generate substantially all the group’s revenue. Their operations are summarised as follows: BT Global Servicesserves multinational corporations, domestic businesses, government departments and other communications providers across the world, providing networked IT services. BT Retailserves consumer customers and small and medium enterprises (SMEs) in the UK, providing a range of innovative communications products and services. BT Retail also includes BT Ireland, which operates across the major corporate, SME, consumer and wholesale markets throughout the Republic of Ireland and Northern Ireland, and BT Enterprises, which comprises a number of individual businesses including BT Conferencing, BT Directories, BT Expedite, BT Redcare and BT Payphones. BT Wholesaleprovides services to UK communications providers through a diverse portfolio ranging from nationally available broadband, voice and data connectivity services and interconnect to bespoke, fully managed network outsourcing and value-added solutions.
Openreachis responsible for the crucial ‘first mile’ connecting communications providers’ customers to their local telephone exchange, giving them equal, open and economic access to the UK network. Openreach products are sold on an equivalent basis to BT lines of business and other communications providers at the same arm’s length prices, with the BT lines of business being treated no differently than any other customer with regard to terms and conditions or access to systems and data.
BT Innovate & Design and BT Operate are internal service units which support the four customer-facing lines of business. BT Innovate & Design is responsible for the design and build of the platforms, systems and processes which support the provision of the group’s products and services, and BT Operate is responsible for their operation. BT Innovate & Design and BT Operate operate on a full cost recovery basis. The costs incurred by BT Innovate & Design and BT Operate are allocated to the customer-facing lines of business in line with the services they provide. The depreciation and amortisation incurred by BT Operate in relation to the networks and systems they manage and operate on behalf of the customer-facing lines of business are allocated to the lines of business based on their respective utilisation. Capital expenditure incurred by BT Innovate & Design for specific projects undertaken on behalf of the customer-facing lines of business is allocated based on the value of the directly attributable expenditure incurred. Where projects are not directly attributable to a particular line of business, capital expenditure is allocated based on the proportion of estimated future economic benefits. Capital expenditure incurred by BT Operate is allocated to the customer-facing lines of business in line with the proportion of operating cost recoveries. BT Innovate & Design and BT Operate and the group’s centralised functions are not reportable segments as they do not meet the quantitative thresholds as set out in IFRS 8 for any of the years presented.
Intra group revenue generated from the sale of regulated products and services is based on market price. Intra group revenue from the sale of other products and services is agreed between the relevant lines of business and thus line of business profitability can be impacted by transfer pricing levels.
In addition to the four customer-facing lines of business, the remaining operations of the group are aggregated and included within the ‘Other’ category to reconcile to the consolidated results of the group. The ‘Other’ category includes costs associated with the group’s centralised functions including procurement and supply chain, fleet and property management. Provisions for the settlement of significant legal, commercial and regulatory disputes, which are negotiated at a group level, are initially recorded in the ‘Other’ segment. On resolution of the dispute, the full impact is recognised in the relevant lines of business results, offset in the group results by the utilisation of the provision previously charged to the ‘Other’ segment. Settlements which are particularly significant or cover more than one financial year may fall within the definition of specific items as detailed on page 87.
Information regarding the results of each reportable segment is provided below. Performance is measured based on EBITDA before specific items and contract and financial review charges recognised in BT Global Services in 2009 (defined as ‘adjusted EBITDA’), as included in the internal financial reports reviewed by theOperating Committee. EBITDA is defined as the operating profit or loss before depreciation, amortisation, net finance expense and taxation. Adjusted EBITDA is considered to be a useful measure of the operating performance of the lines of business because it reflects the underlying cash by eliminating depreciation and amortisation and also provides a meaningful analysis of trading performance by excluding specific items which are significant, one-off or unusual in nature and have little predictive value. Specific items are detailed in note 5 and are not allocated to the reportable segments as this reflects how they are reported to theOperating Committee. Finance expense and income is not allocated to the reportable segments as this activity is managed by the treasury function which manages the overall net debt position of the group.
Restatements
Comparatives have been restated for the adoption of the amendment to IFRS 2, which has been dealt with in the ‘Other’ category and detailed on page 94. Comparatives have also been restated for the impact of customer account moves between BT Global Services and BT Retail and other internal trading model changes effective from 1 April 2009 and has had no impact on the total results of the group.
BT GROUP PLCANNUAL REPORT & FORM 20-F 101
Table of Contents
FINANCIAL STATEMENTSNOTES TO THE CONSOLIDATED FINANCIAL STATEMENTS
1. Segment information continued
Segment revenue and profit
| BT Global | ||||||||||||||||||||||||
| Services | BT Retail | BT Wholesale | Openreach | Other | Total | |||||||||||||||||||
| Year ended 31 March 2010 | £m | £m | £m | £m | £m | £m | ||||||||||||||||||
| Total segment revenue | 8,513 | 8,297 | 4,450 | 5,164 | 40 | 26,464 | ||||||||||||||||||
| Internal revenue | – | (373 | ) | (1,227 | ) | (3,953 | ) | – | (5,553 | ) | ||||||||||||||
Revenue from external customers | 8,513 | 7,924 | 3,223 | 1,211 | 40 | 20,911 | ||||||||||||||||||
Adjusted EBITDAb | 457 | 1,850 | 1,279 | 1,960 | 93 | 5,639 | ||||||||||||||||||
| Depreciation and amortisation | (815 | ) | (459 | ) | (680 | ) | (856 | ) | (229 | ) | (3,039 | ) | ||||||||||||
Adjusted operating profit (loss)b | (358 | ) | 1,391 | 599 | 1,104 | (136 | ) | 2,600 | ||||||||||||||||
| Specific items (note 5) | – | – | – | – | (477 | ) | (477 | ) | ||||||||||||||||
Operating (loss) profit | (358 | ) | 1,391 | 599 | 1,104 | (613 | ) | 2,123 | ||||||||||||||||
| Share of post tax profits of associates and joint ventures | 54 | |||||||||||||||||||||||
| Loss on disposal of associate | (12 | ) | ||||||||||||||||||||||
| Net finance expense | (1,158 | ) | ||||||||||||||||||||||
| Profit before tax | 1,007 | |||||||||||||||||||||||
| BT Global | ||||||||||||||||||||||||
| Services | BT Retail | BT Wholesale | Openreach | Other | Total | |||||||||||||||||||
| Year ended 31 March 2009a | £m | £m | £m | £m | £m | £m | ||||||||||||||||||
| Total segment revenue | 8,628 | 8,663 | 4,658 | 5,231 | 40 | 27,220 | ||||||||||||||||||
| Internal revenue | – | (343 | ) | (1,228 | ) | (4,218 | ) | – | (5,789 | ) | ||||||||||||||
Adjusted revenue from external customersb | 8,628 | 8,320 | 3,430 | 1,013 | 40 | 21,431 | ||||||||||||||||||
| Contract and financial review charges | (41 | ) | – | – | – | – | (41 | ) | ||||||||||||||||
| Revenue from external customers | 8,587 | 8,320 | 3,430 | 1,013 | 40 | 21,390 | ||||||||||||||||||
Adjusted EBITDAb | 261 | 1,664 | 1,277 | 1,996 | 40 | 5,238 | ||||||||||||||||||
| Depreciation and amortisation | (776 | ) | (426 | ) | (686 | ) | (778 | ) | (224 | ) | (2,890 | ) | ||||||||||||
Adjusted operating profit (loss)b | (515 | ) | 1,238 | 591 | 1,218 | (184 | ) | 2,348 | ||||||||||||||||
| Specific items (note 5) | – | – | – | – | (408 | ) | (408 | ) | ||||||||||||||||
| Contract and financial review charges | (1,639 | ) | – | – | – | – | (1,639 | ) | ||||||||||||||||
Operating (loss) profit | (2,154 | ) | 1,238 | 591 | 1,218 | (592 | ) | 301 | ||||||||||||||||
| Share of post tax profits of associates and joint ventures | 75 | |||||||||||||||||||||||
| Net finance expense | (620 | ) | ||||||||||||||||||||||
| Loss before tax | (244 | ) | ||||||||||||||||||||||
| a | Restated. See pages 94 and 101. |
| BT Global | ||||||||||||||||||||||||
| Services | BT Retail | BT Wholesale | Openreach | Other | Total | |||||||||||||||||||
| Year ended 31 March 2008a | £m | £m | £m | £m | £m | £m | ||||||||||||||||||
| Total segment revenue | 7,664 | 8,682 | 4,959 | 5,266 | 28 | 26,599 | ||||||||||||||||||
| Internal revenue | – | (265 | ) | (1,252 | ) | (4,378 | ) | – | (5,895 | ) | ||||||||||||||
Revenue from external customers | 7,664 | 8,417 | 3,707 | 888 | 28 | 20,704 | ||||||||||||||||||
Adjusted EBITDAb | 808 | 1,529 | 1,406 | 1,911 | 130 | 5,784 | ||||||||||||||||||
| Depreciation and amortisation | (744 | ) | (445 | ) | (893 | ) | (689 | ) | (118 | ) | (2,889 | ) | ||||||||||||
Adjusted operating profitb | 64 | 1,084 | 513 | 1,222 | 12 | 2,895 | ||||||||||||||||||
| Specific items (note 5) | – | – | – | – | (539 | ) | (539 | ) | ||||||||||||||||
Operating profit (loss) | 64 | 1,084 | 513 | 1,222 | (527 | ) | 2,356 | |||||||||||||||||
| Share of post tax losses of associates and joint ventures | (11 | ) | ||||||||||||||||||||||
| Profit on disposal of associate | 9 | |||||||||||||||||||||||
| Net finance expense | (378 | ) | ||||||||||||||||||||||
| Profit before tax | 1,976 | |||||||||||||||||||||||
| a | Restated. See pages 94 and 101. | |
| b | Adjusted revenue, adjusted EBITDA and adjusted operating profit (loss) are stated before specific items and BT Global Services contract and financial review charges in 2009 and are non-GAAP measures provided in addition to the disclosure requirements defined under IFRS. The rationale for using non-GAAP measures is explained on pages 54 to 56. |
102 BT GROUP PLCANNUAL REPORT & FORM 20-F
Table of Contents
FINANCIAL STATEMENTSNOTES TO THE CONSOLIDATED FINANCIAL STATEMENTS
1. Segment information continued
Capital expenditure
| BT Global | ||||||||||||||||||||||||
| Services | BT Retail | BT Wholesale | Openreach | Other | Total | |||||||||||||||||||
| Year ended 31 March 2010 | £m | £m | £m | £m | £m | £m | ||||||||||||||||||
| Property, plant and equipment | 395 | 333 | 230 | 816 | 130 | 1,904 | ||||||||||||||||||
| Intangible assets | 204 | 84 | 95 | 91 | 155 | 629 | ||||||||||||||||||
Capital expenditure | 599 | 417 | 325 | 907 | 285 | 2,533 | ||||||||||||||||||
| BT Global | ||||||||||||||||||||||||
| Services | BT Retail | BT Wholesale | Openreach | Other | Total | |||||||||||||||||||
| Year ended 31 March 2009 | £m | £m | £m | £m | £m | £m | ||||||||||||||||||
| Property, plant and equipment | 576 | 386 | 310 | 823 | 154 | 2,249 | ||||||||||||||||||
| Intangible assets | 310 | 85 | 125 | 128 | 191 | 839 | ||||||||||||||||||
Capital expenditure | 886 | 471 | 435 | 951 | 345 | 3,088 | ||||||||||||||||||
| Revenue by products and services | ||||||||||||||||||||||||
| 2010 | 2009 | 2008 | ||||||||||||||||||||||
| Year ended 31 March | £m | £m | £m | |||||||||||||||||||||
| Managed solutions | 6,581 | 6,390 | 5,293 | |||||||||||||||||||||
| Broadband and convergence | 2,678 | 2,617 | 2,549 | |||||||||||||||||||||
| Calls and lines | 6,293 | 6,862 | 7,405 | |||||||||||||||||||||
| Transit, conveyance, interconnect services, WLR, global carrier and other wholesale products | 2,957 | 3,244 | 3,327 | |||||||||||||||||||||
| Other products and services | 2,402 | 2,318 | 2,130 | |||||||||||||||||||||
Total adjusted revenue | 20,911 | 21,431 | 20,704 | |||||||||||||||||||||
| Specific items | (52 | ) | – | – | ||||||||||||||||||||
| Contract and financial review charges | – | (41 | ) | – | ||||||||||||||||||||
Total revenue | 20,859 | 21,390 | 20,704 | |||||||||||||||||||||
| Geographic information | ||||||||||||||||||||||||
| The UK is the group’s country of domicile and generates the majority of its revenue from external customers in the UK. The geographic analysis of revenue is on the basis of the country of origin in which the customer is invoiced. | ||||||||||||||||||||||||
| Revenue from external customers | ||||||||||||||||||||||||
| 2010 | 2009 | 2008 | ||||||||||||||||||||||
| Year ended 31 March | £m | £m | £m | |||||||||||||||||||||
| UK | 16,064 | 16,736 | 17,186 | |||||||||||||||||||||
| Europe, Middle East and Africa, excluding the UK | 3,250 | 3,247 | 2,510 | |||||||||||||||||||||
| Americas | 1,235 | 1,119 | 847 | |||||||||||||||||||||
| Asia Pacific | 310 | 288 | 161 | |||||||||||||||||||||
Total revenue | 20,859 | 21,390 | 20,704 | |||||||||||||||||||||
| Non current assets | ||||||||||||||||||||||||
| 2010 | 2009 | |||||||||||||||||||||||
| At 31 March | £m | £m | ||||||||||||||||||||||
| UK | 15,583 | 16,110 | ||||||||||||||||||||||
| Europe, Middle East and Africa, excluding the UK | 2,761 | 3,046 | ||||||||||||||||||||||
| Americas | 653 | 421 | ||||||||||||||||||||||
| Asia Pacific | 62 | 70 | ||||||||||||||||||||||
Total | 19,059 | 19,647 | ||||||||||||||||||||||
Non current assets other than derivative financial instruments and investments and deferred tax assets are based on the location of the assets.
BT GROUP PLCANNUAL REPORT & FORM 20-F 103
Table of Contents
FINANCIAL STATEMENTSNOTES TO THE CONSOLIDATED FINANCIAL STATEMENTS
2. Other operating income
| 2010 | 2009 | 2008 | ||||||||||
| Year ended 31 March | £m | £m | £m | |||||||||
| Profits on disposal of property, plant and equipment | 75 | 52 | 50 | |||||||||
| Income from repayment works | 74 | 72 | 74 | |||||||||
| Other operating income | 229 | 228 | 235 | |||||||||
Other operating income before specific items | 378 | 352 | 359 | |||||||||
| Specific items (note 5) | 2 | (13 | ) | (10 | ) | |||||||
Other operating income | 380 | 339 | 349 | |||||||||
3. Operating costs
| 2010 | 2009 | a | 2008 | a | ||||||||||||
| Year ended 31 March | Notes | £m | £m | £m | ||||||||||||
Costs by nature | ||||||||||||||||
| Staff costs: | ||||||||||||||||
| Wages and salaries | 4,182 | 4,499 | 4,242 | |||||||||||||
| Social security costs | 447 | 432 | 417 | |||||||||||||
| Pension costs | 29 | 304 | 544 | 626 | ||||||||||||
| Share-based payment expense | 30 | 71 | 141 | 73 | ||||||||||||
Total staff costs | 5,004 | 5,616 | 5,358 | |||||||||||||
| Own work capitalised | (575 | ) | (673 | ) | (724 | ) | ||||||||||
Net staff costs | 4,429 | 4,943 | 4,634 | |||||||||||||
| Depreciation of property, plant and equipment: | ||||||||||||||||
| Owned assets | 13 | 2,260 | 2,200 | 2,324 | ||||||||||||
| Held under finance leases | 13 | 44 | 49 | 86 | ||||||||||||
| Amortisation of intangible assets | 12 | 735 | 641 | 479 | ||||||||||||
| Payments to telecommunications operators | 4,083 | 4,266 | 4,237 | |||||||||||||
Other operating costsb | 7,138 | 8,934 | 6,408 | |||||||||||||
Total operating costs before specific items | 18,689 | 21,033 | 18,168 | |||||||||||||
| Specific items | 5 | 427 | 395 | 529 | ||||||||||||
Total operating costs | 19,116 | 21,428 | 18,697 | |||||||||||||
| Operating costs before specific items include the following: | ||||||||||||||||
Contract and financial review chargese | – | 1,598 | – | |||||||||||||
Leaver costsc | 142 | 204 | 127 | |||||||||||||
Research and development expenditured | 1,177 | 1,021 | 857 | |||||||||||||
| Rental costs relating to operating leases | 451 | 426 | 423 | |||||||||||||
| Foreign currency losses | 7 | 30 | 8 | |||||||||||||
| a | Restated for the adoption of the amendment to IFRS 2. See page 94. | |
| b | Other operating costs also include a net charge of £1m (2009: £8m credit, 2008: £nil) relating to fair value movements on derivatives recycled from the cash flow reserve. | |
| c | Leaver costs exclude leaver costs associated with the restructuring of BT Global Services during 2010 and 2009 and manager leaver costs associated with the group’s transformation and reorganisation activities during 2009 and 2008. These costs have been recorded as a specific item. Other leaver costs are included within wages and salaries and social security costs. | |
| d | Research and development expenditure includes amortisation of £733m (2009: £431m, 2008: £325m) in respect of internally developed computer software. | |
| e | In 2009, the group recognised contract and financial review charges of £1,639m, of which £1,598m was recognised within other operating costs and £41m was recognised as a reduction to revenue. The total charge of £1,639m was allocated against the following assets and liabilities: intangible assets £241m; non current trade and other receivables £913m; prepayments £52m; accrued income £41m; provisions £256m; £136m was allocated against a number of other balance sheet categories and the individual amounts were insignificant. |
104 BT GROUP PLCANNUAL REPORT & FORM 20-F
Table of Contents
FINANCIAL STATEMENTSNOTES TO THE CONSOLIDATED FINANCIAL STATEMENTS
4. Employees
| 2010 | 2009 | 2008 | ||||||||||||||||||||||
| Year end | Average | Year end | Average | Year end | Average | |||||||||||||||||||
| 000 | 000 | 000 | 000 | 000 | 000 | |||||||||||||||||||
Number of employees in the groupa: | ||||||||||||||||||||||||
| UK | 79.8 | 82.9 | 86.5 | 89.5 | 91.3 | 93.0 | ||||||||||||||||||
| Non UK | 18.0 | 18.8 | 20.5 | 21.1 | 20.6 | 15.5 | ||||||||||||||||||
Total employees | 97.8 | 101.7 | 107.0 | 110.6 | 111.9 | 108.5 | ||||||||||||||||||
| 2010 | 2009 | b | 2008 | b | ||||||||||||||||||||
| Year end | Average | Year end | Average | Year end | Average | |||||||||||||||||||
| 000 | 000 | 000 | 000 | 000 | 000 | |||||||||||||||||||
Number of employees in the groupa: | ||||||||||||||||||||||||
| BT Global Services | 24.3 | 26.1 | 28.2 | 28.4 | 29.7 | 26.8 | ||||||||||||||||||
| BT Retail | 19.4 | 20.2 | 21.2 | 21.9 | 21.9 | 21.5 | ||||||||||||||||||
| BT Wholesale | 2.4 | 2.4 | 2.4 | 2.5 | 2.8 | 3.1 | ||||||||||||||||||
| Openreach | 30.8 | 31.4 | 32.3 | 33.1 | 33.6 | 33.8 | ||||||||||||||||||
| Other | 20.9 | 21.6 | 22.9 | 24.7 | 23.9 | 23.3 | ||||||||||||||||||
Total employees | 97.8 | 101.7 | 107.0 | 110.6 | 111.9 | 108.5 | ||||||||||||||||||
| a | The numbers disclosed include both full and part-time employees. | |
| b | Restated for the impact of customer account moves and other internal trading model changes. See page 101. |
BT GROUP PLCANNUAL REPORT & FORM 20-F 105
Table of Contents
FINANCIAL STATEMENTSNOTES TO THE CONSOLIDATED FINANCIAL STATEMENTS
5. Specific items
The group separately identifies and discloses significant one off or unusual items (termed ‘specific items’). This is consistent with the way that financial performance is measured by management and reported to the Board and theOperating Committeeand it assists in providing a meaningful analysis of the trading results of the group. A definition of specific items is provided on page 87.
| 2010 | 2009 | 2008 | ||||||||||
| Year ended 31 March | £m | £m | £m | |||||||||
Revenue | ||||||||||||
Regulatory settlementa | 52 | – | – | |||||||||
Other operating income | ||||||||||||
(Profit) loss on disposal of a businessb | (2 | ) | 13 | 10 | ||||||||
Operating costs | ||||||||||||
| BT Global Services restructuring charges: | ||||||||||||
– Networks, products and procurement channels rationalisationc | 142 | 183 | – | |||||||||
– People and propertyc | 132 | 51 | – | |||||||||
– Intangible asset impairments and other chargesc | 27 | 46 | – | |||||||||
| 301 | 280 | – | ||||||||||
Property rationalisation costsd | 121 | – | – | |||||||||
Costs associated with settlement of open tax yearse | 5 | – | – | |||||||||
Restructuring costs – group transformation and reorganisation activitiesf | – | 65 | 402 | |||||||||
21CN asset impairment and related chargesg | – | 50 | – | |||||||||
Creation of Openreach and delivery of the Undertakingsh | – | – | 53 | |||||||||
Write off of circuit inventory and other working capital balancesi | – | – | 74 | |||||||||
| 427 | 395 | 529 | ||||||||||
Finance income | ||||||||||||
Interest on settlement of open tax yearse | (11 | ) | – | – | ||||||||
Share of results of associates and joint ventures | ||||||||||||
Impact of renegotiated supply contracts on associatej | (29 | ) | – | – | ||||||||
Reassessment of carrying value of associatek | – | (36 | ) | – | ||||||||
Loss (profit) on disposal of associates and joint venturesl | 12 | – | (9 | ) | ||||||||
| (17 | ) | (36 | ) | (9 | ) | |||||||
Net specific items charge before tax | 449 | 372 | 530 | |||||||||
Tax credit in respect of settlement of open tax yearse | (230 | ) | – | (40 | ) | |||||||
Tax credit on re-measurement of deferred taxm | – | – | (154 | ) | ||||||||
| Tax credit on specific items above | (112 | ) | (43 | ) | (149 | ) | ||||||
Net specific items charge after tax | 107 | 329 | 187 | |||||||||
| a | In 2010 a charge of £52m was recognised reflecting an Ofcom determination in relation to 2Mb/s partial private circuits. | |
| b | In 2010 a profit of £2m arose on disposal of a business. In 2009 and 2008 respectively, a £13m and £10m loss on disposal arose from exiting businesses. | |
| c | In 2010 and 2009 respectively, the group recognised BT Global Services restructuring charges of £301m and £280m. The main components of the charges are set out below: | |
| – Networks, products and procurement channels rationalisation charges of £142m (2009: £183m and 2008: £nil). In 2010 this included a payment of £127m made to Tech Mahindra for the renegotiation of certain supply contracts as part of the rationalisation of procurement channels. | ||
| – People and property charges of £132m (2009: £51m and 2008: £nil) principally comprising leaver costs and property exit costs. | ||
| – Intangible asset impairments and other charges of £27m (2009: £46m and 2008: £nil) reflecting the costs associated with rationalising the services that are offered to customers and the brands under which customers are served. | ||
| d | In 2010 £121m (2009 and 2008: £nil) of property rationalisation charges were recognised in relation to the rationalisation of the group’s UK property portfolio. The charge recognised relates to properties which have been vacated and as a result of which, the associated leases have become onerous. This programme is expected to continue over the next two years. Including the charge recognised in 2010, the total cost of the rationalisation programme is expected to be around £300m. | |
| e | In 2010 the group agreed substantially all outstanding tax matters with HMRC relating to the 2006, 2007 and 2008 tax years. Specific items include a tax credit of £230m, associated interest of £11m and costs of £5m in connection with reaching the agreement. In 2008 the group agreed an outstanding tax matter relating to a business disposed of in 2001, the impact of which was a tax credit of £40m. | |
| f | In 2009 and 2008 respectively, the group incurred costs of £65m and £402m in respect of the group’s transformation and reorganisation activities. The costs mainly comprised leaver costs, property exit and transformation programme costs. | |
| g | In 2009 a £50m charge was recognised comprising £31m of asset impairments and £19m of associated costs, following the group’s review of its 21CN programme and associated voice strategy in the light of the move to a customer-led roll out strategy and focus on next generation voice service developments of fibre-based products. | |
| h | In 2008 a charge of £53m was recognised in relation to further estimated costs to create Openreach and deliver the Undertakings agreed with Ofcom. | |
| i | In 2008 a charge of £74m was recognised as a result of the completion of a review of circuit inventory and other working capital balances. | |
| j | In 2010 the group recognised a specific item credit of £29m in connection with the £127m payment to its associate Tech Mahindra, as described above. | |
| k | In 2009 a credit of £36m was recognised in respect of a reassessment of the value of the group’s share of the net assets of an associate. | |
| l | In 2010 a £12m loss on disposal of an indirect interest in Tech Mahindra was recognised. In 2008, a £9m profit on the sale of an associate was recognised. | |
| m | In 2008 a tax credit of £154m was recognised for the re-measurement of deferred tax balances as a result of the change in the UK statutory corporation tax rate from 30% to 28% effective in 2009. |
106 BT GROUP PLCANNUAL REPORT & FORM 20-F
Table of Contents
FINANCIAL STATEMENTSNOTES TO THE CONSOLIDATED FINANCIAL STATEMENTS
6. Finance expense and finance income
| 2010 | 2009 | 2008 | ||||||||||
| Year ended 31 March | £m | £m | £m | |||||||||
Finance expense | ||||||||||||
Interest on listed bonds, debentures and notesa,b | 806 | 777 | 629 | |||||||||
Interest on finance leasesa | 18 | 25 | 31 | |||||||||
Interest on other borrowingsa | 58 | 130 | 159 | |||||||||
Unwinding of discount on provisionsa | 4 | 3 | 3 | |||||||||
Fair value loss on derivatives not in a designated hedge relationshipe | 19 | 29 | 41 | |||||||||
| Interest on pension scheme liabilities | 2,211 | 2,308 | 2,028 | |||||||||
Finance expensec,d | 3,116 | 3,272 | 2,891 | |||||||||
Less: amounts included in the cost of qualifying assetsf | (3 | ) | – | – | ||||||||
Total finance expense | 3,113 | 3,272 | 2,891 | |||||||||
| a | Calculated using the effective interest rate method unless otherwise stated below. | |
| b | Includes a net charge of £44m (2009: £25m, 2008: £77m) relating to fair value movements on derivatives recycled from the cash flow reserve. | |
| c | Includes a net credit of £29m (2009: net charge of £39m, 2008: net credit of £6m) relating to fair value movements arising on hedged items and net charge of £29m (2009: net credit of £39m, 2008: net charge of £6m) relating to fair value movements arising on derivatives designated as fair value hedges. | |
| d | Includes a net credit of £451m (2009: net charge of £2,161m, 2008: net charge of £373m) relating to foreign exchange movements on loans and borrowings and a net charge of £451m (2009: net credit of £2,161m, 2008: net credit of £373m) relating to fair value movements on derivatives recycled from the cash flow reserve. The items generating this foreign exchange are in designated hedge relationships. | |
| e | Includes a loss of £nil (2009: £nil, 2008: £2m) recycled from the cash flow reserve arising on de-designation of derivatives from a hedge relationship and includes a charge of £9m arising from the negotiation of swap break dates on certain derivatives. | |
| f | The weighted average capitalisation rate on general borrowings was 7.9% in 2010. |
| 2010 | 2009 | 2008 | ||||||||||
| Year ended 31 March | £m | £m | £m | |||||||||
Finance income | ||||||||||||
| Other interest and similar income | ||||||||||||
| Interest on available-for-sale investments | 5 | 14 | 25 | |||||||||
| Interest on loans and receivables | 7 | 17 | 40 | |||||||||
Other interest and similar incomea | 11 | – | – | |||||||||
| Expected return on pension scheme assets | 1,932 | 2,621 | 2,448 | |||||||||
Total finance income | 1,955 | 2,652 | 2,513 | |||||||||
| a | 2010 includes £11m relating to interest on settlement of tax matters disclosed as a specific item (see note 5). |
| 2010 | 2009 | 2008 | ||||||||||
| Year ended 31 March | £m | £m | £m | |||||||||
| Net finance expense before specific items and pensions | 890 | 933 | 798 | |||||||||
| Net interest expense (income) on pensions | 279 | (313 | ) | (420 | ) | |||||||
Net finance expense before specific items | 1,169 | 620 | 378 | |||||||||
| Specific items | (11 | ) | – | – | ||||||||
Net finance expense | 1,158 | 620 | 378 | |||||||||
7. Dividends
| 2010 | 2009 | 2008 | ||||||||||||||||||||||
| pence | pence | pence | ||||||||||||||||||||||
| Year ended 31 March | per share | £m | per share | £m | per share | £m | ||||||||||||||||||
| Final dividend paid in respect of the prior year | 1.10 | 85 | 10.40 | 804 | 10.00 | 810 | ||||||||||||||||||
| Interim dividend paid in respect of the current year | 2.30 | 178 | 5.40 | 418 | 5.40 | 431 | ||||||||||||||||||
| 3.40 | 263 | 15.80 | 1,222 | 15.40 | 1,241 | |||||||||||||||||||
The Board recommends that a final dividend in respect of the year ended 31 March 2010 of 4.6p per share will be paid to shareholders on 6 September 2010, taking the full year proposed dividend in respect of the 2010 financial year to 6.9p (2009: 6.5p, 2008: 15.8p) which amounts to approximately £534m (2009: £503m, 2008: £1,236m). This dividend is subject to approval by shareholders at the Annual General Meeting and therefore the liability of approximately £356m (2009: £85m) has not been included in these financial statements. The proposed dividend will be payable to all shareholders on the Register of Members on 13 August 2010.
BT GROUP PLCANNUAL REPORT & FORM 20-F 107
Table of Contents
FINANCIAL STATEMENTSNOTES TO THE CONSOLIDATED FINANCIAL STATEMENTS
8. Taxation
Analysis of taxation (credit) expense for the year
| 2010 | 2009 | 2008 | ||||||||||
| Year ended 31 March | £m | £m | £m | |||||||||
| United Kingdom | ||||||||||||
| Corporation tax at 28% (2009: 28%, 2008: 30%) | 161 | – | 214 | |||||||||
| Adjustments in respect of prior periods | (204 | ) | (50 | ) | 18 | |||||||
| Non UK taxation | ||||||||||||
| Current | 31 | 48 | 42 | |||||||||
| Adjustments in respect of prior periods | – | (10 | ) | (88 | ) | |||||||
Total current tax (credit) expense | (12 | ) | (12 | ) | 186 | |||||||
| Deferred tax | ||||||||||||
| Origination and reversal of temporary differences | 53 | (77 | ) | 78 | ||||||||
| Adjustments in respect of prior periods | (63 | ) | 36 | (26 | ) | |||||||
Total deferred tax (credit) expense | (10 | ) | (41 | ) | 52 | |||||||
Total taxation (credit) expense | (22 | ) | (53 | ) | 238 | |||||||
Factors affecting taxation (credit) expense
The taxation (credit) expense on the profit (loss) for the year differs from the amount computed by applying the corporation tax rate to the profit (loss) before taxation as a result of the following factors:
| 2010 | 2009 | a | 2008 | a | ||||||||||||||||||||
| Year ended 31 March | £m | % | £m | % | £m | % | ||||||||||||||||||
Profit (loss) before taxation | 1,007 | (244 | ) | 1,976 | ||||||||||||||||||||
| Notional taxation expense (credit) at UK rate of 28% (2009: 28%, 2008: 30%) | 282 | 28.0 | (68 | ) | 28.0 | 592 | 30.0 | |||||||||||||||||
| Effects of: | ||||||||||||||||||||||||
| Non deductible depreciation and amortisation | 18 | 1.7 | 27 | (11.0 | ) | 23 | 1.1 | |||||||||||||||||
| Non deductible (taxable) non UK losses (profits) | 26 | 2.6 | (24 | ) | 9.8 | (7 | ) | (0.3 | ) | |||||||||||||||
| Overseas losses utilised | (35 | ) | (3.4 | ) | – | – | – | – | ||||||||||||||||
| Higher (lower) taxes on non UK profits | 1 | 0.1 | (9 | ) | 3.7 | 7 | 0.3 | |||||||||||||||||
| Higher (lower) taxes on gain on disposal of non current investments and group undertakings | – | – | 4 | (1.6 | ) | – | – | |||||||||||||||||
| Other deferred tax assets not recognised | 17 | 1.6 | 5 | (2.0 | ) | (13 | ) | (0.6 | ) | |||||||||||||||
| Associates and joint ventures | (11 | ) | (1.1 | ) | (21 | ) | 8.6 | (2 | ) | (0.1 | ) | |||||||||||||
| Adjustments in respect of prior periods | (37 | ) | (3.7 | ) | (24 | ) | 9.8 | (56 | ) | (2.8 | ) | |||||||||||||
| Tax credit settlement of open tax years | (230 | ) | (22.9 | ) | – | – | (40 | ) | (2.0 | ) | ||||||||||||||
| Re-measurements of deferred tax balances at 28% | – | – | – | – | (154 | ) | (7.8 | ) | ||||||||||||||||
| Adoption of the amendment to IFRS 2 | – | – | 30 | (12.3 | ) | – | – | |||||||||||||||||
| Other | (53 | ) | (5.1 | ) | 27 | (11.1 | ) | (112 | ) | (5.8 | ) | |||||||||||||
Total taxation (credit) expense and effective tax rate | (22 | ) | (2.2 | ) | (53 | ) | 21.9 | 238 | 12.0 | |||||||||||||||
| Specific items | 342 | 43 | 343 | |||||||||||||||||||||
Total taxation (credit) expense before specific items and effective rate on profit before specific items | 320 | 22.0 | (10 | ) | (7.8 | ) | 581 | 23.2 | ||||||||||||||||
| a | Restated. See page 94. |
108 BT GROUP PLCANNUAL REPORT & FORM 20-F
Table of Contents
FINANCIAL STATEMENTSNOTES TO THE CONSOLIDATED FINANCIAL STATEMENTS
8. Taxation continued
Tax components of other comprehensive income
The tax credit (expense) relating to components of other comprehensive income is as follows:
| 2010 | 2009 | 2008 | ||||||||||||||||||||||||||||||||||
| Tax | Tax | Tax | ||||||||||||||||||||||||||||||||||
| Before | credit | After | Before | credit | After | Before | credit | After | ||||||||||||||||||||||||||||
| Year ended 31 March | tax | (expense) | tax | tax | (expense) | tax | tax | (expense) | tax | |||||||||||||||||||||||||||
| £m | £m | £m | £m | £m | £m | £m | £m | £m | ||||||||||||||||||||||||||||
| Actuarial (losses) gains relating to retirement benefit obligations | (4,324 | ) | 1,211 | (3,113 | ) | (7,037 | ) | 1,959 | (5,078 | ) | 2,621 | (804 | ) | 1,817 | ||||||||||||||||||||||
| Exchange differences on translation of foreign operations | (119 | ) | (20 | ) | (139 | ) | 692 | 64 | 756 | 213 | 1 | 214 | ||||||||||||||||||||||||
| Fair value movements on available-for-sale assets | 7 | – | 7 | 5 | – | 5 | – | – | – | |||||||||||||||||||||||||||
| Fair value movements on cash flow hedges | ||||||||||||||||||||||||||||||||||||
| – fair value gains (losses) | (1,067 | ) | 297 | (770 | ) | 2,719 | (766 | ) | 1,953 | 446 | (108 | ) | 338 | |||||||||||||||||||||||
| – reclassified and reported in net (loss) profit | 496 | (139 | ) | 357 | (2,144 | ) | 600 | (1,544 | ) | (294 | ) | 82 | (212 | ) | ||||||||||||||||||||||
| – reclassified and reported in non current assets | (4 | ) | 1 | (3 | ) | (5 | ) | 2 | (3 | ) | 11 | (3 | ) | 8 | ||||||||||||||||||||||
| (5,011 | ) | 1,350 | (3,661 | ) | (5,770 | ) | 1,859 | (3,911 | ) | 2,997 | (832 | ) | 2,165 | |||||||||||||||||||||||
| Current tax (expense) credit | (2 | ) | – | 2 | ||||||||||||||||||||||||||||||||
| Deferred tax credit (expense) | 1,352 | 1,859 | (834 | ) | ||||||||||||||||||||||||||||||||
| 1,350 | 1,859 | (832 | ) | |||||||||||||||||||||||||||||||||
Tax on items recognised directly in equity
| 2010 | 2009 | 2008 | ||||||||||
| Year ended 31 March | £m | £m | £m | |||||||||
| Current tax credit relating to share-based payments | – | – | 17 | |||||||||
| Deferred tax credit (expense) relating to share-based payments | 19 | (12 | ) | (62 | ) | |||||||
Total taxation credit (expense) on items recognised directly in equity | 19 | (12 | ) | (45 | ) | |||||||
9. Earnings (loss) per share
Basic earnings (loss) per share is calculated by dividing the profit or loss attributable to equity shareholders by the weighted average number of shares in issue after deducting the group’s shares held by employee share ownership trusts and treasury shares.
In calculating the diluted earnings (loss) per share, share options outstanding and other potential ordinary shares have been taken into account where the impact of these is dilutive. Options over 138m shares (2009: 158m shares, 2008: 58m shares) were excluded from the calculation of the total diluted number of shares as the impact of these is antidilutive.
The weighted average number of shares in the years was:
| 2010 | 2009 | a | 2008 | a | ||||||||
| millions of | millions of | millions of | ||||||||||
| Year ended 31 March | shares | shares | shares | |||||||||
Basic | 7,740 | 7,724 | 8,066 | |||||||||
| Dilutive ordinary shares from share options | 174 | 5 | 106 | |||||||||
| Dilutive ordinary shares held in trust | 74 | 42 | 51 | |||||||||
Diluted | 7,988 | 7,771 | 8,223 | |||||||||
| Profit (loss) attributable to equity shareholders of the parent (£m) | 1,028 | (193 | ) | 1,737 | ||||||||
| Basic earnings (loss) per share (p) | 13.3p | (2.5)p | 21.5p | |||||||||
| Diluted earnings (loss) per share (p) | 12.9p | (2.5)p | 21.1p | |||||||||
| a | Restated. See page 94. |
BT GROUP PLCANNUAL REPORT & FORM 20-F 109
Table of Contents
FINANCIAL STATEMENTSNOTES TO THE CONSOLIDATED FINANCIAL STATEMENTS
9. Earnings (loss) per share continued
Adjusted basic and diluted earnings (loss) per share, and the per share impact of the adjustments, is as follows:
| 2010 | 2009 | a | 2008 | a | ||||||||||||||||||||
| pence | pence | pence | ||||||||||||||||||||||
| Year ended 31 March | per share | £m | per share | £m | per share | £m | ||||||||||||||||||
Basic earnings (loss) per share/profit (loss)b | 13.3 | 1,028 | (2.5 | ) | (193 | ) | 21.5 | 1,737 | ||||||||||||||||
| Net specific items charge after tax | 1.4 | 107 | 4.3 | 329 | 2.4 | 187 | ||||||||||||||||||
| Net pension interest expense (income) after tax | 2.6 | 201 | (3.0 | ) | (225 | ) | (3.7 | ) | (294 | ) | ||||||||||||||
| BT Global Services contract and financial review charges after tax | – | – | 15.3 | 1,178 | – | – | ||||||||||||||||||
Adjusted basic earnings (loss)per share/profit (loss) attributable to adjustmentsb | 4.0 | 308 | 16.6 | 1,282 | (1.3 | ) | (107 | ) | ||||||||||||||||
Adjusted basic earnings per share/profitb | 17.3 | 1,336 | 14.1 | 1,089 | 20.2 | 1,630 | ||||||||||||||||||
Diluted earnings (loss) per share/profit (loss)b | 12.9 | 1,028 | (2.5 | ) | (193 | ) | 21.1 | 1,737 | ||||||||||||||||
Adjusted diluted earnings (loss) per share/profit (loss)attributable to adjustmentsb | 3.9 | 308 | 16.5 | 1,282 | (1.3 | ) | (107 | ) | ||||||||||||||||
Adjusted diluted earnings per share/profitb | 16.8 | 1,336 | 14.0 | 1,089 | 19.8 | 1,630 | ||||||||||||||||||
| a | Restated. See page 94. | |
| b | The stated profit (loss) amounts are the component of the total profit (loss) which is attributable to equity shareholders excluding minority interests. |
10. Cash and cash equivalents
| 2010 | 2009 | |||||||
| At 31 March | £m | £m | ||||||
Cash at bank and in hand | 197 | 562 | ||||||
Cash equivalents | ||||||||
| Available-for-sale | ||||||||
| Listed | – | 7 | ||||||
| Loans and receivables | ||||||||
| UK deposits | 1,211 | 711 | ||||||
| European deposits | 7 | 5 | ||||||
| US deposits | 37 | 15 | ||||||
Total cash equivalents | 1,255 | 738 | ||||||
Total cash and cash equivalents | 1,452 | 1,300 | ||||||
| Bank overdrafts | (8 | ) | (185 | ) | ||||
Cash and cash equivalents per the cash flow statement | 1,444 | 1,115 | ||||||
The group has cross undertaking guarantee facilities across certain bank accounts which allow a legally enforceable right of set off of the relevant cash and overdraft balances on bank accounts included within each scheme. Included within overdrafts at 31 March 2010 were balances of £nil (2009: £160m) which had a legally enforceable right of set off against cash balances of £nil (2009: £96m).
The group’s cash at bank included restricted cash of £54m (2009: £52m), of which £29m (2009: £27m) were held in countries in which prior approval is required to transfer funds abroad. Such liquid funds are at the group’s disposition within a reasonable period of time if it complies with these requirements. The remaining balance of £25m (2009: £25m) were held in escrow accounts.
110 BT GROUP PLCANNUAL REPORT & FORM 20-F
Table of Contents
FINANCIAL STATEMENTSNOTES TO THE CONSOLIDATED FINANCIAL STATEMENTS
10. Cash and cash equivalents continued
The credit rating of counterparties with which cash equivalents were held is detailed in the table below.
| 2010 | 2009 | |||||||
| At 31 March | £m | £m | ||||||
Moody’s/S&P credit ratinga | ||||||||
| Aaa/AAA | 100 | 90 | ||||||
| Aa2/AA | 609 | 124 | ||||||
| Aa3/AA– | 202 | 271 | ||||||
| A1/A+ | 341 | 251 | ||||||
| A2/A | 3 | 2 | ||||||
Total cash equivalents | 1,255 | 738 | ||||||
| a | Cash equivalent balances with counterparties have been classified at the lower of their Moody’s and S&P rating. |
Cash and cash equivalents are primarily fixed rate financial assets held for periods ranging from one day to three months.
11. Net debt
Net debt consists of loans and other borrowings less current asset investments and cash and cash equivalents. Loans and other borrowings are measured at the net proceeds raised, adjusted to amortise any discount over the term of the debt. For the purpose of this analysis, current asset investments and cash and cash equivalents are measured at the lower of cost and net realisable value. Currency denominated balances within net debt are translated to Sterling at swapped rates where hedged.
This definition of net debt measures balances at the expected value of future undiscounted cash flows due to arise on maturity of financial instruments and removes the adjustments made for the re-measurement of hedged risks under fair value hedges and accrued interest applied to reflect the effective interest method as required by IAS 39. In addition, the gross balances are adjusted to take account of netting arrangements amounting to £nil (2009: £160m). Net debt is a non-GAAP measure since it is not defined in accordance with IFRS, but it is a key indicator used by management in order to assess operational performance and balance sheet strength.
| 2010 | 2009 | |||||||
| Analysis of net debt | £m | £m | ||||||
| Loans and other borrowings (current and non current) | 12,791 | 13,907 | ||||||
| Less: | ||||||||
| Cash and cash equivalents | (1,452 | ) | (1,300 | ) | ||||
| Current asset investments | (406 | ) | (163 | ) | ||||
| 10,933 | 12,444 | |||||||
| Adjustments: | ||||||||
| To retranslate currency denominated balances at swapped rates where hedged | (1,326 | ) | (1,766 | ) | ||||
| To remove fair value adjustments and accrued interest applied to reflect the effective interest method | (324 | ) | (317 | ) | ||||
Net debt at 31 March | 9,283 | 10,361 | ||||||
After allocating the element of the adjustments which impacts loans and other borrowings, as defined above, gross debt at 31 March 2010 was £11,139m (2009: £11,663m).
| 2010 | 2009 | |||||||
| Reconciliation of movement in net debt | £m | £m | ||||||
| At 1 April | 10,361 | 9,460 | ||||||
| (Decrease) increase in net debt resulting from cash flows | (1,079 | ) | 921 | |||||
| Net debt assumed or issued on acquisitions | – | (2 | ) | |||||
| Currency movements | – | (36 | ) | |||||
| Other non cash movements | 1 | 18 | ||||||
| At 31 March | 9,283 | 10,361 | ||||||
BT GROUP PLCANNUAL REPORT & FORM 20-F 111
Table of Contents
FINANCIAL STATEMENTSNOTES TO THE CONSOLIDATED FINANCIAL STATEMENTS
12. Intangible assets
| Brands, | ||||||||||||||||||||||||
| Telecommunication | customer | Internally | ||||||||||||||||||||||
| licences and | relationships | developed | Computer | |||||||||||||||||||||
| Goodwill | other | and technology | software | software | Total | |||||||||||||||||||
| £m | £m | £m | £m | £m | £m | |||||||||||||||||||
Cost | ||||||||||||||||||||||||
| At 1 April 2008 | 1,088 | 266 | 248 | 1,896 | 1,281 | 4,779 | ||||||||||||||||||
| Additions | – | – | – | 712 | 127 | 839 | ||||||||||||||||||
| Acquisitions through business combinations | 131 | – | 46 | – | – | 177 | ||||||||||||||||||
| Disposals and adjustments | 1 | (3 | ) | 20 | (225 | ) | (12 | ) | (219 | ) | ||||||||||||||
Impairmentsa | – | – | (26 | ) | (48 | ) | (261 | ) | (335 | ) | ||||||||||||||
| Exchange differences | 269 | 44 | 88 | 13 | 69 | 483 | ||||||||||||||||||
| At 1 April 2009 | 1,489 | 307 | 376 | 2,348 | 1,204 | 5,724 | ||||||||||||||||||
| Additions | – | – | – | 585 | 44 | 629 | ||||||||||||||||||
Acquisitions through business combinationsc | 1 | – | – | – | – | 1 | ||||||||||||||||||
Interest on qualifying assetsb | – | – | – | 2 | – | 2 | ||||||||||||||||||
| Disposals and adjustments | (2 | ) | (6 | ) | (3 | ) | (362 | ) | 9 | (364 | ) | |||||||||||||
| Exchange differences | (56 | ) | (11 | ) | (16 | ) | (5 | ) | (16 | ) | (104 | ) | ||||||||||||
At 31 March 2010 | 1,432 | 290 | 357 | 2,568 | 1,241 | 5,888 | ||||||||||||||||||
Amortisation | ||||||||||||||||||||||||
| At 1 April 2008 | 121 | 67 | 520 | 716 | 1,424 | |||||||||||||||||||
| Charge for the year | 14 | 62 | 433 | 132 | 641 | |||||||||||||||||||
| Disposals and adjustments | (1 | ) | – | (225 | ) | (9 | ) | (235 | ) | |||||||||||||||
| Exchange differences | 22 | 24 | 11 | 49 | 106 | |||||||||||||||||||
| At 1 April 2009 | 156 | 153 | 739 | 888 | 1,936 | |||||||||||||||||||
| Charge for the year | 15 | 54 | 559 | 107 | 735 | |||||||||||||||||||
| Disposals and adjustments | (4 | ) | (1 | ) | (366 | ) | (53 | ) | (424 | ) | ||||||||||||||
| Exchange differences | (5 | ) | (9 | ) | (5 | ) | (12 | ) | (31 | ) | ||||||||||||||
At 31 March 2010 | 162 | 197 | 927 | 930 | 2,216 | |||||||||||||||||||
Carrying amount | ||||||||||||||||||||||||
At 31 March 2010 | 1,432 | 128 | 160 | 1,641 | 311 | 3,672 | ||||||||||||||||||
| At 31 March 2009 | 1,489 | 151 | 223 | 1,609 | 316 | 3,788 | ||||||||||||||||||
| a | Impairment charges of £335m were recognised in 2009, comprising BT Global Services restructuring charges of £81m, BT Global Services contract and financial review charges of £241m (see note 3) and £13m in relation to the review of the 21CN programme and associated voice strategy. All impairment losses were recognised in the income statement. The recoverable amount of the impaired assets was equal to their value in use. | |
| b | Additions to internally generated software in 2010 includes interest capitalised at a weighted average borrowing rate of 7.9%. | |
| c | Additional earnout payment in respect of investment in BT Leasing Limited. |
Goodwill impairment review
The group performs an annual goodwill impairment review, based on its cash generating units (CGUs). The CGUs that have associated goodwill are BT Global Services and the following business units within BT Retail: BT Consumer, BT Business, BT Ireland and BT Enterprises. These are the smallest identifiable groups of assets that generate cash inflows that are largely independent of the cash inflows from other groups of assets, and to which goodwill is allocated. Goodwill is allocated to the group’s CGUs as follows:
| BT Global | BT Retail | |||||||||||||||||||||||
| Services | BT Consumer | BT Business | BT Ireland | BT Enterprises | Total | |||||||||||||||||||
| £m | £m | £m | £m | £m | £m | |||||||||||||||||||
| At 1 April 2008 | 936 | 47 | 34 | 16 | 55 | 1,088 | ||||||||||||||||||
| Acquisitions through business combinations | 37 | 10 | 10 | – | 74 | 131 | ||||||||||||||||||
| Disposals, adjustments and reclassifications | 1 | – | – | – | – | 1 | ||||||||||||||||||
| Exchange differences | 252 | – | – | – | 17 | 269 | ||||||||||||||||||
| At 1 April 2009 | 1,226 | 57 | 44 | 16 | 146 | 1,489 | ||||||||||||||||||
| Acquisitions through business combinations | 1 | – | – | – | – | 1 | ||||||||||||||||||
| Disposals, adjustments and reclassifications | (3 | ) | 8 | 17 | 5 | (29 | ) | (2 | ) | |||||||||||||||
| Exchange differences | (52 | ) | – | – | – | (4 | ) | (56 | ) | |||||||||||||||
At 31 March 2010 | 1,172 | 65 | 61 | 21 | 113 | 1,432 | ||||||||||||||||||
112 BT GROUP PLCANNUAL REPORT & FORM 20-F
Table of Contents
FINANCIAL STATEMENTSNOTES TO THE CONSOLIDATED FINANCIAL STATEMENTS
12. Intangible assets continued
The key assumptions used in performing value in use calculations in 2010 are as follows:
| BT Global | BT Retail | |||||||||||||||||||
| Services | BT Consumer | BT Business | BT Ireland | BT Enterprises | ||||||||||||||||
| Discount rate | 10.8% | 10.8% | 10.8% | 10.8% | 10.8% | |||||||||||||||
| Perpetuity growth rate | 2.5% | 2.0% | 2.0% | 2.0% | 2.0% | |||||||||||||||
The key assumptions used in performing the value in use calculations in 2009 were as follows:
| BT Global | BT Retail | |||||||||||||||||||
| Services | BT Consumer | BT Business | BT Ireland | BT Enterprises | ||||||||||||||||
| Discount rate | 11.1% | 11.1% | 11.1% | 11.1% | 11.1% | |||||||||||||||
| Perpetuity growth rate | 2.5% | 2.0% | 2.0% | 2.0% | 2.0% | |||||||||||||||
Recoverable amount
The value in use of each CGU is determined using cash flow projections derived from financial plans approved by the Board covering a three year period and a further two years approved by the line of business and group senior management team. They reflect management’s expectations of revenue, EBITDA margins, capital expenditure, working capital and operating cash flows, based on past experience and future expectations of business performance. Cash flows are also adjusted downwards to reflect the different risk attributes of each CGU. Cash flows beyond the five year period have been extrapolated using perpetuity growth rates.
Discount rate
The pre-tax discount rates applied to the cash flow forecasts are derived from the group’s post-tax weighted average cost of capital. The assumptions used in the calculation of the group’s weighted average cost of capital are benchmarked to externally available data.
Growth rates
The perpetuity growth rates are determined based on the long-term historical growth rates of the regions in which the CGU operates, and they reflect an assessment of the long-term growth prospects of the sector in which the CGU operates. The growth rates have been benchmarked against external data for the relevant markets. None of the growth rates applied exceed the long-term historical average growth rates for those markets or sectors.
Sensitivities
For the BT Retail CGUs, significant headroom exists in each CGU and, based on the sensitivity analysis performed, no reasonably possible changes in the assumptions would cause the carrying amount of the CGUs to exceed their recoverable amount.
For BT Global Services, the value in use exceeds the carrying value of the CGU by approximately £725m. The following changes in assumptions would cause the recoverable amount to fall below the carrying value:
| 4 | a reduction in the perpetuity growth rate from the 2.5% assumption applied to a revised assumption of 0.5% or less |
| 4 | an increase in the discount rate from the 10.8% assumption applied to a revised assumption of 12.2% or more |
| 4 | a reduction in the projected operating cash flows across five years by 15% or more. |
BT GROUP PLCANNUAL REPORT & FORM 20-F 113
Table of Contents
FINANCIAL STATEMENTSNOTES TO THE CONSOLIDATED FINANCIAL STATEMENTS
13. Property, plant and equipment
| Network | Assets in | |||||||||||||||||||
| Land and | infrastructure | course of | ||||||||||||||||||
| buildings | a,b | equipment | b | Other | c | construction | Total | |||||||||||||
| £m | £m | £m | £m | £m | ||||||||||||||||
Cost | ||||||||||||||||||||
| At 1 April 2008 | 1,209 | 39,117 | 2,194 | 1,240 | 43,760 | |||||||||||||||
| Additions | 8 | 238 | 187 | 1,813 | 2,246 | |||||||||||||||
| Acquisition through business combinations | – | – | 2 | – | 2 | |||||||||||||||
| Transfers | 16 | 2,045 | 19 | (2,080 | ) | – | ||||||||||||||
| Disposals and adjustments | 3 | (373 | ) | (169 | ) | (71 | ) | (610 | ) | |||||||||||
Impairmentsd | – | (121 | ) | (8 | ) | (18 | ) | (147 | ) | |||||||||||
| Exchange differences | 58 | 652 | 149 | 26 | 885 | |||||||||||||||
| At 1 April 2009 | 1,294 | 41,558 | 2,374 | 910 | 46,136 | |||||||||||||||
| Additions | 22 | 254 | 144 | 1,441 | 1,861 | |||||||||||||||
Interest on qualifying assetse | – | – | – | 1 | 1 | |||||||||||||||
| Transfers | 5 | 1,520 | 1 | (1,526 | ) | – | ||||||||||||||
| Disposals and adjustments | 71 | (1,121 | ) | (346 | ) | (14 | ) | (1,410 | ) | |||||||||||
| Exchange differences | (13 | ) | (131 | ) | (22 | ) | (5 | ) | (171 | ) | ||||||||||
At 31 March 2010 | 1,379 | 42,080 | 2,151 | 807 | 46,417 | |||||||||||||||
Accumulated depreciation | ||||||||||||||||||||
| At 1 April 2008 | 500 | 26,404 | 1,574 | – | 28,478 | |||||||||||||||
| Charge for the year | 56 | 1,928 | 265 | – | 2,249 | |||||||||||||||
| Disposals and adjustments | 4 | (395 | ) | (209 | ) | – | (600 | ) | ||||||||||||
| Exchange differences | 30 | 476 | 126 | – | 632 | |||||||||||||||
| At 1 April 2009 | 590 | 28,413 | 1,756 | – | 30,759 | |||||||||||||||
| Charge for the year | 70 | 2,015 | 219 | – | 2,304 | |||||||||||||||
| Disposals and adjustments | 72 | (1,124 | ) | (255 | ) | – | (1,307 | ) | ||||||||||||
| Exchange differences | (7 | ) | (103 | ) | (14 | ) | – | (124 | ) | |||||||||||
At 31 March 2010 | 725 | 29,201 | 1,706 | – | 31,632 | |||||||||||||||
Carrying amount | ||||||||||||||||||||
At 31 March 2010 | 654 | 12,879 | 445 | 807 | 14,785 | |||||||||||||||
| Engineering stores | – | – | – | 71 | 71 | |||||||||||||||
Total at 31 March 2010 | 654 | 12,879 | 445 | 878 | 14,856 | |||||||||||||||
| At 31 March 2009 | 704 | 13,145 | 618 | 910 | 15,377 | |||||||||||||||
| Engineering stores | – | – | – | 28 | 28 | |||||||||||||||
| Total at 31 March 2009 | 704 | 13,145 | 618 | 938 | 15,405 | |||||||||||||||
| 2010 | 2009 | |||||||
| £m | £m | |||||||
a The carrying amount of land and buildings, including leasehold improvements, comprised: | ||||||||
| Freehold | 431 | 451 | ||||||
| Long leases (over 50 years unexpired) | 33 | 30 | ||||||
| Short leases | 190 | 223 | ||||||
Total land and buildings | 654 | 704 | ||||||
| b | The carrying amount of the group’s property, plant and equipment includes an amount of £183m (2009: £216m) in respect of assets held under finance leases, comprising land and buildings of £74m (2009: £76m) and network infrastructure and equipment of £109m (2009: £140m). The depreciation charge on those assets for 2010 was £44m (2009: £49m), comprising land and buildings of £3m (2009: £3m) and network infrastructure and equipment of £41m (2009: £46m). | |
| c | Other mainly comprises motor vehicles and computers. | |
| d | Impairment charges of £147m were recognised in 2009, comprising BT Global Services restructuring charges of £129m and £18m in relation to the review of the 21CN programme and associated voice strategy. All impairment losses were recognised in the income statement. The recoverable amount of the impaired assets was equal to their value in use. | |
| e | Additions to assets in the course of construction in 2010 includes interest capitalised at a weighted average borrowing rate of 7.9%. |
114 BT GROUP PLCANNUAL REPORT & FORM 20-F
Table of Contents
FINANCIAL STATEMENTSNOTES TO THE CONSOLIDATED FINANCIAL STATEMENTS
13. Property, plant and equipment continued
| 2010 | 2009 | |||||||
| Year ended 31 March | £m | £m | ||||||
| Additions to property, plant and equipment comprised: | ||||||||
| Land and buildings | 29 | 23 | ||||||
| Network infrastructure and equipment | ||||||||
| Transmission equipment | 902 | 1,067 | ||||||
| Exchange equipment | 29 | 44 | ||||||
| Other network equipment | 753 | 899 | ||||||
| Other | ||||||||
| Computers and office equipment | 115 | 140 | ||||||
| Motor vehicles and other | 33 | 73 | ||||||
Total additions to property, plant and equipment | 1,861 | 2,246 | ||||||
| Increase in engineering stores | 43 | 3 | ||||||
Total additions | 1,904 | 2,249 | ||||||
14. Investments
| 2010 | 2009 | |||||||
| At 31 March | £m | £m | ||||||
Non current assets | ||||||||
| Available-for-sale | 32 | 23 | ||||||
| Loans and receivables | 32 | 32 | ||||||
| 64 | 55 | |||||||
Current assets | ||||||||
| Available-for-sale | 258 | 153 | ||||||
| Loans and receivables | 148 | 10 | ||||||
| 406 | 163 | |||||||
The credit rating of counterparties with which current asset investments were held is detailed in the table below.
| 2010 | 2009 | |||||||
| At 31 March | £m | £m | ||||||
Moody’s/S&P credit ratinga | ||||||||
| Aaa/AAA | 258 | 153 | ||||||
| Aa3/AA- | 35 | – | ||||||
| A1/A+ | 105 | 10 | ||||||
| A2/A | 8 | – | ||||||
Total current asset investments | 406 | 163 | ||||||
| a | Current asset investment balances with counterparties have been classified at the lower of their Moody’s and S&P rating. |
The majority of current asset investments are held for periods ranging from one day to one year.
Available-for-sale
Available-for-sale current assets consist of floating rate liquidity fund deposits denominated in Sterling of £185m (2009: £97m), Euros of £56m (2009: £43m) and US Dollars of £17m (2009: £13m) which are immediately accessible to the group to manage liquidity.
Loans and receivables
Loans and receivables mainly consist of term deposits denominated in Sterling with a fixed interest rate.
BT GROUP PLCANNUAL REPORT & FORM 20-F 115
Table of Contents
FINANCIAL STATEMENTSNOTES TO THE CONSOLIDATED FINANCIAL STATEMENTS
15. Associates and joint ventures
| 2010 | 2009 | |||||||||||||||||||||||
| Associates | Joint ventures | Total | Associates | Joint ventures | Total | |||||||||||||||||||
| £m | £m | £m | £m | £m | £m | |||||||||||||||||||
| Non current assets | 49 | 7 | 56 | 41 | 7 | 48 | ||||||||||||||||||
| Current assets | 278 | 4 | 282 | 168 | 4 | 172 | ||||||||||||||||||
| Current liabilities | (77 | ) | (2 | ) | (79 | ) | (86 | ) | (2 | ) | (88 | ) | ||||||||||||
| Non current liabilities | (64 | ) | – | (64 | ) | – | – | – | ||||||||||||||||
Share of net assets at 31 March | 186 | 9 | 195 | 123 | 9 | 132 | ||||||||||||||||||
| Revenue | 298 | 14 | 312 | 308 | 15 | 323 | ||||||||||||||||||
| Expenses | (266 | ) | (14 | ) | (280 | ) | (262 | ) | (15 | ) | (277 | ) | ||||||||||||
| Taxation | (7 | ) | – | (7 | ) | (7 | ) | – | (7 | ) | ||||||||||||||
Share of post tax results before specific items | 25 | – | 25 | 39 | – | 39 | ||||||||||||||||||
| Specific items (note 5) | ||||||||||||||||||||||||
| – impact of renegotiated supply contracts on associate | 29 | – | 29 | – | – | – | ||||||||||||||||||
| – reassessment of carrying value of associate | – | – | – | 36 | – | 36 | ||||||||||||||||||
Share of post tax results | 54 | – | 54 | 75 | – | 75 | ||||||||||||||||||
| Associates | Joint ventures | Total | ||||||||||
| £m | £m | £m | ||||||||||
| At 1 April 2008 | 79 | 6 | 85 | |||||||||
| Share of post tax profit | 75 | – | 75 | |||||||||
| Dividends received | (6 | ) | – | (6 | ) | |||||||
| Exchange differences and other | (25 | ) | 3 | (22 | ) | |||||||
| At 1 April 2009 | 123 | 9 | 132 | |||||||||
| Share of post tax profit | 54 | – | 54 | |||||||||
| Additions | 3 | – | 3 | |||||||||
| Disposals (note 5) | (12 | ) | – | (12 | ) | |||||||
| Dividends received | (3 | ) | – | (3 | ) | |||||||
| Exchange differences and other | 21 | – | 21 | |||||||||
At 31 March 2010 | 186 | 9 | 195 | |||||||||
At 31 March 2010 the fair value of the group’s investments in associates and joint ventures for which published price quotations are available was £473m (2009: £153m). Details of the group’s principal associate at 31 March 2010 are set out on page 149.
16. Inventories
| 2010 | 2009 | |||||||
| At 31 March | £m | £m | ||||||
| Consumables | 30 | 23 | ||||||
| Work in progress | 43 | 57 | ||||||
| Finished goods | 34 | 41 | ||||||
| 107 | 121 | |||||||
116 BT GROUP PLCANNUAL REPORT & FORM 20-F
Table of Contents
FINANCIAL STATEMENTSNOTES TO THE CONSOLIDATED FINANCIAL STATEMENTS
17. Trade and other receivables
| 2010 | 2009 | |||||||
| At 31 March | £m | £m | ||||||
Current | ||||||||
| Trade receivables | 1,937 | 1,966 | ||||||
| Prepayments | 549 | 825 | ||||||
| Accrued income | 1,010 | 1,135 | ||||||
| Other receivables | 200 | 259 | ||||||
| 3,696 | 4,185 | |||||||
| 2010 | 2009 | |||||||
| £m | £m | |||||||
Non current | ||||||||
Other assetsa | 336 | 322 | ||||||
| a | Other assets mainly represents costs relating to the initial set up, transition or transformation phase of long-term networked IT services contracts. At 31 March 2010 the balance was £294m (2009: £322m). Other assets also include prepayments of £42m (2009: £nil). |
Trade receivables are stated after deducting allowances for doubtful debts, as follows:
| 2010 | 2009 | |||||||
| £m | £m | |||||||
| At 1 April | 246 | 209 | ||||||
| Expense recognised in the income statement | 155 | 151 | ||||||
| Utilised in the year | (183 | ) | (139 | ) | ||||
| Acquisitions | – | 4 | ||||||
| Exchange differences | 1 | 21 | ||||||
| At 31 March | 219 | 246 | ||||||
Trade receivables are continuously monitored and allowances applied against trade receivables consist of both specific impairments and collective impairments based on the group’s historical loss experiences for the relevant aged category and taking into account general economic conditions. Historical loss experience allowances are calculated by line of business in order to reflect the specific nature of the customers relevant to that line of business.
Trade receivables are due as follows:
| Past due and not specifically impaired: | ||||||||||||||||||||||||||||
| Trade | ||||||||||||||||||||||||||||
| receivables | ||||||||||||||||||||||||||||
| specifically | ||||||||||||||||||||||||||||
| impaired net | Between 0 | Between 3 | Between 6 | Over 12 | ||||||||||||||||||||||||
| Not past due | of provision | and 3 months | and 6 months | and 12 months | months | Total | ||||||||||||||||||||||
| £m | £m | £m | £m | £m | £m | £m | ||||||||||||||||||||||
2010 | 1,257 | 51 | 426 | 98 | 60 | 45 | 1,937 | |||||||||||||||||||||
| 2009 | 1,263 | 1 | 474 | 90 | 65 | 73 | 1,966 | |||||||||||||||||||||
Gross trade receivables which have been specifically impaired amounted to £230m (2009: £30m).
BT GROUP PLCANNUAL REPORT & FORM 20-F 117
Table of Contents
FINANCIAL STATEMENTSNOTES TO THE CONSOLIDATED FINANCIAL STATEMENTS
17. Trade and other receivables continued
Trade receivables not past due and accrued income are analysed below by line of business. The nature of customers associated with each line of business is disclosed in note 1.
| 2010 | 2009 | |||||||
| At 31 March | £m | £m | ||||||
| BT Global Services | 867 | 878 | ||||||
| BT Retail | 228 | 308 | ||||||
| BT Wholesale | 127 | 64 | ||||||
| Openreach | 27 | 3 | ||||||
| Other | 8 | 10 | ||||||
Total trade receivables not past due | 1,257 | 1,263 | ||||||
| 2010 | 2009 | |||||||
| At 31 March | £m | £m | ||||||
| BT Global Services | 633 | 635 | ||||||
| BT Retail | 148 | 274 | ||||||
| BT Wholesale | 182 | 195 | ||||||
| Openreach | 44 | 26 | ||||||
| Other | 3 | 5 | ||||||
Total accrued income | 1,010 | 1,135 | ||||||
Given the broad and varied nature of the group’s customer base, the analysis of trade receivables not past due and accrued income by line of business is considered the most appropriate disclosure of credit concentrations. Cash collateral held against trade and other receivables amounted to £25m (2009: £23m).
118 BT GROUP PLCANNUAL REPORT & FORM 20-F
Table of Contents
FINANCIAL STATEMENTSNOTES TO THE CONSOLIDATED FINANCIAL STATEMENTS
18. Loans and other borrowings
| 2010 | 2009 | |||||||
| At 31 March | £m | £m | ||||||
Sterling 6.375% bonds June 2037b | 521 | 521 | ||||||
US Dollar 9.625% (2009: 9.125%) notes December 2030 (minimum 8.625%a)b | 1,811 | 1,914 | ||||||
Sterling 5.75% bonds December 2028c | 602 | 608 | ||||||
| Sterling 3.5% indexed linked notes April 2025 | 325 | 330 | ||||||
| Sterling 8.625% bonds March 2020 | 298 | 298 | ||||||
US Dollar 5.95% bonds January 2018b | 734 | 777 | ||||||
Sterling 6.625% bonds June 2017b | 525 | 524 | ||||||
Sterling 8.5% (2009: 8.0%) notes December 2016 (minimum 7.5%a) | 715 | 713 | ||||||
Euro 6.5% bonds July 2015b | 935 | 973 | ||||||
Euro 6.125% bonds July 2014b,f | 561 | – | ||||||
Euro 5.25% bonds June 2014b | 696 | 723 | ||||||
Euro 5.25% bonds January 2013b | 902 | 935 | ||||||
US Dollar 5.15% bonds January 2013b | 566 | 599 | ||||||
Euro 7.87% (2009: 7.375%) notes February 2011 (minimum 6.875%a)b | 1,015 | 1,051 | ||||||
US Dollar 9.125% (2009: 8.625%) notes December 2010 (minimum 8.125%a)b | 1,951 | 2,074 | ||||||
US Dollar 8.765% bonds August 2009d | – | 149 | ||||||
Total listed bonds, debentures and notes | 12,157 | 12,189 | ||||||
Finance leases | 304 | 332 | ||||||
Commercial paperb,e | – | 715 | ||||||
| Sterling 6.35% bank loan due August 2012 | 312 | 312 | ||||||
| Sterling 10.4% bank loan due September 2009 | – | 140 | ||||||
| Sterling floating rate note 2009-2010 | – | 28 | ||||||
| Other loans 2009-2012 | 10 | 6 | ||||||
| Bank overdrafts (of which £nil (2009: £160m) had a legally enforceable right | ||||||||
| of set off – see note 10) | 8 | 185 | ||||||
Total other loans and borrowings | 330 | 1,386 | ||||||
Total loans and other borrowings | 12,791 | 13,907 | ||||||
| a | The interest rate payable on these notes will be subject to adjustment from time to time if either Moody’s or Standard and Poor’s (S&P) reduce the rating ascribed to the group’s senior unsecured debt below A3 in the case of Moody’s or below A– in the case of S&P. In this event, the interest rate payable on the notes and the spread applicable to the floating notes will be increased by 0.25% for each ratings category adjustment by each rating agency. In addition, if Moody’s or S&P subsequently increase the ratings ascribed to the group’s senior unsecured debt, then the interest rate then payable on notes and the spread applicable to the floating notes will be decreased by 0.25% for each rating category upgrade by each rating agency, but in no event will the interest rate be reduced below the minimum interest rate reflected in the above table. In February 2010, S&P downgraded BT’s credit rating by one ratings category to BBB– as detailed on page 138. At the next coupon date in the 2011 financial year, the rate payable on these bonds will therefore increase by 0.25 percentage points. | |
| b | Hedged in a designated cash flow hedge. | |
| c | Hedged in a designated fair value hedge. | |
| d | Hedged in a designated cash flow and fair value hedge. | |
| e | Commercial paper is denominated in Sterling of £nil (2009: £209m) and Euros of £nil (2009: £506m). | |
| f | The group’s €600m bond issued in June 2009 would attract an additional 1.25 percentage points for a downgrade by one credit rating category by both Moody’s and S&P below Baa3/BBB– respectively. |
The interest rates payable on loans and borrowings disclosed above reflect the coupons on underlying issued loans and borrowings and not the interest rates achieved through applying associated currency and interest rate swaps in hedge arrangements.
The carrying values disclosed above reflect balances at amortised cost adjusted for deferred and current fair value adjustments to the relevant loans or borrowings’ hedged risk in a fair value hedge. This does not reflect the final principal repayment that will arise after taking account of the relevant derivatives in hedging relationships which is reflected in the table below. Apart from finance leases, all borrowings as at 31 March 2010 and 2009 were unsecured.
| 2010 | 2009 | |||||||||||||||||||||||
| Effect of | Principal | Effect of | Principal | |||||||||||||||||||||
| Carrying | hedging | repayments at | Carrying | hedging and | repayments at | |||||||||||||||||||
| amount | and interest | a | hedged rates | amount | interest | a | hedged rates | |||||||||||||||||
| At 31 March | £m | £m | £m | £m | £m | £m | ||||||||||||||||||
| Repayments fall due as follows: | ||||||||||||||||||||||||
Within one year, or on demand | 3,269 | (737 | ) | 2,532 | 1,542 | (352 | ) | 1,190 | ||||||||||||||||
| Between one and two years | 18 | – | 18 | 3,098 | (551 | ) | 2,547 | |||||||||||||||||
| Between two and three years | 1,763 | (313 | ) | 1,450 | 10 | – | 10 | |||||||||||||||||
| Between three and four years | 11 | – | 11 | 1,829 | (380 | ) | 1,449 | |||||||||||||||||
| Between four and five years | 1,213 | (177 | ) | 1,036 | 14 | – | 14 | |||||||||||||||||
| After five years | 6,523 | (431 | ) | 6,092 | 7,412 | (799 | ) | 6,613 | ||||||||||||||||
Total due for repayment after more than one year | 9,528 | (921 | ) | 8,607 | 12,363 | (1,730 | ) | 10,633 | ||||||||||||||||
Total repayments | 12,797 | (1,658 | ) | 11,139 | 13,905 | (2,082 | ) | 11,823 | ||||||||||||||||
| Fair value adjustments for hedged risk | (6 | ) | 2 | |||||||||||||||||||||
Total loans and other borrowings | 12,791 | 13,907 | ||||||||||||||||||||||
| a | Adjustments for hedging and interest reflect the impact of the currency element of derivatives and adjust the repayments to exclude interest recognised in the carrying amount. |
BT GROUP PLCANNUAL REPORT & FORM 20-F 119
Table of Contents
FINANCIAL STATEMENTSNOTES TO THE CONSOLIDATED FINANCIAL STATEMENTS
18. Loans and other borrowings continued
As noted on page 119, the principal repayments of loans and borrowings at hedged rates amounted to £11,139m (2009: £11,823m). The table below reflects the currency risk and interest cash flow and fair value risk associated with these loans and borrowings after the impact of hedging.
| 2010 | 2009 | |||||||||||||||||||||||
| Fixed rate | Floating rate | Fixed rate | Floating rate | |||||||||||||||||||||
| interest | interest | Total | interest | interest | Total | |||||||||||||||||||
| At 31 March | £m | £m | £m | £m | £m | £m | ||||||||||||||||||
| Sterling | 10,110 | 835 | 10,945 | 10,239 | 1,373 | 11,612 | ||||||||||||||||||
| Euro | – | 184 | 184 | – | 204 | 204 | ||||||||||||||||||
| US Dollar | – | 3 | 3 | – | 2 | 2 | ||||||||||||||||||
| Other | – | 7 | 7 | – | 5 | 5 | ||||||||||||||||||
Total | 10,110 | 1,029 | 11,139 | 10,239 | 1,584 | 11,823 | ||||||||||||||||||
| Weighted average effective fixed interest rate Sterling | 8.0% | 8.1% | ||||||||||||||||||||||
| The floating rate loans and borrowings bear interest rates fixed in advance for periods ranging from one day to one year, primarily by reference to LIBOR and EURIBOR quoted rates. | ||||||||||||||||||||||||
| 2010 | 2009 | 2010 | 2009 | |||||||||||||||||||||
| Repayment of outstanding | ||||||||||||||||||||||||
| Minimum lease payments | lease obligations | |||||||||||||||||||||||
| At 31 March | £m | £m | £m | £m | ||||||||||||||||||||
| Amounts payable under finance leases: | ||||||||||||||||||||||||
| Within one year | 33 | 32 | 16 | 14 | ||||||||||||||||||||
| In the second to fifth years inclusive | 119 | 135 | 48 | 66 | ||||||||||||||||||||
| After five years | 422 | 456 | 240 | 252 | ||||||||||||||||||||
| 574 | 623 | 304 | 332 | |||||||||||||||||||||
| Less: future finance charges | (270 | ) | (291 | ) | – | – | ||||||||||||||||||
Total finance lease obligations | 304 | 332 | 304 | 332 | ||||||||||||||||||||
| Assets held under finance leases mainly consist of buildings and network assets. The group’s obligations under finance leases are secured by the lessors’ title to the leased assets. | ||||||||||||||||||||||||
19. Derivative financial instruments | ||||||||||||||||||||||||
| 2010 | 2009 | a | 2008 | a | ||||||||||||||||||||
| Assets | Liabilities | Assets | Liabilities | Assets | Liabilities | |||||||||||||||||||
| At 31 March | £m | £m | £m | £m | £m | £m | ||||||||||||||||||
| Interest rate swaps – cash flow hedge | – | 361 | – | 446 | 1 | 207 | ||||||||||||||||||
| Interest rate swaps – fair value hedge | – | 6 | – | – | – | – | ||||||||||||||||||
| Other interest rate swaps | 106 | 295 | 107 | 316 | 25 | 239 | ||||||||||||||||||
| Cross currency swaps – cash flow hedge | 1,571 | 30 | 2,541 | 1 | 340 | 605 | ||||||||||||||||||
| Cross currency swaps – fair value hedge | – | – | 18 | – | – | 20 | ||||||||||||||||||
| Other cross currency swaps | – | 1 | – | – | – | – | ||||||||||||||||||
| Forward foreign exchange contracts – cash flow hedge | 23 | 4 | 27 | 1 | 20 | 1 | ||||||||||||||||||
| Other forward foreign exchange contracts | – | 2 | 7 | 2 | 1 | – | ||||||||||||||||||
| Credit default swaps | – | – | – | 1 | – | – | ||||||||||||||||||
| 1,700 | 699 | 2,700 | 767 | 387 | 1,072 | |||||||||||||||||||
| Analysed as: | ||||||||||||||||||||||||
| Current | 624 | 166 | 158 | 56 | 71 | 58 | ||||||||||||||||||
| Non current | 1,076 | 533 | 2,542 | 711 | 316 | 1,014 | ||||||||||||||||||
| 1,700 | 699 | 2,700 | 767 | 387 | 1,072 | |||||||||||||||||||
| a | Restated. See page 94. |
120 BT GROUP PLCANNUAL REPORT & FORM 20-F
Table of Contents
FINANCIAL STATEMENTSNOTES TO THE CONSOLIDATED FINANCIAL STATEMENTS
19. Derivative financial instruments continued
The credit rating of counterparties with which derivative financial assets were held is detailed in the table below.
| 2010 | 2009 | |||||||
| At 31 March | £m | £m | ||||||
Moody’s/S&P credit ratinga | ||||||||
| Aa2/AA | 89 | 200 | ||||||
| Aa3/AA– | 480 | 650 | ||||||
| A1/A+ | 708 | 1,030 | ||||||
| A2/A | 318 | 719 | ||||||
| A3/A– | 105 | 101 | ||||||
| 1,700 | 2,700 | |||||||
| a | Derivative financial instrument balances with counterparties have been classified at the lower of their Moody’s and S&P rating. |
In 2010 derivative financial assets were held with 18 counterparties (2009: 19 counterparties). After applying the legal right of set off under the group’s International Swaps and Derivative Association (ISDA) documentation, the group had a net exposure to derivative counterparties of £1,303m (2009: £2,282m). Of this, 85% (2009: 85%) was with 6 counterparties (2009: 6). Details of hedges in which the derivative financial instruments are utilised are disclosed in note 32.
20. Trade and other payables
| 2010 | 2009 | |||||||
| At 31 March | £m | £m | ||||||
Current | ||||||||
| Trade payables | 3,668 | 4,367 | ||||||
| Other taxation and social security | 516 | 489 | ||||||
| Other payables | 506 | 527 | ||||||
| Accrued expenses | 498 | 460 | ||||||
| Deferred income | 1,343 | 1,372 | ||||||
| 6,531 | 7,215 | |||||||
| 2010 | 2009 | |||||||
| At 31 March | £m | £m | ||||||
Non current | ||||||||
| Other payables | 734 | 718 | ||||||
| Deferred income | 70 | 76 | ||||||
| 804 | 794 | |||||||
Non current payables mainly relate to operating lease liabilities and deferred gains on a prior period sale and finance leaseback transaction.
BT GROUP PLCANNUAL REPORT & FORM 20-F 121
Table of Contents
FINANCIAL STATEMENTSNOTES TO THE CONSOLIDATED FINANCIAL STATEMENTS
21. Provisions
| BT Global | Property | Other | ||||||||||||||
| Services provisions | a | provisions | b | provisions | c | Total | ||||||||||
| £m | £m | £m | £m | |||||||||||||
| At 1 April 2009 | 303 | 172 | 245 | 720 | ||||||||||||
Charged to the income statementd | 10 | 131 | 204 | 345 | ||||||||||||
| Unwind of discount | – | 4 | – | 4 | ||||||||||||
| Utilised in the year | (139 | ) | (35 | ) | (98 | ) | (272 | ) | ||||||||
| Transfers | 16 | – | 31 | 47 | ||||||||||||
| Exchange differences | (3 | ) | – | – | (3 | ) | ||||||||||
At 31 March 2010 | 187 | 272 | 382 | 841 | ||||||||||||
| 2010 | 2009 | |||||||
| At 31 March | £m | £m | ||||||
| Analysed as: | ||||||||
| Current | 134 | 254 | ||||||
| Non current | 707 | 466 | ||||||
| 841 | 720 | |||||||
| a | Amounts provided in relation to the BT Global Services restructuring programme and the contract and the financial reviews in 2009. These will be utilised as the obligations are settled. | |
| b | Property provisions mainly comprise onerous lease provisions arising from the rationalisation of the group’s property portfolio. The provisions will be utilised over the remaining lease periods, which range from one to 22 years. Financial liabilities comprise £255m (2009: £166m) of this balance. | |
| c | Other provisions includes: – Amounts provided for incremental and directly attributable costs arising from the group’s obligation to deliver the Undertakings, which will be utilised within one year. – Amounts provided for legal or constructive obligations arising from insurance claims, litigation and regulatory risk, which will be utilised as the obligations are settled. | |
| d | Includes specific items of £121m for property rationalisation costs and £10m relating to the BT Global Services restructuring programme. |
22. Deferred taxation
| Retirement | ||||||||||||||||||||
| Excess capital | benefit | Share-based | ||||||||||||||||||
| allowances | obligations | a | payments | Other | Total | |||||||||||||||
| £m | £m | £m | £m | £m | ||||||||||||||||
| At 1 April 2008 | 1,969 | 778 | (51 | ) | (183 | ) | 2,513 | |||||||||||||
| (Credit) expense recognised in the income statement | (158 | ) | 78 | 32 | 7 | (41 | ) | |||||||||||||
| (Credit) expense recognised in equity | – | (1,959 | ) | 12 | 100 | (1,847 | ) | |||||||||||||
| At 31 March 2009 | 1,811 | (1,103 | ) | (7 | ) | (76 | ) | 625 | ||||||||||||
| Deferred tax asset | – | (1,103 | ) | – | – | (1,103 | ) | |||||||||||||
| Deferred tax liability | 1,811 | – | (7 | ) | (76 | ) | 1,728 | |||||||||||||
| At 1 April 2009 | 1,811 | (1,103 | ) | (7 | ) | (76 | ) | 625 | ||||||||||||
| (Credit) expense recognised in the income statement | (115 | ) | 118 | (15 | ) | 2 | (10 | ) | ||||||||||||
| (Credit) expense recognised in equity | – | (1,211 | ) | (19 | ) | (143 | ) | (1,373 | ) | |||||||||||
| Transfer from current tax | – | – | – | 18 | 18 | |||||||||||||||
At 31 March 2010 | 1,696 | (2,196 | ) | (41 | ) | (199 | ) | (740 | ) | |||||||||||
| Deferred tax asset | – | (2,196 | ) | – | – | (2,196 | ) | |||||||||||||
| Deferred tax liability | 1,696 | – | (41 | ) | (199 | ) | 1,456 | |||||||||||||
At 31 March 2010 | 1,696 | (2,196 | ) | (41 | ) | (199 | ) | (740 | ) | |||||||||||
| a | Includes a deferred tax asset of £3m (2009: £nil) arising on contributions payable to defined contribution schemes. |
At 31 March 2010, all of the deferred tax asset of £2,196m (2009: £1,103m) is expected to be recovered after more than one year. At 31 March 2010, all of the deferred tax liability of £1,456m (2009: £1,728m) is expected to be settled after more than one year.
122 BT GROUP PLCANNUAL REPORT & FORM 20-F
Table of Contents
FINANCIAL STATEMENTSNOTES TO THE CONSOLIDATED FINANCIAL STATEMENTS
22. Deferred taxation continued
At 31 March 2010 the group had operating losses, capital losses and other temporary differences carried forward in respect of which no deferred tax assets were recognised amounting to £29.5bn (2009: £24.3bn). The group’s capital losses and other temporary differences have no expiry date restrictions. The expiry date of operating losses carried forward is dependent upon the tax law of the various territories in which the losses arose. A summary of expiry dates for losses in respect of which restrictions apply is set out below:
| 2010 | Expiry of | |||||||
| At 31 March | £m | losses | ||||||
Restricted losses: | ||||||||
| Americas | 284 | 2010-2029 | ||||||
| Europe | 1,719 | 2010-2025 | ||||||
Total restricted losses | 2,003 | |||||||
Unrestricted losses: | ||||||||
| Operating losses | 3,278 | No expiry | ||||||
| Capital losses | 23,439 | No expiry | ||||||
| Other | 775 | No expiry | ||||||
Total unrestricted losses | 27,492 | |||||||
Total | 29,495 | |||||||
At 31 March 2010, the undistributed earnings of overseas subsidiaries was £5.5bn (2009: £10.1bn). No deferred tax liabilities have been recognised in respect of these unremitted earnings because the group is in a position to control the timing of the reversal of the temporary differences and it is probable that such differences will not reverse in the foreseeable future. Temporary differences arising in connection with interests in associates and joint ventures for which deferred tax liabilities have not been recognised are insignificant.
23. Minority interests
| 2010 | 2009 | |||||||
| £m | £m | |||||||
| At 1 April | 27 | 23 | ||||||
| Share of profits | 1 | 2 | ||||||
| Disposals | (4 | ) | (9 | ) | ||||
| Minority share of dividend paid | – | (1 | ) | |||||
| Acquisitions through business combinations | – | 3 | ||||||
| Exchange differences | – | 9 | ||||||
| At 31 March | 24 | 27 | ||||||
24. Share capital
| Number | Share capital | a | Share premium | b | ||||||||
| of shares | £m | £m | ||||||||||
| At 1 April 2008 | 8,401,227,029 | 420 | 62 | |||||||||
Cancelledc | (250,000,000 | ) | (12 | ) | – | |||||||
| At 1 April 2009 and 31 March 2010 | 8,151,227,029 | 408 | 62 | |||||||||
| a | The authorised share capital of the company up to 1 October 2009 was £13,463m, representing 269,260,253,468 ordinary shares of 5p each. The allotted, called up and fully paid ordinary share capital of the company at 31 March 2010 and 31 March 2009 was £408m, representing 8,151,227,029 ordinary shares of 5p each. | |
| b | The share premium account, representing the premium on allotment of shares, is not available for distribution. | |
| c | In 2010 the group cancelled nil treasury shares (2009: 250,000,000) with a nominal value of £nil (2009: £12m). |
BT GROUP PLCANNUAL REPORT & FORM 20-F 123
Table of Contents
FINANCIAL STATEMENTSNOTES TO THE CONSOLIDATED FINANCIAL STATEMENTS
25. Other reserves
| Treasury | Cash flow | Available-for- | Translation | Merger | Total other | |||||||||||||||||||
| shares | a | reserve | b | sale reserve | c | reserve | d | reserve | e | reserves | ||||||||||||||
| £m | £m | £m | £m | £m | £m | |||||||||||||||||||
| At 1 April 2007 | (884 | ) | 23 | – | (49 | ) | 998 | 88 | ||||||||||||||||
| Exchange differences | – | – | – | 210 | – | 210 | ||||||||||||||||||
| Net fair value gain on cash flow hedges | – | 446 | – | – | – | 446 | ||||||||||||||||||
| Recognised in income and expense in the year | – | (294 | ) | – | – | – | (294 | ) | ||||||||||||||||
| Reclassified and reported in non current assets | – | 11 | – | – | – | 11 | ||||||||||||||||||
| Tax recognised in other comprehensive income | – | (29 | ) | – | – | – | (29 | ) | ||||||||||||||||
| Net purchase of treasury shares | (1,529 | ) | – | – | – | – | (1,529 | ) | ||||||||||||||||
| Cancellation of treasury shares | 570 | – | – | – | – | 570 | ||||||||||||||||||
| At 1 April 2008 | (1,843 | ) | 157 | – | 161 | 998 | (527 | ) | ||||||||||||||||
| Exchange differences | – | – | – | 683 | – | 683 | ||||||||||||||||||
| Net fair value gain on cash flow hedges | – | 2,719 | – | – | – | 2,719 | ||||||||||||||||||
| Recognised in income and expense in the year | – | (2,144 | ) | – | – | – | (2,144 | ) | ||||||||||||||||
| Reclassified and reported in non current assets | – | (5 | ) | – | – | – | (5 | ) | ||||||||||||||||
| Gains on available-for-sale investments | – | – | 5 | – | – | 5 | ||||||||||||||||||
| Tax recognised in other comprehensive income | – | (164 | ) | – | – | – | (164 | ) | ||||||||||||||||
| Net purchase of treasury shares | (63 | ) | – | – | – | – | (63 | ) | ||||||||||||||||
| Cancellation of treasury shares | 797 | – | – | – | – | 797 | ||||||||||||||||||
| At 1 April 2009 | (1,109 | ) | 563 | 5 | 844 | 998 | 1,301 | |||||||||||||||||
| Exchange differences | – | – | – | (119 | ) | – | (119 | ) | ||||||||||||||||
| Net fair value loss on cash flow hedges | – | (1,067 | ) | – | – | – | (1,067 | ) | ||||||||||||||||
| Recognised in income and expense in the year | – | 496 | – | – | – | 496 | ||||||||||||||||||
| Reclassified and reported in non current assets | – | (4 | ) | – | – | – | (4 | ) | ||||||||||||||||
| Gains on available-for-sale investments | – | – | 7 | – | – | 7 | ||||||||||||||||||
| Tax recognised in other comprehensive income | – | 159 | – | (20 | ) | – | 139 | |||||||||||||||||
| Net issue of treasury shares | 4 | – | – | – | – | 4 | ||||||||||||||||||
At 31 March 2010 | (1,105 | ) | 147 | 12 | 705 | 998 | 757 | |||||||||||||||||
| a | The treasury shares reserve is used to hold BT Group plc shares purchased by the group. During 2010 the company purchased nil (2009: 142,608,225, 2008: 539,657,691) of its own shares of 5p each, representing nil% (2009: 2%, 2008: 6%) of the called-up share capital, for consideration (including transaction costs) of £nil (2009: £189m, 2008: £1,626m). In addition, 8,320,766 shares (2009: 90,626,518, 2008: 53,250,144) were issued from treasury to satisfy obligations under employee share schemes and executive share awards at a cost of £4m (2009: £126m, 2008: £97m), and nil treasury shares (2009 and 2008: 250,000,000) were cancelled at a cost of £nil (2009: £797m, 2008: £570m). At 31 March 2010, 400,906,119 shares (2009: 409,226,885, 2008: 607,285,178) with an aggregate nominal value of £20m (2009: £20m, 2008: £30m) were held as treasury shares at cost. | |
| b | The cash flow reserve is used to record the effective portion of the cumulative net change in the fair value of cash flow hedging instruments related to hedged transactions that have not yet occurred. | |
| c | The available-for-sale reserve is used to record the cumulative fair value gains and losses on available-for-sale financial assets. The cumulative gains and losses are recycled to the income statement on disposal of the assets. The gross gain in the year amounted to £7m (2009: £5m, 2008: £nil). | |
| d | The translation reserve is used to record cumulative translation differences on the assets and liabilities of foreign operations. The cumulative translation differences are recycled to the income statement on disposal of the foreign operation. | |
| e | The merger reserve arose on the group reorganisation that occurred in November 2001 and represented the difference between the nominal value of shares in the new parent company, BT Group plc, and the aggregate of the share capital, share premium account and capital redemption reserve of the prior parent company, British Telecommunications plc. |
26. Related party transactions
Key management personnel comprise executive and non-executive directors and members of theOperating Committee. Key management personnel compensation is shown in the table below:
| 2010 | 2009 | a | 2008 | a | ||||||||
| Year ended 31 March | £m | £m | £m | |||||||||
| Salaries and short-term benefits | 10.3 | 8.4 | 8.3 | |||||||||
| Termination benefits | 0.1 | 2.4 | – | |||||||||
| Post employment benefits | 1.8 | 2.3 | 1.0 | |||||||||
| Share-based payments | 2.6 | 3.6 | 5.0 | |||||||||
| 14.8 | 16.7 | 14.3 | ||||||||||
| a | Restated to include the Chairman and non-executive directors. |
More detailed information concerning directors’ remuneration, shareholdings, pension entitlements, share options and other long-term incentive plans is shown in the audited part of the Report on Directors’ Remuneration (pages 73 to 77), which forms part of the consolidated financial statements.
Amounts paid to the group’s retirement benefit plans are set out in note 29. There were a number of transactions during the year between the company and its subsidiary undertakings, which are eliminated on consolidation and therefore not disclosed.
During 2010, the group purchased services in the normal course of business and on an arm’s length basis from its principal associate, Tech Mahindra Limited. The net value of services purchased was £301m (2009: £296m, 2008: £305m) and the amount outstanding and payable for services at 31 March 2010 was £65m (2009: £89m, 2008: £125m). In addition in 2010 a cash payment of £127m was made to Tech Mahindra Limited for the renegotiation of certain supply contracts as part of the rationalisation of procurement channels within BT Global Services. In 2008, a cash payment of £55m was received from Tech Mahindra Limited, which was recognised as income in 2008 (£28m) and 2009 (£27m).
124 BT GROUP PLCANNUAL REPORT & FORM 20-F
Table of Contents
FINANCIAL STATEMENTSNOTES TO THE CONSOLIDATED FINANCIAL STATEMENTS
27. Financial commitments and contingent liabilities
| 2010 | 2009 | |||||||
| Capital expenditure contracted for at the balance sheet date but not yet incurred was as follows: | £m | £m | ||||||
| Property, plant and equipment | 368 | 414 | ||||||
| Computer software | 15 | 37 | ||||||
Total | 383 | 451 | ||||||
| 2010 | 2009 | |||||||
| Future minimum operating lease payments for the group were as follows: | £m | £m | ||||||
| Payable in the year ending 31 March: | ||||||||
| 2010 | – | 484 | ||||||
| 2011 | 494 | 455 | ||||||
| 2012 | 460 | 430 | ||||||
| 2013 | 431 | 403 | ||||||
| 2014 | 400 | 377 | ||||||
| 2015 | 375 | 356 | ||||||
| Thereafter | 5,527 | 5,499 | ||||||
Total future minimum operating lease payments | 7,687 | 8,004 | ||||||
Operating lease commitments were mainly in respect of land and buildings which arose from a sale and operating leaseback transaction in a prior period. Leases have an average term of 22 years (2009: 23 years) and rentals are fixed for an average of 22 years (2009: 23 years).
At 31 March 2010, other than as disclosed below, there were no contingent liabilities or guarantees other than those arising in the ordinary course of the group’s business and on these no material losses are anticipated. The group has insurance cover to certain limits for major risks on property and major claims in connection with legal liabilities arising in the course of its operations. Otherwise, the group generally carries its own risks.
The group has provided guarantees relating to certain leases entered into by O2 UK Limited prior to its demerger with O2 on 19 November 2001. O2 plc has given BT a counter indemnity for these guarantees. The maximum exposure was US$132m as at 31 March 2010 (2009: US$110m), approximately £87m (2009: £77m), although this could increase by a further US$304m (2009: US$399m), approximately £200m (2009: £278m), in the event of credit default in respect of amounts used to defease future lease obligations. The guarantee lasts until O2 UK Limited has discharged all its obligations, which is expected to be when the lease ends on 30 January 2017.
We do not believe that there is any single current court action that would have a material adverse effect on the financial position or operations of the group. However the aggregate volume and value of legal actions to which the group is party has increased significantly during 2010.
There have been criminal proceedings in Italy against 21 defendants, including a former BT employee, in connection with the Italian UMTS (universal mobile telecommunication system) auction in 2000. Blu, in which BT held a minority interest, participated in that auction process. On 20 July 2005, the former BT employee was found not culpable of the fraud charge brought by the Rome Public Prosecutor. All the other defendants were also acquitted. The Public Prosecutor has appealed the court’s decision. The appeal was unsuccessful and no damages follow.
The European Commission formally investigated the way the UK Government set the rates payable on BT’s infrastructure and those paid by Kingston Communications, and whether or not the UK Government complied with European Community Treaty rules on state aid. The Commission concluded in October 2006 that no state aid had been granted. The Commission’s decision was appealed. Judgement on the appeal has not yet been given but we continue to believe that any allegation of state aid is groundless and that the appeal will not succeed.
BT GROUP PLCANNUAL REPORT & FORM 20-F 125
Table of Contents
FINANCIAL STATEMENTSNOTES TO THE CONSOLIDATED FINANCIAL STATEMENTS
28. Acquisitions
There were no acquisitions made in 2010. A summary of the acquisitions made in 2009 is set out below.
| BT | ||||||||||||||||
| Global Services | BT Retail | Other | Total | |||||||||||||
| Year ended 31 March 2009 | £m | £m | £m | £m | ||||||||||||
| Fair value of consideration | 13 | 98 | 75 | 186 | ||||||||||||
| Less: fair value of net assets acquired | 3 | 24 | 28 | 55 | ||||||||||||
Goodwill arising | 10 | 74 | 47 | 131 | ||||||||||||
| Consideration: | ||||||||||||||||
| Cash | 13 | 98 | 65 | 176 | ||||||||||||
| Deferred consideration | – | – | 10 | 10 | ||||||||||||
Total | 13 | 98 | 75 | 186 | ||||||||||||
| The outflow of cash and cash equivalents was as follows: | ||||||||||||||||
| Cash consideration | 13 | 98 | 65 | 176 | ||||||||||||
| Less: cash acquired | 1 | 3 | 5 | 9 | ||||||||||||
| 12 | 95 | 60 | 167 | |||||||||||||
BT Global Services
During 2009 the group acquired 100% of Stemmer GmbH and SND GmbH. The purchase consideration was £13m. The net assets acquired and the goodwill arising were as follows:
| Fair value | ||||||||||||
| Book value | adjustments | Fair value | ||||||||||
| £m | £m | £m | ||||||||||
| Receivables | 6 | – | 6 | |||||||||
| Cash and cash equivalents | 1 | – | 1 | |||||||||
| Payables | (4 | ) | – | (4 | ) | |||||||
Net assets acquired | 3 | – | 3 | |||||||||
Goodwill | 10 | |||||||||||
Total consideration | 13 | |||||||||||
During 2010 the determination of fair values has been finalised. No adjustments have been made to the balances previously reported.
BT Retail
During 2009 the group acquired 100% of the issued share capital of Wire One Holdings Inc and Ufindus Ltd for a total consideration of £98m. The combined net assets acquired in these transactions and the goodwill arising were as follows:
| Fair value | ||||||||||||
| Book value | adjustments | Fair value | ||||||||||
| £m | £m | £m | ||||||||||
| Intangible assets | 2 | 21 | 23 | |||||||||
| Property, plant and equipment | 2 | – | 2 | |||||||||
| Receivables | 20 | (1 | ) | 19 | ||||||||
| Cash and cash equivalents | 3 | – | 3 | |||||||||
| Payables | (22 | ) | (1 | ) | (23 | ) | ||||||
Net assets acquired | 5 | 19 | 24 | |||||||||
Goodwill | 74 | |||||||||||
Total consideration | 98 | |||||||||||
Intangible assets recognised in respect of these acquisitions comprised customer relationships, brand names and proprietary technology. Goodwill arising on these acquisitions principally related to anticipated cost and revenue synergies and the assembled workforce. During 2010 the determination of fair values has been finalised. No adjustments have been made to the balances previously reported.
126 BT GROUP PLCANNUAL REPORT & FORM 20-F
Table of Contents
FINANCIAL STATEMENTSNOTES TO THE CONSOLIDATED FINANCIAL STATEMENTS
28. Acquisitions continued
Other
During 2009 the group acquired 100% of the issued share capital of Moorhouse Consulting and Ribbit Corporation, for a total consideration of £75m including £10m of deferred, contingent consideration. The combined net assets acquired in these transactions and the goodwill arising were as follows:
| Fair value | ||||||||||||
| Book value | adjustments | Fair value | ||||||||||
| £m | £m | £m | ||||||||||
| Intangible assets | – | 25 | 25 | |||||||||
| Receivables | 2 | – | 2 | |||||||||
| Cash and cash equivalents | 5 | – | 5 | |||||||||
| Payables | (4 | ) | – | (4 | ) | |||||||
Net assets acquired | 3 | 25 | 28 | |||||||||
Goodwill | 47 | |||||||||||
Total consideration | 75 | |||||||||||
Intangible assets recognised in respect of these acquisitions comprised internally developed technology. Goodwill on the acquisitions principally related to cost savings and other synergies. During 2010 the determination of fair values has been finalised and adjustments have been made to the balances previously reported. Prior year balances have not been restated as the amount is not significant to the group.
29. Retirement benefit plans
Background
The group offers retirement benefit plans to its employees. The group’s main scheme, the BT Pension Scheme (BTPS), is a defined benefit scheme. This scheme has been closed to new entrants since 31 March 2001 when it was replaced by a defined contribution scheme, the BT Retirement Plan (BTRP) which was closed on 31 March 2009. On 1 April 2009 BT set up the BT Retirement Saving Scheme, a contract based defined contribution arrangement, to which BTRP members were invited to transfer their accumulated assets. The total pension cost of the group for 2010, included within staff costs, was £304m (2009: £544m, 2008: £626m). The total cost associated with the group’s defined benefit pension schemes for 2010 was £206m (2009: £459m, 2008: £576m).
Defined contribution schemes
The income statement charge in respect of defined contribution schemes represents the contribution payable by the group based upon a fixed percentage of employees’ pay. The total pension cost for 2010 in respect of the group’s main defined contribution scheme was £66m (2009: £47m, 2008: £37m) and £6m (2009: £4m, 2008: £3m) of contributions were outstanding at 31 March 2010.
Defined benefit schemes
BT Pension Scheme Trustees Limited administers and manages the scheme on behalf of the members in accordance with the terms of the Trust Deed of the scheme and relevant legislation. Under the terms of the Trust Deed of the BTPS, there are nine Trustee directors appointed by the group, five of which appointments are made with the agreement of the relevant trade unions, including the Chairman of the Trustee. Four Trustee directors, other than the Chairman, are appointed by BT on the nomination of the relevant trade unions. Two of the Trustee directors will normally hold senior positions within the group, and two will normally hold (or have held) senior positions in commerce or industry. Subject to there being an appropriately qualified candidate, there should be at least one current pensioner or deferred pensioner of the BTPS as one of the Trustee directors. Trustee directors are appointed for a three year term, but are then eligible for re-appointment.
Measurement of scheme assets and liabilities – IAS 19
Scheme assets are measured at the bid market value at the balance sheet date. The liabilities of the BTPS are measured by discounting the best estimate of future cash flows to be paid out by the scheme using the projected unit credit method. Estimated future cash flows are discounted at the current rate of return on high quality corporate bonds of an equivalent term to the liability. Actuarial gains and losses are recognised in full in the year in which they occur in the statement of comprehensive income.
IAS 19 requires that the discount rate used be determined by reference to market yields at the reporting date on high quality corporate bonds. The currency and term of these should be consistent with the currency and estimated term of the pension obligations. The discount rate has been assessed by reference to the duration of the BTPS’s liabilities and by reference to the published iBoxx index of Sterling corporate bonds of duration greater than 15 years and investment grade AA and above. Allowance is made where the constituent bonds in the published index have been re-rated or new issues made.
The rate of inflation influences the assumptions for salary and pension increase. This has been assessed by reference to yields on long-term fixed and index-linked Government bonds and has regard to Bank of England published inflationary expectations. Salary increases are assumed to be in line with inflation.
BT GROUP PLCANNUAL REPORT & FORM 20-F 127
Table of Contents
FINANCIAL STATEMENTSNOTES TO THE CONSOLIDATED FINANCIAL STATEMENTS
29. Retirement benefit plans continued
The financial assumptions used to measure the net pension obligation of the BTPS under IAS 19 at 31 March 2010 are as follows:
| Real rates (per annum) | Nominal rates (per annum) | |||||||||||||||||||||||
| 2010 | 2009 | 2008 | 2010 | 2009 | 2008 | |||||||||||||||||||
| At 31 March | % | % | % | % | % | % | ||||||||||||||||||
| Rate used to discount liabilities | 1.83 | 3.84 | 3.24 | 5.50 | 6.85 | 6.85 | ||||||||||||||||||
| Average future increases in wages and salaries | – | – | 0.75 | a | 3.60 | 2.90 | 4.28 | a | ||||||||||||||||
| Average increase in pensions in payment and deferred pensions | – | – | – | 3.60 | 2.90 | 3.50 | ||||||||||||||||||
| Inflation – average increase in retail price index | n/a | n/a | n/a | 3.60 | 2.90 | 3.50 | ||||||||||||||||||
| a | There is a short-term reduction in the real salary growth assumption to 0.5% for the first three years. |
The assumptions about life expectancy have regard to information published by the UK actuarial profession’s Continuous Mortality Investigation Bureau. However, due to the size of the membership of the BTPS (333,000 members at 31 December 2009) it is considered appropriate for the life expectancy assumptions adopted to take in to account the actual membership experience. Allowance is also made for future improvements in mortality. The BTPS actuary undertakes formal reviews of the membership experience every three years. The IAS 19 life expectancy assumptions reflect the 2008 triennial funding valuation basis.
The average life expectancy assumptions, after retirement at 60 years of age, are as follows:
| 2010 | 2009 | |||||||
| Number of | Number of | |||||||
| years | years | |||||||
| Male in lower pay bracket | 25.2 | 24.8 | ||||||
| Male in higher pay bracket | 27.4 | 27.1 | ||||||
| Female | 28.1 | 27.7 | ||||||
| Future improvement every 10 years | 1.1 | 1.0 | ||||||
Amounts recognised in respect of defined benefit schemes
The net pension obligation is set out below:
| 2010 | 2009 | |||||||||||||||||||||||
| Present | Present | |||||||||||||||||||||||
| value | value | |||||||||||||||||||||||
| Assets | of liabilities | Obligation | Assets | of liabilities | Obligation | |||||||||||||||||||
| At 31 March | £m | £m | £m | £m | £m | £m | ||||||||||||||||||
| BTPS | 35,278 | (43,018 | ) | (7,740 | ) | 29,227 | (33,070 | ) | (3,843 | ) | ||||||||||||||
Other schemesa | 151 | (275 | ) | (124 | ) | 126 | (256 | ) | (130 | ) | ||||||||||||||
| 35,429 | (43,293 | ) | (7,864 | ) | 29,353 | (33,326 | ) | (3,973 | ) | |||||||||||||||
| Deferred tax asset | 2,193 | 1,103 | ||||||||||||||||||||||
Net pension obligation | (5,671 | ) | (2,870 | ) | ||||||||||||||||||||
| a | Included in the present value of liabilities of other schemes is £54m (2009: £52m) related to unfunded schemes. |
Amounts recognised in the income statement in respect of the group’s pension schemes were as follows:
| 2010 | 2009 | 2008 | ||||||||||
| Year ended 31 March | £m | £m | £m | |||||||||
| Current service cost (including defined contribution schemes) | 304 | 544 | 626 | |||||||||
| Total operating charge | 304 | 544 | 626 | |||||||||
| Expected return on pension scheme assets | (1,932 | ) | (2,621 | ) | (2,448 | ) | ||||||
| Interest expense on pension scheme liabilities | 2,211 | 2,308 | 2,028 | |||||||||
Net finance expense (income) | 279 | (313 | ) | (420 | ) | |||||||
Total recognised in the income statement | 583 | 231 | 206 | |||||||||
128 BT GROUP PLCANNUAL REPORT & FORM 20-F
Table of Contents
FINANCIAL STATEMENTSNOTES TO THE CONSOLIDATED FINANCIAL STATEMENTS
29. Retirement benefit plans continued
The present value of the obligation is derived from long-term cash flow projections and is thus inherently uncertain. The benefits payable by the BTPS are expected to be paid as follows:
Forecast benefits payable by the BTPS at 31 March 2010
(£m)
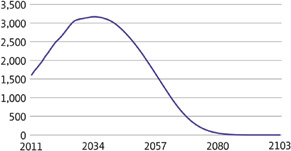
An analysis of actuarial gains and losses and the actual return on plan assets is shown below:
| 2010 | 2009 | 2008 | ||||||||||
| Year ended 31 March | £m | £m | £m | |||||||||
| Actuarial (loss) gain recognised in the year | (4,324 | ) | (7,037 | ) | 2,621 | |||||||
| Cumulative actuarial (losses) gains | (4,915 | ) | (591 | ) | 6,446 | |||||||
| Actual return on plan assets | 7,089 | (6,830 | ) | (124 | ) | |||||||
Changes in the present value of the defined benefit pension obligation are as follows:
| 2010 | 2009 | |||||||
| Year ended 31 March | £m | £m | ||||||
| Opening defined benefit pension obligation | (33,326 | ) | (34,669 | ) | ||||
| Current service cost | (206 | ) | (459 | ) | ||||
| Interest expense | (2,211 | ) | (2,308 | ) | ||||
| Contributions by employees | (15 | ) | (18 | ) | ||||
| Actuarial (loss) gain | (9,481 | ) | 2,414 | |||||
| Business combinations | – | (4 | ) | |||||
| Benefits paid | 1,948 | 1,741 | ||||||
| Exchange differences | (2 | ) | (23 | ) | ||||
Closing defined benefit pension obligation | (43,293 | ) | (33,326 | ) | ||||
Changes in the fair value of plan assets are as follows:
| 2010 | 2009 | |||||||
| Year ended 31 March | £m | £m | ||||||
| Opening fair value of plan assets | 29,353 | 37,448 | ||||||
| Expected return | 1,932 | 2,621 | ||||||
| Actuarial gain (loss) | 5,157 | (9,451 | ) | |||||
| Regular contributions by employer | 391 | 441 | ||||||
| Deficiency contributions by employer | 525 | – | ||||||
| Contributions by employees | 15 | 18 | ||||||
| Benefits paid | (1,948 | ) | (1,741 | ) | ||||
| Exchange differences | 4 | 17 | ||||||
Closing fair value of plan assets | 35,429 | 29,353 | ||||||
BT GROUP PLCANNUAL REPORT & FORM 20-F 129
Table of Contents
FINANCIAL STATEMENTS NOTES TO THE CONSOLIDATED FINANCIAL STATEMENTS
29. Retirement benefit plans continued
The BTPS assets are invested in UK and overseas equities, UK and overseas properties, fixed interest and index-linked securities, alternative assets, deposits and short-term investments. At 31 March 2010 and 31 March 2009, the scheme’s assets did not include any ordinary shares of the company. However, the scheme held £52m (2009: £65m) of bonds and £6m (2009: £5m) of index-linked notes issued by the group. The group occupies four (2009: two) properties owned by the BTPS on which an annual rental of £0.2m is payable (2009: £0.1m).
The Trustee’s main investment objective is to ensure that over the long-term, and after allowing for all future income, the BTPS will always have sufficient liquid resources to meet the cost of benefit payments to be made as they fall due. The strategic allocation of assets between different classes of investment is reviewed regularly and is a key factor in the Trustee’s investment policy. The targets set reflect the Trustee’s views on the appropriate balance to be struck between seeking high returns and incurring risk, and on the extent to which the assets should be distributed to match its liabilities. The targets are a long-term aim to be achieved over a period as and when favourable opportunities arise. Current market conditions and trends are continuously assessed and short-term tactical shifts in asset allocation may be made around the long-term strategic target, for example, by using stock index future contracts.
The BTPS uses financial instruments to manage interest rate risk, liquidity risk and foreign currency risk. Exposure to interest rate fluctuations on its borrowings and deposits is managed by using interest rate swaps. Liquidity risk is managed by maintaining a balance between continuity of funding and flexibility through the use of borrowings with a range of maturities. The BTPS has significant investments overseas, as a result of which the value of the scheme’s assets can be significantly affected by movements in foreign currencies against Sterling. A portion of the exposure to foreign currencies embedded in the overseas assets is hedged back into Sterling to remove some of the currency risk.
The assumptions for the expected long-term rate of return and the fair values of the assets of the BTPS at 31 March were:
| At 31 March 2010 | At 31 March 2009 | |||||||||||||||||||||||||||||||
| Expected | Expected | |||||||||||||||||||||||||||||||
| long-term | long-term | |||||||||||||||||||||||||||||||
| rate of return | rate of return | |||||||||||||||||||||||||||||||
| (per annum) | Asset fair value | Target | (per annum) | Asset fair value | Target | |||||||||||||||||||||||||||
| % | £bn | % | % | % | £bn | % | % | |||||||||||||||||||||||||
| UK equities | 8.5 | 3.6 | 10 | 11 | 8.5 | 3.2 | 11 | 11 | ||||||||||||||||||||||||
| Non-UK equities | 8.5 | 7.5 | 21 | 22 | 8.5 | 5.9 | 20 | 22 | ||||||||||||||||||||||||
| Fixed-interest securities | 5.0 | 5.9 | 17 | 20 | 5.9 | 6.6 | 22 | 20 | ||||||||||||||||||||||||
| Index-linked securities | 4.2 | 5.8 | 16 | 15 | 4.0 | 4.4 | 15 | 15 | ||||||||||||||||||||||||
| Property | 7.7 | 3.8 | 11 | 12 | 7.0 | 3.2 | 11 | 12 | ||||||||||||||||||||||||
| Alternative assets | 6.9 | 5.9 | 17 | 20 | 7.0 | 5.2 | 18 | 20 | ||||||||||||||||||||||||
| Cash and other | 4.2 | 2.8 | 8 | – | 3.5 | 0.8 | 3 | – | ||||||||||||||||||||||||
| 6.5 | 35.3 | 100 | 100 | 6.7 | 29.3 | 100 | 100 | |||||||||||||||||||||||||
The assumption for the expected return on scheme assets is a weighted average based on the assumed expected return for each asset class and the proportions held of each asset class at the beginning of the year. The expected returns on fixed interest and index-linked securities are based on the gross redemption yields at the start of the year. Expected returns on equities, property and alternative asset classes are based on a combination of an estimate of the risk premium above yields on government bonds, consensus economic forecasts of future returns and historical returns. Alternative asset classes include commodities, hedge funds, private equity, infrastructure and credit opportunities. The long-term expected rate of return on investments does not affect the level of the obligation but does affect the expected return on pension scheme assets within the net finance expense.
The history of experience gains and losses are as follows:
| 2010 | 2009 | 2008 | 2007 | 2006 | ||||||||||||||||
| £m | £m | £m | £m | £m | ||||||||||||||||
| Present value of defined benefit obligation | (43,293 | ) | (33,326 | ) | (34,669 | ) | (38,779 | ) | (38,187 | ) | ||||||||||
| Fair value of plan assets | 35,429 | 29,353 | 37,448 | 38,390 | 35,640 | |||||||||||||||
| Net pension (obligation) asset | (7,864 | ) | (3,973 | ) | 2,779 | (389 | ) | (2,547 | ) | |||||||||||
| Experience adjustment on defined benefit obligation – gain (loss) | 1,632 | (238 | ) | (22 | ) | 190 | (527 | ) | ||||||||||||
| Percentage of the present value of the defined benefit obligation | 3.8% | 0.7% | 0.1% | 0.5% | 1.4% | |||||||||||||||
| Experience adjustment on plan assets – gain (loss) | 5,157 | (9,451 | ) | (2,572 | ) | 993 | 4,855 | |||||||||||||
| Percentage of the plan assets | 14.6% | 32.2% | 6.9% | 2.6% | 13.6% | |||||||||||||||
The group expects to contribute approximately £669m to the BTPS in 2011, including deficiency contributions of £525m.
130 BT GROUP PLC ANNUAL REPORT & FORM 20-F
Table of Contents
FINANCIAL STATEMENTS NOTES TO THE CONSOLIDATED FINANCIAL STATEMENTS
29. Retirement benefit plans continued
Sensitivity analysis of the principal assumptions used to measure BTPS liabilities
The assumed discount rate, life expectancy and salary increases all have a significant effect on the measurement of scheme liabilities. The following table shows the sensitivity of the valuation of the pension obligations, and of the prospective 2011 income statement charge, to changes in these assumptions:
| Decrease | Decrease | Decrease | ||||||||||
| (increase) in | (increase) in | (increase) in net | ||||||||||
| liability | service cost | finance expense | ||||||||||
| £bn | £m | £m | ||||||||||
| 0.25 percentage point increase to: | ||||||||||||
| – discount rate | 1.6 | 15 | (15 | ) | ||||||||
| – salary increases | (0.2 | ) | – | (15 | ) | |||||||
| Additional 1 year increase to life expectancy | (1.0 | ) | (10 | ) | (55 | ) | ||||||
| 0.1 percentage point increase in expected return on assets | – | – | 35 | |||||||||
The sensitivities relating to the discount rate, inflation rate and expected return on assets in respect of the pension cost elements in the income statement are shown for information only. The amounts that will be recognised in the income statement in 2011 are derived from market conditions at 1 April 2010. Subsequent changes in market conditions will have no effect on the income statement in 2011 and will be reflected as actuarial gains and losses in the Statement of comprehensive income.
Funding valuation and future funding obligations
A triennial valuation is carried out for the independent Trustee by a professionally qualified independent actuary, using the projected unit credit method. The purpose of the valuation is to design a funding plan to ensure that present and future contributions should be sufficient to meet future liabilities. The funding valuation is based on prudent assumptions and is performed at 31 December as this is the financial year end of the BTPS.
The valuation basis for funding purposes is broadly as follows:
| 4 | scheme assets are valued at market value at the valuation date; and | |
| 4 | scheme liabilities are measured using a projected unit credit method and discounted to their present value. |
The outcome of the latest triennial actuarial funding valuation at 31 December 2008 was announced on 11 February 2010, together with the agreement between BT and the Trustee of the BTPS to a recovery plan to make good the £9.0bn funding deficit. Whilst the valuation and the recovery plan have been agreed with the Trustee, they are currently under review by the Pensions Regulator. However, the Pensions Regulator’s initial view is that they have substantial concerns with certain features of the agreement. BT and the Trustee continue to work with the Pensions Regulator to help them complete their detailed review. The Pensions Regulator has indicated it will discuss its position with us once they have completed their review. Accordingly, as matters stand, it is uncertain as to whether the Pensions Regulator will take any further action. This uncertainty is outside of our control. Since the valuation date the scheme’s assets have increased by £4.1bn and the Trustee estimates that if the funding valuation was performed at 31 December 2009 the deficit would have been about £7.5bn on this prudent valuation basis.
The last two triennial valuations were determined using the following long-term assumptions:
| Real rates (per annum) | Nominal rates (per annum) | |||||||||||||||
| 2008 | 2005 | 2008 | 2005 | |||||||||||||
| valuation | valuation | valuation | valuation | |||||||||||||
| % | % | % | % | |||||||||||||
| Discount rate | ||||||||||||||||
| Pre retirement liabilities | 3.65 | 3.06 | 6.76 | 5.84 | ||||||||||||
| Post retirement liabilities | 2.15 | 1.79 | 5.21 | 4.54 | ||||||||||||
| Average increase in retail price index | – | – | 3.00 | 2.70 | ||||||||||||
| Average future increases in wages and salaries | – | 0.75 | 3.00 | 3.47 | ||||||||||||
| Average increase in pensions | – | – | 3.00 | 2.70 | ||||||||||||
At 31 December 2008 the assets of the BTPS had a market value of £31.2bn (2005: £34.4bn) and were sufficient to cover 77.6% (2005: 90.9%) of the benefits accrued by that date. This represented a funding deficit of £9.0bn compared with £3.4bn at 31 December 2005. The funding valuation uses prudent assumptions. In the three years ended 31 December 2008, the decline in the market value of assets combined with longer life expectancy assumptions significantly increased the funding deficit, although the impact on the liabilities was reduced by the higher discount rate and favourable experience compared to other actuarial assumptions used at 31 December 2005.
Following the agreement of the valuation the ordinary contributions rate reduced to 13.6% of pensionable salaries (including employee contributions) from 19.5%, reflecting the implementation of benefit changes with effect from 1 April 2009, following the UK pensions review. In addition, the group will make deficit payments of £525m per annum for the first three years of the 17 year recovery plan, the first payment of which was made in December 2009. The payment in the fourth year will be £583m, then increasing at 3% per annum. The payments in years four to 17 are equivalent to £533m per annum in real terms. Under the 2005 valuation deficit contributions were £280m per annum for 10 years. In 2010, the group made regular contributions of £384m (2009: £433m) and deficit contributions of £525m. No deficit contributions were made in 2009 as they were paid in advance during 2008.
BT GROUP PLCANNUAL REPORT & FORM 20-F 131
Table of Contents
FINANCIAL STATEMENTS NOTES TO THE CONSOLIDATED FINANCIAL STATEMENTS
29. Retirement benefit plans continued
Other features of the legal agreements with the Trustee for BT providing support to the scheme are:
| 4 | In the event that cumulative shareholder distributions exceed cumulative total pension contributions over the three year period to 31 December 2011, then BT will make additional matching contributions to the scheme. Total pension contributions (including regular contributions) are expected to be approximately £2.4bn over the three financial years. | |
| 4 | In the event that BT generates net cash proceeds greater than £1bn from disposals and acquisitions in any 12 month period to 31 December 2011 then BT will make additional contributions to the scheme equal to one third of those net cash proceeds. | |
| 4 | A negative pledge that provides comfort to the scheme that future creditors will not be granted superior security to the scheme in excess of a £1.5bn threshold. |
The intention is for there to be sufficient assets in the scheme to pay pensions now and in the future. Without any further contribution from the company, it is estimated that at 31 December 2008, the assets of the scheme would have been sufficient to provide around 57% of the members’ benefits with an insurance company.
If the group were to become insolvent, however, there are a number of additional protections available to members. Firstly, there is the Crown Guarantee which was granted when the group was privatised in 1984. The scope and extent of the Crown Guarantee is being confirmed by the Trustee through the courts. This applies, on a winding up of the group, as a minimum to pension entitlements for anyone who joined the scheme before 6 August 1984, and to payments to beneficiaries of such persons. Secondly, the Pension Protection Fund (PPF) may take over the scheme and pay certain benefits to members. There are limits on the amounts paid by the PPF and this would not give exactly the same benefits as those provided by the scheme.
Under the terms of the Trust Deed that governs the BTPS, the group is required to have a funding plan that should address the deficit over a maximum period of 20 years. The BTPS was closed to new entrants on 31 March 2001 and the age profile of active members will consequently increase. Under the projected unit credit method, the current service cost, as a proportion of the active members’ pensionable salaries, is expected to increase as the members of the scheme approach retirement. Despite the scheme being closed to new entrants, the projected payment profile extends over more than 60 years.
30. Share-based payments
The total charge recognised in 2010 in respect of share-based payments was £71m (2009: £141m, 2008: £73m).
The company has an employee share investment plan and savings-related share option plans for its employees and those of participating subsidiaries, further share option plans for selected employees and an employee stock purchase plan for employees in the United States. It also has several share plans for executives. All share-based payment plans are equity settled and details of these plans and an analysis of the total charge by type of award is set out below.
| 2010 | 2009 | a | 2008 | a | ||||||||
| Year ended 31 March | £m | £m | £m | |||||||||
| Employee Sharesave Plan | 25 | 107 | 29 | |||||||||
| Allshare International | 2 | 2 | 2 | |||||||||
| Employee Stock Purchase Plan | 1 | – | 1 | |||||||||
| Incentive Share Plan | 29 | 18 | 26 | |||||||||
| Deferred Bonus Plan | 13 | 12 | 12 | |||||||||
| Retention Share Plan | 1 | 2 | 3 | |||||||||
| 71 | 141 | 73 | ||||||||||
| a | Restated for the adoption of the amendment to IFRS 2 ‘Share-based payment – vesting conditions and cancellations’. See page 94. |
Share options
BT Group Employee Sharesave Plans
There is an HMRC approved savings related share option plan, under which employees save on a monthly basis, over a three or five-year period, towards the purchase of shares at a fixed price determined when the option is granted. This price is usually set at a 20% discount to the market price for five year plans and 10% for three year plans. The options must be exercised within six months of maturity of the savings contract, otherwise they lapse. Similar plans operate for BT’s overseas employees.
Employee Stock Purchase Plan
The BT Group Employee Stock Purchase Plan (ESPP), for employees in the US, enables participants to purchase American Depositary Shares (ADSs) quarterly at a price which is 85% of the fair market price of an ADS at the end of each quarterly purchase period.
132 BT GROUP PLC ANNUAL REPORT & FORM 20-F
Table of Contents
FINANCIAL STATEMENTS NOTES TO THE CONSOLIDATED FINANCIAL STATEMENTS
30. Share-based payments continued
The following are legacy option plans which are no longer operated by the group:
BT Group Global Share Option Plan (GSOP)
The options granted in previous years were exercisable on the third anniversary of the date of grant, subject to continued employment and meeting corporate performance targets. Options must be exercised within ten years of the grant date.
BT Group Legacy Option Plan (GLOP)
On the demerger of 02, BT’s share option plans ceased to operate and were replaced by similar BT Group Employee Sharesave plans and the BT Group GSOP. The BT GLOP was launched on 17 December 2001 following the scheme of arrangement and demerger of 02 in November 2001, and is therefore outside the scope of IFRS 2. The options were exercisable subject to continued employment and meeting corporate performance targets. Options must be exercised within 10 years of the original grant date.
Share plans
Employee Share Investment Plan (ESIP)
The ESIP is an HMRC approved plan. It allows BT employees to buy shares with contributions of up to £1,500 per tax year out of gross pay (directshare) and allows BT to provide free shares to UK employees which are held in trust for at least three years (allshare). In 2008, allshare was replaced by free broadband for all BT employees in the UK. Employees outside the UK continue to receive awards of shares where practicable, otherwise they will receive awards equivalent to the value of free shares.
During 2010, 13.7m directshare shares (2009: 10.7m directshare shares), were purchased by the Trustee of the ESIP on behalf of 19,730 (2009: 20,384) employees at a total cost of £15.0m (2009: £16.4m). A further 1.0m shares (2009: 3.3m shares) were purchased by the Trustee through dividend reinvestment on behalf of 20,120 (2009: 21,782) allshare and directshare employee participants. At 31 March 2010 79.2m shares (2009: 75.9m shares) were held in trust on behalf of 68,444 participants (2009: 76,678).
Incentive Share Plan, Retention Share Plan and Deferred Bonus Plan
Under the BT Group Incentive Share Plan (ISP), participants are only entitled to these shares in full at the end of a three-year period if the company has met the relevant pre-determined corporate performance measure and if the participants are still employed by the group. In 2010, the corporate performance measure for the ISP was amended. For all ISP awards made in 2010, 50% of each share award is linked to a total shareholder return target (TSR) for a revised comparator group of companies from the beginning of the relevant performance period and the remaining 50% is linked to a three year cumulative free cash flow measure. The revised comparator group contains European telecommunications companies and companies which are either similar in size or market capitalisation and/or have a similar business mix and spread to BT. For ISP awards in prior periods, a single corporate performance measure was used, being BT’s TSR measured against a comparator group of companies from the European telecommunications sector.
Under the BT Group Retention Share Plan (RSP), the length of retention period before awards vest is flexible. Awards may vest annually in tranches. The shares are transferred at the end of a specified period, only if the employee is still employed by the group.
Under the BT Group Deferred Bonus Plan (DBP) awards are granted annually to selected employees of the group. Shares in the company are transferred to participants at the end of three years if they continue to be employed by the group throughout that period.
In accordance with the terms of the ISP, RSP and DBP, dividends or dividend equivalents earned on shares during the conditional periods are reinvested in company shares for the potential benefit of the participants.
BT GROUP PLCANNUAL REPORT & FORM 20-F 133
Table of Contents
FINANCIAL STATEMENTS NOTES TO THE CONSOLIDATED FINANCIAL STATEMENTS
30. Share-based payments continued
Share option plans
Activity relating to share options during 2010, 2009 and 2008 is shown below.
| Employee Sharesave | GSOP and GLOP | |||||||||||||||||||||||
| 2010 | 2009 | 2008 | 2010 | 2009 | 2008 | |||||||||||||||||||
| Movement in the number of share options: | millions | millions | millions | millions | millions | millions | ||||||||||||||||||
| Outstanding at the beginning of the year | 136 | 281 | 272 | 42 | 46 | 103 | ||||||||||||||||||
| Granted | 490 | 339 | 54 | – | – | – | ||||||||||||||||||
| Forfeited | (44 | ) | (390 | ) | (15 | ) | (4 | ) | (3 | ) | (10 | ) | ||||||||||||
| Exercised | (1 | ) | (80 | ) | (28 | ) | – | (1 | ) | (14 | ) | |||||||||||||
| Expired | (47 | ) | (14 | ) | (2 | ) | – | – | (33 | ) | ||||||||||||||
Outstanding at the end of the year | 534 | 136 | 281 | 38 | 42 | 46 | ||||||||||||||||||
Exercisable at the end of the year | 1 | 1 | 2 | 38 | 42 | 46 | ||||||||||||||||||
Weighted average exercise price: | ||||||||||||||||||||||||
| Outstanding at the beginning of the year | 160 | p | 180 | p | 165 | p | 256 | p | 257 | p | 227 | p | ||||||||||||
| Granted | 63 | p | 135 | p | 269 | p | – | – | – | |||||||||||||||
| Forfeited | 107 | p | 153 | p | 208 | p | 263 | p | 199 | p | 251 | p | ||||||||||||
| Exercised | 125 | p | 155 | p | 188 | p | – | 196 | p | 198 | p | |||||||||||||
| Expired | 150 | p | 178 | p | 179 | p | – | – | 199 | p | ||||||||||||||
Outstanding at the end of the year | 76 | p | 160 | p | 180 | p | 255 | p | 256 | p | 257 | p | ||||||||||||
Exercisable at the end of the year | 163 | p | 195 | p | 158 | p | 255 | p | 256 | p | 257 | p | ||||||||||||
The weighted average share price for options exercised during the year was 136p (2009: 180p, 2008: 293p). The following table summarises information relating to options outstanding and exercisable under all share option plans at 31 March 2010, together with their exercise prices and dates:
| Number of | Number of | |||||||||||
| Exercise | outstanding | exercisable | ||||||||||
| price | options | options | ||||||||||
| Normal dates of vesting and exercise (based on calendar years) | per share | millions | millions | |||||||||
BT Group Employee Sharesave Plans | ||||||||||||
| 2010 | 171p–294 | p | 16 | 1 | ||||||||
| 2011 | 137p–208 | p | 12 | – | ||||||||
| 2012 | 68p–262 | p | 143 | – | ||||||||
| 2013 | 185 | p | 8 | – | ||||||||
| 2014 | 61p–111 | p | 355 | – | ||||||||
Total | 534 | 1 | ||||||||||
BT Group Legacy Option Plan | ||||||||||||
| 2001-2011 | 318p–648 | p | 8 | 8 | ||||||||
Total | 8 | 8 | ||||||||||
BT Group Global Share Option Plan | ||||||||||||
| 2004-2014 | 176p–199.5 | p | 24 | 24 | ||||||||
| 2005-2015 | 179p–263 | p | 6 | 6 | ||||||||
Total | 30 | 30 | ||||||||||
Total options | 572 | 39 | ||||||||||
134 BT GROUP PLC ANNUAL REPORT & FORM 20-F
Table of Contents
FINANCIAL STATEMENTS NOTES TO THE CONSOLIDATED FINANCIAL STATEMENTS
30. Share-based payments continued
The options outstanding under all share option plans at 31 March 2010, have weighted average remaining contractual lives as follows:
| Employee Sharesave | GSOP and GLOP | |||||||||||||||||||||||||||
| Weighted | Number of | Weighted | Weighted | Number of | Weighted | |||||||||||||||||||||||
| average | outstanding | average | average | outstanding | average | |||||||||||||||||||||||
| Range of exercise | exercise | options | contractual | Range of exercise | exercise | options | contractual | |||||||||||||||||||||
| prices | price | millions | remaining life | prices | price | millions | remaining life | |||||||||||||||||||||
| 61p–68p | 63p | 465 | 48 months | – | – | – | – | |||||||||||||||||||||
| 100p – 199p | 143p | 57 | 32 months | 150p-317p | 198p | 30 | 52 months | |||||||||||||||||||||
| 200p – 300p | 242p | 12 | 26 months | 318p-650p | 424p | 8 | 8 months | |||||||||||||||||||||
Total | 534 | 38 | ||||||||||||||||||||||||||
Executive share plans
Movements in executive share plans during 2010 are shown below:
| Millions of shares | ||||||||||||||||
| ISP | DBP | RSP | Total | |||||||||||||
| At 1 April 2009 | 75.2 | 15.5 | 1.5 | 92.2 | ||||||||||||
| Awards granted | 50.0 | 4.5 | 0.3 | 54.8 | ||||||||||||
| Awards vested | – | (5.0 | ) | (0.6 | ) | (5.6 | ) | |||||||||
| Awards lapsed | (28.4 | ) | (1.1 | ) | – | (29.5 | ) | |||||||||
| Dividend shares reinvested | 2.4 | 0.4 | – | 2.8 | ||||||||||||
At 31 March 2010 | 99.2 | 14.3 | 1.2 | 114.7 | ||||||||||||
At 31 March 2010 1.1m shares (2009: 1.3m) were held in trust and 113.6m shares (2009: 90.9m) were held in treasury for executive share plans.
Fair value
The following table summarises the fair values and key assumptions used for grants made under the Employee Sharesave plans and ISP in 2010, 2009 and 2008.
| 2010 | 2009 | 2008 | ||||||||||||||||||||||
| Employee | Employee | Employee | ||||||||||||||||||||||
| Year ended 31 March | Sharesave | ISP | Sharesave | ISP | Sharesave | ISP | ||||||||||||||||||
| Weighted average fair value | 14p | 106p | 27p | 47p | 71p | 182p | ||||||||||||||||||
| Weighted average share price | 80p | 131p | 152p | 199p | 329p | 306p | ||||||||||||||||||
| Weighted average exercise price | 63p | – | 135p | – | 269p | – | ||||||||||||||||||
| Expected dividend yield | 5.7%–6.4% | 6.5% | 4.6%–6.4% | 4.9% | 5.5% | 5.5% | ||||||||||||||||||
| Risk free rates | 2.2%–2.8% | 2.5% | 2.1%–5.5% | 5.2% | 5.8% | 5.8% | ||||||||||||||||||
| Expected volatility | 26.9%–30.7% | 38.5% | 20.7%–28.4% | 23.3% | 22.0% | 18.0% | ||||||||||||||||||
Employee Sharesave grants, under the BT Group Employee Sharesave and the BT Group International Employee Sharesave option plans, are valued using a Binomial option pricing model. Awards under the ISP are valued using Monte Carlo simulations. TSRs were generated for BT and the comparator group at the end of the three year performance period, using each company’s volatility and dividend yield, as well as the cross correlation between pairs of stocks.
Volatility has been determined by reference to BT’s historical volatility which is expected to reflect the BT share price in the future. An expected life of three months after vesting date is assumed for Employee Sharesave options and for all other awards the expected life is equal to the vesting period. The risk free interest rate is based on the UK gilt curve in effect at the time of the grant, for the expected life of the option or award.
The fair values for the RSP and DBP were determined using the market price of the shares at the date of grant. The weighted average share price for RSP awards granted in 2010 was 104p (2009: 151p, 2008: 310p). The weighted average share price for DBP awards granted in 2010 was 131p (2009: 203p, 2008: 319p).
BT GROUP PLCANNUAL REPORT & FORM 20-F 135
Table of Contents
FINANCIAL STATEMENTS NOTES TO THE CONSOLIDATED FINANCIAL STATEMENTS
31. Audit and non-audit services
The following fees for audit and non-audit services were paid or are payable to the company’s auditors, PricewaterhouseCoopers LLP, for the three years ended 31 March 2010.
| 2010 | 2009 | 2008 | ||||||||||
| Year ended 31 March | £000 | £000 | £000 | |||||||||
Audit services | ||||||||||||
| Fees payable to the company’s auditor and its associates for the audit of parent company and consolidated financial statements | 2,585 | 2,831 | 2,990 | |||||||||
Non-audit services | ||||||||||||
| Fees payable to the company’s auditor and its associates for other services: | ||||||||||||
– The audit of the company’s subsidiaries pursuant to legislationa | 4,732 | 4,675 | 3,848 | |||||||||
– Other services pursuant to legislationa | 867 | 1,211 | 1,590 | |||||||||
| – Tax services | 792 | 1,247 | 727 | |||||||||
– Services relating to corporate finance transactionsb | – | 32 | 549 | |||||||||
| – All other services | 941 | 887 | 527 | |||||||||
| 9,917 | 10,883 | 10,231 | ||||||||||
| a | These services are audit services as defined by the Public Company Accounting Oversight Board AU Section 550 (PCAOB AU Section 550). | |
| b | These services are audit related services as defined by the PCAOB AU Section 550. |
Audit services represents fees payable for services in relation to the audit of the parent company and the consolidated financial statements and also includes fees for reports under section 404 of the US Public Company Accounting Reform and Investor Protection Act of 2002 (Sarbanes-Oxley).
The audit of the company’s subsidiaries pursuant to legislation represents fees payable for services in relation to the audit of the financial statements of subsidiary companies.
Other services pursuant to legislation represents fees payable for services in relation to other statutory filings or engagements that are required to be carried out by the appointed auditor. In particular, this includes fees for audit reports issued on the group’s regulatory financial statements.
Tax services represents fees payable for tax compliance and advisory services.
Services relating to corporate finance transactions represent fees payable in relation to due diligence work completed on acquisitions and disposals.
All other services represents fees payable for non regulatory reporting on internal controls and other advice on accounting or financial matters.
The audit fee of the company was £41,000 (2009: £41,000, 2008: £40,000).
In order to maintain the independence of the external auditors, the Board has determined policies as to what non audit services can be provided by the company’s external auditors and the approval processes related to them. Under those policies, work of a consultancy nature will not be offered to the external auditors unless there are clear efficiencies and value-added benefits to the company.
136 BT GROUP PLC ANNUAL REPORT & FORM 20-F
Table of Contents
FINANCIAL STATEMENTS NOTES TO THE CONSOLIDATED FINANCIAL STATEMENTS
32. Financial instruments and risk management
The group issues or holds financial instruments mainly to finance its operations; to finance corporate transactions such as dividends, share buy backs and acquisitions; for the temporary investment of short-term funds; and to manage the currency and interest rate risks arising from its operations and from its sources of finance. In addition, various financial instruments, for example trade receivables and trade payables, arise directly from the group’s operations.
Funding and exposure management
The group finances its operations primarily by a mixture of issued share capital, retained profits, deferred taxation and long-term and short-term borrowing. The group borrows in the major long-term bond markets in major currencies and typically, but not exclusively, these markets provide the most cost effective means of long-term borrowing. The group uses derivative financial instruments primarily to manage its exposure to changes in interest and foreign exchange rates against these borrowings. The derivatives used for this purpose are principally interest rate swaps, cross currency swaps and forward currency contracts. The group also uses forward currency contracts to hedge some of its currency exposures arising from funding its overseas operations, acquisitions, overseas assets, liabilities and forward purchase commitments. The group does not hold or issue derivative financial instruments for trading purposes. All transactions in derivative financial instruments are undertaken to manage the risks arising from underlying business activities.
Treasury operations
The group has a centralised treasury operation whose primary role is to manage liquidity, funding, investments and counterparty credit risk arising from transactions with financial institutions. This treasury operation also manages the group’s market risk exposures, including risks arising from volatility in currency and interest rates. The treasury operation acts as a central bank to members of the group providing central deposit taking, funding and foreign exchange management services. Funding and deposit taking is usually provided in the functional currency of the relevant entity. The treasury operation is not a profit centre and its objective is to manage financial risk at optimum cost.
Treasury policy
The Board sets the policy for the group’s treasury operation and its activities are subject to a set of controls commensurate with the magnitude of the borrowings and investments and group wide exposures under its management. The Board has delegated its authority to operate these polices to a series of panels that are responsible for the management of key treasury risks and operations. Appointment to and removal from the key panels requires approval from two of the Chairman, the Chief Executive or the Group Finance Director. The key policies defined by the Board are highlighted in each of the sections below.
The financial risk management of exposures arising from trading related financial instruments, primarily trade receivables and trade payables, is through a series of policies and procedures set at a group and line of business level. Line of business management apply these policies and procedures and perform review processes to assess and manage financial risk exposures arising from these financial instruments.
There has been no change in the nature of the group’s risk profile between 31 March 2010 and the date of approval of these financial statements.
Capital management
The objective of the group’s capital management policy is to reduce net debt whilst investing in the business, supporting the pension scheme and delivering progressive dividends. In order to meet this objective, the group may issue or repay debt, issue new shares, repurchase shares, or adjust the amount of dividends paid to shareholders. The group manages the capital structure and makes adjustments to it in the light of changes in economic conditions and the risk characteristics of the group. The Board regularly reviews the capital structure. No changes were made to the group’s objectives and processes during 2010 and 2009.
The group’s capital structure consists of net debt, committed facilities and shareholders’ equity (excluding the cash flow reserve). The following analysis summarises the components which the group manages as capital:
| 2010 | 2009 | 2008 | ||||||||||
| At 31 March | £m | £m | £m | |||||||||
| Total parent shareholders’ (deficit) equity (excluding cash flow reserve) | (2,797 | ) | (421 | ) | 5,252 | |||||||
| Net debt | 9,283 | 10,361 | 9,460 | |||||||||
| Committed facilities | 1,500 | 2,300 | 2,335 | |||||||||
Total capital | 7,986 | 12,240 | 17,047 | |||||||||
Interest rate risk management
Management policy
The group has interest bearing financial assets and financial liabilities which may expose the group to either cash flow or fair value volatility. The group’s policy, as prescribed by the Board, is to ensure that at least 70% of net debt is at fixed rates. Short-term interest rate management is delegated to the treasury operation whilst long-term interest rate management decisions require further approval from the Group Finance Director, Director Treasury, Tax and Risk Management or the Treasurer who have been delegated such authority by the Board.
BT GROUP PLCANNUAL REPORT & FORM 20-F 137
Table of Contents
FINANCIAL STATEMENTS NOTES TO THE CONSOLIDATED FINANCIAL STATEMENTS
32. Financial instruments and risk management continued
Hedging strategy
In order to manage the group’s interest rate mix profile, the group has entered into swap agreements with commercial banks and other institutions to vary the amounts and periods for which interest rates on borrowings are fixed. Under cross currency swaps, the group agrees with other parties to exchange, at specified intervals, US Dollar and Euro fixed rates into either fixed or floating Sterling interest amounts calculated by reference to an agreed notional principal amount. Under Sterling interest rate swaps, the group agrees with other parties to exchange, at specified intervals, the differences between fixed rate and floating rate Sterling interest amounts calculated by reference to an agreed notional principal amount. The group uses a combination of these derivatives to primarily fix its interest rates.
The majority of the group’s long-term borrowings have been, and are, subject to fixed Sterling interest rates after applying the impact of hedging instruments. Outstanding currency and interest rate swaps at 31 March 2010 are detailed in the Hedging activities and Other derivatives sections below.
At 31 March 2010 the group’s fixed floating interest rate profile, after hedging, on gross debt was 91:9 (2009: 87:13).
Sensitivities
The group is exposed to volatility in the income statement and shareholders’ equity arising from changes in interest rates. To demonstrate this volatility, management have concluded that a 100 basis point increase (2009: 100 basis point increase) in interest rates and parallel shift in yield curves across Sterling, US Dollar and Euro currencies is a reasonable benchmark for performing a sensitivity analysis. All adjustments to interest rates for the impacted financial instruments are assumed to take effect from the respective balance sheet date.
After the impact of hedging, the group’s main exposure to interest rate volatility in the income statement arises from fair value movements on derivatives not in hedging relationships and on variable rate borrowings and investments which are largely influenced by Sterling interest rates. Trade payables, trade receivables and other financial instruments do not present a material exposure to interest rate volatility. With all other factors remaining constant and based on the composition of net debt at 31 March 2010, a 100 basis point increase (2009 and 2008: 100 basis point increase) in Sterling interest rates would decrease the group’s annual net finance expense by approximately £17m (2009: £5m, 2008: £5m).
The group’s main exposure to interest rate volatility within shareholders’ equity, as defined in IFRS 7, arises from fair value movements on derivatives held in the cash flow reserve. The derivatives have an underlying interest rate exposure to Sterling, Euro and US Dollar rates. With all other factors remaining constant and based on the composition of derivatives included in the cash flow reserve at the balance sheet date, a 100 basis point increase (2009 and 2008: 100 basis point increase) in interest rates in each of the currencies would impact equity, before tax, as detailed below:
| 2010 | 2009 | 2008 | ||||||||||
| £m | £m | £m | ||||||||||
| Charge | Charge | Charge | ||||||||||
| At 31 March | (credit) | (credit) | (credit) | |||||||||
| Sterling interest rates | 496 | 550 | 470 | |||||||||
| US Dollar interest rates | (392 | ) | (538 | ) | (347 | ) | ||||||
| Euro interest rates | (134 | ) | (149 | ) | (90 | ) | ||||||
The impact as a result of a 100 basis point decrease in interest rates would have broadly the same impact in the opposite direction.
The long-term debt instruments which the group issued in December 2000 and February 2001 both contained covenants providing that if the BT Group credit rating were downgraded below A3 in the case of Moody’s or below A– in the case of Standard & Poor’s (S&P), additional interest would accrue from the next coupon period at a rate of 0.25 percentage points for each ratings category adjustment by each ratings agency. In February 2010 S&P downgraded BT’s credit rating to BBB–. Prior to this in March 2009, Moody’s and S&P downgraded BT’s credit rating to Baa2 and BBB, respectively. Based on the total debt of £4.4bn outstanding on these instruments at 31 March 2010, the group’s finance expense would increase/decrease by approximately £9m in the year ending 31 March 2011 if BT’s credit rating were to be downgraded/upgraded respectively by one credit rating category by both agencies below a long-term debt rating of Baa2/BBB–.
In addition, the group’s €600m 2014 bond issued in June 2009 would attract an additional 1.25 percentage points for a downgrade by one credit rating category by both Moody’s and S&P below Baa3/BBB–, respectively. This would result in an additional finance expense of £5m in the year ending 31 March 2011.
Foreign exchange risk management
Management policy
The purpose of the group’s foreign currency hedging activities is to protect the group from the risk that the eventual net inflows and net outflows will be adversely affected by changes in exchange rates. The Board’s policy for foreign exchange risk management defines the types of transactions which should normally be covered, including significant operational, funding and currency interest exposures, and the period over which cover should extend for the different types of transactions. Short-term foreign exchange management is delegated to the treasury operation whilst long-term foreign exchange management decisions require further approval from the Group Finance Director, Director Treasury, Tax and Risk Management or the Treasurer who have been delegated such authority by the Board. The policy delegates authority to the Director Treasury, Tax and Risk Management to take positions of up to £100m and for the Group Finance Director to take positions of up to £1bn.
138 BT GROUP PLC ANNUAL REPORT & FORM 20-F
Table of Contents
FINANCIAL STATEMENTS NOTES TO THE CONSOLIDATED FINANCIAL STATEMENTS
32. Financial instruments and risk management continued
Exposure and hedging
A significant proportion of the group’s current revenue is invoiced in Sterling, and a significant element of its operations and costs arise within the UK. The group’s overseas operations generally trade and are funded in their functional currency which limits their exposure to foreign exchange volatility. The group’s foreign currency borrowings, which totalled £9.4bn at 31 March 2010 (2009: £9.9bn), are used to finance its operations and have been predominantly swapped into Sterling using cross currency swaps. The group also enters into forward currency contracts to hedge foreign currency investments, interest expense, capital purchases and purchase and sale commitments on a selective basis. The commitments hedged are principally denominated in US Dollar, Euro and Asia Pacific region currencies. As a result, the group’s exposure to foreign currency arises mainly on its non UK subsidiary investments and on residual currency trading flows.
Sensitivities
After hedging, with all other factors remaining constant and based on the composition of assets and liabilities at the balance sheet date, the group’s exposure to foreign exchange volatility in the income statement from a 10% strengthening/weakening in Sterling against other currencies would result in a credit/charge respectively of approximately £26m (2009: approximately £20m).
The group’s main exposure to foreign exchange volatility within shareholders’ equity (excluding translation exposures) arises from fair value movements on derivatives held in the cash flow reserve. The majority of foreign exchange fluctuations in the cash flow reserve are recycled immediately to the income statement to match the hedged item and therefore the group’s exposure to foreign exchange fluctuations in equity would be insignificant in both 2010 and 2009.
Outstanding cross currency swaps at 31 March 2010 are detailed in the Hedging activities and Other derivatives sections below.
Credit risk management
Treasury management policy
The group’s exposure to credit risk arises from financial assets transacted by the treasury operation (primarily derivatives, investments, cash and cash equivalents) and from its trading related receivables. For treasury related balances, the Board’s defined policy restricts exposure to any one counterparty by setting credit limits based on the credit quality as defined by Moody’s and Standard and Poor’s and by defining the types of financial instruments which may be transacted. The minimum credit ratings permitted with counterparties are A3/A– for long-term and P1/A1 for short-term investments. The treasury operation continuously reviews the limits applied to counterparties and will adjust the limit according to the nature and credit standing of the counterparty up to the maximum allowable limit set by the Board. Management review significant utilisations on a regular basis to determine the adjustments required, if any, and actively manage any exposures which may arise. Where multiple transactions are undertaken with a single counterparty, or group of related counterparties, the group may enter into netting arrangements to reduce the group’s exposure to credit risk. The group makes use of standard International Swaps and Derivative Association (ISDA) documentation. In addition, where possible the group will seek a combination of a legal right of set off and net settlement. The group also seeks collateral or other security where it is considered necessary. The treasury operation regularly reviews the credit limits applied when investing with counterparties in response to market conditions and continues to monitor their credit quality and actively manage any exposures which arise.
Exposures
The maximum credit risk exposure of the group’s financial assets at the balance sheet date are as follows:
| 2010 | 2009 | 2008 | ||||||||||
| At 31 March | £m | £m | £m | |||||||||
| Derivative financial assets | 1,700 | 2,700 | 387 | |||||||||
| Investments | 470 | 218 | 471 | |||||||||
Trade and other receivablesa | 2,947 | 3,101 | 3,193 | |||||||||
| Cash and cash equivalents | 1,452 | 1,300 | 1,435 | |||||||||
Total | 6,569 | 7,319 | 5,486 | |||||||||
| a | The carrying amount excludes £749m (2009: £1,084m, 2008: £1,256m) of current and £336m (2009: £322m, 2008: £854m) of non current trade and other receivables which relate to non financial assets. |
Note 19 discloses the credit concentration and credit quality of derivative financial assets. The majority of these derivatives are in designated cash flow hedges. With all other factors remaining constant and based on the composition of net derivative financial assets at 31 March 2010, a 100 basis point shift in yield curves across each of the ratings categories within which these derivative financial assets are classified would change their carrying values and impact equity, before tax, as follows:
| Impact of 100 basis | Impact of 100 basis | |||||||
| point increase | point decrease | |||||||
| At 31 March 2010 | £m | £m | ||||||
| Moody’s/S&P credit rating | ||||||||
| Aa2/AA | (3 | ) | 4 | |||||
| Aa3/AA– | (26 | ) | 30 | |||||
| A1/A+ | (89 | ) | 104 | |||||
| A2/A | (102 | ) | 122 | |||||
| (220 | ) | 260 | ||||||
The credit quality of other treasury related financial assets is disclosed in notes 10 and 14.
BT GROUP PLCANNUAL REPORT & FORM 20-F 139
Table of Contents
FINANCIAL STATEMENTS NOTES TO THE CONSOLIDATED FINANCIAL STATEMENTS
32. Financial instruments and risk management continued
Operational management policy
The group’s credit policy for trading related financial assets is applied and managed by each of the lines of business to ensure compliance. The policy requires that the creditworthiness and financial strength of customers is assessed at inception and on an ongoing basis. Payment terms are set in accordance with industry standards. The group will also enhance credit protection when appropriate, taking into consideration the customer’s exposure to the group, by applying processes which include netting and off setting, and requesting securities such as deposits, guarantees and letters of credit. The group takes proactive steps to minimise the impact of adverse market conditions on trading related financial assets. The concentration of credit risk for trading balances of the group is provided in note 17 which analyses outstanding balances by line of business and reflects the nature of customers in each line of business.
Liquidity risk management
Management policy
The group ensures its liquidity is maintained by entering into short, medium and long-term Financial instruments to support operational and other funding requirements. On at least an annual basis the Board reviews and approves the maximum long-term funding of the group and on an ongoing basis considers any related matters. Short and medium-term requirements are regularly reviewed and managed by the treasury operation within the parameters of the policies set by the Board.
The group’s liquidity and funding management process includes projecting cash flows and considering the level of liquid assets in relation thereto, monitoring balance sheet liquidity and maintaining a diverse range of funding sources and back up facilities. The Board reviews forecasts, including cash flow forecasts, on a quarterly basis. The treasury operation reviews cash flows more frequently to assess the short and medium-term requirements. These assessments ensure the group responds to possible future cash constraints in a timely manner. Liquid assets surplus to the immediate operating requirements of the group are generally invested and managed by the treasury operation. Requests from group companies for operating finance are met whenever possible from central resources.
Liquidity position
| 2010 | 2009 | 2008 | ||||||||||
| At 31 March | £m | £m | £m | |||||||||
| Net debt | 9,283 | 10,361 | 9,460 | |||||||||
During 2010, the group’s net debt decreased from £10.4bn to £9.3bn primarily driven by higher free cash flow partially offset by the pension deficit payment of £525m in December 2010. During 2010, debt amounting to £1bn matured consisting of £0.7bn of commercial paper and £0.3bn of long-term debt. This was offset by new issuance of a €600m bond at 6.125% repayable in 2014 which was swapped into £520m at a fixed semi-annual rate of 6.8%. During 2009, the group’s net debt increased from £9.5bn to £10.4bn primarily driven by lower free cash flow being exceeded by dividend and share buy back payments. During 2009, debt amounting to £0.9bn matured consisting of bank notes and Sterling floating notes. This was offset by new issuances of £1.5bn mainly consisting of a €1bn bond at 6.5% repayable in 2015, which was swapped into £0.8bn at an average annualised Sterling interest rate of 7.7%, and commercial paper. In addition, investments of £0.3bn matured.
During 2010 and 2009 the group issued commercial paper and held cash, cash equivalents and current asset investments in order to manage short-term liquidity requirements. At 31 March 2010 the group had an undrawn committed borrowing facility of £1.5bn (2009: £1.5bn). The facility is available for the period to January 2013. The group had an additional undrawn committed borrowing facility of £900m which expired in March 2010.
Refinancing risk is managed by limiting the amount of borrowing that matures within any specified period and having appropriate strategies in place to manage refinancing needs as they arise. The group has two significant term debt maturities during the 2011 financial year. In December 2010 the group’s US Dollar 8.625% note matures with a principal of $2,883m (£1,742m at swapped rates) and in February 2011 a Euro 7.375% note matures with a principal of €1,125m (£758m at swapped rates). The group has built up significant liquidity in anticipation of these maturities which, alongside cash flows generated from operations and the group’s financing strategy, will fund this requirement. In May 2010, the group entered into a £650m two-year facility arrangement. There are no term debt maturities in the 2012 financial year. At 31 March 2010, the group’s credit rating was BBB– with stable outlook with S&P and Baa2 with negative outlook with Moody’s respectively (2009: BBB with stable outlook/Baa2 with negative outlook).
140 BT GROUP PLC ANNUAL REPORT & FORM 20-F
Table of Contents
FINANCIAL STATEMENTS NOTES TO THE CONSOLIDATED FINANCIAL STATEMENTS
32. Financial instruments and risk management continued
The group’s remaining contractually agreed cash flows, including interest, associated with financial liabilities based on undiscounted cash flows are as follows:
| Within one | Between | Between | Between | Between | ||||||||||||||||||||||||
| Carrying | year, or on | one and | two and | three and | four and | After | ||||||||||||||||||||||
| amount | demand | two years | three years | four years | five years | five years | ||||||||||||||||||||||
| Outflow (inflow)d | £m | £m | £m | £m | £m | £m | £m | |||||||||||||||||||||
At 31 March 2010 | ||||||||||||||||||||||||||||
| Loans and borrowings | 12,791 | |||||||||||||||||||||||||||
| Principal | 2,937 | 18 | 1,763 | 11 | 1,213 | 6,523 | ||||||||||||||||||||||
| Interest | 833 | 581 | 581 | 484 | 484 | 4,016 | ||||||||||||||||||||||
Trade and other payablesa | 4,672 | 4,672 | – | – | – | – | – | |||||||||||||||||||||
Provisionsb | 255 | 61 | 37 | 30 | 26 | 45 | 143 | |||||||||||||||||||||
Derivative financial instrument liabilities analysed based on earliest payment datec | ||||||||||||||||||||||||||||
| Net settled | 662 | 450 | 78 | 185 | 65 | (215 | ) | 745 | ||||||||||||||||||||
| Gross settled | 37 | |||||||||||||||||||||||||||
| Outflow | 1,081 | – | – | – | – | – | ||||||||||||||||||||||
| Inflow | (1,074 | ) | – | – | – | – | – | |||||||||||||||||||||
Total | 8,960 | 714 | 2,559 | 586 | 1,527 | 11,427 | ||||||||||||||||||||||
Derivative financial instrument liabilities analysed based on holding instrument to maturity | ||||||||||||||||||||||||||||
| Net settled | 662 | 193 | 92 | 93 | 92 | 93 | 745 | |||||||||||||||||||||
| Gross settled | 37 | |||||||||||||||||||||||||||
| Outflow | 424 | 20 | 20 | 20 | 20 | 577 | ||||||||||||||||||||||
| Inflow | (413 | ) | (21 | ) | (21 | ) | (21 | ) | (21 | ) | (577 | ) | ||||||||||||||||
| Within one | Between | Between | Between | Between | ||||||||||||||||||||||||
| Carrying | year, or on | one and | two and | three and | four and | After | ||||||||||||||||||||||
| amount | demand | two years | three years | four years | five years | five years | ||||||||||||||||||||||
| Outflow (inflow)d | £m | £m | £m | £m | £m | £m | £m | |||||||||||||||||||||
| At 31 March 2009 | ||||||||||||||||||||||||||||
| Loans and borrowings | 13,907 | |||||||||||||||||||||||||||
| Principal | 1,227 | 3,098 | 10 | 1,829 | 14 | 7,412 | ||||||||||||||||||||||
| Interest | 906 | 900 | 649 | 650 | 550 | 5,333 | ||||||||||||||||||||||
Trade and other payablesa | 5,354 | 5,354 | – | – | – | – | – | |||||||||||||||||||||
Provisionsb | 166 | 59 | 17 | 15 | 13 | 8 | 119 | |||||||||||||||||||||
Derivative financial instrument liabilities analysed based on earliest payment datec | ||||||||||||||||||||||||||||
| Net settled | 762 | 244 | 338 | 28 | 50 | 19 | 30 | |||||||||||||||||||||
| Gross settled | 5 | |||||||||||||||||||||||||||
| Outflow | 414 | 113 | – | – | – | – | ||||||||||||||||||||||
| Inflow | (409 | ) | (113 | ) | – | – | – | – | ||||||||||||||||||||
Total | 7,795 | 4,353 | 702 | 2,542 | 591 | 12,894 | ||||||||||||||||||||||
Derivative financial instrument liabilities analysed based on holding instrument to maturity | ||||||||||||||||||||||||||||
| Net settled | 762 | 117 | 117 | 60 | 60 | 60 | 634 | |||||||||||||||||||||
| Gross settled | 5 | |||||||||||||||||||||||||||
| Outflow | 414 | 113 | – | – | – | – | ||||||||||||||||||||||
| Inflow | (409 | ) | (113 | ) | – | – | – | – | ||||||||||||||||||||
| a | The carrying amount excludes £1,859m (2009: £1,861m) of current and £804m (2009: £794m) of non current trade and other payables which relate to non financial liabilities. | |
| b | The carrying amount excludes £73m (2009: £195m) of current and £513m (2009: £359m) of non current provisions which relate to non financial liabilities. | |
| c | Certain derivative financial instrument liabilities contain break clauses whereby either the group or bank counterparty can terminate the swap on certain dates and the mark to market position is settled in cash. | |
| d | Foreign currency related cash flows were translated at the closing rate as at the relevant reporting date. Future variable interest rate cash flows were calculated using the most recent rate applied at the relevant balance sheet date. |
BT GROUP PLCANNUAL REPORT & FORM 20-F 141
Table of Contents
FINANCIAL STATEMENTS NOTES TO THE CONSOLIDATED FINANCIAL STATEMENTS
32. Financial instruments and risk management continued
Price risk management
The group has limited exposure to price risk.
Hedging activities
The group had outstanding hedging activities as at 31 March 2010 as follows:
| Derivative fair valueb | ||||||||||||||||||||||||||||
| Notional | Remaining term | Weighted average | Period over | |||||||||||||||||||||||||
| principal | Asset | Liability | of hedging | interest rate on | which forecast | |||||||||||||||||||||||
| Hedged item | Hedging instruments | Hedge type | £m | £m | £m | instruments | hedging instruments | transaction arises | ||||||||||||||||||||
| Euro and US Dollar | Interest rate swaps | Cash flow | 2,913 | – | 361 | 9 months to 21 years | Sterling receivable at 0.8% | |||||||||||||||||||||
denominated borrowingsa | Sterling payable at 5.9% | |||||||||||||||||||||||||||
| Cross currency swaps | Cash flow | 7,612 | 1,571 | 30 | 9 months to 21 years | Euro receivable at 6.1% | ||||||||||||||||||||||
| US Dollar receivable at 7.6% | ||||||||||||||||||||||||||||
| Sterling payable at 6.3% | ||||||||||||||||||||||||||||
| Sterling denominated | Interest rate swaps | Fair value | 500 | – | 6 | 19 years | Sterling receivable at 5.8% | |||||||||||||||||||||
borrowingsa | Sterling payable at 2.2% | |||||||||||||||||||||||||||
| Euro and US Dollar step up | Forward currency contracts | Cash flow | 247 | 16 | – | 3 to 9 months | 21 years | |||||||||||||||||||||
| interest on currency | rolling basis | |||||||||||||||||||||||||||
denominated borrowingsa | ||||||||||||||||||||||||||||
| Currency exposures on overseas | Forward currency contracts | Cash flow | 161 | – | 4 | 1 month | 12 months | |||||||||||||||||||||
| purchases principally US Dollar | rolling basis | |||||||||||||||||||||||||||
| and Asia Pacific currencies | ||||||||||||||||||||||||||||
| Purchase of US Dollar | Forward currency contracts | Cash flow | 180 | 7 | – | 1 to 9 months | ||||||||||||||||||||||
| denominated retail devices | ||||||||||||||||||||||||||||
| a See note 18. b See note 19. | ||||||||||||||||||||||||||||
| The group had outstanding hedging activities as at 31 March 2009 as follows: | ||||||||||||||||||||||||||||
| Derivative fair valueb | ||||||||||||||||||||||||||||
| Notional | Remaining term | Weighted average | Period over | |||||||||||||||||||||||||
| principal | Asset | Liability | of hedging | interest rate on | which forecast | |||||||||||||||||||||||
| Hedged item | Hedging instruments | Hedge type | £m | £m | £m | instruments | hedging instruments | transaction arises | ||||||||||||||||||||
| Euro and US Dollar | Interest rate swaps | Cash flow | 2,913 | – | 446 | 2 to 22 years | Sterling receivable at 3.0% | |||||||||||||||||||||
denominated borrowingsa | Sterling payable at 5.9% | |||||||||||||||||||||||||||
| Cross currency swaps | Cash flow and fair value | 7,227 | 2,559 | 1 | 5 months to 22 years | Euro receivable at 6.0% | ||||||||||||||||||||||
| US Dollar receivable at 7.7% | ||||||||||||||||||||||||||||
| Sterling payable at 7.2% | ||||||||||||||||||||||||||||
| Euro and US Dollar step up | Forward currency contracts | Cash flow | 223 | 9 | – | 3 to 5 months | 22 years | |||||||||||||||||||||
| interest on currency | rolling basis | |||||||||||||||||||||||||||
denominated borrowingsa | ||||||||||||||||||||||||||||
| Euro and US Dollar | Forward currency contracts | Cash flow | 490 | 17 | – | Less than 3 months | ||||||||||||||||||||||
commercial papera | rolling basis | |||||||||||||||||||||||||||
| Purchase of US Dollar | Forward currency contracts | Cash flow | 48 | – | 1 | Less than 1 month | 4 years | |||||||||||||||||||||
| denominated fixed assets | ||||||||||||||||||||||||||||
| Euro deferred consideration | Forward currency contracts | Cash flow | 50 | 1 | – | Less than 5 months | ||||||||||||||||||||||
| on acquisition | ||||||||||||||||||||||||||||
| a | See note 18. | |
| b | See note 19. |
Other derivatives
At 31 March 2010, the group held certain foreign currency forward and interest rate swap contracts which were not in hedging relationships in accordance with IAS 39. Foreign currency forward contracts were economically hedging operational purchases and sales and had a notional principal amount of £189m for purchases of currency (2009: £533m) and had a maturity period of under one month (2009: under nine months). Interest rate swaps not in hedging relationships under IAS 39 had a notional principal amount of £1.9bn (2009: £1.9bn) and mature between 2014 and 2030 (2009: 2014 and 2030). The interest receivable under these swap contracts is at a weighted average rate of 4.2% (2009: 6%) and interest payable is at a weighted average rate of 5.8% (2009: 7.6%). The volatility arising from these swaps is recognised through the income statement but is limited due to a natural offset in their fair value movements. In 2009 the group entered into credit default swap contracts to economically hedge part of its US Dollar denominated derivative financial assets, which had a notional principal of $90m. These derivatives matured in 2010.
142 BT GROUP PLC ANNUAL REPORT & FORM 20-F
Table of Contents
FINANCIAL STATEMENTS NOTES TO THE CONSOLIDATED FINANCIAL STATEMENTS
32. Financial instruments and risk management continued
Fair value of financial instruments
The table below discloses the carrying amounts and fair values of all of the group’s financial instruments which are not carried at an amount which approximates to their fair value on the balance sheet at 31 March 2010, 2009 and 2008. The carrying amounts are included in the group balance sheet under the indicated headings. The fair values of listed investments were estimated based on quoted market prices for those investments. The carrying amount of the short-term deposits and investments approximated to their fair values due to the short maturity of the investments held. The carrying amount of trade receivables and payables approximated to their fair values due to the short maturity of the amounts receivable and payable. The fair value of the group’s bonds, debentures, notes, finance leases and other long-term borrowings has been estimated on the basis of quoted market prices for the same or similar issues with the same maturities where they existed, and on calculations of the present value of future cash flows using the appropriate discount rates in effect at the balance sheet dates, where market prices of similar issues did not exist. The fair value of the group’s outstanding swaps and foreign exchange contracts were the estimated amounts, calculated using discounted cash flow models taking into account market rates of interest and foreign exchange at the balance sheet date.
| Carrying amount | Fair value | |||||||||||||||||||||||
| 2010 | 2009 | 2008 | 2010 | 2009 | 2008 | |||||||||||||||||||
| At 31 March | £m | £m | £m | £m | £m | £m | ||||||||||||||||||
| Financial liabilities | ||||||||||||||||||||||||
| Listed bonds, debentures and notes | 12,157 | 12,189 | 9,298 | 13,304 | 11,384 | 9,436 | ||||||||||||||||||
| Finance leases | 304 | 332 | 320 | 343 | 366 | 347 | ||||||||||||||||||
| Other loans and borrowings | 330 | 1,386 | 1,724 | 354 | 1,338 | 1,690 | ||||||||||||||||||
The table below shows certain financial assets and financial liabilities that have been measured at fair value, analysed by the level of valuation method. The three levels of valuation methodology used are:
| 4 | Level 1 – uses quoted prices in active markets for identical assets or liabilities | |
| 4 | Level 2 – uses inputs for the asset or liability other than quoted prices, that are observable either directly or indirectly | |
| 4 | Level 3 – uses inputs for the asset or liability that are not based on observable market data such as internal models or other valuation methods. |
| Level 1 | Level 2 | Level 3 | Total | |||||||||||||
| At 31 March 2010 | £m | £m | £m | £m | ||||||||||||
| Financial assets at fair value | ||||||||||||||||
| Non current and current derivative financial assets | ||||||||||||||||
| Derivatives designated as accounting hedges | – | 1,594 | – | 1,594 | ||||||||||||
| Other derivatives | – | 106 | – | 106 | ||||||||||||
| Total current and non current derivative financial assets (note 19) | – | 1,700 | – | 1,700 | ||||||||||||
| Available-for-sale financial assets | ||||||||||||||||
| Non current and current investments | ||||||||||||||||
| Liquid investments | – | 258 | – | 258 | ||||||||||||
| Other investments | 20 | – | 12 | 32 | ||||||||||||
| Total non current and current investments (note 14) | 20 | 258 | 12 | 290 | ||||||||||||
Total financial assets at fair value | 20 | 1,958 | 12 | 1,990 | ||||||||||||
| Financial liabilities at fair value | ||||||||||||||||
| Current and non current derivative financial liabilities | ||||||||||||||||
| Derivatives designated as accounting hedges | – | 401 | – | 401 | ||||||||||||
| Other derivatives | – | 298 | – | 298 | ||||||||||||
| Total current and non current financial liabilities (note 19) | – | 699 | – | 699 | ||||||||||||
Total financial liabilities at fair value | – | 699 | – | 699 | ||||||||||||
BT GROUP PLCANNUAL REPORT & FORM 20-F 143
Table of Contents
FINANCIAL STATEMENTS NOTES TO THE CONSOLIDATED FINANCIAL STATEMENTS
32. Financial instruments and risk management continued
Movements in 2010 for financial instruments measured using Level 3 valuation methods are presented below:
| Other investments | ||||
| £m | ||||
| At 1 April 2009 | 11 | |||
| Additions | 3 | |||
| Disposals | (2 | ) | ||
At 31 March 2010 | 12 | |||
There were no losses recognised in the income statement in respect of Level 3 assets held at 31 March 2010.
144 BT GROUP PLC ANNUAL REPORT & FORM 20-F
Table of Contents
FINANCIAL STATEMENTS
REPORT OF THE INDEPENDENT AUDITORS – PARENT COMPANY FINANCIAL STATEMENTS
We have audited the parent company financial statements of BT Group plc for the year ended 31 March 2010 which comprise the BT Group plc company balance sheet, the BT Group plc company reconciliation of movement in equity shareholders’ funds, the related notes and the BT Group plc accounting policies. The financial reporting framework that has been applied in their preparation is applicable law and United Kingdom Accounting Standards (United Kingdom Generally Accepted Accounting Practice).
Respective responsibilities of directors and auditors
As explained more fully in the Statement of directors’ responsibilities set out on page 84, the directors are responsible for the preparation of the parent company financial statements and for being satisfied that they give a true and fair view. Our responsibility is to audit the parent company financial statements in accordance with applicable law and International Standards on Auditing (UK and Ireland). Those standards require us to comply with the Auditing Practices Board’s Ethical Standards for Auditors.
This report, including the opinions, has been prepared for and only for the company’s members as a body in accordance with Chapter 3 of Part 16 of the Companies Act 2006 and for no other purpose. We do not, in giving these opinions, accept or assume responsibility for any other purpose or to any other person to whom this report is shown or into whose hands it may come save where expressly agreed by our prior consent in writing.
Scope of the audit of the financial statements
An audit involves obtaining evidence about the amounts and disclosures in the financial statements sufficient to give reasonable assurance that the financial statements are free from material misstatement, whether caused by fraud or error. This includes an assessment of: whether the accounting policies are appropriate to the parent company’s circumstances and have been consistently applied and adequately disclosed; the reasonableness of significant accounting estimates made by the directors; and the overall presentation of the financial statements.
Opinion on financial statements
In our opinion the parent company financial statements:
| 4 | give a true and fair view of the state of the company’s affairs as at 31 March 2010; | |
| 4 | have been properly prepared in accordance with United Kingdom Generally Accepted Accounting Practice; and | |
| 4 | have been prepared in accordance with the requirements of the Companies Act 2006. |
Opinion on other matters prescribed by the Companies Act 2006
In our opinion:
| 4 | the part of the Report on directors’ remuneration to be audited has been properly prepared in accordance with the Companies Act 2006; and | |
| 4 | the information given in the Report of the directors for the financial year for which the parent company financial statements are prepared is consistent with the parent company financial statements. |
Matters on which we are required to report by exception
We have nothing to report in respect of the following matters where the Companies Act 2006 requires us to report to you if, in our opinion:
| 4 | adequate accounting records have not been kept by the parent company, or returns adequate for our audit have not been received from branches not visited by us; or | |
| 4 | the parent company financial statements and the part of the Report on directors’ remuneration to be audited are not in agreement with the accounting records and returns; or | |
| 4 | certain disclosures of directors’ remuneration specified by law are not made; or | |
| 4 | we have not received all the information and explanations we require for our audit. |
Other matter
We have reported separately on the consolidated financial statements of BT Group plc for the year ended 31 March 2010.
Philip Rivett (Senior Statutory Auditor)
for and on behalf of PricewaterhouseCoopers LLP
Chartered Accountants and Statutory Auditors
London, United Kingdom
12 May 2010
for and on behalf of PricewaterhouseCoopers LLP
Chartered Accountants and Statutory Auditors
London, United Kingdom
12 May 2010
BT GROUP PLCANNUAL REPORT & FORM 20-F 145
Table of Contents
FINANCIAL STATEMENTS
FINANCIAL STATEMENTS OF BT GROUP PLC
BT Group plc accounting policies
(i) Accounting basis
As used in these financial statements and associated notes, the term ‘company’ refers to BT Group plc. These separate financial statements of the company are presented as required by the Companies Act 2006. The separate financial statements have been prepared in accordance with UK Generally Accepted Accounting Principles (UK GAAP).
The financial statements are prepared on a going concern basis and under the historical cost convention as modified by the revaluation of certain financial instruments at fair value.
As permitted by Section 408(3) of the Companies Act 2006, the company’s profit and loss account has not been presented.
The BT Group plc consolidated financial statements for the year ended 31 March 2010 contain a consolidated statement of cash flows. Consequently, the company has taken advantage of the exemption in FRS 1, ‘Cash Flow Statements’, not to present its own cash flow statement.
The BT Group plc consolidated financial statements for the year ended 31 March 2010 contain related party disclosures. Consequently, the company has taken advantage of the exemption in FRS 8, ‘Related Party Disclosures’, not to disclose transactions with other members of the BT Group.
The BT Group plc consolidated financial statements for the year ended 31 March 2010 contain financial instrument disclosures which comply with FRS 29, ‘Financial Instruments: Disclosures’. Consequently, the company is exempted from the disclosure requirements of FRS 29 in respect of its financial instruments.
(ii) Investments in subsidiary undertakings
Investments in subsidiary undertakings are stated at cost and reviewed for impairment if there are indicators that the carrying value may not be recoverable.
(iii) Taxation
Full provision is made for deferred taxation on all timing differences which have arisen but not reversed at the balance sheet date. Deferred tax assets are recognised to the extent that it is regarded as more likely than not that there will be sufficient taxable profits from which the underlying timing differences can be deducted. The deferred tax balances are not discounted.
(iv) Dividends
Dividend distributions are recognised as a liability in the year in which the dividends are approved by the company’s shareholders. Interim dividends are recognised when they are paid; final dividends when authorised in general meetings by shareholders.
(v) Share capital
Ordinary shares are classified as equity. Repurchased shares of the company are recorded in the balance sheet as treasury shares and presented as a deduction from shareholders’ equity at cost.
(vi) Cash
Cash includes cash in hand and bank deposits repayable on demand.
(vii) Share-based payments
The company does not incur a charge for share-based payments. However, the issuance by the company of share options and awards to employees of its subsidiaries represents additional capital contributions to its subsidiaries. An addition to the company’s investment in subsidiaries is recorded with a corresponding increase in equity shareholders’ funds. The additional capital contribution is determined based on the fair value of options and awards at the date of grant and is recognised over the vesting period.
The company has adopted the amendment to FRS 20 (IFRS 2) ‘Share-based payment’ – Vesting Conditions and Cancellations with effect from 1 April 2009. The amendment requires retrospective adjustment and therefore prior period comparatives have been restated. This has resulted in an increase of £110m in the carrying value of investments in subsidiary undertakings in the year ended 31 March 2009. A corresponding increase to equity shareholders’ funds representing the additional capital contribution has also been recognised.
Other information
(i) Dividends
The Board recommends that a final dividend in respect of the year ended 31 March 2010 of 4.6p will be paid to shareholders on 6 September 2010, taking the full year proposed dividend in respect of the 2010 financial year to 6.9p (2009: 6.5p). This dividend is subject to shareholder approval at the Annual General Meeting and therefore the liability of approximately £356m (2009: £85m) has not been included in these financial statements.
(ii) Employees
The executive directors and the Chairman of BT Group plc were the only employees of the company during 2010. The costs relating to qualifying services provided to the company’s principal subsidiary, British Telecommunications plc, are recharged to that company.
(iii) Audit fees
The audit fee in respect of the parent company was £41,000 (2009: £41,000). Fees payable to PricewaterhouseCoopers LLP for non-audit services to the company are not required to be disclosed as they are included within note 31 to the consolidated financial statements of BT Group plc.
146 BT GROUP PLC ANNUAL REPORT & FORM 20-F
Table of Contents
FINANCIAL STATEMENTS FINANCIAL STATEMENTS OF BT GROUP PLC
BT Group plc company balance sheet
| 2010 | 2009 | e | ||||||
| At 31 March | £m | £m | ||||||
Fixed assets | ||||||||
Investments in subsidiary undertakingsa | 10,349 | 10,278 | ||||||
Total fixed assets | 10,349 | 10,278 | ||||||
Current assets | ||||||||
Debtorsb | – | 142 | ||||||
| Cash at bank and in hand | 11 | 13 | ||||||
Total current assets | 11 | 155 | ||||||
Creditors: amounts falling due within one yearc | 186 | 65 | ||||||
Net current (liabilities) assets | (175 | ) | 90 | |||||
Total assets less current liabilities | 10,174 | 10,368 | ||||||
Capital and reserves | ||||||||
| Called up share capital | 408 | 408 | ||||||
| Share premium account | 62 | 62 | ||||||
| Capital redemption reserve | 27 | 27 | ||||||
| Treasury shares reserve | (1,105 | ) | (1,109 | ) | ||||
| Profit and loss account | 10,782 | 10,980 | ||||||
Total equity shareholders’ fundsd | 10,174 | 10,368 | ||||||
| a | Throughout 2010, the company held a 100% investment in BT Group Investments Limited, a company registered in England and Wales. The change to investments in subsidiary undertakings relates to additional capital contributions in respect of share-based payments of £71m in 2010 (2009: £141m). | |
| b | Debtors consists of amounts owed by subsidiary undertakings of £nil (2009: £142m). | |
| c | Creditors consists of amounts owed to subsidiary undertakings of £166m (2009: £15m) and other creditors of £20m (2009: £50m). | |
| d | The movements in total equity shareholders’ funds shown on page 148. | |
| e | Restated. See page 146. |
The financial statements of the company on pages 146 to 149 were approved by the Board of the directors on 12 May 2010 and were signed on its behalf by
Sir Michael Rake
Chairman
Chairman
Ian Livingston
Chief Executive
Chief Executive
Tony Chanmugam
Group Finance Director
Group Finance Director
BT GROUP PLCANNUAL REPORT & FORM 20-F 147
Table of Contents
FINANCIAL STATEMENTS FINANCIAL STATEMENTS OF BT GROUP PLC
BT Group plc company reconciliation of movement in equity shareholders’ funds
| Capital | Profit | |||||||||||||||||||||||
| Share | Share premium | redemption | Treasury | and loss | ||||||||||||||||||||
| capital | a | account | reserve | reserve | b | account | b,c | Total | ||||||||||||||||
| £m | £m | £m | £m | £m | £m | |||||||||||||||||||
| At 1 April 2008 | 420 | 62 | 15 | (1,843 | ) | 12,356 | 11,010 | |||||||||||||||||
| Profit for the financial year | – | – | – | – | 502 | 502 | ||||||||||||||||||
| Dividends paid | – | – | – | – | (1,222 | ) | (1,222 | ) | ||||||||||||||||
| Change in accounting policy for adoption of the amendment to FRS 20 (see page 6) | – | – | – | – | 110 | 110 | ||||||||||||||||||
| Capital contribution in respect of share-based payment | – | – | – | – | 31 | 31 | ||||||||||||||||||
| Net purchase of treasury shares | – | – | – | (63 | ) | – | (63 | ) | ||||||||||||||||
| Cancellation of shares | (12 | ) | – | 12 | 797 | (797 | ) | – | ||||||||||||||||
| At 1 April 2009 | 408 | 62 | 27 | (1,109 | ) | 10,980 | 10,368 | |||||||||||||||||
| Loss for the financial year | – | – | – | – | (6 | ) | (6 | ) | ||||||||||||||||
| Dividends paid | – | – | – | – | (263 | ) | (263 | ) | ||||||||||||||||
| Capital contribution in respect of share-based payment | – | – | – | – | 71 | 71 | ||||||||||||||||||
| Net issue of treasury shares | – | – | – | 4 | – | 4 | ||||||||||||||||||
At 31 March 2010 | 408 | 62 | 27 | (1,105 | ) | 10,782 | 10,174 | |||||||||||||||||
| a | The authorised share capital of the company up to 1 October 2009 was £13,463m, representing 269,260,253,468 ordinary shares of 5p each. The allotted, called up and fully paid ordinary share capital of the company at 31 March 2010 was £408m (2009: £408m), representing 8,151,227,027 ordinary shares of 5p each (2009: 8,151,227,029). | |
| b | During 2010, the company repurchased nil (2009: 142,608,225) of its own shares of 5p each, nil % (2009: 2%) of the called-up share capital, for consideration (including transaction costs) of £nil (2009: £189m). In addition, 8,320,766 shares (2009: 90,626,518) were issued from treasury to satisfy obligations under employee share schemes and executive share awards at a cost of £4m (2009: £126m), and nil treasury shares (2009: 250,000,000) were cancelled at a cost of £nil (2009: £797m). At 31 March 2010, 400,906,119 shares (2009: 409,226,885) with an aggregate nominal value of £20m (2009: £20m) were held as treasury shares at cost. | |
| c | The loss for the financial year, dealt with in the profit and loss account of the company after taking into account dividends received from subsidiary undertakings, was £6m (2009: profit of £502m). As permitted by Section 408(3) of the Companies Act 2006, no profit and loss account of the company is presented. |
148 BT GROUP PLC ANNUAL REPORT & FORM 20-F
Table of Contents
FINANCIAL STATEMENTS
SUBSIDIARY UNDERTAKINGS AND ASSOCIATE
The tables below give brief details of the group’s principalaoperating subsidiariesb and associate at 31 March 2010. All subsidiaries are unlisted and held through an intermediate holding company, unless otherwise stated. No subsidiaries are excluded from the group consolidation.
| Group interest | Country | |||||||
| Subsidiary undertakings | Activity | in allotted capitalc | of operation | d | ||||
| British Telecommunications plc | Communications related services and products provider | 100% ordinary | UK | |||||
BT Americas Incd | Communications related services, systems integration and | 100% common | International | |||||
| products provider | ||||||||
| BT Australasia Pty Limited | Communications related services and products provider | 100% ordinary | Australia | |||||
| 100% preference | ||||||||
| BT Centre Nominee 2 Limited | Property holding company | 100% ordinary | UK | |||||
| BT Communications do Brasil Limitada | Communications related services, technology consulting | 100% ordinary | Brazil | |||||
| and products provider | ||||||||
| BT Communications Ireland Limited | Telecommunications service provider | 100% ordinary | Ireland | |||||
| BT Conferencing Inc | Audio, video and web collaboration services provider | 100% common | US | |||||
| BT Conferencing Video Inc | Audio, video and web collaboration services provider | 100% common | US | |||||
| BT Convergent Solutions Limited | Communications related services and products provider | 100% ordinary | UK | |||||
| BT Engage IT Limited | IT solutions provider | 100% ordinary | UK | |||||
| BT ESPANA, Compania de Servicios Globales de | Communications related services and products provider | 100% ordinary | Spain | |||||
| Telecommunicaciones, SA | ||||||||
| BT Fleet Limited | Fleet management company | 100% ordinary | UK | |||||
| BT France SA | Communications related services, systems integration and | 100% ordinary | France | |||||
| products provider | ||||||||
| BT Frontline Pte Ltd | Communications related services and products provider | 100% ordinary | Singapore | |||||
| BT (Germany) GmbH & Co oHG | Communications related services and products provider | 100% ordinary | Germany | |||||
| BT Global Communications India Private Limited | Communications related services | 100% ordinary | India | |||||
| BT Global Services Limited | International telecommunications network systems provider | 100% ordinary | UK | |||||
| BT Holdings Limited | Investment holding company | 100% ordinary | UK | |||||
| BT Hong Kong Limited | Communications related services and products provider | 100% ordinary | Hong Kong | |||||
| 100% preference | ||||||||
| BT INS Inc | Information telecommunications consulting and software | 100% common | US | |||||
| solutions provider | ||||||||
| BT Italia SpA | Communications related services and products provider | 98.6% ordinary | Italy | |||||
| BT Limited | International telecommunications network systems provider | 100% ordinary | International | |||||
| BT Nederland NV | Communications related services and products provider | 100% ordinary | Netherlands | |||||
| BT Payment Services Limited | Payment services provider | 100% ordinary | UK | |||||
| BT Professional Services Nederland BV | Systems integration and application development | 100% ordinary | Netherlands | |||||
| BT Services SA | Technology consulting and engineering services | 100% ordinary | France | |||||
| BT Singapore Pte Ltd | Communications related services and products provider | 100% ordinary | Singapore | |||||
BT US Investments Limitedb | Investment holding company | 100% ordinary | Jersey | |||||
Communications Global Network Services Limitedd | Communications related services and products provider | 100% ordinary | International | |||||
| Communications Networking Services (UK) | Communications related services and products provider | 100% ordinary | UK | |||||
| dabs.com plc | Technology equipment retailer | 100% ordinary | UK | |||||
| Infonet Services Corporation | Global managed network service provider | 100% common | US | |||||
| Infonet USA Corporation | Global managed network service provider | 100% common | US | |||||
| Plusnet plc | Broadband service provider | 100% ordinary | UK | |||||
| Radianz Americas Inc | Global managed network service provider | 100% preference | US | |||||
| 100% common | ||||||||
| a | The group comprises a large number of entities and it is not practical to include all of them in this list. The list therefore includes only those entities that have a significant impact on the revenue, profit or assets of the group. A full list of subsidiaries, joint ventures and associates will be annexed to the company’s next annual return filed with the Registrar of Companies. | |
| b | The principal operating subsidiaries (listed above) have a reporting date of 31 March, except for BT US Investments Limited which has a reporting date of 31 October in order to meet its corporate objectives. | |
| c | The proportion of voting rights held corresponds to the aggregate interest percentage held by the holding company and subsidiary undertakings. | |
| d | All overseas undertakings are incorporated in their country of operations. Subsidiary undertakings operating internationally are all incorporated in England and Wales, except BT Americas Inc and Communications Global Network Services Limited which are incorporated in the US and Bermuda, respectively. |
| Share capital | ||||||||||||||
| Percentage | Country | |||||||||||||
| Associate | Activity | Issued | e | owned | f | of operation | g | |||||||
| Tech Mahindra Limited | Global systems integrator and business | |||||||||||||
| transformation consultancy provider | 122,320,114 | 30.9 | % | India | ||||||||||
| e | Issued share capital comprises ordinary or common shares unless otherwise stated. | |
| f | Held through an intermediate holding company. | |
| g | Incorporated in the country of operation. |
BT GROUP PLCANNUAL REPORT & FORM 20-F 149
Table of Contents
FINANCIAL STATEMENTS
QUARTERLY ANALYSIS OF REVENUE AND PROFIT
| Unaudited | ||||||||||||||||||||||||
| 1st | 2nd | 3rd | 4th | Total | ||||||||||||||||||||
| Year ended 31 March 2010 | Quarters | £m | £m | £m | £m | £m | ||||||||||||||||||
| Revenue | 5,235 | 5,070 | 5,198 | 5,356 | 20,859 | |||||||||||||||||||
| Other operating income | 79 | 93 | 80 | 128 | 380 | |||||||||||||||||||
| Operating costs | (4,767 | ) | (4,613 | ) | (4,805 | ) | (4,931 | ) | (19,116 | ) | ||||||||||||||
| Operating profit | 547 | 550 | 473 | 553 | 2,123 | |||||||||||||||||||
| Net finance expense | (283 | ) | (284 | ) | (292 | ) | (299 | ) | (1,158 | ) | ||||||||||||||
| Share of post tax profits of associates and joint ventures | 8 | 9 | 28 | 9 | 54 | |||||||||||||||||||
| Loss on disposal of associate | – | – | – | (12 | ) | (12 | ) | |||||||||||||||||
| Profit before taxation | 272 | 275 | 209 | 251 | 1,007 | |||||||||||||||||||
| Taxation | (58 | ) | 153 | (31 | ) | (42 | ) | 22 | ||||||||||||||||
| Profit for the period | 214 | 428 | 178 | 209 | 1,029 | |||||||||||||||||||
| Basic earnings per share | 2.8p | 5.5p | 2.3p | 2.7p | 13.3p | |||||||||||||||||||
| Diluted earnings per share | 2.7p | 5.4p | 2.2p | 2.6p | 12.9p | |||||||||||||||||||
| Profit before specific items and taxation | 313 | 370 | 339 | 434 | 1,456 | |||||||||||||||||||
Adjusted basic earnings per sharea | 3.8p | 4.3p | 4.1p | 5.0p | 17.3p | |||||||||||||||||||
| Unaudited | ||||||||||||||||||||||||
| 1st | 2nd | 3rd | 4th | Total | b | |||||||||||||||||||
| Year ended 31 March 2009 | Quarters | £m | £m | £m | £m | £m | ||||||||||||||||||
| Revenue | 5,177 | 5,303 | 5,437 | 5,473 | 21,390 | |||||||||||||||||||
| Other operating income | 90 | 107 | 71 | 71 | 339 | |||||||||||||||||||
| Operating costs | (4,641 | ) | (4,762 | ) | (5,299 | ) | (6,726 | ) | (21,428 | ) | ||||||||||||||
| Operating profit (loss) | 626 | 648 | 209 | (1,182 | ) | 301 | ||||||||||||||||||
| Net finance expense | (130 | ) | (159 | ) | (180 | ) | (151 | ) | (620 | ) | ||||||||||||||
| Share of post tax profits of associates and joint ventures | 1 | 5 | 52 | 17 | 75 | |||||||||||||||||||
| (Loss) profit before taxation | 497 | 494 | 81 | (1,316 | ) | (244 | ) | |||||||||||||||||
| Taxation | (115 | ) | (116 | ) | (19 | ) | 303 | 53 | ||||||||||||||||
| (Loss) profit for the period | 382 | 378 | 62 | (1,013 | ) | (191 | ) | |||||||||||||||||
| Basic (loss) earnings per share | 4.9p | 4.9p | 0.8p | (13.1)p | (2.5)p | |||||||||||||||||||
| Diluted (loss) earnings per share | 4.8p | 4.9p | 0.8p | (13.0)p | (2.5)p | |||||||||||||||||||
| Profit (loss) before specific items and taxation | 524 | 532 | 45 | (973 | ) | 128 | ||||||||||||||||||
Adjusted basic earnings per sharea | 4.4p | 4.5p | 2.7p | 2.4p | 14.1p | |||||||||||||||||||
| Unaudited | ||||||||||||||||||||||||
| 1st | 2nd | 3rd | 4th | Total | b | |||||||||||||||||||
| Year ended 31 March 2008 | Quarters | £m | £m | £m | £m | £m | ||||||||||||||||||
| Revenue | 5,033 | 5,095 | 5,154 | 5,422 | 20,704 | |||||||||||||||||||
| Other operating income | 66 | 73 | 74 | 136 | 349 | |||||||||||||||||||
| Operating costs | (4,441 | ) | (4,647 | ) | (4,646 | ) | (4,963 | ) | (18,697 | ) | ||||||||||||||
| Operating profit | 658 | 521 | 582 | 595 | 2,356 | |||||||||||||||||||
| Net finance expense | (55 | ) | (92 | ) | (134 | ) | (97 | ) | (378 | ) | ||||||||||||||
| Share of post tax losses of associates and joint ventures | (3 | ) | (3 | ) | (2 | ) | (3 | ) | (11 | ) | ||||||||||||||
| Profit (loss) on disposal of associate | – | 9 | 1 | (1 | ) | 9 | ||||||||||||||||||
| Profit before taxation | 600 | 435 | 447 | 494 | 1,976 | |||||||||||||||||||
| Taxation | 8 | (96 | ) | (82 | ) | (68 | ) | (238 | ) | |||||||||||||||
| Profit for the period | 608 | 339 | 365 | 426 | 1,738 | |||||||||||||||||||
| Basic earnings per share | 7.4p | 4.2p | 4.5p | 5.4p | 21.5p | |||||||||||||||||||
| Diluted earnings per share | 7.2p | 4.1p | 4.4p | 5.3p | 21.1p | |||||||||||||||||||
| Profit before specific items and taxation | 650 | 617 | 581 | 658 | 2,506 | |||||||||||||||||||
Adjusted basic earnings per sharea | 5.0p | 4.8p | 4.8p | 5.5p | 20.2p | |||||||||||||||||||
| a | Adjusted results refer to the amounts before BT Global Services contract and financial review charges in 2009, specific items and net interest on pensions. | |
| b | Restated. See page 94. |
150 BT GROUP PLCANNUAL REPORT & FORM 20-F
Table of Contents
FINANCIAL STATEMENTS
SELECTED FINANCIAL DATA
Summary group income statement
| 2010 | 2009 | a | 2008 | a | 2007 | a | 2006 | a | ||||||||||||
| Year ended 31 March | £m | £m | £m | £m | £m | |||||||||||||||
Revenue | ||||||||||||||||||||
Adjustedb | 20,911 | 21,431 | 20,704 | 20,223 | 19,514 | |||||||||||||||
| Specific items | (52 | ) | – | – | – | – | ||||||||||||||
| Contract and financial review charges | – | (41 | ) | – | – | – | ||||||||||||||
| 20,859 | 21,390 | 20,704 | 20,223 | 19,514 | ||||||||||||||||
Other operating income | ||||||||||||||||||||
Adjustedb | 378 | 352 | 359 | 236 | 227 | |||||||||||||||
| Specific items | 2 | (13 | ) | (10 | ) | (3 | ) | – | ||||||||||||
| 380 | 339 | 349 | 233 | 227 | ||||||||||||||||
Operating costs | ||||||||||||||||||||
Adjustedb | (18,689 | ) | (19,435 | ) | (18,168 | ) | (17,746 | ) | (17,108 | ) | ||||||||||
| Specific items | (427 | ) | (395 | ) | (529 | ) | (169 | ) | (138 | ) | ||||||||||
| Contract and financial review charges | – | (1,598 | ) | – | – | – | ||||||||||||||
| (19,116 | ) | (21,428 | ) | (18,697 | ) | (17,915 | ) | (17,246 | ) | |||||||||||
Operating profit | ||||||||||||||||||||
Adjustedb | 2,600 | 2,348 | 2,895 | 2,713 | 2,633 | |||||||||||||||
| Specific items | (477 | ) | (408 | ) | (539 | ) | (172 | ) | (138 | ) | ||||||||||
| Contract and financial review charges | – | (1,639 | ) | – | – | – | ||||||||||||||
| 2,123 | 301 | 2,356 | 2,541 | 2,495 | ||||||||||||||||
Net finance expense | ||||||||||||||||||||
Adjustedb | (890 | ) | (933 | ) | (798 | ) | (653 | ) | (726 | ) | ||||||||||
| Specific items | 11 | – | – | 139 | ||||||||||||||||
| Net interest on pensions | (279 | ) | 313 | 420 | 420 | 254 | ||||||||||||||
| (1,158 | ) | (620 | ) | (378 | ) | (94 | ) | (472 | ) | |||||||||||
Share of post tax profits (losses) of associates and joint ventures | ||||||||||||||||||||
Adjustedb | 25 | 39 | (11 | ) | 15 | 16 | ||||||||||||||
| Specific items | 29 | 36 | – | – | – | |||||||||||||||
| 54 | 75 | (11 | ) | 15 | 16 | |||||||||||||||
(Loss) profit on disposal of associates and joint ventures - specific itemsa | (12 | ) | – | 9 | 22 | 1 | ||||||||||||||
Profit (loss) before taxation | ||||||||||||||||||||
Adjustedb | 1,735 | 1,454 | 2,086 | 2,075 | 1,923 | |||||||||||||||
| Specific items | (449 | ) | (372 | ) | (530 | ) | (11 | ) | (137 | ) | ||||||||||
| Contract and financial review charges | – | (1,639 | ) | – | – | – | ||||||||||||||
| Net interest on pensions | (279 | ) | 313 | 420 | 420 | 254 | ||||||||||||||
| 1,007 | (244 | ) | 1,976 | 2,484 | 2,040 | |||||||||||||||
Taxation | ||||||||||||||||||||
Adjustedb | (398 | ) | (361 | ) | (455 | ) | (485 | ) | (457 | ) | ||||||||||
| Specific items | 342 | 43 | 343 | 979 | 41 | |||||||||||||||
| Contract and financial review charges | – | 459 | – | – | – | |||||||||||||||
| Net interest on pensions | 78 | (88 | ) | (126 | ) | (126 | ) | (76 | ) | |||||||||||
| 22 | 53 | (238 | ) | 368 | (492 | ) | ||||||||||||||
Profit (loss) for the year | ||||||||||||||||||||
Adjustedb | 1,337 | 1,093 | 1,631 | 1,590 | 1,466 | |||||||||||||||
| Specific items | (107 | ) | (329 | ) | (187 | ) | 968 | (96 | ) | |||||||||||
| Contract and financial review charges | – | (1,180 | ) | – | – | – | ||||||||||||||
| Net interest on pensions | (201 | ) | 225 | 294 | 294 | 178 | ||||||||||||||
| 1,029 | (191 | ) | 1,738 | 2,852 | 1,548 | |||||||||||||||
Basic earnings (loss) per share | ||||||||||||||||||||
Adjustedb | 17.3p | 14.1p | 20.2p | 19.1p | 17.4p | |||||||||||||||
| Specific items | (1.4)p | (4.3)p | (2.4)p | 11.7p | (1.1)p | |||||||||||||||
| Contract and financial review charges | – | (15.3)p | – | – | – | |||||||||||||||
| Net interest on pensions | (2.6)p | 3.0p | 3.7p | 3.6p | 2.1p | |||||||||||||||
Total basic (loss) earnings per share | 13.3p | (2.5)p | 21.5p | 34.4p | 18.4p | |||||||||||||||
| a | Restated. See page 94. | |
| b | Adjusted revenue, adjusted other operating income, adjusted operating costs, adjusted operating profit, adjusted net finance expense, adjusted share of post tax profits (losses) of associates and joint ventures, adjusted (loss) profit on disposal of associates and joint ventures, adjusted profit (loss) before taxation, adjusted taxation credit (charge), adjusted profit (loss) for the year and adjusted basic earnings (loss) per share are non-GAAP measures provided in addition to the disclosure requirements defined under IFRS. The rationale for using non-GAAP measures is explained on pages 54 to 56. |
BT GROUP PLCANNUAL REPORT & FORM 20-F 151
Table of Contents
FINANCIAL STATEMENTSSELECTED FINANCIAL DATA
Summary group income statement continued
| Year ended 31 March | 2010 | 2009 | a | 2008 | a | 2007 | a | 2006 | a | |||||||||||
| Average number of shares used in basic earnings per share (millions) | 7,740 | 7,724 | 8,066 | 8,293 | 8,422 | |||||||||||||||
| Average number of shares used in diluted earnings per share (millions) | 7,988 | 7,771 | 8,223 | 8,479 | 8,537 | |||||||||||||||
| Basic earnings (loss) per share | 13.3p | (2.5)p | 21.5p | 34.4p | 18.4p | |||||||||||||||
| Diluted earnings (loss) per share | 12.9p | (2.5)p | 21.1p | 33.6p | 18.1p | |||||||||||||||
Dividends per shareb | 6.9p | 6.5p | 15.8p | 15.1p | 11.9p | |||||||||||||||
Dividends per share, centsb,c | 10.5c | 9.3c | 31.4c | 29.7c | 20.7c | |||||||||||||||
| a | Restated. See page 94. | |
| b | Dividends per share represents the dividend paid and proposed in respect of the relevant financial year. Under IFRS, dividends are recognised as a deduction from shareholders’ equity when they are paid. | |
| c | Based on actual dividends paid and/or year end exchange rate on proposed dividends. |
Summary group cash flow statement
| 2010 | 2009 | 2008 | 2007 | 2006 | ||||||||||||||||
| Year ended 31 March | £m | £m | £m | £m | £m | |||||||||||||||
| Net cash inflow from operating activities | 4,825 | 4,706 | 5,486 | 5,210 | 5,387 | |||||||||||||||
| Net cash (outflow) inflow from investing activities | (2,775 | ) | (2,954 | ) | (3,664 | ) | (2,778 | ) | 214 | |||||||||||
| Net cash used in financing activities | (1,714 | ) | (1,865 | ) | (1,430 | ) | (2,898 | ) | (5,278 | ) | ||||||||||
| Effect of exchange rate changes on cash and cash equivalents | (7 | ) | 54 | 25 | (35 | ) | – | |||||||||||||
Net increase (decrease) in cash and cash equivalents | 329 | (59 | ) | 417 | (501 | ) | 323 | |||||||||||||
| Cash and cash equivalents at the start of the year | 1,115 | 1,174 | 757 | 1,258 | 935 | |||||||||||||||
Cash and cash equivalents at the end of the year | 1,444 | 1,115 | 1,174 | 757 | 1,258 | |||||||||||||||
Summary group balance sheet
| 2010 | 2009 | a | 2008 | a | 2007 | a | 2006 | a | ||||||||||||
| At 31 March | £m | £m | £m | £m | £m | |||||||||||||||
| Intangible assets | 3,672 | 3,788 | 3,355 | 2,584 | 1,908 | |||||||||||||||
| Property, plant and equipment | 14,856 | 15,405 | 15,307 | 14,997 | 15,222 | |||||||||||||||
| Retirement benefit asset | – | – | 2,887 | – | – | |||||||||||||||
| Other non current assets | 3,867 | 4,154 | 1,286 | 780 | 1,175 | |||||||||||||||
| 22,395 | 23,347 | 22,835 | 18,361 | 18,305 | ||||||||||||||||
| Current assets less current liabilities | (4,135 | ) | (3,141 | ) | (2,978 | ) | (3,746 | ) | (3,052 | ) | ||||||||||
Total assets less current liabilities | 18,260 | 20,206 | 19,857 | 14,615 | 15,253 | |||||||||||||||
| Non current loans and other borrowings | (9,522 | ) | (12,365 | ) | (9,818 | ) | (6,387 | ) | (7,995 | ) | ||||||||||
| Retirement benefit obligations | (7,864 | ) | (3,973 | ) | (108 | ) | (389 | ) | (2,547 | ) | ||||||||||
| Other non current liabilities | (3,500 | ) | (3,699 | ) | (4,499 | ) | (3,567 | ) | (3,104 | ) | ||||||||||
Total assets less liabilities | (2,626 | ) | 169 | 5,432 | 4,272 | 1,607 | ||||||||||||||
| Called up share capital | 408 | 408 | 420 | 432 | 432 | |||||||||||||||
| Share premium account | 62 | 62 | 62 | 31 | 7 | |||||||||||||||
| Capital redemption reserve | 27 | 27 | 15 | 2 | 2 | |||||||||||||||
| Other reserves | 757 | 1,301 | (527 | ) | 88 | 364 | ||||||||||||||
| Retained (loss) earnings | (3,904 | ) | (1,656 | ) | 5,439 | 3,685 | 750 | |||||||||||||
Total parent shareholders’ (deficit) equity | (2,650 | ) | 142 | 5,409 | 4,238 | 1,555 | ||||||||||||||
| Minority interests | 24 | 27 | 23 | 34 | 52 | |||||||||||||||
Total (deficit) equity | (2,626 | ) | 169 | 5,432 | 4,272 | 1,607 | ||||||||||||||
| a | Restated. See page 94. |
Other selected financial data
| 2010 | 2009 | a | 2008 | a | 2007 | a | 2006 | a | ||||||||||||
| £m | £m | £m | £m | £m | ||||||||||||||||
Adjusted EBITDAb | 5,639 | 5,238 | 5,784 | 5,633 | 5,517 | |||||||||||||||
Free cash flowc | 1,933 | 737 | 1,823 | 1,874 | 1,612 | |||||||||||||||
Net debtd | 9,283 | 10,361 | 9,460 | 7,914 | 7,534 | |||||||||||||||
| a | Restated. See page 94. | |
| b | Adjusted EBITDA is stated before specific items and BT Global Services contract and financial review charges in 2009 and is defined on page 55. | |
| c | Free cash flow is defined on page 55. | |
| d | Net debt is defined on page 56. |
152 BT GROUP PLCANNUAL REPORT & FORM 20-F
Table of Contents
FINANCIAL STATEMENTS
FINANCIAL STATISTICS
| Year ended 31 March | 2010 | 2009 | a | 2008 | a | 2007 | a | 2006 | a | |||||||||||
Financial ratios | ||||||||||||||||||||
Adjusted basic earnings per shareb– pence | 17.3 | 14.1 | 20.2 | 19.1 | 17.4 | |||||||||||||||
| Reported basic (loss) earnings per share – pence | 13.3 | (2.5 | ) | 21.5 | 34.4 | 18.4 | ||||||||||||||
Adjusted return on capital employedb, c(unaudited) | 16.0 | 14.5 | 17.7 | 17.6 | 18.1 | |||||||||||||||
Reported return on capital employedc (unaudited) | 13.3 | 2.3 | 14.4 | 16.5 | 17.1 | |||||||||||||||
Adjusted interest cover before net pension interestd – times (unaudited) | 2.9 | 2.5 | 3.6 | 4.2 | 3.6 | |||||||||||||||
Reported interest covere – times (unaudited) | 0.3 | 0.5 | 6.2 | 27.0 | 5.3 | |||||||||||||||
| 2010 | 2009 | 2008 | 2007 | 2006 | ||||||||||||||||
| Year ended 31 March | £m | £m | £m | £m | £m | |||||||||||||||
Expenditure on research and development | ||||||||||||||||||||
| Research and development expense | 444 | 590 | 532 | 378 | 326 | |||||||||||||||
| Amortisation of internally developed computer software | 733 | 431 | 325 | 314 | 161 | |||||||||||||||
Total | 1,177 | 1,021 | 857 | 692 | 487 | |||||||||||||||
| 2010 | 2009 | 2008 | 2007 | 2006 | ||||||||||||||||
| Year ended 31 March | £m | £m | £m | £m | £m | |||||||||||||||
Capital expenditure | ||||||||||||||||||||
| Plant and equipment | ||||||||||||||||||||
| Transmission equipment | 902 | 1,067 | 1,117 | 1,209 | 1,429 | |||||||||||||||
| Exchange equipment | 29 | 44 | 83 | 118 | 80 | |||||||||||||||
| Other network equipment | 753 | 899 | 1,060 | 854 | 727 | |||||||||||||||
| Computers and office equipment | 115 | 140 | 181 | 149 | 138 | |||||||||||||||
| Motor vehicles and other | 662 | 912 | 876 | 877 | 715 | |||||||||||||||
| Land and buildings | 29 | 23 | 33 | 61 | 68 | |||||||||||||||
| 2,490 | 3,085 | 3,350 | 3,268 | 3,157 | ||||||||||||||||
| Increase (decrease) in engineering stores | 43 | 3 | (11 | ) | (21 | ) | (15 | ) | ||||||||||||
Total capital expenditure | 2,553 | 3,088 | 3,339 | 3,247 | 3,142 | |||||||||||||||
| (Decrease) increase in payables | (24 | ) | (6 | ) | (24 | ) | 51 | (202 | ) | |||||||||||
Cash outflow on capital expenditure | 2,509 | 3,082 | 3,315 | 3,298 | 2,940 | |||||||||||||||
| a | Restated. See page 94. | |
| b | Adjusted results refer to the results before specific items, the BT Global Services contract and financial review charges in 2009, and net interest on pensions. | |
| c | The ratio is based on profit before taxation and net finance expense to average capital employed. Capital employed is represented by total assets less current liabilities (excluding corporation tax, current borrowings, derivative financial liabilities and finance lease creditors) less deferred tax assets, retirement benefit asset, cash and cash equivalents, derivative financial assets and investments. | |
| d | The number of times net finance expense before net pension interest and specific items is covered by adjusted operating profit. | |
| e | The number of times reported net finance expense is covered by reported operating profit. |
BT GROUP PLCANNUAL REPORT & FORM 20-F 153
Table of Contents
FINANCIAL STATEMENTS
OPERATIONAL STATISTICS
| All values (000) unless otherwise stated. | Unaudited | |||||||||||||||||||
| Year ended 31 March | 2010 | 2009 | 2008 | 2007 | 2006 | |||||||||||||||
BT Global Services | ||||||||||||||||||||
12 month rollingaorder intake (£m) | 6,631 | 7,917a | 7,835a | 9,101a | 8,787a | |||||||||||||||
BT Retail | ||||||||||||||||||||
BT’s retail share of broadbandbinstalled base | 35% | 34% | 35% | 34% | 33% | |||||||||||||||
| BT Vision installed base | 467 | 423 | 214 | – | – | |||||||||||||||
| Call minutes (bn) | ||||||||||||||||||||
| Non geographic | 11.86 | 14.73 | 19.18 | 25.03 | 34.66 | |||||||||||||||
| Geographic | 37.31 | 42.06 | 46.84 | 51.92 | 58.35 | |||||||||||||||
| Total | 49.17 | 56.79 | 66.02 | 76.95 | 93.01 | |||||||||||||||
Active consumer linesc | 11,113 | 11,789 | 12,600 | 13,634 | 14,587 | |||||||||||||||
Average annual revenue per consumer user (ARPU)d(£) | 309 | 287 | 274 | 262 | 251 | |||||||||||||||
BT Group | ||||||||||||||||||||
Total employeese | 97.8 | 107.0 | 111.9 | 106.2 | 104.4 | |||||||||||||||
| Broadband lines (UK) | ||||||||||||||||||||
| BT Retail | 5,132 | 4,757 | 4,402 | 3,659 | 2,668 | |||||||||||||||
| BT Wholesale (external) | 2,926 | 3,305 | 3,983 | 5,168 | 5,092 | |||||||||||||||
| Openreach | 6,620 | 5,750 | 4,300 | 1,910 | 356 | |||||||||||||||
| Total broadband lines | 14,678 | 13,812 | 12,685 | 10,737 | 8,116 | |||||||||||||||
| Exchange lines (UK) | ||||||||||||||||||||
| Consumer | 13,051 | 14,514 | 15,793 | 16,636 | 17,912 | |||||||||||||||
| Business | 5,367 | 5,992 | 6,750 | 7,264 | 7,797 | |||||||||||||||
| External WLR lines | 6,028 | 5,647 | 4,666 | 4,227 | 2,874 | |||||||||||||||
| Total exchange lines | 24,446 | 26,153 | 27,209 | 28,127 | 28,583 | |||||||||||||||
| a | Restated for impact of customer account moves. See page 101. | |
| b | DSL and LLU. | |
| c | Active consumer lines represents the number of lines over which BT is the call provider (excluding Northern Ireland but including Plusnet in 2010). | |
| d | Rolling 12 month consumer revenue, less mobile POLOs, divided by average number of primary lines. | |
| e | The numbers disclosed include both full-time and part-time employees. |
154 BT GROUP PLCANNUAL REPORT & FORM 20-F
Table of Contents
ADDITIONAL INFORMATION
BT GROUP PLCANNUAL REPORT & FORM 20-F 155
Table of Contents
ADDITIONAL INFORMATION
INFORMATION FOR SHAREHOLDERS
Cautionary statement regarding forward-looking statements
Certain statements in this annual report are forward-looking and are made in reliance on the safe harbour provisions of the US Private Securities Litigation Reform Act of 1995. These statements relate to analyses and other information which are based on forecasts of future results and estimates of amounts not yet determinable. These statements include, without limitation, those concerning: revenue; operating cost savings; adjusted EBITDA after leaver costs; free cash flow; payments to the BTPS; net debt; investment in operating expenditure; enhancing our TV offering; capital expenditure; progressive dividends; growth of, and opportunities available in, the communications industry and BT’s positioning to take advantage of those opportunities; expectations regarding competition, market shares, prices and growth; expectations regarding the convergence of technologies; growth opportunities in networked IT services, the TV market, broadband and mobility; BT’s network development and fibre roll-out; opportunities in BT Global Services; plans for the launch of new products and services; network performance and quality; the impact of regulatory initiatives and decisions on operations, including the regulation of the UK fixed wholesale and retail businesses and the impact of the Undertakings to Ofcom under the Enterprise Act; BT’s possible or assumed future results of operations and/or those of its associates and joint ventures; capital expenditure and investment plans; adequacy of capital; financing plans and refinancing requirements; demand for and access to broadband and the promotion of broadband by third-party service providers; and those preceded by, followed by, or that include the words ‘aims’, ‘believes’, ‘expects’, ‘anticipates’, ‘intends’, ‘will’, ‘should’ or similar expressions.
Although BT believes that the expectations reflected in these forward-looking statements are reasonable, it can give no assurance that these expectations will prove to have been correct. Because these statements involve risks and uncertainties, actual results may differ materially from those expressed or implied by these forward-looking statements. Factors that could cause differences between actual results and those implied by the forward-looking statements include, but are not limited to: material adverse changes in economic conditions in the markets served by BT; future regulatory actions and conditions in its operating areas, including competition from others; selection by BT of the appropriate trading and marketing models for its products and services; technological innovations, including the cost of developing new products, networks and solutions and the need to increase expenditures for improving the quality of service; the anticipated benefits and advantages of new technologies, products and services not being realised; developments in the convergence of technologies; prolonged adverse weather conditions resulting in a material increase in overtime, staff or other costs; the timing of entry and profitability of BT in certain communications markets; significant changes in market shares for BT and its principal products and services; fluctuations in foreign currency exchange rates and interest rates; the underlying assumptions and estimates made in respect of major customer contracts proving unreliable; the aims of the BT Global Services restructuring programme not being achieved; the outcome of the Pensions Regulator’s review; and general financial market conditions affecting BT’s performance and ability to raise finance. Certain of these factors are discussed in more detail elsewhere in this annual report including, without limitation, inOur riskson pages 36 to 37. BT undertakes no obligation to update any forward-looking statements whether as a result of new information, future events or otherwise.
156 BT GROUP PLCANNUAL REPORT & FORM 20-F
Table of Contents
ADDITIONAL INFORMATIONINFORMATION FOR SHAREHOLDERS
Stock exchange listings
The principal listing of BT Group’s ordinary shares is on the London Stock Exchange. Trading on the London Stock Exchange is under the symbol ‘BT.A’. American Depositary Shares (ADSs), each representing ten ordinary shares, have been issued by JPMorgan Chase Bank, as Depositary for the American Depositary Receipts (ADRs) evidencing the ADSs, and are listed on the New York Stock Exchange. ADSs also trade, but are not listed, on the London Stock Exchange. Trading on the New York Stock Exchange is under the symbol ‘BT’.
Share and ADS prices
| Pence per | US$ per | |||||||||||||||
| ordinary share | ADS | |||||||||||||||
| High | Low | High | Low | |||||||||||||
| pence | pence | US$ | US$ | |||||||||||||
Financial years ended 31 March | ||||||||||||||||
| 2006 | 235.00 | 196.50 | 41.71 | 35.34 | ||||||||||||
| 2007 | 321.75 | 209.25 | 62.96 | 37.08 | ||||||||||||
| 2008 | 336.75 | 205.50 | 68.55 | 40.86 | ||||||||||||
| 2009 | 235.50 | 71.40 | 46.20 | 9.80 | ||||||||||||
| 2010 | 149.60 | 79.70 | 25.14 | 11.64 | ||||||||||||
Financial year ended 31 March 2009 | ||||||||||||||||
| 1 April – 30 June 2008 | 235.50 | 198.40 | 46.20 | 39.47 | ||||||||||||
| 1 July – 30 September 2008 | 217.50 | 158.90 | 42.60 | 27.67 | ||||||||||||
| 1 October – 31 December 2008 | 167.60 | 110.00 | 29.11 | 16.98 | ||||||||||||
| 1 January – 31 March 2009 | 143.30 | 71.40 | 21.31 | 9.80 | ||||||||||||
Financial year ended 31 March 2010 | ||||||||||||||||
| 1 April – 30 June 2009 | 105.60 | 79.70 | 17.27 | 11.64 | ||||||||||||
| 1 July – 30 September 2009 | 141.45 | 100.35 | 22.95 | 16.22 | ||||||||||||
| 1 October – 31 December 2009 | 149.60 | 128.50 | 25.14 | 20.47 | ||||||||||||
| 1 January – 31 March 2010 | 146.90 | 113.50 | 24.00 | 17.00 | ||||||||||||
Months | ||||||||||||||||
| November 2009 | 149.60 | 131.30 | 25.14 | 21.35 | ||||||||||||
| December 2009 | 144.60 | 135.00 | 23.94 | 21.74 | ||||||||||||
| January 2010 | 146.90 | 135.00 | 24.00 | 21.74 | ||||||||||||
| February 2010 | 136.50 | 114.90 | 21.85 | 17.53 | ||||||||||||
| March 2010 | 126.40 | 113.50 | 19.15 | 17.00 | ||||||||||||
| April 2010 | 134.20 | 122.30 | 20.58 | 18.65 | ||||||||||||
| 1 May – 7 May 2010 | 126.70 | 109.90 | 19.29 | 16.19 | ||||||||||||
The prices are the highest and lowest closing middle market prices for BT ordinary shares, as derived from the Daily Official List of the London Stock Exchange and the highest and lowest closing sales prices of ADSs, as reported on the New York Stock Exchange composite tape.
Fluctuations in the exchange rate between Sterling and the US Dollar affect the US Dollar equivalent of the Sterling price of the company’s ordinary shares on the London Stock Exchange and, as a result, are likely to affect the market price of the ADSs on the New York Stock Exchange.
Background
BT Group plc is a public limited company registered in England and Wales and listed on the London and New York stock exchanges. It was incorporated in England and Wales on 30 March 2001 as Newgate Telecommunications Limited with the registered number 4190816. Its registered office address is 81 Newgate Street, London EC1A 7AJ. The company changed its name to BT Group plc on 11 September 2001. Following the demerger of O2 in November 2001, the continuing activities of BT were transferred to BT Group plc.
British Telecommunications plc is a wholly owned subsidiary of BT Group plc and encompasses virtually all the businesses and assets of the BT group. The successor to the statutory corporation British Telecommunications, it was incorporated in England and Wales as a public limited company, wholly owned by the UK Government, as a result of the Telecommunications Act 1984. Between November 1984 and July 1993, the UK Government sold all of its shareholding in British Telecommunications plc in three public offerings.
Capital gains tax
The rights issue in June 2001 and the demerger of O2 in November 2001 adjusted the value, for capital gains tax (CGT) purposes, of BT shares.
BT GROUP PLCANNUAL REPORT & FORM 20-F 157
Table of Contents
ADDITIONAL INFORMATIONINFORMATION FOR SHAREHOLDERS
Rights issue
An explanatory note on the effects of the rights issue on the CGT position relating to BT shareholdings is available from the Shareholder Helpline (see page 167).
Demerger of O2 – CGT calculation
The confirmed official opening prices for BT Group and O2 shares on 19 November 2001 following the demerger were 285.75p and 82.75p, respectively. This means that, of the total (combined) value of 368.50p, 77.544% is attributable to BT Group and 22.456% to O2. Accordingly, for CGT calculations, the base cost of BT Group shares and O2 shares is calculated by multiplying the acquisition cost of a BT shareholding by 77.544% and 22.456%, respectively.
Analysis of shareholdings at 31 March 2010
| Ordinary shares of 5p each | ||||||||||||||||
| Number of | Percentage | No. of | Percentage | |||||||||||||
| holdings | of total | shares held | of total | |||||||||||||
| Range | (%) | millions | (%) | |||||||||||||
| 1 – 399 | 438,089 | 38.54 | 92 | 1.13 | ||||||||||||
| 400 – 799 | 312,685 | 27.49 | 175 | 2.15 | ||||||||||||
| 800 – 1,599 | 223,916 | 19.70 | 250 | 3.07 | ||||||||||||
| 1,600 – 9,999 | 155,753 | 13.70 | 463 | 5.68 | ||||||||||||
| 10,000 – 99,999 | 5,367 | 0.47 | 97 | 1.19 | ||||||||||||
| 100,000 – 999,999 | 602 | 0.05 | 219 | 2.69 | ||||||||||||
| 1,000,000 – 4,999,999 | 287 | 0.03 | 646 | 7.92 | ||||||||||||
5,000,000 and abovea,b,c,d | 190 | 0.02 | 6,209 | 76.17 | ||||||||||||
Totale | 1,136,889 | 100.00 | 8,151 | 100.00 | ||||||||||||
| a | 9m shares were held in trust by Ilford Trustees (Jersey) Limited for allocation to employees under the employee share plans. | |
| b | Under the BT Group Employee Share Investment Plan, 79.2m shares were held in trust on behalf of 68,444 participants who were beneficially entitled to the shares. 236m shares were held in the corporate nominee BT Group EasyShare on behalf of 105,102 beneficial owners. | |
| c | 134m shares were represented by ADSs. An analysis by size of holding is not available for this holding. | |
| d | 398m shares were held as treasury shares. | |
| e | 12.43% of the shares were in 1,120,540 individual holdings, of which 95,883 were joint holdings, and 87.57% of the shares were in 16,349 institutional holdings. |
As far as the company is aware, the company is not directly or indirectly owned or controlled by another corporation or by the UK Government or any other foreign government or by any other natural or legal person severally or jointly. There are no arrangements known to the company, the operation of which may at a subsequent date result in a change in control of the company.
The company’s major shareholders do not have different voting rights to those of other shareholders.
At 7 May 2010, there were 8,151,227,029 ordinary shares outstanding, including 397,312,949 shares held as treasury shares. At the same date, approximately 12.8m ADSs (equivalent to 128m ordinary shares, or approximately 1.6% of the total number of ordinary shares outstanding on that date) were outstanding and were held by 2,208 record holders of ADRs.
At 31 March 2010, there were 3,668 shareholders with a US address on the register of shareholders who in total hold 0.03% of the ordinary shares of the company.
Dividends
A final dividend in respect of the year ended 31 March 2009 was paid on 7 September 2009 to shareholders on the register on 14 August 2009, and an interim dividend in respect of the year ended 31 March 2010 was paid on 8 February 2010 to shareholders on the register on 29 December 2009. The final proposed dividend in respect of the year ended 31 March 2010, if approved by shareholders, will be paid on 6 September 2010 to shareholders on the register on 13 August 2010.
The dividends paid or payable on BT shares and ADSs for the last five financial years are shown in the following table. The dividends on the ordinary shares exclude the associated tax credit. The amounts shown are not those that were actually paid to holders of ADSs. For the tax treatment of dividends paid, seeTaxation of dividendson page 164. Dividends have been translated from Sterling into US Dollars using exchange rates prevailing on the date the ordinary dividends were paid.
| per ordinary share | per ADS | per ADS | ||||||||||||||||||||||||||||||||||
| Interim | Final | Total | Interim | Final | Total | Interim | Final | Total | ||||||||||||||||||||||||||||
| Financial years ended 31 March | pence | pence | pence | £ | £ | £ | US$ | US$ | US$ | |||||||||||||||||||||||||||
| 2006 | 4.30 | 7.60 | 11.90 | 0.430 | 0.760 | 1.190 | 0.747 | 1.415 | 2.162 | |||||||||||||||||||||||||||
| 2007 | 5.10 | 10.00 | 15.10 | 0.510 | 1.000 | 1.510 | 0.991 | 1.972 | 2.963 | |||||||||||||||||||||||||||
| 2008 | 5.40 | 10.40 | 15.80 | 0.540 | 1.040 | 1.580 | 1.030 | 1.833 | 2.863 | |||||||||||||||||||||||||||
| 2009 | 5.40 | 1.10 | 6.50 | 0.540 | 0.110 | 0.650 | 0.765 | 0.161 | 0.926 | |||||||||||||||||||||||||||
| 2010 | 2.30 | 4.60 | 6.90 | 0.230 | 0.460 | 0.690 | 0.339 | – | a | – | a | |||||||||||||||||||||||||
| a | Qualifying holders of ADSs on record as of 13 August 2010 are entitled to receive the final dividend which will be paid to ADS holders on 14 September 2010, subject to approval at the AGM. The US Dollar amount of the final dividend of 46.0 pence per ADS to be paid to holders of ADSs will be based on the exchange rate in effect on 6 September 2010, the date of payment to holders of ordinary shares. |
158 BT GROUP PLCANNUAL REPORT & FORM 20-F
Table of Contents
ADDITIONAL INFORMATIONINFORMATION FOR SHAREHOLDERS
As dividends paid by the company are in Sterling, exchange rate fluctuations will affect the US Dollar amounts received by holders of ADSs on conversion by the Depositary of such cash dividends.
Dividend mandate
Any shareholder wishing dividends to be paid directly into a bank or building society account should contact the Shareholder Helpline (see page 167). Dividends paid in this way will be paid through the Bankers Automated Clearing System (BACS). Alternatively, a form may be downloaded from the Dividends page of our website atwww.bt.com/investorcentre
Dividend investment plan
Under the Dividend investment plan, cash from participants’ dividends is used to buy further BT shares in the market.
Shareholders could elect to receive additional shares in lieu of a cash dividend for the following dividends:
| Date paid | Price per share pence | |||||||
| 2006 interim | 13 February 2006 | 214.50 | ||||||
| 2006 final | 11 September 2006 | 250.98 | ||||||
| 2007 interim | 12 February 2007 | 320.54 | ||||||
| 2007 final | 17 September 2007 | 316.21 | ||||||
| 2008 interim | 11 February 2008 | 232.08 | ||||||
| 2008 final | 15 September 2008 | 174.38 | ||||||
| 2009 interim | 9 February 2009 | 107.04 | ||||||
| 2009 final | 7 September 2009 | 133.34 | ||||||
| 2010 interim | 8 February 2010 | 131.67 | ||||||
Global Invest Direct
Details of the direct purchase plan run by the ADR Depositary, JPMorgan Chase Bank, Global Invest Direct, including reinvestment of dividends, are available from JPMorgan Chase Bank on +1 800 428 4237 (toll free within the US), or on written request to the ADR Depositary.
Total shareholder return
Total shareholder return (TSR) is the measure of the returns that a company has generated for its shareholders, reflecting share price movements and assuming reinvestment of dividends. BT’s TSR for the 2010 financial year was positive 62.4%, compared with the FTSE 100 TSR which was positive 50.4% and the FTSEurofirst 300 Telco Index TSR which was positive 27.9%. BT’s TSR improvement in the 2010 financial year is mainly due to the recovery of the share price during 2010, from a closing price of 71.4p in March 2009. Over the last five financial years, BT’s TSR was negative 20.7% compared with the FTSE 100 TSR of positive 39.5% and the FTSEurofirst 300 Telco Index TSR of positive 15.0%. In the period between the demerger on 19 November 2001 and 31 March 2010, BT’s TSR was negative 34.2%, compared with the FTSE 100 TSR of positive 44.6% and the FTSEurofirst 300 Telco Index TSR of negative 5.5%.
BT’s total shareholder return (TSR) performance vs the FTSE 100
and FTSEurofirst 300 Telco Index
over the five financial years to 31 March 2010
and FTSEurofirst 300 Telco Index
over the five financial years to 31 March 2010
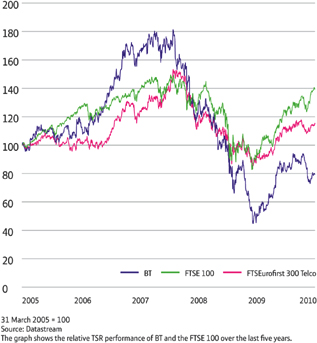
BT’s total shareholder return (TSR) performance vs the FTSE 100
and FTSEurofirst 300 Telco Index
since demerger
and FTSEurofirst 300 Telco Index
since demerger
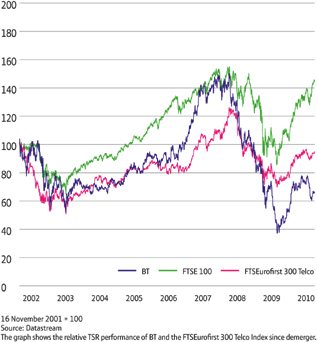
BT GROUP PLCANNUAL REPORT & FORM 20-F 159
Table of Contents
ADDITIONAL INFORMATIONINFORMATION FOR SHAREHOLDERS
Results announcements
Expected announcements of results:
| Results for the 2011 financial year | Datea | |||
| 1st quarter | 29 July 2010 | |||
| 2nd quarter and half year | 11 November 2010 | |||
| 3rd quarter and nine months | February 2011 | |||
| 4th quarter and full year | May 2011 | |||
| 2011 Annual Report published | May 2011 | |||
| a | Dates may be subject to change. |
Individual savings accounts (ISAs)
Information about investing in BT shares through an ISA may be obtained from Halifax Share Dealing Limited, 1 Lovell Park Road, West Yorkshire, Leeds LS1 1NS (telephone: 08457 22 55 25). ISAs are also offered by other organisations.
ShareGift
The charity ShareGift specialises in accepting small numbers of shares as donations. Further information about ShareGift may be obtained by telephoning 020 7930 3737 or fromwww.ShareGift.org or alternatively, from the Shareholder Helpline (see page 167).
Unclaimed Assets Register
BT, along with many other leading UK companies, subscribes to Experian’s Unclaimed Assets Register (UAR), a register of individuals owed unclaimed financial assets such as shareholdings and dividends. UAR provides members of the public with a search device to trace lost assets. For further information visitwww.uar.co.ukor telephone 0870 241 1713.
Exchange rates
BT publishes its consolidated financial statements expressed in Sterling. The following tables detail certain information concerning the exchange rates between Sterling and US Dollars based on the noon buying rate in New York City for cable transfers in Sterling as certified for customs purposes by the Federal Reserve Bank of New York (the Noon Buying Rate).
| Year ended 31 March | 2010 | 2009 | 2008 | 2007 | 2006 | |||||||||||||||
| Period end | 1.52 | 1.43 | 1.99 | 1.97 | 1.74 | |||||||||||||||
Averagea | 1.55 | 1.70 | 2.01 | 1.91 | 1.78 | |||||||||||||||
| High | 1.64 | 2.00 | 2.11 | 1.99 | 1.92 | |||||||||||||||
| Low | 1.49 | 1.37 | 1.94 | 1.74 | 1.71 | |||||||||||||||
| a | The average of the Noon Buying Rates in effect on the last day of each month during the relevant period. |
| Month | ||||||||||||||||||||||||
| April | March | February | January | December | November | |||||||||||||||||||
| 2010 | 2010 | 2010 | 2010 | 2009 | 2009 | |||||||||||||||||||
| High | 1.55 | 1.53 | 1.60 | 1.64 | 1.66 | 1.68 | ||||||||||||||||||
| Low | 1.52 | 1.49 | 1.52 | 1.59 | 1.59 | 1.64 | ||||||||||||||||||
On 7 May 2010, the most recent practicable date for this Annual Report, the Noon Buying Rate was US$1.47 to £1.00.
160 BT GROUP PLCANNUAL REPORT & FORM 20-F
Table of Contents
ADDITIONAL INFORMATIONINFORMATION FOR SHAREHOLDERS
Articles of Association (‘Articles’)
The following is a summary of the principal provisions of BT’s Articles, a copy of which has been filed with the Registrar of Companies. A ‘holder of shares’ and a ‘shareholder’ is, in either case, the person entered on the company’s register of members as the holder of the relevant shares. Shareholders can choose whether their shares are to be evidenced by share certificates (ie in certificated form) or held in electronic (ie uncertificated) form in CREST (the electronic settlement system in the UK).
At the AGM held on 15 July 2009, shareholders voted to adopt new Articles of Association with effect from October 2009, largely to take account of changes in UK company law brought about by the Companies Act 2006 (‘2006 Act’). Under that Act, the Memorandum of Association serves a more limited role as historical evidence of the formation of the company. Since October 2009, the provisions in relation to objects in BT’s Memorandum are deemed to form part of BT’s Articles, and have been deleted from those Articles because of shareholders passing a resolution to this effect at the AGM. Under the 2006 Act, BT’s objects are unrestricted.
(a) Voting rights
Subject to the restrictions described below, on a show of hands, every shareholder present in person or by proxy at any general meeting has one vote and, on a poll, every shareholder present in person or by proxy has one vote for each share which they hold.
Voting at any meeting of shareholders is by a show of hands unless a poll is demanded by the chairman of the meeting or by at least five shareholders at the meeting who are entitled to vote (or their proxies), or by one or more shareholders at the meeting who are entitled to vote (or their proxies) and who have, between them, at least 10% of the total votes of all shareholders who have the right to vote at the meeting.
No person is, unless the Board decide otherwise, entitled to attend or vote at any general meeting or to exercise any other right conferred by being a shareholder if they or any person appearing to be interested in those shares has been sent a notice under section 793 of the Companies Act 2006 (which confers upon public companies the power to require information with respect to interests in their voting shares) and they or any interested person has failed to supply to the company the information requested within 14 days after delivery of that notice. These restrictions end seven days after the earlier of the date the shareholder complies with the request satisfactorily or the company receives notice that there has been an approved transfer of the shares.
(b) Variation of rights
Whenever the share capital of the company is split into different classes of shares, the special rights attached to any of those classes can be varied or withdrawn either:
| (i) | with the sanction of a special resolution passed at a separate meeting of the holders of the shares of that class; or | |
| (ii) | with the consent in writing of the holders of at least 75% in nominal value of the issued shares of that class. |
At any separate meeting, the necessary quorum is two persons holding or representing by proxy not less than one-third in nominal amount of the issued shares of the class in question (but at any adjourned meeting, any person holding shares of the class or his proxy is a quorum).
The company can issue new shares and attach any rights and restrictions to them, as long as this is not restricted by special rights previously given to holders of any existing shares. Subject to this, the rights of new shares can take priority over the rights of existing shares, or existing shares can take priority over them, or the new shares and the existing shares can rank equally.
(c) Changes in capital
The company may by ordinary resolution:
| (i) | divide all or any of its share capital into shares with a smaller nominal value; and | |
| (ii) | consolidate and divide all or part of its share capital into shares of a larger nominal value. |
The company may also:
| (i) | buy back its own shares; and | |
| (ii) | by special resolution reduce its share capital, any capital redemption reserve and any share premium account. |
(d) Dividends
The company’s shareholders can declare dividends by passing an ordinary resolution provided that no dividend can exceed the amount recommended by the directors. Dividends must be paid out of profits available for distribution. If the directors consider that the profits of the company justify such payments, they can pay interim dividends on any class of shares of the amounts and on the dates and for the periods they decide. Fixed dividends will be paid on any class of shares on the dates stated for the payments of those dividends.
The directors can offer ordinary shareholders the right to choose to receive new ordinary shares, which are credited as fully paid, instead of some or all of their cash dividend. Before they can do this, the company’s shareholders must have passed an ordinary resolution authorising the directors to make this offer.
Any dividend which has not been claimed for ten years after it was declared or became due for payment will be forfeited and will belong to the company.
BT GROUP PLCANNUAL REPORT & FORM 20-F 161
Table of Contents
ADDITIONAL INFORMATIONINFORMATION FOR SHAREHOLDERS
(e) Distribution of assets on winding up
If the company is wound up (whether the liquidation is voluntary, under supervision of the court or by the court) the liquidator can, with the authority of a special resolution passed by the shareholders, divide among the shareholders all or any part of the assets of the company. This applies whether the assets consist of property of one kind or different kinds. For this purpose, the liquidator can place whatever value the liquidator considers fair on any property and decide how the division is carried out between shareholders or different groups of shareholders. The liquidator can also, with the same authority, transfer any assets to trustees upon any trusts for the benefit of shareholders which the liquidator decides. The liquidation of the company can then be finalised and the company dissolved. No past or present shareholder can be compelled to accept any shares or other property under the Articles which could give that shareholder a liability.
(f) Transfer of shares
Certificated shares of the company may be transferred in writing either by an instrument of transfer in the usual standard form or in another form approved by the Board. The transfer form must be signed or made effective by or on behalf of the person making the transfer. The person making the transfer will be treated as continuing to be the holder of the shares transferred until the name of the person to whom the shares are being transferred is entered in the register of members of the company.
The Board may refuse to register any transfer of any share held in certificated form:
| (i) | which is in favour of more than four joint holders; or | |
| (ii) | unless the transfer form to be registered is properly stamped to show payment of any applicable stamp duty and delivered to the company’s registered office or any other place the Board decide. The transfer must have with it the share certificate for the shares to be transferred; any other evidence which the Board ask for to prove that the person wanting to make the transfer is entitled to do this; and if the transfer form is executed by another person on behalf of the person making the transfer, evidence of the authority of that person to do so. |
Transfers of uncertificated shares must be carried out using a relevant system (as defined in the Uncertificated Securities Regulations 2001 (the Regulations)). The Board can refuse to register a transfer of an uncertificated share in the circumstances stated in the Regulations.
If the Board decide not to register a transfer of a share, the Board must notify the person to whom that share was to be transferred giving reasons for their decision. This must be done as soon as possible and no later than two months after the company receives the transfer or instruction from the operator of the relevant system.
(g) Untraced shareholders
BT may sell any shares after advertising its intention and waiting for three months if the shares have been in issue for at least ten years, during that period at least three dividends have become payable on them and have not been cashed and BT has not heard from the shareholder or any person entitled to the dividends by transmission. The net sale proceeds belong to BT, but it must pay those proceeds to the former shareholder or the person entitled to them by transmission if that shareholder, or that other person, asks for them.
(h) General meetings of shareholders
Every year the company must hold an annual general meeting. The Board can call a general meeting at any time and, under general law, must call one on a shareholders’ requisition. At least 21 clear days’ written notice must be given for every annual general meeting. For every other general meeting, at least 14 clear days’ written notice must be given. The Board can specify in the notice of meeting a time by which a person must be entered on the register of shareholders in order to have the right to attend or vote at the meeting. The time specified must not be more than 48 hours before the time fixed for the meeting.
(i) Limitations on rights of non-resident or foreign shareholders
The only limitation imposed by the Articles on the rights of non-resident or foreign shareholders is that a shareholder whose registered address is outside the UK and who wishes to receive notices of meetings of shareholders or documents from BT must give the company an address within the UK to which they may be sent.
(j) Directors
Directors’ remuneration
Excluding remuneration referred to below, each director will be paid such fee for his services as the Board decide, not exceeding £65,000 a year and increasing by the percentage increase of the retail prices index (as defined by Section 833(2) Income and Corporation Taxes Act 1988) for any 12 month period beginning 1 April 1999 or an anniversary of that date. The company may by ordinary resolution decide on a higher sum. This resolution can increase the fee paid to all or any directors either permanently or for a particular period. The directors may be paid their expenses properly incurred in connection with the business of the company.
The Board can award extra fees to a director who holds an executive position; acts as chairman or deputy chairman; serves on a Board committee at the request of the Board; or performs any other services which the Board consider extend beyond the ordinary duties of a director.
The directors may grant pensions or other benefits to, among others, any director or former director or persons connected with them. However, BT can only provide these benefits to any director or former director who has not been an employee or held any other office or executive position in the company or any of its subsidiary undertakings, or to relations or dependants of, or people connected to, those directors or former directors, if the shareholders approve this by passing an ordinary resolution.
162 BT GROUP PLCANNUAL REPORT & FORM 20-F
Table of Contents
ADDITIONAL INFORMATIONINFORMATION FOR SHAREHOLDERS
Directors’ votes
A director need not be a shareholder, but a director who is not a shareholder can still attend and speak at shareholders’ meetings.
Unless the Articles say otherwise, a director cannot vote on a resolution about a contract in which the director has an interest (this will also apply to interests of a person connected with the director).
If the legislation allows, a director can vote and be counted in the quorum on a resolution concerning a contract:
| (i) | in which the director has an interest of which the director is not aware; or which cannot reasonably be regarded as likely to give rise to a conflict of interest; | |
| (ii) | in which the director has an interest only because the director is a holder of shares, debentures or other securities of BT, or by reason of any other interest in or through BT; | |
| (iii) | which involves the giving of any security, guarantee or indemnity to the director or any other person for money lent or obligations incurred by the director or by any other person at the request of or for the benefit of BT or the benefit of any of its subsidiary undertakings; or a debt or other obligation which is owed by BT or any of its subsidiary undertakings to that other person if the director has taken responsibility for all or any part of that debt or obligation by giving a guarantee, security or indemnity; | |
| (iv) | where BT or any of its subsidiary undertakings is offering any shares, debentures or other securities for subscription or purchase to which the director is or may be entitled to participate as a holder of BT securities; or where the director will be involved in the underwriting or sub-underwriting; | |
| (v) | relating to any other company in which the director has an interest, directly or indirectly (including holding a position in that company) or is a shareholder, creditor, employee or otherwise involved in that company. These rights do not apply if the director owns one per cent or more of that company or of the voting rights in that company; | |
| (vi) | relating to an arrangement for the benefit of BT employees or former BT employees or any of BT’s subsidiary undertakings which only gives the directors the same benefits that are generally given to the employees or former employees to whom the arrangement relates; | |
| (vii) | relating to BT buying or renewing insurance for any liability for the benefit of directors or for the benefit of persons who include directors; | |
| (viii) | relating to the giving of indemnities in favour of directors; | |
| (ix) | relating to the funding of expenditure by any director or directors: on defending criminal, civil or regulatory proceedings or actions against the director or the directors; in connection with an application to the court for relief; or on defending the director or the directors in any regulatory investigations; or which enables any director or directors to avoid incurring expenditure as described in this paragraph; and | |
| (x) | in which the director’s interest, or the interest of directors generally, has been authorised by an ordinary resolution. |
Subject to the relevant legislation, the shareholders can by passing an ordinary resolution ratify any particular contract carried out in breach of those provisions.
Directors’ appointment and retirement
Under BT’s Articles there must be at least two directors, who manage the business of the company. The shareholders can vary this minimum and/or decide a maximum by ordinary resolution. The Board and the shareholders (by ordinary resolution) may appoint a person who is willing to be elected as a director, either to fill a vacancy or as an additional director.
At every annual general meeting, any director who was elected or last re-elected a director at or before the annual general meeting held in the third year before the current year, must retire by rotation. Any director appointed by the directors automatically retires at the next following annual general meeting. A retiring director is eligible for re-election.
In addition to any power of removal under the 2006 Act, the shareholders can pass an ordinary resolution to remove a director, even though his or her time in office has not ended. They can elect a person to replace that director subject to the Articles, by passing an ordinary resolution. A person so appointed is subject to retirement by rotation when the director replaced would have been due to retire.
Directors’ borrowing powers
To the extent that the legislation and the Articles allow, the Board can exercise all the powers of the company to borrow money, to mortgage or charge its business, property and assets (present and future) and to issue debentures and other securities, and give security either outright or as collateral security for any debt, liability or obligation of the company or another person. The Board must limit the borrowings of the company and exercise all the company’s voting and other rights or powers of control exercisable by the company in relation to its subsidiary undertakings so as to ensure that the aggregate amount of all borrowings by the group outstanding, net of amounts borrowed intra-group among other things, at any time does not exceed £35bn. These borrowing powers may only be varied by amending the Articles.
(k) Sinking fund, liability to further calls and change of control
BT’s shares are not subject to any sinking fund provision under the Articles or as a matter of the laws of England and Wales. No shareholder is currently liable to make additional contributions of capital in respect of BT’s ordinary shares in the future. There are no provisions in the Articles or of corporate legislation in England and Wales that would delay, defer or prevent a change of control.
BT GROUP PLCANNUAL REPORT & FORM 20-F 163
Table of Contents
ADDITIONAL INFORMATIONINFORMATION FOR SHAREHOLDERS
(l) Disclosure of interests in shares
Under the Financial Services and Markets Act 2000 and the UK Disclosure and Transparency Rules there is a statutory obligation on a person who acquires or ceases to have a notifiable interest in the relevant share capital of a public company like BT to notify the company of that fact. The disclosure threshold is 3%. These Rules also deal with the disclosure by persons of interests in shares or debentures of companies in which they are directors and certain associated companies. Under Section 793 of the 2006 Act (referred to in (a) above), BT may ascertain the persons who are or have within the last three years been interested in its shares and the nature of those interests. The UK City Code on Takeovers and Mergers also imposes strict disclosure requirements with regard to dealings in the securities of an offeror or offeree company on all parties to a takeover and also on their respective associates during the course of an offer period.
Material contracts
Excluding contracts entered into in the ordinary course of business, no contracts have been entered into in the two years preceding the date of this document by BT or another member of the group which are, or may be, material to the group or contain a provision under which a member of the group has an obligation or entitlement which is, or may be, material to BT or such other member of the group.
Taxation (US Holders)
This is a summary only of the principal US federal income tax and UK tax consequences of the ownership and disposition of ordinary shares or ADSs by US Holders (as defined below) who hold their ordinary shares or ADSs as capital assets. It does not address all aspects of US federal income taxation and does not address aspects that may be relevant to persons who are subject to special provisions of US federal income tax law, including US expatriates, insurance companies, tax-exempt organisations, banks, regulated investment companies, financial institutions, securities broker-dealers, traders in securities who elect a mark-to-market method of accounting, persons subject to alternative minimum tax, investors that directly, indirectly or by attribution own 10% or more of the outstanding share capital or voting power of BT, persons holding their ordinary shares or ADSs as part of a straddle, hedging transaction or conversion transaction, persons who acquired their ordinary shares or ADSs pursuant to the exercise of options or otherwise as compensation, or persons whose functional currency is not the US Dollar, amongst others. Those holders may be subject to US federal income tax consequences different from those set forth below.
For the purposes of this summary, a US Holder is a beneficial owner of ordinary shares or ADSs that, for US federal income tax purposes, is: a citizen or individual resident of the United States, a corporation (or other entity taxable as a corporation for US federal income tax purposes) created or organised in or under the laws of the United States or any political subdivision thereof, an estate the income of which is subject to US federal income taxation regardless of its source, or a trust if a US court can exercise primary supervision over the administration of the trust and one or more US persons are authorised to control all substantial decisions of the trust. If a partnership holds ordinary shares or ADSs, the US tax treatment of a partner generally will depend upon the status of the partner and the activities of the partnership. A partner in a partnership that holds ordinary shares or ADSs is urged to consult its own tax advisor regarding the specific tax consequences of owning and disposing of the ordinary shares or ADSs.
In particular, this summary is based on (i) current UK tax law and the practice of Her Majesty’s Revenue & Customs (HMRC) and US law and US Internal Revenue Service (IRS) practice, including the Internal Revenue Code of 1986, as amended, existing and proposed Treasury regulations, rulings, judicial decisions and administrative practice, all as currently in effect and available, (ii) the United Kingdom–United States Convention relating to estate and gift taxes, and (iii) the United Kingdom–United States Tax Convention that entered into force on 31 March 2003 and the protocol thereto (the Convention), all as in effect on the date of this annual report, all of which are subject to change or changes in interpretation, possibly with retroactive effect.
US Holders should consult their own tax advisors as to the applicability of the Convention and the consequences under UK, US federal, state and local, and other laws, of the ownership and disposition of ordinary shares or ADSs.
Taxation of dividends
Under current UK tax law, BT will not be required to withhold tax at source from dividend payments it makes. Unless a US Holder of ordinary shares or ADSs is resident in or ordinarily resident for UK tax purposes in the United Kingdom or unless a US Holder of ordinary shares or ADSs carries on a trade, profession or vocation in the United Kingdom through a branch or agency, or, in the case of a company, a permanent establishment in the United Kingdom, the holder should not be liable for UK tax on dividends received in respect of ordinary shares and/or ADSs.
For US federal income tax purposes, a distribution will be treated as ordinary dividend income. The amount of the distribution includible in gross income of a US Holder will be the US Dollar value of the distribution calculated by reference to the spot rate in effect on the date the distribution is actually or constructively received by a US Holder of ordinary shares, or by the Depositary, in the case of ADSs. A US Holder who converts Sterling into US Dollars on the date of receipt generally should not recognise any exchange gain or loss. A US Holder who does not convert Sterling into US Dollars on the date of receipt generally will have a tax basis in the British pounds equal to their US Dollar value on such date. Foreign currency gain or loss, if any, recognised by the US Holder on a subsequent conversion or other disposition of Sterling generally will be US source ordinary income or loss. Dividends paid by BT to a US Holder will not be eligible for the US dividends received deduction that may otherwise be available to corporate shareholders.
For purposes of calculating the foreign tax credit limitation, dividends paid on the ordinary shares or ADSs will be treated as income from sources outside the United States and generally will constitute ‘passive income’. The rules relating to the determination of the foreign tax credit are very complex. US Holders who do not elect to claim a credit with respect to any foreign taxes paid in a given taxable year may instead claim a deduction for foreign taxes paid. A deduction does not reduce US federal income tax on a dollar for dollar basis like a tax credit. The deduction, however, is not subject to the limitations applicable to foreign credits.
There will be no right to any UK tax credit or to any payment from HMRC in respect of any tax credit on dividends paid on ordinary shares or ADSs.
164 BT GROUP PLCANNUAL REPORT & FORM 20-F
Table of Contents
ADDITIONAL INFORMATIONINFORMATION FOR SHAREHOLDERS
Certain US Holders (including individuals) are eligible for reduced rates of US federal income tax (currently at a maximum rate of 15%) in respect of ‘qualified dividend income’ received in taxable years beginning before 1 January 2011. For this purpose, qualified dividend income generally includes dividends paid by a non-US corporation if, among other things, the US Holders meet certain minimum holding periods and the non-US corporation satisfies certain requirements, including that either (i) the shares or ADSs with respect to which the dividend has been paid are readily tradeable on an established securities market in the United States, or (ii) the non-US corporation is eligible for the benefits of a comprehensive US income tax treaty (such as the Convention) which provides for the exchange of information. BT currently believes that dividends paid with respect to its ordinary shares and ADSs should constitute qualified dividend income for US federal income tax purposes. Each individual US Holder of ordinary shares or ADSs is urged to consult his own tax advisor regarding the availability to him of the reduced dividend tax rate in light of his own particular situation and regarding the computations of his foreign tax credit limitation with respect to any qualified dividend income paid by BT to him, as applicable.
Taxation of capital gains
Unless a US Holder of ordinary shares or ADSs is resident in or ordinarily resident for United Kingdom tax purposes in the United Kingdom or unless a US Holder of ordinary shares or ADSs carries on a trade, profession, or vocation in the United Kingdom through a branch, agency, or in the case of a company, a permanent establishment in the UK, and the ordinary shares and/or ADSs have been used, held, or acquired for the purposes of that trade, profession or vocation the holder should not be liable for UK tax on capital gains on a disposal of ordinary shares and/or ADSs.
A US Holder who is an individual and who has ceased to be resident or ordinarily resident for tax purposes in the United Kingdom on or after 17 March 1998 or who falls to be regarded as resident outside the United Kingdom for the purposes of any double tax treaty (Treaty non-resident) on or after 16 March 2005 and continues to not be resident or ordinarily resident in the United Kingdom or continues to be Treaty non-resident for a period of less than five years of assessment and who disposes of his ordinary shares or ADSs during that period may also be liable on his return to the United Kingdom to UK tax on capital gains, subject to any available exemption or relief, even though he is not resident or ordinarily resident in the United Kingdom or is Treaty non-resident at the time of disposal.
For US federal income tax purposes, a US Holder generally will recognise capital gain or loss on the sale, exchange or other disposition of ordinary shares or ADSs in an amount equal to the difference between the US Dollar value of the amount realised on the disposition and the US Holder’s adjusted tax basis (determined in US Dollars) in the ordinary shares or ADSs. Such gain or loss generally will be US source gain or loss, and will be treated as long-term capital gain or loss if the ordinary shares have been held for more than one year at the time of disposition. Long-term capital gains recognised by an individual US Holder generally are subject to US federal income tax at preferential rates. The deductibility of capital losses is subject to significant limitations.
A US Holder’s tax basis in an ordinary share will generally be its US Dollar cost. The US Dollar cost of an ordinary share purchased with foreign currency will generally be the US dollar value of the purchase price on the date of purchase, or the settlement date for the purchase, in the case of ordinary shares traded on an established securities market, as defined in the applicable Treasury Regulations, that are purchased by a cash basis US Holder (or an accrual basis US Holder that so elects). Such an election by an accrual basis US Holder must be applied consistently from year to year and cannot be revoked without the consent of the IRS. The amount realised on a sale or other disposition of ordinary shares for an amount in foreign currency will be the US Dollar value of this amount on the date of sale or disposition. On the settlement date, the US Holder will recognise US source foreign currency gain or loss (taxable as ordinary income or loss) equal to the difference (if any) between the US Dollar value of the amount received based on the exchange rates in effect on the date of sale or other disposition and the settlement date. However, in the case of ordinary shares traded on an established securities market that are sold by a cash basis US Holder (or an accrual basis US Holder that so elects), the amount realised will be based on the exchange rate in effect on the settlement date for the sale, and no exchange gain or loss will be recognised at that time.
Passive foreign investment company status
A non-US corporation will be classified as a passive foreign investment company for US federal income tax purposes (a PFIC) for any taxable year if at least 75% of its gross income consists of passive income or at least 50% of the average value of its assets consist of assets that produce, or are held for the production of, passive income. BT currently believes that it did not qualify as a PFIC for the tax year ending 31 March 2010. If BT were to become a PFIC for any tax year, US Holders would suffer adverse tax consequences. These consequences may include having gains realised on the disposition of ordinary shares or ADSs treated as ordinary income rather than capital gains and being subject to punitive interest charges on certain dividends and on the proceeds of the sale or other disposition of the ordinary shares or ADSs. Furthermore, dividends paid by BT would not be ‘qualified dividend income’ which may be eligible for reduced rates of taxation as described above. US Holders should consult their own tax advisors regarding the potential application of the PFIC rules to BT.
US information reporting and backup withholding
Dividends paid on and proceeds received from the sale, exchange or other disposition of ordinary shares or ADSs may be subject to information reporting to the IRS and backup withholding at a current rate of 28% (which rate may be subject to change). Certain exempt recipients (such as corporations) are not subject to these information reporting requirements. Backup withholding will not apply, however, to a US Holder who provides a correct taxpayer identification number or certificate of foreign status and makes any other required certification or who is otherwise exempt. Persons that are US persons for US federal income tax purposes who are required to establish their exempt status generally must furnish IRS Form W-9 (Request for Taxpayer Identification Number and Certification). Holders that are not United States persons for US federal income tax purposes generally will not be subject to US information reporting or backup withholding. However, such holders may be required to provide certification of non-US status in connection with payments received in the United States or through certain US-related financial intermediaries.
Backup withholding is not an additional tax. Amounts withheld as backup withholding may be credited against a holder’s US federal income tax liability. A holder may obtain a refund of any excess amounts withheld under the backup withholding rules by timely filing the appropriate claim for refund with the IRS and furnishing any required information.
BT GROUP PLCANNUAL REPORT & FORM 20-F 165
Table of Contents
ADDITIONAL INFORMATIONINFORMATION FOR SHAREHOLDERS
UK stamp duty
A transfer of or an agreement to transfer an ordinary share will generally be subject to UK stamp duty or UK stamp duty reserve tax (SDRT) at 0.5% of the amount or value of any consideration provided rounded up (in the case of stamp duty) to the nearest £5. SDRT is generally the liability of the purchaser. It is customarily also the purchaser who pays UK stamp duty. A transfer of an ordinary share to, or to a nominee for, a person whose business is or includes the provision of clearance services or to, or to a nominee or agent of, a person whose business is or includes issuing depositary receipts gives rise to a 1.5% charge to stamp duty or SDRT of either the amount of the consideration provided or the value of the share issued rounded up (in the case of stamp duty) to the nearest £5. No UK stamp duty will be payable on the transfer of an ADS (assuming it is not registered in the UK), provided that the transfer documents are executed and always retained outside the UK.
Transfers of ordinary shares into CREST will generally not be subject to stamp duty or SDRT unless such a transfer is made for a consideration in money or money’s worth, in which case a liability to SDRT will arise, usually at the rate of 0.5% of the value of the consideration. Paperless transfers of ordinary shares within CREST are generally liable to SDRT at the rate of 0.5% of the value of the consideration. CREST is obliged to collect SDRT from the purchaser of the shares on relevant transactions settled within the system.
UK inheritance and gift taxes in connection with ordinary shares and/or ADSs
The rules and scope of domicile are complex and action should not be taken without advice specific to the individual’s circumstances. A lifetime gift or a transfer on death of ordinary shares and/or ADSs by an individual holder, who is US domiciled (for the purposes of the UK/US Estate and Gift Tax Convention) and who is not a UK national (as defined in the Convention) will not generally be subject to UK inheritance tax if the gift is subject to US federal gift or US estate tax unless the tax is not paid.
Limitations affecting security holders
There are no government laws, decrees, regulations, or other legislation of the United Kingdom which have a material effect on the import or export of capital, including the availability of cash and cash equivalents for use by the company except as otherwise described in Taxation (US Holders).
There are no limitations under the laws of the United Kingdom restricting the right of non-residents to hold or to vote shares in the company.
Documents on display
All reports and other information that BT files with the US Securities and Exchange Commission (SEC) may be inspected at the SEC’s public reference facilities at Room 1580, 100 F Street, NE Washington, DC, 20549, US. These reports may be accessed via the SEC’s website atwww.sec.gov
Publications
BT produces a series of reports on the company’s financial, compliance, social and environmental performance. Most of these reports (as well as the EAB Annual Report on BT’s compliance with the Undertakings), are available to shareholders on request and can be accessed atwww.bt.com/aboutbt. More detailed disclosures on BT’s implementation of social, ethical and environmental policies and procedures are available online through our independently verified sustainability report atwww.bt.com/betterworld
| Document | Publication date | |||
| Summary financial statement & Notice of Meeting | May | |||
| Annual Report & Form 20-F | May | |||
| Changing World: Sustained Values | May | |||
| EAB Annual Report | May | |||
| Quarterly results releases | July, November, February and May | |||
| Current Cost Financial Statements | September | |||
Statement of Business Practice (The Way We Work) | January 2009 | |||
For printed copies, when available, contact the Shareholder Helpline on Freefone 0808 100 4141 or, alternatively, contact our Registrars in the UK, at the address on page 167.
Electronic communication
Shareholders can now choose to receive their shareholder documents electronically rather than by post. Shareholders may elect to receive documents in this way by going towww.bt.com/signupand following the online instructions, or by calling the Shareholder Helpline (see page 167).
166 BT GROUP PLCANNUAL REPORT & FORM 20-F
Table of Contents
ADDITIONAL INFORMATIONINFORMATION FOR SHAREHOLDERS
Shareholder communication
BT is committed to communicating openly with each of its stakeholder audiences in the manner most appropriate to their requirements.
All investors can visit our website atwww.bt.com/investorcentrefor more information about BT. There are direct links from this page to sites providing information particularly tailored for shareholders, institutional investors and analysts, industry analysts and journalists.
An online version of this document is available atwww.bt.com/annualreport
Private shareholders
If private shareholders have any enquiries about their shareholding, they should contact our Registrars, Equiniti, at the address below.
Equiniti maintain BT Group’s share register and the separate BT Group EasyShare register. They also provide a Shareholder Helpline service on Freefone 0808 100 4141.
Shareholder helpline
Tel: Freefone0808 100 4141
Fax: 01903 833371
Textphone: Freefone0800 169 6907
From outside the UK:
Tel: +44 121 415 7178
Fax: +44 1903 833371
Textphone: +44 121 415 7028
e-mail:bt@equiniti.com
Website:www.shareview.co.uk
Tel: Freefone0808 100 4141
Fax: 01903 833371
Textphone: Freefone0800 169 6907
From outside the UK:
Tel: +44 121 415 7178
Fax: +44 1903 833371
Textphone: +44 121 415 7028
e-mail:bt@equiniti.com
Website:www.shareview.co.uk
The Registrar | ADR Depositary: | |
| Equiniti | JPMorgan Chase Bank, N.A. | |
| Aspect House | PO Box 64504 | |
| Spencer Road | St Paul, MN 55164-0504, US | |
| Lancing | Tel:+1 800 990 1135(General) | |
| West Sussex | or +1 651 453 2128 (from outside the US) | |
| BN99 6DA | or +1 800 428 4237 (Global Invest Direct) | |
Website:www.equiniti.com | e-mail:jpmorgan.adr@wellsfargo.com | |
| Website:www.adr.com |
General enquiries
BT Group plc
BT Centre
81 Newgate Street
London EC1A 7AJ
United Kingdom
Tel: 020 7356 5000
Fax: 020 7356 5520
From outside the UK:
Tel: +44 20 7356 5000
Fax: +44 20 7356 5520
BT Group plc
BT Centre
81 Newgate Street
London EC1A 7AJ
United Kingdom
Tel: 020 7356 5000
Fax: 020 7356 5520
From outside the UK:
Tel: +44 20 7356 5000
Fax: +44 20 7356 5520
Institutional investors and analysts
Institutional investors and equity research analysts may contact BT Investor Relations on:
Tel: 020 7356 4909
e-mail:investorrelations@bt.com
Tel: 020 7356 4909
e-mail:investorrelations@bt.com
Industry analysts may contact:
Tel: 020 7356 5631
Fax: 020 7356 6546
e-mail:industryenquiry@bt.com
Tel: 020 7356 5631
Fax: 020 7356 6546
e-mail:industryenquiry@bt.com
A full list of BT contacts and an electronic feedback facility is available atwww.bt.com/talk
BT GROUP PLCANNUAL REPORT & FORM 20-F 167
Table of Contents
ADDITIONAL INFORMATION
CROSS REFERENCE TO FORM 20-F
The information in this document that is referred to in the following table shall be deemed to be filed with the Securities and Exchange Commission for all purposes:
| Required Item in Form 20-F Item | Where information can be found in this Annual Report Section | Page | ||||||
| 1 | Identity of directors, senior management and advisors | Not applicable | ||||||
| 2 | Offer statistics and expected timetable | Not applicable | ||||||
| 3 | Key information | |||||||
| 3A | Selected financial data | Financial summary | 2 | |||||
| Selected financial data | 151 | |||||||
| Information for shareholders | ||||||||
| Exchange rates | 160 | |||||||
| 3B | Capitalisation and indebtedness | Not applicable | ||||||
| 3C | Reasons for the offer and use of proceeds | Not applicable | ||||||
| 3D | Risk factors | Our risks | 36 | |||||
| 4 | Information on the company | |||||||
| 4A | History and development of the company | Our business and strategy | ||||||
| Who we are | 11 | |||||||
| What we do | 11 | |||||||
| How we are structured | 16 | |||||||
| Information for shareholders | ||||||||
| Background | 157 | |||||||
| Other information | ||||||||
| Acquisitions and disposals | 40 | |||||||
| Financial review | ||||||||
| Liquidity | ||||||||
| Capital expenditure | 51 | |||||||
| Acquisitions and disposals | 52 | |||||||
| 4B | Business overview | Our business and strategy | 11 | |||||
| Our markets and customers | 15 | |||||||
| Our resources | 18 | |||||||
| Our lines of business | 22 | |||||||
| Our corporate responsibility | 34 | |||||||
| Consolidated financial statements | ||||||||
| Notes to the consolidated financial statements | ||||||||
| Segment information | 101 | |||||||
| Operational statistics | 154 | |||||||
| Information for shareholders | ||||||||
| Cautionary statement regarding forward-looking statements | 156 | |||||||
| 4C | Organisational structure | Our business and strategy | ||||||
| How we are structured | 16 | |||||||
| Subsidiary undertakings and associate | 149 | |||||||
| 4D | Property, plants and equipment | Our resources | ||||||
| Property portfolio | 21 | |||||||
| Consolidated financial statements | ||||||||
| Notes to the consolidated financial statements | ||||||||
| Property, plant and equipment | 114 | |||||||
| Financial statistics | 153 | |||||||
| 5 | Operating and financial review and prospects | |||||||
| 5A | Operating results | Our business and strategy | 11 | |||||
| Our lines of business | 22 | |||||||
| Financial review | 41 | |||||||
| Information for shareholders | ||||||||
| Cautionary statement regarding forward-looking statements | 156 | |||||||
| 5B | Liquidity and capital resources | Financial review | 41 | |||||
| Information for shareholders | ||||||||
| Cautionary statement regarding forward-looking statements | 156 | |||||||
| Consolidated financial statements | ||||||||
| Notes to the consolidated financial statements | ||||||||
| Loans and other borrowings | 119 | |||||||
| Financial commitments and contingent liabilities | 125 | |||||||
| Financial instruments and risk management | 137 | |||||||
| 5C | Research and development, patents and licences | Our resources | ||||||
| Global research capability | 20 | |||||||
| Financial statistics | 153 | |||||||
168 BT GROUP PLCANNUAL REPORT & FORM 20-F
Table of Contents
ADDITIONAL INFORMATIONCROSS REFERENCE TO FORM 20-F
| Required Item in Form 20-F Item | Where information can be found in this Annual Report Section | Page | ||||||
| 5D | Trend information | Financial review | 41 | |||||
| Quarterly analysis of revenue and profit | 150 | |||||||
| Selected Financial Data | 151 | |||||||
| Information for shareholders | ||||||||
| Cautionary statement regarding forward-looking statements | 156 | |||||||
| 5E | Off-balance sheet arrangements | Financial review | ||||||
| Funding and capital management | ||||||||
| Off-balance sheet arrangements | 54 | |||||||
| 5F | Tabular disclosure of contractual obligations | Financial review | ||||||
| Funding and capital management | ||||||||
| Contractual obligations and commitments | 54 | |||||||
| 6 | Directors, senior management and employees | |||||||
| 6A | Directors and senior management | Board of Directors and Operating Committee | 58 | |||||
| 6B | Compensation | Report on directors’ remuneration | 66 | |||||
| Consolidated financial statements | ||||||||
| Notes to the consolidated financial statements | ||||||||
| Retirement benefit plans | 127 | |||||||
| Share-based payments | 132 | |||||||
| 6C | Board practices | Board of Directors and Operating Committee | 58 | |||||
| The Board | 60 | |||||||
| Report on directors’ remuneration | 66 | |||||||
| 6D | Employees | Our resources | 18 | |||||
| Financial review | ||||||||
| Financial results | 43 | |||||||
| Consolidated financial statements | ||||||||
| Notes to the consolidated financial statements | ||||||||
| Employees | 105 | |||||||
| Operational statistics | 154 | |||||||
| 6E | Share ownership | Report on directors’ remuneration | 66 | |||||
| Consolidated financial statements | ||||||||
| Notes to the consolidated financial statements | ||||||||
| Share-based payments | 132 | |||||||
| 7 | Major shareholders and related party transactions | |||||||
| 7A | Major shareholders | Shareholders and Annual General Meeting | ||||||
| Substantial shareholdings | 82 | |||||||
| Information for shareholders | ||||||||
| Analysis of shareholdings at 31 March 2010 | 158 | |||||||
| 7B | Related party transactions | Directors’ information | ||||||
| Interest of management in certain transactions | 78 | |||||||
| Report on directors’ remuneration | 66 | |||||||
| Consolidated financial statements | ||||||||
| Notes to the consolidated financial statements | ||||||||
| Related party transactions | 124 | |||||||
| 7C | Interests of experts and counsel | Not applicable | ||||||
| 8 | Financial information | |||||||
| 8A | Consolidated statements and other financial information | See Item 18 below | ||||||
| Other information | ||||||||
| Legal proceedings | 39 | |||||||
| Financial review | ||||||||
| Financial results | ||||||||
| Dividends | 47 | |||||||
| Consolidated financial statements | ||||||||
| Notes to the consolidated financial statements | ||||||||
| Financial commitments and contingent liabilities | 125 | |||||||
| Information for shareholders | ||||||||
| Dividends | 158 | |||||||
| Articles of Association (‘Articles’) | ||||||||
| Dividends | 161 | |||||||
| 8B | Significant changes | Financial review | ||||||
| Funding and capital management | 52 | |||||||
| Going concern | 54 | |||||||
BT GROUP PLCANNUAL REPORT & FORM 20-F 169
Table of Contents
ADDITIONAL INFORMATIONCROSS REFERENCE TO FORM 20-F
| Required Item in Form 20-F Item | Where information can be found in this Annual Report Section | Page | ||||||
| 9 | The offer and listing | |||||||
| 9A | Offer and listing details | Information for shareholders | ||||||
| Stock exchange listings | ||||||||
| Share and ADS prices | 157 | |||||||
| 9B | Plan of distribution | Not applicable | ||||||
| 9C | Markets | Information for shareholders | ||||||
| Stock exchange listings | 157 | |||||||
| 9D | Selling shareholders | Not applicable | ||||||
| 9E | Dilution | Not applicable | ||||||
| 9F | Expenses of the issue | Not applicable | ||||||
| 10 | Additional information | |||||||
| 10A | Share capital | Not applicable | ||||||
| 10B | Memorandum and articles of association | Information for shareholders | ||||||
| Articles of Association (‘Articles’) | 161 | |||||||
| 10C | Material contracts | Information for shareholders | ||||||
| Material contracts | 164 | |||||||
| 10D | Exchange controls | Information for shareholders | ||||||
| Limitations affecting security holders | 166 | |||||||
| 10E | Taxation | Information for shareholders | ||||||
| Taxation (US Holders) | 164 | |||||||
| 10F | Dividends and paying agents | Not applicable | ||||||
| 10G | Statement by experts | Not applicable | ||||||
| 10H | Documents on display | Information for shareholders | ||||||
| Documents on display | 166 | |||||||
| 10I | Subsidiary information | Not applicable | ||||||
| 11 | Quantitative and qualitative | Consolidated financial statements | ||||||
| disclosures about market risk | Accounting policies | |||||||
| Financial instruments | 91 | |||||||
| Notes to the consolidated financial statements | ||||||||
| Financial instruments and risk management | 137 | |||||||
| 12 | Description of securities other than equity securities | Not applicable | ||||||
| 13 | Defaults, dividend arrearages and delinquencies | Not applicable | ||||||
| 14 | Material modifications to the rights of security holders | |||||||
| and use of proceeds | Not applicable | |||||||
| 15 | Controls and procedures | Business policies | ||||||
| US Sarbanes-Oxley Act of 2002 | 81 | |||||||
| Disclosure controls and procedures | 81 | |||||||
| Internal control over financial reporting | 81 | |||||||
| 16A | Audit committee financial expert | Business policies | ||||||
| US Sarbanes-Oxley Act of 2002 | 81 | |||||||
| 16B | Code of ethics | Business policies | ||||||
| US Sarbanes-Oxley Act of 2002 | 81 | |||||||
| 16C | Principal accountants’ fees and services | Consolidated financial statements | ||||||
| Notes to the consolidated financial statements | ||||||||
| Audit and non-audit services | 136 | |||||||
| Report of the Audit Committee | 62 | |||||||
| 16E | Purchases of equity securities by the issuer and | Not applicable | ||||||
| affiliated purchasers | ||||||||
| 16F | Change in registrant’s reporting accountant | Not applicable | ||||||
| 16G | Corporate Governance | The Board | ||||||
| New York Stock Exchange | 61 | |||||||
| 17 | Financial statements | Not applicable | ||||||
| 18 | Financial statements | Report of the independent auditors – Consolidated financial statements | 85 | |||||
| United States opinion | 86 | |||||||
| Consolidated financial statements | 87 | |||||||
| Quarterly analysis of revenue and profit | 150 | |||||||
170 BT GROUP PLCANNUAL REPORT & FORM 20-F
Table of Contents
ADDITIONAL INFORMATION
GLOSSARY OF TERMS
1,2,3
21CN: an end-to-end, next generation IP network, designed to transform the customer experience by delivering new, converged services rapidly and cost effectively.
A
ADS: American Depositary Share
ADSL: Asynchronous Digital Subscriber Line technology converts a standard copper line into a high-speed internet connection, which allows customers to talk and use the internet at the same time
ADSL2+: an enhanced version of ADSL, enabling the provision of higher speed connections
ARPU: average annual revenue per consumer user
B
broadband: comes from ‘broad bandwidth’ and is used to describe a high-capacity, two-way link between an end user and an access network supplier – capable of carrying a wide range of applications
BT Basic: offers a discount of over 60% off line rental available to nearly four million people on low income and also includes a call allowance
BT Business One Plan Plus: the first unlimited calls, lines, broadband and mobile option available to small and medium-sized businesses in the UK
BT Conferencing: the business within BT Enterprises offering global audio, video and internet collaboration services
BT Directories: the business within BT Enterprises offering directory enquiries, operator and emergency services and The Phone Book
BT Engage IT: offers customers a wide range of IT services, including data centre virtualisation and unified communications
BT Enterprises: the business unit within BT Retail encompassing BT Conferencing, BT Directories, BT Expedite, BT Payphones, BT Redcare and BT Openzone
BT Expedite: the business within BT Enterprises offering software and IT services for retailers
BT Fon: global wireless broadband access for BT Total Broadband customers using BT Openzone wi-fi hotspots and the connections of other Fon members
BT Global Services: the BT line of business providing networked IT products, services and solutions in the UK and globally
BT Infinity: the super-fast fibre-based broadband service
BT Innovate & Design: the BT internal service unit responsible for the design and deployment of the platforms, systems and processes which support BT’s products and services
BT Ireland: a division of BT Retail. It operates in the consumer, business, major business and wholesale markets throughout Northern Ireland and the Republic of Ireland
BT Openzone: the broadband internet access service using wireless technology (wi-fi)
BT Operate: the BT internal service unit responsible for the operation of the platforms, systems and processes which support BT’s products and services
BT Payphones: the business within BT Enterprises providing street, managed, prison, card and private payphones
BT Pension Scheme (BTPS): the defined benefit pension scheme which was closed to new members on 31 March 2001
BT Redcare: the business within BT Enterprises offering alarm monitoring and tracking services
BT Retail: the BT line of business offering a wide range of retail products and services to the consumer and small to medium-sized business markets
BT Retirement Plan (BTRP): the defined contribution pension arrangement that was introduced for new BT employees from 1 April 2001 and was closed to new members on 31 March 2009
BT Retirement Saving Scheme (BTRSS): set up on 1 April 2009 as a successor to the BT Retirement Plan and the Syntegra Ltd Flexible Pensions Plan. It is a contract based, defined contribution arrangement
BT Vision: the on-demand television service, which gives viewers access to a wide range of TV and radio channels and pay-per-view services
BT Wholesale: the BT line of business providing network services and solutions within the UK. It services more than 1,000 UK communications providers, including other BT businesses, and others worldwide
Business in the Community: an organisation of more than 800 of the UK’s top companies committed to improving their positive impact on society
C
Childline: the UK’s free, 24-hour helpline for children in distress or danger
‘cloud’ computing: a type of computing that relies on sharing computer resources rather than having local servers or personal devices to handle applications
CP: communications provider
CRM: customer relationship management
CR: corporate responsibility
D
Dabs: one of the UK’s leading internet retailers of IT and technology products, part of BT Business
DBP: BT Group Deferred Bonus Plan – a plan where share awards are granted to selected employees of the group
Dow Jones Sustainability Index: assesses 2,500 companies worldwide on their performance in areas such as corporate governance and ethical practices, investor relations, environmental management, community investment, human rights, health and safety, diversity, supply chain and risk management
DSL: digital subscriber line – a broadband service where existing wires between the local telephone exchange and a customer’s telephone sockets are transformed into a high-speed digital line
E
EBITDA: earnings before interest, taxation, depreciation and amortisation
Etherflow: an adaptive Ethernet service which uses BT’s 21st century network
Ethernet: a popular standard or protocol for linking computers into a local area network. Our Ethernet portfolio gives our communications provider customers a wide choice of high-bandwidth circuits
EPS: earnings per share
ESIP: Employee Share Investment Plan – a plan under which BT can provide free shares to employees, and employees can buy shares in BT from pre-tax salaries
ESPP: BT Group Employee Stock Purchase Plan – a plan for employees in the US which enables them to purchase American Depositary Shares
BT GROUP PLCANNUAL REPORT & FORM 20-F 171
Table of Contents
ADDITIONAL INFORMATIONGLOSSARY OF TERMS
F
FTTC: fibre to the cabinet
FTTP: fibre to the premises
G
GLOP: BT Group Legacy Option Plan – a legacy share option plan which is no longer operated by the group
GSOP: BT Group Global Share Option Plan – a legacy share option plan which is no longer operated by the group
I
IASB: International Accounting Standards Board – the board which sets International Financial Reporting Standards
ICT: information and communication technology
IFRS: International Financial Reporting Standards
IP Exchange: BT Wholesale’s global IP interoperability platform that allows communications providers to manage traditional and IP voice calls on a single gateway
IP: internet protocol – a packet-based protocol for delivering data – including voice and video – across networks
ISDN: integrated services digital network – an all digital network that enables a host of services to be carried together on the same circuits. It makes it possible for any two compatible pieces of connected equipment to talk to each other
ISO 14001: the environmental management standard
ISP: internet service provider
ISP: BT Group Incentive Share Plan
L
LLU: local loop unbundling – the process whereby BT’s exchange lines are physically disconnected from BT’s network and connected to other communications providers’ networks. This enables operators, other than BT, to use the company’s local loop to provide services to customers
M
MNS: managed network services – BT Wholesale’s broad portfolio of long-term managed network outsourcing and white label platform offerings
MPLS: multi-protocol label switching – supports the rapid transmission of data across network routers, enabling modern networks to achieve high quality of service
N
N3: the secure broadband network that BT has built and is managing for the NHS
narrowband: non-broadband, fixed access network or line
NCC: network charge control
NGA: Next Generation Access – a super-fast fibre-based broadband service, which we aim to roll out to at least 40% of UK premises in 2012
O
Ofcom: the independent regulator and competition authority for the UK communications industries, with responsibilities across television, radio, telecommunications and wireless communications services
Openreach: Openreach looks after the ‘first mile’ of the UK network, from the exchange through to homes and businesses. Its role is to provide services to all communications providers – including other BT lines of business – on a fair, equal and open basis
P
PPC: partial private circuit
Project Canvas: a joint broadband TV venture with the BBC, Channel 4, Five, ITV and others
Q
Queen’s Award for Enterprise: the UK’s most prestigious award for business performance
R
‘right first time’: the internal measure of whether we are keeping our promises to our customers and meeting or exceeding their expectations
RSP: BT Group Retention Share Plan – a plan where share awards are granted to selected employees of the group
S
SME: small and medium enterprises
SMP: significant market power
Super-fast fibre-based broadband: see NGA
T
TSR: Total shareholder return – a corporate performance measure used to measure BT against a comparator group of companies which contains European telecommunications companies and companies which are either similar in size or market capitalisation and/or have a similar business mix and spread to BT
U
Undertakings: legally-binding commitments BT made to Ofcom, designed to bring greater transparency and certainty to the regulation of the telecommunications industry in the UK. They led to the formation of Openreach
UK GAAP: United Kingdom Generally Accepted Accounting Principles
USO: universal service obligation
US SEC: US Securities and Exchange Commission
172 BT GROUP PLCANNUAL REPORT & FORM 20-F
Table of Contents
ADDITIONAL INFORMATIONGLOSSARY OF TERMS
V
VoIP: voice over internet protocol – a method of transporting speech over the internet
W
Wholesale Broadband Connect Fibre: a wholesale variant of BT’s fibre-based broadband service tailored to the needs of communications providers
wi-fi: wireless networking – the ability to connect to a network or a PC using radio as opposed to a physical (cabling) connection
WLR: wholesale line rental – enables communications providers to offer their own-branded telephony services over the BT network
BT GROUP PLCANNUAL REPORT & FORM 20-F 173
Table of Contents
ADDITIONAL INFORMATION
INDEX
A
Accounting policies, Group87
Accounting policies, BT Group plc146
Accounting standards, interpretations and
amendments to published standards94-95
Acquisitions89, 126-127
Acquisitions and disposals40, 52
Additional information155
Alternative performance measures54-56
Articles of Association161
Associates and joint ventures47, 87, 97, 100, 116
Audit Committee, Report of the62
Audit and non-audit services136
Audit opinions85, 86, 145
B
Background57
Balance sheet48-50, 100, 147, 152
Board, the58-60
Board of Directors and Operating Committee58
BT Global Services12, 22-25, 101
BT Innovate & Design33, 101
BT Operate33, 101
BT Retail25-28, 101
BT Wholesale28-31, 101
Business6
Business and strategy11
Business policies79
C
Capital expenditure14, 51, 55, 103, 125, 153
Capital gains tax157
Cash and cash equivalents91, 99, 110
Cash flow statement, group51, 99, 152
Cautionary statement regarding forward-looking statements156
Chairman’s message4
Chief Executive’s statement5
Competition15, 36
Comprehensive income, Group statement of97
Consolidated financial statements83
Contractual obligations and commitments54, 125
Corporate Governance Statement60
Corporate responsibility34
Cost transformation11, 44
Critical accounting policies41, 93-94
Cross reference to Form 20-F168-170
Customer service11, 13-14, 27
Customers16
D
Deferred taxation49, 91, 94, 108, 122-123
Derivative financial instruments49, 92, 120-121, 137-144
Directors’ information78
Directors’ remuneration, report on66-78
Directors’ responsibility, statement of84
Directors, Report of the57-82
Disclosure controls and procedures81
Dividend investment plan159
Dividend mandate159
Dividends47, 52, 91, 107, 146, 158
Documents on display166
E
Earnings per share13, 47, 54-55, 109-110, 150-153
EBITDA2, 22, 45, 102, 151
Electronic communication166
Employee plans132-135
Employees105
Equity, Group statement of changes in98
Exchange rates88, 160
F
Financial commitments and contingent liabilities125
Financial data, selected151
Finance expense and finance income46-47, 107
Financial instruments and risk management137-144
Financial liabilities92
Financial position and resources48-50
Financial review41
Financial results43
Financial statements of BT Group plc146
Financial statistics153
Financial summary2
Foreign currencies88
Free cash flow13, 51, 55, 152
Funding and capital maintenance52-54
G
Geographical information103
Goodwill impairment review112
Global Invest Direct159
Global research capability20
Glossary of terms171-173
Going concern54
Group results43-45
H
Hedging120, 138-139, 142
How we are structured8, 16
174 BT GROUP PLCANNUAL REPORT & FORM 20-F
Table of Contents
ADDITIONAL INFORMATIONINDEX
I
Income statement, group96-97
Income statement, group (summarised)42
Independent auditors, Report of the85, 86, 145
Individual savings accounts (ISAs)160
Information for shareholders156
Intangible assets89, 112-113
Internal control and risk management80
Internal control over financial reporting81
Investments115
Investing for the future12
L
Legal proceedings39
Limitations affecting security holdings166
Line of business results41
Lines of business22
Liquidity51
Loans and other borrowings119
Long-term share-based incentives69
M
Markets and Customers15
Material contracts164
Minority interests123
N
Net debt53, 56, 111 |
Nominating Committee, Report of the64 |
Non-executive directors59 |
Notes to the consolidated financial statements101-144 |
New York Stock Exchange61 |
O
Off-balance sheet arrangements54
Openreach31-33
Operating Committee58-59
Operating costs44, 104
Operational statistics154
Other information38-40
Other operating income43, 88, 104
Other reserves124
Our relationship with HM Government39
Outlook3, 14
Overview2-9
P
Pensions19, 37, 49, 53
People18
Performance 20103, 24, 28, 30, 32
Principal risks and uncertainties36
Profit before taxation47
Property, plant and equipment49, 89, 93, 114-115
Property portfolio21
Provisions49, 91, 94, 122
Publications166
Q
Quarterly analysis of revenue and profit150
R
Regulation38-39
Related party transactions124
Resources18-21
Results announcements160
Retirement benefit plans127-132
Revenue43, 87, 102-103
Risks36
S
Segmental analysis101-103
Selected financial data151-153
Share and ADS prices157
Share capital93, 123, 146
Share-based payments90, 132-135, 146
ShareGift160
Shareholder communication167
Shareholders and annual general meeting82
Shareholdings, analysis of158
Specific items45-46, 55, 106
Statement of comprehensive income, group97
Stock exchange listings157
Strategic priorities12
Subsidiary undertakings and associate149
T
Taxation47, 50, 91, 108-109, 122-123, 146
Taxation (US Holders)164
Total shareholder return19, 133, 159
Trade and other payables49, 92, 121
Trade and other receivables49, 91, 117-118
U
Unclaimed Assets Register160
US Sarbanes-Oxley Act of 200280
BT GROUP PLCANNUAL REPORT & FORM 20-F 175
Table of Contents
BT Group plc
Registered office: 81 Newgate Street, London EC1A 7AJ
Registered in England and Wales No. 4190816
Registered in England and Wales No. 4190816
Produced by BT Group
Printed in England by Pindar Plc
Printed on Revive 50:50 Silk, which is produced using 50% recovered
waste fibre and 50% virgin wood fibre. All pulps used are elemental
chlorine free (ECF).
Printed on Revive 50:50 Silk, which is produced using 50% recovered
waste fibre and 50% virgin wood fibre. All pulps used are elemental
chlorine free (ECF).
www.bt.com
PHME 59912