First Quarter 2016 Supplementary Financial Data April 20, 2016
Certain statements in this supplementary data are forward-looking statements. Forward-looking statements include statements about our future financial condition, our industry and our business strategy. Statements that contain words such as “anticipate”, “believe”, “expect”, “intend”, “estimate”, “hope” or similar expressions, are forward-looking statements. These forward-looking statements are based on the current expectations of PCA. Because forward-looking statements involve inherent risks and uncertainties, the plans, actions and actual results of PCA could differ materially. Among the factors that could cause plans, actions and results to differ materially from PCA’s current expectations are those identified under the caption “Risk Factors” in PCA’s Form 10K filed with the Securities and Exchange Commission and available at the SEC’s website at “www.sec.gov”. We undertake no obligation to publically update any forward-looking statements, whether as a result of new information, future events, or otherwise. Packaging Corporation of America Certain non-U.S. GAAP financial information is presented on these slides. A reconciliation of those numbers to U.S. GAAP financial measures is included in the schedules attached to our press release. Non-GAAP Financial Measures 2
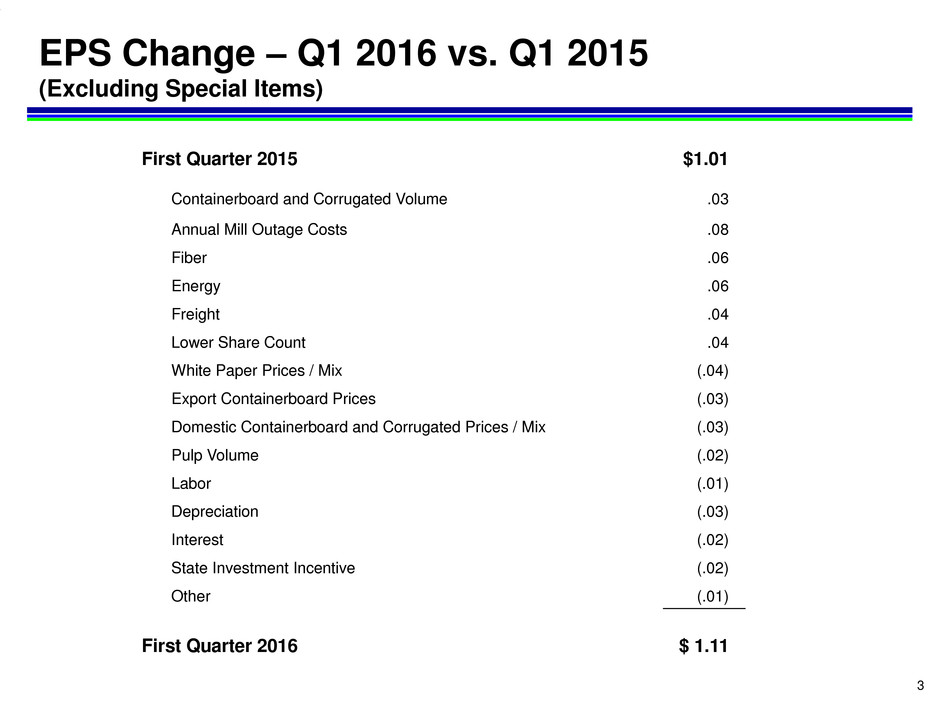
First Quarter 2015 $1.01 Containerboard and Corrugated Volume .03 Annual Mill Outage Costs .08 Fiber .06 Energy .06 Freight .04 Lower Share Count .04 White Paper Prices / Mix (.04) Export Containerboard Prices (.03) Domestic Containerboard and Corrugated Prices / Mix (.03) Pulp Volume (.02) Labor (.01) Depreciation (.03) Interest (.02) State Investment Incentive (.02) Other (.01) First Quarter 2016 $ 1.11 EPS Change – Q1 2016 vs. Q1 2015 (Excluding Special Items) 3
Supplemental Cash Data ($ Millions) 4 (1) Net of state tax cash payments of $5 million. Q1 2016 Cash Provided by Operations (1) 191$ Less: Capital Expenditures (53) Free Cash Flow 138$ Other Cash Uses Common Stock Dividends (53)$ Share Repurchases (100) Debt Repayments (2) Other (5) Total Other Cash Uses (160)$ Net Decrease in Cash (22) Beginning Cash, January 1, 2016 184 Ending Cash, March 31, 2016 162$