Exhibit 99.1 Packaging Corporation of America KeyBanc Industrials & Basic Materials Conference June 4, 2021 Mark W. Kowlzan Robert P. Mundy Chairman & CEO Executive V. P. & CFOExhibit 99.1 Packaging Corporation of America KeyBanc Industrials & Basic Materials Conference June 4, 2021 Mark W. Kowlzan Robert P. Mundy Chairman & CEO Executive V. P. & CFO

Packaging Corporation of America Certain statements in this presentation are forward-looking statements. Forward-looking statements include statements about our future financial condition, our industry and our business strategy. Statements that contain words such as “anticipate”, “believe”, “expect”, “intend”, “estimate”, “hope” or similar expressions, are forward-looking statements. These forward-looking statements are based on the current expectations of PCA. Because forward-looking statements involve inherent risks and uncertainties, the plans, actions and actual results of PCA could differ materially. Among the factors that could cause plans, actions and results to differ materially from PCA’s current expectations are those identified under the caption “Risk Factors” in PCA’s Annual Report on Form 10-K for the year ended December 31, 2020, and in subsequent quarterly reports on Form 10-Q, filed with the Securities and Exchange Commission and available at the SEC’s website at “www.sec.gov”. Non-GAAP financial measures are reconciled to the most comparable GAAP measure in the Appendix. 2Packaging Corporation of America Certain statements in this presentation are forward-looking statements. Forward-looking statements include statements about our future financial condition, our industry and our business strategy. Statements that contain words such as “anticipate”, “believe”, “expect”, “intend”, “estimate”, “hope” or similar expressions, are forward-looking statements. These forward-looking statements are based on the current expectations of PCA. Because forward-looking statements involve inherent risks and uncertainties, the plans, actions and actual results of PCA could differ materially. Among the factors that could cause plans, actions and results to differ materially from PCA’s current expectations are those identified under the caption “Risk Factors” in PCA’s Annual Report on Form 10-K for the year ended December 31, 2020, and in subsequent quarterly reports on Form 10-Q, filed with the Securities and Exchange Commission and available at the SEC’s website at “www.sec.gov”. Non-GAAP financial measures are reconciled to the most comparable GAAP measure in the Appendix. 2

2Q21 Update • Packaging Segment - Demand remains broad-based and very strong; box shipments on pace to exceed 2Q20 by double-digit % - All four planned annual mill outages have been successfully completed on budget - Expect to replenish some inventory during the quarter by utilizing our Jackson Mill for additional containerboard production; however, again at or near record lows from a weeks-of-supply standpoint due to stronger than expected demand - Continuing to implement our previously announced price increases; export prices moving higher • Paper Segment - Industry conditions in the uncoated freesheet market continue to be challenged, but improving, due to the nationwide responses to help control the spread of the pandemic - Our sales volume coming in where we expected - Higher average prices and mix as we continue the roll-out of our paper price increases announced in 1Q21; additional price increases announced last week - Continue to assess the outlook for paper demand and will run our paper system accordingly • Cost inflation and freight/logistics challenges as economic conditions improve - Projects and initiatives help to minimize impact 32Q21 Update • Packaging Segment - Demand remains broad-based and very strong; box shipments on pace to exceed 2Q20 by double-digit % - All four planned annual mill outages have been successfully completed on budget - Expect to replenish some inventory during the quarter by utilizing our Jackson Mill for additional containerboard production; however, again at or near record lows from a weeks-of-supply standpoint due to stronger than expected demand - Continuing to implement our previously announced price increases; export prices moving higher • Paper Segment - Industry conditions in the uncoated freesheet market continue to be challenged, but improving, due to the nationwide responses to help control the spread of the pandemic - Our sales volume coming in where we expected - Higher average prices and mix as we continue the roll-out of our paper price increases announced in 1Q21; additional price increases announced last week - Continue to assess the outlook for paper demand and will run our paper system accordingly • Cost inflation and freight/logistics challenges as economic conditions improve - Projects and initiatives help to minimize impact 3
Continuing to Identify Tactical/Strategic, Value-Creating Initiatives and Projects …… • Pre-pandemic, N.A. uncoated freesheet market was in secular decline of 3-4% per year; sharp decline in demand in 2020 due to nationwide responses to COVID-19 pandemic • Record demand in Packaging segment created shortfall in integrated containerboard supply; tight market conditions virtually eliminated ability to purchase outside tons • The flexible production capability of the Jackson Mill’s No. 3 paper machine (J3) enabled us to quickly alter the manufacturing process and produce linerboard with virtually zero capital - provided immediate value-creating solution to demand situations in both Packaging and Paper segments • Capital project for full conversion of J3 to linerboard approved by PCA Board in February 2021 - First-phase outage in 2Q22 at initial production rate of ~ 75% of capacity - Second-phase outage planned for mid-2023; machine reaches run-rate capacity of 2,000 tons-per-day by the end of 2023 • Project addresses strategic need for integrated containerboard volume and reduces J3 manufacturing costs, providing long-term value creation 4Continuing to Identify Tactical/Strategic, Value-Creating Initiatives and Projects …… • Pre-pandemic, N.A. uncoated freesheet market was in secular decline of 3-4% per year; sharp decline in demand in 2020 due to nationwide responses to COVID-19 pandemic • Record demand in Packaging segment created shortfall in integrated containerboard supply; tight market conditions virtually eliminated ability to purchase outside tons • The flexible production capability of the Jackson Mill’s No. 3 paper machine (J3) enabled us to quickly alter the manufacturing process and produce linerboard with virtually zero capital - provided immediate value-creating solution to demand situations in both Packaging and Paper segments • Capital project for full conversion of J3 to linerboard approved by PCA Board in February 2021 - First-phase outage in 2Q22 at initial production rate of ~ 75% of capacity - Second-phase outage planned for mid-2023; machine reaches run-rate capacity of 2,000 tons-per-day by the end of 2023 • Project addresses strategic need for integrated containerboard volume and reduces J3 manufacturing costs, providing long-term value creation 4
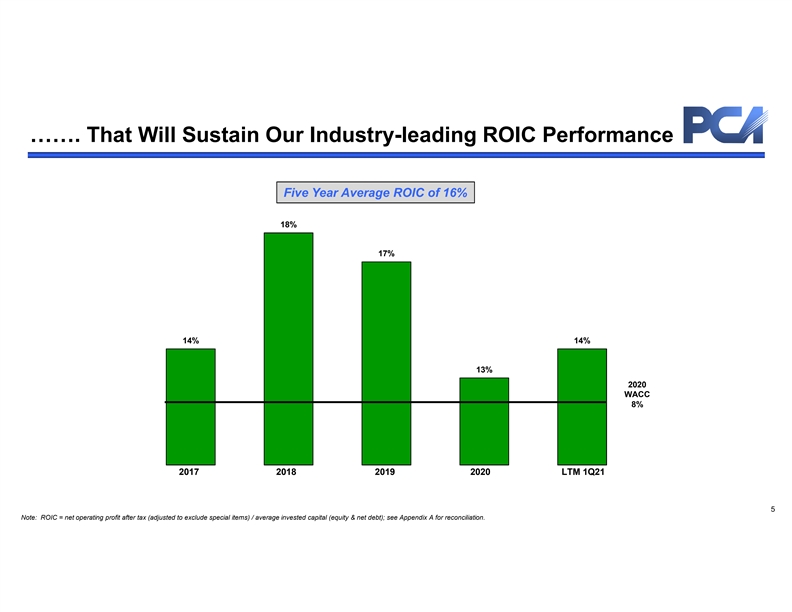
……. That Will Sustain Our Industry-leading ROIC Performance Five Year Average ROIC of 16% 18% 17% 14% 14% 13% 2020 WACC 8% 2017 2018 2019 2020 LTM 1Q21 5 Note: ROIC = net operating profit after tax (adjusted to exclude special items) / average invested capital (equity & net debt); see Appendix A for reconciliation.……. That Will Sustain Our Industry-leading ROIC Performance Five Year Average ROIC of 16% 18% 17% 14% 14% 13% 2020 WACC 8% 2017 2018 2019 2020 LTM 1Q21 5 Note: ROIC = net operating profit after tax (adjusted to exclude special items) / average invested capital (equity & net debt); see Appendix A for reconciliation.
Strategic Focus Areas • Continued Operational Excellence in Manufacturing and Sales • Containerboard / Corrugated System Optimization with Jackson No. 3 Machine Linerboard Conversion • Enhance Revenue in Packaging Segment thru Profitable Organic Box Volume Growth and Strategic Capital Spending in Corrugated System • Maintain Profitable Paper Segment While Balancing Supply with Demand • Disciplined Capital Allocation • Maintain Financial Flexibility with Strong Balance Sheet 6Strategic Focus Areas • Continued Operational Excellence in Manufacturing and Sales • Containerboard / Corrugated System Optimization with Jackson No. 3 Machine Linerboard Conversion • Enhance Revenue in Packaging Segment thru Profitable Organic Box Volume Growth and Strategic Capital Spending in Corrugated System • Maintain Profitable Paper Segment While Balancing Supply with Demand • Disciplined Capital Allocation • Maintain Financial Flexibility with Strong Balance Sheet 6

Appendix A LTM 2017 2018 2019 2020 1Q 2021 1Q 2021 Return on invested capital (ROIC) is calculated as follows: Reported income from operations $ 932 $ 1,068 $ 1,054 $ 724 $ 238 $ 753 Special items and adjustments: - Jackson mill conversion - - - - 1 1 - Hurricane Laura impact - - - 10 - 10 - Goodwill impairment - - - 55 - 55 - Incremental costs for Covid-19 - - - 7 - 6 - DeRidder mill fixed asset disposals - - 3 - - - - Wallula mill restructuring 33 30 1 - - - - Facilities closure and other costs (6) 3 - 28 2 30 - DeRidder mill incident 5 - - - - - - Acquisition and integration related costs 2 - - - - - - Hexacomb working capital adjustment (2) - - - - - - Expiration of timberland repurchase option (2) - - - - - - Adjusted income from operations $ 962 $ 1,101 $ 1,058 $ 824 $ 241 $ 855 Provision for income taxes (326) (266) (258) (206) (58) (207) NOPAT $ 636 $ 835 $ 800 $ 618 $ 183 $648 LTM 2016 2017 2018 2019 2020 1Q 2021 1Q 2021 Stockholders’ Equity $ 1,760 $ 2,182 $ 2,672 $ 3,071 $ 3,246 $ 3,331 $ 3,331 Current maturities of long term debt and 27 151 1 2 2 2 2 finance lease obligations Long-term debt 2,620 2,480 2,484 2,477 2,479 2,480 2,480 Finance lease obligations 20 19 18 16 14 14 14 Cash and cash equivalents (239) (217) (362) (679) (975) (983) (983) Marketable debt securities - - - (146) (148) (149) (149) Invested capital $ 4,188 $ 4,615 $ 4,813 $ 4,741 $ 4,618 $ 4,695 $ 4,695 Average invested capital $ 4,402 $ 4,714 $ 4,777 $ 4,680 $ 4,657 $ 4,713 ROIC (NOPAT/average invested capital) 14% 18% 17% 13% 16% 14%Appendix A LTM 2017 2018 2019 2020 1Q 2021 1Q 2021 Return on invested capital (ROIC) is calculated as follows: Reported income from operations $ 932 $ 1,068 $ 1,054 $ 724 $ 238 $ 753 Special items and adjustments: - Jackson mill conversion - - - - 1 1 - Hurricane Laura impact - - - 10 - 10 - Goodwill impairment - - - 55 - 55 - Incremental costs for Covid-19 - - - 7 - 6 - DeRidder mill fixed asset disposals - - 3 - - - - Wallula mill restructuring 33 30 1 - - - - Facilities closure and other costs (6) 3 - 28 2 30 - DeRidder mill incident 5 - - - - - - Acquisition and integration related costs 2 - - - - - - Hexacomb working capital adjustment (2) - - - - - - Expiration of timberland repurchase option (2) - - - - - - Adjusted income from operations $ 962 $ 1,101 $ 1,058 $ 824 $ 241 $ 855 Provision for income taxes (326) (266) (258) (206) (58) (207) NOPAT $ 636 $ 835 $ 800 $ 618 $ 183 $648 LTM 2016 2017 2018 2019 2020 1Q 2021 1Q 2021 Stockholders’ Equity $ 1,760 $ 2,182 $ 2,672 $ 3,071 $ 3,246 $ 3,331 $ 3,331 Current maturities of long term debt and 27 151 1 2 2 2 2 finance lease obligations Long-term debt 2,620 2,480 2,484 2,477 2,479 2,480 2,480 Finance lease obligations 20 19 18 16 14 14 14 Cash and cash equivalents (239) (217) (362) (679) (975) (983) (983) Marketable debt securities - - - (146) (148) (149) (149) Invested capital $ 4,188 $ 4,615 $ 4,813 $ 4,741 $ 4,618 $ 4,695 $ 4,695 Average invested capital $ 4,402 $ 4,714 $ 4,777 $ 4,680 $ 4,657 $ 4,713 ROIC (NOPAT/average invested capital) 14% 18% 17% 13% 16% 14%